5,018 Matching Annotations
  1. Dec 2025
    1. Author response:

      The following is the authors’ response to the original reviews

      Public Reviews:

      Reviewer #1 (Public review):

      Domínguez-Rodrigo and colleagues make a moderately convincing case for habitual elephant butchery by Early Pleistocene hominins at Olduvai Gorge (Tanzania), ca. 1.8-1.7 million years ago. They present this at the site scale (the EAK locality, which they excavated), as well as across the penecontemporaneous landscape, analyzing a series of findspots that contain stone tools and large-mammal bones. The latter are primarily elephants, but giraffids and bovids were also butchered in a few localities. The authors claim that this is the earliest well-documented evidence for elephant butchery; doing so requires debunking other purported cases of elephant butchery in the literature, or in one case, reinterpreting elephant bone manipulation as being nutritional (fracturing to obtain marrow) rather than technological (to make bone tools). The authors' critical discussion of these cases may not be consensual, but it surely advances the scientific discourse. The authors conclude by suggesting that an evolutionary threshold was achieved at ca. 1.8 ma, whereby regular elephant consumption rich in fats and perhaps food surplus, more advanced extractive technology (the Acheulian toolkit), and larger human group size had coincided.

      The fieldwork and spatial statistics methods are presented in detail and are solid and helpful, especially the excellent description (all too rare in zooarchaeology papers) of bone conservation and preservation procedures. However, the methods of the zooarchaeological and taphonomic analysis - the core of the study - are peculiarly missing. Some of these are explained along the manuscript, but not in a standard Methods paragraph with suitable references and an explicit account of how the authors recorded bone-surface modifications and the mode of bone fragmentation. This seems more of a technical omission that can be easily fixed than a true shortcoming of the study. The results are detailed and clearly presented.

      By and large, the authors achieved their aims, showcasing recurring elephant butchery in 1.8-1.7 million-year-old archaeological contexts. Nevertheless, some ambiguity surrounds the evolutionary significance part. The authors emphasize the temporal and spatial correlation of (1) elephant butchery, (2) Acheulian toolkits, and (3) larger sites, but do not actually discuss how these elements may be causally related. Is it not possible that larger group size or the adoption of Acheulian technology have nothing to do with megafaunal exploitation? Alternative hypotheses exist, and at least, the authors should try to defend the causation, not just put forward the correlation. The only exception is briefly mentioning food surplus as a "significant advantage", but how exactly, in the absence of food-preservation technologies? Moreover, in a landscape full of aggressive scavengers, such excess carcass parts may become a death trap for hominins, not an advantage. I do think that demonstrating habitual butchery bears very significant implications for human evolution, but more effort should be invested in explaining how this might have worked.

      Overall, this is an interesting manuscript of broad interest that presents original data and interpretations from the Early Pleistocene archaeology of Olduvai Gorge. These observations and the authors' critical review of previously published evidence are an important contribution that will form the basis for building models of Early Pleistocene hominin adaptation.

      This is a good example of the advantages of the eLife reviewing process. It has become much too common, among traditional peer-reviewing journals, to reject articles when there is no coincident agreement in the reviews, regardless of the heuristics (i.e., empirically-supported weight) of the arguments on both reviewers. Reviewers 1 and 2 provide contrasting evaluations, and the eLife dialogue between authors and reviewers enable us to address their comments differentially. Reviewer 1 (R1), whose evaluation is overall positive, remarks that the methods of the zooarchaeological and taphonomic analysis are missing. We have added them now in the revised version of our manuscript. R1 also remarks that our work highlights correlation of events, but not necessarily causation. We did not establish causation because such interpretations bear a considerable amount of speculation (and they might have fostered further criticism by R2); however, in the revised version, we expanded our discussion of these issues substantially. Establishing causation among the events described is impossible, but we certainly provide arguments to link them.

      Reviewer #2 (Public review):

      The authors argue that the Emiliano Aguirre Korongo (EAK) assemblage from the base of Bed II at Olduvai Gorge shows systematic exploitation of elephants by hominins about 1.78 million years ago. They describe it as the earliest clear case of proboscidean butchery at Olduvai and link it to a larger behavioral shift from the Oldowan to the Acheulean.

      The paper includes detailed faunal and spatial data. The excavation and mapping methods appear to be careful, and the figures and tables effectively document the assemblage. The data presentation is strong, but the behavioral interpretation is not supported by the evidence.

      The claim for butchery is based mainly on the presence of green-bone fractures and the proximity of bones and stone artifacts. These observations do not prove human activity. Fractures of this kind can form naturally when bones break while still fresh, and spatial overlap can result from post-depositional processes. The studies cited to support these points, including work by Haynes and colleagues, explain that such traces alone are not diagnostic of butchery, but this paper presents them as if they were.

      The spatial analyses are technically correct, but their interpretation extends beyond what they can demonstrate. Clustering indicates proximity, not behavior. The claim that statistical results demonstrate a functional link between bones and artifacts is not justified. Other studies that use these methods combine them with direct modification evidence, which is lacking in this case.

      The discussion treats different bodies of evidence unevenly. Well-documented cut-marked specimens from Nyayanga and other sites are described as uncertain, while less direct evidence at EAK is treated as decisive. This selective approach weakens the argument and creates inconsistency in how evidence is judged.

      The broader evolutionary conclusions are not supported by the data. The paper presents EAK as marking the start of systematic megafaunal exploitation, but the evidence does not show this. The assemblage is described well, but the behavioral and evolutionary interpretations extend far beyond what can be demonstrated.

      We disagree with the arguments provided by Reviewer 2 (R2). The arguments are based on two issues: bone breakage and spatial association. We will treat both separately here.

      Bone breakage

      R2 argues that:

      “The claim for butchery is based mainly on the presence of green-bone fractures and the proximity of bones and stone artifacts. These observations do not prove human activity. Fractures of this kind can form naturally when bones break while still fresh, and spatial overlap can result from post-depositional processes. The studies cited to support these points, including work by Haynes and colleagues, explain that such traces alone are not diagnostic of butchery, but this paper presents them as if they were.”

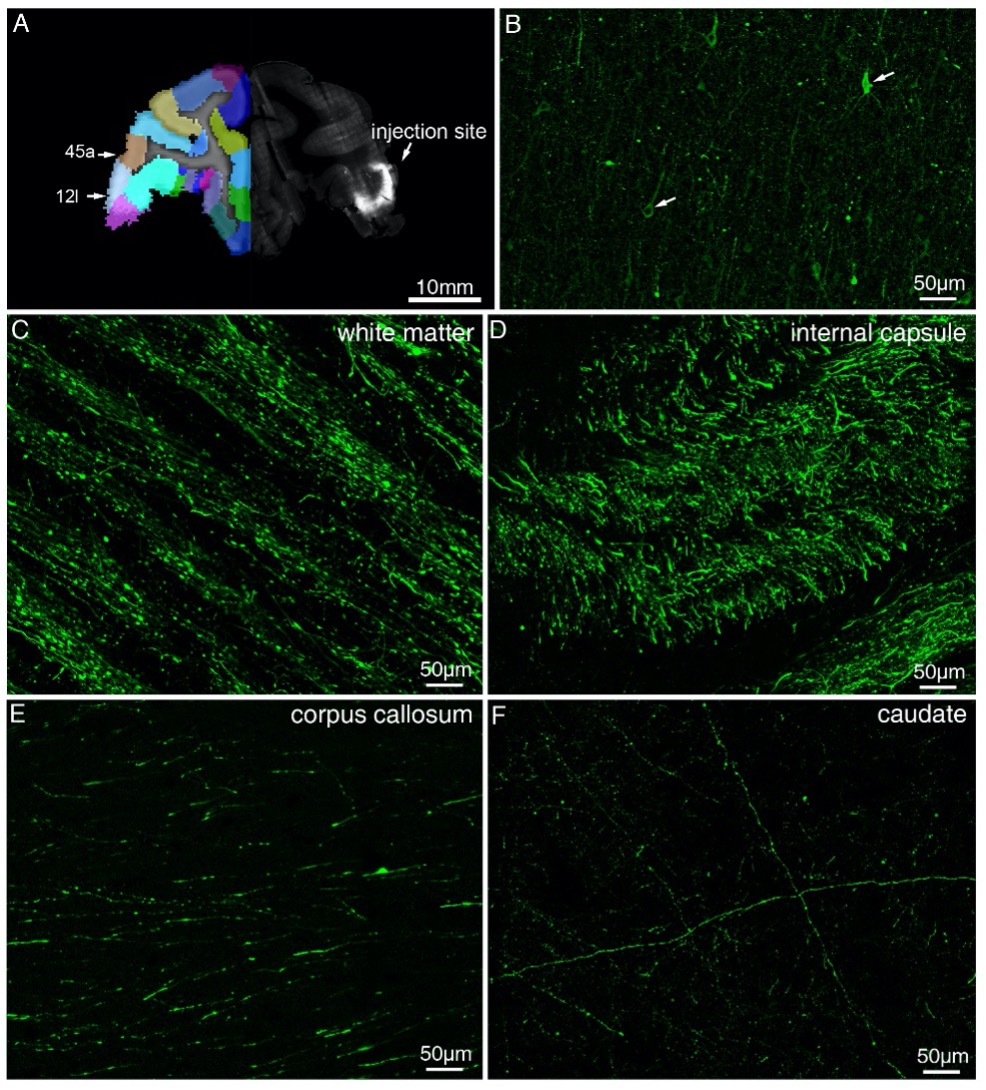
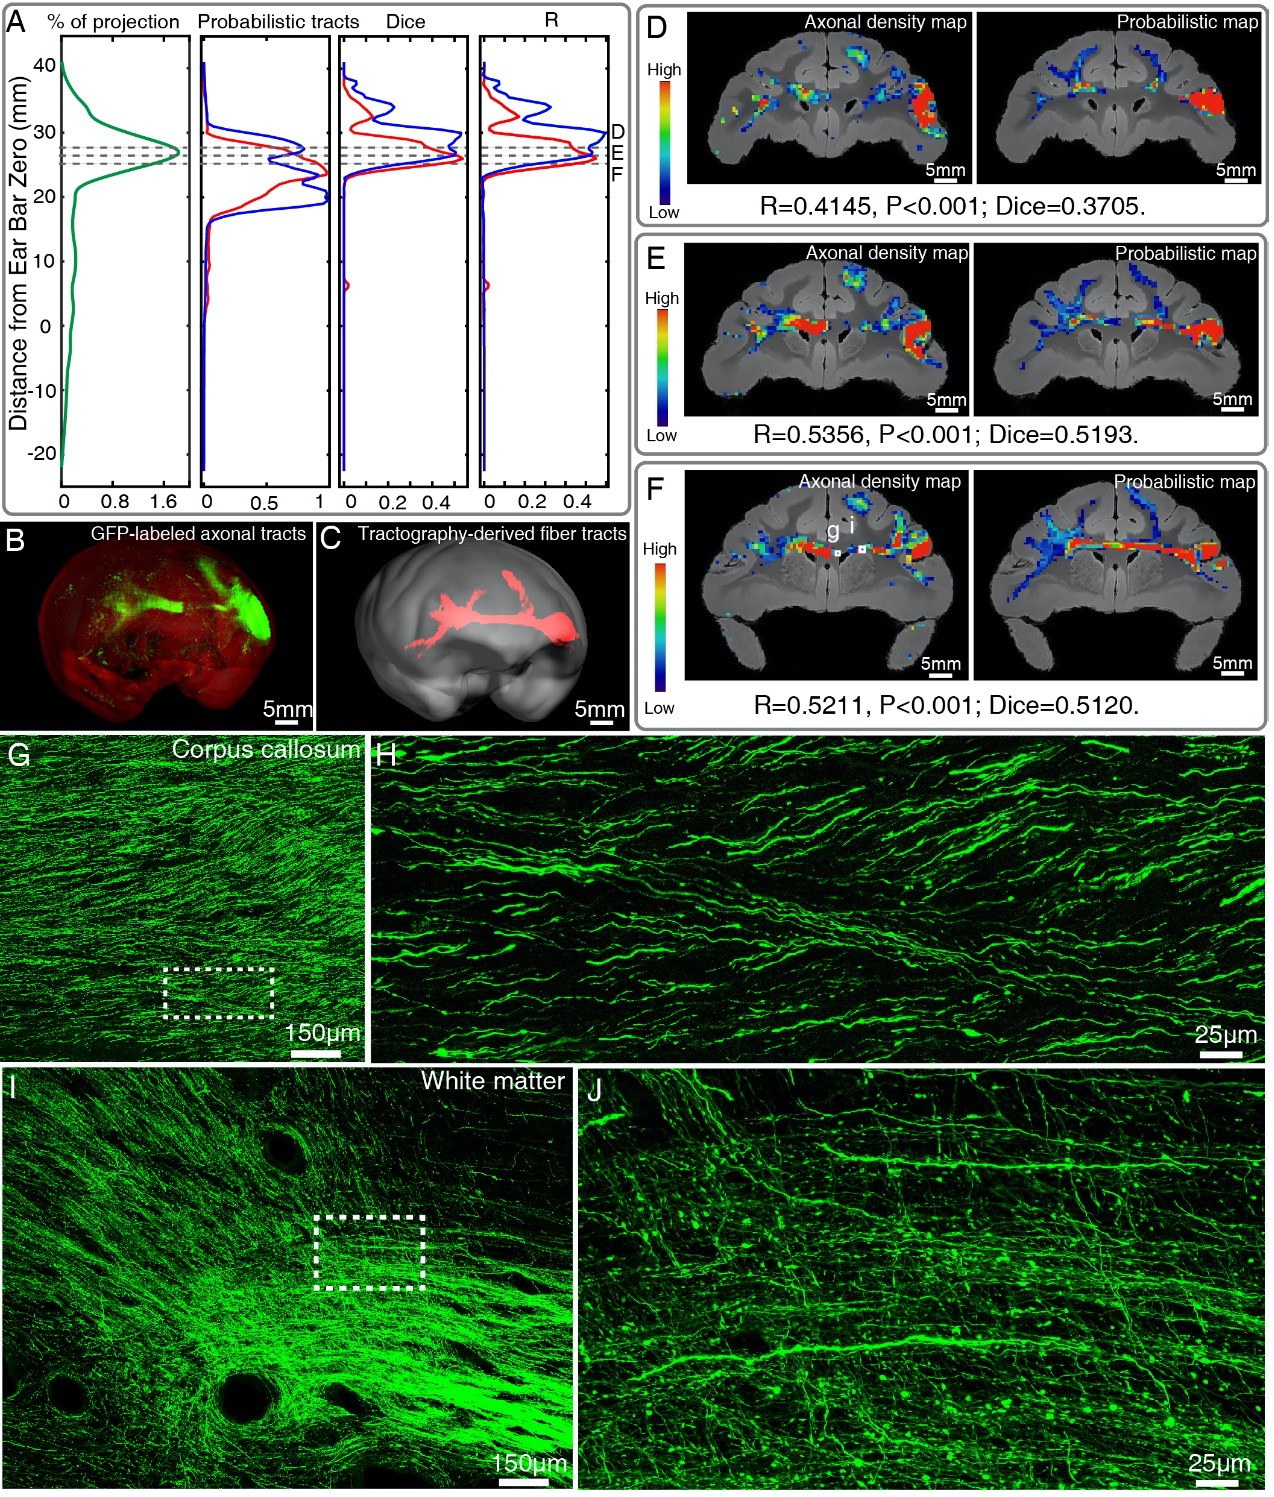
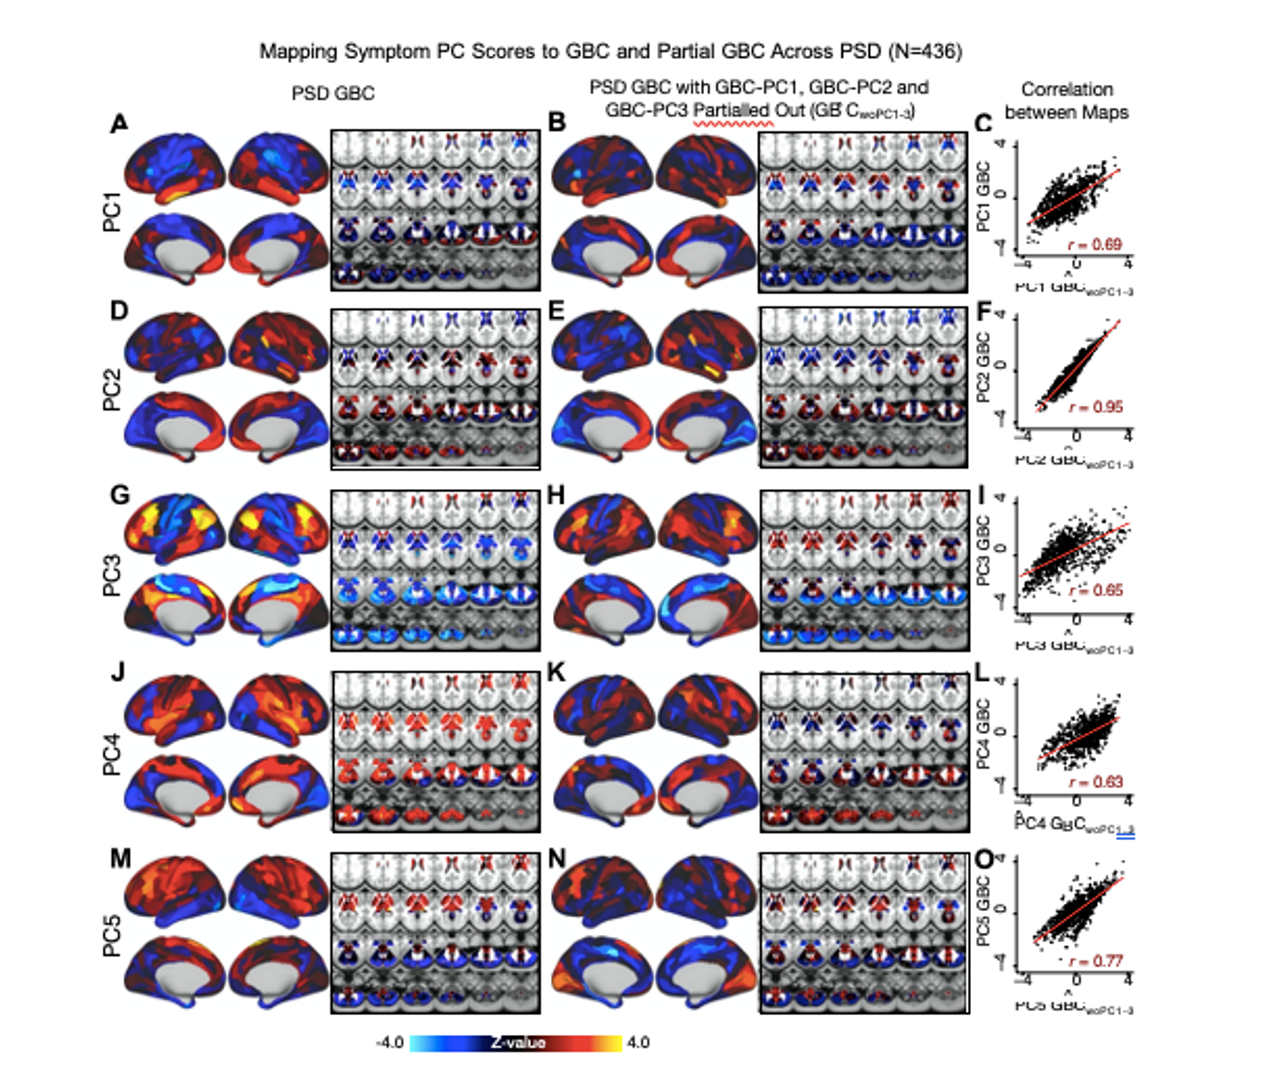
      In our manuscript, we argued that green-breakage provides an equally good (or even  better) taphonomic evidence of butchery if documented following clear taphonomic indicators. Not all green breaks are equal and not all “cut marks” are unambiguously identifiable as such. First, “natural” elephant long limb breaks have been documented only in pre/peri-mortem stages when an elephant breaks a leg. As a matter of fact, they have only been reported in publication on femora, the thinnest long bone (Haynes et al., 2021). Unfortunately, they have been studied many months after the death of the individuals, and the published diagnosis is made under the assumption that no other process intervened in the modification of those bones during this vast time span. Most of the breaks resulting from pre-mortem fractures produce long smooth, oblique/helical outlines. Occasionally, some flake scarring may occur on the cortical surface. This has been documented as uneven, small-sized, spaced, and we are not sure if it resulted from rubbing of broken fragments while the animal was alive and attempting to walk or some may have resulted from dessication of the bone after one year. When looking at them in detail, such breaks contain sometimes step-microfractures and angular (butterfly-like) outlines. Sometimes, they may be accompanied by pseudo-notches, which are distinct and not comparable to the deep notches that hammerstone breaking generates on the same types of bones. Commonly, the edges of the breaks show some polishing, probably from separate break planes rubbing against each other. It should be emphasized that the experimental work on hammerstone breaking documented by Haynes et al. (2021) is based on bone fracture properties of bones that are no longer completely green. The cracking documented in their hammerstone experimentation, with very irregular outlines differs from the cracking that we are documented in butchery of recently dead elephants.

      All this contrasts with the overlapping notches and flake scars (mostly occurring on the medullary side of the bone), both of them bigger in size, with clear smooth, spiral and longitudinal trajectories, with a more intensive modification on the medullary surface, and with sharp break edges resulting from hammerstone breaking of the green bone. No “natural” break has been documented replicating the same morphologies displayed in the Supplementary File to our paper. We display specimens with inflection points, hackle marks on the breaks, overlapping scarring on the medullary surface, with several specimens displaying percussion marks and pitting (also most likely percussion marks). Most importantly, we document this patterned modification on elements other than femora, for which no example has been documented of purported morphological equifinality caused by pre-mortem “natural” breaking. In contrast, such morphologies are documented in hammerstone-broken completely green bones (work in progress). We cited the works of Haynes to support this, because they do not show otherwise. As a matter of fact, Haynes himself had the courtesy of making a thorough reading of our manuscript and did not encounter any contradiction with his work. 

      Spatial association

      R2 argues in this regard:

      “The spatial analyses are technically correct, but their interpretation extends beyond what they can demonstrate. Clustering indicates proximity, not behavior. The claim that statistical results demonstrate a functional link between bones and artifacts is not justified. Other studies that use these methods combine them with direct modification evidence, which is lacking in this case.”

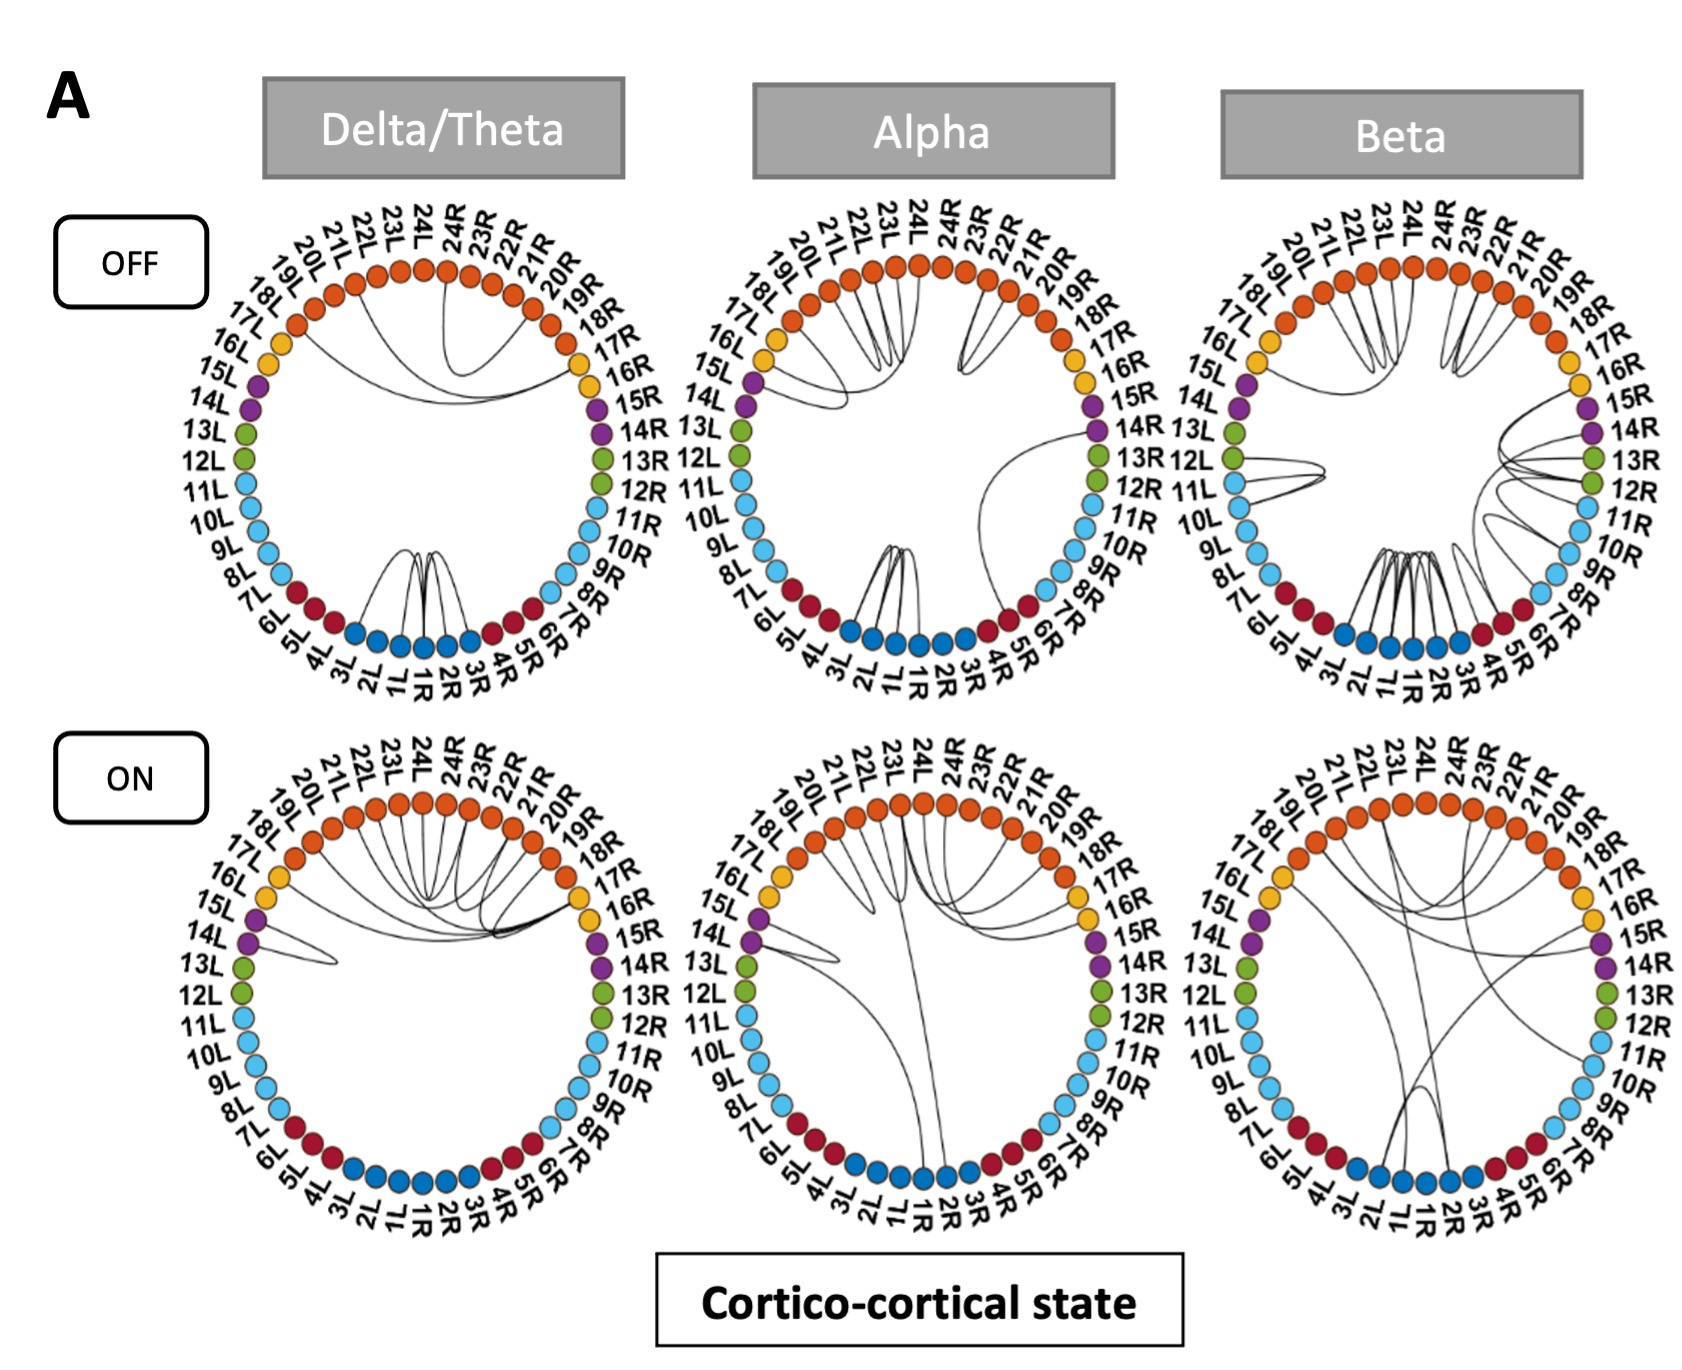
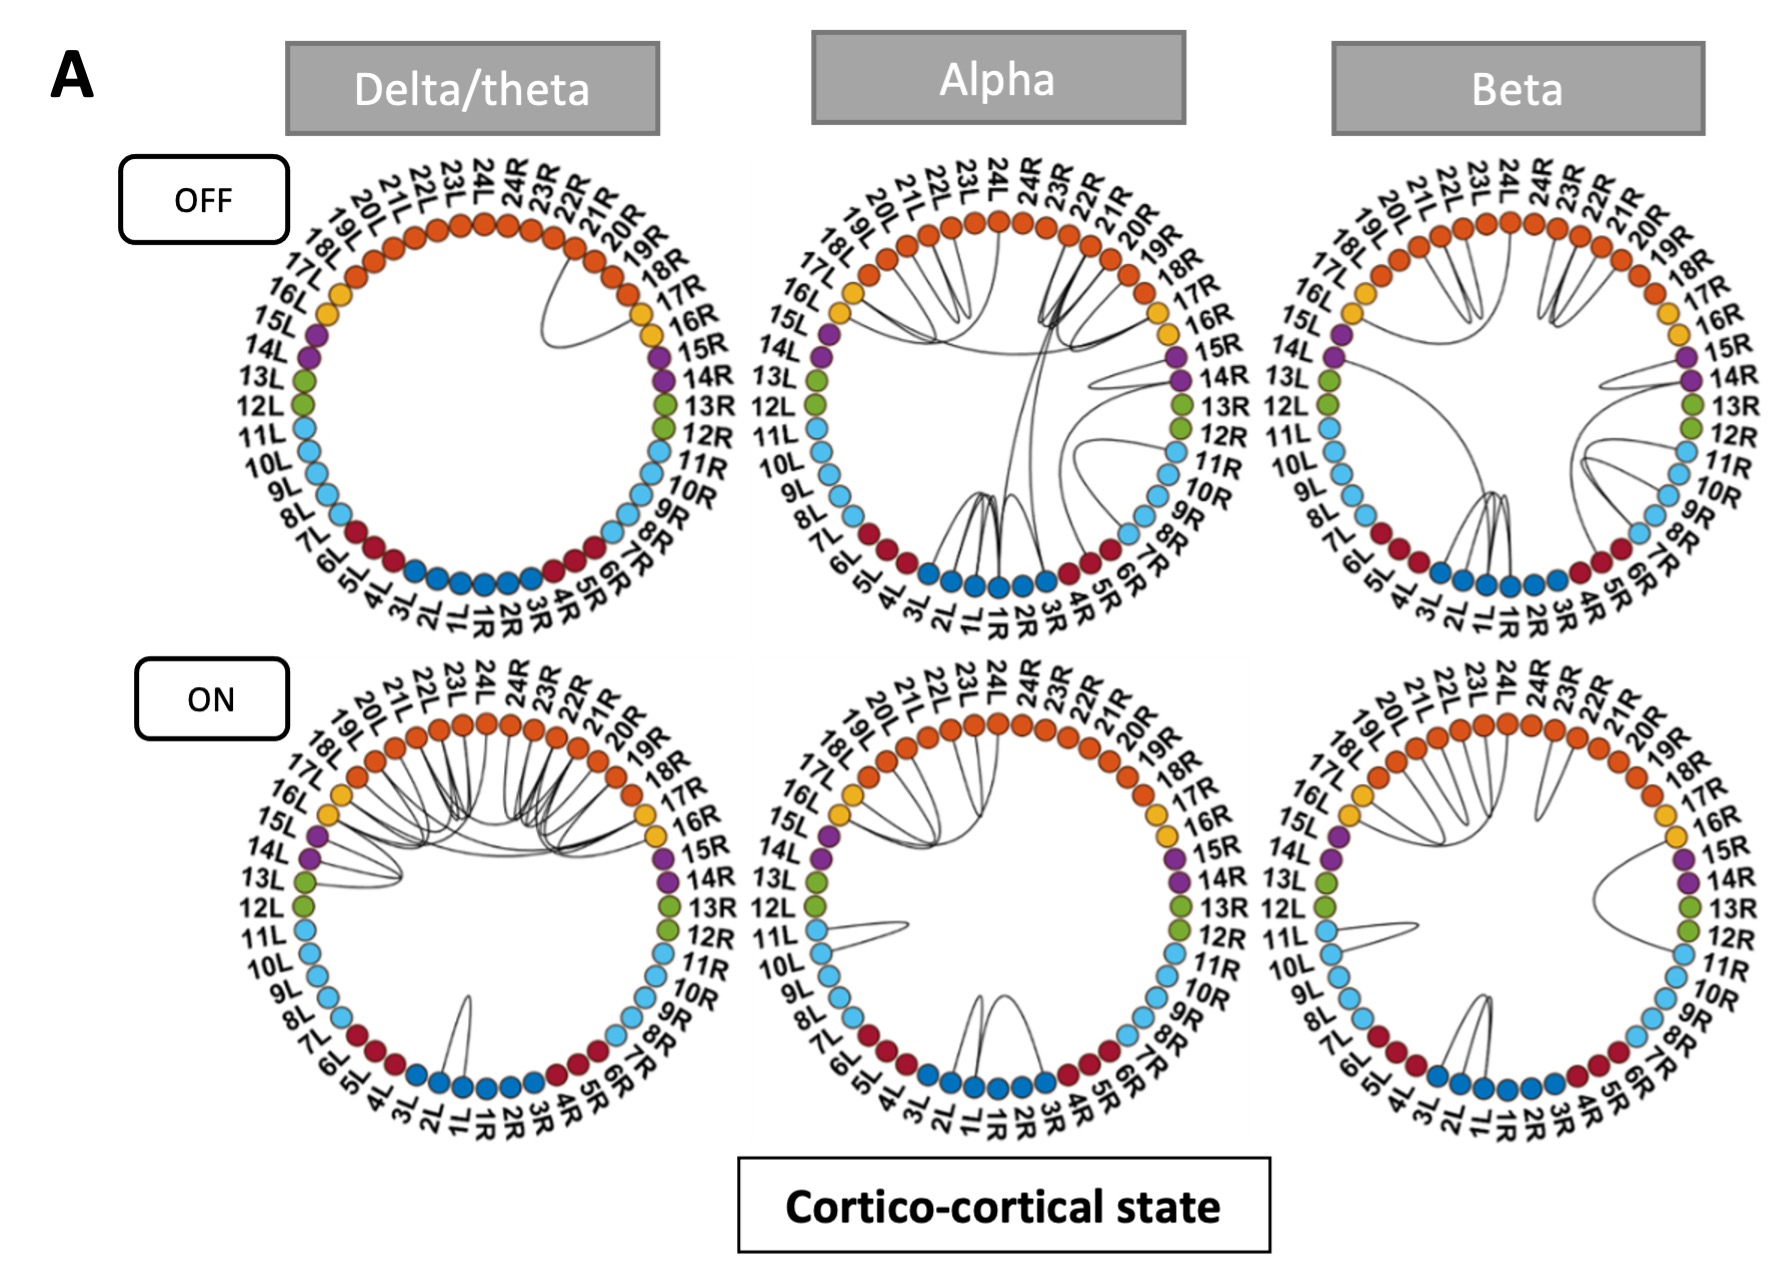
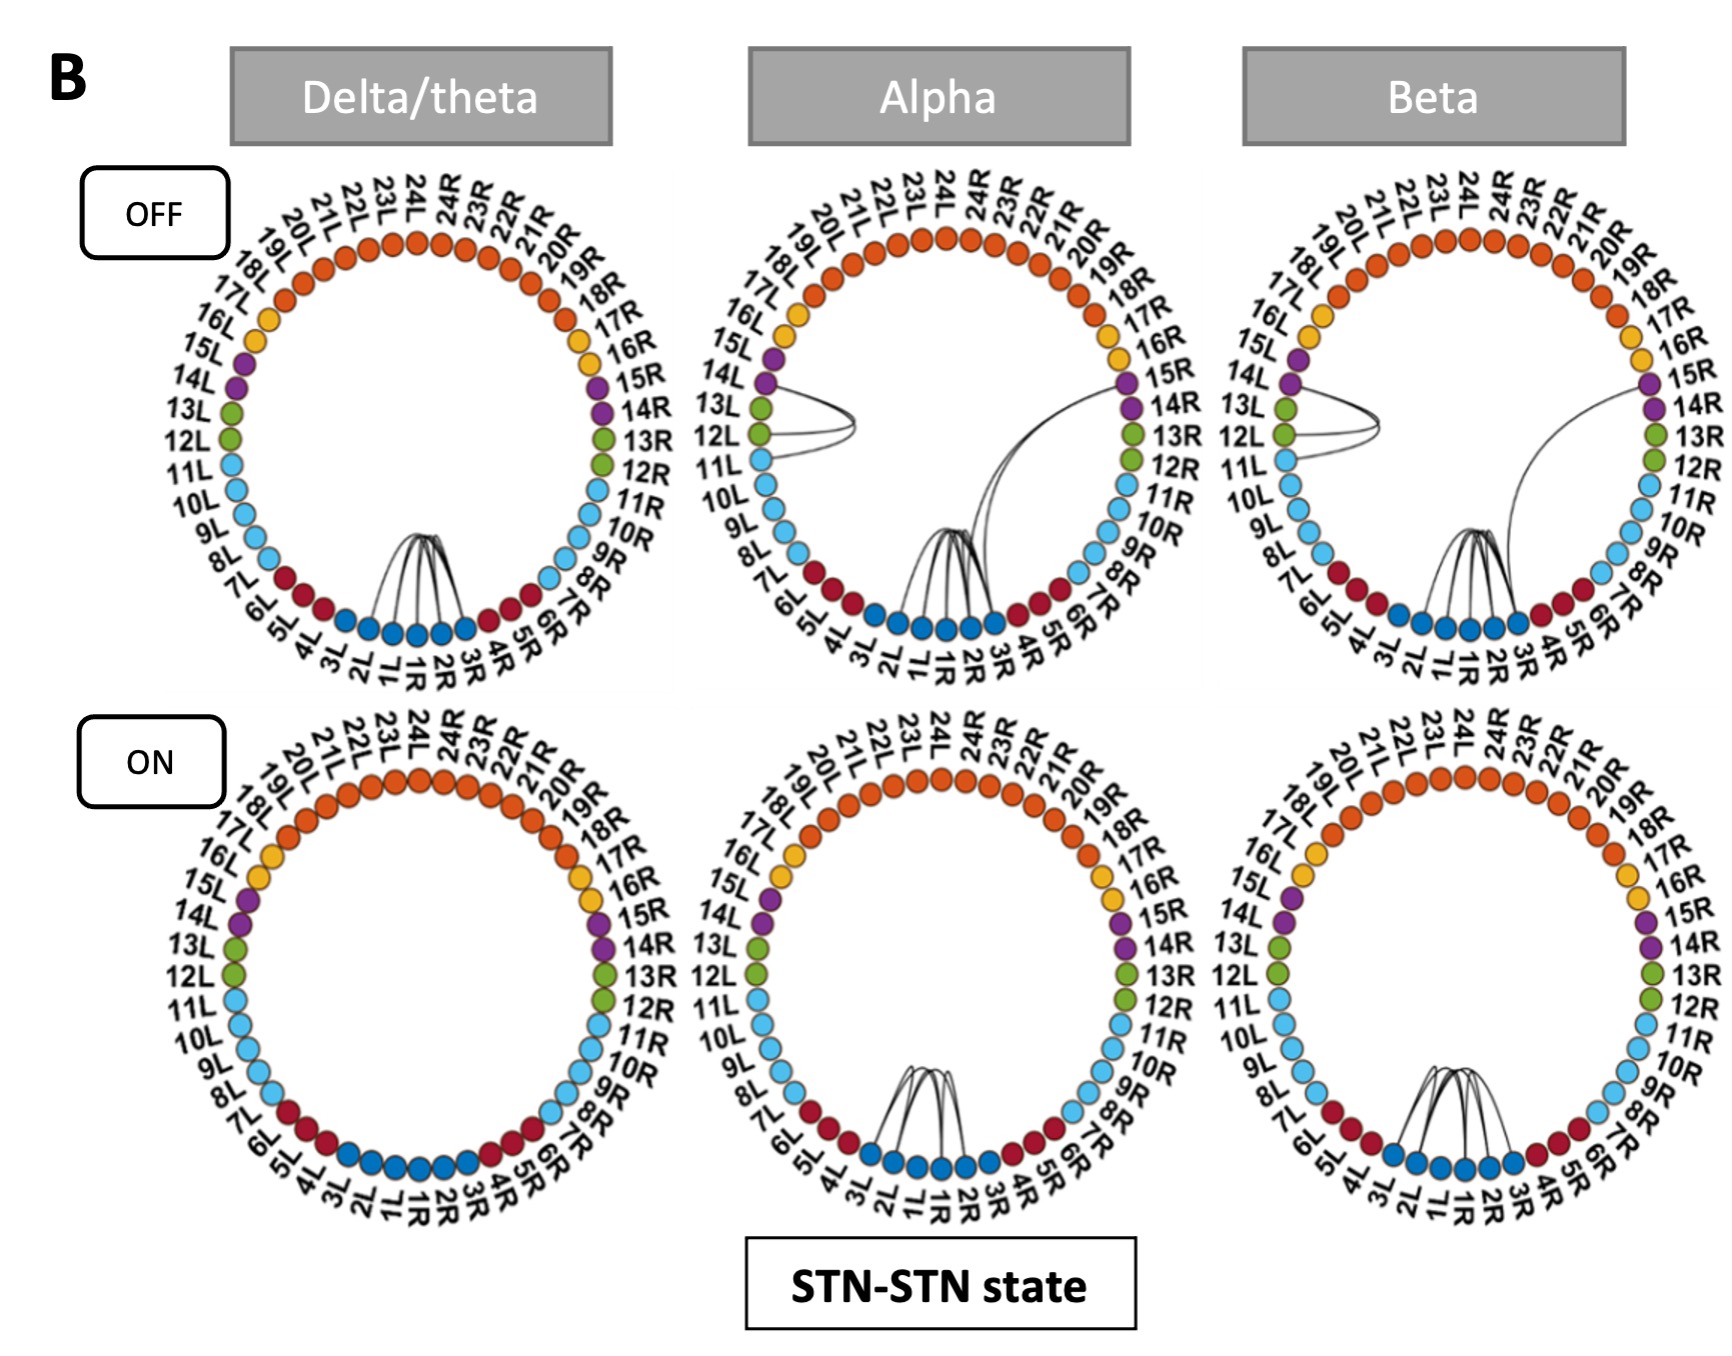
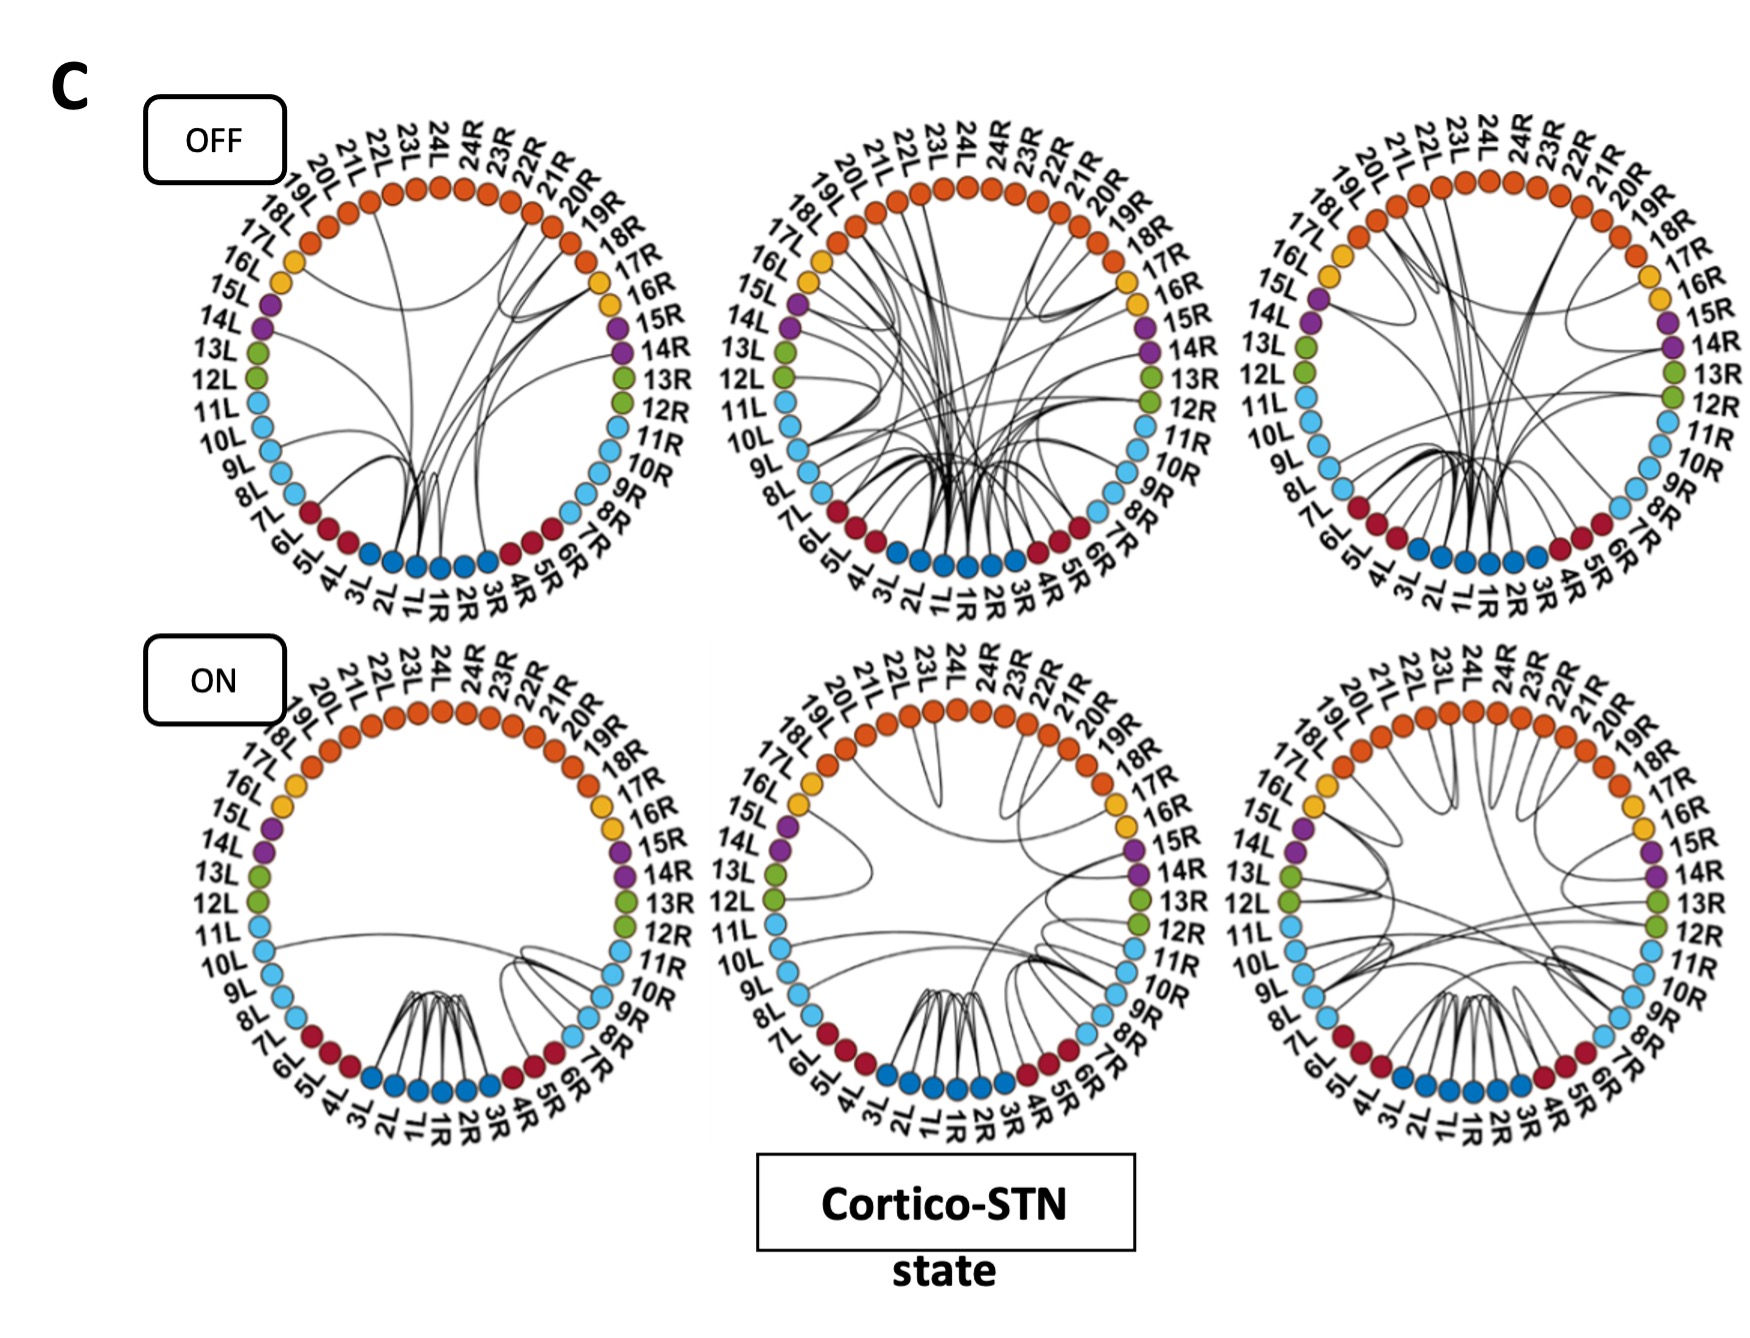
      We should emphasize that there is some confusion in the use and interpretation of clustering by R2 when applied to EAK. R2 appears to interpret clustering as the typical naked-eye perception of the spatial association of different items. In contrast, we rely on the statistical concept of clustering, more specifically on spatial interdependence or covariance, which is different. Items may appear visually clustered but still be statistically independent. This could, for example, result from two independent depositional episodes that happen to overlap spatially. In such cases, the item-to-item relationship does not necessarily show any spatial interdependence between classes other than simple clustering (i.e., spatial coincidence in intensity).

      Spatial statistical interdependence, on the other hand, reflects a spatial relationship or co-dependence between different items. This goes beyond the mere fact that classes appear clustered: items between classes may show specific spatial relationships — they may avoid each other or occupy distinct positions in space (regular co-dependence), or they may interact within the same spatial area (clustering co-dependence). Our tests indicate the latter for EAK.

      Such patterns are difficult to explain when depositional events are unrelated, since the probability that two independent events would generate identical spatial patterns in the same loci is very low. They are also difficult to reconcile when post-depositional processes intervene and resediment part of the assemblage (Domínguez-Rodrigo et al. 2018).

      Finally, R2 concludes:

      “The discussion treats different bodies of evidence unevenly. Well-documented cut-marked specimens from Nyayanga and other sites are described as uncertain, while less direct evidence at EAK is treated as decisive. This selective approach weakens the argument and creates inconsistency in how evidence is judged.”

      The Nyayanga hippo remains bearing modifications have not been well-documented cut marks. Neither R2 nor we can differentiate those marks from those inflicted by natural abrasive processes in coarse-grained sedimentary contexts, where the carcasses are found. The fact that the observable microscopic features (through low-quality photographs as appear in the original publication) differ between the cut marks documented on smaller animals and those inferred for the hippo remains makes them even more ambiguous. Nowhere in our manuscript do we treat the EAK evidence (or any other evidence) as decisive, but as the most likely given the methods used and the results reported.

      References

      Haynes G, Krasinski K, Wojtal P. 2021. A Study of Fractured Proboscidean Bones in Recent and Fossil Assemblages. Journal of Archaeological Method and Theory 28:956–1025.

      Domínguez-Rodrigo, M., Cobo-Sánchez, L., yravedra, J., Uribelarrea, D., Arriaza, C., Organista, E., Baquedano, E. 2018. Fluvial spatial taphonomy: a new method for the study of post-depositional processes. Archaeological and Anthropological Sciences 10: 1769-1789.

      Recommendations for authors:

      Reviewer #1 (Recommendations for the authors):

      I have several recommendations that, in my opinion, could enhance the communication of this study to the readers. The first point is the only crucial one.

      (1) A detailed zooarchaeological methods section must be added, with explanations (or references to them) of precisely how the authors defined and recorded bone-surface modifications and mode of bone fragmentation.

      This appears in the revised version of the manuscript in the form of a new sub-section within the Methods section.

      (2) The title could be improved to better represent the contents of the paper. It contains two parts: the earliest evidence for elephant butchery (that's ok), and revealing the evolutionary impact of megafaunal exploitation. The latter point is not actually revealed in the manuscript, just alluded to here and there (see also below).

      We have elaborated on this in the revised version, linking megafaunal exploitation and anatomical changes (which appear discussed in much more detail in the references indicated).

      (3) The abstract does not make it clear whether the authors think that the megafaunal adaptation strongly correlates with the Acheulian technocomplex. It seems that they do, so please make this point apparent in the abstract.

      From a functional point of view, we document the correlation, but do not believe in the causation, since most butchering tools around these megafaunal carcasses are typologically non Acheulian. We have indicated so in the abstract.

      (4) Please define what you mean by "megafauna". How large should an animal be to be considered as megafauna in this particular context?

      We have added this definition: we identify as “megafauna” those animals heavier than 800 kg.

      (5) In the literature survey, consider also this Middle Pleistocene case-study of elephant butchery, including a probable bone tool: Rabinovich, R., Ackermann, O., Aladjem, E., Barkai, R., Biton, R., Milevski, I., Solodenko, N., and Marder, O., 2012. Elephants at the middle Pleistocene Acheulian open-air site of Revadim Quarry, Israel. Quaternary International, 276, pp.183-197.

      Added to the revised version

      (6) The paragraph in lines 123-160 is unclear. Do the authors argue that the lack of evidence for processing elephant carcasses for marrow and grease is universal? They bring forth a single example of a much later (MIS 5) site in Germany. Then, the authors state the huge importance of fats for foragers (when? Where? Surely not in all latitudes and ecosystems). This left me confused - what exactly are you trying to claim here?

      We have explained this a little more in the revised text. What we pointed out was that most prehistoric (and modern) elephant butchery sites leave grease-containing long bones intact. Evidence of anthropogenic breakage of these elements is rather limited. The most probably reason is the overabundance of meat and fat from the rest of the carcass and the time-consuming effort needed to access the medullary cavity of elephant long bones.

      (7) The paragraph in lines 174-187 disrupts the flow of the text, contains previously mentioned information, ends with an unclear sentence, and could be cut.

      (8) Results: please provide the MNI for the EAK site (presumably 1, but this is never mentioned).

      Done in the revised version.

      (9) Lines 292 - 295: The authors found no traces of carnivoran activity (carnivoran remains, coprolites, or gnawing marks on the elephant bones), yet they attribute the absence of some non-dense skeletal elements to carnivore ravaging. I cannot understand this rationale, given that other density-mediated processes could have deleted the missing bones and epiphysis.

      This interpretation stems from our observations of several elephant carcasses in the Okavango delta in Botswana. Those that were monitored showed deletion of remains (i.e., disappearance of certain bones, like feet) without necessarily imprinting damage on the rest of the carcass. Carnivore intervention in an elephant death site can result in deletion of a few remains without much damage (if any), or if hyena clans access the carcass, much more conspicuous damage can be documented. There is a whole range of carnivore signatures in between. We are currently working on our study of several elephant carcasses subjected to these highly variable degrees of carnivore impact.

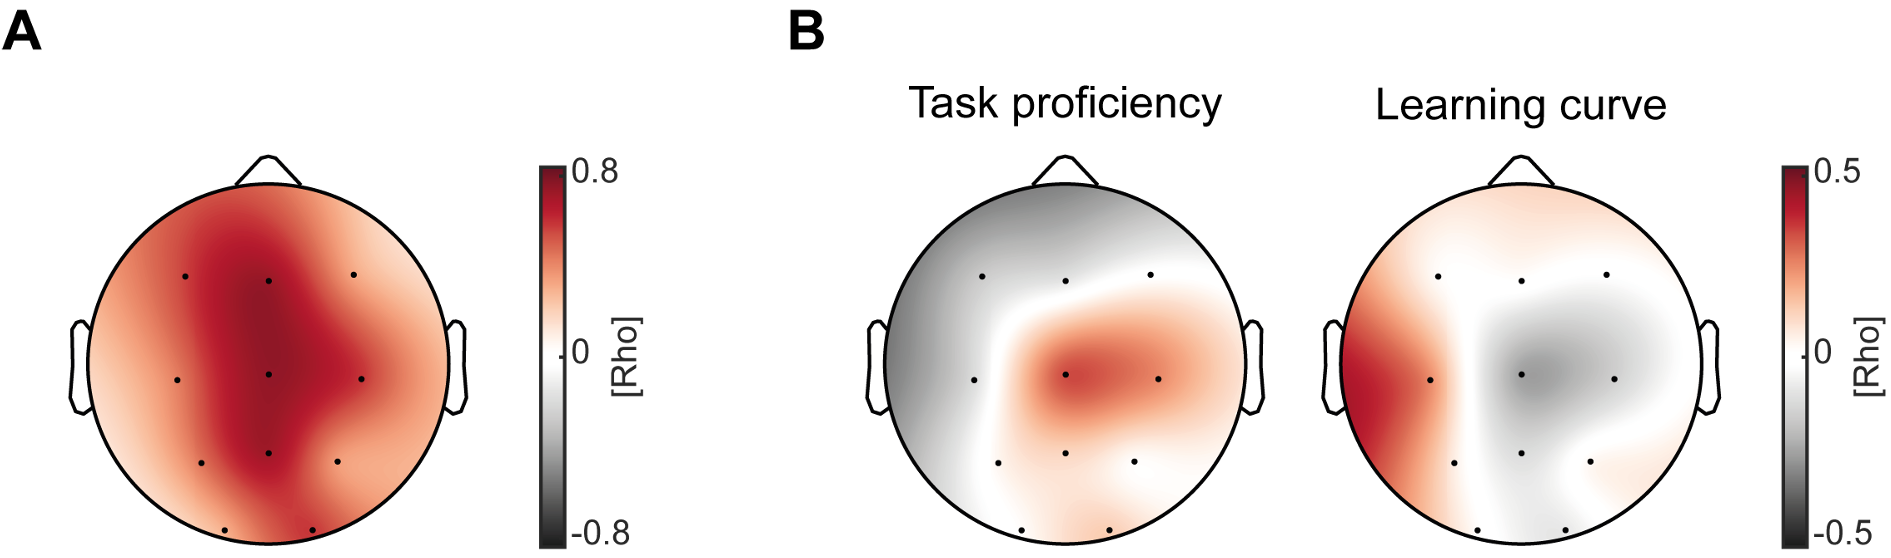
      (10) Lines 412 - 422: "The clustering of the elephant (and hippopotamus) carcasses in the areas containing the highest densities of landscape surface artifacts is suggestive of a hominin agency in at least part of their consumption and modification." - how so? It could equally suggest that both hominins and elephants were drawn to the same lush environments.

      We agree. Both hominins and megafauna must have been drawn to the same ecological loci for interaction to emerge. However, the fact that the highest density clusters of artifacts coincide with the highest density of carcasses “showing evidence of having been broken”, is suggestive of hominin use and consumption.

      (11) Discussion: I suggest starting the Discussion with a concise appraisal of the lines of evidence detailed in the Results and their interpretation, and only then, the critical reassessment of other studies. Similarly, a new topic starts in line 508, but without any subheading or an introductory sentence that could assist the readers.

      We added the introductory lines of the former Conclusion section to the revised Discussion section, as suggested by R1.

      (12) Line 607: Neumark-Nord are Late Pleistocene sites (MIS 5), not Middle Pleistocene.

      Corrected.

      (13) Regarding the ambiguity in how megafaunal exploitation may be causally related to the other features of the early Acheulian, the authors can develop the discussion. Alternatively, they should explicitly state that correlation is not causation, and that the present study adds the megafaunal exploitation element to be considered in future discussion of the shifts in lifestyles 1.8 million years ago.

      We have done so.

      Reviewer #2 (Recommendations for the authors):

      The following detailed comments are provided to help clarify arguments, ensure accurate representation of cited literature, and strengthen the logical and methodological framing of the paper. Line numbers refer to the version provided for review.

      (1) Line 55: Such concurrency (sometimes in conjunction with other variables)

      The term "other variables" is very vague. I would suggest expanding on this or taking it out altogether.

      (2) Line 146: Megafaunal long bone green breakage (linked to continuous spiral fractures on thick cortical bone) is probably a less ambiguous trace of butchery than "cut marks", since many of the latter could be equifinal and harder to identify, especially in contexts of high abrasion and trampling (Haynes et al., 2021, 2020).

      This reasoning is not supported by the evidence or the cited sources. Green-bone spiral fractures only show that a bone broke while it was fresh and do not reveal who or what caused it. Carnivore feeding, trampling, and natural sediment pressure can all create the same patterns, so these fractures are not clearer evidence of butchery than cut marks. Cut marks, when they are preserved and morphologically clear, remain the most reliable indicator of human activity. The Haynes papers actually show the opposite of what is claimed here. They warn that spiral fractures and surface marks can form naturally and that fracture patterns alone cannot be used to infer butchery. This section should be revised to reflect what those studies actually demonstrate.

      The reasoning referred to in line 146 is further explained below in the original text as follows:

      “Despite the occurrence of green fractures on naturally-broken bones, such as those trampled by elephants (Haynes et al., 2020), those occurring through traumatic fracturing or gnawed by carnivores (Haynes and Hutson, 2020), these fail to reproduce the elongated, extensive, or helicoidal spiral fractures (uninterrupted by stepped sections), accompanied by the overlapping conchoidal scars (both cortical and medullary), the reflected scarring, the inflection points, or the impact hackled break surfaces and flakes typical of dynamic percussive breakage. Evidence of this type of green breakage had not been documented earlier for the Early Pleistocene proboscidean or hippopotamid carcasses, beyond the documentation of flaked bone with the purpose of elaboration of bone tools (Backwell and d’Errico, 2004; Pante et al., 2020; Sano et al., 2020).”

      The problem in the way that R2 uses Haynes et al.´s works is that R2 uses features separately. Natural breaks occurring while the bone is green can generate spiral smooth breaks, for example, but it is not the presence of a single feature that invalidates the diagnosis of agency or that is taphonomically relevant, but the concurrence of several of them. The best example of a naturally (pre-mortem) broken bone was published by Haynes et al.

      The natural break shows helical fractures, subjugated to linear (angular) fracture outlines. Notice how the crack displays a zig-zag. The break is smooth but most damage occurs on the cortical surface, with flaking adjacent to the break and step micro-fracturing on the edges. The cortical scarring is discontinuous (almost marginal) and very small, almost limited to the very edge of the break. No modification occurs on the medullary surface. No extensive conchoidal fractures are documented, and certainly none inside the medullary surface of the break.

      Compare with Figure S8, S10, S17 and S34 (all specimens are shown in their medullary surface):

      In these examples, we see clearly modified medullary surfaces with multiple green breaks and large-sized step fractures, accompanied in some examples by hackle marks. Some show large overlapping scars (of substantially bigger size than those documented in the natural break image). Not a single example of naturally-broken bones has been documented displaying these morphologies simultaneously. It is the comprehensive analysis of the co-occurrence of these features and not their marginal and isolated occurrence in naturally-broken bones that make a difference in the attribution of agency. Likewise, no example of naturally-broken bone has been published that could mimic any of the two green-broken bones documented at EAK. In contrast, we do have bones from our on-going experimentation with green elephant carcasses that jointly reproduce these features. See also Figure 6 of the article to find another example without any modern referent in the naturally-broken bones documented.

      We should emphasize that R2 is inaccurately portraying what Haynes et al.´s results really document. Contrary to R2´s assertion, trampling does not reproduce any of the examples shown above. Neither do carnivores. It should be stressed that Haynes & Harrod only document similar overlapping scarring on the medullary surface of bones, when using much smaller animals. In all the carnivore damage repertoire that they document for elephants, durophagous spotted hyenas can only inflict furrowing on the ends of the biggest long bones, especially if they are adults. Long bone midshafts remain inaccessible to them. The mid-shaft portions of bones that we document in our Supplementary File and at EAK cannot be the result of hyena (or carnivore damage) for this reason, and also because their intense gnawing on elephant bones leaves tooth marking on most of the elements that they modify, being absent in our sample.

      (3) Line 176: other than hominins accessed them in different taphonomically-defined stages- stages - the "Stages" is repeated twice

      Defined in the revised version

      (4) Line 174: Regardless of the type of butchery evidence - and with the taphonomic caveat that no unambiguous evidence exists to confirm that megafaunal carcasses were hunted or scavenged other than hominins accessed them in different taphonomically-defined stages- stages - the principal reasons for exploring megafaunal consumption in early human evolution is its origin, its episodic or temporally-patterned occurrence, its impact on hominin adaptation to certain landscapes, and its reflection on hominin group size and site functionality.

      This sentence is confusing and needs to be rewritten for clarity. It tries to combine too many ideas at once, and the phrasing makes it hard to tell what the main point is. The taphonomic caveat in the middle interrupts the sentence and obscures the argument. It should be broken into separate, clearer statements that distinguish what evidence exists, what remains uncertain, and what the broader goals of the discussion are.

      We believe the ideas are displayed clearly

      (5) Line 179: landscapes, and its reflection on hominin group size and site functionality. If hominins actively sought the exploitation of megafauna, especially if targeting early stages of carcass consumption, the recovery of an apparent surplus of resources reflects a substantially different behavior from the small-group/small-site pattern documented at several earlier Oldowan anthropogenic sites (Domínguez-Rodrigo et al., 2019) -or some modern foragers, like the Hadza, who only exploit megafaunal carcasses very sporadically, mostly upon opportunistic encounters (Marlowe, 2010; O'Connell et al., 1992; Wood, 2010; Wood and Marlowe, 2013).

      This sentence makes a reasonable point, but is written in a confusing way. The idea that early, deliberate access to megafauna would represent a different behavioral pattern from smaller Oldowan or modern foraging contexts is valid, but the sentence is awkward and hard to follow. It should be rephrased to make the logic clearer and more direct.

      We believe the ideas are displayed clearly

      (6) Line 186: When the process started of becoming megafaunal commensal started has major implications for human evolution.

      This sentence is awkward and needs to be rewritten for clarity. The phrasing "when the process started of becoming megafaunal commensal started" is confusing and grammatically incorrect. It could be revised to something like "Determining when hominins first began to interact regularly with megafauna has major implications for human evolution," or another version that clearly identifies the process being discussed.

      Modified in the revised version

      (7) Line189: The multiple taphonomic biases intervening in the palimpsestic nature of most of these butchery sites often prevent the detection of the causal traces linking megafaunal carcasses and hominins. Functional links have commonly been assumed through the spatial concurrence of tools and carcass remains; however, this perception may be utterly unjustified as we argued above. Functional association of both archaeological elements can more securely be detected through objective spatial statistical methods. This has been argued to be foundational for heuristic interpretations of proboscidean butchery sites (Giusti, 2021). Such an approach removes ambiguity and solidifies spatial functional association, as demonstrated at sites like Marathousa 1 (Konidaris et al., 2018) or TK Sivatherium (Panera et al., 2019). This method will play a major role in the present study.

      This section overstates what spatial analysis can demonstrate and misrepresents the cited studies. The works by Giusti (2021), Konidaris et al. (2018), and Panera et al. (2019) do use spatial statistics to examine relationships between artifacts and faunal remains, but they explicitly caution that spatial overlap alone does not prove functional or behavioral association. These studies argue that clustering can support such interpretations only when combined with detailed taphonomic and stratigraphic evidence. None of them claims that spatial analysis "removes ambiguity" or "solidifies" functional links. The text should be revised to reflect the more qualified conclusions of those papers and to avoid implying that spatial statistics can establish behavioral causation on their own.

      We disagree. Both works (Giusti and Panera) use spatial statistical tools to create an inferential basis reinforcing a functional association of lithics and bones. In both cases, the anthropogenic agency inferred is based on that. We should stress that this only provides a basis for argumentation, not a definitive causation. Again, those analyses show much more than just apparent visual clustering.

      (8) Line 200: Here, we present the discovery of a new elephant butchery site (Emiliano Aguirre Korongo, EAK), dated to 1.78 Ma, from the base of Bed II at Olduvai Gorge. It is the oldest unambiguous proboscidean butchery site at Olduvai.

      It is fine to state the main finding in the introduction, but the phrasing here is too strong. Calling EAK "the oldest unambiguous proboscidean butchery site" asserts certainty before the evidence is presented. The claim should be stated more cautiously, for example, "a new site that provides early evidence for proboscidean butchery," so that the language reflects the strength of the data rather than pre-judging it.

      We understand the caution by R2, but in this case, EAK is the oldest taphonomically-supported evidence of elephant butchery at Olduvai (see discussion about FLK North in the text). Whether this is declared at the beginning or the end of the text is irrelevant.

      (9) Line 224: The drying that characterizes Bed II had not yet taken place during this moment.

      This sentence reads like a literal translation. It should be rewritten for clarity.

      Modified in the revised version

      (10) Line 233: During the recent Holocene, the EAK site was affected by a small landslide which displaced the...

      This section contains far more geological detail than is needed for the argument. The reader only needs to know that the site block was displaced by a small Holocene landslide but retains its stratigraphic integrity. The extended discussion of regional faults, seismicity, and slope processes goes well beyond what is necessary for context and distracts from the main focus of the paper.

      We disagree. The geological information is what is most commonly missing from most archaeological reports. Here, it is relevant because of the atypical process and because it has been documented only twice with elephant butchery sites. Explaining the dynamic geological process that shaped the site helps to understand its spatial properties.

      (11) Line 264: In June 2022, a partial elephant carcass was found at EAK on a fragmented stratigraphic block...

      This section reads like field notes rather than a formal site description. Most of the details about the discovery sequence, trench setup, and excavation process are unnecessary for the main text. Only the basic contextual information about the find location, stratigraphic position, and anatomical composition is needed. The rest could be condensed or moved to the methods or supplementary material.

      We disagree. See reply above.

      (12) Line 291: hominins or other carnivores. Ongoing restoration work will provide an accurate estimate of well-preserved and modified fractions of the assemblage.

      This sentence is unclear and needs to specify what kind of restoration work is being done and what is meant by well-preserved and modified fractions. It is not clear whether modified refers to surface marks, diagenetic alteration, or something else. If the bones are still being cleaned or prepared, the analysis is incomplete, and the counts cannot be considered final. If restoration only means conservation or stabilization, that should be stated clearly so the reader understands that it does not affect the results. As written, it is not clear whether the data presented here are preliminary or complete.

      We added: For this reason, until restoration is concluded, we cannot produce any asssertion about the presence or absence of bone surface modifications.

      (13) Line 294: The tibiae were well preserved, but the epiphyseal portions of the femora were missing, probably removed by carnivores, which would also explain why a large portion of the rib cage and almost all vertebrae are missing.

      This explanation is not well supported. The missing elements could be the result of other forms of density-mediated destruction, such as sediment compaction or post-depositional fragmentation, especially since no tooth marks were found. Given the low density of ribs, vertebrae, and femoral epiphyses, these processes are more likely explanations than carnivore removal. The text should acknowledge these alternatives rather than attributing the pattern to carnivore activity without direct evidence.

      Sediment compaction and post-depositional can break bones but cannot make them disappear. Our excavation process was careful enough to detect bone if present. Their absence indicates two possibilities: erosion through the years at the front of the excavation or carnivore intervention. Carnivores can take elephant bones without impacting the remaining assemblage (see our reply above to a similar comment).

      (14) Line 304: The fact that the carcass was moved while encased in its sedimentary context, along with the close association of stone tools with the elephant bones, is in agreement with the inference that the animal was butchered by hominins. A more objective way to assess this association is through spatial statistical analysis.

      The authors state that "the carcass was moved while encased in its sedimentary context, along with the close association of stone tools with the elephant bones, is in agreement with the inference that the animal was butchered by hominins." This does not logically follow. Movement of the block explains why the bones and tools remain together, not how that association was created. The preserved association alone does not demonstrate butchery, especially in the absence of cut marks or other direct evidence of hominin activity.

      Again, we are sorry that R2 is completely overlooking the strong signal detected by the spatial statistical analysis. The way that the block moved, it preserved the original association of bones and tools. This statement is meant to clarify that despite the allochthonous nature of the block, the original autochthonous depositional process of both types of archaeological materials has been preserved. The spatial association, as statistically demonstrated, indicates that the functional link is more likely than any other alternative process. The additional fact that nowhere else in that portion of the outcrop do we identify scatters of tools (all appear clustered at a landscape scale with the elephant) adds more support to this interpretation. This would have been further supported by the presence of cut marks, no doubt, but their absence does not indicate lack of functional association, since as Haynes´ works have clearly shown, most bulk defleshing of modern elephant leaves no traces on most bones.

      (15) Line 370: This also shows that the functional connection between the elephant bones and the tools has been maintained despite the block post-sedimentary movement.

      The spatial analyses appear to have been carried out appropriately, and the interpretations of clustering and segregation are consistent with the reported results. However, the conclusion that the "functional connection" between bones and tools has been maintained goes beyond what spatial correlation alone can demonstrate. These analyses show spatial proximity and scale-dependent clustering but cannot, by themselves, confirm a behavioral or functional link.

      R2 is making this comment repeatedly and we have addressed it more than once above. We disagree and we refer to our replies above to sustain it.

      (16) Line 412: The clustering of the elephant (and hippopotamus) carcasses in the areas containing the highest densities of landscape surface artifacts is suggestive of a hominin agency in at least part of their consumption and modification. The presence of green broken elephant long bone elements in the area surveyed is only documented within such clusters, both for lower and upper Bed II. This constitutes inverse negative evidence for natural breaks occurring on those carcasses through natural (i.e., non-hominin) pre- and peri-mortem limb breaking (Haynes et al., 2021, 2020; Haynes and Hutson, 2020). In this latter case, it would be expected for green-broken bones to show a more random landscape distribution, and occur in similar frequencies in areas with intense hominin landscape use (as documented in high density artifact deposition) and those with marginal or non-hominin intervention (mostly devoid of anthropogenic lithic remains).

      The clustering of green-bone fractures with stone tools is intriguing but should be interpreted cautiously. The Haynes references are misrepresented here. Those studies address both cut marks and green-bone (spiral) fractures, emphasizing that each can arise through non-hominin processes such as trampling, carcass collapse, and sediment loading. They do not treat green fractures as clearer evidence of butchery; in fact, they caution that such breakage patterns can occur naturally and even form clustered distributions in areas of repeated animal activity. The claim that these studies support spiral fractures as unambiguous indicators of hominin activity, or that natural breaks would be randomly distributed, is not accurate.

      We would like to emphasize again that the Haynes´references are not misrepresented here. See our extensive reply above. If R2 can provide evidence of natural breakage patterns resulting from pre-mortem limb breaking or post-mortem trampling resulting in all limb bones being affected by these processes and resulting in smooth spiral breaks, accompanied with extensive and overlapping scarring on the medullary surface, in conjunction with the other features described in our replies above, then we would be willing to reconsider. With the evidence reported until now, that does not occur simultaneously on specimens resulting from studies on modern elephant bones.

      R2 seems to contradict him(her)self here by saying that Haynes studies show that cut marks are not reliable because they can also be reproduced via trampling. Until this point, R2 had been saying that only cut marks could demonstrate a functional link and support butchery. Haynes´ studies do not deal experimentally with sediment loading.

      (17) Line 424: This indicates that from lower Bed II (1.78 Ma) onwards, there is ample documented evidence of anthropogenic agency in the modification of proboscidean bones across the Olduvai paleolandscapes. The discovery of EAK constitutes, in this respect, the oldest evidence thereof at the gorge. The taphonomic evidence of dynamic proboscidean bone breaking across time and space supports, therefore, the inferences made by the spatial statistical analyses of bones and lithics at the site.

      This conclusion is overstated. The claim of "ample documented evidence of anthropogenic agency" is too strong, given that the main support comes from indirect indicators like green-bone fractures and spatial clustering rather than clear butchery marks. It would be more accurate to say that the evidence suggests or is consistent with possible hominin involvement. The final sentence also conflates association with causation; spatial and taphonomic data can indicate a relationship, but do not confirm that the carcasses were butchered by hominins.

      The evidence is based on spatially clustering (at a landscape scale) of tools and elephant (and other megafaunal taxa) bones, in conjunction with a large amount of green-broken elements. This interpretation, if we compare it against modern referents is supported even stronger. In the past few years, we have been conducting work on modern naturally dead elephant carcasses in Botswana and Zambia, and of the several carcasses that we have seen, we have not identified a single case of long bone shaft breaks like those described by Haynes as natural or like those we describe here as anthropogenic. This probably means that they are highly unlikely or marginal occurrences at a landscape scale. This seems to be supported by Haynes´ work too. Out of the hundreds of elephant carcasses that he has monitored and studied over the years for different works, we have managed to identify only two instances where he described natural pre-mortem breaks. This certainly qualifies as extremely marginal. 

      Most of the Results section is clearly descriptive, but beginning with "The clustering of the elephant (and hippopotamus) carcasses..." the text shifts from reporting observations to drawing behavioral conclusions. From this point on, it interprets the data as evidence of hominin activity rather than simply describing the patterns. This part would be more appropriate for the Discussion, or should be rewritten in a neutral, descriptive way if it is meant to stay in the Results.

      This appears extensively discussed in the Discussion section, but the data presented in the results is also interpreted in that section, following a clear argumental chain.

      (18) Line 433: A recent discovery of a couple of hippopotamus partial carcasses at the 3.0-2.6 Ma site of Nyayanga (Kenya), spatially concurrent with stone artifacts, has been argued to be causally linked by the presence of cut marks on some bones (Plummer et al., 2023). The only evidence published thereof is a series of bone surface modifications on a hippo rib and a tibial crest, which we suggest may be the result of byproduct of abiotic abrasive processes; the marks contrast noticeably with the well-defined cut marks found on smaller mammal bones (Plummer et al. ́s 2023: Figure 3C, D) associated with the hippo remains (Plummer et al., 2023).

      The authors suggest that the Nyayanga marks could result from abiotic abrasion, but this claim does not engage with the detailed evidence presented by Plummer et al. (2023). Plummer and colleagues documented well-defined, morphologically consistent cut marks and considered the sedimentary context in their interpretation. Raising abrasion as a general possibility without addressing that analysis gives the impression of selective skepticism rather than an evaluation grounded in the published data.

      We disagree again on this matter. R2 does not clarify what he/she means by well-defined or morphologically consistent. We provide an alternative interpretation of those marks that fit their morphology and features and that Plummer at al did not successfully exclude. We also emphasize that the interpretation of the Nyayanga marks was made descriptively, without any analytical approach and with a high degree of subjectivity by the researcher. All of this disqualifies the approach as well defined and keeps casting an old look at modern taphonomy. Descriptive taphonomy is a thing of the 1980´s. Today there are a plethora of analytical methods, from multivariate statistics, to geometric morphometrics to AI computer vision (so far the most reliable) which represent how taphonomy (and more specifically, analysis of bone surface modifications) should be conducted in the XXI century. This approaches would reinforce interpretations as preliminarily published by Plummer et al, provided they reject alternative explanations like those that we have provided.

      (19) Line 459: It would have been essential to document that the FLK N6 tools associated with the elephant were either on the same depositional surface as the elephant bones and/or on the same vertical position. The ambiguity about the FLK N6 elephant renders EAK the oldest secure proboscidean butchery evidence at Olduvai, and also probably one of the oldest in the early Pleistocene elsewhere in Africa.

      The concern about vertical mixing is fair, but the tone makes it sound like the association is definitely not real. It would be more accurate to say that the evidence is ambiguous, not that it should be dismissed altogether.

      We have precisely done so. We do not dismiss it, but we cannot take it for anything solid since we excavated the site and show how easily one could make functional associations if forgetting about the third dimension. It is not a secure butchery site. This is what we said and we stick to this statement.

      (20) Line 479: In all cases, these wet environments must have been preferred places for water-dependent megafauna, like elephants and hippos, and their overlapping ecological niches are reflected in the spatial co-occurrence of their carcasses. Both types of megafauna show traces of hominin use through either cutmarked or percussed bones, green-broken bones, or both (Supplementary Information).

      The environmental part is good, but the behavioral interpretation is too strong. Saying elephants and hippos "must have been" drawn to these areas is too certain, and claiming that both "show traces of hominin use" makes it sound like every carcass was modified. It should be clearer that only some have possible evidence of this.

      The sentence only refers to both types of fauna taxonomically. No inference can be drawn therefor that all carcasses are modified.

      (21) Line 496: In most green-broken limb bones, we document the presence of a medullary cavity, despite the continuous presence of trabecular bone tissue on its walls.

      This sentence is confusing and doesn't seem to add anything meaningful. All limb bones naturally have a medullary cavity lined with trabecular bone, so it's unclear why this is noted as significant. The authors should clarify what they mean here or remove it if it's simply describing normal bone structure.

      No. Modern elephant long bones do not have a hollow medullary cavity. All the medullary volume is composed of trabecular tissue. Some elephants in the past had hollow medullary cavities, which probably contained larger amounts of marrow and fat. 

      (22) Line 518: We are not confident that the artefacts reported by de la Torre et al are indeed tools.

      While I generally agree with this statement, the paragraph reads as defensive rather than comparative. It would help if they briefly summarized what de la Torre et al. actually argued before explaining why they disagree.

      We devote two full pages of the Discussion section to do so precisely.

      (23) Lines 518-574: They are similar to the green-broken specimens that we have reported here...

      This part is very detailed but inconsistent. They argue that the T69 marks could come from natural processes, but they use similar evidence (green fractures, overlapping scars) to argue for human activity at EAK. If equifinality applies to one, it applies to both.

      We are confused by this misinterpretation. Features like green fractures and overlapping scars (among others) can be used to detect anthropogenic agency in elephant bone breaking; that is, any given specimen can be determined to have been an “artifact” (in the sense of human-created item), but going from there to interpreting an artifact as a tool, there is a large distance. Whereas an artifact (something made by a human) can be created indirectly through several processes (for example, demarrowing a bone resulting in long bone fragments), a tool suggest either intentional manufacture and use or both. That is the difference between de la Torre et al.´s interpretation and ours. We believe that they are showing anthropogenically-made items, but they have provided no proof that they were tools.

      (24) Line 576: A final argument used by the authors to justify the intentional artifactual nature of their bone implements is that the bone tools were found in situ within a single stratigraphic horizon securely dated to 1.5 million years ago, indicating systematic production rather than episodic use. This is taphonomically unjustified.

      The reasoning here feels uneven in how clustering evidence is used. At EAK, clustering of bones and artifacts is taken as meaningful evidence of hominin activity, but here the same pattern at T69 is treated as a natural by-product of butchery or carnivore activity. If clustering alone cannot distinguish between intentional and incidental association, the authors should clarify why it is interpreted as diagnostic in one case but not in the other.

      Again, we are confused by this misinterpretation. It applies to two different scenarios/questions:

      a) is there a functional link between tools and bones at EAK and T69? We have statistically demonstrated that at EAK and we think de la Torre et al. is trying to do the same for T69, although using a different method. 

      b) Are the purported tools at T69 tools? Are those that we report here tools? In this regard there is no evidence for either case and given that several bones from T69 come from animals smaller than elephants, we do not discard that carnivores might have been responsible for those, whereas hominin butchery might have been responsible for the intense long limb breaking at that site. It remains to be seen how many (if any) of those specimens were tools.

      (25) Line 600: If such a bone implement was a tool, it would be the oldest bone tool documented to date (>1.7 Ma).

      The comparison to prior studies is useful, and the point about missing use-wear traces is well taken. However, the last lines feel speculative. If no clear use evidence has been found, it's premature to suggest that one specimen "would be the oldest bone tool." That claim should be either removed or clearly stated as hypothetical.

      It clearly reads as hypothetical.

      (26) Line 606: Evidence documents that the oldest systematic anthropogenic exploitation of proboscidean carcasses are documented (at several paleolandscape scales) in the Middle Pleistocene sites of Neumark-Nord (Germany)(Gaudzinski-Windheuser et al., 2023a, 2023b).

      This is the first and only mention of Neumark-Nord in the paper, and it appears without any prior discussion or connection to the rest of the study. If this site is being used for comparison or as part of a broader temporal framework, it needs to be introduced and contextualized earlier. As written, it feels out of place and disconnected from the rest of the argument.

      This is a Late Pleistocene site and we do not see the need to present it earlier, given that the scope of this work is Early Pleistocene.

      (27) Line 608: Evidence of at least episodic access to proboscidean remains goes back in time (see review in Agam and Barkai, 2018; Ben-Dor et al., 2011; Haynes, 2022).

      The distinction between "systematic" and "episodic" exploitation is useful, but the authors should clarify what criteria define each. The phrase "episodic access...goes back in time" is vague and could be replaced with a clearer statement summarizing the nature of the earlier evidence.

      It is self-explanatory

      (28) Line 610: Redundant megafaunal exploitation is well documented at some early Pleistocene sites from Olduvai Gorge (Domínguez-Rodrigo et al., 2014a, 2014b; Organista et al., 2019, 2017, 2016).

      The phrase "redundant megafaunal exploitation" needs clarification. "Redundant" is not standard terminology in this context. Does this mean repeated, consistent, or overlapping behaviors? Also, while these same Olduvai sites are mentioned earlier, this phrasing also introduces new interpretive language not used before and implies a broader behavioral generalization than what the data actually show.

      Webster: Redundant means repetitive, occurring multiple times.

      (29) Line 612: At the very same sites, the stone artifactual assemblages, as well as the site dimensions, are substantially larger than those documented in the Bed I Oldowan sites (Diez-Martín et al., 2024, 2017, 2014, 2009).

      The placement and logic of this comparison are unclear. The discussion moves from Middle Pleistocene Neumark-Nord to early Pleistocene Olduvai sites, then to Bed I Oldowan contexts without clearly signaling the temporal or geographic transitions. If the intent is to contrast Acheulean vs. Oldowan site scale or organization, that connection needs to be made explicit. As written, it reads as a disjointed shift rather than a continuation of the argument.

      We disagree. Here, we finalize by bringing in some more recent assemblages where hominin agency is not in question.

      (30) Line 616: Here, we have reported a significant change in hominin foraging behaviors during Bed I and Bed II times, roughly coinciding with the replacement of Oldowan industries by Acheulian tool kits -although during Bed II, both industries co-existed for a substantial amount of time (Domínguez-Rodrigo et al., 2023; Uribelarrea et al., 2019, 2017).

      This section should be restructured for flow. The reference to behavioral change during Bed I-II and the overlap of Oldowan and Acheulean industries is important, but feels buried after a long detour. Consider moving this earlier or rephrasing so the main conclusion (behavioral change across Beds I-II) is clearly stated first, followed by supporting examples.

      It is not within the scope of this work and is properly described in the references mentioned.

      (31) Line 620: The evidence presented here, together with that documented by de la Torre et al. (2025), represents the most geographically extensive documentation of repeated access to proboscidean and other megafaunal remains at a single fossil locality.

      The phrase "most geographically extensive documentation of repeated access" overstates what has been demonstrated. The evidence presented is site-specific and does not justify such a broad superlative. This should be toned down or supported with comparative quantitative data.

      We disagree. There is no other example where such an abundant record of green-broken elements from megafauna is documented. Neumark-Nord is more similar because it shows extensive evidence of butchery, but not so much about degreasing.

      (32) Line 623: The transition from Oldowan sites, where lithic and archaeofaunal assemblages are typically concentrated within 30-40 m2 clusters, to Acheulean sites that span hundreds or even over 1000 m2 (as in BK), with distinct internal spatial organization and redundancy in space use across multiple archaeological layers spanning meters of stratigraphic sequence (Domínguez-Rodrigo et al., 2014a, 2009b; Organista et al., 2017), reflects significant behavioral and technological shifts.

      This sentence about site size and spatial organization repeats earlier claims without adding new insight. If it's meant as a synthesis, it should explicitly say how the spatial expansion relates to changes in behavior or mobility, not just describe the difference.

      In the Conclusion section these correlations have been explained in more detail to add some causation.

      (33) Line 628: This pattern likely signifies critical innovations in human evolution, coinciding with major anatomical and physiological transformations in early hominins (Dembitzer et al., 2022; Domínguez-Rodrigo et al., 2021, 2012).

      The conclusion that this "signifies critical innovations in human evolution" is too sweeping, given the data presented. It introduces physiological and anatomical transformation without connecting it to any evidence in this paper. Either cite the relevant findings or limit the claim to behavioral implications.

      The references cited elaboration in extension this. The revised version of the Conclusion section also elaborates on this.

      Overall, the conclusions section reads as a loosely connected set of assertions rather than a focused synthesis. It introduces new interpretations and terminology not supported or developed earlier in the paper, and the argument jumps across temporal and geographic scales without clear transitions. The discussion should be restructured to summarize key results, clarify the scope of interpretation, and avoid speculative or overstated claims about evolutionary significance.

      We have done so, supported by the references used in addition to extending some of the arguments

      (34) Line 639: The systematic excavation of the stratigraphic layers involved a small crew.

      This sentence is not necessary.

      No comment

      (35) Line 643: The orientation and inclination of the artifacts were recorded using a compass and an inclinometer, respectively.

      What were these measurements used for (e.g., post-depositional movement analysis, spatial patterning)? A short note on the purpose would make this more meaningful.

      Fabric analysis has been added to the revised version.

      (36) Line 659: Restoration of the EAK elephant bones

      This section could be streamlined and clarified. It includes procedural detail that doesn't contribute to scientific replicability (e.g., the texture of gauze, number of consolidant applications), while omitting some key information (such as how restoration may have affected analytical results). It also contains interpretive comments ("most of the assemblage has been successfully studied") that don't belong in Methods.

      No comment

      (37) Line 689: In the field laboratory, cleaning of the bone remains was carried out, along with adhesion of fragments and their consolidation when necessary.

      Clarify whether cleaning or adhesion treatments might obscure or alter bone surface modifications, as this has analytical implications.

      These protocols do not impact bone like that anymore.

      (38) Line 711: (b) Percussion Tools - Includes hammerstones or cobbles exhibiting diagnostic battering, pitting, and/or impact scars consistent with percussive activities.

      Define how diagnostic features (battering, pitting) were identified - visual inspection, magnification, or quantitative criteria?

      Both macro and microscopically

      (39) Line 734: We conducted the analysis in three different ways after selecting the spatial window, i.e., the analysed excavated area (52.56 m2).

      Clarify why the 52.56 m<sup>2</sup> spatial window was chosen. Was this the total excavated area or a selected portion?

      It was what was left of the elephant accumulation after erosion.

      (40) Line 728: The spatial statistical analyses of EAK.

      Adding one or two sentences at the start explaining the analytical objective, such as testing spatial association between faunal and lithic materials, would help readers understand how each analysis relates to the broader research questions.

      This is well explained in the main text

      (41) Line 782: An intensive survey seeking stratigraphically-associated megafaunal bones was carried out in the months of June 2023 and 2024.

      It would help to specify whether the same areas were resurveyed in both field seasons or if different zones were covered each year. This information is important for understanding sampling consistency and potential spatial bias.

      Both areas were surveyed in both field seasons. We were very consistent.

      (42) Line 787: We focused on proboscidean bones and used hippopotamus bones, some of the most abundant in the megafaunal fossils, as a spatial control.

      Clarify how the hippopotamus remains functional as a "spatial control." Are they used as a proxy for water-associated taxa to test habitat patterning, or as a baseline for comparing carcass distribution? The meaning of "control" in this context is ambiguous.

      As a proxy for megafaunal distribution given their greater abundance over any other megafaunal taxa.

      (43) Line 789: Stratigraphic association was carried out by direct observation of the geological context and with the presence of a Quaternary geologist during the whole survey.

      This is good methodological practice, but it would be helpful to describe how stratigraphic boundaries were identified in the field (for example, by reference to tuffs or marker beds). That information would make the geological framework more replicable.

      This is basic geological work. Of course, both tuffs and marker beds were followed.

      (44) Line 791: When fossils found were ambiguously associated with specific strata, these were excluded from the present analysis.

      You might specify what proportion of the total finds were excluded due to uncertain stratigraphic association. Reporting this would indicate the strength of the stratigraphic control.

      This was not quantified but it was a very small amount compared to those whose stratigraphic provenience was certain.

      (45) Line 799: The goals of this survey were: a) collect a spatial sample of proboscidean and megafaunal bones enabling us to understand if carcasses on the Olduvai paleolandscapes were randomly deposited or associated to specific habitats.

      You might clarify how randomness or habitat association was tested.

      Randomness was tested spatially and comparing density according to ecotone. Same for habitat association.

      (46) The Methods section provides detailed information about excavation, restoration, and spatial analyses but omits critical details about the zooarchaeological and taphonomic procedures. There is no explanation of how faunal remains were analyzed once recovered, including how cut marks, percussion marks, or green bone fractures were identified or what magnification or diagnostic criteria were used. The authors also do not specify the analytical unit used for faunal quantification (e.g., NISP, MNI, MNE, or other), making it unclear how specimen counts were generated for spatial or taphonomic analyses. Even if these details are provided in the Supplementary Information, the main text should include at least a concise summary describing the analytical framework, the criteria for identifying surface modifications and fracture morphology, and the quantification system employed. This information is essential for transparency, replicability, and proper evaluation of the behavioral interpretations.

      See reply above. There is a new subsection on taphonomic methods now.

      Supplementary information:

      (47) The Supplementary Information includes a large number of green-broken proboscidean specimens from other Olduvai localities (BK, LAS, SC, FLK West), but it is never explained why these are shown or how they relate to the EAK study. The main analysis focuses entirely on the EAK elephant, including so much unrelated material without any stated purpose, which makes the supplement confusing. If these examples are meant only to illustrate the appearance of green fractures, that should be stated. Otherwise, the extensive inclusion of non-EAK material gives the impression that they were part of the analyzed assemblage when they were not.

      This is stated in the opening paragraph to the section.

      (48) Line 96: A small collection of green-broken elephant bones was retrieved from the lower and upper Bed II units.

      It would help to clarify whether these specimens are part of the EAK assemblage or derive from other Bed II localities. As written, it is not clear whether this description refers to material analyzed in the main text or to comparative examples shown only in the Supplementary Information.

      No, EAK only occupies the lower Bed II section. They belong in the Bed II paleolandscape units.

      (49) Line 97: One of them, a proximal femoral shaft found within the LAS unit, has all the traces of having been used as a tool (Figure 6).

      This says the bone tool in Figure 6 is from LAS, but the main text caption identifies it as from EAK. If I am not mistaken, EAK is a site at the base of Bed II, and LAS is a separate stratigraphic unit higher in the sequence, so the authors should clarify which is correct.

      Our mistake. It provenience is from LAS in the vicinity of EAK.

      (50) Line 186: Figure S20. Example of other megafaunal long bone shafts showing green breaks.

      Not cited in text or SI narrative. No indication where these bones come from or why they are relevant.

      It appears justified in the revised version.

      (51) Line 474: Figure S28-S30. Hyena-ravaged giraffe bones from Chobe (Botswana).

      These figures are not discussed in the text or SI, and their relevance to the study is unclear. The authors should explain why these modern comparative examples were included and how they inform interpretations of the Olduvai assemblages.

      It appears justified in the revised version.

      (52) Line 498: Figure S31. Bos/Bison bone from Bois Roche (France).

      This figure is not mentioned in the text or Supplementary Information. The authors should specify why this specimen is shown and how it contributes to the study's taphonomic or behavioral comparisons.

      It appears justified in the revised version.

      (53) Line 504: Figure S32. Miocene Gomphotherium femur from Spain.

      This figure is never referenced in the paper. The authors should clarify the purpose of including a Miocene specimen from outside Africa and explain what it adds to the interpretation of Bed II material.

      It appears justified in the revised version.

      (54) Line 508: Figure S33. Elephant femoral shaft from BK (Olduvai).

      This figure appears to show comparative material but is not cited or discussed in the text. The authors should explain why the BK material is presented here and how it relates to EAK or the broader analysis.

      There are two figures labeled S33.

      It appears justified in the revised version.

      (55) Line 515: Figure S33. Tibia fragment from a large medium-sized bovid displaying multiple overlapping scars on both breakage planes inflicted by carnivore damage.

      Because this figure repeats the S33 label and is not cited or explained in the text, it is unclear why this specimen is included or how it contributes to the study. The authors should correct the duplicate numbering and clarify the purpose of this figure.

      It appears justified in the revised version.

      (56) Line 522: Same specimen as shown in Figure S30, viewed on its medial side.

      This is not the same bone as S30. This figure is not discussed in the text or Supplementary Information. The authors should clarify why it is included and how it relates to the rest of the analysis.

      It appears justified in the revised version.

    1. Author response:

      Public Reviews: 

      Reviewer #1 (Public review): 

      Summary: 

      This study aims to explore how different forms of "fragile nucleosomes" facilitate RNA Polymerase II (Pol II) transcription along gene bodies in human cells. The authors propose that pan-acetylated, pan-phosphorylated, tailless, and combined acetylated/phosphorylated nucleosomes represent distinct fragile states that enable eFicient transcription elongation. Using CUT&Tagseq, RNA-seq, and DRB inhibition assays in HEK293T cells, they report a genome-wide correlation between histone pan-acetylation/phosphorylation and active Pol II occupancy, concluding that these modifications are essential for Pol II elongation. 

      Strengths: 

      (1) The manuscript tackles an important and long-standing question about how Pol II overcomes nucleosomal barriers during transcription. 

      (2) The use of genome-wide CUT&Tag-seq for multiple histone marks (H3K9ac, H4K12ac, H3S10ph, H4S1ph) alongside active Pol II mapping provides a valuable dataset for the community. 

      (3) The integration of inhibition (DRB) and recovery experiments oFers insight into the coupling between Pol II activity and chromatin modifications. 

      (4) The concept of "fragile nucleosomes" as a unifying framework is potentially appealing and could stimulate further mechanistic studies. 

      Really appreciate the positive or affirmative comments from the reviewer.

      Weaknesses: 

      (1)  Misrepresentation of prior literature 

      The introduction incorrectly describes findings from Bintu et al., 2012. The cited work demonstrated that pan-acetylated or tailless nucleosomes reduce the nucleosomal barrier for Pol II passage, rather than showing no improvement. This misstatement undermines the rationale for the current study and should be corrected to accurately reflect prior evidence. 

      What we said is according to the original report in the publication (Bintu et al., Cell, 2012). Here is the citation from the report:

      Page 739,(Bintu, L. et al., Cell, 2012)(PMID: 23141536)

      “Overall transcription through tailless and acetylated nucleosomes is slightly faster than through unmodified nucleosomes (Figure 1C), with crossing times that are generally under 1 min (39.5 ± 5.7 and 45.3 ± 7.6 s, respectively). Both the removal and acetylation of the tails increase eFiciency of NPS passage:71% for tailless nucleosomes and 63% for acetylated nucleosomes (Figures 1C and S1), in agreement with results obtained using bulk assays of transcription (Ujva´ ri et al., 2008).”

      We will cite this original sentence in our revision.

      (2) Incorrect statement regarding hexasome fragility

      The authors claim that hexasome nucleosomes "are not fragile," citing older in vitro work. However, recent studies clearly showed that hexasomes exist in cells (e.g., PMID 35597239) and that they markedly reduce the barrier to Pol II (e.g., PMID 40412388). These studies need to be acknowledged and discussed. 

      “hexasome” was introduced in the transcription field four decades ago. Later, several groups claimed that “hexasome” is fragile and could be generated in transcription elongation of Pol II. However, their original definition was based on the detection of ~100 bps DNA fragments (MNase resistant) in vivo by Micrococcal nuclease sequencing (MNase-seq), which is the right length to wrap up one hexasome histone subunit (two H3/4 and one H2A/2B) to form the sub-nucleosome of a hexasome. As we should all agree that acetylation or phosphorylation of the tails of histone nucleosomes will lead to the compromised interaction between DNA and histone subunits, which could lead to the intact naïve nucleosome being fragile and easy to disassemble, and easy to access by MNase. Fragile nucleosomes lead to better accessibility of MNase to DNA that wraps around the histone octamer, producing shorter DNA fragments (~100 bps instead of ~140 bps). In this regard, we believe that these ~100 bps fragments are the products of fragile nucleosomes (fragile nucleosome --> hexasome), instead of the other way around (hexasome --> fragile). 

      Actually, two early reports from Dr. David J.  Clark’s group from NIH raised questions about the existence of hexasomes in vivo (PMID: 28157509) (PMID: 25348398).

      From the report of PMID:35597239, depletion of INO80 leads to the reduction of “hexasome” for a group of genes, and the distribution of both “nucleosomes” and “hexasomes” with the gene bodies gets fuzzier (less signal to noise). In a recent theoretical model (PMID: 41425263), the corresponding PI found that chromatin remodelers could act as drivers of histone modification complexes to carry out different modifications along gene bodies. The PI found that INO80 could drive NuA3 (a H3 acetyltransferase) to carry out pan-acetylation of H3 and possibly H2B as well in the later runs of transcription of Pol II for a group of genes (SAGA-dependent). It suggests that the depletion of INO80 will affect (reduce) the pan-acetylation of nucleosomes, which leads to the drop of pan-acetylated fragile nucleosomes, subsequently the drop of “hexasomes”. This explains why depletion of INO80 leads to the fuzzier results of either nucleosomes or “hexasomes” in PMID: 35597239. The result of PMID: 35597239 could be a strong piece of evidence to support the model proposed by the corresponding PI (PMID: 41425263).

      From a recent report: PMID:40412388, the authors claimed that FACT could bind to nucleosomes to generate “hexasomes”, which are fragile for Pol II to overcome the resistance of nucleosomes. It was well established that FACT enhances the processivity of Pol II in vivo via its chaperonin property. However, the exact working mechanism of FACT still remains ambiguous. A report from Dr. Cramer’s group showed that FACT enhances the elongation of regular genes but works just opposite for pausing-regulated genes (PMID: 38810649). An excellent review by Drs. Tim Formosa and Fred Winston showed that FACT is not required for the survival of a group of differentiated cells (PMID: 33104782), suggesting that FACT is not always required for transcription. It is quite tricky to generate naïve hexasomes in vitro according to early reports from the late Dr. Widom’s group. Most importantly, the new data (the speed of Pol II, the best one on bare DNA is ~27 bps/s) from the report of PMID: 40412388, which is much slower than the speed of Pol II in vivo: ~2.5 kbs/min or ~40 bps/s. From our recovering experiments (Fig. 4C, as mentioned by reviewer #3), in 20 minutes (the period between 10 minutes and 30 minutes, due to the property of CUT-&TAG-seq, of which Pol II still active after cells are collected, there is a big delay of complete stop of Pol II during the procedure of CUT&TAG experiments, so the first period of time does not actually reflect the speed of Pol II, which is ~5 kb/min), all Pol IIs move at a uniform speed of ~2.5 kbs/min in vivo. Interestingly, a recent report from Dr. Shixin Liu’s group (PMID: 41310264) showed that adding SPT4/5 to the transcription system with bare DNA (in vitro), the speed of Pol II reaches ~2.5kbs/min, exactly the same one as we derived in vivo. Similar to the original report (PMID: 23141536), the current report of PMID:40412388 does not mimic the conditions in vivo exactly.

      There is an urgent need for a revisit of the current definition of “hexasome”, which is claimed to be fragile and could be generated during the elongation of Pol II in vivo. MNase is an enzyme that only works when the substrate is accessible. In inactive regions of the genome, due to the tight packing of chromatin, MNase is not accessible to individual nucleosomes within the bodies of a gene or upstream of promoters, which is why we only see phased/spacing or clear distribution of nucleosomes at the transcription start sites, but it becomes fuzzy downstream or upstream of promoters. On the other hand, for fragile nucleosomes, the accessibility to MNase should increase dramatically, which leads to the ~100 bps fragments. Based on the uniform rate (2.5 kbs/min) of Pol II for all genes derived from human 293T cells and the similar rate (2.5 kbs/min) of Pol II on bare DNA in vitro, it is unlikely for Pol II to pause in the middle of nucleosomes to generate “hexasomes” to continue during elongation along gene bodies. Similar to RNAPs in bacterial (no nucleosomes) and Archaea (tailless nucleosomes), there should be no resistance when Pol IIs transcribe along all fragile nucleosomes within gene bodies in all eukaryotes, as we characterized in this manuscript. 

      (3)  Inaccurate mechanistic interpretation of DRB 

      The Results section states that DRB causes a "complete shutdown of transcription initiation (Ser5-CTD phosphorylation)." DRB is primarily a CDK9 inhibitor that blocks Pol II release from promoter-proximal pausing. While recent work (PMID: 40315851) suggests that CDK9 can contribute to CTD Ser5/Ser2 di-phosphorylation, the manuscript's claim of initiation shutdown by DRB should be revised to better align with the literature. The data in Figure 4A indicate that 1 M DRB fully inhibits Pol II activity, yet much higher concentrations (10-100 ) are needed to alter H3K9ac and H4K12ac levels. The authors should address this discrepancy by discussing the differential sensitivities of CTD phosphorylation versus histone modification turnover. 

      Yes, it was reported that DRB is also an inhibitor of CDK9. However, if the reviewer agrees with us and the current view in the field, the phosphorylation of Ser5-CTD of Pol II is the initiation of transcription for all Pol II-regulated genes in eukaryotes. CDK9 is only required to work on the already phosphorylated Ser5-CTD of Pol II to release the paused Pol II, which only happens in metazoans. From a series of works by us and others: CDK9 is unique in metazoans, required only for the pausing-regulated genes but not for regular genes. We found that CDK9 works on initiated Pol II (Ser5-CTD phosphorylated Pol II) and generates a unique phosphorylation pattern on CTD of Pol II (Ser2ph-Ser2ph-Ser5ph-CTD of Pol II), which is required to recruit JMJD5 (via CID domain) to generate a tailless nucleosome at +1 from TSS to release paused Pol II (PMID: 32747552). Interestingly, the report from Dr. Jesper Svejstrup’s group (PMID: 40315851) showed that CDK9 could generate a unique phosphorylation pattern (Ser2ph-Ser5ph-CTD of Pol II), which is not responsive to the popular 3E10 antibody that recognizes the single Ser2phCTD of Pol II.  This interesting result is consistent with our early report showing the unique phosphorylation pattern (Ser2ph-Ser2ph-Ser5ph-CTD of Pol II) is specifically generated by CDK9 in animals, which is not recognized by 3E10 either (PMID: 32747552). Actually, an early report from Dr. Dick Eick’s group (PMID: 26799765) showed the difference in the phosphorylation pattern of the CTD of Pol II between animal cells and yeast cells.  We have characterized how CDK9 is released from 7SK snRNP and recruited onto paused Pol II via the coupling of JMJD6 and BRD4 (PMID: 32048991), which was published on eLIFE. It is well established that CDK9 works after CDK7 or CDK8. From our PRO-seq data (Fig. 3) and CUT&TAG-seq data of active Pol II (Fig. 4), adding DRB completely shuts down all genes via inhibiting the initiation of Pol II (generation of Ser5ph-CTD of Pol II). Due to the uniqueness of CDK9 only in metazoans, it is not required for the activation of CDK12 or CDK13 (they are orthologs of CTK1 in yeast), as we demonstrated recently (PMID: 41377501). Instead, we found that CDK11/10 acts as the ortholog of Bur1 kinase from yeast, is essential for the phosphorylation of Spt5, the link of CTD of Pol II, and CDK12 (PMID: 41377501). 

      (4) Insufficient resolution of genome-wide correlations 

      Figure 1 presents only low-resolution maps, which are Insufficient o determine whether pan-acetylation and pan-phosphorylation correlate with Pol II at promoters or gene bodies. The authors should provide normalized metagene plots (from TSS to TTS) across different subgroups to visualize modification patterns at higher resolution. In addition, the genome-wide distribution of another histone PTM with a diFerent localization pattern should be included as a negative control. 

      A popular view in the field is that the majority of genomes are inactive since they do not contain coding RNAs, which are responsible for ~20,000 protein candidates characterized in animals. However, our genomewide characterization using the four histone modification marks, active Pol II, and RNA-seq, shows a different story. Figure 1 shows that most of the human genome of HEK293T is active in producing not only protein-coding RNAs but also non-coding RNAs (the majority of them). We believe that Figure 1 could change our current view of the activity of the entire genome, and should be of great interest to general readers as well as researchers on genomics. Furthermore, it is a basis for Figure 2, which is a zoom-in of Figure 1.  

      (5) Conceptual framing 

      The manuscript frequently extrapolates correlative genome-wide data to mechanistic conclusions (e.g., that pan-acetylation/phosphorylation "generate" fragile nucleosomes). Without direct biochemical or structural evidence. Such causality statements should be toned down.  

      The reviewer is right, we should tone down the strong sentences. However, we believe that our data is strong enough to derive the general conclusion. The reviewer may agree with us that the entire field of transcription and epigenetics has been stagnant in recent decades, but there is an urgent need for fresh ideas to change the current situation. Our novel discoveries, for sure, additional supporting data are needed, should open up a brand new avenue for people to explore. We believe that a new era of transcription will emerge based on our novel discoveries. We hope that this manuscript will attract more people to these topics. As Reviewer #3 pointed out, this story establishes the connection between transcription and epigenetics in the field. 

      Reviewer #2 (Public review): 

      Summary: 

      In this manuscript, the authors use various genomics approaches to examine nucleosome acetylation, phosphorylation, and PolII-CTD phosphorylation marks. The results are synthesized into a hypothesis that 'fragile' nucleosomes are associated with active regions of PolII transcription. 

      Strengths: 

      The manuscript contains a lot of genome-wide analyses of histone acetylation, histone phosphorylation, and PolII-CTD phosphorylation. 

      Weaknesses: 

      This reviewer's main research expertise is in the in vitro study of transcription and its regulation in purified, reconstituted systems. 

      Actually, the pioneering work of the establishment of in vitro transcription assays at Dr. Robert Roeder’s group led to numerous groundbreaking discoveries in the transcription field. The contributions of in vitro work in the transcription field are the key for us to explore the complexity of transcription in eukaryotes in the early times and remain important currently.

      I am not an expert at the genomics approaches and their interpretation, and overall, I had a very hard time understanding and interpreting the data that are presented in this manuscript.  I believe this is due to a problem with the manuscript, in that the presentation of the data is not explained in a way that's understandable and interpretable to a non-expert.

      Thanks for your suggestions. You are right, we have problems expressing our ideas clearly in this manuscript, which could confuse. We will make modifications accordingly per your suggestions.

      For example: 

      (1) Figure 1 shows genome-wide distributions of H3K9ac, H4K12ac, Ser2phPolII, mRNA, H3S10ph, and H4S1ph, but does not demonstrate correlations/coupling - it is not clear from these data that pan-acetylation and pan-phosphorylation are coupled with Pol II transcription. 

      Figure 1 shows the overall distribution of the four major histone modifications, active Pol II, and mRNA genome-wide in human HEK293T cells. It tells general readers that the entire genome is quite active and far more than people predicted that most of the genome is inactive, since just a small portion of the genome expresses coding RNAs (~20,000 in animals). Figure 1 shows that the majority of the genome is active and expresses not only coded mRNA but also non-coding RNAs. After all, it is the basis of Figure 2, which is a zoom-in of Figure 1. However, it is beyond the scope of this manuscript to discuss the non-coding RNAs. 

      (2) Figure 2 - It's not clear to me what Figure 2 is supposed to be showing. 

      (A) Needs better explanation - what is the meaning of the labels at the top of the gel lanes? 

      Figure 2 is a zoom-in for the individual gene, which shows how histone modifications are coupled with Pol II activity on the individual gene. We will give a more detailed explanation of the figure per the reviewer’s suggestions.

      (B) This reviewer is not familiar with this technique, its visualization, or its interpretation - more explanation is needed. What is the meaning of the quantitation graphs shown at the top? How were these calculated (what is on the y-axis)? 

      Good suggestions, we will do some modifications.

      (3) To my knowledge, the initial observation of DRB eFects on RNA synthesis also concluded that DRB inhibited initiation of RNA chains (pmid:982026) - this needs to be acknowledged. 

      Thanks for the reference, which is the first report to show the DRB inhibits initiation of Pol II in vivo. We will cite it in the revision.  

      (4) Again, Figures 4B, 4C, 5, and 6 are very difficult to understand - what is shown in these heat maps, and what is shown in the quantitation graphs on top? 

      Thanks for the suggestions, we will give a more detailed description of the Figures.  

      Reviewer #3 (Public review): 

      Summary: 

      Li et al. investigated the prevalence of acetylated and phosphorylated histones (using H3K9ac, H4K12ac, H3S10ph & H4S1ph as representative examples) across the gene body of human HEK293T cells, as well as mapping elongating Pol II and mRNA. They found that histone acetylation and phosphorylation were dominant in gene bodies of actively transcribing genes. Genes with acetylation/phosphorylation restricted to the promoter region were also observed. Furthermore, they investigated and reported a correlation between histone modifications and Pol II activity, finding that inhibition of Pol II activity reduced acetylation/phosphorylation levels, while resuming Pol II activity restored them. The authors then proposed a model in which panacetylation or pan-phosphorylation of histones generates fragile nucleosomes; the first round of transcription is accompanied by panacetylation, while subsequent rounds are accompanied by panphosphorylation. 

      Strengths: 

      This study addresses a highly significant problem in gene regulation. The author provided riveting evidence that certain histone acetylation and/or phosphorylation within the gene body is correlated with Pol II transcription. The author furthermore made a compelling case that such transcriptionally correlated histone modification is dynamic and can be regulated by Pol II activity. This work has provided a clearer view of the connection between epigenetics and Pol II transcription. 

      Thanks for the insightful comments, which are exactly what we want to present in this manuscript. 

      Weaknesses: 

      The title of the manuscript, "Fragile nucleosomes are essential for RNA Polymerase II to transcribe in eukaryotes", suggests that fragile nucleosomes lead to transcription. While this study shows a correlation between histone modifications in gene bodies and transcription elongation, a causal relationship between the two has not been demonstrated. 

      Thanks for the suggestions. What we want to express is that the generation of fragile nucleosomes precedes transcription, or, more specifically, transcription elongation. The corresponding PI wrote a hypothetical model on how pan-acetylation is generated by the coupling of chromatin remodelers and acetyltransferase complexes along gene bodies, in which chromatin remodelers act as drivers to carry acetyltransferases along gene bodies to generate pan-acetylation of nucleosomes (PMID: 41425263). We have a series of work to show how “tailless nucleosomes” at +1 from transcription start sites are generated to release paused Pol II in metazoans (PMID: 28847961) (PMID: 29459673) (PMID: 32747552) (PMID: 32048991).   We still do not know how pan-phosphorylation along gene bodies is generated. It should be one of the focuses of our future research.

    1. Reviewer #1 (Public review):

      Summary:

      This manuscript reports a prospective longitudinal study examining whether infants with high likelihood (HL) for autism differ from low-likelihood (LL) infants in two levels of word learning: brain-to-speech cortical entrainment and implicit word segmentation. The authors report reduced syllable tracking and post-learning word recognition in the HL group relative to the LL group. Importantly, both the syllable-tracking entrainment measure and the word recognition ERP measure are positively associated with verbal outcomes at 18-20 months, as indexed by the Mullen Verbal Developmental Quotient. Overall, I found this to be a thoughtfully designed and carefully executed study that tackles a difficult and important set of questions. With some clarifications and modest additional analyses or discussion on the points below, the manuscript has strong potential to make a substantial contribution to the literature on early language development and autism.

      Strengths:

      This is an important study that addresses a central question in developmental cognitive neuroscience: what mechanisms underlie variability in language learning, and what are the early neural correlates of these individual differences? While language development has a relatively well-defined sensitive period in typical development, the mechanisms of variability - particularly in the context of neurodevelopmental conditions - remain poorly understood, in part because longitudinal work in very young infants and toddlers is rare. The present study makes a valuable contribution by directly targeting this gap and by grounding the work in a strong theoretical tradition on statistical learning as a foundational mechanism for early language acquisition.

      I especially appreciate the authors' meticulous approach to data quality and their clear, transparent description of the methods. The choice of partial least squares correlation (PLS-c) is well motivated, given the multidimensional nature of the data and collinearity among variables, and the manuscript does a commendable job explaining this technique to readers who may be less familiar with it.

      The results reveal interesting developmental changes in syllable tracking and word segmentation from birth to 2 years in both HL and LL infants. Simply mapping these trajectories in both groups is highly valuable. Moreover, the associations between neural indices of brain-to-speech entrainment and word segmentation with later verbal outcomes in the LL group support a critical role for speech perception and statistical learning in early language development, with clear implications for understanding autism. Overall, this is a rich dataset with substantial potential to inform theory.

      Weaknesses:

      (1) Clarifying longitudinal vs. concurrent associations

      Because the current analytical approach incorporates all time points, including the final visit, it is challenging to determine to what extent the brain-language associations are driven by longitudinal relationships vs. concurrent correlations at the last time point. This does not undermine the main findings, but clarifying this issue could significantly enhance the impact of the individual-differences results. If feasible, the authors might consider (a) showing that a model excluding the final visit still predicts verbal outcomes at the last visit in a similar way, or (b) more explicitly acknowledging in the discussion that the observed associations may be partly or largely driven by concurrent correlations. Either approach would help readers interpret the strength and nature of the longitudinal claims.

      (2) Incorporating sleep status into longitudinal models

      Sleep status changes systematically across developmental stages in this cohort. Given that some of the papers cited to justify the paradigm also note limitations in speech entrainment and word segmentation during sleep or in patients with impaired consciousness, it would be helpful to account for sleep more directly. Including sleep status as a factor or covariate in the longitudinal models, or at least elaborating more fully on its potential role and limitations, would further strengthen the conclusions and reassure readers that these effects are not primarily driven by differences in sleep-wake state.

      (3) Use of PLS-c and potential group × condition interactions

      I am relatively new to PLS-c. One question that arose is whether PLS-c could be extended to handle a two-way interaction between group and condition contrasts (STR vs. RND). If so, some of the more complex supplementary models testing developmental trajectories within each group (Page 8, Lines 258-265) might be more directly captured within a single, unified framework. Even a brief comment in the methods or discussion about the feasibility (or limitations) of modeling such interactions within PLS-c would be informative for readers and could streamline the analytic narrative.

      (4) STR-only analyses and the role of RND

      Page 8, Lines 241-245: This analysis is conducted only within the STR condition. The lack of group difference observed here appears consistent with the lack of group difference in word-level entrainment (Page 9, Lines 292-294), suggesting that HL and LL groups may not differ in statistical learning per se, but rather in syllabic-level entrainment. As a useful sanity check and potential extension, it might be informative to explore whether syllable-level entrainment in the RND condition differs between groups to a similar extent as in Figure 2C-D. In other work (e.g., adults vs. children; Moreau et al., 2022), group differences can be more pronounced for syllable-level than for word-level entrainment. Figure S6 seems to hint that a similar pattern may exist here. If feasible, including or briefly reporting such an analysis could help clarify the asymmetry between the two learning measures and further support the interpretation of syllabic-level differences.

      (5) Multi-speaker input and voice perception (Page 15, Lines 475-483)

      The multi-speaker nature of the speech input is an interesting and ecologically relevant feature of the design, but it does add interpretive complexity. The literature on voice perception in autism is still mixed: for example, Boucher et al. (2000) reported no differences in voice recognition and discrimination between children with autism and language-matched non-autistic peers, whereas behavioral work in autistic adults suggests atypical voice perception (e.g., Schelinski et al., 2016; Lin et al., 2015). I found the current interpretation in this paragraph somewhat difficult to follow, partly because the data do not directly test how HL and LL infants integrate or suppress voice information. I think the authors could strengthen this section by slightly softening and clarifying the claims.

      (6) Asymmetry between EEG learning measures

      Page 16, Lines 502-507 touches on the asymmetry between the two EEG learning measures but leaves some questions for the reader. The presence of word recognition ERPs in the LL group suggests that a failure to suppress voice information during learning did not prevent successful word learning. At the same time, there is an interesting complementary pattern in the HL group, who show LL-like word-level entrainment but does not exhibit robust word recognition. Explicitly discussing this asymmetry - why HL infants might show relatively preserved word-level entrainment yet reduced word recognition ERPs, whereas LL infants show both - would enrich the theoretical contribution of the manuscript.

      References:

      (1) Moreau, C. N., Joanisse, M. F., Mulgrew, J., & Batterink, L. J. (2022). No statistical learning advantage in children over adults: Evidence from behaviour and neural entrainment. Developmental Cognitive Neuroscience, 57, 101154. https://doi.org/10.1016/j.dcn.2022.101154

      (2) Boucher, J., Lewis, V., & Collis, G. M. (2000). Voice processing abilities in children with autism, children with specific language impairments, and young typically developing children. Journal of Child Psychology and Psychiatry, 41(7), 847-857. https://doi.org/10.1111/1469-7610.00672

      (3) Schelinski, S., Borowiak, K., & von Kriegstein, K. (2016). Temporal voice areas exist in autism spectrum disorder but are dysfunctional for voice identity recognition. Social Cognitive and Affective Neuroscience, 11(11), 1812-1822. https://doi.org/10.1093/scan/nsw089

      (4) Lin, I.-F., Yamada, T., Komine, Y., Kato, N., Kato, M., & Kashino, M. (2015). Vocal identity recognition in autism spectrum disorder. PLOS ONE, 10(6), e0129451. https://doi.org/10.1371/journal.pone.0129451

    1. Author response:

      The following is the authors’ response to the original reviews.

      Public reviews:

      Reviewer #1 (Public review):

      Summary:

      Wu and colleagues aimed to explain previous findings that adolescents, compared to adults, show reduced cooperation following cooperative behaviour from a partner in several social scenarios. The authors analysed behavioural data from adolescents and adults performing a zero-sum Prisoner's Dilemma task and compared a range of social and non-social reinforcement learning models to identify potential algorithmic differences. Their findings suggest that adolescents' lower cooperation is best explained by a reduced learning rate for cooperative outcomes, rather than differences in prior expectations about the cooperativeness of a partner. The authors situate their results within the broader literature, proposing that adolescents' behaviour reflects a stronger preference for self-interest rather than a deficit in mentalising.

      Strengths:

      The work as a whole suggests that, in line with past work, adolescents prioritise value accumulation, and this can be, in part, explained by algorithmic differences in weighted value learning. The authors situate their work very clearly in past literature, and make it obvious the gap they are testing and trying to explain. The work also includes social contexts that move the field beyond non-social value accumulation in adolescents. The authors compare a series of formal approaches that might explain the results and establish generative and modelcomparison procedures to demonstrate the validity of their winning model and individual parameters. The writing was clear, and the presentation of the results was logical and well-structured.

      We thank the reviewer for recognizing the strengths of our work.

      Weaknesses:

      (1) I also have some concerns about the methods used to fit and approximate parameters of interest. Namely, the use of maximum likelihood versus hierarchical methods to fit models on an individual level, which may reduce some of the outliers noted in the supplement, and also may improve model identifiability.

      We thank the reviewer for this suggestion. Following the comment, we added a hierarchical Bayesian estimation. We built a hierarchical model with both group-level (adolescent group and adult group) and individual-level structures for the best-fitting model. Four Markov chains with 4,000 samples each were run, and the model converged well (see Figure supplement 7).

      We then analyzed the posterior parameters for adolescents and adults separately. The results were consistent with those from the MLE analysis. These additional results have been included in the Appendix Analysis section (also see Figure supplement 5 and 7). In addition, we have updated the code and provided the link for reference. We appreciate the reviewer’s suggestion, which improved our analysis.

      (2) There was also little discussion given the structure of the Prisoner's Dilemma, and the strategy of the game (that defection is always dominant), meaning that the preferences of the adolescents cannot necessarily be distinguished from the incentives of the game, i.e. they may seem less cooperative simply because they want to play the dominant strategy, rather than a lower preferences for cooperation if all else was the same.

      We thank the reviewer for this comment and agree that adolescents’ lower cooperation may partly reflect a rational response to the incentive structure of the Prisoner’s Dilemma. 

      However, our computational modeling explicitly addressed this possibility. Model 4 (inequality aversion) captures decisions that are driven purely by self-interest or aversion to unequal outcomes, including a parameter reflecting disutility from advantageous inequality, which represents self-oriented motives. If participants’ behavior were solely guided by the payoff-dominant strategy, this model should have provided the best fit. However, our model comparison showed that Model 5 (social reward) performed better in both adolescents and adults, suggesting that cooperative behavior is better explained by valuing social outcomes beyond payoff structures.

      Besides, if adolescents’ lower cooperation is that they strategically respond to the payoff structure by adopting defection as the more rewarding option. Then, adolescents should show reduced cooperation across all rounds. Instead, adolescents and adults behaved similarly when partners defected, but adolescents cooperated less when partners cooperated and showed little increase in cooperation even after consecutive cooperative responses. This pattern suggests that adolescents’ lower cooperation cannot be explained solely by strategic responses to payoff structures but rather reflects a reduced sensitivity to others’ cooperative behavior or weaker social reciprocity motives. We have expanded our Discussion to acknowledge this important point and to clarify how the behavioral and modeling results address the reviewer’s concern.

      “Overall, these findings indicate that adolescents’ lower cooperation is unlikely to be driven solely by strategic considerations, but may instead reflect differences in the valuation of others’ cooperation or reduced motivation to reciprocate. Although defection is the payoff-dominant strategy in the Prisoner’s Dilemma, the selective pattern of adolescents’ cooperation and the model comparison results indicate that their reduced cooperation cannot be fully explained by strategic incentives, but rather reflects weaker valuation of social reciprocity.”

      Appraisal & Discussion:

      (3) The authors have partially achieved their aims, but I believe the manuscript would benefit from additional methodological clarification, specifically regarding the use of hierarchical model fitting and the inclusion of Bayes Factors, to more robustly support their conclusions. It would also be important to investigate the source of the model confusion observed in two of their models.

      We thank the reviewer for this comment. In the revised manuscript, we have clarified the hierarchical Bayesian modeling procedure for the best-fitting model, including the group- and individual-level structure and convergence diagnostics. The hierarchical approach produced results that fully replicated those obtained from the original maximumlikelihood estimation, confirming the robustness of our findings. Please also see the response to (1).

      Regarding the model confusion between the inequality aversion (Model 4) and social reward (Model 5) models in the model recovery analysis, both models’ simulated behaviors were best captured by the baseline model. This pattern arises because neither model includes learning or updating processes. Given that our task involves dynamic, multi-round interactions, models lacking a learning mechanism cannot adequately capture participants’ trial-by-trial adjustments, resulting in similar behavioral patterns that are better explained by the baseline model during model recovery. We have added a clarification of this point to the Results:

      “The overlap between Models 4 and 5 likely arises because neither model incorporates a learning mechanism, making them less able to account for trial-by-trial adjustments in this dynamic task.”

      (4) I am unconvinced by the claim that failures in mentalising have been empirically ruled out, even though I am theoretically inclined to believe that adolescents can mentalise using the same procedures as adults. While reinforcement learning models are useful for identifying biases in learning weights, they do not directly capture formal representations of others' mental states. Greater clarity on this point is needed in the discussion, or a toning down of this language.

      We sincerely thank the reviewer for this professional comment. We agree that our prior wording regarding adolescents’ capacity to mentalise was somewhat overgeneralized. Accordingly, we have toned down the language in both the Abstract and the Discussion to better align our statements with what the present study directly tests. Specifically, our revisions focus on adolescents’ and adults’ ability to predict others’ cooperation in social learning. This is consistent with the evidence from our analyses examining adolescents’ and adults’ model-based expectations and self-reported scores on partner cooperativeness (see Figure 4). In the revised Discussion, we state:

      “Our results suggest that the lower levels of cooperation observed in adolescents stem from a stronger motive to prioritize self-interest rather than a deficiency in predicting others’ cooperation in social learning”.

      (5) Additionally, a more detailed discussion of the incentives embedded in the Prisoner's Dilemma task would be valuable. In particular, the authors' interpretation of reduced adolescent cooperativeness might be reconsidered in light of the zero-sum nature of the game, which differs from broader conceptualisations of cooperation in contexts where defection is not structurally incentivised.

      We thank the reviewer for this comment and agree that adolescents’ lower cooperation may partly reflect a rational response to the incentive structure of the Prisoner’s Dilemma. However, our behavioral and computational evidence suggests that this pattern cannot be explained solely by strategic responses to payoff structures, but rather reflects a reduced sensitivity to others’ cooperative behavior or weaker social reciprocity motives. We have expanded the Discussion to acknowledge this point and to clarify how both behavioral and modeling results address the reviewer’s concern (see also our response to 2).

      (6) Overall, I believe this work has the potential to make a meaningful contribution to the field. Its impact would be strengthened by more rigorous modelling checks and fitting procedures, as well as by framing the findings in terms of the specific game-theoretic context, rather than general cooperation.

      We thank the reviewer for the professional comments, which have helped us improve our work.

      Reviewer #2 (Public review):

      Summary:

      This manuscript investigates age-related differences in cooperative behavior by comparing adolescents and adults in a repeated Prisoner's Dilemma Game (rPDG). The authors find that adolescents exhibit lower levels of cooperation than adults. Specifically, adolescents reciprocate partners' cooperation to a lesser degree than adults do. Through computational modeling, they show that this relatively low cooperation rate is not due to impaired expectations or mentalizing deficits, but rather a diminished intrinsic reward for reciprocity. A social reinforcement learning model with asymmetric learning rate best captured these dynamics, revealing age-related differences in how positive and negative outcomes drive behavioral updates. These findings contribute to understanding the developmental trajectory of cooperation and highlight adolescence as a period marked by heightened sensitivity to immediate rewards at the expense of long-term prosocial gains.

      Strengths:

      (1) Rigid model comparison and parameter recovery procedure.

      (2) Conceptually comprehensive model space.

      (3) Well-powered samples.

      We thank the reviewer for highlighting the strengths of our work.

      Weaknesses:

      A key conceptual distinction between learning from non-human agents (e.g., bandit machines) and human partners is that the latter are typically assumed to possess stable behavioral dispositions or moral traits. When a non-human source abruptly shifts behavior (e.g., from 80% to 20% reward), learners may simply update their expectations. In contrast, a sudden behavioral shift by a previously cooperative human partner can prompt higher-order inferences about the partner's trustworthiness or the integrity of the experimental setup (e.g., whether the partner is truly interactive or human). The authors may consider whether their modeling framework captures such higher-order social inferences. Specifically, trait-based models-such as those explored in Hackel et al. (2015, Nature Neuroscience)-suggest that learners form enduring beliefs about others' moral dispositions, which then modulate trial-bytrial learning. A learner who believes their partner is inherently cooperative may update less in response to a surprising defection, effectively showing a trait-based dampening of learning rate.

      We thank the reviewer for this thoughtful comment. We agree that social learning from human partners may involve higher-order inferences beyond simple reinforcement learning from non-human sources. To address this, we had previously included such mechanisms in our behavioral modeling. In Model 7 (Social Reward Model with Influence), we tested a higher-order belief-updating process in which participants’ expectations about their partner’s cooperation were shaped not only by the partner’s previous choices but also by the inferred influence of their own past actions on the partner’s subsequent behavior. In other words, participants could adjust their belief about the partner’s cooperation by considering how their partner’s belief about them might change. Model comparison showed that Model 7 did not outperform the best-fitting model, suggesting that incorporating higher-order influence updates added limited explanatory value in this context. As suggested by the reviewer, we have further clarified this point in the revised manuscript.

      Regarding trait-based frameworks, we appreciate the reviewer’s reference to Hackel et al. (2015). That study elegantly demonstrated that learners form relatively stable beliefs about others’ social dispositions, such as generosity, especially when the task structure provides explicit cues for trait inference (e.g., resource allocations and giving proportions). By contrast, our study was not designed to isolate trait learning, but rather to capture how participants update their expectations about a partner’s cooperation over repeated interactions. In this sense, cooperativeness in our framework can be viewed as a trait-like latent belief that evolves as evidence accumulates. Thus, while our model does not include a dedicated trait module that directly modulates learning rates, the belief-updating component of our best-fitting model effectively tracks a dynamic, partner-specific cooperativeness, potentially reflecting a prosocial tendency.

      This asymmetry in belief updating has been observed in prior work (e.g., Siegel et al., 2018, Nature Human Behaviour) and could be captured using a dynamic or belief-weighted learning rate. Models incorporating such mechanisms (e.g., dynamic learning rate models as in Jian Li et al., 2011, Nature Neuroscience) could better account for flexible adjustments in response to surprising behavior, particularly in the social domain.

      We thank the reviewer for the suggestion. Following the comment, we implemented an additional model incorporating a dynamic learning rate based on the magnitude of prediction errors. Specifically, we developed Model 9:  Social reward model with Pearce–Hall learning algorithm (dynamic learning rate), in which participants’ beliefs about their partner’s cooperation probability are updated using a Rescorla–Wagner rule with a learning rate dynamically modulated by the Pearce–Hall (PH) Error Learning mechanism. In this framework, the learning rate increases following surprising outcomes (larger prediction errors) and decreases as expectations become more stable (see Appendix Analysis section for details).

      The results showed that this dynamic learning rate model did not outperform our bestfitting model in either adolescents or adults (see Figure supplement 6). We greatly appreciate the reviewer’s suggestion, which has strengthened the scope of our analysis. We now have added these analyses to the Appendix Analysis section (see Figure Supplement 6) and expanded the Discussion to acknowledge this modeling extension and further discuss its implications.

      Second, the developmental interpretation of the observed effects would be strengthened by considering possible non-linear relationships between age and model parameters. For instance, certain cognitive or affective traits relevant to social learning-such as sensitivity to reciprocity or reward updating-may follow non-monotonic trajectories, peaking in late adolescence or early adulthood. Fitting age as a continuous variable, possibly with quadratic or spline terms, may yield more nuanced developmental insights.

      We thank the reviewer for this professional comment. In addition to the linear analyses, we further conducted exploratory analyses to examine potential non-linear relationships between age and the model parameters. Specifically, we fit LMMs for each of the four parameters as outcomes (α+, α-, β, and ω). The fixed effects included age, a quadratic age term, and gender, and the random effects included subject-specific random intercepts and random slopes for age and gender. Model comparison using BIC did not indicate improvement for the quadratic models over the linear models for α<sup>+</sup> (ΔBIC<sub>quadratic-linear</sub> = 5.09), α− (ΔBICquadratic-linear = 3.04), β (ΔBICquadratic-linear = 3.9), or ω (ΔBICquadratic-linear = 0). Moreover, the quadratic age term was not significant for α<sup>+</sup>, α<sup>−</sup>, or β (all ps > 0.10). For ω, we observed a significant linear age effect (b = 1.41, t = 2.65, p = 0.009) and a significant quadratic age effect (b = −0.03, t = −2.39, p = 0.018; see Author response image 1). This pattern is broadly consistent with the group effect reported in the main text. The shaded area in the figure represents the 95% confidence interval. As shown, the interval widens at older ages (≥ 26 years) due to fewer participants in that range, which limits the robustness of the inferred quadratic effect. In consideration of the limited precision at older ages and the lack of BIC improvement, we did not emphasize the quadratic effect in the revised manuscript and present these results here as exploratory.

      Author response image 1.

      Linear and quadratic model fits showing the relationship between age and the ω parameter, with 95% confidence intervals.<br />

      Finally, the two age groups compared - adolescents (high school students) and adults (university students) - differ not only in age but also in sociocultural and economic backgrounds. High school students are likely more homogenous in regional background (e.g., Beijing locals), while university students may be drawn from a broader geographic and socioeconomic pool. Additionally, differences in financial independence, family structure (e.g., single-child status), and social network complexity may systematically affect cooperative behavior and valuation of rewards. Although these factors are difficult to control fully, the authors should more explicitly address the extent to which their findings reflect biological development versus social and contextual influences.

      We appreciate this comment. Indeed, adolescents (high school students) and adults (university students) differ not only in age but also in sociocultural and socioeconomic backgrounds. In our study, all participants were recruited from Beijing and surrounding regions, which helps minimize large regional and cultural variability. Moreover, we accounted for individual-level random effects and included participants’ social value orientation (SVO) as an individual difference measure. 

      Nonetheless, we acknowledge that other contextual factors, such as differences in financial independence, socioeconomic status, and social experience—may also contribute to group differences in cooperative behavior and reward valuation. Although our results are broadly consistent with developmental theories of reward sensitivity and social decisionmaking, sociocultural influences cannot be entirely ruled out. Future work with more demographically matched samples or with socioeconomic and regional variables explicitly controlled will help clarify the relative contributions of biological and contextual factors. Accordingly, we have revised the Discussion to include the following statement:  “Third, although both age groups were recruited from Beijing and nearby regions, minimizing major regional and cultural variation, adolescents and adults may still differ in socioeconomic status, financial independence, and social experience. Such contextual differences could interact with developmental processes in shaping cooperative behavior and reward valuation. Future research with demographically matched samples or explicit measures of socioeconomic background will help disentangle biological from sociocultural influences.”

      Reviewer #3 (Public review):

      Summary:

      Wu and colleagues find that in a repeated Prisoner's Dilemma, adolescents, compared to adults, are less likely to increase their cooperation behavior in response to repeated cooperation from a simulated partner. In contrast, after repeated defection by the partner, both age groups show comparable behavior.

      To uncover the mechanisms underlying these patterns, the authors compare eight different models. They report that a social reward learning model, which includes separate learning rates for positive and negative prediction errors, best fits the behavior of both groups. Key parameters in this winning model vary with age: notably, the intrinsic value of cooperating is lower in adolescents. Adults and adolescents also differ in learning rates for positive and negative prediction errors, as well as in the inverse temperature parameter.

      Strengths: 

      The modeling results are compelling in their ability to distinguish between learned expectations and the intrinsic value of cooperation. The authors skillfully compare relevant models to demonstrate which mechanisms drive cooperation behavior in the two age groups.

      We thank the reviewer’s recognition of our work’s strengths.

      Weaknesses:

      Some of the claims made are not fully supported by the data:

      The central parameter reflecting preference for cooperation is positive in both groups. Thus, framing the results as self-interest versus other-interest may be misleading.

      We thank the reviewer for this insightful comment. In the social reward model, the cooperation preference parameter is positive by definition, as defection in the repeated rPDG always yields a +2 monetary advantage regardless of the partner’s action. This positive value represents the additional subjective reward assigned to mutual cooperation (e.g., reciprocity value) that counterbalances the monetary gain from defection. Although the estimated social reward parameter ω was positive, the effective advantage of cooperation is Δ=p×ω−2. Given participants’ inferred beliefs p, Δ was negative for most trials (p×ω<2), indicating that the social reward was insufficient to offset the +2 advantage of defection. Thus, both adolescents and adults valued cooperation positively, but adolescents’ smaller ω and weaker responsiveness to sustained partner cooperation suggest a stronger weighting on immediate monetary payoffs. 

      In this light, our framing of adolescents as more self-interested derives from their behavioral pattern: even when they recognized sustained partner cooperation and held high expectations of partner cooperation, adolescents showed lower cooperative behavior and reciprocity rewards compared with adults. Whereas adults increased cooperation after two or three consecutive partner cooperations, this pattern was absent among adolescents. We therefore interpret their behavior as relatively more self-interested, reflecting reduced sensitivity to the social reward from mutual cooperation rather than a categorical shift from self-interest to other-interest, as elaborated in the Discussion.

      It is unclear why the authors assume adolescents and adults have the same expectations about the partner's cooperation, yet simultaneously demonstrate age-related differences in learning about the partner. To support their claim mechanistically, simulations showing that differences in cooperation preference (i.e., the w parameter), rather than differences in learning, drive behavioral differences would be helpful.

      We thank the reviewer for raising this important point. In our model, both adolescents and adults updated their beliefs about partner cooperation using an asymmetric reinforcement learning (RL) rule. Although adolescents exhibited a higher positive and a lower negative learning rate than adults, the two groups did not differ significantly in their overall updating of partner cooperation probability (Fig. 4a-b). We then examined the social reward parameter ω, which was significantly smaller in adolescents and determined the intrinsic value of mutual cooperation (i.e., p×ω). This variable differed significantly between groups and closely matched the behavioral pattern.

      Following the reviewer’s suggestion, we conducted additional simulations varying one model parameter at a time while holding the others constant. The difference in mean cooperation probability between adults and adolescents served as the index (positive = higher cooperation in adults). As shown in the Author response image 2, decreases in ω most effectively reproduced the observed group difference (shaded area), indicating that age-related differences in cooperation are primarily driven by variation in the social reward parameter ω rather than by others.

      Author response image 2.

      Simulation results showing how variations in each model parameter affect the group difference in mean cooperation probability (Adults – Adolescents). Based on the best-fitting Model 8 and parameters estimated from all participants, each line represents one parameter (i.e., α+, α-, ω, β) systematically varied within the tested range (α±:0.1–0.9; ω, β:1–9) while other parameters were held constant. Positive values indicate higher cooperation in adults. Smaller ω values most strongly reproduced the observed group difference, suggesting that reduced social reward weighting primarily drives adolescents’ lower cooperation.

      Two different schedules of 120 trials were used: one with stable partner behavior and one with behavior changing after 20 trials. While results for order effects are reported, the results for the stable vs. changing phases within each schedule are not. Since learning is influenced by reward structure, it is important to test whether key findings hold across both phases.

      We thank the reviewer for this thoughtful and professional comment. In our GLMM and LMM analyses, we focused on trial order rather than explicitly including the stable vs. changing phase factor, due to concerns about multicollinearity. In our design, phases occur in specific temporal segments, which introduces strong collinearity with trial order. In multi-round interactions, order effects also capture variance related to phase transitions. 

      Nonetheless, to directly address this concern, we conducted additional robustness analyses by adding a phase variable (stable vs. changing) to GLMM1, LMM1, and LMM3 alongside the original covariates. Across these specifications, the key findings were replicated (see GLMM<sub>sup</sub>2 and LMM<sub>sup</sub>4–5; Tables 9-11), and the direction and significance of main effects remained unchanged, indicating that our conclusions are robust to phase differences.

      The division of participants at the legal threshold of 18 years should be more explicitly justified. The age distribution appears continuous rather than clearly split. Providing rationale and including continuous analyses would clarify how groupings were determined.

      We thank the reviewer for this thoughtful comment. We divided participants at the legal threshold of 18 years for both conceptual and practical reasons grounded in prior literature and policy. In many countries and regions, 18 marks the age of legal majority and is widely used as the boundary between adolescence and adulthood in behavioral and clinical research. Empirically, prior studies indicate that psychosocial maturity and executive functions approach adult levels around this age, with key cognitive capacities stabilizing in late adolescence (Icenogle et al., 2019; Tervo-Clemmens et al., 2023). We have clarified this rationale in the Introduction section of the revised manuscript.

      “Based on legal criteria for majority and prior empirical work, we adopt 18 years as the boundary between adolescence and adulthood (Icenogle et al., 2019; Tervo-Clemmens et al., 2023).”

      We fully agree that the underlying age distribution is continuous rather than sharply divided. To address this, we conducted additional analyses treating age as a continuous predictor (see GLMM<sub>sup</sub>1 and LMM<sub>sup</sub>1–3; Tables S1-S4), which generally replicated the patterns observed with the categorical grouping. Nevertheless, given the limited age range of our sample, the generalizability of these findings to fine-grained developmental differences remains constrained. Therefore, our primary analyses continue to focus on the contrast between adolescents and adults, rather than attempting to model a full developmental trajectory.

      Claims of null effects (e.g., in the abstract: "adults increased their intrinsic reward for reciprocating... a pattern absent in adolescents") should be supported with appropriate statistics, such as Bayesian regression.

      We thank the reviewer for highlighting the importance of rigor when interpreting potential null effects. To address this concern, we conducted Bayes factor analyses of the intrinsic reward for reciprocity and reported the corresponding BF10 for all relevant post hoc comparisons. This approach quantifies the relative evidence for the alternative versus the null hypothesis, thereby providing a more direct assessment of null effects. The analysis procedure is now described in the Methods and Materials section: 

      “Post hoc comparisons were conducted using Bayes factor analyses with MATLAB’s bayesFactor Toolbox (version v3.0, Krekelberg, 2024), with a Cauchy prior scale σ = 0.707.”

      Once claims are more closely aligned with the data, the study will offer a valuable contribution to the field, given its use of relevant models and a well-established paradigm.

      We are grateful for the reviewer’s generous appraisal and insightful comments.

      Recommendations for the authors

      Reviewer #1 (Recommendations for the authors):

      I commend the authors on a well-structured, clear, and interesting piece of work. I have several questions and recommendations that, if addressed, I believe will strengthen the manuscript.

      We thank the reviewer for commending the organization of our paper.

      Introduction: - Why use a zero-sum (Prisoner's Dilemma; PD) versus a mixed-motive game (e.g. Trust Task) to study cooperation? In a finite set of rounds, the dominant strategy can be to defect in a PD.

      We thank the reviewer for this helpful comment. We agree that both the rationale for using the repeated Prisoner’s Dilemma (rPDG) and the limitations of this framework should be clarified. We chose the rPDG to isolate the core motivational conflict between selfinterest and joint welfare, as its symmetric and simultaneous structure avoids the sequential trust and reputation dependencies/accumulation inherent to asymmetric tasks such as the Trust Game (King-Casas et al., 2005; Rilling et al., 2002).

      Although a finitely repeated rPDG theoretically favors defection, extensive prior research shows that cooperation can still emerge in long repeated interactions when players rely on learning and reciprocity rather than backward induction (Rilling et al., 2002; Fareri et al., 2015). Our design employed 120 consecutive rounds, allowing participants to update expectations about partner behavior and to establish stable reciprocity patterns over time. We have added the following clarification to the Introduction:

      “The rPDG provides a symmetric and simultaneous framework that isolates the motivational conflict between self-interest and joint welfare, avoiding the sequential trust and reputation dynamics characteristic of asymmetric tasks such as the Trust Game (Rilling et al., 2002; King-Casas et al., 2005)”

      Methods:

      Did the participants know how long the PD would go on for?

      Were the participants informed that the partner was real/simulated?

      Were the participants informed that the partner was going to be the same for all rounds?

      We thank the reviewer for the meticulous review work, which helped us present the experimental design and reporting details more clearly. the following clarifications: I. Participants were not informed of the total number of rounds in the rPDG. This prevented endgame expectations and avoided distraction from counting rounds, which could introduce additional effects. II. Participants were told that their partner was another human participant in the laboratory. However, the partner’s behavior was predetermined by a computer program. This design enabled tighter experimental control and ensured consistent conditions across age groups, supporting valid comparisons. III. Participants were informed that they would interact with the same partner across all rounds, aligning with the essence of a multiround interaction paradigm and stabilizing partner-related expectations. For transparency, we have clarified these points in the Methods and Materials section:

      “Participants were told that their partner was another human participant in the laboratory and that they would interact with the same partner across all rounds. However, in reality, the actions of the partner were predetermined by a computer program. This setup allowed for a clear comparison of the behavioral responses between adolescents and adults. Participants were not informed of the total number of rounds in the rPDG.”

      The authors mention that an SVO was also recorded to indicate participant prosociality. Where are the results of this? Did this track game play at all? Could cooperativeness be explained broadly as an SVO preference that penetrated into game-play behaviour?

      We thank the reviewer for pointing this out. We agree that individual differences in prosociality may shape cooperative behavior, so we conducted additional analyses incorporating SVO. Specifically, we extended GLMM1 and LMM3 by adding the measured SVO as a fixed effect with random slopes, yielding GLMM<sub>sup</sub>3 and LMM<sub>sup</sub>6 (Tables 12–13). The results showed that higher SVO was associated with greater cooperation, whereas its effect on the reward for reciprocity was not significant. Importantly, the primary findings remained unchanged after controlling for SVO. These results indicate that cooperativeness in our task cannot be explained solely by a broad SVO preference, although a more prosocial orientation was associated with greater cooperation. We have reported these analyses and results in the Appendix Analysis section.

      Why was AIC chosen rather an BIC to compare model dominance?

      Sorry for the lack of clarification. Both the Akaike Information Criterion (AIC, Akaike, 1974) and Bayesian Information Criterion (BIC, Schwarz, 1978) are informationtheoretic criterions for model comparison, neither of which depends on whether the models to be compared are nested to each other or not (Burnham et al., 2002). We have added the following clarification into the Methods.

      “We chose to use the AICc as the metric of goodness-of-fit for model comparison for the following statistical reasons. First, BIC is derived based on the assumption that the “true model” must be one of the models in the limited model set one compares (Burnham et al., 2002; Gelman & Shalizi, 2013), which is unrealistic in our case. In contrast, AIC does not rely on this unrealistic “true model” assumption and instead selects out the model that has the highest predictive power in the model set (Gelman et al., 2014). Second, AIC is also more robust than BIC for finite sample size (Vrieze, 2012).”

      I believe the model fitting procedure might benefit from hierarchical estimation, rather than maximum likelihood methods. Adolescents in particular seem to show multiple outliers in a^+ and w^+ at the lower end of the distributions in Figure S2. There are several packages to allow hierarchical estimation and model comparison in MATLAB (which I believe is the language used for this analysis; see https://journals.plos.org/ploscompbiol/article?id=10.1371/journal.pcbi.1007043).

      We thank the reviewer for this helpful comment and for referring us to relevant methodological work (Piray et al., 2019). We have addressed this point by incorporating hierarchical Bayesian estimation, which effectively mitigates outlier effects and improves model identifiability. The results replicated those obtained with MLE fitting and further revealed group-level differences in key parameters. Please see our detailed response to Reviewer#1 Q1 for the full description of this analysis and results.

      Results: Model confusion seems to show that the inequality aversion and social reward models were consistently confused with the baseline model. Is this explained or investigated? I could not find an explanation for this.

      The apparent overlap between the inequality aversion (Model 4) and social reward (Model 5) models in the recovery analysis likely arises because neither model includes a learning mechanism, making them unable to capture trial-by-trial adjustments in this dynamic task. Consequently, both were best fit by the baseline model. Please see Response to Reviewer #1 Q3 for related discussion.

      Figures 3e and 3f show the correlation between asymmetric learning rates and age. It seems that both a^+ and a^- are around 0.35-0.40 for young adolescents, and this becomes more polarised with age. Could it be that with age comes an increasing discernment of positive and negative outcomes on beliefs, and younger ages compress both positive and negative values together? Given the higher stochasticity in younger ages (\beta), it may also be that these values simply represent higher uncertainty over how to act in any given situation within a social context (assuming the differences in groups are true).

      We appreciate this insightful interpretation. Indeed, both α+ and α- cluster around 0.35–0.40 in younger adolescents and become increasingly polarized with age, suggesting that sensitivity to positive versus negative feedback is less differentiated early in development and becomes more distinct over time. This interpretation remains tentative and warrants further validation. Based on this comment, we have revised the Discussion to include this developmental interpretation.

      We also clarify that in our model β denotes the inverse temperature parameter; higher β reflects greater choice precision and value sensitivity, not higher stochasticity. Accordingly, adolescents showed higher β values, indicating more value-based and less exploratory choices, whereas adults displayed relatively greater exploratory cooperation. These group differences were also replicated using hierarchical Bayesian estimation (see Response to Reviewer #1 Q1). In response to this comment, we have added a statement in the Discussion highlighting this developmental interpretation.

      “Together, these findings suggest that the differentiation between positive and negative learning rates changes with age, reflecting more selective feedback sensitivity in development, while higher β values in adolescents indicate greater value sensitivity. This interpretation remains tentative and requires further validation in future research.”

      A parameter partial correlation matrix (off-diagonal) would be helpful to understand the relationship between parameters in both adolescents and adults separately. This may provide a good overview of how the model properties may change with age (e.g. a^+'s relation to \beta).

      We thank the reviewer for this helpful comment. We fully agree that a parameter partial correlation matrix can further elucidate the relationships among parameters. Accordingly, we conducted a partial correlation analysis and added the visually presented results to the revised manuscript as Figure 2-figure supplement 4.

      It would be helpful to have Bayes Factors reported with each statistical tests given that several p-values fall within the 0.01 and 0.10.

      We thank the reviewer for this important recommendation. We have conducted Bayes factor analyses and reported BF10 for all relevant post hoc comparisons. We also clarified our analysis in the Methods and Materials section: 

      “Post hoc comparisons were conducted using Bayes factor analyses with MATLAB’s bayesFactor Toolbox (version v3.0, Krekelberg, 2024), with a Cauchy prior scale σ = 0.707.”

      Discussion: I believe the language around ruling out failures in mentalising needs to be toned down. RL models do not enable formal representational differences required to assess mentalising, but they can distinguish biases in value learning, which in itself is interesting. If the authors were to show that more complex 'ToM-like' Bayesian models were beaten by RL models across the board, and this did not differ across adults and adolescents, there would be a stronger case to make this claim. I think the authors either need to include Bayesian models in their comparison, or tone down their language on this point, and/or suggest ways in which this point might be more thoroughly investigated (e.g., using structured models on the same task and running comparisons: https://journals.plos.org/plosone/article?id=10.1371/journal.pone.0087619).

      We thank the reviewer for the comments. Please see our response to Reviewer 1 (Appraisal & Discussion section) for details.

      Reviewer #2 (Recommendations for the authors):

      The authors may want to show the winning model earlier (perhaps near the beginning of the Results section, when model parameters are first mentioned).

      We thank the reviewer for this suggestion. We agree that highlighting the winning model early improves clarity. Currently, we have mentioned the winning model before the beginning of the Results section. Specifically, in the penultimate paragraph of the Introduction we state:

      “We identified the asymmetric RL learning model as the winning model that best explained the cooperative decisions of both adolescents and adults.”

      Reviewer #3 (Recommendations for the authors):

      In addition to the points mentioned above, I suggest the following:

      (1) Clarify plots by clearly explaining each variable. In particular, the indices 1 vs. 1,2 vs. 1,2,3 were not immediately understandable.

      We thank the reviewer for this suggestion. We agree that the indices were not immediately clear. We have revised the figure captions (Figure 1 and 4) to explicitly define these terms more clearly: 

      “The x-axis represents the consistency of the partner’s actions in previous trials (t<sub>−1</sub>: last trial; t<sub>−1,2</sub>: last two trials; t<sub>−1,2,3</sub>: last three trials).”

      It's unclear why the index stops at 3. If this isn't the maximum possible number of consecutive cooperation trials, please consider including all relevant data, as adolescents might show a trend similar to adults over more trials.

      We thank the reviewer for raising this point. In our exploratory analyses, we also examined longer streaks of consecutive partner cooperation or defection (up to four or five trials). Two empirical considerations led us to set the cutoff at three in the final analyses. First, the influence of partner behavior diminished sharply with temporal distance. In both GLMMs and LMMs, coefficients for earlier partner choices were small and unstable, and their inclusion substantially increased model complexity and multicollinearity. This recency pattern is consistent with learning and decision models emphasizing stronger weighting of recent evidence (Fudenberg & Levine, 2014; Fudenberg & Peysakhovich, 2016). Second, streaks longer than three were rare, especially among some participants, leading to data sparsity and inflated uncertainty. Including these sparse conditions risked biasing group estimates rather than clarifying them. Balancing informativeness and stability, we therefore restricted the index to three consecutive partner choices in the main analyses, which we believe sufficiently capture individuals’ general tendencies in reciprocal cooperation.

      The term "reciprocity" may not be necessary. Since it appears to reflect a general preference for cooperation, it may be clearer to refer to the specific behavior or parameter being measured. This would also avoid confusion, especially since adolescents do show negative reciprocity in response to repeated defection.

      We thank you for this comment. In our work, we compute the intrinsic reward for reciprocity as p × ω, where p is the partner cooperation expectation and ω is the cooperation preference. In the rPDG, this value framework manifests as a reciprocity-derived reward: sustained mutual cooperation maximizes joint benefits, and the resulting choice pattern reflects a value for reciprocity, contingent on the expected cooperation of the partner. This quantity enters the trade-off between U<sub>cooperation</sub> and U<sub>defection</sub>and captures the participant’s intrinsic reward for reciprocity versus the additional monetary reward payoff of defection. Therefore, we consider the term “reciprocity” an acceptable statement for this construct.

      Interpretation of parameters should closely reflect what they specifically measure.

      We thank the reviewer for pointing this out. We have refined the relevant interpretations of parameters in the current Results and Discussion sections.

      Prior research has shown links between Theory of Mind (ToM) and cooperation (e.g., Martínez-Velázquez et al., 2024). It would be valuable to test whether this also holds in your dataset.

      We thank the reviewer for this thoughtful comment. Although we did not directly measure participants’ ToM, our design allowed us to estimate participants’ trial-by-trial inferences (i.e., expectations) about their partner’s cooperation probability. We therefore treat these cooperation expectations as an indirect representation for belief inference, which is related to ToM processes. To test whether this belief-inference component relates to cooperation in our dataset, we further conducted an exploratory analysis (GLMM<sub>sup</sub>4) in which participants’ choices were regressed on their cooperation expectations, group, and the group × cooperation-expectation interaction, controlling for trial number and gender, with random effects. Consistent with the ToM–cooperation link in prior research (MartínezVelázquez et al., 2024), participants’ expectations about their partner’s cooperation significantly predicted their cooperative behavior (Table 14), suggesting that decisions were shaped by social learning about others’ inferred actions. Moreover, the interaction between group and cooperation expectation was not significant, indicating that this inference-driven social learning process likely operates similarly in adolescents and adults. This aligns with our primary modeling results showing that both age groups update beliefs via an asymmetric learning process. We have reported these analyses in the Appendix Analysis section.

      More informative table captions would help the reader. Please clarify how variables are coded (e.g., is female = 0 or 1? Is adolescent = 0 or 1?), to avoid the need to search across the manuscript for this information.

      We thank the reviewer for raising this point. We have added clear and standardized variable coding in the table notes of all tables to make them more informative and avoid the need to search the paper. We have ensured consistent wording and formatting across all tables.

      I hope these comments are helpful and support the authors in further strengthening their manuscript.

      We thank the three reviewers for their comments, which have been helpful in strengthening this work.

      Reference

      (1) Fudenberg, D., & Levine, D. K. (2014). Recency, consistent learning, and Nash equilibrium. Proceedings of the National Academy of Sciences of the United States of America, 111(Suppl. 3), 10826–10829. https://doi.org/10.1073/pnas.1400987111

      (2) Fudenberg, D., & Peysakhovich, A. (2016). Recency, records, and recaps: Learning and nonequilibrium behavior in a simple decision problem. ACM Transactions on Economics and Computation, 4(4), Article 23, 1–18. https://doi.org/10.1145/2956581

      (3) Hackel, L., Doll, B., & Amodio, D. (2015). Instrumental learning of traits versus rewards: Dissociable neural correlates and effects on choice. Nature Neuroscience, 18, 1233– 1235. https://doi.org/10.1038/nn.4080

      (4) Icenogle, G., Steinberg, L., Duell, N., Chein, J., Chang, L., Chaudhary, N., Di Giunta, L.,Dodge, K. A., Fanti, K. A., Lansford, J. E., Oburu, P., Pastorelli, C., Skinner, A. T.,Sorbring, E., Tapanya, S., Uribe Tirado, L. M., Alampay, L. P., Al-Hassan, S. M.,Takash, H. M. S., & Bacchini, D. (2019). Adolescents’ cognitive capacity reaches adult levels prior to their psychosocial maturity: Evidence for a “maturity gap” in a multinational, cross-sectional sample. Law and Human Behavior, 43(1), 69–85. https://doi.org/10.1037/lhb0000315

      (5) Krekelberg, B. (2024). Matlab Toolbox for Bayes Factor Analysis (v3.0) [Computer software]. Zenodo. https://doi.org/10.5281/zenodo.13744717

      (6) Martínez-Velázquez, E. S., Ponce-Juárez, S. P., Díaz Furlong, A., & Sequeira, H. (2024). Cooperative behavior in adolescents: A contribution of empathy and emotional regulation? Frontiers in Psychology, 15, 1342458. https://doi.org/10.3389/fpsyg.2024.1342458

      (7) Tervo-Clemmens, B., Calabro, F. J., Parr, A. C., et al. (2023). A canonical trajectory of executive function maturation from adolescence to adulthood. NatureCommunications, 14, 6922. https://doi.org/10.1038/s41467-023-42540-8

      (8) King-Casas, B., Tomlin, D., Anen, C., Camerer, C. F., Quartz, S. R., & Montague, P. R. (2005). Getting to know you: reputation and trust in a two-person economic exchange. Science, 308(5718), 78-83. https://doi.org/10.1126/science.1108062

      (9) Rilling, J. K., Gutman, D. A., Zeh, T. R., Pagnoni, G., Berns, G. S., & Kilts, C. D. (2002). A neural basis for social cooperation. Neuron, 35(2), 395-405. https://doi.org/10.1016/s0896-6273(02)00755-9

      (10) Fareri, D. S., Chang, L. J., & Delgado, M. R. (2015). Computational substrates of social value in interpersonal collaboration. Journal of Neuroscience, 35(21), 8170-8180. https://doi.org/10.1523/JNEUROSCI.4775-14.2015

      (11) Akaike, H. (2003). A new look at the statistical model identification. IEEE transactions on automatic control, 19(6), 716-723. https://doi.org/10.1109/TAC.1974.1100705

      (12) Schwarz, G. (1978). Estimating the dimension of a model. The annals of statistics, 461464. https://doi.org/10.1214/aos/1176344136

      (13) Burnham, K. P., & Anderson, D. R. (2002). Model selection and multimodel inference: A practical information-theoretic approach (2nd ed.). Springer.https://doi.org/10.1007/b97636

      (14) Gelman, A., & Shalizi, C. R. (2013). Philosophy and the practice of Bayesian statistics. British Journal of Mathematical and Statistical Psychology, 66(1), 8–38. https://doi.org/10.1111/j.2044-8317.2011.02037.x

      (15) Gelman, A., Carlin, J. B., Stern, H. S., Dunson, D. B., Vehtari, A., & Rubin, D. B. (2014). Bayesian data analysis (3rd ed.). Chapman and Hall/CRC. https://doi.org/10.1201/b16018

      (16) Vrieze, S. I. (2012). Model selection and psychological theory: A discussion of the differences between the Akaike Information Criterion (AIC) and the Bayesian Information Criterion (BIC). Psychological Methods, 17(2), 228–243. https://doi.org/10.1037/a0027127.

    1. visualize_token2token_scores(norm_fn(output_attentions_all, dim=2).squeeze().detach().cpu().numpy(), x_label_name='Layer')

      维度变化链路 output_attentions_all:(layer, batch, head, seq_len, seq_len) → norm_fn(dim=2):聚合head维度 → (layer, batch, seq_len, seq_len) → squeeze():删除batch维度 → (layer, seq_len, seq_len) → 最终用于可视化:每层的“token-token注意力强度矩阵”(汇总所有头的信息)


      维度格式 output_attentions_all.shape = (layer, batch, head, seq_len, seq_len)<br /> (文档中通过代码 output_attentions_all = torch.stack(output_attentions) 明确堆叠逻辑,且在 [29] 单元格注释中验证了维度构成)

      各维度含义

      • layer(维度索引 0,数值示例为 12) 表示 BERT 模型中编码器的层数。以 bert-base-uncased 为例,模型默认包含 12 个 Transformer 编码层。

      • batch(维度索引 1,数值示例为 1) 表示输入样本的批次大小。文档示例中仅使用了 1 个问答对作为输入,因此该维度取值为 1。

      • head(维度索引 2,数值示例为 12) 表示每一层中的多头注意力头数。对于 bert-base-uncased,每个编码层默认包含 12 个注意力头。

      • seq_len(维度索引 3,行维度,数值示例为 26) 表示输入序列的长度,包括 [CLS][SEP] 等特殊 token。该维度对应注意力的“发出者”(query)token。

      • seq_len(维度索引 4,列维度,数值示例为 26) 与上一维度含义一致,同样表示序列长度,但对应注意力的“接收者”(key)token。张量中的每个元素 $[l, b, h, i, j]$ 表示在第 $l$ 层、第 $b$ 个样本、第 $h$ 个注意力头下,第 $i$ 个 token 对第 $j$ 个 token 分配的注意力权重(经 softmax 归一化)。


      文档中 norm_fn 是 L2 范数计算函数(基于 PyTorch 版本选择 torch.linalg.normtorch.norm),调用方式为 norm_fn(output_attentions_all, dim=2),核心是在“注意力头(head)”维度上计算范数,以汇总每层所有头的注意力信息。

      操作逻辑 - 输入:output_attentions_all 维度为 (layer, batch, head, seq_len, seq_len)<br /> - 关键参数:dim=2 表示对第2维(head维度)计算L2范数——即对每层、每个样本、每个“发出者-接收者”token对(i,j),将12个注意力头的权重作为向量,计算其L2范数( \(\sqrt{\sum_{h=1}^{12} w_{l,b,h,i,j}^2}\) )。

      输出维度与含义 - 输出维度(norm_fn 后):(layer, batch, seq_len, seq_len)<br /> (因在 head 维度(dim=2)上聚合,故维度数从5维减少为4维,删除了 head 维度) - 后续处理:squeeze().detach().cpu().numpy() 是张量格式转换操作,不改变维度含义: - squeeze():去除维度大小为1的维度(此处 batch=1,故删除 batch 维度),最终维度变为 (layer, seq_len, seq_len); - detach().cpu().numpy():将PyTorch张量转为NumPy数组,用于后续可视化。

      最终维度

      • layer(维度索引 0,数值示例为 12) 与输入保持一致,表示 BERT 的 12 个编码器层。

      • seq_len(维度索引 1,行维度,数值示例为 26) 表示输入序列的长度,对应注意力的“发出者”(query)token,与原始注意力张量的第 3 维一致。

      • seq_len(维度索引 2,列维度,数值示例为 26) 同样表示输入序列的长度,对应注意力的“接收者”(key)token,与原始注意力张量的第 4 维一致。张量中每个元素 $[l,i,j]$ 表示在第 $l$ 层中,第 $i$ 个 token 对第 $j$ 个 token 的多头注意力权重汇总范数,用于刻画该 token 对在该层上的整体注意力强度,而不区分具体注意力头。

    1. Author response:

      Reviewer #1

      (1) Mechanistic insight into how Hsp70 but not Hsc70 increase PL-SF FL tau aggregation/pathology is missing. This is despite both chaperones binding to PL-SF FL tau. What species of tau does Hsp70 bind, and what cofactors are important in this process?

      We agree that explaining why Hsp70, but not Hsc70, promotes tau aggregation would strengthen the study. Although both chaperones bind tau, they diverge slightly in 1) protein sequence, 2) biochemical activity, and 3) co-chaperone engagement.

      Sequence: Hsp70 has an extra cysteine residue (Cys306) that is highly reactive to oxidation and a glycine residue that is critical for cysteine oxidation (Gly557). Both residues are specific to Hsp70 (not present in Hsc70) and may alter Hsp70 conformation or client handling (Hong et al., 2022).

      Biochemical activity: Prior studies indicate that Hsp70’s ATPase domain (NBD) is critical for tau interactions (Jinwal et al., 2009; Fontaine et al., 2015; Young et al., 2016) and can be disrupted with point mutations including K71E and E175S for ATPase and A406G/V438G for substrate binding (Fontaine et al., 2015).

      Co-chaperone engagement: Hsp70 recruits the co-chaperone and E3 ubiquitin ligase CHIP/Stub1 more strongly than Hsc70, suggesting co-chaperone engagement could lead to differences in tau processing (Jinwal et al., 2013).

      To directly test how the two closely related chaperones could differentially impact tau, we plan to perform the following experiments:

      (a) We will mutate residues responsible for cysteine reactivity in Hsp70 including the cysteine itself (Cys306) and the critical glycine that facilitates cysteine reactivity (Gly557). These residues will be deleted from Hsp70 or alternatively inserted into Hsc70 to determine whether cysteine reactivity is the reason for Hsp70’s ability to drive tau aggregation.

      (b) We will generate Hsp70 mutants lacking ATPase- or substrate-binding mutants to determine which Hsp70 domains are responsible for driving tau aggregation.

      (c) We will perform seeding assays in stable tau-expressing cell lines to determine whether Hsp70/Hsc70 overexpression or depletion alters seeded tau aggregation.

      (d) We will perform confocal microscopy to determine the extent of co-localization of Hsp70 or Hsc70 with phospho-tau, oligomeric tau, or Thioflavin-S (ThioS) to identify which tau species are engaged by Hsp70/Hsc70.

      (e) We will perform immunoprecipitation pull-downs followed by mass spectrometry to globally identify any relevant Hsp70/Hsc70 interacting factors that might account for the differences in tau aggregation.

      (2) The study relies heavily on densitometry of bands to draw conclusions; in several instances, the blots are overexposed to accurately quantify the signal.

      All immunoblots were acquired as 16-bit TIFFs with exposure settings chosen to prevent pixel saturation, and quantification was performed on raw, unsaturated images. Brightness and contrast adjustments were applied only for visualization and did not alter pixel values used for analysis. All quantified bands fell within the linear range of the detector, with one exception in Figure 7B, which we removed from quantification. We will add both low- and high-exposure versions of immunoblots to the revised figures to demonstrate signal linearity and dynamic range.

      Reviewer #2

      (1) Although the PL-SF model can accelerate tau aggregation, it is crucial to determine whether this aligns with the temporal progression and spatial distribution of tau pathology in the brains of patients with tauopathies.

      No single tauopathy model fully recapitulates the temporal and spatial progression of human tauopathies. The PL-SF system is not intended to model the disease course. Rather, it is an excellent model for mechanistic studies of mature tau aggregation, which is otherwise challenging to study. We note that prior studies showed that PL-SF tau expression in transgenic mice (Xia et al., 2022 and Smith et al., 2025) and rhesus monkeys (Beckman et al., 2021) led to prion-like tau seeding and aggregation in hippocampal and cortical regions. Indeed, the spatial and temporal tau aggregation patterns aligned with features of human tauopathies. So far, these findings all support PL-SF as a valid accelerated model of tauopathy than can be used to interrogate pathogenic mechanisms that impact tau processing, degradation, and/or aggregation.

      (2) The authors did not elucidate the specific molecular mechanism by which Hsp70 promotes tau aggregation.

      We agree that a deeper understanding of the molecular mechanism is needed. The revision experiments outlined above (Reviewer #1, point #1) will define how Hsp70 promotes tau aggregation by testing sequence contributions, dissecting ATPase and substrate-binding domain requirements, and mapping Hsp70/Hsc70 interactors to directly address this mechanistic question.

      (3) Some figures in this study show large error bars in the quantitative data (some statistical analysis figures, MEA recordings, etc.), indicating significant inter-sample variability. It is recommended to label individual data points in all quantitative figures and clearly indicate them in figure legends.

      We acknowledge the inter-sample variability in some of the quantitative datasets. This level of variability can occur in primary neuronal cultures (e.g., MEA recordings) that are sensitive to growth and surface adhesion conditions, leading to many technical considerations. To improve transparency and interpretation, we will revise all quantitative figures to display individual data points overlaid on summary statistics and will update figure legends to clearly indicate sample sizes and statistical tests used.

      References

      Hong Z, Gong W, Yang J, Li S, Liu Z, Perrett S, Zhang H. Exploration of the cysteine reactivity of human inducible Hsp70 and cognate Hsc70. J Biol Chem. 2023 Jan;299(1):102723. doi: 10.1016/j.jbc.2022.102723. Epub 2022 Nov 19. PMID: 36410435; PMCID: PMC9800336.

      Jinwal UK, Miyata Y, Koren J 3rd, Jones JR, Trotter JH, Chang L, O'Leary J, Morgan D, Lee DC, Shults CL, Rousaki A, Weeber EJ, Zuiderweg ER, Gestwicki JE, Dickey CA. Chemical manipulation of hsp70 ATPase activity regulates tau stability. J Neurosci. 2009 Sep 30;29(39):12079-88. doi: 10.1523/JNEUROSCI.3345-09.2009. PMID: 19793966; PMCID: PMC2775811.

      Fontaine SN, Rauch JN, Nordhues BA, Assimon VA, Stothert AR, Jinwal UK, Sabbagh JJ, Chang L, Stevens SM Jr, Zuiderweg ER, Gestwicki JE, Dickey CA. Isoform-selective Genetic Inhibition of Constitutive Cytosolic Hsp70 Activity Promotes Client Tau Degradation Using an Altered Co-chaperone Complement. J Biol Chem. 2015 May 22;290(21):13115-27. doi: 10.1074/jbc.M115.637595. Epub 2015 Apr 11. PMID: 25864199; PMCID: PMC4505567

      Young ZT, Rauch JN, Assimon VA, Jinwal UK, Ahn M, Li X, Dunyak BM, Ahmad A, Carlson G, Srinivasan SR, Zuiderweg ERP, Dickey CA, Gestwicki JE. Stabilizing the Hsp70‑Tau Complex Promotes Turnover in Models of Tauopathy. Cell Chem Biol. 2016 Aug 4;23(8):992–1001. doi:10.1016/j.chembiol.2016.04.014.

      Jinwal UK, Akoury E, Abisambra JF, O'Leary JC 3rd, Thompson AD, Blair LJ, Jin Y, Bacon J, Nordhues BA, Cockman M, Zhang J, Li P, Zhang B, Borysov S, Uversky VN, Biernat J, Mandelkow E, Gestwicki JE, Zweckstetter M, Dickey CA. Imbalance of Hsp70 family variants fosters tau accumulation. FASEB J. 2013 Apr;27(4):1450-9. doi: 10.1096/fj.12-220889. Epub 2012 Dec 27. PMID: 23271055; PMCID: PMC3606536.

      Xia, Y., Prokop, S., Bell, B.M. et al. Pathogenic tau recruits wild-type tau into brain inclusions and induces gut degeneration in transgenic SPAM mice. Commun Biol 5, 446 (2022). https://doi.org/10.1038/s42003-022-03373-1.

      Smith ED, Paterno G, Bell BM, Gorion KM, Prokop S, Giasson BI. Tau from SPAM Transgenic Mice Exhibit Potent Strain-Specific Prion-Like Seeding Properties Characteristic of Human Neurodegenerative Diseases. Neuromolecular Med. 2025 May 30;27(1):44. doi: 10.1007/s12017-025-08850-4. PMID: 40447946; PMCID: PMC12125038.

      Beckman D, Chakrabarty P, Ott S, Dao A, Zhou E, Janssen WG, Donis-Cox K, Muller S, Kordower JH, Morrison JH. A novel tau-based rhesus monkey model of Alzheimer's pathogenesis. Alzheimers Dement. 2021 Jun;17(6):933-945. doi: 10.1002/alz.12318. Epub 2021 Mar 18. PMID: 33734581; PMCID: PMC8252011.

    1. Author response:

      The following is the authors’ response to the original reviews.

      Public Reviews:

      Reviewer #1 (Public review):

      Summary:

      Artiushin et al. establish a comprehensive 3D atlas of the brain of the orb-web building spider Uloborus diversus. First, they use immunohistochemistry detection of synapsin to mark and reconstruct the neuropils of the brain of six specimens and they generate a standard brain by averaging these brains. Onto this standard 3D brain, they plot immunohistochemical stainings of major transmitters to detect cholinergic, serotonergic, octopaminergic/taryminergic and GABAergic neurons, respectively. Further, they add information on the expression of a number of neuropeptides (Proctolin, AllatostatinA, CCAP, and FMRFamide). Based on this data and 3D reconstructions, they extensively describe the morphology of the entire synganglion, the discernible neuropils, and their neurotransmitter/neuromodulator content.

      Strengths:

      While 3D reconstruction of spider brains and the detection of some neuroactive substances have been published before, this seems to be the most comprehensive analysis so far, both in terms of the number of substances tested and the ambition to analyze the entire synganglion. Interestingly, besides the previously described neuropils, they detect a novel brain structure, which they call the tonsillar neuropil.<br /> Immunohistochemistry, imaging, and 3D reconstruction are convincingly done, and the data are extensively visualized in figures, schemes, and very useful films, which allow the reader to work with the data. Due to its comprehensiveness, this dataset will be a valuable reference for researchers working on spider brains or on the evolution of arthropod brains.

      Weaknesses:

      As expected for such a descriptive groundwork, new insights or hypotheses are limited, apart from the first description of the tonsillar neuropil. A more comprehensive labeling in the panels of the mentioned structures would help to follow the descriptions. The reconstruction of the main tracts of the brain would be a very valuable complementary piece of data.

      Reviewer #2 (Public review):

      Summary

      Artiushin et al. created the first three-dimensional atlas of a synganglion in the hackled orb-weaver spider, which is becoming a popular model for web-building behavior. Immunohistochemical analysis with an impressive array of antisera reveals subcompartments of neuroanatomical structures described in other spider species as well as two previously undescribed arachnid structures, the protocerebral bridge, hagstone, and paired tonsillar neuropils. The authors describe the spider's neuroanatomy in detail and discuss similarities and differences from other spider species. The final section of the discussion examines the homology between onychophoran and chelicerate arcuate bodies and mandibulate central bodies.

      Strengths

      The authors set out to create a detailed 3D atlas and accomplished this goal.

      Exceptional tissue clearing and imaging of the nervous system reveal the three-dimensional relationships between neuropils and some connectivity that would not be apparent in sectioned brains.

      A detailed anatomical description makes it easy to reference structures described between the text and figures.

      The authors used a large palette of antisera which may be investigated in future studies for function in the spider nervous system and may be compared across species.

      Weaknesses

      It would be useful for non-specialists if the authors would introduce each neuropil with some orientation about its function or what kind of input/output it receives, if this is known for other species. Especially those structures that are not described in other arthropods, like the opisthosomal neuropil. Are there implications for neuroanatomical findings in this paper on the understanding of how web-building behaviors are mediated by the brain?

      Likewise, where possible, it would be helpful to have some discussion of the implications of certain neurotransmitters/neuropeptides being enriched in different areas. For example, GABA would signal areas of inhibitory connections, such as inhibitory input to mushroom bodies, as described in other arthropods. In the discussion section on relationships between spider and insect midline neuropils, are there similarities in expression patterns between those described here and in insects?

      Reviewer #3 (Public review):

      Summary:

      This is an impressive paper that offers a much-needed 3D standardized brain atlas for the hackled-orb weaving spider Uloborus diversus, an emerging organism of study in neuroethology. The authors used a detailed immunohistological whole-mount staining method that allowed them to localize a wide range of common neurotransmitters and neuropeptides and map them on a common brain atlas. Through this approach, they discovered groups of cells that may form parts of neuropils that had not previously been described, such as the 'tonsillar neuropil', which might be part of a larger insect-like central complex. Further, this work provides unique insights into the previously underappreciated complexity of higher-order neuropils in spiders, particularly the arcuate body, and hints at a potentially important role for the mushroom bodies in vibratory processing for web-building spiders.

      Strengths:

      To understand brain function, data from many experiments on brain structure must be compiled to serve as a reference and foundation for future work. As demonstrated by the overwhelming success in genetically tractable laboratory animals, 3D standardized brain atlases are invaluable tools - especially as increasing amounts of data are obtained at the gross morphological, synaptic, and genetic levels, and as functional data from electrophysiology and imaging are integrated. Among 'non-model' organisms, such approaches have included global silver staining and confocal microscopy, MRI, and, more recently, micro-computed tomography (X-ray) scans used to image multiple brains and average them into a composite reference. In this study, the authors used synapsin immunoreactivity to generate an averaged spider brain as a scaffold for mapping immunoreactivity to other neuromodulators. Using this framework, they describe many previously known spider brain structures and also identify some previously undescribed regions. They argue that the arcuate body - a midline neuropil thought to have diverged evolutionarily from the insect central complex - shows structural similarities that may support its role in path integration and navigation.

      Having diverged from insects such as the fruit fly Drosophila melanogaster over 400 million years ago, spiders are an important group for study - particularly due to their elegant web-building behavior, which is thought to have contributed to their remarkable evolutionary success. How such exquisitely complex behavior is supported by a relatively small brain remains unclear. A rich tradition of spider neuroanatomy emerged in the previous century through the work of comparative zoologists, who used reduced silver and Golgi stains to reveal remarkable detail about gross neuroanatomy. Yet, these techniques cannot uncover the brain's neurochemical landscape, highlighting the need for more modern approaches-such as those employed in the present study.

      A key insight from this study involves two prominent higher-order neuropils of the protocerebrum: the arcuate body and the mushroom bodies. The authors show that the arcuate body has a more complex structure and lamination than previously recognized, suggesting it is insect central complex-like and may support functions such as path integration and navigation, which are critical during web building. They also report strong synapsin immunoreactivity in the mushroom bodies and speculate that these structures contribute to vibratory processing during sensory feedback, particularly in the context of web building and prey localization. These findings align with prior work that noted the complex architecture of both neuropils in spiders and their resemblance (and in some cases greater complexity) compared to their insect counterparts. Additionally, the authors describe previously unrecognized neuropils, such as the 'tonsillar neuropil,' whose function remains unknown but may belong to a larger central complex. The diverse patterns of neuromodulator immunoreactivity further suggest that plasticity plays a substantial role in central circuits.

      Weaknesses:

      My major concern, however, is that some of the authors' neuroanatomical descriptions rely too heavily on inference rather than what is currently resolvable from their immunohistochemistry stains alone.

      We would like to thank the reviewers for their time and effort in carefully reading our manuscript and providing helpful feedback, and particularly for their appreciation and realistic understanding of the scope of this study and its context within the existing spider neuroanatomical literature.

      Regarding the limitations and potential additions to this study, we believe these to be well-reasoned and are in agreement. We plan to address some of these shortcomings in future publications.

      As multiple reviewers remarked, a mapping of the major tracts of the brain would be a welcome addition to understanding the neuroanatomy of U. diversus. This is something which we are actively working on and hope to provide in a forthcoming publication. Given the length of this paper as is, we considered that a treatment of the tracts would be better served as an additional paper. Likewise, mapping of the immunoreactive somata of the currently investigated targets is a component which we would like to describe as part of a separate paper, keeping the focus of the current one on neuropils, in order to leverage our aligned volumes to describe co-expression patterns, which is not as useful for the more widely dispersed somata. Furthermore, while we often see somata through immunostaining, the presence and intensity of the signal is variable among immunoreactive populations. We are finding that these populations are more consistently and comprehensively revealed thru fluorescent in situ hybridization.

      We appreciate the desire of the reviewers for further information regarding the connectivity and function of the described neuropils, and where possible we have added additional statements and references. That being said, where this context remains sparse is largely a reflection of the lack of information in the literature. This is particularly the case for functional roles for spider neuropils, especially higher order ones of the protocerebrum, which are essentially unexamined. As summarized in the quite recent update to Foelix’s Spider Neuroanatomy, a functional understanding for protocerebral neuropil is really only available for the visual pathway. Consequently, it is therefore also difficult to speak of the implications for presence or absence of particular signaling elements in these neuropils, if no further information about the circuitry or behavioral correlates are available. Finally, multiple reviewers suggested that it might be worthwhile to explore a comparison of the arcuate body layer innervation to that of the central bodies of insects, of which there is a richer literature. This is an idea which we were also initially attracted to, and have now added some lines to the discussion section. Our position on this is a cautious one, as a series of more recent comparative studies spanning many insect species using the same antibody, reveals a considerable amount of variation in central body layering even within this clade, which has given us pause in interpreting how substantive similarities and differences to the far more distant spiders would be. Still, this is an interesting avenue which merits an eventual comprehensive analysis, one which would certainly benefit from having additional examples from more spider species, in order to not overstate conclusions based on the currently limited neuroanatomical representation.

      Given our framing for the impetus to advance neuroanatomical knowledge in orb-web builders, the question of whether the present findings inform the circuitry controlling web-building is one that naturally follows. While we are unable with this dataset alone to define which brain areas mediate web-building - something which would likely be beyond any anatomical dataset lacking complementary functional data – the process of assembling the atlas has revealed structures and defined innervation patterns in previously ambiguous sectors of the spider brain, particularly in the protocerebrum. A simplistic proposal is that such regions, which are more conspicuous by our techniques and in this model species, would be good candidates for further inquiries into web-building circuitry, as their absence or oversight in past work could be attributable to the different behavioral styles of those model species. Regardless, granted that such a hypothesis cannot be readily refuted by the existing neuroanatomical literature, underscores the need to have more finely refined models of the spider brain, to which we hope that we have positively contributed to and are gratified by the reviewer’s enthusiasm for the strengths of this study.

      Recommendations for the authors:

      Reviewer #1 (Recommendations for the authors):

      (1) Brenneis 2022 has done a very nice and comprehensive study focused on the visual system - this might be worth including.

      Thank you, we have included this reference on Line 34.

      (2) L 29: When talking about "connectivity maps", the emerging connectomes based on EM data could be mentioned.

      Additional references have been added, thank you. Line 35.

      (3) L 99: Please mention that you are going to describe the brain from ventral to dorsal.

      Thank you, we have added a comment to Line 99.

      (4) L 13: is found at the posterior.

      Thank you, revised.

      (5) L 168: How did you pick those two proctolin+ somata, given that there is a lot of additional punctate signal?

      Although not visible in this image, if you scroll through the stack there is a neurite which extends from these neurons directly to this area of pronounced immunoreactivity.

      (6) Figure 1: Please add the names of the neuropils you go through afterwards.

      We have added labels for neuropils which are recognizable externally.

      (7) Figure 1 and Figure 5: Please mark the esophagus.

      Label has now been added to Figure 1. In Figure 5, the esophagus should not really be visible because these planes are just ventral to its closure.

      (8) Figure 5A: I did not see any CCAP signal where the arrow points to; same for 5B (ChAT).

      In hindsight, the CCAP point is probably too minor to be worth mentioning, so we have removed it.

      The ChAT signal pattern in 5B has been reinforced by adding a dashed circle to show its location as well.

      (9) L 249: Could the circular spot also be a tract (many tracts lack synapsin - at least in insects)?

      Yes, thank you for pointing this out – the sentence is revised (L274). We are currently further analyzing anti-tubulin volumes and it seem that indeed there are tracts which occupy these synapsin-negative spaces, although interestingly they do not tend to account for the entire space.

      (10) L 302: Help me see the "conspicuous" thing.

      Brace added to Fig. 8B, note in caption.

      (11) L 315: Please first introduce the number of the eyes and how these relate to 1{degree sign} and 2{degree sign} pathway. Are these separate pathways from separate eyes or two relay stations of one visual pathway?

      We have expanded the introduction to this section (L336). Yes, these are considered as two separate visual pathways, with a typical segregation of which eyes contribute to which pathway – although there is evidence for species-specific differences in these contributions. In the context of this atlas, we are not currently able to follow which eyes are innervating which pathway.

      (12) L 343: It seems that the tonsillar neuropil could be midline spanning (at least this is how I interpret the signal across the midline). Would it make sense to re-formulate from a paired structure to midline-spanning? Would that make it another option for being a central complex homolog?

      In the spectrum from totally midline spanning and unpaired (e.g., arcuate body (at least in adults)) to almost fully distinct and paired (e.g., mushroom bodies (although even here there is a midline spanning ‘bridge’)), we view the tonsillar to be more paired due to the oval components, although it does have a midline spanning section, particularly unambiguous just posterior to the oval sections.

      Regarding central complex homology, if the suggestion is that the tonsillar with its midline spanning component could represent the entire central complex, then this is a possibility, but it would neglect the highly innervated and layered arcuate body, which we think represent a stronger contender – at least as a component of the central complex. For this reason, we would still be partial to the possibility that the tonsillar is a part of the central complex, but not the entire complex.

      (13) L 407: ...and dorsal (..) lobe...

      Added the word ‘lobe’ to this sentence (L429).

      (14) L 620ff: Maybe mention the role of MBs in learning and memory.

      A reference has been added at L661.

      (15) L 644: In the context of arcuate body homology with the central body, I was missing a discussion of the neurotransmitters expressed in the respective parts in insects. Would that provide additional arguments?

      This is an interesting comparison to explore, and is one that we initially considered making as well. There are certainly commonalities that one could point to, particularly in trying to build the case of whether particular lobes of the arcuate body are similar to the fan-shaped or ellipsoid bodies in insects. Nevertheless, something which has given us pause is studying the more recent comparative works between insect species (Timm et al., 2021, J Comp Neuro, Homberg et al., 2023, J Comp Neuro), which also reveal a fair degree of heterogeneity in expression patterns between species – and this is despite the fact that the neuropils are unambiguously homologous. When comparing to a much more evolutionarily distant organism such as the spider, it becomes less clear which extant species should serve as the best point of comparison, and therefore we fear making specious arguments by focusing on similarities when there are also many differences. We have added some of these comments to the discussion (L699-725).

      Throughout the text, I frequently had difficulties in finding the panels right away in the structures mentioned in the text. It would help to number the panels (e.g., 6Ai, Aii, Aii,i etc) and refer to those in the text. Further, all structures mentioned in the text should be labelled with arrows/arrowheads unless they are unequivocally identified in the panel

      Thank you for the suggestion. We have adopted the additional numbering scheme for panels, and added additional markers where suggested.

      Reviewer #2 (Recommendations for the authors):

      (1) L 18: "neurotransmitter" should be pluralized.

      Thank you, revised (L18).

      (2) L 55: Missing the word "the" before "U. diversus".

      Thank you, revised (L57).

      (3) L 179: Change synaptic dense to "synapse-dense".

      Thank you, revised (L189).

      (4) L 570: "present in" would be clearer than "presented on in".

      Our intention here was to say that Loesel et al did not show slices from the subesophageal mass for CCAP, so it was ambiguous as to whether it had immunoreactivity there but they simply did not present it, or if it indeed doesn’t show signal in the subesophageal. But agreed, this is awkward phrasing which has been revised (L606-608), thank you.

      (5) L 641: It would be worth noting that the upper and lower central bodies are referred to as the fan-shaped and ellipsoid bodies in many insects.

      Thank you, this has been added in L694.

      (6) L 642: Although cited here regarding insect central body layers, Strausfeld et al. 2006 mainly describe the onychophoran brain and the evolutionary relationship between the onychophoran and chelicerate arcuate bodies. The phylogenetic relationships described here would strengthen the discussion in the section titled "A spider central complex?"

      The phylogenetic relationship of onychophorans and chelicerates remains controversial and therefore we find it tricky to use this point to advance the argument in that discussion section, as one could make opposing arguments. The homology of the arcuate body (between chelicerates, onychophorans, and mandibulates) has likewise been argued over, with this Strausfeld et al paper offering one perspective, while others are more permissive (good summary at end of Doeffinger et al., 2010). Our thought was simply to draw attention to grossly similar protocerebral neuropils in examples from distantly related arthropods, without taking a stance, as our data doesn’t really deeply advance one view over the other.

      (7) L 701- Noduli have been described in stomatopods (Thoen et al., Front. Behav. Neurosci., 2017).

      This is an important addition, thank you – it has been incorporated and cited (L766).

      (8) Antisera against DC0 (PKA-C alpha) may distinguish globuli cells from other soma surrounding the mushroom bodies, but this may be accomplished in future studies.

      Agreed, this is something we have been interested in, but have not yet acquired the antibody.

      Reviewer #3 (Recommendations for the authors):

      Overall, this paper is both timely and important. However, it may face some resistance from classically trained arthropod neuroanatomists due to the authors' reliance on immunohistochemistry alone. A method to visualize fiber tracts and neuropil morphology would have been a valuable and grounding complement to the dataset and can be added in future publications. Tract-tracing methods (e.g., dextran injections) would strengthen certain claims about connectivity - particularly those concerning the mushroom bodies. For delineating putative cell populations across regions, fluorescence in situ hybridization for key transcripts would offer convincing evidence, especially in the context of the arcuate body, the tonsillar neuropil, and proposed homologies to the insect central complex.

      That said, the dataset remains rich and valuable. Outlined below are a number of issues the authors may wish to address. Most are relatively minor, but a few require further clarification.

      (1) Abstract

      (a) L 12-14: The authors should frame their work as a novel contribution to our understanding of the spider brain, rather than solely as a tool or stepping stone for future studies. The opening sentences currently undersell the significance of the study.

      Thank you for your encourament! We have revised the abstract.

      (b) Rather than touting "first of its kind" in the abstract, state what was learned from this.

      Thank you, we have revised the abstract.

      (c) The abstract does not mention the major results of the study. It should state which brain regions were found. It should list all of the peptides and transmitters that were tested so that they can be discoverable in searches.

      Thank you, revised.

      (2) Introduction

      (a) L 38: There's a more updated reference for Long (2016): Long, S. M. (2021). Variations on a theme: Morphological variation in the secondary eye visual pathway across the order of Araneae. Journal of Comparative Neurology, 529(2), 259-280.

      Thank you, this has been updated (L41 and elsewhere).

      (b) L 47: While whole-mount imaging offers some benefits, a downside is the need for complete brain dissection from the cuticle, which in spiders likely damages superficial structures (such as the secondary eye pathways).

      True – we have added this caveat to the section (L48-51).

      (c) L 49-52: If making this claim, more explicit comparisons with non-web building C. saeli in terms of neuropil presence, volume, or density later in the paper would be useful.

      We do not have the data on hand to make measured comparisons of C. salei structures, and the neuropils identified in this study are not clearly identifiable in the slices provided in the literature, so would likely require new sample preparations. We’ve removed the reference to proportionality and softened this sentence slightly – we are not trying to make a strong claim, but simply state that this is a possibility.

      (3) Results

      (a) The authors should state how they accounted for autofluorescence.

      While we did not explicitly test for autofluorescence, the long process of establishing a working whole-mount immuno protocol and testing antibodies produced many examples of treated brains which did not show any substantial signal.  We have added a note to the methods section (L866).

      (b) L 69: There is some controversy in delineating the subesophageal and supraesophageal mass as the two major divisions despite its ubiquity in the literature. It might be safer to delineate the protocerebrum, deutocerebrum, and fused postoral ganglia (including the pedipalp ganglion) instead.

      Thank you for this insight, we have modified the section, section headings and Figure 1 to account for this delineation as well. We have chosen to include both ways of describing the synganglion, in order to maintain a parallel with the past literature, and to be further accessible to non-specialist readers. L73-77

      (c) L 90: It might be useful to include a justification for the use of these particular neuropeptides.

      Thank you, revised. L97-99.

      (d) L 106 - 108: It is stated that the innervation pattern of the leg neuropils is generally consistent, but from Figure 2, it seems that there are differences. The density of 5HT, Proctolin, ChAT, and FMRFamide seems to be higher in the posterior legs. AstA seems to have a broader distribution in L1 and is absent in L4.

      We would still stand by the generalization that the innervation pattern is fairly similar for each leg. The L1 neuropils tend to be bigger than the posterior legs, which might explain the difference in density. Another important aspect to keep in mind is that not all of the leg neuropils appear at the exact same imaging plane as we move from ventral to dorsal. If you scroll through the synapsin stack (ventral to dorsal), you will see that L2 and L3 appear first, followed shortly by L1, and then L4, and at the dorsal end of the subesophageal they disappear in the opposite order. The observations listed here are true for the single z-plane in Figure 2, but the fact that they don’t appear at the same time seems to mainly account for these differences. For example, if you scroll further ventrally in the AstA volume, you will see a very similar innervation appear in L4 as well, even though it is absent in the Fig. 2 plane. We plan to have these individual volumes available from a repository so that they can be individually examined to better see the signal at all levels. At the moment, the entire repository can be accessed here: https://doi.org/10.35077/ace-moo-far.

      (e) Figure 1 and elsewhere: The axes for the posterior and lateral views show Lateral and Medial. It would be more accurate to label them Left and Right. because it does not define the medial-to-lateral axis. The medial direction is correct for only one hemiganglion, and it's the opposite for the contralateral side.

      Thank you, revised.

      (f) In Figures that show particular sections, it might be helpful to include a plane in the standard brain to illustrate where that section is.

      Yes, we agree and it was our original intention. It is something we can attempt to do, but there is not much room in the corners of many of the synapsin panels, making it harder to make the 3D representation big enough to be clear.

      (g) Figure 2, 3: Presenting the z-section stack separately in B and C is awkward because it makes it seem that they are unrelated. I think it would be better to display the z160-190 directly above its corresponding z230-260 for each of the exemplars in B and C. Since there's no left-right asymmetry, a hemibrain could be shown for all examples as was done for TH in D. It's not clear why TH was presented differently.

      Thank you for this suggestion. We rearranged the figure as described, but ultimately still found the original layout to be preferrable, in part because the labelling becomes too cramped. We hope that the potential confusion of the continuity of the B and C sections will be mitigated by focusing on the z plane labels and overall shape – which should suggest that the planes are not far from each other. We trust that the form of the leg neuropils is recognizable in both B and C synapsin images, and so readers will make the connection.

      Regarding TH, this panel is apart from the rest because we were unable to register the TH volume to the standard brain because the variant of the protocol which produced good anti-TH staining conflicted with synapsin, and we could not simultaneously have adequate penetration of the synapsin signal. We did not want to align the TH panel with the others to avoid potential confusion that this was a view from the same z-plane of a registered volume, as the others are. We have added a note to the figure caption.

      (h) The locations of the labels should be consistent. The antisera are below the images in Figure 2, above in Figure 3, and to the bottom left in Figure 5. The slices are shown above in Figure 2 and below in Figure 3.

      Thank you, this has been revised for better consistency.

      (i) It is surprising to me that there is no mention of the neuronal somata visible in Figure 2 and Figure 3. A typical mapping of the brain would map the locations of the neurons, not just the neuropils.

      Our first arrangement of this paper described each immunostain individually from ventral to dorsal, including locations of the immunoreactive somata which could be observed. To aid the flow of the paper and leverage the aligned volumes to emphasize co-expression in the function divisions of the brain, we re-formulated to this current layout which is organized around neuropils. Somata locations are tricky to incorporate in this format of the paper which focuses on key z-planes or tight max projections, because the relevant immunoreactive somata are more dispersed throughout the synganglion, not always overlapping in neighboring z-planes. Further, since only a minority of the antisera we used can reveal traceable projections from the supplying somata in the whole-mount preparation, we would be quite limited in the degree to which we could integrate the specific somata mapping with expression patterns in the neuropil.  Finally, compared to immuno, which can be variable in staining intensity between somata for the same target, we find that FISH reveals these locations more clearly and comprehensively – so while we agree that this mapping would also be useful for the atlas, we would like to better provide this information in a future publication using whole-mount FISH.

      (j) L 139: There is a reference to a "brace" in Figure 3B, which does not seem to exist. There's one in Figure 3C.

      There is a smaller brace near the bottom of the TDC2 panel in Fig. 3B.

      (k) L 151 should be "3D".

      Thank you, revised (L160).

      (l) Figure 4C: It is not mentioned in the legend that the bottom inset is Proctolin without synapsin.

      Thank you, revised (L1213).

      (m) L 199: Are the authors sure this subdivision is solely on the anterior-posterior axis? Could it also be dorsal ventral? (i.e., could this be an artifact of the protocerebrum and deutocerebrum?)

      Yes, this division can be appreciated to extend somewhat in the dorsal-ventral axis and it is possible that this is the protocerebrum emerging after the deutocerebrum, although this area is largely dorsal to the obvious part of the deutocerebrum. In the horizontal planes there appears to be a boundary line which we use for this subdivision in order to assist in better describing features within this generally ventral part of the protocerebrum – referred to as “stalk” because it is thinner before the protocerebrum expands in size, dorsally. Our intention was more organizational, and as stated in the text, this area is likely heterogenous and we are not suggesting that it has a unified function, so being a visual artifact would not be excluded.

      (n) L 249: Could it also indicate large tracts projecting elsewhere?

      Yes, definitely, we have evidence that part of the space is occupied by tracts. Revised, thank you (L262).

      (o) L 281: Several investigators, including Long (2021,) noted very large and robust mushroom bodies of Nephila.

      Thank you – the point is well taken that there are examples of orb-web builders that do have appreciable mushroom bodies. We have added a note in this section (L295), giving the examples of Deinopis spinosa and Argiope trifasciata (Figure 4.20 and 4.22 in Long, 2016).

      It looks like these species make the point better than Nephila, as Long lists the mushroom body percentage of total protocerebral volume for D. spinosa as 4.18%, for A. trifasciata as 2.38%, but doesn’t give a percentage for Nephila clavipes (Figure 4.24) and only labels the mushroom bodies structures as “possible” in the figure.

      In Long (2021), Nephilidae is described as follows: “In Nephilidae, I found what could be greatly reduced medullae at the caudal end of the laminae, as well as a structure that has many physical hallmarks of reduced mushroom bodies”

      (p) L 324: If the authors were able to stain for histamine or supplement this work with a different dissection technique for the dorsal structures, the visual pathways might have been apparent, which seems like a very important set of neuropils to include in a complete brain atlas.

      Yes, for this reason histamine has been an interesting target which we have attempted to visualize, but unfortunately have not yet been able to successfully stain for in U. diversus. An additional complication is that the antibodies we have seen call for glutaraldehyde fixation, which may make them incompatible with our approach to producing robust synapsin staining throughout the brain. 

      We agree that the lack of the complete visual pathway is a substantial weakness of our preparation, and should be amended in future work, but this will likely require developing a modified approach in order to preserve these delicate structures in U. diversus.

      (q) L 331: Is this bulbous shape neuropil, or just the remains of neuropil that were not fully torn away during dissection?

      This certainly is a severed part of the primary pathway, although it seems more likely that the bulbous shape is indicative of a neuropil form, rather than just being a happenstance shape that occurred during the breakage. We have examples where the same bulbous shape appears on both sides, and in different brains. It is possible that this may be the principal eye lamina – although we did not see co-staining with expected markers in examples where it did appear, so cannot be sure.

      (r) L 354: Is tyraminergic co-staining with the protocerebral bridge enough evidence to speculate that inputs are being supplied?

      We agree that this is not compelling, and have removed the statement.

      (s) L 372: This whole structure appears to be a previously described structure in spiders, the 'protocerebral commissure'.

      We are reasonably sure that what we are calling the PCB is a distinct structure from the protocerebral bridge (PCC). In Babu and Barth’s (1984) horizontal slice (Fig. 11b), you can see the protocerebral commissure immediately adjacent to the mushroom body bridge. It is found similarly located in other species, as can be seen in the supplementary 3D files provided by Steinhoff et al., (2024).

      While not visible with synapsin in U. diversus, we likewise can make out a commissure in this area in close proximity to the mushroom body bridge using tubulin staining. What we are calling the protocerebral bridge is a structure which is much more dorsal to the protocerebral commissure, not appearing in the same planes as the MB bridge.

      (t) L 377: Do you have an intuition why the tonsillar neuropil and the protocerebral bridge would show limited immunoreactivity, while the arcuate body's is quite extensive?

      This is an interesting question. Given the degree of interconnection and the fact that multiple classes of neurons in insects will innervate both central body as well as PCB or noduli, perhaps it would be expected that expression in tonsillar and protocerebral bridge should be commensurate to the innervation by that particular neurotransmitter expressing population in the arcuate body. Apart from the fact that the arcuate body is just bigger, perhaps this points to a great role of the arcuate body for integration, whereas the tonsillar and PCB may engage in more particular processing, or be limited to certain sensory modalities.

      Interestingly, it seems that this pattern of more limited immunoreactivity in the PCB and noduli compared with the central bodies (fan-shaped/ellipsoid) also appears in insects (Kahsai et al., 2010, J Comp Neuro, Timm et al., 2021, J Comp Neuro, Homberg et al., 2023, J Comp Neuro) – particularly, with almost every target having at least some layering in the fan-shaped body (Kahsai et al., 2010, J Comp Neuro).  For example, serotoninergic innervation is fairly consistently seen in the upper and lower central bodies across insects, but its presence in the PCB or noduli is more variable – appearing in one or the other in a species-dependent manner (Homberg et al., 2023, J Comp Neuro).

      (4) Discussion

      (a) L 556: But if confocal images from slices are aligned, is the 3D shape not preserved?

      Yes, fair enough – the point we wanted to make was that there is still a limitation in z resolution depending on the thickness of the slices used, which could obscure structures, but perhaps this is too minor of a comment.

      (b) L 597: This is a very interesting result. I agree it's likely to do with the processing of mechanosensory information relevant to web activities, and the mushroom body seems like the perfect candidate for this.

      (c) L 638: Worth noting that neuropil volume vs density of synapses might play a role in this, as the literature is currently a bit ambiguous with regards to the former.

      Thank you, noted (L689).

      (d) L 651: The latter seems far more plausible.

      Agreed, though the presence of mushroom bodies appears to be variable in spiders, so we didn’t want to take a strong stance, here.

    1. Author response:

      We thank the editors and reviewers for their generally positive and thoughtful feedback on this work. Below are provisional responses to some of the concerns raised:

      Reviewer 1:

      At a total scan duration of 2 minutes, the ASL sequence utilized in this cohort is much shorter than that of a typical ASL sequence (closer to 5 minutes as mentioned by the authors). However, this implementation also included multiple (n=5) PLDs. As currently described, it is unclear how any repetitions were acquired at each PLD and whether these were acquired efficiently (i.e., with a Look-Locker readout) or whether individual repetitions within this acquisition were dedicated to a single PLD. If the latter, the number of repetitions per PLD (and consequently signal-to-noise-ratio, SNR) is likely to be very low. Have the authors performed any analyses to determine whether the signal in individual subjects generally lies above the noise threshold? This is particularly relevant for white matter, which is the focus of several findings discussed in the study.

      We agree that this was a short acquisition compared to most ASL protocols, necessitated by the strict time-keeping requirements for running such a large study. We apologise if this was not clear in the original manuscript, but due to this time constraint and the use of a segmented readout (which was not Look-Locker) there was only time available for a single average at each PLD. This does mean that the perfusion weighted images at each PLD are relatively noisy, although the image quality with this sequence was still reasonable, as demonstrated in Figure 1, with perfusion weighted images visibly above the noise floor. In addition, as has been demonstrated theoretically and experimentally in recent work (Woods et al., 2023, 2020), even though the SNR of each individual PLD image might be low in multi-PLD acquisitions, this is effectively recovered during the model fitting process, giving it comparable or greater accuracy than a protocol which collects many averages at a single (long) PLD. As also noted by the reviewers, this approach has the further benefit of allowing ATT estimation, which has proven to provide useful and complementary information to CBF. Finally, the fact that many of the findings in this study pass strict statistical thresholds for significance, despite the many multiple comparisons performed, and that the spatial patterns of these relationships are consistent with expectations, even in the white matter (e.g. Figure 6B), give us confidence that the perfusion estimation is robust. However, we will consider adding some additional metrics around SNR or fitting uncertainty in a revised manuscript, as well as clarifying details of the acquisition.

      Hematocrit is one of the variables regressed out in order to reduce the effect of potential confounding factors on the image-derived phenotypes. The effect of this, however, may be more complex than accounting for other factors (such as age and sex). The authors acknowledge that hematocrit influences ASL signal through its effect on longitudinal blood relaxation rates. However, it is unclear how the authors handled the fact that the longitudinal relaxation of blood (T1Blood) is explicitly needed in the kinetic model for deriving CBF from the ASL data. In addition, while it may reduce false positives related to the relationships between dietary factors and hematocrit, it could also mask the effects of anemia present in the cohort. The concern, therefore, is two-fold: (1) Were individual hematocrit values used to compute T1Blood values? (2) What effect would the deconfounding process have on this?

      We agree this is an important point to clarify. In this work we decided not to use the haematocrit to directly estimate the T1 of blood for each participant a) because this would result in slight differences in the model fitting for each subject, which could introduce bias (e.g. the kinetic model used assumes instantaneous exchange between blood water and tissue, so changing the T1 of blood for each subject could make us more sensitive to inaccuracies in this assumption); and b) because typically the haematocrit measures were quite some time (often years) prior to the imaging session, leading to an imperfect correction. We therefore took the pragmatic approach to simply regress each subject’s average haematocrit reading out of the IDP and voxelwise data to prevent it contributing to apparent correlations caused by indirect effects on blood T1. However, we agree with the reviewer that this certainly would mask the effects of anaemia in this cohort, so for researchers interested in this condition a different approach should be taken. We will update the revised manuscript to try to clarify these points.

      The authors leverage an observed inverse association between white matter hyperintensity volume and CBF as evidence that white matter perfusion can be sensitively measured using the imaging protocol utilized in this cohort. The relationship between white matter hyperintensities and perfusion, however, is not yet fully understood, and there is disagreement regarding whether this structural imaging marker necessarily represents impaired perfusion. Therefore, it may not be appropriate to use this finding as support for validation of the methodology.

      We appreciate the reviewer’s point that there is still debate about the relationship between white matter hyperintensities and perfusion. We therefore agree that this observed relationship therefore does not validate the methodology in the sense that it is an expected finding, but it does demonstrate that the data quality is sufficient to show significant correlations between white matter hyperintensity volume and perfusion, even in white matter regions, which would not be the case if the signal there were dominated by noise. Similarly, the clear spatial pattern of perfusion changes in the white matter that correlate with DTI measures in the same regions also suggests there is sensitivity to white matter perfusion. However, we will update the wording in the revised manuscript to try to clarify this point.

      Reviewer 2:

      This study primarily serves to illustrate the efficacy and potential of ASL MRI as an imaging parameter in the UK Biobank study, but some of the preliminary observations will be hypothesis-generating for future analyses in larger sample sizes. However, a weakness of the manuscript is that some of the reported observations are difficult to follow. In particular, the associations between ASL and resting fMRI illustrated in Figure 7 and described in the accompanying Results text are difficult to understand. It could also be clearer whether the spatial maps showing ASL correlates of other image-derived phenotypes in Figure 6B are global correlations or confined to specific regions of interest. Finally, while addressing partial volume effects in gray matter regions by covarying for cortical thickness is a reasonable approach, the Methods section seems to imply that a global mean cortical thickness is used, which could be problematic given that cortical thickness changes may be localized.

      We apologise if any of the presented information was unclear and will try to improve this in our revised manuscript. To clarify, the spatial maps associated with other (non-ASL) IDPs were generated by calculating the correlation between the ASL CBF or ATT in every voxel in standard space with the non-ASL IDP of interest, not the values of the other imaging modality in the same voxel. No region-based masking was used for this comparison. This allowed us to examine whether the correlation with this non-ASL IDP was only within the same brain region or if the correlations extended to other regions too.

      We also agree that the associations between ASL and resting fMRI are not easy to interpret. We therefore tried to be clear in the manuscript that these were preliminary findings that may be of interest to others, but clearly further study is required to explore this complex relationship further. However, we will try to clarify how the results are presented in the revised manuscript.

      In relation to partial volume effects, we did indeed use only a global measure of cortical thickness in the deconfounding and we acknowledged that this could be improved in the discussion: [Partial volume effects were] “mitigated here by the inclusion of cortical thickness in the deconfounding process, although a region-specific correction approach that is aware of the through-slice blurring (Boscolo Galazzo et al., 2014) is desirable in future iterations of the ASL analysis pipeline.” As suggested here, although this is a coarse correction, we did not feel that a more comprehensive partial volume correction approach could be used without properly accounting for the through-slice blurring effects from the 3D-GRASE acquisition (that will vary across different brain regions), which is not currently available, although this is an area we are actively working on for future versions of the image analysis pipeline. We again will try to clarify this point further in the revised manuscript.

      References

      Woods JG, Achten E, Asllani I, Bolar DS, Dai W, Detre J, Fan AP, Fernández-Seara M, Golay X, Günther M, Guo J, Hernandez-Garcia L, Ho M-L, Juttukonda MR, Lu H, MacIntosh BJ, Madhuranthakam AJ, Mutsaerts HJ, Okell TW, Parkes LM, Pinter N, Pinto J, Qin Q, Smits M, Suzuki Y, Thomas DL, Van Osch MJP, Wang DJ, Warnert EAH, Zaharchuk G, Zelaya F, Zhao M, Chappell MA. 2023. Recommendations for Quantitative Cerebral Perfusion MRI using Multi-Timepoint Arterial Spin Labeling: Acquisition, Quantification, and Clinical Applications (preprint). Open Science Framework. doi:10.31219/osf.io/4tskr

      Woods JG, Chappell MA, Okell TW. 2020. Designing and comparing optimized pseudo-continuous Arterial Spin Labeling protocols for measurement of cerebral blood flow. NeuroImage 223:117246. doi:10.1016/j.neuroimage.2020.117246

    1. <center>

      How Rosetta Stone unravelled the history of ancient Egypt?

      </center>

      Where was Rosetta Stone discovered? Where-was-Rosetta-Stone-discovered

      The Rosetta Stone, a pivotal artifact discovered in 1799, unlocked ancient Egyptian hieroglyphics through its trilingual inscription, sparking a race among scholars like Young and Champollion to decipher its secrets, ultimately revealing a vanished world. <center>

      Highlights

      </center>
      • Rosetta Stone was created during the reign of King Ptolemy V in ancient Egypt in 196 BCE and was eventually discovered by French engineers in 1799. This discovery played a crucial role in deciphering Egyptian hieroglyphics.
      • An artisan inscribed the "Memphis Decree on the stone, which grants tax exemptions to the priestly class, aiming to stabilize Ptolemy V's rule.
      • Fast forward to 1799, French military engineer Pierre Francois Bouchard discovers the stone while repairing a fort, unaware of its historical importance.
      The French Expedition included academics who recognized the significance of the stone's inscriptions, which would later be key to understanding ancient Egyptian writing. <center>

      How the scholars deciphered the script on Rosetta Stone

      </center>
      • After Napoleon abandoned the expedition, the scholars were left with the stone and a pressing need to disseminate its information despite military challenges.
      • The team devised a new method to capture the stone's inscriptions by using ink and paper, which proved successful.
      • Following the surrender of the French forces, the Rosetta Stone was claimed as a spoil of war by the British and eventually donated to the British Museum.
      • -
      • Despite initial expectations, matching the Greek text with hieroglyphics did not lead to immediate decipherment of ancient Egyptian.
      • The quest to decode the Rosetta Stone saw numerous attempts throughout history, culminating in significant breakthroughs by Thomas Young and Jean-François Champollion, who recognized the phonetic nature of hieroglyphics.- The misunderstanding of hieroglyphics persisted until the 1800s, despite efforts by medieval Muslim researchers.
      • Thomas Young made initial progress in translating the Rosetta Stone by focusing on the Demotic section and recognizing the phonetic writing of Greek names.</l>
      • Jean-François Champollion, a talented linguist who understood Coptic, began his own translation efforts and ultimately surpassed Young's work. He utilized various sources, including artifacts and inscriptions from Egypt, to further his understanding of hieroglyphics.

      Champollion's groundbreaking work

      Jean-François Champollion's groundbreaking work on deciphering Egyptian hieroglyphics using the Rosetta Stone highlights his struggles, rivalries, and eventual success in unlocking the secrets of ancient Egypt. He utilizes his knowledge of Coptic and previous research to reconstruct Egyptian royal names in cartouches, aiming to decode hieroglyphics. Despite facing rivalries and political challenges, Champollion perseveres in his studies, leading to a significant breakthrough in understanding hieroglyphics. In 1822, Champollion successfully read the name Thutmose from an inscription, confirming his theories and dramatically celebrating his discovery. Champollion's journey to Egypt allowed him to read inscriptions and uncover the history of ancient kings and common people, further solidifying his achievements.

      Click Cartouche in Rosetta Stone
    1. Author response:

      The following is the authors’ response to the original reviews.

      Public Reviews:

      Reviewer #1 (Public review): 

      Summary: 

      The authors analyzed the expression of ATAD2 protein in post-meiotic stages and characterized the localization of various testis-specific proteins in the testis of the Atad2 knockout (KO). By cytological analysis as well as the ATAC sequencing, the study showed that increased levels of HIRA histone chaperone, accumulation of histone H3.3 on post-meiotic nuclei, defective chromatin accessibility and also delayed deposition of protamines. Sperm from the Atad2 KO mice reduces the success of in vitro fertilization. The work was performed well, and most of the results are convincing. However, this manuscript does not suggest a molecular mechanism for how ATAD2 promotes the formation of testis-specific chromatin. 

      We would like to take this opportunity to highlight that the present study builds on our previously published work, which examined the function of ATAD2 in both yeast S. pombe and mouse embryonic stem (ES) cells (Wang et al., 2021). In yeast, using genetic analysis we showed that inactivation of HIRA rescues defective cell growth caused by the absence of ATAD2. This rescue could also be achieved by reducing histone dosage, indicating that the toxicity depends on histone over-dosage, and that HIRA toxicity, in the absence of ATAD2, is linked to this imbalance.

      Furthermore, HIRA ChIP-seq performed in mouse ES cells revealed increased nucleosome-bound HIRA, particularly around transcription start sites (TSS) of active genes, along with the appearance of HIRA-bound nucleosomes within normally nucleosome-free regions (NFRs). These findings pointed to ATAD2 as a major factor responsible for unloading HIRA from nucleosomes. This unloading function may also apply to other histone chaperones, such as FACT (see Wang et al., 2021, Fig. 4C).

      In the present study, our investigations converge on the same ATAD2 function in the context of a physiologically integrated mammalian system—spermatogenesis. Indeed, in the absence of ATAD2, we observed H3.3 accumulation and enhanced H3.3-mediated gene expression. Consistent with this functional model of ATAD2— unloading chaperones from histone- and non-histone-bound chromatin—we also observed defects in histone-toprotamine replacement.

      Together, the results presented here and in Wang et al. (2021) reveal an underappreciated regulatory layer of histone chaperone activity. Previously, histone chaperones were primarily understood as factors that load histones. Our findings demonstrate that we must also consider a previously unrecognized regulatory mechanism that controls assembled histone-bound chaperones. This key point was clearly captured and emphasized by Reviewer #2 (see below).

      Strengths:

      The paper describes the role of ATAD2 AAA+ ATPase in the proper localization of sperm-specific chromatin proteins such as protamine, suggesting the importance of the DNA replication-independent histone exchanges with the HIRA-histone H3.3 axis. 

      Weaknesses: 

      (1) Some results lack quantification. 

      We will consider all the data and add appropriate quantifications where necessary.

      (2) The work was performed well, and most of the results are convincing. However, this manuscript does not suggest a molecular mechanism for how ATAD2 promotes the formation of testis-specific chromatin. 

      Please see our comments above.

      Reviewer #2 (Public review): 

      Summary:

      This manuscript by Liakopoulou et al. presents a comprehensive investigation into the role of ATAD2 in regulating chromatin dynamics during spermatogenesis. The authors elegantly demonstrate that ATAD2, via its control of histone chaperone HIRA turnover, ensures proper H3.3 localization, chromatin accessibility, and histone-toprotamine transition in post-meiotic male germ cells. Using a new well-characterized Atad2 KO mouse model, they show that ATAD2 deficiency disrupts HIRA dynamics, leading to aberrant H3.3 deposition, impaired transcriptional regulation, delayed protamine assembly, and defective sperm genome compaction. The study bridges ATAD2's conserved functions in embryonic stem cells and cancer to spermatogenesis, revealing a novel layer of epigenetic regulation critical for male fertility. 

      Strengths:

      The MS first demonstration of ATAD2's essential role in spermatogenesis, linking its expression in haploid spermatids to histone chaperone regulation by connecting ATAD2-dependent chromatin dynamics to gene accessibility (ATAC-seq), H3.3-mediated transcription, and histone eviction. Interestingly and surprisingly, sperm chromatin defects in Atad2 KO mice impair only in vitro fertilization but not natural fertility, suggesting unknown compensatory mechanisms in vivo. 

      Weaknesses:

      The MS is robust and there are not big weaknesses 

      Reviewer #3 (Public review): 

      Summary: 

      The authors generated knockout mice for Atad2, a conserved bromodomain-containing factor expressed during spermatogenesis. In Atad2 KO mice, HIRA, a chaperone for histone variant H3.3, was upregulated in round spermatids, accompanied by an apparent increase in H3.3 levels. Furthermore, the sequential incorporation and removal of TH2B and PRM1 during spermiogenesis were partially disrupted in the absence of ATAD2, possibly due to delayed histone removal. Despite these abnormalities, Atad2 KO male mice were able to produce offspring normally. 

      Strengths:

      The manuscript addresses the biological role of ATAD2 in spermatogenesis using a knockout mouse model, providing a valuable in vivo framework to study chromatin regulation during male germ cell development. The observed redistribution of H3.3 in round spermatids is clearly presented and suggests a previously unappreciated role of ATAD2 in histone variant dynamics. The authors also document defects in the sequential incorporation and removal of TH2B and PRM1 during spermiogenesis, providing phenotypic insight into chromatin transitions in late spermatogenic stages. Overall, the study presents a solid foundation for further mechanistic investigation into ATAD2 function. 

      Weaknesses:

      While the manuscript reports the gross phenotype of Atad2 KO mice, the findings remain largely superficial and do not convincingly demonstrate how ATAD2 deficiency affects chromatin dynamics. Moreover, the phenotype appears too mild to elucidate the functional significance of ATAD2 during spermatogenesis. 

      We respectfully disagree with the statement that our findings are largely superficial. Based on our investigations of this factor over the years, it has become evident that ATAD2 functions as an auxiliary factor that facilitates mechanisms controlling chromatin dynamics (see, for example, Morozumi et al., 2015). These mechanisms can still occur in the absence of ATAD2, but with reduced efficiency, which explains the mild phenotype we observed.

      This function, while not essential, is nonetheless an integral part of the cell’s molecular biology and should be studied and brought to the attention of the broader biological community, just as we study essential factors. Unfortunately, the field has tended to focus primarily on core functional actors, often overlooking auxiliary factors. As a result, our decade-long investigations into the subtle yet important roles of ATAD2 have repeatedly been met with skepticism regarding its functional significance, which has in turn influenced editorial decisions.

      We chose eLife as the venue for this work specifically to avoid such editorial barriers and to emphasize that facilitators of essential functions do exist. They deserve to be investigated, and the underlying molecular regulatory mechanisms must be understood.

      (1) Figures 4-5: The analyses of differential gene expression and chromatin organization should be more comprehensive. First, Venn diagrams comparing the sets of significantly differentially expressed genes between this study and previous work should be shown for each developmental stage. Second, given the established role of H3.3 in MSCI, the effect of Atad2 knockout on sex chromosome gene expression should be analyzed. Third, integrated analysis of RNA-seq and ATAC-seq data is needed to evaluate how ATAD2 loss affects gene expression. Finally, H3.3 ChIP-seq should be performed to directly assess changes in H3.3 distribution following Atad2 knockout.  

      (1) In the revised version, we will include Venn diagrams to illustrate the overlap in significantly differentially expressed genes between this study and previous work. However, we believe that the GSEAs presented here provide stronger evidence, as they indicate the statistical significance of this overlap (p-values). In our case, we observed p-value < 0.01 (**) and p < 0.001 (***).

      (2) Sex chromosome gene expression was analyzed and is presented in Fig. 5C.

      (3) The effect of ATAD2 loss on gene expression is shown in Fig. 4A, B, and C as histograms, with statistical significance indicated in the middle panels.

      (4) Although mapping H3.3 incorporation across the genome in wild-type and Atad2 KO cells would have been informative, the available anti-H3.3 antibody did not work for ChIP-seq, at least in our hands. The authors of Fontaine et al., 2022, who studied H3.3 during spermatogenesis in mice, must have encountered the same problem, since they tagged the endogenous H3.3 gene to perform their ChIP experiments.

      (2) Figure 3: The altered distribution of H3.3 is compelling. This raises the possibility that histone marks associated with H3.3 may also be affected, although this has not been investigated. It would therefore be important to examine the distribution of histone modifications typically associated with H3.3. If any alterations are observed, ChIP-seq analyses should be performed to explore them further.

      Based on our understanding of ATAD2’s function—specifically its role in releasing chromatin-bound HIRA—in the absence of ATAD2 the residence time of both HIRA and H3.3 on chromatin increases. This results in the detection of H3.3 not only on sex chromosomes but across the genome. Our data provide clear evidence of this phenomenon. The reviewer is correct in suggesting that the accumulated H3.3 would carry H3.3-associated histone PTMs; however, we are unsure what additional insights could be gained by further demonstrating this point.

      (3) Figure 7: While the authors suggest that pre-PRM2 processing is impaired in Atad2 KO, no direct evidence is provided. It is essential to conduct acid-urea polyacrylamide gel electrophoresis (AU-PAGE) followed by western blotting, or a comparable experiment, to substantiate this claim. 

      Figure 7 does not suggest that pre-PRM2 processing is affected in Atad2 KO; rather, this figure—particularly Fig. 7B—specifically demonstrates that pre-PRM2 processing is impaired, as shown using an antibody that recognizes the processed portion of pre-PRM2. ELISA was used to provide a more quantitative assessment; however, in the revised manuscript we will also include a western blot image.

      (4) HIRA and ATAD2: Does the upregulation of HIRA fully account for the phenotypes observed in Atad2 KO? If so, would overexpression of HIRA alone be sufficient to phenocopy the Atad2 KO phenotype? Alternatively, would partial reduction of HIRA (e.g., through heterozygous deletion) in the Atad2 KO background be sufficient to rescue the phenotype? 

      These are interesting experiments that require the creation of appropriate mouse models, which are not currently available.

      (5) The mechanism by which ATAD2 regulates HIRA turnover on chromatin and the deposition of H3.3 remains unclear from the manuscript and warrants further investigation. 

      The Reviewer is absolutely correct. In addition to the points addressed in response to Reviewer #1’s general comments (see above), it would indeed have been very interesting to test the segregase activity of ATAD2 (likely driven by its AAA ATPase activity) through in vitro experiments using the Xenopus egg extract system described by Tagami et al., 2004. This system can be applied both in the presence and absence (via immunodepletion) of ATAD2 and would also allow the use of ATAD2 mutants, particularly those with inactive AAA ATPase or bromodomains. However, such experiments go well beyond the scope of this study, which focuses on the role of ATAD2 in chromatin dynamics during spermatogenesis.

      References:

      (1) Wang T, Perazza D, Boussouar F, Cattaneo M, Bougdour A, Chuffart F, Barral S, Vargas A, Liakopoulou A, Puthier D, Bargier L, Morozumi Y, Jamshidikia M, Garcia-Saez I, Petosa C, Rousseaux S, Verdel A, Khochbin S. ATAD2 controls chromatin-bound HIRA turnover. Life Sci Alliance. 2021 Sep 27;4(12):e202101151. doi: 10.26508/lsa.202101151. PMID: 34580178; PMCID: PMC8500222.

      (2) Morozumi Y, Boussouar F, Tan M, Chaikuad A, Jamshidikia M, Colak G, He H, Nie L, Petosa C, de Dieuleveult M, Curtet S, Vitte AL, Rabatel C, Debernardi A, Cosset FL, Verhoeyen E, Emadali A, Schweifer N, Gianni D, Gut M, Guardiola P, Rousseaux S, Gérard M, Knapp S, Zhao Y, Khochbin S. Atad2 is a generalist facilitator of chromatin dynamics in embryonic stem cells. J Mol Cell Biol. 2016 Aug;8(4):349-62. doi: 10.1093/jmcb/mjv060. Epub 2015 Oct 12. PMID: 26459632; PMCID: PMC4991664.

      (3) Fontaine E, Papin C, Martinez G, Le Gras S, Nahed RA, Héry P, Buchou T, Ouararhni K, Favier B, Gautier T, Sabir JSM, Gerard M, Bednar J, Arnoult C, Dimitrov S, Hamiche A. Dual role of histone variant H3.3B in spermatogenesis: positive regulation of piRNA transcription and implication in X-chromosome inactivation. Nucleic Acids Res. 2022 Jul 22;50(13):7350-7366. doi: 10.1093/nar/gkac541. PMID: 35766398; PMCID: PMC9303386.

      (4) Tagami H, Ray-Gallet D, Almouzni G, Nakatani Y. Histone H3.1 and H3.3 complexes mediate nucleosome assembly pathways dependent or independent of DNA synthesis. Cell. 2004 Jan 9;116(1):51-61. doi: 10.1016/s0092-8674(03)01064-x. PMID: 14718166.

      Recommendations for the authors:

      Reviewing Editor Comments:

      I note that the reviewers had mixed opinions about the strength of the evidence in the manuscript. A revision that addresses these points would be welcome.

      Reviewer #1 (Recommendations for the authors):  

      Major points: 

      (1) No line numbers: It is hard to point out the issues.

      The revised version harbors line numbers.

      (2) Given the results shown in Figure 3 and Figure 4, it is nice to show the chromosomal localization of histone H3.3 in spermatocytes or post-meiotic cells by Chromatin-immunoprecipitation sequencing (ChIP-seq).

      Although mapping H3.3 incorporation across the genome in wild-type and Atad2 KO cells would have been informative, the available anti-H3.3 antibody did not work for ChIP-seq in our hands. In fact, this antibody is not well regarded for ChIP-seq. For example, Fontaine et al. (2022), who investigated H3.3 during spermatogenesis in mice, circumvented this issue by tagging the endogenous H3.3 genes for their ChIP experiments.

      (3) Figure 7B and 8: Why the authors used ELISA for the protein quantification. At least, western blotting should be shown.

      ELISA is a more quantitative method than traditional immunoblotting. Nevertheless, as requested by the reviewer, we have now included a corresponding western blot in Fig. S3.

      (4) For readers, please add a schematic pathway of histone-protamine replacement in sperm formation in Fig.1 and it would be nice to have a model figure, which contains the authors' idea in the last figure.

      As requested by this reviewer, we have now included a schematic model in Figure 9 to summarize the main conclusions of our work.

      Minor points: 

      (1) Page 2, the second paragraph, "pre-PRM2: Please explain more about pre-PRM2 and/or PRM2 as well as PRM1 (Figure 6).

      More detailed descriptions of PRM2 processing are now given in this paragraph. 

      (2) Page 3, bottom paragraph, line 1: "KO" should be "knockout (KO)".

      Done.

      (3) Page 4, second paragraph bottom: Please explain more about the protein structure of germ-line-specific ATAD2S: how it is different from ATAD2L. Germ-line specific means it is also expressed in ovary?

      As Atad2 is predominantly expressed in embryonic stem cells and in spermatogenic cells, we replaced all through the text germ-line specific by more appropriate terms.

      (4) Figure 1C, western blotting: Wild-type testis extracts, both ATAD2L and -S are present. Does this mean that ATADS2L is expressed in both germ line as well as supporting cells. Please clarify this and, if possible, show the western blotting of spermatids well as spermatocytes.

      Figure 1D shows sections of seminiferous tubules from Atad2 KO mice, in which lacZ expression is driven by the endogenous Atad2 promoter. The results indicate that Atad2 is expressed mainly in post-meiotic cells. Most labeled cells are located near the lumen, whereas the supporting Sertoli cells remain unlabeled. Sertoli cells, which are anchored to the basal lamina, span the entire thickness of the germinal epithelium from the basal lamina to the lumen. Their nuclei, however, are usually positioned closer to the basal membrane. Thus, the observed lacZ expression pattern argues against substantial Atad2 expression in Sertoli cells. 

      (5) Figure 1C: Please explain a bit more about the reduction of ATAD2 proteins in heterozygous mice.

      Done

      (6) Figure 1C: Genotypes of the mice should be shown in the legend.

      Done 

      (7) Figure 1D: Please add a more magnified image of the sections to see the staining pattern in the seminiferous tubules.

      The magnification does not bring more information since we lose the structure of cells within tubules due the nature of treatment of the sections for X-gal staining. Please see comments to question 1C to reviewer 2

      (8) Page 5, first paragraph, line 2, histone dosage: What do the authors meant by the histone dosage? Please explain more or use more appropriate word.

      "Histone dosage" refers to the amount or relative abundance of histone proteins in a cell.

      (9) Figure 2A: Figure 2A: Given the result in Figure 1C, it is interesting to check the amount of HIRA in Atad2 heterozygous mice.

      In Atad2 heterozygous mice, we would expect an increase in HIRA, but only to about half the level seen in the Atad2 homozygous knockout shown in Figure 2A, which is relatively modest. Therefore, we doubt that detecting such a small change—approximately half of that in Figure 2A—would yield clear or definitive results. 

      (10) Figure 2A, legend (n=5): What does this "n" mean? The extract of testes from "5" male mice like Figure 2B. Or 5 independent experiments. If the latter is true, it is important to share the other results in the Supplements.

      “n” refers to five WT and five Atad2 KO males. The legend has been clarified as suggested by the reviewer.

      (11) Figure 2A, legend, line 2, Atad2: This should be italicized.

      Done

      (12) Figure 2B: Please show the quantification of amounts of HIRA protein like Fig. 2A.

      As indicated in the legend, what is shown is a pool of testes from 3 individuals per genotype.

      (13) Figure 2B shows an increased level of HIRA in Atad2 KO testis. This suggests the role of ATAD2 in the protein degradation of HIRA. This possibility should be mentioned or tested since ATAD2 is an AAA+ ATPase. 

      The extensive literature on ATAD2 provides no indication that it is involved in protein degradation. In our early work on ATAD2 in the 2000s, we hypothesized that, as a member of the AAA ATPase family, ATAD2 might associate with the 19S proteasome subunit (through multimerization with the other AAA ATPase member of this regulatory subunit). However, both our published pilot studies (Caron et al., PMID: 20581866) and subsequent unpublished work ruled out this possibility. Instead, since the amount of nucleosome-bound HIRA increases in the absence of ATAD2, we propose that chromatin-bound HIRA is more stable than soluble HIRA once it has been released from chromatin by ATAD2.

      (14) Page 6, second paragraph, line 5, ko: KO should be capitalized.

      Done

      (15) Page 6, second paragraph, line 2 from the bottom, chromatin dynamics: Throughout the text, the authors used "chromatin dynamics". However, all the authors analyzed in the current study is the localization of chromatin protein.  So, it is much easier to explain the results by using "chromatin status," etc. In this context, "accessibility" is better. 

      We changed the term “chromatin dynamics” into a more precise term according to the context used all through the text.

      (16) Figure 3: Please provide the quantification of signals of histone H3.3 in a nucleus or nuclear cytoplasm.

      This request is not clear to us since we do not observe any H3.3 signal in the cytoplasm.

      (17) Figure 3: As the control of specificity in post-meiotic cells, please show the image and quantification of the H3.3 signals in spermatocyte, for example.

      This request is not clear to us. What specificity is meant? 

      (18) Figure 3, bottom panels: Please show what the white lines indicate? 

      The white lines indicate the limit of cell nucleus and estimated by Hoechst staining. This is now indicated in the legend of the figure. 

      (19) Figure 4A: Please explain more about what kind of data is here. Is this wild-type and/or Atad2 KO? The label of the Y-axis should be "mean expression level". What is the standard deviation (SD) here on the X-axis. Moreover, there is only one red open circle, but the number of this class is 5611. All 5611 genes in this group show NO expression. Please explain more.

      The plot displays the mean expression levels (y-axis, labeled as "mean expression level") versus the corresponding standard deviations (x-axis), both calculated from three independent biological replicates of isolated round spermatids (Atad2 wild-type and Atad2 KO). The standard deviation reflects the variability of gene expression across biological replicates. Genes were grouped into four categories (grp1: blue, grp2: cyan, grp3: green, grp4: orange) according to the quartile of their mean expression. For grp4, all genes have no detectable expression, resulting in a mean expression of zero and a standard deviation of zero; consequently, the 5611 genes in this group are represented by a single overlapping point (red open circle) at the origin. 

      (20) Figure 4C: If possible, it would be better to have a statistical comparison between wild-type and the KO.  

      The mean profiles are displayed together with their variability (± 2 s.e.m.) across the four replicates for both ATAD2 WT (blue) and ATAD2 KO (red). For groups 1, 2, and 3, the envelopes of the curves remain clearly separated around the peak, indicating a consistent difference in signal between the two conditions. In contrast, group 4 does not present a strong signal and, accordingly, no marked difference is observed between WT and KO in this group.

      (21) Figure 5, GSEA panels: Please explain more about what the GSEA is in the legend.  The legend has been updated as follows:

      (A) Expression profiles of post-meiotic H3.3-activated genes. The heatmap (left panel) displays the normalized expression levels of genes identified by Fontaine and colleagues as upregulated in the absence of histone H3.3 (Fontaine et al. 2022) for Atad2 WT (WT) and Atad2 KO (KO) samples at days 20, 22, 24, and 26 PP (D20 to D26). The colour scale represents the z-score of log-transformed DESeq2-normalized counts. The middle panel box plots display, pooled, normalized expression levels, aggregated across replicates and genes, for each condition (WT and KO) and each time point (D20 to D26). Statistical significance between WT and KO conditions was determined using a two-sided t-test, with p-values indicated as follows: * for p-value<0.05, ** for p-value<0.01 and *** for p-value<0.001. The right panel shows the results of gene set enrichment analysis (GSEA), which assesses whether predefined groups of genes show statistically significant differences between conditions. Here, the post-meiotic H3.3-activated genes set, identified by Fontaine et al. (2022), is significantly enriched in Atad2 KO compared with WT samples at day 26 (p < 0.05, FDR < 0.25). Coloured vertical bars indicate the “leading edge” genes (i.e., those contributing most to the enrichment signal), located before the point of maximum enrichment score.  (B) As shown in (A) but for the "post-meiotic H3.3-repressed genes" gene set. (C) As shown in (A) but for the " sex chromosome-linked genes " gene set.

      (22) Figure 6. In the KO, the number of green cells is more than red and yellow cells, suggesting the delayed maturation of green (TH2B-positive) cells. It is essential to count the number of each cell and show the quantification.

      The green cells correspond to those expressing TH2B but lacking transition proteins (TP) and protamine 1 (Prm1), indicating that they are at earlier stages than elongating–condensing spermatids. Counting these green cells simply reflects the ratio of elongating/condensing spermatids to earlier-stage cells, which varies depending on the field examined. The key point in this experiment is that in wild-type mice, only red cells (elongating/condensing spermatids) and green cells (earlier stages) are observed. By contrast, in Atad2 KO testes, a significant proportion of yellow cells appears, which are never seen in wild-type tissue. The crucial metric here is the percentage of yellow cells relative to the total number of elongating/condensing spermatids (red cells). In wild-type testes, this value is consistently 0%, whereas in Atad2 KO testes it always ranges between 50% and 100% across all fields containing substantial numbers of elongating/condensing spermatids.

      (23) Figure 8A: Please show the images of sperm (heads) in the KO mice with or without decompaction.

      The requested image is now displayed in Figure S5.

      (24) Figure 8C: In the legend, it says n=5. However, there are more than 5 plots on the graph. Please explain the experiment more in detail.

      The experiment is now better explained in the legend of this Figure.

      Reviewer #2 (Recommendations for the authors): 

      While the study is rigorous and well performed, the following minor points could be addressed to strengthen the manuscript: 

      Figure 1C should indicate each of the different types of cells present in the sections. It would be of interest to show specifically the different post-meiotic germ cells.

      With this type of sample preparation, it is difficult to precisely distinguish the different cell types within the sections. Nevertheless, the staining pattern strongly indicates that most of the intensely stained cells are post-meiotic, situated near the tubule lumens and extending roughly halfway toward the basal membrane.

      In the absence of functional ATAD2, the accumulation of HIRA primarily occurs in round spermatids (Fig. 2B). If technically possible, it would be of great interest to show this by IHC of testis section. 

      Unfortunately, our antibody did not satisfactorily work in IHC.

      The increased of H3.3 signal in Atad2 KO spermatids (Fig. 3) is interpreted because of a reduced turnover. However, alternative explanations (e.g., H3.3 misincorporation or altered chaperone affinity) should not be ruled out. 

      The referee is correct that alternative explanations are possible. However, based on our previous work (Wang et al., 2021; PMID: 34580178), we demonstrated that in the absence of ATAD2, there is reduced turnover of HIRAbound nucleosomes, as well as reduced nucleosome turnover, evidenced by the appearance of nucleosomes in regions that are normally nucleosome-free at active gene TSSs. We have no evidence supporting any other alternative hypothesis.

      In the MS the reduced accessibility at active genes (Fig. 4) is attributed to H3.3 overloading. However, global changes in histone acetylation (e.g., H4K5ac) or other remodelers in KO cells could be also consider.

      In fact, we meant that histone overloading could be responsible for the altered accessibility. This has been clearly demonstrated in case of S. cerevisiae in the absence of Yta7 (S.  cerevisiae’ ATAD2) (PMID: 25406467).

      In relation with the sperm compaction assay (Fig. 8A), the DTT/heparin/Triton protocol may not fully reflect physiological decompaction. This could be validated with alternative methods (e.g., MNase sensitivity). 

      The referee is right, but since this is a subtle effect as it can be judged by normal fertility, we doubt that milder approaches could reveal significant differences between wildtype and Atad2 KO sperms.

      It is surprising that despite the observed alterations in the genome organization of the sperm, the natural fertility of the KO mice is not affected (Fig. 8C). This warrants deeper discussion: Is functional compensation occurring (e.g., by p97/VCP)? Analysis of epididymal sperm maturation or uterine environment could provide insights.

      As detailed in the Discussion section, this work, together with our previous study (Wang et al., 2021; PMID: 34580178), highlights an overlooked level of regulation in histone chaperone activity: the release of chromatinbound factors following their interaction with chromatin. This is an energy-dependent process, driven by ATP and the associated ATPase activity of these factors. Such activity could be mediated by various proteins, such as p97/VCP or DNAJC9–HSP70, as discussed in the manuscript, or by yet unidentified factors. However, most of these mechanisms are likely to occur during the extensive histone-to-histone variant exchanges of meiosis and post-meiotic stages. To the best of our knowledge, epididymal sperm maturation and the uterine environment do not involve substantial histone-to-histone or histone-to-protamine exchanges.

      The authors showed that MSCI genes present an enhancement of repression in the absence of ATAD2 by enhancing H3.3 function. It would be also of interest to analyze the behavior of the Sex body during its silencing (zygotene to pachytene) by looking at different markers (i.e., gamma-H2AX phosphorylation, Ubiquitylation etc). 

      The referee is correct that this is an interesting question. Accordingly, in our future work, we plan to examine the sex body in more detail during its silencing, using a variety of relevant markers, including those suggested by the reviewer. However, we believe that such investigations fall outside the scope of the present study, which focuses on the molecular relationship between ATAD2 and H3.3, rather than on the role of H3.3 in regulating sex body transcription. For a comprehensive analysis of this aspect, studies should primarily focus on the H3.3 mouse models reported by Fontaine and colleagues (PMID: 35766398).

      Fig. 6: Co-staining of TH2B/TP1/PRM1 is convincing but would benefit from quantification (% cells with overlapping signals).

      The green cells correspond to those expressing TH2B but lacking transition proteins (TP) and protamine 1 (Prm1), indicating that they are at earlier stages than elongating–condensing spermatids. Counting these green cells simply reflects the ratio of elongating/condensing spermatids to earlier-stage cells, which varies depending on the field examined. The key point is that in wild-type mice, only red cells (elongating/condensing spermatids) and green cells (earlier stages) are observed. By contrast, in Atad2 KO testes, a significant proportion of yellow cells appears, which are never seen in wild-type tissue. The crucial metric is the percentage of yellow cells relative to the total number of elongating/condensing spermatids (red cells). In wild-type testes, this value is consistently 0%, whereas in Atad2 KO testes it always ranges between 50% and 100% across all fields containing substantial numbers of elongating/condensing spermatids.

    1. Note: This response was posted by the corresponding author to Review Commons. The content has not been altered except for formatting.

      Learn more at Review Commons


      Reply to the reviewers

      The PDF version of point-by-point response includes figures (I, II, III,... IX) that are not included in the manuscript nor in this post but serve to illustrate and clarify our replies to the reviewers' comments.

      Dear Editor,

      Many thanks for forwarding the comments from reviewers #1-#4 regarding our manuscript (Preprint #RC-2025-03087144), entitled "HIV-1 Envelope glycoprotein modulates CXCR4 clustering and dynamics on the T cell membrane", by Quijada-Freire A. et al.

      We have carefully reviewed all reviewer comments and prepared our specific, detailed responses. Alongside this, we have created a revised version of the manuscript to post them on BioRxiv, and we are pleased to announce that we will transfer this new version to an affiliate journal for consideration.

      Reviewer #1

      Thank you very much for considering that our manuscript evaluates an important question and that the reagents used are well prepared and characterized. We also much appreciate that you consider the information generated as potentially useful for those studying HIV infection processes and strategies to prevent infection.

      • While a single particle tracking routine was applied to the data, it's not clear how the signal from a single GFP was defined and if movement during the 100 ms acquisition time impacts this. My concern would be that the routine is tracking fluctuations, and these are related to single particle dynamics, it appears from the movies that the density or the GFP tagged receptors in the cells is too high to allow clear tracking of single molecules. SPT with GFP is very difficult due to bleaching and relatively low quantum yield. Current efforts in this direction that are more successful include using SNAP tags with very photostable organic fluorophores. The data likely does mean something is happening with the receptor, but they need to be more conservative about the interpretation. *

      Some of the paradoxical effects might be better understood through deeper analysis of the SPT data, particularly investigation of active transport and more detailed analysis of "immobile" objects. Comments on early figures illustrate how this could be approached. This would require selecting acquisitions where the GFP density is low enough for SPT and performing a more detailed analysis, but this may be difficult to do with GFP.

      When the authors discuss clusters of 3, how do they calibrate the value of GFP and the impact of diffusion on the measurement. One way to approach this might be single molecules measurements of dilute samples on glass vs in a supported lipid bilayer to map the streams of true immobility to diffusion at >1 µm2/sec.

      We fully understand the reviewer's apprehensions regarding the application of these high-end biophysical techniques, in particular the associated complexity of the data analysis. We provide below extensive explanations on our methodology, which we hope will satisfactorily address all of the reviewer's concerns.

      We would first like to emphasize that the experimental conditions and the quantitative analysis used in our current experiments are similar to the established protocols and methodologies applied by our group previously (Martinez-Muñoz et al. Mol. Cell, 2018; García-Cuesta et al. PNAS, 2022; Gardeta et al. Frontiers in Immunol., 2022; García-Cuesta et al.eLife, 2024; Gardeta et al. Cell. Commun. Signal., 2025) and by others (Calebiro et al. PNAS, 2013; Jaqaman et al. Cell,2011; Mattila et al. Immunity, 2013; Torreno-Pina et al. PNAS, 2014; Torreno-Pina et al. PNAS, 2016).

      As SPT (single-particle tracking) experiments require low-expressing conditions in order to follow individual trajectories (Manzo & García-Parajo Rep. Prog. Phys., 2015), we transiently transfected Jurkat CD4+ cells with CXCR4-AcGFP or CXCR4R334X-AcGFP. At 24 h post-transfection, cells expressing low CXCR4-AcGFP levels were selected by a MoFlo Astrios Cell Sorter (Beckman-Coulter) to ensure optimal conditions for SPT. Using Dako Qifikit (DakoCytomation), we quantified the number of CXCR4 receptors and found ∼8,500 - 22,000 CXCR4-AcGFP receptors/cell, which correspond to a particle density ∼2 - 4.5 particles/mm2 (Figure I, only for review purposes) and are similar to the expression levels found in primary human lymphocytes.

      These cells were resuspended in RPMI supplemented with 2% FBS, NaPyr and L-glutamine and plated on 96-well plates for at least 2 h. Cells were centrifuged and resuspended in a buffer with HBSS, 25 mM HEPES, 2% FBS (pH 7.3) and plated on glass-bottomed microwell dishes (MatTek Corp.) coated with fibronectin (FN) (Sigma-Aldrich, 20 mg/ml, 1 h, 37{degree sign}C). To observe the effect of the ligand, we coated dishes with FN + CXCL12; FN + X4-gp120 or FN + VLPs, as described in material and methods; cells were incubated (20 min, 37{degree sign}C, 5% CO2) before image acquisition.

      For SPT measurements, we use a total internal reflection fluorescence (TIRF) microscope (Leica AM TIRF inverted) equipped with an EM-CCD camera (Andor DU 885-CS0-#10-VP), a 100x oil-immersion objective (HCX PL APO 100x/1.46 NA) and a 488-nm diode laser. The microscope was equipped with incubator and temperature control units; experiments were performed at 37{degree sign}C with 5% CO2. To minimize photobleaching effects before image acquisition, cells were located and focused using the bright field, and a fine focus adjustment in TIRF mode was made at 5% laser power, an intensity insufficient for single-particle detection that ensures negligible photobleaching. Image sequences of individual particles (500 frames) were acquired at 49% laser power with a frame rate of 10 Hz (100 ms/frame). The penetration depth of the evanescent field used was 90 nm.

      We performed automatic tracking of individual particles using a very well established and common algorithm first described by Jaqaman (Jaqaman et al. Nat. Methods, 2008). Nevertheless, we would stress that we implemented this algorithm in a supervised fashion, i.e., we visually inspect each individual trajectory reconstruction in a separate window. Indeed, this algorithm is not able to quantify merging or splitting events.

      We follow each individual fluorescence spot frame-by-frame using a three-by-three matrix around the centroid position of the spot, as it diffuses on the cell membrane. To minimize the effect of photon fluctuations, we averaged the intensity over 20 frames. Nevertheless, to assure the reviewer that most of the single molecule traces last for at least 50 frames (i.e., 5 seconds), we provide the following data and arguments. We currently measure the photobleaching times from individual CD86-AcGFP spots exclusively having one single photobleaching step to guarantee that we are looking at individual CD86-AcGFP molecules. The distribution of the photobleaching times is shown below (Figure II, only for review purposes). Fitting of the distribution to a single exponential decay renders a t0 value of ~5 s. Thus, with 20 frames averaging, we are essentially measuring the whole population of monomers in our experiments. As the survival time of a molecule before photobleaching will strongly depend on the excitation conditions, we used low excitation conditions (2 mW laser power, which corresponds to an excitation power density of ~0.015 kW/cm2 considering the illumination region) and longer integration times (100 ms/frame) to increase the signal-to-background for single GFP detection while minimizing photobleaching.

      To infer the stoichiometry of receptor complexes, we also perform single-step photobleaching analysis of the TIRF trajectories to establish the existence of different populations of monomers, dimers, trimers and nanoclusters and extract their percentage. Some representative trajectories of CXCR4-AcGFP with the number of steps detected are shown in new Supplementary Figure 1.

      The emitted fluorescence (arbitrary units, a.u.) of each spot in the cells is quantified and normalized to the intensity emitted by monomeric CD86-AcGFP spots that strictly showed a single photobleaching step (Dorsch et al. Nat. Methods,2009). We have preferred to use CD86-AcGFP in cells rather than AcGFP on glass to exclude any potential effect on the different photodynamics exhibited by AcGFP when bound directly to glass. We have also previously shown pharmacological controls to exclude CXCL12-mediated receptor clustering due to internalization processes (Martinez-Muñoz et al. Mol. Cell, 2018) that, together with the evaluation of single photobleaching steps and intensity histograms, allow us to exclude the presence of vesicles in our data. Thus, the dimers, trimers and nanoclusters found in our data do correspond to CXCR4 molecules on the cell surface. Finally, distribution of monomeric particle intensities, obtained from the photobleaching analysis, was analyzed by Gaussian fitting, rendering a mean value of 980 {plus minus} 86 a.u. This value was then used as the monomer reference to estimate the number of receptors per particle in both cases, CXCR4-AcGFP and CXCR4R334X-AcGFP (new Supplementary Figure 1).

      • I understand that the CXCL12 or gp120 are attached to the substrate with fibronectin for adhesion. I'm less clear how how that VLPs are integrated. Were these added to cells already attached to FN?*

      For TIRF-M experiments, cells were adhered to glass-bottomed microwell dishes coated with fibronectin, fibronectin + CXCL12, fibronectin + X4-gp120, or fibronectin + VLPs. As for CXCL12 and X4-gp120, the VLPs were attached to fibronectin taking advantage of electrostatic interactions. To clarify the integration of the VLPs in these assays, we have stained the microwell dishes coated with fibronectin and those coated with fibronectin + VLPs with wheat germ agglutinin (WGA) coupled to Alexa647 (Figure III, only for review purposes) and evaluated the staining by confocal microscopy. These results indicate the presence of carbohydrates on the VLPs and are, therefore, indicative of the presence of VLPs on the fibronectin layer.

      Moreover, it is important to remark that the effect of the VLPs on CXCR4 behavior at the cell surface observed by TIRF-M confirmed that the VLPs remained attached to the substrate during the experiment.

      • Fig 1A- The classification of particle tracks into mobile and immobile is overly simplistic description that goes back to bulk FRAP measurements and it not really applicable to single molecule tracking data, where it's rare to see anything that is immobile and alive. An alternative classification strategy uses sub-diffusion, normal diffusion and active diffusion (or active transport) to descriptions and particles can transition between these classes over the tracking period. Fig 1B- this data might be better displayed as histograms showing distributions within the different movement classes.*

      In agreement with the reviewer's commentary, the majority of the particles detected in our TIRF-M experiments were indeed mobile. However, we also detected a variable, and biologically appreciable, percentage of immobile particles depending on the experimental condition analyzed (Figure 1A in the main manuscript). To establish a stringent threshold for identifying these immobile particles under our specific experimental conditions, we used purified monomeric AcGFP proteins immobilized on glass coverslips. Our analysis demonstrated that 95% of these immobilized proteins showed a diffusion coefficient £0.0015 mm2/s; consequently, this value was established as the cutoff to distinguish immobile from mobile trajectories. While the observation of truly immobile entities in a dynamic, living system is rare, the presence of these particles under our conditions is biologically significant. For instance, the detection of large, immobile receptor nanoclusters at the plasma membrane is entirely consistent with facilitating key cellular processes, such as enabling the robust signaling cascade triggered by ligand binding or promoting the crucial events required for efficient viral entry into the cells.

      Regarding the mobile receptors (defined as those with D1-4 values exceeding 0.0015 mm2/s), we observed distinct diffusion profiles derived from mean square displacement (MSD) plots (Figure V) (Manzo & García-Parajo Rep. Prog. Phys., 2015), which were further classified based on motion, using the moment scaling spectrum (MSS) (Ewers et al. PNAS, 2005). Under all experimental conditions, the majority of mobile particles, ∼85%, showed confined diffusion: for example under basal conditions, without ligand addition, ∼90% of mobile particles showed confined diffusion, ∼8.5% showed Brownian-free diffusion and ∼1.5% exhibited directed motion (new Supplementary Figure 5A in the main manuscript). These data have been also included in the revised manuscript to show, in detail, the dynamic parameters of CXCR4.

      Due to the space constraints, it is very difficult to include all the figures generated. However, to ensure comprehensive assessment and transparency (for the purpose of this review), we have included below representative plots of the MSD values as a function of time from individual trajectories, showing different types of motion obtained in our experiments (Figure IV, only for review purposes).

      • Fig 1C,D- It would be helpful to see a plot of D vs MSI at a single particle level. In comparing C and D I'm surprised there is not a larger difference between CXCL12 and X4-gp120. It would also be very important to see the behaviour of X4-gp120 on the CXCR4 deficient Jurkat that would provide a picture of CD4 diffusion. The CXCR4 nanoclustering related to the X4-gp120 could be dominated by CD4 behaviour.*

      As previously described, all analyses were performed under SPT conditions (see previous response to point 1 in this reply). Figure 1C details the percentage of oligomers (>3 receptors/particle) calibrated using Jurkat CD4+ cells electroporated with monomeric CD86-AcGFP (Dorsch et al. Nat. Methods, 2009). The monomer value was determined by analyzing photobleaching steps as described in our previous response to point 1.

      In our experiments, we observed a trend towards a higher number of oligomers upon activation with CXCL12 compared with X4-gp120. This trend was further supported by measurements of Mean Spot Intensity. However, the values are also influenced by the number of larger spots, which represents a minor fraction of the total spots detected.

      The differences between the effect triggered by CXCL12 or X4-gp120 might also be attributed to a combination of factors related to differences in ligand concentration, their structure, and even to the technical requirements of TIRF-M. Both ligands are in contact with the substrate (fibronectin) and the specific nature of this interaction may differ between both ligands and influence their accessibility to CXCR4. Moreover, the requirement of the prior binding of gp120 to CD4 before CXCR4 engagement, in contrast to the direct binding of CXCL12 to CXCR4, might also contribute to the differences observed.

      We previously reported that CXCL12-mediated CXCR4 dynamics are modulated by CD4 co-expression (Martinez-Muñoz et al. Mol. Cell, 2018). We have now detected the formation of CD4 heterodimers with both CXCR4 and CXCR4R334X, and found that these conformations are influenced by gp120-VLPs. In the present manuscript, we did not focus on CD4 clustering as it has been extensively characterized previously (Barrero-Villar et al. J. Cell Sci., 2009; Jiménez-Baranda et al. Nat. Cell. Biol., 2007; Yuan et al. Viruses, 2021). Regarding the investigation of the effects of X4-gp120 on CXCR4-deficient Jurkat cells, which would provide a picture of CD4 diffusion, we would note that a previous report has already addressed this issue using single-molecule super-resolution imaging, and revealed that CD4 molecules on the cell membrane are predominantly found as individual molecules or small clusters of up to 4 molecules, and that the size and number of these clusters increases upon virus binding or gp120 activation (Yuan et al. Viruses, 2021).

      • Fig S1D- This data is really interesting. However, if both the CD4 and the gp120 have his tags they need to be careful as poly-His tags can bind weakly to cells and increasing valency could generate some background. So, they should make the control is fair here. Ideally, using non-his tagged person of sCD4 and gp120 would be needed ideal or they need a His-tagged Fab binding to gp120 that doesn't induce CXCR4 binding.*

      New Supplementary Figure 2D shows that X4-gp120 does not bind Daudi cells (these cells do not express CD4) in the absence of soluble CD4. While the reviewer is correct to state that both proteins contain a Histidine Tag, cell binding is only detected if X4-gp120 binds sCD4. Nonetheless, we have included in the revised Supplementary Figure 2D a control showing the negative binding of sCD4 to Daudi cells in the absence of X4-gp120. Altogether, these results confirm that only sCD4/X4-gp120 complexes bind these cells.

      • Fig S4- Panel D needs a scale bar. I can't figure out what I'm being shown without this.*

      Apologies. A scale bar has been included in this panel (new Supplementary Figure 6D).

      Reviewer #2

      • This study is well described in both the main text and figures. Introduction provides adequate background and cites the literature appropriately. Materials and Methods are detailed. Authors are careful in their interpretations, statistical comparisons, and include necessary controls in each experiment. The Discussion presents a reasonable interpretation of the results. Overall, there are no major weaknesses with this manuscript.*

      We very much appreciate the positive comments of the reviewer regarding the broad interest and strength of our work.

      • NL4-3deltaIN and immature HIV virions are found to have less associated gp120 relative to wild-type particles. It is not obvious why this is the case for the deltaIN particles or genetically immature particles. Can the authors provide possible explanations? (A prior paper was cited, Chojnacki et al Science, 2012 but can the current authors provide their own interpretation.)*

      Our conclusion from the data is actually exactly the opposite. As shown in Figure 2D, the gp120 staining intensity was higher for NL4-3DIN particles (1,786 a.u.) than for gp120-VLPs (1,223 a.u.), indicating lower expression of Env proteins in the latter. Furthermore, analysis of gp120 intensity per particle (Figure 2E) confirmed that gp120-VLPs contained fewer gp120 molecules per particle than NL4-3DIN virions. These levels were comparable with, or even lower than, those observed in primary HIV-1 viruses (Zhu et al. Nature, 2006). This reduction was a direct consequence of the method used to generate the VLPs, as our goal was to produce viral particles with minimal gp120 content to prevent artifacts in receptor clustering that might occur using high levels of Env proteins in the VLPs to activate the receptors.

      This misunderstanding may arise from the fact that we also compared Gag condensation and Env distribution on the surface of gp120-VLPs with those observed in genetically immature particles and integrase-defective NL4-3ΔIN virions, which served as controls. STED microscopy data revealed differences in Env distribution between gp120-VLPs and NL4-3ΔIN virions, supporting the classification of gp120-VLPs as mature particles (Figure 2 A,B).

      Reviewer #3

      We thank the reviewer for considering that our work offers new insights into the spatial organization of receptors during HIV-1 entry and infection and that the manuscript is well written, and the findings significant.

      • For mechanistic basis of gp120-CXCR4 versus CXCL12-CXCR4 differences. Provide additional structural or biochemical evidence to support the claim that gp120 stabilises a distinct CXCR4 conformation compared to CXCL12. If feasible, include molecular modelling, mutagenesis, or cross-linking experiments to corroborate the proposed conformational differences.*

      We appreciate the opportunity to clarify this point. The specific claim that gp120 stabilizes a conformation of CXCR4 that is distinct from the CXCL12-bound state was not explicitly stated in our manuscript, although we agree that our data strongly support this possibility. It is important to consider that CXCL12 binds directly to CXCR4, whereas gp120 requires prior sequential binding to CD4, and its subsequent interaction is with a CXCR4 molecule that is already forming part of the CD4/CXCR4 complex, as demonstrated by our FRET experiments and supported by previous studies (Zaitseva et al. J. Leuk. Biol., 2005; Busillo & Benovic Biochim. Biophys. Acta, 2007; Martínez-Muñoz et al. PNAS, 2014). This difference makes it inherently complex to compare the conformational changes induced by gp120 and CXCL12 on CXCR4.

      However, our findings show that both stimuli induce oligomerization of CXCR4, a phenomenon not observed when mutant CXCR4R334X was exposed to the chemokine CXCL12 (García-Cuesta et al. PNAS, 2022).

      1. CXCL12 induced oligomerization of CXCR4 but did not affect the dynamics of CXCR4R334X (Martinez-Muñoz et al. Mol. Cell, 2018; García-Cuesta et al. PNAS, 2022). By contrast, X4-gp120 and the corresponding VLPs-which require initial binding to CD4 to engage the chemokine receptor-stabilized oligomers of both CXCR4 and CXCR4R334X.

      FRET analysis revealed distinct FRET50 values for CD4/CXCR4 (2.713) and CD4/CXCR4R334X (0.399) complexes, suggesting different conformations for each complex. Consistent with previous reports (Balabanian et al. Blood, 2005; Zmajkovicova et al. Front. Immunol., 2024; García-Cuesta et al. PNAS, 2022), the molecular mechanisms activated by CXCL12 are distinct when comparing CXCR4 with CXCR4R334X. For instance, CXCL12 induces internalization of CXCR4, but not of mutant CXCR4R334X. Conversely, X4-gp120 triggers approximately 25% internalization of both receptors. Similarly, CXCL12 does not promote CD4 internalization in cells co-expressing CXCR4 or CXCR4R334X, whereas X4-gp120 does, although CD4 internalization was significantly higher in cells co-expressing CXCR4.

      These findings suggest that CD4 influences the conformation and the oligomerization state of both co-receptors. To further support this hypothesis, we have conducted new in silico molecular modeling of CD4 in complex with either CXCR4 or its mutant CXCR4R334X using AlphaFold 3.0 (Abramson et al. Nature, 2024). The server was provided with both sequences, and the interaction between the two molecules for each protein was requested. It produced a number of solutions, which were then analyzed using the software ChimeraX 1.10 (Meng et al. Protein Sci., 2023). CXCR4 and its mutant, CXCR4R334X bound to CD4, were superposed using one of the CD4 molecules from each complex, with the aim of comparing the spatial positioning of CD4 molecules when interacting with CXCR4.

      As illustrated in Figure V (only for review purposes), the superposition of the CD4/CXCR4 complexes was complete. However, when CD4/CXCR4 complexes were superimposed with CD4/CXCR4R334X complexes using the same CD4 molecule as a reference, indicated by an arrow in the figure, a clear structural deviation became evident. The main structural difference detected was the positioning of the CD4 transmembrane domains when interacting with either the wild-type or mutant CXCR4. While in complexes with CXCR4, the angle formed by the lines connecting residues E416 at the C-terminus end of CD4 with N196 in CXCR4 was 12{degree sign}, for the CXCR4R334X complex, this angle increased to 24{degree sign}, resulting in a distinct orientation of the CD4 extracellular domain (Figure VI, only for review purposes).

      To further analyze the models obtained, we employed PDBsum software (Laskowski & Thornton Protein Sci., 2021) to predict the CD4/CXCR4 interface residues. Data indicated that at least 50% of the interaction residues differed when the CD4/CXCR4 interaction surface was compared with that of the CD4/CXCR4R334X complex (Figure VII, only for review purposes). It is important to note that while some hydrogen bonds were present in both complex models, others were exclusive to one of them. For instance, whereas Cys394(CD4)-Tyr139 and Lys299(CD4)-Glu272 were present in both CD4/CXCR4 and CD4/CXCR4R334X complexes, the pairs Asn337(CD4)-Ser27(CXCR4R334X) and Lys325(CD4)-Asp26(CXCR4R334X) were only found in CD4/CXCR4R334X complexes.

      These findings, which are consistent with our FRET results, suggest distinct interaction surfaces between CD4 and the two chemokine receptors. Overall, these results are compatible with differences in the spatial conformation adopted by these complexes.

      • For Empty VLP effects on CXCR4 dynamics: Explore potential causes for the observed effects of Env-deficient VLPs. It's valuable to include additional controls such as particles from non-producer cells, lipid composition analysis, or blocking experiments to assess nonspecific interactions. *

      As VLPs are complex entities, we thought that the relevant results should be obtained comparing the effects of Env(-) VLPs with gp120-VLPs. Therefore, we would first remark that regardless of the effect of Env(-) VLPs on CXCR4 dynamics, the most evident finding in this study is the strong effect of gp120-VLPs compared with control Env(-) VLPs. Nevertheless, regarding the effect of the Env(-) VLPs compared with medium, we propose several hypotheses. As several virions can be tethered to the cell surface via glycosaminoglycans (GAGs), we hypothesized that VLPs-GAGs interactions might indirectly influence the dynamics of CXCR4 and CXCR4R334X at the plasma membrane. Additionally, membrane fluidity is essential for receptor dynamics, therefore VLPs interactions with proteins, lipids or any other component of the cell membrane could also alter receptor behavior. It is well known that lipid rafts participate in the interaction of different viruses with target cells (Nayak & Hu Subcell. Biochem., 2004; Manes et al. Nat. Rev. Immunol., 2003; Rioethmullwer et al. Biochim. Biophys. Acta, 2006) and both the lipid composition and the presence of co-expressed proteins modulate ligand-mediated receptor oligomerization (Gardeta et al. Frontiers in Immunol., 2022; Gardeta et al. Cell. Commun. Signal., 2025). We have thus performed Raster Image Correlation Spectroscopy (RICS) analysis to assess membrane fluidity through membrane diffusion measurements on cells treated with Env(-) VLPs.

      Jurkat cells were labeled with Di-4-ANEPPDHG and seeded on FN and on FN + VLPs prior to analysis by RICS on confocal microscopy. The results indicated no significant differences in membrane diffusion under the treatment tested, thereby discarding an effect of VLPs on overall membrane fluidity (Figure VIII, only for review purposes).

      Nonetheless, these results do not rule out other non-specific interactions of Env(-) VLPs with membrane proteins that could affect receptor dynamics. For instance, it has been reported that C-type lectin DC-SIGN acts as an efficient docking site for HIV-1 (Cambi et al. J. Cell. Biol., 2004; Wu & KewalRamani Nat. Rev. Immunol., 2006). However, a detailed investigation of these possible mechanisms is beyond the scope of this manuscript.

      • For Direct link between clustering and infection efficiency - Test whether disruption of CXCR4 clustering (e.g., using actin cytoskeleton inhibitors, membrane lipid perturbants, or clustering-deficient mutants) alters HIV-1 fusion or infection efficiency*.

      Designing experiments using tools that disrupt receptor clustering by interacting with the receptors themselves is difficult and challenging, as these tools bind the receptor and can therefore alter parameters such as its conformation and/or its distribution at the cell membrane, as well as affect some cellular processes such as HIV-1 attachment and cell entry. Moreover, effects on actin polymerization or lipids dynamics can affect not only receptor clustering but also impact on other molecular mechanisms essential for efficient infection.

      Many previous reports have, nonetheless, indirectly correlated receptor clustering with cell infection efficiency. Cholesterol plays a key role in the entry of several viruses. Its depletion in primary cells and cell lines has been shown to confer strong resistance to HIV-1-mediated syncytium formation and infection by both CXCR4- and CCR5-tropic viruses (Liao et al. AIDS Res. Hum. Retrovisruses, 2021). Moderate cholesterol depletion also reduces CXCL12-induced CXCR4 oligomerization and alters receptor dynamics (Gardeta et al. Cell. Commun. Signal., 2025). By restricting the lateral diffusion of CD4, sphingomyelinase treatment inhibits HIV-1 fusion (Finnegan et al. J. Virol., 2007). Depletion of sphingomyelins also disrupts CXCL12-mediated CXCR4 oligomerization and its lateral diffusion (Gardeta et al. Front Immunol., 2022). Additional reports highlight the role of actin polymerization at the viral entry site, which facilitates clustering of HIV-1 receptors, a crucial step for membrane fusion (Serrano et al. Biol. Cell., 2023). Blockade of actin dynamics by Latrunculin A treatment, a drug that sequesters actin monomers and prevents its polymerization, blocks CXCL12-induced CXCR4 dynamics and oligomerization (Martínez-Muñoz et al. Mol. Cell, 2018).

      Altogether, these findings strongly support our hypothesis of a direct link between CXCR4 clustering and the efficiency of HIV-1 infection.

      • CD4/CXCR4 co-endocytosis hypothesis - Support the proposed model with direct evidence from live-cell imaging or co-localization experiments during viral entry. Clarification is needed on whether internalization is simultaneous or sequential for CD4 and CXCR4.*

      When referring to endocytosis of CD4 and CXCR4, we only hypothesized that HIV-1 might promote the internalization of both receptors either sequentially or simultaneously. The hypothesis was based in several findings:

      1) Previous studies have suggested that HIV-1 glycoproteins can reduce CD4 and CXCR4 levels during HIV-1 entry (Choi et al. Virol. J., 2008; Geleziunas et al. FASEB J, 1994; Hubert et al. Eur. J. Immunol., 1995).

      2) Receptor endocytosis has been proposed as a mechanism for HIV-1 entry (Daecke et al. J. Virol., 2005; Aggarwal et al.Traffick, 2017; Miyauchi et al. Cell, 2009; Carter et al. Virology, 2011).

      3) Our data from cells activated with X4-gp120 demonstrated internalization of CD4 and chemokine receptors, which correlated with HIV-1 infection in PBMCs from WHIM patients and healthy donors.

      4) CD4 and CXCR4 have been shown to co-localize in lipid rafts during HIV-1 infection (Manes et al. EMBO Rep., 2000; Popik et al. J. Virol., 2002)

      5) Our FRET data demonstrated that CD4 and CXCR4 form heterocomplexes and that FRET efficiency increased after gp120-VLPs treatment.

      We agree with the reviewer that further experiments are required to test this hypothesis, however, we believe that this is beyond the scope of the current manuscript.

      Minor Comments:

      • The conclusions rely solely on the HXB2 X4-tropic Env. It would strengthen the study to assess whether other X4 or dual-tropic strains induce similar receptor clustering and dynamics.*

      The primary goal of our current study was to investigate the dynamics of the co-receptor CXCR4 during HIV-1 infection, motivated by previous reports showing CD4 oligomerization upon HIV-1 binding and gp120 stimulation (Yuan et al.Viruses, 2021). We initially used a recombinant X4-gp120, a soluble protein that does not fully replicate the functional properties of the native HIV-1 Env. Previous studies have shown that Env consists of gp120 trimers, which redistribute and cluster on the surface of virions following proteolytic Gag cleavage during maturation (Chojnacki et al. Nat. Commun., 2017). An important consideration in receptor oligomerization studies is the concentration of recombinant gp120 used, as it does not accurately reflect the low number of Env trimers present on native HIV-1 particles (Hart et al. J. Histochem. Cytochem., 1993; Zhu et al. Nature, 2006). To address these limitations, we generated virus-like particles (VLPs) containing low levels of X4-gp120 and repeated the dynamic analysis of CXCR4. The use of primary HIV-1 isolates was limited, in this project, to confirm that PBMCs from both healthy donors and WHIM patients were equally susceptible to infection. This result using a primary HIV-1 virus supports the conclusion drawn from our in vitroapproaches. We thus believe that although the use of other X4- and dual-tropic strains may complement and reinforce the analysis, it is far beyond the scope of the current manuscript.

      • Given the observed clustering effects, it would be valuable to explore whether gp120-induced rearrangements alter epitope exposure to broadly neutralizing antibodies like 17b or 3BNC117. This would help connect the mechanistic insights to therapeutic relevance.*

      As 3BNC117, VRC01 and b12 are broadly neutralizing mAbs that recognize conformational epitopes on gp120 (Li et al. J. Virol., 2011; Mata-Fink et al. J. Mol. Biol., 2013), they will struggle to bind the gp120/CD4/CXCR4 complex and therefore may not be ideal for detecting changes within the CD4/CXCR4 complex. The experiment suggested by the reviewer is thus challenging but also very complex. It would require evaluating antibody binding in two experimental conditions, in the absence and in the presence of oligomers. However, our data indicate that receptor oligomerization is promoted by X4-gp120 binding, and the selected antibodies are neutralizing mAbs, so they should block or hinder the binding of gp120 and, consequently, receptor oligomerization. An alternative approach would be to study the neutralizing capacity of these mAbs on cells expressing CD4/CXCR4 or CD4/CXCR4R334X complexes. Variations in their neutralizing activity could be then extrapolated to distinct gp120 conformations, which in turn may reflect differences between CD4/CXCR4 and CD4/CXCR4R334X complexes.

      We thus assessed the ability of the VRC01 and b12, anti-gp120 mAbs, which were available in our laboratory, to neutralize gp120 binding on cells expressing CD4/CXCR4 or CD4/CXCR4R334X. Specifically, increasing concentrations of each antibody were preincubated (60 min, 37ºC) with a fixed amount of X4-gp120 (0.05 mg/ml). The resulting complexes were then incubated with Jurkat cells expressing CD4/CXCR4 or CD4/CXCR4R334X (30 min, 37ºC) and, finally, their binding was analyzed by flow cytometry. Although we did not observe statistically significant differences in the neutralization capacity of b12 or VRC01 for the binding of X4-gp120 depending on the presence of CXCR4 or CXCR4334X, we observed a trend for greater concentrations of both mAbs to neutralize X4-gp120 binding in Jurkat CD4/CXCR4 cells than in Jurkat CD4/CXCR4R334X cells (Figure IX, only for review purposes).

      These slight alterations in the neutralizing capacity of b12 and VRC01 mAbs may thus suggest minimal differences in the conformations of gp120 depending of the coreceptor used. We also detected that X4-gp120 and VLPs expressing gp120, which require initial binding to CD4 to engage the chemokine receptor, stabilized oligomers of both CXCR4 and CXCR4R334X, but FRET data indicated distinct FRET50 values between the partners, (2.713) for CD4/CXCR4 and (0.399) for CD4/CXCR4R334X (Figure 5A,B in the main manuscript). Moreover, we also detected significantly more CD4 internalization mediated by X4-gp120 in cells co-expressing CD4 and CXCR4 than in those co-expressing CD4 and CXCR4R334X (Figure 6 in the main manuscript). Overall these latter data and those included in Figures V, VI and VII of this reply, indicate distinct conformations within each receptor complexes.

      • TIRF imaging limits analysis to the cell substrate interface. It would be useful to clarify whether CXCR4 receptor clustering occurs elsewhere, such as at immunological synapses or during cell-to-cell contact.*

      In recent years, chemokine receptor oligomerization has gained significant research interest due to its role in modulating the ability of cells to sense chemoattractant gradients. This molecular organization is now recognized as a critical factor in governing directed cell migration (Martínez-Muñoz et al. Mol. Cell, 2018; García-Cuesta et al. PNAS, 2022, Hauser et al.Immunity, 2016). In addition, advanced imaging techniques such as single-molecule and super-resolution microscopy have been used to investigate the spatial distribution and dynamic behaviour of CXCR4 within the immunological synapse in T cells (Felce et al. Front. Cell Dev. Biol., 2020). Building on these findings, we are currently conducting a project focused on characterizing CXCR4 clustering specifically within this specialized cellular region.

      • In LVP experiments, it would be useful to report transduction efficiency (% GFP+ cells) alongside MSI data to relate VLP infectivity with receptor clustering functionally.*

      These experiments were designed to validate the functional integrity of the gp120 conformation on the LVPs, confirming their suitability for subsequent TIRF microscopy. Our objective was to establish a robust experimental tool rather than to perform a high-throughput quantification of transduction efficiency. It is for that reason that these experiments were included in new Supplementary Figure S6, which also contains the complete characterization of gp120-VLPs and LVPs. In such experimental conditions, quantifying the percentage of GFP-positive cells relative to the total number of cells plated in each well is very difficult. However, in line with the reviewer's commentary and as we used the same number of cells in each experimental condition, we have included, in the revised manuscript, a complementary graph illustrating the GFP intensity (arbitrary units) detected in all the wells analyzed (new Supplementary Fig. 6E).

      • To ensure that differences in fusion events (Figure 7B) are attributable to target cell receptor properties, consider confirming that effector cells express similar levels of HIV-1 Env. Quantifying gp120 expression by flow cytometry or western blot would rule out the confounding effects of variable Env surface density.*

      In these assays (Figure 7B), we used the same effector cells (cells expressing X4-gp120) in both experimental conditions, ensuring that any observed differences should be attributable solely to the target cells, either JKCD4X4 or JKCD4X4R334X. For this reason, in Figure 7A we included only the binding of X4-gp120 to the target cells which demonstrated similar levels of the receptors expressed by the cells.

      • HIV-mediated receptor downregulation may occur more slowly than ligand-induced internalization. Including a 24-hour time point would help assess whether gp120 induces delayed CD4 or CXCR4 loss beyond the early effects shown and to better capture potential delayed downregulation induced by gp120.*

      The reviewer suggests using a 24-hour time point to facilitate detection of receptor internalization. However, such an extended incubation time may introduce some confounding factors, including receptor degradation, recycling and even de novo synthesis, which could affect the interpretation of the results. Under our experimental conditions, we observed that CXCL12 did not trigger CD4 internalization whereas X4-gp120 did. Interestingly, CD4 internalization depended on the co-receptor expressed by the cells.

      • Increase label font size in microscopy panels for improved readability.*

      Of course; the font size of these panels has been increased in the revised version.

      • Consider adding more references on ligand-induced co-endocytosis of CD4 and chemokine receptors during HIV-1 entry.*

      We have added more references to support this hypothesis (Toyoda et al. J. Virol., 2015; Venzke et al. J. Virol., 2006; Gobeil et al J. Virol., 2013).

      • For Statistical analysis. Biological replicates are adequate, and statistical tests are generally appropriate. For transparency, report n values, exact p-values, and the statistical test used in every figure legend and discussed in the results.*

      Thank you for highlighting the importance of transparency in statistical reporting. We confirm that the n values for all experiments have been included in the figure legends. The statistical tests used for each analysis are also clearly indicated in the figure legends, and the interpretation of these results is discussed in detail in the Results section. Furthermore, the Methods section specifies the tests applied and the thresholds for significance, ensuring full transparency regarding our analytical approach.

      In accordance with established conventions in the field, we have utilized categorical significance indicators (e.g., n.s., *, **, ***) within our figures to enhance readability and focus on biological trends. This approach is widely adopted in high-impact literature to prevent visual clutter. However, to ensure full transparency and reproducibility, we have ensured that the underlying statistical tests and thresholds are clearly defined in the respective figure legends and Methods section.

      Reviewer #4

      We thank the reviewer for considering that this work is presented in a clear fashion, and the main findings are properly highlighted, and for remarking that the paper is of interest to the retrovirology community and possibly to the broader virology community.

      We also agree on the interest that X4-gp120 clusters CXCR4R334X suggests a different binding mechanism for X4-gp120 from that of the natural ligand CXCL12, an aspect that we are now evaluating. These data also indicate that WHIM patients can be infected by HIV-1 similarly to healthy people.

      • The observation that "empty VLPs" reduce CXCR4 diffusivity is potentially interesting. However, it is not supported by the data owing to insufficient controls. The authors correctly discuss the limitations of that observation in the Discussion section (lines 702-704). However, they overinterpret the observation in the Results section (lines 509-512), suggesting non-specific interactions between empty VLPs, CD4 and CXCR4. I suggest either removing the sentence from the Results section or replacing it with a sentence similar to the one in the Discussion section.*

      In accordance with the reviewer`s suggestion, the sentence in the result section has been replaced with one similar to that found in the discussion section. In addition, we have performed Raster Image Correlation Spectroscopy (RICS) analysis using the Di-4-ANEPPDHQ lipid probe to assess membrane fluidity by means of membrane diffusion, and compared the results with those of cells treated with Env(-) VLPs. The results indicated that VLPs did not modulate membrane fluidity (Figure VIII in this reply). Nonetheless, these results do not rule out other potential non-specific interactions of the Env(-) VLPs with other components of the cell membrane that might affect receptor dynamics (see our response to point 2 of reviewer #3 p. 14-15 of this reply).

      • In the case of the WHIM mutant CXCR4-R334X, the addition of "empty VLPs" did not cause a significant change in the diffusivity of CXCR4-R334X (Figure 4B). This result is in contrast with the addition of empty VLPs to WT CXCR4. However, the authors neither mention nor comment on that result in the results section. Please mention the result in the paper and comment on it in relation to the addition of empty VLPs to WT CXCR4.*

      We would remark that the main observation in these experiments should focus on the effect of gp120-VLPs, and the results indicates that gp120-VLPs promoted clustering of CXCR4 and of CXCR4R334X and reduced their diffusion at the cell membrane. The Env(- ) VLPs were included as a negative control in the experiments, to compare the data with those obtained using gp120-VLPs. However, once we observed some residual effect of the Env(-) VLPs, we decided to give a potential explanation, formulated as a hypothesis, that the Env(-) VLPs modulated membrane fluidity. We have now performed a RICS analysis using Di-4-ANEPPDHQ as a lipid probe (Figure IX only for review purposes). The results suggest that Env(-) VLPs do not modulate cell membrane fluidity, although we do not rule out other potential interactions with membrane proteins that might alter receptor dynamics. We appreciate the reviewer's observation and agree that this result can be noted. However, since the main purpose of Figure 4B is to show that gp120-VLPs modulate the dynamics of CXCR4R334X rather than to remark that the Env(-) VLPs also have some effects, we consider that a detailed discussion of this specific aspect would detract from the central finding and may dilute the primary narrative of the study.

      Minor comments

      • It would be helpful for the reader to combine thematically or experimentally linked figures, e.g., Figures 3 and 4.*

      • Figures 3 and 4 are very similar. Please unify the colours in them and the order of the panels (e.g. Figure 3 panel A shows diffusivity of CXCR4, while Figure 4 panel A shows MSI of CXCR4-R334X).*

      While we considered consolidating Figures 3 and 4, we believe that maintaining them as separate entities enhances conceptual clarity. Since Figure 3 establishes the baseline dynamics for wild-type CXCR4 and Figure 4 details the distinct behavior of the CXCR4R334X mutant, keeping them separate allows the reader to fully appreciate the specificities of each system before making a cross-comparison.

      • Some parts of the Discussion section could be shortened, moved to the Introduction (e.g.,lines 648-651), or entirely removed (e.g.,lines 633-635 about GPCRs).*

      In accordance, the Discussion section has been reorganized and shortened to improve clarity.

      • I suggest renaming "empty VLPs" to "Env(−) VLPs" (or similar). The name empty VLPs can mislead the reader into thinking that these are empty vesicles.*

      The term empty VLPs has been renamed to Env(−) VLPs throughout the manuscript to more accurately reflect their composition. Many thanks for this suggestion.

      • Line 492 - please rephrase "...lower expression of Env..." to "...lower expression of Env or its incorporation into the VLPs...".*

      The sentence has been rephrased

      • Line 527 - The data on CXCL12 modulating CXCR4-R334X dynamics and clustering are not present in Figure 4 (or any other Figure). Please add them or rephrase the sentence with an appropriate reference. Make clear which results are yours.*

      • Line 532 - Do the data in the paper really support a model in which CXCL12 binds to CXCR4-R334X? If not, please rephrase with an appropriate reference.*

      Previous studies support the association of CXCL12 with CXCR4R334X (Balabanian et al. Blood, 2005; Hernandez et al. Nat Genet., 2003; Busillo & Benovic Biochim. Biophys. Acta, 2007). In fact, this receptor has been characterized as a gain-of-function variant for this ligand (McDermott et al. J. Cell. Mol. Med., 2011). The revised manuscript now includes these bibliographic references to support this commentary. In any case, our previous data indicate that CXCL12 binding does not affect CXCR4R334X dynamics (García-Cuesta et al. PNAS, 2022).

      • Line 695 - "...lipid rafts during HIV-1 (missing word?) and their ability to..." During what?*

      Many thanks for catching this mistake. The sentence now reads: "Although direct evidence for the internalization of CD4 and CXCR4 as complexes is lacking, their co-localization in lipid rafts during HIV-1 infection (97-99) and their ability to form heterocomplexes (22) strongly suggest they could be endocytosed together."

    1. Author response:

      The following is the authors’ response to the original reviews.

      Public reviews:

      Reviewer #1 (Public review):

      In this important study, the authors characterized the transformation of neural representations of olfactory stimuli from the primary sensory cortex to multisensory regions in the medial temporal lobe and investigated how they were affected by non-associative learning. The authors used high-density silicon probe recordings from five different cortical regions while familiar vs. novel odors were presented to a head-restrained mouse. This is a timely study because unlike other sensory systems (e.g., vision), the progressive transformation of olfactory information is still poorly understood. The authors report that both odor identity and experience are encoded by all of these five cortical areas but nonetheless some themes emerge. Single neuron tuning of odor identity is broad in the sensory cortices but becomes narrowly tuned in hippocampal regions. Furthermore, while experience affects neuronal response magnitudes in early sensory cortices, it changes the proportion of active neurons in hippocampal regions. Thus, this study is an important step forward in the ongoing quest to understand how olfactory information is progressively transformed along the olfactory pathway.

      The study is well-executed. The direct comparison of neuronal representations from five different brain regions is impressive. Conclusions are based on single neuronal level as well as population level decoding analyses. Among all the reported results, one stands out for being remarkably robust. The authors show that the anterior olfactory nucleus (AON), which receives direct input from the olfactory bulb output neurons, was far superior at decoding odor identity as well as novelty compared to all the other brain regions. This is perhaps surprising because the other primary sensory region - the piriform cortex - has been thought to be the canonical site for representing odor identity. A vast majority of studies have focused on aPCx, but direct comparisons between odor coding in the AON and aPCx are rare. The experimental design of this current study allowed the authors to do so and the AON was found to convincingly outperform aPCx. Although this result goes against the canonical model, it is consistent with a few recent studies including one that predicted this outcome based on anatomical and functional comparisons between the AON-projecting tufted cells vs. the aPCx-projecting mitral cells in the olfactory bulb (Chae, Banerjee et. al. 2022). Future experiments are needed to probe the circuit mechanisms that generate this important difference between the two primary olfactory cortices as well as their potential causal roles in odor identification.

      The authors were also interested in how familiarity vs. novelty affects neuronal representation across all these brain regions. One weakness of this study is that neuronal responses were not measured during the process of habituation. Neuronal responses were measured after four days of daily exposure to a few odors (familiar) and then some other novel odors were introduced. This creates a confound because the novel vs. familiar stimuli are different odorants and that itself can lead to drastic differences in evoked neural responses. Although the authors try to rule out this confound by doing a clever decoding and Euclidian distance analysis, an alternate more straightforward strategy would have been to measure neuronal activity for each odorant during the process of habituation.

      Reviewer #2 (Public review):

      This manuscript investigates how olfactory representations are transformed along the cortico-hippocampal pathway in mice during a non-associative learning paradigm involving novel and familiar odors. By recording single-unit activity in several key brain regions (AON, aPCx, LEC, CA1, and SUB), the authors aim to elucidate how stimulus identity and experience are encoded and how these representations change across the pathway.

      The study addresses an important question in sensory neuroscience regarding the interplay between sensory processing and signaling novelty/familiarity. It provides insights into how the brain processes and retains sensory experiences, suggesting that the earlier stations in the olfactory pathway, the AON aPCx, play a central role in detecting novelty and encoding odor, while areas deeper into the pathway (LEC, CA1 & Sub) are more sparse and encodes odor identity but not novelty/familiarity. However, there are several concerns related to methodology, data interpretation, and the strength of the conclusions drawn.

      Strengths:

      The authors combine the use of modern tools to obtain high-density recordings from large populations of neurons at different stages of the olfactory system (although mostly one region at a time) with elegant data analyses to study an important and interesting question.

      Weaknesses:

      (1) The first and biggest problem I have with this paper is that it is very confusing, and the results seem to be all over the place. In some parts, it seems like the AON and aPCx are more sensitive to novelty; in others, it seems the other way around. I find their metrics confusing and unconvincing. For example, the example cells in Figure 1C show an AON neuron with a very low spontaneous firing rate and a CA1 with a much higher firing rate, but the opposite is true in Figure 2A. So, what are we to make of Figure 2C that shows the difference in firing rates between novel vs. familiar odors measured as a difference in spikes/sec. This seems nearly meaningless. The authors could have used a difference in Z-scored responses to normalize different baseline activity levels. (This is just one example of a problem with the methodology.)

      We appreciate the reviewer’s concerns regarding clarity and methodology. It is less clear why all neurons in a given brain area should have similar firing rates. Anatomically defined brain areas typically comprise of multiple cell types, which can have diverse baseline firing rates. Since we computed absolute firing rate differences per neuron (i.e., novel vs. familiar odor responses within the same neuron), baseline differences across neurons do not have a major impact.

      The suggestion to use Z-scores instead of absolute firing rate differences is well taken. However, Z-scoring assumes that the underlying data are normally distributed, which is not the case in our dataset. Specifically, when analyzing odor-evoked firing rates on a per-neuron basis, only 4% of neurons exhibit a normal distribution. In cases of skewed distributions, Z-scoring can distort the data by exaggerating small variations, leading to misleading conclusions. We acknowledge that different analysis methods exist, we believe that our chosen approach best reflects the properties of the dataset and avoids potential misinterpretations introduced by inappropriate normalization techniques.

      (2) There are a lot of high-level data analyses (e.g., decoding, analyzing decoding errors, calculating mutual information, calculating distances in state space, etc.) but very little neural data (except for Figure 2C, and see my comment above about how this is flawed). So, if responses to novel vs. familiar odors are different in the AON and aPCx, how are they different? Why is decoding accuracy better for novel odors in CA1 but better for familiar odors in SUB (Figure 3A)? The authors identify a small subset of neurons that have unusually high weights in the SVM analyses that contribute to decoding novelty, but they don't tell us which neurons these are and how they are responding differently to novel vs. familiar odors.

      We performed additional analyses to address the reviewer’s feedback (Figures 2C-E and lines 118-132) and added more single-neuron data (Figures 1, S3 and S4).

      (3) The authors call AON and aPCx "primary sensory cortices" and LEC, CA1, and Sub "multisensory areas". This is a straw man argument. For example, we now know that PCx encodes multimodal signals (Poo et al. 2021, Federman et al., 2024; Kehl et al., 2024), and LEC receives direct OB inputs, which has traditionally been the criterion for being considered a "primary olfactory cortical area". So, this terminology is outdated and wrong, and although it suits the authors' needs here in drawing distinctions, it is simplistic and not helpful moving forward.

      We appreciate the reviewer’s concern regarding the classification of brain regions as “primary sensory” versus “multisensory.” Of note, the cited studies (Poo et al., 2021; Federman et al., 2024; Kehl et al., 2024) focus on posterior PCx (pPCx), while our recordings were conducted in very anterior section of anterior PCx. The aPCx and pPCx have distinct patterns of connectivity, both anatomically and functionally. To the best of our knowledge, there is no evidence for multimodal responses in aPCx, whereas there is for LEC, CA1 and SUB. Furthermore, our distinction is not based on a connectivity argument, as the reviewer suggests, but on differences in the α-Poisson ratio (Figure 1E and F).

      To avoid confusion due to definitions of what constitutes a “primary sensory” region, we adopted a more neutral description throughout the manuscript.

      (4) Why not simply report z-scored firing rates for all neurons as a function of trial number? (e.g., Jacobson & Friedrich, 2018). Figure 2C is not sufficient.

      Regarding z-scores, please see response to 1). We further added a figure showing responses of all neurons to novel stimuli (using ROC instead of z-scoring, as described previously (e.g. Cohen et al. Nature 2012). We added the following figure to the supplementary for the completeness of the analysis (S2E).

      For example, in the Discussion, they say, "novel stimuli caused larger increases in firing rates than familiar stimuli" (L. 270), but what does this mean?

      This means that on average, the population of neurons exhibit higher firing rates in response to novel odors compared to familiar ones.

      Odors typically increase the firing in some neurons and suppress firing in others. Where does the delta come from? Is this because novel odors more strongly activate neurons that increase their firing or because familiar odors more strongly suppress neurons?

      We thank the reviewer for this valuable feedback and extended the characterization of firing rate properties, including a separate analysis of neurons i) significantly excited by odorants, ii) significantly inhibited by odorants and iii) not responsive to odorants. We added the analysis and corresponding discussion to the main manuscript (Figures 2C-E and lines 118-132)

      (5) Lines 122-124 - If cells in AON and aPCx responded the same way to novel and familiar odors, then we would say that they only encode for odor and not at all for experience. So, I don't understand why the authors say these areas code for a "mixed representation of chemical identity and experience." "On the other hand," if LEC, CA1, and SUB are odor selective and only encode novel odors, then these areas, not AON and aPCx, are the jointly encoding chemical identity and experience. Also, I do not understand why, here, they say that AON and PCx respond to both while LEC, CA1, and SUB were selective for novel stimuli, but the authors then go on to argue that novelty is encoded in the AON and PCx, but not in the LEC, CA1, and SUB.

      We appreciate the reviewer’s request for clarification. Throughout the brain areas we studied, odorant identity and experience can be decoded. However, the way information is represented is different between regions. We acknowledge that that “mixed” representation is a misleading term and removed it from the manuscript.

      In AON and aPCx, neurons significantly respond to both novel and familiar odors. However, the magnitude of their responses to novel and familiar odors is sufficiently distinct to allow for decoding of odor experience (i.e., whether an odor is novel or familiar). Moreover, novelty engages more neurons in encoding the stimulus (Figure 2D). In neural space, the position of an odor’s representation in AON and aPCx shifts depending on whether it is novel or familiar, meaning that experience modifies the neural representation of odor identity. This suggests that in these regions the two representations are intertwined.

      In contrast, some neurons in LEC, CA1, and SUB exhibit responses to novel odors, but few neurons respond to familiar odors at all. This suggests a more selective encoding of novelty.

      (6) Lines 132-140 - As presented in the text and the figure, this section is poorly written and confusing. Their use of the word "shuffled" is a major source of this confusion, because this typically is the control that produces outcomes at the chance level. More importantly, they did the wrong analysis here. The better and, I think, the only way to do this analysis correctly is to train on some of the odors and test on an untrained odor (i.e., what Bernardi et al., 2021 called "cross-condition generalization performance"; CCGP).

      We appreciate the feedback and thank the reviewer for the recommendation to implement cross-condition generalization performance (CCGP) as used in Bernardi et al., 2020. We acknowledge that the term "shuffled" may have caused confusion, as it typically refers to control analyses producing chance-level outcomes. In our case, by "shuffling" we shuffled the identity of novel and familiar odors to assess how much the decoder relies on odor identity when distinguishing novelty. This test provided insight into how novelty-based structure exists within neural activity beyond random grouping but does not directly assess generalization.

      As suggested, we used CCGP to measure how well novelty-related representations generalize across different odors. Our findings show that in AON and aPCx, novelty-related information is indeed highly generalizable, supporting the idea that these regions encode novelty in a less odor-selective manner (Figure 2K).

      Reviewer #3 (Public review):

      In this manuscript, the authors investigate how odor-evoked neural activity is modulated by experience within the olfactory-hippocampal network. The authors perform extracellular recordings in the anterior olfactory nucleus (AON), the anterior piriform (aPCx) and lateral entorhinal cortex (LEC), the hippocampus (CA1), and the subiculum (SUB), in naïve mice and in mice repeatedly exposed to the same odorants. They determine the response properties of individual neurons and use population decoding analyses to assess the effect of experience on odor information coding across these regions.

      The authors' findings show that odor identity is represented in all recorded areas, but that the response magnitude and selectivity of neurons are differentially modulated by experience across the olfactory-hippocampal pathway.

      Overall, this work represents a valuable multi-region data set of odor-evoked neural activity. However, limitations in the interpretability of odor experience of the behavioral paradigm, and limitations in experimental design and analysis, restrict the conclusions that can be drawn from this study.

      Recommendations for the authors:

      Reviewer #1 (Recommendations for the authors):

      Some suggestions, in no particular order, to further improve the manuscript:

      (1) The example neuronal responses for CA1 and SUB in Figure 1 are not very inspiring. To my eyes, the odor period response is not that different from the baseline period. In general, a thorough characterization of firing rate properties during the odor period between the different brain regions would be informative.

      We thank the reviewer for this valuable feedback. We have replaced the example neurons from CA1 and SUB in Figure 1C. We further extended the characterization of firing rate properties, including a separate analysis of neurons i) significantly excited by odorants, ii) significantly inhibited by odorants and iii) not responsive to odorants. We added the analysis and corresponding discussion to the main manuscript (Figures 2C-E and lines 118-132)

      (2) For the summary in Figure 1, why not show neuronal responses as z-scored firing rates as opposed to auROC?

      We chose to use auROC instead of z-scored firing rates due to the non-normality of the dataset, which can distort results when using z-scores. Specifically, z-scoring can exaggerate small deviations in neurons with low responsiveness, potentially leading to misleading conclusions. auROC provides a more robust measure of response change that is less sensitive to these distortions because it does not assume any specific distribution. This approach has been used previously (e.g. Cohen et al. 2012, Nature).

      (3) To study novelty, the authors presented odorants that were not used during four days of habituation. But this design makes it hard to dissociate odor identity from novelty. Why not track the response of the same odorants during the habituation process itself?

      We respectfully disagree with the argument that using different stimuli as novel and familiar constitutes a confound in our analysis. In our study, we used multiple different, structurally dissimilar single molecule chemicals which were randomly assigned to novel and familiar categories in each animal. If individual stimuli did cause “drastic differences in evoked neural responses”, these would be evenly distributed between novel and familiar stimuli. It is therefore extremely unlikely that the clear differences we observed between novel and familiar conditions and between brain areas can be attributed to the contribution of individual stimuli, in particular given our analyses was performed at the population level. In fact, we observed that responses between novel and familiar conditions were qualitatively very similar in the short time window after odor onset (Figure 1G and H).

      Importantly, the goal of this study was to investigate the impact of long-term habituation over more than 4 days, rather than short term habituation during one behavioral session. However, tracking the activity of large numbers of neurons across multiple days presents a significant technical challenge, due to the difficulty of identifying stable single-unit recordings over extended periods of time with sufficient certainty. Tools that facilitate tracking have recently been developed (e.g. Yuan AX et al., Elife. 2024) and it will be interesting to apply them to our dataset in the future.

      (4) Since novel odors lead to greater sniffing and sniffing strongly influences firing rates in the olfactory system, the authors decided to focus on a 400 ms window with similar sniffing rates for both novel vs. familiar odors. Although I understand the rationale for this choice, I worry that this is too restrictive, and it may not capture the full extent of the phenomenology.

      Could the authors model the effect of sniffing on firing rates of individual neurons from the data, and then check whether the odor response for novel context can be fully explained just by increased sniffing or not?

      It is an interesting suggestion to extend the window of analysis and observe how responses evolve with sniffing (and other behavioral reactions). To address this, we added an additional figure to the supplementary material, showing the mean responses of all neurons to novel stimuli during the entire odor presentation window (Fig. S1B).

      As suggested, we further created a Generalized Linear Model (GLM) for the entire 2s odor stimulation period, incorporating sniffing and novelty as independent variables. As expected, sniffing had a dominant impact on firing rate in all brain areas. A smaller proportion of neurons was modulated by novelty or by the interaction between novelty x breathing, suggesting the entrainment of neural activity by sniffing during the response to novel odors. These results support our decision to focus the analysis on the early 400ms window in order to dissociate the effects of novelty and behavioral responses. Taken together, our results suggest that odorant responses are modulated by novelty early during odorant processing, whereas at later stages sniffing becomes the predominant factor driving firing (Figure S2C-D).

      (5) The authors conclude that aPCx has a subset of neurons dedicated to familiar odors based on the distribution of SVM weights in Figure 3D. To me, this is the weakest conclusion of the paper because although significant, the effect size is paltry; the central tendencies are hardly different for the two conditions in aPCx. Could the authors show the PSTHs of some of these neurons to make this point more convincing?

      We appreciate the reviewer’s concern regarding the effect size. To strengthen our conclusion, we now include PSTHs of representative neurons in the least 10% and best 10% of neuronal population based on the SVM analysis (Figures S3 and S4). We hope this provides more clarity and support for the interpretation that there is a subset of neurons in aPCx that show greater sensitivity to familiar odors, despite the relatively modest central tendency differences.

      In the revised manuscript, we discuss the effect size more explicitly in the text to provide context for its significance (lines 193 - 195).

      Reviewer #2 (Recommendations for the authors):

      (1) The authors only talk about "responsive" neurons. Does this include neurons whose activity increases significantly (activated) and neurons whose activity decreases (suppressed)?

      Yes, the term "responsive" refers to neurons whose activity either increases significantly (excited) or decreases (inhibited) in response to the odor stimuli. We performed additional analyses to characterize responses separately for the different groups (Figure 2C-E and lines 118-132).

      (2) Line 54 - The Schoonover paper doesn't show that cells lose their responses to odors, but rather that the population of cells that respond to odors changes with time. That is, population responses don't become more sparse

      The fact that “the population of cells that respond to odors changes with time”, implies that some neurons lose their responsiveness (e.g. unit 2 in Figure 1 of Schoonover et al., 2021), while others become responsive (e.g. unit 1 in Figure 1 of Schoonover et al., 2021). Frequent responses reduce drift rate (Figure 4 of Schoonover et al., 2021), thus fewer neurons loose or gain responsiveness. We have revised the manuscript to clarify this.

      (3) Line 104 - "Recurrent" is incorrectly used here. I think the authors mean "repeated" or something more like that.

      Thank you for pointing this out. We replaced "recurrent" with "repeated".

      (4) Figure 3D - What is the scale bar here?

      We apologize for the accidental omission. The scale bar was be added to Figure 3D in the revised version of the manuscript.

      (5) Line 377 - They say they lowered their electrodes to "200 um/s per second." This must be incorrect. Is this just a typo, or is it really 200 um/s, because that's really fast?

      Thank you for pointing this out. It was 20 to 60 um/s, the change has been made in the manuscript.

      (6) Line 431: The authors say they used auROC to calculate changes in firing rates (which I think is only shown in Figure 1D). Note that auROC measures the discriminability of two distributions, not the strength or change in the strength of response.

      Indeed we used auROC to measure the discriminability of firing between baseline and during stimulus response. We have corrected the wording in the methods.

      (7) Figure 1B: The anatomical locations of the five areas they recorded from are straightforward, and this figure is not hugely helpful. However, the reader would benefit tremendously by including an experimental schematic. As is, we needed to scour the text and methods sections to understand exactly what they did when.

      We thank the reviewer for this suggestion. We included an experimental schematic in the supplementary material.

      (8) Figure 1F(left): This plot is much less useful without showing a pre-odor window, even if only times after the odor onset were used for calculation alpha

      We appreciate this concern, however the goal of Figure 1F is to illustrate the meaning of the alpha value itself. We chose not to include a pre-odor window comparison to avoid confusing the reader.

      (9) Figure 2A: What are the bar plots above the raster plots? Are these firing rates? Are the bars overlaid or stacked? Where is the y-axis scale bar?

      The bar plots above the raster plots represent a histogram of the spike count/trials over time, with a bin width of 50 ms. These bars are overlaid on the raster plot. We will include a y-axis scale bar in the revised figure to clarify the presentation.

      (10) Figure 4G: This makes no sense. First, the Y axis is supposed to measure standard deviation, but the axis label is spikes/s. Second, if responses in the AON are much less reliable than responses in "deeper" areas, why is odor decoding in AON so much better than in the other areas?

      We acknowledge the error in the axis label, and we will correct it to indicate the correct units. AON has a larger response variability but also larger responses magnitudes, which can explain the higher decoding accuracy.

      (11) From the model and text, one predicts that the lifetime sparseness increases along the pathway. The authors should use this metric as well/instead of "odor selectivity" because of problems with arbitrary thresholding.

      We acknowledge that lifetime sparseness, often computed using lifetime kurtosis, can be an informative measure of selectivity. However, we believe it has limitations that make it less suitable for our analysis. One key issue is that lifetime sparseness does not account for the stability of responses across multiple presentations of the same stimulus. In contrast, our odor selectivity measure incorporates trial-to-trial variability by considering responses over 10 trials and assessing significance using a Wilcoxon test compared to baseline. While the choice of a p-value threshold (e.g., 0.05) is somewhat arbitrary, it is a widely accepted statistical convention. Additionally, lifetime sparseness does not account for excitatory and inhibitory responses. For example, if a neuron X is strongly inhibited by odor A, strongly excited by odor B, and unresponsive to odors C and D, lifetime sparseness would classify it as highly selective for odor B, without capturing its inhibitory selectivity for odor A. The lifetime sparseness will be higher than if X was simply unresponsive for A.

      Our odor selectivity measure addresses this by considering both excitation and inhibition as potential responses. Thus, while lifetime sparseness could provide a useful complementary perspective in another type of dataset, it does not fully capture the dynamics of odor selectivity here.

      Author response 1.

      Lifetime Kurtosis distribution per region.

      Reviewer #3 (Recommendations for the authors):

      Main points:

      (1) The authors use a non-associative learning paradigm - repeated odor exposure - to test how experience modulates odor responses along the olfactory-hippocampal pathway. While repeated odor exposure clearly modulates odor-evoked neural activity, the relevance of this modulation and its differential effect across different brain areas are difficult to assess in the absence of any behavioral read-outs.

      Our experimental paradigm involves a robust, reliable behavioral readout of non-associative learning. Novel olfactory stimuli evoke a well-characterized orienting reaction, which includes a multitude of physiological reactions, including exploratory sniffing, facial movements and pupil dilation (Modirshanechi et al., Trends Neuroscience 2023). In our study, we focused on exploration sniffing.

      Compared to associative learning, non-associative learning might have received less attention. However, it is critically important because it forms the foundation for how organisms adapt to their environment through experience without forming associations. This is highlighted by the fact that non-instrumental stimuli can be remembered in large number (Standing, 1973) and with remarkable detail (Brady et al., 2008). While non-associative learning can thus create vast, implicit memory of stimuli in the environment, it is unclear how stimulus representations reflect this memory. Our study contributes to answering this question. We describe the impact of experience on olfactory sensory representations and reveal a transformation of representations from olfactory cortical to hippocampal structures. Our findings also indicate that sensory responses to familiar stimuli persist within sensory cortical and hippocampal regions, even after spontaneous orienting behaviors habituated. Further studies involving experimental manipulation techniques are needed to elucidate the causal mechanisms underlying the formation of stimulus memory during non-associative learning.

      (2) The authors discuss the olfactory-hippocampal pathway as a transition from primary sensory (AON, aPCx) to associative areas (LEC, CA1, SUB). While this is reasonable, given the known circuit connectivity, other interpretations are possible. For example, AON, aPCx, and LEC receive direct inputs from the olfactory bulb ('primary cortex'), while CA1 and SUB do not; AON receives direct top-down inputs from CA1 ('associative cortex'), while aPCx does not. In fact, the data presented in this manuscript does not appear to support a consistent, smooth transformation from sensory to associative, as implied by the authors (e.g. Figure 4A, F, and G).

      Thank you for this insightful comment. Indeed, there are complexities in the circuitry, and the relationships between different areas are not linear. We believe that AON and aPCx are distinctly different from LEC, CA1 and SUB, as the latter areas have been shown to integrate multimodal sensory information. To avoid confusion due to definitions of what constitutes a “primary sensory” region, we adopted a more neutral description throughout the manuscript. We also removed the term “gradual” to describe the transition of neural representations from olfactory cortical to hippocampal areas.

      (3) The analysis of odor-evoked responses is focused on a 400 ms window to exclude differences in sniffing behavior. This window spans 200 ms before and after the first inhalation after odor onset. Inhalation onset initiates neural odor responses - why do the authors include neural data before inhalation onset?

      The reason to include a brief time window prior to odor onset is to account for what is often called “partical” sniffs. In our experimental setup, odor delivery is not triggered by the animal’s inhalation. Therefore, it can happen that an animal has just begun to inhale when the stimulus is delivered. In this case, the animal is exposed to odorant molecules prior to the first complete inhalation after odor onset. We acknowledge that this limits the temporal resolution of our measurements, but it does not affect the comparison of sensory representations between different brain areas.

      It would also be interesting to explore the effect of sniffing behavior (see point 2) on odor-evoked neural activity.

      Thank you for your comment, we performed additional analysis including a GLM to address this question (Figure S2C-D).

      Minor points:

      (4) Figure 2A represents raster plots for 2 neurons per area - it is unclear how to distinguish between the 2 neurons in the plots.

      Figure 2A shows one example neuron per brain area. Each neurons has two raster plot which indicate responses to either a novel (orange) or a familiar stimulus (blue). We have revised the figure caption for clarity.

      (5) Overall, axes should be kept consistent and labeled in more detail. For example, Figure 2H and I are difficult to compare, given that the y-axis changes and that decoding accuracies are difficult to estimate without additional marks on the y-axis.

      Axes are indeed different, because chance level decoding accuracy is different between those two figures. The decoding between novel and familiar odors has a chance level of 0.5, while chance level decoding odors is 0.1 (there are 10 odors to decode the identity from).

      (6) Some parts of the discussion seem only loosely related to the data presented in this manuscript. For example, the statement that 'AON rather than aPCx should be considered as the primary sensory cortex in olfaction' seems out of context. Similarly, it would be helpful to provide data on the stability of subpopulations of neurons tuned to familiar odors, rather than simply speculate that they could be stable. The authors could summarize more speculative statements in an 'Ideas and Speculation' subsection.

      Thank you for your comment. We appreciate your perspective on our hypotheses. We have revised the discussion accordingly. Specifically, we removed the discussion of stable subpopulations, since we have not performed longitudinal tracking in this study.

      (7) The authors should try to reference relevant published work more comprehensively.

      Thank you for your comment. We attempted to include relevant published work without exceeding the limit for references but might have overseen important contributions. We apologize to our colleagues, whose relevant work might not have been cited.

    1. Author response:

      The following is the authors’ response to the original reviews.

      Public Reviews:

      Reviewer #1 (Public review):

      Summary:

      The main contributions of this paper are: (1) a replication of the surprising prior finding that information about peripherally-presented stimuli can be decoded from foveal V1 (Williams et al 2008), (2) a new demonstration of cross-decoding between stimuli presented in the periphery and stimuli presented at the fovea, (3) a demonstration that the information present in the fovea is based on shape not semantic category, and (4) a demonstration that the strength of foveal information about peripheral targets is correlated with the univariate response in the same block in IPS.

      Strengths:

      The design and methods appear sound, and finding (2) above is new, and importantly constrains our understanding of this surprising phenomenon. The basic effect investigated here is so surprising that even though it has been replicated several times since it was first reported in 2008, it is useful to replicate it again.

      We thank the reviewer for their summary. While we agree with many points, we would like to respectfully push back on the notion that this work is a replication of Williams et al. (2008). What our findings share with those of Williams is a report of surprising decoding at the fovea without foveal stimulation. Beyond this similarity, we treat these as related but clearly separate findings, for the following reasons:

      (1) Foveal feedback, as shown by Williams et al. (2008) and others during fixation, was only observed during a shape discrimination task, specific to the presented stimulus. Control experiments without such a task (or a color-related task) did not show effects of foveal feedback. In contrast, in the present study, the participants’ task was merely to perform saccades towards stimuli, independently of target features. We thus show that foveal feedback can occur independently of a task related to stimulus features. This dissociation demonstrates that our study must be tapping into something different than reported by Williams.

      (2) In a related study, Kroell and Rolfs (2022, 2025) demonstrated a connection between foveal feedback and saccade preparation, including the temporal details of the onset of this effect before saccade execution, highlighting the close link of this effect to saccade preparation. Here we used a very similar behavioral task to capture this saccade-related effect in neural recordings and investigate how early it occurs and what its nature is. Thus, there is a clear motivation for this study in the context of eye movement preparation that is separate from the previous work by Williams.

      (3) Lastly, decoding in the experimental task was positively associated with activity in FEF and IPS, areas that have been reliably linked to saccade preparation. We have now also performed an additional analysis (see our response to Specific point 2 of Reviewer 2) showing that decoding in the control condition did not show the same association, further supporting the link of foveal feedback to saccade preparation. 

      Despite our emphasis on these critical differences in studies, covert peripheral attention, as required by the task in Williams et al., and saccade preparation in natural vision, as in our study, are tightly coupled processes. Indeed, the task in Williams et al. would, during natural vision, likely involve an eye movement to the peripheral target. While speculative, a parsimonious and ecologically valid explanation is that both ours and earlier studies involve eye movement preparation, for which execution is suppressed, however, in studies enforcing fixation (e.g., Williams et al., 2008). We now discuss this idea of a shared underlying mechanism more extensively in the revised manuscript (pg 8 ln 228-240). 

      Weaknesses:

      (1) The paper, including in the title ("Feedback of peripheral saccade targets to early foveal cortex") seems to assume that the feedback to foveal cortex occurs in conjunction with saccade preparation. However, participants in the original Williams et al (2008) paper never made saccades to the peripheral stimuli. So, saccade preparation is not necessary for this effect to occur. Some acknowledgement and discussion of this prior evidence against the interpretation of the effect as due to saccade preparation would be useful. (e.g., one might argue that saccade preparation is automatic when attending to peripheral stimuli.)

      We agree that the effects Williams et al. showed were not sufficiently discussed in the first version of this manuscript. To more clearly engage with these findings we now introduce saccade related foveal feedback (foveal prediction) and foveal feedback during fixation separately in the introduction (pg 2 ln 46-59).

      We further added another section in the discussion called “Foveal feedback during saccade preparation” in which we discuss how our findings are related to Williams et al. and how they differ (pg 8 ln 211-240). 

      As described in our previous response, we believe that our findings go beyond those described by Williams et al. (2008) and others in significant ways. However, during natural vision, the paradigm used by Williams et al. (2008) would likely be solved using an eye movement. Thus, while participants in Williams et al. (2008) did not execute saccades, it appears plausible that they have prepared saccades. Given the fact that covert peripheral attention and saccade preparation are tightly coupled processes (Kowler et al., 1995, Vis Res; Deubel & Schneider, 1996, Vis Res; Montagnini & Castet, 2007, J Vis; Rolfs & Carrasco, 2012, J Neurosci; Rolfs et al., 2011, Nat Neurosci), their results are parsimoniously explained by saccade preparation (but not execution) to a behaviorally relevant target.

      (2) The most important new finding from this paper is the cross-decodability between stimuli presented in the fovea and stimuli presented in the periphery. This finding should be related to the prior behavioral finding (Yu & Shim, 2016) that when a foveal foil stimulus identical to a peripheral target is presented 150 ms after the onset of the peripheral target, visual discrimination of the peripheral target is improved, and this congruency effect occurred even though participants did not consciously perceive the foveal stimulus (Yu, Q., & Shim, W. M., 2016). Modulating foveal representation can influence visual discrimination in the periphery (Journal of Vision, 16(3), 15-15).

      We thank the reviewer for highlighting this highly relevant reference. In the revised version of the manuscript, we now put more emphasis on the finding of cross-decodability (pg 2 ln 60-61). We now also discuss Yu et al.’s finding, which support our conclusion that foveal feedback and direct stimulus presentation share representational formats in early visual areas (pg 9 ln 277-279).

      (3) The prior literature should be laid out more clearly. For example, most readers will not realize that the basic effect of decodability of peripherally-presented stimuli in the fovea was first reported in 2008, and that that original paper already showed that the effect cannot arise from spillover effects from peripheral retinotopic cortex because it was not present in a retinotopic location between the cortical locus corresponding to the peripheral target and the fovea. (For example, this claim on lines 56-57 is not correct: "it remains unknown 1) whether information is fed back all the way to early visual areas".) What is needed is a clear presentation of the prior findings in one place in the introduction to the paper, followed by an articulation and motivation of the new questions addressed in this paper. If I were writing the paper, I would focus on the cross-decodability between foveal and peripheral stimuli, as I think that is the most revealing finding.

      We agree that the structure of the introduction did not sufficiently place our work in the context of prior literature. We have now expanded upon our Introduction section to discuss past studies of saccade- and fixation-related foveal feedback (pg 2 ln 49-59), laying out how this effect has been studied previously. We also removed the claim that "it remains unknown 1) whether information is fed back all the way to early visual areas", where our intention was to specifically focus on foveal prediction. We realize that this was not clear and hence removed this section. Instead, we now place a stronger focus on the cross-decodability finding (pg 2 ln 60-61).

      Reviewer #2 (Public review):

      Summary:

      This study investigated whether the identity of a peripheral saccade target object is predictively fed back to the foveal retinotopic cortex during saccade preparation, a critical prediction of the foveal prediction hypothesis proposed by Kroell & Rolfs (2022). To achieve this, the authors leveraged a gaze-contingent fMRI paradigm, where the peripheral saccade target was removed before the eyes landed near it, and used multivariate decoding analysis to quantify identity information in the foveal cortex. The results showed that the identity of the saccade target object can be decoded based on foveal cortex activity, despite the fovea never directly viewing the object, and that the foveal feedback representation was similar to passive viewing and not explained by spillover effects. Additionally, exploratory analysis suggested IPS as a candidate region mediating such foveal decodability. Overall, these findings provide neural evidence for the foveal cortex processing the features of the saccade target object, potentially supporting the maintenance of perceptual stability across saccadic eye movements.

      Strengths:

      This study is well-motivated by previous theoretical findings (Kroell & Rolfs, 2022), aiming to provide neural evidence for a potential neural mechanism of trans-saccadic perceptual stability. The question is important, and the gaze-contingent fMRI paradigm is a solid methodological choice for the research goal. The use of stimuli allowing orthogonal decoding of stimulus category vs stimulus shape is a nice strength, and the resulting distinctions in decoded information by brain region are clean. The results will be of interest to readers in the field, and they fill in some untested questions regarding pre-saccadic remapping and foveal feedback.

      We thank the reviewer for the positive assessment of our study.

      Weaknesses:

      The conclusions feel a bit over-reaching; some strong theoretical claims are not fully supported, and the framing of prior literature is currently too narrow. A critical weakness lies in the inability to test a distinction between these findings (claiming to demonstrate that "feedback during saccade preparation must underlie this effect") and foveal feedback previously found during passive fixation (Williams et al., 2008). Discussions (and perhaps control analysis/experiments) about how these findings are specific to the saccade target and the temporal constraints on these effects are lacking. The relationship between the concepts of foveal prediction, foveal feedback, and predictive remapping needs more thorough treatment. The choice to use only 4 stimuli is justified in the manuscript, but remains an important limitation. The IPS results are intriguing but could be strengthened by additional control analysis. Finally, the manuscript claims the study was pre-registered ("detailing the hypotheses, methodology, and planned analyses prior to data collection"), but on the OSF link provided, there is just a brief summary paragraph, and the website says "there have been no completed registrations of this project".

      We thank the reviewer for these helpful considerations. We agree that some of the claims were not sufficiently supported by the evidence, and in the revised manuscript, we added nuance to those claims (pg 8 ln 211-240). Furthermore, we now address more directly the distinction between foveal feedback during fixation and foveal feedback (foveal prediction) during saccade preparation. In particular, we now describe the literature about these two effects separately in the introduction (pg 2 ln 46-59), and we have added a new section in the discussion (“Foveal feedback during saccade preparation”) that more thoroughly explains why a passive fixation condition would have been unlikely to produce the same results we find (pg 8 ln 211-227). We also adapted the section about “Saccadic remapping or foveal prediction”, clearly delineating foveal prediction from feature remapping and predictive updating of attention pointers. As recommended by the reviewer, we conducted the parametric modulation analyses on the control condition, strengthening the claim that our findings are saccade-related. These results were added as Supplementary Figure 2 and are discussed in (pg 7 ln 190-191) and (pg 8 ln 224-227). 

      Lastly, we would like to apologize about a mistake we made with the pre-registration. We realized that the pre-registration had indeed not been submitted. We have now done so without changing the pre-registration itself, which can be seen from the recent activity of the preregistration (screenshot attached in the end). After consulting an open science expert at the University of Leipzig, we added a note of this mistake to the methods section of the revised manuscript (pg 10 ln 326-332). We could remove reference to this preregistration altogether, but would keep it at the discretion of the editor. 

      Specifics:

      (1) In the eccentricity-dependent decoding results (Figure 2B), are there any statistical tests to support the results being a U-shaped curve? The dip isn't especially pronounced. Is 4 degrees lower than the further ones? Are there alternative methods of quantifying this (e.g., fitting it to a linear and quadratic function)?

      We statistically tested the U-shaped relationship using a weighted quadratic regression, which showed significant positive curvature for decoding between fovea and periphery in all early visual areas (V1: t(27) = 3.98, p = 0.008, V2: t(27) = 3.03, p = 0.02, V3: t(27)= 2.776, p = 0.025, one-sided). We now report these results in the revised manuscript (pg 5 ln 137-138).

      (2) In the parametric modulation analysis, the evidence for IPS being the only region showing stronger fovea vs peripheral beta values was weak, especially given the exploratory nature of this analysis. The raw beta value can reflect other things, such as global brain fluctuations or signal-to-noise ratio. I would also want to see the results of the same analysis performed on the control condition decoding results.

      We appreciate the reviewer’s suggestion and repeated the same parametric modulation analysis on the control condition to assess the influence of potential confounds on the overall beta values (Supplementary Figure 2). The results show a negative association between foveal decoding and FEF and IPS (likely because eye movements in the control condition lead to less foveal presentation of the stimulus) and a positive association with LO. Peripheral decoding was not associated with significant changes in any of the ROIs, indicating that global brain fluctuations alone are not responsible for the effects reported in the experimental condition. The results of this analysis thus show a specific positive association of IPS activity with the experimental condition, not the control condition, which is in line with the idea that the foveal feedback effect reported in this study may be related to saccade preparation.

      (3) Many of the claims feel overstated. There is an emphasis throughout the manuscript (including claims in the abstract) that these findings demonstrate foveal prediction, specifically that "image-specific feedback during saccade preparation must underlie this effect." To my understanding, one of the key aspects of the foveal prediction phenomenon that ties it closely to trans-saccadic stability is its specificity to the saccade target but not to other objects in the environment. However, it is not clear to what degree the observed findings are specific to saccade preparation and the peripheral saccade target. Should the observers be asked to make a saccade to another fixation location, or simply maintain passive fixation, will foveal retinotopic cortex similarly contain the object's identity information? Without these control conditions, the results are consistent with foveal prediction, but do not definitively demonstrate that as the cause, so claims need to be toned down.

      We fully agree with the reviewer and toned down claims about foveal prediction. We engage with the questions raised by the reviewer more thoroughly in the new discussion section “Foveal feedback during saccade preparation”.

      In addition, we agree that another condition in which subjects make a saccade towards a different location would have been a great addition that we also considered, but due to concerns with statistical power did not add. While including such a condition exceeds the scope of the current study, we included this limitation in the Discussion section (pg 10 ln 316) and hope that future studies will address this question.

      (4) Another critical aspect is the temporal locus of the feedback signal. In the paradigm, the authors ensured that the saccade target object was never foveated via the gaze-contingent procedure and a conservative data exclusion criterion, thus enabling the test of feedback signals to foveal retinotopic cortex. However, due to the temporal sluggishness of fMRI BOLD signals, it is unclear when the feedback signal arrives at the foveal retinotopic cortex. In other words, it is possible that the feedback signal arrives after the eyes land at the saccade target location. This possibility is also bolstered by Chambers et al. (2013)'s TMS study, where they found that TMS to the foveal cortex at 350-400 ms SOA interrupts the peripheral discrimination task. The authors should qualify their claims of the results occurring "during saccade preparation" (e.g., pg 1 ln 22) throughout the manuscript, and discuss the importance of temporal dynamics of the effect in supporting stability across saccades.

      We fully agree that the sluggishness of the fMRI signal presents an important challenge in investigating foveal feedback. We have now included this limitation in the discussion (pg 10 ln 306-318). We also clarify that our argument connects to previous studies investigating the temporal dynamics of foveal feedback using similar tasks (pg 10 ln 313-316). Specifically, in their psychophysical work, Kroell and Rolfs (2022) and (2025) showed that foveal feedback occurs before saccade execution with a peak around 80 ms before the eye movement. 

      (5) Relatedly, the claims that result in this paradigm reflect "activity exclusively related to predictive feedback" and "must originate from predictive rather than direct visual processes" (e.g., lines 60-65 and throughout) need to be toned down. The experimental design nicely rules out direct visual foveal stimulation, but predictive feedback is not the only alternative to that. The activation could also reflect mental imagery, visual working memory, attention, etc. Importantly, the experiment uses a block design, where the same exact image is presented multiple times over the block, and the activation is taken for the block as a whole. Thus, while at no point was the image presented at the fovea, there could still be more going on than temporally-specific and saccade-specific predictive feedback.

      We agree that those claims could have misled the reader. Our intention was to state that the activation originates from feedback rather than direct foveal stimulation because of the nature of the design. We have now clarified these statements (pg 2 ln 65) and also included a discussion of other effects including imagery and working memory in the limitations section (pg 10 ln 306-313).

      (6) The authors should avoid using the terms foveal feedback and foveal prediction interchangeably. To me, foveal feedback refers to the findings of Williams et al. (2008), where participants maintained passive fixation and discriminated objects in the periphery (see also Fan et al., 2016), whereas foveal prediction refers to the neural mechanism hypothesized by Kroell & Rolfs (2022), occurring before a saccade to the target object and contains task irrelevant feature information.

      We agree, and we have now adopted a clearer distinction between these terms, referring to foveal prediction only when discussing the distinct predictive nature of the effect discovered by Kroell and Rolfs (2022). Otherwise we referred to this effect as foveal feedback.

      (7) More broadly, the treatment of how foveal prediction relates to saccadic remapping is overly simplistic. The authors seem to be taking the perspective that remapping is an attentional phenomenon marked by remapping of only attentional/spatial pointers, but this is not the classic or widely accepted definition of remapping. Within the field of saccadic remapping, it is an ongoing debate whether (/how/where/when) information about stimulus content is remapped alongside spatial location (and also whether the attentional pointer concept is even neurophysiologically viable). This relationship between saccadic remapping and foveal prediction needs clarification and deeper treatment, in both the introduction and discussion.

      We thank the reviewer for their remarks. We reformulated the discussion section on “Saccadic remapping or foveal prediction” to include the nuances about spatial and feature remapping laid out in the reviewer’s comment (pg 8-9 ln 241-269). We also put a stronger focus on the special role the fovea seems to be playing regarding the feedback of visual features (pg 8-9 ln 265-269).

      (8) As part of this enhanced discussion, the findings should be better integrated with prior studies. E.g., there is some evidence for predictive remapping inducing integration of non-spatial features (some by the authors themselves; Harrison et al., 2013; Szinte et al., 2015). How do these findings relate to the observed results? Can the results simply be a special case of non-spatial feature integration between the currently attended and remapped location (fovea)? How are the results different from neurophysiological evidence for facilitation of the saccade target object's feature across the visual field (Burrow et al., 2014)? How might the results be reconciled with a prior fMRI study that failed to find decoding of stimulus content in remapped responses (Lescroart et al, 2016)? Might this reflect a difference between peripheral-to-peripheral vs peripheral-to-foveal remapping? A recent study by Chiu & Golomb (2025) provided supporting evidence for peripheral-to-fovea remapping (but not peripheral-to-peripheral remapping) of object-location binding (though in the post-saccadic time window), and suggested foveal prediction as the underlying mechanism.

      We thank the reviewer for raising these intriguing questions. We now address them in the revised discussion. We argue that the findings by Harrison et al., 2013 and Szinte et al., 2015 of presaccadic integration of features across two peripheral locations can be explained by presaccadic updating of spatial attention pointers rather than remapping of feature information (pg 8 ln 248-253). The lack of evidence for periphery-to-periphery remapping (Lescroart et al, 2016) and the recent study by Chiu & Golomb (2025) showing object-location binding from periphery to fovea nicely align with our characterization of foveal processing as unique in predicting feature information of upcoming stimuli (pg 8-9 ln 265-269). Finally, we argue that the global (i.e., space-invariant) selection task-irrelevant saccadic target features (Burrows et al., 2014) is well-established at the neural level, but does not suffice to explain the spatially specific nature of foveal prediction (pg 8 ln 220-224). We now include these studies in the revised discussion section.

      Reviewer #3 (Public review):

      Summary:

      In this paper, the authors used fMRI to determine whether peripherally viewed objects could be decoded from the foveal cortex, even when the objects themselves were never viewed foveally. Specifically, they investigated whether pre-saccadic target attributes (shape, semantic category) could be decoded from the foveal cortex. They found that object shape, but not semantic category, could be decoded, providing evidence that foveal feedback relies on low-mid-level information. The authors claim that this provides evidence for a mechanism underlying visual stability and object recognition across saccades.

      Strengths:

      I think this is another nice demonstration that peripheral information can be decoded from / is processed in the foveal cortex - the methods seem appropriate, and the experiments and analyses are carefully conducted, and the main results seem convincing. The paper itself was very clear and well-written.

      We thank the reviewer for this positive evaluation of our work. As discussed in our response to Reviewer 1, we now elaborate on the differences between previous work showing decoding of peripheral information from foveal cortex from the effect shown here. While there are important similarities between these findings, foveal prediction in our study occurs in a saccade condition and in the absence of a task that is specific to stimulus features. 

      Weaknesses:

      There are a couple of reasons why I think the main theoretical conclusions drawn from the study might not be supported, and why a more thorough investigation might be needed to draw these conclusions.

      (1) The authors used a blocked design, with each object being shown repeatedly in the same block. This meant that the stimulus was entirely predictable on each block, which weakens the authors' claims about this being a predictive mechanism that facilitates object recognition - if the stimulus is 100% predictable, there is no aspect of recognition or discrimination actually being tested. I think to strengthen these claims, an experiment would need to have unpredictable stimuli, and potentially combine behavioural reports with decoding to see whether this mechanism can be linked to facilitating object recognition across saccades.

      We appreciate the reviewer’s point and would like to highlight that it was not our intention to claim a behavioral effect on object recognition. We believe that an ambiguous formulation in the original abstract may have been interpreted this way, and we thus removed this reference. We also speculated in our Discussion that a potential reason for foveal prediction could be a headstart in peripheral object recognition and in the revised manuscript more clearly highlight that this is a  potential future direction only.

      (2)  Given that foveal feedback has been found in previous studies that don't incorporate saccades, how is this a mechanism that might specifically contribute to stability across saccades, rather than just being a general mechanism that aids the processing/discrimination of peripherally-viewed stimuli? I don't think this paper addresses this point, which would seem to be crucial to differentiate the results from those of previous studies.

      We fully agree that this point had not been sufficiently addressed in the previous version of the manuscript. As described in our responses to similar comments from reviewers 1 and 2, we included an additional section in the Discussion (“Foveal feedback during saccade preparation”) to more clearly delineate the present study from previous findings of foveal feedback. Previous studies (Williams et al., 2008) only found foveal feedback during narrow discrimination tasks related to spatial features of the target stimulus, not during color-discrimination or fixation-only tasks, concluding that the observed effect must be related to the discrimination behavior. In contrast, we found foveal feedback (as evidenced by decoding of target features) during a saccade condition that was independent of the target features, suggesting a different role of foveal feedback than hypothesized by Williams et al. (2008).

      Recommendations for the authors:  

      Reviewer #2 (Recommendations for the authors):

      (A) Minor comments:

      (1)  The task should be clarified earlier in the manuscript.

      We now characterise the task in the abstract and clarified its description in the third paragraph, right after introducing the main literature.

      (2) Is there actually only 0.5 seconds between saccades? This feels very short/rushed.

      The inter-trial-interval was 0.5 seconds, though effectively it varied because the target only appeared once participants fixated on the fixation dot. Note that this pacing is slower than the rate of saccades in natural vision (about 3 to 4 saccades per second).Participants did not report this paradigm as rushed.

      (3) Typo on pg2 ln64 (whooe).

      Fixed.

      (4)  Can the authors also show individual data points for Figures 3 and 4?

      We added individual data points for Figures 4 and S2

      (5) The MNI coordinates on Figure 4A seem to be incorrect.

      We took out those coordinates.

      (6) Pg4 ln126 and pg6 ln194, why cite Williams et al. (2008)?

      We included this reference here to acknowledge that Williams et al. raised the same issues. We added a “cf.” before this reference to clarify this.

      (7) Pg7 ln207 Fabius et al. (2020) showed slow post-saccadic feature remapping, rather than predictive remapping of spatial attention.

      We have corrected this mistake.

      (8) The OSF link is valid, but I couldn't find a pre-registration.

      The issue with the OSF link has been resolved. The pre-registration had been set up but not published. We now published it without changing the original pre-registration (see the screenshot attached).

      (9) I couldn't access the OpenNeuro repository.

      The issue with the OpenNeuro link has been resolved.

      (B) Additional references you may wish to include:

      (1) Burrows, B. E., Zirnsak, M., Akhlaghpour, H., Wang, M., & Moore, T.  (2014). Global selection of saccadic target features by neurons in area v4. Journal of Neuroscience.

      (2) Chambers, C. D., Allen, C. P., Maizey, L., & Williams, M. A. (2013). Is delayed foveal feedback critical for extra-foveal perception?. Cortex.

      (3) Chiu, T. Y., & Golomb, J. D. (2025). The influence of saccade target status on the reference frame of object-location binding. Journal of Experimental Psychology. General.

      (4) Harrison, W. J., Retell, J. D., Remington, R. W., & Mattingley, J. B. (2013). Visual crowding at a distance during predictive remapping. Current Biology.

      (5) Lescroart, M. D., Kanwisher, N., & Golomb, J. D. (2016). No evidence for automatic remapping of stimulus features or location found with fMRI. Frontiers in Systems Neuroscience.

      (6) Moran, C., Johnson, P. A., Hogendoorn, H., & Landau, A. N. (2025). The representation of stimulus features during stable fixation and active vision. Journal of Neuroscience.

      (7) Szinte, M., Jonikaitis, D., Rolfs, M., Cavanagh, P., & Deubel, H. (2016). Presaccadic motion integration between current and future retinotopic locations of attended objects. Journal of Neurophysiology.

      We thank the reviewer for pointing out these references. We have included them in the revised version of the manuscript.

      Reviewer #3 (Recommendations for the authors):

      I just have a few minor points where I think some clarifications could be made.

      (1) Line 64 - "whooe" should be "whoose" I think.

      Fixed.

      (2) Around line 53 - you might consider citing this review on foveal feedback - https://doi.org/10.1167/jov.20.12.2

      We included the reference (pg 2 ln 55).

      (3) Line 129 - you mention a u-shaped relationship for decoding - I wasn't quite sure of the significance/relevance of this relationship - it would be helpful to expand on this / clarify what this means.

      We have expanded this section and added statistical tests of the u-shaped relationship in decoding using a weighted quadratic regression. We found significant positive curvature in all early visual areas between fovea and periphery (V1: t(27) = 3.98, p = 0.008, V2: t(27) = 3.03, p = 0.02, V3: t(27)= 2.776, p = 0.025). These findings support a u-shaped relationship. We now report these results in the revised manuscript (pg 5 ln 137-138).

      (4) Figure 1 - it would be helpful to indicate how long the target was viewed in the "stim on" panels - I assume it was for the saccade latency, but it would be good to include those values in the main text.

      We included that detail in the text (pg 3 ln 96-97).

    1. Author response:

      The following is the authors’ response to the current reviews.

      Public Reviews:

      Reviewer #1 (Public review):

      Summary:

      This study examines whether changes in pupil size index prediction-error-related updating during associative learning, formalised as information gain via Kullback-Leibler (KL) divergence. Across two independent tasks, pupil responses scaled with KL divergence shortly after feedback, with the timing and direction of the response varying by task. Overall, the work supports the view that pupil size reflects information-theoretic processes in a context-dependent manner.

      Strengths:

      This study provides a novel and convincing contribution by linking pupil dilation to informationtheoretic measures, such as KL divergence, supporting Zénon's hypothesis that pupil responses reflect information gain during learning. The robust methodology, including two independent datasets with distinct task structures, enhances the reliability and generalisability of the findings. By carefully analysing early and late time windows, the authors capture the timing and direction of prediction-error-related responses, oPering new insights into the temporal dynamics of model updating. The use of an ideal-learner framework to quantify prediction errors, surprise, and uncertainty provides a principled account of the computational processes underlying pupil responses. The work also highlights the critical role of task context in shaping the direction and magnitude of these ePects, revealing the adaptability of predictive processing mechanisms. Importantly, the conclusions are supported by rigorous control analyses and preprocessing sanity checks, as well as convergent results from frequentist and Bayesian linear mixed-ePects modelling approaches.

      Weaknesses:

      Some aspects of directionality remain context-dependent, and on current evidence cannot be attributed specifically to whether average uncertainty increases or decreases across trials. DiPerences between the two tasks (e.g., sensory modality and learning regime) limit direct comparisons of ePect direction and make mechanistic attribution cautious. In addition, subjective factors such as confidence were not measured and could influence both predictionerror signals and pupil responses. Importantly, the authors explicitly acknowledge these limitations, and the manuscript clearly frames them as areas for future work rather than settled conclusions.

      Reviewer #2 (Public review):

      Summary:

      The authors investigate whether pupil dilation reflects information gain during associative learning, formalised as Kullback-Leibler divergence within an ideal observer framework. They examine pupil responses in a late time window after feedback and compare these to informationtheoretic estimates (information gain, surprise, and entropy) derived from two diPerent tasks with contrasting uncertainty dynamics.

      Strength:

      The exploration of task evoked pupil dynamics beyond the immediate response/feedback period and then associating them with model estimates was interesting and inspiring. This oPered a new perspective on the relationship between pupil dilation and information processing.

      Weakness:

      However, the interpretability of the findings remains constrained by the fundamental diPerences between the two tasks (stimulus modality, feedback type, and learning structure), which confound the claimed context-dependent ePects. The later time-window pupil ePects, although intriguing, are small in magnitude and may reflect residual noise or task-specific arousal fluctuations rather than distinct information-processing signals. Thus, while the study oPers valuable methodological insight and contributes to ongoing debates about the role of the pupil in cognitive inference, its conclusions about the functional significance of late pupil responses should be treated with caution.

      Reviewer #3 (Public review):

      Summary:

      Thank you for inviting me to review this manuscript entitled "Pupil dilation oPers a time-window on prediction error" by Colizoli and colleagues. The study examines prediction errors, information gain (Kullback-Leibler [KL] divergence), and uncertainty (entropy) from an information-theory perspective using two experimental tasks and pupillometry. The authors aim to test a theoretical proposal by Zénon (2019) that the pupil response reflects information gain (KL divergence). The conclusion of this work is that (post-feedback) pupil dilation in response to information gain is context dependent.

      Strengths:

      Use of an established Bayesian model to compute KL divergence and entropy.

      Pupillometry data preprocessing and multiple robustness checks.

      Weaknesses:

      Operationalization of prediction errors based on frequency, accuracy, and their interaction:

      The authors rely on a more model-agnostic definition of the prediction error in terms of stimulus frequency ("unsigned prediction error"), accuracy, and their interaction ("signed prediction error"). While I see the point, I would argue that this approach provides a simple approximation of the prediction error, but that a model-based approach would be more appropriate.

      Model validation:

      My impression is that the ideal learner model should work well in this case. However, the authors don't directly compare model behavior to participant behavior ("posterior predictive checks") to validate the model. Therefore, it is currently unclear if the model-derived terms like KL divergence and entropy provide reasonable estimates for the participant data.

      Lack of a clear conclusion:

      The authors conclude that this study shows for the first time that (post-feedback) pupil dilation in response to information gain is context dependent. However, the study does not oPer a unifying explanation for such context dependence. The discussion is quite detailed with respect to taskspecific ePects, but fails to provide an overarching perspective on the context-dependent nature of pupil signatures of information gain. This seems to be partly due to the strong diPerences between the experimental tasks.

      Recommendations for the authors:

      Reviewer #1 (Recommendations for the authors):

      I highly appreciate the care and detail in the authors' response and thank them for the ePort invested in revising the manuscript. They addressed the core concerns to a high standard, and the manuscript has substantially improved in methodological rigour (through additional controls/sanity checks and complementary mixed-ePects analyses) and in clarity of interpretation (by explicitly acknowledging context-dependence and tempering stronger claims). The present version reads clearly and is much strengthened overall. I only have a few minor points below:

      Minor suggestions:

      Abstract:

      In the abstract KL is introduced as abbreviation, but at first occurence it should be written out as "Kullback-Leibler (KL)" for readers not familiar with it.

      We thank the reviewer for catching this error. It has been correct in the version of record.

      Methods:

      I appreciate the additional bayesian LME analysis. I only had a few things that I thought were missing from knowing the parameters: 1) what was the target acceptance rate (default of .95?), 2) which family was used to model the response distribution: (default) "gaussian" or robust "student-t"? Depending on the data a student-t would be preferred, but since the author's checked the fit & the results corroborate the correlation analysis, using the default would also be fine! Just add the information for completeness.

      Thank you for bringing this to our attention. We have now noted that default parameters were used in all cases unless otherwise mentioned. 

      Thank you once again for your time and consideration.

      Reviewer #2 (Recommendations for the authors):

      Thanks to the authors' ePort on revision. I am happy with this new version of manuscript.

      Thank you once again for your time and consideration.

      Reviewer #3 (Recommendations for the authors):

      (1) Regarding comments #3 and #6 (first round) on model validation and posterior predictive checks, the authors replied that since their model is not a "generative" one, they can't perform posterior predictive checks. Crucially, in eq. 2, the authors present the p{tilde}^j_k variable denoting the learned probability of event k on trial j. I don't see why this can't be exploited for simulations. In my opinion, one could (and should) generate predictions based on this variable. The simplest implementation would translate the probability into a categorical choice (w/o fitting any free parameter). Based on this, they could assess whether the model and data are comparable.

      We thank the reviewer for this clarification. The reviewer suggests using the probability distributions at each trial to predict which event should be chosen on each trial. More specifically, the event(s) with the highest probability on trial j could be used to generate a prediction for the choice of the participant on trial j. We agree that this would indeed be an interesting analysis. However, the response options of each task are limited to two-alternatives. In the cue-target task, four events are modeled (representing all possible cue-target conditions) while the participants’ response options are only “left” and “right”. Similarly, in the letter-color task, 36 events are modeled while the participants’ response options are “match” and “no-match”. In other words, we do not know which event (either four or 36, for the two tasks) the participant would have indicated on each trial. As an approximation to this fine-grained analysis, we investigated the relationship between the information-theoretic variables separately for error and correct trials. Our rationale was that we would have more insight into how the model fits depended on the participants’ actual behavior as compared with the ideal learner model.

      (2) I recommend providing a plot of the linear mixed model analysis of the pupil data. Currently, results are only presented in the text and tables, but a figure would be much more useful.

      We thank the reviewer for the suggestion to add a plot of the linear mixed model results. We appreciate the value of visualizing model estimates; however, we feel that the current presentation in the text and tables clearly conveys the relevant findings. For this reason, and to avoid further lengthening the manuscript, we prefer to retain the current format.

      (3) I would consider only presenting the linear mixed ePects for the pupil data in the main results, and the correlation results in the supplement. It is currently quite long.

      We thank the reviewer for this recommendation. We agree that the results section is detailed; however, we consider the correlation analyses to be integral to the interpretation of the pupil data and therefore prefer to keep them in the main text rather than move them to the supplement.


      The following is the authors’ response to the original reviews

      eLife Assessment

      This important study seeks to examine the relationship between pupil size and information gain, showing opposite effects dependent upon whether the average uncertainty increases or decreases across trials. Given the broad implications for learning and perception, the findings will be of broad interest to researchers in cognitive neuroscience, decision-making, and computational modelling. Nevertheless, the evidence in support of the particular conclusion is at present incomplete - the conclusions would be strengthened if the authors could both clarify the differences between model-updating and prediction error in their account and clarify the patterns in the data.

      Public Reviews:

      Reviewer #1 (Public review):

      Summary:

      This study investigates whether pupil dilation reflects prediction error signals during associative learning, defined formally by Kullback-Leibler (KL) divergence, an information-theoretic measure of information gain. Two independent tasks with different entropy dynamics (decreasing and increasing uncertainty) were analyzed: the cue-target 2AFC task and the lettercolor 2AFC task. Results revealed that pupil responses scaled with KL divergence shortly after feedback onset, but the direction of this relationship depended on whether uncertainty (entropy) increased or decreased across trials. Furthermore, signed prediction errors (interaction between frequency and accuracy) emerged at different time windows across tasks, suggesting taskspecific temporal components of model updating. Overall, the findings highlight that pupil dilation reflects information-theoretic processes in a complex, context-dependent manner.

      Strengths:

      This study provides a novel and convincing contribution by linking pupil dilation to informationtheoretic measures, such as KL divergence, supporting Zénon's hypothesis that pupil responses reflect information gained during learning. The robust methodology, including two independent datasets with distinct entropy dynamics, enhances the reliability and generalisability of the findings. By carefully analysing early and late time windows, the authors capture the temporal dynamics of prediction error signals, offering new insights into the timing of model updates. The use of an ideal learner model to quantify prediction errors, surprise, and entropy provides a principled framework for understanding the computational processes underlying pupil responses. Furthermore, the study highlights the critical role of task context - specifically increasing versus decreasing entropy - in shaping the directionality and magnitude of these effects, revealing the adaptability of predictive processing mechanisms.

      Weaknesses:

      While this study offers important insights, several limitations remain. The two tasks differ significantly in design (e.g., sensory modality and learning type), complicating direct comparisons and limiting the interpretation of differences in pupil dynamics. Importantly, the apparent context-dependent reversal between pupil constriction and dilation in response to feedback raises concerns about how these opposing effects might confound the observed correlations with KL divergence. 

      We agree with the reviewer’s concerns and acknowledge that the speculation concerning the directional effect of entropy across trials can not be fully substantiated by the current study. As the reviewer points out, the directional relationship between pupil dilation and information gain must be due to other factors, for instance, the sensory modality, learning type, or the reversal between pupil constriction and dilation across the two tasks. Also, we would like to note that ongoing experiments in our lab already contradict our original speculation. In line with the reviewer’s point, we noted these differences in the section on “Limitations and future research” in the Discussion. To better align the manuscript with the above mentioned points, we have made several changes in the Abstract, Introduction and Discussion summarized below: 

      We have removed the following text from the Abstract and Introduction: “…, specifically related to increasing or decreasing average uncertainty (entropy) across trials.”

      We have edited the following text in the Introduction (changes in italics) (p. 5):

      “We analyzed two independent datasets featuring distinct associative learning paradigms, one characterized by increasing entropy and the other by decreasing entropy as the tasks progressed. By examining these different tasks, we aimed to identify commonalities (if any) in the results across varying contexts. Additionally, the contrasting directions of entropy in the two tasks enabled us to disentangle the correlation between stimulus-pair frequency and information gain in the postfeedback pupil response.

      We have removed the following text from the Discussion:

      “…and information gain in fact seems to be driven by increased uncertainty.”

      “We speculate that this difference in the direction of scaling between information gain and the pupil response may depend on whether entropy was increasing or decreasing across trials.” 

      “…which could explain the opposite direction of the relationship between pupil dilation and information gain”

      “… and seems to relate to the direction of the entropy as learning progresses (i.e., either increasing or decreasing average uncertainty).” 

      We have edited the following texts in the Discussion (changes in italics):

      “For the first time, we show that the direction of the relationship between postfeedback pupil dilation and information gain (defined as KL divergence) was context dependent.” (p. 29):

      Finally, we have added the following correction to the Discussion (p. 30):

      “Although it is tempting to speculate that the direction of the relationship between pupil dilation and information gain may be due to either increasing or decreasing entropy as the task progressed, we must refrain from this conclusion. We note that the two tasks differ substantially in terms of design with other confounding variables and therefore cannot be directly compared to one another. We expand on these limitations in the section below (see Limitations and future research).”

      Finally, subjective factors such as participants' confidence and internal belief states were not measured, despite their potential influence on prediction errors and pupil responses.

      Thank you for the thoughtful comment. We agree with the reviewer that subjective factors, such as participants' confidence, can be important in understanding prediction errors and pupil responses. As per the reviewer’s point, we have included the following limitation in the Discussion (p. 33): 

      “Finally, while we acknowledge the potential relevance of subjective factors, such as the participants’ overt confidence reports, in understanding prediction errors and pupil responses, the current study focused on the more objective, model-driven measure of information-theoretic variables. This approach aligns with our use of the ideal learner model, which estimates information-theoretic variables while being agnostic about the observer's subjective experience itself. Future research is needed to explore the relationship between information-gain signals in pupil dilation and the observer’s reported experience of or awareness about confidence in their decisions.” 

      Reviewer #2 (Public review):

      Summary:

      The authors proposed that variability in post-feedback pupillary responses during the associative learning tasks can be explained by information gain, which is measured as KL divergence. They analysed pupil responses in a later time window (2.5s-3s after feedback onset) and correlated them with information-theory-based estimates from an ideal learner model (i.e., information gain-KL divergence, surprise-subjective probability, and entropy-average uncertainty) in two different associative decision-making tasks.

      Strength:

      The exploration of task-evoked pupil dynamics beyond the immediate response/feedback period and then associating them with model estimates was interesting and inspiring. This offered a new perspective on the relationship between pupil dilation and information processing.

      Weakness:

      However, disentangling these later effects from noise needs caution. Noise in pupillometry can arise from variations in stimuli and task engagement, as well as artefacts from earlier pupil dynamics. The increasing variance in the time series of pupillary responses (e.g., as shown in Figure 2D) highlights this concern.

      It's also unclear what this complicated association between information gain and pupil dynamics actually means. The complexity of the two different tasks reported made the interpretation more difficult in the present manuscript.

      We share the reviewer’s concerns. To make this point come across more clearly, we have added the following text to the Introduction (p. 5):

      “The current study was motivated by Zenon’s hypothesis concerning the relationship between pupil dilation and information gain, particularly in light of the varying sources of signal and noise introduced by task context and pupil dynamics. By demonstrating how task context can influence which signals are reflected in pupil dilation, and highlighting the importance of considering their temporal dynamics, we aim to promote a more nuanced and model-driven approach to cognitive research using pupillometry.”

      Reviewer #3 (Public review):

      Summary:

      This study examines prediction errors, information gain (Kullback-Leibler [KL] divergence), and uncertainty (entropy) from an information-theory perspective using two experimental tasks and pupillometry. The authors aim to test a theoretical proposal by Zénon (2019) that the pupil response reflects information gain (KL divergence). In particular, the study defines the prediction error in terms of KL divergence and speculates that changes in pupil size associated with KL divergence depend on entropy. Moreover, the authors examine the temporal characteristics of pupil correlates of prediction errors, which differed considerably across previous studies that employed different experimental paradigms. In my opinion, the study does not achieve these aims due to several methodological and theoretical issues.

      Strengths:

      (1)  Use of an established Bayesian model to compute KL divergence and entropy.

      (2)  Pupillometry data preprocessing, including deconvolution.

      Weaknesses:

      (1) Definition of the prediction error in terms of KL divergence:

      I'm concerned about the authors' theoretical assumption that the prediction error is defined in terms of KL divergence. The authors primarily refer to a review article by Zénon (2019): "Eye pupil signals information gain". It is my understanding that Zénon argues that KL divergence quantifies the update of a belief, not the prediction error: "In short, updates of the brain's internal model, quantified formally as the Kullback-Leibler (KL) divergence between prior and posterior beliefs, would be the common denominator to all these instances of pupillary dilation to cognition." (Zénon, 2019).

      From my perspective, the update differs from the prediction error. Prediction error refers to the difference between outcome and expectation, while update refers to the difference between the prior and the posterior. The prediction error can drive the update, but the update is typically smaller, for example, because the prediction error is weighted by the learning rate to compute the update. My interpretation of Zénon (2019) is that they explicitly argue that KL divergence defines the update in terms of the described difference between prior and posterior, not the prediction error.

      The authors also cite a few other papers, including Friston (2010), where I also could not find a definition of the prediction error in terms of KL divergence. For example [KL divergence:] "A non-commutative measure of the non-negative difference between two probability distributions." Similarly, Friston (2010) states: Bayesian Surprise - "A measure of salience based on the Kullback-Leibler divergence between the recognition density (which encodes posterior beliefs) and the prior density. It measures the information that can be recognized in the data." Finally, also in O'Reilly (2013), KL divergence is used to define the update of the internal model, not the prediction error.

      The authors seem to mix up this common definition of the model update in terms of KL divergence and their definition of prediction error along the same lines. For example, on page 4: "KL divergence is a measure of the difference between two probability distributions. In the context of predictive processing, KL divergence can be used to quantify the mismatch between the probability distributions corresponding to the brain's expectations about incoming sensory input and the actual sensory input received, in other words, the prediction error (Friston, 2010; Spratling, 2017)."

      Similarly (page 23): "In the current study, we investigated whether the pupil's response to decision outcome (i.e., feedback) in the context of associative learning reflects a prediction error as defined by KL divergence."

      This is problematic because the results might actually have limited implications for the authors' main perspective (i.e., that the pupil encodes prediction errors) and could be better interpreted in terms of model updating. In my opinion, there are two potential ways to deal with this issue:

      (a) Cite work that unambiguously supports the perspective that it is reasonable to define the prediction error in terms of KL divergence and that this has a link to pupillometry. In this case, it would be necessary to clearly explain the definition of the prediction error in terms of KL divergence and dissociate it from the definition in terms of model updating.

      (b) If there is no prior work supporting the authors' current perspective on the prediction error, it might be necessary to revise the entire paper substantially and focus on the definition in terms of model updating.

      We thank the reviewer for pointy out these inconsistencies in the manuscript and appreciate their suggestions for improvement. We take approach (a) recommended by the reviewer, and provide our reasoning as to why prediction error signals in pupil dilation are expected to correlate with information gain (defined as the KL divergence between posterior and prior belief distributions). This can be found in a new section in the introduction, copied here for convenience (p. 3-4):

      “We reasoned that the link between prediction error signals and information gain in pupil dilation is through precision-weighting. Precision refers to the amount of uncertainty (inverse variance) of both the prior belief and sensory input in the prediction error signals [6,64–67]. More precise prediction errors receive more weighting, and therefore, have greater influence on model updating processes. The precisionweighting of prediction error signals may provide a mechanism for distinguishing between known and unknown sources of uncertainty, related to the inherent stochastic nature of a signal versus insufficient information of the part of the observer, respectively [65,67,68]. In Bayesian frameworks, information gain is fundamentally linked to prediction error, modulated by precision [65,66,69–75]. In non-hierarchical Bayesian models, information gain can be derived as a function of prediction errors and the precision of the prior and likelihood distributions, a relationship that can be approximately linear [70]. In hierarchical Bayesian inference, the update in beliefs (posterior mean changes) at each level is proportional to the precision-weighted prediction error; this update encodes the information gained from new observations [65,66,69,71,72]. Neuromodulatory arousal systems are well-situated to act as precision-weighting mechanisms in line with predictive processing frameworks [76,77]. Empirical evidence suggests that neuromodulatory systems broadcast precisionweighted prediction errors to cortical regions [11,59,66,78]. Therefore, the hypothesis that feedback-locked pupil dilation reflects a prediction error signal is similarly in line with Zenon’s main claim that pupil dilation generally reflects information gain, through precision-weighting of the prediction error. We expected a prediction error signal in pupil dilation to be proportional to the information gain.”

      We have referenced previous work that has linked prediction error and information gain directly (p. 4): “The KL divergence between posterior and prior belief distributions has been previously considered to be a proxy of (precision-weighted) prediction errors [68,72].”

      We have taken the following steps to remedy this error of equating “prediction error” directly with the information gain.

      First, we have replaced “KL divergence” with “information gain” whenever possible throughout the manuscript for greater clarity. 

      Second, we have edited the section in the introduction defining information gain substantially (p. 4): 

      “Information gain can be operationalized within information theory as the KullbackLeibler (KL) divergence between the posterior and prior belief distributions of a Bayesian observer, representing a formalized quantity that is used to update internal models [29,79,80]. Itti and Baldi (2005)81 termed the KL divergence between posterior and prior belief distributions as “Bayesian surprise” and showed a link to the allocation of attention. The KL divergence between posterior and prior belief distributions has been previously considered to be a proxy of (precision-weighted) prediction errors[68,72]. According to Zénon’s hypothesis, if pupil dilation reflects information gain during the observation of an outcome event, such as feedback on decision accuracy, then pupil size will be expected to increase in proportion to how much novel sensory evidence is used to update current beliefs [29,63]. ” 

      Finally, we have made several minor textual edits to the Abstract and main text wherever possible to further clarify the proposed relationship between prediction errors and information gain.

      (2) Operationalization of prediction errors based on frequency, accuracy, and their interaction:

      The authors also rely on a more model-agnostic definition of the prediction error in terms of stimulus frequency ("unsigned prediction error"), accuracy, and their interaction ("signed prediction error"). While I see the point here, I would argue that this approach offers a simple approximation to the prediction error, but it is possible that factors like difficulty and effort can influence the pupil signal at the same time, which the current approach does not take into account. I recommend computing prediction errors (defined in terms of the difference between outcome and expectation) based on a simple reinforcement-learning model and analyzing the data using a pupillometry regression model in which nuisance regressors are controlled, and results are corrected for multiple comparisons.

      We agree with the reviewer’s suggestion that alternatively modeling the data in a reinforcement learning paradigm would be fruitful. We adopted the ideal learner model as we were primarily focused on Information Theory, stemming from our aim to test Zenon’s hypothesis that information gain drives pupil dilation. However, we agree with the reviewer that it is worthwhile to pursue different modeling approaches in future work. We have now included a complementary linear mixed model analysis in which we controlled for the effects of the information-theoretic variables on one another, while also including the nuisance regressors of pre-feedback baseline pupil dilation and reaction times (explained in more detail below in our response to your point #4). Results including correction for multiple comparisons was reported for all pupil time course data as detailed in Methods section 2.5. 

      (3) The link between model-based (KL divergence) and model-agnostic (frequency- and accuracy-based) prediction errors:

      I was expecting a validation analysis showing that KL divergence and model-agnostic prediction errors are correlated (in the behavioral data). This would be useful to validate the theoretical assumptions empirically.

      The model limitations and the operalization of prediction error in terms of post-feedback processing do not seem to allow for a comparison of information gain and model-agnostic prediction errors in the behavioral data for the following reasons. First, the simple ideal learner model used here is not a generative model, and therefore, cannot replicate or simulate the participants responses (see also our response to your point #6 “model validation” below). Second, the behavioral dependent variables obtained are accuracy and reaction times, which both occur before feedback presentation. While accuracy and reaction times can serve as a marker of the participant’s (statistical) confidence/uncertainty following the decision interval, these behavioral measures cannot provide access to post-feedback information processing. The pupil dilation is of interest to us because the peripheral arousal system is able to provide a marker of post-feedback processing. Through the analysis presented in Figure 3, we indeed aimed to make the comparison of the model-based information gain to the model-agnostic prediction errors via the proxy variable of post-feedback pupil dilation instead of behavioral variables. To bridge the gap between the “behaviorally agnostic” model parameters and the actual performance of the participants, we examined the relationship between the model-based information gain and the post-feedback pupil dilation separately for error and correct trials as shown in Figure 3D-F & Figure 3J-L. We hope this addresses the reviewers concern and apologize in case we did not understand the reviewers suggestion here.

      (4) Model-based analyses of pupil data:

      I'm concerned about the authors' model-based analyses of the pupil data. The current approach is to simply compute a correlation for each model term separately (i.e., KL divergence, surprise, entropy). While the authors do show low correlations between these terms, single correlational analyses do not allow them to control for additional variables like outcome valence, prediction error (defined in terms of the difference between outcome and expectation), and additional nuisance variables like reaction time, as well as x and y coordinates of gaze.

      Moreover, including entropy and KL divergence in the same regression model could, at least within each task, provide some insights into whether the pupil response to KL divergence depends on entropy. This could be achieved by including an interaction term between KL divergence and entropy in the model.

      In line with the reviewer’s suggestions, we have included a complementary linear mixed model analysis in which we controlled for the effects of the information-theoretic variables on one another, while also including the nuisance regressors of pre-feedback baseline pupil dilation and reaction times. We compared the performance of two models on the post-feedback pupil dilation in each time window of interest: Modle 1 had no interaction between information gain and entropy and Model 2 included an interaction term as suggested. We did not include the x- and y- coordinates of gaze in the mixed linear model analysis, as there are multiple values of these coordinates per trial. Furthermore, regressing out the x and y- coordinates of gaze can potentially remove signal of interest in the pupil dilation data in addition to the gaze-related confounds and we did not measure absolute pupil size (Mathôt, Melmi & Castet, 2015; Hayes & Petrov, 2015). We present more sanity checks on the pre-processing pipeline as recommended by Reviewer 1.  

      This new analysis resulted in several additions to the Methods (see Section 2.5) and Results. In sum, we found that including an interaction term for information gain and entropy did not lead to better model fits, but sometimes lead to significantly worse fits. Overall, the results of the linear mixed model corroborated the “simple” correlation analysis across the pupil time course while accounting for the relationship to the pre-feedback baseline pupil and preceeding reaction time differences. There was only one difference to note between the correlation and linear mixed modeling analyses: for the error trials in the cue-target 2AFC task, including entropy in the model accounted for the variance previously explained by surprise.

      (5) Major differences between experimental tasks:

      More generally, I'm not convinced that the authors' conclusion that the pupil response to KL divergence depends on entropy is sufficiently supported by the current design. The two tasks differ on different levels (stimuli, contingencies, when learning takes place), not just in terms of entropy. In my opinion, it would be necessary to rely on a common task with two conditions that differ primarily in terms of entropy while controlling for other potentially confounding factors. I'm afraid that seemingly minor task details can dramatically change pupil responses. The positive/negative difference in the correlation with KL divergence that the authors interpret to be driven by entropy may depend on another potentially confounding factor currently not controlled.

      We agree with the reviewer’s concerns and acknowledge that the speculation concerning the directional effect of entropy across trials can not be fully substantiated by the currect study. We note that Review #1 had a similar concern. Our response to Reviewer #1 addresses this concern of Reviewer #3 as well. To better align the manuscript with the above mentioned points, we have made several changes that are detailed in our response to Reviewer #1’s public review (above). 

      (6) Model validation:

      My impression is that the ideal learner model should work well in this case. However, the authors don't directly compare model behavior to participant behavior ("posterior predictive checks") to validate the model. Therefore, it is currently unclear if the model-derived terms like KL divergence and entropy provide reasonable estimates for the participant data.

      Based on our understanding, posterior predictive checks are used to assess the goodness of fit between generated (or simulated) data and observed data. Given that the “simple” ideal learner model employed in the current study is not a generative model, a posterior predictive check would not apply here (Gelman, Carlin, Stern, Dunson, Vehtari, & Rubin (2013). The ideal learner model is unable to simulate or replicate the participants’ responses and behaviors such as accuracy and reaction times; it simply computes the probability of seeing each stimulus type at each trial based on the prior distribution and the exact trial order of the stimuli presented to each participant. The model’s probabilities are computed directly from a Dirichlet distribution of values that represent the number of occurences of each stimulus-pair type for each task. The information-theoretic variables are then directly computed from these probabilities using standard formulas. The exact formulas used in the ideal learner model can be found in section 2.4.

      We have now included a complementary linear mixed model analysis which also provides insight into the amount of explained variance of these information-theoretic predictors on the post-feedback pupil response, while also including the pre-feedback baseline pupil and reaction time differences (see section 3.3, Tables 3 & 4). The R<sup>2</sup> values ranged from 0.16 – 0.50 across all conditions tested.

      (7) Discussion:

      The authors interpret the directional effect of the pupil response w.r.t. KL divergence in terms of differences in entropy. However, I did not find a normative/computational explanation supporting this interpretation. Why should the pupil (or the central arousal system) respond differently to KL divergence depending on differences in entropy?

      The current suggestion (page 24) that might go in this direction is that pupil responses are driven by uncertainty (entropy) rather than learning (quoting O'Reilly et al. (2013)). However, this might be inconsistent with the authors' overarching perspective based on Zénon (2019) stating that pupil responses reflect updating, which seems to imply learning, in my opinion. To go beyond the suggestion that the relationship between KL divergence and pupil size "needs more context" than previously assumed, I would recommend a deeper discussion of the computational underpinnings of the result.

      Since we have removed the original speculative conclusion from the manuscript, we will refrain from discussing the computational underpinnings of a potential mechanism. To note as mentioned above, we have preliminary data from our own lab that contradicts our original hypothesis about the relationship between entropy and information gain on the post-feedback pupil response. 

      Recommendations for the authors:

      Reviewer #1 (Recommendations for the authors):

      Apart from the points raised in the public review above, I'd like to use the opportunity here to provide a more detailed review of potential issues, questions, and queries I have:

      (1) Constriction vs. Dilation Effects:

      The study observes a context-dependent relationship between KL divergence and pupil responses, where pupil dilation and constriction appear to exhibit opposing effects. However, this phenomenon raises a critical concern: Could the initial pupil constriction to visual stimuli (e.g., in the cue-target task) confound correlations with KL divergence? This potential confound warrants further clarification or control analyses to ensure that the observed effects genuinely reflect prediction error signals and are not merely a result of low-level stimulus-driven responses.

      We agree with the reviewers concern and have added the following information to the limitations section in the Discussion (changes in italics below; p. 32-33).

      “First, the two associative learning paradigms differed in many ways and were not directly comparable. For instance, the shape of the mean pupil response function differed across the two tasks in accordance with a visual or auditory feedback stimulus (compare Supplementary Figure 3A with Supplementary Figure 3D), and it is unclear whether these overall response differences contributed to any differences obtained between task conditions within each task. We are unable to rule out whether so-called “low level” effects such as the initial constriction to visual stimuli in the cue-target 2AFC task as compared with the dilation in response auditory stimuli in letter-color 2AFC task could confound correlations with information gain. Future work should strive to disentangle how the specific aspects of the associative learning paradigms relate to prediction errors in pupil dilation by systematically manipulating design elements within each task.”

      Here, I also was curious about Supplementary Figure 1, showing 'no difference' between the two tones (indicating 'error' or 'correct'). Was this the case for FDR-corrected or uncorrected cluster statistics? Especially since the main results also showed sig. differences only for uncorrected cluster statistics (Figure 2), but were n.s. for FDR corrected. I.e. can we be sure to rule out a confound of the tones here after all?

      As per the reviewer’s suggestion, we verified that there were also no significant clusters after feedback onset before applying the correction for multiple comparisons. We have added this information to Supplemenatary section 1.2 as follows: 

      “Results showed that the auditory tone dilated pupils on average (Supplementary Figure 1C). Crucially, however, the two tones did not differ from one another in either of the time windows of interest (Supplementary Figure 1D; no significant time points after feedback onset were obtained either before or after correcting for multiple comparisons using cluster-based permutation methods; see Section 2.5.” 

      Supplementary Figure 1 is showing effects cluster-corrected for multiple comparisons using cluster-based permutation tests from the MNE software package in Python (see Methods section 2.5). We have clarified that the cluster-correction was based on permutation testing in the figure legend. 

      (2) Participant-Specific Priors:

      The ideal learner models do not account for individualised priors, assuming homogeneous learning behaviour across participants. Could incorporating participant-specific priors better reflect variability in how individuals update their beliefs during associative learning?

      We have clarified in the Methods (see section 2.4) that the ideal learner models did account for participant-specific stimuli including participant-specific priors in the letter-color 2AFC task. We have added the following texts: 

      “We also note that while the ideal learner model for the cue-target 2AFC task used a uniform (flat) prior distribution for all participants, the model parameters were based on the participant-specific cue-target counterbalancing conditions and randomized trial order.” (p. 13)

      “The prior distributions used for the letter-color 2AFC task were estimated from the randomized letter-color pairs and randomized trial order presentation in the preceding odd-ball task; this resulted in participant-specific prior distributions for the ideal learner model of the letter-color 2AFC task. The model parameters were likewise estimated from the (participant-specific) randomized trial order presented in the letter-color 2AFC task.” (p. 13)

      (3) Trial-by-Trial Variability:

      The analysis does not account for random effects or inter-trial variability using mixed-effects models. Including such models could provide a more robust statistical framework and ensure the observed relationships are not influenced by unaccounted participant- or trial-specific factors.

      We have included a complementary linear mixed model analysis in which “subject” was modeled as a random effect on the post-feedback pupil response in each time window of interest and for each task. Across all trials, the results of the linear mixed model corroborated the “simple” correlation analysis across the pupil time course while accounting for the relationship to the prefeedback baseline pupil and preceeding reaction time differences (see section 3.3, Tables 3 & 4).

      (4) Preprocessing/Analysis choices:

      Before anything else, I'd like to highlight the authors' effort in providing public code (and data) in a very readable and detailed format!

      We appreciate the compliment - thank you for taking the time to look at the data and code provided.

      I found the idea of regressing the effect of Blinks/Saccades on the pupil trace intriguing. However, I miss a complete picture here to understand how well this actually worked, especially since it seems to be performed on already interpolated data. My main points here are:

      (4.1) Why is the deconvolution performed on already interpolated data and not on 'raw' data where there are actually peaks of information to fit?

      To our understanding, at least one critical reason for interpolating the data before proceeding with the deconvolution analysis is that the raw data contain many missing values (i.e., NaNs) due to the presence of blinks. Interpolating over the missing data first ensures that there are valid numerical elements in the linear algebra equations. We refer the reviewer to the methods detailed in Knapen et al. (2016) for more details on this pre-processing method. 

      (4.2) What is the model fit (e.g. R-squared)? If this was a poor fit for the regressors in the first place, can we trust the residuals (i.e. clean pupil trace)? Is it possible to plot the same Pupil trace of Figure 1D with a) the 'raw' pupil time-series, b) after interpolation only (both of course also mean-centered for comparison), on top of the residuals after deconvolution (already presented), so we can be sure that this is not driving the effects in a 'bad' way? I'd just like to make sure that this approach did not lead to artefacts in the residuals rather than removing them.

      We thank the reviewer for this suggestion. In the Supplementary Materials, we have included a new figure (Supplementary Figure 2, copied below for convience), which illustrates the same conditions as in Figure 1D and Figure 2D, with 1) the raw data, and 2) the interpolated data before the nuisance regression. Both the raw data and interpolated data have been band-pass filtered as was done in the original pre-processing pipeline and converted to percent signal change. These figures can be compared directly to Figure 1D and Figure 2D, for the two tasks, respectively. 

      Of note is that the raw data seem to be dominated by responses to blinks (and/or saccades). Crucially, the pattern of results remains overall unchaged between the interpolated-only and fully pre-processed version of the data for both tasks. 

      In the Supplementary Materials (see Supplementary section 2), we have added the descriptives of the model fits from the deconvolution method. Model fits (R<sup>2</sup>) for the nuisance regression were generally low: cue-target 2AFC task, M = 0.03, SD = 0.02, range = [0.00, 0.07]; letter-color visual 2AFC, M = 0.08, SD = 0.04, range = [0.02, 0.16].

      Furthermore, a Pearson correlation analysis between the interpolated and fully pre-processed data within the time windows of interest for both task indicated high correspondence: 

      Cue-target 2AFC task

      Early time window: M = 0.99, SD = 0.01, range = [0.955, 1.000]

      Late time window: M = 0.99, SD = 0.01, range = [0.971, 1.000]

      Letter-color visual 2AFC

      Early time window: M = 0.95, SD = 0.04, range = [0.803, 0.998]

      Late time window: M = 0.97, SD = 0.02, range = [0.908, 0.999]

      In hindsight, including the deconvolution (nuisance regression) method may not have changed the pattern of results much. However, the decision to include this deconvolution method was not data-driven; instead, it was based on the literature establishing the importance of removing variance (up to 5 s) of these blinks and saccades from cognitive effects of interest in pupil dilation (Knapen et al., 2016). 

      (4.3) Since this should also lead to predicted time series for the nuisance-regressors, can we see a similar effect (of what is reported for the pupil dilation) based on the blink/saccade traces of a) their predicted time series based on the deconvolution, which could indicate a problem with the interpretation of the pupil dilation effects, and b) the 'raw' blink/saccade events from the eye-tracker? I understand that this is a very exhaustive analysis so I would actually just be interested here in an averaged time-course / blink&saccade frequency of the same time-window in Figure 1D to complement the PD analysis as a sanity check.

      Also included in the Supplementary Figure 2 is the data averaged as in Figure 1D and Figure 2D for the raw data and nuisance-predictor time courses (please refer to the bottom row of the sub-plots). No pattern was observed in either the raw data or the nuisance predictors as was shown in the residual time courses. 

      (4.4) How many samples were removed from the time series due to blinks/saccades in the first place? 150ms for both events in both directions is quite a long bit of time so I wonder how much 'original' information of the pupil was actually left in the time windows of interest that were used for subsequent interpretations.

      We thank the reviewer for bringing this issue to our attention. The size of the interpolation window was based on previous literature, indicating a range of 100-200 ms as acceptable (Urai et al., 2017; Knapen et al., 2016; Winn et al., 2018). The ratio of interpolated-to-original data (across the entire trial) varied greatly between participants and between trials: cue-target 2AFC task, M = 0.262, SD = 0.242, range = [0,1]; letter-color 2AFC task, M = 0.194, SD = 0.199, range = [0,1]. 

      We have now included a conservative analysis in which only trials with more than half (threshold = 60%) of original data are included in the analyses. Crucially, we still observe the same pattern of effects as when all data are considered across both tasks (compare the second to last row in the Supplementary Figure 2 to Figure 1D and Figure 2D).

      (4.5) Was the baseline correction performed on the percentage change unit?

      Yes, the baseline correction was performed on the pupil timeseries after converting to percentsignal change. We have added that information to the Methods (section 2.3).

      (4.6) What metric was used to define events in the derivative as 'peaks'? I assume some sort of threshold? How was this chosen?

      The threshold was chosen in a data-driven manner and was kept consistent across both tasks. The following details have been added to the Methods:

      “The size of the interpolation window preceding nuisance events was based on previous literature [13,39,99]. After interpolation based on data-markers and/or missing values, remaining blinks and saccades were estimated by testing the first derivative of the pupil dilation time series against a threshold rate of change. The threshold for identifying peaks in the temporal derivative is data-driven, partially based on past work[10,14,33]. The output of each participant’s pre-processing pipeline was checked visually. Once an appropriate threshold was established at the group level, it remained the same for all participants (minimum peak height of 10 units).” (p. 8 & 11).

      (5) Multicollinearity Between Variables:

      Lastly, the authors state on page 13: "Furthermore, it is expected that these explanatory variables will be correlated with one another. For this reason, we did not adopt a multiple regression approach to test the relationship between the information-theoretic variables and pupil response in a single model". However, the very purpose of multiple regression is to account for and disentangle the contributions of correlated predictors, no? I might have missed something here.

      We apologize for the ambiguity of our explanation in the Methods section. We originally sought to assess the overall relationship between the post-feedback response and information gain (primarily), but also surprise and entropy. Our reasoning was that these variables are often investigated in isolation across different experiments (i.e., only investigating Shannon surprise), and we would like to know what the pattern of results would look like when comparing a single information-theoretic variable to the pupil response (one-by-one). We assumed that including additional explanatory variables (that we expected to show some degree of collinearity with each other) in a regression model would affect variance attributed to them as compared with the one-on-one relationships observed with the pupil response (Morrissey & Ruxton 2018). We also acknowledge the value of a multiple regression approach on our data. Based on the suggestions by the reviewers we have included a complementary linear mixed model analysis in which we controlled for the effects of the information-theoretic variables on one another, while also including the nuisance regressors of pre-feedback baseline pupil dilation and reaction times.  

      This new analysis resulted in several additions to the Methods (see Section 2.5) and Results (see Tables 3 and 4). Overall, the results of the linear mixed model corroborated the “simple” correlation analysis across the pupil time course while accounting for the relationship to the prefeedback baseline pupil and preceeding reaction time differences. There was only one difference to note between the correlation and linear mixed modeling analyses: for the error trials in the cue-target 2AFC task, including entropy in the model accounted for the variance previously explained by surprise. 

      Reviewer #2 (Recommendations for the authors):

      (1) Given the inherent temporal dependencies in pupil dynamics, characterising later pupil responses as independent of earlier ones in a three-way repeated measures ANOVA may not be appropriate. A more suitable approach might involve incorporating the earlier pupil response as a covariate in the model.

      We thank the reviewer for bringing this issue to our attention. From our understanding, a repeated-measures ANOVA with factor “time window” would be appropriate in the current context for the following reasons. First, autocorrelation (closely tied to sphericity) is generally not considered a problem when only two timepoints are compared from time series data (Field, 2013; Tabachnick & Fidell, 2019). Second, the repeated-measures component of the ANOVA takes the correlated variance between time points into account in the statistical inference. Finally, as a complementary analysis, we present the results testing the interaction between the frequency and accuracy conditions across the full time courses (see Figures 1D and 2D); in these pupil time courses, any difference between the early and late time windows can be judged by the reader visually and qualitatively. 

      (2) Please clarify the correlations between KL divergence, surprise, entropy, and pupil response time series. Specifically, state whether these correlations account for the interrelationships between these information-theoretic measures. Given their strong correlations, partialing out these effects is crucial for accurate interpretation.

      As mentioned above, based on the suggestions by the reviewers we have included a complementary linear mixed model analysis in which we controlled for the effects of the information-theoretic variables on one another, while also including the nuisance regressors of pre-feedback baseline pupil dilation and reaction times.  

      This new analysis resulted in several additions to the Methods (see Section 2.5) and Results (see Tables 3 and 4). Overall, the results of the linear mixed model corroborated the “simple” correlation analysis across the pupil time course while accounting for the relationship to the prefeedback baseline pupil and preceeding reaction time differences. There was only one difference to note between the correlation and linear mixed modeling analyses: for the error trials in the cue-target 2AFC task, including entropy in the model accounted for the variance previously explained by surprise. 

      (3) The effects observed in the late time windows appear weak (e.g., Figure 2E vs. 2F, and the generally low correlation coefficients in Figure 3). Please elaborate on the reliability and potential implications of these findings.

      We have now included a complementary linear mixed model analysis which also provides insight into the amount of explained variance of these information-theoretic predictors on the post-feedback pupil response, while also including the pre-feedback baseline pupil and reaction time differences (see section 3.3, Tables 3 & 4). The R<sup>2</sup> values ranged from 0.16 – 0.50 across all conditions tested. Including the pre-feedback baseline pupil dilation as a predictor in the linear mixed model analysis consistently led to more explained variance in the post-feedback pupil response, as expected.  

      (4) In Figure 3 (C-J), please clarify how the trial-by-trial correlations were computed (averaged across trials or subjects). Also, specify how the standard error of the mean (SEM) was calculated (using the number of participants or trials).

      The trial-by-trial correlations between the pupil signal and model parameters were computed for each participant, then the coefficients were averaged across participants for statistical inference. We have added several clarifications in the text (see section 2.5 and legends of Figure 3 and Supplementary Figure 4).

      We have added “the standard error of the mean across participants” to all figure labels.

      (5) For all time axes (e.g., Figure 2D), please label the ticks at 0, 0.5, 1, 1.5, 2, 2.5, and 3 seconds. Clearly indicate the duration of the feedback on the time axes. This is particularly important for interpreting the pupil dilation responses evoked by auditory feedback.

      We have labeled the x-ticks every 0.5 seconds in all figures and indicated the duration of the auditory feedback in the letter-color decision task and as well as the stimuli presented in the control tasks in the Supplementary Materials. 

      Reviewer #3 (Recommendations for the authors):

      (1) Introduction page 3: "In information theory, information gain quantifies the reduction of uncertainty about a random variable given the knowledge of another variable. In other words, information gain measures how much knowing about one variable improves the prediction or understanding of another variable."

      (2) In my opinion, the description of information gain can be clarified. Currently, it is not very concrete and quite abstract. I would recommend explaining it in the context of belief updating.

      We have removed these unclear statements in the Introduction. We now clearly state the following:

      “Information gain can be operationalized within information theory as the KullbackLeibler (KL) divergence between the posterior and prior belief distributions of a Bayesian observer, representing a formalized quantity that is used to update internal models [29,79,80].” (p. 4)

      (3) Page 4: The inconsistencies across studies are described in extreme detail. I recommend shortening this part and summarizing the inconsistencies instead of listing all of the findings separately.

      As per the reviewer’s recommendation, we have shortened this part of the introduction to summarize the inconsistencies in a more concise manner as follows: 

      “Previous studies have shown different temporal response dynamics of prediction error signals in pupil dilation following feedback on decision outcome: While some studies suggest that the prediction error signals arise around the peak (~1 s) of the canonical impulse response function of the pupil [11,30,41,61,62,90], other studies have shown evidence that prediction error signals (also) arise considerably later with respect to feedback on choice outcome [10,25,32,41,62]. A relatively slower prediction error signal following feedback presentation may suggest deeper cognitive processing, increased cognitive load from sustained attention or ongoing uncertainty, or that the brain is integrating multiple sources of information before updating its internal model. Taken together, the literature on prediction error signals in pupil dilation following feedback on decision outcome does not converge to produce a consistent temporal signature.” (p. 5)

      We would like to note some additional minor corrections to the preprint:

      We have clarified the direction of the effect in Supplementary Figure 3 with the following: 

      “Participants who showed a larger mean difference between the 80% as compared with the 20% frequency conditions in accuracy also showed smaller differences (a larger mean difference in magnitude in the negative direction) in pupil responses between frequency conditions (see Supplementary Figure 4).”

      The y-axis labels in Supplementary Figure 3 were incorrect and have been corrected as the following: “Pupil responses (80-20%)”.

      We corrected typos, formatting and grammatical mistakes when discovered during the revision process. Some minor changes were made to improve clarity. Of course, we include a version of the manuscript with Tracked Changes as instructed for consideration.

    1. Author response:

      The following is the authors’ response to the original reviews.

      Public Reviews:

      Reviewer #1(Public review):

      In this manuscript, Pagano and colleagues test the idea that the protein GMCL1 functions as a substrate receptor for a Cullin RING 3 E3 ubiquitin ligase (CUL3) complex. Using a pulldown approach, they identify GMCL1 binding proteins, including the DNA damage scaffolding protein 53BP1. They then focus on the idea that GMCL1 recruits 53BP1 for CUL3-dependent ubiquitination, triggering subsequent proteasomal degradation of ubiquitinated 53BP1.

      In addition to its DNA damage signalling function, in mitosis, 53BP1 is reported to form a stopwatch complex with the deubiquitinating enzyme USP28 and the transcription factor p53 (PMID: 38547292). These 53BP1-stopwatch complexes generated in mitosis are inherited by G1 daughter cells and help promote p53-dependent cell cycle arrest independent from DNA damage (PMID: 38547292). Several studies show that knockout of 53BP1 overcomes G1 cell cycle arrest after mitotic delays caused by anti-mitotic drugs or centrosome ablation (PMID: 27432897, 27432896). In this model, it is crucial that 53BP1 remains stable in mitosis and more stopwatch complex is formed after delayed mitosis.

      Major concerns:

      Pagano and coworkers suggest that 53BP1 levels can sometimes be suppressed in mitosis if the cells overexpress GMCL1. They carry out a bioinformatic analysis of available public data for p53 wild-type cancer cell lines resistant to the anti-mitotic drug paclitaxel and related compounds. Stratifying GMCL1 into low and high expression groups reveals a weak (p = 0.05 or ns) correlation with sensitivity to taxanes. It is unclear on what basis the authors claim paclitaxel-resistant and p53 wild-type cancer cell lines bypass the mitotic surveillance/timer pathway. They have not tested this. Figure 3 is a correlation assembled from public databases but has no experimental tests. Figure 4 looks at proliferation but not cell cycle progression or the length of mitosis. The main conclusions relating to cell cycle progression and specifically the link to mitotic delays are therefore not supported by experimental data. There is no imaging of the cell cycle or cell fate after mitotic delays, or analysis of where the cells arrest in the cell cycle. Most of the cell lines used have been reported to lack a functional mitotic surveillance pathway in the recent work by Meitinger. To support these conclusions, the stability of endogenous 53BP1 under different conditions in cells known to have a functional mitotic surveillance pathway needs to be examined. A key suggestion in the work is that the level of GMCL1 expression correlates with resistance to taxanes. For the mitotic surveillance pathway, the type of drug (nocodazole, taxol, etc) used to induce a delay isn't thought to be relevant, only the length of the delay. Do GMCL1-overexpressing cells show resistance to anti-mitotics in general?

      We thank the reviewer for this insightful comment. We propose that GMCL1 promotes CUL3-dependent ubiquitination of 53BP1 during prolonged mitotic arrest, thereby facilitating its proteasome-dependent degradation. To evaluate the potential clinical relevance of this mechanism, we stratified cancer cell lines based on GMCL1 mRNA expression using publicly available datasets from DepMap (PMID: 39468210). We observed correlations between GMCL1 expression levels and taxane sensitivity that appear to reflect specific cancer type-drug combinations. To experimentally evaluate this correlation and obtain mechanistic insights, we performed knockdown experiments in hTERT-RPE1 cells, which are known to possess an intact mitotic surveillance pathway. Silencing of GMCL1 alone inhibited cell proliferation and induced apoptosis, while co-depletion of either TP53BP1 or USP28 significantly rescued these effects. These results suggest that GMCL1 modulates the stability of 53BP1 and therefore the availability of the 53BP1-USP28-p53 ternary complex in cells with a functional mitotic surveillance pathway (MSP) (new Figure 5I,J) directly linking GMCL1 to the regulation of the MSP complex. Moreover, to further support our mechanism, we assessed the effect of GMCL1 levels on cell cycle progression. Briefly, following nocodazole synchronization and release, we treated cells with EdU and performed FACS analyses at different times. Knockdown of GMCL1 alone led to a delayed cell cycle progression, but co-depletion of either TP53BP1 or USP28 restored this phenotype (new Figure 3A and new Supplementary Figure 3A-C). These results are consistent with our proliferation data and suggest that the observed effects of GMCL1 are specific to mitotic exit. Finally, overexpression of GMCL1 accelerates cell cycle progression (as assessed by FACS analyses) upon release from prolonged mitotic arrest (new Figure 3B and new Supplementary Figure 3D-E). 

      Importantly, if GMCL1 specifically degrades 53BP1 during prolonged mitotic arrests, the authors should show what happens during normal cell divisions without any delays or drug treatments. How much 53BP1 is destroyed in mitosis under those conditions? Does 53BP1 destruction depend on the length of mitosis, drug treatment, or does 53BP1 get degraded every mitosis regardless of length? Testing the contribution of key mitotic E3 ligase activities on mitotic 53BP1 stability, such as the anaphase-promoting complex/cyclosome (APC/C) is important in this regard. One previous study reported an analysis of putative APC/C KEN-box degron motifs in 53BP1 and concluded these play a role in 53BP1 stability in anaphase (PMID: 28228263).

      Physiological mitosis under unperturbed conditions is typically brief (approximately 30 minutes), making protein quantification during this window challenging. Despite this, we tried by synchronizing cells using RO-3306 and releasing them into drug-free medium to assess GMCL1 dynamics during normal mitosis. Under these conditions, GMCL1 expression was similar to that in asynchronous cells and higher than the levels upon extended mitosis. However, when we attempted to measure the half-life of proteins using cycloheximide, most cells died, likely due to the toxic effect of cycloheximide in cells subjected to co-treatment with RO-3306 or nocodazole. This is the same reasons why in Figure 2C, we assessed 53BP1 in daughter cells rather than mitotic cells. 

      There is no direct test of the proposed mechanism, and it is therefore unclear if 53BP1 is ubiquitinated by a GMCL1-CUL3 ligase in cells, and how efficient this process would be at different cell cycle stages. A key issue is the lack of experimental data explaining why the proposed mechanism would be restricted to mitosis. Indirect effects, such as loss of 53BP1 from the chromatin fraction during M phase upon GMCL1 overexpression, do not necessarily mean that 53BP1 is degraded. PLK1-dependent chromatin-cytoplasmic shuttling of 53BP1 during mitotic delays has been described previously (PMID: 38547292, 37888778). These papers are cited in the text, but the main conclusions of those papers on 53BP1 incorporation into a stopwatch complex during mitotic delays have been ignored. Are the authors sure that 53BP1 is destroyed in mitosis and not simply re-localised between chromatin and non-chromatin fractions? At the very least, these reported findings should be discussed in the text.

      To examine whether GMCL1 promotes 53BP1 ubiquitination in cells, we expressed in cells Trypsin-Resistant Tandem Ubiquitin-Binding Entity (TR-TUBE), a protein that binds polyubiquitin chains. Abundant, endogenous ubiquitinated 53BP1 co-precipitated with TR-TUBE constructs only when wild-type GMCL1 but not the E142K GMCL1 mutant, was expressed (new Figure 2D).  The PLK1-dependent incorporation of 53BP1 into the stopwatch complex and the chromatin-cytoplasmic shuttling of 53BP1 during mitotic delays is now discussed in the text. That said, compared to parental cells, 53BP1 levels in the chromatin fraction are high in two different GMCL1 KO clones in M phase arrested cells (Figure 2A-B).  This increase does not correspond to a decrease in the 53BP1 soluble fraction (Figure 2A and new Supplementary Figure 2D), suggesting decreased 53BP1 is not due to re-localization. The increased half-life of 53BP1 in daughter cells (Figure 2C), also supports this hypothesis. 

      The authors use a variety of cancer cell line models throughout their study, most of which have been reported to lack a functional mitotic surveillance pathway. U2OS and HCT116 cells do not respond normally to mitotic delays, despite being annotated as p53 WT. Other studies have used p53 wild-type hTERT RPE-1 cells to study the mitotic surveillance pathway. If the model is correct, then over-expressing GMCL1 in hTERT-RPE1 cells should suppress cell cycle arrest after mitotic delays, and GMCL1 KO should make the cells more sensitive to delays. These experiments are needed to provide an adequate test of the proposed model.

      We greatly appreciate the reviewer’s suggestion regarding overexpression of GMCL1 in hTERT-RPE1 cells. To address this, we generated stable RPE1 cells expressing V5-tagged GMCL1 and conducted EdU incorporation assays following nocodazole synchronization and release. Overexpression of GMCL1 enhanced cell cycle progression compared to control cells (new Figure 3B and new Supplementary Figure 3D-E) after mitotic arrest, consistent with our model. We, therefore, propose that GMCL1 controls 53BP1 stability to suppress p53-dependent cell cycle arrest.

      We also want to point out that while some papers suggest that HCT116 and U2OS cells do not have an intact mitotic surveillance pathway, others have shown that the MSP is indeed functioning in HCT116 cells and can be triggered with variable efficiency in U2OS cells (PMID: 38547292). This is likely due to high heterogeneity and extensive clonal diversity of cancer cell lines grown in different labs. Please see examples in PMIDs: 3620713, 30089904, and 30778230. In particular, PMID: 30089904 shows that this heterogeneity correlates with considerably different drug responses. 

      To conclude, while the authors propose a potentially interesting model on how GMCL1 overexpression could regulate 53BP1 stability to limit p53-dependent cell cycle arrest, it is unclear what triggers this pathway or when it is relevant. 53BP1 is known to function in DNA damage signalling, and GMCL1 might be relevant in that context. The manuscript contains the initial description of GMCL1-53BP1 interaction but lacks a proper analysis of the function of this interaction and is therefore a preliminary report.

      We hope that the new experiments, along with the clarifications provided in this response letter and revised manuscript, offer the reviewer increased confidence in the robustness and validity of our proposed model.

      Reviewer #2 (Public review):

      This study investigates the role of GMCL1 in regulating the mitotic surveillance pathway (MSP), a protective mechanism that activates p53 following prolonged mitosis. The authors identify a physical interaction between 53BP1 and GMCL1, but not with GMCL2. They propose that the ubiquitin ligase complex CRL3-GMCL1 targets 53BP1 for degradation during mitosis, thereby preventing the formation of the "mitotic stopwatch" complex (53BP1-USP28-p53) and subsequent p53 activation. The authors show that high GMCL1 expression correlates with resistance to paclitaxel in cancer cell lines that express wild-type p53. Importantly, loss of GMCL1 restores paclitaxel sensitivity in these cells, but not in p53-deficient lines. They propose that GMCL1 overexpression enables cancer cells to bypass MSP-mediated p53 activation, promoting survival despite mitotic stress. Targeting GMCL1 may thus represent a therapeutic strategy to re-sensitize resistant tumors to taxane-based chemotherapy.

      Strengths:

      This manuscript presents potentially interesting observations. The major strength of this article is the identification of GMCL1 as a 53BP1 interaction partner. The authors identified relevant domains and showed that GMCL1 controls 53BP1 stability. The authors further show a potentially interesting link between GMCL1 status and sensitivity to Taxol.

      Weaknesses:

      However, the manuscript is significantly weakened by unsubstantiated mechanistic claims, overreliance on a non-functional model system (U2OS), and overinterpretation of correlative data. To support the conclusions of the manuscript, the authors must show that the GMCL1-dependent sensitivity to Taxol depends on the mitotic surveillance pathway.

      To demonstrate that GMCL1-dependent taxane sensitivity is mediated through the mitotic surveillance pathway (MSP), we now performed experiments using hTERT-RPE1 (RPE1) cells, a widely used, non-transformed cell line known to possess a functional MSP.  We compared RPE1 cells with knockdown of GMCL1 alone to those with simultaneous knockdown of GMCL1 and either TP53BP1 or USP28. Upon paclitaxel (Taxol) treatment, cells with GMCL1 knockdown exhibited suppressed proliferation and increased apoptosis. Notably, these phenotypes were rescued by co-depletion of TP53BP1 or USP28 (new Figure 5I,J). These results support the notion that GMCL1 contributes to MSP activity, at least in part, through its regulation of 53BP1.       

      To further strengthen our mechanistic experiments, we assessed the effect of GMCL1 levels on cell cycle progression. Following nocodazole synchronization and release, we treated cells with EdU and performed FACS analyses at different times. Knockdown of GMCL1 alone led to a delay in cell cycle progression, but co-depletion of either TP53BP1 or USP28 alleviate this phenotype (new Figure 3A and new Supplementary Figure 3A, B). These results are consistent with our proliferation data.

      Reviewer #3 (Public review):

      Summary:

      In this study, Kito et al follow up on previous work that identified Drosophila GCL as a mitotic substrate recognition subunit of a CUL3-RING ubiquitin ligase (CRL3) complex.

      Here they characterize mutants of the human ortholog of GCL, GMCL1, that disrupt the interaction with CUL3 (GMCL1E142K) and that lack the substrate interaction domain (GMCL1 BBO). Immunoprecipitation followed by mass spectrometry identified 9 proteins that interacted with wild-type FLAG-GMCL1 and GMCL1 EK but not GMCL1 BBO. These proteins included 53BP1, which plays a well-characterized role in double-strand break repair but also functions in a USP28-p53-53BP1 "mitotic stopwatch" complex that arrests the cell cycle after a substantially prolonged mitosis. Consistent with the IP-MS results, FLAG-GMCL1 immunoprecipitated 53BP1. Depletion of GMCL1 during mitotic arrest increased protein levels of 53BP1, and this could be rescued by wild-type GMCL1 but not the E142K mutant or a R433A mutant that failed to immunoprecipitate 53BP1.

      Using a publicly available dataset, the authors identified a relatively small subset of cell lines with high levels of GMCL1 mRNA that were resistant to the taxanes paclitaxel, cabazitaxel, and docetaxel. This type of analysis is confounded by the fact that paclitaxel and other microtubule poisons accumulate to substantially different levels in various cell lines (DOI: 10.1073/pnas.90.20.9552 , DOI: 10.1091/mbc.10.4.947 ), so careful follow-up experiments are required to validate results. The correlation between increased GMCL1 mRNA and taxane resistance was not observed in lung cancer cell lines. The authors propose this was because nearly half of lung cancers harbor p53 mutations, and lung cancer cell lines with wild-type but not mutant p53 showed the correlation between increased GMCL1 mRNA and taxane resistance. However, the other cancer cell types in which they report increased GMCL1 expression correlates with taxane sensitivity also have high rates of p53 mutation. Furthermore, p53 status does not predict taxane response in patients (DOI: 10.1002/1097-0142(20000815)89:4<769::aid-cncr8>3.0.co;2-6 , DOI: 10.1002/(SICI)1097-0142(19960915)78:6<1203::AID-CNCR6>3.0.CO;2-A , PMID: 10955790).

      The authors then depleted GMCL1 and reported that it increased apoptosis in two cell lines with wild-type p53 (MCF7 and U2OS) due to activation of the mitotic stopwatch. This is surprising because the mitotic stopwatch paper they cite (DOI: 10.1126/science.add9528 ) reported that U2OS cells have an inactive stopwatch and that activation of the stopwatch results in cell cycle arrest rather than apoptosis in most cell types, including MCF7. Beyond this, it has recently been shown that the level of taxanes and other microtubule poisons achieved in patient tumors is too low to induce mitotic arrest (DOI: 10.1126/scitranslmed.3007965 , DOI: 10.1126/scitranslmed.abd4811 , DOI: 10.1371/journal.pbio.3002339 ), raising concerns about the relevance of prolonged mitosis to paclitaxel response in cancer. The findings here demonstrating that GMCL1 mediates degradation of 53BP1 during mitotic arrest are solid and of interest to cell biologists, but it is unclear that these findings are relevant to paclitaxel response in patients.

      Strengths:

      This study identified 53BP1 as a target of CRL3GMCL1-mediated degradation during mitotic arrest. AlphaFold3 predictions of the binding interface, followed by mutational analysis, identified mutants of each protein (GMCL1 R433A and 53BP1 IEDI1422-1425AAAA) that disrupted their interaction. Knock-in of a FLAG tag into the C-terminus of GMCL1 in HCT116 cells, followed by FLAG immunoprecipitation, confirmed that endogenous GMCL1 interacts with endogenous CUL3 and 53BP1 during mitotic arrest.

      Weaknesses:

      The clinical relevance of the study is overinterpreted. The authors have not taken relevant data about the clinical mechanism of taxanes into account. Supraphysiologic doses of microtubule poisons cause mitotic arrest and can activate the mitotic stopwatch. However, in physiologic concentrations of clinically useful microtubule poisons, cells proceed through mitosis and divide their chromosomes on mitotic spindles that are at least transiently multipolar. Though these low concentrations may result in a brief mitotic delay, it is substantially shorter than the arrest caused by high concentrations of microtubule poisons, and the one mimicked here by 16 hours of 0.4 mg/mL nocodazole, which is not used clinically and does not induce multipolar spindles. Resistance to mitotic arrest occurs through different mechanisms than resistance to multipolar spindles. No evidence is presented in the current version of the manuscript that GMCL1 affects cellular response to clinically relevant doses of paclitaxel.

      We agree that it would be an overstatement to claim that GMCL1 and p53 regulates paclitaxel sensitivity in cancer patients in a clinical context. The correlations we observed were based on publicly available cancer cell lines from datasets catalogued in CCLE and DepMap, which do not fully account for clinical heterogeneity and patient-specific factors. In response to this important point, we have revised the text accordingly. 

      In the experiments shown in former Figure 4A-H (now Figure 5A-H) and in those shown in the new Figure 5I-J, we used 100 nM paclitaxel to test the hypothesis that low GMCL1 levels sensitizes cancer cells in a p53-dependent manner. Here, paclitaxel was chosen to mimic the conditions reported in the PRISM dataset (PMID: 32613204), which compiles the proliferation inhibitory activity of 4,518 compounds tested across 578 cancer cell lines. Consistent with our cell cycle findings, the paclitaxel sensitivity caused by GMCL1 depletion was reverted by silencing 53BP1 or USP28 (new Figure 5I-J), again supporting the involvement of the stopwatch complex. We are unsure about how to model the “physiologic concentrations of clinically useful microtubule poisons” in cell-based studies. A recent review notes that “The time above a threshold paclitaxel plasma concentration (0.05 mmol/L) is important for the efficacy and toxicity of the drug” (PMID: 28612269).  Two other reviews mention that the clinically relevant concentration of paclitaxel is considered to be plasma levels between 0.05–0.1 μmol/L (approximately 50–100 nM) and that in clinical dosing, typical patient plasma concentrations after paclitaxel infusion range from 80–280 nM, with corresponding intratumoral concentrations between 1.1–9.0 μM, due to drug accumulation in tumor tissue (PMIDs: 24670687 and  29703818).  We have now emphasized in the revised text the rationale for using 100 nM paclitaxel in our experiments.

      Recommendations for the authors:

      Reviewer #1 (Recommendations for the authors):

      General comments on the Figures:

      (1) Western blots lack molecular weight markers on most panels and are often over-exposed and over-contrasted, rendering them hard to interpret.

      We have now included molecular weight markers in all Western blot panels. We have also reprocessed the images to avoid overexposure and excessive contrast, ensuring that the bands are clearly visible and interpretable.

      (2) Input and IP samples do not show percentage loading, so it is hard to interpret relative enrichments.

      In the revised figures, we have indicated what % of the input was loaded.

      (3) The authors change between cell line models for their experiments, and this is not clear in the figures. These are important details for interpreting the data, as many of the cell lines used are not functional for the mitotic surveillance pathway.

      In the revised manuscript, we have clearly indicated the specific cell lines used in each experiment in the figure legends. Additionally, to address concerns regarding the mitotic surveillance pathway, we have included new experiments using hTERT-RPE1 cells, which have been reported to possess a functional mitotic surveillance pathway (MSP) (Figure 4I-J).

      (4) No n-numbers are provided in the figure legends. Are the Western blots provided done once, or are they reproducible? Many of the blots would benefit from quantification and presentation via graphs to test for reproducible changes to 53BP1 levels under the different conditions.

      As now indicated in the methods section, we have conducted each Western blot no less than three times, yielding results that exhibit a high degree of reproducibility. A representative Western blot has been selected for each figure. We did not include densiometric quantification of immunoblots, given that the semi-quantitative nature of this technique would lead to an overinterpretation of our data; unfortunately, this is a limitation of the technique. In fact, eLife and other similar scientific journals do not adhere to the practice of quantifying Western blots. One exception to this norm is for protein half-life studies, which is done to measure the kinetics of decay rates and their internal comparisons. Accordingly, the experiments in Figure 2C were quantified.

      (5) Graphs displayed in the supplementary figures are blacked out, and individual data points cannot be visualised. All graphs should have individual data points clearly visible.

      We revised the quantified graphs and replaced them with scatter plots to clearly display individual data points, showing sample distribution.

      Additional experiments with specific comments on Figures:

      (1) Figure 1C-D: the relative amount of 53BP1 co-precipitating with FLAG-tagged GMCL1 WT appears very different between the two experiments. If the idea is that MLN4924 (Cullin neddylation inhibitor) makes the interaction easier to capture, then this should be explained in the text, and ideally shown on the same gel/blot -/+ MLN4924.

      We now present the samples treated with and without MLN4924 on the same gel/blot to allow direct comparison (new Figure 1D) and clarified this point in the text.

      (2) Figure 1E: The figure legend states that GMCL1 was immunoprecipitated, but the Figure looks as though FLAG-tagged 53BP1 was the bait protein being immunoprecipitated? Can the authors clarify?

      We thank the reviewer for pointing out the discrepancy between the figure and the figure legend in Figure 1E. The immunoprecipitation was indeed performed using FLAG-tagged 53BP1, and we have now rectified the figure legend accordingly. 

      (3) Figure 1F: Rather than parental cell lysate, the better control would be to IP FLAG from another FLAG-tagged expressing cell line, to rule out non-specific binding with the FLAG tag at the non-overexpressed level. 

      Figure 1F shows interaction at the endogenous level. The specificity of binding with overexpressed proteins is shown in Figures 1C and 1D.

      The USP28 blot is over-exposed and makes it hard to see any changes in electrophoretic mobility - it looks as though there is a change between the parental and the KI cell line? It is surprising that USP28 would co-IP with GMCL1 (presumably because USP28 is bound to 53BP1) if the function of GMCL1-53BP1 interaction is to promote 53BP1 degradation. Can the authors reconcile this? Crucially, if the authors claim that the 53BP1-GMCL1 interaction is specific to prolonged mitosis, then this experiment should be repeated and performed with asynchronous, normal-length mitosis, and prolonged mitosis conditions. This is vital for supporting the claim that this interaction only occurs during prolonged mitoses and does not occur in every mitosis regardless of length.

      This is a good point. Unfortunately, many of the protein-protein interactions occur post lysis. Therefore, we could not observe differences in asynchronous vs. mitotic cells.

      (4) Figure S1F: Label on blot should be CUL3 not CUI3.

      We thank the reviewer for pointing this out and we have corrected the typo.

      (5) Figure 2A: The authors suggest an increase in chromatin-bound 53BP1 in GMCL1 KO U2OS cells, specifically in M phase. Again, is this time in mitosis dependent, or would this be evident in every mitosis, regardless of length? Such an experiment would benefit from repetition and quantification to test whether the observed effect is reproducibly consistent. If the authors' model is correct, simply treating U2OS WT mitotic cells with MG132 during the mitotic arrest and performing the same fractionation should bring 53BP1 levels up to that seen in GMCL1 KO cells under the same conditions.

      The reviewer’s suggestion to assess 53BP1 accumulation in wild-type U2OS cells treated with MG132 during mitotic arrest is indeed highly relevant. However, treatment with MG132 during prolonged mitosis consistently led to significant cell death, making it technically challenging to evaluate 53BP1 levels under these conditions.

      (6) Figure 2B: The authors restore GMCL1 expression in the KO U2OS cells using WT and 2 distinct mutant cDNAs. However, the expression of these constructs is not equivalent, and thus their effects cannot be directly compared. It is also surprising that GMCL1 is much higher in M phase samples in this experiment (shouldn't it be destroyed?), when no such behaviour has been observed in the other figures.

      There is no evidence in our study or others that GMCL1 should be destroyed in M phase.  We show that the R433A mutant is expressed at a level very similar to the WT protein, yet it doesn’t promote the degradation of 53BP1. It is true that the E142K is expressed less in mitotic cells whereas is the most expressed in asynchronous cells. For some reason, this mutant has an inverse behavior compared to the WT, limiting the interpretation of this result. We now mention this in the text. 

      (7) Figure 2C: The CHX experiment would benefit from inclusion of a control protein known to have a short half-life (e.g. c-myc, p53). Is GMCL1 known to have a relatively short half-life? It looks as though GMCL1 disappears after 1 h CHX treatment (although hard to definitively tell in the absence of molecular weight markers). 53BP1 appears to continue declining in the absence of GMCL1, which is surprising if p53BP1 degradation requires GMCL1. How can the authors reconcile this?

      As a control for the CHX chase experiments, we included p21, whose protein levels decreased in a CHX-dependent. GMCL1 itself also appeared to undergo degradation upon CHX treatment, but it doesn’t disappear completely.

      (8) Supplemental Figure 2:

      Transcription is largely inhibited in M phase, so the p53 target gene transcripts present in M phase are inherited from the preceding G2 phase. The qPCR's thus need a reference sample to compare against. I.e., was p21/PUMA/NOXA mRNA already low in G2 in the GMCL1 KO + WT cells before they entered mitosis? Or is the mRNA stability affected during M phase specifically? Is this effect on the mRNA dependent on the time in mitosis?

      It is well established that transcription is not entirely shut down during mitosis, particularly for a subset of genes involved in cell cycle regulation. For example, p21, PUMA, NOXA, and p53 mRNAs have been shown to remain actively transcribed during mitosis (see Table S5 in PMID: 28912132). However, we currently lack direct evidence that p53 activation during mitosis, specifically through the mitotic surveillance pathway, drives the transcription of p21, PUMA, or NOXA mRNAs during M phase. In the absence of such mechanistic data, we opted to exclude these analyses from the final figures.

      Panel B: blots are too over-exposed to see differences in p53 stability under the different conditions. Mitotic samples should be included to show how these differ from the G1 samples.

      The background of all blot images has been adjusted to ensure clarity and consistency.

      Panel D: The authors show no significant difference in the cell cycle profiles of the GMCL1 KO and reconstituted cells compared to parental U2OS cells. This should also be performed in the G1 daughter cells following a prolonged mitosis, to test the effect of the different GMCL1 constructs on G1 cell cycle arrest. U2OS cells have been reported not to have a functional mitotic surveillance pathway (Meitinger et al, Science, 2024), so U2OS cells are perhaps not a good model for testing this.

      We performed cell cycle profiling using EdU incorporation in hTERT-RPE1 cells, which possess a functional MSP, to evaluate cell cycle progression in daughter cells following prolonged mitosis. We observed that GMCL1 knockdown alone leads to G1-phase arrest. In contrast, co-depletion of GMCL1 with either 53BP1 or USP28 bypasses this arrest, indicating that GMCL1 regulates cell cycle progression in an MSP-dependent manner. Please see also the answer to the public review above. 

      (9) Figure 3:

      The authors show expression data for GMCL1 in the different cancer cell lines. This should be validated for a subset of cancer cell lines at the GMCL1 protein level, and cross-correlated to their MSP/mitotic timer status. Does GMCL1 depletion or knockout in p53 wild-type cancer cell lines overexpressing GMCL1 protein restore mitotic surveillance function?

      We were unable to assess GMCL1 protein levels using publicly available proteomics datasets, as GMCL1 expression was not detected. In p53 wild-type hTERT-RPE1 cells, GMCL1 knockdown impaired the mitotic surveillance pathway, as evidenced by G1-phase arrest following prolonged mitosis (new Figure 3A and new Supplementary Figure 3A, B). This arrest was rescued by co-depletion of either TP53BP1 or USP28, indicating that GMCL1 acts upstream of the MSP.

      (10) Figure 4:

      The authors show siRNA experiments depleting GMCL1 and testing the effects of GMCL1 loss on cell viability and apoptosis induction. This is performed in different cell line backgrounds. However, there is no demonstration that any of the observed effects are due to a lack of GMCL1 activity on 53BP1. These experiments need to be repeated in 53BP1 co-depleted cells to test for rescue. Without this, the interpretation is purely correlative.

      We assessed the effects of GMCL1 knockdown, alone or in combination with TP53BP1 or USP28 knockdown, on cell viability and apoptosis in hTERT-RPE1 cells using siRNA. Knockdown of GMCL1 alone led to a significant reduction in cell viability and an increase in apoptosis. However, co-depletion of GMCL1 with either TP53BP1 or USP28 restored both cell viability and apoptosis levels to those observed in control cells (new Figure 5I,J).

      (11) Text comments:

      Line 257: HeLa cells supress p53 through the E6 viral protein and are not "mutant" for p53.

      The authors should cite early work by Uetake and Sluder describing the effects of spindle poisons on the mitotic surveillance pathway.

      We appreciate the reviewer’s comments – We have now made the necessary corrections.

      Reviewer #2 (Recommendations for the authors):

      Major Points:

      (1) Unsubstantiated Mechanistic Claims:

      In Figures 3 and 4, the authors show correlations between GMCL1 expression and sensitivity to Taxol. However, they fail to demonstrate that the mitotic stopwatch is mechanistically involved. To support this conclusion, the authors must test whether deletion of 53BP1, USP28, or disruption of their interaction rescues Taxol sensitivity in GMCL1-depleted cells. Since 53BP1 also plays a role in DNA damage response, such rescue experiments are necessary to distinguish between mitotic surveillance-specific and broader stress-response effects. Deletion of USP28 would be particularly informative.

      We sought to experimentally determine whether GMCL1 is involved in regulating the mitotic stopwatch. Knockdown of GMCL1 alone resulted in reduced cell proliferation and increased apoptosis. In contrast, co-depletion of GMCL1 with either TP53BP1 or USP28 restored both proliferation and apoptosis levels to those observed in control cells (new Figure 5I, J). To further strengthen our mechanistic experiments, we assessed the effect of GMCL1 levels on cell cycle progression. We conducted EdU incorporation assays following nocodazole synchronization and release. Knockdown of GMCL1 alone led to a delay in G1 progression, whereas co-depletion of either TP53BP1 or USP28 rescued normal cell cycle progression (new Figure 3A and new Supplementary Figure 3A, B). These results are consistent with our proliferation data and suggest that GMCL1 functions upstream of the ternary complex, likely by regulating 53BP1 protein levels.

      (2) Model System Limitations (U2OS Cells):

      The use of U2OS cells is highly problematic for investigating the mitotic surveillance pathway. U2OS cells lack a functional mitotic stopwatch and do not arrest following prolonged mitosis in a 53BP1/USP28-dependent manner (PMID: 38547292). Therefore, conclusions drawn from this model system about the function of the mitotic surveillance pathway are not substantiated. Key experiments should be repeated in a cell line with an intact pathway, such as RPE1.

      We now performed all key experiments also hTERT-RPE1 cells (see above). We also would like to point out that while some papers suggest that HCT116 and U2OS cells do not have an intact mitotic surveillance pathway, others have showed that the MSP is indeed functioning in HCT116 cells and can be triggered with variable efficiency in U2OS cells (PMID: 38547292).  This is likely due to high heterogeneity and extensive clonal diversity of cancer cell lines grown in different labs. Please see examples in PMIDs: 3620713, 30089904, and 30778230. In particular, PMID: 30089904 shows that this heterogeneity correlates with considerably different drug responses. 

      (3) Misinterpretation of p53 Activity Timing:

      The manuscript states that "GMCL1 KO cells led to decreased mRNA levels of p21 and NOXA during mitosis" (line 194). However, it is well established that the mitotic surveillance pathway activates p53 in the G1 phase following prolonged mitosis-not during mitosis itself (PMID: 38547292). Therefore, the observed changes in mRNA levels during mitosis are unlikely to be relevant to this pathway.

      We currently lack direct evidence that p53 activated during mitosis through the mitotic surveillance pathway directly influences the transcription of p21, PUMA, or NOXA mRNAs during M phase. Therefore, we have chosen to exclude these data from the final figures.

      (4) Incorrect Interpretation of 53BP1 Chromatin Binding:

      The authors claim that 53BP1 remains associated with chromatin during mitosis, which contradicts established literature. It is known that 53BP1 is released from chromatin during mitosis via mitosis-specific phosphorylation (PMID: 24703952), and this is supported by more recent findings (PMID: 38547292). A likely explanation for the discrepancy may be contamination of mitotic fractions with interphase cells. The chromatin fraction data in Figure 2C must be interpreted with caution.

      Our method to synchronize in M phase is rather stringent (see Supplementary Figure 3D as an example). The literature indicates that the bulk of 53BP1 is released from chromatin during mitosis. Yet, even in the two publications mentioned by the reviewer, there is a difference in the observable amount of 53BP1 bound to chromatin (compare Figure 2B in PMID: 38547292 and Figure 5A in PMID: 24703952). The difference is likely due to the different biochemical approaches used to purify chromatin bound proteins (salt and detergent concentrations, sonication, etc.). Using our fractionation approach, we can reliably separate the soluble fraction (containing also the nucleoplasmic fraction) and chromatin associated proteins as indicated by the controls such as a-Tubulin and Histon H3.  We have now mentioned these limitations when comparing different fractionation methods in our discussion section.

      (5) Inadequate Citation of Foundational Literature:

      The literature on the mitotic surveillance pathway is relatively limited, and it is essential that the authors provide a comprehensive and accurate account of its development. The foundational work by the Sluder lab (PMID: 20832310), demonstrating a p53-dependent arrest following prolonged mitosis, must be cited. Furthermore, the three key 2016 papers (PMID: 27432896, 27432897, 27432896) that identified the involvement of USP28 and 53BP1 in this pathway are critical and should be cited as the basis of the mitotic surveillance pathway.

      In contrast, the manuscript currently emphasizes publications that either contribute minimally or have been contradicted by prior and subsequent work. For example: PMID: 31699974, which proposes Ser15 phosphorylation of p53 as critical, has been contradicted by multiple groups (e.g., Holland, Oegema, and Tsou labs).

      PMID: 37888778, which suggests that 53BP1 must be released from kinetochores, is inconsistent with findings that indicate kinetochore localization is not relevant.

      The authors should thoroughly revise the Introduction to reflect what this reviewer would describe as a more accurate and scholarly approach to the literature.

      We have substantially revised both the Introduction and Discussion sections to incorporate important references kindly suggested by the reviewer.

      Minor Points:

      (1) Overexposed Western Blots:

      The Western blots throughout the manuscript are heavily overexposed and saturated, obscuring differences in protein levels and hindering data interpretation. The authors should provide properly exposed blots with quantification where appropriate.

      We have provided Western blot images with appropriate exposure levels and included quantification where appropriate (i.e., to measure the kinetics of decay rates as in Figure 2C). For all the other immunoblots, we did not include densiometric quantification, given that the semi-quantitative nature of this technique would lead to overinterpretation of our data. This is, unfortunately, a limitation of the technique. In fact, eLife and other similar scientific journals do not adhere to the practice of quantifying Western blot analyses. 

      (2) Missing information in the graphs in Figure 2C and 4; S2? How many repeats? What are the asterisks?

      Panels referenced above have been repeated several times, and further details are now provided in the figure legends.

      Reviewer #3 (Recommendations for the authors):

      (1)   The claim that GMCL1 modulates paclitaxel sensitivity in cancer should be toned down

      .

      We agree that it would be an overstatement to claim that GMCL1 regulates paclitaxel sensitivity in cancer patients in a clinical context. The correlations we observed were based on publicly available, cell line–based datasets, which do not fully account for clinical heterogeneity and patient-specific factors. In response to this important point, we have revised our statements and corresponding text accordingly. We now placed greater emphasis on our molecular and cell biology studies.

      (2) Additional experiments in low, physiologically relevant concentrations of paclitaxel would be interesting. It is possible that these concentrations activate the mitotic stopwatch in a portion of cells, in addition to inducing cell death due to chromosome loss, activation of an immune response, and chromothripsis. Results should be interpreted in the context of this complexity.

      Please see the response to the public review. 

      (3) It would be helpful to show that CUL3 interacts with 53BP1 only in the presence of GMCL1.

      We show that the binding of 53BP1 to GMCL1 is independent of the ability of GMCL1 to bind CUL3 (Figure 1C, D). The binding between 53BP1 and CUL3 is difficult to detect (Figure 1F) likely because it’s not direct but mediated by GMCL1.

      (4) The GMCL1 "KO" lines appear to still express a low level of GMCL1 (Figure 2A), which should be acknowledged

      We have included the GMCL1 mRNA expression data, as measured by RT-PCR, in Supplementary Figure 1G, demonstrating that GMCL1 expression was undetectable under the tested conditions.

      (5) Additional description of the methods is warranted. This is particularly true for the database analysis that forms the basis for the claim that GMCL1 overexpression causes resistance to paclitaxel and other taxanes presented in Figure 3, the methodology used to obtain M-phase cells, and the concentration and duration of taxol treatment.

      We have now extensively revised the Methods section.  

      (6) "Taxol" and "paclitaxel" are used interchangeably throughout the manuscript. Consistency would be preferable.

      We have revised the manuscript to maintain consistency in the use of the terms “Taxol” and “paclitaxel” and now refer to “paclitaxel” when discussing that individual compound; “taxanes” when referring collectively to cabazitaxel, docetaxel and paclitaxel; and “Taxol” has been removed entirely to avoid redundancy or confusion.    

      (7) It is unclear why it is claimed that GMCL1 interacts "specifically" with 53BP1 (line 176) since multiple interactors were identified in the IP-MS study

      We meant that the GMCL1 R433A mutant loses its ability to bind 53BP1, suggesting that the GMCL1-53BP1 interaction is not an artifact. We have now clarified the text. 

      (8) The bottom row in Figure S3 is misleading. Paclitaxel is not uniformly effective in every tumor of any given type, and so resistance occurs in every cancer type.

      We fully agree that cancer is highly heterogeneous and that paclitaxel efficacy varies across tumors, even within the same histological subtype. Our intension was not to suggest uniform sensitivity/resistance, but rather to provide a high-level overview using aggregated data. We acknowledge that this coarse-grained representation may unintentionally imply overly generalized conclusions. To avoid potential misinterpretation, we have removed the corresponding panel in the revised paper.

    1. Author response:

      The following is the authors’ response to the previous reviews.

      Public Reviews:

      Reviewer #1 (Public Review):

      Summary:

      This research group has consistently performed cutting-edge research aiming to understand the role of hormones in the control of social behaviors, specifically by utilizing the genetically-tractable teleost fish, medaka, and the current work is no exception. The overall claim they make, that estrogens modulate social behaviors in males and females is supported, with important caveats. For one, there is no evidence these estrogens are generated by "neurons" as would be assumed by their main claim that it is NEUROestrogens that drive this effect. While indeed the aromatase they have investigated is expressed solely in the brain, in most teleosts, brain aromatase is only present in glial cells (astrocytes, radial glia). The authors should change this description so as not to mislead the reader. Below I detail more specific strengths and weaknesses of this manuscript.

      We thank the reviewer for this positive evaluation of our work and for the helpful comments and suggestions. Regarding the concern that the term “neuroestrogens” may be misleading, we addressed this in the previous revision by consistently replacing it throughout the manuscript with “brain-derived estrogens” or “brain estrogens.”

      In addition, the following sentence was added to the Introduction (line 61): “In teleost brains, including those of medaka, aromatase is exclusively localized in radial glial cells, in contrast to its neuronal localization in rodent brains (Forlano et al., 2001; Diotel et al., 2010; Takeuchi and Okubo, 2013).”

      Strenghth:

      Excellent use of the medaka model to disentangle the control of social behavior by sex steroid hormones 

      The findings are strong for the most part because deficits in the mutants are restored by the molecule (estrogens) that was no longer present due to the mutation 

      Presentation of the approach and findings are clear, allowing the reader to make their own inferences and compare them with the authors' 

      Includes multiple follow-up experiments, which leads to tests of internal replication and an impactful mechanistic proposal 

      Findings are provocative not just for teleost researchers, but for other species since, as the authors point out, the data suggest mechanisms of estrogenic control of social behaviors may be evolutionary ancient 

      We thank the reviewer again for their positive evaluation of our work.

      Weakness:

      As stated in the summary, the authors are attributing the estrogen source to neurons and there isn't evidence this is the case. The impact of the findings doesn't rest on this either

      As mentioned above, we addressed this in the previous revision by replacing “neuroestrogens” with “brain-derived estrogens” or “brain estrogens” throughout the manuscript. In addition, the following sentence was added to the Introduction (line 61): “In teleost brains, including those of medaka, aromatase is exclusively localized in radial glial cells, in contrast to its neuronal localization in rodent brains (Forlano et al., 2001; Diotel et al., 2010; Takeuchi and Okubo, 2013).”

      The d4 versus d8 esr2a mutants showed different results for aggression. The meaning and implications of this finding are not discussed, leaving the reader wondering

      This comment is the same as one raised in the first review (Reviewer #1’s comment 2 on weaknesses), which we already addressed in our initial revision. For the reviewer’s convenience, we provide the response below:

      Line 300: As the reviewer correctly noted, circles were significantly reduced in mutant males of the Δ8 line, whereas no significant reduction was observed in those of the Δ4 line. However, a tendency toward reduction was evident in the Δ4 line (P = 0.1512), and both lines showed significant differences in fin displays. Based on these findings, we believe our conclusion that esr2a<sup>−/−</sup> males exhibit reduced aggression remains valid. To clarify this point and address potential reader concerns, we have revised the text as follows: “esr2a<sup>−/−</sup> males exhibited significantly fewer fin displays (P = 0.0461 and 0.0293 for Δ8 and Δ4 lines, respectively) and circles (P = 0.0446 and 0.1512 for Δ8 and Δ4 lines, respectively) than their wild-type siblings (Fig. 5L; Fig. S8E), suggesting less aggression” was edited to read “esr2a<sup>−/−</sup> males from both the Δ8 and Δ4 lines exhibited significantly fewer fin displays than their wild-type siblings (P = 0.0461 and 0.0293, respectively). Circles followed a similar pattern, with a significant reduction in the Δ8 line (P = 0.0446) and a comparable but non-significant decrease in the Δ4 line (P =0.1512) (Figure 5L, Figure 5—figure supplement 3E), showing less aggression.”

      Lack of attribution of previous published work from other research groups that would provide the proper context of the present study

      This comment is also the same as one raised in the first review (Reviewer #1’s comment 3 on weaknesses). In our previous revision, in response to this comment, we cited the relevant references (Hallgren et al., 2006; O’Connell and Hofmann, 2012; Huffman et al., 2013; Jalabert et al., 2015; Yong et al., 2017; Alward et al., 2020; Ogino et al., 2023) in the appropriate sections. We also added the following new references and revised the Introduction and Discussion accordingly:

      (2) Alward BA, Laud VA, Skalnik CJ, York RA, Juntti SA, Fernald RD. 2020. Modular genetic control of social status in a cichlid fish. Proceedings of the National Academy of Sciences of the United States of America 117:28167–28174. DOI: https://doi.org/10.1073/pnas.2008925117

      (39) O’Connell LA, Hofmann HA. 2012. Social status predicts how sex steroid receptors regulate complex behavior across levels of biological organization. Endocrinology 153:1341–1351. DOI:https://doi.org/10.1210/en.2011-1663

      (54) Yong L, Thet Z, Zhu Y. 2017. Genetic editing of the androgen receptor contributes to impaired male courtship behavior in zebrafish. Journal of Experimental Biology 220:3017–3021.DOI:https://doi.org/10.1242/jeb.161596

      There are a surprising number of citations not included; some of the ones not included argue against the authors' claims that their findings were "contrary to expectation"

      In our previous revision, we cited the relevant references (Hallgren et al., 2006; O’Connell and Hofmann, 2012; Huffman et al., 2013; Jalabert et al., 2015) in the Introduction. We also revised the text to remove phrases such as “contrary to expectation” and “unexpected.”

      The experimental design for studying aggression in males has flaws. A standard test like a residentintruder test should be used.

      Following this comment, we have attempted additional aggression assays using the resident-intruder paradigm. However, these experiments did not produce consistent or interpretable results. As noted in our previous revision, medaka naturally form shoals and exhibit weak territoriality, and even slight differences in dominance between a resident and an intruder can markedly increase variability, reducing data reliability. Therefore, we believe that the approach used in the present study provides a more suitable assessment of aggression in medaka, regardless of territorial tendencies. We will continue to explore potential refinements in future studies and respectfully ask the reviewer to evaluate the present work based on the assay used here.

      While they investigate males and females, there are fewer experiments and explanations for the female results, making it feel like a small addition or an aside

      While we did not adopt this comment in our previous revision, we have carefully reconsidered the reviewers’ feedback and have now decided to remove the female data. This change allows us to present a more focused and cohesive story centered on males. The specific revisions are outlined below:

      Abstract

      Line 25: The text “, thereby revealing a previously unappreciated mode of action of brain-derived estrogens. We additionally show that female fish lacking Cyp19a1b are less receptive to male courtship and conversely court other females, highlighting the significance of brain-derived estrogens in establishing sex-typical behaviors in both sexes.” has been revised to “. Taken together, these findings reveal a previously unappreciated mode of action of brain-derived estrogens in shaping male-typical behaviors.”

      Results

      Line 88: The text “Loss of cyp19a1b function in these fish was verified by measuring brain and peripheral levels of sex steroids. As expected, brain estradiol-17β (E2) in both male and female homozygous mutants (cyp19a1b<sup>−/−</sup>) was significantly reduced to 16% and 50%, respectively, of the levels in their wild-type (cyp19a1b<sup>+/+</sup>) siblings (P = 0.0037, males; P = 0.0092, females) (Fig. 1, A and B). In males, brain E2 in heterozygotes (cyp19a1b<sup>−/−</sup>) was also reduced to 45% of the level in wild-type siblings (P = 0.0284) (Fig. 1A), indicating a dosage effect of cyp19a1b mutation. In contrast, peripheral E2 levels were unaltered in both cyp19a1b<sup>−/−</sup> males and females (Fig. S1, C and D), consistent with the expected functioning of Cyp19a1b primarily in the brain. Strikingly, brain levels of testosterone, as opposed to E2, increased 2.2-fold in cyp19a1b<sup>−/−</sup> males relative to wild-type siblings (P = 0.0006) (Fig. 1A). Similarly, brain 11KT levels in cyp19a1b<sup>−/−</sup> males and females increased 6.2- and 1.9-fold, respectively, versus wild-type siblings (P = 0.0007, males; P = 0.0316, females) (Fig. 1, A and B). These results show that cyp19a1b-deficient fish have reduced estrogen levels coupled with increased androgen levels in the brain, confirming the loss of cyp19a1b function. They also suggest that the majority of estrogens in the male brain and half of those in the female brain are synthesized locally in the brain. In addition, peripheral 11KT levels in cyp19a1b<sup>−/−</sup> males and females increased 3.7- and 1.8-fold, respectively (P = 0.0789, males; P = 0.0118, females) (Fig. S1, C and D), indicating peripheral influence in addition to central effects.” has been revised to “Loss of cyp19a1b function in these fish was verified by measuring brain and peripheral levels of sex steroids in males. As expected, brain estradiol-17β (E2) in homozygous mutants (cyp19a1b<sup>−/−</sup>) was significantly reduced to 16% of the levels in wild-type (cyp19a1b<sup>+/+</sup>) siblings (P = 0.0037) (Figure 1A). Brain E2 in heterozygotes (cyp19a1b<sup>+/−</sup>) was also reduced to 45% of wild-type levels (P = 0.0284) (Figure 1A), indicating a dosage effect of the cyp19a1b mutation. In contrast, peripheral E2 levels were unaltered in cyp19a1b<sup>−/−</sup> males (Figure 1B), consistent with the expected functioning of Cyp19a1b primarily in the brain. Strikingly, brain testosterone levels, as opposed to E2, increased 2.2-fold in cyp19a1b<sup>−/−</sup> males relative to wild-type siblings (P = 0.0006) (Figure 1A). Similarly, brain 11KT levels increased 6.2-fold (P = 0.0007) (Figure 1A). These results indicate that cyp19a1b-deficient males have reduced estrogen coupled with elevated androgen levels in the brain, confirming the loss of cyp19a1b function. They also suggest that the majority of estrogens in the male brain are synthesized locally in the brain. Peripheral 11KT levels also increased 3.7-fold in cyp19a1b<sup>−/−</sup> males (P = 0.0789) (Figure 1B), indicating peripheral influence in addition to central effects.”

      Line 211: “expression of vt in the pNVT of cyp19a1b<sup>−/−</sup> males was significantly reduced to 18% as compared with cyp19a1b<sup>+/+</sup> males (P = 0.0040), a level comparable to that observed in females” has been revised to “expression of vt in the pNVT of cyp19a1b<sup>−/−</sup> males was significantly reduced to 18% as compared with cyp19a1b<sup>+/+</sup> males (P = 0.0040).”

      The subsection entitled “cyp19a1b-deficient females are less receptive to males and instead court other females,” which followed line 311, has been removed.

      Discussion

      The two paragraphs between lines 373 and 374, which addressed the female data, have been removed.

      Materials and methods

      Line 433: “males and females” has been changed to “males”.

      Line 457: “focal fish” has been changed to “focal male”.

      Line 458: “stimulus fish” has been changed to “stimulus female”.

      Line 458: “Fig. 6, E and F, ” has been deleted.

      Line 460: “; wild-type males in Fig. 6, A to C” has been deleted.

      Line 466: The text “The period of interaction/recording was extended to 2 hours in tests of courtship displays received from the stimulus esr2b-deficient female and in tests of mating behavior between females, because they take longer to initiate courtship (12). In tests using an esr2b-deficient female as the stimulus fish, where the latency to spawn could not be calculated because these fish were unreceptive to males and did not spawn, the sexual motivation of the focal fish was instead assessed by counting the number of courtship displays and wrapping attempts in 30 min. The number of these mating acts was also counted in tests to evaluate the receptivity of females. In tests of mating behavior between two females, the stimulus female was marked with a small notch in the caudal fin to distinguish it from the focal female.” has been revised to “In tests using an esr2b-deficient female as the stimulus fish, the latency to spawn could not be calculated because the female was unreceptive to males and did not spawn. Therefore, the sexual motivation of the focal male was assessed by counting the number of courtship displays and wrapping attempts in 30 min. To evaluate courtship displays performed by stimulus esr2bdeficient females toward focal males, the recording period was extended to 2 hours, as these females take longer to initiate courtship (Nishiike et al., 2021). In all video analyses, the researcher was blind to the fish genotype and treatment.”

      Line 499: “brains dissected from males and females of the cyp19a1b-deficient line (analysis of ara, arb, vt, gal, npba, and esr2b) and males of the esr1-, esr2a-, and esr2b-deficient lines” has been revised to “male brains from the cyp19a1b-deficient line (analysis of ara, arb, vt, and gal) and from the esr1-, esr2a-, and esr2b-deficient lines.”

      Line 504: “After color development for 15 min (gal), 40 min (npba), 2 hours (vt), or overnight (ara, arb, and esr2b)” has been revised to “After color development for 15 min (gal), 2 hours (vt), or overnight (ara and arb).”

      Line 516: “Thermo Fisher Scientific, Waltham, MA” has been changed to “Thermo Fisher Scientific” to avoid redundancy.

      Line 565: The subsection entitled “Measurement of spatial distances between fish” has been removed.

      Line 585: “6/10 cyp19a1b<sup>+/+</sup>, 3/10 cyp19a1b<sup>+/−</sup>, and 6/10 cyp19a1b<sup>−/−</sup> females were excluded in Fig. 6B;” has been deleted.

      References

      The following references have been removed:

      Capel B. 2017. Vertebrate sex determination: evolutionary plasticity of a fundamental switch. Nature Reviews Genetics 18:675–689. DOI: https://doi.org/10.1038/nrg.2017.60

      Hiraki T, Nakasone K, Hosono K, Kawabata Y, Nagahama Y, Okubo K. 2014. Neuropeptide B is femalespecifically expressed in the telencephalic and preoptic nuclei of the medaka brain. Endocrinology 155:1021–1032. DOI: https://doi.org/10.1210/en.2013-1806

      Juntti SA, Hilliard AT, Kent KR, Kumar A, Nguyen A, Jimenez MA, Loveland JL, Mourrain P, Fernald RD. 2016. A neural basis for control of cichlid female reproductive behavior by prostaglandin F2α. Current Biology 26:943–949. DOI: https://doi.org/10.1016/j.cub.2016.01.067

      Kimchi T, Xu J, Dulac C. 2007. A functional circuit underlying male sexual behaviour in the female mouse brain. Nature 448:1009–1014. DOI: https://doi.org/10.1038/nature06089

      Kobayashi M, Stacey N. 1993. Prostaglandin-induced female spawning behavior in goldfish (Carassius auratus) appears independent of ovarian influence. Hormones and Behavior 27:38–55.

      DOI:https://doi.org/10.1006/hbeh.1993.1004

      Liu H, Todd EV, Lokman PM, Lamm MS, Godwin JR, Gemmell NJ. 2017. Sexual plasticity: a fishy tale. Molecular Reproduction and Development 84:171–194. DOI: https://doi.org/10.1002/mrd.22691

      Munakata A, Kobayashi M. 2010. Endocrine control of sexual behavior in teleost fish. General and Comparative Endocrinology 165:456–468. DOI: https://doi.org/10.1016/j.ygcen.2009.04.011

      Nugent BM, Wright CL, Shetty AC, Hodes GE, Lenz KM, Mahurkar A, Russo SJ, Devine SE, McCarthy MM. 2015. Brain feminization requires active repression of masculinization via DNA methylation. Nature Neuroscience 18:690–697. DOI: https://doi.org/10.1038/nn.3988

      Shaw K, Therrien M, Lu C, Liu X, Trudeau VL. 2023. Mutation of brain aromatase disrupts spawning behavior and reproductive health in female zebrafish. Frontiers in Endocrinology 14:1225199.

      DOI:https://doi.org/10.3389/fendo.2023.1225199

      Stacey NE. 1976. Effects of indomethacin and prostaglandins on the spawning behaviour of female goldfish. Prostaglandins 12:113–126. DOI: https://doi.org/10.1016/s0090-6980(76)80010-x

      Figure 1

      Panel B, which originally showed steroid levels in female brains, has been replaced with steroid levels in the periphery of males, originally presented in Figure S1, panel C. Accordingly, the legend “(A and B) Levels of E2, testosterone, and 11KT in the brain of adult cyp19a1b<sup>+/+</sup>, cyp19a1b<sup>+/−</sup>, and cyp19a1b<sup>−/−</sup> males (A) and females (B) (n = 3 per genotype and sex).” has been revised to “(A, B) Levels of E2, testosterone, and 11KT in the brain (A) and periphery (B) of adult cyp19a1b<sup>+/+</sup>, cyp19a1b<sup>+/−</sup>, and cyp19a1b<sup>−/−</sup> males (n = 3 per genotype).”

      Figure 3

      The female data have been deleted from Figure 3. The revised Figure 3 is presented.

      The corresponding legend text has been revised as follows:

      Line 862: “males and females (n = 4 and 5 per genotype for males and females, respectively)” has been changed to “males (n = 4 per genotype)”.

      Line 864: “males and females (n = 4 except for cyp19a1b<sup>+/+</sup> males, where n = 3)” has been changed to “males (n = 3 and 4, respectively)”.

      Figure 6

      Figure 6 and its legend have been removed.

      Figure 1—figure supplement 1

      Panel C, showing male data, has been moved to Figure 1B, as described above, while panel D, showing female data, has been deleted. The corresponding legend “(C and D) Levels of E2, testosterone, and 11KT in the periphery of adult cyp19a1b<sup>+/+</sup>, cyp19a1b<sup>+/−</sup>, and cyp19a1b<sup>−/−</sup> males (C) and females (D) (n = 3 per genotype and sex). Statistical differences were assessed by Bonferroni’s post hoc test (C and D). Error bars represent SEM. *P < 0.05.” has also been removed.

      Line 804: Following this change, the figure title has been updated from “Generation of cyp19a1bdeficient medaka and evaluation of peripheral sex steroid levels” to “Generation of cyp19a1b-deficient medaka.”

      The statistics comparing "experimental to experimental" and "control to experimental" isn't appropriate 

      This comment is the same as one raised in the first review (Reviewer #1’s comment 7 on weaknesses), which we already addressed in our initial revision. For the reviewer’s convenience, we provide the response below:

      The reviewer raised concerns about the statistical analysis used for Figures 4C and 4E, suggesting that Bonferroni’s test should be used instead of Dunnett’s test. However, Dunnett’s test is commonly used to compare treatment groups to a reference group that receives no treatment, as in our study. Since we do not compare the treated groups with each other, we believe Dunnett’s test is the most appropriate choice.

      Line 576: The reviewer’s concern may have arisen from the phrase “comparisons between control and experimental groups” in the Materials and methods. We have revised it to “comparisons between untreated and E2-treated groups in Figure 4C and D” for clarity.

      Reviewer #3 (Public Review):

      Summary:

      Taking advantage of the existence in fish of two genes coding for estrogen synthase, the enzyme aromatase, one mostly expressed in the brain (Cyp19a1b) and the other mostly found in the gonads (Cyp19a1a), this study investigates the role of brain-derived estrogens in the control of sexual and aggressive behavior in medaka. The constitutive deletion of Cyp19a1b markedly reduced brain estrogen content in males and to a lesser extent in females. These effects are accompanied by reduced sexual and aggressive behavior in males and reduced preference for males in females. These effects are reversed by adult treatment with supporting a role for estrogens. The deletion of Cyp19a1b is associated with a reduced expression of the genes coding for the two androgen receptors, ara and arb, in brain regions involved in the regulation of social behavior. The analysis of the gene expression and behavior of mutants of estrogen receptors indicates that these effects are likely mediated by the activation of the esr1 and esr2a isoforms. These results provide valuable insight into the role of estrogens in social behavior in the most abundant vertebrate taxon, however the conclusion of brain-derived estrogens awaits definitive confirmation.

      We thank this reviewer for their positive evaluation of our work and comments that have improved the manuscript.

      Strength:

      Evaluation of the role of brain "specific" Cyp19a1 in male teleost fish, which as a taxon are more abundant and yet proportionally less studied that the most common birds and rodents. Therefore, evaluating the generalizability of results from higher vertebrates is important. This approach also offers great potential to study the role of brain estrogen production in females, an understudied question in all taxa.

      Results obtained from multiple mutant lines converge to show that estrogen signaling, likely synthesized in the brain drives aspects of male sexual behavior.

      The comparative discussion of the age-dependent abundance of brain aromatase in fish vs mammals and its role in organization vs activation is important beyond the study of the targeted species.  - The authors have made important corrections to tone down some of the conclusions which are more in line with the results. 

      We thank the reviewer again for their positive evaluation of our work and the revisions we have made.

      weaknesses:

      No evaluation of the mRNA and protein products of Cyp19a1b and ESR2a are presented, such that there is no proper demonstration that the mutation indeed leads to aromatase reduction. The conclusion that these effects dependent on brain derived estrogens is therefore only supported by measures of E2 with an EIA kit that is not validated. No discussion of these shortcomings is provided in the discussion thus further weakening the conclusion manuscript.

      In response to this and other comments, we have now provided direct validation that the cyp19a1b mutation in our medaka leads to loss of function. Real-time PCR analysis showed that cyp19a1b transcript levels in the brain were reduced by approximately half in cyp19a1b<sup>+/−</sup> males and were nearly absent in cyp19a1b<sup>−/−</sup> males, consistent with nonsense-mediated mRNA decay

      In addition, AlphaFold 3-based structural modeling indicated that the mutant Cyp19a1b protein lacks essential motifs, including the aromatic region and heme-binding loop, and exhibits severe conformational distortion (see figure; key structural features are annotated as follows: membrane helix (blue), aromatic region (red), and heme-binding loop (orange)). 

      Results:

      Line 101: The following text has been added: “Loss of cyp19a1b function was further confirmed by measuring cyp19a1b transcript levels in the brain and by predicting the three-dimensional structure of the mutant protein. Real-time PCR revealed that transcript levels were reduced by half in cyp19a1b<sup>+/−</sup> males and were nearly undetectable in cyp19a1b<sup>−/−</sup> males, presumably as a result of nonsense-mediated mRNA decay (Lindeboom et al., 2019) (Figure 1C). The wild-type protein, modeled by AlphaFold 3, exhibited a typical cytochrome P450 fold, including the membrane helix, aromatic region, and hemebinding loop, all arranged in the expected configuration (Figure 1—figure supplement 1C). The mutant protein, in contrast, was severely truncated, retaining only the membrane helix (Figure 1—figure supplement 1C). The absence of essential domains strongly indicates that the allele encodes a nonfunctional Cyp19a1b protein. Together, transcript and structural analyses consistently demonstrate that the mutation generated in this study causes a complete loss of cyp19a1b function.”

      Materials and methods

      Line 438: A subsection entitled “Real-time PCR” has been added. The text of this subsection is as follows: “Total RNA was isolated from the brains of cyp19a1b<sup>+/+</sup>, cyp19a1b<sup>+/−</sup>, and cyp19a1b<sup>−/−</sup> males using the RNeasy Plus Universal Mini Kit (Qiagen, Hilden, Germany). cDNA was synthesized with the SuperScript VILO cDNA Synthesis Kit (Thermo Fisher Scientific, Waltham, MA). Real-time PCR was performed on the LightCycler 480 System II using the LightCycler 480 SYBR Green I Master (Roche Diagnostics). Melting curve analysis was conducted to verify that a single amplicon was obtained in each sample. The β-actin gene (actb; GenBank accession number NM_001104808) was used to normalize the levels of target transcripts. The primers used for real-time PCR are shown in Supplementary file 2.”

      Line 448: A subsection entitled “Protein structure prediction” has been added. The text of this subsection is as follows: “Structural predictions of Cyp19a1b proteins were conducted using AlphaFold 3 (Abramson et al., 2024). Amino acid sequences corresponding to the wild-type allele and the mutant allele generated in this study were submitted to the AlphaFold 3 prediction server. The resulting models were visualized with PyMOL (Schrödinger, New York, NY), and key structural features, including the membrane helix, aromatic region, and heme-binding loop, were annotated.”

      References

      The following two references have been added:

      Abramson J, Adler J, Dunger J, Evans R, Green T, Pritzel A, Ronneberger O, Willmore L, Ballard AJ, Bambrick J, Bodenstein SW, Evans DA, Hung CC, O'Neill M, Reiman D, Tunyasuvunakool K, Wu Z, Žemgulytė A, Arvaniti E, Beattie C, Bertolli O, Bridgland A, Cherepanov A, Congreve M, CowenRivers AI, Cowie A, Figurnov M, Fuchs FB, Gladman H, Jain R, Khan YA, Low CMR, Perlin K, Potapenko A, Savy P, Singh S, Stecula A, Thillaisundaram A, Tong C, Yakneen S, Zhong ED, Zielinski M, Žídek A, Bapst V, Kohli P, Jaderberg M, Hassabis D, Jumper JM. 2024. Accurate structure prediction of biomolecular interactions with AlphaFold 3. Nature 630:493–500. DOI: https://doi.org/10.1038/s41586-024-07487-w

      Lindeboom RGH, Vermeulen M, Lehner B, Supek F. 2019. The impact of nonsense-mediated mRNA decay on genetic disease, gene editing and cancer immunotherapy. Nature Genetics 51:1645–1651.DOI:https://doi.org/10.1038/s41588-019-0517-5

      Figure 1

      The real-time PCR results described above have been incorporated in Figure 1, panel C, with the corresponding legend provided below (line 788).

      (C) Brain cyp19a1b transcript levels in cyp19a1b<sup>+/+</sup>, cyp19a1b<sup>+/−</sup>, and cyp19a1b<sup>−/−</sup> males (n = 6 per genotype). Mean value for cyp19a1b<sup>+/+</sup> males was arbitrarily set to 1.

      The subsequent panels have been renumbered accordingly. The entirety of the revised Figure 1.

      Figure 1—figure supplement 1

      The AlphaFold 3-generated structural models described above have been incorporated in Figure 1— figure supplement 1, panel C, with the corresponding legend provided below (line 811).

      (C) Predicted three-dimensional structures of wild-type (left) and mutant (right) Cyp19a1b proteins. Key structural features are annotated as follows: membrane helix (blue), aromatic region (red), and heme-binding loop (orange).

      The entirety of the revised Figure 1—figure supplement 1 is presented

      The information on the primers used for real-time PCR has been included in Supplementary file 2.

      The functional deficiency of esr2a was already addressed in the previous revision. For clarity, we have reproduced the relevant information here.

      A previous study reported that female medaka lacking esr2a fail to release eggs due to oviduct atresia (Kayo et al., 2019, Sci Rep 9:8868). Similarly, in this study, some esr2a-deficient females exhibited spawning behavior but were unable to release eggs, although the sample size was limited (Δ8 line: 2/3; Δ4 line: 1/1). In contrast, this was not observed in wild-type females (Δ8 line: 0/12; Δ4 line: 0/11). These results support the effective loss of esr2a function. To incorporate this information into the manuscript, the following text has been added to the Materials and methods (line 423): “A previous study reported that esr2a-deficient female medaka cannot release eggs due to oviduct atresia (Kayo et al., 2019). Likewise, some esr2a-deficient females generated in this study, despite the limited sample size, exhibited spawning behavior but were unable to release eggs (Δ8 line: 2/3; Δ4 line: 1/1), while such failure was not observed in wild-type females (Δ8 line: 0/12; Δ4 line: 0/11). These results support the effective loss of esr2a function.”

      Most experiments are weakly powered (low sample size).

      This comment is essentially the same as one raised in the first review (Reviewer #3’s comment 7 on weaknesses). We acknowledge the reviewer’s concern that the histological analyses were weakly powered due to the limited sample size. In our earlier revision, we responded as follows:

      Histological analyses were conducted with a relatively small sample size, as our previous experience suggested that interindividual variability in the results would not be substantial. Since significant differences were detected in many analyses, further increasing the sample size was deemed unnecessary.

      The variability of the mRNA content for a same target gene between experiments (genotype comparison vs E2 treatment comparison) raises questions about the reproducibility of the data (apparent disappearance of genotype effect).

      This comment is the same as one raised in the first review (Reviewer #3’s comment 8 on weaknesses), which we already addressed in our initial revision. For the reviewer’s convenience, we provide the response below:

      As the reviewer pointed out, the overall area of ara expression is larger in Figure 2J than in Figure 2F. However, the relative area ratios of ara expression among brain nuclei are consistent between the two figures, indicating the reproducibility of the results. Thus, this difference is unlikely to affect the conclusions of this study.

      Additionally, the differences in ara expression in pPPp and arb expression in aPPp between wild-type and cyp19a1b-deficient males appear less pronounced in Figures 2J and 2K than in Figures 2F and 2H. This is likely attributable to the smaller sample size used in the experiments for Figures 2J and 2K, resulting in less distinct differences. However, as the same genotype-dependent trends are observed in both sets of figures, the conclusion that ara and arb expression is reduced in cyp19a1b-deficient male brains remains valid.

      Conclusions:

      Overall, the claims regarding role of estrogens originating in the brain on male sexual behavior is supported by converging evidence from multiple mutant lines. The role of brain-derived estrogens on gene expression in the brain is weaker as are the results in females. 

      We appreciate the reviewer’s positive evaluation of our findings on male behavior. The concern regarding the role of brain-derived estrogens in gene expression has been addressed in our rebuttal, and the female data have been removed so that the analysis now focuses on males. The specific revisions for removing the female data are described in Response to reviewer #1’s comment 6 on weaknesses.

      Recommendations For The Authors:

      Reviewer #1 (Recommendations For The Authors):

      The manuscript is improved slightly. I am thankful the authors addressed some concerns, but for several concerns the referees raised, the authors acknowledged them yet did not make corresponding changes to the manuscript or disagreed that they were issues at all without explanation. All reviewers had issues with the imbalanced focus on males versus females and the male aggression assay. Yet, they did not perform additional experiments or even make changes to the framing and scope of the manuscript. If the authors had removed the female data, they may have had a more cohesive story, but then they would still be left with inadequate behavior assays in the males. If the authors don't have the time or resources to perform the additional work, then they should have said so. However, the work would be incomplete relative to the claims. That is a key point here. If they change their scope and claims, the authors avoid overstating their findings. I want to see this work published because I believe it moves the field forward. But the authors need to be realistic in their interpretations of their data. 

      In response to this and related comments, we have removed the female data and focused the manuscript on analyses in males. The specific revisions are described in Response to reviewer #1’s comment 6 on weaknesses. Additionally, we have validated that the cyp19a1b mutation in our medaka leads to loss of function (see Response to reviewer #3’s comment 1 on weaknesses), which further strengthens the reliability of our conclusions regarding male behavior.

      I agree with the reviewer who said we need to see validation of the absence of functional cyp19a1 b in the brain. However, the results from staining for the protein and performing in situ could be quizzical. Indeed, there aren't antibodies that could distinguish between aromatase a and b, and it is not uncommon for expression of a mutated gene to be normal. One approach they could do is measure aromatase activity, but they are *sort of* doing that by measuring brain E2. It's not perfect, but we teleost folks are limited in these areas. At the very least, they should show the predicted protein structure of the mutated aromatase alleles. It could show clearly that the tertiary structure is utterly absent, giving more support to the fact that their aromatase gene is non-functional. 

      As noted above, we have further validated the loss of cyp19a1b function by measuring cyp19a1b transcript levels in the brain and predicting the three-dimensional structure of the mutant protein. These analyses confirmed that cyp19a1b function is indeed lost, thereby increasing the reliability of our conclusions. For further details, please refer to Response to reviewer #3’s comment 1 on weaknesses.

      With all of this said, the work is important, and it is possible that with a reframing of the impact of their work in the context of their findings, I could consider the work complete. I think with a proper reframing, the work is still impactful. 

      In accordance with this feedback, and as described above, we have reframed the manuscript by removing the female data and focusing exclusively on males. This revision clarifies the scope of our study and reinforces the support for our conclusions. For further details, please refer to Response to reviewer #1’s comment 6 on weaknesses.

      (1) Clearly state in the Figure 1 legend that each data point for male aggressive behaviors represents the total # of behaviors calculated over the 4 males in each experimental tank.

      In response to this comment, we have revised the legend of Figure 1K (line 797). The original legend, “(K) Total number of each aggressive act observed among cyp19a1b<sup>+/+</sup>, cyp19a1b<sup>+/−</sup>, or cyp19a1<sup>−/−</sup> males in the tank (n = 6, 7, and 5, respectively),” has been updated to “(K) Total number of each aggressive act performed by cyp19a1b<sup>+/+</sup>, cyp19a1b<sup>+/−</sup>, and cyp19a1b<sup>−/−</sup> males. Each data point represents the sum of acts recorded for the 4 males of the same genotype in a single tank (n = 6, 7, and 5 tanks, respectively).” This clarifies that each data point reflects the total behaviors of the 4 males within each tank.

      (2) The authors wrote under "Response to reviewer #1's major comment "...the development of male behaviors may require moderate neuroestrogen levels that are sufficient to induce the expression of ara and arb, but not esr2b, in the underlying neural circuitry": "This may account for the lack of aggression recovery in E2-treated cyp19a1b-deficient males in this study.".

      What is meant by the latter statement? What accounts for the lack of aggression? The lack of increase in esr2b? Please clarify. 

      Line 365: In response to this comment, “This may account for the lack of aggression recovery in E2treated cyp19a1b-deficient males in this study.” has been revised to “Considering this, the lack of aggression recovery in E2-treated cyp19a1b-deficient males in this study may be explained by the possibility that the E2 dose used was sufficient to induce not only ara and arb but also esr2b expression in aggression-relevant circuits, which potentially suppressed aggression.”

      This revision clarifies that, while moderate brain estrogen levels are sufficient to promote male behaviors via induction of ara and arb, the E2 dose used in this study may have additionally induced esr2b in circuits relevant to aggression, potentially underlying the lack of aggression recovery.

      (3) This is a continuation of my comment/concern directly above. If the induction of ara and arb aren't enough, then how can, as the authors state, androgen signaling be the primary driver of these behaviors? 

      In response to this follow-up comment, we would like to clarify that, as described above, the lack of aggression recovery in E2-treated cyp19a1b-deficient males is not due to insufficient induction of ara and arb, but instead is likely because esr2b was also induced in aggression-relevant circuits, which may have suppressed aggression. Therefore, the concern that androgen signaling cannot be the primary driver of these behaviors is not applicable.

      (4) The authors' point about sticking with the terminology for the ar genes as "ara" and "arb" is not convincing. The whole point of needing a change to match the field of neuroendocrinology as a whole (that is, across all vertebrates) is researchers, especially those with high standing like the Okubo group, adopt the new terminology. Indeed, the Okubo group is THE leader in medaka neuroendocrinology. It would go a long way if they began adopting the new terminology of "ar1" and "ar2". I understand this may be laborious to a degree, and each group can choose to use their terminology, but I'd be remiss if I didn't express my opinion that changing the terminology could help our field as a whole. 

      We sincerely appreciate the reviewer’s thoughtful comments regarding nomenclature consistency in vertebrate neuroendocrinology. We understand the motivation behind the suggestion to adopt ar1 and ar2. However, we consider the established nomenclature of ara and arb to be more appropriate for the following reasons.

      First, adopting the ar1/ar2 nomenclature would introduce a discrepancy between gene and protein symbols. According to the NCBI International Protein Nomenclature Guidelines (Section 2B.Abbreviations and symbols;

      https://www.ncbi.nlm.nih.gov/genbank/internatprot_nomenguide/), the ZFIN Zebrafish Nomenclature Conventions (Section 2. PROTEINS:https://zfin.atlassian.net/wiki/spaces/general/pages/1818394635/ZFIN+Zebrafish+Nomenclature+Con ventions), and the author guidelines of many journal

      (e.g.,https://academic.oup.com/molehr/pages/Gene_And_Protein_Nomenclature), gene and protein symbols should be identical (with proteins designated in non-italic font and with the first letter capitalized). Maintaining consistency between gene and protein symbols helps avoid unnecessary confusion. The ara/arb nomenclature allows this, whereas ar1/ar2 does not.

      Second, the two androgen receptor genes in teleosts are paralogs derived from the third round of wholegenome duplication that occurred early in teleost evolution. For such duplicated genes, the ZFIN Zebrafish Nomenclature Conventions (Section 1.2. Duplicated genes) recommend appending the suffixes “a” and “b” to the approved symbol of the human or mouse ortholog. This convention clearly indicates that these genes are whole-genome duplication paralogs and provides an intuitive way to represent orthologous and paralogous relationships between teleost genes and those of other vertebrates. As a result, it has been widely adopted, and we consider it logical and beneficial to apply the same principle to androgen receptors.

      In light of these considerations, we respectfully maintain that the ara/arb nomenclature is more suitable for the present manuscript than the alternative ar1/ar2 system.

      (5) In the discussion please discuss these potentially unexpected findings.

      (a) gal was unaffected in female cyp19a1 mutants, but they exhibit mating behaviors towards females. Given gal is higher in males and these females act like females, what does this mean about the function of gal/its utility in being a male-specific marker (is it one??)? 

      (b) esr2b expression is higher in female cyp19a1 mutants. this is unexpected as well given esr2b is required for female-typical mating and is higher in females compared to males and E2 increases esr2b expression. please explain...well, what this means for our idea of what esr2b expression tell us. 

      We thank the reviewer for the insightful comments. As the female data have been removed from the manuscript, discussion of these findings in female cyp19a1b mutants is no longer necessary.

      Reviewer #3 (Recommendations For The Authors):

      The authors have addressed a number of answers to the reviewer's comments, notably they provided missing methodological information and rephrased the text. However, the authors have not addressed the main issues raised by the reviewers. Notably, it is regrettable that the reduced amount of brain aromatase cannot be confirmed, this seems to be the primary step when validating a new mutant. Even if protein products of the two genes may not be discriminated (which I can understand), it should be possible to evaluate the expression of a common messenger and/or peptide and confirm that aromatase expression is reduced in the brain. Since Cyp19a1b is relatively more abundant in the brain Cyp19a1a, this would strengthen the conclusion and provide confidence that the mutant indeed does silence aromatase expression in the brain. Although these short comings are acknowledged in the rebuttal letter, this is not mentioned in the discussion. Doing so would make the manuscript more transparent and clearer. 

      As noted in Response to reviewer #3’s comment 1 on weaknesses, we have validated the loss of Cyp19a1b function by measuring its transcript levels in the brain and predicting the three-dimensional structure of the mutant protein. These analyses confirmed that Cyp19a1b function is indeed lost, thereby increasing the reliability of our conclusions.

      FigS1 - panels C&D please indicate in which tissue were hormones measured. Blood?

      We thank the reviewer for pointing this out. In our study, “peripheral” refers to the caudal half of the body excluding the head and visceral organs, not blood. Accordingly, we have revised the figure legend and the description in the Materials and Methods section as follows:

      Legend for Figure 1B (line 787) now reads: “Levels of E2, testosterone, and 11KT in the brain (A) and peripheral tissues (caudal half of the body) (B) of adult cyp19a1b<sup>+/+</sup>, cyp19a1b<sup>+/−</sup>, and cyp19a1b<sup>−/−</sup> males (n = 3 per genotype).”

      Materials and methods (line 431): The sentence “Total lipids were extracted from the brain and peripheral tissues (from the caudal half) of” has been revised to “Total lipids were extracted from the brain and from peripheral tissues, specifically the caudal half of the body excluding the head and visceral organs, of.”

      Additional Alterations:

      We have reformatted the text and supporting materials to comply with the journal’s Author Guidelines. The following changes have been made:

      (1) Figures and supplementary files are now provided separately from the main text.

      (2) The title page has been reformatted without any changes to its content.

      (3) In-text citations have been changed from numerical references to the author–year format.

      (4) Figure labels have been revised from “Fig. 1,” “Fig. S1,” etc., to “Figure 1,” “Figure 1—figure supplement 1,” etc.

      (5) Table labels have been revised from “Table S1,” etc., to “Supplementary file 1,” etc.

      (6) Line 324: The typo “is” has been corrected to “are”.

      (7) Line 382: The section heading “Materials and Methods” has been changed to “Materials and methods” (lowercase “m”).

      (8) Line 383: The Key Resources Table has been placed at the beginning of the Materials and methods section.

      (9) Line 389: The sentence “Sexually mature adults (2–6 months) were used for experiments, and tissues were consistently sampled 1–5 hours after lights on.” has been revised to “Sexually mature adults (2–6 months) were used for experiments and assigned randomly to experimental groups. Tissues were consistently sampled 1–5 hours after lights on.”

      (10)  Line 393: The sentence “All fish were handled in accordance with the guidelines of the Institutional Animal Care and Use Committee of the University of Tokyo.” has been removed.

      (11)  Line 589: The following sentence has been added: “No power analysis was conducted due to the lack of relevant data; sample size was estimated based on previous studies reporting inter-individual variation in behavior and neural gene expression in medaka.”

      (12)  Line 598: The reference list has been reordered from numerical sequence to alphabetical order by author.

      (13)  In the figure legends, notations such as “A and B” have been revised to “A, B.”

    1. Note: This response was posted by the corresponding author to Review Commons. The content has not been altered except for formatting.

      Learn more at Review Commons


      Reply to the reviewers

      Dear editor and reviewers,

      We sincerely thank you for your thoughtful comments and constructive suggestions, which have greatly improved the quality and clarity of our manuscript. In response, we have implemented all requested changes, which are highlighted in yellow throughout the revised text, and updated several figures accordingly. Furthermore, we have performed all additional experiments recommended by the reviewers and incorporated the new data into the manuscript. To enhance clarity, we have also included a schematic representation of our proposed model in an additional figure, providing a concise visual summary of our findings.

      We hope that these revisions fully address all concerns raised by the reviewers and meet all the expectations for publication.

      Below, we answer the reviewers point by point (in blue).


      Reviewer #1 (Evidence, reproducibility and clarity (Required)):

      In this paper, the authors address the important question of the role of centrosomes during neuronal development. They use Drosophila as an in vivo model. The field is somewhat unclear on the role and importance of centrosomes during neuronal development, although the current data would suggest they are dispensable for axon specification and growth. Early studies in cultured mammalian neurons showed that centrosomes are active and that their microtubules can be cut and transported into the neurites. But a study then showed that centrosomes in these cultured neurons are deactivated relatively early during neuronal development in vitro and that ablating centrosomes even when they are active had no obvious effect on axon specification and growth. Consistent with this, a study in Drosophila provided evidence that centrosomes were not active or necessary in different types of neurons. More recently, a study showed that centrosomal microtubules are dispensable for axon specification and growth in mice in vivo but are required for neuronal migration in the cerebral cortex. However, another study has linked the generation of acetylated microtubules at centrosomes with axon development. In this current study, the authors examine the effect of centrosome loss on various motor and sensory neurons and muscles mainly by examining mutants in essential centriole duplication genes. They associate axonal routing and morphology defects with centrosome loss and provide some evidence that centrosomes could still be active in the developing neurons. Overall, they conclude that centrosomes are active during at least early neuronal development and that this activity is important for proper axonal morphology and routing.

      While I think this study addressing a very interesting and important question, I think as it stands the data is not sufficient to be conclusive on a role for centrosomes during neuronal development. My biggest concern is that most phenotypes have not yet been shown to be cell autonomous, as whole animal mutants have been analysed rather than analysing the effect of cell-specific depletion, and the evidence for active centrosomes needs to be strengthened. If the authors can provide stronger evidence for a role of centrosomes in axonal development then the paper will certainly be of interest to a broad readership.

      We thank the reviewer for the clear and concise summary and fully agree that our study addresses a critical gap in understanding. Centrosomes have long been implicated in morphogenesis, yet their precise contribution to nervous system development has remained unclear. Our findings provide compelling evidence that centrosomes are indispensable for proper nervous system formation and that their absence also triggers muscular defects, highlighting their broader role in tissue organization.

      We acknowledge that the original manuscript lacked some key details; therefore, we have now strengthened our conclusions with additional experiments. Specifically, we demonstrate that these effects are cell-autonomous by using two independent RNAi lines targeted to a subset of motor neurons. Furthermore, we present new data showing that neuronal centrosomes remain active during the early stages of axonal development, emphasising their functional relevance in morphogenesis. All new experiments, figures, and corresponding text revisions are detailed below.

      Major comments 1) The sas-6 transallelic combination shows only 17% embryonic lethality compared to 50% embryonic lethality with sas-4 mutants. Given that both mutants should result in the same degree of centrosome loss (this should be quantified in sas-6 mutants) it would suggest that either sas-4 has other roles away from centrosomes or that the sas-4 mutant chromosome used in the experiment has other mutations that affect viability. The effect of picking up "second-site lethal" mutations on mutant chromosomes is common and so I would not be surprised if this is the reason for the difference in phenotypes. This can be addressed either by "cleaning up" the sas-4 mutant chromosome by backcrossing to wild-type lines, allowing recombination to occur and replace the potential second site mutations, or by using transallelic combinations of sas-4, as they did for sas-6. The "easier" option may just be to analyse all the phenotypes with the sas-6 transallelic combination.

      We appreciate this comment, as it brought to light an issue with the CRISPR line Sas-6-Δa. Upon reanalysing all the data, we determined that this line is embryonic lethal both in homozygosis and when combined with the deficiency uncovering the genomic region, Df(3R)BSC794. In contrast, Sas-6-Δb homozygotes are viable. The inconsistency between these results raised concerns about whether the Δa and Δb Sas-6 mutants carry deletions confined to the Sas-6 coding region. Although this would not hinder our cell biology analysis, it could represent a problem in viability tests. To address this, we repeated all analyses using Sas-6-Δb homozygotes and Sas-6-Δb combined with Df(3R)BSC794. These new results are more consistent and indicate that approximately 50% of Sas-6/Def individuals hatch as adults. Fig. 3 was redone and the manuscript text changed in view of these results.

      2) Using "whole animal" mutants for assessing neuronal morphology is risky due to non-cell-autonomous effects. The authors have carried out some phenotypic analysis of neurons depleted of Sas-4 by cell-specific RNAi, but I feel they need to do this for all of their analysis. This includes embryonic lethality measures, quantification of centrosome numbers, and all axonal phenotypes in Sas-4 RNAi neurons. It would also be prudent to use 2 distinct RNAi lines to help ensure any phenotypes are not off-target effects (and this may help clarify why the authors see some additional phenotypes with RNAi). Indeed, there are relatively weak phenotypes in muscles when using RNAi compared to the mutants and these potential non-cell-autonomous effects could then have a knock-on effect on neuronal morphology. If the authors were concerned that RNAi is not very efficient (explaining any potential weaker phenotypes than in mutants) the authors could examine the effectiveness of RNAi lines by analysing protein depletion by western blotting or mRNA depletion by rt-qPCR (although this has to be done in a different cell type due to the difficulty in obtaining a neuronal extract).

      We have now added a new panel to supplementary Figure 1, showing how the expression of a different Sas-4 RNAi line (2) induces similar nervous system phenotypes when expressed only in aCC, pCC and RP2 pioneer neurons (Sup. Fig. 1 M-O).

      3) When analysing centriole presence or absence it is a good idea to stain with two different centriole markers e.g. Asl and Plp. This helps rule out unspecific staining. It is clear from the images that similar sized foci can be observed outside of the cells (see Figure 5A for example), so clearly some of the foci that appear to be within the cells may also be unspecific staining.

      In a new supplementary figure, we now show that Asl and Plp colocalize and quantify the number of times we find this colocalization in neurons (Supl. Fig 3). In addition, and we apologise for the confusion, but the reason why there are foci outside the marked cells is because these are wholemount embryonic stainings and the anti-Plp antibody marks all centrosomes in all cells in the embryo.

      4) The evidence for active centrosomes is not that convincing. Acetylated tubulin is associated with stable MTs, which are not normally organised by "active" centrosomes that nucleate dynamic microtubules. Moreover, it is plausible that centriole foci happen to overlap with the acetylated tubulin staining by chance. This would explain why not all centrosomes colocalise with acetylated tubulin signal. The authors could better test centrosome activity by performing live imaging with EB1-GFP. If centrosomes are active, it is very easy to observe the many comets produced by the centrosomes.

      We appreciate the reviewer’s comment and agree that acetylated tubulin alone is not an ideal marker for centrosome activity. To address this, we performed live imaging of aCC neurons expressing EB1-GFP together with Asl-Tomato. This was technically challenging because we were imaging only two neurons per segment in live embryos, under significant limitations in fluorescence detection and timing. Despite these constraints, we were able to clearly observe EB1 comets emerging from the centrosome and moving toward the cell periphery, providing direct evidence of microtubule nucleation from centrosomes in neurons.

      Importantly, we complemented this with a microtubule depolymerization/polymerization assay, which provides unequivocal evidence that polymerization initiates at the centrosome. After depolymerization, we observed microtubule regrowth from the centrosome, confirming its role as an active microtubule-organizing centre in these neurons. Together, we hope that these results are enough to demonstrate that neuronal centrosomes are functionally active during early axonal development. These experiments are presented in Figure 6 and corresponding text in the manuscript.

      5) If the authors believe that centrosomes have a role in axon pathfinding in sensory neurons, they should show that these centrosomes are active, at least during early stages (again using EB1-GFP imaging).

      We appreciate the reviewer’s suggestion and agree that EB1-GFP imaging would be the most direct way to assess centrosome activity in sensory neurons. However, performing time-lapse imaging in these neurons is technically very demanding due to their location and accessibility in live embryos, and we did not attempt this approach. Instead, we now provide new evidence showing that sensory neuron centrosomes colocalize with both α-tubulin and γ-tubulin. This strongly supports that these centrosomes are associated with microtubule nucleation machinery and are as likely as motor neuron centrosomes to be active during early stages of axon development. These new data have been included in the revised manuscript (see Figure 5 and corresponding text).

      6) The authors mention in the discussion that "increased JNK activity, can result in axonal wiggliness (Karkali et al, 2023)". I therefore wonder whether centrosome loss may induce JNK activation (the stress response), as this would then indicate an indirect effect of centrosome loss on axonal structure rather than a direct influence of centrosome-generated microtubules. The authors could assess whether the DNK-JNK pathway is activated in neurons lacking centrosomes by expression UAS-Puc-GFP and quantifying the nuclear signal.

      In a new supplementary figure, we now show by using a reporter for JNK signalling, as requested, that Sas-4 neurons do not activate the JNK pathway (Supl. Fig 4).

      7) In Figure 5, the authors claim that they find "a correlation between axonal guidance phenotypes and the numbers of centrioles per embryo". I don't think this is a strong correlation. The difference in centriole number between embryos with no defects and those with defects is very small. In contrast, the difference between centriole numbers in control (no defects) and mutant (no defects) is very large. So, there does not appear to be a strong correlation between centrosome number and phenotype.

      We agree and we have corrected this sentence to better explain the results.

      Minor comments

      1) I don't understand Figure 3C - why do the % of surviving homozygotes and heterozygotes add up to 100%? Should the grey boxes not relate to dead and the white to surviving?

      Thank you for pointing this out. Figures 1B and 3C represent only the surviving individuals. The grey boxes correspond to surviving homozygotes, and the white boxes correspond to surviving heterozygotes. The percentages add up to 100% only at embryonic stages because all embryos reach late embryonic stages. The grey and white boxes reflect the proportion of these two genotypes among the survivors, not the total number of embryos including those that died. We have changed the text to convey this.

      2) "In mouse fibroblasts, myoblasts and endothelial cells, centrosome orientation is important for nuclear positioning and cell migration(Chang et al, 2015; Gomes et al, 2005; Kushner et al, 2014)." Do you mean "centrosome position"?

      Yes, text changed, thank you for spotting it.

      3) In the introduction, the authors mention Meka et al. when saying the centrosomal microtubules are important for axonal development, but they should also discuss the counter argument from Vinopal et al., 2023 (Neuron) that showed how centrosomes were required for neuronal migration but not axon growth, which was instead mediated by Golgi-derived microtubules.

      Done, thank you very much.

      4) Lines 228-230 - repeated sentence

      Corrected, thank you very much.

      5) Additionally, we did not detect centrioles in the quadrant opposite the axon exit point (Fig. 2B n=75) - this data is not in Fig 2B

      Correct, it is in figure 4B, thank you very much.

      6) "This significant decrease in the humber of centrioles further supports the critical role of Sas-4 in pioneer neurons of the ventral nerve cord (VNC) during Drosophila embryogenesis". It rather highlights that Sas-4 is required for centriole formation in these neurons. Also, humber = number.

      We agree, and have changed the text, thank you very much.

      7) Result title: Non-ciliated sensory neurons have centrioles. This is kind of obvious. A better title may be "axon phenotypes correlate with centriole numbers in sensory neurons" but unfortunately i don't think there is good evidence for this (See major point above).

      We agree and we have changed. We now believe we have strong evidence to support it. We hope the additional data presented in the revision convincingly demonstrate this point.

      Reviewer #1 (Significance (Required)):

      As mentioned above, the advance will be important if more evidence is provided. In this case, the paper will be interesting to a broad readership. But currently the paper is limited by the lack of evidence for centrosome function and activity in the neurons.

      We hope that reviewer 1, now considers that the manuscript is not limited anymore and that it shows convincing evidence for centrosome function and activity in embryonic neurons.

      Reviewer #2 (Evidence, reproducibility and clarity (Required)):

      Summary: In this manuscript, Gonzalez et al. examine the potential function of centrosomes in the neurons and muscle cells of Drosophila embryos. By studying various mutant and RNAi lines in which centriole duplication has been disrupted, they conclude that the loss of centrioles disrupts axonal pathfinding and muscle integrity.

      Major points: 1. Throughout the manuscript, the phenotypes presented are often quite subtle. For this reason, I would really recommend that these experiments are scored blind. Perhaps the authors did this, but I didn't see any mention of this.

      All our phenotypic analyses are performed blind. We apologize for not having originally included this information in the Methods section; it has now been added. Embryos are stained using colorimetric methods (DAB) to label the nervous system, while balancer chromosomes are marked with a fluorescent antibody. This approach allows us to assess and quantify phenotypes using white light without knowing whether the embryos are homozygous mutants or heterozygous, which can only be detected by changing the channels to fluorescence.

      1. The authors conclude that neurons have active centrioles that function as centrosomes (Figure 6), but the data here is confusing. The authors state that in these cells they observe acetylated MTs extending from the centrosomes and these colocalised with g-tubulin. But the authors don't show the overlap between centrosomes, g-tubulin and MTs, as they stain for these separately. This is problematic, as it was not clear from these images that the majority of the MTs really are extending from the centrosome: the centrosome may just associate or be close by to these MT cables (Figure 6A,B). Moreover, the authors show that only a fraction of the centrosomes in these cells associate with g-tubulin, so presumably in cells where the centrosomes lack g-tubulin they would not expect the centrosomes to be associated with the MTs-but they do not show that this is the case. Perhaps the authors can't test this, but an alternative would be to show that these MT arrays are absent in Sas-4 mutants. This would give more confidence that these MTs arise from the centrosomes.

      We agree that the initial data based on acetylated microtubules and γ-tubulin colocalization were not sufficient to conclude that microtubules originate from the centrosome, as these markers can only suggest association. To address this, we have now included additional experiments that provide direct evidence of centrosome activity.

      First, we performed live imaging of aCC neurons expressing EB1-GFP together with Asl-Tomato. Despite the technical challenges of imaging only two neurons per segment in live embryos under strict fluorescence and timing constraints, we were able to clearly observe EB1 comets emerging from the centrosome and moving toward the cell periphery. This demonstrates active microtubule nucleation from centrosomes rather than mere proximity to microtubule bundles.

      Second, we carried out a microtubule depolymerization/polymerization assay, which provides unequivocal evidence that polymerization initiates at the centrosome. After depolymerization, microtubules regrew from the centrosome, confirming its role as an active microtubule-organizing center. These experiments go beyond colocalization and directly address the concern that centrosomes might simply be adjacent to microtubule cables.

      Regarding the suggestion to use Sas-4 mutants, while we did not perform this experiment, the regrowth assay combined with EB1 imaging strongly supports that these microtubules originate from the centrosome. All new data are presented in Figure 6 and the corresponding text in the revised manuscript.

      1. The authors show that muscle cell integrity is compromised by centriole-loss (Figure 2). This is very surprising as it is widely believed that centrosomes are non-functional in muscle cells, and the MTs are instead organised around the nuclear envelope. I'm not aware of the situation in Drosophila muscle cells, but the authors should ideally try to examine if the centrioles are functioning as centrosomes in these cells. At the very least they should discuss how they think centriole-loss is influencing the muscle integrity when it is widely believed they are inactive in these cells.

      We do not claim that centrosomes are active in muscle cells at these developmental stages. The observed muscle defects could result from earlier processes such as cell division, migration, or muscle fusion. We agree that this is an intriguing observation; however, pursuing this question further would go beyond the scope of the current manuscript. As requested by the reviewer, we have now expanded the discussion to consider how centriole loss might impact muscle integrity.

      Regardless of the strength of the supporting data, I think the authors should tone down their conclusions. The title and abstract led me to believe that centriole loss would cause significant problems in axonal pathfinding and muscle integrity. In all the mutant specimens examined (and certainly the low magnification views shown in Figure 1D'-F', Figure 1I'-K' and Figure 2D'-F') the mutants look very similar to the WT. Many readers may not get past the title and abstract, so the authors should make it clearer that these defects are very subtle.

      We have changed the text to convey this idea.

      Minor points: 1. In Figures 4 and 5, CP309 staining is relied on to identify centrioles, but there is quite a background of non-specific dots, making it hard to be certain what is a centriole and what isn't. For example, in Figure 5D' there are lots of dots within some of the cells - are any of these centrioles? How can the authors be certain which dot is a centriole in some of the cells shown in Figure 5C'? Is it possible to use a second marker and only count as centrioles dots that are recognised by both antibodies?

      We thank the reviewer for this suggestion and agree that using a second marker improves confidence in centriole identification. In a new supplementary figure (Supplementary Fig. 3), we now show that Asl and Plp colocalize in neurons and provide a quantification of the frequency of this colocalization. This dual labelling confirms the identity of centrioles and addresses the concern about non-specific background.

      We also apologize for any confusion regarding the presence of foci outside the marked cells. These images are whole-mount embryonic stainings, and the anti-Plp antibody labels all centrosomes in all cells of the embryo, which explains the additional foci observed.

      In the abstract that authors state that traditionally centrosomes have been considered to be non-essential in terminally differentiated cells. I don't think this is correct. In the standard "textbook" view of a cell, the centrosome is normally positioned in the centre of the cell organising an extensive array of MTs that are thought play an important role in organising intracellular transport, the positioning and movement of organelles and the maintenance and establishment of cell polarity. I don't think it is only recent evidence that suggests they play vital roles in terminally differentiated cells.

      We thank the reviewer for this correction and we have changed the text accordingly.

      1. Line 162 the authors state that in the RNAi knockdown lines they observe several additional phenotypes, but then in the same sentence (Line 164) they say that these defects were also observed in the original mutant and mutant/Df lines.

      We apologise for this confusion, we have rearranged the sentence for clearance.

      The sentences in Line281-287 don't reference any of the Figures, so it seems the authors are just stating these results without presenting any data (e.g. "Significantly, we also found a correlation between axonal guidance phenotypes and the numbers of centrioles per embryo". If they've tested this correlation, they should show it.

      We have rearranged the sentences for better understanding.

      In Figure 7 I did not understand how the authors measured tortuosity (wiggliness) and could see no description in the methods. This is important as, again the defect seems quite subtle, but perhaps I am not understanding which bits of the axon are being measures. Is it just the small bit of the axons close to the asterixis that is being measured, or the whole FasII track?

      We have now added another quantification and additional descriptions in the methods section.

      Reviewer #2 (Significance (Required)):

      The potential function of centrosomes in axonal outgrowth is quite controversial, so this study is potentially of considerable interest.

      However, several aspects of the data presented here were confusing or not terribly convincing. In its present state, I don't think the main conclusions are strongly enough supported by the data.

      We hope that reviewer 2, now considers that the manuscript is not confusing anymore and that it shows convincing evidence for centrosome function and activity in embryonic neurons.

      Reviewer #3 (Evidence, reproducibility and clarity (Required)):

      The manuscript of González et al. entitled "Centriole Loss in Embryonic Development Disrupts Axonal Pathfinding and Muscle Integrity" deals with the role of centrosomes in shaping axonal morphology. To this aim the AA analysed Drosophila Sas-4 mutants that are reported to develop until adult stage without centrioles. Remarkably, the AA observe that 50% of the homozygous mutant embryos fail to hatch as larvae. The present observations suggest that centrosome loss results in axonemal shaping defects and muscle developmental abnormalities. Finally, the AA show the presence of functional centrosomes in neurons. In my opinion, the manuscript is interesting because shows unexpected findings. However, to justify these new findings the AA are required to improve some experimental observations.

      We thank the reviewer for his summary of our work and for considering it interesting. We have taken into account all the comments and believe that these have helped improve our manuscript.

      Major: Abstract- It is unclear in which phenotypic condition the observations of centrosome loss or centrosome presence have been found. Please better explain. l.36. embryos, larvae, adult, from Sas4 or controls? If mutants, the observations are very interesting since Sas4 would be without centrioles. Indeed, Basto et al., show that chemosensory neurons do not develop an axoneme in the absence of centrioles, but extend dendrites toward the sensory bristle.

      We have made clear which refer to wild-type and which are Centriole Loss (CL) conditions. CL conditions refer to mutant and downregulation conditions, whereas targeted downregulation refers to RNAi downregulation only in neurons.

      I do not think appropriate the use of "centriole" in the main title since the centrioles would be localized by true centriolar antigens rather than by centrosomal antigens. This problem occurs throughout the text and some figures where the AA image centrioles by centrosomal material. In Gig. 5A only the AA properly look at Asl localization. The other pictures of presumptive centrioles or centriole quantification report CP309 dots. This localization does not unequivocally reveal centrioles, since CP309 is essentially required for centrosome-mediated Mt nucleation. There are differentiated Drosophila tissues in which centrioles are present, but inactivated, and unable to recruit pericentriolar material. Mt are nucleated by ncMTOCs that contain centrosomal material and gamma-tubulin. Thus, the centrosomal antigens do not colocalize with centrioles.

      We have changed centrioles to centrosomes in the title and most sections in the manuscript. We have also included an extra control, showing that Asl and Plp colocalize and quantify the number of times we find this colocalization in neurons (Supl. Fig 3). Asl is a reliable and widely used marker for centrioles, as it localizes specifically to the centriole structure (Varmark H, Llamazares S, Rebollo E, Lange B, Reina J, Schwarz H, Gonzalez C. Asterless is a centriolar protein required for centrosome function and embryo development in Drosophila. Curr Biol. 2007 Oct 23;17(20):1735-45. doi: 10.1016/j.cub.2007.09.031. PMID: 17935995.)

      Minor: l. 58. The early arrest is mainly due to a checkpoint control. In double mutant for Sas4 and P53 the embryos survive longer, even if their further development is asrrested.

      We thank the reviewer for this comment, and we have changed the text accordingly.

      1. Previous works, also quoted by the AA, reported that in mature neurons the centrosome are inactivated, whereas the present manuscript describes functional centrosomes in Drosophila motor and peripheral nervous system. This is an intriguing observations that needs a better explanation in Discussion section.

      We thank the reviewer for this comment, and we have changed the discussion accordingly.

      l.143-145. I understand that 50% of the Sas4 embryos that reach the adult stage have centrioles. Is it correct? But if it is so, how the AA explain the absence of centrioles in sensory neurons of adult flies as reported by Basto et al. ?

      According to our results they have less centrioles than controls already at embryonic stages. In addition, as reported in Basto et al. they continue losing centrioles during larval stages and metamorphosis, which explains why centrioles are not detected at adult stages.

      l.215. It is unclear for me why the AA analyse Sas6 flies, unless explain the mutant phenotype.

      To strengthen our conclusions with Sas-4 and exclude the possibility that the observed phenotypes arise from a centrosome-independent function of Sas-4. For this reason, we have taken additional steps to confirm that the effects are specifically due to centrosome loss and we used Sas-6 mutants as one of these.

      l.221. How the centrioles have been quantified? What antibody, the AA used.

      We have quantified centrosomes using antibodies agains Plp (CP309) and Asl-YFP expression.

      l.244. and Fig 4C,D. I see high background with CP309. As reported previously I think better to use antibodies against centriolar proteins, such as Sas6, Ana1, Asl, or Sas4 ( if centrioles are present in 50% of mutants as the AA claim, the antibody could be also useful). In addition, I can see some CP309 spots in Fig 4E,F. Are they centrioles?

      Indeed, as we report, Sas-4 mutant embryos are not totally devoid of centrosomes. In addition, and we apologise for the confusion, but the reason why there are foci outside the marked cells in control embryos is because these are wholemount embryonic stainings and the anti-Plp antibody marks all centrosomes in all cells in the embryo, not just in the neurons.

      l.270 and Fig. 5A and Fig.5 C-E. Why the AA localize Cp309 and not Asl (Fig. 5A) to detect centrioles?

      In a new supplementary figure, we now show that Asl and Plp colocalize and quantify the number of times we find this colocalization in neurons (Supl. Fig 3). So, we can use CP309 in neurons to the same effect as Asl-

      L295-296. I cannot see Mts, but only a diffuse staining. I am expecting to see distinct Mt bundles.

      In figure 5 it is now easier to see the MT bundles in the new experiment in Fig. 5F-I , where we performed MT depolymerisation/repolymerisation: Nevertheless, we need to stress out that we are doing these analyses in wholemount embryonic stainings.

      326-327. How the AA explain this different lethality, even if both the proteins are involved in centriole assembly?

      We have now redone all the viability and mutant phenotype analysis using Sas-6 CRISPR mutant over the Deficiency, which is a better way to access the phenotype.

      335-337. In my opinion the quoted publications are not relevant.

      We believe that these references back up our hypothesis because:

      • Metzger et al 2012 stress the importance of nuclear position in muscle development in Drosophila
      • Loh et al 2023, relate centrosomes with nuclear migration in Drosophila
      • Tillery et al 2018, is a review describing MTs in muscle development in Drosophila.

      358-359. Does maternal contribution persist after gastrulation?

      While bulk degradation occurs by midblastula transition, some stable maternal products persist beyond gastrulation. In our case, if centrioles are formed due to the maternal contribution, they will only be diluted by cell division, which explains why we can detect centrioles at late embryonic stages.

      l.366. This is an intriguing point, but as previously observed I have some problem with centriole localization. References. Please uniform Journal abbreviations and control page numbers.

      I hope we have clarified this problem with the new experiments showing MT repolarization from the centrosomes in neurons.

      Reviewer #3 (Significance (Required)):

      The manuscript is potentially interesting for peoples working of cell and molecular biology, and development. However, the paper needs an additional working to be suitable for publication.

      We hope that reviewer 3, considers that the additional work and revision make this manuscript suitable for publication.

    1. Author response:

      The following is the authors’ response to the original reviews.

      Public Reviews:

      Reviewer #1 (Public Reviews):

      Summary:

      Argunşah et al. describe and investigate the mechanisms underlying the differential response dynamics of barrel vs septa domains of the whisker-related primary somatosensory cortex (S1). Upon repeated stimulation, the authors report that the response ratio between multi- and single-whisker stimulation increases in layer (L) 4 neurons of the septal domain, while remaining constant in barrel L4 neurons. This difference is attributed to the short-term plasticity properties of interneurons, particularly somatostatin-expressing (SST+) neurons. This claim is supported by the increased density of SST+ neurons found in L4 of the septa compared to barrels, along with a stronger response of (L2/3) SST+ neurons to repeated multi- vs single-whisker stimulation. The role of the synaptic protein Elfn1 is then examined. Elfn1 KO mice exhibited little to no functional domain separation between barrel and septa, with no significant difference in single- versus multi-whisker response ratios across barrel and septal domains. Consistently, a decoder trained on WT data fails to generalize to Elfn1 KO responses. Finally, the authors report a relative enrichment of S2- and M1-projecting cell densities in L4 of the septal domain compared to the barrel domain.

      Strengths:

      This paper describes and aims to study a circuit underlying differential response between barrel columns and septal domains of the primary somatosensory cortex. This work supports the view that barrel and septal domains contribute differently to processing single versus multi-whisker inputs, suggesting that the barrel cortex multiplexes sensory information coming from the whiskers in different domains.

      We thank the reviewer for the very neat summary of our findings that barrel cortex multiplexes converging information in separate domains.

      Weaknesses:

      While the observed divergence in responses to repeated SWS vs MWS between the barrel and septal domains is intriguing, the presented evidence falls short of demonstrating that short-term plasticity in SST+ neurons critically underpins this difference. The absence of a mechanistic explanation for this observation limits the work’s significance. The measurement of SST neurons’ response is not specific to a particular domain, and the Elfn1 manipulation does not seem to be specific to either stimulus type or a particular domain.

      We appreciate the reviewer’s perspective. Although further research is needed to understand the circuit mechanisms underlying the observed phenomenon, we believe our data suggest that altering the short-term dynamics of excitatory inputs onto SST neurons reduces the divergent spiking dynamics in barrels versus septa during repetitive single- and multi-whisker stimulation. Future work could examine how SST neurons, whose somata reside in barrels and septa, respond to different whisker stimuli and the circuits in which they are embedded. At this time, however, the authors believe there is no alternative way to test how the short-term dynamics of excitatory inputs onto SST neurons, as a whole, contribute to the temporal aspects of barrel versus septa spiking.

      The study's reach is further constrained by the fact that results were obtained in anesthetized animals, which may not generalize to awake states.

      We appreciate the reviewer’s concern regarding the generalizability of our findings from anesthetized animals to awake states. Anesthesia was employed to ensure precise individual whisker stimulation (and multi-whisker in the same animal), which is challenging in awake rodents due to active whisking. While anesthesia may alter higher-order processing, core mechanisms, such as short and long term plasticity in the barrel cortex, are preserved under anesthesia (Martin-Cortecero et al., 2014; Mégevand et al., 2009).

      The statistical analysis appears inappropriate, with the use of repeated independent tests, dramatically boosting the false positive error rate.

      Thank you for your feedback on our analysis using independent rank-based tests for each time point in wild-type (WT) animals. To address concerns regarding multiple comparisons and temporal dependencies (for Figure 1F and 4D for now but we will add more in our revision), we performed a repeated measures ANOVA for WT animals (13 Barrel, 8 Septa, 20 time points), which revealed a significant main effect of Condition (F(1,19) = 16.33, p < 0.001) and a significant Condition-Time interaction (F(19,361) = 2.37, p = 0.001). Post-hoc tests confirmed significant differences between Barrel and Septa at multiple time points (e.g., p < 0.0025 at times 3, 4, 6, 7, 8, 10, 11, 12, 16, 19 after Bonferroni posthoc correction), supporting a differential multi-whisker vs. single-whisker ratio response in WT animals. In contrast, a repeated measures ANOVA for knock-out (KO) animals (11 Barrel, 7 Septa, 20 time points) showed no significant main effect of Condition (F(1,14) = 0.17, p = 0.684) or Condition-Time interaction (F(19,266) = 0.73, p = 0.791), indicating that the BarrelSepta difference observed in WT animals is absent in KO animals.

      Furthermore, the manuscript suffers from imprecision; its conclusions are occasionally vague or overstated. The authors suggest a role for SST+ neurons in the observed divergence in SWS/MWS responses between barrel and septal domains. However, this remains speculative, and some findings appear inconsistent. For instance, the increased response of SST+ neurons to MWS versus SWS is not confined to a specific domain. Why, then, would preferential recruitment of SST+ neurons lead to divergent dynamics between barrel and septal regions? The higher density of SST+ neurons in septal versus barrel L4 is not a sufficient explanation, particularly since the SWS/MWS response divergence is also observed in layers 2/3, where no difference in SST+ neuron density is found.

      Moreover, SST+ neuron-mediated inhibition is not necessarily restricted to the layer in which the cell body resides. It remains unclear through which differential microcircuits (barrel vs septum) the enhanced recruitment of SST+ neurons could account for the divergent responses to repeated SWS versus MWS stimulation.

      We fully appreciate the reviewer’s comment. We currently do not provide any evidence on the contribution of SST neurons in the barrels versus septa in layer 4 on the response divergence of spiking observed in SWS versus MWS. We only show that these neurons differentially distribute in the two domains in this layer. It is certainly known that there is molecular and circuit-based diversity of SST-positive neurons in different layers of the cortex, so it is plausible that this includes cells located in the two domains of vS1, something which has not been examined so far. Our data on their distribution are one piece of information that SST neurons may have a differential role in inhibiting barrel stellate cells versus septa ones. Morphological reconstructions of SST neurons in L4 of the somatosensory barrel cortex has shown that their dendrites and axons project locally and may confine to individual domains, even though not specifically examined (Fig. 3 of Scala F et al., 2019). The same study also showed that L4 SST cells receive excitatory input from local stellate cells) and is known that they are also directly excited by thalamocortical fibers (Beierlein et al., 2003; Tan et al., 2008), both of which facilitate.

      As shown in our supplementary figure, the divergence is also observed in L2/3 where, as the reviewer also points out, where we do not have a differential distribution of SST cells, at least based on a columnar analysis extending from L4. There are multiple scenarios that could explain this “discrepancy” that one would need to examine further in future studies. One straightforward one is that the divergence in spiking in L2/3 domains may be inherited from L4 domains, where L4 SST act on. Another is that even though L2/3 SST neurons are not biased in their distribution their input-output function is, something which one would need to examine by detailed in vitro electrophysiological and perhaps optogenetic approaches in S1. Despite the distinctive differences that have been found between the L4 circuitry in S1 and V1 (Scala F et al., 2019), recent observations indicate that small but regular patches of V1 marked by the absence of muscarinic receptor 2 (M2) have high temporal acuity (Ji et al., 2015), and selectively receive input from SST interneurons (Meier et al., 2025). Regions lacking M2 have distinct input and output connectivity patterns from those that express M2 (Meier et al., 2021; Burkhalter et al., 2023). These findings, together with ours, suggest that SST cells preferentially innervate and regulate specific domains columns- in sensory cortices.

      Regardless of the mechanism, the Elfn1 knock-out mouse line almost exclusively affects the incoming excitability onto SST neurons (see also reply to comment below), hence what can be supported by our data is that changing the incoming short-term synaptic plasticity onto these neurons brings the spiking dynamics between barrels and septa closer together.

      The Elfn1 KO mouse model seems too unspecific to suggest the role of the short-term plasticity in SST+ neurons in the differential response to repeated SWS vs MWS stimulation across domains. Why would Elfn1-dependent short-term plasticity in SST+ neurons be specific to a pathway, or a stimulation type (SWS vs MWS)? Moreover, the authors report that Elfn1 knockout alters synapses onto VIP+ as well as SST+ neurons (Stachniak et al., 2021; previous version of this paper)-so why attribute the phenotype solely to SST+ circuitry? In fact, the functional distinctions between barrel and septal domains appear largely abolished in the Elfn1 KO.

      Previous work by others and us has shown that globally removing Elfn1 selectively removes a synaptic process from the brain without altering brain anatomy or structure. This allows us to study how the temporal dynamics of inhibition shape activity, as opposed to inhibition from particular cell types. We will nevertheless update the text to discuss more global implications for SST interneuron dynamics and include a reference to VIP interneurons that contain Elfn1.

      When comparing SWS to MWS, we find that MWS replaces the neighboring excitation which would normally be preferentially removed by short-term plasticity in SST interneurons, thus providing a stable control comparison across animals and genotypes. On average, VIP interneurons failed to show modulation by MWS. We were unable to measure a substantial contribution of VIP cells to this process and also note that the Elfn1 expressing multipolar neurons comprise only ~5% of VIP neurons (Connor and Peters, 1984; Stachniak et al., 2021), a fraction that may be lost when averaging from 138 VIP cells. Moreover, the effect of Elfn1 loss on VIP neurons is quite different and marginal compared to that of SST cells, suggesting that the primary impact of Elfn1 knockout is mediated through SST+ interneuron circuitry. Therefore, even if we cannot rule out that these 5% of VIP neurons contribute to barrel domain segregation, we are of the opinion that their influence would be very limited if any.

      Reviewer #2 (Public Reviews):

      Summary:

      Argunsah and colleagues demonstrate that SST-expressing interneurons are concentrated in the mouse septa and differentially respond to repetitive multi-whisker inputs. Identifying how a specific neuronal phenotype impacts responses is an advance.

      Strengths:

      (1)  Careful physiological and imaging studies.

      (2)  Novel result showing the role of SST+ neurons in shaping responses.

      (3)  Good use of a knockout animal to further the main hypothesis.

      (4)  Clear analytical techniques.

      We thank the reviewer for their appreciation of the study.

      Weaknesses:

      No major weaknesses were identified by this reviewer. Overall, I appreciated the paper but feel it overlooked a few issues and had some recommendations on how additional clarifications could strengthen the paper. These include:

      (1) Significant work from Jerry Chen on how S1 neurons that project to M1 versus S2 respond in a variety of behavioral tasks should be included (e.g. PMID: 26098757). Similarly, work from Barry Connor’s lab on intracortical versus thalamocortical inputs to SST neurons, as well as excitatory inputs onto these neurons (e.g. PMID: 12815025) should be included.

      We thank the reviewer for these valuable resources that we overlooked. We will include Chen et al. (2015), Cruikshank et al. (2007) and Gibson et al. (1999) to contextualize S1 projections and SST+ inputs, strengthening the study’s foundation as well as Beierlein et al. (2003) which nicely show both local and thalamocortical facilitation of excitatory inputs onto L4 SST neurons, in contrast to PV cells. The paper also shows the gradual recruitment of SST neurons by thalamocortical inputs to provide feed-forward inhibition onto stellate cells (regular spiking) of the barrel cortex L4 in rat.

      (2) Using Layer 2/3 as a proxy to what is happening in layer 4 (~line 234). Given that layer 2/3 cells integrate information from multiple barrels, as well as receiving direct VPm thalamocortical input, and given the time window that is being looked at can receive input from other cortical locations, it is not clear that layer 2/3 is a proxy for what is happening in layer 4.

      We agree with the reviewer that what we observe in L2/3 is not necessarily what is taking place in L4 SST-positive cells. The data on L2/3 was included to show that these cells, as a population, can show divergent responses when it comes to SWS vs MWS, which is not seen in L2/3 VIP neurons. Regardless of the mechanisms underlying it, our overall data support that SST-positive neurons can change their activation based on the type of whisker stimulus and when the excitatory input dynamics onto these neurons change due to the removal of Elfn1 the recruitment of barrels vs septa spiking changes at the temporal domain. Having said that, the data shown in Supplementary Figure 3 on the response properties of L2/3 neurons above the septa vs above the barrels (one would say in the respective columns) do show the same divergence as in L4. This suggests that a circuit motif may exist that is common to both layers, involving SST neurons that sit in L4, L5 or even L2/3. This implies that despite the differences in the distribution of SST neurons in septa vs barrels of L4 there is an unidentified input-output spatial connectivity motif that engages in both L2/3 and L4. Please also see our response to a similar point raised by reviewer 1.

      (3) Line 267, when discussing distinct temporal response, it is not well defined what this is referring to. Are the neurons no longer showing peaks to whisker stimulation, or are the responses lasting a longer time? It is unclear why PV+ interneurons which may not be impacted by the Elfn1 KO and receive strong thalamocortical inputs, are not constraining activity.

      We thank the reviewer for their comment and will clarify the statement.

      This convergence of response profiles was further clear in stimulus-aligned stacked images, where the emergent differences between barrels and septa under SWS were largely abolished in the KO (Figure 4B). A distinction between directly stimulated barrels and neighboring barrels persisted in the KO. In addition, the initial response continued to differ between barrel and septa and also septa and neighbor (Figure 4B). This initial stimulus selectivity potentially represents distinct feedforward thalamocortical activity, which includes PV+ interneuron recruitment that is not directly impacted by the Elfn1 KO (Sun et al., 2006; Tan et al., 2008). PV+ cells are strongly excited by thalamocortical inputs, but these exhibit short-term depression, as does their output, contrasting with the sustained facilitation observed in SST+ neurons. These findings suggest that in WT animals, activity spillover from principal barrels is normally constrained by the progressive engagement of SST+ interneurons in septal regions, driven by Elfn1-dependent facilitation at their excitatory synapses. In the absence of Elfn1, this local inhibitory mechanism is disrupted, leading to longer responses in barrels, delayed but stronger responses in septa, and persistently stronger responses in unstimulated neighbors, resulting in a loss of distinction between the responses of barrel and septa domains that normally diverge over time (see Author response image 1 below).

      Author response image 1.

      (A) Barrel responses are longer following whisker stimulation in KO. (B) Septal responses are slightly delayed but stronger in KO. (C) Unstimulated neighbors show longer persistent responses in KO.


      (4) Line 585 “the earliest CSD sink was identified as layer 4…” were post-hoc measurements made to determine where the different shank leads were based on the post-hoc histology?

      Post hoc histology was performed on plane-aligned brain sections which would allow us to detect barrels and septa, so as to confirm the insertion domains of each recorded shank. Layer specificity of each electrode therefore could therefore not be confirmed by histology as we did not have coronal sections in which to measure electrode depth.

      (5) For the retrograde tracing studies, how were the M1 and S2 injections targeted (stereotaxically or physiologically)? How was it determined that the injections were in the whisker region (or not)?

      During the retrograde virus injection, the location of M1 and S2 injections was determined by stereotaxic coordinates (Yamashita et al., 2018). After acquiring the light-sheet images, we were able to post hoc examine the injection site in 3D and confirm that the injections were successful in targeting the regions intended. Although it would have been informative to do so, we did not functionally determine the whisker-related M1 and whisker-related S2 region in this experiment.

      (6) Were there any baseline differences in spontaneous activity in the septa versus barrel regions, and did this change in the KO animals?

      Thank you for this interesting question. Our previous study found that there was a reduction in baseline activity in L4 barrel cortex of KO animals at postnatal day (P)12, but no differences were found at P21 (Stachniak et al., 2023).

      Reviewer #3 (Public Reviews):

      Summary:

      This study investigates the functional differences between barrel and septal columns in the mouse somatosensory cortex, focusing on how local inhibitory dynamics, particularly involving Elfn1-expressing SST⁺ interneurons, may mediate temporal integration of multiwhisker (MW) stimuli in septa. Using a combination of in vivo multi-unit recordings, calcium imaging, and anatomical tracing, the authors propose that septa integrate MW input in an Elfn1-dependent manner, enabling functional segregation from barrel columns.

      Strengths:

      The core hypothesis is interesting and potentially impactful. While barrels have been extensively characterized, septa remain less understood, especially in mice, and this study's focus on septal integration of MW stimuli offers valuable insights into this underexplored area. If septa indeed act as selective integrators of distributed sensory input, this would add a novel computational role to cortical microcircuits beyond what is currently attributed to barrels alone. The narrative of this paper is intellectually stimulating.

      We thank the reviewer for finding the study intellectually stimulating.

      Weaknesses:

      The methods used in the current study lack the spatial and cellular resolution needed to conclusively support the central claims. The main physiological findings are based on unsorted multi-unit activity (MUA) recorded via low-channel-count silicon probes. MUA inherently pools signals from multiple neurons across different distances and cell types, making it difficult to assign activity to specific columns (barrel vs. septa) or neuron classes (e.g., SST⁺ vs. excitatory).

      The recording radius (~50-100 µm or more) and the narrow width of septa (~50-100 µm or less) make it likely that MUA from "septal" electrodes includes spikes from adjacent barrel neurons.

      The authors do not provide spike sorting, unit isolation, or anatomical validation that would strengthen spatial attribution. Calcium imaging is restricted to SST⁺ and VIP⁺ interneurons in superficial layers (L2/3), while the main MUA recordings are from layer 4, creating a mismatch in laminar relevance.

      We thank the reviewer for pointing out the possibility of contamination in septal electrodes. Importantly, it may not have been highlighted, although reported in the methods, but we used an extremely high threshold (7.5 std, in methods, line 583) for spike detection in order to overcome the issue raised here, which restricts such spatial contaminations. Since the spike amplitude decays rapidly with distance, at high thresholds, only nearby neurons contribute to our analysis, potentially one or two. We believe that this approach provides a very close approximation of single unit activity (SUA) in our reported data. We will include a sentence earlier in the manuscript to make this explicit and prevent further confusion.

      Regarding the point on calcium imaging being performed on L2/3 SST and VIP cells instead of L4. Both reviewer 1 and 2 brought up the same issue and we responded as follows. As shown in our supplementary figure, the divergence is also observed in L2/3 where we do not have a differential distribution of SST cells, at least based on a columnar analysis extending from L4. There are multiple scenarios that could explain this “discrepancy” that one would need to examine further in future studies. One straightforward one is that the divergence in spiking in L2/3 domains may be inherited from L4 domains, where L4 SST act on. Another is that even though L2/3 SST neurons are not biased in their distribution their input-output function is, something which one would need to examine by detailed in vitro electrophysiological and perhaps optogenetic approaches in S1. Despite the distinctive differences that have been found between the L4 circuitry in S1 and V1 (Scala F et al., 2019), recent observations indicate that small but regular patches of V1 marked by the absence of muscarinic receptor 2 (M2) have high temporal acuity (Ji et al., 2015), and selectively receive input from SST interneurons (Meier et al., 2025). Regions lacking M2 have distinct input and output connectivity patterns from those that express M2 (Meier et al., 2021; Burkhalter et al., 2023). These findings, together with ours, suggest that SST cells preferentially innervate and regulate specific domains -columns- in sensory cortices.

      Furthermore, while the role of Elfn1 in mediating short-term facilitation is supported by prior studies, no new evidence is presented in this paper to confirm that this synaptic mechanism is indeed disrupted in the knockout mice used here.

      We thank Reviewer #3 for noting the absence of new evidence confirming Elfn1’s disruption of short-term facilitation in our knockout mice. We acknowledge that our study relies on previously strong published data demonstrating that Elfn1 mediates short-term synaptic facilitation of excitatory inputs onto SST+ interneurons (Sylwestrak and Ghosh, 2012; Tomioka et al., 2014; Stachniak et al., 2019, 2023). These studies consistently show that Elfn1 knockout abolishes facilitation in SST+ synapses, leading to altered temporal dynamics, which we hypothesize underlies the observed loss of barrel-septa response divergence in our Elfn1 KO mice (Figure 4). Nevertheless, to address the point raised, we will clarify in the revised manuscript (around lines 245-247 and 271-272) that our conclusions are based on these established findings, stating: “Building on prior evidence that Elfn1 knockout disrupts short-term facilitation in SST+ interneurons (Sylwestrak and Ghosh, 2012; Tomioka et al., 2014; Stachniak et al., 2019, 2023), we attribute the abolished barrel-septa divergence in Elfn1 KO mice to altered SST+ synaptic dynamics, though direct synaptic measurements were not performed here.”

      Additionally, since Elfn1 is constitutively knocked out from development, the possibility of altered circuit formation-including changes in barrel structure and interneuron distribution, cannot be excluded and is not addressed.

      We thank Reviewer #3 for raising the valid concern that constitutive Elfn1 knockout could potentially alter circuit formation, including barrel structure and interneuron distribution. To address this, we will clarify in the revised manuscript (around line ~271 and in the Discussion) that in our previous studies that included both whole-cell patch-clamp in acute brain slices ranging from postnatal day 11 to 22 (P11 - P21) and in vivo recordings from barrel cortex at P12 and P21, we saw no gross abnormalities in barrel structure, with Layer 4 barrels maintaining their characteristic size and organization, consistent with wildtype (WT) mice (Stachniak et al., 2019, 2023). While we cannot fully exclude subtle developmental changes, prior studies indicate that Elfn1 primarily modulates synaptic function rather than cortical cytoarchitecture (Tomioka et al., 2014). Elfn1 KO mice show no gross morphological or connectivity differences and the pattern and abundance of Elfn1 expressing cells (assessed by LacZ knock in) appears normal (Dolan and Mitchell, 2013).

      We will add the following to the Discussion: “Although Elfn1 is constitutively knocked out, we find here and in previous studies that barrel structure is preserved (Stachniak et al., 2019, 2023). Further, the distribution of Elfn1 expressing interneurons is not different in KO mice, suggesting minimal developmental disruption (Dolan and Mitchell, 2013).

      Nonetheless, we acknowledge that subtle circuit changes cannot be ruled out without the usage of time-depended conditional knockout of the gene.”

      Recommendations for the authors:

      Reviewer #1 (Recommendations for the authors): 

      (1) My biggest concern is regarding statistics. Did the authors repeatedly apply independent tests (Mann-Whitney) without any correction for multiple comparisons (Figures 1 and 4)? In that case, the chances of a spurious "significant" result rise dramatically. 

      In response to the reviewer’s comment, we now present new statistical results by utilizing ANOVA and blended these results in the manuscript between lines 172 and 192 for WT data and 282 and 298 for Elfn1 KO data. This new statistical approach shows the same differences as we had previously reported, hence consolidating the statements made. 

      (2) The findings only hint at a mechanism involving SST+ neurons for how SWS and MWS are processed differently in the barrel vs septal domains. As a direct test of SST+ neuron involvement in the divergence of barrel and septal responses, the authors might consider SST-specific manipulations - for example, inhibitory chemo- or optogenetics during SWS and MWS stimulation.

      We thank the reviewer for this comment and agree that a direct manipulation of SST+ neurons via inhibitory chemo- or opto-genetics could provide further supporting evidence for the main claims in our study. We have opted out from performing these experiments for this manuscript as we feel they can be part of a future study.  At the same time, it is conceivable that such manipulations and depending on how they are performed may lead to larger and non-specific effects on cortical activity, since SST neurons will likely be completely shut down. So even though we certainly appreciate and value the strengths of such approaches, our experiments have addressed a more nuanced hypothesis, namely that the synaptic dynamics onto SST+ neurons matter for response divergence of septa versus barrels, which could not have been easily and concretely addressed by manipulating SST+ cell firing activity.  

      (3) In general, it is hard to comprehend what microcircuit could lead to the observed divergence in the MWS/SWS ratio in the barrel vs septal domain. There preferential recruitment of SST+ neurons during MWS is not specific to a particular domain, and the higher density of SST+ neurons specifically in L4 septa cannot per se explain the diverging MWS/SWS ratio in L4 septal neurons since similar ratio divergence is observed across domains in L2/3 neurons without increase SST+ neuron density in L2/3. This view would also assume that SST+ inhibition remains contained to its own layer and domain. Is this the case? Is it that different microcircuits between barrels and septa differently shape the response to repeated MWS? This is partially discussed in the paper; can the authors develop on that? What would the proposed mechanism be? Can the short-term plasticity of the thalamic inputs (VPM vs POm) be part of the picture?

      We thank the reviewer for raising this important point. We propose that the divergence in MWS/SWS ratios across barrel and septal domains arises from dynamic microcircuit interactions rather than static anatomical features such as SST+ density, which we describe and can provide a hint. In L2/3, where SST+ density is uniform, divergence persists, suggesting that trans-laminar and trans-domain interactions are key. Barrel domains, primarily receiving VPM inputs, exhibit short-term depression onto excitatory cells and engage PV+ and SST+ neurons to stabilize the MWS/SWS ratio, with Elfn1-dependent facilitation of SST+ neurons gradually increasing inhibition during repetitive SWS. Septal domains, in contrast, are targeted by facilitating POm inputs, combined with higher L4 SST+ density and Elfn1-mediated facilitation, producing progressive inhibitory buildup that amplifies the MWS/SWS ratio. SST+ projections in septa may extend trans-laminarly and laterally, influencing L2/3 and neighboring barrels, thereby explaining L2/3 divergence despite uniform SST+ density in L2/3. In this regards, direct laminar-dependent manipulations will be required to confirm whether L2/3 divergence is inherited from L4 dynamics. In Elfn1 KO mice, the loss of facilitation in SST+ neurons likely flattens these dynamics, disrupting functional segregation. Future experiments using VPM/POm-specific optogenetic activation and SST+ silencing will be critical to directly test this model.

      We expanded the discussion accordingly.

      (4) Can the decoder generalize between SWS and MWS? In this condition, if the decoder accuracy is higher for barrels than septa, it would support the idea that septa are processing the two stimuli differently. 

      Our results show that septal decoding accuracy is generally higher than barrel accuracy when generalizing from multi-whisker stimulation (MWS) to single-whisker stimulation (SWS), indicating distinct information processing in septa compared to barrels.

      In wild-type (WT) mice, septal accuracy exceeds barrel accuracy across all time windows (150ms, 51-95ms, 1-95ms), with the largest difference in the 51-95ms window (0.9944 vs. 0.9214 at pulse 20, 10Hz stimulation). This septal advantage grows with successive pulses, reflecting robust, separable neural responses, likely driven by the posterior medial nucleus (POm)’s strong MWS integration contrasting with minimal SWS activation. Barrel responses, driven by consistent ventral posteromedial nucleus (VPM) input for both stimuli, are less distinguishable, leading to lower accuracy.

      In Elfn1 knockout (KO) mice, which disrupt excitatory drive to somatostatin-positive (SST+) interneurons, barrel accuracy is higher initially in the 1-50ms window (0.8045 vs. 0.7500 at pulse 1), suggesting reduced early septal distinctiveness. However, septal accuracy surpasses barrels in later pulses and time windows (e.g., 0.9714 vs. 0.9227 in 51-95ms at pulse 20), indicating restored septal processing. This supports the role of SST+ interneurons in shaping distinct MWS responses in septa, particularly in late-phase responses (51-95ms), where inhibitory modulation is prominent, as confirmed by calcium imaging showing stronger SST+ activation during MWS.

      These findings demonstrate that septa process SWS and MWS differently, with higher decoding accuracy reflecting structured, POm- and SST+-driven response patterns. In Elfn1 KO mice, early deficits in septal processing highlight the importance of SST+ interneurons, with later recovery suggesting compensatory mechanisms. 

      We have added Supplementary Figure 4 and included this interpretation between lines 338353. 

      We thank the reviewer for suggesting this analysis.

      (5) It is not clear to me how the authors achieve SWS. How is it that the pipette tip "placed in contact with the principal whisker" does not detach from the principal whisker or stimulate other whiskers? Please clarify the methods. 

      Targeting the specific principal whisker is performed under the stereoscope.  

      Specifically, we have added this statement in line 628:

      “We trimmed the whiskers where necessary, to avoid them touching each other and to avoid stimulating other whiskers. By putting the pipette tip very close (almost touching) to the principal whisker, the movement of the tip (limited to 1mm) would reliably move the targeted whisker. The specificity of the stimulation of the selected principal whisker was observed under the stereoscope.”

      (6) The method for calculating decoder accuracy is not clearly described-how can accuracy exceed 1? The authors should clarify this metric and provide measures of variability (e.g., confidence intervals or standard deviations across runs) to assess the significance of their comparisons. Additionally, using a consistent scale across all plots would improve interoperability. 

      We thank the reviewer for raising this point. We have now changed the way accuracies are calculated and adopted a common scale among different plots (see updated Figure 5). We have also changed the methods section accordingly.

      (7) Figure 1: The sample size is not specified. It looks like the numbers match the description in the methods, but the sample size should be clearly stated here. 

      These are the numbers the reviewer is inquiring about. 

      WT: (WT) animals: a 280 × 95 × 20 matrix for the stimulated barrel (14 Barrels, 95ms, 20 pulses), a 180 × 95 × 20 matrix for the septa (9 Septa, 95ms, 20 pulses), and a 360 × 95 × 20 matrix for the neighboring barrel (18 Neighboring barrels, 95ms, 20 pulses). N=4 mice.

      KO: 11-barrel columns, 7 septal columns, 11 unstimulated neighbors from N=4 mice.

      Panels D-F are missing axes and axis labels (firing rate, p-value). Panel D is mislabeled (left, middle, and right). I can't seem to find the yellow line. 

      Thank you for this observation. We made changes in the figures to make them easier to navigate based on the collective feedback from the reviewers.

      Why is changing the way to compare the differences in the responses to repeated stimulation between SWS and MWS? 

      To assess temporal accumulation of information, we compared responses to repeated single-whisker stimulation (SWS) and multi-whisker stimulation (MWS) using an accumulative decoding approach rather than simple per-pulse firing rates. This method captures domain-specific integration dynamics over successive pulses.

      The use of the term "principal whisker" is confusing, as it could refer to the whisker that corresponds to the recorded barrel. 

      When we use the term principal whisker, the intention is indeed to refer to the whisker corresponding to the recorded barrel during single whisker stimulation. The term principal whisker is removed from Figure legend 1 and legend S1C where it may have led to  ambiguity.    

      Why the statement "after the start of active whisking"? Mice are under anesthesia here; it does not appear to be relevant for the figure. 

      “After the start of active whisking” refers to the state of the barrel cortex circuitry at the time of recordings. The particular reference we use comes from the habit of assessing sensory processing also from a developmental point of view. The reviewer is correct that it has nothing to do the with the status of the experiment. Nevertheless, since the reviewer found that it may create confusion, we have now taken it out. 

      (8) Figure 3: The y-axis label is missing for panel C. 

      This is now fixed. (dF/F).

      (9) Figure 4: Axis labels are missing.

      Added.

      Minor: 

      (10) Line 36: "progressive increase in septal spiking activity upon multi-whisker stimulation". There is no increase in septal spiking activity upon MWS; the ratio MWS/SWS increases.

      We have changed the sentence as follows: Genetic removal of Elfn1, which regulates the incoming excitatory synaptic dynamics onto SST+ interneurons, leads to the loss of the progressive increase in septal spiking ratio (MWS/SWS) upon stimulation.

      (11) Line 105: domain-specific, rather than column-specific, for consistency.

      We have changed it.

      (12) Lines 173-174: "a divergence between barrel and septa domain activity also occurred in Layer 4 from the 2nd pulse onward (Figure 1E)". The authors only show a restricted number of comparisons. Why not show the p-values as for SWS?

      The statistics is now presented in current Figure 1E.

      (13) Lines 151-153: "Correspondingly, when a single whisker is stimulated repeatedly, the response to the first pulse is principally bottom-up thalamic-driven responses, while the later pulses in the train are expected to also gradually engage cortico-thalamo-cortical and cortico-cortical loops." Can the authors please provide a reference?

      We have now added the following references : (Kyriazi and Simons, 1993; Middleton et al., 2010; Russo et al., 2025).

      (14) Lines 184-186: "Our electrophysiological experiments show a significant divergence of responses over time upon both SWS and MWS in L4 between barrels (principal and neighboring) and adjacent septa, with minimal initial difference". The only difference between the neighboring barrel and septa is the responses to the initial pulse. Can the author clarify? 

      We have now changed the sentence as follows: Our electrophysiological experiments show a significant divergence of responses between domains upon both SWS and MWS in L4. (Line 198 now)

      (15) Line 214: "suggest these interneurons may play a role in diverging responses between barrels and septa upon SWS". Why SWS specifically?

      We have changed the sentence as follows: These results confirmed that SST+ and VIP+ interneurons have higher densities in septa compared to barrels in L4 and suggest these interneurons may play a role in diverging responses between barrels and septa. (Line 231 now).

      (16) Line 235: "This result suggests that differential activation of SST+ interneurons is more likely to be involved in the domain-specific temporal ratio differences between barrels and septa". Why? The results here are not domain-specific.

      We have now revised this statement to: This result suggested that temporal ratio differences specific to barrels and septa might involve differential activation of SST+ interneurons rather than VIP+ interneurons.

      (17) Lines 241-243: "SST+ interneurons in the cortex are known to show distinct short-term synaptic plasticity, particularly strong facilitation of excitatory inputs, which enables them to regulate the temporal dynamics of cortical circuits." Please provide a reference.

      We have now added the following references: (Grier et al., 2023; Liguz-Lecznar et al., 2016).

      (18) Lines 245-247: "A key regulator of this plasticity is the synaptic protein Elfn1, which mediates short-term synaptic facilitation of excitation on SST+ interneurons (Stachniak et al., 2021, 2019; Tomioka et al., 2014)". Is Stachniak et al., 2021 not about the role of Elf1n in excitatory-to-VIP+ neuron synapses?

      The reviewer correctly spotted this discrepancy . This reference has now been removed from this statement.

      (19) Lines 271-272: "Building on our findings that Elfn1-dependent facilitation in SST+ interneurons is critical for maintaining barrel-septa response divergence". The authors did not show that.

      We have now changed the statement to: Building on our findings that Elfn1 is critical for maintaining barrel-septa response divergence  

      (20) Line 280: second firing peak, not "peal".

      Thank you, it is now fixed.

      (21) Lines 304-305: "These results highlight the critical role of Elfn1 in facilitating the temporal integration of 305 sensory inputs through its effects on SST+ interneurons". This claim is also overstated. 

      We have now changed the statement to: These results highlight the contribution of Elfn1 to the temporal integration of sensory inputs. (Line 362)

      (22) Line 329: Any reason why not cite Chen et al., Nature 2013?

      We have now added this reference, as also pointed out by reviewer 1.

      (23) Line 341-342: "wS1" and "wS2" instead of S1 and S2 for consistency.

      Thanks, we have now updated the terms.

      Reviewer #2 (Recommendations for the authors): 

      (1) Figure 3D - the SW conditions are labeled but not the MW conditions (two right graphs) - they should be labeled similarly (SSTMW, VIPMW). 

      The two right graphs in Figure 3D represent paired SW vs MW comparisons of the evoked responses for SST and VIP populations, respectively.

      (2) Figure 6 D and E I think it would be better if the Depth measurements were to be on the yaxis, which is more typical of these types of plots. 

      We thank the reviewer for this comment. Although we appreciate this may be the case, we feel that the current presentation may be easier for the reader to navigate, and we have hence kept it. 

      (3) Having an operational definition of septa versus barrel would be useful. As the authors point out, this is a tough distinction in a mouse, and often you read papers that use Barrel Wall versus Barrel Hollow/Center - operationally defining how these areas were distinguished would be helpful. 

      We thank the reviewer for this comment and understand the point made.

      We have now updated the methods section in line 611: 

      DiI marks contained within the vGlut2 staining were defined as barrel recordings, while DiI marks outside vGlut2 staining were septal recordings.

      Reviewer #3 (Recommendations for the authors): 

      To support the manuscript's major claims, the authors should consider the following:

      (1) Validate the septal identity of the neurons studied, either anatomically or functionally at the single-cell level (e.g., via Ca²⁺ imaging with confirmed barrel/septa mapping). 

      We thank the reviewer for this suggestion, but we feel that these extensive experiments are beyond the scope of this study. 

      (2) Provide both anatomical and physiological evidence to assess the possibility of altered cortical development in Elfn1 KO mice, including potential changes in barrel structure or SST⁺ cell distribution. 

      To address the reviewer’s point, we have now added the following to the Discussion: “Although Elfn1 is constitutively knocked out, we find here and in previous studies that barrel structure is preserved (Stachniak et al., 2019, 2023). Further, the distribution of Elfn1 expressing interneurons is not different in KO mice, suggesting minimal developmental disruption (Dolan and Mitchell, 2013). Nonetheless, we acknowledge that subtle circuit changes cannot be ruled out without conditional knockouts.”,

      (3) Examine the sensory responses of SST⁺ and VIP⁺ interneurons in deeper cortical layers, particularly layer 4, which is central to the study's main conclusions.

      We thank the reviewer for this suggestion and appreciate the value it would bring to the study. We nevertheless feel that these extensive experiments are beyond the scope of this study and hence opted out from performing them. 

      Minor Comments:

      (1)  The authors used a CLARITY-based passive clearing protocol, which is known to sometimes induce tissue swelling or distortion. This may affect anatomical precision, especially when assigning neurons to narrow domains such as septa versus barrels. Please clarify whether tissue expansion was measured, corrected, or otherwise accounted for during analysis.

      Yes, the tissue expansion was accounted during analysis for the laminar specification. We excluded the brains with severe distortion. 

      (2) While the anatomical data are plotted as a function of "depth from the top of layer 4," the manuscript does not specify the precise depth ranges used to define individual cortical layers in the cleared tissue. Given the importance of laminar specificity in projection and cell type analyses, the criteria and boundaries used to delineate each layer should be explicitly stated.

      Thank you for pointing this out. We now include the criteria for delineating each layer in the manuscript. “Given that the depth of Layer 4 (L4) can be reliably measured due to its welldefined barrel boundaries, and that the relative widths of other layers have been previously characterized (El-Boustani et al., 2018), we estimated laminar boundaries proportionally. Specifically, Layer 2/3 was set to approximately 1.3–1.5 times the width of L4, Layer 5a to ~0.5 times, and Layer 5b to a similar width as L4. Assuming uniform tissue expansion across the cortical column, we extrapolated the remaining laminar thicknesses proportionally.”

      (3)  In several key comparisons (e.g., SST⁺ vs. VIP⁺ interneurons, or S2-projecting vs. M1projecting neurons), it is unclear whether the same barrel columns were analyzed across conditions. Given the anatomical and functional heterogeneity across wS1 columns, failing to control for this may introduce significant confounds. We recommend analyzing matched columns across groups or, if not feasible, clearly acknowledging this limitation in the manuscript.

      We thank the reviewer for raising this important point. For the comparison of SST⁺ versus VIP⁺ interneurons, it would in principle have been possible to analyze the same barrel columns across groups. However, because some of the cleared brains did not reach the optimal level of clarity, our choice of columns was limited, and we were not always able to obtain sufficiently clear data from the same columns in both groups. Similarly, for the analysis of S2- versus M1-projecting neurons, variability in the position and spread of retrograde virus injections made it difficult to ensure measurements from identical barrel columns. We have now added a statement in the Discussion to acknowledge this limitation.

      (4) Figure 1C: Clarify what each point in the t-SNE plot represents-e.g., a single trial, a recording channel, or an averaged response. Also, describe the input features used for dimensionality reduction, including time windows and preprocessing steps.

      In response to the reviewer’s comment, we have now added the following in the methods: In summary, each point in the t-SNE plots represents an averaged response across 20 trials for a specific domain (barrel, septa, or neighbor) and genotype (WT or KO), with approximately 14 points per domain derived from the 280 trials in each dataset. The input features are preprocessed by averaging blocks of 20 trials into 1900-dimensional vectors (95ms × 20), which are then reduced to 2D using t-SNE with the specified parameters. This approach effectively highlights the segregation and clustering patterns of neural responses across cortical domains in both WT and KO conditions.

      (5) Figures 1D, E (left panels): The y-axes lack unit labeling and scale bars. Please indicate whether values are in spikes/sec, spikes/bin, or normalized units.

      We have now clarified this. 

      (6) Figures 1D, E (right panels): The color bars lack units. Specify whether the values represent raw firing rates, z-scores, or other normalized measures. Replace the vague term "Matrix representation" with a clearer label such as "Pulse-aligned firing heatmap."

      Thank you, we have now done it.

      (7) Figure 1E (bottom panel): There appears to be no legend referring to these panels. Please define labels such as "B" and "S." 

      Thank you, we have now done it.

      (8) Figure 1E legend: If it duplicates the legend from Figure 1D, this should be made explicit or integrated accordingly. 

      We have changed the structure of this figure.

      (9) Figure 1F: Define "AUC" and explain how it was computed (e.g., area under the firing rate curve over 0-50 ms). Indicate whether the plotted values represent percentages and, if so, label the y-axis accordingly. If normalization was applied, describe the procedure. Include sample sizes (n) and specify what each data point represents (e.g., animal, recording site). 

      The following paragraph has been added in the methods section:

      The Area Under the Curve (AUC) was computed as the integral of the smoothed firing rate (spikes per millisecond) over a 50ms window following each whisker stimulation pulse, using trapezoidal integration. Firing rate data for layer 4 barrel and septal regions in wild-type (WT) and knockout (KO) mice were smoothed with a 3-point moving average and averaged across blocks of 20 trials. Plotted values represent the percentage ratio of multi-whisker (MW) to single whisker (SW) AUC with error bars showing the standard error of the mean. Each data point reflects the mean AUC ratio for a stimulation pulse across approximately 11 blocks (220 trials total). The y-axis indicates percentages.

      (10) Figure 3C: Add units to the vertical axis.

      We have added them.

      (11) Figure 3D: Specify what each line represents (e.g., average of n cells, individual responses?). 

      Each line represents an average response of a neuron.  

      (12) Figure 4C legend: Same with what?". No legend refers to the bottom panels - please revise to clarify. 

      Thank you. We have now changed the figure structure and legends and fixed the missing information issue.

      (13) Supplementary Figure 1B: Indicate the physical length of the scale bar in micrometers. 

      This has been fixed. The scale bar is 250um.

      (14) Indicate the catalog number or product name of the 8×8 silicon probe used for recordings.

      We have added this information. It is the A8x8-Edge-5mm-100-200-177-A64

      References

      (1) Beierlein, M., Gibson, J. R. & Connors, B. W. (2003). Two dynamically distinct inhibitory networks in layer 4 of the neocortex. J. Neurophysiol. 90, 2987–3000.

      (2) Burkhalter, A., D’Souza, R. D. & Ji, W. (2023). Integration of feedforward and feedback information streams in the modular architecture of mouse visual cortex. Annu. Rev. Neurosci. 46, 259–280.

      (3) Chen, J. L., Margolis, D. J., Stankov, A., Sumanovski, L. T., Schneider, B. L. & Helmchen, F. (2015). Pathway-specific reorganization of projection neurons in somatosensory cortex during learning. Nat. Neurosci. 18, 1101–1108.

      (4) Connor, J. R. & Peters, A. (1984). Vasoactive intestinal polypeptide-immunoreactive neurons in rat visual cortex. Neuroscience 12, 1027–1044.

      (5) Cruikshank, S. J., Lewis, T. J. & Connors, B. W. (2007). Synaptic basis for intense thalamocortical activation of feedforward inhibitory cells in neocortex. Nat. Neurosci. 10, 462–468.

      (6) Dolan, J. & Mitchell, K. J. (2013). Mutation of Elfn1 in mice causes seizures and hyperactivity. PLoS One 8, e80491.

      (7) Gibson, J. R., Beierlein, M. & Connors, B. W. (1999). Two networks of electrically coupled inhibitory neurons in neocortex. Nature 402, 75–79.

      (8) Ji, W., Gămănuţ, R., Bista, P., D’Souza, R. D., Wang, Q. & Burkhalter, A. (2015). Modularity in the organization of mouse primary visual cortex. Neuron 87, 632–643.

      (9) Martin-Cortecero, J. & Nuñez, A. (2014). Tactile response adaptation to whisker stimulation in the lemniscal somatosensory pathway of rats. Brain Res. 1591, 27–37.

      (10) Mégevand, P., Troncoso, E., Quairiaux, C., Muller, D., Michel, C. M. & Kiss, J. Z. (2009). Long-term plasticity in mouse sensorimotor circuits after rhythmic whisker stimulation. J. Neurosci. 29, 5326–5335.

      (11) Meier, A. M., Wang, Q., Ji, W., Ganachaud, J. & Burkhalter, A. (2021). Modular network between postrhinal visual cortex, amygdala, and entorhinal cortex. J. Neurosci. 41, 4809– 4825.

      (12) Meier, A. M., D’Souza, R. D., Ji, W., Han, E. B. & Burkhalter, A. (2025). Interdigitating modules for visual processing during locomotion and rest in mouse V1. bioRxiv 2025.02.21.639505.

      (13) Scala, F., Kobak, D., Shan, S., Bernaerts, Y., Laturnus, S., Cadwell, C. R., Hartmanis, L., Froudarakis, E., Castro, J. R., Tan, Z. H., et al. (2019). Layer 4 of mouse neocortex differs in cell types and circuit organization between sensory areas. Nat. Commun. 10, 4174.

      (14) Stachniak, T. J., Sylwestrak, E. L., Scheiffele, P., Hall, B. J. & Ghosh, A. (2019). Elfn1induced constitutive activation of mGluR7 determines frequency-dependent recruitment of somatostatin interneurons. J. Neurosci. 39, 4461–4475.

      (15) Stachniak, T. J., Kastli, R., Hanley, O., Argunsah, A. Ö., van der Valk, E. G. T., Kanatouris, G. & Karayannis, T. (2021). Postmitotic Prox1 expression controls the final specification of cortical VIP interneuron subtypes. J. Neurosci. 41, 8150–8166.

      (16) Stachniak, T. J., Argunsah, A. Ö., Yang, J. W., Cai, L. & Karayannis, T. (2023). Presynaptic kainate receptors onto somatostatin interneurons are recruited by activity throughout development and contribute to cortical sensory adaptation. J. Neurosci. 43, 7101–7118.

      (17) Sun, Q.-Q., Huguenard, J. R. & Prince, D. A. (2006). Barrel cortex microcircuits: Thalamocortical feedforward inhibition in spiny stellate cells is mediated by a small number of fast-spiking interneurons. J. Neurosci. 26, 1219–1230.

      (18) Sylwestrak, E. L. & Ghosh, A. (2012). Elfn1 regulates target-specific release probability at CA1-interneuron synapses. Science 338, 536–540.

      (19) Tan, Z., Hu, H., Huang, Z. J. & Agmon, A. (2008). Robust but delayed thalamocortical activation of dendritic-targeting inhibitory interneurons. Proc. Natl. Acad. Sci. USA 105, 2187–2192.

      (20) Tomioka, N. H., Yasuda, H., Miyamoto, H., Hatayama, M., Morimura, N., Matsumoto, Y., Suzuki, T., Odagawa, M., Odaka, Y. S., Iwayama, Y., et al. (2014). Elfn1 recruits presynaptic mGluR7 in trans and its loss results in seizures. Nat. Commun. 5, 4501.

      (21) Yamashita, T., Vavladeli, A., Pala, A., Galan, K., Crochet, S., Petersen, S. S. & Petersen, C. C. (2018). Diverse long-range axonal projections of excitatory layer 2/3 neurons in mouse barrel cortex. Front. Neuroanat. 12, 33.

    1. Author response:

      The following is the authors’ response to the original reviews.

      Reviewer #1 (Public review): 

      Summary: 

      This very thorough anatomical study addresses the innervation of the Drosophila male reproductive tract. Two distinct glutamatergic neuron types were classified: serotonergic (SGNs) and octopaminergic (OGNs). By expansion microscopy, it was established that glutamate and serotonin /octopamine are co-released. The expression of different receptors for 5-HT and OA in muscles and epithelial cells of the innervation target organs was characterized. The pattern of neurotransmitter receptor expression in the target organs suggests that seminal fluid and sperm transport and emission are subjected to complex regulation. While silencing of abdominal SGNs leads to male infertility and prevents sperm from entering the ejaculatory duct, silencing of OGNs does not render males infertile. 

      Strengths: 

      The studied neurons were analysed with different transgenes and methods, as well as antibodies against neurotransmitter synthesis enzymes, building a consistent picture of their neurotransmitter identity. The careful anatomical description of innervation patterns together with receptor expression patterns of the target organs provides a solid basis for advancing the understanding of how seminal fluid and sperm transport and emission are subjected to complex regulation. The functional data showing that SGNs are required for male fertility and for the release of sperm from the seminal vesicle into the ejaculatory duct is convincing. 

      Weaknesses: 

      The functional analysis of the characterized neurons is not as comprehensive as the anatomical description, and phenotypic characterization was limited to simple fertility assays. It is understandable that a full functional dissection is beyond the scope of the present work. The paper contains experiments showing neuron-independent peristaltic waves in the reproductive tract muscles, which are thematically not very well integrated into the paper. Although very interesting, one wonders if these experiments would not fit better into a future work that also explores these peristaltic waves and their interrelation with neuromodulation mechanistically. 

      Reviewer #2 (Public review): 

      Summary: 

      Cheverra et al. present a comprehensive anatomical and functional analysis of the motor neurons innervating the male reproductive tract in Drosophila melanogaster, addressing a gap in our understanding of the peripheral circuits underlying ejaculation and male fertility. They identify two classes of multi-transmitter motor neurons-OGNs (octopamine/glutamate) and SGNs (serotonin/glutamate)-with distinct innervation patterns across reproductive organs. The authors further characterize the differential expression of glutamate, octopamine, and serotonin receptors in both epithelial and muscular tissues of these organs. Behavioral assays reveal that SGNs are essential for male fertility, whereas OGNs and glutamatergic transmission are dispensable. This work provides a high-resolution map linking neuromodulatory identity to organ-specific motor control, offering a valuable framework to explore the neural basis of male reproductive function. 

      Strengths: 

      Through the use of an extensive set of GAL4 drivers and antibodies, this work successfully and precisely defines the neurons that innervate the male reproductive tract, identifying the specific organs they target and the nature of the neurotransmitters they release. It also characterizes the expression patterns and localization of the corresponding neurotransmitter receptors across different tissues. The authors describe two distinct groups of dual-identity neurons innervating the male reproductive tract: OGNs, which co-express octopamine and glutamate, and SGNs, which co-express serotonin and glutamate. They further demonstrate that the various organs within the male reproductive system differentially express receptors for these neurotransmitters. Based on these findings, the authors propose that a single neuron capable of co-releasing a fast-acting neurotransmitter alongside a slower-acting one may more effectively synchronize and stagger events that require precise timing. This, together with the differential expression of ionotropic glutamate receptors and metabotropic aminergic receptors in postsynaptic muscle tissue, adds an additional layer of complexity to the coordinated regulation of fluid secretion, organ contractility, and directional sperm movement-all contributing to the optimization of male fertility. 

      Weaknesses: 

      The main weakness of the manuscript is the lack of detail in the presentation of the results. Specifically, all microscopy image figures are missing information about the number of samples (N), and in the case of colocalization experiments, quantitative analyses are not provided. Additionally, in the first behavioral section, it would be beneficial to complement the data table with figures similar to those presented later in the manuscript for consistency and clarity. 

      Wider context: 

      This study delivers the first detailed anatomical map connecting multi-transmitter motor neurons with specific male reproductive structures. It highlights a previously unrecognized functional specialization between serotonergic and octopaminergic pathways and lays the groundwork for exploring fundamental neural mechanisms that regulate ejaculation and fertility in males. The principles uncovered here may help explain how males of Drosophila and other organisms adjust reproductive behaviors in response to environmental changes. Furthermore, by shedding light on how multi-transmitter systems operate in reproductive control, this model could provide insights into therapeutic targets for conditions such as male infertility and prostate cancer, where similar neuronal populations are involved in humans. Ultimately, this genetically accessible system serves as a powerful tool for uncovering how multi-transmitter neurons orchestrate coordinated physiological actions necessary for the functioning of complex organs. 

      Reviewer #3 (Public review): 

      Summary: 

      This work provides an overview of the motor neuron landscape in the male reproductive system. Some work had been done to elucidate the circuits of ejaculation in the spine, as well as the cord, but this work fills a gap in knowledge at the level of the reproductive organs. Using complementary approaches, the authors show that there are two types of motor neurons that are mutually exclusive: neurons that co-express octopamine and glutamate and neurons that co-express serotonin and glutamate. They also show evidence that both types of neurons express large dense core vesicles, indicating that neuropeptides play a role in male fertility. This paper provides a thorough characterization of the expression of the different glutamate, octopamine, and serotonin receptors in the different organs and tissues of the male reproductive system. The differential expression in different tissues and organs allows building initial theories on the control of emission and expulsion. Additionally, the authors characterize the expression of synaptic proteins and the neuromuscular junction sites. On a mechanistic level, the authors show that neither octopamine/glutamate neuron transmission nor glutamate transmission in serotonin/glutamate neurons is required for male fertility. This final result is quite surprising and opens up many questions on how ejaculation is coordinated. 

      Strengths: 

      This work fills an important gap in the characterization of innervation of the male reproductive system by providing an extensive characterization of the motor neurons and the potential receptors of motor neuron release. The authors show convincing evidence of glutamate/monoamine co-release and of mutual exclusivity of serotonin/glutamate and octopamine/glutamate neurons. 

      Weaknesses: 

      (1) Often, it is mentioned that the expression is higher or lower or regional without quantification or an indication of the number of samples analysed. 

      (2) The experiment aimed at tracking sperm in the male reproductive system is difficult to interpret when it is not assessed whether ejaculation has occurred. 

      (3) The experiment looking at peristaltic waves in the male organs is missing labeling of the different regions and quantification of the observed waves. 

      Recommendations for the authors:

      Reviewer #1 (Recommendations for the authors): 

      (1) While the peripheral innervations are very carefully described, it is not clear to which SGNs and OGNs (i.e., cell bodies in the central nervous system) these innervations belong. Are SV, AG, and ED innervated by branches of one neuron or by separate neurons? Multi-color flip-out experiments could provide an answer to this. 

      We agree this is important and are planning these experiments for follow-up study.

      (2) In contrast, for the analysis of the VT19028 split line (Figure 9), only vnc and cell body images are shown. How do the arborisations of these split combinations look in the periphery? Are the same reproductive organs innervated as shown in Figure 2?

      Figure 9S3 was inadvertently omitted from the initial submission.  That figure is now included and shows that the VT019028 split broadly innervates the SV, AG, and ED.

      (3) In the discussion, I think it would be helpful to offer some potential explanations for the role of octopaminergic and glutamatergic signaling. If not required for basic fertility, they probably have some other role.

      Thank you, we have included speculation in the Discussion section "Potential for adaptation to environment".

      (4) Line 543: Figure 8S4 E, (not 8E). 

      Correction made.

      Reviewer #2 (Recommendations for the authors): 

      (1) Line 213-217 

      Comment:

      The use of "significantly less expression" may be misleading, as no quantification or statistical analysis is provided to support this comparison. 

      Suggestion:

      Consider using a more neutral term, such as "markedly less" or "noticeably less," unless quantitative data and statistical analysis are included to substantiate the claim.

      Good recommendation.This suggestion has been incorporated.

      (2) Line 264-267 

      Comment:

      The observation regarding the distinct morphology of SGNs and OGNs is interesting and could strengthen the argument regarding functional differences. 

      Suggestion: 

      Consider including a quantification of morphological complexity (e.g., branching) to support the claim. A method such as Sholl analysis (Sholl, 1953), as adapted in Fernández et al., 2008, could be applied. 

      This is a good suggestion, and we will consider it as part of a follow-up study.

      (3) Line 269-271 

      Comment:

      The anatomical context of the observation is not explicitly stated. 

      Suggestion:

      Add "in the ED" for clarity: "With the TRH-GAL4 experiment in the ED, vGlut-40XMYC (Figure 5S1, A and E) and 6XV5-vMAT (Figure 5S1, B and F) were both present with a highly overlapping distribution (Figure 5S1, I)." 

      Suggestion has been incorporated.

      (4) Line 275-276 

      Comment:

      The claim about the reduced ability to distinguish SGNs and OGNs in the ED would benefit from quantitative support. 

      Suggestion:

      Include a morphological comparison or quantification between SGNs and OGNs in the ED and SV to reinforce this point.

      Certain information on morphological comparison can be inferred within the images themselves, and we will include quantitation in a follow-up study.

      (5) Line 277-279 

      Comment:

      As with line 269, the anatomical site could be specified more clearly. 

      Suggestion: 

      Rephrase as: "With the Tdc2-GAL4 experiment in the ED, vGlut-40XMYC (Figure 5S1, M and Q) and 6XV5-vMAT (Figure 5S1, N and R) were both observed in a highly overlapping distribution (Figure 5S1, U)." 

      Suggestion has been incorporated.

      (6) Line 348-350 

      Comment:

      The phrase "significantly higher density" implies a statistical comparison that is not shown. 

      Suggestion:

      If no quantification is provided, replace with a qualitative term such as "visibly higher" or "notably more dense." Alternatively, add a quantitative analysis with statistical testing to justify the use of "significantly." 

      Suggestion has been incorporated.

      (7) Lines 415-458 (Section comment) 

      Comment:

      There appears to be differential localization of neurotransmitter receptor expression (glutamate in muscle vs. 5-HT in epithelium or neurons), which could have functional implications. 

      Suggestion:

      Expand this section to briefly discuss the differential localization patterns of these receptors and potential implications for signal transduction in male reproductive tissues. 

      (8) Lines 638-682 (Section comment) 

      Comment:

      The table summarizing fertility phenotypes would be more informative with additional detail on experimental outcomes. 

      Suggestion:

      Add a column showing the number of fertile males over the total tested (e.g., "n fertile / n total"). Also, clarify whether the fertility assays are identical to those reported in Figure 10S2, and whether similar analyses were conducted for females. Consider including a figure summarizing fertility results for all genotypes listed in the table, similar to Figure 10S2. 

      The fertility tests reported in Table 1 were separate from those reported in Figure 10S2.  For these tests, the results were clear-cut with 100% of males and females reported as infertile exhibiting the infertile phenotype.  For the males and females reported as fertile, it was also clear-cut with nearly 100% showing fertility at a high level.  In subsequent figures we attempted to assess degrees of fertility.

      (9) Line 724-727 

      Comment:

      There seems to be a mistake in the identification of the driver lines used to silence OA neurons. Also, figure references might be incorrect. 

      Suggestion:

      The OA neuron driver line should be corrected to "Tdc2-GAL4-DBD ∩ AbdB-AD" instead of TRH-GAL4. Additionally, the figure references should be verified; specifically, the letter "B" (in "Figure 10B, D" and "10B, E") appears to be unnecessary or misplaced.

      Thanks for catching this, the corrections have been made.

      (10) Line 872-877 

      Comment:

      The discussion on the co-release of fast-acting glutamate and slower aminergic neurotransmitters is interesting and well-articulated. However, it remains somewhat disconnected from the behavioral findings. 

      Suggestion:

      Consider linking this proposed mechanism to the results observed in the mating duration assays. For instance, the sequential action of neurotransmitters described here could potentially underlie the prolonged mating observed when specific neuromodulators are active, helping to functionally integrate molecular and behavioral data. 

      (11) Line 926-928 

      Comment:

      The interpretation of 5-HT7 receptor expression in the sphincter is compelling, suggesting a role in regulating its function. However, this anatomical observation could be further contextualized with the functional data. 

      Suggestion:

      It may strengthen the interpretation to explicitly connect this finding with the fertility assays, where SGNs - presumably acting via serotonergic signaling - are shown to be necessary for male fertility. This would support a functional role for 5-HT7 in reproductive success via sphincter regulation.

      This has been added. 

      (12) Figure 1 

      Comment:

      The figure legend is generally clear, but could benefit from more consistency and precision in the color-coded labeling. Additionally, the naming of some structures could be more explicit. 

      Suggestion: 

      Revise the figure and the legend as follows:

      Figure 1. The Drosophila male reproductive system. A) Schematic diagram showing paired testes (colour), SVs (green), AGs (purple), Sph (red), ED (gray), and EB (colour). B) Actual male reproductive system. Te - testes, SV - seminal vesicle, AG - accessory gland, Sph - singular sphincter, ED - ejaculatory duct, EB - ejaculatory bulb. Scale bar: 200 µm.

      This suggestion has been incorporated.

      (13) Figure 3S2 

      Comment:

      There appears to be a typographical error in the description of the genotypes, which may lead to confusion. 

      Suggestion:

      Correct the legend to reflect the appropriate genotypes:

      Figure 3S2. Expression of vGlut-LexA and Tdc2-GAL4 in the Drosophila male reproductive system. A, D, G, J, M, P) vGlut-LexA, LexAop-6XmCherry; B, E, H, K, N, Q) Tdc2-GAL4, UAS-6XGFP; C, F, I, L, O, R) Overlay. Scale bars: O - 50 µm; R - 10 µm.

      The corrections have been made.

      (14) Figure 3S3

      Comment:

      The genotypes for panels D and E appear to be incomplete; the DBD component of the split-GAL4 drivers is missing. 

      Suggestion:

      Update the figure legend to: 

      Figure 3S3. Fruitless and Doublesex expression in the Drosophila male reproductive system. A) fru-GAL4, UAS-6XGFP; B) vGlut-LexA, LexAop-6XmCherry; C) Overlay; D) Tdc2-AD ∩ dsx-GAL4-DBD; E) TRH-AD ∩ dsx-GAL4-DBD. Scale bar: 200 µm.

      The corrections have been made.

      (15) Figure 4S4 

      Comment: 

      There is a repeated segment in the figure legend, which makes it unclear and redundant. 

      Suggestion:

      Edit the legend to remove the duplicated lines: 

      Figure 4S4. Expression of vGlut, TβH-GFP, and 5-HT at the junction of the SV and AGs with the ED of the Drosophila male reproductive system. A) vGlut-40XV5; B) TβH-GFP; C) 5-HT; D) vGlut-40XV5, TβH-GFP overlay; E) vGlut-40XV5, 5-HT overlay; F) TβH-GFP, 5-HT overlay. Scale bar: 50 µm.

      The correction has been made.

      (16) Figure 6S5 

      Comment:

      Within this figure, the orientation and/or scale of the tissue varies noticeably between individual panels, making it difficult to directly compare the different experimental conditions. 

      Suggestion:

      For improved clarity and interpretability, consider standardizing the orientation and size of the tissue shown across all panels within the figure. Consistent presentation will facilitate direct comparisons between treatments or genotypes. 

      There is often variation in the size of the male reproductive organs. They were all acquired at the same magnification. The only point of this figure is there is no vGAT or vAChT at these NMJs and the result is unambiguously negative. 

      (17) Figure 10 

      Comment:

      Panel A appears redundant, as it shows the same information as the other panels but without indicating statistical significance. 

      Suggestion:

      Consider removing panel A and keeping only the remaining four graphs, which include relevant statistical comparisons and clearly show significant differences.

      We realize there is some redundancy of panel A with the other panels, but we feel there is value in having all the genotypes in a single panel for comparison.

      Reviewer #3 (Recommendations for the authors): 

      Here are some suggestions to improve the manuscript: 

      (1) Prot B GFP experiment: the authors should explain better the time chosen to look at the sperm content of the male reproductive system. At 10 minutes, it is expected that the male has already ejaculated, and therefore, a failure to ejaculate would result in more sperm in the reproductive system, not less. Since we are not certain when the male ejaculates, it would be important to do the analysis at different time points.

      In the Prot-GFP experiments, the 10-minute time point was chosen because we nearly always observe sperm in the ejaculatory duct of control males.  In the experimental males, we never observed sperm in the ejaculatory duct at this time point.  Also, no Prot-GFP sperm were observed in the reproductive tract of females mated to experimental males even when mating was allowed to go to completion, while abundant sperm were found in females mated to Prot-GFP controls.  Figure 10S1 has been updated to include Images of these female reproductive systems.  The results showing the absence of Prot-GFP sperm in the female reproductive tract mated to experimental males indicates sperm transfer in these males isn't occurring earlier during the copulation process than in control males and that we didn't miss it by only examining at the ejaculatory duct.

      (2) Discuss what may be the role of the octopamine/glutamate neurons and glutamate transmission in serotonin/glutamate neurons in the male reproductive system, given that they are not required for fertility (at least under the context in which it was tested). It is quite a striking result that deserves some attention. 

      We agree it is a surprising result and have included speculation on the role of glutamate and octopamine in male reproduction in the Discussion section "Potential for adaptation to environment".

      (3) Very important: 

      (a) Figure 3 is present in the Word document but not the PDF. 

      (b) Figure 9S3 is not present 

      (c) In Figure 5 X), the legend does not correspond to the panel.

      All of these corrections have been made. 

      (4) Other suggestions:

      (a) A summary schematic (or several) of the findings would make it an easier read.

      (b) Explain why the ejaculatory bulb was left out of the analysis.

      (c) Explain in the main text some of the tools, such as, BONT-C and the conditional vGlut mutation.

    1. Reviewer #2 (Public review):

      Here, Hudait et al. use CG modeling to investigate the mechanism by which lenacapavir (LEN) treats HIV capsids that dock to the nuclear pore complex (NPC). However, the manuscript fails to present meaningful findings that were previously unreported in the literature, and is thus of low impact. Many claims made in the manuscript are not substantiated by the presented data. Key mechanistic details that the work purports to reveal are artifacts of the parameterization choices or simulation/analysis design, with the simulations said to reveal details that they were specifically biased to reproduce. This makes the manuscript highly problematic, as its contributions to the literature would represent misconceptions based on oversights in modeling, and thus mislead future readers.

      (1) Considering the literature, it is unclear that the manuscript presents new scientific discoveries. The following are results from this paper that have been previously reported:

      (a) LEN-bound capsid can dock to the nuclear pore (Figure 2; see e.g. 10.1016/j.cell.2024.12.008 or 10.1128/mbio.03613-24).

      (b) NUP98 interacts with the docked capsid (Figure 2; see e.g. 10.1016/j.virol.2013.02.008 or 10.1038/s41586-023-06969-7 or 10.1016/j.cell.2024.12.008).

      (c) LEN and NUP98 compete for a binding interface (Figure 2; see e.g. 10.1126/science.abb4808 or 10.1371/journal.ppat.1004459).

      (d) LEN creates capsid defects (Figure 3 and 5, see e.g. 10.1073/pnas.2420497122).

      (e) RNP can emerge from a damaged capsid (Figure 3 and 5; see e.g. 10.1073/pnas.2117781119 or 10.7554/eLife.64776).

      (f) LEN hyperstabilizes/reduces the elasticity of the capsid lattice (Figure 6; see e.g. 10.1371/journal.ppat.1012537).

      (2) The mechanistic findings related to how these processes occur are problematic, either based on circular reasoning or unsubstantiated, based on the presented data. In some cases, features of parameterization and simulation/analysis design are erroneously interpreted as predictions by the CG models.

      (a) Claim: LEN-bound capsids remain associated with the NPC after rupture. CG simulations did not reach the timescale needed to demonstrate continued association or failure to translocate, leaving the claim unsubstantiated.

      (b) Claim: LEN contributes to loss of capsid elasticity. The authors do not measure elasticity here, only force constants of fluctuations between capsomers in freely diffusing capsids. Elasticity is defined as the ability of a material to undergo reversible deformation when subjected to stress. Other computational works that actually measure elasticity (e.g., 0.1371/journal.ppat.1012537) could represent a point of comparison, but are not cited. The changes in force constants in the presence of LEN are shown in Figure 6C, but the text of the scale bar legend and units of k are not legible, so one cannot discern the magnitude or significance of the change.

      (c) Claim: Capsid defects are formed along striated patterns of capsid disorder. Data is not presented that correlates defects/cracks with striations.

      (d) Claim: Typically 1-2 LEN, but rarely 3 bind per capsid hexamer. The authors state: "The magnitude of the attractive interactions was adjusted to capture the substoichiometric binding of LEN to CA hexamers (Faysal et al., 2024). ... We simulated LEN binding to the capsid cone (in the absence of NPC), which resulted in a substoichiometric binding (~1.5 LEN per CA hexamer), consistent with experimental data (Singh et al., 2024)." This means LEN was specifically parameterized to reproduce the 1-2 binding ratio per hexamer apparent from experiments, so this was a parameterization choice, not a prediction by CG simulations as the authors erroneously claim: "This indicates that the probability of binding a third LEN molecule to a CA hexamer is impeded, likely due to steric effects that prevent the approach of an incoming molecule to a CA hexamer where 2 LEN molecules are already associated. ... Approximately 20% of CA hexamers remain unoccupied despite the availability of a large excess of unbound LEN molecules. This suggests a heterogeneity in the molecular environment of the capsid lattice for LEN binding." These statements represent gross over-interpretation of a bias deliberately introduced during parameterization, and the "finding" represents circular reasoning. Also, if "steric effects" play any role, the authors could analyze the model to characterize and report them rather than simply speculate.

      (e) Claim: Competition between NUP98 and LEN regulates capsid docking. The authors state: "A fraction of LEN molecules bound at the narrow end dissociate to allow NUP98 binding to the capsid ... Therefore, LEN can inhibit the efficient binding of the viral cores to the NPC, resulting in an increased number of cores in the cytoplasm." Capsid docking occurs regardless of the presence of LEN, and appears to occur at the same rate as the LEN-free capsid presented in the authors' previous work (Hudait &Voth, 2024). The presented data simply show that there is a fluctuation of bound LEN, with about 10 fewer (<5%) bound at the end of the simulation than at the beginning, and the curve (Figure 2A) does not clearly correlate with increased NUP98 contact. In that case, no data is shown that connects LEN binding with the regulation of the docking process. Further, the two quoted statements contradict each other. The presented data appear to show that NUP outcompetes LEN binding, rather than LEN inhibiting NUP binding. The "Therefore" statement is an attempt to reconcile with experimental studies, but is not substantiated by the presented data.

      (f) Claim: LEN binding leads to spontaneous dissociation of pentamers. The CG simulation trajectories show pentamer dissociation. However, it is quite difficult to believe that a pentamer in the wide end of the capsid would dissociate and diffuse 100 nm away before a hexamer in the narrow end (previously between two pentamers and now only partially coordinated, also in a highly curved environment, and further under the force of the extruding RNA) would dissociate, as in Figure 2B. A more plausible explanation could be force balance between pent-hex versus hex-hex contacts, an aspect of CG parameterization. No further modeling is presented to explain the release of pentamers, and changes in pent-hex stiffness are not apparent in the force constant fluctuation analysis in Figure 6C.

      (g) Claim: WTMetaD simulations predict capsid rupture. The authors state: "In WTMetaD simulations, we used the mean coordination number (Figure S6) between CA proteins in pentamers and in hexamers as the reaction coordinate." This means that the coordination number, the number of pent-hex contacts, is the bias used to accelerate simulation sampling. Yet the authors then interpret a change in coordination number leading to capsid rupture as a discovery, representing a fundamental misuse of the WTMetaD method. Changes in coordination number cannot be claimed as an emergent property when they are in fact the applied bias, when the simulation forced them to sample such states. The bias must be orthogonal to the feature of interest for that feature to be discoverable. While the reported free energies are orthogonal to the reaction coordinate, the structural and stepwise-mechanism "findings" here represent circular reasoning.

      (3) Another major concern with this work is the excessive self-citation, and the conspicuous lack of engagement with similar computational modeling studies that investigate the HIV capsid and its interactions with LEN, capsid mechanical properties relevant to nuclear entry, and other capsid-NPC simulations (e.g., 10.1016/j.cell.2024.12.008 and 10.1371/journal.ppat.1012537). Other such studies available in the literature include examination of varying aspects of the system at both CG and all-atom levels of resolution, which could be highly complementary to the present work and, in many cases, lend support to the authors' claims rather than detract from them. The choice to omit relevant literature implies either a lack of perspective or a lack of collegiality, which the presentation of the work suffers from. Overall, it is essential to discuss findings in the context of competing studies to give readers an accurate view of the state of the field and how the present work fits into it. It is appropriate in a CG modeling study to discuss the potential weaknesses of the methodology, points of disagreement with alternative modeling studies, and any lack of correlation with a broader range of experimental work. Qualitative agreement with select experiments does not constitute model validation.

      (4) Other critiques, questions, concerns:

      (a) The first Results sub-heading presents "results", complete with several supplementary figures and a movie that are from a previous publication about the development of the HIV capsid-NPC model in the absence of LEN (Hudait &Voth, 2024). This information should be included as part of the introduction or an abbreviated main-text methods section rather than being included within Results as if it represents a newly reported advancement, as this could be misleading.

      (b) The authors say the unbiased simulations of capsid-NPC docking were run as two independent replicates, but results from only one trajectory are ever shown plotted over time. It is not mentioned if the time series data are averaged or smoothed, so what is the shadow in these plots (e.g., Figures 1,2, and Supplementary Figure 5)?

      (c) Why do the insets showing LEN binding in Figure 2A look so different from the models they are apparently zoomed in on? Both instances really look like they are taken from different simulation frames, rather than being a zoomed-in view.

      (d) What are the sudden jerks apparent in the SI movies? Perhaps this is related to the rate at which trajectory frames are saved, but occasionally, during the relatively smooth motion of the capsid-NPC complex, something dramatic happens all of a sudden in a frame. For example, significant and apparently instantaneous reorientation of the cone far beyond what preceding motions suggest is possible (SI movie 2, at timestamp 0.22), RNP extrusion suddenly in a single frame (SI movie 2, at timestamp 0.27), and simultaneous opening of all pentamers all at once starting in a single frame (SI movie 2, at timestamp 0.33). This almost makes the movie look generated from separate trajectories or discontinuous portions of the same trajectory. If movies have been edited for visual clarity (e.g., to skip over time when "nothing" is happening and focus on the exciting aspects), then the authors should state so in the captions.

      (e) Figure 3c presents a time series of the degree of defects at pent-hex and hex-hex interfaces, but I do not understand the normalization. The authors state, "we represented the defects as the number of under-coordinated CA monomers of the hexamers at the pentamer-hexamer-pentamer and hexamer-hexamer interface as N_Pen-Hex and N_Hex-Hex ... Note that in N_Pen-Hex and N_Hex-Hex are calculated by normalizing by the total number of CA pentamer (12) and hexamer rings (209) respectively." Shouldn't the number of uncoordinated monomers be normalized by the number of that type of monomer, rather than the number of capsomers/rings? E.g., 12*5 and 209*6, rather than 12 and 209?

      (f) The authors state that "Although high computational cost precluded us from continuing these CG MD simulations, we expect these defects at the hexamer-hexamer interface to propagate towards the high curvature ends of the capsid." The defects being reported are apparently propagating from (not towards) the high curvature ends of the capsid.

      (g) The first half of the paper uses the color orange in figures to indicate LEN, but the second half uses orange to indicate defects, and this could be confusing for some readers. Both LEN and "defects" are simply a cluster of spheres, so highlighted defects appear to represent LEN without careful reading of captions.

      (h) SI Figure S3 captions says "The CA monomers to which at least one LEN molecule is bound are shown in orange spheres. The CA monomers to which no LEN molecule is bound are shown in white spheres. " While in contradiction, the main-text Fig 2 says "The CA monomers to which at least one LEN molecule is bound are shown in white spheres. The CA monomers to which no LEN molecule is bound are shown in orange spheres. " One of these must be a typo.

      (i) The authors state that: "CG MD simulations and live-cell imaging demonstrate that LEN-treated capsids dock at the NPC and rupture at the narrow end when bound to the central channel and then remain associated to the NPC after rupture." However, the live cell imaging data do not show where rupture occurs, such that this statement is at least partially false. It is also unclear that CG simulations show that cores remain bound following rupture, given that simulations were not extended to the timescale needed to observe this, again rendering the statement partially false.

      (j) The authors state: "We previously demonstrated that the RNP complex inside the capsid contributes to internal mechanical strain on the lattice driven by CACTD-RNP interactions and condensation state of RNP complex (Hudait &Voth, 2024). " In that case, why do the present CG models detect no difference in results for condensed versus uncondensed RNP?

      (k) The authors state: "The distribution demonstrates that the binding of LEN to the distorted lattice sites is energetically favorable. Since LEN localizes at the hydrophobic pocket between two adjoining CA monomers, it is sterically favorable to accommodate the incoming molecule at a distorted lattice site. This can be attributed to the higher available void volume at the distorted lattice relative to an ordered lattice, the latter being tightly packed. This also allows the drug molecule to avoid the multitude of unfavorable CA-LEN interactions and establish the energetically favorable interactions leading to a successful binding event. " What multitude of unfavorable interactions are the authors referring to? Data is not presented to substantiate the claim of increased void volume between hexamers in the distorted lattice. Capsomer distortion is shown as a schematic in Figure 6A rather than in the context of the actual model.

      (l) The authors state that "These striated patterns also demonstrate deviations from ideal lattice packing. " What does ideal lattice packing mean in this context, where hexamers are in numerous unique environments in terms of curvature? What is the structural reference point?

      (m) If pentamer-hexamer interactions are weakened in the presence of LEN, why are differences at these interfaces not apparent in the Figure 6C data that shows stiffening of the interactions between capsomer subunits?

      (n) The authors state: "Lattice defects arising from the loss of pentamers and cracks along the weak points of the hexameric lattice drive the uncoating of the capsid." The word rupture or failure should be used here rather than uncoating; it is unclear that the authors are studying the true process of uncoating and whether the defects induced by LEN binding relate in any way to uncoating.

      (o) The authors state: "LEN-treated broken cores are stabilized by the interaction with the disordered FG-NUP98 mesh at the NPC." But no data is presented to demonstrate that capsid stability is increased by NUP98 interaction. In fact, the presented data could suggest the opposite since capsids in contact with NUP98 in the NPC appeared to rupture faster than freely diffusing capsids.

      (p) The authors state: "LEN binding stimulates similar changes in free capsids, but they occur with lower frequency on similar time scales, suggesting that the cores docked at the NPC are under increased stress, resulting in more frequent weakening of the hexamer-pentamer and hexamer-hexamer interactions, as well as more nucleation of defects at the hexamer-hexamer<br /> Interface. ... Our results suggest that in the presence of the LEN, capsid docking into the NPC central channel will increase stress, resulting in more frequent breaks in the capsid lattice compared to free capsids." The first is a run-on sentence. The results shown support that LEN stimulates changes in free capsids to happen faster, but not more frequently. The frequency with which an event occurs is separate from the speed with which the event occurs.

      (q) The authors state: "A possible mechanistic pathway of capsid disassembly can be that multiple pentamers are dissociated from the capsid sequentially, and the remaining hexameric lattice remains stabilized by bound LEN molecules for a time, before the structural integrity of the remaining lattice is compromised." This statement is inconsistent with experimental studies that say LEN does not lead to capsid disassembly, and may even prevent disassembly as part of its disruption of proper uncoating (e.g., 10.1073/pnas.2420497122 previously published by the authors).

      (r) Finally, it remains a concern with the authors' work that the bottom-up solvent-free CG modeling software used in this and supporting works is not open source or even available to other researchers like other commonly used molecular dynamics software packages, raising significant questions about transparency and reproducibility.

    1. Author response:

      The following is the authors’ response to the original reviews.

      Reviewer #1 (Public review):

      Summary:

      In this paper, the authors develop a biologically plausible recurrent neural network model to explain how the hippocampus generates and uses barcode-like activity to support episodic memory. They address key questions raised by recent experimental findings: how barcodes are generated, how they interact with memory content (such as place and seed-related activity), and how the hippocampus balances memory specificity with flexible recall. The authors demonstrate that chaotic dynamics in a recurrent neural network can produce barcodes that reduce memory interference, complement place tuning, and enable context-dependent memory retrieval, while aligning their model with observed hippocampal activity during caching and retrieval in chickadees.

      Strengths:

      (1) The manuscript is well-written and structured.

      (2) The paper provides a detailed and biologically plausible mechanism for generating and utilizing barcode activity through chaotic dynamics in a recurrent neural network. This mechanism effectively explains how barcodes reduce memory interference, complement place tuning, and enable flexible, context-dependent recall.

      (3) The authors successfully reproduce key experimental findings on hippocampal barcode activity from chickadee studies, including the distinct correlations observed during caching, retrieval, and visits.

      (4) Overall, the study addresses a somewhat puzzling question about how memory indices and content signals coexist and interact in the same hippocampal population. By proposing a unified model, it provides significant conceptual clarity.

      Weaknesses:

      The recurrent neural network model incorporates assumptions and mechanisms, such as the modulation of recurrent input strength, whose biological underpinnings remain unclear. The authors acknowledge some of these limitations thoughtfully, offering plausible mechanisms and discussing their implications in depth.

      One thread of questions that authors may want to further explore is related to the chaotic nature of activity that generates barcodes when recurrence is strong. Chaos inherently implies sensitivity to initial conditions and noise, which raises questions about its reliability as a mechanism for producing robust and repeatable barcode signals. How sensitive are the results to noise in both the dynamics and the input signals? Does this sensitivity affect the stability of the generated barcodes and place fields, potentially disrupting their functional roles? Moreover, does the implemented plasticity mitigate some of this chaos, or might it amplify it under certain conditions? Clarifying these aspects could strengthen the argument for the robustness of the proposed mechanism.

      In our model, chaos is used to produce a random barcode when forming memories, but memory retrieval depends on attractor dynamics. Specifically, the plasticity update at the end of the cache creates an attractor state, and then afterwards for successful memory retrieval the network activity must settle into this attractor rather than remaining chaotic. This attractor state is a conjunction of memory content (place and seed activity) and memory index (barcode activity). Thus a barcode is ‘reactivated’ when network dynamics during retrieval settle into this cache attractor, or in other words chaotic dynamics do not need to generate the same barcode twice.

      The reviewer raises an important point, which is how sensitivity to initial conditions and noise would affect the reliability of our proposed mechanism. The key question here is how noise will affect the network’s dynamics during retrieval. Would adding noise to the dynamics make memory retrieval more difficult? We thank the reviewer for suggesting we investigate this further, and below describe our experiments and changes to the manuscript to better address this topic.

      We first experimented with adding independent gaussian distributed noise into each unit, drawn independently at each timestep. We analyzed recall accuracy using the same task and methods as Fig. 4F while varying the magnitude of noise. Memory recall was quite robust to this form of noise, even as the magnitude of noise approached half of the signal amplitude. This first experiment added noise into the temporal dynamics of the network. We subsequently examined adding static noise into the network inputs, which can also be thought of as introducing noise into initial conditions. Specifically, we added independent gaussian distributed noise into each unit, with the random value held constant for the extent of temporal dynamics. This perturbation decreased the likelihood of memory recall in a graded manner with noise magnitude, without dramatically changing the spatial profile. Examination of dynamics on individual trials revealed that the network failed to converge onto a cache attractor on some random fraction of trials, with other trials appearing nearly identical to noiseless results. We now include these results in the text and as a new supplementary figure, Figure S4AB.

      To clarify the network dynamics and the purpose of chaos in our model, we make the following modifications in text:

      Section 2.3, paragraph 2 (starting at “To store memories…”):

      “…place inputs arrive into the RNN, recurrent dynamics generate an essentially random barcode, seed inputs are activated, and then Hebbian learning binds a particular pattern of barcode activity to place- and seed-related activity.”

      Section 2.3, paragraph 3 (starting at “Memory recall in our network…”): As an example, consider a scenario in which an animal has already formed a memory at some location l, resulting in the storage of an attractor \vec{a} into the RNN. The attractor \vec{a} can be thought of as a linear combination of place input-driven activity $p(l)$, seed input-driven activity $s$, and a recurrent-driven barcode component $b$. Later, the animal returns to the same location and attempts recall (i.e. sets r \= 1, Figure 3B). Place inputs for location l drive RNN activity towards $p(l)$, which is partially correlated with attractor \vec{a}, and the recurrent dynamics cause network activity to converge onto attractor \vec{a}. In this way, barcode activity $b$ is reactivated, along with the place and seed components stored in the attractor state, $p(l)$ and $s$. The seed input can also affect recall, as discussed in the following section.

      Section 2.4, final paragraph (starting “We further examined how model hyperparameters affected performance on these tasks”), added the following describing new results on adding noise: We found that adding noise to the network's temporal dynamics had little effect on memory recall performance (Figure S4A). However, large static noise vectors added to the network's input and initial state decreased the overall probability of memory recall, but not its spatial profile (Figure S4B).

      It may also be worth exploring the robustness of the results to certain modeling assumptions.  For instance, the choice to run the network for a fixed amount of time and then use the activity  at the end for plasticity could be relaxed.

      As described above, chaotic dynamics are necessary to generate a barcode during a cache, but not to reactivate that barcode during retrieval. During a successful memory retrieval, network activity settles into an attractor state and thus does not depend on the duration of simulated dynamics. The choice of duration to run dynamics during caching is important, but only insofar as activity significantly decorrelates from the initial state. We show in Figure S1B that decorrelation saturates ~t=25, and thus any random time point t > 25 would be similarly effective. We used a fixed duration runtime for caches only to avoid introducing unnecessary complication into our model.

      Reviewer #2 (Public review):

      Summary:

      Striking experimental results by Chettih et al 2024 have identified high-dimensional, sparse patterns of activity in the chickadee hippocampus when birds store or retrieve food at a given site. These barcode-like patterns were interpreted as "indexes" allowing the birds to retrieve from memory the locations of stored food.

      The present manuscript proposes a recurrent network model that generates such barcode activity and uses it to form attractor-like memories that bind information about location and food. The manuscript then examines the computational role of barcode activity in the model by simulating two behavioral tasks, and by comparing the model with an alternate model in which barcode activity is ablated.

      Strengths of the study:

      Proposes a potential neural implementation for the indexing theory of episodic memory - Provides a mechanistic model of striking experimental findings: barcode-like, sparse patterns of activity when birds store a grain at a specific location

      A particularly interesting aspect of the model is that it proposes a mechanism for binding discrete events to a continuous spatial map, and demonstrates the computational advantages of this mechanism.

      Weaknesses:

      The relation between the model and experimentally recorded activity needs some clarification

      The relation with indexing theory could be made more clear

      The importance of different modeling ingredients and dynamical mechanisms could be made more clear

      The paper would be strengthened by focusing on the most essential aspects

      Comments:

      The model distinguishes between "barcode activity" and "attractors". Which of the two corresponds to experimentally-recorded barcodes? I would presume the attractors. A potential issue is that the attractors are, as explained in the text (l.137), conjunctions of place activity, barcode activity and "seed" inputs. The fact that the seed activity is shared across attractors seems to imply that they have a non-zero correlation independent of distance. Is that the case in the model? If I understand correctly, Fig 3D shows correlations between an attractor and barcodes at different locations, but correlations between attractors at different locations are not shown. Fig 1 F instead shows that correlations between recorded retrieval activities decay to zero with distance.

      More generally, the fact that the expression "barcode" is apparently used with different meanings in the model and in the experiments is potentially confusing (in the model they correspond to activity generating during caching, and this activity is distinct from the memories; my understanding is that in the experiments barcodes correspond to both caching and retrieval, but perhaps I am mistaken?).

      Our intent is to use the expression “barcode” as similarly as possible between model and experimental work. The reviewer points out that the connection between barcodes in experimental and modeling work is unclear, as well as the relation of “attractors” in our model to previous experimental results. The meaning of ‘barcode’ is absolutely critical—we clarify below our intended meaning, and then describe changes to the manuscript to highlight this.

      In experiments, we observed that activity during caching looked different than ordinary hippocampal activity (i.e. typical “place activity” observed during visits). Empirically there were two major differences. First, there was a pattern of neural activity which was present during every cache . This pattern was also present when birds visually inspected sites containing a cached seed, but not when visually inspecting an empty site. This is what we refer to as “seed activity”. Second, there was a pattern of neural activity which was unique to each cache. This pattern re-occurred during retrieval, and was orthogonal to place activity (see Fig. 1E-F). This is what we refer to as “barcode activity”. In summary, activity during a cache (or retrieval) contains a combination of three components: place activity, seed activity, and barcode activity.

      These experimental findings are recapitulated in our model, as activity during a cache contains a combination of three components: place activity driven by place inputs, seed activity driven by seed inputs, and barcode activity generated by recurrent dynamics. Cache activity in the model corresponds to cache activity in experiments, and barcodes in the model correspond to barcodes in experiments. Our model additionally has “attractors”, meaning that network connectivity changes so that the activity generated during a simulated cache becomes an attractor state of network dynamics. “Attractors” refers to a feature of network dynamics, not a distinct activity state, and we do not yet know if these attractors exist in experimental data.

      Figure 3D, as described in the figure legend, is a correlation of activity during cache and retrieval (in purple), for cache-retrieval pairs at the same or at different sites. We believe this is what the reviewer asks to see: the correlation between attractor states for different cache locations. The reviewer makes an important point: seed activity is shared across all attractors, so then why are correlations not high for all locations? This is because attractors also have a place component, which is anti-correlated for distant locations. This is evident in Fig. 3D by noticing that visit-visit correlations (black line, corresponding to place activity only) are negative for distant locations, and the correlation between attractors (purple line, cache-retrieval pairs) is subtly shifted up relative to the black line (place code only) for these distant locations. The size of this shift is due to the relative magnitude of place and seed inputs. For example, if we increase the strength of the seed input during caching (blue line), we can further increase the correlation between attractors even for quite distant sites:

      Author response image 1.

      To clarify the manuscript, we made the following modifications:

      Section 2.2, first paragraph: We model the hippocampus as a recurrent neural network (RNN) (Alvarez and Squire, 1994; Tsodyks, 1999; Hopfield, 1982) and propose that recurrent dynamics can generate barcodes from place inputs. As in experiments, the model’s population activity during a cache should exhibit both place and barcode activity components.

      Section 2.3, paragraph 3 (starting at “Memory recall in our network…”): As an example, consider a scenario in which an animal has already formed a memory at some location l , resulting in the storage of an attractor \vec{a} into the RNN . The attractor \vec{a} can be thought of as a linear combination of place input-driven activity $p(l)$, seed input-driven activity $s$, and a recurrent-driven barcode component $b$. Later, the animal returns to the same location and attempts recall (i.e. sets r \= 1, Figure 3B). Place inputs for l drive RNN activity towards $p(l)$, which is partially correlated with attractor \vec{a}, and the recurrent dynamics cause network activity to converge onto attractor \vec{a}. In this way, barcode activity $b$ is reactivated as part of attractor \vec{a}, along with the place and seed components stored in the attractor state, $p(l)$ and $s$. The seed input can also affect recall, as discussed in the following section.

      The insights obtained from the network model for the computational role of barcode activity could be explained more clearly. The introduction starts by laying out the indexing theory, which proposes that the hippocampus links an index with each memory so that the memory is reactivated when the index is presented. The experimental paper suggests that the barcode activations play the role of indexes. Yet, in the model reactivations of memories are driven not by presenting bar-code activity, but by presenting place activity (Cache Presence task) or seed activity (Cache Location task). So it seems that either place activity and seed activity play the role of indexes. Section 2.5 nicely shows that ultimately the role of barcode activity is to decorrelate attractors, which seems different from playing the role of indexes. I feel it would be useful that the Discussion reassess more critically the relationship between barcodes, indexing theory, and key-value architectures.

      The reviewer highlights a failure on our part to clearly identify the connection between our findings on barcodes, indexing theory, and key-value architectures. This is another major component of the paper, and below we propose changes to the manuscript to clarify these concepts and their relationships. First, we will summarize the key points that were unclear in our original manuscript.

      The reviewer equates the concept of an ‘index’ with that of a ‘query’: the signal that drives memory reactivation. This may be intuitive, but it is not how a memory index was defined in indexing theory (e.g. Teyler & DiScenna 1986). In indexing theory, the index is a pattern of hippocampal activity that is (a) generated during memory formation, (b) separate from the activity encoding memory content, and (c) linked to memory content via associative plasticity. After memory formation, a memory might be queried by activating a partial set of the memory contents, which would then drive reactivation of the hippocampal index, leading to pattern completion of memory contents. See, for example, figure 1 of Teyler and DiScenna 1986. The ‘index’ is thus not the same as the ‘query’ that drives recall.

      We propose in this work that barcode activity is such an index. Indexing theory originally posited that memory content was encoded by neocortex, and memory index was encoded by hippocampus. However the experiments of Chettih et al. 2024 revealed that the hippocampus contained both memory content and memory index signals, and furthermore there was no division of cells into ‘content’ and ‘index’ subtypes. Thus our model drops the assumption of earlier work that index and content signals correspond to different neurons in different brain areas—a significant advance of our work. Otherwise, the experimentally observed barcodes and the barcodes generated by our computational model play the role of indices as originally defined.

      Our original manuscript was unclear on the relationship of indexing theory and key-value systems. Our work connects diverse areas of memory models, including attractor dynamics, key-value memory systems, and memory indexing. A full account of these literatures and their relationships may be beyond the scope of this manuscript, and we note that a recent review article (Gershman, Fiete, and Irie, 2025) further clarifies the relationship between key-value memory, indexing theory, and the hippocampus. We will cite this work in our discussion as a source for the interested reader.

      Briefly, a key-value memory system distinguishes between the address where a memory is stored, the ‘key’, and the content of that memory, the ‘value’. An advantage of such systems is that keys can be optimized for purposes independent of the value of each memory. The use of barcodes in our model to decorrelate memories is related to this optimization of keys in key-value memory systems. By generating barcodes and adding this to the attractor state corresponding to a cache memory, the ‘address’ of the memory in population activity is differentiated from other memories. Our work is thus consistent with the idea that hippocampus generates keys and implements a key storage system. However it is not so straightforward to equate barcodes with keys, as they are defined in key-value memory. As the reviewer points out, memory recall can be driven by location and seed inputs, i.e. it is content-addressable. We think of the barcode as modifying the memory address to better separate similar memories, without changing memory content, and the resulting memory can be recalled by querying with either content or barcode. Given the complex and speculative nature of these relationships, we prefer to note the salient connection of our work with ongoing efforts applying the key-value framework to biological memory, and leave the precise details of this connection to future work.

      We make the following changes in the manuscript to clarify these ideas:

      Introduction, first paragraph: In this scheme, during memory formation the hippocampus generates an index of population activity, and the neurons representing this index are linked with the neurons representing memory content by associative plasticity . Later, re-experience of partial memory contents may reactivate the index, and reactivation of the index drives complete recall of the memory contents.

      Discussion, 4th paragraph on key-value: Interestingly, prior theoretical work has suggested neural implementations for both key-value memory and attention mechanisms, arguing for their usefulness in neural systems such as long term memory (Kanerva, 1988; Tyulmankov et al., 2021; Bricken and Pehlevan, 2021; Whittington et al., 2021; Kozachkov et al., 2023; Krotov and Hopfield, 2020; Gershman 2025 ). In this framework, the address where a memory is stored (the key) may be optimized independently of the value or content of the memory. In our model, barcodes improve memory performance by providing a content-independent scaffold that binds to memory content, preventing memories with overlapping content from blurring together. Thus barcodes can be considered as a change in memory address, and our model suggests important connections between recurrent neural activity and key generation mechanisms. However we note that barcodes should not be literally equated with keys in key-value systems as our model’s memory is ‘content-addresable’—it can be queried by place and seed inputs.

      The model includes a number of non-standard ingredients. It would be useful to explain which of these ingredients and which of the described mechanisms are essential for the studied phenomenon. In particular:

      - the dynamics in Eq.2 include a shunting inhibition term. Is it essential and why?

      The shunting inhibition is important as it acts to normalize the network activity to prevent runaway excitation. We hope to clarify this further by amending the following sentence in section 2.2: “g (·) is a leak rate that depends on the average activity of the full network, representing a form of global shunting inhibition that normalizes network activity to prevent runaway excitation from recurrent dynamics.”

      - same question for the global inhibition included in the random connectivity;

      The distribution from which connectivity strengths are drawn has a negative mean (global inhibition). This causes activity during caching (i.e. r = 1) to be sparser than activity during visits (i.e. r = 0), and was chosen to match experimental findings. In figures 2B and S2B we show that our model can transition between a mode with place code only, barcode only, or a mode containing both, by changing the variance of the weight distribution while holding the mean constant. We suggest clarifying this by editing the following in section 2.2, paragraph 2: “We initialize the recurrent weights from a random Gaussian distribution, . where 𝑁<sub>𝑋</sub> is the number of RNN neurons and μ < 0, reflecting global subtractive inhibition that encourages sparse network activity to match experimental findings (Chettih et al. 2024).”

      - the model is fully rate-based, but for certain figures, spikes are randomly generated. This seems superfluous.

      Spikes are simulated for one analysis and one visualization, where it is important to consider noise or variability in neural responses across trials. First, for Fig. 2H,J, we generated spikes to allow a visual comparison to figures that can be easily generated from experimental data. Second, and more significantly, for the analysis underlying Fig. 3D, it is essential to simulate variability in neural responses. Because our rate-based models are noiseless, the RNN’s rate vector at site distance = 0 will always be the same and result in a correlation of 1 for both visit-visit and cache-retrieval. However, we show that, if one interprets the rate as a noisy Poisson spiking process, the correlation at site distance = 0 between a cache-retrieval pair is higher than that of two visits. This is because under a Poisson spiking model, the signal-to-noise ratio is higher for cache-retrieval activity, where rates are higher in magnitude. The greater correlation for a cache-retrieval pair at the same site, relative to visits at the same site, is an experimental finding that was critical for our model to reproduce. We detail clarifications to the manuscript below in response to the reviewer’s following and related question.

      How are the correlations determined in the model (e.g., Fig 2 B)? The methods explain that they are computed from Poisson-generated spikes, but over which time period? Presumably during steady-state responses, but are these responses time-averaged?

      The reviewer points out a lack of clarity in our original manuscript. Correlations for events (caches, retrievals and visits) at different sites are calculated in two sections of the paper (2B, 3D), for different purposes and with slight differences in methods:

      - For figure 2B, no spikes are simulated. Note that the methods mentioning poisson spike generation specify only Fig. 2H,J and Fig. 3D. We simply take the network’s rate vector at timestep t=100 (when the decorrelating effect of chaotic dynamics has saturated, S1A-B) and correlate this vector when generated at different locations. We now clarify this in the legend for Figure 2B: “We show correlation of place inputs (gray) and correlation of the RNN's rate vector at t = 100 (black).”

      - For Figure 3D, we want to compare the model to empirical results from Chettih et al. 2024, and reproduced in this paper in Fig. 1E-F. These empirical results are derived from correlating vectors of spiking activity on pairs of single trials, and are thus affected by noise or variability in neural responses as described in our response to the reviewer’s previous question. We thus took the RNN’s rate vector at t=100 and simulated spiking data by drawing samples from a poisson distribution to get spike counts. Our original manuscript was unclear about this, and we suggest the following changes:

      - Legend for Figure 3D: D. Correlation of Poisson-generated spikes simulated from RNN rate vectors at two sites, plotted as a function of the distance between the two sites.

      - Section 2.3, last paragraph: Population activity during retrieval closely matches activity during caching, and is substantially decorrelated from activity during visits (Figure 3C). To compare our model with the empirical results reproduced in Figure 1E,F, we ran in silico experiments with caches and retrievals at varying sites in the circular arena. We simulated Poisson-generated spikes drawn from our network's underlying rates to match the intrinsic variability in empirical data (see Methods).

      - Methods, subsection Spatial correlation of RNN activity for cache-retrieval pairs at different sites: To calculate correlation values as in Figure \ref{fig3}D, we simulated experiments where 5 sites were randomly chosen for caching and retrieval. To compare model results to the empirical data in Fig. 1E,F, which includes intrinsic neural variability, we sampled Poisson-generated spike counts from the rates output by our model. Specifically, for RNN activity \vec{r_i} at location i, using the rates at t=100 as elsewhere, we first generate a sample vector of spikes…

      I was confused by early and late responses in Fig 2 C. The text says that the activity is initialized at zero, so the response at t=0 should be flat (and zero). More generally, I am not sure I understand why the dynamics matter for the phenomenon at all, presumably the decorrelation shown in Fig 2B depends only on steady state activity (cf previous question).

      Thanks for catching this mistake. The legend has been updated to indicate that the ‘early’ response is actually at t=1, when network activity reflects place inputs without the effects of dynamics. The reviewer is correct that we are primarily interested in the ‘late’ response of the network. All other results in the paper use this late response at t=100. As shown in Fig. S2A,B, this timepoint is not truly a steady state, as activity in the network continues to change, but the decorrelation of network activity with place-driven activity has saturated.

      We include the early response in Fig. 2C for visual comparison of the purely place-driven early activity with the eventual network response. It is also relevant since, as the reviewer points out above, there is a shunting inhibition term in the dynamics that is present during both low and high recurrent strength simulations.

      Related to the previous point, the discussion of decorrelation (l.79 - 97) is somewhat confusing. That paragraph focuses on chaotic activity, but chaos decorrelates responses across different time points. Here the main phenomenon is the decorrelation of responses across different spatial inputs (Fig 2B). This decorrelation is presumably due to the fact that different inputs lead to different non-trivial steady-state responses, but this requires some clarification. If that is correct, the temporal chaos adds fluctuations around these non-trivial steady-state responses, but that alone would not lead to the decorrelation shown in Fig 2B.

      We agree with the reviewer that chaotic activity produces a decorrelation across time points. Because of chaotic dynamics, network activity does not settle into a trivial steady-state, and instead evolves from the initial state in an unpredictable way. The network does not settle into a steady-state pattern, but both the decorrelation of network state with initial state and the rate of change in the network state saturate after ~t=25 timesteps, as shown in Fig. S2A-B.

      The initial activity for nearby states is similar, due to them receiving similar place inputs.

      Because network activity is chaotically decorrelated from this initial state by temporal dynamics, ‘late stage’ network activity between nearby spatial states is less correlated than ‘early stage’ activity. Thus the temporal decorrelation produces a spatial decorrelation. We believe that the changes we have introduced to the manuscript in revision will make this point clearer in our resubmission.

      A key ingredient of the model is that the recurrent interactions are switched on and off between "caching" and "visits". The discussion argues that a possible mechanism for this is recurrent inhibition (l.320), which would need to be added. However two forms of inhibition are already included in the model. The text also says that it is unclear how units in the model should be mapped onto E and I neurons. However the model makes explicit assumptions about this, in particular by generating spikes from individual neurons. Altogether, I did not find that part of the Discussion convincing.

      We agree with the reviewer that this section is a limitation of our current work, and in fact it is an ongoing area of future research. However we think the advances in this current work warrant publication despite this topic requiring further research. We attempted to discuss this limitation explicitly, and note that the other reviewer pointed this section out as particularly helpful. We do not think it is problematic for a realistic model of the brain to ultimately include 3, or even more forms of inhibition. We do not think that poisson-generated spikes commit us to interpreting network units as single neurons. Spikes are not a core part of our model’s mechanism, and were used only as a mechanism of introducing variability on top of deterministic rates for specific analyses. Furthermore one could still view network units as pools of both E and I spiking neurons. We would welcome further recommendations the reviewer believes are important to note in this section on our model’s limitations.

      On lines 117-120 the text briefly mentions an alternate feed-forward model and promptly discards it. The discussion instead says that a "separate possibility is that barcodes are generated in a circuit upstream of where memories are stored, and supplied as inputs to the hippocampal population", and that this possibility would lead to identical conclusions. The two statements seem a bit contradictory. It seems that the alternative possibility would replace the need for switching on and off recurrent interactions, with a mechanism where barcode inputs are switched on and off. This alternate scenario is perhaps more plausible, so it would be useful to discuss it more explicitly.

      We apologize for the confusion here, which seems to be due to our phrasing in the discussion section. We do reject the idea that a simple feed-forward model could generate the spatial correlation profile observed in data, as mentioned in the text and included as Fig. S2. Our statement in the discussion may have seemed contradictory because here we intended to discuss the possibility that an upstream area generates barcodes, for example by the chaotic recurrent dynamics proposed in our work, while a downstream network receives these barcodes as inputs and undergoes plasticity to store memories as attractors. We did not intend to suggest any connection to the feedforward model of barcode generation, and apologize for the confusion. Our claim that this ‘2 network’ solution would lead to similar conclusions is because the upstream network would need an efficient means of barcode generation, and the downstream network would need an efficient means of storing memory attractors, and separating these functions into different networks is not likely to affect for example the advantage of partially decorrelating memory attractors. Moreover, the downstream network would still require some form of recurrent gating, so that during visits it exhibits place activity without activating stored memory attractors!

      We thus chose a 1 network instead of a 2 network solution because it was simpler and, we believe, more interesting. It is challenging in the absence of more data to say which is more plausible, thus we wanted to mention the possibility of a 2 network solution. We suggest the following changes to the manuscript:

      - Discussion, 3rd paragraph: “Alternatively, other mechanisms may be involved in generating barcodes. We demonstrated that conventional feed-forward sparsification (Babadi and Sompolinsky, 2014; Xie et al., 2023) was highly inefficient, but more specialized computations may improve this (Földiak, 1990; Olshausen and Field, 1996; Sacouto and Wichert, 2023; Muscinelli et al., 2023). Another possibility is that barcodes are generated in a separate recurrent network upstream of the recurrent network where memories are stored. In this 2-network scenario, the downstream network receives both spatial tuning and barcodes as inputs. This would not obviate the need for modulating recurrent strength in the downstream network to switch between input-driven modes and attractor dynamics. We suspect separating barcode generation and memory storage in separate networks would not fundamentally affect our conclusions.”

      As a minor note, the beginning of the discussion states that the presented model is similar to previous recurrent network models of the hippocampus. It would be worth noting that several of the cited works assign a very different role to recurrent interactions: they generate place cell activity, while the present model assumes it is inherited from upstream inputs.

      We are not sure how best to modify the paper to address this suggestion. As far as we know, all of the cited models which deal with spatial encoding do assume that the hippocampus receives a spatially-modulated or spatially-tuned input. For example, the Tsodyks 1999 paper cited in this paragraph uses exponentially-decaying place inputs to each neuron highly similar to our model. Furthermore we explore how our model would perform if we change the format of spatial inputs in Fig. S4, and find key results are unchanged. It is unclear how hippocampal place fields could emerge without inputs that differentiate between spatial locations. We think it is appropriate to highlight the similarity of our model to well known hopfield-type recurrent models, where memories are stored as attractor states of the network dynamics.

      On the other hand, we agree that a common line of hippocampal modeling proposes that recurrent interactions reshape spatial inputs to produce place fields. This often arises in the context of hippocampus generating a predictive map, where inputs may be one-hot for a single spatial state, in a grid cell-like format, or a random projection of sensory features. We attempted to address this in section 2.6, using a model which superimposes the random connectivity needed for barcode generation with the structured connectivity needed for predictive map formation. We found that such a model was able to perform both predictive and barcode functions, suggesting a path forward to connecting different lines of hippocampal modeling in future work.

  2. bafybeibc6bqagreyg5oggwyomlj6pxvjmv45r44b4hjufzqkd73aafck7a.ipfs.inbrowser.link bafybeibc6bqagreyg5oggwyomlj6pxvjmv45r44b4hjufzqkd73aafck7a.ipfs.inbrowser.link
    1. Reviewer #2 (Public review):

      Summary:

      In this paper, authors used MEFs expressing the R1441G mutant of leucine-rich repeat kinase 2 (LRRK2), a mutant associated with the early onset of Parkinson's disease. They report that in these cells LAMP2 fluorescence is higher but BMP fluorescence is lower, MVE size is reduced and that MVEs contain less ILVs. They also report that LAMP2-positive EVs are increased in mutant cells in a process sensitive to LRRK2 kinase inhibition but are further increased by glucocerebrosidase (GCase) inhibition, and that total di-22:6-BMP and total di-18:1-BMP are increased in mutant LRRK2 MEFs compared to WT cells by mass spectrometry. They also report that LRRK2 kinase inhibition partially restores cellular BMP levels, and that GCase inhibition further increased BMP levels, and that in EVs from the LRRK2 mutant, LRRK2 inhibition decreases BMP while GCase inhibition has the opposite effect. Moreover, they report that BMP increase is not due to increased BMP synthesis, although authors observe that CLN5 is increased in LRRK2 mutant cells. Finally, they report that GW4869 decreases EV release and exosomal BMP, while bafilomycin A1 increases EV release. They conclude that LRRK2 regulates BMP levels (in cells) and release (via EVs). They also conclude that the process is modulated by GCase in LRRK2 mutant cells, and that these studies may contribute to the use of BMP-positive EVs as a biomarker for Parkinson's disease and associated treatments.

      Strengths:

      This is a potentially interesting paper,. However, I had comments that authors needed to address to clarify some aspects of their study.

      Weaknesses:

      (1) The authors seem to have missed the point in their reply to my first comment. They mention the paper by Stuffers et al., who reports that endosome biogenesis continues without ESCRT. This is a nice paper, but it is irrelevant to the subject at hand. In my initial comment, I drew the author's attention to an apparent contradiction: higher LAMP2 staining in R1441G LRRK2 knock-in MEFs and yet smaller MVEs with a reduced surface area. LAMP2 being one of the major glycoproteins of MVE's limiting membrane, one would have expected lower LAMP2 staining if cells contain fewer and smaller MVEs. Authors now state that elevated LAMP2 expression in cells expressing R1441G reflects a cell type-specific effect (differential penetrance of LRRK2 signaling on lysosomal biogenesis), because amounts of LAMP1 and CD63 are similar in cells from LRRK2 G2019S PD patients and control cells (new Fig 7A-F). However, authors still conclude that LRRK2 modulates the lysosomal network, including LAMP2 and CLN5. Does it?

      Similarly, the mass spec analysis of BMP (Fig S1H) does not support the data in Fig 1. Does this Table include all major isoforms found in these cells? If so, the dominant isoform is by far the di-18:1 isoform in wt and R1441G cells (at least 10X more abundant than other isoforms). Now, di-18:1-BMP is roughly 4X more abundant in R1441G cells when compared to wt cells, while BMP is reduced by half in R1441G cells (light microscopy in Fig 1). Authors argue that light microscopy may only detects a so-called antibody accessible pool. What is this? And why would this pool decrease in R1441G cells when LAMP2 is higher? Alternatively, they argue that the anti-BMP antibody may be less specific and detect other analytes. As I had already mentioned, this makes no sense, since the observed signal is lower and not higher. If authors do not trust their light microscopy analysis, why show the data?

      (2) Cells contain 3 LAMP2 isoforms. Which one is upregulated and/or secreted in exosomes?

      (3) The new Fig S4A is far from convincing. How were cells fractionated and what are the gradients (not described in Methods)? CD63 (presumably endolysosomes) is spread over fractions 8 - 13. LRRK2 (fractions 8-9) does not copurify with CD63. The bulk of LRRK2 is at the bottom (presumably cytosol if this is a floatation gradient), and a minor fraction moves into the gradient. CLN5 is even less clear since the bulk is also at the bottom with a tiny fraction only between LRRK2 and CD63. Also, why do authors conclude that a considerable pool of newly synthesized CLN5 did not reach its final destination at the endolysosome and may instead be retained in the ER? Where is the ER on the gradient?

      (4) Fig S4B shows blots of whole cell lysates from CTRL and LRRK2 mutant-derived fibroblasts: 6 lanes are shown but without captions, containing varying amounts of calnexin and CD63. In addition, the blots look very dirty. Where is CD63? Is it the minor band at ≈37 kD (as in Fig S4A)? Or the major band below the 50kD marker? What are the other bands on these blots? As a result, the quantification shown in the bar graph does not mean much.

      (5) The cell content of 18.1-BMP is increased approx. 5X by BafA1 (Fig 6C) but amounts of 18.1-BMP secreted in EVs hardly changes (Fig 6E). Since BMP is mostly present as 18.1 isoform (22:6-BMP being only a minor species, Fig S1H), does it mean that BafA1 does not increase BMP secretion and/or only a minor fraction of total cellular BMP is secreted in exosomes?

      Comments on revisions:

      How come 0.2 mmol/L of 22:6 and 18:1 fatty acid both correspond to 65 µg/mL (Fig 4A)?

      It is stated in the Legend of Fig4 that long (B-C) and short (D) chase time points are shown as fold change. There is no panel D in the figure.

    2. Author response:

      The following is the authors’ response to the original reviews.

      eLife Assessment

      This useful study presents the potentially interesting concept that LRRK2 regulates cellular BMP levels and their release via extracellular vesicles, with GCase activity further modulating this process in mutant LRRK2-expressing cells. However, the evidence supporting the conclusions remains incomplete, and certain statistical analyses are inadequate. This work would be of interest to cell biologists working on Parkinson's disease.

      Reviewer #1 (Public review):

      Summary:

      Even though mutations in LRRK2 and GBA1 (which encodes the protein GCase) increase the risk of developing Parkinson's disease (PD), the specific mechanisms driving neurodegeneration remain unclear. Given their known roles in lysosomal function, the authors investigate how LRRK2 and GCase activity influence the exocytosis of the lysosomal lipid BMP via extracellular vesicles (EVs). They use fibroblasts carrying the PDassociated LRRK2-R1441G mutation and pharmacologically modulate LRRK2 and GCase activity.

      Strengths:

      The authors examine both proteins at endogenous levels, using MEFs instead of cancer cells. The study's scope is potentially interesting and could yield relevant insights into PD disease mechanisms.

      Weaknesses:

      Many of the authors' conclusions are overstated and not sufficiently supported by the data. Several statistical errors undermine their claims. Pharmacological treatment is very long, leading to potential off-target effects. Additionally, the authors should be more rigorous when using EV markers.

      We thank the reviewer for these valuable observations. In the revised manuscript, we have addressed each of these points as follows:

      (1) Conclusions and data support – We carefully revised our text throughout the manuscript to ensure that all conclusions are better supported by the presented data. For instance, we now explicitly state that while pharmacological modulation supports the regulatory role of LRRK2 activity in EV-mediated BMP release, we have softened our conclusions concerning the contribution of GCase in this model (see revised Results and Discussion sections).

      (2) Statistical analyses – We reanalyzed experiments involving more than two groups and replaced simple t-tests with non-parametric Kruskal-Wallis tests followed by Dunn’s post hoc comparisons. This approach, described in the updated figure legends (e.g., Figure 2D-F and H-J), provides a more rigorous statistical framework that accounts for small sample sizes and variability typical of EV quantifications.

      (3) Pharmacological treatment duration – Prolonged MLi-2 treatments have been extensively used in the field without evidence of significant off-target effects. Several studies, including Fell et al. (2015, J Pharmacol Exp Ther 355:397-409), De Wit et al. (2019, Mol Neurobiol 56:5273-5286), Ho et al. (2022, NPJ Parkinson’s Dis 8:115),Tengberg et al. (2024, Neurobiol Dis 202:106728), and Jaimon et al. (2025, Sci Signal 18:eads5761), have applied long-term (24-48 h) MLi-2 treatments at comparable concentrations without detecting toxicity or off-target alterations, including in MEFs (Ho et al., 2022; Dhekne et al., 2018, eLife 7:e40202).  In our study, 48-hour incubations were necessary to sustain full LRRK2 inhibition throughout the extracellular vesicle (EV) collection period. EV biogenesis, BMP biosynthesis, and packaging into EVs are timedependent processes; therefore, extended incubation and collection periods (48 h) were required to allow downstream effects of LRRK2 inhibition on BMP production and release to manifest, and to obtain sufficient EV material for biochemical and lipidomic analyses. This experimental design also reflects our and others’ previous observations in humans and non-human primates, where urinary BMP changes are associated with chronic or subchronic LRRK2 inhibitor treatment (Baptista MAS, Merchant K, et al. Sci Transl Med. 2020, 12:eaav0820; Jennings D, et al. Sci Transl Med. 2022, 14:eabj2658; Maloney MT, et al. Mol Neurodegener. 2025, 20:89). Importantly, under these conditions, we did not observe significant changes in cell viability or morphology, supporting that the treatment was well tolerated.  We have clarified this rationale in the revised Methods section to emphasize that the prolonged incubation reflects the experimental design for EV isolation rather than a requirement for achieving LRRK2 inhibition.

      (4) EV markers – We and others have reported enrichment of Flotillin-1 and LAMP proteins in isolated small EV fractions (Kowal et al., 2016; Lu et al., 2018; Mathieu et al., 2021; Ferreira et al., 2022). Moreover, LAMP proteins have been reported to be more enriched in EVs of endolysosomal origin (Mathieu et al., 2021). To further strengthen this point, we performed new experiments using a CD63-pHluorin sensor combined with TIRF microscopy, which allowed real-time visualization of CD63-positive exosome release. These new data (now presented in Figure 7, Panels G-I; Videos 1 and 2) confirm increased CD63-positive EV release in LRRK2 mutant fibroblasts, which was reversed by LRRK2 inhibition with MLi-2. The CD63-positive compartment was also largely BMPpositive (new Figure 7D, F, G), reinforcing our conclusions and providing additional rigor in EV marker validation.

      Reviewer #2 (Public review):

      Summary:

      In this paper, the authors used MEFs expressing the R1441G mutant of leucine-rich repeat kinase 2 (LRRK2), a mutant associated with the early onset of Parkinson's disease. They report that in these cells LAMP2 fluorescence is higher but BMP fluorescence is lower, MVE size is reduced, and that MVEs contain less ILVs. They also report that LAMP2-positive EVs are increased in mutant cells in a process sensitive to LRRK2 kinase inhibition but are further increased by glucocerebrosidase (GCase) inhibition, and that total di-22:6-BMP and total di-18:1-BMP are increased in mutant LRRK2 MEFs compared to WT cells by mass spectrometry. They also report that LRRK2 kinase inhibition partially restores cellular BMP levels, and that GCase inhibition further increases BMP levels, and that in EVs from the LRRK2 mutant, LRRK2 inhibition decreases BMP while GCase inhibition has the opposite effect. Moreover, they report that the BMP increase is not due to increased BMP synthesis, although the authors observe that CLN5 is increased in LRRK2 mutant cells. Finally, they report that GW4869 decreases EV release and exosomal BMP, while bafilomycin A1 increases EV release. They conclude that LRRK2 regulates BMP levels (in cells) and release (via EVs). They also conclude that the process is modulated by GCase in LRRK2 mutant cells, and that these studies may contribute to the use of BMP-positive EVs as a biomarker for Parkinson's disease and associated treatments.

      Strengths:

      This is an interesting paper, which provides novel insights into the biogenesis of exosomes with exciting biomedical potential. However, I have comments that authors need to address to clarify some aspects of their study.

      Weaknesses:

      (1) The intensity of LAMP2 staining is increased significantly in cells expressing the R1441G mutant of LRRK2 when compared to WT cells (Figure 1C). Yet mutant cells contain significantly smaller MVEs with fewer ILVs, and the MVE surface area is reduced (Figure 1D-F). This is quite surprising since LAMP2 is a major component of the limiting membrane of late endosomes. Are other proteins of endo-lysosomes (eg, LAMP1, CD63, RAB7) or markers (lysotracker) also decreased (see also below)?

      As referenced in our original manuscript, several previous studies have reported endolysosomal morphological and homeostatic defects in cells harboring pathogenic LRRK2 mutations. LAMP2 can be upregulated as part of a lysosomal biogenesis or stress response (e.g., via MiT/TFE transcription factors such as TFEB; Sardiello et al., Science 2009, 325:473-477), whereas ILV biogenesis is primarily controlled by ESCRT- and SMPD3-dependent pathways that are regulated independently of MiT/TFE-driven transcriptional programs. Indeed, Stuffers et al. (Traffic 2009, 10:925-937) demonstrated that depletion of key ESCRT subunits markedly inhibited ILV formation while concomitantly increasing LAMP2 expression, highlighting the mechanistic dissociation between LAMP2 abundance and ILV number. In our study, we observed a similar pattern in R1441G LRRK2 MEFs, in which elevated LAMP2 staining and protein levels occurred despite a reduction in MVE size and ILV number. We interpret this as a compensatory lysosomal biogenesis response.

      Our revised manuscript now includes new immunofluorescence data for BMP, LAMP1 and CD63 (New Figure 7, Panels A-F) together with biochemical analysis of CD63 protein levels (New Supplemental Figure 4, Panel B) in human skin fibroblasts derived from healthy donors and LRRK2 G2019S PD patients. Quantitative analysis of these experiments revealed no statistically significant differences in total cellular levels of either LAMP1 or CD63 between groups. However, we observed a consistent decrease in BMP immunostaining intensity (New Figure 7, Panel A and B), in agreement with our findings in mouse fibroblasts. We therefore propose that the elevated LAMP2 expression observed in the engineered MEF clone expressing R1441G may reflect a cell type-specific effect, potentially linked to differential penetrance of LRRK2 signaling on the lysosomal biogenesis response. We have updated the Results and Discussion section of the manuscript to incorporate and clarify these findings.

      (2) LRRK2 has been reported to interact with endolysosomal membranes. Does the R1441G mutant bind LAMP2- and/or BMP-positive membranes? 

      We agree that LRRK2 has been reported to associate dynamically with endolysosomal membranes, particularly under conditions of endolysosomal stress or damage (Eguchi T, et al. PNAS 2018, 115:E9115-E9124; Bonet-Ponce L, et al. Sci Adv. 2020, 6:eabb2454; Wang X, et al. Elife. 2023, 12:e87255).

      Nevertheless, to explore whether LRRK2 associates with BMP-positive endolysosomes, we performed subcellular fractionation followed by biochemical analysis of endolysosomal fractions, since our available LRRK2 antibodies did not provide reliable immunofluorescence signals. These experiments were carried out using human skin fibroblasts derived from both healthy controls and Parkinson’s disease patients carrying the LRRK2-G2019S mutation. In both control and mutant fibroblasts, a pool of LRRK2 was detected in fractions positive for the BMP synthase CLN5 and the endolysosomal marker CD63 (New Supplementary Figure 4, Panel A), supporting the localization of LRRK2 to endolysosomal membranes that are likely BMP-enriched. Our manuscript’s Results and Methods sections have been updated accordingly.

      Does the mutant affect endolysosomes?

      As referenced in our original manuscript, several studies have reported that pathogenic LRRK2 mutations can lead to endolysosomal defects. Consistent with these reports, we also observed morphological alterations in endolysosomes of cells expressing mutant LRRK2, including reduced MVE size and fewer ILVs, as shown in Figure 1D–F. These observations are in agreement with previously described phenotypes associated with pathogenic LRRK2 variants. Furthermore, in mutant LRRK2 MEFs, and now in humanderived fibroblasts (see new Figure 7, Panel A and B), we observed a decrease in BMP immunostaining signal.

      (3) Immunofluorescence data indicate that BMP is decreased in mutant LRRK2expressing cells compared to WT (Figure 1A-B), but mass spec data indicate that di-22:6BMP and di-18:1-BMP are increased (Figure 3). Authors conclude that the BMP pool detected by mass spec in mutant cells is less antibody-accessible than that present in wt cells, or that the anti-BMP antibody is less specific and that it detects other analytes. This is an awkward conclusion, since the IF signal with the antibody is lower (not higher): why would the antibody be less specific? Could it be that the antibody does not see all BMP isoforms equally well? Moreover, the observations that mutant cells contain smaller MVEs (Figure 1D-F) with fewer ILVs are consistent with the IF data and reduced BMP amounts. This needs to be clarified.

      As previously reported by us (Lu et al., J Cell Biol 2022;221:e202105060) and others (Berg AL, et al. Cancer Lett. 2023, 557:216090), discrepancies can occur between BMP levels detected by immunofluorescence and those quantified by mass spectrometry. This is because immunostaining reflects the pool of antibody-accessible BMP, whereas lipidomics measures the total cellular content of all BMP molecular species, irrespective of their distribution or accessibility.

      We agree that the anti-BMP antibody may not detect all BMP isoforms equally well. Differences in acyl chain composition (such as the degree of saturation or chain length) can alter the stereochemistry of BMP and, consequently, epitope accessibility to antibody binding.

      In addition, in a personal communication with Monther Abu-Remaileh (Stanford University), we were informed that the antibody may also cross-react with other lipid species in endolysosomes. Nevertheless, since there is no formal evidence supporting this, we have removed the sentence in the Discussion section stating “Alternatively, the antibody may also detect non-BMP analytes” to avoid any potential misinterpretations. In its place, we have added a short statement noting that “not all BMP isoforms may be detected equally well”.

      Mass spectrometry data are only shown for two BMP species (di-22:6, di-18:1). What are the major BMP isoforms in WT cells? The authors should show the complete analysis for all BMP species if they wish to draw quantitative conclusions about the amounts of BMP in wt and mutant cells. Finally, BMP and PG are isobaric lipids. Fragmentation of BMPs or PGs results in characteristic fingerprints, but the presence of each daughter ion is not absolutely specific for either lipid. This should be clarified, e.g., were BMP and PG separated before mass spec analysis? Was PG affected? The authors should also compare the BMP data with mass spec data obtained with a control lipid, e.g., PC.

      Regarding BMP isoforms, our targeted UPLC-MS/MS analyses revealed that 2,2′-di-22:6-BMP (sn2/sn2′) and 2,2′-di-18:1-BMP (sn2/sn2′) are the predominant BMP isoforms in MEF cells, consistent with previous reports showing docosahexaenoyl (22:6; DHA) and oleoyl (18:1) BMP as the most abundant isoforms. Across diverse mammalian cells and tissues, BMP typically exhibits a fatty acid composition dominated by oleoyl, with polyunsaturated fatty acids (particularly DHA) also contributing substantially. Enrichment of DHA-containing BMP species has been observed in multiple systems, including rat uterine stromal cells, PC12 cells, THP-1 and RAW macrophages, as well as in rat and human liver. This consistent presence of oleoyl- and docosahexaenoyl-containing BMP species across tissues indicates that these acyl chains are conserved features influencing the lipid’s structural and functional characteristics (Kobayashi et al. J Biol Chem, 2002; Hullin-Matsuda et al. Prostaglandins Leukotriens Essent Fatty Acids, 2009; Thompson et al. Int J Toxicol. 2012; Delton-Vandenbroucke et al. J Lipid Res, 2019).

      Nevertheless, we have included a Table (Panel H in updated Supplemental Figure 1) showing other BMP species that were also detected in our lipidomics analysis. Overall, dioleoyl (18:1)- and di-docosahexaenoyl (22:6)-BMP species were the most abundant in MEF cells, whereas di-arachidonoyl (20:4)- and di-linoleoyl (18:2)-BMP isoforms were present at lower levels. Consistently, R1441G LRRK2 MEFs displayed higher levels of dioleoyl- and di-docosahexaenoyl-BMP compared with WT cells, and these elevations were reduced following LRRK2 kinase inhibition with MLi-2. Data from three independent representative experiments are shown, and the manuscript has been revised accordingly to include these results.

      Regarding the separation of BMP and PG species, we confirm that BMP and PG were chromatographically resolved prior to MS/MS detection using a validated UPLC-MS/MS method developed by Nextcea, Inc. PG exhibits a substantially longer LC retention time than BMP, ensuring complete baseline separation. This approach (established by Nextcea nearly two decades ago and later validated through a multi-year collaboration with the U.S. FDA to clinically qualify di-22:6-BMP as a biomarker) prevents any ambiguity arising from the isobaric nature of BMP and PG species. No changes in PG levels were detected under any experimental conditions.

      Finally, we employed isotope-labeled BMP as an internal standard to ensure robust normalization across samples. These additional details and references cited above have been included in the revised Methods and References sections to further clarify the analytical rigor of our lipidomics workflow.

      (4) It is quite surprising that the amounts of labeled BMP continue to increase for up to 24h after a short 25min pulse with heavy BMP precursors (Figure 4B).

      In these isotope-labeling experiments, it is important to note (as described in our original manuscript) that two distinct pools of metabolically labeled BMP species were detected: semi-labeled BMP (with only one heavy isotope-labeled fatty acyl chain) and fully-labeled BMP (with both fatty acyl chains labeled). We consider the fully-labeled BMP pool to provide the most reliable readout for BMP turnover, as it showed a rapid decline after a 1h chase (decreasing by more than 50% within 8 h in all conditions), reaching its lowest levels at the end of the 48-h chase period.

      The apparent increase in semi-labeled BMP species over time may be explained by continued incorporation of labeled precursors following the initial pulse. Specifically, once existing semi-labeled and fully-labeled BMP molecules are degraded by PLA2G15 (Nyame K, et al. Nature 2025, 642:474-483), the resulting isotope-labeled lysophosphatidylglycerol (LPG) and fatty acids could be recycled and re-enter a new round of BMP biosynthesis, leading to a gradual accumulation of semi-labeled BMP such as di-18:1-BMP. Why would this reasoning not also apply to the fully-labeled species? Once the pulse is completed, newly incorporated non-labeled fatty acyl chains present in the cellular pool can compete with labeled ones during subsequent rounds of lipid remodeling or synthesis. As a result, the probability of generating semi-labeled BMP molecules becomes higher than that of forming fully-labeled species. Consistent with this, our data show an increase in only semi-labeled BMP species (but not in fully-labeled ones) up to 24 hours after the pulse. We have added a clarification regarding this point in the revised manuscript.

      (5) It is argued that upregulation of CLN5 may be due to an overall upregulation of lysosomal enzymes, as LAMP2 levels were also increased (Figure 2A, C, E). Again, this is not consistent with the observed decrease in MVE size and number (Figure 1D-F). As mentioned above, other independent markers of endo-lysosomes should be analyzed (eg, LAMP1, CD63, RAB7), and/or other lysosomal enzymes (e.g. cathepsin. D).

      Our revised manuscript now includes new immunofluorescence data for BMP, LAMP1 and CD63 (New Figure 7, Panels A-F) together with biochemical analysis of CD63 protein levels (New Supplemental Figure 4, Panel B) in human skin fibroblasts derived from healthy controls and LRRK2 G2019S PD patients. Quantitative analysis of these experiments revealed no statistically significant differences in total cellular levels of either LAMP1 or CD63 between groups. However, our results consistently show increased CLN5 protein levels in both mouse and human fibroblast cell lines harboring pathogenic LRRK2 mutations. Upregulation of CLN5 may reflect a compensatory effect from loss of BMP via EV exocytosis. As discussed above, the elevated LAMP2 signal observed in the engineered MEF clone expressing R1441G could represent a cell type-specific effect, potentially linked to differential penetrance of LRRK2 signaling on the lysosomal biogenesis response. Our Results and Discussion sections have been updated accordingly.

      (6) The authors report that the increase in BMP is not due to an increase in BMP synthesis (Figure 4), although they observe a significant increase in CLN5 (Figure 5A) in LRRK2 mutant cells. Some clarification is needed.

      In our original manuscript, we proposed that although CLN5 protein levels are increased in R1441G LRRK2 MEFs, the absence of significant changes in BMP synthesis rates (Figure 4B, C) may reflect either limited substrate availability or that CLN5 is already operating near its maximal enzymatic capacity. Our new subcellular fractionation data (new Figure 7, Panel A) further indicate that, despite a relative increase in total CLN5 levels in G2019S LRRK2 human fibroblasts, the amount of CLN5 associated with endolysosomes remains comparable between mutant LRRK2 and control cells. This suggests that a considerable fraction of upregulated CLN5 may not localize to endolysosomes, potentially accumulating in the endoplasmic reticulum due to enhanced translation or impaired trafficking. Unfortunately, the available anti-CLN5 antibody did not yield reliable immunofluorescence signals, preventing us from directly confirming this possibility. Nevertheless, in light of our new data (new Supplemental Figure 4A), we have included a clarification in the revised manuscript discussing this possibility as well.

      (7) Authors observe that both LAMP2 and BMP are decreased in EVs by GW4869 and increased by bafilomycin (Figure 6). Given my comments above on Figure 1, it would also be nice to illustrate/quantify the effects of these compounds on cells by immunofluorescence.

      We appreciate the reviewer’s suggestion. We have previously published immunofluorescence data showing increased BMP accumulation in endolysosomes following treatment with bafilomycin A1 Lu A, et al. J Cell Biol. 2009, 184:863-879). However, in the present study, our lipidomics analyses revealed a decrease in both di22:6-BMP and di-18:1-BMP species in cells treated with this compound. As discussed above, this apparent discrepancy likely reflects methodological differences between immunofluorescence, which detects only antibody-accessible BMP pools, and lipidomics, which quantifies total cellular BMP content. 

      Moreover, in a recent study (Andreu Z, et al. Nanotheranostics 2023, 7:1-21), BMP levels were analyzed by immunofluorescence in cells treated with spiroepoxide, a potent and selective irreversible inhibitor of nSMase (different from GW4869) known to block EV release. Spiroepoxide-treated cells showed decreased BMP immunostaining; a result that, again, does not align with mass spectrometry data revealing increased cellular BMP levels upon GW4869 treatment. Notably, in that study, spiroepoxide was used instead of GW4869 because the intrinsic autofluorescence of GW4869 could potentially interfere with the immunofluorescence BMP signal.

      We therefore consider lipidomics measurements to provide a more reliable and quantitative representation of BMP dynamics under these conditions.

      Reviewer #1 (Recommendations for the authors):

      Major concerns:

      (1) 48 h for MLi2 treatment seems too long. LRRK2 kinase activity is inhibited with much shorter incubation times. The longer the incubation, the more likely off-target effects are. The authors should repeat these experiments with 1-2 h of MLi2.

      We thank the reviewer for this valuable comment. We acknowledge that MLi-2 is a potent and selective LRRK2 kinase inhibitor that achieves near-complete target engagement within a few hours of treatment. However, prolonged exposure has been widely used in the field without evidence of significant off-target effects. Several studies, including Fell et al. (2015, J Pharmacol Exp Ther 355:397-409), De Wit et al. (2019, Mol Neurobiol 56:5273-5286), Ho et al. (2022, NPJ Parkinson’s Dis 8:115), Tengberg et al. (2024, Neurobiol Dis 202:106728), and Jaimon et al. (2025, Sci Signal 18:eads5761), have employed long-term (24-48 h) MLi-2 treatments at comparable concentrations without detecting toxicity or off-target alterations, including in MEFs (Ho et al., 2022; Dhekne et al., 2018, eLife 7:e40202).

      In our study, 48-hour incubations were necessary to sustain full LRRK2 inhibition throughout the extracellular vesicle (EV) collection period. EV biogenesis, BMP biosynthesis, and packaging into EVs are time-dependent processes; therefore, extended incubation and collection periods (48 h) were required to allow downstream effects of LRRK2 inhibition on BMP production and release to manifest, and to obtain sufficient EV material for biochemical and lipidomic analyses. This experimental design also reflects our and others’ previous observations in humans and non-human primates, where urinary BMP changes are associated with chronic or subchronic LRRK2 inhibitor treatment (Baptista MAS, Merchant K, et al. Sci Transl Med. 2020, 12:eaav0820; Jennings D, et al. Sci Transl Med. 2022, 14:eabj2658; Maloney MT, et al. Mol Neurodegener. 2025, 20:89). Importantly, under these conditions, we did not observe significant changes in cell viability or morphology, supporting that the treatment was well tolerated.

      We have clarified this rationale in the revised Methods section to emphasize that the prolonged incubation reflects the experimental design for EV isolation rather than a requirement for achieving LRRK2 inhibition.

      (2) Is there a reason why the authors don't include CD81, CD63, and Syntenin-1 in their study as an EV marker? Using solely Flotilin-1 does not seem to be enough to justify their claims.

      We actually used not only Flotillin-1 but also LAMP2 as EV markers in our study. While both Flotillin-1 and LAMP2 detection on EVs may vary depending on the cell type, we and others have reported enrichment of Flotillin-1 and LAMP proteins in isolated small EV fractions (Kowal et al., 2016; Lu et al., 2018; Mathieu et al., 2021; Ferreira et al., 2022). In particular, one of these studies reported that “LAMP1-positive subpopulations of EVs represent MVB/lysosome-derived exosomes, which also contain syntenin-1.” Therefore, our choice of EV markers (LAMP2 and Flotillin-1) is consistent with those previously and reliably used to characterize small EVs.

      Nevertheless, to further address the reviewer’s concern, we performed additional experiments using a CD63-based fluorescence sensor (CD63-pHluorin), which, combined with TIRF microscopy, enables real-time visualization of CD63-positive exosome release. These experiments were conducted in control and LRRK2-mutant fibroblasts, and the data are presented in new Figure 7 (Panels G-I; Videos 1 and 2). We have also included all relevant references and clarified this point in the revised manuscript.

      (3) Indeed, to quantify the amount of certain proteins in EVs, the authors should normalize them by CD63 or CD81.

      Protein normalization in isolated EV fractions is indeed challenging. Although tetraspanins such as CD63 and CD81 are commonly enriched in EVs, their abundance can vary considerably across EV subpopulations, cell types, and experimental conditions, making them unreliable as universal normalization markers (Théry et al., J Extracell Vesicles, 2018; Margolis & Sadovsky, Nat Rev Mol Cell Biol, 2019).  Current guidelines from the International Society for Extracellular Vesicles (ISEV), as described in the Minimal Information for Studies of Extracellular Vesicles 2018 (MISEV2018; Théry C, et al. JExtracell Vesicles. 2018, 7:1535750) and updated in MISEV2024 (Welsh JA, et al. J Extracell Vesicles. 2024, 13:e12404), recommend reporting multiple EV markers rather than relying on a single protein for normalization. They also suggest ensuring comparable experimental conditions by using the same number of cells at the start of the experiment and normalizing EV data to cell number or whole-cell lysate protein content at the end of the experiment, among other approaches.

      In our study, we normalized EV data to whole-cell lysate (WCL) protein content, as this approach accounts for differences in EV production due to variations in cell number or treatment conditions and is commonly used in the field (Kowal et al., PNAS, 2016; Mathieu et al., Nat Commun, 2021). We also included Flotillin-1 and LAMP2 as EV markers, both of which have been validated as molecular markers of small EV subpopulations.

      (4) Hyper normalization in WB quantification in Figure 2E-G is statistically incorrect, as it assumes that one group (in this case, R1441G ctrl) has no variability at all, which is not biologically possible. The authors should repeat the quantification without hypernormalizing one of their groups. This issue is prevalent across the whole manuscript.

      We understand the concern regarding “hyper-normalization” (i.e., expressing all values relative to one condition set to 1), which may mask variability in the reference group. However, it is standard practice in immunoblotting analysis to express data relative to a control condition for comparison, as variations in membrane transfer, exposure time, and signal development can differ across blots. In our case, the data are expressed as relative levels (arbitrary units) rather than absolute quantitative values. To facilitate comparison between datasets and account for inter-experimental variation, we continued to express values relative to the mutant LRRK2 MEF condition.

      On the other hand, in lipidomics experiments, despite using the same number of seeded cells and identical extraction and analysis protocols, minor biological and technical variability was observed across independent replicates. This variability is inherent to the experimental system and is now explicitly represented in the new table included in Supplemental Figure 1F, which compiles three independent representative lipidomics experiments showing quantitative BMP levels across different conditions.

      (5) The authors perform a t-test in Figure 2E-G when comparing more than 2 groups, which is wrong. The authors should use a two-way ANOVA as they are comparing genotype and treatment.

      We appreciate the reviewer’s comment and agree with this observation. The MLi-2 and CBE experiments were performed independently and in separate experimental runs; therefore, we have reanalyzed these datasets separately rather than combining them in a two-way ANOVA. To properly compare more than two groups within each dataset, we have now applied a Kruskal-Wallis test followed by an uncorrected Dunn’s post hoc test (Figure 2 D-F and H-J). This non-parametric approach is more appropriate for our data structure, as EV experiments are usually subject to high variability and immunoblot quantifications involving small sample sizes (n≈6) do not always meet the assumptions of normality or equal variance. The Kruskal-Wallis test does not assume normality or equal variances, making it more robust for small, variable biological datasets. The statistical analyses and figure legend have been updated in the revised manuscript accordingly.

      In addition, since our CBE treatments yielded statistically non-significant data, we have softened our conclusions throughout the manuscript concerning the contribution of GCase activity to EV-mediated BMP release modulation.

      (6) There is a very strong reduction in flotillin-1 in R1441G cells vs WT (Figure 2G) in the EV fraction. That reduction is further exacerbated with MLi2, which likely means it is not kinase activity dependent. Can the authors comment on that?

      We agree with the reviewer that Flotillin-1 showed a different behavior compared with LAMP2 in these experiments. As recommended by the MISEV guidelines (Théry C, et al. J Extracell Vesicles. 2018;  7:1535750; Welsh JA, et al. J Extracell Vesicles. 2024, 13:e12404), it is important to analyze more than one EV-associated protein marker. We examined LAMP2, which, together with LAMP1, has been reported to be specifically enriched in EVs of endolysosomal origin (exosomes; Mathieu et al., Nat Commun. 2021, 12:4389 ). In contrast, Flotillin-1 is also associated with small EVs but may represent a distinct EV subpopulation from those positive for LAMP proteins (Kowal J, et al. PNAS 2016, 113:E968-E977).

      Nevertheless, the biochemical analysis of isolated EV fractions was complemented by our lipidomics data and, in the revised version, by TIRF microscopy analysis of exosome release in control and G2019S LRRK2 human fibroblasts (new Figure 7, Panels G-I; Videos 1 and 2). In this analysis, we confirmed increased exocytosis of CD63-pHluorin– positive endolysosomes in G2019S LRRK2 human fibroblasts compared to controls, an effect that was reversed by MLi-2 treatment. The CD63-pHluorin–positive compartment of these cells was also largely positive for BMP (new Figure 7G). Collectively, these findings further support the regulatory role of LRRK2 activity in EV-mediated BMP secretion.

      (7) In Figure 2C, the authors should express that the LAMP2-EV and flotillin-1 EV fractions from the WB are highly exposed. As presently presented, it is slightly misleading.

      We thank the reviewer for this comment. In EV preparations, the amount of protein recovered is typically very low. Therefore, although we loaded all the EV protein obtained from each sample, the immunoblots for LAMP2 and Flotillin-1 in EV fractions required longer exposure times to visualize clear signals across all conditions. We have now indicated in the corresponding figure legend that these EV blots are long-exposure blots to facilitate signal detection and avoid any potential misunderstanding.

      (8) If Figure 2C and D are from two different experiments, they should not be plotted together in Figure 2E-G. You cannot compare the effect of MLi2 vs CBE if done in completely different experiments.

      We appreciate the reviewer’s comment and agree with this observation. The MLi-2 and CBE experiments were performed independently and in separate experimental runs; therefore, we have reanalyzed these datasets separately rather than combining them in a two-way ANOVA. To properly compare more than two groups within each dataset, we have now applied a Kruskal-Wallis test followed by an uncorrected Dunn’s post hoc test (Figure 2 D-F and H-J). This non-parametric approach is more appropriate for our data structure, as EV experiments are usually subject to high variability and immunoblot quantifications involving small sample sizes (n≈6) do not always meet the assumptions of normality or equal variance. The Kruskal-Wallis test does not assume normality or equal variances, making it more robust for small, variable biological datasets. The revised statistical analyses and figure legends have been updated accordingly in the manuscript.

      (9) The authors state that "For the R1441G MEF cells, MLi-2 decreased EV concentration while CBE increased EV particles per ml, in agreement with the effects observed in our biochemical analysis." As Figure S1D shows no statistical significance, the authors don't have sufficient evidence to make this claim.

      We apologize for this overstatement. We have revised the text to clarify that, although the differences did not reach statistical significance, a consistent trend toward decreased EV concentration upon MLi-2 treatment and increased EV release following CBE treatment was observed in R1441G MEF cells.

      (10) "Altogether, given that BMP is specifically enriched in ILVs (which become exosomes upon release), the data presented above support our biochemical analysis (Figure 2C, D, F) and suggest a role for LRRK2 and GCase in modulating BMP release in association with LAMP2-positive exosomes from MEF cells." As Figure 3E shows no statistical difference of BMP on EVs upon CBE treatment, this sentence is not accurate and should be reframed. Furthermore, the authors claim an increase in EV-LAMP2 in R1441G cells compared to WT, however, the amount of BMP in EVs of R1441G cells vs WT is unchanged with a non-significant reduction. This contradiction does not support the authors' conclusions and really puts into question their whole model.

      We thank the reviewer for this observation. After reanalyzing our biochemical data from isolated EV fractions (see new Panels D-F and H-J) using an improved statistical approach, we found that although EV-associated LAMP2 levels were consistently elevated in untreated R1441G LRRK2 MEFs compared to WT cells, CBE treatment only produced a non-significant trend toward increased EV-associated LAMP2 compared to untreated R1441G LRRK2 cells. Accordingly, we have revised the sentence to read as follows:

      “Altogether, given that BMP is specifically enriched in ILVs (which become exosomes upon release), the data presented above support our biochemical analysis (Figure 2C, E, G, I) and suggest that LRRK2 activity regulates BMP release in association with LAMP2positive exosomes, whereas GCase activity appears to have a more variable effect under the tested conditions.”

      We also agree with the reviewer that, in our MEF model, the amount of BMP in EVs of R1441G cells vs WT is unchanged with a non-significant reduction. However, pharmacological modulation supports our conclusion that BMP release is modulated by LRRK2 activity. Specifically, treatment with the LRRK2 inhibitor MLi-2 decreased EVassociated BMP and LAMP2 levels in R1441G LRRK2 MEFs, and our new data (new Figure 7, Panel G-I; Videos 1 and 2) show increased exocytosis of CD63-pHluorin– positive endolysosomes in G2019S LRRK2 human fibroblasts compared to controls, an effect that was reversed by MLi-2 treatment. The CD63-pHluorin–positive compartment of these cells was also largely positive for BMP (new Figure 7G).

      In light of the reviewer’s comment about CBE treatment, we have softened our conclusions throughout the manuscript concerning the contribution of GCase activity in this model.

      (11) In Figure 5, 16 h of MLi2 treatment is too long and can lead to off-target effects. I would advise reducing it to 1-4 h.

      Prolonged MLi-2 treatments have been extensively used in the field without evidence of significant off-target effects. Several studies, including Fell et al. (2015, J Pharmacol Exp Ther 355:397-409), De Wit et al. (2019, Mol Neurobiol 56:5273-5286), Ho et al. (2022, NPJ Parkinson’s Dis 8:115), Tengberg et al. (2024, Neurobiol Dis 202:106728), and Jaimon et al. (2025, Sci Signal 18:eads5761), have applied long-term (24-48 h) MLi-2 treatments at comparable concentrations without detecting toxicity or off-target alterations, including in MEFs (Ho et al., 2022; Dhekne et al., 2018, eLife 7:e40202). Moreover, the data presented in Figure 5 demonstrate a reduction in CLN5 protein levels in both MEFs and human fibroblasts following MLi-2 treatment, confirming the specificity of the observed effects in LRRK2 mutant cells.

      (12) "Our data suggest that BMP is exocytosed in association with EVs and that LRRK2 and GCase activities modulate BMP secretion." Again, cells carrying the R1441G mutation have the same amount of BMP in EVs than WT. This sentence is not factually accurate. Accordingly, CBE did not change the amount of BMP in EVs.

      We thank the reviewer for this observation and agree that, in our MEF model, the amount of BMP in EVs from R1441G LRRK2 cells is comparable to that observed in WT cells. However, pharmacological modulation supports our conclusion that BMP release is modulated by LRRK2 activity. Specifically, treatment with the LRRK2 inhibitor MLi-2 decreased EV-associated BMP levels in R1441G LRRK2 MEFs, and our new data (new Figure 7G-I; Videos 1 and 2) show increased exocytosis of CD63-pHluorin–positive endolysosomes in G2019S LRRK2 human fibroblasts compared to controls, an effect that was reversed by MLi-2 treatment. The CD63-pHluorin–positive compartment of these cells was also largely positive for BMP (new Figure 7G). These findings further support the regulatory role of LRRK2 activity in EV-mediated BMP secretion. In addition, in light of the reviewer’s comment about CBE treatment, we have softened our conclusions throughout the paper concerning the contribution of GCase activity in this model.

      (13) Figure 6; EV release should have been monitored by more accurate markers such as CD63 and CD81.

      We thank the reviewer for this comment. We and others (Kowal et al., 2016; Lu et al., 2018; Mathieu et al., 2021; Ferreira et al., 2022) have reported enrichment of Flotillin-1 and LAMP proteins in isolated small EV fractions. In particular, one of these studies (Mathieu et al., Nat Commun. 2021), in which bafilomycin A1 was also used (to boost exosome release), reported that “LAMP1-positive subpopulations of EVs represent MVB/lysosome-derived exosomes, which also contain syntenin-1.” Altogether, our choice of EV markers (LAMP2 and Flotillin-1) is consistent with those previously and accurately used to characterize EVs. We have now included all relevant references in the revised manuscript to further clarify this point.

      (14) Figure 6 suggests that exosomal BMP is controlled by EV release. I would think that is rather obvious.

      We agree that the finding that exosomal BMP release is influenced by EV secretion may appear “obvious.” However, our intention in Figure 6 was to provide direct experimental evidence confirming this relationship using pharmacological modulators of EV release. Specifically, inhibition of EV secretion with GW4869 reduced exosomal BMP levels, whereas stimulation with bafilomycin A1 increased them. These data were important to establish a causal link between EV trafficking and BMP export, thereby validating our model and supporting the interpretation that LRRK2 regulates BMP homeostasis through EV-mediated exocytosis, which is further modulated, to some extent, by GCase activity. 

      Minor concerns:

      (1) Figure 1: Change colors to be color blind friendly.

      We thank the reviewer for this helpful suggestion. We have adjusted the colors in Figure 1 to be color-blind friendly. In addition, we have applied the same color-blind friendly palette to the new immunofluorescence data presented in new Figure 7, Panel A and D.

      (2) More consistency on "Xmin" vs "X min" would be appreciated.

      We thank the reviewer for this observation. We have revised the manuscript to ensure consistent formatting of time indications throughout the text and figures, using the standardized format “X min.”

      Reviewer #2 (Recommendations for the authors):

      (1)  Figure 2C-D. Were equal amounts of protein loaded in each lane?

      Equal protein amounts were loaded in lanes corresponding to whole-cell lysate (WCL) fractions and normalized based on α-Tubulin levels.

      For the extracellular vesicle (EV) fractions, all protein recovered from EV pellets after isolation was loaded. In all EV-related experiments, we seeded the same number of EVproducing cells per condition, and the resulting EV-derived data (from both immunoblotting and lipidomics analyses) were normalized to the corresponding whole cell lysate (WCL) protein content to ensure comparability across conditions.

      All these technical details have been included in the Materials section of our revised manuscript.

      (2) The authors refer to the papers of Medoh et al (ref 43) and Singh et al. (44) for the key role of CLN5 in the BMP biosynthetic pathway. However, Medoh et al reported that CLN5 is the lysosomal BMP synthase. In contrast, Singh et al. reported that PLD3 and PLD4 mediate the synthesis of SS-BMP, and did not find any role for CLN5. 

      To avoid any confusion or misinterpretation of our findings regarding CLN5 and given that we do not analyze PLD3 or PLD4 in our study, we have decided to replace the reference to Singh et al. with Bulfon D. et al. (Nat. Commun. 2024, 15:9937) instead. This last work, conducted by an independent group distinct from the one that originally described CLN5, also validated CLN5 as the sole BMP synthase in cells.

      Also, authors mention that bafilomycin A1 (B-A1) dramatically boosts EV exocytosis, referring to Kowal et al., 2016 (ref 35) and Lu et al., 2018 (ref 45). However, this is not shown in Kowal et al.

      We thank the reviewer for pointing out this mistake. We apologize for the incorrect citation and have now corrected the reference. The statement regarding the effect of bafilomycin A1 on EV exocytosis now appropriately refers to Mathieu et al., 2021 and Lu et al., 2018.

      (3) Page 7, it is stated that "No statistically significant differences in intracellular BMP levels were observed in WT LRRK2 MEFs upon LRRK2 or GCase inhibition(Supplemental Figure 1D, E)". The authors probably mean "Supplemental Figure 1F, G"

      We thank the reviewer for noting this error. We have corrected the text to refer to panels F and G of Supplemental Figure 1, which correspond to the relevant data. We have also revised the reference to panel I of Supplemental Figure 1 accordingly.

    1. Author response:

      The following is the authors’ response to the original reviews.

      Reviewer #1 (Public Review):

      Summary:

      The authors attempted to clarify the impact of N protein mutations on ribonucleoprotein (RNP) assembly and stability using analytical ultracentrifugation (AUC) and mass photometry (MP). These complementary approaches provide a more comprehensive understanding of the underlying processes. Both SV-AUC and MP results consistently showed enhanced RNP assembly and stability due to N protein mutations.

      The overall research design appears well planned, and the experiments were carefully executed.

      Strengths:

      SV-AUC, performed at higher concentrations (3 µM), captured the hydrodynamic properties of bulk assembled complexes, while MP provided crucial information on dissociation rates and complex lifetimes at nanomolar concentrations. Together, the methods offered detailed insights into association states and dissociation kinetics across a broad concentration range. This represents a thorough application of solution physicochemistry.

      We thank the Reviewer for this positive assessment. 

      Weaknesses:

      Unlike AUC, MP observes only a part of the solution. In MP, bound molecules are accumulated on the glass surface (not dissociated), thus the concentration in solution should change as time develops. How does such concentration change impact the result shown here?

      We agree with the Reviewer that the concentration in solution above the surface will change with time; however, the impact of surface adsorption turns out to be negligible. To show this we have added a calculation as Supplementary Methods that is based on the number of imaged adsorption events, the fraction of imaged area to total surface area, and the initial sample volume and concentration. Under our experimental conditions the reduction is less than 1%, which is well within the range of experimental concentration errors.

      This is in line with the observation that surface adsorption of proteins to glass is critical and needs to be prevented when working at picomolar concentrations (Zhao H, Mayer ML, Schuck P. 2014. Analysis of protein interactions with picomolar binding affinity by fluorescence-detected sedimentation velocity. Anal Chem 86:3181–3187. doi:10.1021/ac500093m), but is ordinarily negligible when working at the mid nanomolar concentration range. The difference in the MP experiments is that where usually the surface adsorption to glass and plastic is invisible, it is being imaged and quantified in MP. The negligible impact of surface adsorption on solution concentration in typical MP experiments is also in line with the results of several studies that have successfully measured dissociation constants of binding equilibria by MP (Young G et al., Science 360 (2018) 432; Wu & Piszczeck, Anal Biochem 592 (2020) 113575; Solterman et al. Angewandte Chemie 59 (2020) 10774) with samples in the 5-50 nM range and similar experimental setup. It should be noted that in the MP experiments no surface functionalization is employed, in contrast to optical biosensors that utilize surface-immobilized ligands and polymeric matrices and thereby enhance the surface binding capacity.

      Even though this depletion effect is negligible under ordinary MP conditions, the Reviewer raises a good point and readers may have a similar question with this novel technique. For this reason, we have added in the MP section of the Methods the sentence “In either configuration, the impact of surface binding on the sample concentration is < 1% and negligible, as described in the Supplementary Methods S1.” and added the detailed calculations in the Supplement accordingly. The use of SV as a traditional, orthogonal technique and the observation of consistent results with those of MP should further dispel readers’ methodological concerns in this point.

      Reviewer #2 (Public Review):

      Summary:

      In this manuscript, the authors apply a variety of biophysical and computational techniques to characterize the effects of mutations in the SARS-CoV-2 N protein on the formation of ribonucleoprotein particles (RNPs). They find convergent evolution in multiple repeated independent mutations strengthening binding interfaces, compensating for other mutations that reduce RNP stability but which enhance viral replication.

      Strengths:

      The authors assay the effects of a variety of mutations found in SARS-CoV-2 variants of concern using a variety of approaches, including biophysical characterization of assembly properties of RNPs, combined with computational prediction of the effects of mutations on molecular structures and interactions. The findings of the paper contribute to our increasing understanding of the principles driving viral self-assembly, and increase the foundation for potential future design of therapeutics such as assembly inhibitors.

      Thank you for highlighting the strengths of our paper and the potential impact on future design of therapeutics.

      Weaknesses:

      For the most part, the paper is well-written, the data presented support the claims made, and the arguments are easy to follow. However, I believe that parts of the presentation could be substantially improved. I found portions of the text to be overly long and verbose and likely could be substantially edited; the use of acronyms and initialisms is pervasive, making parts of the exposition laborious to follow; and portions of the figures are too small and difficult to read/understand.

      We are glad the Reviewer concurs the data support our conclusions, and finds the arguments easy to follow.  We appreciate the comment that the work was not optimally presented. To address this point, we have identified multiple opportunities to streamline the text without jeopardizing the clarity. We have also rewritten the end of the Introduction.

      As recommended, we have reduced and harmonized the use of acronyms and abbreviations throughout the text to improve readability. Specifically, we have now spelled out nucleic acid (NA), intrinsically disordered regions (IDR), full-length (FL), AlphaFold (AF3), and variants of concern (VOC).

      Finally, we have improved the presentation of most figures, adding labels and new panels, and increased the label font sizes to facilitate more detailed inspections of the data.

      Reviewer #3 (Public Review):

      This manuscript investigates how mutations in the SARS-CoV-2 nucleocapsid protein (N) alter ribonucleoprotein (RNP) assembly, stability, and viral fitness. The authors focus on mutations such as P13L, G214C, and G215C, combining biophysical assays (SV-AUC, mass photometry, CD spectroscopy, EM), VLP formation, and reverse genetics. They propose that SARS-CoV-2 exploits "fuzzy complex" principles, where distributed weak interfaces in disordered regions allow both stability and plasticity, with measurable consequences for viral replication.

      Strengths:

      (1) The paper demonstrates a comprehensive integration of structural biophysics, peptide/protein assays, VLP systems, and reverse genetics.

      (2) Identification of both de novo (P13L) and stabilizing (G214C/G215C) interfaces provides a mechanistic insight into RNP formation.

      (3) Strong application of the "fuzzy complex" framework to viral assembly, showing how weak/disordered interactions support evolvability, is a significant conceptual advance in viral capsid assembly.

      (4) Overall, the study provides a mechanistic context for mutations that have arisen in major SARS-CoV-2 variants (Omicron, Delta, Lambda) and a mechanistic basis for how mutations influence phenotype via altered biomolecular interactions.

      We are grateful for these comments highlighting this work as a significant conceptual advance.

      Weaknesses:

      (1) The arrangement of N dimers around LRS helices is presented in Figure 1C, but the text concedes that "the arrangement sketched in Figure 1C is not unique" (lines 144-146) and that AF3 modeling attempts yielded "only inconsistent results" (line 149).

      The authors should therefore present the models more cautiously as hypotheses instead. Additional alternative arrangements should be included in the Supplementary Information, so the readers do not over-interpret a single schematic model.

      We agree that in the absence of high-resolution structures the RNP models are hypothetical, and have now emphasized this in the Results, following the Reviewer’s recommendation. To present alternative arrangements that satisfy the biophysical constraints upfront, we have promoted the previous Supplementary Figure 11 showing different models to the first Supplementary Figure, and expanded it with examples of different oligomers. In this way it is referenced early on in the Results and in the legend to Figure 1C. We agree this strengthens the manuscript, as one of the take-home messages is the inherent polydispersity of the RNPs.

      The fact that AF3 can only provide inconsistent results will not come as a surprise, given the substantial disordered regions of the complex, and is a drawback of AF3 rather than our structural model. We slightly emphasized this point so as to clarify that the presentation of the AF3-based RNP structure serves solely as supporting evidence that our hypothetical model is sterically reasonable.

      The new Results paragraph reads:

      “As suggested in the cartoon of Figure 1C, this supports the hypothesis of a three-dimensional arrangement with a central LRS oligomer with symmetry properties and dimensions similar to low resolution EM images of model RNPs (Carlson et al., 2022, 2020) and cryo-ET of RNPs in virions (Klein et al., 2020; Yao et al., 2020).  It should be noted, however, that the arrangement sketched in Figure 1C is not unique and other subunit orientations could be envisioned that satisfy all constraints from experimentally observed binding interfaces, including different oligomers and anti-parallel subunits as illustrated in Supplementary Figure S1. Extending previous ColabFold structural predictions that show multiple N-protein dimers self-assembled via the LRS coiled-coils (Zhao et al., 2023), we attempted the AlphaFold modeling of RNPs combining multiple N dimers with SL7 RNA ligands, mimicking our biophysical assembly model. Current AlphaFold restrictions limit the prediction to pentamers of N-protein dimers with 10 copies of SL7 RNA. While only inconsistent results were obtained – which is not surprising given the large intrinsically disordered regions exceed the predictive power of AlphaFold – some models did produce an overall RNP organization similar to Figure 1C, suggesting such an arrangement is at least sterically reasonable with regard to possible N-protein subunit orientations in an RNP (Supplementary Figure S2)”

      (2) Negative-stained EM fibrils (Figure 2A) and CD spectra (Figure 2B) are presented to argue that P13L promotes β-sheet self-association. However, the claim could benefit from more orthogonal validation of β-sheet self-association. Additional confirmation via FTIR spectra or ThT fluorescence could be used to further distinguish structured β-sheets from amorphous aggregation.

      We completely agree that the application of multiple orthogonal biophysical methods can strengthen the conclusions. In addition to EM fibrils and CD spectra (a classical gold standard technique for protein secondary structure in solution), we already have support from ColabFold modeling, as well as NMR results from the Zweckstetter lab showing the potential for for β-sheet-like conformations.

      Furthermore, we believe the evidence for the absence of ‘amorphous aggregates’ is very strong, as this would be inconsistent with the long-range order required to create the visibly fibrillar morphology in EM, and amorphous aggregates would be inconsistent with the increased solution viscosity. In this context, it is also highly relevant that the β-sheet-like secondary structure recorded by CD is concentration-dependent and reversible upon dilution. The long-range spatial order of fibrils is consistent with the formation of secondary structure in solution.

      In addition, it must be kept in mind that what we see is specific to N-arm peptides carrying the P13L mutation (in EM, CD, and structural prediction) and does not occur in the other two N-arm peptides (ancestral N-arm and N-arm with deletion of 31-33), linker peptides, or C-arm peptides.

      Most importantly, as elaborated in more detail below, we do not claim that fibril formation is physiologically relevant. At the heart of this – in the context of the evolution of fuzzy complexes – is that the P13L mutation creates additional weak protein-protein interactions. Indeed, the assembly of fibrils geometrically requires at least two interfaces for each subunit. These weak interactions are at play physiologically in the context of the disordered RNP particles, and in macromolecular condensates, but not in the formation of fibrils. Therefore, while we appreciate the suggestion for FTIR spectra ThT staining, we are afraid further emphasis on the fibril structure might confuse the reader, and therefore we would rather clarify upfront that these fibrillar assemblies are not thought to form in vivo from full-length protein, but merely demonstrate the presence of N-arm self-association interfaces in the model of truncated peptides.

      Accordingly, we have amended the Results paragraph reporting the fibrils:

      “Thus, the N-arm mutation P13L is responsible for the formation of fibrils in N-arm peptides after prolonged storage. Some of these N-arm fibrils exhibit a twisted morphology with width of »5 nm (Figure 2A), in some instances exhibiting patterns of strand breaks. Such fibrils are frequently encountered in proteins that can stack β-sheets, such as in amyloids (Paravastu et al., 2008). While we have not observed fibril formation in the context of full-length N, and have no evidence such fibrils are physiologically relevant, their occurrence in solutions of truncated N-arm peptide nonetheless demonstrates the introduction of ordered N-arm self-association interfaces in conformations of P13L mutants.”

      And more completely summarized experimental evidence prior to describing the ColabFold prediction results (which previously did not include mention of the NMR):

      “Finally, confirming the interpretation of the EM images and the CD data, as well as the b-structure propensity reported from NMR data (Zachrdla et al., 2022), the structural prediction of N[10-20]:P13L in ColabFold displayed oligomers with stacking b-sheets …”

      (3) In the main text, the authors alternate between emphasizing non-covalent effects ("a major effect of the cysteines already arises in reduced conditions without any covalent bonds," line 576) and highlighting "oxidized tetrameric N-proteins of N:G214C and N:G215C can be incorporated into RNPs". Therefore, the biological relevance of disulfide redox chemistry in viral assembly in vivo remains unclear. Discussing cellular redox plausibility and whether the authors' oxidizing conditions are meant as a mechanistic stress test rather than physiological mimicry could improve the interpretation of these results.

      The paper could benefit if the authors provide a summary figure or table contrasting reduced vs. oxidized conditions for G214C/G215C mutants (self-association, oligomerization state, RNP stability). Explicitly discuss whether disulfides are likely to form in infected cells.

      We thank the Reviewer for raising this most interesting point.  The reason why the biological relevance of N dilsulfides remains unclear is simply that this is still unknown, unfortunately. Recently, Kubinski et al. have strongly argued for the formation of disulfides in infected cells, but in our view the evidence remains weak since the majority of disulfide bonds in that work presented as post-lysis artifacts, and it appears the non-covalent effects alone could explain the physiological observations. We aimed for a balanced presentation and wrote in the relevant Results section:

      “Covalent disulfide bonds in the LRS in non-reducing conditions were found to further promote LRS oligomerization. However, there is no conclusive data yet whether covalent bonds in the LRS occur in vivo, or any G215C effect is entirely non-covalent due to the significant strengthening of LRS helix oligomerization (see Discussion).”

      Despite the uncertainty regarding physiological disulfide bond formation, we believe it is useful to ask whether covalently crosslinked N dimers would aid or constrain RNP assembly in our biophysical model. We have now better explained this motivation in the Results section describing the RNP experiments:

      “Even though it is still unclear whether disulfide bonds of N cysteine mutants form in vivo, we were curious about the impact of disulfide-linked oligomers of the cysteine mutants on their RNP structure and stability in our biophysical assembly model.”

      The referenced paragraph from the Discussion reads:

      “Regarding the cysteine mutations that have been repeatedly introduced in the LRS prior to the rise of the Omicron VOCs, it is an open question whether they lead to covalent bonds in vivo or in the VLP assay. While examples of disulfide-linked viral nucleocapsid proteins have been reported (Kubinski et al., 2024; Prokudina et al., 2004; Wootton and Yoo, 2003), a methodological difficulty in their detection is artifactual disulfide bond formation post-lysis of infected cells (Kubinski et al., 2024; Wootton and Yoo, 2003).  However, our results clearly show that a major effect of the cysteines already arises in reduced conditions without any covalent bonds, through extension of the LRS helices, and concomitant redirection of the disordered N-terminal sequence. While oxidized tetrameric N-proteins of N:G214C and N:G215C can be incorporated into RNPs, the covalent bonds provided only marginally improved RNP stability.  Interestingly, the introduction of cysteines imposes preferences of RNP oligomeric states dependent on oxidation state, consistent with our MD simulations highlighting the impact of cysteine orientation of 214C versus 215C relative to the hydrophobic surface of the LRS helices. Overall, considering potentially detrimental structural constraints from covalent bonds on LRS clusters seeding RNPs, energetic penalties on RNP disassembly, as well as the required monomeric state of the LRS helix for interaction with the NSP3 Ubl domain (Bessa et al., 2022), at present it is unclear to what extent the formation of disulfide linkages between LRS helices would be beneficial or detrimental in the viral life cycle.”

      We feel that this text addresses the Reviewer’s comment, and that expanding the existing discussion further would conflict with other recommendations to shorten and focus the text.

      Finally, we have addressed the valuable suggestion of a new table summarizing the oligomeric state and self-association of the different cysteine mutants by inserting a new column in the existing Table 1 reporting all species’ oligomeric state at low micromolar concentrations. In this way they can be compared at a glance with the other mutants as well. A more detailed comparison of the concentration-dependent size-distribution is provided in Figure 4.

      (4) VLP assays (Figure 7) show little enhancement for P13L or G215C alone, whereas Figure 8 shows that P13L provides clear fitness advantages. This discrepancy is acknowledged but not reconciled with any mechanistic or systematic rationale. The authors should consider emphasizing the limitations of VLP assays and the sources of the discrepancy with respect to Figure 8.

      We thank the Reviewer for this comment, which highlights a very important point. 

      For clarification and to improve the cohesion of the manuscript we have inserted a reference to the Discussion after the presentation of the VLP results, which provides a natural transition to the following description of the reverse genetics experiments:

      “As expanded on in the Discussion, the failure to observe enhancement by P13L alone may be related to limitations of the VLP assay in sensitivity, including the restriction to a single round of infection, and protein expression levels.”

      This references a paragraph in the Discussion about the limitations of the VLP assay in general and the reasons we believe the enhancement by P13L alone was not picked up:

      “…While this assay has been widely used for rapid assessment of spike protein and N variants (Syed et al., 2021), it has limitations due to the addition of non-genomic RNA and the lack of double membrane vesicles from which gRNA emerges through the NSP3/NSP4 pore complex potentially poised for packaging (Bessa et al., 2022; Ke et al., 2024; Ni et al., 2023). It should also be recognized that the results do not directly reflect the relative efficiency of RNP assembly only, since protein expression levels, their localization, and their posttranslational modifications are not controlled for. Susceptibility for such factors might be exacerbated with mutations that modulate weak protein interactions. For example, as shown previously (Syed et al., 2024; Zhao et al., 2024), a GSK3 inhibitor inhibiting N-protein phosphorylation significantly enhances VLP formation and eliminates the advantage provided for by the N:G215C mutation relative to the ancestral N – presumably due to an increase in assembly-competent, non-phosphorylated N-protein erasing an affinity advantage. A similar process may be underlying the absent or marginal improvement in VLP readout from the cysteine LRS mutants and P13L at the achieved transfection level in the present work, and the enhanced signal from R203K/G204R and R203M (the latter being consistent with previous reports (Li et al., 2025; Syed et al., 2021)) modulating protein phosphorylation. Nonetheless, mirroring the results of the biophysical in vitro experiments, the addition of RNP-stabilizing P13L and G214C mutations on top of R203K/G204R led to a significantly larger VLP signal.

      The VLP assay may be limited in sensitivity to mutation effects due to its restriction to a single round of infection. To avoid this and other potential limitations of the VLP assay for the study of viral packaging, for the key mutation N:P13L we carried out reverse genetics experiments. These showed the sole N:P13L mutation significantly increases viral fitness (Figure 8).”

      (5) Figures 5 and 6 are dense, and the several overlays make it hard to read. The authors should consider picking the most extreme results to make a point in the main Figure 5 and move the other overlays to the Supplementary. Additionally, annotating MP peaks directly with "2×, 4×, 6× subunits" can help non-experts.

      We completely agree with the Reviewer – these figures were very dense.  To mitigate this problem without having the reader to switch back-and-forth to the supplement, we subdivided the panels of Figure 5 and showed only a subset of curves in each.  In this way the data are easier to read while still readily compared. It is a large figure, but it contains the key data for the present work and is therefore worthwhile to have in one place. For the MP histogram data we also have inserted the suggested peak labels. Similarly, we have split Figure 6A into two panels for clarity.

      (6) The paper has several names and shorthand notations for the mutants, making it hard to keep up. The authors could include a table that contains mutation keys, with each shorthand (Ancestral, Nο/No, Nλ, etc.) mapped onto exact N mutations (P13L, Δ31-33, R203K/G204R, G214C/G215C, etc.). They could then use the same glyphs (Latin vs Greek) consistently in text and figure labels.

      Yes, we agree this is a problem and we apologize for the confusion. However, it is not possible to refer exclusively to either Latin or Greek terminology, which we feel would be even more detrimental to readability (the former being exhaustively lengthy and the latter being imprecise). But we have used a rational system: If the complete set of mutations of a variant are present, then its Greek letter will be used as an abbreviation, and otherwise we use Latin amino acid/position indicators for individual mutations or combinations thereof. Unfortunately, previously we inadvertently failed to explicitly mention this, and we are most grateful for the Reviewer to point this out.

      We have now rectified this by including upfront the sentence:

      “We will adopt a nomenclature where the complete set of defining mutations of a variant will be referred to by its Greek letter, i.e., N:P13L/R203K/G204R/G214C is N<sub>­­λ</sub>, and analogously the set of Omicron mutations N:P13L/Δ31-33/R203K/G204R are referred to as N<sub>ο</sub>; see Table 1”

      This will define the two shorthands N<sub>λ</sub> and N<sub>ο</sub> used. Furthermore, as suggested and pointed to in the text, Table 1 does provide the keys to mutation and variants, including the information in which variant any of the other mutations studied here occur.

      (7) The EM fibrils (Figure 2A) and CD spectra (Figure 2B) were collected at mM peptide concentrations. These are far above physiological levels and may encourage non-specific aggregation. Similarly, the authors mention" ultra-weak binding energies that require mM concentrations to significantly populate oligomers". On the other hand, the experiments with full-length protein were performed at concentrations closer to biologically relevant concentrations in the micromolar range. While I appreciate the need to work at high concentrations to detect weak interactions, this raises questions about physiological relevance.

      This is indeed an important point to clarify. We agree that much lower nucleocapsid protein concentrations are present in the cytosol on average, and these were used in our RNP assembly experiments. However, there are at least two important physiologically relevant cases where high local N concentrations do occur:

      (1) Once assembled in RNPs, the disordered N-terminal extensions are locally at a very high concentration within the volume they can explore while tethered to the NTD. A back-of-the-envelope calculation assuming 12 N-protein subunits confining 12 N-terminal extensions to the volume of a single RNP (≈14x14x14 nm<sup>3</sup> by cryoEM; Klein et al 2020) leads to an effective concentration of 7.4 mM. Obviously the N-arm peptides are not completely free and there will be constraints that would hinder or promote encounter complex probability, but interfaces with mM Kd are clearly strong enough to populate Narm-Narm contacts extending from N-protein in the RNP.

      Additionally, any interaction where N-proteins are brought in close proximity could allow weak N-arm interactions to provide additional stability. Besides the RNP, we demonstrate this in our Results for nucleic-acid liganded N tetramers (Figure 4B), but this might similarly occur in complexes with NSP3 or host proteins. Generally, it is quite common that small additional binding energies play important roles in the modulation of multivalent protein complexes.

      (2) Within the macromolecular condensate the local concentration will be substantially higher than on average within the infected cell.  While we do not know its precise concentration, it is well-established that the sum of many ultra-weak interactions is driving the formation of this dense liquid phase. In our previous eLife paper (Nguyen et al., 2024) we have shown LLPS is suppressed with the R203K/G204R mutation, but it is ‘rescued’ with the additional P13L/del31-33 mutation of the Omicron variant showing strong LLPS. Similarly, LLPS is suppressed by the LRS mutant L222P, but rescued in conjunction with P13L. This is another biologically relevant scenario where weak interactions are critical.

      We have emphasized these points in the revised manuscript as described below.

      Specifically:

      (a) Could some of the fibril/β-sheet features attributed to P13L (Figure 2A-C) reflect non-specific aggregation at high concentrations rather than bona fide self-association motifs that could play out in biologically relevant scenarios?

      We understand this concern from the experience with proteins that often have limited solubility and tendencies to aggregate, sometimes accompanied by unfolding and driven by hydrophobic interactions, or clustering on the path to LLPS. However, we are struggling to reconcile the picture of non-specific aggregation with the context of our P13L N-arm peptides. The term ‘non-specific aggregation’ implies the idea of amorphous aggregates, which we would contend is inconsistent with the observed geometry of fibrils, which exhibit long-range order. In addition, non-specific aggregation does not lead to increased solution viscosity, which we describe, but fibril formation does. Another connotation of ‘aggregates’ is irreversibility.  However, we find the beta-sheet-like conformation seen at 1 mM becomes significantly more disordered when the same sample is diluted to 0.4 mM peptide. This is consistent with a reversible self-association driven by a conformational change toward ordered secondary structure.

      To highlight the reversibility, we have clarified the description: “Interestingly, diluting the 1 mM sample (solid) to a concentration of 0.4 mM (dashed) reveals a large shift in the far-UV spectra … both indicative of a significant increase of disorder upon dilution. This is consistent with the stabilization of b-sheets in a reversible, strongly cooperative self-association process with an effective K<sub>D</sub> in the high mM to low mM range.”

      We have also inserted a concentration conversion to mg/ml units, which shows even 1 mM of peptides is only ~5 mg/ml, i.e. not excessively high. “While the ancestral N-arm at »1 mM (» 4.6 mg/ml) concentrations exhibits CD spectra with a minimum at »200 nm typical of disordered conformations (black)”

      With regard to the question of specificity, we have studied similar N-arm peptides without P13L mutations and with the 31-33 deletion under equivalent conditions. But we observe the reversible self-association, conformational change, and fibril formation only for those containing the P13L mutation, consistent with ColabFold predictions. Neither did we observe fibrils with disordered C-arm peptides.

      How these weak self-association motifs in the N-arm can be physiologically relevant in the context of full-length protein modulating the stability of multi-molecular complexes and enhancing LLPS was outlined above, and further clarified in the manuscript as detailed below.

      (b) How do the authors justify extrapolating from the mM-range peptide behaviors to the crowded but far lower effective concentrations in cells?

      As pointed out above, the key to this question is the local preconcentration as the N-arm peptides are tethered to the rest of protein in the context of flexible multi-molecular assemblies. Another mechanism to consider is the formation of condensates. The response to the next comment will expand on this.

      The authors should consider adding a dedicated section (either in Methods or Discussion) justifying the use of high concentrations, with estimation of local concentrations in RNPs and how they compare to the in vitro ranges used here. For concentration-dependent phenomena discussed here, it is vital to ensure that the findings are not artefacts of non-physiological peptide aggregation..

      The use of high concentration in biophysical experiments is quite common, for example, in NMR or crystallography, insofar as they elucidate molecular properties. We believe this is obvious; the Reviewer will certainly agree with us, and this does not require further elaboration. The property observed in this case is the existence of specific, weak protein self-association interfaces in the N-arm.

      Our response to the Reviewer’s point 7(a) addresses the distinction between artefactual aggregation and self-association of N-arm peptides. The relevance of these weak protein self-association interfaces in the context of the full-length protein is the second underlying question.

      As we have previously stated in a dedicated Results paragraph:

      “In contrast to the modulation of the coiled-coil LRS interfaces, the de novo creation of the N-arm self-association interface through beta-sheet interactions enabled by P13L cannot be readily observed in full-length N-protein at low M concentrations. Similar to the ancestral LRS interface, it provides only ultra-weak binding energies that require mM concentrations to significantly populate oligomers. This is fully consistent with the previous observation by SV-AUC that neither N:P13L,31-33 nor N<sub>o</sub> with the full set of Omicron mutations show any significant higher-order self-association at low M concentrations, whereas at high local concentrations – as observed in phase-separated droplets – they can modulate and cooperatively enhance self-association processes (Nguyen et al., 2024). (If fact, P13L can substitute for the LRS promoting LLPS, as observed in the rescue of LLPS by N:P13L,31-33/L222P mutants whereas N:L222P LRS-abrogating mutants are deficient in LLPS.) Another process that increases the local concentration of N-arm chains is the tetramerization of full-length N-protein. As described earlier, occupancy of the NA-binding site in the NTD allosterically promotes self-assembly of the LRS into higher oligomers (Zhao et al., 2021). We hypothesized that these oligomers may be cooperatively stabilized by additional N-arm interactions in P13L mutants.”

      To state completely unambiguously why weak interfaces are important, we have followed the Reviewer’s suggestion and added an additional clarification already earlier, at the end of the P13L Results section:

      “While this self-association interface in the P13L N-arm is weak and its direct observation in biophysical experiments requires mM concentrations, which far exceed average intracellular concentration of N, such  weak interactions can become highly relevant physiologically when high local concentrations are prevailing, for example, when the disordered extension is preconcentrated while tethered within macromolecular assemblies as in the RNP, or in macromolecular condensates.”

      Furthermore, we have added early in the Discussion:

      “Even though the solution affinity of the N-arm P13L interface is ultra-weak, the average local concentration of N-arm chains across the RNP volume (in a back-of-the-envelope calculation assuming a ≈14 nm cube (Klein et al., 2020) with a dodecameric N cluster) is ≈7.4 mM, such that disordered N-arm peptides could well create populations of N-arm clusters stabilizing RNPs through this interface.  However, besides the RNP-stabilizing mutants we have also observed unexpected RNP destabilization by the ubiquitous R203K/G204R double mutation, which may be caused by the introduction of additional charges close to the self-association interface in the LRS. In our experiments, this destabilization is more than compensated for by the P13L mutation. (Another scenario where ultra-weak interactions can have a critical impact is in molecular condensates. We previously reported the suppression of LLPS by the R203K/G204R mutation, which is rescued by the additional P13L/Δ31-33 mutation (Nguyen et al., 2024). This is consistent with compensatory weak stabilizing and destabilizing impacts of weak interactions on the RNP observed here.)”

      Reviewer #1 (Recommendations for the Authors):

      In Figure 1B, it is unclear what the orange lines connecting polypeptides represent, as well as the zig-zag orange lines in the N-arm.

      We thank the Reviewer for this comment. We intended this to represent regions of self-association but recognize the patterned background is confusing. We have changed this now to solid-colored backgrounds, and indicated this in the figure legend:

      “Regions of self-association are indicated by shaded backgrounds.”

      Regarding presentation, in Figure 5 (MP), the relationship between mass and oligomer size should be shown more clearly.

      We agree. To this end we have labeled the peaks in the MP histograms in Figure 5 with the oligomeric state of the 2N/2SL7 subunits.

      Reviewer #2 (Recommendations for the Authors):

      I find the science of the paper to be convincing and compellingly supported.

      Thank you for this positive statement.

      My primary complaints are with presentation or minor technical questions that, honestly, primarily arise due to my own ignorance and unfamiliarity with some of the techniques employed.

      My primary issue is with the figures. I find, generally, the text in axes labels, ticks, and legends to be too small to comfortably read. This is particularly true in the CD spectra and

      other data presented in Figures 1D, 2B, 4, 5, 6, and 8.

      We agree and have increased the font size of all text and labels of the plots in Figure 1, 2, 4, 5, 6, and 8.

      I also found the use of initialisms to be a bit overbearing and inconsistent. For example, the authors repeatedly switch between spelling out "nucleic acid" and the initialism "NA" (which is also never explicitly spelled out in the text). With the already substantial length of the text, my own personal opinion would be to suggest spelling out all initialisms in the interest of making the reading easier.

      This is a valid criticism. To improve the readability, we have followed this advice and systematically spelled out “nucleic acid” instead of using “NA”.  Similarly, we have now written out full-length instead of the abbreviation FL, and omitted the abbreviation IDR for intrinsically disordered regions, as well as VOC for variant of concern, and AF3 for AlphaFold.

      Regarding the reference to mutants, we have now explained upfront the system of Latin and Greek nomenclature we consistently applied.

      “We will adopt a nomenclature where the complete set of defining mutations of a variant will be referred to by its Greek letter, i.e., N:P13L/R203K/G204R/G214C is N­­<sub>l</sub>, and analogously the set of Omicron mutations N:P13L/Δ31-33/R203K/G204R are referred to as N<sub>ο</sub>; see Table 1”

      I found the text to be verbose, bordering on overly so; the Introduction is more than two pages long. The section "Enhanced oligomerization of the leucine-rich sequence through cysteine mutations" has two long paragraphs of introduction before the present results are discussed, et cetera. An (admittedly, very rough) estimation of the length of the paper places it at ~9,000 -10,000 words long, and I think that the presentation might benefit from significant editing and

      shortening.

      We agree the manuscript is longer than would be desirable, and we generally prefer not to insert mini-introductions into Results sections. On the other hand, in order to make a solid contribution to understanding the big picture of fuzzy complexes in molecular evolution of RNA virus proteins it is indispensable to go into the details of RNP assembly and several of the interfaces. Therefore, we feel the length is in the range that it needs to be without losing clarity. In addition, other Reviewer suggestions to extend the discussion, for example, of limitations of VLP assays and the in vivo state of cysteines, conflict with significant shortening.

      In the particular case of the cysteine mutations, cited by the Reviewer, we believe it is important to add detailed background on G215C, because the Results proceed in a comparison of the self-association mode between G215C and G214C. This is of significant interest in the present context not only for the independent introduction of interface-enhancing mutations highlighting the evolution of fuzzy complexes, but also because it illustrates the pleomorphic ability of RNPs.

      Nonetheless, we have slightly shortened this text and merged the background into a single paragraph. More generally, we have critically reread the text to remove tangential sentences where possible and to make it more concise.

      I have a few more specific comments.

      In Figure 1A, I suggest explicitly labeling the location of the LRS, as it comes up repeatedly.

      Yes, we thank the Reviewer for this suggestion and have introduced this label in Figure 1A.

      In Figure 1B, the legend indicates that the red lines indicate "new inter-dimer interactions." However, these red lines are overlayed on a vertical stripe of red squiggles; it is unclear to me and not explicitly described in the legend what these squiggles are meant to illustrate.

      We agree this background was confusing. As mentioned in our Response to Reviewer #1 we have replaced the structured background with a solid background and explained in the figure legend that these areas depict regions of self-association.

      On lines 44-45, the authors state, "The IDRs amount to 45%, ..." 45% of what?

      Thank you, this was unclear.  We have now clarified “The IDRs amount to ≈45% of total residues”

      In lines 244 - 246, the authors compare the sizes of complexes in reducing versus non- reducing conditions as measured by dynamic light scattering, stating, "However, dynamic light scattering (DLS) revealed the presence of N210-246:G214C complexes with hydrodynamic radii 244 ranging from 6 to 40 nm (in comparison to 1-2 nm for N210- 246:G215C(Zhao et al., 2022)) in reducing conditions, and slightly larger in non-reducing conditions (Supplementary Figure S4)." Using this single statistic seems to me to be a less-than-ideal way of characterizing what seems to me to be happening here. In Supplementary Figure 4, it appears to me that what is happening is that in non-reduced conditions, the sample is monodisperse, whereas in reducing conditions, the distribution becomes polydisperse/bimodal, with two clearly separate populations. I feel that this could use a more

      thorough description rather than just stating the overall range of particle sizes.

      Yes, the Reviewer is correct – it is indeed a good idea to be more precise here. To this end we have carried out cumulant analyses on the autocorrelation functions, as a time-honored method to quantify the polydispersity.  Both samples are polydisperse, but more so in reducing conditions. We have now added “For N210-246:G214C a cumulant analysis results in radii of 8.8 nm and 10.6 nm and polydispersity indices of 0.40 and 0.35 for reducing and non-reducing conditions, respectively”

      Finally, I have one remaining comment that is a result of my own inexperience with circular dichroism and interpreting the spectra. For me personally, I would appreciate a more thoroughdescription/illustration of the statistics involved in the CD spectra, but perhaps this is not necessary for people who are more familiar with interpreting these kinds of data. For example, in Figure 1D, it is not clear to me what the error bars/confidence intervals for the CD data look like. I see many squiggles, some of which the authors claim are significant (e.g., the differences between ~215 - 230 nm), and others are not worthy of comment. Let's say, for example, that I fit a smoothed spline through these data and then measure the magnitude of the fluctuations from that spline to define/quantify confidence intervals. What does that distribution look like? Or maybe the confidence intervals are so small that all squiggles are significant?

      Thank you, this is a good question. As mentioned in the methods section, the CD spectra shown are averages of triplicate scans. Therefore, it is straightforward to extract the standard deviation at each wavelength from the three measurements (although a spline would probably work just as well). The values are what one would expect for the squiggles to be random noise. In the region 215 – 220 nm characteristic for helical secondary structure the standard deviations are small relative to the separation between curves, which indicates that the differences are highly significant. Naturally, the curves do overlap in other spectral regions, which would make a plot including the wavelength-dependent error bars or confidence bands too crowded. Therefore, we have kept the plot of the averaged triplicate scans, but have now provided the average standard deviations for all species in the figure legend and mentioned their significant separation:

      “Triplicate scans yield average standard deviations of 0.13 (N), 0.17 (N+SL7), 0.16 (N<sub>l</sub>), and 0.21 (N<sub>l</sub> +SL7) 10<sup>3</sup> deg cm<sup>2</sup>/dmol, respectively, with non-overlapping confidence bands for the different species, for example, between 215-220 nm.”

      Reviewer #3 (Recommendations for the Authors):

      (1) The Discussion reiterates much of the background (mutational tolerance, fuzziness, SLiMs) already covered in the Introduction, diluting focus on the key new findings. The authors should consider shortening and refocusing the discussion on the main contributions in light of existing knowledge of viral assembly.

      In the Introduction we have provided background on intrinsically disordered proteins in general and their mutational tolerance, as well as the concept of fuzzy complexes. The first several paragraphs of the Discussion have a different focus, which is protein binding interfaces between viral proteins (obviously key in fuzzy complexes), specifically their modulation and the remarkable de novo introduction of binding interfaces. We believe this deserves emphasis, since this highlights a novel aspect of fuzziness, for the mutant spectrum of RNA viruses to encode a range and of assembly stabilities and architectures. 

      To reduce redundancy between the end of the Introduction and the beginning of the Discussion, we have shortened the last paragraph of the Introduction and removed its preview of the conclusions, as described in the response to the next comment of the Reviewer (see below).

      Unfortunately, the length of the Discussion is dictated in part also by the need to discuss methodological aspects, among them the limitations of VLP assays, and the redox state of the cysteine in the LRS mutants, which were important points recommended by other suggestions of the Reviewers. Similarly, we believe the discussion of other potential functions of Omicron N-arm mutations is warranted, as well as the background of the R203K/G204R double mutation that has attracted significant attention in the field due to its effects on phosphorylation and expression of truncated N species that also form RNPs. Our goal was to integrate the results by us and other laboratories regarding specific mutation effects into a comprehensive picture of molecular evolution of N, which we believe the framework of fuzzy complexes can provide.

      (2) The Abstract and early Introduction set a broad stage (IDPs, fuzziness), but don't explicitly state the concrete hypotheses that the experiments test. Please add 2-3 sentences in the Introduction that enumerate testable hypotheses, e.g.:

      (a) P13L creates a new N-arm interface that increases RNP stability.

      (b) G214C/G215C strengthens LRS oligomerization to stabilize higher-order N assemblies.

      We agree the introduction can be improved.  However, it seems to us that it cannot be neatly framed in the hypothesis – answer dichotomy, without losing a lot of nuances and without requiring an even longer and more detailed introduction.

      One of the main questions is to test whether the framework of fuzzy complexes can be applied to understand molecular evolution of N, and we feel the introduction is already flowing well towards this:

      “ … In fuzzy complexes the total binding energy is distributed into multiple distinct ultra-weak interaction sites (Olsen et al., 2017). Similar to individual RNA virus proteins with loose or absent structure, maintaining disorder and a spatial distribution of low-energy interactions in the protein complexes may increase the tolerance for mutations and improve evolvability of protein complexes.\

      The unprecedented worldwide sequencing effort of SARS-CoV-2 genomes during its rapid evolution in humans provides a unique opportunity to examine these concepts. ...”

      To bring this to a more concrete set of questions in the end, we have shortened and rewritten the last paragraph in the Introduction:

      “To examine how architecture and energetics of RNP assemblies can be impacted by N-protein mutations we study a panel of N-proteins derived from ancestral Wuhan-Hu-1 and different VOCs, including Alpha, Delta, Lambda, and Omicron (see Table 1), in biophysical experiments, VLP assays, and mutant virus. Specifically, we ask how the RNP size distribution and life-time is modulated by: (1) the novel binding interface created by the P13L mutation of Omicron; (2) enhancements of other weak self-association interfaces through G215C of Delta and G214C of Lambda; (3) the ubiquitous R203K/G204R double mutation of Alpha, Lambda, and Omicron.  We also test whether the P13L mutation improves viral fitness, similar to G215C and R203K/G204R. The results are discussed in the framework of fuzzy complexes and molecular evolution of N in the course of viral adaptation to the human host. Understanding the salient features of the binding interfaces in viral assembly and their evolution expands our foundation for the design of therapeutics such as assembly inhibitors.”

    1. Note: This response was posted by the corresponding author to Review Commons. The content has not been altered except for formatting.

      Learn more at Review Commons


      Reply to the reviewers

      We are grateful to the reviewers for their thoughtful and constructive evaluations of our manuscript. Their comments helped us clarify key aspects of the study and strengthen both the presentation and interpretation of our findings. The central goal of this work is to dissect how the opposing activities of GATA4 and CTCF coordinate chromatin topology and transcriptional timing during human cardiomyogenesis. The reviewers’ feedback has allowed us to refine this message and better contextualize our results within the broader framework of chromatin regulation and cardiac development.

      In response to the reviews, in our preliminary revision we have already implemented substantial improvements to the manuscript, including additional analyses, clearer data visualization, and revisions to the text to avoid overinterpretation. These refinements enhance the robustness of our conclusions without altering the overall scope of the study. A small number of additional analyses and experiments are ongoing and will be added to the full revision, as detailed below.

      We believe that the revised manuscript, together with the planned updates, fully addresses the reviewers’ concerns and substantially strengthens the contribution of this work to the field.

      Reviewer 1 – Point 1:

      In the datasets you are examining, what are the relative percentages in each of the four groups relating compartmentalization change to expression change (A→B, expression up; A→B, down; B→A, up; B→A, down)?

      We quantified compartment–expression relationships using Hi-C and bulk RNA-seq from H9 ESCs and CMs. The percentages for each category are shown below and incorporated into updated Figure S2H.

      Group

      Downregulated in CM

      Upregulated in CM

      A-to-A

      11.92%

      8.44%

      A-to-B

      18.20%

      2.79%

      B-to-A

      7.96%

      18.07%

      B-to-B

      14.36%

      6.44%

      A chi-squared test comparing observed vs. expected distributions (based on gene density across bins) confirmed a strong association between compartment dynamics and transcriptional behavior. B-to-A genes are significantly enriched among genes upregulated in CMs, while A-to-B genes are enriched among those downregulated (updated Figure S2H).

      We next assessed with GSEA how these gene classes respond to GATA4 and CTCF knockdown. In 2D CMs, GATA4 knockdown reduces expression of CM-upregulated B-to-A genes and increases expression of CM-downregulated A-to-B genes, whereas CTCF knockdown produces the opposite pattern (updated Figure 2F).

      Applying the same analysis to cardioid bulk RNA-seq (updated Figure 4E) revealed the strongest effects in SHF-RV organoids, consistent with monolayer data. In SHF-A organoids, only GATA4 knockdown had a measurable impact on CM-upregulated B-to-A and CM-downregulated A-to-B genes. Because the subsets of CM-downregulated B-to-A and CM-upregulated A-to-B genes were very small and showed no consistent trends, Figure 4 focuses on the two informative categories only. The full classification is provided in Reviewer Figure 1 below.

      (The figure cannot be rendered in this text-only format)

      Reviewer Figure 1. GSEA for CM-upregulated B-to-A and CM-downregulated A-to-B genes. p-values by Adaptive Monte-Carlo Permutation test.

      Reviewer 1 – Point 2

      This phrase in the abstract is imprecise: ‘whereas premature CTCF depletion accelerates yet confounds cardiomyocyte maturation.’


      The abstract has been revised to: “whereas premature CTCF depletion accelerates yet alters cardiomyocyte maturation.” (lines 29-30).

      Reviewer 1 – Point 3

      Regarding this statement: "Disruption of [3D chromatin architecture] has been linked to genetic dilated cardiomyopathy (DCM) caused by lamin A/C mutations8,9, and mutations in chromatin regulators are strongly enriched in de novo congenital heart defects (CHD)10, underscoring their pathogenic relevance11." The first studies to implicate chromatin structural changes in heart disease, including the role of CTCF in that process, were PMID: 28802249, a model of acquired, rather than genetic, disease.

      We added the following sentence to the paragraph introducing CTCF: “Moreover, depletion of CTCF in the adult cardiomyocytes leads to heart failure28,29.” (line 72)

      Reviewer 1 – Point 4

      Can you quantify this statement: ‘the compartment switch coincided with progressive reduction of promoter–gene body interactions’?

      We quantified promoter–gene body contacts by calculating the area under the curve (AUC) of the virtual 4C signal derived from H9 Hi-C data across differentiation. As a result of this analysis we added the following sentence: “Quantitatively, interactions between the TTN promoter and its gene body decreased by ~55% from the pluripotent stage to day 80 cardiomyocytes.” (lines 89-91).


      Reviewer 1 – Point 5

      Regarding this statement: "six regions became less accessible in CMs, correlating with ChIP-seq signal for the ubiquitous architectural protein CTCF." I don't see 6 ATAC peaks in either TTN trace in Figure 1A.

      We corrected the text as it follows: “TTN experienced clear changes in chromatin accessibility during CM differentiation: ATAC-seq identified two CM-specific peaks that correlated with ChIP-seq signal for the cardiac pioneer TF GATA4 at the two promoters, one driving full length titin and the other the shorter cronos isoform. In contrast, two regions became less accessible in CMs, correlating with two of the six ChIP-seq peaks for the ubiquitous architectural protein CTCF” (lines 93-97). We attribute the differences between ChIP-seq and ATAC-seq profiles to methodological sensitivity and/or biological variability between datasets generated in different laboratories and cell batches.

      Reviewer 1 – Point 6

      Western blots need molecular weight markers.

      We edited the relevant panels accordingly (updated Figures 1E and 2B).

      Reviewer 1 – Point 7

      Regarding this statement: "The decrease in CTCF protein levels may explain its selective detachment from TTN during cardiomyogenesis." At face value, these findings suggest the opposite: i.e. that a massive downregulation of CTCF at protein level should affect its binding across the genome, which is not tested and is hard to evaluate between ChIP-seq studies from different groups and from different developmental timeframes.

      We revised the text to avoid implying selective detachment and performed a genome-wide analysis of CTCF occupancy using ENCODE ChIP-seq datasets generated by the same laboratory with matched protocols in hESCs and hESC-derived CMs. This analysis shows that 43.2% of CTCF sites present in ESCs are lost in CMs, whereas only 5.7% are gained, confirming a broad reduction in CTCF binding during differentiation. These results are now included in__ updated Figure 1B__.

      Reviewer 1 – Point 8a

      A couple thoughts on the FISH experiments in Figure 2. A claim of 'impaired B-A transition' would be more convincing if you show, by FISH, that the relative distance of TTN from lamin B increases with differentiation.

      Although prior work from us and others has established that TTN transitions from the nuclear periphery in hESCs to a more internal position during cardiomyogenesis (Poleshko et al. 2017; Bertero et al. 2019a), we are reproducing this trajectory in WTC11 hiPSCs as part of the FISH experiments for the full revision.

      __Reviewer 1 – Point 8b __

      In the [FISH] images: are you showing a total projection of all z planes? One assumes the quantitation is relative to a 3D reconstruction in which the lamin B signal is restricted to the periphery. Have you shown this? __

      Quantification was performed on full 3D reconstructions from Z-stacks, as detailed in the Methods (lines 721-727). While the original submission displayed maximum-intensity projections, updated Figure 2D and Figure S2E now show representative single optical sections, which more clearly highlight the spatial relationship between the TTN locus and the nuclear lamina.

      Reviewer 1 – Point 8c

      Lastly, these data are very interesting and important, provoking reexamination of your interpretation of the results in Figure 1. Figure 1 was interpreted to show that less CTCF binding led to decreased lamina (and thus B compartment) association during development. Figure 2 shows that depleting CTCF does not change association of TTN with lamina.

      Our interpretation is that by day 25 of hiPSC-CM differentiation the TTN locus may have reached its maximal radial repositioning even in control cells, limiting the ability to detect earlier effects of CTCF depletion. To test whether CTCF knockdown accelerates lamina detachment at earlier stages, we are repeating the FISH analysis for the inducible CTCF knockdown line at multiple time points during differentiation.

      Reviewer 1 – Point 9

      A thought about this statement: "Altogether, these results suggest that GATA4 and CTCF function as positive and negative regulators of B-to-A compartment switching, likely acting through global and local chromatin remodeling, respectively." GATA4 induces TTN expression and its knockdown prevents TTN expression-the evidence that GATA4 affects compartmentalization is unclear. By activating the gene, GATA4 may shift TTN to B classification.

      Our current data do not allow us to disentangle whether GATA4-driven transcriptional activation precedes or follows the B-to-A compartment shift. We have therefore removed the mechanistic speculation from this sentence to avoid overinterpretation. Nevertheless, the analyses in updated Figure 2F, discussed in the response to Reviewer 1 - Point 1, show that GATA4 knockdown preferentially reduces expression of CM-upregulated B-to-A genes, while CTCF knockdown has the opposite effect, supporting the conclusion that both factors influence the transcriptional programs associated with B-to-A transitions.

      Reviewer 1 – Point 10

      __I'm not sure what I am looking at in Figure 3C. Are those traces integration of interactions over a defined window? "Each [mutant is] clearly different from WT" is not obvious from the presentation. The histograms are plotting AUC of what? Interactions of those peaks with the mutated region? I genuinely appreciate how laborious this experiment must have been and encourage you to explain better what you are showing. __

      We revised the main text to avoid overstating the differences (“clearly” “in a similar manner”, line 192) and expanded the l__egends of updated Figures 3C–D__ to clarify what is being shown: “(C) 4C-seq in hiPSCs using the promoter-proximal region of TTN as viewpoint. The top panel shows raw interaction profiles. The lower panels plot pairwise differences between conditions to reveal subtle changes. A schematic indicating the 4C viewpoint is included for clarity. Right inset: zoom of the CBS4–5 region. Mean of n = 3 cultures. (D) AUC of the differential 4C-seq signal for defined intervals (panel C). p-values by one-sample t-test against μ = 0.”. We also added a visual cue in updated Figure 3C indicating the 4C viewpoint to facilitate interpretation.

      Reviewer 1 – Point 11

      Again acknowledging how challenging these experiments are: when you mutant a locus, you change CTCF binding but you also change the DNA. Thus, attributing the changes in interactions to presence/absence of CTCF binding is difficult, because the DNA substrate itself has changed. Perhaps you are presenting all of this as a negative result, given the modest effect on transcription, which is as important as a positive result, given the assumptions usually made about such things. But the results are not clearly described and your interpretation seems to go between implying the structural change causative and being agnostic.

      We recognize that deleting a genomic region can affect both CTCF binding and the DNA substrate itself. For this reason, we implemented two parallel genome-editing strategies:

      (1) a straightforward Cas9-mediated deletion of ~100 bp centered on each CBS, and

      (2) a more precise HDR approach replacing only the 20 bp core CTCF motif.

      Because the HDR strategy succeeded, all downstream analyses were carried out on these minimal edits, which substantially limit disruption of other transcription factor motifs and reduce the likelihood of sequence-dependent polymer effects unrelated to CTCF.

      Nevertheless, to avoid implying unwarranted causality in the absence of more conclusive evidence, we added a paragraph to the Discussion outlining these limitations, including the sentence: “Our study also reflects general challenges in separating chromatin-architectural and transcriptional mechanisms. Although the CBS edits were restricted to the core CTCF motifs, additional sequence-dependent effects cannot be fully excluded, and we therefore interpret the resulting changes as consistent with—but not exclusively due to—loss of CTCF binding.” (lines 365-368)

      Reviewer 1 - Point 12.

      Figure 4C: since you have RNA-seq data, a much more objective way to present these data would be to show all data (again, A-B, up; A-B, down; B-A, up; B-A, down) and the effects of CTCF or GATA4. Regardless, you can still focus on the cardiac specific genes. But my guess is if you examine all genes, the pattern you show in panel C will not be present in the majority of cases. Furthermore, if this hypothesis is wrong, such an analysis will allow you to identify other genes affected by the mechanisms you describe and your analysis will test whether these mechanisms are in fact conserved at different loci.

      As outlined in our response to Point 1, we extended the analysis to all genes undergoing compartment changes and incorporated this into the cardioid RNA-seq dataset. This revealed a clear and consistent relationship between GATA4 or CTCF knockdown and the expression of B-to-A and A-to-B gene classes (updated Figure 4E).

      Reviewer 2 - Point 1.1

      1. CTCF regulation at TTN locus:

      (1) Figure 1A: The claim of the authors about convergent CTCF sites and transcriptional activation of TTN is quite simplistic. This claim is only valid when we know where cohesin is loaded. If cohesin is loaded at then intragenic GATA4 binding site, then the only important CTCF sites is at the promoter of TTN. I suggest that the authors read few more publications which may help the authors to better understand how cohesin and CTCF team up to regulate transcription, such as Hsieh et al., Nature Genetics, 2022; Liu et al., Nature Genetics, 2021; Rinzema et al., Nature Structural and Molecular Biology, 2022.

      __Suggestion: The authors should add cohesin (RAD21/SMC1A) and NIPBL ChIP-seq for better interpretation. __

      In line with the reviewer’s insightful suggestion, we integrated cohesin ChIP-seq data into updated Figure 1A. Specifically, we added a RAD21 ChIP-seq track from hESCs, which provides direct evidence of cohesin occupancy across the TTN locus. RAD21 binding closely parallels CTCF binding at five sites within the gene body, supporting a model in which promoter-proximal CTCF anchors cohesin to stabilize repressive loops at this locus. This analysis substantially strengthens the mechanistic framework and is consistent with the studies recommended by the reviewer, which we have now cited (lines 68 and 104).

      Reviewer 2 - Point 1.2. (2) Figure 3B: If delta2CBS only has heterozygenous deletion of CBS6, why we would expect the binding will be weaken to 50%. However, the CTCF binding is reduced to around 1/10 in the ChIP-qPCR. How do the authors explain this?

      Sequencing of the Δ2CBS line shows that one CBS6 allele carries the intended EcoRI replacement, while the second allele contains a 2-bp deletion within the core CTCF motif (Figure S3C). Remarkably, this small deletion is sufficient to abolish CTCF binding, resulting in complete loss of occupancy at CBS6 despite heterozygosity. We clarified this in the text as follows: “CTCF ChIP-qPCR in hiPSCs confirmed complete loss of CTCF binding at the targeted sites, including CBS6 in the Δ2CBS line, indicating that the 2-bp deletion sufficed to disrupt CTCF binding while occupancy at other CBSs remained unaffected.” (lines 187–189).

      Reviewer 2 - Point 1.3a (3) Figure 3C: There are two problems with the 4C experiments: (a) The changes are really mild. In fact, none of the p-values in Figure 3D are significant.

      The effect of deleting CBS1 is indeed modest, consistent with reports that individual CTCF binding sites often show functional redundancy (i.e., Rodríguez-Carballo et al. 2017; Barutcu et al. 2018; Kang et al. 2021). Nevertheless, our 4C-seq experiments have reproducibly shown the same directional trend across biological replicates. To increase statistical power and more rigorously assess the robustness of this effect, we are generating additional 4C replicates as part of the full revision.

      Reviewer 2 - Point 1.3b [In the 4C experiments] (b) The authors should also consider a model that CTCF directly serves as a repressor. In this way, 3D genome may not be involved. B-A switch is simply caused by the activation of the locus.

      We now explicitly acknowledge this possibility in the Discussion. The revised text states: “Moreover, our data cannot unambiguously separate CTCF’s architectural role from potential direct repressive activity. Both mechanisms could contribute to the observed effects, and our findings likely reflect the combined influence of CTCF on chromatin topology and gene regulation.” (lines 368–371).

      Reviewer 2 - Point 2.1a 2. __(CTCF) detachment: The authors mentioned few times "detachment". In the context of this manuscript, the authors indicate detachment from nuclear lamina. However, the authors haven't provide convincing evidence about this. __

      In the two instances where we used the term “detachment,” we intended it to refer exclusively to reduced CTCF binding to DNA, not to lamina repositioning. To avoid ambiguity, we have replaced “detachment” with “reduced binding” in both locations (lines 123 and 329). We do not use this term to describe TTN–lamina positioning.

      Reviewer 2 - Point 2.1b (1) Figure 1D: I doubt whether such changes of CTCF protein abundance will lead to LAD detachment. Suggest the authors read van Schaik et al., Genome Biology, 2022. With the full depletion of CTCF, the effects on LADs are still very restricted.

      We agree that the observed correlation between reduced CTCF levels and the relocation of TTN away from a LAD does not establish causality. As outlined in our response to Reviewer 1 – Point 8c, we are performing additional FISH experiments at earlier differentiation stages in the CTCF inducible knockdown line to directly assess whether partial CTCF depletion is sufficient to alter the timing of TTN–lamina separation.

      Reviewer 2 - Point 2.2 (2) Figure 2D: Lamin B1 should be mostly at nuclear periphery. I have few questions: (1) is the antibody specific? (2) do these cells carry mutation in LMNB1 gene? (3) is the staining actually LMNA?

      As also clarified in response to Reviewer 1 – Point 8b, the original images displayed maximum-intensity projections of Z-stacks, which obscured the peripheral distribution of LMNB1. We have updated Figure 2D and Figure S2E to show representative individual optical sections, which more clearly display the expected peripheral LMNB1 signal. We also confirm that the antibody used is specific for LMNB1 and previously validated (Bertero et al. 2019b), and that the WTC11-derived lines used in this study carry no mutation in LMNB1.

      Reviewer 2 - Point 3

      3. Opposite functions of GATA4 and CTCF: These data in Figure 5E-H argues the opposite role of GATA4 and CTCF in transcriptional regulation. Would it be that CTCF KD just affected cell proliferation, which is actually known for many cell types, rather than affect CM differentiation process? If this is the reason, inversed correlation between CTCF KD and GATA4 KD in Figure 4D could also be explained by opposite effects on cell cycle.

      We directly evaluated this possibility. In FHF–LV cardioids, cell cycle profiling in Figure 6C and Figure S6C (now S7C) showed that CTCF knockdown does not alter the distribution of CMs across G1/S/G2–M phases, in contrast to the marked increase in proliferation observed with GATA4 knockdown.

      Because this comment referred specifically to the SHF data, we also analyzed mitotic gene expression in the SHF–RV bulk RNA-seq dataset using GSEA. CTCF knockdown did not significantly enrich any cell cycle–related gene sets, whereas GATA4 knockdown produced a strong enrichment for mitotic cell cycle terms, in line with FHF-LV data (Reviewer Figure 2).

      These results are summarized in updated Figure S5C, reporting also the results of the broader GSEA analysis, and together indicate that the transcriptional divergence between CTCF and GATA4 knockdown is not simply explained by opposing effects on proliferation.

      (The figure cannot be rendered in this text-only format)

      Reviewer Figure 2. GSEA for mitotic cell cycle in SHF-RV after inducible knockdown of CTCF (left) or GATA4 (right). p-values by Adaptive Monte-Carlo Permutation test.

      Reviewer 2 - Point 4 4. In discussion, the authors suggested that CTCF is a local chromatin remodeller. In my view, association with local chromatin compaction doesn't qualify CTCF as a chromatin remodeler. To my knowledge, CTCF does not have an enzymatic domain, then how does it remodel chromatin?

      Our intended meaning was that CTCF shapes 3D chromatin architecture through its role in organizing intergenic looping, not that it remodels chromatin enzymatically. To avoid confusion, we have removed the original sentence from the Discussion.

      Reviewer 2 - Point 5. 5. Some conclusions are drawn based on insignificant p-values, e.g. Figure 2F, Figure 3D, etc. The authors should be careful about their conclusion, and tone down their statement for the observations have borderline significance.

      The conclusions based on bulk RNA-seq have been revised in response to Reviewer 1 – Point 1 (updated Figure 2F). By subsetting B-to-A and A-to-B genes according to their expression dynamics, this analysis now yields clearer and statistically significant differences between conditions.

      Regarding the 4C-seq data, as acknowledged in Reviewer 2 – Point 3a, the observed effects are modest. We are generating additional biological replicates to increase statistical power. In the meantime, we have adjusted the text to avoid overstating these findings. The revised manuscript now states: “While the difference did not reach significance, these trends suggest …” (lines 199–200).

      Reviewer 2 - Minor comment 1. Minor comments: 1. Figure 1A: (1) I suggest to label two promoters in the gene model. It's unclear in the figure in the current version; (2) I was a bit confused with the way how the authors labeled CTCF directionality. I thought there are a lot of promoters. Why didn't they use triangles?

      We updated Figure 1A to label both TTN promoters and indicate their orientation. For CTCF sites, we now clearly display the motif direction and core binding region as determined by FIMO analysis of the CTCF ChIP-seq peaks, improving consistency and interpretability.

      Reviewer 2 - Minor comment 2. 2. Figure 2C: I think the drastical reduction of titin-mEGFP levels is only due to the way how the authors analyze their FACS data. Can the author quantify on median fluorescence intensity?

      The gating strategy for titin-mEGFP⁺ cells was defined using a reporter-negative control, and cells lacking TNNT2 expression showed no detectable titin-mEGFP signal, confirming the specificity of the gate. To complement this analysis, we also quantified the median fluorescence intensity (MFI) of titin-mEGFP⁺ cells. The MFI analysis corroborates the original findings, showing a significant decrease in GATA4 knockdown and an increase in CTCF knockdown (updated Figure S2D).

      __Reviewer 2 - Minor comment 3. 3. Figure S2G: P value should be -log10, I assume. Please label it accurately. __

      We appreciate the reviewer pointing out this labeling error. In the revised manuscript, this panel has been removed to accommodate the updated compartment–expression analysis now presented in updated Figure 2H (see response to Reviewer 1 – Point 1), and the issue is no longer applicable.

      References

      Barutcu AR, Maass PG, Lewandowski JP, Weiner CL, Rinn JL. 2018. A TAD boundary is preserved upon deletion of the CTCF-rich Firre locus. Nat Commun 9: 1444.

      Bertero A, Fields PA, Ramani V, Bonora G, Yardımcı GG, Reinecke H, Pabon L, Noble WS, Shendure J, Murry CE. 2019a. Dynamics of genome reorganization during human cardiogenesis reveal an RBM20-dependent splicing factory. Nature communications 10: 1538.

      Bertero A, Fields PA, Smith AS, Leonard A, Beussman K, Sniadecki NJ, Kim D-H, Tse H-F, Pabon L, Shendure J, et al. 2019b. Chromatin compartment dynamics in a haploinsufficient model of cardiac laminopathy. Journal of Cell Biology 218: 2919–44.

      Kang J, Kim YW, Park S, Kang Y, Kim A. 2021. Multiple CTCF sites cooperate with each other to maintain a TAD for enhancer–promoter interaction in the β-globin locus. The FASEB Journal 35: e21768.

      Poleshko A, Shah PP, Gupta M, Babu A, Morley MP, Manderfield LJ, Ifkovits JL, Calderon D, Aghajanian H, Sierra-Pagán JE, et al. 2017. Genome-Nuclear Lamina Interactions Regulate Cardiac Stem Cell Lineage Restriction. Cell 171: 573–587.

      Rodríguez-Carballo E, Lopez-Delisle L, Zhan Y, Fabre PJ, Beccari L, El-Idrissi I, Huynh THN, Ozadam H, Dekker J, Duboule D. 2017. The HoxD cluster is a dynamic and resilient TAD boundary controlling the segregation of antagonistic regulatory landscapes. Genes Dev 31: 2264–2281.

    1. Author response:

      The following is the authors’ response to the original reviews.

      Reviewer #1:

      (1) The authors state that more is known about glial reactivation than cell-cycle re-entry. They are confusing many points here. More gene networks that require cell-cycle re-entry are known. Some of the genes listed for "reactivation" are, in fact, required for cell cycle re-entry/proliferation. And the authors confuse gliosis vs glial reactivation.

      We thank the reviewer for this important and constructive comment. We fully agree that clearly distinguishing between the concepts of glial reactivation, glial proliferation, gliosis, and neurogenesis is essential to avoid conceptual confusion in our study.

      Injury-induced retinal regeneration in zebrafish:

      Glial reactivation refers to the initial response of quiescent Müller glia (MG) to injury, characterized by morphological changes and upregulation of reactive markers (e.g., gfap, ascl1a, lin28a) and activation of signaling pathways such as Notch, Jak/Stat, and Wnt (Lahne et al., 2020; Pollak et al., 2013; Sifuentes et al., 2016; Yao et al., 2016).

      Glial proliferation refers to the clonal expansion of these MG-derived progenitor cells, which undergo rapid cell-cycle re-entry and amplify to generate sufficient progenitors for regeneration (Iribarne and Hyde, 2022; Lee et al., 2024; Wan and Goldman, 2016)

      Gliosis vs neurogenesis represents a divergent fate decision following proliferation. In zebrafish, MG-derived progenitor cells differentiate into retinal neurons that can replace those damaged or lost due to retinal injury. In contrast, mammalian MG tend to undergo an initial gliotic surge and rapidly revert to a quiescent state, exhibiting gliosis and glial scarring (Thomas et al., 2016; Yin et al., 2024). Thus, we totally agreed that gliosis cannot be confused with glial reactivation because glial reactivation is the very first step of glial injury responses, whereas gliogensis is the very last glial response to the injury.

      We agree with the reviewer that many genes typically described as “reactivation markers” (e.g., ascl1a, lin28a, sox2, mycb, mych) are also essential regulators of cell-cycle re-entry (Gorsuch et al., 2017; Hamon et al., 2019; Lee et al., 2024; Lourenço et al., 2021; Pollak et al., 2013; Thomas et al., 2016). Because the glial reactivation is a leading event for glial proliferation, the regulators of glial reactivation are expected to be responsible for glial proliferation as well.

      In our study, we focused on the states preceding glial proliferation to understand the mechanism underlying injury-induced glial cell-cycle re-entry. We defined these transitional states and the subsequent proliferative MG states based on single-cell RNA-seq trajectory analysis. (revised lines: 41-58)

      (2) A major weakness of the approach is testing cone ablation and regeneration in early larval animals. For example, cones are ablated starting the day that they are born. MG that are responding are also very young, less than 48 hrs old. It is also unclear whether the immune response of microglia is a mature response. All of these assays would be of higher significance if they were performed in the context of a mature, fully differentiated, adult retina. All analysis in the paper is negatively affected by this biological variable.

      We thank the reviewer for raising this important point regarding the developmental stage of the retina in our model system. We have carefully considered this concern and now provide additional clarification and justification, as follows:

      (1) The glial responses in larval and adult retina:

      Previous studies have demonstrated that injury-induced glial responses are largely conserved in larval and adult zebrafish retina, including reactive gliosis marked by gfap upregulation and proliferation(Meyers et al., 2012; Sarich et al., 2025). In our study, G/R cones were ablated beginning at 5 dpf using metronidazole (MTZ), and we observed robust induction of PCNA⁺ MG in the inner nuclear layer, consistent with injury-induced proliferation (Figure 1E). These findings align with previous studies showing that key features of MG regenerative responses are conserved across larval and adult stages.

      (2) The microglial responses in larval and adult retina:

      Retinal microglia functionally mature at 5 dpf in the zebrafish retina (Mazzolini et al., 2020; Svahn et al., 2013), and prior studies have demonstrated that microglia in larval and adult zebrafish exhibit similar responses to injury, including migration, morphological activation, and phagocytosis(Nagashima and Hitchcock, 2021; White et al., 2017). In our experiments using Tg(mpeg1: GFP) larvae, we observed clear microglial recruitment to the outer nuclear layer (ONL) following cone ablation (Figure 1E and Figure 1-figure supplement 1A), supporting the functional competence of larval microglia in injury-induced immune responses

      (3) The contribution using larval animals to study the regeneration program:

      We agree that regeneration studies in the adult retina can provide important biological insights, particularly in a fully differentiated tissue environment. Accordingly, we have acknowledged this limitation in our revised manuscript “limitations of this study” section (revised lines 534-540: “1. Our study focuses on larval zebrafish, in which the core features of MG and immune responses are conserved compared to the adult. However, we acknowledge that the adult retina—with its fully matured differentiated retina and immune response—provides irreplaceable biological insight. Nevertheless, larval models offer a powerful platform to uncover conserved regenerative mechanisms and serve as a valuable complement for identifying age-dependent differences in MG-mediated regeneration.”) and have stated our intention to extend future analyses to adult zebrafish, especially to explore age-dependent differences in redox signaling and MG proliferation. At the same time, we believe that the larval model offers unique advantages for uncovering fundamental, conserved mechanisms of regeneration and enables characterization of age-dependent regulatory differences. Thus, our study in larval animals serves as a complementary and informative platform for understanding both the conserved and developmental stage-specific features of injury-induced regeneration.

      (4) Related to the above point, the clonal analysis of cxcl18b+ MG is complicated by the fact that new MG are still being born in the CMZ (as are new cones for that matter).

      We thank the reviewer for raising this important point regarding potential contributions from CMZ-derived progenitors to the lineage-traced cxcl18b⁺ MG clones. To address this concern, we have implemented evidence to rule out a CMZ origin for the clones analyzed:

      Spatial restriction of clones: All clones included in our analysis were located exclusively within the central and dorsal retina, as shown in Figure 2H. From the spatial distribution of reactive MG populations across the retina, we observed a patterned organization in which the vast majority of proliferating MG arose from local mature MG–derived progenitors, rather than from peripheral CMZ-derived progenitors. However, we acknowledge that we cannot entirely exclude the possibility that CMZ-derived progenitors contribute to injury-induced MG proliferation, particularly in the peripheral retina.

      We have clarified this point in the revised Methods section (revised lines 756–762: “Clone analysis of cxcl18b<sup>+</sup> lineage-traced MG was restricted to cells located in the central and dorsal region of the zebrafish retina after G/R cone ablation in Figure 2, Figure 6, and their figure supplement. This spatial restriction strongly suggests that the proliferative MG originate from local mature MG, although we cannot completely rule out the possibility that CMZ-derived progenitors contribute to the generation of proliferative MG in the peripheral retina.”) and updated the corresponding figure legends.

      (4) A near identical study was already done by Hoang et al., 2020, in adult zebrafish, a more relevant biological timepoint. Did the authors check this published RNA-seq database for their gene(s) of interest?

      We thank the reviewer for pointing out the relevance of the study by Hoang et al., 2020, which characterized the transcriptional dynamics of MG reactivation in the adult zebrafish retina. We agree that comparisons with their single-cell RNA-seq dataset are important to confirm the conservation of our findings in larval vs adult zebrafish.

      To this end, we examined the adult zebrafish MG dataset reported by Hoang et al., and confirmed that cxcl18b is also present and enriched in their analysis, particularly in activated MG populations under various injury paradigms:

      (1) cxcl18b is listed as a differentially expressed gene (DEG) in Supplementary Table ST2, enriched in GFP⁺ MG following injury. It is also significantly upregulated in both NMDA-induced and light damage conditions, as shown in Supplementary Table ST3.

      (2) In Supplementary Table ST5, cxcl18b is identified as a classifier of activated MG, with classification power scores of 0.552 (NMDA), 0.632 (light damage), and 0.574 (TNFα + γ-secretase inhibitor treatment), indicating its consistent expression across multiple injury models.

      (3). In their pseudotime analysis (Figure 4C and Supplementary Table ST8), cxcl18b is specifically expressed in Module 5, which is expressed earlier along the trajectory than ascl1a. This temporal pattern of cxcl18b preceding ascl1a expression is consistent with our trajectory analysis in larval MG (Figure 1H), further supporting its role as an early marker of the transitional state before proliferation.

      These findings underscore the robustness and biological relevance of cxcl18b as a conserved marker of injury-responsive MG in both larval and adult zebrafish. Our data expand upon the prior work by specifically characterizing a cxcl18b-defined transitional MG state preceding cell-cycle re-entry, thereby offering additional insights into the temporal staging of MG activation during regeneration.

      (5) KD of cxcl18b did not affect MG proliferation or any other defined outcome. And yet the authors continually state such phrases as "microglia-mediated inflammation is critical for activating the cxcl18b-defined transitional states that drive MG proliferation." This is false. Cxcl18b does not drive MG proliferation at all.

      We thank the reviewer for raising this concern. We agree with the reviewer and have revised this statement as "These findings suggest that microglia-mediated inflammation may contribute to the activation of cxcl18b-defined transitional states that precede MG proliferation, although a causal relationship remains to be established." (revised lines 251-253).

      (6) A technical concern is that intravitreal injections are not routinely performed in larval fish.

      We appreciate the reviewer’s technical concern regarding the use of intravitreal injections in larval zebrafish. In our study, we performed intraocular injection according to previously established methods (Alvarez et al., 2009; Giannaccini et al., 2018; Rosa et al., 2023). This approach involves carefully delivering a small volume of viral suspension into the intraocular space by a glass micropipette. To address this concern, we will revise the Materials and Methods section to clearly describe the injection procedure and will cite the relevant references accordingly.

      Reviewer #2:

      (1) The authors note a peak of PCNA+ Muller glia at 72 hours post injury. This is somewhat surprising as the MG would be expected to generate progenitor cells that would continue proliferating and stain with PCNA. Indeed, only a handful of PCNA+ cells are seen in the INL/ONL layer in Figure 1E2 with few clusters of progenitors present. It would be helpful to stain with a Muller glia marker to confirm these PCNA+ cells are Muller glia. It's also curious that almost all the PCNA+ cells are in the dorsal retina, even though G/R cone loss extends across both dorsal and ventral retina. Is this typical for cone ablation models in larval zebrafish?

      We thank the reviewer for their insightful comment regarding the spatial distribution and identity of PCNA⁺ cells following injury.

      In our study, we observed that the injury-induced proliferating cells (PCNA⁺) were predominantly located in the central and dorsal regions of the retina at 72 hours post-injury (hpi) (Figure 1E). To verify the identity of these proliferating cells, we performed additional immunostaining using BLBP, and confirmed that the majority of PCNA⁺ cells also express BLBP (Figure 1–figure supplement 1B in our revised Data), these results supporting their MG origin.

      The regional bias of MG proliferation towards the central and dorsal retina is consistent with previous findings. Notably, (Krylov et al., 2023) demonstrated that MG exhibit region-specific heterogeneity in their regenerative responses to photoreceptor ablation. Their study identified proliferative MG subpopulations predominantly in the central (fgf24-expressing) and dorsal (efnb2a-expressing) domains, whereas ventral MG showed limited proliferative capacity (Krylov et al., 2023). These observations provide a plausible explanation for the spatially restricted PCNA⁺ MG population observed in our model following cone ablation.

      (2) In Line 148: What is meant by "most original MG states" in this context? Original meaning novel? Or original meaning the earliest state MG adopted following injury? The language here is confusing.

      We thank the reviewer for pointing out the ambiguous phrasing in our original manuscript. The term “most original MG states” was imprecise and misleading, as it could be interpreted as referring to the quiescent state of MG. In our context, we intended to describe the earliest transitional states in MG respond to injury, as they begin to exit quiescence and enter reactive characteristics. These early transitional MG populations co-express quiescent markers such as cx43 and early reactive markers gfap, as shown in Figure 1H.

      To avoid confusion and improve conceptual clarity, we have revised the manuscript by replacing “most original MG states” with “early transitional MG state” (revised line 154) and have added a clearer explanation in the corresponding Results section to define this population more accurately.

      (3) Perhaps provide a better image in Figure 2A of the cxcl18b at 48 hpi and 72 hpi. The current images appear virtually identical, with very little cxcl18b expression observed, especially compared to the 24 hpi. This is in contrast to the Tg(cxcl18b:GFP) transgenic line shown in Figure 2D, which indicates either much higher expression in proliferating cells at 48 hpi or the stability of GFP protein. Can the authors provide guidance on the accurate temporal expression of cxcl18b? Does expression peak rapidly at 24 hpi and then rapidly decline or is there persistence of expression to 48-72 hpi?

      We appreciate the reviewer’s careful observation regarding the apparent similarity of cxcl18b expression at 48 hpi and 72 hpi in the in situ hybridization (ISH) images (Figure 2A), and the differences compared to the Tg(cxcl18b: GFP) reporter line shown in Figure 2D.

      (1) The similarity of ISH images at the 48 hpi and 72 hpi (Figure 2A):

      The cxcl18b mRNA signal peaked at 24 hpi, suggesting a rapid transcriptional response after retina injury. By 48 hpi, cxcl18b expression had already declined substantially, and by 72 hpi, the signal was further reduced to near-background levels. This temporal expression pattern explains why the ISH images at 48 hpi and 72 hpi appear nearly identical and much weaker compared to 24 hpi.

      (2) The discrepancy between ISH and GFP reporter signal (Figure 2D):

      The Tg(cxcl18b: GFP) reporter line shows persistent GFP expression beyond the transcriptional window of cxcl18b mRNA. This may be due to the prolonged stay of GFP protein, which remains detectable even after the endogenous transcription of cxcl18b has diminished. This explanation is also noted in the manuscript (revised lines 198–200). As a result, GFP⁺ MG cells are still visible at 48–72 hpi, and some of them co-label with PCNA.

      These findings are consistent with our Pseudotime analysis based on scRNA-seq data (Figure 1H), which shows that cxcl18b expression precedes the induction of proliferative markers such as pcna and ascl1a.

      (4) Line 198: The establishment of the Tg(cxcl18b:Cre-vhmc:mcherry::ef1a:loxP-dsRed-loxP-EGFP::lws2:nfsb-mCherry) is considerable but the nomenclature doesn't properly fit. Is the mCherry fused with Cre and driven by the cxcl18b promoter? What is the vhmc component? Finally, while this may provide the ability to clonally track cxcl18b-expressing MG, it does not address the prior question of what is the actual temporal expression of cxcl18b? If anything, this only addresses whether proliferating MG expressed cxcl18b at some point in their history, but does not indicate that cxcl18b expression co-exists in proliferating cells. The most convincing evidence is in Supplemental Figure 2B.

      The "vmhc" component refers to the ventricular myosin heavy chain promoter, commonly used to label atrial cardiomyocytes (Jin et al., 2009). We cloned the vmhc upstream region containing its promoter and fusing with mCherry for selection during transgenic fish line construction.

      Clone analysis using the Tg(cxcl18b: Cre-vmhc: mCherry::ef1a: loxP-DsRed-loxP-EGFP::lws2: nfsb-mCherry) further indicates that cxcl18b-defined the transitional state is the essential routing for MG proliferation. We have clarified in the revised text that this lineage tracing indicates a “history of injury-induced cxcl18b expression” rather than its ongoing expression during proliferation (revised line 205).

      (5) Line 203: The data shown in Figure 2F do not indicate that these MG are cxcl18b+. Rather, the data are consistent with the interpretation that these MG expressed Cre at some prior stage and now express GFP from the ef1a promoter rather than DsRed. Whether these MG continue to express cxcl18b at the time these fish were collected is not addressed by these data. It is not accurate to conclude that these cells are cxcl18b+.

      We thank the reviewer for pointing out this important issue. We agreed that the GFP<sup>+</sup> MG shown in Figure 2F represents cells that have previously expressed cxcl18b and thus belong to the cxcl18b-expressing cell lineage, but this does not indicate that they continue to express cxcl18b at the time of sample collection. Performing clonal analysis using the Cre-loxp system, the GFP signal reflects historical cxcl18b promoter activity rather than ongoing transcription. We have revised the relevant sentence in our manuscript to clarify this point and now refer to these GFP<sup>+</sup> cells as "cxcl18b lineage-traced MG" rather than "cxcl18b<sup>+</sup> MG" to avoid any misinterpretation (revised line 207).

      (6) Line 213: The statement that proliferative MG mostly originated from cxcl18b+ MG transitional states is a conclusion that does appear fully supported by the data. Whether those MG continue to express cxcl18b remains unanswered by the data in Figure 2 and would likely be inconsistent with the single-cell data in Figure 1.

      We thank the reviewer for this valuable comment. We agree that the original statement on Line 213 regarding the lineage relationship between cxcl18b⁺ transitional MG and proliferative MG required clarification.

      (1) The cxcl18b expression dynamics:

      Our single-cell RNA-seq and ISH analyses consistently show that cxcl18b expression peaks as early as 24 hpi and declines rapidly, with significantly reduced expression by 48 and 72 hpi. These findings suggest that cxcl18b marks an early transitional MG state, rather than being maintained in proliferative MG. Indeed, in our scRNA-seq pseudotime trajectory analysis (Figure 1H), cxcl18b expression is highest in early transitional MG clusters (Clusters 1) and downregulated as cells progress toward proliferative states (Clusters 3/6), supporting a model in which cxcl18b is downregulated before cell-cycle re-entry.

      (2) Prolonged stability of GFP protein:

      The GFP signal observed in Tg(cxcl18b: GFP) retinas at 72 hpi may be because of the prolonged stability of GFP protein, rather than sustained cxcl18b transcription. The actual expression dynamics of cxcl18b are more directly reflected by our in situ hybridization and single-cell RNA-seq data, both showing a rapid decline after its early peak at 24 hpi. This explanation is also noted in the manuscript (revised lines 196–197).

      (7) Line 246: The use of Dexamethasone to block inflammation is a widely used approach. However, dexamethasone is a broad-spectrum anti-inflammatory molecule that works through glucocorticoid signaling that may involve more than microglia. The observation that microglia recruitment and cxcl18a expression are both reduced is correlative but does not prove causation. Thus, the data are not sufficient to conclude that microglia-mediated inflammation is critical for activating cxcl18b expression. Indeed, data in Figure 1 indicate that cxcl18b expression occurs prior to microglia migration to the ONL.

      We thank the reviewer for this thoughtful and important comment. We fully acknowledge that dexamethasone is a broad-spectrum anti-inflammatory agent that acts via glucocorticoid receptor signaling and may influence multiple immune and non-immune pathways beyond microglia.

      In our study, dexamethasone treatment led to a reduction in both microglial recruitment and the number of cxcl18b<sup>+</sup> MG at 72 hpi, suggesting a potential association between inflammation and cxcl18b activation. However, we agree that this observation remains correlative and is not sufficient to establish a direct link between microglia activity and cxcl18b induction. Our time-course analysis indicates that cxcl18b expression peaks at 24 hpi, preceding robust microglial accumulation in the ONL, further highlighting the need to clarify the temporal dynamics and cellular sources of inflammatory cues.

      To address this question more conclusively, selective ablation of microglia during cone injury would be necessary. However, implementing such an approach would require a complex intersection of three transgenic lines—Tg(mpeg1: nfsB-mCherry) for microglia ablation, Tg(lws2: nfsB-mCherry) for cone ablation, and Tg(cxcl18b: GFP) for reporting—posing substantial genetic and experimental challenges.

      We have revised the Results section accordingly to state: “These findings suggest that microglia-mediated inflammation may contribute to the activation of cxcl18b-defined transitional states that precede MG proliferation, although a causal relationship remains to be established.” (revised lines 251–253). We also added a new paragraph in the “Result: Clonal analysis reveals injury-induced MG proliferation via cxcl18b-defined transitional states associated with inflammation” as “While dexamethasone suppressed both microglial recruitment and cxcl18b<sup>+</sup> MG generation, its broad anti-inflammatory action precludes definitive conclusions about microglial causality. Dissecting this relationship would require concurrent ablation of microglia and cone photoreceptors using a triple-transgenic strategy, which is beyond the scope of the current study. Targeted approaches will be necessary to resolve the specific role of microglia in initiating cxcl18b expression.” (revised lines 251–258) to explicitly acknowledge this limitation and the need for future studies using microglia-specific ablation models to resolve the mechanism.

      (8) Could the authors clarify the basis of investigating NO signaling, given the relative expression of the genes by either cxcl18b+ MG or uninjured MG? Based on the expression illustrated in Supplemental Figure 4A, there is almost no expression of nos1 or nos2b in any MG. The authors are encouraged to revisit the earlier single-cell data sets to identify those cells that express components of NO signaling to determine the source(s) of NO that could be impacting the Muller glia.

      We thank the reviewer for raising these important points.

      Nitric oxide (NO) signaling has been implicated in the regeneration of multiple zebrafish tissues, including the heart (Rochon et al., 2020; Yu et al., 2024), spinal cord (Bradley et al., 2010), and fin (Matrone et al., 2021). Based on these findings, we hypothesized that NO signaling might also contribute to retinal regeneration.

      As described in the manuscript, we compiled a redox-related gene list and systematically screened their roles in injury-induced MG proliferation using CRISPR-Cas9-mediated gene disruption. Among the candidates, disruption of nos genes significantly reduced the number of PCNA<sup>+</sup> MG cells following G/R cone ablation (Figure 4), prompting us to further investigate the role of NO signaling.

      (9) Line 319-320: this sentence appears to be missing text as "while no influenced across the nos mutants and gsnor mutants" does not make sense.

      We appreciate the reviewer’s observation and agree that the original sentence was unclear. We have revised the sentence in the manuscript as follows:

      “In contrast, no significant change in MG proliferation was observed in nos1, nos2a, or gsnor mutants compared to wild type (Figures 4F–4I)” (revised lines 326-328).

      (10) Line 326-328: The text should be rewritten as the current meaning would suggest there was no significant loss of photoreceptors in the nos2b mutants. That is incorrect. Rather, there was no significant difference between WT and the nos2b mutants in the number of photoreceptors lost at 72 hpi following MTZ treatment. Both groups lost photoreceptors, but the number lost in nos2b hets and homozygotes was the same as WT.

      We agree with the suggestion and have revised our manuscript. We have revised the sentence in the manuscript as follows:

      “We observed no significant difference in the loss of cone photoreceptor at 72 hpi between nos2b mutants and WT, indicating that the reduced MG proliferation observed in nos2b mutants is independent of the injury (WT: 45 ± 8 remaining cones, n = 24; nos2b⁺/⁻: 49 ± 12, n = 20; nos2b⁻/⁻: 46 ± 9, n = 20; mean ± SEM) (Figure 4K).” (revised lines 331-335).

      (11) There is concern over the inconsistencies with some of the data. In Figure 4, Supplement 1A, the single-cell data found virtually no expression of nos2b in either uninjured MG or cxcl18b+ MG. In contrast, the authors find nos2b expression by RT-PCR in the cxcl18b:GFP+ MG. The in situ expression of nos2b in Figure 5 - Supplement 1 is not persuasive. The red puncta are seen in a single cxcl18b:GFP+ cell but also in the plexiform layer and is other non cxcl18b:GFP+ cells.

      We appreciate the concern regarding the apparent inconsistencies in nos2b expression across different datasets. We provide the following explanations:

      (1) Low expression of nos2b in scRNA-seq data:

      We propose a potential explanation: Nitric oxide (NO) signaling is known to exert its biological functions in a dose-dependent manner and is tightly regulated post-transcriptionally, especially in inducible nitric oxide synthase (iNOS) (Bogdan, 2001; Nathan and Xie, 1994; Thomas et al., 2008). Thus, even modest changes in nos2b expression may exert meaningful biological effects without producing strong transcriptional signals detectable by scRNA-seq, which could fall below the detection threshold of scRNA-seq methods. Supporting this idea, our functional assay (Figure 4J) reveals a clear concentration-dependent effect of NO on MG proliferation, consistent with the biological relevance of Nos2b activity despite its low transcript abundance.

      (2) Regarding the in situ hybridization data:

      We used both commercially available in situ hybridization probes from (HCR<sup>TM</sup>) and RNAscope<sup>TM</sup> (data not shown) to detect nos2b transcripts. While the nos2b signal was observed in other retinal cell types, including cells in the plexiform layer, our primary study was focused on examining its expression within the cxcl18b<sup>+</sup> MG lineage.

      (3) Regarding RT-PCR detection of nos2b in cxcl18b: GFP<sup>+</sup> MG:

      To enhance detection sensitivity, we enriched cxcl18b: GFP<sup>+</sup> MG by FACS at 72 hpi and performed cDNA amplification before RT-PCR. This approach allowed the detection of low-abundance transcripts such as nos2b. It is also important to note that RT-PCR reflects fold changes in expression compared to MG to other retina cell type. The subtle but biologically upregulated of nos2b expression may not be readily captured by in situ hybridization or scRNA-seq.

      (12) Line 356 - there is a disagreement over the interpretation of the current data. The statement that nos2b was specifically expressed in cxcl18b+ transitional MG states is not entirely accurate. This conclusion is based on expression of GFP from a cxcl18b promoter, which may reflect persistence of the GFP protein and not evidence of cxcl18b expression. Even assuming that the nos2b in situ hybridization and RT-PCR data are correct, the data would indicate that nos2b is expressed in proliferating MG that are derived from the cxcl18b+ transitional states. The single-cell trajectory analysis in Figure 2 indicates that cxcl18b is not co-expressed with PCNA. Furthermore, the single-cell data in Figure 4, Supplement 1, indicates no expression of nos2b in cxcl18b+ MG. The authors need to reconcile these seemingly contradictory pieces of data.

      We thank the reviewer for this thoughtful and important comment. We agree that clarification is needed to accurately interpret the relationship between cxcl18b, nos2b, and MG proliferation, particularly considering the different temporal and technical contexts of our datasets.

      (1) Lineage labeling and interpretation of GFP expression:

      We acknowledge that in the Tg(cxcl18b: Cre-vhmc: mcherry::ef1a: loxP-dsRed-loxP-EGFP::lws2: nfsb-mCherry) line, GFP expression reflects historical activity of the cxcl18b promoter, rather than ongoing transcription. This GFP signal, due to its prolonged stay, may persist beyond the time window of endogenous cxcl18b expression. Accordingly, we have revised the manuscript to replace “cxcl18b⁺ MG” with “cxcl18b⁺ lineage-traced MG” throughout the relevant sections to prevent potential misinterpretation.

      (2) Functional experiments support a lineage relationship between cxcl18b⁺ states and nos2b activity:

      To further investigate the regulatory relationship between cxcl18b and nos2b, we conducted NO scavenging experiments using C-PTIO in the Tg(cxcl18b: GFP) background. We observed that the generation of cxcl18b: GFP⁺ MG after injury was not affected by NO depletion, indicating that cxcl18b activation precedes NO signaling (data not shown). However, PCNA⁺ MG was significantly reduced under the same treatment, suggesting that NO signaling is not required for cxcl18b⁺ transitional state formation, but is necessary for proliferation. Together with our MG-specific nos2b knockout data, these results support a model in which nos2b-derived NO acts downstream of the cxcl18b⁺ transitional state to promote MG cell-cycle re-entry.

      (3) The scRNA-seq data with nos2b expression:

      We agree with the reviewer that our scRNA-seq dataset shows minimal overlap between cxcl18b and pcna expression, which is consistent with our interpretation that cxcl18b expression marks a transitional phase before cell-cycle entry. Furthermore, nos2b transcripts were not robustly detected in cxcl18b⁺ MG clusters in our scRNA dataset. This discrepancy may be caused by technical limitations of scRNA-seq in capturing low-abundance or transient transcripts such as nos2b, as discussed in response to comment #11.

      (13) The data in Figure 7 are interesting and suggest a link between NO signaling and notch activity. The use of the C-PTIO NO scavenger is not specific to MG, which limits the conclusions related to autocrine NO signaling in cxcl18b+ MG.

      We acknowledge that the use of C-PTIO cannot distinguish between NO signaling within MG and paracrine effects from other retinal cells. Currently, technical limitations prevent MG-specific NO depletion. We have discussed this limitation accordingly in our revised “Limitations of this study” section (revised lines 540-545: “2. While our data suggest that injury-induced NO suppresses Notch signaling activation and promotes MG proliferation, the use of a general NO scavenger (C-PTIO) does not allow us to determine whether this regulation occurs in an autocrine or paracrine manner. The specific role of NO signaling within cxcl18b⁺ MG requires further validation using MG-specific NO depletion.”)

      (14) Line 446-448. As mentioned before, the data do not support a causative link between microglia recruitment and cxcl18b induction. More specifically, dexamethasone is a broad-spectrum anti-inflammatory drug that blocks microglia activation and recruitment. Critically, the authors demonstrate that expression of cxcl18b occurs prior to microglia recruitment (see Figure 1, Supplement 1). Thus, the statement that cxcl18b induction depends on microglia recruitment is not accurate.

      We thank the reviewer for reiterating this important point. We fully agree that the current data do not support a direct causal relationship between microglia recruitment and cxcl18b induction. As also addressed in our response to Comment 7, dexamethasone, as a broad-spectrum anti-inflammatory agent, cannot distinguish microglia-specific effects from those of other immune components. We have revised the text in revised lines 251–258 to clarify that microglia-mediated inflammation is associated with—but not required for—activation of cxcl18b-defined transitional MG states.

      Reference:

      Bogdan, C. (2001). Nitric oxide and the immune response. Nature immunology 2, 907-916.

      Bradley, S., Tossell, K., Lockley, R., and McDearmid, J.R. (2010). Nitric oxide synthase regulates morphogenesis of zebrafish spinal cord motoneurons. The Journal of neuroscience : the official journal of the Society for Neuroscience 30, 16818-16831.

      Gorsuch, R.A., Lahne, M., Yarka, C.E., Petravick, M.E., Li, J., and Hyde, D.R. (2017). Sox2 regulates Müller glia reprogramming and proliferation in the regenerating zebrafish retina via Lin28 and Ascl1a. Experimental eye research 161, 174-192.

      Hamon, A., García-García, D., Ail, D., Bitard, J., Chesneau, A., Dalkara, D., Locker, M., Roger, J.E., and Perron, M. (2019). Linking YAP to Müller Glia Quiescence Exit in the Degenerative Retina. Cell reports 27, 1712-1725.e1716.

      Iribarne, M., and Hyde, D.R. (2022). Different inflammation responses modulate Müller glia proliferation in the acute or chronically damaged zebrafish retina. Frontiers in cell and developmental biology 10, 892271.

      Jin, D., Ni, T.T., Hou, J., Rellinger, E., and Zhong, T.P. (2009). Promoter analysis of ventricular myosin heavy chain (vmhc) in zebrafish embryos. Developmental dynamics : an official publication of the American Association of Anatomists 238, 1760-1767.

      Krylov, A., Yu, S., Veen, K., Newton, A., Ye, A., Qin, H., He, J., and Jusuf, P.R. (2023). Heterogeneity in quiescent Müller glia in the uninjured zebrafish retina drive differential responses following photoreceptor ablation. Frontiers in molecular neuroscience 16, 1087136.

      Lahne, M., Nagashima, M., Hyde, D.R., and Hitchcock, P.F. (2020). Reprogramming Müller Glia to Regenerate Retinal Neurons. Annual review of vision science 6, 171-193.

      Lee, M.S., Jui, J., Sahu, A., and Goldman, D. (2024). Mycb and Mych stimulate Müller glial cell reprogramming and proliferation in the uninjured and injured zebrafish retina. Development (Cambridge, England) 151.

      Lourenço, R., Brandão, A.S., Borbinha, J., Gorgulho, R., and Jacinto, A. (2021). Yap Regulates Müller Glia Reprogramming in Damaged Zebrafish Retinas. Frontiers in cell and developmental biology 9, 667796.

      Matrone, G., Jung, S.Y., Choi, J.M., Jain, A., Leung, H.E., Rajapakshe, K., Coarfa, C., Rodor, J., Denvir, M.A., Baker, A.H., et al. (2021). Nuclear S-nitrosylation impacts tissue regeneration in zebrafish. Nat Commun 12, 6282.

      Mazzolini, J., Le Clerc, S., Morisse, G., Coulonges, C., Kuil, L.E., van Ham, T.J., Zagury, J.F., and Sieger, D. (2020). Gene expression profiling reveals a conserved microglia signature in larval zebrafish. Glia 68, 298-315.

      Meyers, J.R., Hu, L., Moses, A., Kaboli, K., Papandrea, A., and Raymond, P.A. (2012). β-catenin/Wnt signaling controls progenitor fate in the developing and regenerating zebrafish retina. Neural development 7, 30.

      Nagashima, M., and Hitchcock, P.F. (2021). Inflammation Regulates the Multi-Step Process of Retinal Regeneration in Zebrafish. Cells 10.

      Nathan, C., and Xie, Q.W. (1994). Nitric oxide synthases: roles, tolls, and controls. Cell 78, 915-918.

      Pollak, J., Wilken, M.S., Ueki, Y., Cox, K.E., Sullivan, J.M., Taylor, R.J., Levine, E.M., and Reh, T.A. (2013). ASCL1 reprograms mouse Muller glia into neurogenic retinal progenitors. Development (Cambridge, England) 140, 2619-2631.

      Rochon, E.R., Missinato, M.A., Xue, J., Tejero, J., Tsang, M., Gladwin, M.T., and Corti, P. (2020). Nitrite Improves Heart Regeneration in Zebrafish. Antioxidants & redox signaling 32, 363-377.

      Sarich, S.C., Sreevidya, V.S., Udvadia, A.J., Svoboda, K.R., and Gutzman, J.H. (2025). The transcription factor Jun is necessary for optic nerve regeneration in larval zebrafish. PloS one 20, e0313534.

      Sifuentes, C.J., Kim, J.W., Swaroop, A., and Raymond, P.A. (2016). Rapid, Dynamic Activation of Müller Glial Stem Cell Responses in Zebrafish. Investigative ophthalmology & visual science 57, 5148-5160.

      Svahn, A.J., Graeber, M.B., Ellett, F., Lieschke, G.J., Rinkwitz, S., Bennett, M.R., and Becker, T.S. (2013). Development of ramified microglia from early macrophages in the zebrafish optic tectum. Developmental neurobiology 73, 60-71.

      Thomas, D.D., Ridnour, L.A., Isenberg, J.S., Flores-Santana, W., Switzer, C.H., Donzelli, S., Hussain, P., Vecoli, C., Paolocci, N., Ambs, S., et al. (2008). The chemical biology of nitric oxide: implications in cellular signaling. Free radical biology & medicine 45, 18-31.

      Thomas, J.L., Ranski, A.H., Morgan, G.W., and Thummel, R. (2016). Reactive gliosis in the adult zebrafish retina. Experimental eye research 143, 98-109.

      Wan, J., and Goldman, D. (2016). Retina regeneration in zebrafish. Current opinion in genetics & development 40, 41-47.

      White, D.T., Sengupta, S., Saxena, M.T., Xu, Q., Hanes, J., Ding, D., Ji, H., and Mumm, J.S. (2017). Immunomodulation-accelerated neuronal regeneration following selective rod photoreceptor cell ablation in the zebrafish retina. Proceedings of the National Academy of Sciences of the United States of America 114, E3719-e3728.

      Yao, K., Qiu, S., Tian, L., Snider, W.D., Flannery, J.G., Schaffer, D.V., and Chen, B. (2016). Wnt Regulates Proliferation and Neurogenic Potential of Müller Glial Cells via a Lin28/let-7 miRNA-Dependent Pathway in Adult Mammalian Retinas. Cell reports 17, 165-178.

      Yin, Z., Kang, J., Xu, H., Huo, S., and Xu, H. (2024). Recent progress of principal techniques used in the study of Müller glia reprogramming in mice. Cell regeneration (London, England) 13, 30.

      Yu, C., Li, X., Ma, J., Liang, S., Zhao, Y., Li, Q., and Zhang, R. (2024). Spatiotemporal modulation of nitric oxide and Notch signaling by hemodynamic-responsive Trpv4 is essential for ventricle regeneration. Cellular and molecular life sciences : CMLS 81, 60.

    1. Author response:

      The following is the authors’ response to the original reviews.

      Reviewer #1 (Public review): 

      Summary: 

      Biomolecular condensates are an essential part of cellular homeostatic regulation. In this manuscript, the authors develop a theoretical framework for the phase separation of membrane-bound proteins. They show the effect of non-dilute surface binding and phase separation on tight junction protein organization. 

      Strengths: 

      It is an important study, considering that the phase separation of membrane-bound molecules is taking the center stage of signaling, spanning from immune signaling to cell-cell adhesion. A theoretical framework will help biologists to quantitatively interpret their findings. 

      Weaknesses: 

      Understandably, the authors used one system to test their theory (ZO-1). However, to establish a theoretical framework, this is sufficient. 

      We acknowledge this limitation. While we agree that additional systems would strengthen the generality of our theory, we note that the focus of this work is to introduce and validate a theoretical framework. As the reviewer notes, this is sufficient for establishing the framework. Nonetheless, we are open to further collaborations or future studies to test the model with other systems.

      Reviewer #2 (Public review): 

      Summary: 

      The authors present a clear expansion of biophysical (thermodynamic) theory regarding the binding of proteins to membrane-bound receptors, accounting for higher local concentration effects of the protein. To partially test the expanded theory, the authors perform in vitro experiments on the binding of ZO1 proteins to Claudin2 C-terminal receptors anchored to a supported lipid bilayer, and capture the effects that surface phase separation of ZO1 has on its adsorption to the membrane. 

      Strengths: 

      (1) The derived theoretical framework is consistent and largely well-explained. 

      (2) The experimental and numerical methodologies are transparent. 

      (3) The comparison between the best parameterized non-dilute theory is in reasonable agreement with experiments. 

      Weaknesses: 

      (1) In the theoretical section, what has previously been known, compared to which equations are new, should be made more clear. 

      We have revised the theory section to clearly distinguish previously established formulations from novel contributions following equation (4), which is .

      (2) Some assumptions in the model are made purely for convenience and without sufficient accompanying physical justification. E.g., the authors should justify, on physical grounds, why binding rate effects are/could be larger than the other fluxes. 

      For our problem, binding is relevant together with diffusive transport in each phase. Each process is accompanied by kinetic coefficients that we estimate for the experimental system. For the considered biological systems (and related ones), it is difficult to determine whether other fluxes (see, e.g., Eq. 8(e)) have relaxed or not. We note that their effects are, of course, included in the kinetic model applied to the coarsening of ZO1 surface condensates as boundary conditions. But we cannot exclude that the corresponding kinetic coefficient in the actual biological system is large enough such that, e.g., Eq. (9e) does not vanish to zero “quasi-statically”. We have now added a sentence to the outlook highlighting the relevance of testing those flux-force relationships in biological systems. 

      (3) I feel that further mechanistic explanation as to why bulk phase separation widens the regime of surface phase separation is warranted.  

      We have discussed the mechanistic explanation related to bulk protein interaction strength in the manuscript in the section: “Effects of binding affinity and interactions on surface phase separation”. We explained how the bulk interaction parameter affects the binding equilibrium. 

      (4) The major advantage of the non-dilute theory as compared with a best parameterized dilute (or homogenous) theory requires further clarification/evidence with respect to capturing the experimental data. 

      We thank reviewer for this helpful question. To address this point, we have added new paragraphs in the conclusion section, which explicitly discuss the necessity of employing the non-dilute theory for interpreting the experimental data.

      (5) Discrete (particle-based) molecular modelling could help to delineate the quantitative improvements that the non-dilute theory has over the previous state-of-the-art. Also, this could help test theoretical statements regarding the roles of bulk-phase separation, which were not explored experimentally.  

      We appreciate the suggestion and agree that such modeling would be valuable. However, this is beyond the scope of the current study. 

      (6) Discussion of the caveats and limitations of the theory and modelling is missing from the text. 

      We sincerely appreciate the reviewer’s helpful comment. We have added a discussion in the conclusion section outlining the caveats and limitations of our modeling approach.

      Reviewing Editor Comments: 

      Upon discussing with the reviewers, we feel that this manuscript could significantly be improved if testing the model with a different model system (beyond ZO1/tight junctions), in which case we foresee that we could enhance the strength of evidence from "compelling" to "exceptional". But of course, this is up to the authors to go for it or not, the paper is already very good. 

      Reviewer #2 (Recommendations for the authors): 

      (1) Lines 132-134: Re-word, the use of "complex" is confusing.

      We have rephrased the sentence for clarity. The revised version reads: ṽ<sub>_𝑃𝑅</sub>_ are the molecular volume and area of the protein-receptor complex ѵ<sub>𝑃𝑅</sub>, respectively”, and the changes have been in the revised manuscript.

      (2) Line 154 use of ""\nu"" for volume and area could be avoided for better clarity. 

      We thank the reviewer for this helpful suggestion. We have removed the statement involving ""\nu"" as these quantities have already been defined in the preceding context.

      (3) Line 158 the total "Helmholtz" free energy F... 

      We have added the word "Helmholtz" to the sentence.

      (4) Line 160 typo "In specific,..." 

      We carefully checked this sentence but could not identify a typo.  

      (5) For equation 5 explain the physical origins of each term, or provide a reference if this equation is explained elsewhere. 

      Thank you very much for your valuable suggestions. We have carefully rephrased Equation (5) and added a paragraph immediately afterward to provide a detailed explanation of its physical meaning.

      (6) Derivation on lines 163-174 is poorly written. Make the logical flow between the equations clearer. 

      We greatly appreciate your insightful suggestions. Equation (6) has been carefully revised for clarity, and the explanation has been rewritten to ensure better readability. All modifications are Done.

      (7) Define bold "t" in Equation 6. 

      The variable “t” has been explicitly defined in the context for clarity.

      (8) In equations. 7b-7c the nablas (gradients) should be the 2D versions.  

      We have updated the gradient operators in Equations (7b) and (7c) [Eq. (9) in revised manuscript]  to their 2D forms for consistency. 

      (9) Line 190, avoid referring to the future Equation 14, and state in words what is meant by "thermodynamic equilibrium". 

      We have added the explanation of “thermodynamic equilibrium” and remove the reference to equation accordingly.

      (10) In Equation 11 you don't explain what you are doing ( which is a perturbation around the minimum of the free energy). 

      We have revised the paragraph before equation (11) [Eq. (13) in revised manuscript] to clarify that the expression represents a perturbation around the minimum of the free energy.

      (11)  In Equation 12, doesn't this also depend on how you have written equation 6 (not just equation 5). 

      Eq. (12) [Eq. (14) in revised manuscript] is derived directly from the variation of the total free energy F. In contrast, Eq. (6) contains the time derivative of free energies that were not written in their final form. In the revised version, we have now given the conjugate forces and fluxes in Eqs. (7) and (8) for clarity.

      (12) Line 206 specify the threshold of local concentration (or provide a reference). 

      We have specified the threshold of local concentration in the revised text, and the corresponding statement has been highlighted.

      (13) Line 223 is the deviation from ideality captured in a pair-wise fashion? I presume it does not account for N many-body interactions?  

      Yes, our model is formulated within a mean-field framework that incorporates pairwise (second order) interaction coefficients. For example, 𝜒<sub>𝑃𝑅 -𝑅</sub> characterizes the interaction between the complex 𝑃𝑅 and the free receptor 𝑅, 𝜒<sub>𝑅 -L</sub> the interaction between free receptor 𝑅 and free lipid 𝐿, 𝜒<sub>𝑃𝑅-𝐿</sub> the interaction between complex 𝑃𝑅and free lipid 𝐿. We have stressed this choice of free energy in the revised manuscript.

      (14) Line 274, how do the authors know the secondary effects (of which they should mention a few) do not significantly impact the observed behaviour?  

      We sincerely thank the reviewer for the helpful comment. First, the parameters 𝜒<sub>𝑅 -L</sub> and 𝜒<sub>𝑃𝑅 -𝑅</sub> are not essential based on the experimental observations. For more information, please see our revised paragraph on the choice of the specific parameter values, which has been in the following Eq. (21).

      (15) It's not clear how Figures 3 b and c are generated with reference to which parameters are changed to investigate with/without bulk phase separation. 

      To improve clarity, we have revised Figure 3 to display the corresponding parameter values directly in each panel. Figures 3b and 3c were generated by computing the surface binding curves (as shown in Fig. 2) for each binding affinity 𝜔<sub>𝑃𝑅</sub> and membrane-complex interaction strength 𝜒<sub>𝑃𝑅-𝐿</sub>, under different bulk interaction strengths chi, to compare the cases with and without bulk phase separation. 

      (16) The jump between theory and the "Mechanism in ..." section is too much. The authors should include the biological context of tight junctions and ZO1 in the main introduction. 

      We appreciate the reviewer’s suggestion. Following this comment, we have added an extended discussion in the main introduction to provide the necessary biological context of tight junctions and ZO1. In addition, we inserted new bridging paragraphs between the theoretical section and the section “Mechanism in tight junction formation” to create a smoother transition from theory to experiments. These revisions help to better connect the theoretical framework with the biological phenomena discussed in the later section.

    1. Reviewer #1 (Public review):

      Disclaimer: While I am familiar with the CFS method and the CFS literature, I am not familiar with primate research or two-photon calcium imaging. Additionally, I may be biased regarding unconscious processing under CFS, as I have extensively investigated this area but have found no compelling evidence in favor of unconscious processing under CFS.

      This manuscript reports the results of a nonhuman-primate study (N=2 behaving macaque monkeys) investigating V1 responses under continuous flash suppression (CFS). The results show that CFS substantially suppressed V1 orientation responses, albeit slightly differently in the two monkeys. The authors conclude that CFS-suppressed orientation information "may not suffice for high-level visual and cognitive processing" (abstract).

      The manuscript is clearly written and well-organized. The conclusions are supported by the data and analyses presented (but see disclaimer). However, I believe that the manuscript would benefit from a more detailed discussion of the different results observed for monkeys A and B (i.e., inter-individual differences), and how exactly the observed results are related to findings of higher-order cognitive processing under CFS, on the one hand, and the "dorsal-ventral CFS hypothesis", on the other hand.

      Major Comments:

      (1) Some references are imprecise. For example, l.53: "Nevertheless, two fMRI studies reported that V1 activity is either unaffected or only weakly affected (Watanabe et al., 2011; Yuval-Greenberg & Heeger, 2013)". "To the best of my understanding, the second study reaches a conclusion that is entirely opposite to that of the first, specifically that for low-contrast, invisible stimuli, stimulus-evoked fMRI BOLD activity in the early visual cortex (V1-V3) is statistically indistinguishable from activity observed during stimulus-absent (mask-only) trials. Therefore, high-level unconscious processing under CFS should not be possible if Yuval-Greenberg & Heeger are correct. The two studies contradict each other; they do not imply the same thing.

      (2) Line 354: "The flashing masker was a circular white noise pattern with a diameter of 1.89{degree sign}{degree sign}, a contrast of 0.5, and a flickering rate of 10 Hz. The white noise consisted of randomly generated black and white blocks (0.07 × 0.07 each)." Why did the authors choose a white noise stimulus as the CFS mask? It has previously been shown that the depth of suppression engendered by CFS depends jointly on the spatiotemporal composition of the CFS and the stimulus it is competing with (Yang & Blake, 2012). For example, Hesselmann et al. (2016) compared Mondrian versus random dot masks using the probe detection technique (see Supplementary Figure S4 in the reference below) and found only a poor masking performance of the random dot masks.

      Yang, E., & Blake, R. (2012). Deconstructing continuous flash suppression. Journal of Vision, 12(3), 8. https://doi.org/10.1167/12.3.8

      Hesselmann, G., Darcy, N., Ludwig, K., & Sterzer, P. (2016). Priming in a shape task but not in a category task under continuous flash suppression. Journal of Vision, 16, 1-17.

      (3) Related to my previous point: I guess we do not know whether the monkeys saw the CF-suppressed grating stimuli or not? Therefore, could it be that the differences between monkey A and B are due to a different individual visibility of the suppressed stimuli? Interocular suppression has been shown to be extremely variable between participants (see reference below). This inter-individual variability may, in fact, be one of the reasons why the CFS literature is so heterogeneous in terms of unconscious cognitive processing: due to the variability in interocular suppression, a significant amount of data is often excluded prior to analysis, leading to statistical inconsistencies. Moreover, the authors' main conclusion (lines 305-307) builds on the assumption that the stimuli were rendered invisible, but isn't this speculation without a measure of awareness?

      Yamashiro, H., Yamamoto, H., Mano, H., Umeda, M., Higuchi, T., & Saiki, J. (2014). Activity in early visual areas predicts interindividual differences in binocular rivalry dynamics. Journal of Neurophysiology, 111(6), 1190-1202. https://doi.org/10.1152/jn.00509.2013

      (4) The authors refer to the "tool priming" CFS studies by Almeida et al. (l.33, l.280, and elsewhere) and Sakuraba et al. (l.284). A thorough critique of this line of research can be found here:

      Hesselmann, G., Darcy, N., Rothkirch, M., & Sterzer, P. (2018). Investigating Masked Priming Along the "Vision-for-Perception" and "Vision-for-Action" Dimensions of Unconscious Processing. Journal of Experimental Psychology. General. https://doi.org/10.1037/xge0000420

      This line of research ("dorsal-ventral CFS hypothesis") has inspired a significant body of behavioral and fMRI/EEG studies (see reference for a review below). The manuscript would benefit from a brief paragraph in the discussion section that addresses how the observed results contribute to this area of research.

      Ludwig, K., & Hesselmann, G. (2015). Weighing the evidence for a dorsal processing bias under continuous flash suppression. Consciousness and Cognition, 35, 251-259. https://doi.org/10.1016/j.concog.2014.12.010

  3. bafybeihwigujdzh7xrbwmf2t2zv5eku6cr3reb5qzqmhgrpnfdd2ryhh7y.ipfs.dweb.link bafybeihwigujdzh7xrbwmf2t2zv5eku6cr3reb5qzqmhgrpnfdd2ryhh7y.ipfs.dweb.link
    1. Note: This response was posted by the corresponding author to Review Commons. The content has not been altered except for formatting.

      Learn more at Review Commons


      Reply to the reviewers

      Reviewer #1

      1. First, the authors have not convincingly shown that skin cells, or more specifically skin ECs, are a major source of circulating G-CSF in the psoriasis model as stated in the title and abstract. The data in Figure 4 show selective upregulation of Csf3 gene in skin ECs and their ability to secrete G-CSF upon IMQ treatment in vitro. However, the provided data do not address to what degree the skin EC-derived G-CSF contributes to the elevated level of circulating G-CSF. Additional experiments to selectively deplete G-CSF in skin ECs, or at least in skin cells of the affected site, are warranted to support the authors' claim. Does intradermal injection of G-CSF neutralizing antibody into the psoriatic skin reduce circulating levels of G-CSF?

      Author's response:

      Thank you for reviewer's comment. We agree with the Reviewer#1 that it is important to directly block G-CSF to the skin via intradermal injection and measure the G-CSF level in the serum afterwards. Therefore, we will perform intradermal injection of IgG-isotype or anti-G-CSF antibody into the IMQ-induced psoriatic mice.

      Another concern is insufficient demonstration of G-CSF-mediated emergency granulopoiesis in the psoriasis model. All data in Figure 5 were obtained from experiments with only n=3, and adding more replicates, in particular to those in Figure 5B, which show quite some variation in MPP numbers, is recommended. The relatively small reduction of BM granulocyte numbers (Figure 5C) compared to greater depletion of circulating granulocytes (Figure S5A) raises the possibility that it is the mobilization effect rather than granulopoiesis-stimulating effect that skin-derived G-CSF exerts to promote supply of circulating neutrophils that eventually infiltrate into the affected skin. This could also explain the negligible effect of IL-1blockade (Figure S4), which selectively shut off myelopoiesis-stimulating effect of IL-1 (Pietras et al. Nat Cell Biol 2016, PMID: 27111842). Are the HSPCs in the psoriasis model more cycling? Do they show myeloid-skewed differentiation when cultured ex vivo or upon transplantation?

      Author's response: Thank you for these critical comments. We agree to do the following experiments to address them:

      1) HSPCs quantification in Figure 5 especially the MPPs will be added with more replicates.

      2) We will assess cycling status of HSPCs by flow cytometric analysis of Ki67and Propidium Iodide to characterize G0, G1 and G2/M cell cycle phase.

      3) To test myeloid-skewed differentiation, Lin- c-Kit+ Sca-1+ cells containing HSPCs will be isolated from bone marrow of Vas/IMQ-treated mice and transplanted into lethally irradiated syngeneic mice.

      The authors' claim that skin-derived G-CSF "induces" neutrophil infiltration warrants further clarification. Alternative explanation is that the upregulated neutrophil-attracting chemokines (Figure S1D) could induce infiltration, whereas G-CSF increase the number of neutrophils to circulate in the vessels near the psoriatic skin. This notion seems supported elsewhere (Moos et al. J Invest Dermatol. 2019, PMID: 30684554). Can the infiltration be inhibited by systemically injecting neutralizing antibody of their receptor, CXCR2?

      Author's response: The manuscript focuses on the skin-derived G-CSF function as a long-distance signal for emergency granulopoiesis in the bone marrow upon psoriasis, not the chemoattractant property of it. The sentence of interest is "We found that upon psoriasis induction, skin-resident endothelial cells are activated to produce G-CSF which activates emergency granulopoiesis in bone marrow and induces cutaneous infiltration and accumulation of neutrophil that are functionally inflammatory." in line 28-30. In agreement with point #2 from Reviewer#2, the fact that neutrophil recruitment factors (CXCL1, CXCL2, and CXCL5) were upregulated in psoriatic skin (Figure S1D), suggesting a CXCL-mediated neutrophil recruitment. The sentence of concern need to be changed to "We found that upon psoriasis induction, skin-resident endothelial cells are activated to produce G-CSF which activates emergency granulopoiesis in bone marrow, leading to cutaneous accumulation of neutrophil that are functionally inflammatory.". This revised sentence has omitted the proposal that G-CSF directly dictates neutrophils mobilization to the skin, which is not the key message of the study. Therefore, we found that the CXCR2 (CXCLs receptor) blockade experiment may be of the benefit of future studies.

      It remains unclear how skin-derived G-CSF accumulates pathogenic neutrophils. The authors state "pathogenic granulopoiesis," but are the circulating neutrophils in the psoriatic mice already "pathogenic" or do they acquire pathogenic phenotype after cutaneous infiltration? Additional RNA-seq to compare circulating and infiltrated neutrophils would answer this question.

      Author's response: We appreciate this valuable comment. We will perform RNA-seq with the peripheral blood-circulating neutrophils (CD45+ CD11b+ Ly6G+ Ly6Cmid) versus skin-infiltrating neutrophils from both Vas/IMQ mice.

      In addition, how the accumulated pathogenic neutrophils exacerbate the psoriatic changes remains obscure. Although the authors have attempted to correlate Il17a gene expression in infiltrated neutrophils with psoriatic skin changes, the data do not address to what degree it contributes to cutaneous IL-17A protein levels. The data that cutaneous neutrophil depletion leads to subtle decrease in skin IL-17A expression (Figure 2H) rather supports alternative possibilities. For instance, as indicated elsewhere, IL-17A cutaneous tone could be enhanced by neutrophil-mediated augmentation of Th17 or gamma/delta T cell function (Lambert et al. J Invest Dermatol. 2019, PMID: 30528823). Does neutrophil depletion or G-CSF neutralization alter cell numbers or function of cutaneous Th17 and gamma/delta T cells?

      Author's response: Thank you for this insightful comment. To better understand the relative contribution of neutrophils to the cutaneous IL-17A tone in the psoriatic skin, we will perform flowcytometric analysis of Th17 and gamma/delta T cells which are widely known as the major source of IL-17 in psoriatic skin of IMQ-induced mice following injection of isotype-matched or anti-Ly6G antibody.

      Finally, as the above conclusions rely solely on the IMQ-induced acute psoriasis model, it would be informative if they could be derived from another psoriasis model. IMQ is known to induce unintended systemic inflammation due to grooming-associated ingestion (Gangwar et al. J Invest Dermatol. 2022, PMID: 34953514), and "pathological crosstalk between skin and BM in psoriatic inflammation" could be strengthened by an intradermal injection model.

      Author's response: We appreciate the reviewer for bringing this important point. Regarding the systemic inflammation upon psoriasis, the above-cited study reported increased IFN-B expression in the intestines of IMQ-ingested animal (Grine L et al. Sci Rep. 2016, PMID: 26818707 in Gangwar et al. J Invest Dermatol. 2022, PMID: 34953514). We examined several pro-inflammatory cytokines including IFN-b, IFN-g, and IL-6 and in contrast, found no systemic increase in all these cytokines, except for IFN-g downregulation (Explanation Figure 1), which suggests no evidence of grooming-associated ingestion.

      We also examined the Csf3 expression across several distinctively located tissues which showed a selective upregulation in the skin (Figure 4C), suggesting a skin-restricted perturbation. In addition, one study showed that IMQ-ingestion didn't alter number of gut injury-associated CXCR3+ macrophages nor did it aggravate skin inflammation (Pinget et al. Cell Reports. 2022, PMID: 35977500). Together, these findings support that IMQ-induced psoriasis by topical cutaneous application used in our study elicit a local inflammation but not systemic inflammation.

      The authors, however, realize that testing alternative psoriasis model such as intradermal injection of IL-23 (Chan et al. J Exp Med. 2006, PMID: 17074928) will strengthen the skin-local insults within the psoriasis model employed, and should be tested in the future.

      Minor comments

      Figure 1E shows multiple elongated Ly6G+ structures in d0-2 control and d0 IMQ skins that do not appear to be neutrophils.

      Author's response: We appreciate the Reviewer#1 pointing this issue. As mentioned by the Reviewer#1, the elongated structures detected in the intravital microscopy are not neutrophils, but autofluorescence from the skin bulge regions (Wun et al. J Invest Dermatol. 2005, PMID: 15816847). We have eliminated these unspecific signals from the transformation and quantification (Figure 1F, S1G, and S1H). We will also add an explanatory sentence in Materials and Methods section "Of note, the fluorescent signal with elongated structures resembling hair bulge were autofluorescence and thus removed from further analysis." to be more precise about our methods.

      In Figure 2C, the bottom GSEA seems to be showing type II IFN response, not type I IFN, according to the text.

      Author's response: Thank you for the comment, we will correct this misspelling.

      Author's response: We appreciate that Reviewer#1 bring up this point. We examined the kinetics of the bone marrow cellularity and GMPs across 4 days of psoriasis induction in mice. The bone marrow cell number was lowered along that span with lowermost count at 2 days. Consistent to the BM-cellularity, the GMP number was also lowered about one-third in the first 2 days of psoriasis. This kinetic is consistent with the previous report showing a rapid reduction of GMPs in the bone marrow within 2 days following systemic G-CSF administration driven emergency granulopoiesis (Hirai et al. Nat. Immunol. 2006, PMID: 16751774). From 2 days to 4 days, the GMP number rapidly increased to slightly above basal number (Explanation Figure 2). This timely coordinated expansion suggests a significant supply of GMPs from the differentiating upstream myeloid progenitors (Figure 3B).

      When the psoriatic mice with elevated G-CSF is injected with anti-G-CSF or IgG-isotype antibody, the bone marrow cellularity and GMP numbers at 4 days were (Explanation Figure 3). Firstly, as psoriasis reduced bone marrow cellularity (Explanation Figure 2), the unchanged number after anti-G-CSF injection indicates that administration of 10µg/day for 4 days does not significantly affect mobilization of psoriatic bone marrow cells. Secondly, the similar GMP numbers at 4 days psoriasis is plausibly due to snapshot analysis when it has already in the numerical recovery period (Explanation Figure 2). Importantly, the notion that anti-G-CSF injection to psoriatic mice reduced granulocytes in the bone marrow, peripheral blood, and skin suggesting G-CSF as a key mediator in psoriatic driven emergency granulopoiesis on top of unlikely case of ineffective anti-G-CSF treatment.

      Taken together, these data suggest a G-CSF mediated emergency granulopoiesis occurrence in the IMQ-induced psoriasis. We will put these data into a revised Figure.

      In Figures 6B, in which cluster of human skin cells IL-17A expression would be enriched?

      Author's response: Thank you for this important point. The IL-17A expression is found in the T-cell cluster (Explanation Figure 4). We also expected to see IL-17A contribution from other cell subset(s), in particular neutrophil. However, due to the fragile nature of neutrophils and thereby, technical difficulty to get their sequencing reads, this dataset (GSE173706) doesn't contain neutrophils, but rather monocytes, macrophages, and dendritic cells among the myeloid subset (Explanation Figure 5). With this, it leaves open the question on what potential contribution of IL-17A produced by neutrophils is in human psoriasis (Reich et al. Exp. Dermatol. 2015, PMID: 25828362).

      Figure 1E shows multiple elongated Ly6G+ structures in d0-2 control and d0 IMQ skins that do not appear to be neutrophils.

      Author's response: We appreciate the Reviewer#1 pointing this issue. As mentioned by the Reviewer#1, the elongated structures detected in the intravital microscopy are not neutrophils, but autofluorescence from the skin bulge regions (Wun et al. J Invest Dermatol. 2005, PMID: 15816847). We have eliminated these unspecific signals from the transformation and quantification (Figure 1F, S1G, and S1H). We will also add an explanatory sentence in Materials and Methods section "Of note, the fluorescent signal with elongated structures resembling hair bulge were autofluorescence and thus removed from further analysis." to be more precise about our methods.

      In Figure 2C, the bottom GSEA seems to be showing type II IFN response, not type I IFN, according to the text.

      Author's response: Thank you for the comment, we will correct this misspelling.

      Reviewer#2

      1. Interpretation of neutrophil transcriptomic changes (Figure 2)

      The RNA-seq analysis reveals substantial downregulation of several canonical pro inflammatory pathways in neutrophils from psoriatic skin, including IL-6, IL-1, and type II interferon signaling. The authors should discuss the functional relevance of this unexpected transcriptional repression. For example, does this indicate a shift toward specialized effector functions rather than classical cytokine responsiveness? More importantly, the most striking transcriptional change is the upregulation of NADPH oxidase-related genes (e.g., Nox1, Nox3, Nox4, Enox2). This suggests an oxidative stress-driven pathogenic mechanism, potentially more relevant than IL-17A production. Yet this aspect is not explored in the manuscript. Assessing ROS levels or oxidative neutrophil effector functions in this model would considerably strengthen the mechanistic link. Conversely, although IL-17A is upregulated in neutrophils, neutrophil depletion reduces total Il17a expression in skin only partially. This indicates that neutrophils are unlikely to be the dominant IL-17A source in the lesion. The authors' focus on neutrophil-derived IL 17A therefore seems overstated. A more rigorous assessment-e.g., conditional deletion of Il17a specifically in neutrophils-would be required to establish its true contribution. Taken together, the data suggest that oxidative programs, rather than IL-17A production, may represent the principal pathogenic axis downstream of neutrophils, and this deserves deeper discussion.

      Author's response: Thank you for raising this valuable views. We have agreed to address these critical points by the following approaches:

      1) To address the changes in NADPH oxidase-related gene signature, we will measure ROS production in the neutrophils from skin and peripheral blood with DHR123.

      2) Responding to the IL17A contribution by neutrophils, we will flow cytometrically assess the Th17 and gamma/delta T cell population in the skin of psoriatic mice treated with anti-Ly6G or isotype-matched antibody as was suggested by Reviewer#1.

      3) We will discuss downregulation of the canonical pro inflammatory and IL-17 pathways in the psoriatic neutrophils in the discussion.

      Human data reanalysis (Figure 6):

      The re-analysis of bulk and single-cell RNA-seq datasets is valuable but incomplete. Several mechanistically relevant questions could be addressed with the available data:

      2.1. GM-CSF (CSF2) is also strongly upregulated in psoriatic lesions (bulk RNA-seq). It would be informative to determine whether endothelial cells also express CSF2 in the scRNA-seq dataset, as this would suggest coordinated regulation of myeloid-supporting cytokines.

      2.2. Myeloid cell subsets should be examined more closely. A comparison of human myeloid transcriptomes with the mouse neutrophil RNA-seq would clarify whether similar IL-17A-related or NADPH oxidase-related signatures occur in human disease. In particular, which cell types express IL17A in human lesions?

      2.3. Chemokine production should be attributed to specific cell types. Bulk RNA-seq confirms strong induction of CXCL1, CXCL2, CXCL5, but the scRNA-seq dataset allows determining whether these chemokines originate from endothelial cells or other stromal/immune populations. This information is important for defining whether endothelial cells coordinate both neutrophil recruitment and granulopoiesis.

      Addressing these points would make the human-mouse comparison substantially stronger.

      Author's response: Thank you for pointing these important issues. By reanalyzing the dataset, we found several points regarding the comments, as follows:

      2.1) CSF2 is expressed by T-cell cluster in the human skin dataset (Explanation Figure 4), in agreement with previous murine study (Hartwig et al. Cell Reports. 2018, PMID: 30590032). We will add this data in the revised manuscript.

      2.2) In line with point#10 from Reviewer#1, the dataset clearly shows T-cell cluster as the main IL17A source (Explanation Figure 4 above). The dataset, however, doesn't contain phenotypic neutrophils (CEACAM (CD66b) and PGLYRP1) but monocytes, macrophages, and dendritic cells (Explanation Figure 5 above). This loss was probably due to a technical limitation given the difficulty in capturing sequencing reads from fragile neutrophils. Therefore, it is no longer possible to reanalyze IL-17 expression in the absence of neutrophils in the datapool.

      2.3) Reanalysis of CXCLs in the human scRNAseq dataset (GSE173706) clarified their secretion dynamics and cellular sources under normal and psoriatic condition. In normal skin, all examined cell subsets show only low CXCLs expression. In contrast, psoriatic skin exhibits significant CXCLs upregulation with distinct cell subsets clearly showing dramatic upregulation, potentially being the major CXCLs source. CXCL1 is markedly upregulated in fibroblasts, myeloid cells, and melanocyte and nerve cells. CXCL2 is strikingly upregulated to myeloid cells, while CXCL5 is hugely increased in fibroblasts, myeloid cells, and mast cells (Explanation Figure 7). Taken together, these results suggest that CXCLs upregulation in the psoriatic skin is coordinatively executed by both stromal and immune compartments. Of note, the endothelial cells show minimal changes in CXCLs expression, even downregulate CXCL2 in psoriasis, indicating that they are unlikely to be the major contributor to CXCL-mediated neutrophil recruitment.

      **Referees cross-commenting**

      I agree with Reviewer 1 that the contribution of EC-derived G-CSF to circulating G-CSF levels and to emergency myelopoiesis requires additional genetic or neutralization experiments to be fully established.

      Author's response: We appreciate that Reviewer#2 raised this key point. In addition to examining the serum G-CSF upon intradermal anti-G-CSF administration in point#1 from Reviewer#1 above, we will also examine the emergency myelopoiesis signs in vivo.

      Minor points

      1. Line 319: the text likely refers to Figure S4, not S3.

      Author's response: Thank you, we will correct the nomenclature.

      Line 338: "psoriatic" is misspelled.

      Author's response: Thank you, we will change this to "psoriatic".

      Reviewer #3

      • Place the work in the context of the existing literature (provide references, where appropriate).

      Psoriasis is extensively studied, a good recent reference- https://doi.org/10.1016/j.mam.2024.101306

      Author's response: Thank you for Reviewer#3's suggestion. The referenced study highlights the current paradigm that largely focus on skin-restricted mechanism and overlook potential cross-organ interaction in the psoriasis inflammation. Our findings provide a new insight into the skin-bone marrow crosstalk in the disease context. In addition, the suggested reference underscores the key roles of diverse innate immune cells including neutrophils, eosinophils, dendritic cells, etc. which is fundamental for our study and might also guide future exploration of additional innate cell subsets beyond neutrophils. We will therefore include the mentioned reference to our revised manuscript.

      • Do you have suggestions that would help the authors improve the presentation of their data and conclusions?

      It is all good. May add graphical-abstract.

      Author's response: Thank you for the reviewer's input, we agree that a graphical-abstract will help the readers more clearly grasp the key messages of our manuscript. We will include it in the revised manuscript.

      Major comments:

      • Should the authors qualify some of their claims as preliminary or speculative, or remove them altogether?

      No. It is very solid.

      Author's response: We appreciate the reviewer's view that the claims in our paper are solid.

      • Would additional experiments be essential to support the claims of the paper? Request additional experiments only where necessary for the paper as it is, and do not ask authors to open new lines of experimentation.

      Such a discovery clearly opens many options, and it is fascinating to suggest additional experiments for future studies. It is a complete study, best to publish as-is and let many to read and proceed with this new concept.

      Author's response: We thank the reviewer for noting that the current experimental evidence is complete that no additional experiments are necessary at this stage. We agree that the discovery opens prospective directions for future studies.

      • Are the suggested experiments realistic in terms of time and resources? It would help if you could add an estimated cost and time investment for substantial experiments.

      N/A - I suggest no additional experiments at this point. Get it published and see how many will follow this new direction!

      Author's response: We thank the reviewer for recognizing that the experimental data has been sufficient to be a foundation for the future research.

      • Are the data and the methods presented in such a way that they can be reproduced?

      Yes.

      Author's response: We thank the reviewer for recognizing that our methods are reproducible.

      • Are the experiments adequately replicated, and is the statistical analysis adequate?

      Yes. The data are of very high quality.

      Author's response: We are grateful that the reviewer view our replication strategy and statistical analysis are of a high quality.

      Minor comments:

      • Specific experimental issues that are easily addressable.

      None. It is good as-is. One may always suggest minor things- but this one is better published so many laboratories may rush for this new direction. I think it will be interesting studying some long-term impacts, and changes not only of neutrophils but also of other innate cells, such as DCs, Macrophages, and Eosinophils - so it is best to let laboratories that focus on these cells know of the discovery and pursue independent studies.

      Author's response: We appreciate the reviewer's assessment that our paper is already well set for the community to explore the newly proposed direction.

      • Are the text and figures clear and accurate?

      Yes.

      Author's response: We thank the reviewer's evaluation. We have ensured that the text and figures in our manuscript are clear and accurate. Once again, we thank the reviewer for the encouraging and constructive appraisal. We are pleased that the reviewer find the manuscript has already been strong and suitable for publication.

    1. Growth of the mutant lines and wildtype is presented in terms of biomass productivity (BP, gDW L−1 day−1), calculated as the product of their specific growth rate (µ, day−1) and biomass concentration (B, gDW L−1) at the end of the cultivation period, following Equation 1

      Here biomass productivity is calculated as u (growth rate) x B_end, but the more common way to calculate BP is B_end - B_start / time. u x B could overstate productivity and/or make comparisons phase-sensitive. Sometimes those early timepoints may be harder to collect/quantify, but is it known that the cultures are in exponential phase for the duration of the experiment?

    1. Author response:

      The following is the authors’ response to the original reviews.

      Reviewer #1 (Public Review):

      Faiz et al. investigate small molecule-driven direct lineage reprogramming of mouse postnatal mouse astrocytes to oligodendrocyte lineage cells (OLCs). They use a combination of in vitro, in vivo, and computational approaches to confirm lineage conversion and to examine the key underlying transcription factors and signaling pathways. Lentiviral delivery of transcription factors previously reported to be essential in OLC fate determination-Sox10, Olig2, and Nkx2.2-to astrocytes allows for lineage tracing. They found that these transcription factors are sufficient in reprogramming astrocytes to iOLCs, but that the OLCs range in maturity level depending on which factor they are transfected with. They followed up with scRNA-seq analysis of transfected and control cultures 14DPT, confirming that TF-induced astrocytes take on canonical OLC gene signatures. By performing astrocyte lineage fate mapping, they further confirmed that TF-induced astrocytes give rise to iOLCs. Finally, they examined the distinct genetic drivers of this fate conversion using scRNA-seq and deep learning models of Sox10- astrocytes at multiple time points throughout the reprogramming. These findings are certainly relevant to diseases characterized by the perturbation of OLC maturation and/or myelination, such as Multiple Sclerosis and Alzheimer's Disease. Their application of such a wide array of experimental approaches gives more weight to their findings and allows for the identification of additional genetic drivers of astrocyte to iOLC conversion that could be explored in future studies. Overall, I find this manuscript thoughtfully constructed and only have a few questions to be addressed. 

      (1) The authors suggest that Sox10- and Olig2- transduced astrocytes result in distinct subpopulations iOLCs. Considering it was discussed in the introduction that these TFs cyclically regulate one another throughout differentiation, could they speculate as to why such varying iOLCs resulted from the induction of these two TFs? 

      We thank the Reviewer for the opportunity to speculate. We hypothesize that Sox10 and Olig2 may induce different OLCs as a result of differential activation of downstream genes within the gene regulatory network, which are important for OPC, committed OLC and mature OL identity [1]. In support of this, we found different expression levels of genes involved in downstream OLC specification networks [1], including Sox6, Tcfl2 and Myrf, at D14 (Author response image 1), following further analysis of our RNA-seq data.

      Author response image 1.

      Expression of OLC regulatory network genes in Sox10- and Olig2- cultures. Violin plots show gene expression levels (log-normalized) of downstream OLC regulatory genes (Sox6, Zeb2, Tcf7l2, Myrf, Zfp488, Nfatc2, Hes5, Id2) between Sox10 and Olig2 treated OLCs at 14 days post transduction. Analysis was performed on oligodendrocyte progenitor and mature oligodendrocyte clusters (from Manuscript Figure 1D, clusters 3 and 8).

      (2) In Figure 1B it appears that the Sox10- MBP+ tdTomato+ cells decreases from D12 to D14. Does this make sense considering MBP is a marker of more mature OLCs? 

      Thank you for this comment. To address this, we compared the number of MBP+tdTomato+ Sox10 cells across reprogramming timepoints. We saw no difference between the number of MBP+tdTomato+ OLs at D12 and D14 (Author response image 2, p = 0.2314). However,  we do see a [nonsignificant] decrease in MBP+tdTomato+ Sox10 cells from D12 to D22 (Manuscript Supplementary Figure 3B, Author response image 2, p= 0.0543), which suggests that culture conditions are not optimal for longer-term cell survival [2], [3], [4].  

      Author response image 2.

      Comparison of Sox10- induced MBP+tdTomato+ iOLCs over time. Quantification of MBP<sup>+</sup>tdTomato<sup>+</sup> iOLs in Sox10 cultures at D8 (n=5), D10 (n=5), D12 (n=5), D14 (n=7) and D22 (n=3) post transduction. Data are presented as mean ± SEM, each data point represents one individual cell culture experiment, Brown-Forsythe and Welch ANOVA on transformed percentages with Dunnett’s T3 multiple comparisons test (*= p<0.05).  

      (3) Previous studies have shown that MBP expression and myelination in vitro occurs at the earliest around 4-6 weeks of culturing. When assessing whether further maturation would increase MBP positivity, authors only cultured cells up to 22 DPT and saw no significant increase. Has a lengthier culture timeline been attempted? 

      We agree with the Reviewer that previous studies of pluripotent stem cell derived (hESCs or iPSCs) have shown MBP+ OLCs in vitro around 4-6 weeks [5], [6], [7]. However,  studies of neural stem cells [8] or fibroblasts [9] conversion show OLC appearance after 7 and 24 days, respectively, demonstrating that OLCs can be generated in vitro within 1-3 weeks of plating. Moreover, as noted above in response to #2, we see fewer MBP+ cells at  22DPT, suggesting that extended time in culture may require additional factors for support. Therefore, we did not attempt longer timepoints. 

      (4) Figure S4D is described as "examples of tdTomatonegzsGreen+OLCmarker+ cells that arose from a tdTomatoneg cell with an astrocyte morphology." The zsGreen+ tdTomato- cell is not convincingly of "astrocyte morphology"; it could be a bipolar OLC. To strengthen the conclusions and remove this subjectivity, more extensive characterizations of astrocyte versus OLC morphology in the introduction or results are warranted. This would make this observation more convincing since there is clearly an overlap in the characteristics of these cell types.  

      We thank the reviewer for this excellent suggestion. To assess astrocyte morphology, we measured the cell size, nucleus size, number of branches and branch thickness of 70 Aldh1l1+tdTomato+ astrocytes in tamoxifen-labelled Aldh1l1-CreERT2;Ai14 cultures (new Supplemental Table 1). To assess OPC morphology, we  performed IHC for PDGFRa in iOLC cultures and measured the same parameters in 70 PDGFRa+ OPCs (new Supplemental Table 1).  We found that astrocytes were characterized by larger branch thickness, cell length and nucleus size, while OPCs showed a larger number of branches (new Supplemental Figure 1, and Author response image 3 below). Based on this framework, the AAV9-GFAP::zsGreen<sup>pos</sup>Aldh1l1-tdTomato<sup>neg</sup> and AAV9-GFAP::zsGreen<sup>pos</sup>Aldh1l1-tdTomato<sup>pos</sup>starting cells tracked fall within the bounds of ‘astrocytes’. We have revised the manuscript to include this more rigorous characterization (Line 119-124, Page 4; Line 307-312, Page 9; Line 323-326, Page 9). We also demonstrate (below) that the GFAP::zsGreen<sup>pos</sup> Aldh1l1-tdTomato<sup>pos</sup> and GFAP::zsGreen<sup>pos</sup>Aldh1l1-tdTomato<sup>neg</sup> starting cell depicted in Figure 2G and Supplemental Figure 5D is consistent with astrocyte morphology (Author response image 3). 

      Author response image 3.

      Morphological characterization of astrocytes, oligodendrocyte lineage cells, and starting cells. Quantification of the (A) cell length, (B) nucleus size, (C) number of branches, and (D) branch thickness iAldh1l1+tdTomato+ and PDGFRα+ OPCs (n= 70 per cell type, data are presented as mean ± SEM). Orange line indicates parameter value for GFAP::zsGreen<sup>pos</sup>Aldh1l1-tdTomato<sup>pos</sup> starting cell in Figure 2G. Green line indicates parameter value for GFAP::zsGreen<sup>pos</sup> Aldh1l1-tdTomato<sup>neg</sup> starting cell in Supplemental Figure 5D.

      Reviewer #2 (Public Review):             

      The study by Bajohr investigates the important question of whether astrocytes can generate oligodendrocytes by direct lineage conversion (DLR). The authors ectopically express three transcription factors - Sox10, Olig2 and Nkx6.2 - in cultured postnatal mouse astrocytes and use a combination of Aldh1|1-astrocyte fate mapping and live cell imaging to demonstrate that Sox10 converts astrocytes to MBP+ oligodendrocytes, whereas Olig2 expression converts astrocytes to PDFRalpha+ oligodendrocyte progenitor cells. Nkx6.2 does not induce lineage conversion. The authors use single-cell RNAseq over 14 days post-transduction to uncover molecular signatures of newly generated iOLs.  

      The potential to convert astrocytes to oligodendrocytes has been previously analyzed and demonstrated. Despite the extensive molecular characterization of the direct astrocyteoligodendrocyte lineage conversion, the paper by Bajohr et al. does not represent significant progress. The entire study is performed in cultured cells, and it is not demonstrated whether this lineage conversion can be induced in astrocytes in vivo, particularly at which developmental stage (postnatal, adult?) and in which brain region. The authors also state that generating oligodendrocytes from astrocytes could be relevant for oligodendrocyte regeneration and myelin repair, but they don't demonstrate that lineage conversion can be induced under pathological conditions, particularly after white matter demyelination. Specific issues are outlined below. 

      We thank the reviewer for this summary. We agree that there are a handful of reports of astrocytelike cells to OLC conversion [10], [11]. However, our study is the first study to confirm bonafide astrocyte to OLC conversion, which is important given the recent controversy in the field of in vivo astrocyte to neuron reprogramming [12]. In addition, the extensive characterization of the molecular timeline of reprogramming, highlights that although conversion of astrocytes is possible by ectopic expression of any of the three factors, the subtypes of astrocytes converted and maturity of OLCs produced may vary depending on the choice of TF delivered. Our findings will inform future in vivo studies of iOLC generation that aim to understand the impact of brain region, age, pathology, and sex, which are especially important given the diversity of astrocyte responses to disease [13], [14], [15].

      (1) The authors perform an extensive characterization of Sox10-mediated DLR by scRNAseq and demonstrate a clear trajectory of lineage conversion from astrocytes to terminally differentiated MBP+ iOLCs. A similar type of analysis should be performed after Olig2 transduction, to determine whether transcriptomics of olig2 conversion overlaps with any phase of sox10 conversion.

      We thank the Reviewer for this excellent comment. We chose to include an in-depth analysis of Sox10 in the manuscript, as Sox10-transduced cultures showed a higher percentage of mature iOLCs compared to Olig2 in our studies. We have added this specific rationale to the manuscript (Line 329-330-Page 9). 

      Nonetheless, we also agree that understanding the underpinnings of Olig2-mediated conversion is important. Therefore, we used Cell Oracle [16] to understand the regulation of cell identity by Olig2.  in silico overexpression of Olig2 in our control time course dataset (D0, D3, D8 and D14) showed cell movement from cluster 1, characterized by astrocyte genes [Mmd2[17], Entpd2[18], H2-D1[19]], towards cluster 5, characterized by OPC genes [Pdgfra[20], Myt1[21]] validating astrocyte to OLC conversion by Olig2 (Author response image 4).

      We hypothesize that reprogramming via Sox10 and Olig2 take different conversion paths to oligodendrocytes for the following reasons. 

      (1) Differential astrocyte gene expression at D14 when cells are exposed to Sox10 and Olig2 (Manuscript Figure 1D-E [Sox10 characterized by Lcn2[19], C3[19]; Olig2 characterized by Slc6a11[22], Slc1a2[23]].

      (2) Differential expression of key OLC gene regulatory network genes at D14 between cells treated with Sox10 and Olig2 (Author response image 1). 

      Author response image 4.

      in silico modeling of Olig2 reprogramming (A) UMAP clustering of Cre control treated cells from 0, 3, 8, and 14 days post transduction (DPT). (B) UMAP clustering from (A) overlayed with timepoint and treatment group. (C) Cell Oracle modeling of predicted cell trajectories following Olig2 knock in (KI), overlaid onto UMAP plot. Arrows indicate cell movement prediction with Olig2 KI perturbation.  

      (2) A complete immunohistochemical characterization of the cultures should be performed at different time points after Sox10 and Olig2 transduction to confirm OL lineage cell phenotypes. 

      We performed a complete immunohistochemical characterization of Ai14 cultures transduced with GFAP::Sox10-Cre and GFAP::Olig2-Cre. This system allows permanent labelling and therefore, enabled the tracking of transduced cells through the process or DLR, which we believe is the most appropriate way to characterize iOLC conversion efficiencies. We then confirmed the conversion of Aldh1l1+ astrocytes in Aldh1l1-CreERT2;Ai14 cultures transduced with GFAP::Sox10-zsGreen and GFAP::Olig2-zsGreen. In this system, GFAP drives the expression of zsGreen, and therefore, may not faithfully track all cells and lead to an underestimate of the numbers of converted cells. For example, iOLCs from Aldh1l1<sup>neg</sup> astrocytes or iOLCs that have lost zsGreen expression following conversion. Therefore we use this system only to confirm astrocyte origin.

      Nonetheless, we appreciate this comment and recognize that there may be differences in conversion efficiencies when analyzing Aldh1l1+ astrocytes versus all transduced cells. Therefore, we have softened the language in the manuscript (see below) regarding Olig2 and Sox10 generating different OLC phenotypes and now claim iOLC generation from both Sox10 and Olig2. We thank the Reviewer for this comment, and believe it has strengthened the discussion. 

      Line 240, Page 7

      Line 261-263, Page 8

      Line 304-307, Page 8/9

      Line 413-414, Page 11

      References

      (1) E. Sock and M. Wegner, “Using the lineage determinants Olig2 and Sox10 to explore transcriptional regulation of oligodendrocyte development,” Dev Neurobiol, vol. 81, no. 7, pp. 892–901, Oct. 2021, doi: 10.1002/dneu.22849.

      (2) B. A. Barres, M. D. Jacobson, R. Schmid, M. Sendtner, and M. C. Raff, “Does oligodendrocyte survival depend on axons?,” Current Biology, vol. 3, no. 8, pp. 489–497, Aug. 1993, doi: 10.1016/0960-9822(93)90039-Q.

      (3) A.-N. Cho et al., “Aligned Brain Extracellular Matrix Promotes Differentiation and Myelination of Human-Induced Pluripotent Stem Cell-Derived Oligodendrocytes,” ACS Appl. Mater. Interfaces, vol. 11, no. 17, pp. 15344–15353, May 2019, doi: 10.1021/acsami.9b03242.

      (4) E. G. Hughes and M. E. Stockton, “Premyelinating Oligodendrocytes: Mechanisms Underlying Cell Survival and Integration,” Front. Cell Dev. Biol., vol. 9, Jul. 2021, doi: 10.3389/fcell.2021.714169.

      (5) M. Ehrlich et al., “Rapid and efficient generation of oligodendrocytes from human induced pluripotent stem cells using transcription factors,” Proc Natl Acad Sci U S A, vol. 114, no. 11, pp. E2243–E2252, Mar. 2017, doi: 10.1073/pnas.1614412114.

      (6) Y. Liu, P. Jiang, and W. Deng, “OLIG gene targeting in human pluripotent stem cells for motor neuron and oligodendrocyte differentiation,” Nat Protoc, vol. 6, no. 5, pp. 640–655, May 2011, doi: 10.1038/nprot.2011.310.

      (7) S. A. Goldman and N. J. Kuypers, “How to make an oligodendrocyte,” Development, vol. 142, no. 23, pp. 3983–3995, Dec. 2015, doi: 10.1242/dev.126409.

      (8) M. Faiz, N. Sachewsky, S. Gascón, K. W. A. Bang, C. M. Morshead, and A. Nagy, “Adult Neural Stem Cells from the Subventricular Zone Give Rise to Reactive Astrocytes in the Cortex after Stroke,” Cell Stem Cell, vol. 17, no. 5, pp. 624–634, Nov. 2015, doi:10.1016/j.stem.2015.08.002.

      (9) F. J. Najm et al., “Transcription factor–mediated reprogramming of fibroblasts to expandable, myelinogenic oligodendrocyte progenitor cells,” Nat Biotechnol, vol. 31, no. 5, pp. 426–433, May 2013, doi: 10.1038/nbt.2561.

      (10) A. Mokhtarzadeh Khanghahi, L. Satarian, W. Deng, H. Baharvand, and M. Javan, “In vivo conversion of astrocytes into oligodendrocyte lineage cells with transcription factor Sox10; Promise for myelin repair in multiple sclerosis,” PLoS One, vol. 13, no. 9, p. e0203785, Sep. 2018, doi: 10.1371/journal.pone.0203785.

      (11) S. Farhangi, S. Dehghan, M. Totonchi, and M. Javan, “In vivo conversion of astrocytes to oligodendrocyte lineage cells in adult mice demyelinated brains by Sox2,” Mult Scler Relat Disord, vol. 28, pp. 263–272, Feb. 2019, doi: 10.1016/j.msard.2018.12.041.

      (12) L.-L. Wang, C. Serrano, X. Zhong, S. Ma, Y. Zou, and C.-L. Zhang, “Revisiting astrocyte to neuron conversion with lineage tracing in vivo,” Cell, vol. 184, no. 21, pp. 5465-5481.e16, Oct. 2021, doi: 10.1016/j.cell.2021.09.005.

      (13) I  Matias, J. Morgado, and F. C. A. Gomes, “Astrocyte Heterogeneity: Impact to Brain Aging and Disease,” Front. Aging Neurosci., vol. 11, Mar. 2019, doi: 10.3389/fnagi.2019.00059.

      (14) N. Habib et al., “Disease-associated astrocytes in Alzheimer’s disease and aging,” Nat Neurosci, vol. 23, no. 6, pp. 701–706, Jun. 2020, doi: 10.1038/s41593-020-0624-8.

      (15)  M. A. Wheeler et al., “MAFG-driven astrocytes promote CNS inflammation,” Nature, vol. 578, no. 7796, pp. 593–599, Feb. 2020, doi: 10.1038/s41586-020-1999-0.

      (16) K. Kamimoto, B. Stringa, C. M. Hoffmann, K. Jindal, L. Solnica-Krezel, and S. A. Morris, “Dissecting cell identity via network inference and in silico gene perturbation,” Nature, vol. 614, no. 7949, pp. 742–751, Feb. 2023, doi: 10.1038/s41586-022-05688-9.

      (17) P. Kang et al., “Sox9 and NFIA coordinate a transcriptional regulatory cascade during the initiation of gliogenesis,” Neuron, vol. 74, no. 1, pp. 79–94, Apr. 2012, doi:10.1016/j.neuron.2012.01.024.

      (18) K. Saito et al., “Microglia sense astrocyte dysfunction and prevent disease progression in an Alexander disease model,” Brain, vol. 147, no. 2, pp. 698–716, Nov. 2023, doi:10.1093/brain/awad358.

      (19) S. A. Liddelow et al., “Neurotoxic reactive astrocytes are induced by activated microglia,” Nature, vol. 541, no. 7638, pp. 481–487, Jan. 2017, doi: 10.1038/nature21029.

      (20) Q. Zhu et al., “Genetic evidence that Nkx2.2 and Pdgfra are major determinants of the timing of oligodendrocyte differentiation in the developing CNS,” Development, vol. 141, no. 3, pp. 548–555, Feb. 2014, doi: 10.1242/dev.095323.

      (21) J. A. Nielsen, J. A. Berndt, L. D. Hudson, and R. C. Armstrong, “Myelin transcription factor 1 (Myt1) modulates the proliferation and differentiation of oligodendrocyte lineage cells,” Mol Cell Neurosci, vol. 25, no. 1, pp. 111–123, Jan. 2004, doi:10.1016/j.mcn.2003.10.001.

      (22) J. Liu, X. Feng, Y. Wang, X. Xia, and J. C. Zheng, “Astrocytes: GABAceptive and GABAergic Cells in the Brain,” Front. Cell. Neurosci., vol. 16, Jun. 2022, doi:10.3389/fncel.2022.892497.

      (23) A. Sharma et al., “Divergent roles of astrocytic versus neuronal EAAT2 deficiency on cognition and overlap with aging and Alzheimer’s molecular signatures,” Proceedings of the National Academy of Sciences, vol. 116, no. 43, pp. 21800–21811, Oct. 2019, doi:10.1073/pnas.1903566116

    1. Author response:

      The following is the authors’ response to the original reviews.

      Reviewer #1 (Public review):

      (1)How is this simplified model representative of what is observed biologically? A bump model does not naturally produce oscillations. How would the dynamics of a rhythm generator interact with this simplistic model?

      Bump models naturally produce sequential activity, and can be engineered to repeat this sequential activity periodically (Zhang, 1996; Samsonovich and McNaughton, 1997; Murray and Escola, 2017). This is the basis for the oscillatory behavior in the model presented here. As we describe in our paper, such a model is consistent with numerous neurobiological observations about cell-type-specific connectivity patterns. The reviewer is, however, correct to point out that our model does not incorporate other key neurobiological features--in particular, intracellular dynamical properties--that have been shown to play important roles in rhythm generation. Our aim in this work is to establish a circuit-level mechanism for rhythm generation, complementary to classical models that rely on intracellular dynamics for rhythm generation. Whether and how these mechanisms work together is something that we plan to explore in future work, and we have added a sentence to the Discussion to this effect.

      (2) Would this theoretical construct survive being expressed in a biophysical model? It seems that it should, but even a simple biological model with the basic patterns of connectivity shown here would greatly increase confidence in the biological plausibility of the theory.

      We thank the reviewer for pointing out this way to strengthen our paper. We implemented the connectivity developed in the rate models in a spiking neuron model which used EI-balanced Poisson noise as input drive. We found that we could reproduce all the main results of our analysis. In particular, with a realistic number of neurons, we observed swimming activity characterized by (i) left-right alternation, (ii) rostal-caudal propagation, and (iii) variable speed control with constant phase lag. The spiking model demonstrates that the connectivity-motif based mechanisms for rhythmogenesis that we propose are robust in a biophysical setting.

      We included these results in the updated manuscript in a new Results subsection titled “Robustness in a biophysical model.”

      (3) How stable is this model in its output patterns? Is it robust to noise? Does noise, in fact, smooth out the abrupt transitions in frequency in the middle range?

      The newly added spiking model implementation of the network demonstrates that the core mechanisms of our models are robust to noise,  since the connectivity is randomly chosen and the input drive is Poisson noise.

      To test the effect of noise as it is parametrically varied, we also added noise directly to the rate models in the form of white noise input to each unit. Namely, the rate model was adapted to obey the stochastic differential equation

      \[

      \tau_i \frac{dr_i(t)}{dt} = -r_i(t) + \left[ \sum_j W_{ij} r_j(t - \Delta_{ij}) + D_i + \sigma\xi_t \right]_+

      \]

      Here $\xi_t$ is a standard Gaussian white noise and $\sigma$ sets the strength of the noise. We found that the swimming patterns were robust at all frequencies up to $\sigma =  0.05$. Above this level, coherent oscillations started to break down for some swim frequencies. To investigate whether the noise smoothed out abrupt transitions, we swept through different values of noise and modularity of excitatory connections. The results showed very minor improvement in controllability (see figure below), but this was not significant enough to include in the manuscript.

      Author response image 1.

      (4) All figure captions are inadequate. They should have enough information for the reader to understand the figure and the point that was meant to be conveyed. For example, Figure 1 does not explain what the red dot is, what is black, what is white, or what the gradations of gray are. Or even if this is a representative connectivity of one node, or if this shows all the connections? The authors should not leave the reader guessing.

      All figure captions have been updated to enhance clarity and address these concerns.

      Reviewer #2 (Public review):

      (1) Figure 1A, if I interpret Figure 1B correctly, should there not be long descending projections as well that don't seem to be illustrated?

      Thank you for highlighting this potential point of confusion. The diagram in question was only intended to be a rough schematic of the types of connections present in the model. We have added additional descending connections as requested

      (2)Page 5, It would be good to define what is meant by slow and fast here, as this definition changes with age in zebrafish (what developmental age)?

      We have updated the manuscript to include the sentence: “These values were chosen to coincide with observed ranges from larval zebrafish.” with appropriate citation.

      Reviewer #3 (Public review):

      (1) The authors describe a single unit as a neuron, be it excitatory or inhibitory, and the output of the simulation is the firing rate of these neurons. Experimentally and in other modeling studies, motor neurons are incorporated in the model, and the output of the network is based on motor neuron firing rate, not the interneurons themselves. Why did the authors choose to build the model this way?

      We chose to leave out the motor neurons from our models for a few reasons. While motor neurons read out the rhythmic activity generated by the interneurons and may provide some feedback, they are not required for rhythmogenesis. In fact, interneuron activity (especially in the excitatory V2a neurons (Agha et al., 2024)) is highly correlated with the ventral root bursts within the same segment. This suggests that motor neurons are primarily a local readout of the rhythmic activity of interneurons; therefore, the rhythmic swimming activity can be deduced directly from the interneurons themselves.

      Moreover, there is a lack of experimental observation of the connectivity between all the cell types considered in our model and motor neurons. Hence, it was unclear how we should include them in the model. To address this, we are currently developing a data-driven approach that will determine the proper connectivity between the motor neurons and the interneurons, including intrasegmental connections.

      (2) In the single population model (Figure 1), the authors use ipsilateral inhibitory connections that are long-range in an ascending direction. Experimentally, these connections have been shown to be local, while long-range ipsilateral connections have been shown to be descending. What were the reasons the authors chose this connectivity? Do the authors think local ascending inhibitions contribute to rostrocaudal propagation, and how?

      The long-range ascending ipsilateral inhibitory connections arises from a limitation of our modeling framework. The V1 neurons that provide these connections have been shown experimentally to fire later than other neurons (especially descending V2a  neurons) within the same hemisegment (Jay et al., J Neurosci, 2023); however, our model can only produce synchronized local activity. Hence, we replace local phase offsets with spatial offsets to produce correctly structured recurrent phasic inputs. We are currently investigating a data-driven method for determining intrasegmental connectivity which should be able to produce the local phase offset and address this concern; however, this is beyond the scope of the current paper.

      (3) In the two-population model, the authors show independent control of frequency and rhythm, as has been reported experimentally. However, in these previous experimental studies, frequency and amplitude are regulated by different neurons, suggesting different networks dedicated to frequency and amplitude control. However, in the current model, the same population with the same connections can contribute to frequency or amplitude depending on relative tonic drive. Can the authors please address these differences either by changes in the model or by adding to the Discussion?

      Our prior  experimental results that suggested a separation of frequency and amplitude control circuits focus on motor neuron recruitment, instead of interneuron activity (Jay et al., J Neurosci 2023; Menelaou and McLean, Nat Commun 2019). To avoid potential confusion about amplitudes of interneurons vs. of motor neurons, we have removed the results from Figure 3 about control of amplitude in the 2-population model, instead focusing this figure on the control of frequency via speed-module recruitment. For the same reason, we have removed the panel showing the effects of targeted ablations on interneuron amplitudes in Figure 7. We have kept the result about amplitude control in our Supplemental Figure S2 for the 8-population model, but we try to make it clear in the text that any relationship between interneuron amplitude and motor neuron amplitude would depend on how motor neurons are modeled, which we do not pursue in this work.

      (4) It would be helpful to add a paragraph in the Discussion on how these results could be applicable to other model systems beyond zebrafish. Cell intrinsic rhythmogenesis is a popular concept in the field, and these results show an interesting and novel alternative. It would help to know if there is any experimental evidence suggesting such network-based propagation in other systems, invertebrates, or vertebrates.

      We have expanded a paragraph in the Discussion to address these questions. In particular, we highlight how a recent study of mouse locomotor circuits produced a model with similar key features (Komi et al., 2024). These authors made direct use of experimentally determined connectivity structure and cell-type distributions, which informed a model that produced purely network-based rhythmogenesis. We also point out that inhibition-dominated connectivity has been used for understanding oscillatory behavior in neural circuits outside the context of motor control (Zhang, 1996; Samsonovich and McNaughton, 1997; Murray and Escola, 2017). Finally, we address a study that used the cell-type specific connectivity within the C. Elegans locomotor circuit as the architecture for an artificial motor control system and found that the resulting system could more efficiently learn motor control tasks than general machine learning architectures (Bhattasali et al. 2022). Like our model, the Komi et al. and Bhattasali et al. models generate rhythm via structured connectivity motifs rather than via intracellular dynamical properties, suggesting that these may be a key mechanism underlying locomotion across species.

      Reviewer #1 (Recommendations for the authors):

      (1) Express this modeling construct in a simple biophysical model.

      See the new Results subsection titled “Robustness in a biophysical model.”

      (2) Please cite the classic models of Kopell, Ermentrout, Williams, Sigvardt etc., especially where you say "classic models".

      We have added relevant citations including the mentioned authors.

      (3) "Rhythmogenesis remain incompletely understood" changed to "Rhythmogenesis remains incompletely understood".

      We chose not to make this change since the ‘remain’ refers to the plural ‘core mechanisms’ not the singular ‘rhythmogenesis’.

      Reviewer #3 (Recommendations for the authors):

      (1) The figures are well made; however, it would help to add more details to the figure legends. For example, what neuron's firing rate is shown in Figure 1C? What is the red dot in 1B? Figures 3E,F,G: what is being plotted? Mean and SD? Blue dot in Figure 5C?

      All figure captions have been updated to enhance clarity and address these concerns.

      (2) A, B text missing in Figure 7.

      We have revised this figure and its caption; please see our response to Comment 3 above.

      (3) It would be nice to see the tonic drive pattern that is fed to the model for each case, along with the different firing rates in the figures. It would help understand how the tonic drive is changed to rhythmic activity.

      The tonic drive in the rate models is implemented as a constant excitatory input that is uniform across all units within the same speed-population. There is no patterning in time or location to this drive.

      References

      (1) Moneeza A Agha, Sandeep Kishore, and David L McLean. Cell-type-specific origins of locomotor rhythmicity at different speeds in larval zebrafish. eLife, July 2024

      (2) Nikhil Bhattasali, Anthony M Zador, and Tatiana Engel. Neural circuit architectural priors for embodied control. In S. Koyejo, S. Mohamed, A. Agarwal, D. Belgrave, K. Cho, and A. Oh, editors, Advances in Neural Information Processing Systems, volume 35, pages 12744–12759. Curran Associates, Inc., 2022.

      (3) Salif Komi, August Winther, Grace A. Houser, Roar Jakob Sørensen, Silas Dalum Larsen, Madelaine C. Adamssom Bonfils, Guanghui Li, and Rune W. Berg. Spatial and network principles behind neural generation of locomotion. bioRxiv, 2024

      (4) James M Murray and G Sean Escola. Learning multiple variable-speed sequences in striatum via cortical tutoring. eLife, 6:e26084, May 2017.

      (5) Alexei Samsonovich and Bruce L McNaughton. Path integration and cognitive mapping in a continuous attractor neural network model. Journal of Neuroscience, 17(15):5900–5920, 1997.

      (6) K Zhang. Representation of spatial orientation by the intrinsic dynamics of the head-direction cell ensemble: a theory. Journal of Neuroscience, 16(6):2112–2126, 1996.

    1. Author response:

      The following is the authors’ response to the original reviews.

      Reviewer #1 (Public review):

      In the Late Triassic and Early Jurassic (around 230 to 180 Ma ago), southern Wales and adjacent parts of England were a karst landscape. The caves and crevices accumulated remains of small vertebrates. These fossil-rich fissure fills are being exposed in limestone quarrying. In 2022 (reference 13 of the article), a partial articulated skeleton and numerous isolated bones from one fissure fill of end-Triassic age (just over 200 Ma) were named Cryptovaranoides microlanius and described as the oldest known squamate - the oldest known animal, by some 20 to 30 Ma, that is more closely related to snakes and some extant lizards than to other extant lizards. This would have considerable consequences for our understanding of the evolution of squamates and their closest relatives, especially for their speed and absolute timing, and was supported in the same paper by phylogenetic analyses based on different datasets.

      In 2023, the present authors published a rebuttal (reference 18) to the 2022 paper, challenging anatomical interpretations and the irreproducible referral of some of the isolated bones to Cryptovaranoides. Modifying the datasets accordingly, they found Cryptovaranoides outside Squamata and presented evidence that it is far outside. In 2024 (reference 19), the original authors defended most of their original interpretation and presented some new data, some of it from newly referred isolated bones. The present article discusses anatomical features and the referral of isolated bones in more detail, documents some clear misinterpretations, argues against the widespread but not justifiable practice of referring isolated bones to the same species as long as there is merely no known evidence to the contrary, further argues against comparing newly recognized fossils to lists of diagnostic characters from the literature as opposed to performing phylogenetic analyses and interpreting the results, and finds Cryptovaranoides outside Squamata again.

      Although a few of the character discussions and the discussion of at least one of the isolated bones can probably still be improved (and two characters are addressed twice), I see no sign that the discussion is going in circles or otherwise becoming unproductive. I can even imagine that the present contribution will end it.

      We appreciate the positive response from reviewer 1!

      Reviewer #2 (Public review):

      Congratulations on this thorough manuscript on the phylogenetic affinities of Cryptovaranoides.

      Thank you.

      Recent interpretations of this taxon, and perhaps some others, have greatly changed the field's understanding of reptile origins- for better and (likely) for worse.

      We agree, and note that while it is possible for challenges to be worse than the original interpretations, both the original and subsequent challenges are essential aspects of what make science, science.

      This manuscript offers a careful review of the features used to place Cryptovaranoides within Squamata and adequately demonstrates that this interpretation is misguided, and therefore reconciles morphological and molecular data, which is an important contribution to the field of paleontology. The presence of any crown squamate in the Permian or Triassic should be met with skepticism, the same sort of skepticism provided in this manuscript.

      We agree and add that every testable hypothesis requires skepticism and testing.

      I have outlined some comments addressing some weaknesses that I believe will further elevate the scientific quality of the work. A brief, fresh read‑through to refine a few phrases, particularly where the discussion references Whiteside et al. could also give the paper an even more collegial tone.

      We have followed Reviewer 2’s recommendations closely (see below) and have justified in our responses if we do not fully follow a particular recommendation.

      This manuscript can be largely improved by additional discussion and figures, where applicable. When I first read this manuscript, I was a bit surprised at how little discussion there was concerning both non-lepidosauromorph lepidosaurs as well as stem-reptiles more broadly. This paper makes it extremely clear that Cryptovaranoides is not a squamate, but would greatly benefit in explaining why many of the characters either suggested by former studies to be squamate in nature or were optimized as such in phylogenetic analyses are rather widespread plesiomorphies present in crownward sauropsids such as millerettids, younginids, or tangasaurids. I suggest citing this work where applicable and building some of the discussion for a greatly improved manuscript. In sum:

      (1) The discussion of stem-reptiles should be improved. Nearly all of the supposed squamate features in Cryptovaranoides are present in various stem-reptile groups. I've noted a few, but this would be a fairly quick addition to this work. If this manuscript incorporates this advice, I believe arguments regarding the affinities of Cryptovaranoides (at least within Squamata) will be finished, and this manuscript will be better off for it.

      (2) I was also surprised at how little discussion there was here of putative stem-squamates or lepidosauromorphs more broadly. A few targeted comparisons could really benefit the manuscript. It is currently unclear as to why Cryptovaranoides could not be a stem-lepidosaur, although I know that the lepidosaur total-group in these manuscripts lacks character sampling due to their scarcity.

      We are responding to (1) and (2) together. We agree with the Reviewer that a thorough comparison of Cryptovaranoides to non-lepidosaurian reptiles is critical. This is precisely what we did in our previous study: Brownstein et al. (2023)— see main text and supplementary information therein. As addressed therein, there is a substantial convergence between early lepidosaurs and some groups of archosauromorphs (our inferred position for Cryptovaranoides). Many of those points are not addressed in detail here in order to avoid redundancy and are simply referenced back to Brownstein et al. (2023). Secondly, stem reptiles (i.e., non-lepidosauromorphs and non-archosauromorphs), such as suggested above (millerettids, younginids, or tangasaurids), are substantially more distantly related to Cryptovaranoides (following any of the published hypotheses). As such, they share fewer traits (either symplesiomorphies or homoplasies), and so, in our opinion, we would risk directing losing the squamate-focus of our study.

      We thus respectfully decline to engage the full scope of the problem in this contribution, but do note that this level of detailed work would make for an excellent student dissertation research program.

      (3) This manuscript can be improved by additional figures, such as the slice data of the humerus. The poor quality of the scan data for Cryptovaranoides is stated during this paper several times, yet the scan data is often used as evidence for the presence or absence of often minute features without discussion, leaving doubts as to what condition is true. Otherwise, several sections can be rephrased to acknowledge uncertainty, and probably change some character scorings to '?' in other studies.

      We strongly agree with the reviewer. Unfortunately, the original publication (Whiteside et al., 2021) did not make available the raw CT scan data to make this possible. As noted below in the Responses to Recommendations Section, we only have access to the mesh files for each segmented element. While one of us has observed the specimens personally, we have not had the opportunity to CT scan the specimens ourselves.

      Reviewer #3 (Public review):

      Summary:

      The study provides an interesting contribution to our understanding of Cryptovaranoides relationships, which is a matter of intensive debate among researchers. My main concerns are in regard to the wording of some statements, but generally, the discussion and data are well prepared. I would recommend moderate revisions.

      Strengths:

      (1) Detailed analysis of the discussed characters.

      (2) Illustrations of some comparative materials.

      Thank you for noting the strengths inherent to our study.

      Weaknesses:

      Some parts of the manuscript require clarification and rewording.

      One of the main points of criticism of Whiteside et al. is using characters for phylogenetic considerations that are not included in the phylogenetic analyses therein. The authors call it a "non-trivial substantive methodological flaw" (page 19, line 531). I would step down from such a statement for the reasons listed below:

      (1) Comparative anatomy is not about making phylogenetic analyses. Comparative anatomy is about comparing different taxa in search of characters that are unique and characters that are shared between taxa. This creates an opportunity to assess the level of similarity between the taxa and create preliminary hypotheses about homology. Therefore, comparative anatomy can provide some phylogenetic inferences.

      That does not mean that tests of congruence are not needed. Such comparisons are the first step that allows creating phylogenetic matrices for analysis, which is the next step of phylogenetic inference. That does not mean that all the papers with new morphological comparisons should end with a new or expanded phylogenetic matrix. Instead, such papers serve as a rationale for future papers that focus on building phylogenetic matrices.

      We agree completely. We would also add that not every study presenting comparative anatomical work need be concluded with a phylogenetic analysis.

      Our criticism of Whiteside et al. (2022) and (2024) is that these studies provided many unsubstantiated claims of having recovered synapomorphies between Cryptovaranoides and crown squamates without actually having done so through the standard empirical means (i.e., phylogenetic analysis and ancestral state reconstruction). Both Whiteside et al. (2022) and (2024) indicate characters presented as ‘shared with squamates’ along with 10 characters presented as synapomorphies (10). However, their actual phylogenetically recovered synapomorphies were few in number (only 3) and these were not discussed.

      Furthermore, Whiteside et al. (2022) and (2024) comparative anatomy was restricted to comparing †Cryptovaranoides to crown squamates., based on the assumption that †Cryptovaranoides was a crown squamate and thus only needed to be compared to crown squamates.

      In conclusion, we respectfully, we maintain such efforts are “non-trivial substantive methodological flaw(s)”.

      (2) Phylogenetic matrices are never complete, both in terms of morphological disparity and taxonomic diversity. I don't know if it is even possible to have a complete one, but at least we can say that we are far from that. Criticising a work that did not include all the possibly relevant characters in the phylogenetic analysis is simply unfair. The authors should know that creating/expanding a phylogenetic matrix is a never-ending work, beyond the scope of any paper presenting a new fossil.

      Respectfully, we did not criticize previous studies for including an incomplete phylogeny. Instead, we criticized the methodology behind the homology statements made in Whiteside et al. (2022) and Whiteside et al. (2024).

      (3) Each additional taxon has the possibility of inducing a rethinking of characters. That includes new characters, new character states, character state reordering, etc. As I said above, it is usually beyond the scope of a paper with a new fossil to accommodate that into the phylogenetic matrix, as it requires not only scoring the newly described taxon but also many that are already scored. Since the digitalization of fossils is still rare, it requires a lot of collection visits that are costly in terms of time.

      We agree on all points, but we are unsure of what the Reviewer is asking us to do relative to this study.

      (4) If I were to search for a true flaw in the Whiteside et al. paper, I would check if there is a confirmation bias. The mentioned paper should not only search for characters that support Cryptovaranoides affinities with Anguimorpha but also characters that deny that. I am not sure if Whiteside et al. did such an exercise. Anyway, the test of congruence would not solve this issue because by adding only characters that support one hypothesis, we are biasing the results of such a test.

      We would refer the Reviewer to their section (1) on comparative anatomy. As we and the Reviewer have pointed out, Whiteside et al. did not perform comparative anatomical statements outside of crown Squamata in their original study. More specifically, Whiteside et al. (2022, Fig. 8) presented a phylogeny where Cryptovaranoides formed a clade with Xenosaurus within the crown of Anguimorpha or what they termed “Anguiformes”, and made comparisons to the anatomies of the legless anguids, Pseudopus and Ophisaurus. Whiteside et al. (2024), abandoned “Anguiformes”, maintained comparisons to Pseudopus and emphasized affinities with Anguimorpha (but almost all of their phylogenies as published, they do not recover a monophyletic Angumimorpha unless amphisbaenians and snakes are considered to be anguimorphans. Thus, we agree that confirmation bias was inherent in their studies.

      To sum up, there is nothing wrong with proposing some hypotheses about character homology between different taxa that can be tested in future papers that will include a test of congruence. Lack of such a test makes the whole argumentation weaker in Whiteside et al., but not unacceptable, as the manuscript might suggest. My advice is to step down from such strong statements like "methodological flaw" and "empirical problems" and replace them with "limitations", which I think better describes the situation.

      We agree with the first sentence in this paragraph – there is nothing wrong with proposing character homologies between different taxa based on comparative anatomical studies. However, that is not what Whiteside et al. (2022) and (2024) did. Instead, they claimed that an ad hoc comparison of Cryptovaranoides to crown Squamata confirmed that Cryptovaranoides is in fact a crown squamate and likely a member of Anguimorpha. Their study did not recognize limitations, but rather, concluded that their new taxon pushed the age of crown Squamata into the Triassic.

      As noted by Reviewer 2, such a claim, and the ‘data’ upon which it is based, should be treated with skepticism. We have elected to apply strong skepticism and stringent tests of falsification to our critique.

      Reviewer #1 (Recommendations for the authors):

      (1) Lines 596-598 promise the following: "we provide a long[-]form review of these and other features in Cryptovaranoides that compare favorably with non-squamate reptiles in Supplementary Material." You have kindly informed me that all this material has been moved into the main text; please amend this passage.

      This has been deleted.

      (2) Comments on science

      41: I would rather say "an additional role".

      This has been edited accordingly.

      43: Reconstructing the tree entirely from extant organisms and adding fossils later is how Hennig imagined it, because he was an entomologist, and fossil insects are, on average,e extremely rare and usually very incomplete (showing a body outline and/or wing venation and little or nothing else). He was wrong, indeed wrong-headed. As a historical matter, phylogenetic hypotheses were routinely built on fossils by the mid-1860s, pretty much as soon as the paleontologists had finished reading On the Origin of Species, and this practice has never declined, let alone been interrupted. As a theoretical matter, including as many extinct taxa as possible in a phylogenetic analysis is desirable because it breaks up long branches (as most recently and dramatically shown by Mongiardino Koch & Parry 2020), and while some methods and some kinds of data are less susceptible to long-branch attraction and long-branch repulsion than others, none are immune; and while missing data (on average more common in fossils) can actively mislead parametric methods, this is not the case with parsimony, and even in Bayesian inference the problem is characters with missing data, not taxa with missing data. Some of you have, moreover, published tip-dated phylogenetic analyses. As a practical matter, molecular data are almost never available from fossils, so it is, of course, true that analyses which only use molecular data can almost never include fossils; but in the very rare exceptions, there is no reason to treat fossil evidence as an afterthought.

      We agree and have changed “have become” to “is.”

      49-50, 59: The ages of individual fissure fills can be determined by biostratigraphy; as far as I understand, all specimens ever referred to Cryptovaranoides [13, 19] come from a single fill that is "Rhaetian, probably late Rhaetian (equivalent of Cotham Member, Lilstock Formation)" [13: pp. 2, 15].

      We appreciate this comment; the recent literature, however, suggests that variable ages are implied by the biostratigraphy at the English Fissure Fills, so we have chosen to keep this as is. Also note that several isolated bones were not recovered with the holotype but were discussed by Whiteside et al. (2024). The provenance of these bones was not clearly discussed in that paper.

      59-60: Why "putative"? Just to express your disagreement? I would do that in a less misleading way, for example: "and found this taxon as a crown-group squamate (squamate hereafter) in their phylogenetic analyses." - plural because [19] presented four different analyses of two matrices just in the main paper.

      We have removed this word.

      121-124: The entepicondylar foramen is homologous all the way down the tree to Eusthenopteron and beyond. It has been lost a quite small number of times. The ectepicondylar foramen - i.e., the "supinator" (brachioradialis) process growing distally to meet the ectepicondyle, fusing with it and thereby enclosing the foramen - goes a bit beyond Neodiapsida and also occurs in a few other amniote clades (...as well as, funnily enough, Eusthenopteron in later ontogeny, but that's independent).

      We agree. However, the important note here is that the features on the humerus of Cryptovaranoides are not comparable (differ in location and morphology) to the ent- and ectepondylar foramina in other reptiles, as we discuss at length. As such, we have kept this sentence as is.

      153: Yes, but you [18] mistakenly wrote "strong anterior emargination of the maxillary nasal process, which is [...] a hallmark feature of archosauromorphs" in the main text (p. 14) - and you make the same mistake again here in lines 200-206! Also, the fact [19: Figure 2a-c] remains that Cryptovaranoides did not have an antorbital fenestra, let alone an antorbital fossa surrounding it (a fossa without a fenestra only occurs in some cases of secondary loss of the fenestra, e.g., in certain ornithischian dinosaurs). Unsurprisingly, therefore, Cryptovaranoides also does not have an orbital-as-opposed-to-nasal process on its maxilla [19: Figure 2a-c].

      Line 243-249 (in original manuscript) deal with the emargination of maxillary nasal process (but this does not imply a full antorbital fenestra).  We explicitly state that this feature alone "has limited utility" for supporting archosauromorph affinity.

      158-173: The problem here is not that the capitellum is not preserved; from amniotes and "microsaurs" to lissamphibians and temnospondyls, capitella ossify late, and larger capitella attach to proportionately larger concave surfaces, so there is nothing wrong with "the cavity in which it sat clearly indicates a substantial condyle in life". Instead, the problem is a lack of quantification (...as has also been the case in the use of the exact same character in the debate on the origin of lissamphibians); your following sentence (lines 173-175) stands. The rest of the paragraph should be drastically shortened.

      We appreciate this comment. We note that the ontogenetic variation of this feature is in part the issue with the interpretation provided by Whiteside et al. (2024). The issue is the lack of consistency on the morphology of the capitellum in that study. We are unclear on what the reviewer means by ‘quantification,’ as the character in question is binary. 

      250-252: It's not going to matter here, but in any different phylogenetic context, "sphenoid" would be confusing given the sphenethmoid, orbitosphenoid, pleurosphenoid, and laterosphenoid. I actually recommend "parabasisphenoid" as used in the literature on early amniotes (fusion of the dermal parasphenoid and the endochondral basisphenoid is standard for amniotes).

      We have added "(=parabasisphenoid)" on first use but retain use of sphenoid because in the squamate and archosauromorph literature, sphenoid (or basisphenoid) is used more frequently.

      314-315: Vomerine teeth are, of course, standard for sarcopterygians. Practically all extant amphibians have a vomerine toothrow, for example. A shagreen of denticles on the vomer is not as widespread but still reaches into the Devonian (Tulerpeton).

      We agree, but vomerine teeth are rare in lepidosaurs and archosaurs and occur only in very recent clades e.g. anguids and one stem scincoid. Their presence in amphibians is not directly relevant to the phylogenetic placement of Cryptovaranoides among reptiles.

      372: Fusion was not scored as present in [13], but as unknown (as "partial" uncertainty between states 0 and 1 [19:8]), and seemingly all three options were explored in [19].

      We politely disagree with the reviewer; state 1 is scored in Whiteside et al. (2024).

      377-383: Together with the partially fused NHMUK PV R37378 [13: Figure 4B, C; 19: 8], this is actually an argument that Cryptovaranoides is outside but close to Unidentata. The components of the astragalus fuse so early in extant amniotes that there is just a single ossification center in the already fused cartilage, but there are Carboniferous and Permian examples of astragali with sutures in the expected places; all of the animals in question (Diadectes, Hylonomus, captorhinids) seem to be close to but outside Amniota. (And yet, the astragalus has come undone in chamaeleons, indicating the components have not been lost.) - Also, if NHMUK PV R37378 doesn't belong to a squamate close to Unidentata, what does it belong to? Except in toothless beaks, premaxillary fusion is really rare; only molgin newts come to mind (and age, tooth size, and tooth number of NHMUK PV R37378 are wholly incompatible with a salamandrid).

      The relevance of the astragalus is to the current discussion is unclear as we do not mention this element in our manuscript.  We discuss the fusion in the premaxillae in response to previous comment. 

      471-474: That thing is concave. (The photo is good enough that you can enlarge it to 800% before it becomes too pixelated.) It could be a foramen filled with matrix; it does not look like a grain sticking to the outside of the bone. Also, spell out that you're talking about "suc.fo" in Figure 3j.

      We are also a bit confused about this comment, as we state:

      “Finally, we note here that Whiteside et al. [19] appear to have labeled a small piece of matrix attached to a coracoid that they refer to †C. microlanius as the supracoroacoid [sic] foramen in their figure 3, although this labeling is inferred because only “suc, supracoroacoid [sic]” is present in their figure 3 caption.” (L. 519-522, P. 17). We cannot verify that this structure is concave, as so we keep this text as is.

      476-489: [19] conceded in their section 4.1 (pp. 11-12) that the atlas pleurocentrum, though fused to the dorsal surface of the axis intercentrum as usual for amniotes and diadectomorphs, was not fused to the axis pleurocentrum.

      This is correct, as we note in the MS. The issue is whether these elements are clearly identifiable.

      506-510: [19:12] did identify what they considered a possible ulnar patella, illustrated it (Figure 4d), scored it as unknown, and devoted the entire section 4.4 to it.<br /> 512-523: What I find most striking is that Whiteside et al., having just discovered a new taxon, feel so certain that this is the last one and any further material from that fissure must be referable to one of the species now known from there.

      We agree with these points and believe we have devoted adequate text to addressing them. Note that the reviewer does not recommend any revisions to these sections.

      553: Not that it matters, but I'm surprised you didn't use TNT 1.6; it came out in 2023 and is free like all earlier versions.

      We have kept this as is following the reviewer comment, and because we were interested in replicating the analyses in the previous publications that have contributed to the debate about the identity of this taxon.  For the present simple analyses both versions should perform identically, as the search algorithms for discrete characters are identical across these versions.

      562: Is "01" a typo, or do you mean "0 or 1"? In that case, rather write "0/1" or "{01}".

      This has been corrected to {01}

      (3) Comments on nomenclature and terminology

      55, 56: Delete both "...".

      This has been corrected.

      100: "ent- and ectepicondylar"

      For clarity, we have kept the full words.

      107-108: I understand that "high" is proximal and "low" is distal, but what is "the distal surface" if it is not the articular surface in the elbow joint?

      This has been corrected.

      120: "stem pan-lepidosaurs, and stem pan-squamates"; Lepidosauria and Squamata are crown groups that don't contain their stems

      This has been corrected.

      122, 123: Italics for Claudiosaurus and Delorhynchus.

      This has been corrected.

      130: Insert a space before "Tianyusaurus" (it's there in the original), and I recommend de-italicizing the two genus names to keep the contrast (as you did in line 162).

      This has been corrected.

      130, 131: Replace both "..." by "[...]", though you can just delete the second one.

      This has been corrected.

      174: Not a capitulum, but a grammatically even smaller (double diminutive) capitellum.

      This has been corrected.

      209, 224, Table 1: Both teams have consistently been doing this wrong. It's "recessus scalae tympani". The scala tympani ("ladder/staircase of the [ear]drum") isn't the recess, it's what the recess is for; therefore, the recess is named "recess of the scala tympani", and because there was no word for "of" in Classical Latin ("de" meant "off" and "about"), the genitive case was the only option. (For the same reason, the term contains "tympani", the genitive of "tympanum".)

      This has been corrected.

      415-425: This is a terminological nightmare. Ribs can have (and I'm not sure this is exhaustive): a) two separate processes (capitulum, tuberculum) that each bear an articulating facet, and a notch in between; b) the same, but with a non-articulating web of bone connecting the processes; c) a single uninterrupted elongate (even angled) articulating facet that articulates with the sutured or fused dia- and parapophysis; d) a single round articulating facet. Certainly, a) is bicapitate and d) is unicapitate, but for b) and c) all bets are off as to how any particular researcher is going to call them. This is a known source of chaos in phylogenetic analyses. I recommend writing a sentence or three on how the terms "unicapitate" & "bicapitate" lack fixed meanings and have caused confusion throughout tetrapod phylogenetics, and that the condition seen in Cryptovaranoides is nonetheless identical to that in archosauromorphs.

      This has been added: “This confusion in part stems from the lack of a fixed meaning for uni- and bicapitate rib heads; in any case, †C. microlanius possesses a condition identical to archosauromorphs as we have shown.”  (L.475-477, P.16).

      439-440: Other than in archosaurs, some squamates and Mesosaurus, in which sauropsids are dorsal intercentra absent?

      We are unclear about the relevance of the question to this section. The issue at hand is that some squamate lineages possess dorsal intercentra, so the absence of dorsal intercentra cannot be considered a squamate synapomorphy without the optimization of this feature along a phylogeny (which was not accomplished by Whiteside et al.).

      458: prezygapophyses.

      This has been corrected.

      516: "[...]".

      This has been corrected.

      566: synapomorphies.

      This has been corrected.

      587: Macrocnemus.

      This has been corrected.

      585: I strongly recommend either taking off and nuking the name Reptilia from orbit (like Pisces) or using it the way it is defined in Phylonyms, namely as the crown group (a subset of Neodiapsida). Either would mean replacing "neodiapsid reptiles" with "neodiapsids".

      This has been corrected to “neodiapsids.”

      625: Replace "inclusive clades" by "included clades", "component clades", "subclades", or "parts," for example.

      This has been kept as is because “inclusive clades” is common terminology and is used extensively in, for example, the PhyloCode. 

      659: Please update.

      References are updated.

      Fig. 8: Typo in Puercosuchus.

      This has been corrected.

      (4) Comments on style and spelling

      You inconsistently use the past and the present tense to describe [13, 19], sometimes both in the same sentence (e.g., lines 323 vs. 325). I recommend speaking of published papers in the past tense to avoid ascribing past views and acts to people in their present state.

      This has been corrected to be more consistent throughout the manuscript.

      48: Remove the second comma.

      This has been corrected.

      91: Replace "[13] and WEA24" by "[13, 19]".

      This has been corrected.

      100: Commas on both sides of "in fact" or on neither

      This has been corrected.

      117: I recommend "the interpretation in [19]". I have nothing against the abbreviation "WEA24", but you haven't defined it, and it seems like a remnant of incomplete editing. - That said, eLife does not impose a format on such things. If you prefer, you can just bring citation by author & year back; in that case, this kind of abbreviation would make perfect sense (though it should still be explicitly defined).<br /> 129, 145: Likewise.

      We have modified this [13] and [19] where necessary.

      192-198: Surely this should be made part of the paragraph in lines 158-175, which has the exact same headline?

      This has been corrected.

      200-206: Surely this should be made part of the paragraph in lines 148-156, which has the exact same headline?

      These sections deal with different issues pertaining to the analyses of Whiteside et al. (2024) and so we have kept to organization as is.

      214: Delete "that".

      This has been deleted.

      312: "Vomer" isn't an adjective; I'd write "main vomer body" or "vomer's main body" or "main body of the vomer".

      This has been corrected.

      350: "figured"

      This has been corrected.

      400: Rather, "rearticulated" or "worked to rearticulate"? - And why "several"? Just write "two". "Several" implies larger numbers.

      These issues have been corrected.

      448, 500: As which? As what kind of feature? I'm aware that "as such" is fairly widely used for "therefore", but it still confuses me every time, and I have to suspect I'm not the only one. I recommend "therefore" or "for this reason" if that is what you mean.

      “As such” has been deleted.

      452: Adobe Reader doesn't let me check, but I think you have two spaces after "of".

      This has been corrected.

      514, 539, 546, 552, 588, Fig. 3, 5, 6, Table 1: "WEA24" strikes again.

      This has been corrected.

      515: Remove the parentheses.

      This has been corrected.

      531: Insert a space after the period.

      This has been corrected.

      532: Remove both commas and the second "that".

      This has been corrected.

      538: Remove the comma.

      This has been kept as is because changing it would render the sentence grammatically incorrect.

      545: "[...]" or, better, nothing.

      This has been corrected.

      547: Spaces on both sides of the dash or on neither (as in line 553).

      This has been corrected.

      552: Rather, "conducted a parsimony analysis".

      This has been corrected.

      556: Space after "[19]".

      This has been corrected.

      560: Comma after "narrow".

      This has been corrected.

      600: Comma after "above" to match the one in the preceding line - there's an insertion in the sentence that must be flanked by commas on both sides.

      This has been corrected.

      603: Compound adjectives like "alpha-taxonomic" need a hyphen to avoid tripping readers up.

      This has been corrected.

      612: Similarly, "ancestral-state reconstruction" needs one to make immediately clear it isn't a state reconstruction that is ancestral but a reconstruction of ancestral states.

      This has been corrected.

      613: If you want to keep this comma, you need to match it with another after "Cryptovaranoides" in line 611.

      We have kept this as is, because removing this comma would render the sentence grammatically incorrect.

      615: Likewise, you need a comma after "and" because "except for a few features" is an insertion. The other comma is actually optional; it depends on how much emphasis you want to place on what comes after it.

      this has been added.

      622: Comma after "[48, 49]".

      this has been added.

      672: Missing italics and two missing spaces.

      This has been corrected.

      678, 680-681, 693, 700-701, 734, 742, 747, 788, 797, 799, 803, 808, 810-811, 814, 817, 820, 823, 828, 841, 843: Missing italics.

      This has been corrected.

      683, 689: These are book chapters. Cite them accordingly.

      This has been corrected.

      737: Missing DOI.

      No DOI is available.

      793: Missing Bolosaurus major; and I'd rather cite it as "2024" than "in press", and "online early" instead of "n/a".

      This has been corrected.

      835: Hoffstetter, RJ?

      This has been corrected.

      836: Is there something missing?

      This has been corrected.

      839: This is the same reference as number 20 (lines 683-684), and it is miscited in a different way...!

      This has been corrected.

      Reviewer #2 (Recommendations for the authors):

      (1) There is a brief mention of a phylogenetic analysis being re-run, but it is unclear if any modifications (changes in scoring) based on the very observations were made. Please state this explicitly.

      This is explained from lines 600-622, P.20-21, in the section “Apomorphic characters not empirically obtained.”  "In order to check the characters listed by Whiteside et al. [19] (p.19) as “two diagnostic characters” and “eight synapomorphies” in support of a squamate identity for †Cryptovaranoides, we conducted a parsimony analysis of the revised version of the dataset [32] provided by Whiteside et al. [19] in TNT v 1.5 [91]. We used Whiteside et al.’s [19] own data version"

      (2) Line 20: There is almost no discussion of non‑lepidosaur lepidosauromorphs. I suggest including this, as the archosauromorph‑like features reported in Cryptovaranoides appear rather plastic. Furthermore, diagnostic features of Archosauromorpha in other datasets (e.g., Ezcurra 2016 or the works of Spiekman) are notably absent (and unsampled) in Cryptovaranoides. Expanding this comparison would greatly strengthen the manuscript.

      The brief discussion (although not absent) of non-lepidosaur lepidosauromorphs is largely a function of the poor fossil record of this grade. But where necessary, we do discuss these taxa. Also see our previous study (Brownstein et al. 2023) for an extensive discussion of characters relevant to archosauromorphs.

      (3) Line 38: I suggest removing "Archosauromorpha" from the keywords. The authors make a compelling case that Cryptovaranoides is not a squamate, yet they do not fully test its placement within Archosauromorpha (as they acknowledge). Perhaps use "Reptilia" instead?

      We have removed this keyword.

      (4) Line 99: The authors' points here are well made and largely valid. The presence of the ent‑ and ectepicondylar foramina is indeed an amniote plesiomorphy and cannot confirm a squamate identity. Their absence, however, can be informative - although it is unclear whether the CT scans of the humerus are of sufficient resolution, and Figure 4 of Brownstein et al. looks hastily reconstructed (perhaps owing to limited resolution). Moreover, the foramina illustrated by Whiteside do resemble those of other reptiles, albeit possibly over‑prepared and exaggerated.

      The issue with the noted figure is indeed due to poor resolution from the scans. Although we agree with the reviewer, we hesitate to talk about absence in this taxon being phylogenetically informative given the confounding influence of ontogeny.

      (5) I encourage the authors to provide slice data to support the claim that the foramina are absent (which could certainly be correct!); otherwise, the assertion remains unsubstantiated.

      We only have access to the mesh files of segmented bones, not the raw (reconstructed slice) data.

      (6) PLEASE NOTE - because the specimen is juvenile, the apparent absence of the ectepicondylar foramen is equivocal: the supinator process develops through ontogeny and encloses this foramen (see Buffa et al. 2025 on Thadeosaurus, for example).

      See above.

      (7) Line 122: Italicize 'Delorhynchus'

      This has been corrected.

      (8) Lines 131‑132: I'd suggest deleting the final sentence; it feels a little condescending, and your argument is already persuasive.

      This has been corrected.

      (9) Line 129: Please note that owenettid "parareptiles" also lack this process, as do several other stem‑saurians. Its absence is therefore not diagnostic of Squamata.<br /> Also: Such plasticity is common outside the crown. Milleropsis and Younginidae develop this process during ontogeny, even though a lower temporal bar never fully forms.

      We appreciate this point. See discussion later in the manuscript.

      (11) Line 172: Consider adding ontogeny alongside taphonomy and preservation. A juvenile would likely have a poorly developed radial condyle, if any. Acknowledging this possibility will add some needed nuance.

      This sentence has been modified, but we have not added in discussion of ontogeny here because it is not immediately relevant to refuting the argument about inference of the presence of this feature when it is not preserved.

      (12) Line 177: The "septomaxilla" in Whiteside et al. (2024, Figure 1C) resembles the contralateral premaxilla in dorsal view, with the maxillary process on the left and the palatal (or vomerine) process on the right (the dorsal process appears eroded). The foramen looks like a prepalatal foramen, common to many stem and crown reptiles. Consequently, scoring the septomaxilla as absent may be premature; this bone often ossifies late. In my experience with stem‑reptile aggregations, only one of several articulated individuals may ossify this element.

      We agree that presence of a late-ossifying septomaxilla cannot be ruled out, but our point remains (and in agreement with Referee) that scoring the septomaxilla as present based on the amorphous fragments is premature.

      (13) Line 200: Tomography data should be shown before citing it. The posterior margin of the maxilla appears rather straight, and the maxilla itself is tall for an archosauromorph. It would be more convincing to score this feature as present only after illustrating the relevant slices - and, as you note, the trait is widespread among non‑archosauromorphs.

      See above and Brownstein et al. (2023).

      (14) Line 208: Well argued: how could Whiteside et al. confidently assign a disarticulated element? Their "vagus" foramen actually resembles a standard hypoglossal foramen - identical to that seen in many stem reptiles, which often have one large and one small opening.

      Thank you!

      (15) Line 248: Again, please illustrate this region. One cannot argue for absence without showing the slice data. Note that millerettids and procolophonians - contemporaneous with Cryptovaranoides - possess an enclosed vidian canal, so the feature is broadly distributed.

      See above.

      (16) Line 258: The choanal fossa is intriguing: originally created for squamate matrices, yet present (to varying degrees) in nearly every reptile I have examined. It is strongly developed in millerettids (see Jenkins et al. 2025 on Milleropsis and Milleretta) and younginids, much like in squamates - Tiago appropriately scores it as present. Thus, it may be more of a "Neodiapsida + millerettids" character. In any case, the feature likely forms an ordered cline rather than a simple binary state.

      We agree and look forward to future study of this feature.

      (17) Line 283: Bolosaurids are not diapsids and, per Simões, myself, and others, "Diapsida" is probably invalid, at least how it is used here. Better to say "neodiapsids" for choristoderes and "stem‑reptiles" or "sauropsids" for bolosaurids. Jenkins et al.'s placement is largely a function of misidentifying the bolosaurid stapes as the opisthotic.

      We are not entirely clear on this point since bolosaurids are not mentioned in this section.

      (18) Line 298: Here, you note that the CT scans are rather coarse, which makes some earlier statements about absence/presence less certain (e.g., humeral foramina). It may strengthen the paper to make fewer definitive claims where resolution limits interpretation.

      We appreciate this point. However, in the case of the humeral foramina the coarseness of the scans is one reason why we question Whiteside et al. scoring of the presence of these features.

      (19) Line 314: Multiple rows of vomerine teeth are standard for amniotes; lepidosauromorphs such as Paliguana and Megachirella also exhibit them (though they may not have been segmented in the latter's description). Only a few groups (e.g., varanopids, some millerettids) have a single medial row.

      We appreciate this point and have added in those citations into the following added sentence: “Multiple rows of vomerine teeth are common in reptiles outside of Squamata [76]; the presence of only one row is restricted to a handful of clades, including millerettids [77,78], †Tanystropheus [49], and some [79], but not all [71,80] choristoderes.” (L. 360-363, P. 12).

      (20) Line 317: This is likely a reptile plesiomorphy - present in all millerettids (e.g., Milleropsis and Milleretta per Jenkins et al.). Citing these examples would clarify that it is not uniquely squamate. Could it be secondarily lost in archosauromorphs?

      We appreciate this point and have cited Jenkins et al. here. It is out of the scope of this discussion to discuss the polarity of this feature relative to Archosauromorpha.

      (21) Line 336: Unfortunately, a distinct quadratojugal facet is usually absent in Neodiapsids and millerettids; where present, the quadratojugal is reduced and simply overlaps the quadrate.

      We appreciate this point but feel that reviewing the distribution of this feature across all reptiles is not relevant to the text noted.

      (22) Line 357: Pterygoid‑quadrate overlap is likely a tetrapod plesiomorphy. Whiteside et al. do not define its functional or phylogenetic significance, and the overlap length is highly variable even among sister taxa.

      We agree, but in any case this feature is impossible to assess in Cryptovaranoides.

      (23) Line 365: Another well‑written section - clear and persuasive.

      Thank you!

      (24) Line 385: The cephalic condyle is widespread among neodiapsids, so it is not uniquely squamate.

      We agree.

      (25) Character 391: Note that the frontal underlapping the parietal is widespread, appearing in both millerettids and neodiapsids such as Youngina.

      We appreciate this point, but the point here deals with the fact that this feature is not observable in the holotype of Cryptovaranoides.

      (26) Line 415: The "anterior process" is actually common among crown reptiles, including sauropterygians, so it cannot by itself place Cryptovaranoides within Archosauromorpha.

      We agree but also note that we do not claim this feature unambiguously unites Cryptovaranoides with Archosauromorpha.

      (28) Line 460: Yes - Whiteside et al. appear to have relabeled the standard amniote coracoid foramen. Excellent discussion.

      Thank you!

      (29) Line 496: While mirroring Whiteside's structure, discussing this mandibular character earlier, before the postcrania, might aid readability.

      We have chosen to keep this structure as is.

      (30) Lines 486-588: This section oversimplifies the quadrate articulation.

      We are unclear how this is an oversimplification.

      (31) Both Prolacerta and Macrocnemus possess a cephalic condyle and some mobility (though less than many squamates). In Prolacerta (Miedema et al. 2020, Figure 4), the squamosal posteroventral process loosely overlaps the quadrate head.

      We assume this comment refers to the section "Peg-in-notch articulation of quadrate head"; we appreciate clarification that this feature occurs in variable extent outside squamates, but this does not affect our statement that the material of Cryptovaranoides is too poorly preserved to confirm its presence.

      (32) Where is this process in Cryptovaranoides? It is not evident in Whiteside's segmentation of the slender squamosal - please illustrate.

      We are unclear as to which section this comment refers.

      (33) Additionally, the quadrate "conch" of Cryptovaranoides is well developed, bearing lateral and medial tympanic crests; the lateral crest is absent in the cited archosauromorphs.

      We note that no vertebrate has a medial tympanic crest (it is always laterally placed for the tympanic membrane, when present). If this is what the reviewer refers to, this is a feature commonly found across all tetrapods bearing a tympanum attached to the quadrate (e.g., most reptiles), and so it is not very relevant phylogenetically. Regarding its presence in Cryptovaranoides, the lateral margin of the quadrate is broken (Brownstein et al., 2023), so it cannot be determined. This incomplete preservation also makes an interpretation of a quadrate conch very hard to determine. But as currently preserved, there is no evidence whatsoever for this feature.

      (34) Line 591: The cervical vertebrae of Cryptovaranoides are not archosauromorph‑like. Archosauromorph cervicals are elongate, parallelogram‑shaped, and carry long cervical ribs-none of which apply here. As the manuscript lacks a phylogenetic analysis, including these features seems unnecessary. Should they be added to other datasets, I suspect Cryptovaranoides would align along the lepidosaur stem (though that remains to be tested).

      We politely disagree. The reviewer here mentions that the cervical vertebrae of archosauromorphs are generally shaped differently from those in Cryptovaranoides. The description provided (“elongate, parallelogram‑shaped, and carry long cervical ribs-none”) is basically limited to protorosaurians (e.g., tanystropheids, Macrocnemus) and early archosauriforms. We note that archosauromorph cervicals are notoriously variable in shape, especially in the crown, but also among early archosauromorphs. Further, the cervical ribs, are notoriously similar among early archosauromorphs (including protorosaurians) and Cryptovaranoides, as discussed and illustrated in Brownstein et al., 2023 (Figs. 2 and 3), especially concerning the presence of the anterior process.

      Further, we do include a phylogenetic analysis of the matrix provided in Whiteside et al. (2024) as noted in our results section. In any case, we direct the reviewer to our previous study (Brownstein et al., 2023), in which we conduct phylogenetic analyses that included characters relevant to this note.

      Reviewer #3 (Recommendations for the authors):

      (1) The authors should use specimen numbers all over the text because we are talking about multiple individuals, and the authors contest the previous affinity of some of them. For example, on page 16, line 447, they mention an isolated vertebra but without any number. The specimen can be identified in the referenced article, but it would be much easier for the reader if the number were also provided here

      Agreed and added.

      (2) Abstract: "Our team questioned this identification and instead suggested Cryptovaranoides had unclear affinities to living reptiles."

      That is very imprecise. The team suggested that it could be an archosauromorph or an indeterminate neodiapsid. Please change accordingly.

      We politely disagree. We stated in our 2023 study that whereas our phylogenetic analyses place this taxon in Archosauromorpha, it remains unclear where it would belong within the latter. This is compatible with “unclear affinities to living reptiles”.

      (3) Page 7, line 172: "Taphonomy and poor preservation cannot be used to infer the presence of an anatomical feature that is absent." Unfortunate wording. Taphonomy always has to be used to infer the presence or absence of anatomical features. Sometimes the feature is not preserved, but it leaves imprints/chemical traces or other taphonomic indicators that it was present in the organism. Please remove or rewrite the sentence.

      We agree and have modified the sentence to read: “Taphonomy and poor preservation cannot be used alone to justify the inference that an anatomical feature was present when it is not preserved and there is no evidence of postmortem damage. In a situation when the absence of a feature is potentially ascribable to preservation, its presence should be considered ambiguous.” (L. 141-145, P.5).

      (4) Page 4, line 91, please explain "WEA24" here, though it is unclear why this abbreviation is used instead of citation in the manuscript.

      This has been corrected to Whiteside et al. [19].

      (5) Page 6, line 144: "Together, these observations suggest that the presence of a jugal posterior process was incorrectly scored in the datasets used by WEA24 (type (ii) error)." That sentence is unclear. Why did the authors use "suggest"? Does it mean that they did not have access to the original data matrix to check it? If so, it should be clearly stated at the beginning of the manuscript.

      See earlier; this has been modified and “suggest” has been removed.

      (6) Page 7, line 174: "Finally, even in the case of the isolated humerus with a preserved capitulum, the condyle illustrated by Whiteside et al. [19] is fairly small compared to even the earliest known pan-squamates, such as Megachirella wachtleri (Figure 4)." Figure 4 does not show any humeri. Please correct.

      The reference to figure 4 has been removed.

      (7) Page 8, line 195-198: "This is not the condition specified in either of the morphological character sets that they cite [18,38], the presence of a distinct condyle that is expanded and is by their own description not homologous to the condition in other squamates." This is a bit unclear. Could the authors explain it a little bit further? How is the condition that is specified in the referred papers different compared to the Whiteside et al. description?

      We appreciate this comment and have broken this sentence up into three sentences to clarify what we mean:

      “The projection of the radial condyle above the adjacent region of the distal anterior extremity is not the condition specified in either of the morphological character sets that Whiteside et al. [19] cite [18,32]. The condition specified in those studies is the presence of a distinct condyle that is expanded. The feature described in Whiteside et al. [19] does not correspond to the character scored in the phylogenetic datasets.” (L.220-225, P.8).

      (8) Page 16, line 446: "they observed in isolated vertebrae that they again refer to C. microlanius without justification". That is not true. The referred paper explains the attribution of these vertebrae to Cryptovaranoides (see section 5.3 therein). The authors do not have to agree with that justification, but they cannot claim that no justification was made. Please correct it here and throughout the text.

      We have modified this sentence but note that the justification in Whiteside et al. (2024) lacked rigor. Whiteside et al. (2024) state: “Brownstein et al. [5] contested the affinities of three vertebrae, cervical vertebra NHMUK PV R37276, dorsal vertebra NHMUK PV R37277 and sacral vertebra NHMUK PV R37275. While all three are amphicoelous and not notochordal, the first two can be directly compared to the holotype. Cervical vertebra NHMUK PV R37276 is of the same form as the holotype CV3 with matching neural spine, ventral keel (=crest) and the posterior lateral ridges or lamina (figure 3c,d) shown by Brownstein et al. [5, fig. 1a]. The difference is that NHMUK PV R37276 has a fused neural arch to the pleurocentrum and a synapophysis rather than separate diapophysis and parapophysis of the juvenile holotype (figure 3c). Neurocentral fusion of the neural arch and centrum can occur late in modern squamates, ‘up to 82% of the species maximum size’ [28].

      The dorsal surface of dorsal vertebra NHMUK PV R37277 (figure 3e) can be matched to the mid-dorsal vertebra in the †Cryptovaranoides holotype (figure 4d, dor.ve) and has the same morphology of wide, dorsally and outwardly directed, prezygapophyses, downwardly directed postzygapophyses and similar neural spine. It is also of similar proportions to the holotype when viewed dorsally (figures 3e and 4d), both being about 1.2 times longer anteroposteriorly than they are wide, measured across the posterior margin. The image in figure 4d demonstrates that the posterior vertebrae are part of the same spinal column as the truncated proximal region but the spinal column between the two parts is missing, probably lost in quarrying or fossil collection.”

      This justification is based on pointing out the presence of supposed shared features between these isolated vertebrae and those in the holotype of Cryptovaranoides, even though none of these features are diagnostic for that taxon. We have changed the sentence in our manuscript to read:

      “Whiteside et al. [19] concur with Brownstein et al. [18] that the diapophyses and parapophyses are unfused in the anterior dorsals of the holotype of †Cryptovaranoides microlanius, and restate that fusion of these structures is based on the condition they observed in isolated vertebrae that they refer to †C. microlanius based on general morphological similarity and without reference to diagnostic characters of †C. microlanius” (L. 502-507, P. 17).

      (9) Figure 2. The figure caption lacks some explanations. Please provide information about affinity (e.g., squamate/gekkotan), ag,e and locality of the taxa presented. Are these left or right palatines? The second one seems to be incomplete, and maybe it is worth replacing it with something else?

      The figure caption has been modified:

      “Figure 2. Comparison of palatine morphologies. Blue shading indicates choanal fossa. Top image of †Cryptovaranoides referred left palatine is from Whiteside et al. [19]. Middle is the left palatine of †Helioscopos dickersonae (Squamata: Pan-Gekkota) from the Late Jurassic Morrison Formation [62]. Bottom is the right palatine of †Eoscincus ornatus (Squamata: Pan-Scincoidea) from the Late Jurassic Morrison Formation [31].”

      (10) Figure 8. The abbreviations are not explained in the figure caption.

      These have been added.

    1. Reviewer #2 (Public review):

      Summary

      The study investigated whether memory retrieval followed soon by extinction training results in a short-term memory deficit when tested - with a reinstatement test that results in recovery from extinction - soon after extinction training. Experiment 1 documents this phenomenon using a between-subjects design. Experiment 2 used a within-subject control and sees that the effect is also observed in a control condition. In addition, it also revealed that if testing is conducted 6 hours after extinction, there is not effect of retrieval prior to extinction as there is recovery from extinction independently of retrieval prior to extinction. A third Group also revealed that retrieval followed by extinction attenuates reinstatement when the test is conducted 24 hours later, consistent with previous literature. Finally, Experiment 3 used continuous theta-burst stimulation of the dorsolateral prefrontal cortex and assessed whether inhibition of that region (vs a control region) reversed the short-term effect revealed in Experiments 1 and 2. The results of control groups in Experiment 3 replicated the previous findings (short-term effect), and the experimental group revealed that these can be reversed by inhibition of the dorsolateral prefrontal cortex.

      Strengths

      The work is performed using standard procedures (fear conditioning and continuous theta-burst stimulation) and there is some justification of the sample sizes. The results replicate previous findings - some of which have been difficult to replicate and this needs to be acknowledged - and suggest that the effect can also be observed in a short-term reinstatement test.

      The study establishes links between the memory reconsolidation and retrieval-induced forgetting (or memory suppression) literatures. The explanations that have been developed for these are distinct and the current results integrate these, by revealing that the DLPFC activity involved in retrieval-extinction short-term effect. There is thus some novelty in the present results, but numerous questions remain unaddressed.

      Weakness

      The fear acquisition data is converted to a differential fear SCR and this is what is analysed (early vs late). However, the figure shows the raw SCR values for CS+ and CS- and therefore it is unclear whether acquisition was successful (despite there being an "early" vs "late" effect - no descriptives are provided).

      In Experiment 1 (Test results) it is unclear whether the main conclusion stems from a comparison of the test data relative to the last extinction trial ("we defined the fear recovery index as the SCR difference between the first test trial and the last extinction trial for a specific CS") or the difference relative to the CS- ("differential fear recovery index between CS+ and CS-"). It would help the reader assess the data if Fig 1e presents all the indexes (both CS+ and CS-). In addition, there is one sentence which I could not understand "there is no statistical difference between the differential fear recovery indexes between CS+ in the reminder and no reminder groups (P=0.048)". The p value suggests that there is a difference, yet it is not clear what is being compared here. Critically, any index taken as a difference relative to the CS- can indicate recovery of fear to the CS+ or absence of discrimination relative to the CS-, so ideally the authors would want to directly compare responses to the CS+ in the reminder and no-reminder groups. In the absence of such comparison, little can be concluded, in particular if SCR CS- data is different between groups. The latter issue is particularly relevant in Experiment 2, in which the CS- seems to vary between groups during the test and this can obscure the interpretation of the result.

      In experiment 1, the findings suggest that there is a benefit of retrieval followed by extinction in a short-term reinstatement test. In Experiment 2, the same effect is observed to a cue which did not undergo retrieval before extinction (CS2+), a result that is interpreted as resulting from cue-independence, rather than a failure to replicate in a within-subjects design the observations of Experiment 1 (between-subjects). Although retrieval-induced forgetting is cue-independent (the effect on items that are supressed [Rp-] can be observed with an independent probe), it is not clear that the current findings are similar, and thus that the strong parallels made are not warranted. Here, both cues have been extinguished and therefore been equally exposed during the critical stage.

      The findings in Experiment 2 suggest that the amnesia reported in experiment 1 is transient, in that no effect is observed when the test is delayed by 6 hours. The phenomena whereby reactivated memories transition to extinguished memories as a function of the amount of exposure (or number of trials) is completely different from the phenomena observed here. In the former, the manipulation has to do with the number of trials (or total amount of time) that the cues are exposed. In the current Experiment 2, the authors did not manipulate the number of trials but instead the retention interval between extinction and test. The finding reported here is closer to a "Kamin effect", that is the forgetting of learned information which is observed with intervals of intermediate length (Baum, 1968). Because the Kamin effect has been inferred to result from retrieval failure, it is unclear how this can be explained here. There needs to be much more clarity on the explanations to substantiate the conclusions.

      There are many results (Ryan et al., 2015) that challenge the framework that the authors base their predictions on (consolidation and reconsolidation theory), therefore these need to be acknowledged. These studies showed that memory can be expressed in the absence of the biological machinery thought to be needed for memory performance. The authors should be careful about statements such as "eliminate fear memores" for which there is little evidence.

      The parallels between the current findings and the memory suppression literature are speculated in the general discussion, and there is the conclusion that "the retrieval-extinction procedure might facilitate a spontaneous memory suppression process". Because one of the basic tenets of the memory suppression literature is that it reflects an "active suppression" process, there is no reason to believe that in the current paradigm the same phenomenon is in place, but instead it is "automatic". In other words, the conclusions make strong parallels with the memory suppression (and cognitive control) literature, yet the phenomena that they observed is thought to be passive (or spontaneous/automatic). Ultimately, it is unclear why 10 mins between the reminder and extinction learning will "automatically" supress fear memories. Further down in the discussion it is argued that "For example, in the well-known retrieval-induced forgetting (RIF) phenomenon, the recall of a stored memory can impair the retention of related long-term memory and this forgetting effect emerges as early as 20 minutes after the retrieval procedure, suggesting memory suppression or inhibition can occur in a more spontaneous and automatic manner". I did not follow with the time delay between manipulation and test (20 mins) would speak about whether the process is controlled or automatic. In addition, the links with the "latent cause" theoretical framework are weak if any. There is little reason to believe that one extinction trial, separated by 10 mins from the rest of extinction trials, may lead participants to learn that extinction and acquisition have been generated by the same latent cause.

      Among the many conclusions, one is that the current study uncovers the "mechanism" underlying the short-term effects of retrieval-extinction. There is little in the current report that uncovers the mechanism, even in the most psychological sense of the mechanism, so this needs to be clarified. The same applies to the use of "adaptive".

      Whilst I could access the data in the OFS site, I could not make sense of the Matlab files as there is no signposting indicating what data is being shown in the files. Thus, as it stands, there is no way of independently replicating the analyses reported.<br /> The supplemental material shows figures with all participants, but only some statistical analyses are provided, and sometimes these are different from those reported in the main manuscript. For example, the test data in Experiment 1 is analysed with a two-way ANOVA with main effects of group (reminder vs no-reminder) and time (last trial of extinction vs first trial of test) in the main report. The analyses with all participants in the sup mat used a mixed two-way ANOVA with group (reminder vs no reminder) and CS (CS+ vs CS-). This makes it difficult to assess the robustness of the results when including all participants. In addition, in the supplementary materials there are no figures and analyses for Experiment 3.

      One of the overarching conclusions is that the "mechanisms" underlying reconsolidation (long term) and memory suppression (short term) phenomena are distinct, but memory suppression phenomena can also be observed after a 7-day retention interval (Storm et al., 2012), which then questions the conclusions achieved by the current study.

      References:

      Baum, M. (1968). Reversal learning of an avoidance response and the Kamin effect. Journal of Comparative and Physiological Psychology, 66(2), 495.<br /> Chalkia, A., Schroyens, N., Leng, L., Vanhasbroeck, N., Zenses, A. K., Van Oudenhove, L., & Beckers, T. (2020). No persistent attenuation of fear memories in humans: A registered replication of the reactivation-extinction effect. Cortex, 129, 496-509.<br /> Ryan, T. J., Roy, D. S., Pignatelli, M., Arons, A., & Tonegawa, S. (2015). Engram cells retain memory under retrograde amnesia. Science, 348(6238), 1007-1013.<br /> Storm, B. C., Bjork, E. L., & Bjork, R. A. (2012). On the durability of retrieval-induced forgetting. Journal of Cognitive Psychology, 24(5), 617-629.

      Comments on revisions:

      Thanks to the authors for trying to address my concerns.

      (1 and 2) My point about evidence for learning relates to the fact that in none of the experiments an increase in SCR to the CSs+ is observed during training (in Experiment 1 CS+/CS- differences are even present from the outset), instead what happens is that participants learn to discriminate between the CS+ and CS- and decrease their SCR responding to the safe CS-. This begs the question as to what is being learned, given that the assumption is that the retrieval-extinction treatment is concerned with the excitatory memory (CS+) rather than the CS+/CS- discrimination. For example, Figures 6A and 6B have short/Long term amnesia in the right axes, but it is unclear from the data what memory is being targeted. In Figure 6C, the right panels depicting Suppression and Reconsolidation mechanisms suggest that it is the CS+ memory that is being targeted. Because the dependent measure (differential SCR) captures how well the discrimination was learned (this point relates to point 2 which the authors now acknowledge that there are differences between groups in responding to the CS-), then I struggle to see how the data supports these CS+ conclusions. The fact that influential papers have used this dependent measure (i.e., differential SCR) does not undermine the point that differences between groups at test are driven by differences in responding to the CS-.

      (3, 4 and 5) The authors have qualified some of the statements, yet I fail to see some of these parallels. Much of the discussion is speculative and ultimately left for future research to address.

      (6) I can now make more sense of the publicly available data, although the files would benefit from an additional column that distinguishes between participants that were included in the final analyses (passed the multiple criteria = 1) and those who did not (did not pass the criteria = 0). Otherwise, anyone who wants to replicate these analyses needs to decipher the multiple inclusion criteria and apply it to the dataset.

    2. Author response:

      The following is the authors’ response to the previous reviews

      Reviewer #1 (Public review):

      Introduction & Theory

      (1) It is difficult to appreciate why the first trial of extinction in a standard protocol does NOT produce the retrieval-extinction effect. This applies to the present study as well as others that have purported to show a retrieval-extinction effect. The importance of this point comes through at several places in the paper. E.g., the two groups in Study 1 experienced a different interval between the first and second CS extinction trials; and the results varied with this interval: a longer interval (10 min) ultimately resulted in less reinstatement of fear than a shorter interval. Even if the different pattern of results in these two groups was shown/known to imply two different processes, there is nothing in the present study that addresses what those processes might be. That is, while the authors talk about mechanisms of memory updating, there is little in the present study that permits any clear statement about mechanisms of memory. The references to a "short-term memory update" process do not help the reader to understand what is happening in the protocol.

      We agree with the reviewer that whether and how the retrieval-extinction paradigm works is still under debate. Our results provide another line of evidence that such a paradigm is effective in producing long term fear amnesia. The focus of the current manuscript is to demonstrate that the retrieval-extinction paradigm can also facilitate a short-term fear memory deficit measured by SCR. Our TMS study provided some preliminary evidence in terms of the brain mechanisms involved in the causal relationship between the dorsolateral prefrontal cortex (dlPFC) activity and the short-term fear amnesia and showed that both the retrieval interval and the intact dlPFC activity were necessary for the short-term fear memory deficit and accordingly were referred to as the “mechanism” for memory update. We acknowledge that the term “mechanism” might have different connotations for different researchers. We now more explicitly clarify what we mean by “mechanisms” in the manuscript (line 99) as follows:

      “In theory, different cognitive mechanisms underlying specific fear memory deficits, therefore, can be inferred based on the difference between memory deficits.”

      In reply to this point, the authors cite evidence to suggest that "an isolated presentation of the CS+ seems to be important in preventing the return of fear expression." They then note the following: "It has also been suggested that only when the old memory and new experience (through extinction) can be inferred to have been generated from the same underlying latent cause, the old memory can be successfully modified (Gershman et al., 2017). On the other hand, if the new experiences are believed to be generated by a different latent cause, then the old memory is less likely to be subject to modification. Therefore, the way the 1stand 2ndCS are temporally organized (retrieval-extinction or standard extinction) might affect how the latent cause is inferred and lead to different levels of fear expression from a theoretical perspective." This merely begs the question: why might an isolated presentation of the CS+ result in the subsequent extinction experiences being allocated to the same memory state as the initial conditioning experiences? This is not yet addressed in any way.

      As in our previous response, this manuscript is not about investigating the cognitive mechanism why and how an isolated presentation of the CS+ would suppress fear expression in the long term. As the reviewer is aware, and as we have addressed in our previous response letters, both the positive and negative evidence abounds as to whether the retrieval-extinction paradigm can successfully suppress the long-term fear expression. Previous research depicted mechanisms instigated by the single CS+ retrieval at the molecular, cellular, and systems levels, as well as through cognitive processes in humans. In the current manuscript, we simply set out to test that in addition to the long-term fear amnesia, whether the retrieval-extinction paradigm can also affect subjects’ short-term fear memory.

      (2) The discussion of memory suppression is potentially interesting but, in its present form, raises more questions than it answers. That is, memory suppression is invoked to explain a particular pattern of results but I, as the reader, have no sense of why a fear memory would be better suppressed shortly after the retrieval-extinction protocol compared to the standard extinction protocol; and why this suppression is NOT specific to the cue that had been subjected to the retrieval-extinction protocol.

      Memory suppression is the hypothesis we proposed that might be able to explain the results we obtained in the experiments. We discussed the possibility of memory suppression and listed the reasons why such a mechanism might be at work. As we mentioned in the manuscript, our findings are consistent with the memory suppression mechanism on at least two aspects: 1) cue-independence and 2) thought-control ability dependence. We agree that the questions raised by the reviewer are interesting but to answer these questions would require a series of further experiments to disentangle all the various variables and conceptual questions about the purpose of a phenomenon, which we are afraid is out of the scope of the current manuscript. We refer the reviewer to the discussion section where memory suppression might be the potential mechanism for the short-term amnesia we observed (lines 562-569) as follows:

      “Previous studies indicate that a suppression mechanism can be characterized by three distinct features: first, the memory suppression effect tends to emerge early, usually 10-30 mins after memory suppression practice and can be transient (MacLeod and Macrae, 2001; Saunders and MacLeod, 2002); second, the memory suppression practice seems to directly act upon the unwanted memory itself (Levy and Anderson, 2002), such that the presentation of other cues originally associated with the unwanted memory also fails in memory recall (cue-independence); third, the magnitude of memory suppression effects is associated with individual difference in control abilities over intrusive thoughts (Küpper et al., 2014).”

      (3) Relatedly, how does the retrieval-induced forgetting (which is referred to at various points throughout the paper) relate to the retrieval-extinction effect? The appeal to retrieval-induced forgetting as an apparent justification for aspects of the present study reinforces points 2 and 3 above. It is not uninteresting but lacks clarification/elaboration and, therefore, its relevance appears superficial at best.

      We brought the topic of retrieval-induced forgetting (RIF) to stress the point that memory suppression can be unconscious. In a standard RIF paradigm, unlike the think/no-think paradigm, subjects are not explicitly told to suppress the non-target memories. However, to successfully retrieve the target memory, the cognitive system actively inhibits the non-target memories, effectively implementing a memory suppression mechanism (though unconsciously). Therefore, it is possible our results might be explained by the memory suppression framework. We elaborated this point in the discussion section (lines 578-584): 

      “In our experiments, subjects were not explicitly instructed to suppress their fear expression, yet the retrieval-extinction training significantly decreased short-term fear expression. These results are consistent with the short-term amnesia induced with the more explicit suppression intervention (Anderson et al., 1994; Kindt and Soeter, 2018; Speer et al., 2021; Wang et al., 2021; Wells and Davies, 1994). It is worth noting that although consciously repelling unwanted memory is a standard approach in memory suppression paradigm, it is possible that the engagement of the suppression mechanism can be unconscious.”

      (4) I am glad that the authors have acknowledged the papers by Chalkia, van Oudenhove & Beckers (2020) and Chalkia et al (2020), which failed to replicate the effects of retrieval-extinction reported by Schiller et al in Reference 6. The authors have inserted the following text in the revised manuscript: "It should be noted that while our long-term amnesia results were consistent with the fear memory reconsolidation literature, there were also studies that failed to observe fear prevention (Chalkia, Schroyens, et al., 2020; Chalkia, Van Oudenhove, et al., 2020; Schroyens et al., 2023). Although the memory reconsolidation framework provides a viable explanation for the long-term amnesia, more evidence is required to validate the presence of reconsolidation, especially at the neurobiological level (Elsey et al., 2018). While it is beyond the scope of the current study to discuss the discrepancies between these studies, one possibility to reconcile these results concerns the procedure for the retrieval-extinction training. It has been shown that the eligibility for old memory to be updated is contingent on whether the old memory and new observations can be inferred to have been generated by the same latent cause (Gershman et al., 2017; Gershman and Niv, 2012). For example, prevention of the return of fear memory can be achieved through gradual extinction paradigm, which is thought to reduce the size of prediction errors to inhibit the formation of new latent causes (Gershman, Jones, et al., 2013). Therefore, the effectiveness of the retrieval-extinction paradigm might depend on the reliability of such paradigm in inferring the same underlying latent cause." Firstly, if it is beyond the scope of the present study to discuss the discrepancies between the present and past results, it is surely beyond the scope of the study to make any sort of reference to clinical implications!!!

      As we have clearly stated in our manuscript that this paper was not about discussing why some literature was or was not able to replicate the retrieval-extinction results originally reported by Schiller et al. 2010. Instead, we aimed to report a novel short-term fear amnesia through the retrieval-extinction paradigm, above and beyond the long-term amnesia reported before. Speculating about clinical implications of these finding is unrelated to the long-term, amnesia debate in the reconsolidation world. We now refer the reader to several perspectives and reviews that have proposed ways to resolve these discrepancies as follows (lines 642-673).

      Secondly, it is perfectly fine to state that "the effectiveness of the retrieval-extinction paradigm might depend on the reliability of such paradigm in inferring the same underlying latent cause..." This is not uninteresting, but it also isn't saying much. Minimally, I would expect some statement about factors that are likely to determine whether one is or isn't likely to see a retrieval-extinction effect, grounded in terms of this theory.

      Again, as we have responded many times, we simply do not know why some studies were able to suppress the fear expression using the retrieval-extinction paradigm and other studies weren’t. This is still an unresolved issue that the field is actively engaging with, and we now refer the reader to several papers dealing with this issue. However, this is NOT the focus of our manuscript. Having a healthy debate does not mean that every study using the retrieval-extinction paradigm must address the long-standing question of why the retrieval-extinction paradigm is effective (at least in some studies).

      Clarifications, Elaborations, Edits

      (5) Some parts of the paper are not easy to follow. Here are a few examples (though there are others):

      (a) In the abstract, the authors ask "whether memory retrieval facilitates update mechanisms other than memory reconsolidation"... but it is never made clear how memory retrieval could or should "facilitate" a memory update mechanism.

      We meant to state that the retrieval-extinction paradigm might have effects on fear memory, above and beyond the purported memory reconsolidation effect. Sentence modified (lines 25-26) as follows:

      “Memory reactivation renders consolidated memory fragile and thereby opens the window for memory updates, such as memory reconsolidation.”

      (b) The authors state the following: "Furthermore, memory reactivation also triggers fear memory reconsolidation and produces cue specific amnesia at a longer and separable timescale (Study 2, N = 79 adults)." Importantly, in study 2, the retrieval-extinction protocol produced a cue-specific disruption in responding when testing occurred 24 hours after the end of extinction. This result is interesting but cannot be easily inferred from the statement that begins "Furthermore..." That is, the results should be described in terms of the combined effects of retrieval and extinction, not in terms of memory reactivation alone; and the statement about memory reconsolidation is unnecessary. One can simply state that the retrieval-extinction protocol produced a cue-specific disruption in responding when testing occurred 24 hours after the end of extinction.

      The sentence the reviewer referred to was in our original manuscript submission but had since been modified based on the reviewer’s comments from last round of revision. Please see the abstract (lines 30-35) of our revised manuscript from last round of revision:

      “Furthermore, across different timescales, the memory retrieval-extinction paradigm triggers distinct types of fear amnesia in terms of cue-specificity and cognitive control dependence, suggesting that the short-term fear amnesia might be caused by different mechanisms from the cue-specific amnesia at a longer and separable timescale (Study 2, N = 79 adults).”

      (c) The authors also state that: "The temporal scale and cue-specificity results of the short-term fear amnesia are clearly dissociable from the amnesia related to memory reconsolidation, and suggest that memory retrieval and extinction training trigger distinct underlying memory update mechanisms." ***The pattern of results when testing occurred just minutes after the retrieval-extinction protocol was different to that obtained when testing occurred 24 hours after the protocol. Describing this in terms of temporal scale is unnecessary; and suggesting that memory retrieval and extinction trigger different memory update mechanisms is not obviously warranted. The results of interest are due to the combined effects of retrieval+extinction and there is no sense in which different memory update mechanisms should be identified with the different pattern of results obtained when testing occurred either 30 min or 24 hours after the retrieval-extinction protocol (at least, not the specific pattern of results obtained here).

      Again, we are afraid that the reviewer referred to the abstract in the original manuscript submission, instead of the revised abstract we submitted in the last round. Please see lines 37-39 of the revised abstract where the sentence was already modified (or the abstract from last round of revision).

      The facts that the 30min, 6hr and 24hr test results are different in terms of their cue-specificity and thought-control ability dependence are, to us, an important discovery in terms of delineating different cognitive processes at work following the retrieval-extinction paradigm. We want to emphasize that the fear memories after going through the retrieval-extinction paradigm showed interesting temporal dynamics in terms of their magnitudes, cue-specificity and thought-control ability dependence.

      (d) The authors state that: "We hypothesize that the labile state triggered by the memory retrieval may facilitate different memory update mechanisms following extinction training, and these mechanisms can be further disentangled through the lens of temporal dynamics and cue-specificities." *** The first part of the sentence is confusing around usage of the term "facilitate"; and the second part of the sentence that references a "lens of temporal dynamics and cue-specificities" is mysterious. Indeed, as all rats received the same retrieval-extinction exposures in Study 2, it is not clear how or why any differences between the groups are attributed to "different memory update mechanisms following extinction"

      The term “facilitate” was used to highlight the fact that the short-term fear amnesia effect is also memory retrieval dependent, as study 1 demonstrated. The novelty of the short-term fear memory deficit can be distinguished from the long-term memory effect via cue-specificity and thought-control ability dependence. Sentence has been modified (lines 97-101) as follows:

      “We hypothesize that the labile state triggered by the memory retrieval may facilitate different memory deficits following extinction training, and these deficits can be further disentangled through the lens of temporal dynamics and cue-specificities. In theory, different cognitive mechanisms underlying specific fear memory deficits, therefore, can be inferred based on the difference between memory deficits.”

      Data

      (6A) The eight participants who were discontinued after Day 1 in Study 1 were all from the no reminder group. The authors should clarify how participants were allocated to the two groups in this experiment so that the reader can better understand why the distribution of non-responders was non-random (as it appears to be).

      (6B) Similarly, in study 2, of the 37 participants that were discontinued after Day 2, 19 were from Group 30 min and 5 were from Group 6 hours. The authors should comment on how likely these numbers are to have been by chance alone. I presume that they reflect something about the way that participants were allocated to groups: e.g., the different groups of participants in studies 1 and 2 could have been run at quite different times (as opposed to concurrently). If this was done, why was it done? I can't see why the study should have been conducted in this fashion - this is for myriad reasons, including the authors' concerns re SCRs and their seasonal variations.

      As we responded in the previous response letters (as well as in the revised the manuscript), subjects were excluded because their SCR did not reach the threshold of 0.02 S when electric shock was applied. Subjects were assigned to different treatments daily (eg. Day 1 for the reminder group and Day 2 for no-reminder group) to avoid potential confusion in switching protocols to different subjects within the same day. We suspect that the non-responders might be related to the body thermal conditions caused by the lack of central heating for specific dates. Please note that the discontinued subjects (non-responders) were let go immediately after the failure to detect their SCR (< 0.02 S) on Day 1 and never invited back on Day 2, so it’s possible that the discontinued subjects were all from certain dates on which the body thermal conditions were not ideal for SCR collection. Despite the number of excluded subjects, we verified the short-term fear amnesia effect in three separate studies, which to us should serve as strong evidence in terms of the validity of the effect.

      (6C) In study 2, why is responding to the CS- so high on the first test trial in Group 30 min? Is the change in responding to the CS- from the last extinction trial to the first test trial different across the three groups in this study? Inspection of the figure suggests that it is higher in Group 30 min relative to Groups 6 hours and 24 hours. If this is confirmed by the analysis, it has implications for the fear recovery index which is partly based on responses to the CS-. If not for differences in the CS- responses, Groups 30 min and 6 hours are otherwise identical. That is, the claim of differential recovery to the CS1 and CS2 across time may simply an artefact of the way that the recovery index was calculated. This is unfortunate but also an important feature of the data given the way in which the fear recovery index was calculated.

      We have provided detailed analysis to this question in our previous response letter, and we are posting our previous response there:

      Following the reviewer’s comments, we went back and calculated the mean SCR difference of CS- between the first test trial and the last extinction trial for all three studies (see Author response image 1 below). In study 1, there was no difference in the mean CS- SCR (between the first test trial and last extinction trial) between the reminder and no-reminder groups (Kruskal-Wallis test , though both groups showed significant fear recovery even in the CS- condition (Wilcoxon signed rank test, reminder: P = 0.0043, no-reminder: P = 0.0037). Next, we examined the mean SCR for CS- for the 30min, 6h and 24h groups in study 2 and found that there was indeed a group difference (one-way ANOVA,F<sub>2.76</sub> = 5.3462, P = 0.0067, panel b), suggesting that the CS- related SCR was influenced by the test time (30min, 6h or 24h). We also tested the CS- related SCR for the 4 groups in study 3 (where test was conducted 1 hour after the retrieval-extinction training) and found that across TMS stimulation types (PFC vs. VER) and reminder types (reminder vs. no-reminder) the ANOVA analysis did not yield main effect of TMS stimulation type (F<sub>1.71</sub> = 0.322, P = 0.572) nor main effect of reminder type (F<sub>1.71</sub> = 0.0499, P = 0.824, panel c). We added the R-VER group results in study 3 (see panel c) to panel b and plotted the CS- SCR difference across 4 different test time points and found that CS- SCR decreased as the test-extinction delay increased (Jonckheere-Terpstra test, P = 0.00028). These results suggest a natural “forgetting” tendency for CS- related SCR and highlight the importance of having the CS- as a control condition to which the CS+ related SCR was compared with.

      Author response image 1.

      (6D) The 6 hour group was clearly tested at a different time of day compared to the 30 min and 24 hour groups. This could have influenced the SCRs in this group and, thereby, contributed to the pattern of results obtained.

      Again, we answered this question in our previous response. Please see the following for our previous response:

      For the 30min and 24h groups, the test phase can be arranged in the morning, in the afternoon or at night. However, for the 6h group, the test phase was inevitably in the afternoon or at night since we wanted to exclude the potential influence of night sleep on the expression of fear memory (see Author response table 1 below). If we restricted the test time in the afternoon or at night for all three groups, then the timing of their extinction training was not matched.

      Author response table 1.

      Nevertheless, we also went back and examined the data for the subjects only tested in the afternoon or at nights in the 30min and 24h groups to match with the 6h group where all the subjects were tested either in the afternoon or at night. According to the table above, we have 17 subjects for the 30min group (9+8),18 subjects for the 24h group (9 + 9) and 26 subjects for the 6h group (12 + 14). As Author response image 2 shows, the SCR patterns in the fear acquisition, extinction and test phases were similar to the results presented in the original figure.

      Author response image 2.

      (6E) The authors find different patterns of responses to CS1 and CS2 when they were tested 30 min after extinction versus 24 h after extinction. On this basis, they infer distinct memory update mechanisms. However, I still can't quite see why the different patterns of responses at these two time points after extinction need to be taken to infer different memory update mechanisms. That is, the different patterns of responses at the two time points could be indicative of the same "memory update mechanism" in the sense that the retrieval-extinction procedure induces a short-term memory suppression that serves as the basis for the longer-term memory suppression (i.e., the reconsolidation effect). My pushback on this point is based on the notion of what constitutes a memory update mechanism; and is motivated by what I take to be a rather loose use of language/terminology in the reconsolidation literature and this paper specifically (for examples, see the title of the paper and line 2 of the abstract).

      As we mentioned previously, the term “mechanism” might have different connotations for different researchers. We aim to report a novel memory deficit following the retrieval-extinction paradigm, which differed significantly from the purported reconsolidation related long-term fear amnesia in terms of its timescale, cue-specificity and thought-control ability. Further TMS study confirmed that the intact dlPFC function is necessary for the short-term memory deficit. It’s based on these results we proposed that the short-term fear amnesia might be related to a different cognitive “mechanism”. As mentioned above, we now clarify what we mean by “mechanism” in the abstract and introduction (lines 31-34, 97-101).

      Reviewer #2 (Public review):

      The fear acquisition data is converted to a differential fear SCR and this is what is analysed (early vs late). However, the figure shows the raw SCR values for CS+ and CS- and therefore it is unclear whether acquisition was successful (despite there being an "early" vs "late" effect - no descriptives are provided).

      (1) There are still no descriptive statistics to substantiate learning in Experiment 1.

      We answered this question in our previous response letter. We are sorry that the definition of “early” and “late” trials was scattered in the manuscript. For example, we wrote “the late phase of acquisition (last 5 trials)” (Line 375-376) in the results section. Since there were 10 trials in total for the acquisition stage, we define the first 5 trials and the last 5 trials as “early” and “late” phases of the acquisition stage and explicitly added them into the first occasion “early” and “late” terms appeared (lines 316-318).

      In the results section, we did test whether the acquisition was successful in our previous manuscript (Line 316-325):

      “To assess fear acquisition across groups (Figure 1B and C), we conducted a mixed two-way ANOVA of group (reminder vs. no-reminder) x time (early vs. late part of the acquisition; first 5 and last 5 trials, correspondingly) on the differential fear SCR. Our results showed a significant main effect of time (early vs. late; F<sub>1,55</sub> \= 6.545, P \= 0.013, η<sup>2</sup> \= 0.106), suggesting successful fear acquisition in both groups. There was no main effect of group (reminder vs. no-reminder) or the group x time interaction (group: F<sub>1,55</sub> \= 0.057, P \= 0.813, η<sup>2</sup> \= 0.001; interaction: F<sub>1,55</sub> \= 0.066, P \= 0.798, η<sup>2</sup> \= 0.001), indicating similar levels of fear acquisition between two groups. Post-hoc t-tests confirmed that the fear responses to the CS+ were significantly higher than that of CS- during the late part of acquisition phase in both groups (reminder group: t<sub>29</sub> \= 6.642, P < 0.001; no-reminder group: t<sub>26</sub> = 8.522, P < 0.001; Figure 1C). Importantly, the levels of acquisition were equivalent in both groups (early acquisition: t<sub>55</sub> \= -0.063, P \= 0.950; late acquisition: t<sub>55</sub> \= -0.318, P \= 0.751; Figure 1C).”

      In Experiment 1 (Test results) it is unclear whether the main conclusion stems from a comparison of the test data relative to the last extinction trial ("we defined the fear recovery index as the SCR difference between the first test trial and the last extinction trial for a specific CS") or the difference relative to the CS- ("differential fear recovery index between CS+ and CS-"). It would help the reader assess the data if Fig 1e presents all the indexes (both CS+ and CS-). In addition, there is one sentence which I could not understand "there is no statistical difference between the differential fear recovery indexes between CS+ in the reminder and no reminder groups (P=0.048)". The p value suggests that there is a difference, yet it is not clear what is being compared here. Critically, any index taken as a difference relative to the CS- can indicate recovery of fear to the CS+ or absence of discrimination relative to the CS-, so ideally the authors would want to directly compare responses to the CS+ in the reminder and no-reminder groups. In the absence of such comparison, little can be concluded, in particular if SCR CS- data is different between groups. The latter issue is particularly relevant in Experiment 2, in which the CS- seems to vary between groups during the test and this can obscure the interpretation of the result.

      (2) In the revised analyses, the authors now show that CS- changes in different groups (for example, Experiment 2) so this means that there is little to conclude from the differential scores because these depend on CS-. It is unclear whether the effects arise from CS+ performance or the differential which is subject to CS- variations.

      There was a typo in the “P = 0.048” sentence and we have corrected it in our last response letter. Also in the previous response letter, we specifically addressed how the fear recovery index was defined (also in the revised manuscript).

      In most of the fear conditioning studies, CS- trials were included as the baseline control. In turn, most of the analyses conducted also involved comparisons between different groups. Directly comparing CS+ trials across groups (or conditions) is rare. In our study 2, we showed that the CS- response decreased as a function of testing delays (30min, 1hr, 6hr and 24hr). Ideally, it would be nice to show that the CS- across groups/conditions did not change. However, even in those circumstances, comparisons are still based on the differential CS response (CS+ minus CS-), that is, the difference of difference. It is also important to note that difference score is important as CS+ alone or across conditions is difficult to interpret, especially in humans, due to noise, signal fluctuations, and irrelevant stimulus features; therefore trials-wise reference is essential to assess the CS+ in the context of a reference stimulus in each trial (after all, the baselines are different). We are listing a few influential papers in the field that the CS- responses were not particularly equivalent across groups/conditions and argue that this is a routine procedure (Kindt & Soeter 2018 Figs. 2-3; Sevenster et al., 2013 Fig. 3; Liu et al., 2014 Fig. 1; Raio et al., 2017 Fig. 2).

      In experiment 1, the findings suggest that there is a benefit of retrieval followed by extinction in a short-term reinstatement test. In Experiment 2, the same effect is observed to a cue which did not undergo retrieval before extinction (CS2+), a result that is interpreted as resulting from cue-independence, rather than a failure to replicate in a within-subjects design the observations of Experiment 1 (between-subjects). Although retrieval-induced forgetting is cue-independent (the effect on items that are suppressed [Rp-] can be observed with an independent probe), it is not clear that the current findings are similar, and thus that the strong parallels made are not warranted. Here, both cues have been extinguished and therefore been equally exposed during the critical stage.

      (3) The notion that suppression is automatic is speculative at best

      We have responded the same question in our previous revision. Please note that our results from study 1 (the comparison between reminder and no-reminder groups) was not set up to test the cue-independence hypothesis for the short-term amnesia with only one CS+. Results from both study 2 (30min condition) and study 3 confirmed the cue-independence hypothesis and therefore we believe interpreting results from study 2 as “a failure to replicate in a within-subject design of the observations of Experiment 1” is not the case.

      We agree that the proposal of automatic or unconscious memory suppression is speculative and that’s why we mentioned it in the discussion. The timescale, cue-specificity and the thought-control ability dependence of the short-term fear amnesia identified in our studies was reminiscent of the memory suppression effects reported in the previous literature. However, memory suppression typically adopted a conscious “suppression” treatment (such as the think/no-think paradigm), which was absent in the current study. However, the retrieval-induced forgetting (RIF), which is also considered a memory suppression paradigm via inhibitory control, does not require conscious effort to suppress any particular thought. Based on these results and extant literature, we raised the possibility of memory suppression as a potential mechanism. We make clear in the discussion that the suppression hypothesis and connections with RIF will require further evidence (lines 615-616):

      “future research will be needed to investigate whether the short-term effect we observed is specifically related to associative memory or the spontaneous nature of suppression as in RIF (Figure 6C).”

      (4) It still struggle with the parallels between these findings and the "limbo" literature. Here you manipulated the retention interval, whereas in the cited studies the number of extinction (exposure) was varied. These are two completely different phenomena.

      We borrowed the “limbo” term to stress the transitioning from short-term to long-term memory deficits (the 6hr test group). Merlo et al. (2014) found that memory reconsolidation and extinction were dissociable processes depending on the extent of memory retrieval. They argued that there was a “limbo” transitional state, where neither the reconsolidation nor the extinction process was engaged. Our results suggest that at the test delay of 6hr, neither the short-term nor the long-term effect was present, signaling a “transitional” state after which the short-term memory deficit wanes and the long-term deficit starts to take over. We make this idea more explicit as follows (lines 622-626):

      “These works identified important “boundary conditions” of memory retrieval in affecting the retention of the maladaptive emotional memories. In our study, however, we showed that even within a boundary condition previously thought to elicit memory reconsolidation, mnemonic processes other than reconsolidation could also be at work, and these processes jointly shape the persistence of fear memory.”

      (5) My point about the data problematic for the reconsolidation (and consolidation) frameworks is that they observed memory in the absence of the brain substrates that are needed for memory to be observed. The answer did not address this. I do not understand how the latent cause model can explain this, if the only difference is the first ITI. Wouldn't participants fail to integrate extinction with acquisition with a longer ITI?

      We take the sentence “they observed memory in the absence of the brain substrates that are needed for memory to be observed” as referring to the long-term memory deficit in our study. As we responded before, the aim of this manuscript was not about investigating the brain substrates involved in memory reconsolidation (or consolidation). Using a memory retrieval-extinction paradigm, we discovered a novel short-term memory effect, which differed from the purported reconsolidation effect in terms of timescale, cue-specificity and thought-control ability dependence. We further showed that both memory retrieval and intact dlPFC functions were necessary to observe the short-term memory deficit effect. Therefore, we conclude that the brain mechanism involved in such an effect should be different from the one related to the purported reconsolidation effect. We make this idea more explicit as follows (lines 546-547):

      “Therefore, findings of the short-term fear amnesia suggest that the reconsolidation framework falls short to accommodate this more immediate effect (Figure 6A and B).”

      Whilst I could access the data in the OFS site, I could not make sense of the Matlab files as there is no signposting indicating what data is being shown in the files. Thus, as it stands, there is no way of independently replicating the analyses reported.

      (6) The materials in the OSF site are the same as before, they haven't been updated.

      Last time we thought the main issue was the OSF site not being publicly accessible and thus made it open to all visitors. We have added descriptive file to explain the variables to help visitors to replicate the analyses we took.

      (7) Concerning supplementary materials, the robustness tests are intended to prove that you 1) can get the same results by varying the statistical models or 2) you can get the same results when you include all participants. Here authors have done both so this does not help. Also, in the rebuttal letter, they stated "Please note we did not include non-learners in these analyses " which contradicts what is stated in the figure captions "(learners + non learners)"

      In the supplementary materials, we did the analyses of varying the statistical models and including both learners and non-learners separately, instead of both. In fact, in the supplementary material Figs. 1 & 2, we included all the participants and performed similar analysis as in the main text and found similar results (learners + non-learners). Also, in the text of the supplementary material, we used a different statistical analysis method to only learners (analyzing subjects reported in the main text using a different method) and achieved similar results. We believe this is exactly what the reviewer suggested us to do. Also there seems to be a misunderstanding for the "Please note we did not include non-learners in these analyses" sentence in the rebuttal letter. As the reviewer can see, the full sentence read “Please note we did not include non-learners in these analyses (the texts of the supplementary materials)”. We meant to express that the Figures and texts in the supplementary material reflect two approaches: 1) Figures depicting re-analysis with all the included subjects (learners + non learners); 2) Text describing different analysis with learners. We added clarifications to emphasize these approaches in the supplementary materials.

      (8) Finally, the literature suggesting that reconsolidation interference "eliminates" a memory is not substantiated by data nor in line with current theorising, so I invite a revision of these strong claims.

      We agree and have toned down the strong claims.

      Overall, I conclude that the revised manuscript did not address my main concerns.

      In both rounds of responses, we tried our best to address the reviewer’s concerns. We hope that the clarifications in this letter and revisions in the text address the remaining concerns. Thank you for your feedback.

      Reference:

      Kindt, M. and Soeter, M. 2018. Pharmacologically induced amnesia for learned fear is time and sleep dependent. Nat Commun, 9, 1316.

      Liu, J., Zhao, L., Xue, Y., Shi, J., Suo, L., Luo, Y., Chai, B., Yang, C., Fang, Q., Zhang, Y., Bao, Y., Pickens, C. L. and Lu, L. 2014. An unconditioned stimulus retrieval extinction procedure to prevent the return of fear memory. Biol Psychiatry, 76, 895-901.

      Raio, C. M., Hartley, C. A., Orederu, T. A., Li, J. and Phelps, E. A. 2017. Stress attenuates the flexible updating of aversive value. Proc Natl Acad Sci U S A, 114, 11241-11246.

      Sevenster, D., Beckers, T., & Kindt, M. 2013. Prediction error governs pharmacologically induced amnesia for learned fear. Science (New York, N.Y.), 339(6121), 830–833.

    1. Reviewer #1 (Public review):

      Summary:

      The study examines human biases in a regime-change task, in which participants have to report the probability of a regime change in the face of noisy data. The behavioral results indicate that humans display systematic biases, in particular, overreaction in stable but noisy environments and underreaction in volatile settings with more certain signals. fMRI results suggest that a frontoparietal brain network is selectively involved in representing subjective sensitivity to noise, while the vmPFC selectively represents sensitivity to the rate of change.

      Strengths:

      - The study relies on a task that measures regime-change detection primarily based on descriptive information about the noisiness and rate of change. This distinguishes the study from prior work using reversal-learning or change-point tasks in which participants are required to learn these parameters from experiences. The authors discuss these differences comprehensively.

      - The study uses a simple Bayes-optimal model combined with model fitting, which seems to describe the data well. The model is comprehensively validated.

      - The authors apply model-based fMRI analyses that provide a close link to behavioral results, offering an elegant way to examine individual biases.

      Weaknesses:

      The authors have adequately addressed most of my prior concerns.

      My only remaining comment concerns the z-test of the correlations. I agree with the non-parametric test based on bootstrapping at the subject level, providing evidence for significant differences in correlations within the left IFG and IPS.

      However, the parametric test seems inadequate to me. The equation presented is described as the Fisher z-test, but the numerator uses the raw correlation coefficients (r) rather than the Fisher-transformed values (z). To my understanding, the subtraction should involve the Fisher z-scores, not the raw correlations.

      More importantly, the Fisher z-test in its standard form assumes that the correlations come from independent samples, as reflected in the denominator (which uses the n of each independent sample). However, in my opinion, the two correlations are not independent but computed within-subject. In such cases, parametric tests should take into account the dependency. I believe one appropriate method for the current case (correlated correlation coefficients sharing a variable [behavioral slope]) is explained here:

      Meng, X.-l., Rosenthal, R., & Rubin, D. B. (1992). Comparing correlated correlation coefficients. Psychological Bulletin, 111(1), 172-175. https://doi.org/10.1037/0033-2909.111.1.172

      It should be implemented here:

      Diedenhofen B, Musch J (2015) cocor: A Comprehensive Solution for the Statistical Comparison of Correlations. PLoS ONE 10(4): e0121945. https://doi.org/10.1371/journal.pone.0121945

      My recommendation is to verify whether my assumptions hold, and if so, perform a test that takes correlated correlations into account. Or, to focus exclusively on the non-parametric test.

      In any case, I recommend a short discussion of these findings and how the authors interpret that some of the differences in correlations are not significant.

    2. Author response:

      The following is the authors’ response to the current reviews.

      eLife Assessment<br /> This study offers valuable insights into how humans detect and adapt to regime shifts, highlighting distinct contributions of the frontoparietal network and ventromedial prefrontal cortex to sensitivity to signal diagnosticity and transition probabilities. The combination of an innovative task design, behavioral modeling, and model-based fMRI analyses provides a solid foundation for the conclusions; however, the neuroimaging results have several limitations, particularly a potential confound between the posterior probability of a switch and the passage of time that may not be fully controlled by including trial number as a regressor. The control experiments intended to address this issue also appear conceptually inconsistent and, at the behavioral level, while informing participants of conditional probabilities rather than requiring learning is theoretically elegant, such information is difficult to apply accurately, as shown by well-documented challenges with conditional reasoning and base-rate neglect. Expressing these probabilities as natural frequencies rather than percentages may have improved comprehension. Overall, the study advances understanding of belief updating under uncertainty but would benefit from more intuitive probabilistic framing and stronger control of temporal confounds in future work.

      We thank the editors for the assessment. The editor added several limitations based on the new reviewer 3 in this round, which we address below.

      With regard to temporal confounds, we clarified in the main text and response to Reviewer 3 that we had already addressed the potential confound between posterior probability of a switch and passage of time in GLM-2 with the inclusion of intertemporal prior. After adding intertemporal prior in the GLM, we still observed the same fMRI results on probability estimates. In addition, we did two other robustness checks, which we mentioned in the manuscript.

      With regard to response mode (probability estimation rather than choice or indicating natural frequencies), we wish to point out that the in previous research by Massey and Wu (2005), which the current study was based on, the concern of participants showing system-neglect tendencies due to the mode of information delivery, namely indicating beliefs through reporting probability estimates rather than through choice or other response mode was addressed. Massy and Wu (2005, Study 3) found the same biases when participants performed a choice task that did not require them to indicate probability estimates.

      With regard to the control experiments, the control experiments in fact were not intended to address the confounds between posterior probability and passage of time. Rather, they aimed to address whether the neural findings were unique to change detection (Experiment 2) and to address visual and motor confounds (Experiment 3). These and the results of the control experiments were mentioned on page 18-19.

      Finally, we wish to highlight that we had performed detailed model comparisons after reviewer 2’s suggestions. Although reviewer 2 was unable to re-review the manuscript, we believe this provides insight into the literature on change detection. See “Incorporating signal dependency into system-neglect model led to better models for regime-shift detection” (p.27-30). The model comparison showed that system-neglect models that incorporate signal dependency are better models than the original system-neglect model in describing participants probability estimates. This suggests that people respond to change-consistent and change-inconsistent signals differently when judging whether the regime had changed. This was not reported in previous behavioral studies and was largely inspired by the neural finding on signal dependency in the frontoparietal cortex. It indicates that neural findings can provide novel insights into computational modeling of behavior.           

      Public Reviews:

      Reviewer #1 (Public review):

      Summary:

      The study examines human biases in a regime-change task, in which participants have to report the probability of a regime change in the face of noisy data. The behavioral results indicate that humans display systematic biases, in particular, overreaction in stable but noisy environments and underreaction in volatile settings with more certain signals. fMRI results suggest that a frontoparietal brain network is selectively involved in representing subjective sensitivity to noise, while the vmPFC selectively represents sensitivity to the rate of change.

      Strengths:

      - The study relies on a task that measures regime-change detection primarily based on descriptive information about the noisiness and rate of change. This distinguishes the study from prior work using reversal-learning or change-point tasks in which participants are required to learn these parameters from experiences. The authors discuss these differences comprehensively.

      - The study uses a simple Bayes-optimal model combined with model fitting, which seems to describe the data well. The model is comprehensively validated.

      - The authors apply model-based fMRI analyses that provide a close link to behavioral results, offering an elegant way to examine individual biases.

      We thank the reviewer for the comments.

      Weaknesses:

      The authors have adequately addressed most of my prior concerns.

      We thank the reviewer for recognizing our effort in addressing your concerns.

      My only remaining comment concerns the z-test of the correlations. I agree with the non-parametric test based on bootstrapping at the subject level, providing evidence for significant differences in correlations within the left IFG and IPS.

      However, the parametric test seems inadequate to me. The equation presented is described as the Fisher z-test, but the numerator uses the raw correlation coefficients (r) rather than the Fisher-transformed values (z). To my understanding, the subtraction should involve the Fisher z-scores, not the raw correlations.

      More importantly, the Fisher z-test in its standard form assumes that the correlations come from independent samples, as reflected in the denominator (which uses the n of each independent sample). However, in my opinion, the two correlations are not independent but computed within-subject. In such cases, parametric tests should take into account the dependency. I believe one appropriate method for the current case (correlated correlation coefficients sharing a variable [behavioral slope]) is explained here:

      Meng, X.-l., Rosenthal, R., & Rubin, D. B. (1992). Comparing correlated correlation coefficients. Psychological Bulletin, 111(1), 172-175. https://doi.org/10.1037/0033-2909.111.1.172

      It should be implemented here:

      Diedenhofen B, Musch J (2015) cocor: A Comprehensive Solution for the Statistical Comparison of Correlations. PLoS ONE 10(4): e0121945. https://doi.org/10.1371/journal.pone.0121945

      My recommendation is to verify whether my assumptions hold, and if so, perform a test that takes correlated correlations into account. Or, to focus exclusively on the non-parametric test.

      In any case, I recommend a short discussion of these findings and how the authors interpret that some of the differences in correlations are not significant.

      Thank you for the careful check. Yes. This was indeed a mistake from us. We also agree that the two correlations are not independent. Therefore, we modified the test that accounts for dependent correlations by following Meng et al. (1992) suggested by the reviewer.

      We referred to the correlation between neural and behavioral sensitivity at change-consistent (blue) signals as , and that at change-inconsistent (red) signals as 𝑟<sub>𝑟𝑒𝑑</sub>. To statistically compare these two correlations, we adopted the approach of Meng et al. (1992), which specifically tests differences between dependent correlations according to the following equation

      where  is the number of subjects, 𝑧<sub>𝑟𝑖</sub> is the Fisher z-transformed value of 𝑟<sub>𝑖</sub>, 𝑟<sub>1</sub> = 𝑟<sub>𝑏𝑙𝑢𝑒</sub> and 𝑟<sub>2</sub> = 𝑟<sub>𝑟𝑒𝑑</sub>. 𝑟<sub>𝑥</sub> is the correlation between the neural sensitivity at change-consistent signals and change-inconsistent signals.

      Where is the mean of the , and 𝑓 should be set to 1 if > 1.

      We found that among the five ROIs in the frontoparietal network, two of them, namely the left IFG and left IPS, the difference in correlation was significant (one-tailed z test; left IFG: 𝑧 = 1.8908, 𝑝 = 0.0293; left IPS: 𝑧 = 2.2584, 𝑝 = 0.0049). For the remaining three ROIs, the difference in correlation was not significant (dmPFC: 𝑧 = 0.9522, 𝑝 = 0.1705; right IFG: 𝑧 = 0.9860, 𝑝 = 0.1621; right IPS: 𝑧 = 1.4833, 𝑝 = 0.0690). We chose one-tailed test because we already know the correlation under the blue signals was significantly greater than 0. These updated results are consistent with the nonparametric tests we had already performed and we will update them in the revised manuscript.

      Reviewer #3 (Public review):

      This study concerns how observers (human participants) detect changes in the statistics of their environment, termed regime shifts. To make this concrete, a series of 10 balls are drawn from an urn that contains mainly red or mainly blue balls. If there is a regime shift, the urn is changed over (from mainly red to mainly blue) at some point in the 10 trials. Participants report their belief that there has been a regime shift as a % probability. Their judgement should (mathematically) depend on the prior probability of a regime shift (which is set at one of three levels) and the strength of evidence (also one of three levels, operationalized as the proportion of red balls in the mostly-blue urn and vice versa). Participants are directly instructed of the prior probability of regime shift and proportion of red balls, which are presented on-screen as numerical probabilities. The task therefore differs from most previous work on this question in that probabilities are instructed rather than learned by observation, and beliefs are reported as numerical probabilities rather than being inferred from participants' choice behaviour (as in many bandit tasks, such as Behrens 2007 Nature Neurosci).

      The key behavioural finding is that participants over-estimate the prior probability of regime change when it is low, and under estimate it when it is high; and participants over-estimate the strength of evidence when it is low and under-estimate it when it is high. In other words participants make much less distinction between the different generative environments than an optimal observer would. This is termed 'system neglect'. A neuroeconomic-style mathematical model is presented and fit to data.

      Functional MRI results how that strength of evidence for a regime shift (roughly, the surprise associated with a blue ball from an apparently red urn) is associated with activity in the frontal-parietal orienting network. Meanwhile, at time-points where the probability of a regime shift is high, there is activity in another network including vmPFC. Both networks show individual differences effects, such that people who were more sensitive to strength of evidence and prior probability show more activity in the frontal-parietal and vmPFC-linked networks respectively.

      We thank the reviewer for the overall descriptions of the manuscript.

      Strengths:

      (1) The study provides a different task for looking at change-detection and how this depends on estimates of environmental volatility and sensory evidence strength, in which participants are directly and precisely informed of the environmental volatility and sensory evidence strength rather than inferring them through observation as in most previous studies

      (2) Participants directly provide belief estimates as probabilities rather than experimenters inferring them from choice behaviour as in most previous studies<br /> (3) The results are consistent with well-established findings that surprising sensory events activate the frontal-parietal orienting network whilst updating of beliefs about the word ('regime shift') activates vmPFC.

      Thank you for these assessments.

      Weaknesses:

      (1) The use of numerical probabilities (both to describe the environments to participants, and for participants to report their beliefs) may be problematic because people are notoriously bad at interpreting probabilities presented in this way, and show poor ability to reason with this information (see Kahneman's classic work on probabilistic reasoning, and how it can be improved by using natural frequencies). Therefore the fact that, in the present study, people do not fully use this information, or use it inaccurately, may reflect the mode of information delivery.

      We appreciate the reviewer’s concern on this issue. The concern was addressed in Massey and Wu (2005) as participants performed a choice task in which they were not asked to provide probability estimates (Study 3 in Massy and Wu, 2005). Instead, participants in Study 3 were asked to predict the color of the ball before seeing a signal. This was a more intuitive way of indicating his or her belief about regime shift. The results from the choice task were identical to those found in the probability estimation task (Study 1 in Massey and Wu). We take this as evidence that the system-neglect behavior the participants showed was less likely to be due to the mode of information delivery.

      (2) Although a very precise model of 'system neglect' is presented, many other models could fit the data.

      For example, you would get similar effects due to attraction of parameter estimates towards a global mean - essentially application of a hyper-prior in which the parameters applied by each participant in each block are attracted towards the experiment-wise mean values of these parameters. For example, the prior probability of regime shift ground-truth values [0.01, 0.05, 0.10] are mapped to subjective values of [0.037, 0.052, 0.069]; this would occur if observers apply a hyper-prior that the probability of regime shift is about 0.05 (the average value over all blocks). This 'attraction to the mean' is a well-established phenomenon and cannot be ruled out with the current data (I suppose you could rule it out by comparing to another dataset in which the mean ground-truth value was different).

      We thank the reviewer for this comment. It is true that the system-neglect model is not entirely inconsistent with regression to the mean, regardless of whether the implementation has a hyper prior or not. In fact, our behavioral measure of sensitivity to transition probability and signal diagnosticity, which we termed the behavioral slope, is based on linear regression analysis. In general, the modeling approach in this paper is to start from a generative model that defines ideal performance and consider modifying the generative model when systematic deviations in actual performance from the ideal is observed. In this approach, a generative model with hyper-prior would be more complex to begin with, and a regression to the mean idea by itself does not generate a priori predictions.

      More generally, any model in which participants don't fully use the numerical information they were given would produce apparent 'system neglect'. Four qualitatively different example reasons are: 1. Some individual participants completely ignored the probability values given. 2. Participants did not ignore the probability values given, but combined them with a hyperprior as above. 3. Participants had a reporting bias where their reported beliefs that a regime-change had occurred tend to be shifted towards 50% (rather than reporting 'confident' values such 5% or 95%). 4. Participants underweighted probability outliers resulting in underweighting of evidence in the 'high signal diagnosticity' environment (10.1016/j.neuron.2014.01.020 )

      In summary I agree that any model that fits the data would have to capture the idea that participants don't differentiate between the different environments as much as they should, but I think there are a number of qualitatively different reasons why they might do this - of which the above are only examples - hence I find it problematic that the authors present the behaviour as evidence for one extremely specific model.

      Thank you for raising this point. The modeling principle we adopt is the following. We start from the normative model—the Bayesian model—that defined what normative behavior should look like. We compared participants’ behavior with the Bayesian model and found systematic deviations from it. To explain those systematic deviations, we considered modeling options within the confines of the same modeling framework. In other words, we considered a parameterized version of the Bayesian model, which is the system-neglect model and examined through model comparison the best modeling choice. This modeling approach is not uncommon, and many would agree this is the standard approach in economics and psychology. For example, Kahneman and Tversky adopted this approach when proposing prospect theory, a modification of expected utility theory where expected utility theory can be seen as one specific model for how utility of an option should be computed.

      (3) Despite efforts to control confounds in the fMRI study, including two control experiments, I think some confounds remain.

      For example, a network of regions is presented as correlating with the cumulative probability that there has been a regime shift in this block of 10 samples (Pt). However, regardless of the exact samples shown, doesn't Pt always increase with sample number (as by the time of later samples, there have been more opportunities for a regime shift)? Unless this is completely linear, the effect won't be controlled by including trial number as a co-regressor (which was done).

      Thank you for raising this concern. Yes, Pt always increases with sample number regardless of evidence (seeing change-consistent or change-inconsistent signals). This is captured by the ‘intertemporal prior’ in the Bayesian model, which we included as a regressor in our GLM analysis (GLM-2), in addition to Pt. In short, GLM-1 had Pt and sample number. GLM-2 had Pt, intertemporal prior, and sample number, among other regressors. And we found that, in both GLM-1 and GLM-2, both vmPFC and ventral striatum correlated with Pt.

      To make this clearer, we updated the main text to further clarify this on p.18:

      On the other hand, two additional fMRI experiments are done as control experiments and the effect of Pt in the main study is compared to Pt in these control experiments. Whilst I admire the effort in carrying out control studies, I can't understand how these particular experiment are useful controls. For example in experiment 3 participants simply type in numbers presented on the screen - how can we even have an estimate of Pt from this task?

      We thank the reviewer for this comment. The purpose of Experiment 3 was to control for visual and motor confounds. In other words, if subjects saw the similar visual layout and were just instructed to press numbers, would we observe the vmPFC, ventral striatum, and the frontoparietal network like what we did in the main experiment (Experiment 1)?

      The purpose of Experiment 2 was to establish whether what we found about Pt was unique to change detection. In Experiment 2, subjects estimated the probability that the current regime is the blue regime (just as they did in Experiment 1) except that there were no regime shifts involved. In other words, it is possible that the regions we identified were generally associated with probability estimation and not particularly about change detection. And we used Experiment 2 to examine whether this were true.

      (4) The Discussion is very long, and whilst a lot of related literature is cited, I found it hard to pin down within the discussion, what the key contributions of this study are. In my opinion it would be better to have a short but incisive discussion highlighting the advances in understanding that arise from the current study, rather than reviewing the field so broadly.

      Thank you. We received different feedbacks from previous reviews on what to include in Discussion. To address the reviewer’s concern, we will revise the Discussion to better highlight the key contributions of the current study at the beginning of Discussion.

      Recommendations for the authors:

      Reviewer #3 (Recommendations for the authors):

      Many of the figures are too tiny - the writing is very small, as are the pictures of brains. I'd suggest adjusting these so they will be readable without enlarging.

      Thank you. We will enlarge the figures to make them more readable.


      The following is the authors’ response to the original reviews.

      Public Reviews:

      Reviewer #1 (Public review):

      Summary:

      The study examines human biases in a regime-change task, in which participants have to report the probability of a regime change in the face of noisy data. The behavioral results indicate that humans display systematic biases, in particular, overreaction in stable but noisy environments and underreaction in volatile settings with more certain signals. fMRI results suggest that a frontoparietal brain network is selectively involved in representing subjective sensitivity to noise, while the vmPFC selectively represents sensitivity to the rate of change.

      Strengths:

      (1) The study relies on a task that measures regime-change detection primarily based on descriptive information about the noisiness and rate of change. This distinguishes the study from prior work using reversal-learning or change-point tasks in which participants are required to learn these parameters from experiences. The authors discuss these differences comprehensively.

      Thank you for recognizing our contribution to the regime-change detection literature and our effort in discussing our findings in relation to the experience-based paradigms.

      (2) The study uses a simple Bayes-optimal model combined with model fitting, which seems to describe the data well.

      Thank you for recognizing the contribution of our Bayesian framework and systemneglect model.

      (3) The authors apply model-based fMRI analyses that provide a close link to behavioral results, offering an elegant way to examine individual biases.

      Thank you for recognizing our execution of model-based fMRI analyses and effort in using those analyses to link with behavioral biases.

      Weaknesses:

      My major concern is about the correlational analysis in the section "Under- and overreactions are associated with selectivity and sensitivity of neural responses to system parameters", shown in Figures 5c and d (and similarly in Figure 6). The authors argue that a frontoparietal network selectively represents sensitivity to signal diagnosticity, while the vmPFC selectively represents transition probabilities. This claim is based on separate correlational analyses for red and blue across different brain areas. The authors interpret the finding of a significant correlation in one case (blue) and an insignificant correlation (red) as evidence of a difference in correlations (between blue and red) but don't test this directly. This has been referred to as the "interaction fallacy" (Niewenhuis et al., 2011; Makin & Orban de Xivry 2019). Not directly testing the difference in correlations (but only the differences to zero for each case) can lead to wrong conclusions. For example, in Figure 5c, the correlation for red is r = 0.32 (not significantly different from zero) and r = 0.48 (different from zero). However, the difference between the two is 0.1, and it is likely that this difference itself is not significant. From a statistical perspective, this corresponds to an interaction effect that has to be tested directly. It is my understanding that analyses in Figure 6 follow the same approach.

      Relevant literature on this point is:

      Nieuwenhuis, S, Forstmann, B & Wagenmakers, EJ (2011). Erroneous analyses of interactions in neuroscience: a problem of significance. Nat Neurosci 14, 11051107. https://doi.org/10.1038/nn.2886

      Makin TR, Orban de Xivry, JJ (2019). Science Forum: Ten common statistical mistakes to watch out for when writing or reviewing a manuscript. eLife 8:e48175. https://doi.org/10.7554/eLife.48175

      There is also a blog post on simulation-based comparisons, which the authors could check out: https://garstats.wordpress.com/2017/03/01/comp2dcorr/

      I recommend that the authors carefully consider what approach works best for their purposes. It is sometimes recommended to directly compare correlations based on Monte-Carlo simulations (cf Makin & Orban). It might also be appropriate to run a regression with the dependent variable brain activity (Y) and predictors brain area (X) and the model-based term of interest (Z). In this case, they could include an interaction term in the model:

      Y = \beta_0 + \beta_1 \cdot X + \beta_2 \cdot Z + \beta_3 \cdot X \cdot Z

      The interaction term reflects if the relationship between the model term Z and brain activity Y is conditional on the brain area of interest X.

      Thank you for the suggestion. In response, we tested for the difference in correlation both parametrically and nonparametrically. The results were identical. In the parametric test, we used the Fisher z transformation to transform the difference in correlation coefficients to the z statistic. That is, for two correlation coefficients, 𝑟<sub>1</sub> (with sample size 𝑛<sub>1</sub>) and 𝑟<sub>2</sub>, (with sample size 𝑛<sub>2</sub>), the z statistic of the difference in correlation is given by

      We referred to the correlation between neural and behavioral sensitivity at change-consistent (blue) signals as 𝑟<sub>𝑏𝑙𝑢𝑒</sub>, and that at change-inconsistent (red) signals as 𝑟<sub>𝑟𝑒𝑑</sub>. For the Fisher z transformation 𝑟<sub>1</sub>= 𝑟<sub>𝑏𝑙𝑢𝑒</sub> and 𝑟<sub>2</sub> \= 𝑟<sub>𝑟𝑒𝑑</sub>. We found that among the five ROIs in the frontoparietal network, two of them, namely the left IFG and left IPS, the difference in correlation was significant (one-tailed z test; left IFG: 𝑧 = 1.8355, 𝑝 =0.0332; left IPS: 𝑧 = 2.3782, 𝑝 = 0.0087). For the remaining three ROIs, the difference in correlation was not significant (dmPFC: 𝑧 = 0.7594, 𝑝 = 0.2238; right IFG: 𝑧 = 0.9068, 𝑝 = 0.1822; right IPS: 𝑧 = 1.3764, 𝑝 = 0.0843). We chose one-tailed test because we already know the correlation under the blue signals was significantly greater than 0.

      In the nonparametric test, we performed nonparametric bootstrapping to test for the difference in correlation (Efron & Tibshirani, 1994). We resampled with replacement the dataset (subject-wise) and used the resampled dataset to compute the difference in correlation. We then repeated the above for 100,000 times so as to estimate the distribution of the difference in correlation coefficients, tested for significance and estimated p-value based on this distribution. Consistent with our parametric tests, here we also found that the difference in correlation was significant in left IFG and left IPS (left IFG: 𝑟<sub>𝑏𝑙𝑢𝑒</sub> − 𝑟<sub>𝑟𝑒𝑑</sub> \= 0.46, 𝑝 = 0.0496; left IPS: 𝑟<sub>𝑏𝑙𝑢𝑒</sub> − 𝑟<sub>𝑟𝑒𝑑</sub> \= 0.5306, 𝑝 = 0.0041), but was not significant in dmPFC, right IFG, and right IPS (dmPFC: 𝑟<sub>𝑏𝑙𝑢𝑒</sub> − 𝑟<sub>𝑟𝑒𝑑</sub> \= 0.1634, 𝑝 = 0.1919; right IFG: 𝑟<sub>𝑏𝑙𝑢𝑒</sub> − 𝑟<sub>𝑟𝑒𝑑</sub> \= 0.2123, 𝑝 = 0.1681; right IPS: 𝑟<sub>𝑏𝑙𝑢𝑒</sub> − 𝑟<sub>𝑟𝑒𝑑</sub> \= 0.3434, 𝑝 = 0.0631).

      In summary, we found that neural sensitivity to signal diagnosticity in the frontoparietal network measured at change-consistent signals significantly correlated with individual subjects’ behavioral sensitivity to signal diagnosticity (𝑟<sub>𝑏𝑙𝑢𝑒</sub>). By contrast, neural sensitivity to signal diagnosticity measured at change-inconsistent did not significantly correlate with behavioral sensitivity (𝑟<sub>𝑟𝑒𝑑</sub>). The difference in correlation, 𝑟<sub>𝑏𝑙𝑢𝑒</sub> − 𝑟<sub>𝑟𝑒𝑑</sub>, however, was statistically significant in some (left IPS and left IFG) but not all brain regions within the frontoparietal network.

      To incorporate these updates, we added descriptions of the methods and results in the revised manuscript. In the Results section (p.26-27):

      “We further tested, for each brain region, whether the difference in correlation was significant using both parametric and nonparametric tests (see Parametric and nonparametric tests for difference in correlation coefficients in Methods). The results were identical. In the parametric test, we used the Fisher 𝑧 transformation to transform the difference in correlation coefficients to the 𝑧 statistic. We found that among the five ROIs in the frontoparietal network, two of them, namely the left IFG and left IPS, the difference in correlation was significant (one-tailed z test; left IFG: 𝑧 = 1.8355, 𝑝 = 0.0332; left IPS: 𝑧 = 2.3782, 𝑝 = 0.0087). For the remaining three ROIs, the difference in correlation was not significant (dmPFC: 𝑧 = 0.7594, 𝑝 = 0.2238; right IFG: 𝑧 = 0.9068, 𝑝 = 0.1822; right IPS: 𝑧 = 1.3764, 𝑝 = 0.0843). We chose one-tailed test because we already know the correlation under change-consistent signals was significantly greater than 0. In the nonparametric test, we performed nonparametric bootstrapping to test for the difference in correlation. We referred to the correlation between neural and behavioral sensitivity at change-consistent (blue) signals as 𝑟<sub>𝑏𝑙𝑢𝑒</sub>, and that at change-inconsistent (red) signals as 𝑟<sub>𝑟𝑒𝑑</sub>. Consistent with the parametric tests, we also found that the difference in correlation was significant in left IFG and left IPS (left IFG: 𝑟<sub>𝑏𝑙𝑢𝑒</sub> − 𝑟<sub>𝑟𝑒𝑑</sub> \= 0.46, 𝑝 = 0.0496; left IPS: 𝑟<sub>𝑏𝑙𝑢𝑒</sub> − 𝑟<sub>𝑟𝑒𝑑</sub> \= 0.5306, 𝑝 = 0.0041), but was not significant in dmPFC, right IFG, and right IPS (dmPFC: 𝑟<sub>𝑏𝑙𝑢𝑒</sub> − 𝑟<sub>𝑟𝑒𝑑</sub> \=0.1634, 𝑝 = 0.1919; right IFG: 𝑟<sub>𝑏𝑙𝑢𝑒</sub> − 𝑟<sub>𝑟𝑒𝑑</sub> \= 0.2123, 𝑝 = 0.1681; right IPS: 𝑟<sub>𝑏𝑙𝑢𝑒</sub> − 𝑟<sub>𝑟𝑒𝑑</sub> \= 0.3434, 𝑝 = 0.0631). In summary, we found that neural sensitivity to signal diagnosticity measured at change-consistent signals significantly correlated with individual subjects’ behavioral sensitivity to signal diagnosticity. By contrast, neural sensitivity to signal diagnosticity measured at change-inconsistent signals did not significantly correlate with behavioral sensitivity. The difference in correlation, however, was statistically significant in some (left IPS and left IFG) but not all brain regions within the frontoparietal network.”

      In the Methods section, we added on p.53:

      “Parametric and nonparametric tests for difference in correlation coefficients. We implemented both parametric and nonparametric tests to examine whether the difference in Pearson correlation coefficients was significant. In the parametric test, we used the Fisher 𝑧 transformation to transform the difference in correlation coefficients to the 𝑧 statistic. That is, for two correlation coefficients, 𝑟<sub>1</sub> (with sample size 𝑛<sub>2</sub>) and 𝑟<sub>2</sub>, (with sample size 𝑛<sub>1</sub>), the 𝑧 statistic of the difference in correlation is given by

      We referred to the correlation between neural and behavioral sensitivity at changeconsistent (blue balls) signals as 𝑟<sub>𝑏𝑙𝑢𝑒</sub>, and that at change-inconsistent (red balls) signals as 𝑟<sub>𝑟𝑒𝑑</sub>. For the Fisher 𝑧 transformation, 𝑟<sub>1</sub> \= 𝑟 𝑟<sub>𝑏𝑙𝑢𝑒</sub> and 𝑟<sub>2</sub> \= 𝑟<sub>𝑟𝑒𝑑</sub>. In the nonparametric test, we performed nonparametric bootstrapping to test for the difference in correlation (Efron & Tibshirani, 1994). That is, we resampled with replacement the dataset (subject-wise) and used the resampled dataset to compute the difference in correlation. We then repeated the above for 100,000 times so as to estimate the distribution of the difference in correlation coefficients, tested for significance and estimated p-value based on this distribution.”

      Another potential concern is that some important details about the parameter estimation for the system-neglect model are missing. In the respective section in the methods, the authors mention a nonlinear regression using Matlab's "fitnlm" function, but it remains unclear how the model was parameterized exactly. In particular, what are the properties of this nonlinear function, and what are the assumptions about the subject's motor noise? I could imagine that by using the inbuild function, the assumption was that residuals are Gaussian and homoscedastic, but it is possible that the assumption of homoscedasticity is violated, and residuals are systematically larger around p=0.5 compared to p=0 and p=1. Relatedly, in the parameter recovery analyses, the authors assume different levels of motor noise. Are these values representative of empirical values?

      We thank the reviewer for this excellent point. The reviewer touched on model parameterization, assumption of noise, and parameter recovery analysis. We answered these questions point-by-point below.

      On how our model was parameterized

      We parameterized the model according to the system-neglect model in Eq. (2) and estimated the alpha parameter separately for each level of transition probability and the beta parameter separately for each level of signal diagnosticity. As a result, we had a total of 6 parameters (3 alpha and 3 beta parameters) in the model. The system-neglect model is then called by fitnlm so that these parameters can be estimated. The term ‘nonlinear’ regression in fitnlm refers to the fact that you can specify any model (in our case the system-neglect model) and estimate its parameters when calling this function. In our use of fitnlm, we assume that the noise is Gaussian and homoscedastic (the default option).

      On the assumptions about subject’s motor noise

      We actually never called the noise ‘motor’ because it can be estimation noise as well. In the context of fitnlm, we assume that the noise is Gaussian and homoscedastic.

      On the possibility that homoscedasticity is violated

      We take the reviewer’s point. In response, we separately estimated the residual standard deviation at different probability intervals ([0.0–0.2), [0.2–0.4), [0.4–0.6), [0.6– 0.8), and [0.8–1.0]). The result is shown in the figure below. The black data points are the average residual standard deviation (across subjects) and the error bars are the standard error of the mean. The residual standard deviation is indeed heteroscedastic— smallest at 0.1 probability and increasing as probability increases and asymptote at 0.5 (Fig. S4).

      To examine how this would affect model fitting (parameter estimation), we performed parameter recovery analysis based on these empirically estimated, probabilitydependent residual standard deviation. That is, we simulated subjects’ probability estimates using the system-neglect model and added the heteroscedastic noise according to the empirical values and then estimated the parameter estimates of the system-neglect model. The recovered parameter estimates did not seem to be affected by the heteroscedasticity of the variance. The parameter recovery results were identical to the parameter recovery results when homoscedasticity was assumed. This suggested that although homoscedasticity was violated, it did not affect the accuracy of the parameter estimates (Fig.S4).

      We added a section ‘Impact of noise homoscedasticity on parameter estimation’ in Methods section (p.47-48) and a figure in the supplement (Fig. S4) to describe this:

      On whether the noise levels in parameter recovery analysis are representative of empirical values

      To address the reviewer’s question, we conducted a new analysis using maximum likelihood estimation to simultaneously estimate the system-neglect model and the noise level of each individual subject. To estimate each subject’s noise level, we incorporated a noise parameter into the system-neglect model. We assumed that probability estimates are noisy and modeled them with a Gaussian distribution where the noise parameter (𝜎,-./&) is the standard deviation. At each period, a probability estimate of regime shift was computed according to the system-neglect model where Θ is the set of parameters including parameters in the system-neglect model and the noise parameter. The likelihood function, 𝐿(Θ), is the probability of observing the subject’s actual probability estimate at period 𝑡, 𝑝), given Θ, 𝐿(Θ) = 𝑃(𝑝)|Θ). Since we modeled the noisy probability estimates with a Gaussian distribution, we can therefore express 𝐿(Θ) as 𝐿(Θ)~𝑁(𝑝); 𝑝)*+, 𝜎,-./&) where 𝑝)*+ is the probability estimate predicted by the system-neglect (SN) model at period 𝑡. As a reminder, we referred to a ‘period’ as the time when a new signal appeared during a trial (for a given transition probability and signal diagnosticity). To find that maximum likelihood estimates of ΘMLE, we summed over all periods the negative natural logarithm of likelihood and used MATLAB’s fmincon function to find ΘMLE. Across subjects, we found that the mean noise estimate was 0.1735 and ranged from 0.1118 to 0.2704 (Supplementary Figure S3).”

      Compared with our original parameter recovery analysis where the maximum noise level was set at 0.1, our data indicated that some subjects’ noise was larger than this value. Therefore, we expanded our parameter recovery analysis to include noise levels beyond 0.1 to up to 0.3. The results are now updated in Supplementary Fig. S3.

      We updated the parameter recovery section (p. 47) in Methods:

      The main study is based on N=30 subjects, as are the two control studies. Since this work is about individual differences (in particular w.r.t. to neural representations of noise and transition probabilities in the frontoparietal network and the vmPFC), I'm wondering how robust the results are. Is it likely that the results would replicate with a larger number of subjects? Can the two control studies be leveraged to address this concern to some extent?

      We can address the issue of robustness through looking at the effect size. In particular, with respect to individual differences in neural sensitivity of transition probability and signal diagnosticity, since the significant correlation coefficients between neural and behavioral sensitivity were between 0.4 and 0.58 for signal diagnosticity in frontoparietal network (Fig. 5C), and -0.38 and -0.37 for transition probability in vmPFC (Fig. 5D), the effect size of these correlation coefficients was considered medium to large (Cohen, 1992).

      It would be challenging to use the control studies to address the robustness concern. The two control studies did not allow us to examine individual differences – in particular with respect to neural selectivity of noise and transition probability – and therefore we think it is less likely to leverage the control studies. Having said that, it is possible to look at neural selectivity of noise (signal diagnosticity) in the first control experiment where subjects estimated the probability of blue regime in a task where there was no regime change (transition probability was 0). However, the fact that there were no regime shifts changed the nature of the task. Instead of always starting at the Red regime in the main experiment, in the first control experiment we randomly picked the regime to draw the signals from. It also changed the meaning and the dynamics of the signals (red and blue) that would appear. In the main experiment the blue signal is a signal consistent with change, but in the control experiment this is no longer the case. In the main experiment, the frequency of blue signals is contingent upon both noise and transition probability. In general, blue signals are less frequent than red signals because of small transition probabilities. But in the first control experiment, the frequency of blue signals may not be less frequent because the regime was blue in half of the trials. Due to these differences, we do not see how analyzing the control experiments could help in establishing robustness because we do not have a good prediction as to whether and how the neural selectivity would be impacted by these differences.

      It seems that the authors have not counterbalanced the colors and that subjects always reported the probability of the blue regime. If so, I'm wondering why this was not counterbalanced.

      We are aware of the reviewer’s concern. The first reason we did not do these (color counterbalancing and report blue/red regime balancing) was to not confuse the subjects in an already complicated task. Balancing these two variables also comes at the cost of sample size, which was the second reason we did not do it. Although we can elect to do these balancing at the between-subject level to not impact the task complexity, we could have introduced another confound that is the individual differences in how people respond to these variables. This is the third reason we were hesitant to do these counterbalancing.

      Reviewer #2 (Public review):

      Summary:

      This paper focuses on understanding the behavioral and neural basis of regime shift detection, a common yet hard problem that people encounter in an uncertain world.

      Using a regime-shift task, the authors examined cognitive factors influencing belief updates by manipulating signal diagnosticity and environmental volatility. Behaviorally, they have found that people demonstrate both over and under-reaction to changes given different combinations of task parameters, which can be explained by a unified system-neglect account. Neurally, the authors have found that the vmPFC-striatum network represents current belief as well as belief revision unique to the regime detection task. Meanwhile, the frontoparietal network represents cognitive factors influencing regime detection i.e., the strength of the evidence in support of the regime shift and the intertemporal belief probability. The authors further link behavioral signatures of system neglect with neural signals and have found dissociable patterns, with the frontoparietal network representing sensitivity to signal diagnosticity when the observation is consistent with regime shift and vmPFC representing environmental volatility, respectively. Together, these results shed light on the neural basis of regime shift detection especially the neural correlates of bias in belief update that can be observed behaviorally.

      Strengths:

      (1) The regime-shift detection task offers a solid ground to examine regime-shift detection without the potential confounding impact of learning and reward. Relatedly, the system-neglect modeling framework provides a unified account for both over or under-reacting to environmental changes, allowing researchers to extract a single parameter reflecting people's sensitivity to changes in decision variables and making it desirable for neuroimaging analysis to locate corresponding neural signals.

      Thank you for recognizing our task design and our system-neglect computational framework in understanding change detection.

      (2) The analysis for locating brain regions related to belief revision is solid. Within the current task, the authors look for brain regions whose activation covary with both current belief and belief change. Furthermore, the authors have ruled out the possibility of representing mere current belief or motor signal by comparing the current study results with two other studies. This set of analyses is very convincing.

      Thank you for recognizing our control studies in ruling out potential motor confounds in our neural findings on belief revision.

      (3) The section on using neuroimaging findings (i.e., the frontoparietal network is sensitive to evidence that signals regime shift) to reveal nuances in behavioral data (i.e., belief revision is more sensitive to evidence consistent with change) is very intriguing. I like how the authors structure the flow of the results, offering this as an extra piece of behavioral findings instead of ad-hoc implanting that into the computational modeling.

      Thank you for appreciating how we showed that neural insights can lead to new behavioral findings.

      Weaknesses:

      (1) The authors have presented two sets of neuroimaging results, and it is unclear to me how to reason between these two sets of results, especially for the frontoparietal network. On one hand, the frontoparietal network represents belief revision but not variables influencing belief revision (i.e., signal diagnosticity and environmental volatility). On the other hand, when it comes to understanding individual differences in regime detection, the frontoparietal network is associated with sensitivity to change and consistent evidence strength. I understand that belief revision correlates with sensitivity to signals, but it can probably benefit from formally discussing and connecting these two sets of results in discussion. Relatedly, the whole section on behavioral vs. neural slope results was not sufficiently discussed and connected to the existing literature in the discussion section. For example, the authors could provide more context to reason through the finding that striatum (but not vmPFC) is not sensitive to volatility.

      We thank the reviewer for the valuable suggestions.

      With regard to the first comment, we wish to clarify that we did not find frontoparietal network to represent belief revision. It was the vmPFC and ventral striatum that we found to represent belief revision (delta Pt in Fig. 3). For the frontoparietal network, we identified its involvement in our task through finding that its activity correlated with strength of change evidence (Fig. 4) and individual subjects’ sensitivity to signal diagnosticity (Fig. 5). Conceptually, these two findings reflect how individuals interpret the signals (signals consistent or inconsistent with change) in light of signal diagnosticity. This is because (1) strength of change evidence is defined as signals (+1 for signal consistent with change, and -1 for signal inconsistent with change) multiplied by signal diagnosticity and (2) sensitivity to signal diagnosticity reflects how individuals subjectively evaluate signal diagnosticity. At the theoretical level, these two findings can be interpreted through our computational framework in that both the strength of change evidence and sensitivity to signal diagnosticity contribute to estimating the likelihood of change (Eqs. 1 and 2). We added a paragraph in Discussion to talk about this.

      We added on p. 36:

      “For the frontoparietal network, we identified its involvement in our task through finding that its activity correlated with strength of change evidence (Fig. 4) and individual subjects’ sensitivity to signal diagnosticity (Fig. 5). Conceptually, these two findings reflect how individuals interpret the signals (signals consistent or inconsistent with change) in light of signal diagnosticity. This is because (1) strength of change evidence is defined as signals (+1 for signal consistent with change, and −1 for signal inconsistent with change) multiplied by signal diagnosticity and (2) sensitivity to signal diagnosticity reflects how individuals subjectively evaluate signal diagnosticity. At the theoretical level, these two findings can be interpreted through our computational framework in that both the strength of change evidence and sensitivity to signal diagnosticity contribute to estimating the likelihood of change (Equations 1 and 2 in Methods).”

      With regard to the second comment, we added a discussion on the behavioral and neural slope comparison. We pointed out previous papers conducting similar analysis (Vilares et al., 2011; Ting et al., 2015; Yang & Wu, 2020), their findings and how they relate to our results. Vilares et al. found that sensitivity to prior information (uncertainty in prior distribution) in the orbitofrontal cortex (OFC) and putamen correlated with behavioral measure of sensitivity to prior. In the current study, transition probability acts as prior in the system-neglect framework (Eq. 1) and we found that ventromedial prefrontal cortex represents subjects’ sensitivity to transition probability. Together, these results suggest that OFC (with vmPFC being part of OFC, see Wallis, 2011) is involved in the subjective evaluation of prior information in both static (Vilares et al., 2011) and dynamic environments (current study).

      We added on p. 37-38:

      “In the current study, our psychometric-neurometric analysis focused on comparing behavioral sensitivity with neural sensitivity to the system parameters (transition probability and signal diagnosticity). We measured sensitivity by estimating the slope of behavioral data (behavioral slope) and neural data (neural slope) in response to the system parameters. Previous studies had adopted a similar approach (Ting et al., 2015a; Vilares et al., 2012; Yang & Wu, 2020). For example, Vilares et al. (2012) found that sensitivity to prior information (uncertainty in prior distribution) in the orbitofrontal cortex (OFC) and putamen correlated with behavioral measure of sensitivity to the prior.

      In the current study, transition probability acts as prior in the system-neglect framework (Eq. 2 in Methods) and we found that ventromedial prefrontal cortex represents subjects’ sensitivity to transition probability. Together, these results suggest that OFC (with vmPFC being part of OFC, see Wallis, 2011) is involved in the subjective evaluation of prior information in both static (Vilares et al., 2012) and dynamic environments (current study). In addition, distinct from vmPFC in representing sensitivity to transition probability or prior, we found through the behavioral-neural slope comparison that the frontoparietal network represents how sensitive individual decision makers are to the diagnosticity of signals in revealing the true state (regime) of the environment.”

      (2) More details are needed for behavioral modeling under the system-neglect framework, particularly results on model comparison. I understand that this model has been validated in previous publications, but it is unclear to me whether it provides a superior model fit in the current dataset compared to other models (e.g., a model without \alpha or \beta). Relatedly, I wonder whether the final result section can be incorporated into modeling as well - i.e., the authors could test a variant of the model with two \betas depending on whether the observation is consistent with a regime shift and conduct model comparison.

      Thank you for the great suggestion. We rewrote the final Results section to specifically focus on model comparison. To address the reviewer’s suggestion (separately estimate beta parameters for change-consistent and change-inconsistent signals), we indeed found that these models were better than the original system-neglect model.

      To incorporate these new findings, we rewrote the entire final result section “Incorporating signal dependency into system-neglect model led to better models for regime-shift detection “(p.28-30).

      Recommendations for the authors:

      Reviewer #1 (Recommendations for the authors):

      (1) Use line numbers for the next round of reviews.

      We added line numbers in the revised manuscript.

      (2) Figure 2b: Can the empirical results be reproduced by the system-neglect model? This would complement the analyses presented in Figure S4.

      Yes. We now add Figure S6 based on system-neglect model fits. For each subject, we first computed period-by-period probability estimates based on the parameter estimates of the system-neglect model. Second, we computed index of overreaction (IO) for each combination of transition probability and signal diagnosticity. Third, we plot the IO like we did using empirical results in Fig. 2b. We found that the empirical results in Fig. 2b are similar to the system-neglect model shown in Figure S6, indicating that the empirical results can be reproduced by the model.

      (3) Page 14: Instead of referring to the "Methods" in general, you could be more specific about where the relevant information can be found.

      Fixed. We changed “See Methods” to “See System-neglect model in Methods”.

      (4) Page 18: Consider avoiding the term "more significantly". Consider effect sizes if interested in comparing effects to each other.

      Fixed. On page 19, we changed that to

      “In the second analysis, we found that for both vmPFC and ventral striatum, the regression coefficient of 𝑃) was significantly different between Experiment 1 and Experiment 2 (Fig. 3C) and between Experiment 1 and Experiment 3 (Fig. 3D; also see Tables S5 and S6 in SI).”

      (5) Page 30: Cite key studies using reversal-learning paradigms. Currently, readers less familiar with the literature might have difficulties with this.

      We now cite key studies using reversal-learning paradigms on p.32:

      “Our work is closely related to the reversal-learning paradigm—the standard paradigm in neuroscience and psychology to study change detection (Fellows & Farah, 2003; Izquierdo et al., 2017; O'Doherty et al., 2001; Schoenbaum et al., 2000; Walton et al., 2010). In a typical reversal-learning task, human or animal subjects choose between two options that differ in the reward magnitude or probability of receiving a reward. Through reward feedback the participants gradually learn the reward contingencies associated with the options and have to update knowledge about reward contingencies when contingencies are switched in order to maximize rewards.”

      Reviewer #2 (Recommendations for the authors):

      (1) Some literature on change detection seems missing. For example, the author should also cite Muller, T. H., Mars, R. B., Behrens, T. E., & O'Reilly, J. X. (2019). Control of entropy in neural models of environmental state. elife, 8, e39404. This paper suggests that medial PFC is correlated with the entropy of the current state, which is closely related to regime change and environmental volatility.

      Thank you for pointing to this paper. We have now added it and other related papers in the Introduction and Discussion.

      In Introduction, we added on p.5-6:

      “Different behavioral paradigms, most notably reversal learning, and computational models were developed to investigate its neurocomputational substrates (Behrens et al., 2007; Izquierdo et al., 2017; Payzan-LeNestour et al., 2011, 2013; Nasser et al., 2010; McGuire et al., 2014; Muller et al., 2019). Key findings on the neural implementations for such learning include identifying brain areas and networks that track volatility in the environment (rate of change) (Behrens et al., 2007), the uncertainty or entropy of the current state of the environment (Muller et al., 2019), participants’ beliefs about change (Payzan-LeNestour et al., 2011; McGuire et al., 2014; Kao et al., 2020), and their uncertainty about whether a change had occurred (McGuire et al., 2014; Kao et al., 2020).”

      In Discussion (p.35), we added a new paragraph:

      “Related to OFC function in decision making and reinforcement learning, Wilson et al. (2014) proposed that OFC is involved in inferring the current state of the environment. For example, medial OFC had been shown to represent probability distribution on possible states of the environment (Chan et al., 2016), the current task state (Schuck et al., 2016) and uncertainty or entropy associated with the state of the environment (Muller et al., 2019). In the context of regime-shift detection, regimes can be regarded as states of the environment and therefore a change in regime indicates a change in the state of the environment. Muller et al. (2019) found that in dynamic environments where changes in the state of the environment happen regularly, medial OFC represented the level of uncertainty in the current state of the environment. Our finding that vmPFC represented individual participants’ probability estimates of regime shifts suggest that vmPFC and/or OFC are involved in inferring the current state of the environment through estimating whether the state has changed. Our finding that vmPFC represented individual participants’ sensitivity to transition probability further suggest that vmPFC and/or OFC contribute to individual participants’ biases in state inference (over- and underreactions to change) in how these brain areas respond to the volatility of the environment.”

      (2) The language used when describing the selective relationship between frontoparietal network activation and change-consistent signal can be clearer. When describing separating those two signals, the authors refer to them as when the 'blue' signal shows up and when the 'red' signal shows up, assuming that the current belief state is blue. This is a little confusing cuz it is hard to keep in mind what is the default color in this example. It would be more intuitive if the author used language such as the 'change consistent' signal.

      Thank you for the suggestion. We have changed the wording according to your suggestion. That is, we say ‘change-consistent (blue) signals’ and ‘change-inconsistent (red) signals’ throughout pages 22-28.

      (3) Figure 4B highlights dmPFC. However, in the associated text, it says p = .10 so it is not significant. To avoid misleading readers, I would recommend pointing this out explicitly beyond saying 'most brain regions in the frontoparietal network also correlated with the intertemporal prior'.

      Thank you for pointing this out. We now say on p.20

      “With independent (leave-one-subject-out, LOSO) ROI analysis, we examined whether brain regions in the frontoparietal network (shown to represent strength of change evidence) correlated with intertemporal prior and found that all brain regions, with the exception of dmPFC, in the frontoparietal network correlated with the intertemporal prior.”

      (4) There is a full paragraph in the discussion talking about the central opercular cortex, but this terminology has not shown up in the main body of the paper. If this is an important brain region to the authors, I would recommend mentioning it more often in the result section.

      Thank you for this suggestion. We have now added central opercular cortex in the Results section (p.18):

      “For 𝑃<sub>𝑡</sub>, we found that the ventromedial prefrontal cortex (vmPFC) and ventral striatum correlated with this behavioral measure of subjects’ belief about change. In addition, many other brain regions, including the motor cortex, central opercular cortex, insula, occipital cortex, and the cerebellum also significantly correlated with 𝑃<sub>𝑡</sub>.”

      (5) The authors have claimed that people make more extreme estimates under high diagnosticity (Supplementary Figure 1). This is an interesting point because it seems to be different from what is shown in the main graph where it seems that people are not extreme enough compared to an ideal Bayesian observer. I understand that these are effects being investigated under different circumstances. It would be helpful if for Supplementary Figure 1 the authors could overlay, or generate a different figure showing what an ideal Bayesian observer would do in this situation.

      We thank the reviewer for pointing this out. We wish to clarify that when we said “more extreme estimates under high diagnosticity” we meant compared with low diagnosticity and not with the ideal Bayesian observer. We clarified this point by rephrasing our sentence on p.11:

      “We also found that subjects tended to give more extreme Pt under high signal diagnosticity than low diagnosticity (Fig. S1 in Supplementary Information, SI).”

      When it comes to comparing subjects’ probability estimates with the normative Bayesian, subjects tended to “underreact” under high diagnosticity. This can be seen in Fig. 4B, which shows a trend of increasing underreaction (or decreasing overreaction) as diagnosticity increased (row-wise comparison for a given transition probability).

      We see the reviewer’s point in overlaying the Bayesian on Fig. S1 and update it by adding the normative Bayesian in orange.

    1. Author response:

      The following is the authors’ response to the original reviews

      Public Reviews:

      Reviewer #1 (Public review):

      Summary:

      Silbaugh, Koster, and Hansel investigated how the cerebellar climbing fiber (CF) signals influence neuronal activity and plasticity in mouse primary somatosensory (S1) cortex. They found that optogenetic activation of CFs in the cerebellum modulates responses of cortical neurons to whisker stimulation in a cell-type-specific manner and suppresses potentiation of layer 2/3 pyramidal neurons induced by repeated whisker stimulation. This suppression of plasticity by CF activation is mediated through modulation of VIP- and SST-positive interneurons. Using transsynaptic tracing and chemogenetic approaches, the authors identified a pathway from the cerebellum through the zona incerta and the thalamic posterior medial (POm) nucleus to the S1 cortex, which underlies this functional modulation.

      Strengths:

      This study employed a combination of modern neuroscientific techniques, including two-photon imaging, opto- and chemo-genetic approaches, and transsynaptic tracing. The experiments were thoroughly conducted, and the results were clearly and systematically described. The interplay between the cerebellum and other brain regions - and its functional implications - is one of the major topics in this field. This study provides solid evidence for an instructive role of the cerebellum in experience-dependent plasticity in the S1 cortex.

      Weaknesses:

      There may be some methodological limitations, and the physiological relevance of the CFinduced plasticity modulation in the S1 cortex remains unclear. In particular, it has not been elucidated how CF activity influences the firing patterns of downstream neurons along the pathway to the S1 cortex during stimulation.

      Our study addresses the important question of whether CF signaling can influence the activity and plasticity of neurons outside the olivocerebellar system, and further identifies the mechanism through which this indeed occurs. We provide a detailed description of the involvement of specific neuron subtypes and how they are modulated by climbing fiber activation to impact S1 plasticity. We also identify at least one critical pathway from the cerebellar output to the S1 circuit. It is indeed correct that we did not investigate how the specific firing patterns of all of these downstream neurons are affected, or the natural behaviors in which this mechanism is involved. Now that it is established that CF signaling can impact activity and plasticity outside the olivocerebellar system -- and even in the primary somatosensory cortex -- these questions will be important to further investigate in future studies.

      (1) Optogenetic stimulation may have activated a large population of CFs synchronously, potentially leading to strong suppression followed by massive activation in numerous cerebellar nuclear (CN) neurons. Given that there is no quantitative estimation of the stimulated area or number of activated CFs, observed effects are difficult to interpret directly. The authors should at least provide the basic stimulation parameters (coordinates of stim location, power density, spot size, estimated number of Purkinje cells included, etc.).

      As discussed in the paper, we indeed expect that synchronous CF activation is needed to allow for an effect on S1 circuits under natural or optogenetic activation conditions. The basic optogenetic stimulation parameters (also stated in the methods) are as follows: 470 nm LED; Ø200 µm core, 0.39 NA rotary joint patch cable; absolute power output of 2.5 mW; spot size at the surface of the cortex 0.6 mm; estimated power density 8 mW/mm2. A serious estimate of the number of Purkinje cells that are activated is difficult to provide, in particular as ‘activation’ would refer to climbing fiber inputs, not Purkinje cells directly.

      (2) There are CF collaterals directly innervating CN (PMID:10982464). Therefore, antidromic spikes induced by optogenetic stimulation may directly activate CN neurons. On the other hand, a previous study reported that CN neurons exhibit only weak responses to CF collateral inputs (PMID: 27047344). The authors should discuss these possibilities and the potential influence of CF collaterals on the interpretation of the results.

      A direct activation of CN neurons by antidromic spikes in CF collaterals cannot be ruled out. However, we believe that this effect will not be substantial. The activation of the multi-synaptic pathway that we describe in this study is more likely to require a strong nudge as resulting from synchronized Purkinje cell input and subsequent rebound activation in CN neurons (PMID: 22198670), rather than small-amplitude input provided by CF collaterals (PMID: 27047344). A requirement for CF/PC synchronization would also set a threshold for activation of this suppressive pathway.

      (3) The rationale behind the plasticity induction protocol for RWS+CF (50 ms light pulses at 1 Hz during 5 min of RWS, with a 45 ms delay relative to the onset of whisker stimulation) is unclear.

      a) The authors state that 1 Hz was chosen to match the spontaneous CF firing rate (line 107); however, they also introduced a delay to mimic the CF response to whisker stimulation (line 108). This is confusing, and requires further clarification, specifically, whether the protocol was designed to reproduce spontaneous or sensory-evoked CF activity.

      This protocol was designed to mimic sensory-evoked CF activity as reported in Bosman et al (J. Physiol. 588, 2010; PMID: 20724365).

      b) Was the timing of delivering light pulses constant or random? Given the stochastic nature of CF firing, randomly timed light pulses with an average rate of 1Hz would be more physiologically relevant. At the very least, the authors should provide a clear explanation of how the stimulation timing was implemented.

      Light pulses were delivered at a constant 1 Hz. Our goal was to isolate synchrony as the variable distinguishing sensory-evoked from spontaneous CF activity; additionally varying stochasticity, rate, or amplitude would have confounded this. Future studies could explore how these additional parameters shape S1 responses.

      (4) CF activation modulates inhibitory interneurons in the S1 cortex (Figure 2): responses of interneurons in S1 to whisker stimulation were enhanced upon CF coactivation (Figure 2C), and these neurons were predominantly SST- and PV-positive interneurons (Figure 2H, I). In contrast, VIP-positive neurons were suppressed only in the late time window of 650-850 ms (Figure 2G). If the authors' hypothesis-that the activity of VIP neurons regulates SST- and PVneuron activity during RWS+CF-is correct, then the activity of SST- and PV-neurons should also be increased during this late time window. The authors should clarify whether such temporal dynamics were observed or could be inferred from their data.

      Yes, we see a significant activity increase in PV neurons in this late time window (see updates to Data S2). Activity was also increased in SST neurons, though this did not reach statistical significance (Data S2). One reason might be that – given the small effect size overall – such an effect would only be seen in paired recordings. Chemogenetic activity modulation in VIP neurons, which provides a more crude test, shows, however, that SST- and PV-positive interneurons are indeed regulated via inhibition from VIP-positive interneurons (Fig. 5).

      (5) Transsynaptic tracing from CN nicely identified zona incerta (ZI) neurons and their axon terminals in both POm and S1 (Figure 6 and Figure S7).

      a) Which part of the CN (medial, interposed, or lateral) is involved in this pathway is unclear.

      We used a dual-injection transsynaptic tracing approach to specifically label the outputs of ZI neurons that receive input from the deep cerebellar nuclei. The anterograde viral vector injected into the CN is unlabeled (no fluorophore) and therefore, it is not possible to reliably assess the extent of viral spread in those experiments as performed. However, we have previously performed similar injections into the deep cerebellar nuclei and post hoc histology suggest all three nuclei will have at least some viral expression (Koster and Sherman, 2024). Due to size and injection location, we will mostly have reached the lateral (dentate) nuclei, but cannot exclude partial transsynaptic tracing from the interposed and medial nuclei.  

      b) Were the electrophysiological properties of these ZI neurons consistent with those of PV neurons?

      Although most recorded cells demonstrated electrophysiological properties consistent with PV+ interneurons in other brain regions (i.e. fast spiking, narrow spike width, non-adapting; see Tremblay et al., 2016), interneuron subtypes in the ZI have been incompletely characterized, with SST+ cells showing similar features to those typically associated with PV+ cells (if interested, compare Fig. 4 in DOI: 10.1126/sciadv.abf6709 vs. Fig. S10 in https://doi.org/10.1016/j.neuron.2020.04.027). Therefore, we did not attempt to delineate cell identity based on these characteristics.

      c) There appears to be a considerable number of axons of these ZI neurons projecting to the S1 cortex (Figure S7C). Would it be possible to estimate the relative density of axons projecting to the POm versus those projecting to S1? In addition, the authors should discuss the potential functional role of this direct pathway from the ZI to the S1 cortex.

      An absolute quantification is difficult to provide based on the images that we obtained. However, any crude estimate would indicate the relative density of projections to POm is higher than the density of projections to S1 (this is apparent from the images themselves). While the anatomical and functional connections from POm to S1 have been described in detail (Audette et al., 2018), this is not the case for the direct projections to ZI. A direct ZI to S1 projection would potentially involve a different recruitment of neurons in the S1 circuit. Any discussion on the specific consequences of the activation of this direct pathway would be purely speculative.

      Reviewer #2 (Public review):

      Summary:

      The authors examined long-distance influence of climbing fiber (CF) signaling in the somatosensory cortex by manipulating whiskers through stimulation. Also, they examined CF signaling using two-photon imaging and mapped projections from the cerebellum to the somatosensory cortex using transsynaptic tracing. As a final manipulation, they used chemogenetics to perturb parvalbumin-positive neurons in the zona incerta and recorded from climbing fibers.

      Strengths:

      There are several strengths to this paper. The recordings were carefully performed, and AAVs used were selective and specific for the cell types and pathways being analyzed. In addition, the authors used multiple approaches that support climbing fiber pathways to distal regions of the brain. This work will impact the field and describes nice methods to target difficult-to-reach brain regions, such as the inferior olive.

      Weaknesses:

      There are some details in the methods that could be explained further. The discussion was very short and could connect the findings in a broader way.

      In the revised manuscript, we provide more methodological details, as requested. We provided as simple as possible explanations in the discussion, so as not to bias further investigations into this novel phenomenon. In particular, we avoid an extended discussion of the gating effect of CF activity on S1 plasticity. While this is the effect on plasticity specifically observed here, we believe that the consequences of CF signaling on S1 activity may entirely depend on the contexts in which CF signals are naturally recruited, the ongoing activity of other brain regions, and behavioral state. Our key finding is that such modulation of neocortical plasticity can occur. How CF signaling controls plasticity of the neocortex in all contexts remains unknown, but needs to be thoughtfully tested in the future.

      Reviewer #3 (Public review):

      Summary:

      The authors developed an interesting novel paradigm to probe the effects of cerebellar climbing fiber activation on short-term adaptation of somatosensory neocortical activity during repetitive whisker stimulation. Normally, RWS potentiated whisker responses in pyramidal cells and weakly suppressed them in interneurons, lasting for at least 1h. Crusii Optogenetic climbing fiber activation during RWS reduced or inverted these adaptive changes. This effect was generally mimicked or blocked with chemogenetic SST or VIP activation/suppression as predicted based on their "sign" in the circuit.

      Strengths:

      The central finding about CF modulation of S1 response adaptation is interesting, important, and convincing, and provides a jumping-off point for the field to start to think carefully about cerebellar modulation of neocortical plasticity.

      Weaknesses:

      The SST and VIP results appeared slightly weaker statistically, but I do not personally think this detracts from the importance of the initial finding (if there are multiple underlying mechanisms, modulating one may reproduce only a fraction of the effect size). I found the suggestion that zona incerta may be responsible for the cerebellar effects on S1 to be a more speculative result (it is not so easy with existing technology to effectively modulate this type of polysynaptic pathway), but this may be an interesting topic for the authors to follow up on in more detail in the future.

      Our interpretation of the anatomical and physiological findings is that a pathway via the ZI is indeed critical for the observed effects. This pathway also represents perhaps the most direct pathway (i.e. least number of synapses connecting the cerebellar nuclei to S1). However, several other direct and indirect pathways are plausible as well and we expect distinct activation requirements and consequences for neurons in the S1 circuit. These are indeed interesting topics for future investigation.

      Recommendations for the authors:

      Reviewer #1 (Recommendations for the authors):

      (1) Line 77: "CF transients" is not a standard or widely recognized term. Please use a more precise expression, such as "CF-induced calcium transients."

      We now avoid the use of the term “CF transients” and replaced it with “CF-induced calcium transients.”

      (2) Titer of AAVs injected should be provided.

      AAV titers have been included in an additional data table (Data S9).

      (3) Several citations to the figures are incorrect (for example, "Supplementary Data 2a (Line 398)" does not exist).

      We apologize for the mistakes in this version of the article. Incorrect citations to the figures have been corrected.

      (4) Line 627-628: "The tip of the patch cable was centered over Crus II in all optogenetic stimulation experiments." The stereotaxic coordinate of the tip position should be provided.

      The stereotaxic coordinate of the tip position has been provided in the methods.

      (5) Line 629: "Blue light pulses were delivered with a 470 nm Fiber-Coupled LED (Thorlabs catalog: M470F3)." The size of the light stim and estimated power density (W/mm^2) at the surface of the cortex should be provided.

      The spot size and estimated power density at the surface of the cortex has been provided in the methods.

      (6) Line 702-706: References for DCZ should be cited.

      We now cited Nagai et al, Nat. Neurosci. 23 (2020) as the original reference.

      (7) Two-photon image processing (Line 807-809): The rationale for normalizing ∆F/F traces to a pre-stimulus baseline is unclear because ∆F/F is, by definition, already normalized to baseline fluorescence: (Ft-F0)/F0. The authors should clarify why this additional normalization step was necessary and how it affected the interpretation of the data.

      A single baseline fluorescence value (F₀) was computed for each neuron across the entire recording session, which lasted ~120-minutes. However, some S1 neurons exhibit fluctuations in baseline fluorescence over time—often related to locomotive activity or spontaneous network oscillations—which can obscure stimulus-evoked changes. To isolate fluorescence changes specifically attributable to whisker stimulation, we normalized each ∆F/F trace to the prestimulus baseline for that trial. This additional normalization allowed us to quantify potentiation or depression of sensory responses themselves, independently of spontaneous oscillations or locomotion-related changes in the ongoing neural activity.

      Reviewer #2 (Recommendations for the authors):

      (1) Did the climbing fiber stimulation for Figure 1 result in any changes to motor activity? Can you make any additional comments on other behaviors that were observed during these manipulations?

      Acute CF stimulation did not cause any changes in locomotive or whisking activity. The CF stimulation also did not influence the overall level of locomotion or whisking during plasticity induction.

      (2) Figure 3B and F- it is very difficult to see the SST+ neurons. Can this be enhanced?

      We linearly adjusted the brightness and contrast for the bottom images in Figure 3B and F to improve visualization of SST+ neurons. Note the expression of both hM3D(Gq) and hM4D(Gi) in SST+ neurons is sparse, which was necessary to avoid off-target effects.

      (3) Can you be more specific about the subregions of cerebellar nuclei and cell types that are targeted in the tracing studies? Discussions of the cerebellar nuclei subregions are missing and would be interesting, as others have shown discrete pathways between cerebellar nuclei subregions and long-distance projections.

      See our response to comment 5a from Reviewer 1 (copied again here): we used a dual-injection transsynaptic tracing approach to specifically label the outputs of ZI neurons that receive input from the deep cerebellar nuclei. The anterograde viral vector injected into the CN is unlabeled (no fluorophone) and therefore, it is not possible to reliably assess the extent of viral spread in those experiments as performed. However, we have previously performed similar injections into the deep cerebellar nuclei and post hoc histology suggest all three nuclei will have at least some viral expression (Koster and Sherman, 2024). Due to size and injection location, we will mostly have reached the lateral (dentate) nuclei, but cannot exclude partial transsynaptic tracing from the interposed and medial nuclei.  

      It would indeed be interesting to further investigate the effect of CFs residing in different cerebellar lobules, which preferentially target different cerebellar nuclei, on targets of these nuclei.

      (4) Did you see any connection to the ventral tegmental area? Can you comment on whether dopamine pathways are influenced by CF and in your manipulations?

      We did not specifically look at these pathways and thus are not able to comment on this.

      (5) These are intensive surgeries, do you think glia could have influenced any results?

      This was not tested and seems unlikely, but we cannot exclude such possibility.

      (6) It is unclear in the methods how long animals were recorded for in each experiment. Can you add more detail?

      Additional detail was added to the methods. Recordings for all experimental configurations did not last more than 120 minutes in total. All data were analyzed across identical time windows for each experiment.

      (7) In the methods it was mentioned that recording length can differ between animals. Can this influence the results, and if so, how was that controlled for?

      There was a variance in recording length within experimental groups, but no systematic difference between groups.

      (8) I do not see any mention of animal sex throughout this manuscript. If animals were mixed groups, were sex differences considered? Would it be expected that CF activity would be different in male and female mice?

      As mentioned in the Methods (Animals), mice of either sex were used. No sex-dependent differences were observed.

      (9) Transsynaptic tracing results of the zona incerta are very interesting. The zona incerta is highly understudied, but has been linked to feeding, locomotion, arousal, and novelty seeking. Do you think this pathway would explain some of the behavioral results found through other studies of cerebellar lobule perturbations? Some discussion of how this brain region would be important as a cerebellar connection in animal behavior would be interesting.

      Since the multi-synaptic pathway from the cerebellum to S1 involves several brain regions with their own inputs and modulatory influences, it seems plausible to assume that behaviors controlled by these regions or affecting signaling pathways that regulate them would show some level of interaction. Our study does not address these interactions, but this will be an interesting question to be addressed in future work.

      Reviewer #3 (Recommendations for the authors):

      General comments on the data presentation:

      I'm not a huge fan of taking areas under curves ('AUC' throughout the study) when the integral of the quantity has no physical meaning - 'normalizing' the AUC (1I,L etc) is even stranger, because of course if you instead normalize the AUC by the # of data points, you literally just get the mean (which is probably what should be used instead).

      Indeed, AUC is equal to the average response in the time window used, multiplied by the window duration (thus, AUC is directly proportional to the mean). We choose to report AUC, a descriptive statistic, rather than the mean within this window. In 1I and L, we normalize the AUC across animals, essentially removing the variability across animals in the ‘Pre’ condition for visualization. Note the significance of these comparisons are consistent whether or not we normalize to the ‘Pre’ condition (non-normalized RWS data in I shows a significant increase in PN activity, p = 0.0068, signrank test; non-normalized RWS+CF data in I shows a significant decrease in PN activity, p = 0.0135, paired t-test; non-normalized RWS data in L shows a significant decrease in IN activity, p <0.001, paired t-test; non-normalized RWS+CF data in L shows no significant change in IN activity, p = 0.7789, paired t-test).

      I think unadorned bar charts are generally excluded from most journals now. Consider replacing these with something that shows the raw datapoints if not too many, or the distribution across points.

      We have replaced bar charts with box plots and violin plots. We have avoided plotting individual data points due to the quantity of points.

      In various places, the statistics produce various questionable outcomes that will draw unwanted reader scrutiny. Many of the examples below involve tiny differences in means with overlapping error bars that are "significant" or a few cases of nonoverlapping error bars that are "not significant." I think replacing the bar charts may help to resolve things here if we can see the whole distribution or the raw data points. As importantly, I think a big problem is that the statistical tests all seem to be nonparametric (they are ambiguously described in Table S3 as "Wilcoxon," which should be clarified, since there is an unpaired Wilcoxon test [rank sum] and a paired Wilcoxon test [sign rank]), and thus based on differences in the *median* whereas the bar charts are based on the *mean* (and SEM rather than MAD or IQR or other medianappropriate measure of spread). This should be fixed (either change the test or change the plots), which will hopefully allay many of the items below.

      We thank the reviewer for this important point. As mentioned in the Statistics and quantification section, Wilcoxon signed rank tests were used for non-normal data. We have replaced the bar charts with box plots which show the IQR and median, which indeed allays may of the items below.

      Here are some specific points on the statistics presentation:

      (1) 1G, the test says that following RWS+CF, the decrease in PN response is not significant. In 1I, the same data, but now over time, shows a highly significant decrease. This probably means that either the first test should be reconsidered (was this a paired comparison, which would "build in" the normalization subsequently used automatically?) or the second test should be reconsidered. It's especially strange because the n value in G, if based on cells, would seem to be ~50-times higher than that in I if based on mice.

      In Figure 1G, the analysis tests whether individual pyramidal neurons significantly changed their responses before vs. after RWS+CF stimulation. This is a paired comparison at the single-cell level, and here indicates that the average per-neuron response did not reliably decrease after RWS+CF when comparing each cell’s pre- and post-values directly. In contrast, Figure 1I examines the same dataset analyzed across time bins using a two-way ANOVA, which tests for effects of time, group (RWS vs. RWS+CF), and their interaction. The analysis showed a significant group effect (p < 0.001), indicating that the overall level of activity across all time points differed between RWS and RWS+CF conditions. The difference in significance between these two analyses arises because the first test (Fig. 1G) assesses within-neuron changes (paired), whereas the second test (Fig. 1I) assesses overall population-level differences between groups over time (independent groups). Thus, the tests address related but distinct questions—one about per-cell response changes, the other about how activity differs across experimental conditions.

      (2) 1J RWS+CF then shows a much smaller difference with overlapping error bars than the ns difference with nonoverlapping errors in 1G, but J gets three asterisks (same n-values).

      Bar graphs have been replaced with box plots.

      (3) 1K, it is very unclear what is under the asterisk could possibly be significant here, since the black and white dots overlap and trade places multiple times.

      See response to point 1. A significant group effect will exist if the aggregate difference across all time bins exceeds within-group variability. The asterisk therefore reflects a statistically significant main group effect (RWS versus RWS+CF) rather than differences at any single time point. Note, however, the very small effect size here.

      (4) 2B, 2G, 2H, 2I, 3G, 3H, 5C etc, again, significance with overlapping error bars, see suggestions above.

      Bar graphs have been replaced with box plots.

      (5) Time windows: e.g., L149-153 / 2B - this section reads weirdly. I think it would be less offputting to show a time-varying significance, if you want to make this point (there are various approaches to this floating around), or a decay rate, or something else.

      Here, we wanted to understand the overall direction of influence of CFs on VIP activity. We find that CFs exert a suppressive effect on VIP activity, which is statistically significant in this later time window. The specific effect of CF modulation on the activity of S1 neurons across multiple time points will be described in more detail in future investigations.

      (6) 4G, 6I, these asterisks again seem impossible (as currently presented).

      Bar graphs have been replaced with box plots.

      The writing is in generally ok shape, but needs tightening/clarifying:

      (1) L45 "mechanistic capacity" not clear.

      We have simplified this term to “capacity.” We use the term here to express that the central question we pose is whether CF signals are able to impact S1 circuits. We demonstrate CF signals indeed influence S1 circuits and further describe the mechanism through which this occurs, but we do not yet know all of the natural conditions in which this may occur. We feel that “capacity” describes the question we pose -- and our findings -- very well.

      (2) L48-58 there's a lot of material here, not clear how much is essential to the present study.

      We would like to give an overview of the literature on instructive CF signaling within the cerebellum. Here, we feel it is important to describe how CFs supervise learning in the cerebellum via coincident activation of parallel fiber inputs and CF inputs. Our results demonstrate CFs have the capacity to supervise learning in the neocortex in a similar manner, as coincident CF activation with sensory input modulates plasticity of S1 neurons.

      (3) L59 "has the capacity to" maybe just "can".

      This has been adopted. We agree that “can” is a more straightforward way of saying “has the capacity to” here. In this sentence, “can” and “has the capacity to” both mean a general ability to do something, without explicit knowledge about the conditions of use.

      (4) L61-62 some of this is circular "observation that CF regulates plasticity in S1..has consequences for plasticity in S1".

      We now changed this to read “…consequences for input processing in S1.”

      (5) L91 "already existing whisker input" although I get it, strictly speaking, not clear what this means.

      This sentence has been reworded for clarity.

      (6) L94 "this form of plasticity" what form?

      Edited to read “sensory-evoked plasticity.”

      (7) L119 should say "to test the".

      This has been corrected.

      (8) L120 should say "well-suited to measure receptive fields".

      We agree; this wording has been adopted.

      (9) L130 should say "optical imaging demonstrated that receptive field".

      This has been adopted.

      (10) L138, the disclaimer is helpful, but wouldn't it be less confusing to just pick a different set of terms? Response potentiation etc.

      Perhaps, but we want to stress that components of LTP and LTD (traditionally tested using electrophysiological methods to specifically measure synaptic gain changes) can be optically measured as long as it is specified what is recorded.

      (11) L140, this whole section is not very clear. What was the experiment? What was done and how?

      The text in this section has been updated.

      (12) L154, 156, 158, 160, 960, what is a "basic response"? Is this supposed to contrast with RWS? If so, I would just say "we measured the response to whisker stimulation without first performing RWS, and compared this to the whisker stimulation with simultaneous CF activation."

      What we meant by “basic response” was the acute response of S1 neurons to a single 100 ms air puff. Here, we indeed measured the acute responses of S1 neurons to whisker stimulation (100 ms air puff) and compared them to whisker stimulation with simultaneous CF activation (100 ms air puff with a 50 ms light pulse; the light pulse was delayed 45 ms with respect to the air puff). This paragraph has been reworded for clarity.

      (13) L156 "comprised of a majority" unclear. You mean most of the nonspecific IN group is either PV or SST?

      Yes, that was meant here. This paragraph has been reworded for clarity.

      (14) L165 tense. "are activated" "we tested" prob should be "were activated."

      This sentence was reworded.

      (15) L173 Not requesting additional experiments, but demonstrating that the effect is mimicked by directly activating SST or suppressing VIP questions the specificity of CF activation per se, versus presumably many other pathways upstream of the same mechanisms, which might be worth acknowledging in the text.

      We indeed observe that directly activating SST or suppressing VIP neurons in S1 is sufficient to mediate the effect of CF activation on S1 pyramidal neurons, implicating SST and VIP neurons as the local effectors of CF signaling. In the text, we wrote “...the notion of sufficiency does not exclude potential effects of plasticity processes elsewhere that might well modulate effector activation in this context and others not yet tested.” Here, we mean that CFs are certainly not the only modulators of the inhibitory network in S1. One example we highlight in the discussion is that projections from M1 are known to modulate this disinhibitory VIP-to-SST-to-PN microcircuit in S1. We conclude from our chemogenetic manipulation experiments that CFs ultimately have the capacity to modulate S1 interneurons, which must occur indirectly (either through the thalamus or “upstream” regions as this reviewer points out). The fact that many other brain regions may also modulate the interneuron network in S1 -- or be modulated by CF activity themselves -- only expands the capacity of CFs to exert a variety of effects on S1 neurons in different contexts.

      (16) L247 "induced ChR2" awkward.

      We changed this to read “we expressed ChR2.”

      (17) 6C, what are the three colors supposed to represent?

      We apologize for the missing labels in this version of the manuscript. Figure 6C and the figure legend have been updated.

  4. bafybeig7nrhxx3nyb5rfmuj7cfy5xbl4ldtwr57ol6lykibww625qkxnke.ipfs.dweb.link bafybeig7nrhxx3nyb5rfmuj7cfy5xbl4ldtwr57ol6lykibww625qkxnke.ipfs.dweb.link
    1. Author response:

      The following is the authors’ response to the original reviews

      We would like to thank all reviewers for their constructive and in-depth reviews. Thanks to your feedback, we realized that the main objective of the paper was not presented clearly enough, and that our use of the same “modality-agnostic” terminology for both decoders and representations caused confusion. We addressed these two major points as outlined in the following. 

      In the revised manuscript, we highlight that the main contribution of this paper is to introduce modality-agnostic decoders. Apart from introducing this new decoder type, we put forward their advantages in comparison to modality-specific decoders in terms of decoding performance and analyze the modality-invariant representations (cf. updated terminology in the following paragraph) that these decoders rely on. The dataset that these analyses are based on is released as part of this paper, in the spirit of open science (but this dataset is only a secondary contribution for our paper). 

      Regarding the terminology, we clearly define modality-agnostic decoders as decoders that are trained on brain imaging data from subjects exposed to stimuli in multiple modalities. The decoder is not given any information on which modality a stimulus was presented in, and is therefore trained to operate in a modality-agnostic way. In contrast, modality-specific decoders are trained only on data from a single stimulus modality. These terms are explained in Figure 2. While these terms describe different ways of how decoders can be trained, there are also different ways to evaluate them afterwards (see also Figure 3); but obviously, this test-time evaluation does not change the nature of the decoder, i.e., there is no contradiction in applying a modality-specific decoder to brain data from a different modality.

      Further, we identify representations that are relevant for modality-agnostic decoders using the searchlight analysis. We realized that our choice of using the same “modality-agnostic” term to describe these brain representations created unnecessary debate and confusion. In order to not conflate the terminology, in the updated manuscript we call these representations modality-invariant (and the opposite modality-dependent). Our methodology does not allow us to distinguish whether certain representations merely share representational structure to a certain degree, or are truly representations that abstract away from any modality-dependent information. However, in order to be useful for modality-agnostic decoding, a significant degree of shared representational structure is sufficient, and it is this property of brain representations that we now define as “modality-invariant”. 

      We updated the manuscript in line with this new terminology and focus: in particular, the first Related Work section on Modality-invariant brain representations, as well as the Introduction and Discussion.

      Public Reviews:

      Reviewer #1 (Public review):

      Summary:

      The authors introduce a densely-sampled dataset where 6 participants viewed images and sentence descriptions derived from the MS Coco database over the course of 10 scanning sessions. The authors further showcase how image and sentence decoders can be used to predict which images or descriptions were seen, using pairwise decoding across a set of 120 test images. The authors find decodable information widely distributed across the brain, with a left-lateralized focus. The results further showed that modality-agnostic models generally outperformed modality-specific models, and that data based on captions was not explained better by caption-based models but by modality-agnostic models. Finally, the authors decoded imagined scenes.

      Strengths:

      (1) The dataset presents a potentially very valuable resource for investigating visual and semantic representations and their interplay.

      (2) The introduction and discussion are very well written in the context of trying to understand the nature of multimodal representations and present a comprehensive and very useful review of the current literature on the topic.

      Weaknesses:

      (1) The paper is framed as presenting a dataset, yet most of it revolves around the presentation of findings in relation to what the authors call modality-agnostic representations, and in part around mental imagery. This makes it very difficult to assess the manuscript, whether the authors have achieved their aims, and whether the results support the conclusions.

      Thanks for this insightful remark. The dataset release is only a secondary contribution of our study; this was not clear enough in the previous version. We updated the manuscript to make the main objective of the paper more clear, as outlined in our general response to the reviews (see above).

      (2) While the authors have presented a potential use case for such a dataset, there is currently far too little detail regarding data quality metrics expected from the introduction of similar datasets, including the absence of head-motion estimates, quality of intersession alignment, or noise ceilings of all individuals.

      As already mentioned in the general response, the main focus of the paper is to introduce modality-agnostic decoders. The dataset is released in addition, this is why we did not focus on reporting extensive quality metrics in the original manuscript. To respond to your request, we updated the appendix of the manuscript to include a range of data quality metrics. 

      The updated appendix includes head motion estimates in the form of realignment parameters and framewise displacement, as well as a metric to assess the quality of intersession alignment. More detailed descriptions can be found in Appendix 1 of the updated manuscript.

      Estimating noise ceilings based on repeated presentations of stimuli (as for example done in Allen et al. (2022)) requires multiple betas for each stimulus. All training stimuli were only presented once, so this could only be done for the test stimuli which were presented repeatedly. However, during our preprocessing procedure we directly calculated stimulus-specific betas based on data from all sessions using one single GLM, which means that we did not obtain separate betas for repeated presentations of the same stimulus. We will however share the raw data publicly, so that such noise ceilings can be calculated using an adapted preprocessing procedure if required.

      Allen, E. J., St-Yves, G., Wu, Y., Breedlove, J. L., Prince, J. S., Dowdle, L. T., Nau, M., Caron, B., Pestilli, F., Charest, I., Hutchinson, J. B., Naselaris, T., & Kay, K. (2022). A massive 7T fMRI dataset to bridge cognitive neuroscience and artificial intelligence. Nature Neuroscience, 25(1), 116–126. https://doi.org/10.1038/s41593-021-00962-x

      (3) The exact methods and statistical analyses used are still opaque, making it hard for a reader to understand how the authors achieved their results. More detail in the manuscript would be helpful, specifically regarding the exact statistical procedures, what tests were performed across, or how data were pooled across participants.

      In the updated manuscript, we improved the level of detail for the descriptions of statistical analyses wherever possible (see also our response to your “Recommendations for the authors”, Point 6).

      Regarding data pooling across participants: 

      Figure 8 shows averaged results across all subjects (as indicated in the caption)

      Regarding data pooling for the estimation of the significance threshold of the searchlight analysis for modality-invariant regions: We updated the manuscript to clarify that we performed a permutation test, combined with a bootstrapping procedure to estimate a group-level null distribution: “For each subject, we evaluated the decoders 100 times with shuffled labels to create per-subject chance-level results. Then, we randomly selected one of the 100 chance-level results for each of the 6 subjects and calculated group-level statistics (TFCE values) the exact same way as described in the preceding paragraph. We repeated this procedure 10,000 times resulting in 10,000 permuted group-level results.”

      Additionally, we indicated that the same permutation testing methods were applied to assess the significance threshold for the imagery decoding searchlight maps (Figure 10). 

      (4) Many findings (e.g., Figure 6) are still qualitative but could be supported by quantitative measures.

      The Figures 6 and 7 are intentionally qualitative results to support the quantitative decoding results presented in Figures 4 and 5. (see also Reviewer 2 Comment 2)

      Figures 4 and 5 show pairwise decoding accuracy as a quantitative measure for evaluation of the decoders. This metric is the main metric we used to compare different decoder types and features. Based on the finding that modality-agnostic decoders using imagebind features achieve the best score on this metric, we performed the additional qualitative analysis presented in Figures 6 and 7. (Note that we expanded the candidate set for the qualitative analysis in order to have a larger and more diverse set of images.)

      (5) Results are significant in regions that typically lack responses to visual stimuli, indicating potential bias in the classifier. This is relevant for the interpretation of the findings. A classification approach less sensitive to outliers (e.g., 70-way classification) could avoid this issue. Given the extreme collinearity of the experimental design, regressors in close temporal proximity will be highly similar, which could lead to leakage effects.

      It is true that our searchlight analysis revealed significant activity in regions outside of the visual cortex. However, it is assumed that the processing of visual information does not stop at the border of the visual cortex. The integration of information such as the semantics of the image is progressively processed in other higher-level regions of the brain. Recent studies have shown that activity in large areas of the cortex (including many outside of the visual cortex) can be related to visual stimulation (Solomon et al. 2024; Raugel et al. 2025). Our work confirms this finding and we therefore do not see reason to believe that this is due to a bias in our decoders.

      Further, you are suggesting that we could replace our regression approach with a 70-way classification. However, this is difficult using our fMRI data as we do not see a straightforward way to assign the training and testing stimuli with class labels (the two datasets consist of non-overlapping sets of naturalistic images).

      To address your concerns regarding the collinearity of the experimental design and possible leakage effects, we trained and evaluated a decoder for one subject after running a “null-hypothesis” adapted preprocessing. More specifically, for all sessions, we shifted the functional data of all runs by one run (moving the data of the last run to the very front), but leaving the design matrices in place. Thereby, we destroyed the relationship of stimuli and brain activity but kept the original data and design with its collinearity (and possible biases). We preprocessed this adapted data for subject 1, and ran a whole-brain decoding using Imagebind features and verified that the decoding performance was at chance level:  Pairwise accuracy (captions): 0.43 | Pairwise accuracy (images): 0.47 | Pairwise accuracy (imagery): 0.50. This result provides evidence against the notion that potential collinearity or biases in our experimental design or evaluation procedure could have led to inflated results.

      Raugel, J., Szafraniec, M., Vo, H.V., Couprie, C., Labatut, P., Bojanowski, P., Wyart, V. and King, J.R. (2025). Disentangling the Factors of Convergence between Brains and Computer Vision Models. arXiv preprint arXiv:2508.18226.

      Solomon, S. H., Kay, K., & Schapiro, A. C. (2024). Semantic plasticity across timescales in the human brain. bioRxiv, 2024-02.

      (6) The manuscript currently lacks a limitations section, specifically regarding the design of the experiment. This involves the use of the overly homogenous dataset Coco, which invites overfitting, the mixing of sentence descriptions and visual images, which invites imagery of previously seen content, and the use of a 1-back task, which can lead to carry-over effects to the subsequent trial.

      Regarding the dataset CoCo: We agree that CoCo is somewhat homogenous, it is however much more diverse and naturalistic than the smaller datasets used in previous fMRI experiments with multimodal stimuli. Additionally, CoCo has been widely adopted as a benchmark dataset in the Machine Learning community, and features rich annotations for each image (e.g. object labels, segmentations, additional captions, people’s keypoints) facilitating many more future analyses based on our data.

      Regarding the mixing of sentence descriptions and images: Subjects were not asked to visualize sentences and different techniques for the one-back tasks might have been used. Generally, we do not see it as problematic if subjects are performing visual imagery to some degree while reading sentences, and this might even be the case during normal reading as well. A more targeted experiment comparing reading with and without interleaved visual stimulation in the form of images and a one-back task would be required to assess this, but this was not the focus of our study. For now, it is true that we can not be sure that our results generalize to cases in which subjects are just reading and are less incentivized to perform mental imagery.

      Regarding the use of a 1-back task: It was necessary to make some design choices in order to realize this large-scale data collection with approximately 10 hours of recording per subject. Specifically, the 1-back task was included in the experimental setup in order to assure continuous engagement of the participant during the rather long sessions of 1 hour. The subjects did indeed need to remember the previous stimulus to succeed at the 1-back task, which means that some brain activity during the presentation of a stimulus is likely to be related to the previous stimulus. We aimed to account for this confound during the preprocessing stage when fitting the GLM, which was fit to capture only the response to the presented image/caption, not the preceding one. Still, it might have picked up on some of the activity from preceding stimuli, causing some decrease of the final decoding performance.

      We added a limitations section to the updated manuscript to discuss these important issues.

      (7) I would urge the authors to clarify whether the primary aim is the introduction of a dataset and showing the use of it, or whether it is the set of results presented. This includes the title of this manuscript. While the decoding approach is very interesting and potentially very valuable, I believe that the results in the current form are rather descriptive, and I'm wondering what specifically they add beyond what is known from other related work. This includes imagery-related results. This is completely fine! It just highlights that a stronger framing as a dataset is probably advantageous for improving the significance of this work.

      Thanks a lot for pointing this out. Based on this comment and feedback from the other reviewers we restructured the abstract, introduction and discussion section of the paper to better reflect the primary aim. (cf. general response above).

      You further mention that it is not clear what our results add beyond what is known from related work. We list the main contributions here:

      A single modality-agnostic decoder can decode the semantics of visual and linguistic stimuli irrespective of the presentation modality with a performance that is not lagging behind modality-specific decoders.

      Modality-agnostic decoders outperform modality-specific decoders for decoding captions and mental imagery.

      Modality-invariant representations are widespread across the cortex (a range of previous work has suggested they were much more localized (Bright et al. 2004; Jung et al. 2018; Man et al. 2012; Simanova et al. 2014).

      Regions that are useful for imagery are largely overlapping with modality-invariant regions

      Bright, P., Moss, H., & Tyler, L. K. (2004). Unitary vs multiple semantics: PET studies of word and picture processing. Brain and language, 89(3), 417-432.

      Jung, Y., Larsen, B., & Walther, D. B. (2018). Modality-Independent Coding of Scene Categories in Prefrontal Cortex. Journal of Neuroscience, 38(26), 5969–5981.

      Liuzzi, A. G., Bruffaerts, R., Peeters, R., Adamczuk, K., Keuleers, E., De Deyne, S., Storms, G., Dupont, P., & Vandenberghe, R. (2017). Cross-modal representation of spoken and written word meaning in left pars triangularis. NeuroImage, 150, 292–307. https://doi.org/10.1016/j.neuroimage.2017.02.032

      Man, K., Kaplan, J. T., Damasio, A., & Meyer, K. (2012). Sight and Sound Converge to Form Modality-Invariant Representations in Temporoparietal Cortex. Journal of Neuroscience, 32(47), 16629–16636.

      Simanova, I., Hagoort, P., Oostenveld, R., & van Gerven, M. A. J. (2014). Modality-Independent Decoding of Semantic Information from the Human Brain. Cerebral Cortex, 24(2), 426–434.

      Reviewer #2 (Public review):

      Summary:

      This study introduces SemReps-8K, a large multimodal fMRI dataset collected while subjects viewed natural images and matched captions, and performed mental imagery based on textual cues. The authors aim to train modality-agnostic decoders--models that can predict neural representations independently of the input modality - and use these models to identify brain regions containing modality-agnostic information. They find that such decoders perform comparably or better than modality-specific decoders and generalize to imagery trials.

      Strengths:

      (1) The dataset is a substantial and well-controlled contribution, with >8,000 image-caption trials per subject and careful matching of stimuli across modalities - an essential resource for testing theories of abstract and amodal representation.

      (2) The authors systematically compare unimodal, multimodal, and cross-modal decoders using a wide range of deep learning models, demonstrating thoughtful experimental design and thorough benchmarking.

      (3) Their decoding pipeline is rigorous, with informative performance metrics and whole-brain searchlight analyses, offering valuable insights into the cortical distribution of shared representations.

      (4) Extension to mental imagery decoding is a strong addition, aligning with theoretical predictions about the overlap between perception and imagery.

      Weaknesses:

      While the decoding results are robust, several critical limitations prevent the current findings from conclusively demonstrating truly modality-agnostic representations:

      (1) Shared decoding ≠ abstraction: Successful decoding across modalities does not necessarily imply abstraction or modality-agnostic coding. Participants may engage in modality-specific processes (e.g., visual imagery when reading, inner speech when viewing images) that produce overlapping neural patterns. The analyses do not clearly disambiguate shared representational structure from genuinely modality-independent representations. Furthermore, in Figure 5, the modality-agnostic encoder did not perform better than the modality-specific decoder trained on images (in decoding images), but outperformed the modality-specific decoder trained on captions (in decoding captions). This asymmetry contradicts the premise of a truly "modality-agnostic" encoder. Additionally, given the similar performance between modality-agnostic decoders based on multimodal versus unimodal features, it remains unclear why neural representations did not preferentially align with multimodal features if they were truly modality-independent.

      We agree that successful modality-agnostic and cross-modal decoding does not necessarily imply that abstract patterns were decoded. In the updated manuscript, we therefore refer to these representations as modality-invariant (see also the updated terminology explained in the general response above).

      If participants are performing mental imagery when reading, and this is allowing us to perform cross-decoding, then this means that modality-invariant representations are formed during this mental imagery process, i.e. that the representations formed during this form of mental imagery are compatible with representations during visual perception (or, in your words, produce overlapping neural patterns). While we can not know to what extent people were performing mental imagery while reading (or having inner speech while viewing images), our results demonstrate that their brain activity allows for decoding across modalities, which implies that modality-invariant representations are present.

      It is true that our current analyses can not disambiguate modality-invariant representations (or, in your words, shared representational structure) from abstract representations (in your words, genuinely modality-independent representations). As the main goal of the paper was to build modality-agnostic decoders, and these only require what we call “modality-invariant” representations (see our updated terminology in the general reviewer response above), we leave this question open for future work. We do however discuss this important limitation in the Discussion section of the updated manuscript.

      Regarding the asymmetry of decoding results when comparing modality-agnostic decoders with the two respective modality-specific decoders for captions and images: We do not believe that this asymmetry contradicts the premise of a modality-agnostic decoder. Multiple explanations for this result are possible: (1) The modality-specific decoder for images might benefit from the more readily decodable lower-level modality-dependent neural activity patterns in response to images, which are less useful for the modality-agnostic decoder because they are not useful for decoding caption trials. The modality-specific decoders for captions might not be able to pick up on low-level modality-dependent neural activity patterns as these might be less easily decodable. 

      The signal-to-noise ratio for caption trials might be lower than for image trials (cf. generally lower caption decoding performance), therefore the addition of training data (even if it is from another modality) improves the decoding performance for captions, but not for images (which might be at ceiling already).

      Regarding the similar performance between modality-agnostic decoders based on multimodal versus unimodal features: Unimodal features are based on rather high-level features of the respective modality (e.g. last-layer features of a model trained for semantic image classification), which can be already modality-invariant to some degree. Additionally, as already mentioned before, in the updated manuscript we only require representations to be modality-invariant and not necessarily abstract.

      (2) The current analysis cannot definitively conclude that the decoder itself is modality-agnostic, making "Qualitative Decoding Results" difficult to interpret in this context. This section currently provides illustrative examples, but lacks systematic quantitative analyses.

      The qualitative decoding results in Figures 6 and 7 present exemplary qualitative results for the quantitative results presented in Figures 4 and 5 (see also Reviewer 1 Comment 4).

      Figures 4 and 5 show pairwise decoding accuracy as a quantitative measure for evaluation of the decoders. This metric is the main metric we used to compare different decoder types and features. Based on the finding that modality-agnostic decoders using imagebind features achieve the best score on this metric, we performed the additional qualitative analysis presented in Figures 6 and 7. (Note that we expanded the candidate set for the qualitative analysis in order to have a larger and more diverse set of images.)

      (3) The use of mental imagery as evidence for modality-agnostic decoding is problematic.

      Imagery involves subjective, variable experiences and likely draws on semantic and perceptual networks in flexible ways. Strong decoding in imagery trials could reflect semantic overlap or task strategies rather than evidence of abstraction.

      It is true that mental imagery does not necessarily rely on modality-agnostic representations. In the updated manuscript we revised our terminology and refer to the analyzed representations as modality-invariant, which we define as “representations that significantly overlap between modalities”. 

      The manuscript presents a methodologically sophisticated and timely investigation into shared neural representations across modalities. However, the current evidence does not clearly distinguish between shared semantics, overlapping unimodal processes, and true modality-independent representations. A more cautious interpretation is warranted.

      Nonetheless, the dataset and methodological framework represent a valuable resource for the field.

      We fully agree with these observations, and updated our terminology as outlined in the general response.

      Reviewer #3 (Public review):

      Summary:

      The authors recorded brain responses while participants viewed images and captions. The images and captions were taken from the COCO dataset, so each image has a corresponding caption, and each caption has a corresponding image. This enabled the authors to extract features from either the presented stimulus or the corresponding stimulus in the other modality.

      The authors trained linear decoders to take brain responses and predict stimulus features.

      "Modality-specific" decoders were trained on brain responses to either images or captions, while "modality-agnostic" decoders were trained on brain responses to both stimulus modalities. The decoders were evaluated on brain responses while the participants viewed and imagined new stimuli, and prediction performance was quantified using pairwise accuracy. The authors reported the following results:

      (1) Decoders trained on brain responses to both images and captions can predict new brain responses to either modality.

      (2) Decoders trained on brain responses to both images and captions outperform decoders trained on brain responses to a single modality.

      (3) Many cortical regions represent the same concepts in vision and language.

      (4) Decoders trained on brain responses to both images and captions can decode brain responses to imagined scenes.

      Strengths:

      This is an interesting study that addresses important questions about modality-agnostic representations. Previous work has shown that decoders trained on brain responses to one modality can be used to decode brain responses to another modality. The authors build on these findings by collecting a new multimodal dataset and training decoders on brain responses to both modalities.

      To my knowledge, SemReps-8K is the first dataset of brain responses to vision and language where each stimulus item has a corresponding stimulus item in the other modality. This means that brain responses to a stimulus item can be modeled using visual features of the image, linguistic features of the caption, or multimodal features derived from both the image and the caption. The authors also employed a multimodal one-back matching task, which forces the participants to activate modality-agnostic representations. Overall, SemReps-8K is a valuable resource that will help researchers answer more questions about modality-agnostic representations.

      The analyses are also very comprehensive. The authors trained decoders on brain responses to images, captions, and both modalities, and they tested the decoders on brain responses to images, captions, and imagined scenes. They extracted stimulus features using a range of visual, linguistic, and multimodal models. The modeling framework appears rigorous, and the results offer new insights into the relationship between vision, language, and imagery. In particular, the authors found that decoders trained on brain responses to both images and captions were more effective at decoding brain responses to imagined scenes than decoders trained on brain responses to either modality in isolation. The authors also found that imagined scenes can be decoded from a broad network of cortical regions.

      Weaknesses:

      The characterization of "modality-agnostic" and "modality-specific" decoders seems a bit contradictory. There are three major choices when fitting a decoder: the modality of the training stimuli, the modality of the testing stimuli, and the model used to extract stimulus features. However, the authors characterize their decoders based on only the first choice-"modality-specific" decoders were trained on brain responses to either images or captions, while "modality-agnostic" decoders were trained on brain responses to both stimulus modalities. I think that this leads to some instances where the conclusions are inconsistent with the methods and results.

      In our analysis setup, a decoder is entirely determined by two factors: (1) the modality of the stimuli that the subject was exposed to, and (2) the machine learning model used to extract stimulus features.

      The modality of the testing stimuli defines whether we are evaluating the decoder in a within-modality or cross-modality setting, but is not an inherent characteristic of a trained decoder

      First, the authors suggest that "modality-specific decoders are not explicitly encouraged to pick up on modality-agnostic features during training" (line 137) while "modality-agnostic decoders may be more likely to leverage representations that are modality-agnostic" (line 140). However, whether a decoder is required to learn modality-agnostic representations depends on both the training responses and the stimulus features. Consider the case where the stimuli are represented using linguistic features of the captions. When you train a "modality-specific" decoder on image responses, the decoder is forced to rely on modality-agnostic information that is shared between the image responses and the caption features. On the other hand, when you train a "modality-agnostic" decoder on both image responses and caption responses, the decoder has access to the modality-specific information that is shared by the caption responses and the caption features, so it is not explicitly required to learn modality-agnostic features. As a result, while the authors show that "modality-agnostic" decoders outperform "modality-specific" decoders in most conditions, I am not convinced that this is because they are forced to learn more modality-agnostic features.

      It is true that for example a modality-specific decoder trained on fmri data from images with stimulus features extracted from captions might also rely on modality-invariant features. We still call this decoder modality-specific, as it has been trained to decode brain activity recorded from a specific stimulus modality. In the updated manuscript we corrected the statement that “modality-specific decoders are not explicitly encouraged to pick up on modality-invariant features during training” to include the case of decoders trained on features from the other modality which might also rely on modality-invariant features.

      It is true that a modality-agnostic decoder can also have access to modality-dependent information for captions and images. However, as it is trained jointly with both modalities and the modality-dependent features are not compatible, it is encouraged to rely on modality-invariant features. The result that modality-agnostic decoders are outperforming modality-specific decoders trained on captions for decoding captions confirms this, because if the decoder was only relying on modality-dependent features the addition of additional training data from another stimulus modality could not increase the performance. (Also, the lack of a performance drop compared to modality-specific decoders trained on images is only possible thanks to the reliance on modality-invariant features. If the decoder only relied on modality-dependent features the addition of data from another modality would equal an addition of noise to the training data which must result in a performance drop at test time.). We can not exclude the possibility that modality-agnostic decoders are also relying on modality-dependent features, but our results suggest that they are relying at least to some degree on modality-invariant features.

      Second, the authors claim that "modality-specific decoders can be applied only in the modality that they were trained on, while "modality-agnostic decoders can be applied to decode stimuli from multiple modalities, even without knowing a priori the modality the stimulus was presented in" (line 47). While "modality-agnostic" decoders do outperform "modality-specific" decoders in the cross-modality conditions, it is important to note that "modality-specific" decoders still perform better than expected by chance (figure 5). It is also important to note that knowing about the input modality still improves decoding performance even for "modality-agnostic" decoders, since it determines the optimal feature space-it is better to decode brain responses to images using decoders trained on image features, and it is better to decode brain responses to captions using decoders trained on caption features.

      Thanks for this important remark. We corrected this statement and now say that “modality-specific decoders that are trained to be applied only in the modality that they were trained on”, highlighting that their training process optimizes them for decoding in a specific modality. They can indeed be applied to the other modality at test time, this however results in a substantial performance drop.

      It is true that knowing the input modality can improve performance even for modality-agnostic decoders. This can most likely be explained by the fact that in that case the decoder can leverage both, modality-invariant and modality-dependent features. We will not further focus on this result however as the main motivation to build modality-agnostic decoders is to be able to decode stimuli without knowing the stimulus modality a priori. 

      Recommendations for the authors:

      Reviewer #1 (Recommendations for the authors):

      I will list additional recommendations below in no specific order:

      (1) I find the term "modality agnostic" quite unusual, and I believe I haven't seen it used outside of the ML community. I would urge the authors to change the terminology to be more common, or at least very early explain why the term is much better suited than the range of existing terms. A modality agnostic representation implies that it is not committed to a specific modality, but it seems that a representation cannot be committed to something.

      In the updated manuscript we now refer to the identified brain patterns as modality-invariant, which has previously been used in the literature (Man et al. 2012; Devereux et al. 2013; Patterson et al. 2016; Deniz et al. 2019, Nakai et al. 2021) (see also the general response on top and the Introduction and Related Work sections of the updated manuscript).

      We continue to refer to the decoders as modality-agnostic, as this is a new type of decoder, and describes the fact that they are trained in a way that abstracts away from the modality of the stimuli. We chose this term as we are not aware of any work in which brain decoders were trained jointly on multiple stimulus modalities and in order not to risk contradictions/confusions with other definitions.

      Deniz, F., Nunez-Elizalde, A. O., Huth, A. G., & Gallant, J. L. (2019). The Representation of Semantic Information Across Human Cerebral Cortex During Listening Versus Reading Is Invariant to Stimulus Modality. Journal of Neuroscience, 39(39), 7722–7736. https://doi.org/10.1523/JNEUROSCI.0675-19.2019

      Devereux, B. J., Clarke, A., Marouchos, A., & Tyler, L. K. (2013). Representational Similarity Analysis Reveals Commonalities and Differences in the Semantic Processing of Words and Objects. The Journal of Neuroscience, 33(48).

      Nakai, T., Yamaguchi, H. Q., & Nishimoto, S. (2021). Convergence of Modality Invariance and Attention Selectivity in the Cortical Semantic Circuit. Cerebral Cortex, 31(10), 4825–4839. https://doi.org/10.1093/cercor/bhab125

      Man, K., Kaplan, J. T., Damasio, A., & Meyer, K. (2012). Sight and Sound Converge to Form Modality-Invariant Representations in Temporoparietal Cortex. Journal of Neuroscience, 32(47), 16629–16636.

      Patterson, K., & Lambon Ralph, M. A. (2016). The Hub-and-Spoke Hypothesis of Semantic Memory. In Neurobiology of Language (pp. 765–775). Elsevier. https://doi.org/10.1016/B978-0-12-407794-2.00061-4

      (2) The table in Figure 1B would benefit from also highlighting the number of stimuli that have overlapping captions and images.

      The number of overlapping stimuli is rather small (153-211 stimuli depending on the subject). We added this information to Table 1B. 

      (3) The authors wrote that training stimuli were presented only once, yet they used a one-back task. Did the authors also exclude the first presentation of these stimuli?

      Thanks for pointing this out. It is indeed true that some training stimuli were presented more than once, but only for the case of one-back target trials. In these cases the second presentation of the stimulus was excluded, but not the first. As the subject can not be aware of the fact that the upcoming presentation is going to be a one-back target, the first presentation can not be affected by the presence of the subsequent repeated presentation. We updated the manuscript to clarify this issue.

      (4) Coco has roughly 80-90 categories, so many image captions will be extremely similar (e.g., "a giraffe walking", "a surfer on a wave", etc.). How can people keep these apart?

      It is true that some captions and images are highly similar even though they are not matching in the dataset. This might result in several false button presses because the subjects identified an image-caption pair as matching when in fact it wasn't intended to. However, as there was no feedback given on the task performance, this issue should not have had a major influence on the brain activity of the participants.

      (5) Footnotes for statistics are quite unusual - could the authors integrate statistics into the text?

      Thanks for this remark, in the updated manuscript all statistics are part of the main text.

      (6) It may be difficult to achieve the assumptions of a permutation test - exchangeability, which may bias statistical results. It is not uncommon for densely sampled datasets to use bootstrap sampling on the predictions of the test data to identify if a given percentile of that distribution crosses 0. The lowest p-value is given by the number of bootstrap samples (e.g., if all 10,000 bootstrap samples are above chance, then p < 0.0001). This may turn out to be more effective.

      Thanks for this comment. Our statistical procedure was in fact involving a bootstrapping procedure to generate a null distribution on the group-level. We updated the manuscript to describe this method in more detail. Here is the updated paragraph: “To estimate the statistical significance of the resulting clusters we performed a permutation test, combined with a bootstrapping procedure to estimate a group-level null distribution see also Stelzer et al., 2013). For each subject, we evaluated the decoders 100 times with shuffled labels to create per-subject chance-level results. Then, we randomly selected one of the 100 chance-level results for each of the 6 subjects and calculated group-level statistics (TFCE values) the exact same way as described in the preceding paragraph. We repeated this procedure 10,000 times resulting in 10,000 permuted group-level results. We ensured that every permutation was unique, i.e. no two permutations were based on the same combination of selected chance-level results. Based on this null distribution, we calculated p-values for each vertex by calculating the proportion of sampled permutations where the TFCE value was greater than the observed TFCE value. To control for multiple comparisons across space, we always considered the maximum TFCE score across vertices for each group-level permutation (Smith and Nichols, 2009).”

      (7) The authors present no statistical evidence for some of their claims (e.g., lines 335-337). It would be good if they could complement this in their description. Further, the visualization in Figure 4 is rather opaque. It would help if the authors could add a separate bar for the average modality-specific and modality-agnostic decoders or present results in a scatter plot, showing modality-specific on the x-axis and modality-agnostic on the y-axis and color-code the modality (i.e., making it two scatter colors, one for images, one for captions). All points will end up above the diagonal.

      We updated the manuscript and added statistical evidence for the claims made:

      We now report results for the claim that when considering the average decoding performance for images and captions, modality-agnostic decoders perform better than modality-specific decoders, irrespective of the features that the decoders were trained on.

      Additionally, we report the average modality-agnostic and modality-specific decoding accuracies corresponding to Figure 4. For modality-agnostic decoders the average value is 81.86\%, for modality-specific decoders trained on images 78.15\%, and for modality-specific decoders trained on captions 72.52\%. We did not add a separate bar to Figure 4 as this would add additional information to a Figure which is already very dense in its information content (cf. Reviewers 2’s recommendations for the authors). We therefore believe it is more useful to report the average values in the text and provide results for a statistical test comparing the decoder types. A scatter plot would make it difficult to include detailed information on the features, which we believe is crucial.

      We further provide statistical evidence for the observation regarding the directionality of cross-modal decoding.

      Reviewer #2 (Recommendations for the authors):

      For achieving more evidence to support modality-agnostic representations in the brain, I suggest more thorough analyses, for example:

      (1) Traditional searchlight RSA using different deep learning models. Through this approach, it might identify different brain areas that are sensitive to different formats of information (visual, text, multimodal); subsequently, compare the decoding performance using these ROIs.

      (2) Build more dissociable decoders for information of different modality formats, if possible. While I do not have a concrete proposal, more targeted decoder designs might better dissociate representational formats (i.e., unimodal vs. modality-agnostic).

      (3) A more detailed exploration of the "qualitative decoding results"--for example, quantitatively examining error types produced by modality-agnostic versus modality-specific decoders--would be informative for clarifying what specific content the decoder captures, potentially providing stronger evidence for modality-agnostic representations.

      Thanks for these suggestions. As the main goal of the paper is to introduce modality-agnostic decoders (which should be more clear from the updated manuscript, see also the general response to reviews), we did not include alternative methods for identifying modality-invariant regions. Nonetheless, we agree that in order to obtain more in-depth insight into the nature of representations that were recorded, performing analyses with additional methods such as RSA, comparisons with more targeted decoder designs in terms of their target features will be indispensable, as well as more in-depth error type analyses. We leave these analyses as promising directions for future work.

      The writing could be further improved in the introduction and, accordingly, the discussion. The authors listed a series of theories about conceptual representations; however, they did not systematically explain the relationships and controversies between them, and it seems that they did not aim to address the issues raised by these theories anyway. Thus, the extraction of core ideas is suggested. The difference between "modality-agnostic" and terms like "modality-independent," "modality-invariant," "abstract," "amodal," or "supramodal," and the necessity for a novel term should be articulated.

      The updated manuscript includes an improved introduction and discussion section that highlight the main focus and contributions of the study.

      We believe that a systematic comparison of theories on conceptual representations involving their relationships and controversies would require a dedicated review paper. Here, we focused on the aspects that are relevant for the study at hand (modality-invariant representations), for which we find that none of the considered theories can be rejected based on our results.

      Regarding the terminology (modality-agnostic vs. modality-invariant, ..) please refer to the general response.

      The figures also have room to improve. For example, Figures 4 and 5 present dense bar plots comparing multiple decoding settings (e.g., modality-specific vs. modality-agnostic decoders, feature space, within-modal vs. cross-modal, etc.); while comprehensive, they would benefit from clearer labels or separated subplots to aid interpretation. All figures are recommended to be optimized for greater clarity and directness in future revisions.

      Thanks for this remark. We agree that the figures are quite dense in information. However, splitting them up into subplots (e.g. separate subplots for different decoder types) would make it much less straightforward to compare the accuracy scores between conditions. As the main goal of these figures is to compare features and decoder types, we believe that it is useful to keep all information in the same plot. 

      You are also suggesting to improve the clarity of the labels. It is true that the top left legend of Figures 4 and 5 was mixing information about decoder type and broad classes of features  (vision/language/multimodal). To improve clarity, we updated the figures and clearly separated information on decoder type (the hue of different bars) and features (x-axis labels).  The broad classes of features (vision/language/multimodal) are distinguished by alternating light gray background colors and additional labels at the very bottom of the plots.

      The new plots allow for easy performance comparison of the different decoder types and additionally provide information on confidence intervals for the performance of modality-specific decoders, which was not available in the previous figures.

      Reviewer #3 (Recommendations for the authors):

      (1) As discussed in the Public Review, I think the paper would greatly benefit from clearer terminology. Instead of describing the decoders as "modality-agnostic" and "modality-specific", perhaps the authors could describe the decoding conditions based on the train and test modalities (e.g., "image-to-image", "caption-to-image", "multimodal-to-image") or using the terminology from Figure 3 (e.g., "within-modality", "cross-modality", "modality-agnostic").

      We updated our terminology to be clearer and more accurate, as outlined in the general response. The terms modality-agnostic and modality-specific refer to the training conditions, and the test conditions are described in Figure 3 and are used throughout the paper.

      (2) Line 244: I think the multimodal one-back task is an important aspect of the dataset that is worth highlighting. It seems to be a relatively novel paradigm, and it might help ensure that the participants are activating modality-agnostic representations.

      It is true that the multimodal one-back task could play an important role for the activation of modality-invariant representations. Future work could investigate to what degree the presence of widespread modality-invariant representations is dependent on such a paradigm.

      (3) Line 253: Could the authors elaborate on why they chose a random set of training stimuli for each participant? Is it to make the searchlight analyses more robust?

      A random set of training stimuli was chosen in order to maximize the diversity of the training sets, i.e. to avoid bias based on a specific subsample of the CoCo dataset. Between-subject comparisons can still be made based on the test set which was shared for all subjects, with the limitation that performance differences due to individual differences or to the different training sets can not be disentangled. However, the main goal of the data collection was not to make between-subject comparisons based on common training sets, but rather to make group-level analyses based on a large and maximally diverse dataset. 

      (4) Figure 4: Could the authors comment more on the patterns of decoding performance in Figure 5? For instance, it is interesting that ResNet is a better target than ViT, and BERT-base is a better target than BERT-large.

      A multitude of factors influence the decoding performance, such as features dimensionality, model architecture, training data, and training objective(s) (Conwell et al. 2023; Raugel et al. 2025). Bert-base might be better than bert-large because the extracted features are of lower dimension. Resnet might be better than ViT because of its architecture (CNN vs. Transformer). To dive deeper into these differences further controlled analysis would be necessary, but this is not the focus of this paper. The main objective of the feature comparison was to provide a broad overview over visual/linguistic/multimodal feature spaces and to identify the most suitable features for modality-agnostic decoding.

      Conwell, C., Prince, J. S., Kay, K. N., Alvarez, G. A., & Konkle, T. (2023). What can 1.8 billion regressions tell us about the pressures shaping high-level visual representation in brains and machines? (p. 2022.03.28.485868). bioRxiv. https://doi.org/10.1101/2022.03.28.485868

      Raugel, J., Szafraniec, M., Vo, H.V., Couprie, C., Labatut, P., Bojanowski, P., Wyart, V. and King, J.R. (2025). Disentangling the Factors of Convergence between Brains and Computer Vision Models. arXiv preprint arXiv:2508.18226.

      (5) Figure 7: It is interesting that the modality-agnostic decoder predictions mostly appear traffic-related. Is there a possibility that the model always produces traffic-related predictions, making it trivially correct for the presented stimuli that are actually traffic-related? It could be helpful to include some examples where the decoder produces other types of predictions to dispel this concern.

      The presented qualitative examples were randomly selected. To make sure that the decoder is not always predicting traffic-related content, we included 5 additional randomly selected examples in Figures 6 and 7 of the updated manuscript. In only one of the 5 new examples the decoder was predicting traffic-related content, and in this case the stimulus had actually been traffic-related (a bus).

    1. Note: This response was posted by the corresponding author to Review Commons. The content has not been altered except for formatting.

      Learn more at Review Commons


      Reply to the reviewers

      __Reviewer #1 (Evidence, reproducibility and clarity (Required)): __

      This study explores chromatin organization around trans-splicing acceptor sites (TASs) in the trypanosomatid parasites Trypanosoma cruzi, T. brucei and Leishmania major. By systematically re-analyzing MNase-seq and MNase-ChIP-seq datasets, the authors conclude that TASs are protected by an MNase-sensitive complex that is, at least in part, histone-based, and that single-copy and multi-copy genes display differential chromatin accessibility. Altogether, the data suggest a common chromatin landscape at TASs and imply that chromatin may modulate transcript maturation, adding a new regulatory layer to an unusual gene-expression system.

      I value integrative studies of this kind and appreciate the careful, consistent data analysis the authors implemented to extract novel insights. That said, several aspects require clarification or revision before the conclusions can be robustly supported. My main concerns are listed below, organized by topic/result section.

      TAS prediction * Why were TAS predictions derived only from insect-stage RNA-seq data? Restricting TAS calls to one life stage risks biasing predictions toward transcripts that are highly expressed in that stage and may reduce annotation accuracy for lowly expressed or stage-specific genes. Please justify this choice and, if possible, evaluate TAS robustness using additional transcriptomes or explicitly state the limitation.

      TAS predictions derived only from insect-stage RNA-seq data because in a previous study it was shown that there are no significant differences between stages in the 5'UTR procesing in T. cruzi life stages (https://doi.org/10.3389/fgene.2020.00166) We are not testing an additional transcriptome here, because the robustness of the software was already probed in the original article were UTRme was described (Radio S, 2018 doi:10.3389/fgene.2018.00671).

      Results - "There is a distinctive average nucleosome arrangement at the TASs in TriTryps": * You state that "In the case of L. major the samples are less digested." However, Supplementary Fig. S1 suggests that replicate 1 of L. major is less digested than the T. brucei samples, while replicate 2 of L. major looks similarly digested. Please clarify which replicates you reference and correct the statement if needed.

      The reviewer has a good point. We made our statement based on the value of the maximum peak of the sequenced DNA molecules, which in general is a good indicative of the extension of the digestion achieved by the sample (Cole H, NAR, 2011).

      As the reviewer correctly points, we should have also considered the length of the DNA molecules in each percentile. However, in this case both, T. brucei's and L major's samples were gel purified before sequencing and it is hard to know exactly what fragments were left behind in each case. Therefore, it is better not to over conclude on that regard.

      We have now comment on this in the main manuscript, and we have clarified in the figure legends which data set we used in each case in the figure legends and in Table S1.

      * It appears you plot one replicate in Fig. 1b and the other in Suppl. Fig. S2. Please indicate explicitly which replicate is in each plot. For T. brucei, the NDR upstream of the TAS is clearer in Suppl. Fig. S2 while the TAS protection is less prominent; based on your digestion argument, this should correspond to the more-digested replicate. Please confirm.

      The replicates used for the construction of each figure are explicitly indicated in Table S1. Although we have detailed in the table the original publication, the project and accession number for each data set, the reviewer is correct that in this case it was still not completely clear to which length distribution heatmap was each sample associated with. To avoid this confusion, we have now added the accession number for each data set to the figure legends and also clarified in Table S1. Regarding the reviewer's comment on the correspondence between the observed TAS protection and the extent of samples digestion, he/she is correct that for a more digested sample we would expect a clearer NDR. In this case, the difference in the extent of digestion between these two samples is minor, as observed the length of the main peak in the length distribution histogram for sequenced DNA molecules is the same. These two samples GSM5363006, represented in Fig1 b, and GSM5363007, represented in S2, belong to the same original paper (Maree et al 2017), and both were gel purified before sequencing. Therefore, any difference between them could not only be the result of a minor difference in the digestion level achieved in each experiment but could be also biased by the fragments included or not during gel purification. Therefore, I would not over conclude about TAS protection from this comparison. We have now included a brief comment on this, in the figure discussion

      * The protected region around the TAS appears centered on the TAS in T. brucei but upstream in L. major. This is an interesting difference. If it is technical (different digestion or TAS prediction offset), explain why; if likely biological, discuss possible mechanisms and implications.

      We appreciate the reviewer suggestion. We cannot assure if it is due to technical or biological reasons, but there is evidence that L. major 's genome has a different dinucleotide content and it might have an impact on nucleosome assembly. We have now added a comment about this observation in the final discussion of the manuscript.

      Additionally, we analyzed DRIP-seq data for L. major, recently published doi: 10.1038/s41467-025-56785-y, and we observed that the R-loop footprint co-localized with the MNase-protected region upstream of the TAS (new S5 Fig), suggesting that the shift is not related to the MNase-seq technique.

      Results - "An MNase sensitive complex occupies the TASs in T. brucei": * The definition of "MNase activity" and the ordering of samples into Low/Intermediate/High digestion are unclear. Did you infer digestion levels from fragment distributions rather than from controlled experimental timepoints? In Suppl. Fig. S3a it is not obvious how "Low digestion" was defined; that sample's fragment distribution appears intermediate. Please provide objective metrics (e.g., median fragment length, fraction 120-180 bp) used to classify digestion levels.

      As the reviewer suggests, the ideal experiment would be to perform a time course of MNase reaction with all the samples in parallel, or to work with a fixed time point adding increasing amounts of MNase. However, even when making controlled experimental timepoints, you need to check the length distribution histogram of sequenced DNA molecules to be sure which level of digestion you have achieved.

      In this particular case, we used public available data sets to make this analysis. We made an arbitrary definition of low, intermediate and high level of digestion, not as an absolute level of digestion, but as a comparative output among the tested samples. We based our definition on the comparison of __the main peak in length distribution heatmaps because this parameter is the best metric to estimate the level of digestion of a given sample. It represents the percentage of the total DNA sequenced that contains the predominant length in the sample tested. __Hence, we considered:

      low digestion: when the main peak is longer than the expected protection for a nucleosome (longer than 150 bp). We expect this sample to contain additional longer bands that correspond to less digested material.

      intermediate digestion, when the main peak is the expected for the nucleosome core-protection (˜146-150bp).

      high digestion, when the main peak is shorter than that (shorter than 146 bp). This case, is normally accompanied by a bigger dispersion in fragment sizes.

      To do this analysis, we chose samples that render different MNase protection of the TAS when plotting all the sequenced DNA molecules relative to this point and we used this protection as a predictor of the extent of sample digestion (Figure 2). To corroborate our hypothesis, that the degree of TAS protection was indeed related to the extent of the MNase digestion of a given sample, we looked at the length distribution histogram of the sequenced DNA molecules in each case. It is the best measurement of the extent of the digestion achieved, especially, when sequencing the whole sample without any gel purification and representing all the reads in the analysis as we did. The only caveat is with the sample called "intermediate digestion 1" that belongs to the original work of Mareé 2017, since only this data set was gel purified. To avoid this problem, we decided to remove this data from figures 2 and S3. In summary, the 3 remaining samples comes from the same lab, and belong to the same publication (Mareé 2022). These sample are the inputs of native MNase ChIp-seq, obtain the same way, totally comparable among each other.

      * Several fragment distributions show a sharp cutoff at ~100-125 bp. Was this due to gel purification or bioinformatic filtering? State this clearly in Methods. If gel purification occurred, that can explain why some datasets preserve the MNase-sensitive region.

      The sharp cutoff is neither due to gel purification or bioinformatic filtering, it is just due to the length of the paired-end read used in each case. In earlier works the most common was to sequence only 50bp, with the improvement of technologies it went up to 75,100 or 125 bp. We have now clarified in Table S1 the length of the paired-reads used in each case when possible.

      * Please reconcile cases where samples labeled as more-digested contain a larger proportion of >200 bp fragments than supposedly less-digested samples; this ordering affects the inference that digestion level determines the loss/preservation of TAS protection. Based on the distributions I see, "Intermediate digestion 1" appears most consistent with an expected MNase curve - please confirm and correct the manuscript accordingly.

      As explained above, it's a common observation in MNase digestion of chromatin that more extensive digestion can still result in a broad range of fragment sizes, including some longer fragments. This seemingly counter-intuitive result is primarily due to the non-uniform accessibility of chromatin and the sequence preference of the MNase enzyme, which has a preference for AT reach sequences.

      The rationale of this is as follows: when you digest chromatin with MNase and the objective is to map nucleosomes genome-wide, the ideal situation would be to get the whole material contained in the mononucleosome band. Given that MNase is less efficient to digest protected DNA but, if the reaction proceeds further, it always ends up destroying part of it, the result is always far from perfect. The better situation we can get, is to obtain samples were ˜80% of the material is contained in the mononucloesome band. __And here comes the main point: __even in the best scenario, you always get some additional longer bands, such as those for di or tri nucleosomes. If you keep digesting, you will get less than 80 % in the nucleosome band and, those remaining DNA fragments that use to contain di and tri nucleosomes start getting digested as well, originating a bigger dispersion in fragments sizes. How do we explain persistence of Long Fragments? The longest fragments (di-, tri-nucleosomes) that persist in a highly digested sample are the ones that were originally most highly protected by proteins or higher-order structure, or by containing a poor AT sequence content, making their linker DNA extremely resistant to initial cleavage. Once the majority of the genome is fragmented, these few resistant longer fragments become a more visible component of the remaining population, contributing to a broader size dispersion. Hence, you end up observing a bigger dispersion in length distributions in the final material. Bottom line, it is not a good practice to work with under or over digested samples. Our main point, is to emphasize that especially when comparing samples, it important to compare those with comparable levels of digestion. Otherwise, a different sampling of the genome will be represented in the remaining sequenced DNA.

      Results - "The MNase sensitive complexes protecting the TASs in T. brucei and T. cruzi are at least partly composed of histones": * The evidence that histones are part of the MNase-sensitive complex relies on H3 MNase-ChIP signal in subnucleosomal fragment bins. This seems to conflict with the observation (Fig. 1) that fragments protecting TASs are often nucleosome-sized. Please reconcile these points: are H3 signals confined to subnucleosomal fragments flanking the TAS while the TAS itself is depleted of H3? Provide plots that compare MNase-seq and H3 ChIP signals stratified by consistent fragment-size bins to clarify this.

      What we learned from other eukaryotic organisms that were deeply studied, such as yeast, is that NDRs are normally generated at regulatory points in the genome. In this sense, yeast tRNA genes have a complex with a bootprint smaller than a nucleosome formed by TFIIIC-TFIIB (Nagarajavel, doi: 10.1093/nar/gkt611). On the other hand, many promotor regions have an MNase-sensitive complex with a nucleosome-size footprint, but it does not contain histones (Chereji, et al 2017, doi:10.1016/j.molcel.2016.12.009). The reviewer is right that from Figure 1 and S2 we could observe that the footprint of whatever occupies the TAS region, especially in T. brucei, is nucleosome-size. However, it only shows the size, but it doesn't prove the nature of its components. Nevertheless, those are only MNase-seq data sets. Since it does not include a precipitation with specific antibodies, we cannot confirm the protecting complex is made up by histones. In parallel, a complementary study by Wedel 2017, from Siegel's lab, shows that using a properly digested sample and further immunoprecipitating with a-H3 antibody, the TAS is not protected by nucleosomes at least not when analyzing nucleosome size-DNA molecules. Besides, Briggs et. al 2018 (doi: 10.1093/nar/gky928) showed that at least at intergenic regions H3 occupancy goes down while R-loops accumulation increases. We have now added a new figure 4 replotting R-loops and MNase-ChIP-seq for H3 relative to our predicted TAS showing this anti-correlation and how it partly correlates with MNase protection as well. As a control we show that Rpb9 trends resembles H3 as Siegel's lab have shown in Wedel 2018. Moreover, we analyzed redate from a recently published paper (doi: 10.1038/s41467-025-56785-y) added a new supplemental figure 5 showing that a similar correlation between MNase protection and R-loop footprint occurs in L. major (S5 Fig).

      * Please indicate which datasets are used for each panel in Suppl. Fig. S4 (e.g., Wedel et al., Maree et al.), and avoid calling data from different labs "replicates" unless they are true replicates.

      In most of our analysis we used real replicated experiments. Such is the case MNase-seq data used in Figure 1, with the corresponding replicate experiments used in Figure S2; T. cruzi MNase-ChIP-seq data used in Figure 3b and 4a with the respective replicate used in Figures S4 and S5 (now S6 in the revised manuscript). The only case in which we used experiments coming from two different laboratories, is in the case of MNase-ChIP-seq for H3 from T. brucei. Unfortunately, there are only two public data sets coming each of them from different laboratories. The samples used in Fig 3 (from Siegel's lab) whether the IP from H3 represented in S4 and S5 (S6 n the updated version) comes from another lab (Patterton's). To be more rigorous, we now call them data 1 and 2 when comparing these particular case.

      The reviewer is right that in this particular case one is native chromatin (Pattertons') while the other one is crosslinked (Siegel's). We have now clarified it in the main text that unfortunately we do not count on a replicate but even under both condition the result remains the same, and this is compatible with my own experience, were crosslinking does not affect the global nucleosome patterns (compared nucleosome organization from crosslinked chromatin MNAse-seq inputs Chereji, Mol Cell, 2017 doi: 10.1016/j.molcel.2016.12.009 and native MNase-seq from Ocampo, NAR, 2016 doi: 10.1093/nar/gkw068).

      * Several datasets show a sharp lower bound on fragment size in the subnucleosomal range (e.g., ~80-100 bp). Is this a filtering artifact or a gel-size selection? Clarify in Methods and, if this is an artifact, consider replotting after removing the cutoff.

      We have only filtered adapter dimmer or overrepresented sequences when needed. In Figures 2 and S3 we represented all the sequenced reads. In other figures when we sort fragments sizes in silico, such as nucleosome range, dinucleosome or subnucleosome size, we make a note in the figure legends. What the reviewer points is related to the length of the sequence DNA fragment in each experiment. As we explained above, the older data-sets were performed with 50 bp paired-end reads, the newer ones are 75, 100 or 125bp. This is information is now clarified in Table S1.

      __Results - "The TASs of single and multi-copy genes are differentially protected by nucleosomes": __

      __ __* Please include T. brucei RNA-seq data in Suppl. Fig. S5b as you did for T. cruzi.

      We have shown chromatin organization for T. brucei in previous S5b to illustrate that there is a similar trend. Unfortunately, we did not get a robust list of multi-copy genes for T. brucei as we did get for T. cruzi, therefore we do not want to over conclude showing the RNA-seq for these subsets of genes. The limitation is related to the fact that UTRme restrict the search and is extremely strict when calling sites at repetitive regions. Additionally, attending to the request of one reviewer we have now changed the UTR predictions for T. brucei using a different RNA-seq data set from Lister 427(detail in method section). Given that with the new predictions it was even harder to obtain the list of multicopy genes for T. brucei, we decided to remove that figure in the updated version of the manuscript.

      * Discuss how low or absent expression of multigene families affects TAS annotation (which relies on RNA-seq) and whether annotation inaccuracies could bias the observed chromatin differences.

      The mapping of occurrence and annotations that belong to repetitive regions has great complexity. UTRme is specially designed to avoid overcalling those sites. In other words, there is a chance that we could be underestimating the number of predicted TASs at multi-copy genes. Regarding the impact on chromatin analysis, we cannot rule out that it might have an impact, but the observation favors our conclusion, since even when some TASs at multi-copy genes can remain elusive, we observe more nucleosome density at those places.

      * The statement that multi-copy genes show an "oscillation" between AT and GC dinucleotides is not clearly supported: the multi-copy average appears noisier and is based on fewer loci. Please tone down this claim or provide statistical support that the pattern is periodic rather than noisy.

      We have fixed this now in the preliminary revised version

      * How were multi-copy genes defined in T. brucei? Include the classification method in Methods.

      This classification was done the same way it was explained for T. cruzi. However, decided to remove the supplemental figure that included this sorting.

      Genomes and annotations: * If transcriptomic data for the Y strain was used for T. cruzi, please explain why a Y strain genome was not used (e.g., Wang et al. 2021 GCA_015033655.1), or justify the choice. For T. brucei, consider the more recent Lister 427 assembly (Tb427_2018) from TriTrypDB. Use strain-matched genomes and transcriptomes when possible, or discuss limitations.

      The most appropriate way to analyze high throughput data, is to aline it to the same genome were the experiments were conducted. This was clearly illustrated in a previous publication from our group were we explained how should be analyzed data from the hybrid CL Brener strain. A common practice in the past was to use only Esmeraldo-like genome for simplicity, but this resulted in output artifacts. Therefore, we aligned it to CL Brener genome, and then focused the main analysis on the Esmeraldo haplotype (Beati Plos ONE, 2023). Ideally, we should have counted on transcriptomic data for the same strain (CL Brener or Esmeraldo). Since this was not the case at that moment, we used data from Y strain that belongs to the same DTU with Esmeraldo.

      In the case of T. brucei, when we started our analysis and the software code for UTRme was written, the previous version of the genome was available. Upon 2018 version came up, we checked chromatin parameters and observed that it did not change the main observations. Therefore, we continue working with our previous setups.

      Reproducibility and broader integration: * Please share the full analysis pipeline (ideally on GitHub/Zenodo) so the results are reproducible from raw reads to plots.

      We are preparing a full pipeline in GitHub. We will make it available before manuscript full revision

      * As an optional but helpful expansion, consider including additional datasets (other life stages, BSF MNase-seq, ATAC-seq, DRIP-seq) where available to strengthen comparative claims.

      We are now including a new figure 4 and a supplemental figure 5 including DRIP-seq and Rp9 ChIP-seq for T. brucei (revised Fig 4) and DRIP-seq for L. major (S5 Fig). Additionally, we added FAIRE-seq data to previous Fig 4 now Fig 5 (revised Fig 5C).

      We are analyzing ATAC-seq data for T. brucei.

      Regarding BSF MNase-seq, the original article by Mareé 2017 claims that there is not significant difference for average chromatin organization between the two life forms; therefore, is not worth including that analysis.

      Optional analyses that would strengthen the study: * Stratify single-copy genes by expression (high / medium / low) and examine average nucleosome occupancy at TASs for each group; a correlation between expression and NDR depth would strengthen the functional link to maturation.

      We have now included a panel in suplemental figure 5 (now revised S6), showing the concordance for chromatin organization of stratified genes by RNA-seq levels relative to TAS.

      __Minor / editorial comments: __ * In the Introduction, the sentence "transcription is initiated from dispersed promoters and in general they coincide with divergent strand switch regions" should be qualified: such initiation sites also include single transcription start regions.

      We have clarified this in the preliminary revised version

      * Define the dotted line in length distribution plots (if it is not the median, please clarify) and consider placing it at 147 bp across plots to ease comparison.

      The dotted line is just to indicate where the maximum peak is located. It is now clarified in figure legends.

      * In Suppl. Fig. 4b "Replicate2" the x-axis ticks are misaligned with labels - please fix.

      We have now fixed the figure. Thanks for noticing this mistake.

      * Typo in the Introduction: "remodellingremodeling" → "remodeling

      Thanks for noticing this mistake, it is fixed in the current version of the manuscript

      **Referee cross-commenting** Comment 1: I think Reviewer #2 and Reviewer #3 missed that they authors of this manuscript do cite and consider the results from Wedel at al. 2017. They even re-analysed their data (e.g. Figure 3a). I second Reviewer #2 comment indicating that the inclusion of a schematic figure to help readers visualize and better understand the findings would be an important addition.

      Comment 2: I agree with Reviewer #3 that the use of different MNase digestion procedures in the different datasets have to be considered. On the other hand, I don't think there is a problem with figure 1 showing an MNase-protected TAS for T. brucei as it is based on MNase-seq data and reproduces the reported results (Maree et al. 2017). What the Siegel lab did in Wedel et al. 2017 was MNase-ChIPseq of H3 showing nucleosome depletion at TAS, but both results are not necessary contradictory: There could still be something else (which does not contain H3) sitting on the TAS protecting it from MNase digestion.

      Reviewer #1 (Significance (Required)):

      This study provides a systematic comparative analysis of chromatin landscapes at trans-splicing acceptor sites (TASs) in trypanosomatids, an area that has been relatively underexplored. By re-analyzing and harmonizing existing MNase-seq and MNase-ChIP-seq datasets, the authors highlight conserved and divergent features of nucleosome occupancy around TASs and propose that chromatin contributes to the fidelity of transcript maturation. The significance lies in three aspects: 1. Conceptual advance: It broadens our understanding of gene regulation in organisms where transcription initiation is unusual and largely constitutive, suggesting that chromatin can still modulate post-transcriptional processes such as trans-splicing. 2. Integrative perspective: Bringing together data from T. cruzi, T. brucei and L. major provides a comparative framework that may inspire further mechanistic studies across kinetoplastids. 3. Hypothesis generation: The findings open testable avenues about the role of chromatin in coordinating transcript maturation, the contribution of DNA sequence composition, and potential interactions with R-loops or RNA-binding proteins. Researchers in parasitology, chromatin biology, and RNA processing will find it a useful resource and a stimulus for targeted experimental follow-up.

      My expertise is in gene regulation in eukaryotic parasites, with a focus on bioinformatic analysis of high-throughput sequencing data

      __Reviewer #2 (Evidence, reproducibility and clarity (Required)): __

      Siri et al. perform a comparative analysis using publicly available MNase-seq data from three trypanosomatids (T. brucei, T. cruzi, and Leishmania), showing that a similar chromatin profile is observed at TAS (trans-splicing acceptor site) regions. The original studies had already demonstrated that the nucleosome profile at TAS differs from the rest of the genome; however, this work fills an important gap in the literature by providing the most reliable cross-species comparison of nucleosome profiles among the tritryps. To achieve this, the authors applied the same computational analysis pipeline and carefully evaluated MNase digestion levels, which are known to influence nucleosome profiling outcomes.

      In my view, the main conclusion is that the profiles are indeed similar-even when comparing T. brucei and T. cruzi. This was not clear in previous studies (and even appeared contradictory, reporting nucleosome depletion versus enrichment) largely due to differences in chromatin digestion across these organisms. The manuscript could be improved with some clarifications and adjustments:

      1. The authors state from the beginning that available MNase data indicate altered nucleosome occupancy around the TAS. However, they could also emphasize that the conclusions across the different trypanosomatids are inconsistent and even contradictory: NDR in T. cruzi versus protection-in different locations-in T. brucei and Leishmania.

      We start our manuscript by referring to the first MNase-seq data sets publicly available for each TriTryp and we point that one of the main observations, in each of them, is the occurrence of a change in nucleosome density or occupancy at intergenic regions. In T. cruzi, in a previous publication from our group, we stablished that this intergenic drop in nucleosome density occurs near the trans-splicing acceptor site. In this work, we extend our study to the other members of TriTryps: T. brucei and L. major.

      In T. brucei the papers from Patterton's lab and Siegel's lab came out almost simultaneously in 2017. Hence, they do not comment on each other's work. The first one claims the presence of a well-positioned nucleosome at the TAS by using MNase-seq, while the second one, shows an NDR at the TAS by using MNase-ChIP-seq. However, we do not think they are contradictory, or they have inconsistency. We brought them together along the manuscript because we think these works can provide complementary information.

      On one hand, we infer data from Pattertons lab is slightly less digested than the sample from Siegel's lab. Therefore, we discuss that this moderate digestion must be the reason why they managed to detect an MNase protecting complex sitting at the TAS (Figure 1). On the other hand, Sigel's lab includes an additional step by performing MNase-ChIP-seq, showing that when analyzing nucleosome size fragments, histones are not detected at the TAS. Here, we go further in this analysis on figure 3, showing that only when looking at subnucleosome-size fragments, we can detect histone H3. And this is also true for T. cruzi.

      By integrating every analysis in this work and the previous ones, we propose that TASs are protected by an MNase-sensitive complex (proved in Figure 2). This complex most likely is only partly formed by histones, since only when analyzing sub-nucleosomes size DNA molecules we can detect histone H3 (Figure 3). To be sure that the complex is not entirely made up by histones, future studies should perform an MNse-ChIP-seq with less digested samples. However, it was previously shown that R-loops are enriched at those intergenic NDRs (Briggs, 2018 doi: 10.1093/nar/gky928) and that R-loops have plenty of interacting proteins (Girasol, 2023 10.1093/nar/gkad836). Therefore, most likely, this MNase-sensitive complexed have a hybrid nature made up by H3 and some other regulatory molecules, possibly involved in trans-splicing. We have now added a new figure 4 showing R-loop co-localization with the NDR.

      Regarding the comparison between different organisms, after explaining the sensitivity to MNase of the TAS protecting complex, we discuss that when comparing equally digested samples T. cruzi and T. brucei display a similar chromatin landscape with a mild NDR at the TAS (See T. cruzi represented in Figure 1 compared to T. brucei represented in Intermediate digestion 2 in Figure 2, intermediate digestion in the revised manuscript). Unfortunately, we cannot make a good comparison with L. major, since we do not count on a similar level of digestion. However, by analyzing a recently published DRIP-seq data-set for L. major we show that R-loop signal co localize with MNase-protection in a similar way (new S5 Fig).

      Another point that requires clarification concerns what the authors mean in the introduction and discussion when they write that trypanosomes have "...poorly organized chromatin with nucleosomes that are not strikingly positioned or phased." On the other hand, they also cite evidence of organization: "...well-positioned nucleosome at the spliced-out region.. in Leishmania (ref 34)"; "...a well-positioned nucleosome at the TASs for internal genes (ref37)"; "...a nucleosome depletion was observed upstream of every gene (ref 35)." Aren't these examples of organized chromatin with at least a few phased nucleosomes? In addition, in ref 37, figure 4 shows at least two (possibly three to four) nucleosomes that appear phased. In my opinion, the authors should first define more precisely what they mean by "poorly organized chromatin" and clarify that this interpretation does not contradict the findings highlighted in the cited literature.

      For a better understanding of nucleosome positioning and phasing I recommend the review: Clark 2010 doi:10.1080/073911010010524945, Figure 4. Briefly, in a cell population there are different alternative positions that a given nucleosome can adopt. However, some are more favorable. When talking about favorable positions, we refer to the coordinates in the genome that are most likely covered by a nucleosome and are predominant in the cell population. Additionally, nucleosomes could be phased or not. This refers not only the position in the genome, but to the distance relative to a given point. In yeast, or in highly transcribed genes of more complex eukaryotes, nucleosomes are regularly spaced and phased relative to the transcription start site (TSS) or to the +1 nucleosome (Ocampo, NAR, 2016, doi:10.1093/nar/gkw068). In trypanosomes, nucleosomes have some regular distribution when making a browser inspection but, given that they are not properly phased with respect to any point, it is almost impossible to make a spacing estimation from paired-end data. This is also consistent with a chromatin that is transcribed in an almost constitutive manner.

      As the reviewer mention, we do site evidence of organization. We think the original observations are correct, but we do not fully agree with some of the original statements. In this manuscript our aim is to take the best we learned from their original works and to make a constructive contribution adding to the original discussions. In this regard, in trypanosomes there are some conserved patterns in the chromatin landscape, but their nucleosomes are far from being well-positioned or phased. For a better understanding, compare the variations observed in the y axis when representing av. nucleosome occupancy in yeast with those observed in trypanosomes and you will see that the troughs and peaks are much more prominent in yeast than the ones observed in any TryTryp member.

      Following the reviewer's suggestion we have now clarified this in the main text.

      The paper would also benefit from the inclusion of a schematic figure to help readers visualize and better understand the findings. What is the biological impact of having nucleosomes, di-nucleosomes, or sub-nucleosomes at TAS? This is not obvious to readers outside the chromatin field. For example, the following statement is not intuitive: "We observed that, when analyzing nucleosome-size (120-180 bp) DNA molecules or longer fragments (180-300 bp), the TASs of either T. cruzi or T. brucei are mostly nucleosome-depleted. However, when representing fragments smaller than a nucleosome-size (50-120 bp) some histone protection is unmasked (Fig. 3 and Fig. S4). This observation suggests that the MNase sensitive complex sitting at the TASs is at least partly composed of histones." Please clarify.

      We appreciate the reviewer's suggestion to make a schematic figure. We have now added a new Figure 6.

      Regarding the biological impact of having mono, di or subnucleosome fragments, it is important to unveil the fragment size of the protected DNA to infer the nature of the protecting complex. In the case of tRNA genes in yeast, at pol III promoters they found footprints smaller than a nucleosome size that ended up being TFIIB-TFIIC (Nagarajavel, doi: 10.1093/nar/gkt611). Therefore, detecting something smaller than a nucleosome might suggest the binding of trans-acting factors different than histones or involving histones in a mixed complex. These mixed complexes are also observed, and that is the case of the centromeric nucleosome which has a very peculiar composition (Ocampo and Clark, Cells Reports, 2015). On the other hand, if instead we detect bigger fragments, it could be indicative of the presence of bigger protecting molecules or that those regions are part of higher order chromatin organization still inaccessible for MNase linker digestions.

      Here we show on 2Dplots, that complex or components protecting the TAS have nucleosome size, but we cannot assure they are entirely made up by histones, since, only when looking at subnucleosome-size fragments, we are able to detect histone H3. We have now added part of this explanation to the discussion.

      By integrating every analysis in this work and the previous ones, we propose that the TAS is protected by an MNase-sensitive complex (Figure 2). This complex most likely is only partly formed by histones, since only when analyzing sub-nucleosomes size DNA molecules we can detect histone H3 (Figure 3). As explained above, to be sure that the complex is not entirely made up by histones, future studies should perform an MNse-ChIP-seq with less digested samples. However, it was previously shown that R-loops are enriched at those intergenic NDRs (Briggs 2018) and that R-loops have plenty of interacting proteins (Girasol, 2023). Therefore, most likely, this MNase-sensitive complexed have a hybrid nature made up by H3 and some other regulatory molecules. We have now added a new figure 4 showing R-loop partial co-localization with MNase protection.

      Some references are missing or incorrect:

      we will make a thorough revision

      "In trypanosomes, there are no canonical promoter regions." - please check Cordon-Obras et al. (Navarro's group). Thank you for the appropiate suggestion.

      Thank you for the appropriate suggestion. We have now added this reference

      Please, cite the study by Wedel et al. (Siegel's group), which also performed MNase-seq analysis in T. brucei.

      We understand that reviewer number 2# missed that we cited this reference and that we did used the raw data from the manuscript of Wedel et. al 2017 form Siegel's group. We used the MNase-ChIP-seq data set of histone H3 in our analysis for Figures 3, S4 and S6 (in the revised version), also detailed in table S1. To be even more explicit, we have now included the accession number of each data set in the figure legends.

      Figure-specific comments: Fig. S3: Why does the number of larger fragments increase with greater MNase digestion? Shouldn't the opposite be expected?

      This a good observation. As we also explained to reviewer#1:

      It's a common observation in MNase digestion of chromatin that more extensive digestion can still result in a broad range of fragment sizes, including some longer fragments. This seemingly counter-intuitive result is primarily due to the non-uniform accessibility of chromatin and the sequence preference of the MNase enzyme.

      The rationale of this is as follows: when you digest chromatin with MNase and the objective is to map nucleosomes genome-wide, the ideal situation would get the whole material contained in the mononucleosome band. Given that MNase is less efficient to digest protected DNA but, if the reaction proceeds further, it always ends up destroying part of it, the result is always far from perfect. The better situation we can get, is to obtain samples were ˜80% of the material is contained in the mononucloesome band. __And here comes the main point: __even in the best scenario, you always have some additional longer bands, such as those for di or tri nucleosomes. If you keep digesting, you will get less than 80 % in the nucleosome band and, those remaining DNA fragments that use to contain di and tri nucleosomes start getting digested as well originating a bigger dispersion in fragments sizes. How do we explain persistence of Long Fragments? The longest fragments (di-, tri-nucleosomes) that persist in a highly digested sample are the ones that were originally most highly protected by proteins or higher-order structure, making their linker DNA extremely resistant to initial cleavage. Once most of the genome is fragmented, these few resistant longer fragments become a more visible component of the remaining population, contributing to a broader size dispersion. Hence, there you end up having a bigger dispersion in length distributions in the final material. Bottom line, it is not a good practice to work with under or overdirected samples. Our main point is to emphasize that especially when comparing samples, it important to compare those with comparable levels of digestion. Otherwise, a different sampling of the genome will be represented in the remaining sequenced DNA.

      Minor points:

      There are several typos throughout the manuscript.

      Thanks for the observation. We will check carefully.

      Methods: "Dinucelotide frecuency calculation."

      We will add a code in GitHub

      Reviewer #2 (Significance (Required)):

      In my view, the main conclusion is that the profiles are indeed similar-even when comparing T. brucei and T. cruzi. This was not clear in previous studies (and even appeared contradictory, reporting nucleosome depletion versus enrichment) largely due to differences in chromatin digestion across these organisms. Audience: basic science and specialized readers.

      Expertise: epigenetics and gene expression in trypanosomatids.

      __Reviewer #3 (Evidence, reproducibility and clarity (Required)): __

      The authors analysed publicly accessible MNase-seq data in TriTryps parasites, focusing on the chromatin structure around trans-splicing acceptor sites (TASs), which are vital for processing gene transcripts. They describe a mild nucleosome depletion at the TAS of T. cruzi and L. major, whereas a histone-containing complex protects the TASs of T. brucei. In the subsequent analysis of T. brucei, they suggest that a Mnase-sensitive complex is localised at the TASs. For single-copy versus multi-copy genes, the authors show different di-nucleotide patterns and chromatin structures. Accordingly, they propose this difference could be a novel mechanism to ensure the accuracy of trans-splicing in these parasites.

      Before providing an in- depth review of the manuscript, I note that some missing information would have helped in assessing the study more thoroughly; however, in the light of the available information, I provide the following comments for consideration.

      The numbering of the figures, including the figure legends, is missing in the PDF file. This is essential for assessing the provided information.

      We apologized for not including the figure numbers in the main text, although they are located in the right place when called in the text. The omission was unwillingly made when figure legends were moved to the bottom of the main text. This is now fixed in the updated version of the manuscript.

      The publicly available Mnase- seq data are manyfold, with multiple datasets available for T. cruzi, for example. It is unclear from the manuscript which dataset was used for which figure. This must be clarified.

      This was detailed in Table S1. We have now replaced the table by an improved version, and we have also included the accession number of each data set used in the figure legends.

      Why do the authors start in figure 1 with the description of an MNase- protected TAS for T.brucei, given that it has been clearly shown by the Siegel lab that there is a nucleosome depletion similar to other parasites?

      We did not want to ignore the paper from Patterton's lab because it was the first one to map nucleosomes genome-wide in T. brucei and the main finding of that paper claimed the existence of a well-positioned nucleosome at intergenic regions, what we though constitutes a point worth to be discussed. While Patterton's work use MNase-seq from gel-purified samples and provides replicated experiments sequenced in really good depth; Siegel's lab uses MNase-ChIP-seq of histone H3 but performs only one experiment and its input was not sequenced. So, each work has its own caveats and provides different information that together contributes to make a more comprehensive study. We think that bringing up both data sets to the discussion, as we have done in Figures 1 and 3, helps us and the community working in the field to enrich the discussion.

      If the authors re- analyse the data, they should compare their pipeline to those used in the other studies, highlighting differences and potential improvements.

      We are working on this point. We will provide a more detail description in the final revision.

      Since many figures resemble those in already published studies, there seems little reason to repeat and compare without a detailed comparison of the pipelines and their differences.

      Following the reviewer advice, we are now working on highlighting the main differences that justify analyzing the data the way we did and will be added in the finally revised method section.

      At a first glance, some of the figures might look similar when looking at the original manuscripts comparing with ours. However, with a careful and detailed reading of our manuscripts you can notice that we have added several analyses that allow to unveil information that was not disclosed before.

      First, we perform a systematic comparison analyzing every data set the same way from beginning to end, being the main difference with previous studies the thorough and precise prediction of TAS for the three organisms. Second, we represent the average chromatin organization relative to those predicted TASs for TriTryps and discuss their global patterns. Third, by representing the average chromatin into heatmaps, we show for the very first time, that those average nucleosome landscape are not just an average, they keep a similar organization in most of the genome. These was not done in any of the previous manuscripts except for our own (Beati, PLOS One 2023). Additionally, we introduce the discussion of how the extension of MNase reaction can affect the output of these experiments and we show 2D-plots and length distribution heatmaps to discuss this point (a point completely ignored in all the chromatin literature for trypanosomes). Furthermore, we made a far-reaching analysis by considering the contributions of each publish work even when addressed by different techniques. Finally, we discuss our findings in the context of a topic of current interest in the field, such as TriTryp's genome compartmentalization.

      Several previous Mnase- seq analysis studies addressing chromatin accessibility emphasized the importance of using varying degrees of chromatin digestion, from low to high digestion (30496478, 38959309, 27151365).

      The reviewer is correct, and this point is exactly what we intended to illustrate in figure number 2. We appreciate he/she suggests these references that we are now citing in the final discussion. Just to clarify, using varying degrees of chromatin digestion is useful to make conclusions about a given organism but when comparing samples, strains, histone marks, etc. It is extremely important to do it upon selection of similar digested samples.

      No information on the extent of DNA hydrolysis is provided in the original Mnase- seq studies. This key information can not be inferred from the length distribution of the sequenced reads.

      The reviewer is correct that "No information on the extent of DNA hydrolysis is provided in the original Mnase-seq studies" and this is another reason why our analysis is so important to be published and discussed by the scientific community working in trypanosomes. We disagree with the reviewer in the second statement, since the level of digestion of a sequenced sample is actually tested by representing the length distribution of the total DNA sequenced. It is true that before sequencing you can, and should, check the level of digestion of the purified samples in an agarose gel and/or in a bioanalyzer. It could be also tested after library preparation, but before sequencing, expecting to observe the samples sizes incremented in size by the addition of the library adapters. But, the final test of success when working with MNase digested samples is to analyze length of DNA molecules by representing the histograms with length distribution of the sequenced DNA molecules. Remarkably, on occasions different samples might look very similar when run in a gel, but they render different length distribution histograms and this is because the nucleosome core could be intact but they might have suffered a differential trimming of the linker DNA associated to it or even be chewed inside (see Cole Hope 2011, section 5.2, doi: 10.1016/B978-0-12-391938-0.00006-9, for a detailed explanation).

      As the input material are selected, in part gel- purified mono- nucleosomal DNA bands. Furthermore the datasets are not directly comparable, as some use native MNase, while others employ MNase after crosslinking; some involve short digestion times at 37 {degree sign} C, while others involve longer digestion at lower temperatures. Combining these datasets to support the idea of an MNase- sensitive complex at the TAS of T. brucei therefore may not be appropriate, and additional experiments using consistent methodologies would strengthen the study's conclusions.

      In my opinion, describing an MNase- sensitive complex based solely on these data is not feasible. It requires specifically designed experiments using a consistent method and well- defined MNase digestion kinetics.

      As the reviewer suggests, the ideal experiment would be to perform a time course of MNase reaction with all the samples in parallel, or to work with a fix time point adding increasing amounts of MNase. However, the information obtained from the detail analysis of the length distribution histogram of sequenced DNA molecules the best test of the real outcome. In fact, those samples with different digestion levels were probably not generated on purpose.

      The only data sets that were gel purified are those from Mareé 2017 (Patterton's lab), used in Figures 1, S1 and S2 and those from L. major shown in Fig 1. It was a common practice during those years, then we learned that is not necessary to gel purify, since we can sort fragment sizes later in silico when needed.

      As we explained to reviewer #1, to avoid this conflict, we decided to remove this data from figures 2 and S3. In summary, the 3 remaining samples comes from the same lab, and belong to the same publication (Mareé 2022). These sample are the inputs of native MNase ChIp-seq, obtain the same way, totally comparable among each other.

      Reviewer #3 (Significance (Required)):

      Due to the lack of controlled MNase digestion, use of heterogeneous datasets, and absence of benchmarking against previous studies, the conclusions regarding MNase-sensitive complexes and their functional significance remain speculative. With standardized MNase digestion and clearly annotated datasets, this study could provide a valuable contribution to understanding chromatin regulation in TriTryps parasites.

      As we have explained in the previous point our conclusions are valid since we do not compare in any figure samples coming from different treatments. The only exception to this comment could be in figure 3 when talking about MNase-ChIP-seq. We have now added a clear and explicit comment in the section and the discussion that despite having subtle differences in experimental procedures we arrive to the same results. This is the case for T. cruzi IP, run from crosslinked chromatin, compared to T. brucei's IP, run from native chromatin.

      Along the years it was observed in the chromatin field that nucleosomes are so tightly bound to DNA that crosslinking is not necessary. However, it is still a common practice specially when performing IPs. In our own hands, we did not observe any difference at the global level neither in T. cruzi (unpublished) nor in my previous work with yeast (compared nucleosome organization from crosslinked chromatin MNAse-seq inputs Chereji, Mol Cell, 2017 doi:10.1016/j.molcel.2016.12.009 and native MNase-seq from Ocampo, NAR, 2016 doi: 10.1093/nar/gkw068).

  5. Nov 2025
    1. Author response:

      The following is the authors’ response to the original reviews.

      Reviewer #1 (Public review):

      Summary:

      From a forward genetic mosaic mutant screen using EMS, the authors identify mutations in glucosylceramide synthase (GlcT), a rate-limiting enzyme for glycosphingolipid (GSL) production, that result in EE tumors. Multiple genetic experiments strongly support the model that the mutant phenotype caused by GlcT loss is due to by failure of conversion of ceramide into glucosylceramide. Further genetic evidence suggests that Notch signaling is comprised in the ISC lineage and may affect the endocytosis of Delta. Loss of GlcT does not affect wing development or oogenesis, suggesting tissue-specific roles for GlcT. Finally, an increase in goblet cells in UGCG knockout mice, not previously reported, suggests a conserved role for GlcT in Notch signaling in intestinal cell lineage specification.

      Strengths:

      Overall, this is a well-written paper with multiple well-designed and executed genetic experiments that support a role for GlcT in Notch signaling in the fly and mammalian intestine. I do, however, have a few comments below.

      Weaknesses:

      (1) The authors bring up the intriguing idea that GlcT could be a way to link diet to cell fate choice. Unfortunately, there are no experiments to test this hypothesis.

      We indeed attempted to establish an assay to investigate the impact of various diets (such as high-fat, high-sugar, or high-protein diets) on the fate choice of ISCs. Subsequently, we intended to examine the potential involvement of GlcT in this process. However, we observed that the number or percentage of EEs varies significantly among individuals, even among flies with identical phenotypes subjected to the same nutritional regimen. We suspect that the proliferative status of ISCs and the turnover rate of EEs may significantly influence the number of EEs present in the intestinal epithelium, complicating the interpretation of our results. Consequently, we are unable to conduct this experiment at this time. The hypothesis suggesting that GlcT may link diet to cell fate choice remains an avenue for future experimental exploration.

      (2) Why do the authors think that UCCG knockout results in goblet cell excess and not in the other secretory cell types?

      This is indeed an interesting point. In the mouse intestine, it is well-documented that the knockout of Notch receptors or Delta-like ligands results in a classic phenotype characterized by goblet cell hyperplasia, with little impact on the other secretory cell types. This finding aligns very well with our experimental results, as we noted that the numbers of Paneth cells and enteroendocrine cells appear to be largely normal in UGCG knockout mice. By contrast, increases in other secretory cell types are typically observed under conditions of pharmacological inhibition of the Notch pathway.

      (3) The authors should cite other EMS mutagenesis screens done in the fly intestine.

      To our knowledge, the EMS screen on 2L chromosome conducted in Allison Bardin’s lab is the only one prior to this work, which leads to two publications (Perdigoto et al., 2011; Gervais, et al., 2019). We have now included citations for both papers in the revised manuscript.

      (4) The absence of a phenotype using NRE-Gal4 is not convincing. This is because the delay in its expression could be after the requirement for the affected gene in the process being studied. In other words, sufficient knockdown of GlcT by RNA would not be achieved until after the relevant signaling between the EB and the ISC occurred. Dl-Gal4 is problematic as an ISC driver because Dl is expressed in the EEP.

      This is an excellent point, and we agree that the lack of an observable phenotype using NRE-Gal4 could be due to delayed expression, which may result in missing the critical window required for effective GlcT knockdown. Consequently, we cannot rule out the possibility that GlcT also plays a role in early EBs or EEPs. We have revised the manuscript to soften this conclusion and to include this alternative explanation for the experiment.

      (5) The difference in Rab5 between control and GlcT-IR was not that significant. Furthermore, any changes could be secondary to increases in proliferation.

      We agree that it is possible that the observed increase in proliferation could influence the number of Rab5+ endosomes, and we will temper our conclusions on this aspect accordingly. However, it is important to note that, although the difference in Rab5+ endosomes between the control and GlcT-IR conditions appeared mild, it was statistically significant and reproducible. In our revised experiments, we have not only added statistical data and immunofluorescence images for Rab11 but also unified the approaches used for detecting Rab-associated proteins (in the previous figures, Rab5 was shown using U-Rab5-GFP, whereas Rab7 was detected by direct antibody staining). Based on this unified strategy, we optimized the quantification of Dl-GFP colocalization with early, late, and recycling endosomes, and the results are consistent with our previous observations (see the updated Fig. 5).

      Reviewer #2 (Public review):

      Summary:

      This study genetically identifies two key enzymes involved in the biosynthesis of glycosphingolipids, GlcT and Egh, which act as tumor suppressors in the adult fly gut. Detailed genetic analysis indicates that a deficiency in Mactosyl-ceramide (Mac-Cer) is causing tumor formation. Analysis of a Notch transcriptional reporter further indicates that the lack of Mac-Ser is associated with reduced Notch activity in the gut, but not in other tissues.

      Addressing how a change in the lipid composition of the membranes might lead to defective Notch receptor activation, the authors studied the endocytic trafficking of Delta and claimed that internalized Delta appeared to accumulate faster into endosomes in the absence of Mac-Cer. Further analysis of Delta steady-state accumulation in fixed samples suggested a delay in the endosomal trafficking of Delta from Rab5+ to Rab7+ endosomes, which was interpreted to suggest that the inefficient, or delayed, recycling of Delta might cause a loss in Notch receptor activation.

      Finally, the histological analysis of mouse guts following the conditional knock-out of the GlcT gene suggested that Mac-Cer might also be important for proper Notch signaling activity in that context.

      Strengths:

      The genetic analysis is of high quality. The finding that a Mac-Cer deficiency results in reduced Notch activity in the fly gut is important and fully convincing.

      The mouse data, although preliminary, raised the possibility that the role of this specific lipid may be conserved across species.

      Weaknesses:

      This study is not, however, without caveats and several specific conclusions are not fully convincing.

      First, the conclusion that GlcT is specifically required in Intestinal Stem Cells (ISCs) is not fully convincing for technical reasons: NRE-Gal4 may be less active in GlcT mutant cells, and the knock-down of GlcT using Dl-Gal4ts may not be restricted to ISCs given the perdurance of Gal4 and of its downstream RNAi.

      As previously mentioned, we acknowledge that a role for GlcT in early EBs or EEPs cannot be completely ruled out. We have revised our manuscript to present a more cautious conclusion and explicitly described this possibility in the updated version.

      Second, the results from the antibody uptake assays are not clear.: i) the levels of internalized Delta were not quantified in these experiments; ii) additionally, live guts were incubated with anti-Delta for 3hr. This long period of incubation indicated that the observed results may not necessarily reflect the dynamics of endocytosis of antibody-bound Delta, but might also inform about the distribution of intracellular Delta following the internalization of unbound anti-Delta. It would thus be interesting to examine the level of internalized Delta in experiments with shorter incubation time.

      We thank the reviewer for these excellent questions. In our antibody uptake experiments, we noted that Dl reached its peak accumulation after a 3-hour incubation period. We recognize that quantifying internalized Dl would enhance our analysis, and we will include the corresponding statistical graphs in the revised version of the manuscript. In addition, we agree that during the 3-hour incubation, the potential internalization of unbound anti-Dl cannot be ruled out, as it may influence the observed distribution of intracellular Dl. We therefore attempted to supplement our findings with live imaging experiments to investigate the dynamics of Dl/Notch endocytosis in both normal and GlcT mutant ISCs. However, we found that the GFP expression level of Dl-GFP (either in the knock-in or transgenic line) was too low to be reliably tracked. During the three-hour observation period, the weak GFP signal remained largely unchanged regardless of the GlcT mutation status, and the signal resolution under the microscope was insufficient to clearly distinguish membrane-associated from intracellular Dl. Therefore, we were unable to obtain a dynamic view of Dl trafficking through live imaging. Nevertheless, our Dl antibody uptake and endosomal retention analyses collectively support the notion that MacCer influences Notch signaling by regulating Dl endocytosis.

      Overall, the proposed working model needs to be solidified as important questions remain open, including: is the endo-lysosomal system, i.e. steady-state distribution of endo-lysosomal markers, affected by the Mac-Cer deficiency? Is the trafficking of Notch also affected by the Mac-Cer deficiency? is the rate of Delta endocytosis also affected by the Mac-Cer deficiency? are the levels of cell-surface Delta reduced upon the loss of Mac-Cer?

      Regarding the impact on the endo-lysosomal system, this is indeed an important aspect to explore. While we did not conduct experiments specifically designed to evaluate the steady-state distribution of endo-lysosomal markers, our analyses utilizing Rab5-GFP overexpression and Rab7 staining did not indicate any significant differences in endosome distribution in MacCer deficient conditions. Moreover, we still observed high expression of the NRE-LacZ reporter specifically at the boundaries of clones in GlcT mutant cells (Fig. 4A), indicating that GlcT mutant EBs remain responsive to Dl produced by normal ISCs located right at the clone boundary. Therefore, we propose that MacCer deficiency may specifically affect Dl trafficking without impacting Notch trafficking.

      In our 3-hour antibody uptake experiments, we observed a notable decrease in cell-surface Dl, which was accompanied by an increase in intracellular accumulation. These findings collectively suggest that Dl may be unstable on the cell surface, leading to its accumulation in early endosomes.

      Third, while the mouse results are potentially interesting, they seem to be relatively preliminary, and future studies are needed to test whether the level of Notch receptor activation is reduced in this model.

      In the mouse small intestine, Olfm4 is a well-established target gene of the Notch signaling pathway, and its staining provides a reliable indication of Notch pathway activation. While we attempted to evaluate Notch activation using additional markers, such as Hes1 and NICD, we encountered difficulties, as the corresponding antibody reagents did not perform well in our hands. Despite these challenges, we believe that our findings with Olfm4 provide an important start point for further investigation in the future.

      Reviewer #3 (Public review):

      Summary:

      In this paper, Tang et al report the discovery of a Glycoslyceramide synthase gene, GlcT, which they found in a genetic screen for mutations that generate tumorous growth of stem cells in the gut of Drosophila. The screen was expertly done using a classic mutagenesis/mosaic method. Their initial characterization of the GlcT alleles, which generate endocrine tumors much like mutations in the Notch signaling pathway, is also very nice. Tang et al checked other enzymes in the glycosylceramide pathway and found that the loss of one gene just downstream of GlcT (Egh) gives similar phenotypes to GlcT, whereas three genes further downstream do not replicate the phenotype. Remarkably, dietary supplementation with a predicted GlcT/Egh product, Lactosyl-ceramide, was able to substantially rescue the GlcT mutant phenotype. Based on the phenotypic similarity of the GlcT and Notch phenotypes, the authors show that activated Notch is epistatic to GlcT mutations, suppressing the endocrine tumor phenotype and that GlcT mutant clones have reduced Notch signaling activity. Up to this point, the results are all clear, interesting, and significant. Tang et al then go on to investigate how GlcT mutations might affect Notch signaling, and present results suggesting that GlcT mutation might impair the normal endocytic trafficking of Delta, the Notch ligand. These results (Fig X-XX), unfortunately, are less than convincing; either more conclusive data should be brought to support the Delta trafficking model, or the authors should limit their conclusions regarding how GlcT loss impairs Notch signaling. Given the results shown, it's clear that GlcT affects EE cell differentiation, but whether this is via directly altering Dl/N signaling is not so clear, and other mechanisms could be involved. Overall the paper is an interesting, novel study, but it lacks somewhat in providing mechanistic insight. With conscientious revisions, this could be addressed. We list below specific points that Tang et al should consider as they revise their paper.

      Strengths:

      The genetic screen is excellent.

      The basic characterization of GlcT phenotypes is excellent, as is the downstream pathway analysis.

      Weaknesses:

      (1) Lines 147-149, Figure 2E: here, the study would benefit from quantitations of the effects of loss of brn, B4GalNAcTA, and a4GT1, even though they appear negative.

      We have incorporated the quantifications for the effects of the loss of brn, B4GalNAcTA, and a4GT1 in the updated Figure 2.

      (2) In Figure 3, it would be useful to quantify the effects of LacCer on proliferation. The suppression result is very nice, but only effects on Pros+ cell numbers are shown.

      We have now added quantifications of the number of EEs per clone to the updated Figure 3.

      (3) In Figure 4A/B we see less NRE-LacZ in GlcT mutant clones. Are the data points in Figure 4B per cell or per clone? Please note. Also, there are clearly a few NRE-LacZ+ cells in the mutant clone. How does this happen if GlcT is required for Dl/N signaling?

      In Figure 4B, the data points represent the fluorescence intensity per single cell within each clone. It is true that a few NRE-LacZ+ cells can still be observed within the mutant clone; however, this does not contradict our conclusion. As noted, high expression of the NRE-LacZ reporter was specifically observed around the clone boundaries in MacCer deficient cells (Fig. 4A), indicating that the mutant EBs can normally receive Dl signal from the normal ISCs located at the clone boundary and activate the Notch signaling pathway. Therefore, we believe that, although affecting Dl trafficking, MacCer deficiency does not significantly affect Notch trafficking.

      (4) Lines 222-225, Figure 5AB: The authors use the NRE-Gal4ts driver to show that GlcT depletion in EBs has no effect. However, this driver is not activated until well into the process of EB commitment, and RNAi's take several days to work, and so the author's conclusion is "specifically required in ISCs" and not at all in EBs may be erroneous.

      As previously mentioned, we acknowledge that a role for GlcT in early EBs or EEPs cannot be completely ruled out. We have revised our manuscript to present a more cautious conclusion and described this possibility in the updated version.

      (5) Figure 5C-F: These results relating to Delta endocytosis are not convincing. The data in Fig 5C are not clear and not quantitated, and the data in Figure 5F are so widely scattered that it seems these co-localizations are difficult to measure. The authors should either remove these data, improve them, or soften the conclusions taken from them. Moreover, it is unclear how the experiments tracing Delta internalization (Fig 5C) could actually work. This is because for this method to work, the anti-Dl antibody would have to pass through the visceral muscle before binding Dl on the ISC cell surface. To my knowledge, antibody transcytosis is not a common phenomenon.

      We thank the reviewer for these insightful comments and suggestions. In our in vivo experiments, we observed increased co-localization of Rab5 and Dl in GlcT mutant ISCs, indicating that Dl trafficking is delayed at the transition to Rab7⁺ late endosomes, a finding that is further supported by our antibody uptake experiments. We acknowledge that the data presented in Fig. 5C are not fully quantified and that the co-localization data in Fig. 5F may appear somewhat scattered; therefore, we have included additional quantification and enhanced the data presentation in the revised manuscript.

      Regarding the concern about antibody internalization, we appreciate this point. We currently do not know if the antibody reaches the cell surface of ISCs by passing through the visceral muscle or via other routes. Given that the experiment was conducted with fragmented gut, it is possible that the antibody may penetrate into the tissue through mechanisms independent of transcytosis.

      As mentioned earlier, we attempted to supplement our findings with live imaging experiments to investigate the dynamics of Dl/Notch endocytosis in both normal and GlcT mutant ISCs. However, we found that the GFP expression level of Dl-GFP (either in the knock-in or transgenic line) was too low to be reliably tracked. During the three-hour observation period, the weak GFP signal remained largely unchanged regardless of the GlcT mutation status, and the signal resolution under the microscope was insufficient to clearly distinguish membrane-associated from intracellular Dl. Therefore, we were unable to obtain a dynamic view of Dl trafficking through live imaging. Nevertheless, our Dl antibody uptake and endosomal retention analyses collectively support the notion that MacCer influences Notch signaling by regulating Dl endocytosis.

      (6) It is unclear whether MacCer regulates Dl-Notch signaling by modifying Dl directly or by influencing the general endocytic recycling pathway. The authors say they observe increased Dl accumulation in Rab5+ early endosomes but not in Rab7+ late endosomes upon GlcT depletion, suggesting that the recycling endosome pathway, which retrieves Dl back to the cell surface, may be impaired by GlcT loss. To test this, the authors could examine whether recycling endosomes (marked by Rab4 and Rab11) are disrupted in GlcT mutants. Rab11 has been shown to be essential for recycling endosome function in fly ISCs.

      We agree that assessing the state of recycling endosomes, especially by using markers such as Rab11, would be valuable in determining whether MacCer regulates Dl-Notch signaling by directly modifying Dl or by influencing the broader endocytic recycling pathway. In the newly added experiments, we found that in GlcT-IR flies, Dl still exhibits partial colocalization with Rab11, and the overall expression pattern of Rab11 is not affected by GlcT knockdown (Fig. 5E-F). These observations suggest that MacCer specifically regulates Dl trafficking rather than broadly affecting the recycling pathway.

      (7) It remains unclear whether Dl undergoes post-translational modification by MacCer in the fly gut. At a minimum, the authors should provide biochemical evidence (e.g., Western blot) to determine whether GlcT depletion alters the protein size of Dl.

      While we propose that MacCer may function as a component of lipid rafts, facilitating Dl membrane anchorage and endocytosis, we also acknowledge the possibility that MacCer could serve as a substrate for protein modifications of Dl necessary for its proper function. Conducting biochemical analyses to investigate potential post-translational modifications of Dl by MacCer would indeed provide valuable insights. We have performed Western blot analysis to test whether GlcT depletion affects the protein size of Dl. As shown below, we did not detect any apparent changes in the molecular weight of the Dl protein. Therefore, it is unlikely that MacCer regulates post-translational modifications of Dl.

      Author response image 1.

      To investigate whether MacCer modifies Dl by Western blot,(A) Four lanes were loaded: the first two contained 20 μL of membrane extract (lane 1: GlcT-IR, lane 2: control), while the last two contained 10 μL of membrane extract (B) Full blot images are shown under both long and shortexposure conditions.

      (8) It is unfortunate that GlcT doesn't affect Notch signaling in other organs on the fly. This brings into question the Delta trafficking model and the authors should note this. Also, the clonal marker in Figure 6C is not clear.

      In the revised working model, we have explicitly described that the events occur in intestinal stem cells. Regarding Figure 6C, we have delineated the clone with a white dashed line to enhance its clarity and visual comprehension.

      (9) The authors state that loss of UGCG in the mouse small intestine results in a reduced ISC count. However, in Supplementary Figure C3, Ki67, a marker of ISC proliferation, is significantly increased in UGCG-CKO mice. This contradiction should be clarified. The authors might repeat this experiment using an alternative ISC marker, such as Lgr5.

      Previous studies have indicated that dysregulation of the Notch signaling pathway can result in a reduction in the number of ISCs. While we did not perform a direct quantification of ISC numbers in our experiments, our Olfm4 staining—which serves as a reliable marker for ISCs—demonstrates a clear reduction in the number of positive cells in UGCG-CKO mice.

      The increased Ki67 signal we observed reflects enhanced proliferation in the transit-amplifying region, and it does not directly indicate an increase in ISC number. Therefore, in UGCG-CKO mice, we observe a decrease in the number of ISCs, while there is an increase in transit-amplifying (TA) cells (progenitor cells). This increase in TA cells is probably a secondary consequence of the loss of barrier function associated with the UGCG knockout.

    1. Author response:

      The following is the authors’ response to the original reviews

      Reviewer #1 (Public review):

      Weakness:

      I wonder how task difficulty and linguistic labels interact with the current findings. Based on the behavioral data, shapes with more geometric regularities are easier to detect when surrounded by other shapes. Do shape labels that are readily available (e.g., "square") help in making accurate and speedy decisions? Can the sensitivity to geometric regularity in intraparietal and inferior temporal regions be attributed to differences in task difficulty? Similarly, are the MEG oddball detection effects that are modulated by geometric regularity also affected by task difficulty?

      We see two aspects to the reviewer’s remarks.

      (1) Names for shapes.

      On the one hand, is the question of the impact of whether certain shapes have names and others do not in our task. The work presented here is not designed to specifically test the effect of formal western education; however, in previous work (Sablé-Meyer et al., 2021), we noted that the geometric regularity effect remains present even for shapes that do not have specific names, and even in participants who do not have names for them. Thus, we replicated our main effects with both preschoolers and adults that did not attend formal western education and found that our geometric feature model remained predictive of their behavior; we refer the reader to this previous paper for an extensive discussion of the possible role of linguistic labels, and the impact of the statistics of the environment on task performance.  

      What is more, in our behavior experiments we can discard data from any shape that is has a name in English and run our model comparison again. Doing so diminished the effect size of the geometric feature model, but it remained predictive of human behavior: indeed, if we removed all shapes but kite, rightKite, rustedHinge, hinge and random (i.e., more than half of our data, and shapes for which we came up with names but there are no established names), we nevertheless find that both models significantly correlate with human behavior—see plot in Author response image 1, equivalent of our Fig. 1E with the remaining shapes.

      Author response image 1.

      An identical analysis on the MEG leads to two noisy but significant clusters (CNN: 64.0ms to 172.0ms; then 192.0ms to 296.0ms; both p<.001: Geometric Features: 312.0ms to 364.0ms with p=.008). We have improved our manuscript thanks to the reviewer’s observation by adding a figure with the new behavior analysis to the supplementary figures and in the result section of the behavior task. We now refer to these analysis where appropriate:

      (intro) “The effect appeared as a human universal, present in preschoolers, first-graders, and adults without access to formal western math education (the Himba from Namibia), and thus seemingly independent of education and of the existence of linguistic labels for regular shapes.”

      (behavior results) “Finally, to separate the effect of name availability and geometric features on behavior, we replicated our analysis after removing the square, rectangle, trapezoids, rhombus and parallelogram from our data (Fig. S5D). This left us with five shapes, and an RDM with 10 entries, When regressing it in a GLM with our two models, we find that both models are still significant predictors (p<.001). The effect size of the geometric feature model is greatly reduced, yet remained significantly higher than that of the neural network model (p<.001).”

      (meg results) “This analysis yielded similar clusters when performed on a subset of shapes that do not have an obvious name in English, as was the case for the behavior analysis (CNN Encoding: 64.0ms to 172.0ms; then 192.0ms to 296.0ms; both p<.001: Geometric Features: 312.0ms to 364.0ms with p=.008).”

      (discussion, end of behavior section) “Previously, we only found such a significant mixture of predictors in uneducated humans (whether French preschoolers or adults from the Himba community, mitigating the possible impact of explicit western education, linguistic labels, and statistics of the environment on geometric shape representation) (Sablé-Meyer et al., 2021).”

      Perhaps the referee’s point can also be reversed: we provide a normative theory of geometric shape complexity which has the potential to explain why certain shapes have names: instead of seeing shape names as the cause of their simpler mental representation, we suggest that the converse could occur, i.e. the simpler shapes are the ones that are given names.

      (2) Task difficulty

      On the other hand is the question of whether our effect is driven by task difficulty. First, we would like to point out that this point could apply to the fMRI task, which asks for an explicit detection of deviants, but does not apply to the MEG experiment. In MEG, participants passively looked at sequences of shapes which, for a given block, comprising many instances of a fixed standard shape and rare deviants–even if they notice deviants, they have no task related to them. Yet two independent findings validated the geometric features model: there was a large effect of geometric regularity on the MEG response to deviants, and the MEG dissimilarity matrix between standard shapes correlated with a model based on geometric features, better than with a model based on CNNs. While the response to rare deviants might perhaps be attributed to “difficulty” (assuming that, in spite of the absence of an explicit task, participants try to spot the deviants and find this self-imposed task more difficult in runs with less regular shapes), it seems very hard to explain the representational similarity analysis (RSA) findings based on difficulty. Indeed, what motivated us to use RSA analysis in both fMRI and MEG was to stop relying on the response to deviants, and use solely the data from standard or “reference” shapes, and model their neural response with theory-derived regressors.

      We have updated the manuscript in several places to make our view on these points clearer:

      (experiment 4) “This design allowed us to study the neural mechanisms of the geometric regularity effect without confounding effects of task, task difficulty, or eye movements.”

      (figure 4, legend) “(A) Task structure: participants passively watch a constant stream of geometric shapes, one per second (presentation time 800ms). The stimuli are presented in blocks of 30 identical shapes up to scaling and rotation, with 4 occasional deviant shape. Participants do not have a task to perform beside fixating.”

      Reviewer #2 (Public review):

      Weakness:

      Given that the primary take away from this study is that geometric shape information is found in the dorsal stream, rather than the ventral stream there is very little there is very little discussion of prior work in this area (for reviews, see Freud et al., 2016; Orban, 2011; Xu, 2018). Indeed, there is extensive evidence of shape processing in the dorsal pathway in human adults (Freud, Culham, et al., 2017; Konen & Kastner, 2008; Romei et al., 2011), children (Freud et al., 2019), patients (Freud, Ganel, et al., 2017), and monkeys (Janssen et al., 2008; Sereno & Maunsell, 1998; Van Dromme et al., 2016), as well as the similarity between models and dorsal shape representations (Ayzenberg & Behrmann, 2022; Han & Sereno, 2022).

      We thank the reviewer for this opportunity to clarify our writing. We want to use this opportunity to highlight that our primary finding is not about whether the shapes of objects or animals (in general) are processed in the ventral versus or the dorsal pathway, but rather about the much more restricted domain of geometric shapes such as squares and triangles. We propose that simple geometric shapes afford additional levels of mental representation that rely on their geometric features – on top of the typical visual processing. To the best of our knowledge, this point has not been made in the above papers.

      Still, we agree that it is useful to better link our proposal to previous ones. We have updated the discussion section titled “Two Visual Pathways” to include more specific references to the literature that have reported visual object representations in the dorsal pathway. Following another reviewer’s observation, we have also updated our analysis to better demonstrate the overlap in activation evoked by math and by geometry in the IPS, as well as include a novel comparison with independently published results.

      Overall, to address this point, we (i) show the overlap between our “geometry” contrast (shape > word+tools+houses) and our “math” contrast (number > words); (ii) we display these ROIs side by side with ROIs found in previous work (Amalric and Dehaene, 2016), and (iii) in each math-related ROIs reported in that article, we test our “geometry” (shape > word+tools+houses) contrast and find almost all of them to be significant in both population; see Fig. S5.

      Finally, within the ROIs identified with our geometry localizer, we also performed similarity analyses: for each region we extracted the betas of every voxel for every visual category, and estimated the distance (cross-validated mahalanobis) between different visual categories. In both ventral ROIs, in both populations, numbers were closer to shapes than to the other visual categories including text and Chinese characters (all p<.001). In adults, this result also holds for the right ITG (p=.021) and the left IPS (p=.014) but not the right IPS (p=.17). In children, this result did not hold in the areas.

      Naturally, overlap in brain activation does not suffice to conclude that the same computational processes are involved. We have added an explicit caveat about this point. Indeed, throughout the article,  we have been careful to frame our results in a way that is appropriate given our evidence, e.g. saying “Those areas are similar to those active during number perception, arithmetic, geometric sequences, and the processing of high-level math concepts” and “The IPS areas activated by geometric shapes overlap with those active during the comprehension of elementary as well as advanced mathematical concepts”. We have rephrased the possibly ambiguous “geometric shapes activated math- and number-related areas, particular the right aIPS.” into “geometric shapes activated areas independently found to be activated by math- and number-related tasks, in particular the right aIPS”.

      Reviewer #3 (Public review):

      Weakness:

      Perhaps the manuscript could emphasize that the areas recruited by geometric figures but not objects are spatial, with reduced processing in visual areas. It also seems important to say that the images of real objects are interpreted as representations of 3D objects, as they activate the same visual areas as real objects. By contrast, the images of geometric forms are not interpreted as representations of real objects but rather perhaps as 2D abstractions.

      This is an interesting possibility. Geometric shapes are likely to draw attention to spatial dimensions (e.g. length) and to do so in a 2D spatial frame of reference rather than the 3D representations evoked by most other objects or images. However, this possibility would require further work to be thoroughly evaluated, for instance by comparing usual 3D objects with rare instances of 2D ones (e.g. a sheet of paper, a sticker etc). In the absence of such a test, we refrained from further speculation on this point.

      The authors use the term "symbolic." That use of that term could usefully be expanded here.  

      The reviewer is right in pointing out that “symbolic” should have been more clearly defined. We now added in the introduction:

      (introduction) “[…] we sometimes refer to this model as “symbolic” because it relies on discrete, exact, rule-based features rather than continuous representations  (Sablé-Meyer et al., 2022). In this representational format, geometric shapes are postulated to be represented by symbolic expressions in a “language-of-thought”, e.g. “a square is a four-sided figure with four equal sides and four right angles” or equivalently by a computer-like program from drawing them in a Logo-like language (Sablé-Meyer et al., 2022).”

      Here, however, the present experiments do not directly probe this format of a representation. We have therefore simplified our wording and removed many of our use of the word “symbolic” in favor of the more specific “geometric features”.

      Pigeons have remarkable visual systems. According to my fallible memory, Herrnstein investigated visual categories in pigeons. They can recognize individual people from fragments of photos, among other feats. I believe pigeons failed at geometric figures and also at cartoon drawings of things they could recognize in photos. This suggests they did not interpret line drawings of objects as representations of objects.

      The comparison of geometric abilities across species is an interesting line of research. In the discussion, we briefly mention several lines of research that indicate that non-human primates do not perceive geometric shapes in the same way as we do – but for space reasons, we are reluctant to expand this section to a broader review of other more distant species. The referee is right that there is evidence of pigeons being able to perceive an invariant abstract 3D geometric shape in spite of much variation in viewpoint (Peissig et al., 2019) – but there does not seem to be evidence that they attend to geometric regularities specifically (e.g. squares versus non-squares). Also, the referee’s point bears on the somewhat different issue of whether humans and other animals may recognize the object depicted by a symbolic drawing (e.g. a sketch of a tree). Again, humans seem to be vastly superior in this domain, and research on this topic is currently ongoing in the lab. However, the point that we are making in the present work is specifically about the neural correlates of the representation of simple geometric shapes which by design were not intended to be interpretable as representations of objects.

      Categories are established in part by contrast categories; are quadrilaterals, triangles, and circles different categories?

      We are not sure how to interpret the referee’s question, since it bears on the definition of “category” (Spontaneous? After training? With what criterion?). While we are not aware of data that can unambiguously answer the reviewer’s question, categorical perception in geometric shapes can be inferred from early work investigating pop-out effects in visual search, e.g. (Treisman and Gormican, 1988): curvature appears to generate strong pop-out effects, and therefore we would expect e.g. circles to indeed be a different category than, say, triangles. Similarly, right angles, as well as parallel lines, have been found to be perceived categorically (Dillon et al., 2019).

      This suggests that indeed squares would be perceived as categorically different from triangles and circles. On the other hand, in our own previous work (Sablé-Meyer et al., 2021) we have found that the deviants that we generated from our quadrilaterals did not pop out from displays of reference quadrilaterals. Pop-out is probably not the proper criterion for defining what a “category” is, but this is the extent to which we can provide an answer to the reviewer’s question.

      It would be instructive to investigate stimuli that are on a continuum from representational to geometric, e.g., table tops or cartons under various projections, or balls or buildings that are rectangular or triangular. Building parts, inside and out. like corners. Objects differ from geometric forms in many ways: 3D rather than 2D, more complicated shapes, and internal texture. The geometric figures used are flat, 2-D, but much geometry is 3-D (e. g. cubes) with similar abstract features.

      We agree that there is a whole line of potential research here. We decided to start by focusing on the simplest set of geometric shapes that would give us enough variation in geometric regularity while being easy to match on other visual features. We agree with the reviewer that our results should hold both for more complex 2-D shapes, but also for 3-D shapes. Indeed, generative theories of shapes in higher dimensions following similar principles as ours have been devised (I. Biederman, 1987; Leyton, 2003).  We now mention this in the discussion:

      “Finally, this research should ultimately be extended to the representation of 3-dimensional geometric shapes, for which similar symbolic generative models have indeed been proposed (Irving Biederman, 1987; Leyton, 2003).”

      The feature space of geometry is more than parallelism and symmetry; angles are important, for example. Listing and testing features would be fascinating. Similarly, looking at younger or preferably non-Western children, as Western children are exposed to shapes in play at early ages.

      We agree with the reviewer on all point. While we do not list and test the different properties separately in this work, we would like to highlight that angles are part of our geometric feature model, which includes features of “right-angle” and “equal-angles” as suggested by the reviewer.

      We also agree about the importance of testing populations with limited exposure to formal training with geometric shapes. This was in fact a core aspect of a previous article of ours which tests both preschoolers, and adults with no access to formal western education – though no non-Western children (Sablé-Meyer et al., 2021). It remains a challenge to perform brain-imaging studies in non-Western populations (although see Dehaene et al., 2010; Pegado et al., 2014).

      What in human experience but not the experience of close primates would drive the abstraction of these geometric properties? It's easy to make a case for elaborate brain processes for recognizing and distinguishing things in the world, shared by many species, but the case for brain areas sensitive to processing geometric figures is harder. The fact that these areas are active in blind mathematicians and that they are parietal areas suggests that what is important is spatial far more than visual. Could these geometric figures and their abstract properties be connected in some way to behavior, perhaps with fabrication and construction as well as use? Or with other interactions with complex objects and environments where symmetry and parallelism (and angles and curvature--and weight and size) would be important? Manual dexterity and fabrication also distinguish humans from great apes (quantitatively, not qualitatively), and action drives both visual and spatial representations of objects and spaces in the brain. I certainly wouldn't expect the authors to add research to this already packed paper, but raising some of the conceptual issues would contribute to the significance of the paper.

      We refrained from speculating about this point in the previous version of the article, but share some of the reviewers’ intuitions about the underlying drive for geometric abstraction. As described in (Dehaene, 2026; Sablé-Meyer et al., 2022), our hypothesis, which isn’t tested in the present article, is that the emergence of a pervasive ability to represent aspects of the world as compact expressions in a mental “language-of-thought” is what underlies many domains of specific human competence, including some listed by the reviewer (tool construction, scene understanding) and our domain of study here, geometric shapes.

      Recommendations for the Authors:

      Reviewer #1 (Recommendations for the authors):

      Overall, I enjoyed reading this paper. It is clearly written and nicely showcases the amount of work that has gone into conducting all these experiments and analyzing the data in sophisticated ways. I also thought the figures were great, and I liked the level of organization in the GitHub repository and am looking forward to seeing the shared data on OpenNeuro. I have some specific questions I hope the authors can address.

      (1) Behavior

      - Looking at Figure 1, it seemed like most shapes are clustering together, whereas square, rectangle, and maybe rhombus and parallelogram are slightly more unique. I was wondering whether the authors could comment on the potential influence of linguistic labels. Is it possible that it is easier to discard the intruder when the shapes are readily nameable versus not?

      This is an interesting observation, but the existence of names for shapes does not suffice to explain all of our findings ; see our reply to the public comment.

      (2) fMRI

      - As mentioned in the public review, I was surprised that the authors went with an intruder task because I would imagine that performance depends on the specific combination of geometric shapes used within a trial. I assume it is much harder to find, for example, a "Right Hinge" embedded within "Hinge" stimuli than a "Right Hinge" amongst "Squares". In addition, the rotation and scaling of each individual item should affect regular shapes less than irregular shapes, creating visual dissimilarities that would presumably make the task harder. Can the authors comment on how we can be sure that the differences we pick up in the parietal areas are not related to task difficulty but are truly related to geometric shape regularities?

      Again, please see our public review response for a larger discussion of the impact of task difficulty. There are two aspects to answering this question.

      First, the task is not as the reviewer describes: the intruder task is to find a deviant shape within several slightly rotated and scaled versions of the regular shape it came from. During brain imaging, we did not ask participants to find an exemplar of one of our reference shape amidst copies of another, but rather a deviant version of one shape against copies of its reference version. We only used this intruder task with all pairs of shapes to generate the behavioral RSA matrix.

      Second, we agree that some of the fMRI effect may stem from task difficulty, and this motivated our use of RSA analysis in fMRI, and a passive MEG task. RSA results cannot be explained by task difficulty.

      Overall, we have tried to make the limitations of the fMRI design, and the motivation for turning to passive presentation in MEG, clearer by stating the issues more clearly when we introduce experiment 4:

      “The temporal resolution of fMRI does not allow to track the dynamic of mental representations over time. Furthermore, the previous fMRI experiment suffered from several limitations. First, we studied six quadrilaterals only, compared to 11 in our previous behavioral work. Second, we used an explicit intruder detection, which implies that the geometric regularity effect was correlated with task difficulty, and we cannot exclude that this factor alone explains some of the activations in figure 3C (although it is much less clear how task difficulty alone would explain the RSA results in figure 3D). Third, the long display duration, which was necessary for good task performance especially in children, afforded the possibility of eye movements, which were not monitored inside the 3T scanner and again could have affected the activations in figure 3C.”

      - How far in the periphery were the stimuli presented? Was eye-tracking data collected for the intruder task? Similar to the point above, I would imagine that a harder trial would result in more eye movements to find the intruder, which could drive some of the differences observed here.

      A 1-degree bar was added to Figure 3A, which faithfully illustrates how the stimuli were presented in fMRI. Eye-tracking data was not collected during fMRI. Although the participants were explicitly instructed to fixate at the center of the screen and avoid eye movements, we fully agree with the referee that we cannot exclude that eye movements were present, perhaps more so for more difficult displays, and would therefore have contributed to the observed fMRI activations in experiment 3 (figure 3C). We now mention this limitation explicity at the end of experiment 3. However, crucially, this potential problem cannot apply to the MEG data. During the MEG task, the stimuli were presented one by one at the center of screen, without any explicit task, thus avoiding issues of eye movements. We therefore consider the MEG geometrical regularity effect, which comes at a relatively early latency (starting at ~160 ms) and even in a passive task, to provide the strongest evidence of geometric coding, unaffected by potential eye movement artefacts. 

      - I was wondering whether the authors would consider showing some un-thresholded maps just to see how widespread the activation of the geometric shapes is across all of the cortex.

      We share the uncorrected threshold maps in Fig. S3. for both adults and children in the category localizer, copied here as well. For the geometry task, most of the clusters identified are fairly big and survive cluster-corrected permutations; the uncorrected statistical maps look almost fully identical to the one presented in Fig. 3 (p<.001 map).

      - I'm missing some discussion on the role of early visual areas that goes beyond the RSA-CNN comparison. I would imagine that early visual areas are not only engaged due to top-down feedback (line 258) but may actually also encode some of the geometric features, such as parallel lines and symmetry. Is it feasible to look at early visual areas and examine what the similarity structure between different shapes looks like?

      If early visual areas encoded the geometric features that we propose, then even early sensor-level RSA matrices should show a strong impact of geometric features similarity, which is not what we find (figure 4D). We do, however, appreciate the referee’s request to examine more closely how this similarity structure looks like. We now provide a movie showing the significant correlation between neural activity and our two models (uncorrected participants); indeed, while the early occipital activity (around 110ms) is dominated by a significant correlation with the CNN model, there are also scattered significant sources associated to the symbolic model around these timepoints already.

      To test this further, we used beamformers to reconstruct the source-localized activity in calcarine cortex and performed an RSA analysis across that ROI. We find that indeed the CNN model is strongly significant at t=110ms (t=3.43, df=18, p=.003) while the geometric feature model is not (t=1.04, df=18, p=.31), and the CNN is significantly above the geometric feature model (t=4.25, df=18, p<.001). However, this result is not very stable across time, and there are significant temporal clusters around these timepoints associated to each model, with no significant cluster associated to a CNN > geometric (CNN: significant cluster from 88ms to 140ms, p<.001 in permutation based with 10000 permutations; geometric features has a significant cluster from 80ms to 104ms, p=.0475; no significant cluster on the difference between the two).

      (3) MEG

      - Similar to the fMRI set, I am a little worried that task difficulty has an effect on the decoding results, as the oddball should pop out more in more geometric shapes, making it easier to detect and easier to decode. Can the authors comment on whether it would matter for the conclusions whether they are decoding varying task difficulty or differences in geometric regularity, or whether they think this can be considered similarly?

      See above for an extensive discussion of the task difficulty effect. We point out that there is no task in the MEG data collection part. We have clarified the task design by updating our Fig. 4. Additionally, the fact that oddballs are more perceived more or less easily as a function of their geometric regularity is, in part, exactly the point that we are making – but, in MEG, even in the absence of a task of looking for them.

      - The authors discuss that the inflated baseline/onset decoding/regression estimates may occur because the shapes are being repeated within a mini-block, which I think is unlikely given the long ISIs and the fact that the geometric features model is not >0 at onset. I think their second possible explanation, that this may have to do with smoothing, is very possible. In the text, it said that for the non-smoothed result, the CNN encoding correlates with the data from 60ms, which makes a lot more sense. I would like to encourage the authors to provide readers with the unsmoothed beta values instead of the 100-ms smoothed version in the main plot to preserve the reason they chose to use MEG - for high temporal resolution!

      We fully agree with the reviewer and have accordingly updated the figures to show the unsmoothed data (see below). Indeed, there is now no significant CNN effect before ~60 ms (up to the accuracy of identifying onsets with our method).

      - In Figure 4C, I think it would be useful to either provide error bars or show variability across participants by plotting each participant's beta values. I think it would also be nice to plot the dissimilarity matrices based on the MEG data at select timepoints, just to see what the similarity structure is like.

      Following the reviewer’s recommendation, we plot the timeseries with SEM as shaded area, and thicker lines for statistically significant clusters, and we provide the unsmoothed version in figure Fig. 4. As for the dissimilarity matrices at select timepoints, this has now been added to figure Fig. 4.

      - To evaluate the source model reconstruction, I think the reader would need a little more detail on how it was done in the main text. How were the lead fields calculated? Which data was used to estimate the sources? How are the models correlated with the source data?

      We have imported some of the details in the main text as follows (as well as expanding the methods section a little):

      “To understand which brain areas generated these distinct patterns of activations, and probe whether they fit with our previous fMRI results, we performed a source reconstruction of our data. We projected the sensor activity onto each participant's cortical surfaces estimated from T1-images. The projection was performed using eLORETA and emptyroom recordings acquired on the same day to estimate noise covariance, with the default parameters of mne-bids-pipeline. Sources were spaced using a recursively subdivided octahedron (oct5). Group statistics were performed after alignement to fsaverage. We then replicated the RSA analysis […]”

      - In addition to fitting the CNN, which is used here to model differences in early visual cortex, have the authors considered looking at their fMRI results and localizing early visual regions, extracting a similarity matrix, and correlating that with the MEG and/or comparing it with the CNN model?

      We had ultimately decided against comparing the empirical similarity matrices from the MEG and fMRI experiments, first because the stimuli and tasks are different, and second because this would not be directly relevant to our goal, which is to evaluate whether a geometric-feature model accounts for the data. Thus, we systematically model empirical similarity matrices from fMRI and from MEG with our two models derived from different theories of shape perception in order to test predictions about their spatial and temporal dynamic. As for comparing the similarity matrix from early visual regions in fMRI with that predicted by the CNN model, this is effectively visible from our Fig. 3D where we perform searchlight RSA analysis and modeling with both the CNN and the geometric feature model; bilaterally, we find a correlation with the CNN model, although it sometimes overlap with predictions from the geometric feature model as well. We now include a section explaining this reasoning in appendix:

      “Representational similarity analysis also offers a way to directly compared similarity matrices measured in MEG and fMRI, thus allowing for fusion of those two modalities and tentatively assigning a “time stamp” to distinct MRI clusters. However, we did not attempt such an analysis here for several reasons. First, distinct tasks and block structures were used in MEG and fMRI. Second, a smaller list of shapes was used in fMRI, as imposed by the slower modality of acquisition. Third, our study was designed as an attempt to sort out between two models of geometric shape recognition. We therefore focused all analyses on this goal, which could not have been achieved by direct MEG-fMRI fusion, but required correlation with independently obtained model predictions.”

      Minor comments

      - It's a little unclear from the abstract that there is children's data for fMRI only.

      We have reworded the abstract to make this unambiguous

      - Figures 4a & b are missing y-labels.

      We can see how our labels could be confused with (sub-)plot titles and have moved them to make the interpretation clearer.

      - MEG: are the stimuli always shown in the same orientation and size?

      They are not, each shape has a random orientation and scaling. On top of a task example at the top of Fig. 4, we have now included a clearer mention of this in the main text when we introduce the task:

      “shapes were presented serially, one at a time, with small random changes in rotation and scaling parameters, in miniblocks with a fixed quadrilateral shape and with rare intruders with the bottom right corner shifted by a fixed amount (Sablé-Meyer et al., 2021)”

      - To me, the discussion section felt a little lengthy, and I wonder whether it would benefit from being a little more streamlined, focused, and targeted. I found that the structure was a little difficult to follow as it went from describing the result by modality (behavior, fMRI, MEG) back to discussing mostly aspects of the fMRI findings.

      We have tried to re-organize and streamline the discussion following these comments.

      Then, later on, I found that especially the section on "neurophysiological implementation of geometry" went beyond the focus of the data presented in the paper and was comparatively long and speculative.

      We have reexamined the discussion, but the citation of papers emphasizing a representation of non-accidental geometric properties in non-human animals was requested by other commentators on our article; and indeed, we think that they are relevant in the context of our prior suggestion that the composition of geometric features might be a uniquely human feature – these papers suggest that individual features may not, and that it is therefore compositionality which might be special to the human brain. We have nevertheless shortened it.

      Furthermore, we think that this section is important because symbolic models are often criticized for lack of a plausible neurophysiological implementation. It is therefore important to discuss whether and how the postulated symbolic geometric code could be realized in neural circuits. We have added this justification to the introduction of this section.

      Reviewer #2 (Recommendations for the authors):

      (1) If the authors want to specifically claim that their findings align with mathematical reasoning, they could at least show the overlap between the activation maps of the current study and those from prior work.

      This was added to the fMRI results. See our answers to the public review.

      (2) I wonder if the reason the authors only found aIPS in their first analysis (Figure 2) is because they are contrasting geometric shapes with figures that also have geometric properties. In other words, faces, objects, and houses also contain geometric shape information, and so the authors may have essentially contrasted out other areas that are sensitive to these features. One indication that this may be the case is that the geometric regularity effect and searchlight RSA (Figure 3) contains both anterior and posterior IPS regions (but crucially, little ventral activity). It might be interesting to discuss the implications of these differences.

      Indeed, we cannot exclude that the few symmetries, perpendicularity and parallelism cues that can be presented in faces, objects or houses were processed as such, perhaps within the ventral pathway, and that these representations would have been subtracted out. We emphasize that our subtraction isolates the geometrical features that are present in simple regular geometric shapes, over and above those that might exist in other categories. We have added this point to the discussion:

      “[… ] For instance, faces possess a plane of quasi-symmetry, and so do many other man-made tools and houses. Thus, our subtraction isolated the geometrical features that are present in simple regular geometric shapes (e.g. parallels, right angles, equality of length) over and above those that might already exist, in a less pure form, in other categories.”

      (3) I had a few questions regarding the MEG results.

      a. I didn't quite understand the task. What is a regular or oddball shape in this context? It's not clear what is being decoded. Perhaps a small example of the MEG task in Figure 4 would help?

      We now include an additional sub-figure in Fig. 4 to explain the paradigm. In brief: there is no explicit task, participants are simply asked to fixate. The shapes come in miniblocks of 30 identical reference shapes (up to rotation and scaling), among which some occasional deviant shapes randomly appear (created by moving the corner of the reference shape by some amount).

      b. In Figure 4A/B they describe the correlation with a 'symbolic model'. Is this the same as the geometric model in 4C?

      It is. We have removed this ambiguity by calling it “geometric model” and setting its color to the one associated to this model thought the article.

      c. The author's explanation for why geometric feature coding was slower than CNN encoding doesn't quite make sense to me. As an explanation, they suggest that previous studies computed "elementary features of location or motor affordance", whereas their study work examines "high-level mathematical information of an abstract nature." However, looking at the studies the authors cite in this section, it seems that these studies also examined the time course of shape processing in the dorsal pathway, not "elementary features of location or motor affordance." Second, it's not clear how the geometric feature model reflects high-level mathematical information (see point above about claiming this is related to math).

      We thank the referee for pointing out this inappropriate phrase, which we removed. We rephrased the rest of the paragraph to clarify our hypothesis in the following way:

      “However, in this work, we specifically probed the processing of geometric shapes that, if our hypothesis is correct, are represented as mental expressions that combine geometrical and arithmetic features of an abstract categorical nature, for instance representing “four equal sides” or “four right angles”. It seems logical that such expressions, combining number, angle and length information, take more time to be computed than the first wave of feedforward processing within the occipito-temporal visual pathway, and therefore only activate thereafter.”

      One explanation may be that the authors' geometric shapes require finer-grained discrimination than the object categories used in prior studies. i.e., the odd-ball task may be more of a fine-grained visual discrimination task. Indeed, it may not be a surprise that one can decode the difference between, say, a hammer and a butterfly faster than two kinds of quadrilaterals.

      We do not disagree with this intuition, although note that we do not have data on this point (we are reporting and modelling the MEG RSA matrix across geometric shapes only – in this part, no other shapes such as tools or faces are involved). Still, the difference between squares, rectangles, parallelograms and other geometric shapes in our stimuli is not so subtle. Furthermore, CNNs do make very fine grained distinctions, for instance between many different breeds of dogs in the IMAGENET corpus. Still, those sorts of distinctions capture the initial part of the MEG response, while the geometric model is needed only for the later part. Thus, we think that it is a genuine finding that geometric computations associated with the dorsal parietal pathway are slower than the image analysis performed by the ventral occipito-temporal pathway.

      d. CNN encoding at time 0 is a little weird, but the author's explanation, that this is explained by the fact that temporal smoothed using a 100 ms window makes sense. However, smoothing by 100 ms is quite a lot, and it doesn't seem accurate to present continuous time course data when the decoding or RSA result at each time point reflects a 100 ms bin. It may be more accurate to simply show unsmoothed data. I'm less convinced by the explanation about shape prediction.

      We agree. Following the reviewer’s advice, as well as the recommendation from reviewer 1, we now display unsmoothed plots, and the effects now exhibit a more reasonable timing (Figure 4D), with effects starting around ~60 ms for CNN encoding.

      (4) I appreciate the author's use of multiple models and their explanation for why DINOv2 explains more variance than the geometric and CNN models (that it represents both types of features. A variance partitioning analysis may help strengthen this conclusion (Bonner & Epstein, 2018; Lescroart et al., 2015).

      However, one difference between DINOv2 and the CNN used here is that it is trained on a dataset of 142 million images vs. the 1.5 million images used in ImageNet. Thus, DINOv2 is more likely to have been exposed to simple geometric shapes during training, whereas standard ImageNet trained models are not. Indeed, prior work has shown that lesioning line drawing-like images from such datasets drastically impairs the performance of large models (Mayilvahanan et al., 2024). Thus, it is unlikely that the use of a transformer architecture explains the performance of DINOv2. The authors could include an ImageNet-trained transformer (e.g., ViT) and a CNN trained on large datasets (e.g., ResNet trained on the Open Clip dataset) to test these possibilities. However, I think it's also sufficient to discuss visual experience as a possible explanation for the CNN and DINOv2 results. Indeed, young children are exposed to geometric shapes, whereas ImageNet-trained CNNs are not.

      We agree with the reviewer’s observation. In fact, new and ongoing work from the lab is also exploring this; we have included in supplementary materials exactly what the reviewer is suggesting, namely the time course of the correlation with ViT and with ConvNeXT. In line with the reviewers’ prediction, these networks, trained on much larger dataset and with many more parameters, can also fit the human data as well as DINOv2. We ran additional analysis of the MEG data with ViT and ConvNeXT, which we now report in Fig. S6 as well as in an additional sentence in that section:

      “[…] similar results were obtained by performing the same analysis, not only with another vision transformer network, ViT, but crucially using a much larger convolutional neural network, ConvNeXT, which comprises ~800M parameters and has been trained on 2B images, likely including many geometric shapes and human drawings. For the sake of completeness, RSA analysis in sensor space of the MEG data with these two models is provided in Fig. S6.”

      We conclude that the size and nature of the training set could be as important as the architecture – but also note that humans do not rely on such a huge training set. We have updated the text, as well as Fig. S6, accordingly by updating the section now entitled “Vision Transformers and Larger Neural Networks”, and the discussion section on theoretical models.

      (5) The authors may be interested in a recent paper from Arcaro and colleagues that showed that the parietal cortex is greatly expanded in humans (including infants) compared to non-human primates (Meyer et al., 2025), which may explain the stronger geometric reasoning abilities of humans.

      A very interesting article indeed! We have updated our article to incorporate this reference in the discussion, in the section on visual pathways, as follows:

      “Finally, recent work shows that within the visual cortex, the strongest relative difference in growth between human and non-human primates is localized in parietal areas (Meyer et al., 2025). If this expansion reflected the acquisition of new processing abilities in these regions, it  might explain the observed differences in geometric abilities between human and non-human primates (Sablé-Meyer et al., 2021).”

      Also, the authors may want to include this paper, which uses a similar oddity task and compelling shows that crows are sensitive to geometric regularity:

      Schmidbauer, P., Hahn, M., & Nieder, A. (2025). Crows recognize geometric regularity. Science Advances, 11(15), eadt3718. https://doi.org/10.1126/sciadv.adt3718

      We have ongoing discussions with the authors of this work and are  have prepared a response to their findings (Sablé-Meyer and Dehaene, 2025)–ultimately, we think that this discussion, which we agree is important, does not have its place in the present article. They used a reduced version of our design, with amplified differences in the intruders. While they did not test the fit of their model with CNN or geometric feature models, we did and found that a simple CNN suffices to account for crow behavior. Thus, we disagree that their conclusions follow from their results and their conclusions. But the present article does not seem to be the right platform to engage in this discussion.

      References

      Ayzenberg, V., & Behrmann, M. (2022). The Dorsal Visual Pathway Represents Object-Centered Spatial Relations for Object Recognition. The Journal of Neuroscience, 42(23), 4693-4710. https://doi.org/10.1523/jneurosci.2257-21.2022

      Bonner, M. F., & Epstein, R. A. (2018). Computational mechanisms underlying cortical responses to the affordance properties of visual scenes. PLoS Computational Biology, 14(4), e1006111. https://doi.org/10.1371/journal.pcbi.1006111

      Bueti, D., & Walsh, V. (2009). The parietal cortex and the representation of time, space, number and other magnitudes. Philosophical Transactions of the Royal Society B: Biological Sciences, 364(1525), 1831-1840.

      Dehaene, S., & Brannon, E. (2011). Space, time and number in the brain: Searching for the foundations of mathematical thought. Academic Press.

      Freud, E., Culham, J. C., Plaut, D. C., & Bermann, M. (2017). The large-scale organization of shape processing in the ventral and dorsal pathways. eLife, 6, e27576.

      Freud, E., Ganel, T., Shelef, I., Hammer, M. D., Avidan, G., & Behrmann, M. (2017). Three-dimensional representations of objects in dorsal cortex are dissociable from those in ventral cortex. Cerebral Cortex, 27(1), 422-434.

      Freud, E., Plaut, D. C., & Behrmann, M. (2016). 'What 'is happening in the dorsal visual pathway. Trends in Cognitive Sciences, 20(10), 773-784.

      Freud, E., Plaut, D. C., & Behrmann, M. (2019). Protracted developmental trajectory of shape processing along the two visual pathways. Journal of Cognitive Neuroscience, 31(10), 1589-1597.

      Han, Z., & Sereno, A. (2022). Modeling the Ventral and Dorsal Cortical Visual Pathways Using Artificial Neural Networks. Neural Computation, 34(1), 138-171. https://doi.org/10.1162/neco_a_01456

      Janssen, P., Srivastava, S., Ombelet, S., & Orban, G. A. (2008). Coding of shape and position in macaque lateral intraparietal area. Journal of Neuroscience, 28(26), 6679-6690.

      Konen, C. S., & Kastner, S. (2008). Two hierarchically organized neural systems for object information in human visual cortex. Nature Neuroscience, 11(2), 224-231.

      Lescroart, M. D., Stansbury, D. E., & Gallant, J. L. (2015). Fourier power, subjective distance, and object categories all provide plausible models of BOLD responses in scene-selective visual areas. Frontiers in Computational Neuroscience, 9(135), 1-20. https://doi.org/10.3389/fncom.2015.00135

      Mayilvahanan, P., Zimmermann, R. S., Wiedemer, T., Rusak, E., Juhos, A., Bethge, M., & Brendel, W. (2024). In search of forgotten domain generalization. arXiv Preprint arXiv:2410.08258.

      Meyer, E. E., Martynek, M., Kastner, S., Livingstone, M. S., & Arcaro, M. J. (2025). Expansion of a conserved architecture drives the evolution of the primate visual cortex. Proceedings of the National Academy of Sciences, 122(3), e2421585122. https://doi.org/10.1073/pnas.2421585122

      Orban, G. A. (2011). The extraction of 3D shape in the visual system of human and nonhuman primates. Annual Review of Neuroscience, 34, 361-388.

      Romei, V., Driver, J., Schyns, P. G., & Thut, G. (2011). Rhythmic TMS over Parietal Cortex Links Distinct Brain Frequencies to Global versus Local Visual Processing. Current Biology, 21(4), 334-337. https://doi.org/10.1016/j.cub.2011.01.035

      Sereno, A. B., & Maunsell, J. H. R. (1998). Shape selectivity in primate lateral intraparietal cortex. Nature, 395(6701), 500-503. https://doi.org/10.1038/26752

      Summerfield, C., Luyckx, F., & Sheahan, H. (2020). Structure learning and the posterior parietal cortex. Progress in Neurobiology, 184, 101717. https://doi.org/10.1016/j.pneurobio.2019.101717

      Van Dromme, I. C., Premereur, E., Verhoef, B.-E., Vanduffel, W., & Janssen, P. (2016). Posterior Parietal Cortex Drives Inferotemporal Activations During Three-Dimensional Object Vision. PLoS Biology, 14(4), e1002445. https://doi.org/10.1371/journal.pbio.1002445

      Xu, Y. (2018). A tale of two visual systems: Invariant and adaptive visual information representations in the primate brain. Annu. Rev. Vis. Sci, 4, 311-336.

      Reviewer #3 (Recommendations for the authors):

      Bring into the discussion some of the issues outlined above, especially a) the spatial rather than visual of the geometric figures and b) the non-representational aspects of geometric form aspects.

      We thank the reviewer for their recommendations – see our response to the public review for more details.

    1. Note: This response was posted by the corresponding author to Review Commons. The content has not been altered except for formatting.

      Learn more at Review Commons


      Reply to the reviewers

      Reviewer #1

      Evidence, reproducibility and clarity

      This paper addresses a very interesting problem of non-centrosomal microtubule organization in developing Drosophila oocytes. Using genetics and imaging experiments, the authors reveal an interplay between the activity of kinesin-1, together with its essential cofactor Ensconsin, and microtubule organization at the cell cortex by the spectraplakin Shot, minus-end binding protein Patronin and Ninein, a protein implicated in microtubule minus end anchoring. The authors demonstrate that the loss of Ensconsin affects the cortical accumulation non-centrosomal microtubule organizing center (ncMTOC) proteins, microtubule length and vesicle motility in the oocyte, and show that this phenotype can be rescued by constitutively active kinesin-1 mutant, but not by Ensconsin mutants deficient in microtubule or kinesin binding. The functional connection between Ensconsin, kinesin-1 and ncMTOCs is further supported by a rescue experiment with Shot overexpression. Genetics and imaging experiments further implicate Ninein in the same pathway. These data are a clear strength of the paper; they represent a very interesting and useful addition to the field.

      The weaknesses of the study are two-fold. First, the paper seems to lack a clear molecular model, uniting the observed phenomenology with the molecular functions of the studied proteins. Most importantly, it is not clear how kinesin-based plus-end directed transport contributes to cortical localization of ncMTOCs and regulation of microtubule length.

      Second, not all conclusions and interpretations in the paper are supported by the presented data.

      We thank the reviewer for recognizing the impact of this work. In response to the insightful suggestions, we performed extensive new experiments that establish a well-supported cellular and molecular model (Figure 7). The discussion has been restructured to directly link each conclusion to its corresponding experimental evidence, significantly strengthening the manuscript.

      Below is a list of specific comments, outlining the concerns, in the order of appearance in the paper/figures.

      Figure 1. The statement: "Ens loading on MTs in NCs and their subsequent transport by Dynein toward ring canals promotes the spatial enrichment of the Khc activator Ens in the oocyte" is not supported by data. The authors do not demonstrate that Ens is actually transported from the nurse cells to the oocyte while being attached to microtubules. They do show that the intensity of Ensconsin correlates with the intensity of microtubules, that the distribution of Ensconsin depends on its affinity to microtubules and that an Ensconsin pool locally photoactivated in a nurse cell can redistribute to the oocyte (and throughout the nurse cell) by what seems to be diffusion. The provided images suggest that Ensconsin passively diffuses into the oocyte and accumulates there because of higher microtubule density, which depends on dynein. To prove that Ensconsin is indeed transported by dynein in the microtubule-bound form, one would need to measure the residence time of Ensconsin on microtubules and demonstrate that it is longer than the time needed to transport microtubules by dynein into the oocyte; ideally, one would like to see movement of individual microtubules labelled with photoconverted Ensconsin from a nurse cell into the oocyte. Since microtubules are not enriched in the oocyte of the dynein mutant, analysis of Ensconsin intensity in this mutant is not informative and does not reveal the mechanism of Ensconsin accumulation.

      As noted by Reviewer 3, the directional movement of microtubules traveling at ~140 nm/s from nurse cells toward the oocyte through Ring Canals was previously reported using a tagged Ens-MT binding domain reporter line by Lu et al. (2022). We have therefore added the citation of this crucial work in the novel version of the manuscript (lane 155-157) and removed the photo-conversion panel.

      Critically, however, our study provides mechanistic insight that was missing from this earlier work: this mechanism is also crucial to enrich MAPs in the oocyte. The fact that Dynein mutants fail to enrich Ensconsin is a crucial piece of evidence: it supports a model of Ensconsin-loaded MT transport (Figure 1D-1F).

      Figure 2. According to the abstract, this figure shows that Ensconsin is "maintained at the oocyte cortex by Ninein". However, the figure doesn't seem to prove it - it shows that oocyte enrichment of Ensonsin is partially dependent on Ninein, but this applies to the whole cell and not just to the cell cortex. Furthermore, it is not clear whether Ninein mutation affects microtubule density, which in turn would affect Ensconsin enrichment, and therefore, it is not clear whether the effect of Ninein loss on Ensconsin distribution is direct or indirect.

      Ninein plays a critical role in Ensconsin enrichment and microtubule organization in the oocyte (new Figure 2, Figure 3, Figure S3). Quantification of total Tubulin signal shows no difference between control and Nin mutant oocytes (new Figure S3 panels A, B). We found decreased Ens enrichment in the oocyte, and Ens localization on MTs and to the cell cortex (Figure 2E, 2F, and Figure S3C and S3D).

      Novel quantitative analyses of microtubule orientation at the anterior cortex, where MTs are normally preferentially oriented toward the posterior pole (Parton et al. 2011), demonstrate that Nin mutants exhibit randomized MT orientation compared to wild-type oocytes (new Figure 3C-3E).These findings establish that Ninein (although not essential) favors Ensconsin localization on MTs, Ens enrichment in the oocyte, ncMTOC cortical localization, and more robust MT orientation toward the posterior cortex. It also suggests that Ens levels in the oocyte acts as a rheostat to control Khc activation.

      The observation that the aggregates formed by overexpressed Ninein accumulate other proteins, including Ensconsin, supports, though does not prove their interactions. Furthermore, there is absolutely no proof that Ninein aggregates are "ncMTOCs". Unless the authors demonstrate that these aggregates nucleate or anchor microtubules (for example, by detailed imaging of microtubules and EB1 comets), the text and labels in the figure would need to be altered.

      We have modified the manuscript, we now refer to an accumulation of these components in large puncta, rather than aggregates, consistent with previous observations (Rosen et al., 2000). We acknowledge in the revised version that these puncta recruit Shot, Patronin and Ens without mentioning direct interaction (lane 218).

      Importantly, we conducted a more detailed characterization of these Ninein/Shot/Patronin/Ens-containing puncta in a novel Figure S4. To rigorously assess their nucleation capacity, we analyzed Eb1-GFP-labeled MT comets, a robust readout of MT nucleation (Parton et al., 2011, Nashchekin et al., 2016). While few Eb1-positive comets occasionally emanate from these structures, confirming their identity as putative ncMTOCs, these puncta function as surprisingly weak nucleation centers (new Figure S4 E, Video S1) and, their presence does not alter overall MT architecture (new Figure S4 F). Moreover, these puncta disappear over time, are barely visible at stage 10B, they do not impair oocyte development or fertility (Figure S4 G and Table 1).

      Minor comment: Note that a "ratio" (Figure 2C) is just a ratio, and should not be expressed in arbitrary units.

      We have amended this point in all the figures.

      Figure 3B: immunoprecipitation results cannot be interpreted because the immunoprecipitated proteins (GFP, Ens-GFP, Shot-YFP) are not shown. It is also not clear that this biochemical experiment is useful. If the authors would like to suggest that Ensconsin directly binds to Patronin, the interaction would need to be properly mapped at the protein domain level.

      This is a good point: the GFP and Ens-GFP immunoprecipitated proteins are now much clearly identified on the blots and in the figure legend (new Figure 4G). Shot-YFP IP, was used as a positive control but is difficult to be detected by Western blot due to its large size (>106 Da) using conventional acrylamide gels (Nashchekin et al., 2016).

      We now explicitly state that immunoprecipitations were performed at 4°C, where microtubules are fully depolymerized, thereby excluding undirect microtubule-mediated interactions. We agree with this reviewer: we cannot formally rule out interactions through bridging by other protein components. This is stated in the revised manuscript (lane 238-239).

      One of the major phenotypes observed by the authors in Ens mutant is the loss of long microtubules. The authors make strong conclusions about the independence of this phenotype from the parameters of microtubule plus-end growth, but in fact, the quality of their data does not allow to make such a conclusion, because they only measured the number of EB1 comets and their growth rate but not the catastrophe, rescue or pausing frequency."Note that kinesin-1 has been implicated in promoting microtubule damage and rescue (doi: 10.1016/j.devcel.2021).In the absence of such measurements, one cannot conclude whether short microtubules arise through defects in the minus-end, plus-end or microtubule shaft regulation pathways.

      We thank the reviewer for raising this important point. Our data demonstrate that microtubule (MT) nucleation and polymerization rates remain unaffected under Khc RNAi and ens mutant conditions, indicating that MT dynamics alterations must arise through alternative mechanisms.

      As the reviewer suggested, recent studies on Kinesin activity and MT network regulation are indeed highly relevant. Two key studies from the Verhey and Aumeier laboratories examined Kinesin-1 gain-of-function conditions and revealed that constitutively active Kinesin-1 induces MT lattice damage (Budaitis et al., 2022). While damaged MTs can undergo self-repair, Aumeier and colleagues demonstrated that GTP-tubulin incorporation generates "rescue shafts" that promote MT rescue events (Andreu-Carbo et al., 2022). Extrapolating from these findings, loss of Kinesin-1 activity could plausibly reduce rescue shaft formation, thereby decreasing MT rescue frequency and stability. Although this hypothesis is challenging to test directly in our system, it provides a mechanistic framework for the observed reduction in MT number and stability.

      Additionally, the reviewer highlighted the role of Khc in transporting the dynactin complex, an anti-catastrophe factor, to MT plus ends (Nieuwburg et al., 2017), which could further contribute to MT stabilization. This crucial reference is now incorporated into the revised Discussion.

      Importantly, our work also demonstrates the contribution of Ens/Khc to ncMTOC targeting to the cell cortex. Our new quantitative analyses of MT organization (new Figure 5 B) reveal a defective anteroposterior orientation of cortical MTs in mutant conditions, pointing to a critical role for cortical ncMTOCs in organizing the MT network.

      Taken together, we propose that the observed MT reduction and disorganization result from multiple interconnected mechanisms: (1) reduced rescue shaft formation affecting MT stability; (2) impaired transport of anti-catastrophe factors to MT plus ends; and (3) loss of cortical ncMTOCs, which are essential for minus-end MT stabilization and network organization. The Discussion has been revised to reflect this integrated model in a dedicated paragraph (“A possible regulation of MT dynamics in the oocyte at both plus end minus MT ends by Ens and Khc” lane 415-432).

      It is important to note in that a spectraplakin, like Shot, can potentially affect different pathways, particularly when overexpressed.

      We agree that Shot harbors multiple functional domains and acts as a key organizer of both actin and microtubule cytoskeletons. Overexpression of such a cytoskeletal cross-linker could indeed perturb both networks, making interpretation of Ens phenotype rescue challenging due to potential indirect effects.

      To address this concern, we selected an appropriate Shot isoform for our rescue experiments that displayed similar localization to “endogenous” Shot-YFP (a genomic construct harboring shot regulatory sequences) and importantly that was not overexpressed.

      Elevated expression of the Shot.L(A) isoform (see Western Blot Figure S8 A), considered as the wild-type form with two CH1 and CH2 actin-binding motifs (Lee and Kolodziej, 2002), showed abnormal localization such as strong binding to the microtubules in nurse cells and oocyte confirming the risk of gain-of-function artifacts and inappropriate conclusions (Figure S8 B, arrows).

      By contrast, our rescue experiments using the Shot.L(C) isoform (that only harbors the CH2 motif) provide strong evidence against such artifacts for three reasons. First, Shot-L(C) is expressed at slightly lower levels than a Shot-YFP genomic construct (not overexpressed), and at much lower levels than Shot-L(A), despite using the same driver (Figure S8 A). Second, Shot-L(C) localization in the oocyte is similar to that of endogenous Shot-YFP, concentrating at the cell cortex (Figure S8 B, compare lower and top panels). Taken together, these controls rather suggest our rescue with the Shot-L(C) is specific.

      Note that this Shot-L(C) isoform is sufficient to complement the absence of the shot gene in other cell contexts (Lee and Kolodziej, 2002).

      Unjustified conclusions should be removed: the authors do not provide sufficient data to conclude that "ens and Khc oocytes MT organizational defects are caused by decreased ncMTOC cortical anchoring", because the actual cortical microtubule anchoring was not measured.

      This is a valid point. We acknowledge that we did not directly measure microtubule anchoring in this study. In response, we have revised the discussion to more accurately reflect our observations. Throughout the manuscript, we now refer to "cortical microtubule organization" rather than "cortical microtubule anchoring," which better aligns with the data presented.

      Minor comment: Microtubule growth velocity must be expressed in units of length per time, to enable evaluating the quality of the data, and not as a normalized value.

      This is now amended in the revised version (modified Figure S7).

      A significant part of the Discussion is dedicated to the potential role of Ensconsin in cortical microtubule anchoring and potential transport of ncMTOCs by kinesin. It is obviously fine that the authors discuss different theories, but it would be very helpful if the authors would first state what has been directly measured and established by their data, and what are the putative, currently speculative explanations of these data.

      We have carefully considered the reviewer's constructive comments and are confident that this revised version fully addresses their concerns.

      First, we have substantially strengthened the connection between the Results and Discussion sections, ensuring that our interpretations are more directly anchored in the experimental data. This restructuring significantly improves the overall clarity and logical flow of the manuscript.

      Second, we have added a new comprehensive figure presenting a molecular-scale model of Kinesin-1 activation upon release of autoinhibition by Ensconsin (new Figure 7D). Critically, this figure also illustrates our proposed positive feedback loop mechanism: Khc-dependent cytoplasmic advection promotes cortical recruitment of additional ncMTOCs, which generates new cortical microtubules and further accelerates cytoplasmic transport (Figure 7 A-C). This self-amplifying cycle provides a mechanistic framework consistent with emerging evidence that cytoplasmic flows are essential for efficient intracellular transport in both insect and mammalian oocytes.

      Minor comment: The writing and particularly the grammar need to be significantly improved throughout, which should be very easy with current language tools. Examples: "ncMTOCs recruitment" should be "ncMTOC recruitment"; "Vesicles speed" should be "Vesicle speed", "Nin oocytes harbored a WT growth,"- unclear what this means, etc. Many paragraphs are very long and difficult to read. Making shorter paragraphs would make the authors' line of thought more accessible to the reader.

      We have amended and shortened the manuscript according to this reviewer feed-back. We have specifically built more focused paragraphs to facilitates the reading.

      Significance

      This paper represents significant advance in understanding non-centrosomal microtubule organization in general and in developing Drosophila oocytes in particular by connecting the microtubule minus-end regulation pathway to the Kinesin-1 and Ensconsin/MAP7-dependent transport. The genetics and imaging data are of good quality, are appropriately presented and quantified. These are clear strengths of the study which will make it interesting to researchers studying the cytoskeleton, microtubule-associated proteins and motors, and fly development.

      The weaknesses of this study are due to the lack of clarity of the overall molecular model, which would limit the impact of the study on the field. Some interpretations are not sufficiently supported by data, but this can be solved by more precise and careful writing, without extensive additional experimentation.

      We thank the reviewer for raising these important concerns regarding clarity and data interpretation. We have thoroughly revised the manuscript to address these issues on multiple fronts. First, we have substantially rewritten key sections to ensure that our conclusions are clearly articulated and directly supported by the data. Second, we have performed several new experiments that now allow us to propose a robust mechanistic model, presented in new figures. These additions significantly strengthen the manuscript and directly address the reviewer's concerns.

      My expertise is cell biology and biochemistry of the microtubule cytoskeleton, including both microtubule-associated proteins and microtubule motors.

      Reviewer #2

      Evidence, reproducibility and clarity

      In this manuscript, Berisha et al. investigate how microtubule (MT) organization is spatially regulated during Drosophila oogenesis. The authors identify a mechanism in which the Kinesin-1 activator Ensconsin/MAP7 is transported by dynein and anchored at the oocyte cortex via Ninein, enabling localized activation of Kinesin-1. Disruption of this pathway impairs ncMTOC recruitment and MT anchoring at the cortex. The authors combine genetic manipulation with high-resolution microscopy and use three key readouts to assess MT organization during mid-to-late oogenesis: cortical MT formation, localization of posterior determinants, and ooplasmic streaming. Notably, Kinesin-1, in concert with its activator Ens/MAP7, contributes to organizing the microtubule network it travels along. Overall, the study presents interesting findings, though we have several concerns we would like the authors to address. Ensconsin enrichment in the oocyte 1. Enrichment in the oocyte • Ensconsin is a MAP that binds MTs. Given that microtubule density in the oocyte significantly exceeds that in the nurse cells, its enrichment may passively reflect this difference. To assess whether the enrichment is specific, could the authors express a non-Drosophila MAP (e.g., mammalian MAP1B) to determine whether it also preferentially localizes to the oocyte?

      To address this point, we performed a new series of experiments analyzing the enrichment of other Drosophila and non-Drosophila MAPs, including Jupiter-GFP, Eb1-GFP, and bovine Tau-GFP, all widely used markers of the microtubule cytoskeleton in flies (see new Figure S2). Our results reveal that Jupiter-GFP, Eb1-GFP, and bovine Tau-GFP all exhibit significantly weaker enrichment in the oocyte compared to Ens-GFP. Khc-GFP also shows lower enrichment. These findings indicate that MAP enrichment in the oocyte is MAP-dependent, rather than solely reflecting microtubule density or organization. Of note, we cannot exclude that microtubule post-translational modifications contribute to differential MAP binding between nurse cells and the oocyte, but this remains a question for future investigation.

      The ability of ens-wt and ens-LowMT to induce tubulin polymerization according to the light scattering data (Fig. S1J) is minimal and does not reflect dramatic differences in localization. The authors should verify that, in all cases, the polymerization product in their in vitro assays is microtubules rather than other light-scattering aggregates. What is the control in these experiments? If it is just purified tubulin, it should not form polymers at physiological concentrations.

      The critical concentration Cr for microtubule self-assembly in classical BRB80 buffer found by us and others is around 20 µM (see Fig. 2c in Weiss et al., 2010). Here, microtubules were assembled at 40 µM tubulin concentration, i.e., largely above the Cr. As stated in the materials and methods section, we systematically induced cooling at 4°C after assembly to assess the presence of aggregates, since those do not fall apart upon cooling. The decrease in optical density upon cooling is a direct control that the initial increase in DO is due to the formation of microtubules. Finally, aggregation and polymerization curves are widely different, the former displaying an exponential shape and the latter a sigmoid assembly phase (see Fig. 3A and 3B in Weiss et al., 2010).

      Photoconversion caveatsMAPs are known to dynamically associate and dissociate from microtubules. Therefore, interpretation of the Ens photoconversion data should be made with caution. The expanding red signal from the nurse cells to the oocyte may reflect a any combination of dynein-mediated MT transport and passive diffusion of unbound Ensconsin. Notably, photoconversion of a soluble protein in the nurse cells would also result in a gradual increase in red signal in the oocyte, independent of active transport. We encourage the authors to more thoroughly discuss these caveats. It may also help to present the green and red channels side by side rather than as merged images, to allow readers to assess signal movement and spatial patterns better.

      This is a valid point that mirrors the comment of Reviewers 1 and 3. The directional movement of microtubules traveling at ~140 nm/s from nurse cells toward the oocyte via the ring canals was previously reported by Lu et al. (2022) with excellent spatial resolution. Notably, this MT transport was measured using a fusion protein containing the Ens MT-binding domain. We now cite this relevant study in our revised manuscript and have removed this redundant panel in Figure 1.

      Reduction of Shot at the anterior cortex• Shot is known to bind strongly to F-actin, and in the Drosophila ovary, its localization typically correlates more closely with F-actin structures than with microtubules, despite being an MT-actin crosslinker. Therefore, the observed reduction of cortical Shot in ens, nin mutants, and Khc-RNAi oocytes is unexpected. It would be important to determine whether cortical F-actin is also disrupted in these conditions, which should be straightforward to assess via phalloidin staining.

      As requested by the reviewer, we performed actin staining experiments, which are now presented in a new Figure S5. These data demonstrate that the cortical actin network remains intact in all mutant backgrounds analyzed, ruling out any indirect effect of actin cytoskeleton disruption on the observed phenotypes.

      MTs are barely visible in Fig. 3A, which is meant to demonstrate Ens-GFP colocalization with tubulin. Higher-quality images are needed.

      The revised version now provides significantly improved images to show the different components examined. Our data show that Ens and Ninein localize at the cell cortex where they co-localize with Shot and Patronin (Figure 2 A-C). In addition, novel images show that Ens extends along microtubules (new Figure 4 A).

      MT gradient in stage 9 oocytesIn ens-/-, nin-/-, and Khc-RNAi oocytes, is there any global defect in the stage 9 microtubule gradient? This information would help clarify the extent to which cortical localization defects reflect broader disruptions in microtubule polarity.

      We now provide quantitative analysis of microtubule (MT) array organization in novel figures (Figure 3D and Figure 5B). Our data reveal that both Khc RNAi and ens mutant oocytes exhibit severe disruption of MT orientation toward the posterior (new Figure 5B). Importantly, this defect is significantly less pronounced in Nin-/- oocytes, which retain residual ncMTOCs at the cortex (new Figure 3D). This differential phenotype supports our model that cortical ncMTOCs are critical for maintaining proper MT orientation toward the posterior side of the oocyte.

      Role of Ninein in cortical anchoringThe requirement for Ninein in cortical anchorage is the least convincing aspect of the manuscript and somewhat disrupts the narrative flow. First, it is unclear whether Ninein exhibits the same oocyte-enriched localization pattern as Ensconsin. Is Ninein detectable in nurse cells? Second, the Ninein antibody signal appears concentrated in a small area of the anterior-lateral oocyte cortex (Fig. 2A), yet Ninein loss leads to reduced Shot signal along a much larger portion of the anterior cortex (Fig. 2F)-a spatial mismatch that weakens the proposed functional relationship. Third, Ninein overexpression results in cortical aggregates that co-localize with Shot, Patronin, and Ensconsin. Are these aggregates functional ncMTOCs? Do microtubules emanate from these foci?

      We now provide a more comprehensive analysis of Ninein localization. Similar to Ensconsin (Ens), endogenous Ninein is enriched in the oocyte during the early stages of oocyte development but is also detected in NCs (see modified Figure 2 A and Lasko et al., 2016). Improved imaging of Ninein further shows that the protein partially co-localizes with Ens, and ncMTOCs at the anterior cortex and with Ens-bound MTs (Figure 2B, 2C).

      Importantly, loss of Ninein (Nin) only partially reduces the enrichment of Ens in the oocyte (Figure 2E). Both Ens and Kinesin heavy chain (Khc) remain partially functional and continue to target non-centrosomal microtubule-organizing centers (ncMTOCs) to the cortex (Figure 3A). In Nin-/- mutants, a subset of long cortical microtubules (MTs) is present, thereby generating cytoplasmic streaming, although less efficiently than under wild-type (WT) conditions (Figure 3F and 3G). As a non-essential gene, we envisage Ninein as a facilitator of MT organization during oocyte development.

      Finally, our new analyses demonstrate that large puncta containing Ninein, Shot, Patronin, and despite their size, appear to be relatively weak nucleation centers (revised Figure S4 E and Video 1). In addition, their presence does not bias overall MT architecture (Figure S4 F) nor impair oocyte development and fertility (Figure S4 G and Table 1).

      Inconsistency of Khc^MutEns rescueThe Khc^MutEns variant partially rescues cortical MT formation and restores a slow but measurable cytoplasmic flow yet it fails to rescue Staufen localization (Fig. 5). This raises questions about the consistency and completeness of the rescue. Could the authors clarify this discrepancy or propose a mechanistic rationale?

      This is a good point. The cytoplasmic flows (the consequence of cargo transport by Khc on MTs) generated by a constitutively active KhcMutEns in an ens mutant condition, are less efficient than those driven by Khc activated by Ens in a control condition (Figure 6C). The rescued flow is probably not efficient enough to completely rescue the Staufen localization at stage 10.

      Additionally, this KhcMutEns variant rescues the viability of embryos from Khc27 mutant germline clones oocytes but not from ens mutants (Table1). One hypothesis is that Ens harbors additional functions beyond Khc activation.

      This incomplete rescue of Ens by an active Khc variant could also be the consequence of the “paradox of co-dependence”: Kinesin-1 also transport the antagonizing motor Dynein that promotes cargo transport in opposite directions (Hancock et al., 2016). The phenotype of a gain of function variant is therefore complex to interpret. Consistent with this, both KhcMutEns-GFP and KhcDhinge2 two active Khc only rescues partially centrosome transport in ens mutant Neural Stem Cells (Figure S10).

      Minor points: 1. The pUbi-attB-Khc-GFP vector was used to generate the Khc^MutEns transgenic line, presumably under control of the ubiquitous ubi promoter. Could the authors specify which attP landing site was used? Additionally, are the transgenic flies viable and fertile, given that Kinesin-1 is hyperactive in this construct?

      All transgenic constructs were integrated at defined genomic landing sites to ensure controlled expression levels. Specifically, both GFP-tagged KhcWT and KhcMutEns were inserted at the VK05 (attP9A) site using PhiC31-mediated integration. Full details of the landing sites are provided in the Materials and Methods section. Both transgenic flies are homozygous lethal and the transgenes are maintained over TM6B balancers.

      On page 11 (Discussion, section titled "A dual Ensconsin oocyte enrichment mechanism achieves spatial relief of Khc inhibition"), the statement "many mutations in Kif5A are causal of human diseases" would benefit from a brief clarification. Since not all readers may be familiar with kinesin gene nomenclature, please indicate that KIF5A is one of the three human homologs of Kinesin heavy chain.

      We clarified this point in the revised version (lane 465-466).

      On page 16 (Materials and Methods, "Immunofluorescence in fly ovaries"), the sentence "Ovaries were mounted on a slide with ProlonGold medium with DAPI (Invitrogen)" should be corrected to "ProLong Gold."

      This is corrected.

      Significance

      This study shows that enrichment of MAP7/ensconsin in the oocyte is the mechanism of kinesin-1 activation there and is important for cytoplasmic streaming and localization non-centrosomal microtubule-organizing centers to the oocyte cortex

      We thank the reviewers for the accurate review of our manuscript and their positive feed-back.

      Reviewer #3

      Evidence, reproducibility and clarity

      The manuscript of Berisha et al., investigates the role of Ensconsin (Ens), Kinesin-1 and Ninein in organisation of microtubules (MT) in Drosophila oocyte. At stage 9 oocytes Kinesin-1 transports oskar mRNA, a posterior determinant, along MT that are organised by ncMTOCs. At stage 10b, Kinesin-1 induces cytoplasmic advection to mix the contents of the oocyte. Ensconsin/Map7 is a MT associated protein (MAP) that uses its MT-binding domain (MBD) and kinesin binding domain (KBD) to recruit Kinesin-1 to the microtubules and to stimulate the motility of MT-bound Kinesin-1. Using various new Ens transgenes, the authors demonstrate the requirement of Ens MBD and Ninein in Ens localisation to the oocyte where Ens activates Kinesin-1 using its KBD. The authors also claim that Ens, Kinesin-1 and Ninein are required for the accumulation of ncMTOCs at the oocyte cortex and argue that the detachment of the ncMTOCs from the cortex accounts for the reduced localisation of oskar mRNA at stage 9 and the lack of cytoplasmic streaming at stage 10b. Although the manuscript contains several interesting observations, the authors' conclusions are not sufficiently supported by their data. The structure function analysis of Ensconsin (Ens) is potentially publishable, but the conclusions on ncMTOC anchoring and cytoplasmic streaming not convincing.

      We are grateful that the regulation of Khc activity by MAP7 was well received by all reviewers. While our study focuses on Drosophila oogenesis, we believe this mechanism may have broader implications for understanding kinesin regulation across biological systems.

      For the novel function of the MAP7/Khc complex in organizing its own microtubule networks through ncMTOC recruitment, we have carefully considered the reviewers' constructive recommendations. We now provide additional experimental evidence supporting a model of flux self-amplification in which ncMTOC recruitment plays a key role. It is well established that cytoplasmic flows are essential for posterior localization of cell fate determinants at stage 10B. Slow flows have also been described at earlier oogenesis stages by the groups of Saxton and St Johnston. Building on these early publications and our new experiments, we propose that these flows are essential to promote a positive feedback loop that reinforces ncMTOC recruitment and MT organization (Figure 7).

      1) The main conclusion of the manuscript is that "MT advection failure in Khc and ens in late oogenesis stems from defective cortical ncMTOCs recruitment". This completely overlooks the abundant evidence that Kinesin-1 directly drives cytoplasmic streaming by transporting vesicles and microtubules along microtubules, which then move the cytoplasm by advection (Palacios et al., 2002; Serbus et al, 2005; Lu et al, 2016). Since Kinesin-1 generates the flows, one cannot conclude that the effect of khc and ens mutants on cortical ncMTOC positioning has any direct effect on these flows, which do not occur in these mutants.

      We regret the lack of clarity of the first version of the manuscript and some missing references. We propose a model in which the Kinesin-1- dependent slow flows (described by Serbus/Saxton and Palacios/StJohnston) play a central role in amplifying ncMTOC anchoring and cortical MT network formation (see model in the new Figure 7).

      2) The authors claim that streaming phenotypes of ens and khs mutants are due to a decrease in microtubule length caused by the defective localisation of ncMTOCs. In addition to the problem raised above, However, I am not convinced that they can make accurate measurements of microtubule length from confocal images like those shown in Figure 4. Firstly, they are measuring the length of bundles of microtubules and cannot resolve individual microtubules. This problem is compounded by the fact that the microtubules do not align into parallel bundles in the mutants. This will make the "microtubules" appear shorter in the mutants. In addition, the alignment of the microtubules in wild-type allows one to choose images in which the microtubule lie in the imaging plane, whereas the more disorganized arrangement of the microtubules in the mutants means that most microtubules will cross the imaging plane, which precludes accurate measurements of their length.

      As mentioned by Reviewer 4, we have been transparent with the methodology, and the limitations that were fully described in the material and methods section.

      Cortical microtubules in oocytes are highly dynamic and move rapidly, making it technically impossible to capture their entire length using standard Z-stack acquisitions. We therefore adopted a compromise approach: measuring microtubules within a single focal plane positioned just below the oocyte cortex. This strategy is consistent with established methods in the field, such as those used by Parton et al. (2011) to track microtubule plus-end directionality. To avoid overinterpretation, we explicitly refer to these measurements as "minimum detectable MT length," acknowledging that microtubules may extend beyond the focal plane, particularly at stage 10, where long, tortuous bundles frequently exit the plane of focus. These methodological considerations and potential biases are clearly described in the Materials and Methods section and the text now mentions the possible disorganization of the MT network in the mutant conditions (lane 272-273).

      In this revised version, we now provide complementary analyses of MT network organization.Beyond length measurements (and the mentioned limitations), we also quantified microtubule network orientation at stage 9, assessing whether cortical microtubules are preferentially oriented toward the posterior axis as observed in controls (revised Figure 3D and Figure 5B). While this analysis is also subject to the same technical limitations, it reveals a clear biological difference: microtubules exhibit posterior-biased orientation in control oocytes similar to a previous study (Parton et al., 2011) but adopt a randomized orientation in Nin-/-, ens, and Khc RNAi-depleted oocytes (revised Figure 3D and Figure 5B).

      Taken together, these complementary approaches, despite their technical constraints, provide convergent evidence for the role of the Khc/Ens complex in organizing cortical microtubule networks during oogenesis.

      3) "To investigate whether the presence of these short microtubules in ens and Khc RNAi oocytes is due to defects in microtubule anchoring or is also associated with a decrease in microtubule polymerization at their plus ends, we quantified the velocity and number of EB1comets, which label growing microtubule plus ends (Figure S3)." I do not understand how the anchoring or not of microtubule minus ends to the cortex determines how far their plus ends grow, and these measurements fall short of showing that plus end growth is unaffected. It has already been shown that the Kinesin-1-dependent transport of Dynactin to growing microtubule plus ends increases the length of microtubules in the oocyte because Dynactin acts as an anti-catastrophe factor at the plus ends. Thus, khc mutants should have shorter microtubules independently of any effects on ncMTOC anchoring. The measurements of EB1 comet speed and frequency in FigS2 will not detect this change and are not relevant for their claims about microtubule length. Furthermore, the authors measured EB1 comets at stage 9 (where they did not observe short MT) rather than at stage 10b. The authors' argument would be better supported if they performed the measurements at stage 10b.

      We thank the reviewer for raising this important point. The short microtubule (MT) length observed at stage 10B could indeed result from limited plus-end growth. Unfortunately, we were unable to test this hypothesis directly: strong endogenous yolk autofluorescence at this stage prevented reliable detection of Eb1-GFP comets, precluding velocity measurements.

      At least during stage 9, our data demonstrate that MT nucleation and polymerization rates are not reduced in both KhcRNAi and ens mutant conditions, indicating that the observed MT alterations must arise through alternative mechanisms.

      In the discussion, we propose the following interconnected explanations, supported by recent literature and the reviewers’ suggestions:

      1- Reduced MT rescue events. Two seminal studies from the Verhey and Aumeier laboratories have shown that constitutively active Kinesin-1 induces MT lattice damage (Budaitis et al., 2022), which can be repaired through GTP-tubulin incorporation into "rescue shafts" that promote MT rescue (Andreu-Carbo et al., 2022). Extrapolating from these findings, loss of Kinesin-1 activity could plausibly reduce rescue shaft formation, thereby decreasing MT stability. While challenging to test directly in our system, this mechanism provides a plausible framework for the observed phenotype.

      2- Impaired transport of stabilizing factors. As that reviewer astutely points out, Khc transports the dynactin complex, an anti-catastrophe factor, to MT plus ends (Nieuwburg et al., 2017). Loss of this transport could further compromise MT plus end stability. We now discuss this important mechanism in the revised manuscript.

      3- Loss of cortical ncMTOCs. Critically, our new quantitative analyses (revised Figure 3 and Figure 5) also reveal defective anteroposterior orientation of cortical MTs in mutant conditions. These experiments suggest that Ens/Khc-mediated localization of ncMTOCs to the cortex is essential for proper MT network organization, and possibly minus-end stabilization as suggested in several studies (Feng et al., 2019, Goodwin and Vale, 2011, Nashchekin et al., 2016).

      Altogether, we now propose an integrated model in which MT reduction and disorganization may result from multiple complementary mechanisms operating downstream of Kinesin-1/Ensconsin loss. While some aspects remain difficult to test directly in our in vivo system, the convergence of our data with recent mechanistic studies provides an interesting conceptual framework. The Discussion has been revised to reflect this comprehensive view in a dedicated paragraph (“A possible regulation of MT dynamics in the oocyte at both plus end minus MT ends by Ens and Khc” lane 415-432).

      4) The Shot overexpression experiments presented in Fig.3 E-F, Fig.4D and TableS1 are very confusing. Originally , the authors used Shot-GFP overexpression at stage 9 to show that there is a decrease of ncMTOCs at the cortex in ens mutants (Fig.3 E-F) and speculated that this caused the defects in MT length and cytoplasmic advection at stage 10B. However the authors later state on page 8 that : "Shot overexpression (Shot OE) was sufficient to rescue the presence of long cortical MTs and ooplasmic advection in most ens oocytes (9/14), resembling the patterns observed in controls (Figures 4B right panel and 4D). Moreover, while ens females were fully sterile, overexpression of Shot was sufficient to restore that loss of fertility (Table S1)". Is this the same UAS Shot-GFP and VP16 Gal4 used in both experiments? If so, this contradictions puts the authors conclusions in question.

      This is an important point that requires clarification regarding our experimental design.

      The Shot-YFP construct is a genomic insertion on chromosome 3. The ens mutation is also located on chromosome 3 and we were unable to recombine this transgene with the ens mutant for live quantification of cortical Shot. To circumvent this technical limitation, we used a UAS-Shot.L(C)-GFP transgenic construct driven by a maternal driver, expressed in both wild-type (control) and ens mutant oocytes. We validated that the expression level and subcellular localization of UAS-Shot.L(C)-GFP were comparable to those of the genomic Shot-YFP (new Figure S8 A and B).

      From these experiments, we drew two key conclusions. First, cortical Shot.L(C)-GFP is less abundant in ens mutant oocytes compared to wild-type (the quantification has been removed from this version). Second, despite this reduced cortical accumulation, Shot.L(C)-GFP expression partially rescues ooplasmic flows and microtubule streaming in stage 10B ens mutant oocytes, and restores fertility to ens mutant females.

      5) The authors based they conclusions about the involvement of Ens, Kinesin-1 and Ninein in ncMTOC anchoring on the decrease in cortical fluorescence intensity of Shot-YFP and Patronin-YFP in the corresponding mutant backgrounds. However, there is a large variation in average Shot-YFP intensity between control oocytes in different experiments. In Fig. 2F-G the average level of Shot-YFP in the control sis 130 AU while in Fig.3 G-H it is only 55 AU. This makes me worry about reliability of such measurements and the conclusions drawn from them.

      To clarify this point, we have harmonized the method used to quantify the Shot-YFP signals in Figure 4E with the methodology used in Figure 3B, based on the original images. The levels are not strictly identical (Control Figure 2 B: 132.7+/-36.2 versus Control Figure 4 E: 164.0+/- 37.7). These differences are usual when experiments are performed at several-month intervals and by different users.

      6) The decrease in the intensity of Shot-YFP and Patronin-YFP cortical fluorescence in ens mutant oocytes could be because of problems with ncMTOC anchoring or with ncMTOCs formation. The authors should find a way to distinguish between these two possibilities. The authors could express Ens-Mut (described in Sung et al 2008), which localises at the oocyte posterior and test whether it recruits Shot/Patronin ncMTOCs to the posterior.

      We tried to obtain the fly stocks described in the 2008 paper by contacting former members of Pernille Rørth's laboratory. Unfortunately, we learned that the lab no longer exists and that all reagents, including the requested stocks, were either discarded or lost over time. To our knowledge, these materials are no longer available from any source. We regret that this limitation prevented us from performing the straightforward experiments suggested by the reviewer using these specific tools.

      7) According to the Materials and Methods, the Shot-GFP used in Fig.3 E-F and Fig.4 was the BDSC line 29042. This is Shot L(C), a full-length version of Shot missing the CH1 actin-binding domain that is crucial for Shot anchoring to the cortex. If the authors indeed used this version of Shot-GFP, the interpretation of the above experiments is very difficult.

      The Shot.L(C) isoform lacks the CH1 domain but retains the CH2 actin-binding motif. Truncated proteins with this domain and fused to GST retains a weak ability to bind actin in vitro. Importantly, the function of this isoform is context-dependent: it cannot rescue shot loss-of-function in neuron morphogenesis but fully restores Shot-dependent tracheal cell remodeling (Lee and Kolodziej, 2002).

      In our experiments, when the Shot.L(C) isoform was expressed under the control of a maternal driver, its localization to the oocyte cortex was comparable to that of the genomic Shot-YFP construct (new Figure S8). This demonstrates unambiguously that the CH1 domain is dispensable for Shot cortical localization in oocytes, and that CH2-mediated actin binding is sufficient for this localization. Of note, a recent study showed that actin network are not equivalent highlighting the need for specific Shot isoforms harboring specialized actin-binding domain (Nashchekin et al., 2024).

      We note that the expression level of Shot.L(C)-GFP in the oocyte appeared slightly lower than that of Shot-YFP (expressed under endogenous Shot regulatory sequences), as assessed by Western blot (Figure S8 A).

      Critically, Shot.L(C)-GFP expression was substantially lower than that of Shot.L(A)-GFP (that harbored both the CH1 and CH2 domain). Shot.L(A)-GFP was overexpressed (Figure 8 A) and ectopically localized on MTs in both nurse cells and the ooplasm (Figure S8 B middle panel and arrow). These observations are in agreement that the Shot.L(C)-GFP rescue experiment was performed at near-physiological expression levels, strengthening the validity of our conclusions.

      8) Page 6 "converted in NCs, in a region adjacent to the ring canals, Dendra-Ens-labeled MTs were found in the oocyte compartment indicating they are able to travel from NC toward the oocyte through ring canals". I have difficulty seeing the translocation of MT through the ring canals. Perhaps it would be more obvious with a movie/picture showing only one channel. Considering that f Dendra-Ens appears in the oocyte much faster than MT transport through ring canals (140nm/s, Lu et al 2022), the authors are most probably observing the translocation of free Ens rather than Ens bound to MT. The authors should also mention that Ens movement from the NC to the oocyte has been shown before with Ens MBD in Lu et al 2022 with better resolution.

      We fully agree on the caveat mentioned by this reviewer: we may observe the translocation of free Dendra-Ensconsin. The experiment, was removed and replaced by referring to the work of the Gelfand lab. The movement of MTs that travel at ~140 nm/s between nurse cells toward the oocyte through the Ring Canals was reported before by Lu et al. (2022) with a very good resolution. Notably, this directional directed movement of MTs was measured using a fusion protein encompassing Ens MT-binding domain. We decided to remove this inclusive experiment and rather refer to this relevant study.

      9) Page 6: The co-localization of Ninein with Ens and Shot at the oocyte cortex (Figure 2A). I have difficulty seeing this co-localisation. Perhaps it would be more obvious in merged images of only two channels and with higher resolution images

      10) "a pool of the Ens-GFP co-localized with Ch-Patronin at cortical ncMTOCs at the anterior cortex (Figure 3A)". I also have difficulty seeing this.

      We have performed new high-resolution acquisitions that provide clearer and more convincing evidence for the localization cortical distribution of these proteins (revised Figure 2A-2C and Figure 4A). These improved images demonstrate that Ens, Ninein, Shot, and Patronin partially colocalize at cortical ncMTOCs, as initially proposed. Importantly, the new data also reveal a spatial distinction: while Ens localizes along microtubules extending from these cortical sites, Ninein appears confined to small cytoplasmic puncta adjacent but also present on cortical microtubules.

      11) "Ninein co-localizes with Ens at the oocyte cortex and partially along cortical microtubules, contributing to the maintenance of high Ens protein levels in the oocyte and its proper cortical targeting". I could not find any data showing the involvement of Ninein in the cortical targeting of Ens.

      We found decreased Ens localization to MTs and to the cell cortex region (new Figure S3 A-B).

      12) "our MT network analyses reveal the presence of numerous short MTs cytoplasmic clustered in an anterior pattern." "This low cortical recruitment of ncMTOCs is consistent with poor MT anchoring and their cytoplasmic accumulation." I could not find any data showing that short cortical MT observed at stage 10b in ens mutant and Khc RNAi were cytoplasmic and poorly anchored.

      The sentence was removed from the revised manuscript.

      13) "The egg chamber consists of interconnected cells where Dynein and Khc activities are spatially separated. Dynein facilitates transport from NCs to the oocyte, while Khc mediates both transport and advection within the oocyte." Dynein is involved in various activities in the oocyte. It anchors the oocyte nucleus and transports bcd and grk mRNA to mention a few.

      The text was amended to reflect Dynein involvement in transport activities in the oocyte, with the appropriate references (lane 105-107).

      14) The cartoons in Fig.2H and 3I exaggerate the effect of Ninein and Ens on cortical ncMTOCs. According to the corresponding graphs, there is a 20 and 50% decrease in each case.

      New cartoons (now revised Figure 3E and 4F), are amended to reflect the ncMTOC values but also MT orientation (Figure 3E).

      Significance

      Given the important concerns raised, the significance of the findings is difficult to assess at this stage.

      We sincerely thank the reviewer for their thorough evaluation of our manuscript. We have carefully addressed their concerns through substantial new experiments and analyses. We hope that the revised manuscript, in its current form, now provides the clarifications and additional evidence requested, and that our responses demonstrate the significance of our findings.

      Reviewer #4 (Evidence, reproducibility and clarity (Required)):

      Summary: This manuscript presents an investigation into the molecular mechanisms governing spatial activation of Kinesin-1 motor protein during Drosophila oogenesis, revealing a regulatory network that controls microtubule organization and cytoplasmic transport. The authors demonstrate that Ensconsin, a MAP7 family protein and Kinesin-1 activator, is spatially enriched in the oocyte through a dual mechanism involving Dynein-mediated transport from nurse cells and cortical maintenance by Ninein. This spatial enrichment of Ens is crucial for locally relieving Kinesin-1 auto-inhibition. The Ens/Khc complex promotes cortical recruitment of non-centrosomal microtubule organizing centers (ncMTOCs), which are essential for anchoring microtubules at the cortex, enabling the formation of long, parallel microtubule streams or "twisters" that drive cytoplasmic advection during late oogenesis. This work establishes a paradigm where motor protein activation is spatially controlled through targeted localization of regulatory cofactors, with the activated motor then participating in building its own transport infrastructure through ncMTOC recruitment and microtubule network organization.

      There's a lot to like about this paper! The data are generally lovely and nicely presented. The authors also use a combination of experimental approaches, combining genetics, live and fixed imaging, and protein biochemistry.

      We thank the reviewer for this enthusiastic and supportive review, which helped us further strengthen the manuscript.

      Concerns: Page 6: "to assay if elevation of Ninein levels was able to mis-regulate Ens localization, we overexpressed a tagged Ninein-RFP protein in the oocyte. At stage 9 the overexpressed Ninein accumulated at the anterior cortex of the oocyte and also generated large cortical aggregates able to recruit high levels of Ens (Figures 2D and 2H)... The examination of Ninein/Ens cortical aggregates obtained after Ninein overexpression showed that these aggregates were also able to recruit high levels of Patronin and Shot (Figures 2E and 2H)." Firstly, I'm not crazy about the use of "overexpressed" here, since there isn't normally any Ninein-RFP in the oocyte. In these experiments it has been therefore expressed, not overexpressed. Secondly, I don't understand what the reader is supposed to make of these data. Expression of a protein carrying a large fluorescent tag leads to large aggregates (they don't look cortical to me) that include multiple proteins - in fact, all the proteins examined. I don't understand this to be evidence of anything in particular, except that Ninein-RFP causes the accumulation of big multi-protein aggregates. While I can understand what the authors were trying to do here, I think that these data are inconclusive and should be de-emphasized.

      We have revised the manuscript by replacing overexpressed with expressed (lanes 211 and 212). In addition, we now provide new localization data in both cortical (new Figure S4 A, top) and medial focal planes (new Figure S4 A, bottom), demonstrating that Ninein puncta (the word used in Rosen et al, 2019), rather than aggregates are located cortically. We also show that live IRP-labelled MTs do not colocalize with Ninein-RFP puncta. In light of the new experiments and the comments from the other reviewers, the corresponding text has been revised and de-emphasized accordingly.

      Page 7: "Co-immunoprecipitations experiments revealed that Patronin was associated with Shot-YFP, as shown previously (Nashchekin et al., 2016), but also with EnsWT-GFP, indicating that Ens, Shot and Patronin are present in the same complex (Figure 3B)." I do not agree that association between Ens-GFP and Patronin indicates that Ens is in the same complex as Shot and Patronin. It is also very possible that there are two (or more) distinct protein complexes. This conclusion could therefore be softened. Instead of "indicating" I suggest "suggesting the possibility."

      We have toned down this conclusion and indicated “suggesting the possibility” (lane 238-239).

      Page 7: "During stage 9, the average subcortical MT length, taken at one focal plane in live oocytes (see methods)..." I appreciate that the authors have been careful to describe how they measured MT length, as this is a major point for interpretation. I think the reader would benefit from an explanation of why they decided to measure in only one focal plane and how that decision could impact the results.

      We appreciate this helpful suggestion. Cortical microtubules are indeed highly dynamic and extend in multiple directions, including along the Z-axis. Moreover, their diameter is extremely small (approximately 25 nm), making it technically challenging to accurately measure their full length with high resolution using our Zeiss Airyscan confocal microscope (over several, microns): the acquisition of Z-stacks is relatively slow and therefore not well suited to capturing the rapid dynamics of these microtubules. Consequently, our length measurements represent a compromise and most likely underestimate the actual lengths of microtubules growing outside the focal plane. We note that other groups have encountered similar technical limitations (Parton et al., 2011).

      Page 7: "... the MTs exhibited an orthogonal orientation relative to the anterior cortex (Figures 4A left panels, 4C and 4E)." This phenotype might not be obvious to readers. Can it be quantified?

      We have now analyzed the orientation of microtubules (MTs) along the dorso-ventral axis. Our analysis shows that ens, Khc RNAi oocytes (new Figure 5B), and, to a lesser extent, Nin mutant oocytes (new Figure 3D), display a more random MT orientation compared to wild-type (WT) oocytes. In WT oocytes, MTs are predominantly oriented toward the posterior pole, consistent with previous findings (Parton et al., 2011).

      Page 8: "Altogether, the analyses of Ens and Khc defective oocytes suggested that MT organization defects during late oogenesis (stage 10B) were caused by an initial failure of ncMTOCs to reach the cell cortex. Therefore, we hypothesized that overexpression of the ncMTOC component Shot could restore certain aspects of microtubule cortical organization in ens-deficient oocytes. Indeed, Shot overexpression (Shot OE) was sufficient to rescue the presence of long cortical MTs and ooplasmic advection in most ens oocytes (9/14)..." The data are clear, but the explanation is not. Can the authors please explain why adding in more of an ncMTOC component (Shot) rescues a defect of ncMTOC cortical localization?

      We propose that cytoplasmic ncMTOCs can bind the cell cortex via the Shot subunit that is so far the only component that harbors actin-binding motifs. Therefore, we propose that elevating cytoplasmic Shot increase the possibility of Shot to encounter the cortex by diffusion when flows are absent. This is now explained lane 282-285.

      I'm grateful to the authors for their inclusion of helpful diagrams, as in Figures 1G and 2H. I think the manuscript might benefit from one more of these at the end, illustrating the ultimate model.

      We have carefully considered and followed the reviewer’s suggestions. In response, we have included a new figure illustrating our proposed model: the recruitment of ncMTOCs to the cell cortex through low Khc-mediated flows at stage 9 enhances cortical microtubule density, which in turn promotes self-amplifying flows (new Figure 7, panels A to C). Note that this Figure also depicts activation of Khc by loss of auto-inhibition (Figure 7, panel D).

      I'm sorry to say that the language could use quite a bit of polishing. There are missing and extraneous commas. There is also regular confusion between the use of plural and singular nouns. Some early instances include:

      1. Page 3: thought instead of "thoughted."
      2. Page 5: "A previous studies have revealed"
      3. Page 5: "A significantly loss"
      4. Page 6: "troughs ring canals" should be "through ring canals"
      5. Page 7: lives stage 9 oocytes
      6. Page 7: As ens and Khc RNAi oocytes exhibits
      7. Page 7: we examined in details
      8. Page 7: This average MT length was similar in Khc RNAi and ens mutant oocyte..

      We apologize for errors. We made the appropriate corrections of the manuscript.

      Reviewer #4 (Significance (Required)):

      This work makes a nice conceptual advance by showing that motor activation controls its own transport infrastructure, a paradigm that could extend to other systems requiring spatially regulated transport.

      We thank the reviewers for their evaluation of the manuscript and helpful comments.

    1. Author response:

      The following is the authors’ response to the original reviews.

      Reviewer #1 (Public review):

      Summary:

      This paper presents two experiments, both of which use a target detection paradigm to investigate the speed of statistical learning. The first experiment is a replication of Batterink, 2017, in which participants are presented with streams of uniform-length, trisyllabic nonsense words and asked to detect a target syllable. The results replicate previous findings, showing that learning (in the form of response time facilitation to later-occurring syllables within a nonsense word) occurs after a single exposure to a word. In the second experiment, participants are presented with streams of variable-length nonsense words (two trisyllabic words and two disyllabic words) and perform the same task. A similar facilitation effect was observed as in Experiment 1. The authors interpret these findings as evidence that target detection requires mechanisms different from segmentation. They present results of a computational model to simulate results from the target detection task and find that an "anticipation mechanism" can produce facilitation effects, without performing segmentation. The authors conclude that the mechanisms involved in the target detection task are different from those involved in the word segmentation task.

      Strengths:

      The paper presents multiple experiments that provide internal replication of a key experimental finding, in which response times are facilitated after a single exposure to an embedded pseudoword. Both experimental data and results from a computational model are presented, providing converging approaches for understanding and interpreting the main results. The data are analyzed very thoroughly using mixed effects models with multiple explanatory factors.

      Weaknesses:

      In my view, the main weaknesses of this study relate to the theoretical interpretation of the results.

      (1) The key conclusion from these findings is that the facilitation effect observed in the target detection paradigm is driven by a different mechanism (or mechanisms) than those involved in word segmentation. The argument here I think is somewhat unclear and weak, for several reasons:

      First, there appears to be some blurring in what exactly is meant by the term "segmentation" with some confusion between segmentation as a concept and segmentation as a paradigm.

      Conceptually, segmentation refers to the segmenting of continuous speech into words. However, this conceptual understanding of segmentation (as a theoretical mechanism) is not necessarily what is directly measured by "traditional" studies of statistical learning, which typically (at least in adults) involve exposure to a continuous speech stream followed by a forced-choice recognition task of words versus recombined foil items (part-words or nonwords). To take the example provided by the authors, a participant presented with the sequence GHIABCDEFABCGHI may endorse ABC as being more familiar than BCG, because ABC is presented more frequently together and the learned association between A and B is stronger than between C and G. However, endorsement of ABC over BCG does not necessarily mean that the participant has "segmented" ABC from the speech stream, just as faster reaction times in responding to syllable C versus A do not necessarily indicate successful segmentation. As the authors argue on page 7, "an encounter to a sequence in which two elements co-occur (say, AB) would theoretically allow the learner to use the predictive relationship during a subsequent encounter (that A predicts B)." By the same logic, encoding the relationship between A and B could also allow for the above-chance endorsement of items that contain AB over items containing a weaker relationship.

      Both recognition performance and facilitation through target detection reflect different outcomes of statistical learning. While they may reflect different aspects of the learning process and/or dissociable forms of memory, they may best be viewed as measures of statistical learning, rather than mechanisms in and of themselves.

      Thanks for this nuanced discussion, and this is an important point that R2 also raised. We agree that segmentation can refer to both an experimental paradigm and a mechanism that accounts for learning in the experimental paradigm. In the experimental paradigm, participants are asked to identify which words they believe to be (whole) words from the continuous syllable stream. In the target-detection experimental paradigm, participants are not asked to identify words from continuous streams, and instead, they respond to the occurrences of a certain syllable. It’s possible that learners employ one mechanism in these two tasks, or that they employ separate mechanisms. It’s also the case that, if all we have is positive evidence for both experimental paradigms, i.e., learners can succeed in segmentation tasks as well as in target detection tasks with different types of sequences, we would have no way of talking about different mechanisms, as you correctly suggested that evidence for segmenting AB and processing B faster following A, is not evidence for different mechanisms.

      However, that is not the case. When the syllable sequences contain same-length subsequences (i.e., words), learning is indeed successful in both segmentation and target detection tasks. However, in studies such as Hoch et al. (2013), findings suggest that words from mixed-length sequences are harder to segment than words from uniform-length sequences. This finding exists in adult work (e.g., Hoch et al. 2013) as well as infant work (Johnson & Tyler, 2010), and replicated here in the newly included Experiment 3, which stands in contrast to the positive findings of the facilitation effect with mixed-length sequences in the target detection paradigm (one of our main findings in the paper). Thus, it seems to be difficult to explain, if the learning mechanisms were to be the same, why humans can succeed in mixed-length sequences in target detection (as shown in Experiment 2) but fail in uniform-length sequences (as shown in Hoch et al. and Experiment 3).

      In our paper, we have clarified these points describe the separate mechanisms in more detail, in both the Introduction and General Discussion sections.

      (2) The key manipulation between experiments 1 and 2 is the length of the words in the syllable sequences, with words either constant in length (experiment 1) or mixed in length (experiment 2). The authors show that similar facilitation levels are observed across this manipulation in the current experiments. By contrast, they argue that previous findings have found that performance is impaired for mixed-length conditions compared to fixed-length conditions. Thus, a central aspect of the theoretical interpretation of the results rests on prior evidence suggesting that statistical learning is impaired in mixed-length conditions. However, it is not clear how strong this prior evidence is. There is only one published paper cited by the authors - the paper by Hoch and colleagues - that supports this conclusion in adults (other mentioned studies are all in infants, which use very different measures of learning). Other papers not cited by the authors do suggest that statistical learning can occur to stimuli of mixed lengths (Thiessen et al., 2005, using infant-directed speech; Frank et al., 2010 in adults). I think this theoretical argument would be much stronger if the dissociation between recognition and facilitation through RTs as a function of word length variability was demonstrated within the same experiment and ideally within the same group of participants.

      To summarize the evidence of learning uniform-length and mixed-length sequences (which we discussed in the Introduction section), “even though infants and adults alike have shown success segmenting syllable sequences consisting of words that were uniform in length (i.e., all words were either disyllabic; Graf Estes et al., 2007; or trisyllabic, Aslin et al., 1998), both infants and adults have shown difficulty with syllable sequences consisting of words of mixed length (Johnson & Tyler, 2010; Johnson & Jusczyk, 2003a; 2003b; Hoch et al., 2013).” The newly added Experiment 3 also provided evidence for the difference in uniform-length and mixed-length sequences. Notably, we do not agree with the idea that infant work should be disregarded as evidence just because infants were tested with habituation methods; not only were the original findings (Saffran et al. 1996) based on infant work, so were many other studies on statistical learning.

      There are other segmentation studies in the literature that have used mixed-length sequences, which are worth discussing. In short, these studies differ from the Saffran et al. (1996) studies in many important ways, and in our view, these differences explain why the learning was successful. Of interest, Thiessen et al. (2005) that you mentioned was based on infant work with infant methods, and demonstrated the very point we argued for: In their study, infants failed to learn when mixed-length sequences were pronounced as adult-directed speech, and succeeded in learning given infant-directed speech, which contained prosodic cues that were much more pronounced. The fact that infants failed to segment mixed-length sequences without certain prosodic cues is consistent with our claim that mixed-length sequences are difficult to segment in a segmentation paradigm. Another such study is Frank et al. (2010), where continuous sequences were presented in “sentences”. Different numbers of words were concatenated into sentences where a 500ms break was present between each sentence in the training sequence. One sentence contained only one word, or two words, and in the longest sentence, there were 24 words. The results showed that participants are sensitive to the effect of sentence boundaries, which coincide with word boundaries. In the extreme, the one-word-per-sentence condition simply presents learners with segmented word forms. In the 24-word-per-sentence condition, there are nevertheless sentence boundaries that are word boundaries, and knowing these word boundaries alone should allow learners to perform above chance in the test phase. Thus, in our view, this demonstrates that learners can use sentence boundaries to infer word boundaries, which is an interesting finding in its own right, but this does not show that a continuous syllable sequence with mixed word lengths is learnable without additional information. In summary, to our knowledge, syllable sequences containing mixed word lengths are better learned when additional cues to word boundaries are present, and there is strong evidence that syllable sequences containing uniform-word lengths are learned better than mixed-length ones.

      Frank, M. C., Goldwater, S., Griffiths, T. L., & Tenenbaum, J. B. (2010). Modeling human performance in statistical word segmentation. Cognition, 117(2), 107-125.

      To address your proposal of running more experiments to provide stronger evidence for our theory, we were planning to run another study to have the same group of participants do both the segmentation and target detection paradigm as suggested, but we were unable to do so as we encountered difficulties to run English-speaking participants. Instead, we have included an experiment (now Experiment 3), showing the difference between the learning of uniform-length and mixed-length sequences with the segmentation paradigm that we have never published previously. This experiment provides further evidence for adults’ difficulties in segmenting mixed-length sequences.

      (3) The authors argue for an "anticipation" mechanism in explaining the facilitation effect observed in the experiments. The term anticipation would generally be understood to imply some kind of active prediction process, related to generating the representation of an upcoming stimulus prior to its occurrence. However, the computational model proposed by the authors (page 24) does not encode anything related to anticipation per se. While it demonstrates facilitation based on prior occurrences of a stimulus, that facilitation does not necessarily depend on active anticipation of the stimulus. It is not clear that it is necessary to invoke the concept of anticipation to explain the results, or indeed that there is any evidence in the current study for anticipation, as opposed to just general facilitation due to associative learning.

      Thanks for raising this point. Indeed, the anticipation effect we reported is indistinguishable from the facilitation effect that we reported in the reported experiments. We have dropped this framing.

      In addition, related to the model, given that only bigrams are stored in the model, could the authors clarify how the model is able to account for the additional facilitation at the 3rd position of a trigram compared to the 2nd position?

      Thanks for the question. We believe it is an empirical question whether there is an additional facilitation at the 3rd position of a trigram compared to the 2nd position. To investigate this issue, we conducted the following analysis with data from Experiment 1. First, we combined the data from two conditions (exact/conceptual) from Experiment 1 so as to have better statistical power. Next, we ran a mixed effect regression with data from syllable positions 2 and 3 only (i.e., data from syllable position 1 were not included). The fixed effect included the two-way interaction between syllable position and presentation, as well as stream position, and the random effect was a by-subject random intercept and stream position as the random slope. This interaction was significant (χ<sup>2</sup>(3) =11.73, p=0.008), suggesting that there is additional facilitation to the 3rd position compared to the 2nd position.

      For the model, here is an explanation of why the model assumes an additional facilitation to the 3rd position. In our model, we proposed a simple recursive relation between the RT of a syllable occurring for the nth time and the n+1<sup>th</sup> time, which is:

      and

      RT(1) = RT0 + stream_pos * stream_inc, where the n in RT(n) represents the RT for the n<sup>th</sup> presentation of the target syllable, stream_pos is the position (3-46) in the stream, and occurrence is the number of occurrences that the syllable has occurred so far in the stream.

      What this means is that the model basically provides an RT value for every syllable in the stream. Thus, for a target at syllable position 1, there is a RT value as an unpredictable target, and for targets at syllable position 2, there is a facilitation effect. For targets at syllable position 3, it is facilitated the same amount. As such, there is an additional facilitation effect for syllable position 3 because effects of predication are recursive.

      (4) In the discussion of transitional probabilities (page 31), the authors suggest that "a single exposure does provide information about the transitions within the single exposure, and the probability of B given A can indeed be calculated from a single occurrence of AB." Although this may be technically true in that a calculation for a single exposure is possible from this formula, it is not consistent with the conceptual framework for calculating transitional probabilities, as first introduced by Saffran and colleagues. For example, Saffran et al. (1996, Science) describe that "over a corpus of speech there are measurable statistical regularities that distinguish recurring sound sequences that comprise words from the more accidental sound sequences that occur across word boundaries. Within a language, the transitional probability from one sound to the next will generally be highest when the two sounds follow one another within a word, whereas transitional probabilities spanning a word boundary will be relatively low." This makes it clear that the computation of transitional probabilities (i.e., Y | X) is conceptualized to reflect the frequency of XY / frequency of X, over a given language inventory, not just a single pair. Phrased another way, a single exposure to pair AB would not provide a reliable estimate of the raw frequencies with which A and AB occur across a given sample of language.

      Thanks for the discussion. We understand your argument, but we respectively disagree that computing transitional probabilities must be conducted under a certain theoretical framework. In our humble opinion, computing transitional probabilities is a mathematical operation, and as such, it is possible to do so with the least amount of data possible that enables the mathematical operation, which concretely is a single exposure during learning. While it is true that a single exposure may not provide a reliable estimate of frequencies or probabilities, it does provide information with which the learner can make decisions.

      This is particularly true for topics under discussion regarding the minimal amount of exposure that can enable learning. It is important to distinguish the following two questions: whether learners can learn from a short exposure period (from a single exposure, in fact) and how long of an exposure period does the learner require for it to be considered to produce a reliable estimate of frequencies. Incidentally, given the fact that learners can learn from a single exposure based on Batterink (2017) and the current study, it does not appear that learners require a long exposure period to learn about transitional probabilities.

      (5) In experiment 2, the authors argue that there is robust facilitation for trisyllabic and disyllabic words alike. I am not sure about the strength of the evidence for this claim, as it appears that there are some conflicting results relevant to this conclusion. Notably, in the regression model for disyllabic words, the omnibus interaction between word presentation and syllable position did not reach significance (p= 0.089). At face value, this result indicates that there was no significant facilitation for disyllabic words. The additional pairwise comparisons are thus not justified given the lack of omnibus interaction. The finding that there is no significant interaction between word presentation, word position, and word length is taken to support the idea that there is no difference between the two types of words, but could also be due to a lack of power, especially given the p-value (p = 0.010).

      Thanks for the comment. Firstly, we believe there is a typo in your comment, where in the last sentence, we believe you were referring to the p-value of 0.103 (source: “The interaction was not significant (χ2(3) = 6.19, p= 0.103”). Yes, a null result with a frequentist approach cannot support a null claim, but Bayesian analyses could potentially provide evidence for the null.

      To this end, we conducted a Bayes factor analysis using the approach outlined in Harms and Lakens (2018), which generates a Bayes factor by computing a Bayesian information criterion for a null model and an alternative model. The alternative model contained a three-way interaction of word length, word presentation, and word position, whereas the null model contained a two-way interaction between word presentation and word position as well as a main effect of word length. Thus, the two models only differ in terms of whether there is a three-way interaction. The Bayes factor is then computed as exp[(BICalt − BICnull)/2]. This analysis showed that there is strong evidence for the null, where the Bayes Factor was found to be exp(25.65) which is more than 1011. Thus, there is no power issue here, and there is strong evidence for the null claim that word length did not interact with other factors in Experiment 2.

      There is another issue that you mentioned, of whether we should conduct pairwise comparisons if the omnibus interaction did not reach significance. This would be true given the original analysis plan, but we believe that a revised analysis plan makes more sense. In the revised analysis plan for Experiment 2, we start with the three-way interaction (as just described in the last paragraph). The three-way interaction was not significant, and after dropping the third interaction terms, the two-way interaction and the main effect of word length are both significant, and we use this as the overall model. Testing the significance of the omnibus interaction between presentation and syllable position, we found that this was significant (χ<sup>2</sup>(3) =49.77, p<0.001). This represents that, in one model, that the interaction between presentation and syllable position using data from both disyllabic and trisyllabic words. This was in addition to a significant fixed effect of word length (β=0.018, z=6.19, p<0.001). This should motivate the rest of the planned analysis, which regards pairwise comparisons in different word length conditions.

      (6) The results plotted in Figure 2 seem to suggest that RTs to the first syllable of a trisyllabic item slow down with additional word presentations, while RTs to the final position speed up. If anything, in this figure, the magnitude of the effect seems to be greater for 1st syllable positions (e.g., the RT difference between presentation 1 and 4 for syllable position 1 seems to be numerically larger than for syllable position 3, Figure 2D). Thus, it was quite surprising to see in the results (p. 16) that RTs for syllable position 1 were not significantly different for presentation 1 vs. the later presentations (but that they were significant for positions 2 and 3 given the same comparison). Is this possibly a power issue? Would there be a significant slowdown to 1st syllables if results from both the exact replication and conceptual replication conditions were combined in the same analysis?

      Thanks for the suggestion and your careful visual inspection of the data. After combining the data, the slowdown to 1st syllables is indeed significant. We have reported this in the results of Experiment 1 (with an acknowledgement to this review):

      Results showed that later presentations took significantly longer to respond to compared to the first presentation (χ<sup>2</sup>(3) = 10.70, p=0.014), where the effect grew larger with each presentation (second presentation: β=0.011, z=1.82, p=0.069; third presentation: β=0.019, z=2.40, p=0.016; fourth presentation: β=0.034, z=3.23, p=0.001).

      (7) It is difficult to evaluate the description of the PARSER simulation on page 36. Perhaps this simulation should be introduced earlier in the methods and results rather than in the discussion only.

      Thanks for the suggestions. We have added two separate simulations in the paper, which should describe the PARSER simulations sufficiently, as well as provide further information on the correspondence between the simulations and the experiments. Thanks again for the great review! We believe our paper has improved significantly as a result.

    1. n 1983, at the age of twenty-one, Michael Johnson 1 had a deadly confrontation with a drug dealer and was convicted of second-degree murder and sentenced to fifteen-years-to-life. He spent the next twenty-eight years in California prisons. While incarcerated, Johnson earned his drug counselor certification through an offender-mentor certification program. He cofounded a program that tutors offenders to take their General Education Development high school equivalency test. He also became a licensed x-ray technician and was a team coordinator for California’s Alter- natives to Violence Project. After release, Johnson earned a bachelor’s degree in psychology, graduating summa cum laude. He is an alcohol and drug counselor in two different California counties and a lead facilitator for an Alternatives to Violence Project in his home town. Johnson’s efforts were recently recognized by His Holiness the Dalai Lama. Johnson is well remembered by those remaining within the walls of the prison; his life continues to shine as a beacon of hope to those who knew him. ‘‘I have been helped greatly by the kindness of others,’’ Johnson remembers. ‘‘I was shown unconditional love and com- passion. I want to pass that on to everyone I meet.’’ Vincent Morales was sentenced to fifteen years in prison. As he came closer to his release date, he realized he needed skills in order to support his family. He chose a woodworking arts program, where he developed carpentry skills with an emphasis on crafting guitars. Upon release, he taught his son and brother his artistry. Over a period of years, they developed a family business where Morales and his son now build high- end guitars for famous artists. BOOM: The Journal of California, Vol. 6, Number 2, pps 52–56, ISSN 2153-8018, electronic ISSN 2153-764X. © 2016 by The Regents of the University of California. All rights reserved. Please direct all requests for permission to photocopy or reproduce article content through the University of California Press’s Reprints and Permissions web page, http://www.ucpress.edu/journals.php?p¼reprints. DOI: 10.1525/boom.2016.6.2.52. 52 B O O M C A L I F O R N I A . C O M Justine Sultano struggled with substance abuse for a long time, eventually committing a crime and receiving a five-year prison sentence. While in prison, she took advantage of the rehabilitative services offered by the California Department of Corrections and Rehabilitation (CDCR), participated in self- help groups, received substance-use disorder treatment, and pursued academic and career technical education programs. While in prison, Justine mastered software programs such as Microsoft Word, Excel, and PowerPoint. Upon her release, she entered a rehabilitation facility in San Francisco, where she learned how to send emails, create a re´sume´, and search for a job. After eighteen months, Justine found a desk-clerk position at a local business. After leaving the rehabilitation facility, she enrolled in a prison-run program that provided transitional housing and emotional support; it also helped her navigate the court process to regain custody of her daughter. Sultano states, ‘‘I used to be a person who pointed fingers at others for my problems, but through the programs offered by CDCR, I learned to be honest and upfront with who I was, and where I wanted to go, and CDCR’s programs helped me get here.’’ Justine completed her journey with CDCR on 9 Septem- ber, 2015, successfully finishing her parole. Today, she still works at the local business, has custody of her daughter, and plans to attend school this year to further her career. Every day, men and women are released from prison and return to their homes and communities. Unfortunately, many will commit another crime and return to prison. CDCR has the tools to break the cycle and give offenders the skills that will enable them to be productive members of our communities. Assessment The Division of Rehabilitative Programs (DRP), the rehabil- itative arm of CDCR, provides programming and teaches skills to both prisoners and parolees to reduce their re- conviction or return-to-prison rate, three years after release from a CDCR institution. As part of CDCR, DRP exists to help prisoners leave prison with better life and job skills, more education, and the confidence to reintegrate into our communities. This process begins the moment they enter the prison system through the community reentry process. BOO M | S U M M E R 2 0 1 6 53 Once a convicted felon enters the prison system, their likelihood of being convicted of a new crime is based on a range of risk factors. CDCR uses the California Static Risk Assessment (CSRA) tool to calculate an offender’s risk of being convicted of a new offense after release from prison. Based on their criminal history and demographics, offen- ders are designated as having a low, moderate, or high risk of being convicted of a new offense after release. CDCR uses the Correctional Offender Management and Profiling Alternative Sanctions (COMPAS) tool to assess an offender’s criminogenic needs and inform decisions regard- ing placement, supervision, and case management. Once a prisoner’s needs are assessed, a correctional counselor assists them with program placement. Prisoners have many in-prison rehabilitative services and programs available to them statewide, including treatment for sub- stance abuse, Cognitive Behavioral Therapy (CBT), aca- demic and college education, and technical training. According to CDCR’s 2014 Outcome Evaluation Report, offenders who received in-prison Substance Abuse Treat- ment (SAT) and completed aftercare returned to prison at a lower rate (20.9 percent) after three years of follow-up than offenders who did not receive in-prison SAT or after- care (55.6 percent). Statewide, the three-year return to prison rate—CDCR’s primary measure of recidivism—for all offenders released in fiscal year 2011-12 was almost double (54.3 percent) the rate of offenders who received in-prison SAT and completed aftercare (20.9 percent). 2 CBT addresses negative patterns of thought that can potentially lead to criminal relapse. Negative patterns might include anything from substance abuse, anger mismanage- ment, strained family relationships, and a propensity to think about committing crimes. These negative patterns are addressed through treatment, individual and group discus- sions, counseling, motivational interviewing, role-playing, and other methods. CBT programs help prisoners deter- mine what leads them to certain actions and how to avoid situations that can trigger relapse. Continuing Education DRP’s Office of Correctional Education (OCE) provides edu- cation programming developed to prepare prisoners upon their release. OCE has established an array of educational programs that enhance the prisoners’ skill levels while providing effective tools and resources to reduce recidi- vism. 3 In fact, many enter prison with poor literacy skills and no vocational trade or college diploma. Most prisoners attend classes for at least thirty hours per week in a traditional school setting with desks, marker boards, and a teacher. Mobilizing thousands of students throughout state prisons and classrooms presents organi- zational and safety challenges, but DRP is committed to organizing classes based upon a model that provides indi- vidualized, self-paced programs for each prisoner. Those who fail to meet the behavior standards are not allowed to attend classes. During incarceration, prisoners are tested for basic reading comprehension. If a prisoner demonstrates skills lower than a ninth-grade level, they are enrolled in the Adult Basic Education (ABE) program, offering more remedial levels of education. 4 ABE is an academic program emphasizing reading, writing, and mathematics. ABE pre- pares prisoners for entry into a high school equivalency or high school diploma program, which they can complete in prison. The OCE currently provides 19 CTE programs designed to train prisoners for a career path in multiple employment and vocational sectors upon release. 5 These sectors include building and construction, energy and utilities, finance and business, public service, manufacturing and product development, and transportation. Many CTE programs include green employment skills relevant to solar, geother- mal, and smart energy management practices. Each pro- gram aligns with a positive employment outlook within the state of California, providing opportunities to earn a livable wage. For many prisoners, having the ability and opportuni- ties to earn a livable wage marks the difference between relapsing into crime or becoming a contributing member of the community. Others focus on a college education, many receiving Associate of Arts degrees in Sociology, Human Services, Business, and General Studies. The Transition Transitioning back to society can be intimidating for prison- ers; often the world has shifted dramatically during years of incarceration. The shock of little-to-no contact with the 54 B O O M C A L I F O R N I A . C O M outside world, followed by release into the community fueled with new technology can be overwhelming without assistance. The Male Community Reentry Program (MCRP) is one of CDCR’s efforts to support the transition back into society. 6 CDCR contracts with established community pro- viders for housing, treatment, and other rehabilitative services. To ease reentry into society, the MCRP allows eligible prisoners to serve the last six months of their sentences in a contracted provider’s community facility instead of state prison. Not quite the same as a halfway house, an older term now used to designate sober living homes, in the case of MCRP men are still ‘‘in custody.’’ Parole is also technically a version of being ‘‘in custody,’’ and yet the MCRP function is both pre-parole and pre-release. The significance of this is found when many inmates today, especially with so many increased commuted sentences from major sentencing law changes, never become paroled. MCRP participants are assisted in obtaining their California identification and Social Security cards—both necessary to find employment. Re´sume´ writing, professional certifications, and job search assistance are also provided. If a qualified participant finds a job while participating in MCRP, they are allowed to work while still serving their remaining sentence, and the money they earn is saved for use upon release. In addition, prison- ers in the MCRP are provided access to a wide range of community-based rehabilitative services designed to deflect negative thought patterns that can lead to relapse, such as CBT. Some prisoners close to release from prison may not be eligible for the MCRP due to their level of offense or med- ical/mental health needs. Instead, they are assigned to an in- prison reentry program, where they can receive similar rehabilitative services such as CTE classes, substance-use disorder treatment, anger management and family relation- ship counseling, and trauma informed gender-responsive treatment for women. While some of these programs may be available to prisoners with longer sentences, the in- prison reentry program’s primary focus is to prepare those who will soon return to our communities. Reentry pro- grams provide prisoners, within 18 months of release, with training for career readiness, job search skills, and practical financial literacy to facilitate a successful reentry into their communities. BOO M | S U M M E R 2 0 1 6 55 Technological Advances Like other educational institutions, California’s prisons are harnessing technology to better reach students. Implement- ing new technology in California prisons poses a raft of challenges due to the physical space, location, security, con- nectivity, firewalls, and funding requirements. However, these challenges are not insurmountable. 7 E-readers allow prisoners enrolled in college correspon- dence programs to study for their classes with digital text- books. They also allow prisoners living in high security areas to continue their education through independent study. Streaming television channels exponentially increase the quantity and quality of media content currently available for education, rehabilitation, and training purposes within Cali- fornia’s prison system. Four channels were branded and designated to stream specific content to aid prisoners in different stages and areas of their rehabilitation process. The four channels managed by and streamed to the institutions directly from CDCR headquarters focus on four subjects critical to the success of a recently released prisoner. Freedom TV focuses on how to prepare for reentry to society. Formerly incarcerated individuals and community members help prisoners prepare for the roadblocks they may face upon reentry. Wellness TV provides inmates infor- mation on developing and maintaining healthy habits. This channel teaches the factors that affect wellness of mind and body. Education TV streams academic programming com- plementing the lessons taught within the education classes developed by OCE and community colleges. Employment TV teaches job search techniques, interviewing skills, re´sume´ building and financial literacy. Continuing Rehabilitation Some prisoners, depending on the duration of their sentence, may not complete all programming by the time of their release. To address this issue, Community Reentry Services (CRS) offers rehabilitative DRP services outside of prison.8 CRS works with contracted community-based partnerships statewide, creating a network of services for parolees. This network provides education, substance-use disorder treat- ment, transitional housing, life skills training, financial plan- ning, and assistance in reestablishing family relationships. Thus, DRP displays a commitment to provide prisoners ongoing rehabilitation in an effort to prevent recidivism. Relapses, especially in criminal thinking, can be very hard to avoid and sometimes take years to overcome. Reducing recidivism is, therefore, a continuous effort— an effort that requires more than conventional tools. The Way Forward Part of the effort to ensure quality and proper programming for prisoners includes a governor-commissioned ‘‘Lifer’’ advisory committee, consisting of 20 to 30 formerly incar- cerated men and women who successfully reintegrated into society. Under the direction of DRP, this advisory group meets to weigh the strengths and weaknesses of the in- prison and community reentry system. As portrayed on reality television shows and often in the news media, California prisons can be very difficult, violent places. The media often misses, however, the many positive programs available to those who desire to change. Tens of thousands of California prisoners are enrolled in some form of rehabilitative program—most want to change. Many are carrying books, not shackles. Many encourage peace, not violence. Most will return to our communities. It is our duty to help them become productive citizens when they do

    1. Author response:

      The following is the authors’ response to the original reviews

      Public Reviews:

      Reviewer #1 (Public review):

      The manuscript by Yin and colleagues addresses a long-standing question in the field of cortical morphogenesis, regarding factors that determine differential cortical folding across species and individuals with cortical malformations. The authors present work based on a computational model of cortical folding evaluated alongside a physical model that makes use of gel swelling to investigate the role of a two-layer model for cortical morphogenesis. The study assesses these models against empirically derived cortical surfaces based on MRI data from ferret, macaque monkey, and human brains.

      The manuscript is clearly written and presented, and the experimental work (physical gel modeling as well as numerical simulations) and analyses (subsequent morphometric evaluations) are conducted at the highest methodological standards. It constitutes an exemplary use of interdisciplinary approaches for addressing the question of cortical morphogenesis by bringing together well-tuned computational modeling with physical gel models. In addition, the comparative approaches used in this paper establish a foundation for broad-ranging future lines of work that investigate the impact of perturbations or abnormalities during cortical development.

      The cross-species approach taken in this study is a major strength of the work. However, correspondence across the two methodologies did not appear to be equally consistent in predicting brain folding across all three species. The results presented in Figures 4 (and Figures S3 and S4) show broad correspondence in shape index and major sulci landmarks across all three species. Nevertheless, the results presented for the human brain lack the same degree of clear correspondence for the gel model results as observed in the macaque and ferret. While this study clearly establishes a strong foundation for comparative cortical anatomy across species and the impact of perturbations on individual morphogenesis, further work that fine-tunes physical modeling of complex morphologies, such as that of the human cortex, may help to further understand the factors that determine cortical functionalization and pathologies.

      We thank the reviewer for positive opinions and helpful comments. Yes, the physical gel model of the human brain has a lower similarity index with the real brain. There are several reasons.

      First, the highly convoluted human cortex has a few major folds (primary sulci) and a very large number of minor folds associated with secondary or tertiary sulci (on scales of order comparable to the cortical thickness), relative to the ferret and macaque cerebral cortex. In our gel model, the exact shapes, positions, and orientations of these minor folds are stochastic, which makes it hard to have a very high similarity index of the gel models when compared with the brain of a single individual.

      Second, in real human brains, these minor folds evolve dynamically with age and show differences among individuals. In experiments with the gel brain, multiscale folds form and eventually disappear as the swelling progresses through the thickness. Our physical model results are snapshots during this dynamical process, which makes it hard to have a concrete one-to-one correspondence between the instantaneous shapes of the swelling gel and the growing human brain.

      Third, the growth of the brain cortex is inhomogeneous in space and varying with time, whereas, in the gel model, swelling is relatively homogeneous.

      We agree that further systematic work, based on our proposed methods, with more fine-tuned gel geometries and properties, might provide a deeper understanding of the relations between brain geometry, and growth-induced folds and their functionalization and pathologies. Further analysis of cortical pathologies using computational and physical gel models can be found in our companion paper (Choi et al., 2025), also published in eLife:

      G. P. T. Choi, C. Liu, S. Yin, G. Séjourné, R. S. Smith, C. A. Walsh, L. Mahadevan, Biophysical basis for brain folding and misfolding patterns in ferrets and humans. eLife, 14, RP107141, 2025. doi:10.7554/eLife.107141

      Reviewer# 2 (Public review):

      This manuscript explores the mechanisms underlying cerebral cortical folding using a combination of physical modelling, computational simulations, and geometric morphometrics. The authors extend their prior work on human brain development (Tallinen et al., 2014; 2016) to a comparative framework involving three mammalian species: ferrets (Carnivora), macaques (Old World monkeys), and humans (Hominoidea). By integrating swelling gel experiments with mathematical differential growth models, they simulate sulcification instability and recapitulate key features of brain folding across species. The authors make commendable use of publicly available datasets to construct 3D models of fetal and neonatal brain surfaces: fetal macaque (ref. [26]), newborn ferret (ref. [11]), and fetal human (ref. [22]).

      Using a combination of physical models and numerical simulations, the authors compare the resulting folding morphologies to real brain surfaces using morphometric analysis. Their results show qualitative and quantitative concordance with observed cortical folding patterns, supporting the view that differential tangential growth of the cortex relative to the subcortical substrate is sufficient to account for much of the diversity in cortical folding. This is a very important point in our field, and can be used in the teaching of medical students.

      Brain folding remains a topic of ongoing debate. While some regard it as a critical specialization linked to higher cognitive function, others consider it an epiphenomenon of expansion and constrained geometry. This divergence was evident in discussions during the Strungmann Forum on cortical development (Silver¨ et al., 2019). Though folding abnormalities are reliable indicators of disrupted neurodevelopmental processes (e.g., neurogenesis, migration), their relationship to functional architecture remains unclear. Recent evidence suggests that the absolute number of neurons varies significantly with position-sulcus versus gyrus-with potential implications for local processing capacity (e.g., https://doi.org/10.1002/cne.25626). The field is thus in need of comparative, mechanistic studies like the present one.

      This paper offers an elegant and timely contribution by combining gel-based morphogenesis, numerical modelling, and morphometric analysis to examine cortical folding across species. The experimental design - constructing two-layer PDMS models from 3D MRI data and immersing them in organic solvents to induce differential swelling - is well-established in prior literature. The authors further complement this with a continuum mechanics model simulating folding as a result of differential growth, as well as a comparative analysis of surface morphologies derived from in vivo, in vitro, and in silico brains.

      We thank the reviewer for the very positive comments.

      I offer a few suggestions here for clarification and further exploration:

      Major Comments

      (1) Choice of Developmental Stages and Initial Conditions

      The authors should provide a clearer justification for the specific developmental stages chosen (e.g., G85 for macaque, GW23 for human). How sensitive are the resulting folding patterns to the initial surface geometry of the gel models? Given that folding is a nonlinear process, early geometric perturbations may propagate into divergent morphologies. Exploring this sensitivity-either through simulations or reference to prior work-would enhance the robustness of the findings.

      The initial geometry is one of the important factors that decides the final folding pattern. The smooth brain in the early developmental stage shows a broad consistency across individuals, and we expect the main folds to form similarly across species and individuals.

      Generally, we choose the initial geometry when the brain cortex is still relatively smooth. For the human, this corresponds approximately to GW23, as the major folds such as the Rolandic fissure (central sulcus), arise during this developmental stage. For the macaque brain, we chose developmental stage G85, primarily because of the availability of the dataset corresponding to this time, which also corresponds to the least folded.

      We expect that large-scale folding patterns are strongly sensitive to the initial geometry but fine-scale features are not. Since our goal is to explain the large-scale features, we expect sensitivity to the initial shape.

      Below are some references of other researchers that are consistent with this idea. Figure 4 from Wang et al. shows some images of simulations obtained by perturbing the geometry of a sphere to an ellipsoid. We see that the growth-induced folds mostly maintain their width (wavelength), but change their orientations.

      Reference:

      Wang, X., Lefévre, J., Bohi, A., Harrach, M.A., Dinomais, M. and Rousseau, F., 2021. The influence of biophysical parameters in a biomechanical model of cortical folding patterns. Scientific Reports, 11(1), p.7686.

      Related results from the same group show that slight perturbations of brain geometry, cause these folds also tend to change their orientations but not width/wavelength (Bohi et al., 2019).

      Reference:

      Bohi, A., Wang, X., Harrach, M., Dinomais, M., Rousseau, F. and Lefévre, J., 2019, July. Global perturbation of initial geometry in a biomechanical model of cortical morphogenesis. In 2019 41st Annual International Conference of the IEEE Engineering in Medicine and Biology Society (EMBC) (pp. 442-445). IEEE.

      Finally, a systematic discussion of the role of perturbations on the initial geometries and physical properties can be seen in our work on understanding a different system, gut morphogenesis (Gill et al., 2024).

      We have added the discussion about geometric sensitivity in the section Methods-Numerical Simulations:

      “Small perturbations on initial geometry would affect minor folds, but the main features of major folds, such as orientations, width, and depth, are expected to be conserved across individuals [49, 50]. For simplicity, we do not perturb the fetal brain geometry obtained from datasets.”

      (2) Parameter Space and Breakdown Points

      The numerical model assumes homogeneous growth profiles and simplifies several aspects of cortical mechanics. Parameters such as cortical thickness, modulus ratios, and growth ratios are described in Table II. It would be informative to discuss the range of parameter values for which the model remains valid, and under what conditions the physical and computational models diverge. This would help delineate the boundaries of the current modelling framework and indicate directions for refinement.

      Exploring the valid parameter space is a key problem. We have tested a series of growth parameters and will state them explicitly in our revision. In the current version, we chose the ones that yield a relatively high similarity index to the animal brains. More generally, folding patterns are largely regulated by geometry as well as physical parameters, such as cortical thickness, modulus ratios, growth ratios, and inhomogeneity. In our previous work on a different system, gut morphogenesis, where similar folding patterns are seen, we have explored these features (Gill et al., 2024).

      Reference:

      Gill, H.K., Yin, S., Nerurkar, N.L., Lawlor, J.C., Lee, C., Huycke, T.R., Mahadevan, L. and Tabin, C.J., 2024. Hox gene activity directs physical forces to differentially shape chick small and large intestinal epithelia. Developmental Cell, 59(21), pp.2834-2849.

      (3) Neglected Regional Features: The Occipital Pole of the Macaque

      One conspicuous omission is the lack of attention to the occipital pole of the macaque, which is known to remain smooth even at later gestational stages and has an unusually high neuronal density (2.5× higher than adjacent cortex). This feature is not reproduced in the gel or numerical models, nor is it discussed. Acknowledging this discrepancy-and speculating on possible developmental or mechanical explanationswould add depth to the comparative analysis. The authors may wish to include this as a limitation or a target for future work.

      Yes, we have added that the omission of the Occipital Pole of the macaque is one of our paper’s limitations. Our main aim in this paper is to explore the formation of large-scale folds, so the smooth region is not discussed. But future work could include this to make the model more complete.

      The main text has been modified in Methods, Numerical simulations:

      “To focus on fold formation, we did not discuss the relatively smooth region, such as the Occipital Pole of the macaque.”

      and also in the caption of Figure 4: “... The occipital pole region of macaque brains remains smooth in real and simulated brains.”

      (4) Spatio-Temporal Growth Rates and Available Human Data

      The authors note that accurate, species-specific spatio-temporal growth data are lacking, limiting the ability to model inhomogeneous cortical expansion. While this may be true for ferret and macaque, there are high-quality datasets available for human fetal development, now extended through ultrasound imaging (e.g., https://doi.org/10.1038/s41586-023-06630-3). Incorporating or at least referencing such data could improve the fidelity of the human model and expand the applicability of the approach to clinical or pathological scenarios.

      We thank the reviewer for pointing out the very useful datasets that exist for the exploration of inhomogeneous growth driven folding patterns. We have referred to this paper to provide suggestions for further work in exploring the role of growth inhomogeneities.

      We have referred to this high-quality dataset in our main text, Discussion:

      “...the effect of inhomogeneous growth needs to be further investigated by incorporating regional growth of the gray and white matter not only in human brains [29, 31] based on public datasets [45], but also in other species.”

      A few works have tried to incorporate inhomogeneous growth in simulating human brain folding by separating the central sulcus area into several lobes (e.g., lobe parcellation method, Wang, PhD Thesis, 2021). Since our goal in this paper is to explain the large-scale features of folding in a minimal setting, we have kept our model simple and show that it is still capable of capturing the main features of folding in a range of mammalian brains.

      Reference:

      Xiaoyu Wang. Modélisation et caractérisation du plissement cortical. Signal and Image Processing. Ecole nationale superieure Mines-Télécom Atlantique, 2021. English. 〈NNT : 2021IMTA0248〉.

      (5) Future Applications: The Inverse Problem and Fossil Brains

      The authors suggest that their morphometric framework could be extended to solve the inverse growth problem-reconstructing fetal geometries from adult brains. This speculative but intriguing direction has implications for evolutionary neuroscience, particularly the interpretation of fossil endocasts. Although beyond the scope of this paper, I encourage the authors to elaborate briefly on how such a framework might be practically implemented and validated.

      For the inverse problem, we could use the following strategies:

      a. Perform systematic simulations using different geometries and physical parameters to obtain the variation in morphologies as a function of parameters.

      b. Using either supervised training or unsupervised training (physics-informed neural networks, PINNs) to learn these characteristic morphologies and classify their dependence on the parameters using neural networks. These can then be trained to determine the possible range of geometrical and physical parameters that yield buckled patterns seen in the systematic simulations.

      c. Reconstruct the 3D surface from fossil endocasts. Using the well-trained neural network, it should be possible to predict the initial shape of the smooth brain cortex, growth profile, and stiffness ratio of the gray and white matter.

      As an example in this direction, supervised neural networks have been used recently to solve the forward problem to predict the buckling pattern of a growing two-layer system (Chavoshnejad et al., 2023). The inverse problem can then be solved using machine-learning methods when the training datasets are the folded shape, which are then used to predict the initial geometry and physical properties.

      Reference:

      Chavoshnejad, P., Chen, L., Yu, X., Hou, J., Filla, N., Zhu, D., Liu, T., Li, G., Razavi, M.J. and Wang, X., 2023. An integrated finite element method and machine learning algorithm for brain morphology prediction. Cerebral Cortex, 33(15), pp.9354-9366.

      Conclusion

      This is a well-executed and creative study that integrates diverse methodologies to address a longstanding question in developmental neurobiology. While a few aspects-such as regional folding peculiarities, sensitivity to initial conditions, and available human data-could be further elaborated, they do not detract from the overall quality and novelty of the work. I enthusiastically support this paper and believe that it will be of broad interest to the neuroscience, biomechanics, and developmental biology communities.

      Note: The paper mentions a companion paper [reference 11] that explores the cellular and anatomical changes in the ferret cortex. I did not have access to this manuscript, but judging from the title, this paper might further strengthen the conclusions.

      The companion paper (Choi et al., 2025) has also been submitted to eLife and can be found here:

      G. P. T. Choi, C. Liu, S. Yin, G. Séjourné, R. S. Smith, C. A. Walsh, L. Mahadevan, Biophysical basis for brain folding and misfolding patterns in ferrets and humans. eLife, 14, RP107141, 2025. doi:10.7554/eLife.107141

      Recommendations for the authors:

      Reviewer #1 (Recommendations for the authors):

      This study was conducted and presented to the highest methodological standards. It is clearly written, and the results are thoroughly presented in the main manuscript and supplementary materials. Nevertheless, I would present the following minor points and comments for consideration by the authors prior to finalizing their work:

      We thank the reviewer for positive opinions and helpful comments.

      (1) Where did the MRI-based cortical surface data come from? Specifically, it would be helpful to include more information regarding whether the surfaces were reconstructed based on individual- or group-level data. It appears the surfaces were group-level, and, if so, accounting for individual-level cortical folding may be a fruitful direction for future work.

      The surface data come from public database, which are stated in the Methods Section. “We used a publicly available database for all our 3d reconstructions: fetal macaque brain surfaces are obtained from Liu et al. (2020); newborn ferret brain surfaces are obtained from Choi et al. (2025); and fetal human brain surfaces are obtained from Tallinen et al. (2016).”

      These surfaces are reconstructed based on group-level data. Specifically, the macaque atlas images are constructed for brains at gestational ages of 85 days (G85, N \=18_, 9 females), 110 days (G110, _N \=10_, 7 females) and 135 days (G135, _N \=16_,_ 7 females). And yes, future work may focus on individual-level cortical folding, and we expect that more specific results could be found.

      (2) One methodological approach for assessing consistency of cortical folding within species might be an evaluation of cross-hemispheric symmetry. I would find this particularly interesting with respect to the gel models, as it could complement the quantification of variation with respect to the computationally derived and real surfaces.

      Yes, the cross-hemispheric symmetry comparison can be done by our morphometric analysis method. We have added the results of ferret brain’s left-right symmetry for gel models, simulations, and real surfaces in the supplementary material. A typical conformal mapping figure and the similarity index table are shown here.

      (3) Was there a specific reason to reorder the histogram plots in Figure 4c to macaque, ferret, human rather than to maintain the order presented in Figure 4a/b of ferret, macaque, human? I appreciate that this is a minor concern, and all subplots are indeed properly titled, but consistent order may improve clarity.

      We have reordered the histogram plots to make all the figure orders consistent.

      Reviewer #2 (Recommendations for the authors):

      (1) Please consider revising the caption of Figure 1 (or equivalent figures) to explicitly state whether features such as the macaque occipital flatness were reproduced or not.

      We thank the reviewer for pointing out the macaque occipital flatness.

      Author response table 1.

      Left-right similarity index evaluated by comparing the shape index of ferret brains, calculated with vector P-NORM p\=2,

      Author response image 1.

      Left-right similarity index of ferret brains

      Occipital Pole of the macaque remains relatively smooth in both real brains and computational models. But our main aim in this paper is to explore the large-scale folds formation, so the smooth region is not discussed in depth. But future work could include this to make the model more complete.

      (2) Some figures could benefit from clearer labelling to distinguish between in vivo, in vitro, and in silico results.

      We have supplemented some texts in panels to make the labelling clearer.

      (3) The manuscript would benefit from a short paragraph in the Discussion reflecting on how future incorporation of regional heterogeneities might improve model fidelity.

      We have added a sentence in the Discussion Section about improving the model fidelity by considering regional heterogeneities.

      “Future more accurate models incorporating spatio-temporal inhomogeneous growth profiles and mechanical properties, such as varying stiffness, would make the folding pattern closer to the real cortical folding. This relies on more in vivo measurements of the brain’s physical properties and cortical expansion.”

      (4) Suggestions for improved or additional experiments, data, or analyses.

      (5) Clarify and justify the selection of developmental stages: The authors should explain why particular gestational stages (e.g., G85 for macaque, GW23 for human) were chosen as starting points for the physical and computational models. A discussion of how sensitive the folding patterns are to the initial geometry would help assess the robustness of the model. If feasible, a brief sensitivity analysis-varying initial age or surface geometry-would strengthen the conclusions.

      The initial geometry is one of the important factors that decides the final folding pattern. The smooth brain in the early developmental stage shows a broad consistency across individuals, and we expect the main folds to form similarly across species and individuals.

      Generally, we choose the initial geometry when the brain cortex is still relatively smooth. For the human, this corresponds approximately to GW23, as the major folds such as the Rolandic fissure (central sulcus), arise during this developmental stage. For the macaque brain, we chose developmental stage G85, primarily because of the availability of the dataset corresponding to this time, which also corresponds to the least folded.

      We expect that large-scale folding patterns are strongly sensitive to the initial geometry but fine-scale features are not. Since our goal is to explain the large-scale features, we expect sensitivity to the initial shape.

      We have added the discussion about geometric sensitivity in the section Methods-Numerical Simulations: “Small perturbations on initial geometry would affect minor folds, but the main features of major folds, such as orientations, width, and depth, are expected to be conserved across individuals [49, 50]. For simplicity, we do not perturb the fetal brain geometry obtained from datasets.”

      (6) Explore parameter boundaries more explicitly: The paper would benefit from a clearer account of the ranges of mechanical and geometric parameters (e.g., growth ratios, cortical thickness) for which the model holds. Are there specific conditions under which the physical and numerical models diverge? Identifying breakdown points would help readers understand the model’s limitations and applicability.

      Exploring the valid parameter space is a key problem. We have tested a series of growth parameters and will state them explicitly in our revision. In the current version, we chose the ones that yield a relatively high similarity index to the animal brains. More generally, folding patterns are largely regulated by geometry as well as physical parameters, such as cortical thickness, modulus ratios, and growth ratios and inhomogeneity. In our previous work on a different system, gut morphogenesis, where similar folding patterns are seen, we have explored these features (Gill et al., 2024).

      (7) Address species-specific cortical peculiarities: A striking omission is the flat occipital pole of the macaque, which is not reproduced in the physical or computational models. Given its known anatomical and cellular distinctiveness, this discrepancy warrants discussion. Even if not explored experimentally, the authors could speculate on what developmental or mechanical conditions would be needed to reproduce such regional smoothness.

      Please refer to our answer to the public reviewer 2, question (3). From our results, the formation of smooth Occipital Pole might indicate that the spatio-temporal growth rate of gray and white matter are consistent in this region, such that there’s no much differential growth.

      (8) Consider integration of available human growth data: While the authors note the lack of spatiotemporal growth data across species, such datasets exist for human fetal brain development, including those from MRI and ultrasound studies (e.g., Nature 2023). Incorporating these into the human model-or at least discussing their implications-would enhance biological relevance.

      Yes, some datasets for fetal human brains have provided very comprehensive measurements on brain shapes at many developmental stages. This can surely be implemented in our current model by calculating the spatio-temporal growth rate from regional cortical shapes at different stages.

      (9) Recommendations for improving the writing and presentation:

      a) The manuscript is generally well-written, but certain sections would benefit from more explicit linksbetween the biological phenomena and the modeling framework. For instance, the Introduction and Discussion could more clearly articulate how mechanical principles interface with genetic or cellular processes, especially in the context of evolution and developmental variation.

      We have briefly discussed the gene-regulated cellular process and the induced changes of mechanical properties and growth rules in SI, table S1. In the main text, to be clearer, we have added a sentence:

      “Many malformations are related to gene-regulated abnormal cellular processes and mechanical properties, which are discussed in SI”

      b) The Discussion could better acknowledge limitations and future directions, including regional dif-ferences in folding, inter-individual variability, and the model’s assumptions of homogeneous material properties and growth.

      In the discussion section, we have pointed out four main limitations and open directions based on our current model, including the discussion on spatiotemporal growth and property. To be more complete, we have supplemented other limitations on the regional differences in folding and the interindividual variability. In the main text, we added the following sentence:

      “In addition to the homogeneity assumption, we have not investigated the inter-individual variability and regional differences in folding. More accurate and specific work is expected to focus on these directions.”

      c) The authors briefly mention the potential for addressing the inverse growth problem. Expanding this idea in a short paragraph - perhaps with hypothetical applications to fossil brain reconstructions-would broaden the paper’s appeal to evolutionary neuroscientists.

      We have stated general steps in the response to public reviewer 2, question (5).

      (10) Minor corrections to the text and figures:

      a) Figures:

      Label figures more clearly to distinguish between in vivo, in vitro, and in silico brain representations.– Ensure that the occipital pole of the macaque is visible or annotated, especially if it lacks the expected smoothness.

      Add scale bars where missing for clarity in morphometric comparisons.

      We thank the reviewer for suggestions to improve the readability of our manuscript.

      The in vivo (real), in vitro (gel), and in silico (simulated) results are both distinguished by their labels and different color scheme: gray-white for real brain, pink-white for gel model, and blue-white for simulations, respectively.

      The occipital pole of the macaque brain remains relatively smooth in our computational model but notin our physical gel model. We have clarified this in the main text: “To focus on fold formation, we did not discuss the relatively smooth region, such as the Occipital Pole of the macaque.”

      All the brain models are rescaled to the same size, where the distance between the anterior-most pointof the frontal lobe and the posterior-most point of the occipital lobe is two units.

      b) Text:

      Consider revising figure captions to explicitly mention whether specific regional features (e.g., flatoccipital pole) were observed or absent in models.

      In Table II (and relevant text), ensure parameter definitions are consistent and explained clearly for across-disciplinary audience.

      Add citations to recent human fetal growth imaging work (e.g., ultrasound-based studies) to support claims about available data.

      We have added some descriptions of the characters of the folding pattern in the caption of Figure 4,including major folds and smooth regions.

      “Three or four major folds of each brain model are highlighted and served as landmarks. The occipital pole region of macaque brains remains smooth in real and simulated brains.”

      We have clarified the definition of growth ratio gMsub>g</sub>/g<sub>w</sub> and stiffness ratio µ<sub>g</sub>/µ<sub>w</sub> between gray matter and white matter, and the normalized cortical thickness h/L in Table 2.

      We have referred to a high-quality dataset of fetal brain imaging work, the ultrasound-imaging method(Namburete et al. 2023), in our main text, Discussion:

      “...the effect of inhomogeneous growth needs to be further investigated by incorporating regional growth of the gray and white matter not only in human brains [29, 31] based on public datasets [45], but also in other species.”

    1. Author response:

      The following is the authors’ response to the original reviews.

      Reviewer #1 (Public review):

      Summary:

      This study focuses on the bacterial metabolite TMA, generated from dietary choline. These authors and others have previously generated foundational knowledge about the TMA metabolite TMAO, and its role in metabolic disease. This study extends those findings to test whether TMAO's precursor, TMA, and its receptor TAAR5 are also involved and necessary for some of these metabolic phenotypes. They find that mice lacking the host TMA receptor (Taar5-/-) have altered circadian rhythms in gene expression, metabolic hormones, gut microbiome composition, and olfactory and innate behavior. In parallel, mice lacking bacterial TMA production or host TMA oxidation have altered circadian rhythms.

      Strengths:

      These authors use state-of-the-art bacterial and murine genetics to dissect the roles of TMA, TMAO, and their receptor in various metabolic outcomes (primarily measuring plasma and tissue cytokine/gene expression). They also follow a unique and unexpected behavioral/olfactory phenotype. Statistics are impeccable.

      Weaknesses:

      Enthusiasm for the manuscript is dampened by some ambiguous writing and the presentation of ideas in the introduction, both of which could easily be improved upon revision.

      We apologize for the abbreviated and ambiguous writing style in our original submission. Given Reviewer 2 also suggested reorganizing and rewriting certain parts, we have spent time to remove ambiguity by adding additional points of clarification and adding more historical context to justify studying TMA-TAAR5 signaling in regulating host circadian rhythms. We have also reorganized the presentation of data aligned with this.

      Reviewer #2 (Public review):

      Summary:

      In the manuscript by Mahen et al., entitled "Gut Microbe-Derived Trimethylamine Shapes Circadian Rhythms Through the Host Receptor TAAR5," the authors investigate the interplay between a host G protein-coupled receptor (TAAR5), the gut microbiota-derived metabolite trimethylamine (TMA), and the host circadian system. Using a combination of genetically engineered mouse and bacterial models, the study demonstrates a link between microbial signaling and circadian regulation, particularly through effects observed in the olfactory system. Overall, this manuscript presents a novel and valuable contribution to our understanding of hostmicrobe interactions and circadian biology. However, several sections would benefit from improved clarity, organization, and mechanistic depth to fully support the authors' conclusions.

      Strengths:

      (1) The manuscript addresses an important and timely topic in host-microbe communication and circadian biology.

      (2) The studies employ multiple complementary models, e.g., Taar5 knockout mice, microbial mutants, which enhance the depth of the investigation.

      (3) The integration of behavioral, hormonal, microbial, and transcript-level data provides a multifaceted view of the observed phenotype.

      (4) The identification of olfactory-linked circadian changes in the context of gut microbes adds a novel perspective to the field.

      Weaknesses:

      While the manuscript presents compelling data, several weaknesses limit the clarity and strength of the conclusions.

      (1) The presentation of hormonal, cytokine, behavioral, and microbiome data would benefit from clearer organization, more detailed descriptions, and functional grouping to aid interpretation.

      We appreciate this comment and have reorganized the data to improve functional grouping and readability. We have also added additional detail to descriptions of the data in the revised figure legends and results.

      (2) Some transitions-particularly from behavioral to microbiome data-are abrupt and would benefit from better contextual framing.

      We agree with this comment, and have added additional language to provide smoother transitions. This in many cases brings in historical context of why we focused on both behavioral and microbiome alterations in this body of work.

      (3) The microbial rhythmicity analyses lack detail on methods and visualization, and the sequencing metadata (e.g., sample type, sex, method) are not clearly stated.

      We apologize for this, and have now added more detail in our methods, figures, and figure legends to ensure the reader can easily understand sample type, sex, and the methods used. 

      (4) Several figures are difficult to interpret due to dense layouts or vague legends, and key metabolites and gene expression comparisons are either underexplained or not consistently assessed across models.

      Aligned with the last comment we now added more detail in our methods, figures, and figure legends to provide clear information. We have now provided additional data showing the same key metabolites, hormones, and gene expression alterations in each model if the same endpoints were measured.

      (5) Finally, while the authors suggest a causal role for TAAR5 and its ligand in circadian regulation, the current data remain correlative; mechanistic experiments or stronger disclaimers are needed to support these claims.

      We agree with this comment, and as a result have removed any language causally linking TMA and TAAR5 together in circadian regulation. Instead, we only state finding in each model and refrain from overinterpreting.

      Reviewer #3 (Public review):

      Summary:

      Deletion of the TMA-sensor TAAR5 results in circadian alterations in gene expression, particularly in the olfactory bulb, plasma hormones, and neurobehaviors.

      Strengths:

      Genetic background was rigorously controlled.

      Comprehensive characterization.

      Weaknesses:

      The weaknesses identified by this reviewer are minor.

      Overall, the studies are very nicely done. However, despite careful experimentation, I note that even the controls vary considerably in their gene expression, etc, across time (eg, compare control graphs for Cry 1 in IB, 4B). It makes me wonder how inherently noisy these measurements are. While I think that the overall point that the Taar5 KO shows circadian changes is robust, future studies to dissect which changes are reproducible over the noise would be helpful.

      We thank the reviewer for this insightful comment. We completely agree that there are clear differences in the circadian data in experiments from Taar5<sup>-/-</sup> mice and those from gnotobiotic mice where we have genetically deleted CutC. Although the data from Taar5<sup>-/-</sup> mice show nice robust circadian rhythms, the data from mice where microbial CutC is altered have inherently more “noise”. We attribute some of this to the fact that the Taar5<sup>-/-</sup> mouse experiment have a fully intact and diverse gut microbiome . Whereas, the gnotobiotic study with CutC manipulation includes only a 6 member microbiome community that does not represent the normal microbiome diversity in the gut. This defined synthetic community was used as a rigorous reductionist approach, but likely affected the normal interactions between a complex intact gut microbiome and host circadian rhythms. We have added some additional discussion to indicate this in the limitations section of the manuscript.

      Impact:

      These data add to the growing literature pointing to a role for the TMA/TMAO pathway in olfaction and neurobehavioral.

      Reviewer #1 (Recommendations for the authors):

      I suggest a revision of the writing and organization. The potential impact of the study after reading the introduction is unclear. One example, in the intro, " TMAO levels are associated with many human diseases including diverse forms of CVD5-12, obesity13,14, type 2 diabetes15,16, chronic kidney disease (CKD)17,18, neurodegenerative conditions including Parkinson's and Alzheimer's disease19,20, and several cancers21,22" It would be helpful to explain how the previous literature has distinguished that the driver of these phenotypes is TMA/TMAO and not increased choline intake. Basically, for a TMA/O novice reader, a more detailed intro would be helpful.

      We appreciate this insightful comment and have now provided a more expansive historical context for the reader regarding the effects of choline consumption (which impacts many things, including choline, acetylcholine, phosphatidylcholine, TMA, TMAO, etc) versus the primary effects of TMA and TMAO.

      There were also many uses of vague language (regulation/impact/etc). Directionality would be super helpful.

      We thank the reviewer for this recommendation and have improved language as suggested to show directionality of our findings. The terms regulation, impact, shape etc. are used only when we describe multiple variable changing at the same time over the time course of a 24-hour circadian period (some increased and some decreased).

      Reviewer #2 (Recommendations for the authors):

      In the manuscript by Mahen et al., entitled "Gut Microbe-Derived Trimethylamine Shapes Circadian Rhythms Through the Host Receptor TAAR5," the authors investigate the interplay between a host G protein-coupled receptor (TAAR5), the gut microbiota-derived metabolite trimethylamine (TMA), and the host circadian system. Using a combination of genetically engineered mouse and bacterial models, the study demonstrates a link between microbial signaling and circadian regulation, particularly through effects observed in the olfactory system. Overall, this manuscript presents a novel and valuable contribution to our understanding of hostmicrobe interactions and circadian biology. However, several sections would benefit from improved clarity, organization, and mechanistic depth to fully support the authors' conclusions. Below are specific major and minor suggestions intended to enhance the presentation and interpretation of the data.

      Major suggestions:

      (1) Consider adding a schematic/model figure as Panel A early in the manuscript to help readers understand the experimental conditions and major comparisons being made.

      We thank the reviewer for this recommendation and have added a graphical abstract figure to help the reader understand the major comparisons being made. 

      (2) Could the authors present body weight and food intake characteristics in Taar5 KO vs. WT animals?

      We have added body weight data as requested in Figure 1, Figure supplement 1. Although we have not stressed these mice with a high fat diet for these behavioral studies, under chow-fed conditions studied here we did not find any significant differences in body weight. Given no difference in body weight, we did not collect data on food consumption and have mentioned this as a limitation in the discussion.  

      (3) Several figures, especially Figures 3 and 4, and Supplemental Figures, would benefit from more structured organization and expanded legends. Grouping related data into thematic panels (e.g., satiety vs. appetite hormones, behavioral domains) may help improve readability.

      We appreciate the reviewer’s thoughtful comments and agree that reorganization would improve clarity. We have reorganized figures to improve clarity and have expanded the figure legends to provide more detail on experimental methods. 

      (4) Clarify and expand the description of hormonal and cytokine changes. For instance, the phrase "altered rhythmic levels" is vague - do the authors mean dampened, phase-shifted, enhanced, etc., relative to WT controls?

      Given a similar suggestion was made by Reviewer 1, we have provided more precise language focused on directionality and which specific endpoints we are referring to. For anything looking at circadian rhythms, the revised manuscript includes specific indications when we are discussing mesor, amplitude, and acrophase alterations. The terms regulation, impact, shape etc. are used only when we describe multiple complex variables changing at the same time over the time course of a 24-hour circadian period (some increased and some decreased).

      (5) Consider grouping hormones and cytokines functionally (e.g., satiety vs. appetite-stimulating, pro- vs. antiinflammatory) to better interpret how these changes relate to the KO phenotype.

      We thank the reviewer for this recommendation, and have re-organized figure panels to reflect this.

      (6) Please provide a more detailed description of the behavioral results, particularly those in Supplemental Figure 2.

      We have both expanded the methods description in the revised figure legends, but have also added a more detailed description of the behavioral results.

      (7) As with hormonal data, behavioral outcomes would be easier to follow if organized thematically (e.g., locomotor activity, anxiety-like behavior, circadian-related behavior), especially for readers less familiar with behavioral assays.

      We appreciate this reviewer’s comment and agree that we can better group our data to show how each test is associated with the type of behavior it assesses. As a result we have reorganized the behavioral data into broad categories such as olfactory-related, innate, cognitive, depressive/anxiety-like, or social behaviors. We have also new data in each of these behavioral categories to provide a more comprehensive understanding of behavioral alterations seen in Taar5<sup>-/-</sup> mice.

      (8) The following statement needs clarification: "Also, it is important to note that many behavioral phenotypes examined, including tests not shown, were unaltered in Taar5-/- mice (Figures S2G, S2H, and S2I)." Consider rephrasing to explicitly state the intended message: are the authors emphasizing a lack of behavioral phenotype, or highlighting specific unaltered aspects?

      We apologize for this confusing statement, and have changed the verbiage to improve readability. To expand the comprehensive nature of this study, we also now include the tests that were “not shown” in the original submission to provide a more comprehensive understanding of behavioral alterations seen in Taar5<sup>-/-</sup> mice. These new data are included as 6 different figure supplements to main Figure 2.

      (9) The transition from behavior to microbiome data feels abrupt. Can the authors better explain whether the behavioral changes are thought to result from gut microbial function, independent of TMA-Taar5 signaling?

      We apologize for the poor transitions in our writing style. We have spent time to explain the previous findings linking the TMA pathway to circadian reorganization of the gut microbiome (mostly coming from our original paper Schugar R, et al. 2022, eLife) and how this correlates with behavioral phenotypes. Although at this point it is difficult to know whether the microbiome changes are driving behavioral changes, or vice versa it could be central TAAR5 signaling is altering oscillations in gut microbiome, we present our findings here as a framework for follow up studies to more precisely get at these questions. It is important to note that our experiment using defined community gnotobiotic mice with or without the capacity to produce TMA (i.e. CutC-null community) shows that clearly microbial TMA production can impact host circadian rhythms in the olfactory bulb. Additional experiments beyond the scope of this work will be required to test which phenotypes originate from TMA-TAAR5 signaling versus more broad effects of the restructured gut microbiome.

      (10) For Figure 3A, please expand the microbiome results with more granularity:

      (a) Indicate in the Results section whether the sequencing method was 16S amplicon or metagenomic.

      Sequencing was done using 16S rRNA amplicon sequencing using methods published by our group (PMID: 36417437, PMID: 35448550).

      (b) State whether samples were from males, females, or a mix. 

      We have indicated that all mice from Figure 1 were male mice in the revised figure legend.

      (c) Clarify whether beta diversity is based on phylogenetic or non-phylogenetic metrics. Consider using both  types if not already done.

      Beta diversity was analyzed using the Bray-Curtis dissimilarity index as the metric. Details have been included in the methods section.

      (d) Make lines partially transparent in the Beta-diversity plot so that individual points are visible.

      We have now updated the Beta-diversity plot with individual points visualized.

      (e) Clarify what percentage of variation in the Beta-diversity plot is explained by CCA1, and whether this low percentage suggests minimal community-level differences.

      We have updated the Beta-diversity plot to include the R<sup>2</sup> and p-values associated with these data.

      (f) Confirm if the y-axis on the Beta-diversity plot should be labeled CCA2 rather than "CCAA 1".

      We appreciate this comments, given it identified a typographical error in the plot. The revised figure now include the proper label of CCA2 instead of CCAA 1.

      (11) For Figure 3B:

      (a) Provide a description of the taxonomy plot in the results.

      We have added a description of the taxonomy plot in the revised results section.

      (b) Add phylum-level labels and enlarge the legend to improve the readability of genus-level data.

      We agree this is a good suggestion so have enlarged the legend for the genus-level data and have also added phylum-level plots as well in the revised manuscript in Figure 3, figure supplement 1.

      (12) Rhythmicity of the microbiome is central to the manuscript. The current approach of comparing relative abundance at discrete time points is limiting.

      We thank the reviewer for this comment. We agree with this statement that discrete timepoint are not enough to describe circadian rhythmicity. In addition to comparing genotypes at discrete time points, we also used a rigorous cosinor analysis to plot the data over a 24-hour time period, and those differences are shown in the figure itself as well as Table 1. 

      (a) Please describe how rhythmicity was determined, e.g., what data or statistical method supports the statement: "Taar5-/- mice showed loss of the normal rhythmicity for Dubosiella and Odoribacter genera yet gained in amplitude of rhythmicity for Bacteroides genera (Figure 3 and S3)."

      We appreciate this reviewer comment. Rhythmicity was determined using a cosinor analysis by use of an R program. Cosinor analysis is a statistical method used to model and analyze rhythmic patterns in time-series data, typically assuming a sinusoidal (cosine) shape. It estimates key parameters like mesor (mean level), amplitude (height of oscillation), and acrophase (timing of the peak), making it especially useful in fields like chronobiology and circadian rhythm research. We have used this in previous research to describe circadian rhythms. We do plan to improve language considering directionality of these circadian changes. 

      (b) Supplemental Figure S3 needs reorganization to highlight key findings. It's not currently clear how taxa are arranged or what trends are being shown.

      The data in Figure S3 show the entire 24-hour time course of the cecal taxa that were significantly altered for at least one time point between Taar5<sup>+/+</sup> and Taar5<sup>-/-</sup> mice. Given we showed time pointspecific alterations in the Main Figure 3, we thought these more expansive plots would be important to show to depict how the circadian rhythms were altered.

      (c) Supplemental Table 1, which includes 16S features, should be referenced and discussed in the microbiome section.

      We have now referenced and discussed Supplemental Table 1 which includes all cosinor statistics for microbiome and other data presented in circadian time point studies.

      (13) Did the authors quantify the 16S rRNA gene via RT-PCR to determine if this was similar between KO and WT over the 24-hour period?

      We did not quantify 16S rRNA gene via RT-PCR, but do not think adding this will change our overall interpretations.

      (14) Reorganize Figure 4 to align with the order of results discussed-starting with TMA and TMAO, followed by related metabolites like choline, L-carnitine, and gamma-butyrobetaine.

      We thank the reviewer for this comment. We have chosen this organization because it is ordered from substrates (choline, L-carnitine, and betaine) to the microbe-associated products (TMA then TMAO). We will improve the writing associated with this figure to clearly explain this organization.

      (a) Although the changes in the latter metabolites are more modest, they may still have physiological relevance. Could the authors comment on their significance?

      We appreciate this reviewer comment and agree. We have expanded the results and discussion to address this.

      (15) The authors note similarities in circadian gene expression between Taar5 KO mice and Clostridium sporogenes WT vs. ΔcutC mice, but the gene patterns are not consistent.

      (a) Can the authors clarify what conclusions can reasonably be drawn from this comparison?

      We hesitate to make definitive conclusions in the manuscript on why the gene patterns are not consistent, because it would be speculation. However, one major factor likely driving differences is the status of the diversity of the gut microbiome in the different studies. For instance, in the studies using Taar5<sup>+/+</sup> and Taar5<sup>-/-</sup> mice there is a very diverse microbiome in these conventionally housed mice. In contrast, by design the experiment using Clostridium sporogenes WT vs. ΔcutC communities is a reductionist approach that allows us to genetically define TMA production. In these gnotobiotic mice, the simplified community has very limited diversity and this likely alters the host circadian rhythms in gene expression quite dramatically. Although it is impossible to directly compare the results between these experiments given the difference microbiome diversity, there are clearly alterations in host gene expression when we manipulate TMA production (i.e. ΔcutC community) or TMA sensing (i.e. Taar5<sup>-/-</sup>). 

      (16) Were circadian and metabolic genes (e.g., Arntl, Cry1, Per2, Pemt, Pdk4) also analyzed in brown adipose tissue of Taar5 KO mice, and how do these results compare to the Clostridium models?

      We thank the reviewer for this comment. Unfortunately, we did not collect brown adipose tissue in our original Taar5 study. We plan on doing this in future follow up studies studying cold-induced thermogenesis that are beyond the scope of this manuscript. However, we have decided to include data from our two timepoint Taar5 study which looks at ZT2 (9am) and ZT14 (9pm). There are clear differences in circadian genes between these timepoints. 

      (17) To allow a more direct comparison, please ensure the same cytokines (e.g., IL-1β, IL-2, TNF-α, IFN-γ, IL6, IL-33) are reported for both the Taar5 KO and microbial models.

      We thank the reviewer for this comment and now include data from the same cytokines for each study.

      (18) What was the defined microbial community used to colonize germ-free mice with C. sporogenes strains? Did this community exhibit oscillatory behavior?

      To define TMA levels using a genetically-tractable model of a defined microbial community, we leveraged access to the community originally described by our collaborator Dr. Federico Rey (University of Wisconsin – Madison) (PMID: 25784704). We chose this community because it provide some functional metabolic diversity and is well known to allow for sufficient versus deficient TMA production. We are thankful for the reviewer comments about oscillatory behavior of this defined community, and to be responsive have performed sequencing to detect the species over time. These data are now included in the revised manuscript and show that there are clear differences in the oscillatory behavior of the defined community members. These data provide additional support that bacterial TMA production not only alters host circadian rhythms, but also the rhythmic behavior of gut bacteria themselves which has never been described before.

      (19) Can the authors explain the rationale for measuring additional metabolites such as tryptophan, indole acetic acid, phenylacetic acid, and phenylacetylglycine? How are these linked to CutC gene function or Taar5 signaling?

      We appreciate that this could be confusing, but have included other gut microbial metabolites to be as comprehensive as possible. This is important to include because we have found in other gnotobiotic studies where we have genetically altered metabolite production, if we alter one gut microbe-derived metabolite there can be unexpected alterations in other distinct classes of microbe-derived metabolites (PMID: 37352836). This is likely due to the fact that complex microbe-microbe and microbehost interactions work together to define systemic levels of circulating metabolites, influencing both the production and turnover of distinct and unrelated metabolites.

      (20) The authors make several strong claims suggesting that loss of Taar5 or disruption of its ligand directly alters the circadian gene network. However, the current data are correlative. The authors should clarify that these findings demonstrate associations rather than direct causal effects, unless additional mechanistic evidence is provided. Approaches such as studies conducted in constant darkness, measurements of wheelrunning behavior, or analyses that control for potential confounding factors, e.g., inflammation or metabolic disruption, would help establish whether the observed changes in clock gene expression are primary or secondary effects. The authors are encouraged to either soften these causal claims or acknowledge this limitation explicitly in the discussion.

      We thank the reviewer for this comment. We agree and have softened our language about direct effects of TMA via TAAR5 because we agree the data presented here are correlative only. 

      Minor suggestions:

      (1) Avoid repetitive phrases such as "it is important to note..." for improved flow. Rephrasing these instances will enhance readability.

      We thank the reviewer for this suggestion and have deleted such repetitive phrases.  

      (2) For Figure 2, remove interpretations above he graphs and use simple, descriptive panel labels, similar to those in Supplemental Figure 2.

      We have removed these interpretations as suggested, but have retained descriptive panel labels to help the reader understand what type of data are being presented.

      Reviewer #3 (Recommendations for the authors):

      Minor:

      In Figure 1D, UCP1 does not appear to be significantly changed.

      We thank the reviewer for this comment and agree that UCP1 gene expression is not significantly altered . However, given the key role that UCP1 plays in white adipose tissue beiging, which is suppressed by the TMAO pathway, we think it is critical to show that this effect appears unaffected by perturbed TMA-TAAR5 signaling.

      It would be helpful, in the discussion, to summarize any consistent changes across Taar5 KO, CutC deletion, and FMO3 deletion.

      We have added this to the discussion, but as discussed above we hesitate to make strong interpretations about consistency between the models because the microbiome diversity is so different between the studies, and we did not measure all endpoints in both models.

      For the Cosinor analysis, it may be helpful to remove the p-values that are >0.05 from the figures.

      We have now removed any non-significant p-values that are associated with our figures. 

      For Figure 2, Supplement 1E, what are the two bars for each genotype?

      We appreciate the reviewer pointing this out and will further explain this test in the figure with labels and in the legend.

    1. Santé Mentale : Fausses Promesses et Solutions Collectives – Synthèse du Briefing

      Résumé Exécutif

      Ce document synthétise les analyses et propositions issues d'une table ronde sur la santé mentale, organisée par Psycom au ministère de la Santé.

      Le constat central est la nécessité urgente de dépasser une vision individualiste de la santé mentale, où le fardeau repose sur l'individu et la psychiatrie, pour adopter une approche collective et systémique.

      Les discussions ont mis en lumière plusieurs problématiques majeures : * l'expansion d'un marché du "bien-être" non réglementé, proposant des solutions pseudoscientifiques dangereuses qui engendrent une "perte de chance" pour les personnes en souffrance ; * la montée des dérives sectaires qui exploitent les vulnérabilités psychiques à des fins financières et d'emprise ; et * l'impact prépondérant sur la santé psychique (estimé à 50 %) des déterminants socio-économiques tels que * la précarité, * les discriminations ou * le logement

      Face à ces défis, les experts proposent des solutions multi-niveaux.

      Celles-ci incluent un renforcement de la régulation des pratiques non conventionnelles et des titres de "thérapeutes", le développement de l'esprit critique et de la métacognition au sein de la population, et une transformation profonde du soin psychiatrique vers des modèles plus humains, participatifs et moins coercitifs, à l'image de l'approche "Open Dialogue".

      Enfin, le rôle crucial des collectivités locales est souligné, celles-ci pouvant agir concrètement sur l'environnement social et urbain pour promouvoir le bien-être et recréer du lien, incarnant ainsi le passage d'une "société du soin" à une "société du prendre soin" attentive aux inégalités et aux vulnérabilités.

      --------------------------------------------------------------------------------

      I. Introduction : Contexte de la Table Ronde

      La présente analyse se fonde sur les échanges d'une table ronde filmée en septembre 2025 au ministère de la Santé, lors de la journée "Full Santé Mentale :

      de l'intime au collectif" organisée par Psycom, un organisme public de lutte contre la stigmatisation en santé mentale.

      Question centrale :

      Comment sortir d’une vision trop individualiste de la santé mentale pour aller vers une réflexion plus collective ?

      Comment passer d’une société du soin à une société du "prendre soin", attentive aux vulnérabilités et aux inégalités ?

      Participants :

      Nom

      Fonction

      Organisation

      Sophia Feuillère

      Responsable de l'innovation pédagogique

      Psychom

      Elisabeth Fetti

      Documentariste, créatrice du podcast sur la métacognition

      Méta de Choc

      Samir Calfa

      Conseiller santé

      Miviludes (Mission interministérielle de vigilance)

      Maeva Musso

      Psychiatre, présidente de l'association des jeunes psychiatres

      Hôpitaux Paris Est Val-de-Marne / AJPJA

      Marie-Christine Sanier Coavran

      Adjointe à la santé et à la lutte contre les exclusions, vice-présidente du réseau Ville Santé

      Ville de Lille

      II. Constats et Problématiques Actuelles

      A. Déconstruire les Idées Reçues sur la Santé Mentale

      Sophia Feuillère identifie trois idées reçues persistantes qui freinent une approche collective :

      1. La frontière rigide entre santé mentale et psychiatrie : Le public perçoit souvent la psychiatrie comme un état figé réservé aux "malades", et la santé mentale comme un état tout aussi figé pour les "bien-portants".

      Pour contrer cela, Psychom promeut une notion de mouvement et de rétablissement, notamment via son outil de la "boussole de la santé mentale".

      2. La seule responsabilité de l'individu : Une croyance répandue veut qu'il suffirait d'outiller les individus (cohérence cardiaque, compétences psychosociales) pour qu'ils prennent soin d'eux. Cette vision omet les déterminants extérieurs.

      L'approche systémique, illustrée par l'outil du "cosmos mental", est donc essentielle pour réintégrer le contexte collectif.

      3. L'exclusivité de l'expertise médicale : L'idée que seuls les soignants peuvent parler de santé mentale reste forte.

      Il est crucial de légitimer la posture du "prendre soin", que chaque citoyen peut adopter, distincte de celle du "soin", qui relève des professionnels qualifiés.

      B. L'Expansion du Marché du Bien-être et ses Dangers

      Elisabeth Fetti observe une explosion des offres de "bien-être" sur les médias sociaux, portées par des influenceurs souvent sans expertise.

      Narratif dominant : Le discours s'appuie sur l'expérience personnelle ("J'ai touché le fond et j'ai rebondi, donc faites comme moi"), mêlant développement personnel (sans fondement scientifique) et spiritualité.

      instrumentalisation de la science : Des termes comme "neurosciences" ou "physique quantique" sont utilisés pour conférer une fausse légitimité aux discours.

      Mécanismes de persuasion : L'"effet Barnum" est massivement utilisé.

      Il s'agit de formuler des généralités vagues dans lesquelles chacun peut se reconnaître ("Tu veux réussir mais parfois tu te sens empêché"), créant un sentiment de confiance et de compréhension.

      Risques avérés :

      Perte de chance : Le risque le plus grave est le retard de diagnostic et de prise en charge adéquate pour des pathologies réelles (dépression, endométriose, addictions).  

      Escalade de l'engagement : Les clients sont entraînés dans un cycle d'engagement financier et émotionnel croissant (séance gratuite, puis livre, puis stage, etc.), rendant difficile la remise en question et la réorientation.   

      Culpabilisation : En cas d'échec, la responsabilité est retournée contre l'individu :

      "Si ça ne marche pas, c'est que tu n'as pas assez travaillé sur toi".  

      Effets paradoxaux : Certaines pratiques, comme la "pensée positive", peuvent aggraver l'anxiété chez les personnes les plus vulnérables, comme le montrent des études scientifiques.

      C. Les Dérives Sectaires : Emprise Mentale et Perte de Chance

      Samir Calfa alerte sur l'émergence d'un "système de santé parallèle" où les dérives sectaires prolifèrent, notamment dans le champ de la santé mentale qui représente 40 % des signalements à la Miviludes.

      Mécanisme central : Il ne peut y avoir de dérive sectaire sans emprise mentale, une relation singulière entre le gourou et sa victime.

      Vide juridique : N'importe qui peut aujourd'hui inventer et proposer une méthode de prise en charge psychologique sans réglementation.

      Profil des victimes et motivations des gourous : Neuf victimes sur dix sont des femmes.

      Les gourous recherchent systématiquement trois choses : l'argent, les faveurs sexuelles et le travail dissimulé (les victimes devenant des "sergents recruteurs").

      Double impact psychologique : La vulnérabilité psychique est une porte d'entrée vers ces dérives, et la sortie de l'emprise laisse des séquelles psychologiques profondes et durables ("l'organisation sectaire ne sort jamais de votre tête").

      Une augmentation des suicides liés à ces phénomènes est constatée.

      D. L'Impact des Déterminants Sociaux et des Inégalités

      Maeva Musso insiste sur le poids des facteurs environnementaux et sociaux.

      Elle prend l'exemple des enfants placés, qui agit comme une "loupe" sur ces phénomènes :

      Statistiques alarmantes : Cette population présente 8 fois plus de handicaps, 5 fois plus de troubles psychiques graves, compose un quart de la population SDF à 25 ans et a une espérance de vie inférieure de 20 ans à la moyenne générale.

      Répartition des facteurs de troubles psychiques :

      50 % : Déterminants socio-économiques (précarité, logement, discriminations).  

      25 % : Résilience du système de santé.  

      25 % : Facteurs individuels (génétique, biologie), eux-mêmes influencés par l'environnement via l'épigénétique.

      Nécessité d'une approche interministérielle : Pour agir sur ces déterminants, une collaboration entre les ministères de la Santé, de l'Éducation, de la Justice, etc., est indispensable, via un délégué interministériel dédié.

      E. Le Rôle de l'Environnement Urbain et Social

      Marie-Christine Sanier Coavran démontre comment les politiques locales peuvent directement influencer la santé mentale de la population, en s'appuyant sur l'exemple de la ville de Lille.

      Urbanisme et logement : La conception des habitations (éviter les grandes tours, intégrer balcons et jardins) et des espaces publics (créer des îlots de verdure avec bancs et jeux) est pensée pour favoriser les interactions sociales et réduire le stress environnemental (bruit, pollution).

      Mobilité : Des mesures comme la limitation de vitesse à 30 km/h et le développement des pistes cyclables réduisent le bruit et la pollution tout en encourageant l'activité physique, bénéfique pour la santé mentale.

      Inclusion sociale : L'accompagnement vers l'emploi est complété par la valorisation d'autres formes d'engagement, comme le bénévolat, qui permettent aux individus de retrouver une place et une reconnaissance dans la société.

      III. Pistes de Réflexion et Solutions Collectives

      A. Renforcer la Vigilance, la Prévention et la Régulation

      Face à la prolifération des offres dangereuses, une réponse ferme de la puissance publique est nécessaire.

      Actions de la Miviludes (Samir Calfa) : La mission mène des actions de sensibilisation auprès des élus et des professionnels de santé, publie des guides, et travaille en partenariat avec les ordres professionnels. 19,6 % des signalements concernent des professionnels de santé déviants.

      Cadre légal (Samir Calfa) : La loi du 10 mai 2024 constitue une avancée majeure, punissant d'un an de prison et 30 000 € d'amende la promotion de pratiques non éprouvées ou l'incitation à l'abandon de soins.

      Appel à la réglementation (Samir Calfa) : Un encadrement strict des appellations comme "psychopraticien", "psy-conseil" ou "coach" est indispensable, tout comme un contrôle des structures d'accueil qui échappent actuellement à la supervision des Agences Régionales de Santé (ARS).

      B. Transformer le Soin Psychiatrique vers une Approche Humaine et Participative

      Maeva Musso plaide pour une réforme des pratiques psychiatriques, en s'inspirant de modèles innovants.

      L'approche "Open Dialogue" :

      Principes : Intervention systématique en binôme de professionnels, implication du réseau social du patient (famille, amis), transparence totale des discussions et décisions, et réactivité (prise en charge sous 24-48h).    ◦

      Résultats observés : Réduction du recours à la coercition (isolement, contention) et aux prescriptions médicamenteuses à long terme.

      Forte déstigmatisation au niveau communautaire, car une large part de la population finit par participer à ces réunions.

      Revendications de l'AJPJA :

      Faire des usagers des acteurs : Les intégrer à tous les niveaux (politique, formation des internes, recherche participative).  

      Abolir les pratiques coercitives : Mettre fin à l'isolement et à la contention.   

      Reconnaître la responsabilité collective : Le véritable tabou actuel est la responsabilité collective dans l'augmentation des troubles psychiques.

      C. Bâtir une Culture Commune du "Prendre Soin"

      Le développement d'une culture partagée de la santé mentale passe par l'éducation et l'outillage de la population.

      Pédagogie et intelligence collective (Sophia Feuillère) : Les solutions doivent être co-construites ("tous ensemble"), en écoutant les singularités et les "points de vue situés" de chacun.

      Les méthodes d'intelligence collective sont un levier puissant pour y parvenir.

      Métacognition et esprit critique (Elisabeth Fetti) : Il est crucial de développer la capacité à appliquer l'esprit critique à ses propres pensées.

      Cela passe par la connaissance des mécanismes cognitifs et par l'étude de parcours de vie où des personnes ont radicalement changé de croyances, afin de "rendre désirable le questionnement sur soi".

      D. Agir à l'Échelle Locale : La Ville comme Acteur Clé

      Marie-Christine Sanier Coavran souligne le potentiel immense des municipalités et des réseaux de villes.

      Rôle de catalyseur : Les villes ont la capacité d'écouter les besoins, de mobiliser tous les acteurs (associations, professionnels, habitants) et de coordonner l'action.

      Actions concrètes : Le réseau Ville Santé recense de nombreuses initiatives, comme la gratuité des transports (Dunkerque), le maintien au logement (Metz), ou l'accès à la culture et au sport comme outils de bien-être (Lille, Poitiers).

      Formation citoyenne : Les villes peuvent financer des formations comme les "Premiers Secours en Santé Mentale" ou la création d'"ambassadeurs santé" pour doter la population de réflexes de base.

      Rôle d'interpellation : Face à la pénurie de soignants (18 mois d'attente dans certains CMP), les élus locaux ont le devoir d'interpeller l'État pour obtenir plus de psychiatres et une meilleure reconnaissance des psychologues cliniciens.

      IV. Conclusion : Vers une Responsabilité Collective

      La table ronde conclut unanimement que la santé mentale est une question éminemment politique.

      Le véritable tabou n'est plus la souffrance psychique elle-même, mais le refus de reconnaître la responsabilité collective dans l'augmentation des troubles.

      La sortie de la crise passe par un engagement politique fort, une action interministérielle coordonnée et une implication de toutes les strates de la société.

      Le passage d'une logique de soin individuel à une culture partagée du "prendre soin" collectif est la condition sine qua non pour construire une société plus résiliente et attentive à la santé psychique de toutes et tous.

    1. Author response:

      Reviewer #1 (Public review):

      Summary:

      The authors examine the neural correlates of face recognition deficits in individuals with Developmental Prosopagnosia (DP; 'face blindness'). Contrary to theories that poor face recognition is driven by reduced spatial integration (via smaller receptive fields), here the authors find that the properties of receptive fields in face-selective brain regions are the same in typical individuals vs. those with DP. The main analysis technique is population Receptive Field (pRF) mapping, with a wide range of measures considered. The authors report that there are no differences in goodness-of-fit (R2), the properties of the pRFs (neither size, location, nor the gain and exponent of the Compressive Spatial Summation model), nor their coverage of the visual field. The relationship of these properties to the visual field (notably the increase in pRF size with eccentricity) is also similar between the groups. Eye movements do not differ between the groups.

      Strengths:

      Although this is a null result, the large number of null results gives confidence that there are unlikely to be differences between the two groups. Together, this makes a compelling case that DP is not driven by differences in the spatial selectivity of face-selective brain regions, an important finding that directly informs theories of face recognition. The paper is well written and enjoyable to read, the studies have clearly been carefully conducted with clear justification for design decisions, and the analyses are thorough.

      Weaknesses:

      One potential issue relates to the localisation of face-selective regions in the two groups. As in most studies of the neural basis of face recognition, localisers are used to find the face-selective Regions of Interest (ROIs) - OFA, mFus, and pFus, with comparison to the scene-selective PPA. To do so, faces are contrasted against other objects to find these regions (or scenes vs. others for the PPA). The one consistent difference that does emerge between groups in the paper is in the selectivity of these regions, which are less selective for faces in DP than in typical individuals (e.g., Figure 1B), as one might expect. 6/20 prosopagnosic individuals are also missing mFus, relative to only 2/20 typical individuals. This, to me, raises the question of whether the two groups are being compared fairly. If the localised regions were smaller and/or displaced in the DPs, this might select only a subset of the neural populations typically involved in face recognition. Perhaps the difference between groups lies outside this region. In other words, it could be that the differences in prosopagnosic face recognition lie in the neurons that are not able to be localised by this approach. The authors consider in the discussion whether their DPs may not have been 'true DPs', which is convincing (p. 12). The question here is whether the regions selected are truly the 'prosopagnosic brain areas' or whether there is a kind of survivor bias (i.e., the regions selected are normal, but perhaps the difference lies in the nature/extent of the regions. At present, the only consideration given to explain the differences in prosopagnosia is that there may be 'qualitative' differences between the two (which may be true), but I would give more thought to this.

      We acknowledge that face-selective ROIs in DPs, relative to controls, may be smaller, less selective, or altogether missing when traditional methods of localization with fixed thresholds are used (Furl et al, 2011). For this reason - to circumvent potential survivor bias and ensure ROI voxel counts across participants are equated - we used a method of ROI definition whereby each subject’s individual statistical map from the localizer was intersected with a generously-sized group mask for each ROI and the top 20% most category-selective voxels were retained for the pRF analysis (Norman-Haignere et al., 2013; Jiahui et al., 2018). This means that the raw number of voxels per ROI was equal across all participants with respect to the common group space, thereby ensuring a fair comparison even in cases where one group shows diminished category-selectivity. The details of the ROI definition are provided in the Methods at the end of the manuscript. To ensure readers understand our approach, we will also make more explicit mention of this in the main body of the manuscript. 

      With regard to the question of whether face-selective ROIs may be displaced in DPs compared to controls, previous work from the senior author’s lab (Jiahui et al., 2018) shows that, despite exhibiting weaker activations, the peak coordinates of significant clusters in DPs occupy very similar locations to those of controls. And, even if there were indeed slight displacements of face-selective ROIs for some subjects, the group-defined masks used in the present analysis were large enough to capture the majority of the top voxels. In the supplemental materials section, we will include a diagram of the group masks used in our study.

      The reviewer here also points out that more DPs than controls were missing the mFUS region (6/20 DPs vs 2/20 controls; Figure 1C). However, ‘missing’ in this context was not based on face-selectivity but rather a lack of retinotopic tuning. PRFs were fit to all voxels within each ROI - with all subjects starting out with equal voxel counts - and thereafter, voxels for which the variance explained by the pRF model was below 20% were excluded from subsequent analysis. We decided that any ROI with fewer than 10 voxels remaining after thresholding on the pRF fit should be deemed ‘missing’ since we considered the amount of data insufficient to reliably characterize the region’s retinotopic profile. While it may be somewhat interesting that four more DPs than controls were ‘missing’ left mFUS, using this particular set of decision criteria, it is important to keep in mind that left mFUS was just one of six face-selective regions under study. The other five regions, many of which evinced strong fits by the pRF model, were represented comparably in DPs and controls and showed high similarity in the pRF parameters. Furthermore, across most participants, mFUS exhibited a low proportion of retinotopically modulated voxels (defined as voxels with pRF R squared greater than 20%, see Figure 1D). A follow-up analysis showed that the count of voxels surviving pRF R squared thresholding in left mFUS was not significantly correlated with mean pRF size (r(30)=0.23, t=1.28,  p=0.21) indicating that the greater exclusion of DPs in this region is unlikely to have biased the group’s average pRF size.

      The discussion considers the differences between the current study and an unpublished preprint (Witthoft et al, 2016), where DPs were found to have smaller pRFs than typical individuals. The discussion presents the argument that the current results are likely more robust, given the use of images within the pRF mapping stimuli here (faces, objects, etc) as opposed to checkerboards in the prior work, and the use of the CSS model here as opposed to a linear Gaussian model previously. This is convincing, but fails to address why there is a lack of difference in the control vs. DP group here. If anything, I would have imagined that the use of faces in mapping stimuli would have promoted differences between the groups (given the apparent difference in selectivity in DPs vs. controls seen here), which adds to the reliability of the present result. Greater consideration of why this should have led to a lack of difference would be ideal. The latter point about pRF models (Gaussian vs. CSS) does seem pertinent, for instance - could the 'qualitative' difference lead to changes in the shape of these pRFs in prosopagnosia that are better characterised by the CSS model, perhaps? Perhaps more straightforwardly, and related to the above, could differences in the localisation of face-selective regions have driven the difference in prior work compared to here?

      We agree that the use of high-level mapping stimuli (including faces) adds to the reliability of the present results for DPs and could have further emphasized differences between the groups if true differences did, in fact, exist. We speculate on the extent to which the type of mapping stimuli and various other methodological factors (e.g. stimulus size, aperture design, pRF model) could have explained the divergent findings in our study versus that of Witthoft et al. (2016) in the section of the Discussion titled, “What factors may have contributed to the different results for the present study and Witthoft et al. (2016)”. In brief, our use of more colorful, naturalistic stimuli targeting higher-level visual areas elicited better model fits than the black and white checkerboard pattern used by Witthoft et al. (2016). The CSS model we used is better suited for higher-level regions and makes fewer assumptions than the linear pRF model. The field of view of our stimulus was smaller but still relevant for real-world perception of faces. Finally, our aperture design and longer run length likely also improved reliability. Overall, these methodological improvements, along with our larger sample size, provide stronger evidence for our findings. These are our best attempts to make sense of the divergent findings, but it is not possible to come to a definitive explanation. Examples abound of exaggerated or spurious effects from small-scale studies that ultimately fail to replicate in the related field of dyslexia research (Jednorog et al., 2015; Ramus et al., 2018) and neuroimaging research more generally (Turner et al., 2018; Poldrack et al., 2017). Sometimes there are clear explanations for a lack of replicability (e.g. software bugs, overly flexible preprocessing methods, etc.), but many times the real reason cannot be determined.

      Regarding the type of pRF model deployed, our use of a non-linear exponent (versus a linear model as in the Witthoft et al. (2016) preprint) is unlikely to explain the similarity we observed between the groups in terms of pRF size. Specifically, the groups did not show substantial differences in the exponent by ROI, as seen in Figure 1E, so the use of a linear model should, in theory, produce similar outcomes for the two groups. We will mention this point in the main text.

      Finally, the lack of variations in the spatial properties of these brain regions is interesting in light of the theories that spatial integration is a key aspect of effective face recognition. In this context, it is interesting to note the marked drop in R2 values in face-selective regions like mFus relative to earlier cortex. The authors note in some sense that this is related to the larger receptive field size, but is there a broader point here that perhaps the receptive field model (even with Compressive Spatial Summation) is simply a poor fit for the function of these areas? Could it be that these areas are simply not spatial at all? A broader link between the null results presented here and their implications for theories of face recognition would be ideal.

      The weaker pRF fits found in mFUS, to us, raise the question of whether there is a more effective pRF stimulus for these more anterior regions. For example, it might be possible to obtain higher and more reliable responses there using single isolated faces (Cf. Kay, Weiner, Grill-Spector, 2015). More broadly, though, we agree that it is important to acknowledge that the receptive field model might ultimately be a coarse and incomplete characterization of neural function in these areas. As the other reviewer suggests, one possibility is that other brain processes (e.g. functional or structural connectivity between ROIs) may give rise to holistic face processing in ways that are not captured by pRF properties.

      Reviewer #2 (Public review):

      Summary:

      This is a well-conducted and clearly written manuscript addressing the link between population receptive fields (pRFs) and visual behavior. The authors test whether developmental prosopagnosia (DP) involves atypical pRFs in face-selective regions, a hypothesis suggested by prior work with a small DP sample. Using a larger cohort of DPs and controls, robust pRF mapping with appropriate stimuli and CSS modeling, and careful in-scanner eye tracking, the authors report no group differences in pRF properties across the visual processing hierarchy. These results suggest that reduced spatial integration is unlikely to account for holistic face processing deficits in DP.

      Strengths:

      The dataset quality, sample size, and methodological rigor are notable strengths.

      Weaknesses:

      The primary concern is the interpretation of the results.

      (1) Relationship between pRFs and spatial integration

      While atypical pRF properties could contribute to deficits in spatial integration, impairments in holistic processing in DPs are not necessarily caused by pRF abnormalities. The discussion could be strengthened by considering alternative explanations for reduced spatial integration, such as altered structural or functional connectivity in the face network, which has been reported to underlie DP's difficulties in integrating facial features.

      We agree the Discussion section could benefit from mentioning that alterations to other neural mechanisms, besides pRF organization, could produce deficits in holistic processing. This could take the form of altered functional connectivity (Rosenthal et al., 2017; Lohse et al., 2016; Avidan et al., 2014) or altered structural connectivity (Gomez et al., 2015; Song et al., 2015)

      (2) Beyond the null hypothesis testing framework

      The title claims "normal spatial integration," yet this conclusion is based on a failure to reject the null hypothesis, which does not justify accepting the alternative hypothesis. To substantiate a claim of "normal," the authors would need to provide analyses quantifying evidence for the absence of effects, e.g., using a Bayesian framework.

      We acknowledge that, using frequentist statistical methods, failing to reject the null hypothesis is not sufficient to claim equivalence. For the revision, we will look into additional analyses that could quantify evidence for the null hypothesis. And we will adjust the wording of the title in this regard.

      (3) Face-specific or broader visual processing

      Prior work from the senior author's lab (Jiahui et al., 2018) reported pronounced reductions in scene selectivity and marginal reductions in body selectivity in DPs, suggesting that visual processing deficits in DPs may extend beyond faces. While the manuscript includes PPA as a high-level control region for scene perception, scene selectivity was not directly reported. The authors could also consider individual differences and potential data-quality confounds (tSNR difference between and within groups, several obvious outliers in the figures, etc). For instance, examining whether reduced tSNR in DPs contributed to lower face selectivity in the DP group in this dataset.

      Thank you for this suggestion - we will compare tSNR between the groups as a measure of data quality and we will include these comparisons. A preliminary look indicates that both groups possessed similar distributions of tSNR across many of the face-selective regions investigated here.

      (4) Linking pRF properties to behavior

      The manuscript aims to examine the relationship between pRF properties and behavior, but currently reports only one aspect of pRF (size) in relation to a single behavioral measure (CFMT), without full statistical reporting:

      "We found no significant association between participants' CFMT scores and mean pRF size in OFA, pFUS, or mFUS."

      For comprehensive reporting, the authors could examine additional pRF properties (e.g., center, eccentricity, scaling between eccentricity and pRF size, shape of visual field coverage, etc), additional ROIs (early, intermediate, and category-selective areas), and relate them to multiple behavioral measures (e.g., HEVA, PI20, FFT). This would provide a full picture of how pRF characteristics relate to behavioral performance in DP.

      We will report the full statistical values (r, p) for the (albeit non-significant) relationship between CFMT score and pRF size - thank you for bringing that to our attention. Additionally, we will add other analyses assessing the relationship between a wider array of pRF measures and the other behavioral tests administered to provide a more comprehensive picture of the relation between pRFs and behavior.

      References:

      Avidan, G., Tanzer, M., Hadj-Bouziane, F., Liu, N., Ungerleider, L. G., & Behrmann, M. (2014). Selective Dissociation Between Core and Extended Regions of the Face Processing Network in Congenital Prosopagnosia. Cerebral Cortex, 24(6), 1565–1578. https://doi.org/10.1093/cercor/bht007

      Furl, N., Garrido, L., Dolan, R. J., Driver, J., & Duchaine, B. (2011). Fusiform gyrus face selectivity relates to individual differences in facial recognition ability. Journal of Cognitive Neuroscience, 23(7), 1723–1740. https://doi.org/10.1162/jocn.2010.21545

      Gomez, J., Pestilli, F., Witthoft, N., Golarai, G., Liberman, A., Poltoratski, S., Yoon, J., & Grill-Spector, K. (2015). Functionally Defined White Matter Reveals Segregated Pathways in Human Ventral Temporal Cortex Associated with Category-Specific Processing. Neuron, 85(1), 216–227. https://doi.org/10.1016/j.neuron.2014.12.027

      Jednoróg, K., Marchewka, A., Altarelli, I., Monzalvo Lopez, A. K., van Ermingen-Marbach, M., Grande, M., Grabowska, A., Heim, S., & Ramus, F. (2015). How reliable are gray matter disruptions in specific reading disability across multiple countries and languages? Insights from a large-scale voxel-based morphometry study. Human Brain Mapping, 36(5), 1741–1754. https://doi.org/10.1002/hbm.22734

      Jiahui, G., Yang, H., & Duchaine, B. (2018). Developmental prosopagnosics have widespread selectivity reductions across category-selective visual cortex. Proceedings of the National Academy of Sciences of the United States of America, 115(28), E6418–E6427. https://doi.org/10.1073/pnas.1802246115

      Kay, K. N., Weiner, K. S., Kay, K. N., & Weiner, K. S. (2015). Attention Reduces Spatial Uncertainty in Human Ventral Temporal Cortex Attention Reduces Spatial Uncertainty in Human Ventral Temporal Cortex. Current Biology, 25(5), 595–600. https://doi.org/10.1016/j.cub.2014.12.050

      Lohse, M., Garrido, L., Driver, J., Dolan, R. J., Duchaine, B. C., & Furl, N. (2016). Effective connectivity from early visual cortex to posterior occipitotemporal face areas supports face selectivity and predicts developmental prosopagnosia. Journal of Neuroscience, 36(13), 3821–3828. https://doi.org/10.1523/JNEUROSCI.3621-15.2016

      Norman-Haignere, S., Kanwisher, N., & McDermott, J. H. (2013). Cortical pitch regions in humans respond primarily to resolved harmonics and are located in specific tonotopic regions of anterior auditory cortex. Journal of Neuroscience, 33(50), 19451–19469. https://doi.org/10.1523/JNEUROSCI.2880-13.2013

      Poldrack, R. A., Baker, C. I., Durnez, J., Gorgolewski, K. J., Matthews, P. M., Munafò, M. R., Nichols, T. E., Poline, J. B., Vul, E., & Yarkoni, T. (2017). Scanning the horizon: Towards transparent and reproducible neuroimaging research. Nature Reviews Neuroscience, 18(2), 115–126. https://doi.org/10.1038/nrn.2016.167

      Ramus, F., Altarelli, I., Jednoróg, K., Zhao, J., & Scotto di Covella, L. (2018). Neuroanatomy of developmental dyslexia: Pitfalls and promise. Neuroscience and Biobehavioral Reviews, 84(July 2017), 434–452. https://doi.org/10.1016/j.neubiorev.2017.08.001

      Rosenthal, G., Tanzer, M., Simony, E., Hasson, U., Behrmann, M., & Avidan, G. (2017). Altered topology of neural circuits in congenital prosopagnosia. ELife, 6, 1–20. https://doi.org/10.7554/eLife.25069

      Song, S., Garrido, L., Nagy, Z., Mohammadi, S., Steel, A., Driver, J., Dolan, R. J., Duchaine, B., & Furl, N. (2015). Local but not long-range microstructural differences of the ventral temporal cortex in developmental prosopagnosia. Neuropsychologia, 78, 195–206. https://doi.org/10.1016/j.neuropsychologia.2015.10.010

      Turner, B. O., Paul, E. J., Miller, M. B., & Barbey, A. K. (2018). Small sample sizes reduce the replicability of task-based fMRI studies. Communications Biology, 1(1). https://doi.org/10.1038/s42003-018-0073-z

      Witthoft, N., Poltoratski, S., Nguyen, M., Golarai, G., Liberman, A., LaRocque, K., Smith, M., & Grill-Spector, K. (2016). Reduced spatial integration in the ventral visual cortex underlies face recognition deficits in developmental prosopagnosia. BioRxiv, 1–26.

    1. Author response:

      The following is the authors’ response to the original reviews.

      Reviewer #1 (Public review):

      Summary:

      Recruitment of neutrophils to the lungs is known to drive susceptibility to infection with M. tuberculosis. In this study, the authors present data in support of the hypothesis that neutrophil production of the cytokine IL-17 underlies the detrimental effect of neutrophils on disease. They claim that neutrophils harbor a large fraction of Mtb during infection, and are a major source of IL-17. To explore the effects of blocking IL-17 signaling during primary infection, they use IL-17 blocking antibodies, SR221 (an inverse agonist of Th17 differentiation), and celecoxib, which they claim blocks Th17 differentiation, and observe modest improvements in bacterial burdens in both WT and IFN-γ deficient mice using the combination of IL-17 blockade with celecoxib during primary infection. Celecoxib enhances control of infection after BCG vaccination.

      Thank you for the summary.

      Strengths:

      The most novel finding in the paper is that treatment with celecoxib significantly enhances control of infection in BCG-vaccinated mice that have been challenged with Mtb. It was already known that NSAID treatments can improve primary infection with Mtb.

      Thank you.

      Weaknesses:

      The major claim of the manuscript - that neutrophils produce IL-17 that is detrimental to the host - is not strongly supported by the data. Data demonstrating neutrophil production of IL17 lacks rigor. 

      Our response: Neutrophil production of IL-17 is supported by two independent methods/ techniques in the current version: 

      (1) Through Flow cytometry- a large fraction of Ly6G<sup>+</sup>CD11b<sup>+</sup> cells from the lungs of Mtb-infected mice were also positive for IL-17 (Fig. 3C).

      (2) IFA co-staining of Ly6G <SUP>+</SUP> cells with IL-17 in the lung sections from Mtb-infected mice (Fig. 3 E_G and Fig. 4H, Fig. 5I). For most of these IFA data, we provide quantified plots to show IL17<SUP>+</SUP>Ly6G<SUP>+</SUP> cells.

      (3) Most importantly, conditions that inhibited IL-17 levels and controlled infection also showed a decline in IL-17 staining in Ly6G<SUP>+</SUP> cells.

      Our efforts on IL-17 ELISPOT assay were not very successful and it needs further standardization. 

      Several independent publications support the production of IL-17 by neutrophils (Li et al. 2010; Katayama et al. 2013; Lin et al. 2011). For example, neutrophils have been identified as a source of IL-17 in human psoriatic lesions (Lin et al. 2011), in neuroinflammation induced by traumatic brain injury (Xu et al. 2023) and in several mouse models of infectious and autoimmune inflammation (Ferretti et al. 2003; Hoshino et al. 2008) (Li et al. 2010).

      The experiments examining the effects of inhibitors of IL-17 on the outcome of infection are very difficult to interpret. First, treatment with IL-17 inhibitors alone has no impact on bacterial burdens in the lung, either in WT or IFN-γ KO mice. This suggests that IL-17 does not play a detrimental role during infection. Modest effects are observed using the combination of IL-17 blocking drugs and celecoxib, however, the interpretation of these results mechanistically is complicated. Celecoxib is not a specific inhibitor of Th17. Indeed, it affects levels of PGE2, which is known to have numerous impacts on Mtb infection separate from any effect on IL-17 production, as well as other eicosanoids. 

      The reviewer correctly says that Celecoxib is not a specific inhibitor of Th17. However, COX2 inhibition does have an effect on IL-17 levels, and numerous reports support this observation (Paulissen et al. 2013; Napolitani et al. 2009; Lemos et al. 2009).

      (1) The detrimental role of IL-17 is obvious in the IFNγ KO experiment, where IL-17 neutralization led to a significant improvement in the lung pathology.

      (2) In the highly susceptible IFNγ KO mice, IL-17 neutralization alone extended the survival of mice by ~10 days.

      (3) IL-17 production independent of IL-23 is known to require PGE2 (Paulissen et al. 2013; Polese et al. 2021). In either WT or IFNγ KO mice, in contrast to IL-17 levels, we observed a decline in IL-23 levels. The PGE2 dependence of IL-17 production is obvious in the WT mice, where celecoxib abrogated IL-17 production.

      (4) While deciding the impact of celecoxib or IL17 inhibition, looking at the cumulative readout of lung CFU, spleen CFU, Ly6G<sup>+</sup> cell recruitment, Ly6G<sup>+</sup> cell-resident Mtb pool and overall pathology, the effects are quite significant.

      (5) Finally, in the revised manuscript, we provide additional results on the effect of SR2211 in BCG-vaccinated animals. It shows the direct impact of IL-17 inhibition on the BCG vaccine efficacy in WT mice.

      Finally, the human data simply demonstrates that neutrophils and IL-17 both are higher in patients who experience relapse after treatment for TB, which is expected and does not support their specific hypothesis. 

      We disagree with the above statement. It also contradicts reviewers’ own assessments in one of the comments below, where a protective role of IL-17 is referred to. The literature lacks consensus in terms of a protective or pathological role of IL-17 in TB. Therefore, it was not expected to see higher IL-17 in patients who experienced relapse, death, or failed treatment outcomes. We do not have evidence from human subjects whether neutrophil-derived IL-17 has a similar pathological role as observed in mice. However, higher IL-17 in failed outcome cases confirm the central theme that IL-17 is pathological in both human and mouse models.

      The use of genetic ablation of IL-17 production specifically in neutrophils and/or IL-17R in mice would greatly enhance the rigor of this study. 

      The reviewer’s point is well-taken. Having a genetic ablation of IL-17 production, specifically in the neutrophils, would be excellent. At present, however, we lack this resource. For the revised manuscript, we include the data with SR2211, a direct inhibitor of RORgt and, therefore, IL-17, in BCG-vaccinated mice.

      The authors do not address the fact that numerous studies have shown that IL-17 has a protective effect in the mouse model of TB in the context of vaccination. 

      Yes, there are a few articles that talk about the protective effect of IL-17 in the mouse model of TB in the context of vaccination (Khader et al. 2007; Desel et al. 2011; Choi et al. 2020). This part was discussed in the original manuscript (in the Introduction section). For the revised manuscript, we also provide results from the experiment where we blocked IL-17 production by inhibiting RORgt using SR2211 in BCG-vaccinated mice. The results clearly show IL-17 as a negative regulator of BCG-mediated protective immunity. We believe some of the reasons for the observed differences could be 1) in our study, we analysed IL-17 levels in the lung homogenates at late phases of infection, and 2) most published studies rely on ex vivo stimulation of immune cells to measure cytokine production, whereas we actually measured the cytokine levels in the lung homogenates. We will elaborate on these points in the revised version.

      Finally, whether and how many times each animal experiment was repeated is unclear.

      We provide the details of the number of experiments in the revised version. Briefly, the BCG vaccination experiment (Figure 1) and BCG vaccination with Celecoxib treatment experiment (Figure 6) were performed twice and thrice, respectively. The IL-17 neutralization experiment (Figure 4) and the SR2211 treatment experiment (Figure 5) were done once. We will add another SR2211 experiment data in the revised version. 

      Reviewer #2 (Public review):

      Summary:

      In this study, Sharma et al. demonstrated that Ly6G+ granulocytes (Gra cells) serve as the primary reservoirs for intracellular Mtb in infected wild-type mice and that excessive infiltration of these cells is associated with severe bacteremia in genetically susceptible IFNγ/- mice. Notably, neutralizing IL-17 or inhibiting COX2 reversed the excessive infiltration of Ly6G+Gra cells, mitigated the associated pathology, and improved survival in these susceptible mice. Additionally, Ly6G+Gra cells were identified as a major source of IL-17 in both wild-type and IFNγ-/- mice. Inhibition of RORγt or COX2 further reduced the intracellular bacterial burden in Ly6G+Gra cells and improved lung pathology.

      Of particular interest, COX2 inhibition in wild-type mice also enhanced the efficacy of the BCG vaccine by targeting the Ly6G+Gra-resident Mtb population.

      Thank you for the summary.

      Strengths:

      The experimental results showing improved BCG-mediated protective immunity through targeting IL-17-producing Ly6G+ cells and COX2 are compelling and will likely generate significant interest in the field. Overall, this study presents important findings, suggesting that the IL-17-COX2 axis could be a critical target for designing innovative vaccination strategies for TB.

      Thank you for highlighting the overall strengths of the study. 

      Weaknesses:

      However, I have the following concerns regarding some of the conclusions drawn from the experiments, which require additional experimental evidence to support and strengthen the overall study.

      Major Concerns:

      (1) Ly6G+ Granulocytes as a Source of IL-17: The authors assert that Ly6G+ granulocytes are the major source of IL17 in wild-type and IFN-γ KO mice based on colocalization studies of Ly6G and IL-17. In Figure 3D, they report approximately 500 Ly6G+ cells expressing IL-17 in the Mtb-infected WT lung. Are these low numbers sufficient to drive inflammatory pathology? Additionally, have the authors evaluated these numbers in IFN-γ KO mice? 

      Thank you for pointing out the numbers in Fig. 3D It was our oversight to label the axis as No. of.  For the observation that Ly6G<sup>+</sup> Gra are the major source of IL-17 in TB, we have used two separate strategies- a) IFA and b) FACS IL17<SUP>+</SUP> Ly6G<SUP>+</SUP> Gra/lung. For this data, only a part of the lung was used. For the revised manuscript, we provide the number of these cells at the whole lung level from Mtb-infected WT mice. Unfortunately, we did not evaluate these numbers in IFN-γ KO mice through FACS.. 

      Our efforts to perform the IL-17 ELISpot assay on the sorted Ly6G<SUP>+</SUP>Gra from the lungs of Mtbinfected WT mice were unsuccessful. However, we provide a quantified representation of IFA of the tissue sections to stress upon the role of Ly6G<SUP>+</SUP> cells in IL-17 production in TB pathogenesis. 

      (2) Role of IL-17-Producing Ly6G Granulocytes in Pathology: The authors suggest that IL-17producing Ly6G granulocytes drive pathology in WT and IFN-γ KO mice. However, the data presented only demonstrate an association between IL-17<SUP>+</SUP> Ly6G cells and disease pathology. To strengthen their conclusion, the authors should deplete neutrophils in these mice to show that IL-17 expression, and consequently the pathology, is reduced.

      Thank you for this suggestion. Neutrophil depletion studies in TB remain inconclusive. In some studies, neutrophil depletion helps the pathogen (Rankin et al. 2022; Pedrosa et al. 2000; Appelberg et al. 1995), and in others, it helps the host (Lovewell et al. 2021; Mishra et al. 2017). One reason for this variability is the stage of infection when neutrophil depletion was done. However, another crucial factor is the heterogeneity in the neutrophil population. There are reports that suggest neutrophil subtypes with protective versus pathological trajectories (Nwongbouwoh Muefong et al. 2022; Lyadova 2017; Hellebrekers, Vrisekoop, and Koenderman 2018; Leliefeld et al. 2018). Depleting the entire population using anti-Ly6G could impact this heterogeneity and may impact the inferences drawn. 

      A better approach would be to characterise this heterogeneous population, efforts towards which could be part of a separate study. Another direct approach could be Ly6G<SUP>+</SUP>-specific deletion of IL-17 function as part of a separate study.

      For the revised manuscript, we provide results from the SR2211 experiment in BCG-vaccinated mice and other results to show the role of IL-17-producing Ly6G<SUP>+</SUP> Gra in TB pathology.   

      (3) IL-17 Secretion by Mtb-Infected Neutrophils: Do Mtb-infected neutrophils secrete IL-17 into the supernatants? This would serve as confirmation of neutrophil-derived IL-17. Additionally, are Ly6G<SUP>+</SUP> cells producing IL-17 and serving as pathogenic agents exclusively in vivo? The authors should provide comments on this.

      Secretion of IL-17 by Mtb-infected neutrophils in vitro has been reported earlier (Hu et al. 2017). Our efforts to do a neutrophil IL-17 ELISPOT assay were not successful, and we are still standardising it. Whether there are a few neutrophil roles exclusively seen under in vivo conditions is an interesting proposition.

      (4) Characterization of IL-17-Producing Ly6G+ Granulocytes: Are the IL-17-producing Ly6G+ granulocytes a mixed population of neutrophils and eosinophils, or are they exclusively neutrophils? Sorting these cells followed by Giemsa or eosin staining could clarify this.

      This is a very important point. While usually eosinophils do not express Ly6G markers in laboratory mice, under specific contexts, including infections, eosinophils can express Ly6G. Since we have not characterized these potential Ly6G<SUP>+</SUP> sub-populations, that is one of the reasons we refer to the cell types as Ly6G<SUP>+</SUP> granulocytes, which do not exclude Ly6G<SUP>+</SUP> eosinophils. A detailed characterization of these subsets could be taken up as a separate study.

      Reviewer #3 (Public review):

      Summary:

      The authors examine how distinct cellular environments differentially control Mtb following BCG vaccination. The key findings are that IL17-producing PMNs harbor a significant Mtb load in both wild-type and IFNg<sup>-/-</sup> mice. Targeting IL17 and Cox2 improved disease and enhanced BCG efficacy over 12 weeks and neutrophils/IL17 are associated with treatment failure in humans. The authors suggest that targeting these pathways, especially in MSMD patients may improve disease outcomes.

      Thank you.

      Strengths:

      The experimental approach is generally sound and consists of low-dose aerosol infections with distinct readouts including cell sorting followed by CFU, histopathology, and RNA sequencing analysis. By combining genetic approaches and chemical/antibody treatments, the authors can probe these pathways effectively.

      Understanding how distinct inflammatory pathways contribute to control or worsen Mtb disease is important and thus, the results will be of great interest to the Mtb field

      Thank you.

      Weaknesses:

      A major limitation of the current study is overlooking the role of non-hematopoietic cells in the IFNg/IL17/neutrophil response. Chimera studies from Ernst and colleagues (Desvignes and Ernst 2009) previously described this IDO-dependent pathway following the loss of IFNg through an increased IL17 response. This study is not cited nor discussed even though it may alter the interpretation of several experiments.

      Thank you for pointing out this earlier study, which we concede, we missed discussing. We disagree on the point that results from that study may alter the interpretation of several experiments in our study. On the contrary, the main observation that loss of IFNγ causes severe IL-17 levels is aligned in both studies.

      IDO1 is known to alter T-helper cell differentiation towards Tregs and away from Th17 (Baban et al. 2009). It is absolutely feasible for the non-hematopoietic cells to regulate these events. However, that does not rule out the neutrophil production of IL-17 and the downstream pathological effect shown in this study. We have discussed and cited this study in the revised manuscript.

      Several of the key findings in mice have previously been shown (albeit with less sophisticated experimentation) and human disease and neutrophils are well described - thus the real new finding is how intracellular Mtb in neutrophils are more refractory to BCG-mediated control. However, given there are already high levels of Mtb in PMNs compared to other cell types, and there is a decrease in intracellular Mtb in PMNs following BCG immunization the strength of this finding is a bit limited.

      The reviewer’s interpretation of the BCG-refractory Mtb population in the neutrophil is interesting. The reviewer is right that neutrophils had a higher intracellular Mtb burden, which decreased in the BCG-vaccinated animals. Thus, on that account, the reviewer rightly mentions that BCG is able to control Mtb even in neutrophils. However, BCG almost clears intracellular burden from other cell types analysed, and therefore, the remnant pool of intracellular Mtb in the lungs of BCG-vaccinated animals could be mostly those present in the neutrophils. This is a substantial novel development in the field and attracts focus towards innate immune cells for vaccine efficacy. 

      References:

      Appelberg, R., A. G. Castro, S. Gomes, J. Pedrosa, and M. T. Silva. 1995. 'SuscepBbility of beige mice to Mycobacterium avium: role of neutrophils', Infect Immun, 63: 3381-7.

      Baban, B., P. R. Chandler, M. D. Sharma, J. Pihkala, P. A. Koni, D. H. Munn, and A. L. Mellor. 2009. 'IDO acBvates regulatory T cells and blocks their conversion into Th17-like T cells', J Immunol, 183: 2475-83.

      Choi, H. G., K. W. Kwon, S. Choi, Y. W. Back, H. S. Park, S. M. Kang, E. Choi, S. J. Shin, and H. J. Kim. 2020. 'AnBgen-Specific IFN-gamma/IL-17-Co-Producing CD4(+) T-Cells Are the Determinants for ProtecBve Efficacy of Tuberculosis Subunit Vaccine', Vaccines (Basel), 8.

      Cruz, A., A. G. Fraga, J. J. Fountain, J. Rangel-Moreno, E. Torrado, M. Saraiva, D. R. Pereira, T. D. Randall, J. Pedrosa, A. M. Cooper, and A. G. Castro. 2010. 'Pathological role of interleukin 17 in mice subjected to repeated BCG vaccinaBon afer infecBon with Mycobacterium tuberculosis', J Exp Med, 207: 1609-16.

      Desel, C., A. Dorhoi, S. Bandermann, L. Grode, B. Eisele, and S. H. Kaufmann. 2011. 'Recombinant BCG DeltaureC hly+ induces superior protecBon over parental BCG by sBmulaBng a balanced combinaBon of type 1 and type 17 cytokine responses', J Infect Dis, 204: 1573-84.

      Desvignes, L., and J. D. Ernst. 2009. 'Interferon-gamma-responsive nonhematopoieBc cells regulate the immune response to Mycobacterium tuberculosis', Immunity, 31: 974-85.

      Ferreg, S., O. Bonneau, G. R. Dubois, C. E. Jones, and A. Trifilieff. 2003. 'IL-17, produced by lymphocytes and neutrophils, is necessary for lipopolysaccharide-induced airway neutrophilia: IL-15 as a possible trigger', J Immunol, 170: 2106-12.

      Hellebrekers, P., N. Vrisekoop, and L. Koenderman. 2018. 'Neutrophil phenotypes in health and disease', Eur J Clin Invest, 48 Suppl 2: e12943.

      Hoshino, A., T. Nagao, N. Nagi-Miura, N. Ohno, M. Yasuhara, K. Yamamoto, T. Nakayama, and K. Suzuki. 2008. 'MPO-ANCA induces IL-17 producBon by acBvated neutrophils in vitro via classical complement pathway-dependent manner', J Autoimmun, 31: 79-89.

      Hu, S., W. He, X. Du, J. Yang, Q. Wen, X. P. Zhong, and L. Ma. 2017. 'IL-17 ProducBon of Neutrophils Enhances AnBbacteria Ability but Promotes ArthriBs Development During Mycobacterium tuberculosis InfecBon', EBioMedicine, 23: 88-99.

      Hult, C., J. T. Magla, H. P. Gideon, J. J. Linderman, and D. E. Kirschner. 2021. 'Neutrophil Dynamics Affect Mycobacterium tuberculosis Granuloma Outcomes and DisseminaBon', Front Immunol, 12: 712457.

      Katayama, M., K. Ohmura, N. Yukawa, C. Terao, M. Hashimoto, H. Yoshifuji, D. Kawabata, T. Fujii, Y. Iwakura, and T. Mimori. 2013. 'Neutrophils are essenBal as a source of IL-17 in the effector phase of arthriBs', PLoS One, 8: e62231.

      Khader, S. A., G. K. Bell, J. E. Pearl, J. J. Fountain, J. Rangel-Moreno, G. E. Cilley, F. Shen, S. M. Eaton, S. L. Gaffen, S. L. Swain, R. M. Locksley, L. Haynes, T. D. Randall, and A. M. Cooper. 2007. 'IL-23 and IL-17 in the establishment of protecBve pulmonary CD4+ T cell responses afer vaccinaBon and during Mycobacterium tuberculosis challenge', Nat Immunol, 8: 369-77.

      Leliefeld, P. H. C., J. Pillay, N. Vrisekoop, M. Heeres, T. Tak, M. Kox, S. H. M. Rooijakkers, T. W. Kuijpers, P. Pickkers, L. P. H. Leenen, and L. Koenderman. 2018. 'DifferenBal anBbacterial control by neutrophil subsets', Blood Adv, 2: 1344-55.

      Lemos, H. P., R. Grespan, S. M. Vieira, T. M. Cunha, W. A. Verri, Jr., K. S. Fernandes, F. O. Souto, I. B. McInnes, S. H. Ferreira, F. Y. Liew, and F. Q. Cunha. 2009. 'Prostaglandin mediates IL-23/IL-17induced neutrophil migraBon in inflammaBon by inhibiBng IL-12 and IFNgamma producBon', Proc Natl Acad Sci U S A, 106: 5954-9.

      Li, L., L. Huang, A. L. Vergis, H. Ye, A. Bajwa, V. Narayan, R. M. Strieter, D. L. Rosin, and M. D. Okusa. 2010. 'IL-17 produced by neutrophils regulates IFN-gamma-mediated neutrophil migraBon in mouse kidney ischemia-reperfusion injury', J Clin Invest, 120: 331-42.

      Lin, A. M., C. J. Rubin, R. Khandpur, J. Y. Wang, M. Riblen, S. Yalavarthi, E. C. Villanueva, P. Shah, M. J. Kaplan, and A. T. Bruce. 2011. 'Mast cells and neutrophils release IL-17 through extracellular trap formaBon in psoriasis', J Immunol, 187: 490-500.

      Lovewell, R. R., C. E. Baer, B. B. Mishra, C. M. Smith, and C. M. Sasseg. 2021. 'Granulocytes act as a niche for Mycobacterium tuberculosis growth', Mucosal Immunol, 14: 229-41.

      Lyadova, I. V. 2017. 'Neutrophils in Tuberculosis: Heterogeneity Shapes the Way?', Mediators Inflamm, 2017: 8619307.

      Mishra, B. B., R. R. Lovewell, A. J. Olive, G. Zhang, W. Wang, E. Eugenin, C. M. Smith, J. Y. Phuah, J. E. Long, M. L. Dubuke, S. G. Palace, J. D. Goguen, R. E. Baker, S. Nambi, R. Mishra, M. G. Booty, C. E. Baer, S. A. Shaffer, V. Dartois, B. A. McCormick, X. Chen, and C. M. Sasseg. 2017. 'Nitric oxide prevents a pathogen-permissive granulocyBc inflammaBon during tuberculosis', Nat Microbiol, 2: 17072.

      Napolitani, G., E. V. Acosta-Rodriguez, A. Lanzavecchia, and F. Sallusto. 2009. 'Prostaglandin E2 enhances Th17 responses via modulaBon of IL-17 and IFN-gamma producBon by memory CD4+ T cells', Eur J Immunol, 39: 1301-12.

      Nwongbouwoh Muefong, C., O. Owolabi, S. Donkor, S. Charalambous, A. Bakuli, A. Rachow, C. Geldmacher, and J. S. Sutherland. 2022. 'Neutrophils Contribute to Severity of Tuberculosis

      Pathology and Recovery From Lung Damage Pre- and Posnreatment', Clin Infect Dis, 74: 175766.

      Paulissen, S. M., J. P. van Hamburg, N. Davelaar, P. S. Asmawidjaja, J. M. Hazes, and E. Lubberts. 2013. 'Synovial fibroblasts directly induce Th17 pathogenicity via the cyclooxygenase/prostaglandin E2 pathway, independent of IL-23', J Immunol, 191: 1364-72.

      Pedrosa, J., B. M. Saunders, R. Appelberg, I. M. Orme, M. T. Silva, and A. M. Cooper. 2000. 'Neutrophils play a protecBve nonphagocyBc role in systemic Mycobacterium tuberculosis infecBon of mice', Infect Immun, 68: 577-83.

      Polese, B., B. Thurairajah, H. Zhang, C. L. Soo, C. A. McMahon, G. Fontes, S. N. A. Hussain, V. Abadie, and I. L. King. 2021. 'Prostaglandin E(2) amplifies IL-17 producBon by gammadelta T cells during barrier inflammaBon', Cell Rep, 36: 109456.

      Rankin, A. N., S. V. Hendrix, S. K. Naik, and C. L. Stallings. 2022. 'Exploring the Role of Low-Density Neutrophils During Mycobacterium tuberculosis InfecBon', Front Cell Infect Microbiol, 12: 901590.

      Xu, X. J., Q. Q. Ge, M. S. Yang, Y. Zhuang, B. Zhang, J. Q. Dong, F. Niu, H. Li, and B. Y. Liu. 2023. 'Neutrophil-derived interleukin-17A parBcipates in neuroinflammaBon induced by traumaBc brain injury', Neural Regen Res, 18: 1046-51.

      Reviewer #1 (Recommendations for the authors):

      All figures: Clear information about the number of repeat experiments for each figure must be included.

      We have provided the details of the number of repeat experiments in the revised version.

      Figure 1: The claim that neutrophils are a dominant cell type infected during Mtb infection of the lungs is undermined by the limited number of markers used to identify cell types. The gating strategy used to initially identify what cells are infected with Mtb divided cells into three categories; granulocytes (Ly6G<SUP>+</SUP> Cd11b<SUP>+</SUP>), CD64+MerTK+ macrophages, or Sca1+CD90.1+CD73+ (mesenchymal stem cells). This strategy leaves out monocyte populations that have been shown to be the dominant infected cells in other strategies (most recently, PMID: 36711606).

      Thank you for this important point. We agree that we did not assess the infected monocyte population, specifically the Cd11c<SUP>+</SUP> population. Both CD11c<SUP>Hi</SUP> and CD11c<SUP>Lo</SUP> monocyte cells appear to be important for Mtb infection, in different studies (Lee et al., 2020), (Zheng et al., 2024). Therefore, leaving out the CD11c<SUP>+</SUP> population in our assays was a conscious decision to ensure the clarity of the cell types being studied. 

      In addition, substantial evidence from multiple studies indicates that Ly6G⁺ granulocytes constitute the predominant infected population in the Mtb-infected lungs of both mice and humans (Lovewell et al., 2021) (Eum et al., 2010). While monocytes may contribute to Mtb infection dynamics, our findings align with a growing body of research emphasizing the significant role of neutrophils as a dominant infected cell type in the lungs during TB pathology.  

      Figure 1: Putting the data from separate panels together, it appears that very few bacteria are isolated from the three cell types in the lung, suggesting there may be some loss in the preparation steps. Why is the total sorted CFU from neutrophils, macrophages, and MSCs so low, <400 bacteria total, when the absolute CFU is so high? Is it because only a fraction of the lung is being sorted/plated?

      Yes, only a fraction of the lung was used for cell sorting and subsequent plating. The CFU plating from sorted cells also does not account for any bacteria growing extracellularly.

      Figure 3C: It is difficult to ascertain whether the gating on IL-17<SUP>+</SUP> cells is accurately identifying IL-17 producing cells. It is surprising, based on other published work, that the authors claim that almost half of CD45+CD11b-Ly6G- cells produce IL-17 in WT mice. It would be informative to show cell type-specific production of IL-17 in both WT and IFN-γ KO mice for comparison with the literature. Unstained/isotype controls for IL-17 staining should be shown. With this in mind, it is difficult to interpret the authors' claim that 80% of neutrophils produce IL-17.

      Thank you for the points above. We do agree that we were surprised to see ~50% of CD45<SUP>+</SUP> CD11b<SUP>-</SUP>Ly6G<SUP>-</SUP> cells producing IL-17. We have now done multiple experiments to confirm that this number is actually less than 1% (~90 cells) in the uninfected mice and less than 4% (~4000) in the Mtb-infected mice.

      Neutrophil-derived IL-17 production in Mtb-infected lungs is supported by two independent techniques in our current study: Flow Cytometry and Immunofluorescence assay. While  Neutrophil production of IL-17 is rarely studied in the context of TB, in several other settings it has been widely reported (Gonzalez-Orozco et al., 2019; Li et al., 2010; Ramirez-Velazquez et al., 2013). We consistently get >60% IL-17 positive cells in the CD11b<SUP>+</SUP> Ly6G<SUP>+</SUP> population, specifically in the infected samples. 

      To specifically address the reviewer’s concerns, we have now used an isotype control for IL17 staining and show the specificity of IL-17A antibody binding. The Author response image 1 is from the uninfected mice, 8 weeks age.

      Unfortunately, our efforts to establish an IL-17  ELISPOT assay from neutrophils were not very successful and need further standardisation. The new results are included in Fig. 3C-D and Fig. S2F-G in the revised manuscript.

      Author response image 1.

      Figure 3 D-H. Quantification of immunofluorescence microscopy should be provided.

      In the revised manuscript, we provide the quantification of IFA results.

      Figure 4: Effects on neutrophil numbers in IFN-γ Kos do not correlate with CFU reductions, suggesting there may be a neutrophilindependent mechanism.

      In the IFN-γ KO, we agree that the effect was less than dramatic. The immune dysfunction in the IFN-γ KO mice is too severe to see a strong reversal in the phenotype through interventions. 

      While we do not rule out any neutrophil-independent mechanism, in the context of following observations, neutrophil-dependent mechanisms certainly appear to play an important role-

      (a) Improved pathology and survival upon IL-17 neutralization, which further improves with the inclusion of celecoxib.

      (b) Loss of IL17<sup>+</sup>-Ly6G<sup>+</sup> cells upon IL-17 neutralization, which is further exacerbated when combined with celecoxib.

      (c) Significant reduction in PMN number (shown by FACS) without any major impact on Th17 cell population upon IL-17 neutralization.

      Finally, we believe some of the observations may become stronger once we characterize the specific sub-population among the Ly6G+ cells that correlates with pathology. For example, as shown in Figure 4I, FACS analysis of the Ly6G<sup>⁺</sup> cell population in Mtb-infected IFNγ<sup>⁻/⁻</sup> mice revealed a substantial subset of CD11b<sup>mid</sup> Ly6G<sup>ʰⁱ</sup> cells, indicative of an immature neutrophil population (Scapini et al., 2016). Efforts are currently underway to identify these important subpopulations.  

      Figure 4: Differences observed in the spleen cannot be connected to dissemination per se but instead could be a result of enhanced immune control in the spleen.

      Thank you for this important point. We have revised this section. The role of neutrophils in Mtb dissemination is an emerging area of research, with growing evidence suggesting that these cells contribute to the spread of Mtb beyond the lungs (Hult et al., 2021). We highlight that the observed correlation could be speculative at this juncture.

      Figure 4, 5: IL-17 neutralization alone has no effect on CFU in the lungs of Mtb-infected mice. While the combination of IL-17 neutralization and celecoxib has a very modest effect on CFU, the mechanism behind this observation is unclear. Further, the experiment shown has only 3 mice per group and it is unclear whether this (or any other) mouse experiment was repeated.

      For Fig. 4, the experiment was done with 3 mice/group. The IFN KO mice were used to help identify the mechanism. IL-17 neutralisation or Celecoxib treatment alone did not have any significant effect on the bacterial burden (in lungs or isolated PMNs). However, it did show a significant effect on the number of PMNs recruited. Combination of IL-17 neutralisation and celecoxib led to about a one-log decrease in CFU, which is significant.

      For Fig. 5, we used SR2211 instead of anti-IL-17 Ab for the experiment. This experiment had WT mice and 5 animals/group. Here, celecoxib and SR2211 alone showed a significant decline in PMN-resident Mtb pool as well as spleen burden. Only in the lungs, the impact of SR2211 alone was not significant.

      Figure 6: The decreases in CFU correlate with a decrease in neutrophils; nothing connects this to neutrophil production of IL-17.

      We now show quantification of observation in Fig. 5I, where in the WT mice, treatment with Celecoxib reduces the frequency of IL-17-producing Ly6G+ cells. In the revised manuscript, we also show direct evidence of SR2211 activity on BCG vaccine efficacy, which causes a significant decline in the Mtb burden in whole lung or in the isolated PMNs.

      Figure 7. The Human data shows that elevated neutrophil levels and elevated IL-17 levels are associated with treatment failure in TB patients. This is expected, and does not

      The literature lacks consensus in terms of a protective or pathological role of IL-17 in TB. Therefore, it was not expected to see higher IL-17 in patients who experienced relapse, death, or failed treatment outcomes. We do not have evidence from human subjects whether neutrophil derived IL-17 has a similar pathological role as observed in mice. However, higher IL-17 in failed outcome cases confirm the central theme that IL-17 is pathological in both human and mouse models.

      Reviewer #2 (Recommendations for the authors):

      (1) Survival of IFN-γ-/- Mice: The survival of IFN-γ-/- mice up to 100 days following a challenge with ~100 CFU of H37Rv is quite unusual. Have the authors checked PDIM expression in their Mtb strain, given that several studies report earlier mortality in these mice?

      As shown in Fig. 4F, H37Rv-infected IFN-γ⁻/⁻ mice survived up to a little over 80 days. These figures are not unusual in the light of the following:

      (1) In one study, IFNγ⁻/⁻ survived for about 40 days when the hypervirulent Mtb strain was used to infect these mice at 100-200 CFU using nose-only aerosol exposure (Nandi and Behar, 2011)

      (2) In yet another study, IFNγ⁻/⁻ mice survived for ~50 days, however, they used H37Rv at 1-3x10<sup>5</sup> CFU to infect through intravenous injection (Kawakami et al., 2004)

      Thus, compared with the above observations, where IFN-γ<sup>-/-</sup> mice survived for maximum 50 days due to hypervirulent infection or a very high dose infection, infection with H37Rv at ~100 CFU through the aerosol route and surviving for ~80 days is not unusual. The H37Rv cultures used in our study are always animal-passaged to ensure PDIM integrity.

      (2) Granuloma Scoring: The granuloma scores appear to represent the percentage of lesion area. Please clarify and, if necessary, amend this in the manuscript.

      The granuloma score is based on the calculation of the number of granulomatous infiltration and their severity. These are not % lesion area. We have added this detail in the revised manuscript.

      (3) Pathology Comparison in Figures 4F and 4G: Does the pathology shown in Figure 4G correspond to the same groups as in Figure 4F? The celecoxib group in Figure 4F and the WT group in Figure 4G seem to be missing. Please clarify.

      Figures 4F and 4G depict two independent experiments. For the time-to-death experiment, we had to leave the animals. The rest of the panels in Fig. 4 represent animals from the same experiment.

      (4) Effect of Celecoxib on Ly6G+ Cells: The authors demonstrated that celecoxib treatment reduces Ly6G+ cells and IL-17-producing Ly6G+ cells. Do Ly6G+ cells express EP2/EP4 receptors? Alternatively, could the reduction in IL-17-producing Ly6G+ cells be due to an improved bactericidal response in other innate cells? The authors should discuss this possibility.

      Yes, Ly6G<sup>⁺</sup> granulocytes express EP2/EP4 receptors (Lavoie et al., 2024), which mediate PGE₂ signaling. Prostaglandin E<sub>₂</sub> (PGE<sub>₂</sub>) is known to regulate neutrophil function and can enhance IL-17 production in various immune cells (Napolitani et al., 2009). However, the expression and functional role of EP2/EP4 receptors specifically on Ly6G<sup>⁺</sup> granulocytes in the context of Mtb infection require further investigation.

      The alternate suggestion by the reviewer that the reduction in IL-17-producing Ly6G<sup>⁺</sup> cells following celecoxib treatment could be attributed to an improved bactericidal response in other innate immune cells is attractive. While we did not experimentally rule out this possibility, since reduced IL-17 invariably associated with reduced neutrophil-resident Mtb population, a cell-autonomous mechanism operational in Ly6G+ granulocytes is a highly likely mechanism.  

      (5) Culture Conditions: The methods section indicates that bacteria were cultured in 7H9+ADC. Is there a specific reason why the Oleic acid supplement was not added, given that standard Mtb culture conditions typically use 7H9+OADC supplements? Please comment on this choice.

      It is a standard microbiological experimental procedure to use 7H9+ADC for broth culture, while 7H11+OADC for solid culture. Compared to broth culture, solid media are usually more stressful for bacteria because of hypoxia inside the growing colonies. Therefore, the media used are enriched in casein hydrolysate (like 7H11) and oleic acid (OADC).

      Reviewer #3 (Recommendations for the authors):

      Major suggestion: To really determine the role of neutrophil IL17 will require depletion studies and chimera experiments. These are clearly a major undertaking. I believe making significant re-writes to alter the conclusions or reanalyze any data to determine the role of nonhematopoietic and hematopoietic cells in IL17 is needed. If the conclusions are left as is, further experimentation is needed to fully support those conclusions.

      Thank you for the suggestion. We have embarked on the specific deletion studies; however, as mentioned, this is a major undertaking and will take time. As suggested, we have discussed the results in accordance with the strength of evidence currently provided.

      Eum, S.Y., J.H. Kong, M.S. Hong, Y.J. Lee, J.H. Kim, S.H. Hwang, S.N. Cho, L.E. Via, and C.E. Barry, 3rd. 2010. Neutrophils are the predominant infected phagocyGc cells in the airways of paGents with acGve pulmonary TB. Chest 137:122-128.

      Gonzalez-Orozco, M., R.E. Barbosa-Cobos, P. Santana-Sanchez, L. Becerril-Mendoza, L. Limon-

      Camacho, A.I. Juarez-Estrada, G.E. Lugo-Zamudio, J. Moreno-Rodriguez, and V. OrGzNavarrete. 2019. Endogenous sGmulaGon is responsible for the high frequency of IL-17Aproducing neutrophils in paGents with rheumatoid arthriGs. Allergy Asthma Clin Immunol 15:44.

      References

      Hult, C., J.T. Ma[la, H.P. Gideon, J.J. Linderman, and D.E. Kirschner. 2021. Neutrophil Dynamics Affect Mycobacterium tuberculosis Granuloma Outcomes and DisseminaGon. Front Immunol 12:712457.

      Kawakami, K., Y. Kinjo, K. Uezu, K. Miyagi, T. Kinjo, S. Yara, Y. Koguchi, A. Miyazato, K. Shibuya, Y. Iwakura, K. Takeda, S. Akira, and A. Saito. 2004. Interferon-gamma producGon and host protecGve response against Mycobacterium tuberculosis in mice lacking both IL-12p40 and IL-18. Microbes Infect 6:339-349.

      Lavoie, J.C., M. Simard, H. Kalkan, V. Rakotoarivelo, S. Huot, V. Di Marzo, A. Cote, M. Pouliot, and N. Flamand. 2024. Pharmacological evidence that the inhibitory effects of prostaglandin E2 are mediated by the EP2 and EP4 receptors in human neutrophils. J Leukoc Biol 115:1183-1189.

      Lee, J., S. Boyce, J. Powers, C. Baer, C.M. Sasse[, and S.M. Behar. 2020. CD11cHi monocyte-derived macrophages are a major cellular compartment infected by Mycobacterium tuberculosis. PLoS Pathog 16:e1008621.

      Li, L., L. Huang, A.L. Vergis, H. Ye, A. Bajwa, V. Narayan, R.M. Strieter, D.L. Rosin, and M.D. Okusa. 2010. IL-17 produced by neutrophils regulates IFN-gamma-mediated neutrophil migraGon in mouse kidney ischemia-reperfusion injury. J Clin Invest 120:331-342.

      Lovewell, R.R., C.E. Baer, B.B. Mishra, C.M. Smith, and C.M. Sasse[. 2021. Granulocytes act as a niche for Mycobacterium tuberculosis growth. Mucosal Immunol 14:229-241.

      Nandi, B., and S.M. Behar. 2011. RegulaGon of neutrophils by interferon-gamma limits lung inflammaGon during tuberculosis infecGon. The Journal of experimental medicine 208:22512262.

      Napolitani, G., E.V. Acosta-Rodriguez, A. Lanzavecchia, and F. Sallusto. 2009. Prostaglandin E2 enhances Th17 responses via modulaGon of IL-17 and IFN-gamma producGon by memory CD4+ T cells. Eur J Immunol 39:1301-1312.

      Ramirez-Velazquez, C., E.C. CasGllo, L. Guido-Bayardo, and V. OrGz-Navarrete. 2013. IL-17-producing peripheral blood CD177+ neutrophils increase in allergic asthmaGc subjects. Allergy Asthma Clin Immunol 9:23.

      Sadikot, R.T., H. Zeng, A.C. Azim, M. Joo, S.K. Dey, R.M. Breyer, R.S. Peebles, T.S. Blackwell, and J.W. Christman. 2007. Bacterial clearance of Pseudomonas aeruginosa is enhanced by the inhibiGon of COX-2. Eur J Immunol 37:1001-1009.

      Zheng, W., I.C. Chang, J. Limberis, J.M. Budzik, B.S. Zha, Z. Howard, L. Chen, and J.D. Ernst. 2023. Mycobacterium tuberculosis resides in lysosome-poor monocyte-derived lung cells during chronic infecGon. bioRxiv 

      Zheng, W., I.C. Chang, J. Limberis, J.M. Budzik, B.S. Zha, Z. Howard, L. Chen, and J.D. Ernst. 2024. Mycobacterium tuberculosis resides in lysosome-poor monocyte-derived lung cells during chronic infecGon. PLoS Pathog 20:e1012205.

    1. Author response:

      The following is the authors’ response to the original reviews.

      Reviewer #1 (Public review):

      Summary:

      In this manuscript, the authors endeavor to capture the dynamics of emotion-related brain networks. They employ slice-based fMRI combined with ICA on fMRI time series recorded while participants viewed a short movie clip. This approach allowed them to track the time course of four non-noise independent components at an effective 2s temporal resolution at the BOLD level. Notably, the authors report a temporal sequence from input to meaning, followed by response, and finally default mode networks, with significant overlap between stages. The use of ICA offers a data-driven method to identify large-scale networks involved in dynamic emotion processing. Overall, this paradigm and analytical strategy mark an important step forward in shifting affective neuroscience toward investigating temporal dynamics rather than relying solely on static network assessments

      Strengths:

      (1) One of the main advantages highlighted is the improved temporal resolution offered by slice-based fMRI. However, the manuscript does not clearly explain how this method achieves a higher effective resolution, especially since the results still show a 2s temporal resolution, comparable to conventional methods. Clarification on this point would help readers understand the true benefit of the approach.

      (2) While combining ICA with task fMRI is an innovative approach to study the spatiotemporaldynamics of emotion processing, task fMRI typically relies on modeling the hemodynamic response (e.g., using FIR or IR models) to mitigate noise and collinearity across adjacent trials. The current analysis uses unmodeled BOLD time series, which might risk suffering from these issues.

      (3) The study's claims about emotion dynamics are derived from fMRI data, which are inherently affected by the hemodynamic delay. This delay means that the observed time courses may differ substantially from those obtained through electrophysiology or MEG studies. A discussion on how these fMRI-derived dynamics relate to - or complement - is critical for the field to understand the emotion dynamics.

      (4) Although using ICA to differentiate emotion elements is a convenient approach to tell a story, it may also be misleading. For instance, the observed delayed onset and peak latency of the 'response network' might imply that emotional responses occur much later than other stages, which contradicts many established emotion theories. Given the involvement of largescale brain regions in this network, the underlying reasons for this delay could be very complex.

      Concerns and suggestions:

      However, I have several concerns regarding the specific presentation of temporal dynamics in the current manuscript and offer the following suggestions.

      (1) One selling point of this work regarding the advantages of testing temporal dynamics is the application of slice-based fMRI, which, in theory, should improve the temporal resolution of the fMRI time course. Improving fMRI temporal resolution is critical for a research project on this topic. The authors present a detailed schematic figure (Figure 2) to help readers understand it. However, I have difficulty understanding the benefits of this method in terms of temporal resolution.

      (a) In Figure 2A, if we examine a specific voxel in slice 2, the slice acquisitions occur at 0.7s, 2.7s, and 4.7s, which implies a temporal resolution of 2s rather than 0.7s. I am unclear on how the temporal resolution could be 0.7s for this specific voxel. I would prefer that the authors clarify this point further, as it would benefit readers who are not familiar with this technology.

      We very much appreciate these concerns as they highlight shortcomings in our explanation of the method. Please note that the main explanation of the method (and comparison with expected HRF and FIR based methods) is done in Janssen et al. (2018, NeuroImage; see further explanations in Janssen et al., 2020). However, to make the current paper more selfcontained, we provided further explanation of the Slice-Based method in Figure 2. With respect to the specific concern of the reviewer, in the hypothetical example used in Figure 2, the temporal resolution of the voxel on slice 2 is 0.7s because it combines the acquisitions from stimulus presentations across all trials. Specifically, given the specific study parameters as outlined in Figures 2A and B, slice 2 samples the state of the brain exactly 0s after stimulus presentation on trial 1 (red color), 0.7s after stimulus presentation on trial 3 (green color), and 1.3s after stimulus presentation on trial 2 (yellow color). Thus after combining data acquisitions across these three 3 stimuli presentations, slice 2 has sampled the state of the brain at timepoints that are multiples of 0.7s starting from stimulus onset. This is why we say that the theoretical maximum temporal resolution is equal to the TR divided by the number of slices (in the example 2/3 = 0.7s, in the actual experiment 3/39 = 0.08s). In the current study we used temporal binning across timepoints to reduce the temporal resolution (to 2 seconds) and improve the tSNR.

      We have updated the legend of Figure 3 to more clearly explain this issue.

      (b) Even with the claim of an increased temporal resolution (0.7s), the actual data (Figure 3) still appears to have a 2s resolution. I wonder what specific benefit slice-based fMRI brings in terms of testing temporal dynamics, aside from correcting the temporal distortions that conventional fMRI exhibits.

      This is a good point. In the current experiment, the TR was 3s, but we extracted the fMRI signal at 2s temporal resolution, which means an increment of 33%. In this study we did not directly compare the impact of different temporal resolutions on the efficacy of detection of network dynamics. Indeed, we agree with the reviewer that there remain many unanswered questions about the issue of temporal resolution of the extracted fMRI signal and the impact on the ability to detect fMRI network dynamics. We think that questions such as those posed by the reviewer should be addressed in future studies that are directly focused on this issue. We have updated our discussion section (page 21-22) to more clearly reflect this point of view.

      (2) In task-fMRI, the hemodynamic response is usually estimated using a specific model (e.g., FIR, IR model; see Lindquist et al., 2009). These models are effective at reducing noise and collinearity across adjacent trials. The current method appears to be conducted on unmodeled BOLD time series.

      (a) I am wondering how the authors avoid the issues that are typically addressed by these HRF modeling approaches. For example, if we examine the baseline period (say, -4 to 0s relative to stimulus onset), the activation of most networks does not remain around zero, which could be due to delayed influences from the previous trial. This suggests that the current time course may not be completely accurate.

      We thank the reviewer for highlighting this issue. Let us start by reiterating what we stated above: That there are many issues related to BOLD signal extraction and fMRI network discovery in task-based fMRI that remain poorly understood and should be addressed in future work. Such work should explore, for example, the impact of using a FIR vs Slice-based method on the discovery of networks in task-fMRI. These studies should also investigate the impact of different types of baselines and baseline durations on the extraction of the BOLD signal and network discovery. For the present purposes, our goal was not to introduce a new technique of fMRI signal extraction, but to show that the slice-based technique, in combination with ICA, can be used to study the brain’s networks dynamics in an emotional task. In other words, while we clearly appreciate the reviewer’s concerns and have several other studies underway that directly address these concerns, we believe that such concerns are better addressed in independent research. See our discussion on page 21-22 that addresses this issue.

      (b) A related question: if the authors take the spatial map of a certain network and apply a modeling approach to estimate a time series within that network, would the results be similar to the current ICA time series?

      Interesting point. Typically in a modeling approach the expected HRF (e.g., the double gamma function) is fitted to the fMRI data. Importantly, this approach produces static maps of the fit between the expected HRF and the data. By contrast, model-free approaches such as FIR or slice-based methods extract the fMRI signal directly from the data without making apriori assumptions about the expected shape of the signal. These approaches do not produce static maps but instead are capable of extracting the whole-brain dynamics during the execution of a task (event-related dynamics). These data-driven approaches (FIR, SliceBased, etc) are therefore a necessary first step in the analyses of the dynamics of brain activity during a task. The subsequent step involves the analyses of these complex eventrelated brain dynamics. In the current paper we suggest that a straightforward way to do this is to use ICA which produces spatial maps of voxels with similar time courses, and hence, yields insights into the temporal dynamics of whole-brain fMRI networks. As we mentioned above, combining ICA with a high temporal resolution data-driven signal is new and there are many new avenues for research in this burgeoning new field.

      (3) Human emotion should be inherently fast to ensure survival, as shown in many electrophysiology and MEG studies. For example, the dynamics of a fearful face can occur within 100ms in subcortical regions (Méndez-Bértolo et al., 2016), and general valence and arousal effects can occur as early as 200ms (e.g., Grootswagers et al., 2020; Bo et al., 2022). In contrast, the time-to-peak or onset timing in the BOLD time series spans a much larger time range due to the hemodynamic delay. fMRI findings indeed add spatial precision to our understanding of the temporal dynamics of emotion, but could the authors comment on how the current temporal dynamics supplement those electrophysiology studies that operate on much finer temporal scales?

      We really like this point. One way that EEG and fMRI are typically discussed is that these two approaches are said to be complementary. While EEG is able to provide information on temporal dynamics, but not spatial localization of brain activity, fMRI cannot provide information on the temporal dynamics, but can provide insights into spatial localization. Our study most directly challenges the latter part of this statement. We believe that by using tasks that highlight “slow” cognition, fMRI can be used to reveal not only spatial but also temporal information of brain activity. The movie task that we used presumably relies on a kind of “slow” cognition that takes place on longer time scales (e.g., the construction of the meaning of the scene). Our results show that with such tasks, whole-brain networks with different temporal dynamics can be separated by ICA, at odds with the claim that fMRI is only good for spatial information. One avenue of future research would be to attempt such “slow” tasks directly with EEG and try to find the electrical correlates of the networks detected in the current study.

      We hope to have answered the concerns of the reviewer.

      (4) The response network shows activation as late as 15 to 20s, which is surprising. Could the authors discuss further why it takes so long for participants to generate an emotional response in the brain?

      We thank the reviewer for this question. Our study design was such that there was an initial movie clip that lasted 12.5s, which was then followed by a two-alternative forced-choice decision task (including a button press, 2.5s), and finally followed by a 10s rest period. We extracted the fMRI signal across this entire 25s period (actually 28s because we also took into account some uncertainty in BOLD signal duration). Network discovery using ICA then showed various networks with distinct time courses (across the 25s period), including one network (IC2 response) that showed a peak around 21s (see Figure 3). Given the properties of the spatial map (eg., activity in primary motor areas, Figure 4), as well as the temporal properties of its timecourse (e.g., peak close to the response stage of the task), we interpreted this network as related to generating the manual response in the two-alternative forced-choice decision task. Further analyses showed that this aspect of the task (e.g., deciding the emotion of the character in the movie clip) was also sensitive to the emotional content of the earlier movie clip (Figure 6 and 7).

      We have further clarified this aspect of our results (see pages 16-17). We thank the reviewer for pointing this out.

      (5) Related to 4. In many theories, the emotion processing stages-including perception, valuation, and response-are usually considered iterative processes (e.g., Gross, 2015), especially in real-world scenarios. The advantage of the current paradigm is that it incorporates more dynamic elements of emotional stimuli and is closer to reality. Therefore, one might expect some degree of dynamic fluctuation within the tested brain networks to reflect those potential iterative processes (input, meaning, response). However, we still do not observe much brain dynamics in the data. In Figure 5, after the initial onset, most network activations remain sustained for an extended period of time. Does this suggest that emotion processing is less dynamic in the brain than we thought, or could it be related to limitations in temporal resolution? It could also be that the dynamics of each individual trial differ, and averaging them eliminates these variations. I would like to hear the authors' comments on this topic.

      We thank the reviewer for this interesting question. We are assuming the reviewer is referring to Figure 3 and not Figure 5. Indeed what Figure 3 shows is the average time course of each detected network across all subjects and trial types. This figure therefore does not directly show the difference in dynamics between the different emotions. However, as we show in further analyses that examine how emotion modulates specific aspects of the fMRI signal dynamics (time to peak, peak value, duration) of different networks, there are differences in the dynamics of these networks depending on the emotion (Figure 6 and 7). Thus, our results show that different emotions evoked by movie clips differ in their dynamics. Obviously, generalizing this to say that in general, different emotions have different brain dynamics is not straightforward and would require further study (probably using other tasks, and other emotions). We have updated the discussion section as well as the caption of Figure 3 to better explain this issue (see also comments by reviewer 2).

      (6) The activation of the default mode network (DMN), although relatively late, is very interesting. Generally, one would expect a deactivation of this network during ongoing external stimulation. Could this suggest that participants are mind-wandering during the later portion of the task?

      Very good point. Indeed this is in line with our interpretation. The late activity of the default mode network could reflect some further processing of the previous emotional experience. More work is required to clarify this further in terms of reflective, mind-wandering or regulatory processing. We have updated our discussion section to better highlight this issue (see page 19).

      We thank the reviewer for their really insightful comments and suggestions!

      Reviewer #2 (Public review):

      Summary:

      This manuscript examined the neural correlates of the temporal-spatial dynamics of emotional processing while participants were watching short movie clips (each 12.5 s long) from the movie "Forrest Gump". Participants not only watched each film clip, but also gave emotional responses, followed by a brief resting period. Employing fMRI to track the BOLD responses during these stages of emotional processing, the authors found four large-scale brain networks (labeled as IC0,1,2,4) were differentially involved in emotional processing. Overall, this work provides valuable information on the neurodynamics of emotional processing.

      Strengths:

      This work employs a naturalistic movie watching paradigm to elicit emotional experiences. The authors used a slice-based fMRI method to examine the temporal dynamics of BOLD responses. Compared to previous emotional research that uses static images, this work provides some new data and insights into how the brain supports emotional processing from a temporal dynamics view.

      Thank you!

      Weaknesses:

      Some major conclusions are unwarranted and do not have relevant evidence. For example, the authors seemed to interpret some neuroimaging results to be related to emotion regulation. However, there were no explicit instructions about emotional regulation, and there was no evidence suggesting participants regulated their emotions. How to best interpret the corresponding results thus requires caution.

      We thank the reviewer for pointing this out. We have updated the limitations section of our Discussion section (page 20) to better qualify our interpretations.

      Relatedly, the authors argued that "In turn, our findings underscore the utility of examining temporal metrics to capture subtle nuances of emotional processing that may remain undetectable using standard static analyses." While this sentence makes sense and is reasonable, it remains unclear how the results here support this argument. In particular, there were only three emotional categories: sad, happy, and fear. These three emotional categories are highly different from each other. Thus, how exactly the temporal metrics captured the "subtle nuances of emotional processing" shall be further elaborated.

      This is an important point. We also discuss this limitation in the “limitations” section of our Discussion (page 20). We again thank the reviewer for pointing this out.

      The writing also contained many claims about the study's clinical utility. However, the authors did not develop their reasoning nor elaborate on the clinical relevance. While examining emotional processing certainly could have clinical relevance, please unpack the argument and provide more information on how the results obtained here can be used in clinical settings.

      We very much appreciate this comment. Note that we did not intend to motivate our study directly from a clinical perspective (because we did not test our approach on a clinical population). Instead, our point is that some researchers (e.g., Kuppens & Verduyn 2017; Waugh et al., 2015) have conceptualized emotional disorders frequently having a temporal component (e.g., dwelling abnormally long on negative thoughts) and that our technique could be used to examine if temporal dynamics of networks are affected in such disorders. However, as we pointed out, this should be verified in future work. We have updated our final paragraph (page 22) to more clearly highlight this issue. We thank the reviewer for pointing this out.

      Importantly, how are the temporal dynamics of BOLD responses and subjective feelings related? The authors showed that "the time-to-peak differences in IC2 ("response") align closely with response latency results, with sad trials showing faster response latencies and earlier peak times". Does this mean that people typically experience sad feelings faster than happy or fear? Yet this is inconsistent with ideas such that fear detection is often rapid, while sadness can be more sustained. Understandably, the study uses movie clips, which can be very different from previous work, mostly using static images (e.g., a fearful or a sad face). But the authors shall explicitly discuss what these temporal dynamics mean for subjective feelings.

      Excellent point! Our results indeed showed that sad trials had faster reaction times compared to happy and fearful trials, and that this result was reflected in the extracted time-to-peak measures of the fMRI data (see Figure 8D). To us, this primarily demonstrates that, as shown in other studies (e.g., Menon et al., 1997), that gross differences detected in behavioral measures can be directly recovered from temporal measures in fMRI data, which is not trivial. However, we do not think we are allowed to make interpretations of the sort suggested by the reviewer (and to be clear: we do not make such interpretations in the paper). Specifically, the faster reaction times on sad trials likely reflect some audio/visual aspect of the movie clips that result in faster reaction times instead of a generalized temporal difference in the subjective experience of sad vs happy/fearful emotions. Presumably the speed with which emotional stimuli influence the brain depends on the context. Perhaps future studies that examine emotional responses while controlling for the audio/visual experience could shed further light on this issue. We have updated the discussion section to address the reviewer’s concern.

      We thank the reviewer for the interesting points which have certainly improved our manuscript!

      Reviewer #1 (Recommendations for the authors):

      Minor:

      (1) Please add the unit to the y-axis in Figure 7, if applicable.

      Done. We have added units.

      (2) Adding a note in the legend of Figure 3 regarding the meaning of the amplitude of the timeseries would be helpful.

      Done. We have added a sentence further explaining the meaning of the timecourse fluctuations.

      Related references:

      (1) Lindquist, M. A., Loh, J. M., Atlas, L. Y., & Wager, T. D. (2009). Modeling the hemodynamic response function in fMRI: efficiency, bias, and mis-modeling. Neuroimage, 45(1), S187-S198.

      (2) Méndez-Bértolo, C., Moratti, S., Toledano, R., Lopez-Sosa, F., Martínez-Alvarez, R., Mah, Y. H., ... & Strange, B. A. (2016). A fast pathway for fear in human amygdala. Nature neuroscience, 19(8), 1041-1049.

      (3) Bo, K., Cui, L., Yin, S., Hu, Z., Hong, X., Kim, S., ... & Ding, M. (2022). Decoding the temporal dynamics of affective scene processing. NeuroImage, 261, 119532.

      (4) Grootswagers, T., Kennedy, B. L., Most, S. B., & Carlson, T. A. (2020). Neural signatures of dynamic emotion constructs in the human brain. Neuropsychologia, 145, 106535.

      (5) Gross, J. J. (2015). The extended process model of emotion regulation: Elaborations, applications, and future directions. Psychological inquiry, 26(1), 130-137.

    1. Author response:

      The following is the authors’ response to the original reviews.

      Reviewer #1 (Public review): 

      Summary: 

      The study by Gupta et al. investigates the role of mast cells (MCs) in tuberculosis (TB) by examining their accumulation in the lungs of M. tuberculosis-infected individuals, non-human primates, and mice. The authors suggest that MCs expressing chymase and tryptase contribute to the pathology of TB and influence bacterial burden, with MC-deficient mice showing reduced lung bacterial load and pathology. 

      Strengths: 

      (1) The study addresses an important and novel topic, exploring the potential role of mast cells in TB pathology. 

      (2) It incorporates data from multiple models, including human, non-human primates, and mice, providing a broad perspective on MC involvement in TB. 

      (3) The finding that MC-deficient mice exhibit reduced lung bacterial burden is an interesting and potentially significant observation. 

      Weaknesses: 

      (1) The evidence is inconsistent across models, leading to divergent conclusions that weaken the overall impact of the study. 

      The strength of the study is the use of multiple models including mouse, nonhuman primate as well as human samples. The conclusions have now been refined to reflect the complexity of the disease and the use of multiple models.

      (2) Key claims, such as MC-mediated cytokine responses and conversion of MC subtypes in granulomas, are not well-supported by the data presented.

      To address the reviewer’ s comments we will carry out further experimentation to strengthen the link between MC subtypes and cytokine responses. 

      (3) Several figures are either contradictory or lack clarity, and important discrepancies, such as the differences between mouse and human data, are not adequately discussed. 

      We will further clarify the figures and streamline the discussions between the different models used in the study. 

      (4) Certain data and conclusions require further clarification or supporting evidence to be fully convincing. 

      We will either provide clarification or supporting evidence for some of the key conclusions in the paper. 

      Reviewer #2 (Public review): 

      Summary: 

      The submitted manuscript aims to characterize the role of mast cells in TB granuloma. The manuscript reports heterogeneity in mast cell populations present within the granulomas of tuberculosis patients. With the help of previously published scRNAseq data, the authors identify transcriptional signatures associated with distinct subpopulations. 

      Strengths: 

      (1) The authors have carried out a sufficient literature review to establish the background and significance of their study. 

      (2) The manuscript utilizes a mast cell-deficient mouse model, which demonstrates improved lung pathology during Mtb infection, suggesting mast cells as a potential novel target for developing host-directed therapies (HDT) against tuberculosis. 

      Weaknesses: 

      (1) The manuscript requires significant improvement, particularly in the clarity of the experimental design, as well as in the interpretation and discussion of the results. Enhanced focus on these areas will provide better coherence and understanding for the readers. 

      The strength of the study is the use of multiple models including mouse, nonhuman primate as well as human samples. The conclusions have now been refined to reflect the complexity of the disease and the use of multiple models.

      (2) Throughout the manuscript, the authors have mislabelled the legends for WT B6 mice and mast cell-deficient mice. As a result, the discussion and claims made in relation to the data do not align with the corresponding graphs (Figure 1B, 3, 4, and S2). This discrepancy undermines the accuracy of the conclusions drawn from the results. 

      We apologize for the discrepancy which will be corrected in the revised manuscript 

      (3) The results discussed in the paper do not add a significant novel aspect to the field of tuberculosis, as the majority of the results discussed in Figure 1-2 are already known and are a re-validation of previous literature.

      This is the first study which has used mouse, NHP and human TB samples from Mtb infection to characterize and validate the role of MC in TB. We believe the current study provides significant novel insights into the role of MC in TB. 

      (4) The claims made in the manuscript are only partially supported by the presented data. Additional extensive experiments are necessary to strengthen the findings and enhance the overall scientific contribution of the work.

      We will either provide clarification or supporting evidence for some of the key conclusions in the paper.

      Reviewer #1 (Recommendations for the authors):

      In the study by Gupta et al., the authors report an accumulation of mast cells (MCs) expressing the proteases chymase and tryptase in the lungs of M. tuberculosis-infected individuals and non-human primates, as compared to healthy controls and latently infected individuals. They also MCs appear to play a pathological role in mice. Notably, MC-deficient mice show reduced lung bacterial burden and pathology during infection.

      While the topic is of interest, the study is overall quite preliminary, and many conclusions are not wellsupported by the presented data. The reliance on three different models, each suggesting divergent outcomes, weakens the ability to draw definitive conclusions. Specifically, the claim that "MCs (...) mediate cytokine responses to drive pathology and promote Mtb susceptibility and dissemination during TB" is not substantiated by the data.

      Major comments

      (1) In human samples, the authors conclude that "While MCTCs accumulated in early immature granulomas within TB lesions, MCCs accumulated in late granulomas in TB patients" and that MCTs "likely convert first to MCTCs in early granulomas before becoming MCCs in late mature granulomas with necrotic cores." However, Figure 1B shows the opposite. Furthermore, the assertion that MCTs "convert" into MCTCs is not justified by the data.

      Corrections have been made to the figures to ensure clarity for the reader. We demonstrate accumulation of tryptase-expressing MCs in healthy individuals, while the dual tryptase and chymaseexpressing MCs were seen in early granulomas, and only chymase-associated MCs were observed in late granulomas depicting more pathology of the disease. We have removed the line as advised by the reviewer.

      (2) In Figure 2 I and J, the panels do not demonstrate co-expression of chymase and tryptase in clusters 0, 1, and 3 in PTB samples, which contradicts the histology data. This discrepancy is left unaddressed and raises concerns about the conclusions drawn from Figures 1 and 2.

      We thank the reviewer for pointing this out. We revisited the data and now show the coexpression of the dual expressing cells in the data (Figure 2H). This discrepancy stemmed from the crossspecies nature of the dataset. It turns out the there is a considerable diversity in sequence similarity and tryptase function between human and NHPs (Trivedi et al., 2007). We explain this in the section now (line 313-364). Briefly, while humans express TPSG1 (encoding  tryptase) and TPSD1 (encoding  tryptase) and have the same gene name in NHP, the gene name for more widely expressed TPSAB1(encoding  /  tryptase) is different for NHP and the gene names are not shared as they are still predicated putative protein. The putative genes from NHP that map to human TPSAB1 is LOC699599 for M. mulatta and LOC102139613 for M. fasicularis, respectively. Thus, looking for TPSAB1 gene yielded no result in our previous analysis but examining these orthologous gene names, now phenocopy the results we see in the histology data. To strengthen our findings, we have now analyzed an additional single-cell dataset from the lungs of NHP M. fasicularis (Figure 2J-L) and found the co-expression of chymase and tryptase, adding an important validation to our histological findings.

      (3) Figure 2 serves more as a resource and contributes little to the core findings of the study. It might be better suited as supplementary material.

      We thank the reviewer for the suggestion; however, we believe that Figure 2 serves as an independent validation in a different species (NHP), showing heterogeneity in MCs across species in a TB model. The figure adds value as there are only a handful of studies (Tauber et al., 2023, Derakhshan et al., 2022, Cildir et al., 2021) but none in TB, describing MCs at single cell level, of which one is published from our group showing MC cluster in Mtb infected macaques (Esaulova et al., 2021). We feel strongly that dissecting MCs as specifically done here provides an important insight into the transcriptional heterogeneity of these cells linked to disease states. We have also added an additional NHP lung single cell dataset (Gideon et al., 2022) to complement our analysis, thus adding another validation, strengthening these findings. So, we believe in retaining the figure as an integral part of the main paper.

      (4) In lines 275-277, the data referenced should be shown to support the claims.

      We thank the reviewer for the suggestion. The text originally noted by the reviewer now appears in the revised manuscript at line 370-372 and the corresponding data has now been included as supplementary Figure S3. 

      (5) In Figure 3B, the difference between the two mouse strains becomes non-significant by day 150 pi, weakening the overall conclusion that MCs contribute to the bacterial burden.

      At 100 dpi, MC-deficient mice exhibit lower Mtb CFU in both the lung and spleen, indicating improved protection. By 150 dpi, lung CFU differences are no longer significant; however, dissemination to the spleen remains reduced in MC-deficient mice. Thus, the overall conclusion that MCs contribute to increased bacterial burden remains valid, particularly with respect to dissemination. This conclusion is further supported by new data showing that adoptive transfer of MCs into B6 Mtb-infected mice increased Mtb dissemination to the spleen (Figure 5E). 

      (6) Figures 3D and E are not particularly convincing.

      Figures 3D and 3E illustrate lung inflammation in MC-deficient mice compared to wild-type which more distinctly show that MC-deficient mice exhibit significantly less inflammation at 150 dpi, supporting the role of MCs in driving lung.

      (7) In Figures 4 and S3, the color coding in panels A-F appears incorrect but is accurate in G. This inconsistency is confusing.

      We thank the reviewer for noting this. The color coding has been corrected to ensure consistency across all figures.

      (8) In the mouse model, MCs seem to disappear during infection, in contrast to observations in human and macaque samples. This discrepancy is not discussed in the paper.

      We thank the reviewer for this important observation. In response, we performed a new analysis of lung MCs at baseline in wild-type and MC-deficient mice. Our data show that naïve wild-type lungs contain a small population of MCs, which is further reduced in MC-deficient mice. Following Mtb infection, MCs progressively accumulate in wild-type mice, whereas this accumulation is significantly impaired in MC-deficient mice. These new data are now included in Figure (Figure 4A) and also updated in the text (line 395-403).

      (9) In lines 306-307, data should be shown to support the claims.

      We thank the reviewer for the suggestion. The text originally noted by the reviewer now appears in the revised manuscript at line 399-400 and the corresponding data has now been included as supplementary Figure S4. 

      Minor comments

      (1) What does "granuloma-associated" cells mean in samples from healthy controls?

      We thank the reviewer for this point. The language has been revised to accurately refer to cells in the lung parenchyma in the Figure 1, rather than “granuloma associated” cells.

      (2) In line 229, it is unclear what "these cells" refers to.

      The phrase “these cells” refers to tryptase-expressing mast cells. This has now been clarified in the revised manuscript (line 276-277).

      (3) The citation of Figure 3A in lines 284-285 is misplaced in the text and should be corrected.

      The figure citation has been corrected in the text in the revised manuscript (lines 376-379).

      Reviewer #2 (Recommendations for the authors):

      (1) The data presented in Figure 1 seems to be a re-validation of the already known aspects of mast cells in TB granulomas. While distinct roles for mast cells in regulating Mtb infection have been reported, the manuscript appears to be a failed opportunity to characterize the transcriptional signatures of the distinct subsets and identify their role in previously reported processes towards controlling TB disease progression.

      We thank the reviewer for the insight. While it was not our intent to investigate the bulk transcriptome, owing to the high number of cells required to get enough RNA for transcriptomic sequencing, it is technically challenging due to the low abundance of mast cells during TB infection (Figure 2). The motivation for Figure 2, that we utilized a more sensitive transcriptomic analysis to find the different transcriptional states in the distinct TB disease states. We believe that this analysis captures the essence of what the reviewer and provides meaningful insights into mast cell heterogeneity during TB.

      (2) The experiments lack uniformity with respect to the strains of Mtb used for experimentation. For eg: Mtb strain HN878 was used for aerosol infection of mice while Mtb CDC1551 was used for macaques. If there were experimental constraints with respect to the choice, the same should be mentioned.

      We thank the reviewer for this comment. The Mtb strain usage has been consistent within each species: HN878 for mice and CDC1551 for non-human primates (NHPs), in line with prior studies from our lab. The species-specific choice reflects the differences in pathogenicity of these strains in mice versus NHPs. CDC1551, which exhibits lower virulence, allows the development of a macaque model that recapitulates human latent to chronic TB when administered via aerosol at low to moderate doses (Kaushal et al., 2015; Sharan et al., 2021; Singh et al., 2025). In contrast, the more virulent HN878 strain leads to severe disease and high mortality in NHPs and is therefore not suitable for these models. Using CDC1551 in macaques provides a controlled and clinically relevant platform to study immunological and pathophysiological mechanisms of TB, justifying its use in the current study. This explanation has now been added to the manuscript method section (lines 109-114).

      (3) Line 84- 85, the authors state that "Chymase positive MCs contribute to immune pathology and reduced Mtb control". Previous reports including Garcia-Rodriguez et al., 2021 associate high MCTCs with improved lung function. Additionally, in the macaques model of latent TB infection reported in the manuscript, the number of chymase-expressing MCs seems to significantly decrease. The authors should justify the same. 

      We thank the reviewer for this comment. In Garcia-Rodriguez et al., 2021, chymase-expressing MCs accumulate in fibrotic lung lesions. Fibrosis is a result of excessive inflammation in TB infection and is associated with lung damage. Similarly, in idiopathic pulmonary fibrosis, higher density and percentage of chymase-expressing MCs correlate positively with fibrosis severity (Andersson et al., 2011). In our study, although fibrosis was not directly assessed, chymase-positive MCs increased in late lung granulomas, consistent with advanced inflammatory disease. Therefore, our conclusion that chymaseproducing MCs contribute to lung pathology is justified and aligns with prior observations.

      (4) The manuscript would benefit from a brief description of the experimental conditions for the previously published scRNAseq data used in the current study.

      We thank the reviewer for the suggestion, and the information has been included in the final manuscript (lines 294-297) and represented as Figure 2A.

      (5) The authors have not mentioned the criteria used to categorize early and late granulomas in TB patients. A lucid description of the same is necessary.

      Based on reviewer’s comment the detailed categorization of early and late granulomas in TB patients is now included in the revised manuscript (line 256-260). Early granulomas: Discrete conglomerates of immune cells and resident stromal cells with defined borders and absence of central necrosis, and Late granulomas: Large and dense clusters of immune cells and resident cells with an evident necrotic center containing bacteria and dead neutrophils and lymphocytic infiltrating cells on the periphery of the necrotic center. MCs were measured in the periphery and inside early granulomas, while in the late granulomas, they were mainly quantified in the periphery.

      (6) The authors mention that "While MCTCs accumulated in early immature granulomas within TB lesions, MCCs accumulated in late granulomas in TB patients". While this is evident from the representative, the quantification in Figure 1B seems to indicate otherwise.

      We thank the reviewer for pointing this out. The labeling in the quantitative analysis shown in Figure 1B has been corrected in the revised manuscript to accurately reflect the accumulation of MC<sub>TC</sub>s in early granulomas and MC<sub>C</sub>s in late granulomas.

      (7) The labelling followed in Figures 3, 4 and S2 do not match with the discussion. Such errors should be rectified to minimize any ambiguity within the text of the manuscript.

      We thank the reviewer for noting this. The color coding has been corrected to ensure consistency across all figures.

      (8) The mast cell deficient mice model has a differential number of immune cells at the site of granuloma as reported in the manuscript. This could contribute to the altered mycobacterial survival and inflammation cytokine production in the lung and hence might not be a direct effect of mast cell depletion. The authors can consider reconstituting mast cell populations to analyze the mast cell function.

      We thank the reviewers for this suggestion. In the revised manuscript, we have adoptively transferred MCs into WT mice before Mtb challenge to assess if this would increase inflammation and Mtb CFU in the lung and spleen. Our results show that while lung inflammation was not impacted, we found that the dissemination to the spleen and the frequency of neutrophils in the lung were increased in WT mice that received MCs (Figure 5, lines 429-443).

      (9) Line 295- 297, the authors state "MCs continued to accumulate in the lung up to 100 dpi in CgKitWsh mice, following which the MC numbers decreased at later stages". However, the quantification in Figure 4A does not reflect the same. This should be addressed.

      In response to the reviewers' comments, we conducted a new analysis of lung MCs at baseline, comparing wild-type and MC-deficient mice. The revised data show that MC-deficient mice have fewer mast cells at baseline compared to B6 mice. Furthermore, mast cell numbers increase during infection, peaking at 100 days post-infection (dpi) and subsequently stabilize by 150 dpi. The revised data has been included in Figure 4A and text line 395-403.

      (10) Additionally, while the scRNAseq data reflects a lower production of TNF in pulmonary TB granulomas, the mice deficient in mast cells are discussed to have a lower production of proinflammatory cytokines.

      Mast cells increasing and contributing to the TB pathogenesis is the theme of the paper and as such we see and increase in the IFNG pathway genes and similar reduction in the production of pro- inflammatory cytokines. The relative decrease in the TNF pathway gene expression can be reconciled by the fact that less TNF gene expression in PTB could also represent loss of Mtb control and increased pathogenesis (Yuk et al., 2024), which is maintained in the LTBI/HC clusters. Higher bacterial burden of Mtb can also decrease the host TNF production, which is in line with what we observe here (Olsen et al., 2016, Reed et al., 2004, Kurtz et al., 2006).

      (11) The authors have not annotated Figure 2 I and J in the text while describing their results and interpretation.

      We thank the reviewer for noting this and the figure 2 has been revised and the results as pointed out have been added to the revised manuscript.

      (12) In line 284, the authors have discussed the results pertaining to Figure 3B, however, mentioned it as Figure 3A in the text.

      We thank the reviewer for noting this and the corrections have been made in the revised manuscript (lines 379-384).

      References

      ANDERSSON, C. K., ANDERSSON-SJOLAND, A., MORI, M., HALLGREN, O., PARDO, A., ERIKSSON, L., BJERMER, L., LOFDAHL, C. G., SELMAN, M., WESTERGREN-THORSSON, G. & ERJEFALT, J. S. 2011. Activated MCTC mast cells infiltrate diseased lung areas in cystic fibrosis and idiopathic pulmonary fibrosis. Respir Res, 12, 139.

      CILDIR, G., YIP, K. H., PANT, H., TERGAONKAR, V., LOPEZ, A. F. & TUMES, D. J. 2021. Understanding mast cell heterogeneity at single cell resolution. Trends Immunol, 42, 523-535.

      DERAKHSHAN, T., BOYCE, J. A. & DWYER, D. F. 2022. Defining mast cell differentiation and heterogeneity through single-cell transcriptomics analysis. J Allergy Clin Immunol, 150, 739-747.

      ESAULOVA, E., DAS, S., SINGH, D. K., CHORENO-PARRA, J. A., SWAIN, A., ARTHUR, L., RANGEL-MORENO, J., AHMED, M., SINGH, B., GUPTA, A., FERNANDEZ-LOPEZ, L. A., DE LA LUZ GARCIA-HERNANDEZ, M., BUCSAN, A., MOODLEY, C., MEHRA, S., GARCIA-LATORRE, E., ZUNIGA, J., ATKINSON, J., KAUSHAL, D., ARTYOMOV, M. N. & KHADER, S. A. 2021. The immune landscape in tuberculosis reveals populations linked to disease and latency. Cell Host Microbe, 29, 165-178 e8.

      GARCIA-RODRIGUEZ, K. M., BINI, E. I., GAMBOA-DOMINGUEZ, A., ESPITIA-PINZON, C. I., HUERTA-YEPEZ, S., BULFONE-PAUS, S. & HERNANDEZ-PANDO, R. 2021. Differential mast cell numbers and characteristics in human tuberculosis pulmonary lesions. Sci Rep, 11, 10687.

      GIDEON, H. P., HUGHES, T. K., TZOUANAS, C. N., WADSWORTH, M. H., 2ND, TU, A. A., GIERAHN, T. M., PETERS, J. M., HOPKINS, F. F., WEI, J. R., KUMMERLOWE, C., GRANT, N. L., NARGAN, K., PHUAH, J. Y., BORISH, H. J., MAIELLO, P., WHITE, A. G., WINCHELL, C. G., NYQUIST, S. K., GANCHUA, S. K. C., MYERS, A., PATEL, K. V., AMEEL, C. L., COCHRAN, C. T., IBRAHIM, S., TOMKO, J. A., FRYE, L. J., ROSENBERG, J. M., SHIH, A., CHAO, M., KLEIN, E., SCANGA, C. A., ORDOVAS-MONTANES, J., BERGER, B., MATTILA, J. T., MADANSEIN, R., LOVE, J. C., LIN, P. L., LESLIE, A., BEHAR, S. M., BRYSON, B., FLYNN, J. L., FORTUNE, S. M. & SHALEK, A. K. 2022. Multimodal profiling of lung granulomas in macaques reveals cellular correlates of tuberculosis control. Immunity, 55, 827846 e10.

      KAUSHAL, D., FOREMAN, T. W., GAUTAM, U. S., ALVAREZ, X., ADEKAMBI, T., RANGEL-MORENO, J., GOLDEN, N. A., JOHNSON, A. M., PHILLIPS, B. L., AHSAN, M. H., RUSSELL-LODRIGUE, K. E., DOYLE, L. A., ROY, C. J., DIDIER, P. J., BLANCHARD, J. L., RENGARAJAN, J., LACKNER, A. A., KHADER, S. A. & MEHRA, S. 2015. Mucosal vaccination with attenuated Mycobacterium tuberculosis induces strong central memory responses and protects against tuberculosis. Nat Commun, 6, 8533.

      KURTZ, S., MCKINNON, K. P., RUNGE, M. S., TING, J. P. & BRAUNSTEIN, M. 2006. The SecA2 secretion factor of Mycobacterium tuberculosis promotes growth in macrophages and inhibits the host immune response. Infect Immun, 74, 6855-64.

      OLSEN, A., CHEN, Y., JI, Q., ZHU, G., DE SILVA, A. D., VILCHEZE, C., WEISBROD, T., LI, W., XU, J., LARSEN, M., ZHANG, J., PORCELLI, S. A., JACOBS, W. R., JR. & CHAN, J. 2016. Targeting Mycobacterium tuberculosis Tumor Necrosis Factor Alpha-Downregulating Genes for the Development of Antituberculous Vaccines. mBio, 7.

      REED, M. B., DOMENECH, P., MANCA, C., SU, H., BARCZAK, A. K., KREISWIRTH, B. N., KAPLAN, G. & BARRY, C. E., 3RD 2004. A glycolipid of hypervirulent tuberculosis strains that inhibits the innate immune response. Nature, 431, 84-7.

      SHARAN, R., SINGH, D. K., RENGARAJAN, J. & KAUSHAL, D. 2021. Characterizing Early T Cell Responses in Nonhuman Primate Model of Tuberculosis. Front Immunol, 12, 706723.

      SINGH, D. K., AHMED, M., AKTER, S., SHIVANNA, V., BUCSAN, A. N., MISHRA, A., GOLDEN, N. A., DIDIER, P. J., DOYLE, L. A., HALL-URSONE, S., ROY, C. J., ARORA, G., DICK, E. J., JR., JAGANNATH, C., MEHRA, S., KHADER, S. A. & KAUSHAL, D. 2025. Prevention of tuberculosis in cynomolgus macaques by an attenuated Mycobacterium tuberculosis vaccine candidate. Nat Commun, 16, 1957.

      TAUBER, M., BASSO, L., MARTIN, J., BOSTAN, L., PINTO, M. M., THIERRY, G. R., HOUMADI, R., SERHAN, N., LOSTE, A., BLERIOT, C., KAMPHUIS, J. B. J., GRUJIC, M., KJELLEN, L., PEJLER, G., PAUL, C., DONG, X., GALLI, S. J., REBER, L. L., GINHOUX, F., BAJENOFF, M., GENTEK, R. & GAUDENZIO, N. 2023. Landscape of mast cell populations across organs in mice and humans. J Exp Med, 220.

      TRIVEDI, N. N., TONG, Q., RAMAN, K., BHAGWANDIN, V. J. & CAUGHEY, G. H. 2007. Mast cell alpha and beta tryptases changed rapidly during primate speciation and evolved from gamma-like transmembrane peptidases in ancestral vertebrates. J Immunol, 179, 6072-9.

      YUK, J. M., KIM, J. K., KIM, I. S. & JO, E. K. 2024. TNF in Human Tuberculosis: A Double-Edged Sword. Immune Netw, 24, e4.

    1. dweb.link This IPFS link is linking to a given state of a file it is immutable name for immutable content

      It give no indication of the context the folder structure where it was store when the hasn the Conted ID CID for the resource been created

      / 🧊/ ♖/ hyperpost/ ~/ indyweb/ 2025-11

      Peergos.link

      A Peergos secret link is one that can retrieve the resource identified by i. It is like IPNS that resolves an opque resource identifier to mutable content.

      Unlike IPFS it actually shows the folder trail for all its parents rooted at a Peergos Account's name

    1. Author response:

      The following is the authors’ response to the previous reviews

      Reviewer #1 (Public Review): 

      Summary:

      The authors of this study sought to define a role for IgM in responses to house dust mites in the lung. 

      Strengths: 

      Unexpected observation about IgM biology 

      Combination of experiments to elucidate function 

      Weaknesses: 

      Would love more connection to human disease 

      We thank the reviewer for these comments. At the time of this publication, we have not made a concrete link with human disease. While there is some anecdotal evidence of diseases such as Autoimmune glomerulonephritis, Hashimoto’s thyroiditis, Bronchial polyp, SLE, Celiac disease and other diseases in people with low IgM. Allergic disorders are also common in people with IgM deficiency, other studies have reported as high as 33-47%. The mechanisms for the high incidence of allergic diseases are unclear as generally, these patients have normal IgG and IgE levels. IgM deficiency may represent a heterogeneous spectrum of genetic defects, which might explain the heterogeneous nature of disease presentations.   

      Reviewer #2 (Public Review): 

      Summary: 

      The manuscript by Hadebe and colleagues describes a striking reduction in airway hyperresponsiveness in Igm-deficient mice in response to HDM, OVA and papain across the B6 and BALB-c backgrounds. The authors suggest that the deficit is not due to improper type 2 immune responses, nor an aberrant B cell response, despite a lack of class switching in these mice. Through RNA-Seq approaches, the authors identify few di]erences between the lungs of WT and Igm-deficient mice, but see that two genes involved in actin regulation are greatly reduced in IgM-deficient mice. The authors target these genes by CRISPR-Cas9 in in vitro assays of smooth muscle cells to show that these may regulate cell contraction. While the study is conceptually interesting, there are a number of limitations, which stop us from drawing meaningful conclusions. 

      Strengths:

      Fig. 1. The authors clearly show that IgMKO mice have striking reduced AHR in the HDM model, despite the presence of a good cellular B cell response. 

      Weaknesses: 

      Fig. 2. The authors characterize the cd4 t cell response to HDM in IGMKO mice.They have restimulated medLN cells with antiCD3 for 5 days to look for IL-4 and IL-13, and find no discernible di]erence between WT and KO mice. The absence of PBStreated WT and KO mice in this analysis means it is unclear if HDM-challenged mice are showing IL-4 or IL-13 levels above that seen at baseline in this assay. 

      We thank the Reviewer for this comment. We would like to mention that a very minimal level of IL-4 and IL-13 in PBS mice was detected. We have indicated with a dotted line on the Figure 2B to show levels in unstimulated or naïve cytokines. Please see Author response image 1 below from anti-CD3 stimulated cytokine ELISA data. The levels of these cytokines are very low (not detectable) and are not changed in control WT and IgM- KO mice challenge with PBS, this is also true for PMA/ionomycin-stimulated cells

      Author response image 1.

      The choice of 5 days is strange, given that the response the authors want to see is in already primed cells. A 1-2 day assay would have been better. 

      We agree with the reviewer that a shorter stimulation period would work. Over the years we have settled for 5-day re-stimulation for both anti-CD3 and HDM. We have tried other time points, but we consistently get better secretion of cytokines after 5 days. 

      It is concerning that the authors state that HDM restimulation did not induce cytokine production from medLN cells, since countless studies have shown that restimulation of medLN would induce IL-13, IL-5 and IL-10 production from medLN. This indicates that the sensitization and challenge model used by the authors is not working as it should. 

      We thank the reviewer for this observation. In our recent paper showing how antigen load a]ects B cell function, we used very low levels of HDM to sensitise and challenge mice (1 ug and 3 ug respectively). See below article, Hadebe et al., 2021 JACI. This is because Labs that have used these low HDM levels also suggested that antigen load impacts B cell function, especially in their role in germinal centres. We believe the reason we see low or undetectable levels of cytokines is because of this low antigen load sensitisation and challenge. In other manuscripts we have published or about to publish, we have shown that normal HDM sensitisation load (1 ug or 100 ug) and challenge (10 ug) do induce cytokine release upon restimulation with HDM. See the below article by Khumalo et al, 2020 JCI Insight (Figure 4A).

      Sabelo Hadebe*, Jermaine Khumalo, Sandisiwe Mangali, Nontobeko Mthembu, Hlumani Ndlovu, Amkele Ngomti, Martyna Scibiorek, Frank Kirstein, Frank Brombacher*. Deletion of IL-4Ra signalling on B cells limits hyperresponsiveness depending on antigen load. doi.org/10.1016/j.jaci.2020.12.635).

      Jermaine Khumalo, Frank Kirstein, Sabelo Hadebe*, Frank Brombacher*. IL-4Rα signalling in regulatory T cells is required for dampening allergic airway inflammation through inhibition of IL-33 by type 2 innate lymphoid cells. JCI Insight. 2020 Oct 15;5(20):e136206. doi: 10.1172/jci.insight.136206

      The IL-13 staining shown in panel c is also not definitive. One should be able to optimize their assays to achieve a better level of staining, to my mind. 

      We agree with the reviewer that much higher IL-13-producing CD4 T cells should be observed. We don’t think this is a technical glitch or non-optimal set-up as we see much higher levels of IL-13-producing CD4 T cells when using higher doses of HDM to sensitise and challenge, say between 7 -20% in WT mice (see Author response image 2 of lung stimulated with PMA/ionomycin+Monensin, please note this is for illustration purposes only and it not linked to the current manuscript, its merely to demonstrate a point from other experiments we have conducted in the lab).

      Author response image 2.

      In d-f, the authors perform a serum transfer, but they only do this once. The half life of IgM is quite short. The authors should perform multiple naïve serum transfers to see if this is enough to induce FULL AHR. 

      We thank the reviewer for this comment. We apologise if this was not clear enough on the Figure legend and method, we did transfer serum 3x, a day before sensitisation, on the day of sensitisation and a day before the challenge to circumvent the short life of IgM. In our subsequent experiments, we have now used busulfan to deplete all bone marrow in IgM-deficient mice and replace it with WT bone marrow and this method restores AHR (Figure 3B).

      This now appears in line 515 to 519 and reads

      Adoptive transfer of naïve serum

      Naïve wild-type mice were euthanised and blood was collected via cardiac puncture before being spun down (5500rpm, 10min, RT) to collect serum. Serum (200µL) was injected intraperitoneally into IgM-deficient mice. Serum was injected intraperitoneally at day -1, 0, and a day before the challenge with HDM (day 10).

      The presence of negative values of total IgE in panel F would indicate some errors in calculation of serum IgE concentrations. 

      We thank the reviewer for this observation. For better clarity, we have now indicated these values as undetected in Figure 2F, as they were below our detection limit.

      Overall, it is hard to be convinced that IgM-deficiency does not lead to a reduction in Th2 inflammation, since the assays appear suboptimal. 

      We disagree with the reviewer in this instance, because we have shown in 3 di]erent models and in 2 di]erent strains and 2 doses of HDM (high and low) that no matter what you do, Th2 remains intact. Our reason for choosing low dose HDM was based on our previous work and that of others, which showed that depending on antigen load, B cells can either be redundant or have functional roles. Since our interest was to tease out the role of B cells and specifically IgM, it was important that we look at a scenario where B cells are known to have a function (low antigen load). We did find similar findings at high dose of HDM load, but e]ects on AHR were not as strong, but Th2 was not changed, in fact in some instances Th2 was higher in IgM-deficient mice.

      Fig. 3. Gene expression di]erences between WT and KO mice in PBS and HDM challenged settings are shown. PCA analysis does not show clear di]erences between all four groups, but genes are certainly up and downregulated, in particular when comparing PBS to HDM challenged mice. In both PBS and HDM challenged settings, three genes stand out as being upregulated in WT v KO mice. these are Baiap2l1, erdr1 and Chil1. 

      Noted

      Fig. 4. The authors attempt to quantify BAIAP2L1 in mouse lungs. It is di]icult to know if the antibody used really detects the correct protein. A BAIAP2L1-KO is not used as a control for staining, and I am not sure if competitive assays for BAIAP2L1 can be set up. The flow data is not convincing. The immunohistochemistry shows BAIAP2L1 (in red) in many, many cells, essentially throughout the section. There is also no discernible di]erence between WT and KO mice, which one might have expected based on the RNA-Seq data. So, from my perspective, it is hard to say if/where this protein is located, and whether there truly exists a di]erence in expression between wt and ko mice. 

      We thank the reviewer for this comment. We are certain that the antibody does detect BAIAP2L1, we have used it in 3 assays, which we admit may show varying specificities since it’s a Polyclonal antibody. However, in our western blot (Figure 5A), the antibody detects a band at 56.7kDa, apart from what we think are isoforms. We agree that BAIAP2L1 is expressed by many cell types, including CD45+ cells and alpha smooth muscle negative cells and we show this in our Figure 5 – figure supplement 1A and B. Where we think there is a di]erence in expression between WT and IgM-deficient mice is in alpha-smooth muscle-positive cells. We have tested antibodies from di]erent companies (Proteintech and Abcam), and we find similar findings. We do not have access to BAIAP2L1 KO mice and to test specificity, we have also used single stain controls with or without secondary antibody and isotype control which show no binding in western blot and Immunofluorescence assays and Fluorescence minus one antibody in Flow cytometry, so that way we are convinced that the signal we are seeing is specific to BAIAP2L1.

      Here we have also added additional Flow cytometry images using anti-BAIAP2L1 (clone 25692-1-AP) from Proteintech

      Author response image 3.

      Figure similar to Figure 5C and Figure 5 -figure supplement 1A and B.

      Fig. 5 and 6. The authors use a single cell contractility assay to measure whether BAIAP2L1 and ERDR1 impact on bronchial smooth muscle cell contractility. I am not familiar with the assay, but it looks like an interesting way of analysing contractility at the single cell level.

      The authors state that targeting these two genes with Cas9gRNA reduces smooth muscle cell contractility, and the data presented for contractility supports this observation. However, the e]iciency of Cas9-mediated deletion is very unclear. The authors present a PCR in supp fig 9c as evidence of gene deletion, but it is entirely unclear with what e]iciency the gene has been deleted. One should use sequencing to confirm deletion. Moreover, if the antibody was truly working, one should be able to use the antibody used in Fig 4 to detect BAIAP2L1 levels in these cells. The authors do not appear to have tried this. 

      We thank the reviewer for these observations. We are in a process to optimise this using new polyclonal BAIAP2L1 antibodies from other companies, since the one we have tried doesn’t seem to work well on human cells via western blot. So hopefully in our new version, we will be able to demonstrate this by immunofluorescence or western blot.

      Other impressions: 

      The paper is lacking a link between the deficiency of IgM and the e]ects on smooth muscle cell contraction. 

      The levels of IL-13 and TNF in lavage of WT and IGMKO mice could be analysed. 

      We have measured Th2 cytokine IL-13 in BAL fluid and found no di]erences between IgM-deficient mice and WT mice challenged with HDM (Author response image 4 below). We could not detected TNF-alpha in the BAL fluid, it was below detection limit.

      Figure legend. IL-13 levels are not changed in IgM-deficient mice in the lung. Bronchoalveolar lavage fluid in WT or IgM-deficient mice sensitised and challenged with HDM. TNF-a levels were below the detection limit.

      Author response image 4.

      Moreover, what is the impact of IgM itself on smooth muscle cells? In the Fig. 7 schematic, are the authors proposing a direct role for IgM on smooth muscle cells? Does IgM in cell culture media induce contraction of SMC? This could be tested and would be interesting, to my mind. 

      We thank the Reviewer for these comments. We are still trying to test this, unfortunately, we have experienced delays in getting reagents such as human IgM to South Africa. We hope that we will be able to add this in our subsequent versions of the article. We agree it is an interesting experiment to do even if not for this manuscript but for our general understanding of this interaction at least in an in vitro system.

      Reviewer #3 (Public Review): 

      Summary: 

      This paper by Sabelo et al. describes a new pathway by which lack of IgM in the mouse lowers bronchial hyperresponsiveness (BHR) in response to metacholine in several mouse models of allergic airway inflammation in Balb/c mice and C57/Bl6 mice. Strikingly, loss of IgM does not lead to less eosinophilic airway inflammation, Th2 cytokine production or mucus metaplasia, but to a selective loss of BHR. This occurs irrespective of the dose of allergen used. This was important to address since several prior models of HDM allergy have shown that the contribution of B cells to airway inflammation and BHR is dose dependent. 

      After a description of the phenotype, the authors try to elucidate the mechanisms. There is no loss of B cells in these mice. However, there is a lack of class switching to IgE and IgG1, with a concomitant increase in IgD. Restoring immunoglobulins with transfer of naïve serum in IgM deficient mice leads to restoration of allergen-specific IgE and IgG1 responses, which is not really explained in the paper how this might work. There is also no restoration of IgM responses, and concomitantly, the phenotype of reduced BHR still holds when serum is given, leading authors to conclude that the mechanism is IgE and IgG1 independent. Wild type B cell transfer also does not restore IgM responses, due to lack of engraftment of the B cells. Next authors do whole lung RNA sequencing and pinpoint reduced BAIAP2L1 mRNA as the culprit of the phenotype of IgM-/- mice. However, this cannot be validated fully on protein levels and immunohistology since di]erences between WT and IgM KO are not statistically significant, and B cell and IgM restoration are impossible. The histology and flow cytometry seems to suggest that expression is mainly found in alpha smooth muscle positive cells, which could still be smooth muscle cells or myofibroblasts. Next therefore, the authors move to CRISPR knock down of BAIAP2L1 in a human smooth muscle cell line, and show that loss leads to less contraction of these cells in vitro in a microscopic FLECS assay, in which smooth muscle cells bind to elastomeric contractible surfaces. 

      Strengths: 

      (1) There is a strong reduction in BHR in IgM-deficient mice, without alterations in B cell number, disconnected from e]ects on eosinophilia or Th2 cytokine production.

      (2) BAIAP2L1 has never been linked to asthma in mice or humans 

      Weaknesses: 

      (1) While the observations of reduced BHR in IgM deficient mice are strong, there is insu]icient mechanistic underpinning on how loss of IgM could lead to reduced expression of BAIAP2L1. Since it is impossible to restore IgM levels by either serum or B cell transfer and since protein levels of BAIAP2L1 are not significantly reduced, there is a lack of a causal relationship that this is the explanation for the lack of BHR in IgMdeficient mice. The reader is unclear if there is a fundamental (maybe developmental) di]erence in non-hematopoietic cells in these IgM-deficient mice (which might have accumulated another genetic mutation over the years). In this regard, it would be important to know if littermates were newly generated, or historically bred along with the KO line. 

      We thank the reviewer for asking this question and getting us to think of this in a di]erent way. This prompted us to use a di]erent method to try and restore IgM function and since our animal facility no longer allows irradiation, we opted for busulfan. We present this data as new data in Figure 3. We had to go back and breed this strain and then generated bone marrow chimeras. What we have shown now with chimeras is that if we can deplete bone marrow from IgM-deficient mice and replace it with congenic WT bone marrow when we allow these mice to rest for 2 months before challenge with HDM (Figure 3 -figure supplement 1A-C) We also show that AHR (resistance and elastance) is partially restored in this way (Figure 3A and B) as mice that receive congenic WT bone marrow after chemical irradiation can mount AHR and those that receive IgM-deficient bone marrow, can’t mount AHR upon challenge with HDM. If the mice had accumulated an unknown genetic mutation in non-hematopoietic cells, the transfer of WT bone marrow would not make a di]erence. So, we don’t believe the colony could have gained a mutation that we are unaware of. We have also shipped these mice to other groups and in their hands, this strains still only behaves as an IgM only knockout mice. See their publication below.

      Mark Noviski, James L Mueller, Anne Satterthwaite, Lee Ann Garrett-Sinha, Frank Brombacher, Julie Zikherman 2018. IgM and IgD B cell receptors di]erentially respond to endogenous antigens and control B cell fate. eLife 2018;7:e35074. DOI: https://doi.org/10.7554/eLife.35074

      we have also added methods for bone marrow chimaeras and added results sections and new Figures related to these methods.

      Methods appear in line 521-532 of the untracked version of the article.

      Busulfan Bone marrow chimeras

      WT (CD45.2) and IgM<sup>-/-</sup> (CD45.2) congenic mice were treated with 25 mg/kg busulfan (Sigma-Aldrich, Aston Manor, South Africa) per day for 3 consecutive days (75 mg/kg in total) dissolved in 10% DMSO and Phosphate bu]ered saline (0.2mL, intraperitoneally) to ablate bone marrow cells. Twenty-four hours after last administration of busulfan, mice were injected intravenously with fresh bone marrow (10x10<sup>6</sup> cells, 100µL) isolated from hind leg femurs of either WT (CD45.1) or IgM<sup>-/-</sup> mice [33]. Animals were then allowed to complement their haematopoietic cells for 8 weeks. In some experiments the level of bone marrow ablation was assessed 4 days post-busulfan treatment in mice that did not receive donor cells. At the end of experiment level of complemented cells were also assessed in WT and IgM<sup>-/-</sup> mice that received WT (CD45.1) bone marrow. 

      Results appear in line 198-228 of the untracked version of the article

      Replacement of IgM-deficient mice with functional hematopoietic cells in busulfan mice chimeric mice restores airway hyperresponsiveness.

      We then generated bone marrow chimeras by chemical radiation using busulfan (Montecino-Rodriguez and Dorshkind, 2020). We treated mice three times with busulfan for 3 consecutive days and after 24 hrs transferred naïve bone marrow from congenic CD45.1 WT mice or CD45.2 IgM KO mice (Figure 3A and Figure 3 -figure supplement 1A). We showed that recipient mice that did not receive donor bone marrow after 4 days post-treatment had significantly reduced lineage markers (CD45<sup>+</sup>Sca-1<sup>+</sup>) or lineage negative (Lin<sup>-</sup>) cells in the bone marrow when compared to untreated or vehicle (10% DMSO) treated mice (Figure 3 -figure supplements 1B-C). We allowed mice to reconstitute bone marrow for 8 weeks before sensitisation and challenge with low dose HDM (Figure 3A). We showed that WT (CD45.2) recipient mice that received WT (CD45.1) donor bone marrow had higher airway resistance and elastance and this was comparable to IgM KO (CD45.2) recipient mice that received donor WT (CD45.1) bone marrow (Figure 3B). As expected, IgM KO (CD45.2) recipient mice that received donor IgM KO (CD45.2) bone marrow had significantly lower AHR compared to WT (CD45.2) or IgM KO (CD45.2) recipient mice that received WT (CD45.1) bone marrow (Figure 3B). We confirmed that the di]erences observed were not due to di]erences in bone marrow reconstitution as we saw similar frequencies of CD45.1 cells within the lymphocyte populations in the lungs and other tissues (Figure 3 -figure supplement 1D). We observed no significant changes in the lung neutrophils, eosinophils, inflammatory macrophages, CD4 T cells or B cells in WT or IgM KO (CD45.2) recipient mice that received donor WT (CD45.1/CD45.2) or IgM KO (CD45.2) bone marrow when sensitised and challenged with low dose HDM (Figure 3C).

      Restoring IgM function through adoptive reconstitution with congenic CD45.1 bone marrow in non-chemically irradiated recipient mice or sorted B cells into IgM KO mice (Figure 2 -figure supplement 1A) did not replenish IgM B cells to levels observed in WT mice and as a result did not restore AHR, total IgE and IgM in these mice (Figure 2 -figure supplements 1B-C). 

      The 2 new figures are Figure 3 which moved the rest of the Figures down and Figure 3- figure supplement 1AD), which also moved the rest of the supplementary figures down.

      Discussion appears in line 410-419 of the untracked version of the article.To resolve other endogenous factors that could have potentially influenced reduced AHR in IgM-deficient mice, we resorted to busulfan chemical irradiation to deplete bone marrow cells in IgM-deficient mice and replace bone marrow with WT bone marrow. While it is well accepted that busulfan chemical irradiation partially depletes bone marrow cells, in our case it was not possible to pursue other irradiation methods due to changes in ethical regulations and that fact that mice are slow to recover after gamma rays irradiation. Busulfan chemical irradiation allowed us to show that we could mostly restore AHR in IgM-deficient recipient mice that received donor WT bone marrow when challenged with low dose HDM.

      (2) There is no mention of the potential role of complement in activation of AHR, which might be altered in IgM-deficient mice   

      We thank the reviewer for this comment. We have not directly looked at complement in this instance, however, from our previous work on C3 knockout mice, there have been comparable AHR to WT mice under the HDM challenge.

      (3) What is the contribution of elevated IgD in the phenotype of the IgM-deficient mice. It has been described by this group that IgD levels are clearly elevated 

      We thank the reviewer for this question. We believe that IgD is essentially what drives partial class switching to IgG, we certainly have shown that in the case of VSV virus and Trypanosoma congolense and Trypanosoma brucei brucei that elevated IgD drive delayed but e]ective IgG in the absence of IgM (Lutz et al, 2001, Nature). This is also confirmed by Noviski et al., 2018 eLife study where they show that both IgM and IgD do share some endogenous antigens, so its likely that external antigens can activate IgD in a similar manner to prompt class switching.

      (4) How can transfer of naïve serum in class switching deficient IgM KO mice lead to restoration of allergen specific IgE and IgG1? 

      We thank the Reviewer for these comments, we believe that naïve sera transferred to IgM deficient mice is able to bind to the surface of B cells via IgM receptors (FcμR / Fcα/μR), which are still present on B cells and this is su]icient to facilitate class switching. Our IgM KO mouse lacks both membrane-bound and secreted IgM, and transferred serum contains at least secreted IgM which can bind to surfaces via its Fc portion. We measured HDM-specific IgE and we found very low levels, but these were not di]erent between WT and IgM KO adoptively transferred with WT serum. We also detected HDM-specific IgG1 in IgM KO transferred with WT sera to the same level as WT, confirming a possible class switching, of course, we can’t rule out that transferred sera also contains some IgG1. We also can’t rule out that elevated IgD levels can partially be responsible for class switched IgG1 as discussed above.

      In the discussion line 463-464, we also added the following

      “We speculate that IgM can directly activate smooth muscle cells by binding a number of its surface receptors including FcμR, Fcα/μR and pIgR (Liu et al., 2019; Nguyen et al., 2017b; Shibuya et al., 2000). IgM binds to FcμR strictly, but shares Fcα/μR and pIgR with IgA (Liu et al., 2019; Michaud et al., 2020; Nguyen et al., 2017b). Both Fcα/μR and pIgR can be expressed by non-structural cells at mucosal sites (Kim et al., 2014; Liu et al., 2019). We would not rule out that the mechanisms of muscle contraction might be through one of these IgM receptors, especially the ones expressed on smooth muscle cells(Kim et al., 2014; Liu et al., 2019). Certainly, our future studies will be directed towards characterizing the mechanism by which IgM potentially activates the smooth muscle.”

      We have discussed this section under Discussion section, line 731 to 757. In addition, since we have now performed bone marrow chimaeras we have further added the following in our discussion in line 410-419.

      To resolve other endogenous factors that could have potentially influenced reduced AHR in IgM-deficient mice, we resorted to busulfan chemical irradiation to deplete bone marrow cells in IgM-deficient mice and replace bone marrow with WT bone marrow. While it is well accepted that busulfan chemical irradiation partially depletes bone marrow cells, in our case it was not possible to pursue other irradiation methods due to changes in ethical regulations and that fact that mice are slow to recover after gamma rays irradiation. Busulfan chemical irradiation allowed us to show that we could mostly restore AHR in IgM-deficient recipient mice that received donor WT bone marrow when challenged with low dose HDM. 

      We removed the following lines, after performing bone marrow chimaeras since this changed some aspects. 

      Our efforts to adoptively transfer wild-type bone marrow or sorted B cells into IgMdeficient mice were also largely unsuccessful partly due to poor engraftment of wildtype B cells into secondary lymphoid tissues. Natural secreted IgM is mainly produced by B1 cells in the peritoneal cavity, and it is likely that any transfer of B cells via bone marrow transfer would not be su]icient to restore soluble levels of IgM<sup>3,10</sup>.

      (5) lpha smooth muscle antigen is also expressed by myofibroblasts. This is insu]iciently worked out. The histology mentions "expression in cells in close contact with smooth muscle". This needs more detail since it is a very vague term. Is it in smooth muscle or in myofibroblasts. 

      We appreciate that alpha-smooth muscle actin-positive cells are a small fraction in the lung and even within CD45 negative cells, but their contribution to airway hyperresponsiveness is major. We also concede that by immunofluorescence BAIAP2L1 seems to be expressed by cells adjacent to alpha-smooth muscle actin (Figure 5B), however, we know that cells close to smooth muscle (such as extracellular matrix and myofibroblasts) contribute to its hypertrophy in allergic asthma.

      James AL, Elliot JG, Jones RL, Carroll ML, Mauad T, Bai TR, et al. Airway Smooth Muscle Hypertrophy and Hyperplasia in Asthma. Am J Respir Crit Care Med [Internet]. 2012; 185:1058–64. Available from: https://doi.org/10.1164/rccm.201110-1849OC

      (6) Have polymorphisms in BAIAP2L1 ever been linked to human asthma? 

      No, we have looked in asthma GWAS studies, at least summary statistics and we have not seen any SNPs that could be associated with human asthma.

      (7) IgM deficient patients are at increased risk for asthma. This paper suggests the opposite. So the translational potential is unclear 

      We thank the reviewer for these comments. At the time of this publication, we have not made a concrete link with human disease. While there is some anecdotal evidence of diseases such as Autoimmune glomerulonephritis, Hashimoto’s thyroiditis, Bronchial polyp, SLE, Celiac disease and other diseases in people with low IgM. Allergic disorders are also common in people with IgM deficiency as the reviewer correctly points out, other studies have reported as high as 33-47%. The mechanisms for the high incidence of allergic diseases are unclear as generally, these patients have normal or higher IgG and IgE levels. IgM deficiency may represent a heterogeneous spectrum of genetic defects, which might explain the heterogeneous nature of disease presentations.

    1. Po roce 2020 došlo k násobnému nárůstu, který odráží především rozšíření programů SFŽP v oblasti energetických úspor a modernizace zdrojů tepla v domácnostech – zejména v souvislosti s implementací programu Nová zelená úsporám. 20152016201720182019202020212022202320240102030OdvětvíDávky pomoci v hmotné nouziDávky státní sociální podpory a dávky pěstounské péčeKomunální služby a územní rozvojOchrana ovzduší a klimatuOstatní činnost v oblasti bydlení, komunálních služeb a úz. rozv.Rozvoj bydlení a bytové hospodářstvíSlužby sociální prevenceZáležitosti těžebního průmyslu a energetikyVýdaje [mld. Kč].cls-1 {fill: #3f4f75;} .cls-2 {fill: #80cfbe;} .cls-3 {fill: #fff;}plotly-logomark {"x":{"data":[{"x":[2015,2016,2017,2018,2019,2020,2021,2022,2023,2024],"y":[3.1362012145199998,2.9167721326199998,2.42229314202,1.8933877991400001,1.5792528450799999,1.6272916878099999,1.76658297259,1.84017972437,1.694480889,1.6739637439999999],"text":["Rok: 2015 <br>Odvětví: Dávky pomoci v hmotné nouzi <br>Výdaje: 3.14 mld. Kč","Rok: 2016 <br>Odvětví: Dávky pomoci v hmotné nouzi <br>Výdaje: 2.92 mld. Kč","Rok: 2017 <br>Odvětví: Dávky pomoci v hmotné nouzi <br>Výdaje: 2.42 mld. Kč","Rok: 2018 <br>Odvětví: Dávky pomoci v hmotné nouzi <br>Výdaje: 1.89 mld. Kč","Rok: 2019 <br>Odvětví: Dávky pomoci v hmotné nouzi <br>Výdaje: 1.58 mld. Kč","Rok: 2020 <br>Odvětví: Dávky pomoci v hmotné nouzi <br>Výdaje: 1.63 mld. Kč","Rok: 2021 <br>Odvětví: Dávky pomoci v hmotné nouzi <br>Výdaje: 1.77 mld. Kč","Rok: 2022 <br>Odvětví: Dávky pomoci v hmotné nouzi <br>Výdaje: 1.84 mld. Kč","Rok: 2023 <br>Odvětví: Dávky pomoci v hmotné nouzi <br>Výdaje: 1.69 mld. Kč","Rok: 2024 <br>Odvětví: Dávky pomoci v hmotné nouzi <br>Výdaje: 1.67 mld. Kč"],"type":"scatter","mode":"lines","line":{"width":5.6692913385826778,"color":"rgba(17,49,68,1)","dash":"solid"},"hoveron":"points","name":"Dávky pomoci v hmotné nouzi","legendgroup":"Dávky pomoci v hmotné nouzi","showlegend":true,"xaxis":"x","yaxis":"y","hoverinfo":"text","frame":null},{"x":[2015,2016,2017,2018,2019,2020,2021,2022,2023,2024],"y":[9.1874478112700011,9.2896525793799984,8.6527129472500004,7.7153884478100005,7.1066980742899997,6.9721704018900006,6.64058688196,8.5408560970200007,17.890107087770001,20.330845674189998],"text":["Rok: 2015 <br>Odvětví: Dávky státní sociální podpory a dávky pěstounské péče <br>Výdaje: 9.19 mld. Kč","Rok: 2016 <br>Odvětví: Dávky státní sociální podpory a dávky pěstounské péče <br>Výdaje: 9.29 mld. Kč","Rok: 2017 <br>Odvětví: Dávky státní sociální podpory a dávky pěstounské péče <br>Výdaje: 8.65 mld. Kč","Rok: 2018 <br>Odvětví: Dávky státní sociální podpory a dávky pěstounské péče <br>Výdaje: 7.72 mld. Kč","Rok: 2019 <br>Odvětví: Dávky státní sociální podpory a dávky pěstounské péče <br>Výdaje: 7.11 mld. Kč","Rok: 2020 <br>Odvětví: Dávky státní sociální podpory a dávky pěstounské péče <br>Výdaje: 6.97 mld. Kč","Rok: 2021 <br>Odvětví: Dávky státní sociální podpory a dávky pěstounské péče <br>Výdaje: 6.64 mld. Kč","Rok: 2022 <br>Odvětví: Dávky státní sociální podpory a dávky pěstounské péče <br>Výdaje: 8.54 mld. Kč","Rok: 2023 <br>Odvětví: Dávky státní sociální podpory a dávky pěstounské péče <br>Výdaje: 17.89 mld. Kč","Rok: 2024 <br>Odvětví: Dávky státní sociální podpory a dávky pěstounské péče <br>Výdaje: 20.33 mld. Kč"],"type":"scatter","mode":"lines","line":{"width":5.6692913385826778,"color":"rgba(9,97,106,1)","dash":"solid"},"hoveron":"points","name":"Dávky státní sociální podpory a dávky pěstounské péče","legendgroup":"Dávky státní sociální podpory a dávky pěstounské péče","showlegend":true,"xaxis":"x","yaxis":"y","hoverinfo":"text","frame":null},{"x":[2018,2019,2020,2021,2022,2023,2024],"y":[1.67657141526,2.7964227882900001,3.15998356346,3.61070579615,2.8862273526500002,1.69988693084,0.82015937066],"text":["Rok: 2018 <br>Odvětví: Komunální služby a územní rozvoj <br>Výdaje: 1.68 mld. Kč","Rok: 2019 <br>Odvětví: Komunální služby a územní rozvoj <br>Výdaje: 2.8 mld. Kč","Rok: 2020 <br>Odvětví: Komunální služby a územní rozvoj <br>Výdaje: 3.16 mld. Kč","Rok: 2021 <br>Odvětví: Komunální služby a územní rozvoj <br>Výdaje: 3.61 mld. Kč","Rok: 2022 <br>Odvětví: Komunální služby a územní rozvoj <br>Výdaje: 2.89 mld. Kč","Rok: 2023 <br>Odvětví: Komunální služby a územní rozvoj <br>Výdaje: 1.7 mld. Kč","Rok: 2024 <br>Odvětví: Komunální služby a územní rozvoj <br>Výdaje: 0.82 mld. Kč"],"type":"scatter","mode":"lines","line":{"width":5.6692913385826778,"color":"rgba(2,146,144,1)","dash":"solid"},"hoveron":"points","name":"Komunální služby a územní rozvoj","legendgroup":"Komunální služby a územní rozvoj","showlegend":true,"xaxis":"x","yaxis":"y","hoverinfo":"text","frame":null},{"x":[2015,2016,2017,2018,2019,2020,2021,2022,2023,2024],"y":[1.6773676289600001,2.2493404589599999,3.1941818671500002,1.2126270560799999,2.1132997519700001,1.31701081322,0.97534286400000003,0.94263653754999999,2.2349673913600001,0.69131391674999998],"text":["Rok: 2015 <br>Odvětví: Ochrana ovzduší a klimatu <br>Výdaje: 1.68 mld. Kč","Rok: 2016 <br>Odvětví: Ochrana ovzduší a klimatu <br>Výdaje: 2.25 mld. Kč","Rok: 2017 <br>Odvětví: Ochrana ovzduší a klimatu <br>Výdaje: 3.19 mld. Kč","Rok: 2018 <br>Odvětví: Ochrana ovzduší a klimatu <br>Výdaje: 1.21 mld. Kč","Rok: 2019 <br>Odvětví: Ochrana ovzduší a klimatu <br>Výdaje: 2.11 mld. Kč","Rok: 2020 <br>Odvětví: Ochrana ovzduší a klimatu <br>Výdaje: 1.32 mld. Kč","Rok: 2021 <br>Odvětví: Ochrana ovzduší a klimatu <br>Výdaje: 0.98 mld. Kč","Rok: 2022 <br>Odvětví: Ochrana ovzduší a klimatu <br>Výdaje: 0.94 mld. Kč","Rok: 2023 <br>Odvětví: Ochrana ovzduší a klimatu <br>Výdaje: 2.23 mld. Kč","Rok: 2024 <br>Odvětví: Ochrana ovzduší a klimatu <br>Výdaje: 0.69 mld. Kč"],"type":"scatter","mode":"lines","line":{"width":5.6692913385826778,"color":"rgba(70,163,112,1)","dash":"solid"},"hoveron":"points","name":"Ochrana ovzduší a klimatu","legendgroup":"Ochrana ovzduší a klimatu","showlegend":true,"xaxis":"x","yaxis":"y","hoverinfo":"text","frame":null},{"x":[2015,2016,2017,2018,2019,2020,2021],"y":[0.66460017107000002,0.46405308710000004,0.19152440866000001,0,0,0,0],"text":["Rok: 2015 <br>Odvětví: Ostatní činnost v oblasti bydlení, komunálních služeb a úz. rozv. <br>Výdaje: 0.66 mld. Kč","Rok: 2016 <br>Odvětví: Ostatní činnost v oblasti bydlení, komunálních služeb a úz. rozv. <br>Výdaje: 0.46 mld. Kč","Rok: 2017 <br>Odvětví: Ostatní činnost v oblasti bydlení, komunálních služeb a úz. rozv. <br>Výdaje: 0.19 mld. Kč","Rok: 2018 <br>Odvětví: Ostatní činnost v oblasti bydlení, komunálních služeb a úz. rozv. <br>Výdaje: 0 mld. Kč","Rok: 2019 <br>Odvětví: Ostatní činnost v oblasti bydlení, komunálních služeb a úz. rozv. <br>Výdaje: 0 mld. Kč","Rok: 2020 <br>Odvětví: Ostatní činnost v oblasti bydlení, komunálních služeb a úz. rozv. <br>Výdaje: 0 mld. Kč","Rok: 2021 <br>Odvětví: Ostatní činnost v oblasti bydlení, komunálních služeb a úz. rozv. <br>Výdaje: 0 mld. Kč"],"type":"scatter","mode":"lines","line":{"width":5.6692913385826778,"color":"rgba(176,165,44,1)","dash":"solid"},"hoveron":"points","name":"Ostatní činnost v oblasti bydlení, komunálních služeb a úz. rozv.","legendgroup":"Ostatní činnost v oblasti bydlení, komunálních služeb a úz. rozv.","showlegend":true,"xaxis":"x","yaxis":"y","hoverinfo":"text","frame":null},{"x":[2015,2016,2017,2018,2019,2020,2021,2022,2023,2024],"y":[6.7056526725900003,6.1896334054099995,5.5863772922199999,5.4263460964599997,6.1337736404399994,6.9382058991499997,7.2597953133500006,6.96437401758,5.8336510214300006,4.9146220281000002],"text":["Rok: 2015 <br>Odvětví: Rozvoj bydlení a bytové hospodářství <br>Výdaje: 6.71 mld. Kč","Rok: 2016 <br>Odvětví: Rozvoj bydlení a bytové hospodářství <br>Výdaje: 6.19 mld. Kč","Rok: 2017 <br>Odvětví: Rozvoj bydlení a bytové hospodářství <br>Výdaje: 5.59 mld. Kč","Rok: 2018 <br>Odvětví: Rozvoj bydlení a bytové hospodářství <br>Výdaje: 5.43 mld. Kč","Rok: 2019 <br>Odvětví: Rozvoj bydlení a bytové hospodářství <br>Výdaje: 6.13 mld. Kč","Rok: 2020 <br>Odvětví: Rozvoj bydlení a bytové hospodářství <br>Výdaje: 6.94 mld. Kč","Rok: 2021 <br>Odvětví: Rozvoj bydlení a bytové hospodářství <br>Výdaje: 7.26 mld. Kč","Rok: 2022 <br>Odvětví: Rozvoj bydlení a bytové hospodářství <br>Výdaje: 6.96 mld. Kč","Rok: 2023 <br>Odvětví: Rozvoj bydlení a bytové hospodářství <br>Výdaje: 5.83 mld. Kč","Rok: 2024 <br>Odvětví: Rozvoj bydlení a bytové hospodářství <br>Výdaje: 4.91 mld. Kč"],"type":"scatter","mode":"lines","line":{"width":5.6692913385826778,"color":"rgba(245,158,14,1)","dash":"solid"},"hoveron":"points","name":"Rozvoj bydlení a bytové hospodářství","legendgroup":"Rozvoj bydlení a bytové hospodářství","showlegend":true,"xaxis":"x","yaxis":"y","hoverinfo":"text","frame":null},{"x":[2015,2016,2017,2018,2019,2020,2021,2022,2023,2024],"y":[0.017831,0.032006400999999997,0.023600388999999999,0.0082595670000000006,0.01070192675,0.10281950179999999,0.090053458209999993,0.013486108,0.014732843000000001,0.018406545],"text":["Rok: 2015 <br>Odvětví: Služby sociální prevence <br>Výdaje: 0.02 mld. Kč","Rok: 2016 <br>Odvětví: Služby sociální prevence <br>Výdaje: 0.03 mld. Kč","Rok: 2017 <br>Odvětví: Služby sociální prevence <br>Výdaje: 0.02 mld. Kč","Rok: 2018 <br>Odvětví: Služby sociální prevence <br>Výdaje: 0.01 mld. Kč","Rok: 2019 <br>Odvětví: Služby sociální prevence <br>Výdaje: 0.01 mld. Kč","Rok: 2020 <br>Odvětví: Služby sociální prevence <br>Výdaje: 0.1 mld. Kč","Rok: 2021 <br>Odvětví: Služby sociální prevence <br>Výdaje: 0.09 mld. Kč","Rok: 2022 <br>Odvětví: Služby sociální prevence <br>Výdaje: 0.01 mld. Kč","Rok: 2023 <br>Odvětví: Služby sociální prevence <br>Výdaje: 0.01 mld. Kč","Rok: 2024 <br>Odvětví: Služby sociální prevence <br>Výdaje: 0.02 mld. Kč"],"type":"scatter","mode":"lines","line":{"width":5.6692913385826778,"color":"rgba(241,135,56,1)","dash":"solid"},"hoveron":"points","name":"Služby sociální prevence","legendgroup":"Služby sociální prevence","showlegend":true,"xaxis":"x","yaxis":"y","hoverinfo":"text","frame":null},{"x":[2015,2016,2017,2018,2019,2020,2021,2022,2023,2024],"y":[0.70368427190999994,1.02549356101,1.58813889794,1.6295806145999998,1.8447968074100001,2.2908671036199997,2.8772400939499998,7.7262381892299992,29.393578740099997,33.00478224247],"text":["Rok: 2015 <br>Odvětví: Záležitosti těžebního průmyslu a energetiky <br>Výdaje: 0.7 mld. Kč","Rok: 2016 <br>Odvětví: Záležitosti těžebního průmyslu a energetiky <br>Výdaje: 1.03 mld. Kč","Rok: 2017 <br>Odvětví: Záležitosti těžebního průmyslu a energetiky <br>Výdaje: 1.59 mld. Kč","Rok: 2018 <br>Odvětví: Záležitosti těžebního průmyslu a energetiky <br>Výdaje: 1.63 mld. Kč","Rok: 2019 <br>Odvětví: Záležitosti těžebního průmyslu a energetiky <br>Výdaje: 1.84 mld. Kč","Rok: 2020 <br>Odvětví: Záležitosti těžebního průmyslu a energetiky <br>Výdaje: 2.29 mld. Kč","Rok: 2021 <br>Odvětví: Záležitosti těžebního průmyslu a energetiky <br>Výdaje: 2.88 mld. Kč","Rok: 2022 <br>Odvětví: Záležitosti těžebního průmyslu a energetiky <br>Výdaje: 7.73 mld. Kč","Rok: 2023 <br>Odvětví: Záležitosti těžebního průmyslu a energetiky <br>Výdaje: 29.39 mld. Kč","Rok: 2024 <br>Odvětví: Záležitosti těžebního průmyslu a energetiky <br>Výdaje: 33 mld. Kč"],"type":"scatter","mode":"lines","line":{"width":5.6692913385826778,"color":"rgba(237,113,99,1)","dash":"solid"},"hoveron":"points","name":"Záležitosti těžebního průmyslu a energetiky","legendgroup":"Záležitosti těžebního průmyslu a energetiky","showlegend":true,"xaxis":"x","yaxis":"y","hoverinfo":"text","frame":null}],"layout":{"margin":{"t":23.305936073059364,"r":7.3059360730593621,"b":24.690038964857905,"l":37.260273972602747},"paper_bgcolor":"rgba(255,255,255,1)","font":{"color":"rgba(0,0,0,1)","family":"","size":14.611872146118724},"xaxis":{"domain":[0,1],"automargin":true,"type":"linear","autorange":false,"range":[2014.55,2024.45],"tickmode":"array","ticktext":["2015","2016","2017","2018","2019","2020","2021","2022","2023","2024"],"tickvals":[2015,2016,2017,2018,2019,2020,2021,2022,2023,2024],"categoryorder":"array","categoryarray":["2015","2016","2017","2018","2019","2020","2021","2022","2023","2024"],"nticks":null,"ticks":"","tickcolor":null,"ticklen":3.6529680365296811,"tickwidth":0,"showticklabels":true,"tickfont":{"color":"rgba(77,77,77,1)","family":"","size":11.68949771689498},"tickangle":-45,"showline":false,"linecolor":null,"linewidth":0,"showgrid":true,"gridcolor":"rgba(235,235,235,1)","gridwidth":0,"zeroline":false,"anchor":"y","title":{"text":"","font":{"color":null,"family":null,"size":0}},"hoverformat":".2f"},"yaxis":{"domain":[0,1],"automargin":true,"type":"linear","autorange":false,"range":[-1.6502391121235001,34.655021354593501],"tickmode":"array","ticktext":["0","10","20","30"],"tickvals":[0,10,20,29.999999999999996],"categoryorder":"array","categoryarray":["0","10","20","30"],"nticks":null,"ticks":"","tickcolor":null,"ticklen":3.6529680365296811,"tickwidth":0,"showticklabels":true,"tickfont":{"color":"rgba(77,77,77,1)","family":"","size":11.68949771689498},"tickangle":-0,"showline":false,"linecolor":null,"linewidth":0,"showgrid":true,"gridcolor":"rgba(235,235,235,1)","gridwidth":0,"zeroline":false,"anchor":"x","title":{"text":"Výdaje [mld. Kč]","font":{"color":"rgba(0,0,0,1)","family":"","size":14.611872146118724}},"hoverformat":".2f"},"shapes":[{"type":"rect","fillcolor":null,"line":{"color":null,"width":0,"linetype":[]},"yref":"paper","xref":"paper","layer":"below","x0":0,"x1":1,"y0":0,"y1":1}],"showlegend":true,"legend":{"bgcolor":null,"bordercolor":null,"borderwidth":0,"font":{"color":"rgba(0,0,0,1)","family":"","size":11.68949771689498},"title":{"text":"Odvětví","font":{"color":null,"family":null,"size":0}},"orientation":"h"},"hovermode":"closest","barmode":"relative"},"config":{"doubleClick":"reset","modeBarButtonsToAdd":["hoverclosest","hovercompare"],"showSendToCloud":false},"source":"A","attrs":{"e303348632b":{"x":{},"y":{},"text":{},"colour":{},"type":"scatter"}},"cur_data":"e303348632b","visdat":{"e303348632b":["function (y) ","x"]},"highlight":{"on":"plotly_click","persistent":false,"dynamic":false,"selectize":false,"opacityDim":0.20000000000000001,"selected":{"opacity":1},"debounce":0},"shinyEvents":["plotly_hover","plotly_click","plotly_selected","plotly_relayout","plotly_brushed","plotly_brushing","plotly_clickannotation","plotly_doubleclick","plotly_deselect","plotly_afterplot","plotly_sunburstclick"],"base_url":"https://plot.ly"},"evals":[],"jsHooks":{"render":[{"code":"function(el){\n el.setAttribute('role','img');\n el.setAttribute('aria-label','Liniový graf výdajů státního rozpočtu na bydlení (včetně výdajů s nepřímým dopadem) v Česku v miliardách Kč podle odvětví. Zobrazuje se výše a složení výdajů na bydlení v čase od roku 2015. Popis dostupný v textu nad grafem v části Výdaje s nepřímým dopadem na bydlení.');\n }","data":null}]}}

      V NZÚ byly taky vyhlašovány výzvy na zateplení bytových domů (v období 14-23 za cca 1 mld. Kč), průměrné výdaje na jednu akci jsou výrazně vyšší než pro rodinné domy (cca 800 tis. Kč)

    1. Author response:

      The following is the authors’ response to the original reviews.

      Reviewer #1 (Public review):

      Summary

      This work provides important new evidence of the cognitive and neural mechanisms that give rise to feelings of shame and guilt, as well as their transformation into compensatory behavior. The authors use a well-designed interpersonal task to manipulate responsibility and harm, eliciting varying levels of shame and guilt in participants. The study combines behavioral, computational, and neuroimaging approaches to offer a comprehensive account of how these emotions are experienced and acted upon. Notably, the findings reveal distinct patterns in how harm and responsibility contribute to guilt and shame and how these factors are integrated into compensatory decision-making.

      Strengths

      (1) Investigating both guilt and shame in a single experimental framework allows for a direct comparison of their behavioral and neural effects while minimizing confounds.

      (2) The study provides a novel contribution to the literature by exploring the neural bases underlying the conversion of shame into behavior.

      (3) The task is creative and ecologically valid, simulating a realistic social situation while retaining experimental control.

      (4) Computational modeling and fMRI analysis yield converging evidence for a quotient-based integration of harm and responsibility in guiding compensatory behavior.

      We are grateful for your thoughtful summary of our work’s strengths and greatly appreciate these positive words.

      We would like to note that, in accordance with the journal’s requirements, we have uploaded both a clean version of the revised manuscript and a version with all modifications highlighted in blue.

      Weakness

      (1) Post-experimental self-reports rely both on memory and on the understanding of the conceptual difference between the two emotions. Additionally, it is unclear whether the 16 scenarios were presented in random order; sequential presentation could have introduced contrast effects or demand characteristics.

      Thank you for pointing out the two limitations of the experimental paradigm. We fully agree with your point. Participants recalled and reported their feelings of guilt and shame immediately after completing the task, which likely ensured reasonably accurate state reports. We acknowledge, however, that in-task assessments might provide greater precision. We opted against them to examine altruistic decision-making in a more natural context, as in-task assessments could have heightened participants’ awareness of guilt and shame and biased their altruistic decisions. Post-task assessments also reduced fMRI scanning time, minimizing discomfort from prolonged immobility and thereby preserving data quality.

      In the present study, assessing guilt and shame required participants to distinguish conceptually between the two emotions. Most research with adult participants has adopted this approach, relying on direct self-reports of emotional intensity under the assumption that adults can differentiate between guilt and shame (Michl et al., 2014; Wagner et al., 2011; Zhu et al., 2019). However, we acknowledge that this approach may be less suitable for studies involving children, who may not yet have a clear understanding of the distinction between guilt and shame.

      The limitations have been added into the Discussion section (Page 47): “This research has several limitations. First, post-task assessments of guilt and shame, unlike in-task assessments, rely on memory and may thus be less precise, although in-task assessments could have heightened participants’ awareness of these emotions and biased their decisions. Second, our measures of guilt and shame depend on participants’ conceptual understanding of the two emotions. While this is common practice in studies with adult participants (Michl et al., 2014; Wagner et al., 2011; Zhu et al., 2019), it may be less appropriate for research involving children.”

      We apologize for the confusion. The 16 scenarios were presented in a random order. We have clarified this in the revised manuscript (Page 13): “After the interpersonal game, the outcomes of the experimental trials were re-presented in a random order.”

      (2) In the neural analysis of emotion sensitivity, the authors identify brain regions correlated with responsibility-driven shame sensitivity and then use those brain regions as masks to test whether they were more involved in the responsibility-driven shame sensitivity than the other types of emotion sensitivity. I wonder if this is biasing the results. Would it be better to use a cross-validation approach? A similar issue might arise in "Activation analysis (neural basis of compensatory sensitivity)." 

      Thank you for this valuable comment. We replaced the original analyses with a leave-one-subject-out (LOSO) cross-validation approach, which minimizes bias in secondary tests due to non-independence (Esterman et al., 2010). The findings were largely consistent with the original results, except that two previously significant effects became marginally significant (one effect changed from P = 0.012 to P = 0.053; the other from P = 0.044 to P = 0.062). Although we believe the new results do not alter our main conclusions, marginally significant findings should be interpreted with caution. We have noted this point in the Discussion section (Page 48): “… marginally significant results should be viewed cautiously and warrant further examination in future studies with larger sample sizes.”

      In the revised manuscript, we have described the cross-validation procedure in detail and reported the corresponding results. Please see the Method section, Page 23: “The results showed that the neural responses in the temporoparietal junction/superior temporal sulcus (TPJ/STS) and precentral cortex/postcentral cortex/supplementary motor area (PRC/POC/SMA) were negatively correlated with the responsibility-driven shame sensitivity. To test whether these regions were more involved in responsibilitydriven shame sensitivity than in other types of emotion sensitivity, we implemented a leave-one-subject-out (LOSO) cross-validation procedure (e.g., Esterman et al., 2010). In each fold, clusters in the TPJ/STS and PRC/POC/SMA showing significant correlations with responsibility-driven shame sensitivity were identified at the group level based on N-1 participants. These clusters, defined as regions of interest (ROI), were then applied to the left-out participant, from whom we extracted the mean parameter estimates (i.e., neural response values). If, in a given fold, no suprathreshold cluster was detected within the TPJ/STS or PRC/POC/SMA after correction, or if the two regions merged into a single cluster that could not be separated, the corresponding value was coded as missing. Repeating this procedure across all folds yielded an independent set of ROI-based estimates for each participant. In the LOSO crossvalidation procedure, the TPJ/STS and PRC/POC/SMA merged into a single inseparable cluster in two folds, and no suprathreshold cluster was detected within the TPJ/STS in one fold. These instances were coded as missing, resulting in valid data from 39 participants for the TPJ/STS and 40 participants for the PRC/POC/SMA. We then correlated these estimates with all four types of emotion sensitivities and compared the correlation with responsibility-driven shame sensitivity against those with the other sensitivities using Z tests (Pearson and Filon's Z).” and Page 24: “To directly test whether these regions were more involved in one of the two types of compensatory sensitivity, we applied the same LOSO cross-validation procedure described above. In this procedure, no suprathreshold cluster was detected within the LPFC in one fold and within the TP in 27 folds. These cases were coded as missing, resulting in valid data from 42 participants for the bilateral IPL, 41 participants for the LPFC, and 15 participants for the TP. The limited sample size for the TP likely reflects that its effect was only marginally above the correction threshold, such that the reduced power in cross-validation often rendered it nonsignificant. Because the sample size for the TP was too small and the results may therefore be unreliable, we did not pursue further analyses for this region. The independent ROI-based estimates were then correlated with both guilt-driven and shame-driven compensatory sensitivities, and the strength of the correlations was compared using Z tests (Pearson and Filon's Z).”

      Please see the Results section, Pages 34 and 35: “To assess whether these brain regions were specifically involved in responsibility-driven shame sensitivity, we compared the Pearson correlations between their activity and all types of emotion sensitivities. The results demonstrated the domain specificity of these regions, by revealing that the TPJ/STS cluster had significantly stronger negative responses to responsibility-driven shame sensitivity than to responsibility-driven guilt sensitivity (Z = 2.44, P = 0.015) and harm-driven shame sensitivity (Z = 3.38, P < 0.001), and a marginally stronger negative response to harm-driven guilt sensitivity (Z = 1.87, P = 0.062) (Figure 4C; Supplementary Table 14). In addition, the sensorimotor areas (i.e., precentral cortex (PRC), postcentral cortex (POC), and supplementary motor area (SMA)) exhibited the similar activation pattern as the TPJ/STS (Figure 4B and 4C; Supplementary Tables 13 and 14).” and Page 35: “The results revealed that the left LPFC was more engaged in shame-driven compensatory sensitivity (Z = 1.93, P = 0.053), as its activity showed a marginally stronger positive correlation with shamedriven sensitivity than with guilt-driven sensitivity (Figure 5C). No significant difference was found in the Pearson correlations between the activity of the bilateral IPL and the two types of sensitivities (Supplementary Table 16). For the TP, the effective sample size was too small to yield reliable results (see Methods).”

      (1) Regarding the traits of guilt and shame, I appreciate using the scores from the subscales (evaluations and action tendencies) separately for the analyses (instead of a composite score). An issue with using the actions subscales when measuring guilt and shame proneness is that the behavioral tendencies for each emotion get conflated with their definitions, risking circularity. It is reassuring that the behavior evaluation subscale was significantly correlated with compensatory behavior (not only the action tendencies subscale). However, the absence of significant neural correlates for the behavior evaluation subscale raises questions: Do the authors have thoughts on why this might be the case, and any implications?

      We are grateful for this important comment. According to the Guilt and Shame Proneness Scale, trait guilt comprises two dimensions: negative behavior evaluations and repair action tendencies (Cohen et al., 2011). Behaviorally, both dimensions were significantly correlated with participants’ compensatory behavior (negative behavior evaluations: R = 0.39, P = 0.010; repair action tendencies: R = 0.33, P = 0.030). Neurally, while repair action tendencies were significantly associated with activity in the aMCC and other brain areas, negative behavior evaluations showed no significant neural correlates. The absence of significant neural correlates for negative behavior evaluations may be due to several factors. In addition to common explanations (e.g., limited sample size reducing the power to detect weak neural correlates or subtle effects obscured by fMRI noise), another possibility is that this dimension influences neural responses indirectly through intermediate processes not captured in our study (e.g., specific motivational states). We have added a discussion of the non-significant result to the revised manuscript (Page 47): “However, the neural correlates of negative behavior evaluations (another dimension of trait guilt) were absent. The reasons underlying the non-significant neural finding may be multifaceted. One possibility is that negative behavior evaluations influence neural responses indirectly through intermediate processes not captured in our study (e.g., specific motivational states).”

      In addition, to avoid misunderstanding, the revised manuscript specifies at the appropriate places that the neural findings pertain to repair action tendencies rather than to trait guilt in general. For instance, see Pages 46 and 47: “Furthermore, we found neural responses in the aMCC mediated the relationship between repair action tendencies (one dimension of trait guilt) and compensation… Accordingly, our fMRI findings suggest that individuals with stronger tendency to engage in compensation across various moral violation scenarios (indicated by their repair action tendencies) are more sensitive to the severity of the violation and therefore engage in greater compensatory behavior.”

      (2) Regarding the computational model finding that participants seem to disregard selfinterest, do the authors believe it may reflect the relatively small endowment at stake? Do the authors believe this behavior would persist if the stakes were higher?

      Additionally, might the type of harm inflicted (e.g., electric shock vs. less stigmatized/less ethically charged harm like placing a hand in ice-cold water) influence the weight of self-interest in decision-making?

      Taken together, the conclusions of the paper are well supported by the data. It would be valuable for future studies to validate these findings using alternative tasks or paradigms to ensure the robustness and generalizability of the observed behavioral and neural mechanisms.

      Thank you for these important questions. As you suggested, we believe that the relatively small personal stakes in our task (a maximum loss of 5 Chinese yuan) likely explain why the computational model indicated that participants disregarded selfinterest. We also agree that when the harm to others is less morally charged, people may be more inclined to consider self-interest in compensatory decision-making. Overall, the more stigmatized the harm and the smaller the personal stakes, the more likely individuals are to disregard self-interest and focus solely on making appropriate compensation.

      We have added the following passage to the Discussion section (Page 42): “Notably, in many computational models of social decision-making, self-interest plays a crucial role (e.g., Wu et al., 2024). However, our computational findings suggest that participants disregarded self-interest during compensatory decision-making. A possible explanation is that the personal stakes in our task were relatively small (a maximum loss of 5 Chinese yuan), whereas the harm inflicted on the receiver was highly stigmatized (i.e., an electric shock). Under conditions where the harm is highly salient and the cost of compensation is low, participants may be inclined to disregard selfinterest and focus solely on making appropriate compensation.”

      Reviewer #2 (Public review):

      Summary

      The authors combined behavioral experiments, computational modeling, and functional magnetic resonance imaging (fMRI) to investigate the psychological and neural mechanisms underlying guilt, shame, and the altruistic behaviors driven by these emotions. The results revealed that guilt is more strongly associated with harm, whereas shame is more closely linked to responsibility. Compared to shame, guilt elicited a higher level of altruistic behavior. Computational modeling demonstrated how individuals integrate information about harm and responsibility. The fMRI findings identified a set of brain regions involved in representing harm and responsibility, transforming responsibility into feelings of shame, converting guilt and shame into altruistic actions, and mediating the effect of trait guilt on compensatory behavior.

      Strengths

      This study offers a significant contribution to the literature on social emotions by moving beyond prior research that typically focused on isolated aspects of guilt and shame. The study presents a comprehensive examination of these emotions, encompassing their cognitive antecedents, affective experiences, behavioral consequences, trait-level characteristics, and neural correlates. The authors have introduced a novel experimental task that enables such a systematic investigation and holds strong potential for future research applications. The computational modeling procedures were implemented in accordance with current field standards. The findings are rich and offer meaningful theoretical insights. The manuscript is well written, and the results are clearly and logically presented.

      We are thankful for your considerate acknowledgment of our work’s strengths and truly value your positive comments.

      We would like to note that, in accordance with the journal’s requirements, we have uploaded both a clean version of the revised manuscript and a version with all modifications highlighted in blue.

      Weakness

      In this study, participants' feelings of guilt and shame were assessed retrospectively, after they had completed all altruistic decision-making tasks. This reliance on memorybased self-reports may introduce recall bias, potentially compromising the accuracy of the emotion measurements.

      Thank you for this crucial comment. We fully agree that measuring guilt and shame after the task may affect accuracy to some extent. However, because participants reported their emotions immediately after completing the task, we believe their recollections were reasonably accurate. In designing the experiment, we considered intask assessments, but this approach risked heightening participants’ awareness of guilt and shame and thereby interfering with compensatory decisions. After careful consideration, we ultimately chose post-task assessments of these emotions. A similar approach has been adopted in prior research on gratitude, where post-task assessments were also used (Yu et al., 2018).

      In the revised manuscript, we have specified the limitations of both post-task and intask assessments of guilt and shame (Page 47): “… post-task assessments of guilt and shame, unlike in-task assessments, rely on memory and may thus be less precise, although in-task assessments could have heightened participants’ awareness of these emotions and biased their decisions.”.

      In many behavioral economic models, self-interest plays a central role in shaping individual decision-making, including moral decisions. However, the model comparison results in this study suggest that models without a self-interest component (such as Model 1.3) outperform those that incorporate it (such as Model 1.1 and Model 1.2). The authors have not provided a satisfactory explanation for this counterintuitive finding. 

      Thank you for this important comment. In the revised manuscript, we have provided a possible explanation (Page 42): “Notably, in many computational models of social decision-making, self-interest plays a crucial role (e.g., Wu et al., 2024). However, our computational findings suggest that participants disregarded self-interest during compensatory decision-making. A possible explanation is that the personal stakes in our task were relatively small (a maximum loss of 5 Chinese yuan), whereas the harm inflicted on the receiver was highly stigmatized (i.e., an electric shock). Under conditions where the harm is highly salient and the cost of compensation is low, participants may be inclined to disregard self-interest and focus solely on making appropriate compensation.”

      The phrases "individuals integrate harm and responsibility in the form of a quotient" and "harm and responsibility are integrated in the form of a quotient" appear in the Abstract and Discussion sections. However, based on the results of the computational modeling, it is more accurate to state that "harm and the number of wrongdoers are integrated in the form of a quotient." The current phrasing misleadingly suggests that participants represent information as harm divided by responsibility, which does not align with the modeling results. This potentially confusing expression should be revised for clarity and accuracy.

      We sincerely thank you for this helpful suggestion and apologize for the confusion caused. We have removed expressions such as “harm and responsibility are integrated in the form of a quotient” from the manuscript. Instead, we now state more precisely that “harm and the number of wrongdoers are integrated in the form of a quotient.”

      However, in certain contexts we continue to discuss harm and responsibility. Introducing “the number of wrongdoers” in these places would appear abrupt, so we have opted for alternative phrasing. For example, on Page 3, we now write:

      “Computational modeling results indicated that the integration of harm and responsibility by individuals is consistent with the phenomenon of responsibility diffusion.” Similarly, on Page 49, we state: “Notably, harm and responsibility are integrated in a manner consistent with responsibility diffusion prior to influencing guilt-driven and shame-driven compensation.”

      In the Discussion, the authors state: "Since no brain region associated with social cognition showed significant responses to harm or responsibility, it appears that the human brain encodes a unified measure integrating harm and responsibility (i.e., the quotient) rather than processing them as separate entities when both are relevant to subsequent emotional experience and decision-making." However, this interpretation overstates the implications of the null fMRI findings. The absence of significant activation in response to harm or responsibility does not necessarily imply that the brain does not represent these dimensions separately. Null results can arise from various factors, including limitations in the sensitivity of fMRI. It is possible that more finegrained techniques, such as intracranial electrophysiological recordings, could reveal distinct neural representations of harm and responsibility. The interpretation of these null findings should be made with greater caution.

      Thank you for this reminder. In the revised manuscript, we have provided a more cautious interpretation of the results (Page 43): “Although the fMRI findings revealed that no brain region associated with social cognition showed significant responses to harm or responsibility, this does not suggest that the human brain encodes only a unified measure integrating harm and responsibility and does not process them as separate entities. Using more fine-grained techniques, such as intracranial electrophysiological recordings, it may still be possible to observe independent neural representations of harm and responsibility.”

      Reviewer #3 (Public review):

      Summary

      Zhu et al. set out to elucidate how the moral emotions of guilt and shame emerge from specific cognitive antecedents - harm and responsibility - and how these emotions subsequently drive compensatory behavior. Consistent with their prediction derived from functionalist theories of emotion, their behavioral findings indicate that guilt is more influenced by harm, whereas shame is more influenced by responsibility. In line with previous research, their results also demonstrate that guilt has a stronger facilitating effect on compensatory behavior than shame. Furthermore, computational modeling and neuroimaging results suggest that individuals integrate harm and responsibility information into a composite representation of the individual's share of the harm caused. Brain areas such as the striatum, insula, temporoparietal junction, lateral prefrontal cortex, and cingulate cortex were implicated in distinct stages of the processing of guilt and/or shame. In general, this work makes an important contribution to the field of moral emotions. Its impact could be further enhanced by clarifying methodological details, offering a more nuanced interpretation of the findings, and discussing their potential practical implications in greater depth.

      Strengths

      First, this work conceptualizes guilt and shame as processes unfolding across distinct stages (cognitive appraisal, emotional experience, and behavioral response) and investigates the psychological and neural characteristics associated with their transitions from one stage to the next.

      Second, the well-designed experiment effectively manipulates harm and responsibility - two critical antecedents of guilt and shame.

      Third, the findings deepen our understanding of the mechanisms underlying guilt and shame beyond what has been established in previous research.

      We truly appreciate your acknowledgment of our work’s strengths and your encouraging feedback.

      We would like to note that, in accordance with the journal’s requirements, we have uploaded both a clean version of the revised manuscript and a version with all modifications highlighted in blue.

      Weakness

      Over the course of the task, participants may gradually become aware of their high error rate in the dot estimation task. This could lead them to discount their own judgments and become inclined to rely on the choices of other deciders. It is unclear whether participants in the experiment had the opportunity to observe or inquire about others' choices. This point is important, as the compensatory decision-making process may differ depending on whether choices are made independently or influenced by external input.

      Thank you for pointing this out. We apologize for not making the experimental procedure sufficiently clear. Participants (as deciders) were informed that each decider performed the dot estimation independently and was unaware of the estimations made by the other deciders. We now have clarified this point in the revised manuscript (Pages 10 and 11): “Each decider indicated whether the number of dots was more than or less than 20 based on their own estimation by pressing a corresponding button (dots estimation period, < 2.5 s) and was unaware of the estimations made by other deciders”.

      Given the inherent complexity of human decision-making, it is crucial to acknowledge that, although the authors compared eight candidate models, other plausible alternatives may exist. As such, caution is warranted when interpreting the computational modeling results.

      Thank you for this comment. We fully agree with your opinion. Although we tried to build a conceptually comprehensive model space based on prior research and our own understanding, we did not include all plausible models, nor would it be feasible to do so. We acknowledge it as a limitation in the revised manuscript (Page 47): “... although we aimed to construct a conceptually comprehensive computational model space informed by prior research and our own understanding, it does not encompass all plausible models. Future research is encouraged to explore additional possibilities.”

      I do not agree with the authors' claim that "computational modeling results indicated that individuals integrate harm and responsibility in the form of a quotient" (i.e., harm/responsibility). Rather, the findings appear to suggest that individuals may form a composite representation of the harm attributable to each individual (i.e., harm/the number of people involved). The explanation of the modeling results ought to be precise.

      We appreciate your comment and apologize for the imprecise description. In the revised manuscript, we now use the expressions “… integrate harm and the number of wrongdoers in the form of a quotient.” and “… the integration of harm and responsibility by individuals is consistent with the phenomenon of responsibility diffusion.” For example, on Page 19, we state: “It assumes that individuals neglect their self-interest, have a compensatory baseline, and integrate harm and the number of wrongdoers in the form of a quotient.” On Page 3, we state: “Computational modeling results indicated that the integration of harm and responsibility by individuals is consistent with the phenomenon of responsibility diffusion.”

      Many studies have reported positive associations between trait gratitude, social value orientation, and altruistic behavior. It would be helpful if the authors could provide an explanation about why this study failed to replicate these associations.

      Thanks a lot for this important comment. We have now added an explanation into the revised manuscript (Page 47): “Although previous research has found that trait gratitude and SVO are significantly associated with altruistic behavior in contexts such as donation (Van Lange et al., 2007; Yost-Dubrow & Dunham, 2018) and reciprocity (Ma et al., 2017; Yost-Dubrow & Dunham, 2018), their associations with compensatory decisions in the present study were not significant. This suggests that the effects of trait gratitude and SVO on altruistic behavior are context-dependent and may not predict all forms of altruistic behavior.”

      As the authors noted, guilt and shame are closely linked to various psychiatric disorders. It would be valuable to discuss whether this study has any implications for understanding or even informing the treatment of these disorders.

      We are grateful for this advice. Although our study did not directly examine patients with psychological disorders, the findings offer insights into the regulation of guilt and shame. As these emotions are closely linked to various disorders, improving their regulation may help alleviate related symptoms. Accordingly, we have added a paragraph highlighting the potential clinical relevance (Pages 48 and 49): “Our study has potential practical implications. The behavioral findings may help counselors understand how cognitive interventions targeting perceptions of harm and responsibility could influence experiences of guilt and shame. The neural findings highlight specific brain regions (e.g., TPJ) as potential intervention targets for regulating these emotions. Given the close links between guilt, shame, and various psychological disorders (e.g., Kim et al., 2011; Lee et al., 2001; Schuster et al., 2021), strategies to regulate these emotions may contribute to symptom alleviation. Nevertheless, because this study was conducted with healthy adults, caution is warranted when considering applications to other populations.”

      Reviewer #1 (Recommendations for the authors):

      (1) Would it be interesting to explore other categories of behavior apart from compensatory behavior?

      Thanks a lot for this insightful question. We focused on a classic form of altruistic behavior, compensation. Future studies are encouraged to adapt our paradigm to examine other behaviors associated with guilt and/or shame, such as donation (Xu, 2022), avoidance (Shen et al., 2023), or aggression (Velotti et al., 2014). Please see Page 48: “Future research could combine this paradigm with other cognitive neuroscience methods, such as electroencephalography (EEG) or magnetoencephalography (MEG), and adapt it to investigate additional behaviors linked to guilt and shame, including donation (Xu, 2022), avoidance (Shen et al., 2023), and aggression (Velotti et al., 2014).”

      (2) Did the computational model account for the position of the block (slider) at the start of each decision-making response (when participants had to decide how to divide the endowment)? Or are anchoring effects not relevant/ not a concern?

      Thank you for this interesting question. In our task, the initial position of the slider was randomized across trials, and participants were explicitly informed of this in the instructions. This design minimized stable anchoring effects across trials, as participants could not rely on a consistent starting point. Although anchoring might still have influenced individual trial responses, we believe it is unlikely that such effects systematically biased our results, since randomization would tend to cancel them out across trials. Additionally, prior research has shown that when multiple anchors are presented, anchoring effects are reduced if the anchors contradict each other (Switzer

      III & Sniezek, 1991). Therefore, we did not attempt to model potential anchoring effects. Nevertheless, future research could systematically manipulate slider starting positions to directly examine possible anchoring influences. In the revised manuscript, we have added a brief clarification (Page 11): “The initial position of the block was randomized across trials, which helped minimize stable anchoring effects across trials.”

      (3) Was there a real receiver who experienced the shocks and received compensation? I think it is not completely clear in the paper.

      We are sorry for not making this clear enough. The receiver was fictitious and did not actually exist. We have supplemented the Methods section with the following description (Page 12): “We told the participant a cover story that the receiver was played by another college student who was not present in the laboratory at the time. … In fact, the receiver did not actually exist.”.

      (4) What was the rationale behind not having participants meet the receiver?

      Thank you for this question. Having participants meet the receiver (i.e., the victim), played by a confederate, might have intensified their guilt and shame and produced a ceiling effect. In addition, the current approach simplified the experimental procedure and removed the need to recruit an additional confederate. These reasons have been added to the Methods section (Page 12): “Not having participants meet the receiver helped prevent excessive guilt and shame that might produce a ceiling effect, while also eliminating the need to recruit an additional confederate.”

      Minor edits:

      (1) Line 49: "the cognitive assessment triggers them", I think a word is missing.

      (2) Line 227: says 'Slide' instead of 'Slider'.

      (3) Lines 867/868: "No brain response showed significant correlation with responsibility-driven guilt sensitivity, harm-driven shame sensitivity, or responsibilitydriven shame sensitivity." I think it should be harm-driven guilt sensitivity, responsibility-driven guilt sensitivity, and harm-driven shame sensitivity.

      (4) Supplementary Information Line 12: I think there is a typo ( 'severs' instead of 'serves')

      We sincerely thank you for patiently pointing out these typos. We have corrected them accordingly. 

      (1) “the cognitive assessment triggers them” has been revised to “the cognitive antecedents that trigger them” (Page 2).

      (2) “SVO Slide Measure” has been revised to “SVO Slider Measure” (Page 8).

      (3) “No brain response showed significant correlation with responsibility-driven guilt sensitivity, harm-driven shame sensitivity, or responsibility-driven shame sensitivity." has been revised to “No brain response showed significant correlation with harm-driven guilt sensitivity, responsibility-driven guilt sensitivity, and harm-driven shame sensitivity.” (Page 35).

      (4) “severs” has been revised to “serves” (see Supplementary Information). In addition, we have carefully checked the entire manuscript to correct any remaining typographical errors.

      Reviewer #2 (Recommendations for the authors):

      The statement that trait gratitude and SVO were measured "for exploratory purposes" would benefit from further clarification regarding the specific questions being explored.

      Thank you for this valuable suggestion. In the revised manuscript, we have illustrated the exploratory purposes (Page 9): “We measured trait gratitude and SVO for exploratory purposes. Previous research has shown that both are linked to altruistic behavior, particularly in donation contexts (Van Lange et al., 2007; Yost-Dubrow & Dunham, 2018) and reciprocity contexts (Ma et al., 2017; Yost-Dubrow & Dunham, 2018). Here, we explored whether they also exert significant effects in a compensatory context.”

      In the Methods section, the authors state: "To confirm the relationships between κ and guilt-driven and shame-driven compensatory sensitivities, we calculated the Pearson correlations between them." However, the Results section reports linear regression results rather than Pearson correlation coefficients, suggesting a possible inconsistency. The authors are advised to carefully check and clarify the analysis approach used.

      We thank you for the careful reviewing and apologize for this mistake. We used a linear mixed-effects regression instead of Pearson correlations for the analysis. The mistake has been revised (Page 25): “To confirm the relationships between κ and guiltdriven and shame-driven compensatory sensitivities, we conducted a linear mixedeffects regression. κ was regressed onto guilt-driven and shame-driven compensatory sensitivities, with participant-specific random intercepts and random slopes for each fixed effect included as random effects.”

      A more detailed discussion of how the current findings inform the regulation of guilt and shame would further strengthen the contribution of this study.

      Thank you for this suggestion. We have added a paragraph discussing the implications for the regulation of guilt and shame (Pages 48 and 49): “Our study has potential practical implications. The behavioral findings may help counselors understand how cognitive interventions targeting perceptions of harm and responsibility could influence experiences of guilt and shame. The neural findings highlight specific brain regions (e.g., TPJ) as potential intervention targets for regulating these emotions. Given the close links between guilt, shame, and various psychological disorders (e.g., Kim et al., 2011; Lee et al., 2001; Schuster et al., 2021), strategies to regulate these emotions may contribute to symptom alleviation. Nevertheless, because this study was conducted with healthy adults, caution is warranted when considering applications to other populations.”

      As fMRI provides only correlational evidence, establishing a causal link between neural activity and guilt- or shame-related cognition and behavior would require brain stimulation or other intervention-based methods. This may represent a promising direction for future research.

      Thank you for this advice. We also agree that it is important for future research to establish the causal relationships between the observed brain activity, psychological processes, and behavior. We have added a corresponding discussion in the revised manuscript (Pages 47 and 48): “… fMRI cannot establish causality. Future studies using brain stimulation techniques (e.g., transcranial magnetic stimulation) are needed to clarify the causal role of brain regions in guilt-driven and shame-driven altruistic behavior.”

      Reviewer #3 (Recommendations for the authors):

      It was mentioned that emotions beyond guilt and shame, such as indebtedness, may also drive compensation. Were any additional types of emotion measured in the study?

      Thank you for this question. We did not explicitly measure emotions other than guilt and shame. However, the parameter κ from our winning computational model captures the combined influence of various psychological processes on compensation, which may reflect the impact of emotions beyond guilt and shame (e.g., indebtedness). We acknowledge that measuring other emotions similar to guilt and shame may help to better understand their distinct contributions. This point has been added into the revised manuscript (Page 48): “… we did not explicitly measure emotions similar to guilt and shame (e.g., indebtedness), which would have been helpful for understanding their distinct contributions.”

      The experimental task is complicated, raising the question of whether participants fully understood the instructions. For instance, one participant's compensation amount was zero. Could this reflect a misunderstanding of the task instructions?

      Thanks a lot for this question. In our study, after reading the instructions, participants were required to complete a comprehension test on the experimental rules. If they made any mistakes, the experimenter provided additional explanations. Only after participants fully understood the rules and correctly answered all comprehension questions did they proceed to the main experimental task. We have clarified this procedure in the revised manuscript (Page 13): “Participants did not proceed to the interpersonal game until they had fully understood the experimental rules and passed a comprehension test.”

      Making identical choices across different trials does not necessarily indicate that participants misunderstood the rules. Similar patterns, where participants made the same choices across trials, have also been observed in previous studies (Zhong et al., 2016; Zhu et al., 2021).

      Reference

      Cohen, T. R., Wolf, S. T., Panter, A. T., & Insko, C. A. (2011). Introducing the GASP scale: a new measure of guilt and shame proneness. Journal of Personality and Social Psychology, 100(5), 947–966. https://doi.org/10.1037/a0022641

      Esterman, M., Tamber-Rosenau, B. J., Chiu, Y. C., & Yantis, S. (2010). Avoiding nonindependence in fMRI data analysis: Leave one subject out. NeuroImage, 50(2), 572–576. https://doi.org/10.1016/j.neuroimage.2009.10.092

      Kim, S., Thibodeau, R., & Jorgensen, R. S. (2011). Shame, guilt, and depressive symptoms: A meta-analytic review. Psychological Bulletin, 137(1), 68. https://doi.org/10.1037/a0021466

      Lee, D. A., Scragg, P., & Turner, S. (2001). The role of shame and guilt in traumatic events: A clinical model of shame-based and guilt-based PTSD. British Journal of Medical Psychology, 74(4), 451–466. https://doi.org/10.1348/000711201161109

      Ma, L. K., Tunney, R. J., & Ferguson, E. (2017). Does gratitude enhance prosociality?: A meta-analytic review. Psychological Bulletin, 143(6), 601–635. https://doi.org/10.1037/bul0000103

      Michl, P., Meindl, T., Meister, F., Born, C., Engel, R. R., Reiser, M., & Hennig-Fast, K. (2014). Neurobiological underpinnings of shame and guilt: A pilot fMRI study. Social Cognitive and Affective Neuroscience, 9(2), 150–157.

      Schuster, P., Beutel, M. E., Hoyer, J., Leibing, E., Nolting, B., Salzer, S., Strauss, B., Wiltink, J., Steinert, C., & Leichsenring, F. (2021). The role of shame and guilt in social anxiety disorder. Journal of Affective Disorders Reports, 6, 100208. https://doi.org/10.1016/j.jadr.2021.100208

      Shen, B., Chen, Y., He, Z., Li, W., Yu, H., & Zhou, X. (2023). The competition dynamics of approach and avoidance motivations following interpersonal transgression. Proceedings of the National Academy of Sciences, 120(40), e2302484120. https://doi.org/10.1073/pnas.230248412

      Switzer III, F. S., & Sniezek, J. A. (1991). Judgment processes in motivation: Anchoring and adjustment effects on judgment and behavior. Organizational Behavior and Human Decision Processes, 49(2), 208–229. https://doi.org/10.1016/0749-5978(91)90049-Y

      Van Lange, P. A. M., Bekkers, R., Schuyt, T. N. M., & Van Vugt, M. (2007). From games to giving: Social value orientation predicts donations to noble causes. Basic and Applied Social Psychology, 29(4), 375–384. https://doi.org/10.1080/01973530701665223

      Velotti, P., Elison, J., & Garofalo, C. (2014). Shame and aggression: Different trajectories and implications. Aggression and Violent Behavior, 19(4), 454–461. https://doi.org/10.1016/j.avb.2014.04.011

      Wagner, U., N’Diaye, K., Ethofer, T., & Vuilleumier, P. (2011). Guilt-specific processing in the prefrontal cortex. Cerebral Cortex, 21(11), 2461–2470. https://doi.org/10.1093/cercor/bhr016

      Wu, X., Ren, X., Liu, C., & Zhang, H. (2024). The motive cocktail in altruistic behaviors. Nature Computational Science, 4, 659–676. https://doi.org/10.1038/s43588-024-00685-6

      Xu, J. (2022). The impact of guilt and shame in charity advertising: The role of self- construal. Journal of Philanthropy and Marketing, 27(1). https://doi.org/10.1002/nvsm.1709

      Yost-Dubrow, R., & Dunham, Y. (2018). Evidence for a relationship between trait gratitude and prosocial behaviour. Cognition and Emotion, 32(2), 397–403. https://doi.org/10.1080/02699931.2017.1289153

      Yu, H., Gao, X., Zhou, Y., & Zhou, X. (2018). Decomposing gratitude: Representation and integration of cognitive antecedents of gratitude in the brain. Journal of Neuroscience, 38(21), 4886–4898. https://doi.org/10.1523/JNEUROSCI.2944-17.2018

      Zhong, S., Chark, R., Hsu, M., & Chew, S. H. (2016). Computational substrates of social norm enforcement by unaffected third parties. NeuroImage, 129, 95–104. https://doi.org/10.1016/j.neuroimage.2016.01.040

      Zhu, R., Feng, C., Zhang, S., Mai, X., & Liu, C. (2019). Differentiating guilt and shame in an interpersonal context with univariate activation and multivariate pattern analyses. NeuroImage, 186, 476486. https://doi.org/10.1016/j.neuroimage.2018.11.012

      Zhu, R., Xu, Z., Su, S., Feng, C., Luo, Y., Tang, H., Zhang, S., Wu, X., Mai, X., & Liu, C. (2021). From gratitude to injustice: Neurocomputational mechanisms of gratitude-induced injustice. NeuroImage, 245, 118730. https://doi.org/10.1016/j.neuroimage.2021.118730

    1. Author Response:

      Reviewer #1 (Public Review):

      The work by Wang et al. examined how task-irrelevant, high-order rhythmic context could rescue the attentional blink effect via reorganizing items into different temporal chunks, as well as the neural correlates. In a series of behavioral experiments with several controls, they demonstrated that the detection performance of T2 was higher when occurring in different chunks from T1, compared to when T1 and T2 were in the same chunk. In EEG recordings, they further revealed that the chunk-related entrainment was significantly correlated with the behavioral effect, and the alpha-band power for T2 and its coupling to the low-frequency oscillation were also related to behavioral effect. They propose that the rhythmic context implements a second-order temporal structure to the first-order regularities posited in dynamic attention theory.

      Overall, I find the results interesting and convincing, particularly the behavioral part. The manuscript is clearly written and the methods are sound. My major concerns are about the neural part, i.e., whether the work provides new scientific insights to our understanding of dynamic attention and its neural underpinnings.

      1) A general concern is whether the observed behavioral related neural index, e.g., alpha-band power, cross-frequency coupling, could be simply explained in terms of ERP response for T2. For example, when the ERP response for T2 is larger for between-chunk condition compared to within-chunk condition, the alpha-power for T2 would be also larger for between-chunk condition. Likewise, this might also explain the cross-frequency coupling results. The authors should do more control analyses to address the possibility, e.g., plotting the ERP response for the two conditions and regressing them out from the oscillatory index.

      Many thanks for the comment. In short, the enhancement in alpha power and cross-frequency coupling results in the between-cycle condition compared with those in the within-cycle condition cannot be accounted for by the ERP responses for T2.

      In general, the rhythmic stimulation in the AB paradigm prevents EEG signals from returning to the baseline. Therefore, we cannot observe typical ERP components purely related to individual items, except for the P1 and N1 components related to the stream onset, which reveals no difference between the two conditions and are trailed by steady-state responses (SSRs) resonating at the stimulus rate (Fig. R1).

      Fig. R1. ERPs aligned to stream onset. EEG signals were filtered between 1–30 Hz, baseline-corrected (-200 to 0 ms before stream onset) and averaged across the electrodes in left parieto-occipital area where 10-Hz alpha power showed attentional modulation effect.

      To further inspect the potential differences in the target-related ERP signals between the within- and between-cycle conditions, we plotted the target-aligned waveforms for these experimental conditions. As shown in Fig. R2, a drop of ERP amplitude occurred for both conditions around T2 onset, and the difference between these two conditions was not significant (paired t-test estimated on mean amplitude every 20 ms from 0 to 700 ms relative to T1 onset, p > .05, FDR-corrected).

      Fig. R2. ERPs aligned to T1 onset. EEG signals were filtered between 1–30 Hz, and baseline-corrected using signals -100 to 0 ms before T1 onset. The two dash lines indicate the onset of T1 and T2, respectively.

      Since there is a trend of enhanced ERP response for the between-cycle relative to the within-cycle condition during the period of 0 to 100 ms after T2 onset (paired t-test on mean amplitude, p =.065, uncorrected), we then directly examined whether such post-T2 responses contribute to the behavioral attentional modulation effect and behavior-related neural indices. Crucially, we did not find any significant correlation of such T2-related ERP enhancement with the behavioral modulation index (BMI), or with the reported effects of alpha power and cross-frequency coupling (PAC). Furthermore, after controlling for the T2-related ERP responses, there still remains a significant correlation between the delta-alpha PAC and the BMI (rpartial = .596, p = .019), which is not surprising given that the PAC is calculated based on an 800-ms time window covering more pre-T2 than post-T2 periods (see the response to point #4 for details) rather than around the T2 onset. Taken together, these results clearly suggest that the T2-related ERP responses cannot explain the attentional modulation effect and the observed behavior-related neural indices.

      2) The alpha-band increase for T2 is indeed contradictory to the well known inhibitory function of alpha-band in attention. How could a target that is better discriminated elicit stronger inhibitory response? Related to the above point, the observed enhancement in alpha-band power and its coupling to low-frequency oscillation might derive from an enhanced ERP response for T2 target.

      Many thanks for the comment. We have briefly discussed this point in the revised manuscript (page 18, line 477).

      A widely accepted function of alpha activity in attention is that alpha oscillations suppress irrelevant visual information during spatial selection (Kelly et al., 2006; Thut et al., 2006; Worden et al., 2000). However, it becomes a controversial issue when there exists rhythmic sensory stimulation at alpha-band, just like the situation in the current study where both the visual stream and the contextual auditory rhythm were emitted at 10 Hz. In such a case, alpha-band neural responses at the stimulation frequency can be interpreted as either passively evoked steady-state responses (SSR) or actively synchronized intrinsic brain rhythms. From the former perspective (i.e., the SSR view), an increase in the amplitude or power at the stimulus frequency may indicate an enhanced attentional allocation to the stimulus stream that may result in better target detection (Janson et al., 2014; Keil et al., 2006; Müller & Hübner, 2002). Conversely, the latter view of the inhibitory function of intrinsic alpha oscillations would produce the opposite prediction. In a previous AB study, Janson and colleagues (2014) investigated this issue by separating the stimulus-evoked activity at 12 Hz (using the same power analysis method as ours) from the endogenous alpha oscillations ranging from 10.35 to 11.25 Hz (as indexed by individual alpha frequency, IAF). Interestingly, they found a dissociation between these two alpha-band neural responses, showing that the RSVP frequency power was higher in non-AB trials (T2 detected) than in AB trials (T2 undetected) while the IAF power exhibited the opposite pattern. According to these findings, the currently observed increase in alpha power for the between-cycle condition may reflect more of the stimulus-driven processes related to attentional enhancement. However, we don’t negate the effect of intrinsic alpha oscillations in our study, as the current design is not sufficient to distinguish between these two processes. We have discussed this point in the revised manuscript (page 18, line 477). Also, we have to admit that “alpha power” may not be the most precise term to describe our findings of the stimulus-related results. Thus, we have specified it as “neural responses to first-order rhythms at 10 Hz” and “10-Hz alpha power” in the revised manuscript (see page 12 in the Results section and page 18 in the Discussion section).

      As for the contribution of T2-related ERP response to the observed effect of 10 Hz power and cross-frequency coupling, please refer to our response to point #1.

      References:

      Janson, J., De Vos, M., Thorne, J. D., & Kranczioch, C. (2014). Endogenous and Rapid Serial Visual Presentation-induced Alpha Band Oscillations in the Attentional Blink. Journal of Cognitive Neuroscience, 26(7), 1454–1468. https://doi.org/10.1162/jocn_a_00551

      Keil, A., Ihssen, N., & Heim, S. (2006). Early cortical facilitation for emotionally arousing targets during the attentional blink. BMC Biology, 4(1), 23. https://doi.org/10.1186/1741-7007-4-23

      Kelly, S. P., Lalor, E. C., Reilly, R. B., & Foxe, J. J. (2006). Increases in Alpha Oscillatory Power Reflect an Active Retinotopic Mechanism for Distracter Suppression During Sustained Visuospatial Attention. Journal of Neurophysiology, 95(6), 3844–3851. https://doi.org/10.1152/jn.01234.2005

      Müller, M. M., & Hübner, R. (2002). Can the Spotlight of Attention Be Shaped Like a Doughnut? Evidence From Steady-State Visual Evoked Potentials. Psychological Science, 13(2), 119–124. https://doi.org/10.1111/1467-9280.00422

      Thut, G., Nietzel, A., Brandt, S., & Pascual-Leone, A. (2006). Alpha-band electroencephalographic activity over occipital cortex indexes visuospatial attention bias and predicts visual target detection. The Journal of Neuroscience : The Official Journal of the Society for Neuroscience, 26(37), 9494–9502. https://doi.org/10.1523/JNEUROSCI.0875-06.2006

      Worden, M. S., Foxe, J. J., Wang, N., & Simpson, G. V. (2000). Anticipatory Biasing of Visuospatial Attention Indexed by Retinotopically Specific α-Bank Electroencephalography Increases over Occipital Cortex. Journal of Neuroscience, 20(6), RC63–RC63. https://doi.org/10.1523/JNEUROSCI.20-06-j0002.2000

      3) To support that it is the context-induced entrainment that leads to the modulation in AB effect, the authors could examine pre-T2 response, e.g., alpha-power, and cross-frequency coupling, as well as its relationship to behavioral performance. I think the pre-stimulus response might be more convincing to support the authors' claim.

      Many thanks for the insightful suggestion. We have conducted additional analyses.

      Following this suggestion, we have examined the 10-Hz alpha power within the time window of -100–0 ms before T2 onset and found stronger activity for the between-cycle condition than for the within-cycle condition. This pre-T2 response is similar to the post-T2 response except that it is more restricted to the left parieto-occipital cluster (CP3, CP5, P3, P5, PO3, PO5, POZ, O1, OZ, t(15) = 2.774, p = .007), which partially overlaps with the cluster that exhibits a delta-alpha coupling effect significantly correlated with the BMI. We have incorporated these findings into the main text (page 12, line 315) and the Fig. 5A of the revised manuscript.

      As for the coupling results reported in our manuscript, the coupling index (PAC) was calculated based on the activity during the second and third cycles (i.e., 400 to 1200 ms from stream onset) of the contextual rhythm, most of which covers the pre-T2 period as T2 always appeared in the third cycle for both conditions. Together, these results on pre-T2 10-Hz alpha power and cross-frequency coupling, as well as its relationship to behavioral performance, jointly suggest that the observed modulation effect is caused by the context-induced entrainment rather than being a by-product of post-T2 processing.

      4) About the entrainment to rhythmic context and its relation to behavioral modulation index. Previous studies (e.g., Ding et al) have demonstrated the hierarchical temporal structure in speech signals, e.g., emergence of word-level entrainment introduced by language experience. Therefore, it is well expected that imposing a second-order structure on a visual stream would elicit the corresponding steady-state response. I understand that the new part and main focus here are the AB effects. The authors should add more texts explaining how their findings contribute new understandings to the neural mechanism for the intriguing phenomena.

      Many thanks for the suggestion. We have provided more discussion in the revised manuscript (page 17, line 447).

      We have provided more discussion on this important issue in the revised manuscript (page 17, line 447). In brief, our study demonstrates how cortical tracking of feature-based hierarchical structure reframes the deployment of attentional resources over visual streams. This effect, distinct from the hierarchical entrainment to speech signals (Ding et al., 2016; Gross et al., 2013), does not rely on previously acquired knowledge about the structured information and can be established automatically even when the higher-order structure comes from a task-irrelevant and cross-modal contextual rhythm. On the other hand, our finding sheds fresh light on the adaptive value of the structure-based entrainment effect by expanding its role from rhythmic information (e.g., speech) perception to temporal attention deployment. To our knowledge, few studies have tackled this issue in visual or speech processing.

      References:

      Ding, N., Melloni, L., Zhang, H., Tian, X., & Poeppel, D. (2016). Cortical tracking of hierarchical linguistic structures in connected speech. Nature Neuroscience, 19(1), 158–164. https://doi.org/10.1038/nn.4186

      Gross, J., Hoogenboom, N., Thut, G., Schyns, P., Panzeri, S., Belin, P., & Garrod, S. (2013). Speech Rhythms and Multiplexed Oscillatory Sensory Coding in the Human Brain. PLoS Biol, 11(12). https://doi.org/10.1371/journal.pbio.1001752

      Reviewer #2 (Public Review):

      In cognitive neuroscience, a large number of studies proposed that neural entrainment, i.e., synchronization of neural activity and low-frequency external rhythms, is a key mechanism for temporal attention. In psychology and especially in vision, attentional blink is the most established paradigm to study temporal attention. Nevertheless, as far as I know, few studies try to link neural entrainment in the cognitive neuroscience literature with attentional blink in the psychology literature. The current study, however, bridges this gap.

      The study provides new evidence for the dynamic attending theory using the attentional blink paradigm. Furthermore, it is shown that neural entrainment to the sensory rhythm, measured by EEG, is related to the attentional blink effect. The authors also show that event/chunk boundaries are not enough to modulate the attentional blink effect, and suggest that strict rhythmicity is required to modulate attention in time.

      In general, I enjoyed reading the manuscript and only have a few relatively minor concerns.

      1) Details about EEG analysis.

      . First, each epoch is from -600 ms before the stimulus onset to 1600 ms after the stimulus onset. Therefore, the epoch is 2200 s in duration. However, zero-padding is needed to make the epoch duration 2000 s (for 0.5-Hz resolution). This is confusing. Furthermore, for a more conservative analysis, I recommend to also analyze the response between 400 ms and 1600 ms, to avoid the onset response, and show the results in a supplementary figure. The short duration reduces the frequency resolution but still allows seeing a 2.5-Hz response.

      Thanks for the comments. Each epoch was indeed segmented from -600 to 1600 ms relative to the stimulus onset, but in the spectrum analysis, we only used EEG signals from stream onset (i.e., time point 0) to 1600 ms (see the Materials and Methods section) to investigate the oscillatory characteristics of the neural responses purely elicited by rhythmic stimuli. The 1.6-s signals were zero-padded into a 2-s duration to achieve a frequency resolution of 0.5 Hz.

      According to the reviewer’s suggestion, we analyzed the EEG signals from 400 ms to 1600 ms relative to stream onset to avoid potential influence of the onset response, and showed the results in Figure 4. Basically, we can still observe spectral peaks at the stimulus frequencies of 2.5, 5 (the harmonic of 2.5 Hz), and 10 Hz for both power and ITPC spectrum. However, the peak magnitudes were much weaker than those of 1.6-s signals especially for 2.5 Hz, and the 2.5-Hz power did not survive the multiple comparisons correction across frequencies (FDR threshold of p < .05), which might be due to the relatively low signal-to-noise ratio for the analysis based on the 1.2-s epochs (only three cycles to estimate the activity at 2.5 Hz). Importantly, we did identify a significant cluster for 2.5 Hz ITPC in the left parieto-occipital region showing a positive correlation with the individuals’ BMI (Fig. R3; CP5, TP7, P5, P7, PO5, PO7, O1; r = .538, p = .016), which is consistent with the findings based on the longer epochs.

      Fig. R3. Neural entrainment to contextual rhythms during the period of 400–1600 ms from stream onset. (A) The spectrum for inter-trial phase coherence (ITPC) of EEG signals from 400 to 1600 ms after the stimulus onset. Shaded areas indicate standard errors of the mean. (B) The 2.5-Hz ITPC was significantly correlated with the behavioral modulation index (BMI) in a parieto-occipital cluster, as indicated by orange stars in the scalp topographic map.

      Second, "The preprocessed EEG signals were first corrected by subtracting the average activity of the entire stream for each epoch, and then averaged across trials for each condition, each participant, and each electrode." I have several concerns about this procedure.

      (A) What is the entire stream? It's the average over time?

      Yes, as for the power spectrum analysis, EEG signals were first demeaned by subtracting the average signals of the entire stream over time from onset to offset (i.e., from 0 to 1600 ms) before further analysis. We performed this procedure following previous studies on the entrainment to visual rhythms (Spaak et al., 2014). We have clarified this point in the “Power analysis” part of the Materials and Methods section (page 25, line 677).

      References:

      Spaak, E., Lange, F. P. de, & Jensen, O. (2014). Local Entrainment of Alpha Oscillations by Visual Stimuli Causes Cyclic Modulation of Perception. The Journal of Neuroscience, 34(10), 3536–3544. https://doi.org/10.1523/JNEUROSCI.4385-13.2014

      (B) I suggest to do the Fourier transform first and average the spectrum over participants and electrodes. Averaging the EEG waveforms require the assumption that all electrodes/participants have the same response phase, which is not necessarily true.

      Thanks for the suggestion. In an AB paradigm, the evoked neural responses are sufficiently time-locked to the periodic stimulation, so it is reasonable to quantify power estimate with spectral decomposition performed on trial-averaged EEG signals (i.e., evoked power). Moreover, our results of inter-trial phase coherence (ITPC), which estimated the phase-locking value across trials based on single-trial decomposed phase values, also provided supporting evidence that the EEG waveforms were temporally locked across trials to the 2.5-Hz temporal structure in the context session.

      Nevertheless, we also took the reviewer’s suggestion seriously and analyzed the power spectrum on the average of single-trial spectral transforms, i.e., the induced power, which puts emphasis on the intrinsic non-phase-locked activities. In line with the results of evoked power and ITPC, the induced power spectrum in context session also peaked at 2.5 Hz and was significantly stronger than that in baseline session at 2.5 Hz (t(15) = 4.186, p < .001, FDR-corrected with a p value threshold < .001). Importantly, Person correlation analysis also revealed a positive cluster in the left parieto-occipital region, indicating the induced power at 2.5 Hz also had strong relevance with the attentional modulation effect (P7, PO7, PO5, PO3; r = .606, p = .006). We have added these additional findings to the revised manuscript (page 11, line 288; see also Figure 4—figure supplement 1).

      2) The sequences are short, only containing 16 items and 4 cycles. Furthermore, the targets are presented in the 2nd or 3rd cycle. I suspect that a stronger effect may be observed if the sequence are longer, since attention may not well entrain to the external stimulus until a few cycles. In the first trial of the experiment, they participant may not have a chance to realize that the task-irrelevant auditory/visual stimulus has a cyclic nature and it is not likely that their attention will entrain to such cycles. As the experiment precedes, they learns that the stimulus is cyclic and may allocate their attention rhythmically. Therefore, I feel that the participants do not just rely on the rhythmic information within a trial but also rely on the stimulus history. Please discuss why short sequences are used and whether it is possible to see buildup of the effect over trials or over cycles within a trial.

      Thanks for the comments. Typically, to induce a classic pattern of AB effect, the RSVP stream should contain 3–7 distractors before the first target (T1), with varying lengths of distractors (0–7) between two targets and at least 2 items after the second target (T2). In our study, we created the RSVP streams following these rules, which allowed us to observe the typical AB effect that T2 performance was deteriorated at Lag 2 relative to that at Lag 8. Nevertheless, we agree with the reviewer that longer streams would be better for building up the attentional entrainment effect, as we did observe the attentional modulation effect ramped up as the stream proceeded over cycles, consistent with the reviewer’s speculation. In Experiments 1a (using auditory context) and 2a (using color-defined visual context), we adopted two sets of target positions—an early one where T2 appeared at the 6th or 8th position (in the 2nd cycle) of the visual stream, and a late one where T2 appeared at the 10th or 12th position (in the 3rd cycle) of the visual stream. In the manuscript, we reported T2 performance with all the target positions combined, as no significant interaction was found between the target positions and the experimental conditions (ps. > .1). However, additional analysis demonstrated a trend toward an increase of the attentional modulation effect over cycles, from the early to the late positions. As shown in Fig. R4, the modulation effect went stronger and reached significance for the late positions (for Experiment 1a, t(15) = 2.83, p = .013, Cohen’s d = 0.707; for Experiment 2a, t(15) = 3.656, p = .002, Cohen’s d = 0.914) but showed a weaker trend for the early positions (for Experiment 1a, t(15) = 1.049, p = .311, Cohen’s d = 0.262; for Experiment 2a, t(15) = .606, p = .553, Cohen’s d = 0.152).

      Fig. R4. Attentional modulation effect built up over cycles in Experiments 1a & 2a. Error bars represent 1 SEM; * p<0.05, ** p<0.01.

      However, we did not observe an obvious buildup effect across trials in our study. The modulation effect of contextual rhythms seems to be a quick process that the effect is evident in the first quarter of trials in Experiment 1a (for, t(15) = 2.703, p = .016, Cohen’s d = 0.676) and in the second quarter of trials in Experiment 2a (for, t(15) = 2.478, p = .026, Cohen’s d = 0.620.

      3) The term "cycle" is used without definition in Results. Please define and mention that it's an abstract term and does not require the stimulus to have "cycles".

      Thanks for the suggestion. By its definition, the term “cycle” refers to “an interval of time during which a sequence of a recurring succession of events or phenomena is completed” or “a course or series of events or operations that recur regularly and usually lead back to the starting point” (Merriam-Webster dictionary). In the current study, we stuck to the recurrent and regular nature of “cycle” in general while defined the specific meaning of “cycle” by feature-based periodic changes of the contextual stimuli in each experiment (page 5, line 101; also refer to Procedures in the Materials and Methods section for details). For example, in Experiment 1a, the background tone sequence changed its pitch value from high to low or vice versa isochronously at a rate of 2.5 Hz, thus forming a rhythmic context with structure-based cycles of 400 ms. Note that we did not use the more general term “chunk”, because arbitrary chunks without the regularity of cycles are insufficient to trigger the attentional modulation effect in the current study. Indeed, the effect was eliminated when we replaced the rhythmic cycles with irregular chunks (Experiments 1d & 1e).

      4) Entrainment of attention is not necessarily related to neural entrainment to sensory stimulus, and there is considerable debate about whether neural entrainment to sensory stimulus should be called entrainment. Too much emphasis on terminology is of course counterproductive but a short discussion on these issues is probably necessary.

      Thanks for the comments. As commonly accepted, entrainment is defined as the alignment of intrinsic neuronal activity to the temporal structure of external rhythmic inputs (Lakatos et al., 2019; Obleser & Kayser, 2019). Here, we are interested in the functional roles of cortical entrainment to the higher-order temporal structure imposed on first-order sensory stimulation, and used the term entrainment to describe the phase-locking neural responses to such hierarchical structure following literature on auditory and visual perception (Brookshire et al., 2017; Doelling & Poeppel, 2015). In our study, the consistent results of power and ITPC have provided strong evidence that neural entrainment at the structure level (2.5 Hz) is significantly correlated with the observed attentional modulation effect. However, this does not mean that the entrainment of attention is necessarily associated with neural entrainment to sensory stimulus in a broader context, as attention may also be guided by predictions based on non-isochronous temporal regularity without requiring stimulus-based oscillatory entrainment (Breska & Deouell, 2017; Morillon et al._2016).

      On the other hand, there has been a debate about whether the neural alignment to rhythmic stimulation reflects active entrainment of endogenous oscillatory processes (i.e., induced activity) or a series of passively evoked steady-state responses (Keitel et al., 2019; Notbohm et al., 2016; Zoefel et al., 2018). The latter process is also referred to as “entrainment in a broad sense” by Obleser & Kayser (2019). Given that a presented rhythm always evokes event-related potentials, a better question might be whether the observed alignment reflects the entrainment of endogenous oscillations in addition to evoked steady-state responses. Here we attempted to tackle this issue by measuring the induced power, which emphasizes the intrinsic non-phase-locked activity, in addition to the phase-locked evoked power. Specifically, we quantified these two kinds of activities with the average of single-trial EEG power spectra and the power spectra of trial-averaged EEG signals, respectively, according to Keitel et al. (2019). In addition to the observation of evoked responses to the contextual structure, we also demonstrated an attention-related neural tracking of the higher-order temporal structure based on the induced power at 2.5 Hz (see Figure 4—figure supplement 1), suggesting that the observed attentional modulation effect is at least partially derived from the entrainment of intrinsic oscillatory brain activity. We have briefly discussed this point in the revised manuscript (page 17, line 460).

      References:

      Breska, A., & Deouell, L. Y. (2017). Neural mechanisms of rhythm-based temporal prediction: Delta phase-locking reflects temporal predictability but not rhythmic entrainment. PLOS Biology, 15(2), e2001665. https://doi.org/10.1371/journal.pbio.2001665

      Brookshire, G., Lu, J., Nusbaum, H. C., Goldin-Meadow, S., & Casasanto, D. (2017). Visual cortex entrains to sign language. Proceedings of the National Academy of Sciences, 114(24), 6352–6357. https://doi.org/10.1073/pnas.1620350114

      Doelling, K. B., & Poeppel, D. (2015). Cortical entrainment to music and its modulation by expertise. Proceedings of the National Academy of Sciences, 112(45), E6233–E6242. https://doi.org/10.1073/pnas.1508431112

      Henry, M. J., Herrmann, B., & Obleser, J. (2014). Entrained neural oscillations in multiple frequency bands comodulate behavior. Proceedings of the National Academy of Sciences, 111(41), 14935–14940. https://doi.org/10.1073/pnas.1408741111

      Keitel, C., Keitel, A., Benwell, C. S. Y., Daube, C., Thut, G., & Gross, J. (2019). Stimulus-Driven Brain Rhythms within the Alpha Band: The Attentional-Modulation Conundrum. The Journal of Neuroscience, 39(16), 3119–3129. https://doi.org/10.1523/JNEUROSCI.1633-18.2019

      Lakatos, P., Gross, J., & Thut, G. (2019). A New Unifying Account of the Roles of Neuronal Entrainment. Current Biology, 29(18), R890–R905. https://doi.org/10.1016/j.cub.2019.07.075

      Morillon, B., Schroeder, C. E., Wyart, V., & Arnal, L. H. (2016). Temporal Prediction in lieu of Periodic Stimulation. Journal of Neuroscience, 36(8), 2342–2347. https://doi.org/10.1523/JNEUROSCI.0836-15.2016

      Notbohm, A., Kurths, J., & Herrmann, C. S. (2016). Modification of Brain Oscillations via Rhythmic Light Stimulation Provides Evidence for Entrainment but Not for Superposition of Event-Related Responses. Frontiers in Human Neuroscience, 10. https://doi.org/10.3389/fnhum.2016.00010

      Obleser, J., & Kayser, C. (2019). Neural Entrainment and Attentional Selection in the Listening Brain. Trends in Cognitive Sciences, 23(11), 913–926. https://doi.org/10.1016/j.tics.2019.08.004

      Zoefel, B., ten Oever, S., & Sack, A. T. (2018). The Involvement of Endogenous Neural Oscillations in the Processing of Rhythmic Input: More Than a Regular Repetition of Evoked Neural Responses. Frontiers in Neuroscience, 12. https://doi.org/10.3389/fnins.2018.00095

      Reviewer #3 (Public Review):

      The current experiment tests whether the attentional blink is affected by higher-order regularity based on rhythmic organization of contextual features (pitch, color, or motion). The results show that this is indeed the case: the AB effect is smaller when two targets appeared in two adjacent cycles (between-cycle condition) than within the same cycle defined by the background sounds. Experiment 2 shows that this also holds for temporal regularities in the visual domain and Experiment 3 for motion. Additional EEG analysis indicated that the findings obtained can be explained by cortical entrainment to the higher-order contextual structure. Critically feature-based structure of contextual rhythms at 2.5 Hz was correlated with the strength of the attentional modulation effect.

      This is an intriguing and exciting finding. It is a clever and innovative approach to reduce the attention blink by presenting a rhythmic higher-order regularity. It is convincing that this pulling out of the AB is driven by cortical entrainment. Overall, the paper is clear, well written and provides adequate control conditions. There is a lot to like about this paper. Yet, there are particular concerns that need to be addressed. Below I outline these concerns:

      1) The most pressing concern is the behavioral data. We have to ensure that we are dealing here with a attentional blink. The way the data is presented is not the typical way this is done. Typically in AB designs one see the T2 performance when T1 is ignored relative to when T1 has to be detected. This data is not provided. I am not sure whether this data is collected but if so the reader should see this.

      Many thanks for the suggestion. We appreciate the reviewer for his/her thoughtful comments. To demonstrate the AB effect, we did include two T2 lag conditions in our study (Experiments 1a, 1b, 2a, and 2b)—a short-SOA condition where T2 was located at the second lag of T1 (i.e., SOA = 200 ms), and a long-SOA condition where T2 appeared at the 8th lag of T1 (i.e., SOA = 800 ms). In a typical AB effect, T2 performance at short lags is remarkably impaired compared with that at long lags. In our study, we consistently replicated this effect across the experiments, as reported in the Results section of Experiment 1 (page 5, line 106). Overall, the T2 detection accuracy conditioned on correct T1 response was significantly impaired in the short-SOA condition relative to that in the long-SOA condition (mean accuracy > 0.9 for all experiments), during both the context session and the baseline session. More crucially, when looking into the magnitude of the AB effect as measured by (ACClong-SOA - ACCshort-SOA)/ACClong-SOA, we still obtained a significant attentional modulation effect (for Experiment 1a, t(15) = -2.729, p = .016, Cohen’s d = 0.682; for Experiment 2a, t(15) = -4.143, p <.001, Cohen’s d = 1.036) similar to that reflected by the short-SOA condition alone, further confirming that cortical entrainment effectively influences the AB effect.

      Although we included both the long- and short-SOA conditions in the current study, we focused on T2 performance in the short-SOA condition rather than along the whole AB curve for the following reasons. Firstly, for the long-SOA conditions, the T2 performance is at ceiling level, making it an inappropriate baseline to probe the attentional modulation effect. We focused on Lag 2 because previous research has identified a robust AB effect around the second lag (Raymond et al., 1992), which provides a reasonable and sensitive baseline to probe the potential modulation effect of the contextual auditory and visual rhythms. Note that instead of using multiple lags, we varied the length of the rhythmic cycles (i.e., a cycle of 300 ms, 400 ms, and 500 ms corresponding to a rhythm frequency of 3.3 Hz, 2.5 Hz, and 2 Hz, respectively, all within the delta band), and showed that the attentional modulation effect could be generalized to these different delta-band rhythmic contexts, regardless of the absolute positions of the targets within the rhythmic cycles.

      As to the T1 performance, the overall accuracy was very high, ranging from 0.907 to 0.972, in all of our experiments. The corresponding results have been added to the Results section of the revised manuscript (page 5, line 103). Notably, we did not find T1-T2 trade-offs in most of our experiments, except in Experiment 2a where T1 performance showed a moderate decrease in the between-cycle condition relative to that in the within-cycle condition (mean ± SE: 0.888 ± 0.026 vs. 0.933 ± 0.016, respectively; t(15) = -2.217, p = .043). However, by examining the relationship between the modulation effects (i.e., the difference between the two experimental conditions) on T1 and T2, we did not find any significant correlation (p = .403), suggesting that the better performance for T2 was not simply due to the worse performance in detecting T1.

      Finally, previous studies have shown that ignoring T1 would lead to ceiling-level T2 performance (Raymond et al., 1992). Therefore, we did not include such manipulation in the current study, as in that case, it would be almost impossible for us to detect any contextual modulation effect.

      References:

      Raymond, J. E., Shapiro, K. L., & Arnell, K. M. (1992). Temporary suppression of visual processing in an RSVP task: An attentional blink? Journal of Experimental Psychology: Human Perception and Performance, 18(3), 849–860. https://doi.org/10.1037/0096-1523.18.3.849

      2) Also, there is only one lag tested. The ensure that we are dealing here with a true AB I would like to see that more than one lag is tested. In the ideal situation a full AB curve should be presented that includes several lags. This should be done for at least for one of the experiments. It would be informative as we can see how cortical entrainment affects the whole AB curve.

      Many thanks for the suggestion. Please refer to our response to the point #1 for “Reviewer #3 (Public Review)”. In short, we did include two T2 lag conditions in our study (Experiments 1a, 1b, 2a and 2b), and the results replicated the typical AB effect. We have clarified this point in the revised manuscript (page 5, line 106).

      3) Also, there is no data regarding T1 performance. It is important to show that this the better performance for T2 is not due to worse performance in detecting T1. So also please provide this data.

      Many thanks for the suggestion. Please refer to our response to the point #1 or “Reviewer #3 (Public Review)”. We have reported the T1 performance in the revised manuscript (page 5, line 103), and the results didn’t show obvious T1-T2 trade-offs.

      4) The authors identify the oscillatory characteristics of EEG signals in response to stimulus rhythms, by examined the FFT spectral peaks by subtracting the mean power of two nearest neighboring frequencies from the power at the stimulus frequency. I am not familiar with this procedure and would like to see some justification for using this technique.

      According to previous studies (Nozaradan, 2011; Lenc e al., 2018), the procedure to subtract the average amplitude of neighboring frequency bins can remove unrelated background noise, like muscle activity or eye movement. If there were no EEG oscillatory responses characteristic of stimulus rhythms, the amplitude at a given frequency bin should be similar to the average of its neighbors, and thus no significant peaks could be observed in the subtracted spectrum.

      References:

      Lenc, T., Keller, P. E., Varlet, M., & Nozaradan, S. (2018). Neural tracking of the musical beat is enhanced by low-frequency sounds. Proceedings of the National Academy of Sciences, 115(32), 8221–8226. https://doi.org/10.1073/pnas.1801421115

      Nozaradan, S., Peretz, I., Missal, M., & Mouraux, A. (2011). Tagging the Neuronal Entrainment to Beat and Meter. The Journal of Neuroscience, 31(28), 10234–10240. https://doi.org/10.1523/JNEUROSCI.0411-11.2011

    1. Author Response

      Summary:

      This work is of interest because it increases our understanding of the molecular mechanisms that distinguish subtypes of VIP interneurons in the cerebral cortex and because of the multiple ways in which the authors address the role of Prox1 in regulating synaptic function in these cells.

      The authors would like to thank the reviewers for their constructive comments. In response, we would like to clarify a number of issues, as well as outline how we plan to resolve major concerns.

      Reviewer #1:

      Stachiak and colleagues examine the physiological effects of removing the homeobox TF Prox1 from two subtypes of VIP neurons, defined on the basis of their bipolar vs. multipolar morphology.

      The results will be of interest to those in the field, since it is known from prior work that VIP interneurons are not a uniform class and that Prox1 is important for their development.

      The authors first show that selective removal of a conditional Prox1 allele using a VIP cre driver line results in a change in paired pulse ratio of presumptive excitatory synaptic responses in multipolar but not bipolar VIP interneurons. The authors then use RNA-seq to identify differentially expressed genes that might contribute and highlight a roughly two-fold reduction in the expression of a transcript encoding a trans-synaptic protein Elfn1 known to contribute to reduced glutamate release in Sst+ interneurons. They then test the potential contribution of Elfn1 to the phenotype by examining whether loss of one allele of Elfn1 globally alters facilitation. They find that facilitation is reduced both by this genetic manipulation and by a pharmacological blockade of presynaptic mGluRs known to interact with Elfn1.

      Although the results are interesting, and the authors have worked hard to make their case, the results are not definitive for several reasons:

      1) The global reduction of Elfn1 may act cell autonomously, or may have other actions in other cell types. The pharmacological manipulation is less subject to this interpretation, but these results are not as convincing as they could be because the multipolar Prox1 KO cells (Fig. 3 J) still show substantial facilitation comparable, for example to the multipolar control cells in the Elfn1 Het experiment (controls in Fig. 3E). This raises a concern about control for multiple comparisons. Instead of comparing the 6 conditions in Fig 3 with individual t-tests, it may be more appropriate to use ANOVA with posthoc tests controlled for multiple comparisons.

      The reviewer’s concerns regarding non-cell-autonomous actions of global Elfn1 KO are well founded. Significant phenotypic alterations have previously been reported, both in the physiology of SST neurons as well in the animals’ behavior (Stachniak, Sylwestrak, Scheiffele, Hall, & Ghosh, 2019; Tomioka et al., 2014). The homozygous Elfn1 KO mouse displays a hyperactive phenotype and epileptic activity after 3 months of age, suggesting generalcortical activity differences exist (Dolan & Mitchell, 2013; Tomioka et al., 2014). Nevertheless, we have not observed such changes in P17-21 Elfn1 heterozygous (Het) animals.

      Comparing across different experimental animal lines, for example the multipolar Prox1 KO cells (Fig. 3 J) to the multipolar control cells in the Elfn1 Het experiment (controls in Fig. 3E), is in our view not advisable. There is a plethora of examples in the literature on the effect of mouse strain on even the most basic cellular functions and hence it is always expected that researchers use the correct control animals for their experiments, which in the best case scenario are littermate controls. For these reasons, we would argue that statistical comparisons across mouse lines is not ideal for our study. Elfn1 Het and MSOP data are presented side by side to illustrate that Elfn1 Hets (3C,E) phenocopy the effects of Prox1 deletion (3G,H,I,J). (See also point 3) MSOP effect sizes, however, do show significant differences by ANOVA with Bonferroni post-hoc (normalized change in EPSC amplitude; multipolar prox1 control: +12.1 ± 3.8%, KO: -8.4 ± 4.3%, bipolar prox1 control: -5.2 ± 4.3%, KO: -3.4 ± 4.7%, cell type x genotype interaction, p= 0.02, two way ANOVA).

      2) The isolation of glutamatergic currents is not described. Were GABA antagonists present to block GABAergic currents? Especially with the Cs-based internal solutions used, chloride reversal potentials can be somewhat depolarized relative to the -65 mV holding potential. If IPSCs were included it would complicate the analysis.

      No, in fact GABA antagonists were not present in these experiments. The holding voltage in our evoked synaptic experiments is -70 mV, which combined with low internal [Cl-] makes it highly unlikely that the excitatory synaptic responses we study are contaminated by GABA-mediated ones, even with a Cs MeSO4-based solution. Nevertheless, we have now performed additional experiments where glutamate receptor blockers were applied in bath and we observe a complete blockade of the synaptic events at -70mV proving that they are AMPA/NMDA receptor mediated. When holding the cell at 0mV with these blockers present, outward currents were clearly visible, suggesting intact GABA-mediated events.

      3) The assumption that protein levels of Elfn1 are reduced to half in the het is untested. Synaptic proteins can be controlled at the level of translation and trafficking and WT may not have twice the level of this protein.

      We thank reviewer for pointing this out. Our rationale for using the Elfn1 heterozygous animals is rather that transcript levels are reduced by half in heterozygous animals, to match the reduction we found in the mRNA levels of VIP Prox1 KO cells (Fig 2). The principle purpose of the Elfn1 KO experiment was to determine whether the change in Elfn1 transcript levels could be sufficient to explain the synaptic deficit observed in VIP Prox1 KO cells. As the reviewer notes, translational regulation and protein trafficking could ultimately result in even larger changes than 0.5x protein levels at the synapse. This may ultimately explain the observed multipolar/bipolar disparity, which cannot be explained by transcriptional regulation alone (Fig 4).

      4) The authors are to be commended for checking whether Elfn1 is regulated by Prox1 only in the multipolar neurons, but unfortunately it is not. The authors speculate that the selective effects reflect a selective distribution of MgluR7, but without additional evidence it is hard to know how likely this explanation is.

      Additional experiments are underway to better understand this mechanism.

      Reviewer #2:

      Stachniak et al., provide an interesting manuscript on the postnatal role of the critical transcription factor, Prox1, which has been shown to be important for many developmental aspects of CGE-derived interneurons. Using a combination of genetic mouse lines, electrophysiology, FACS + RNAseq and molecular imaging, the authors provide evidence that Prox1 is genetically upstream of Elfn1. Moreover, they go on to show that loss of Prox1 in VIP+ cells preferentially impacts those that are multipolar but not the bipolar subgroup characterized by the expression of calretinin. This latter finding is very interesting, as the field is still uncovering how these distinct subgroups emerge but are at a loss of good molecular tools to fully uncover these questions. Overall, this is a great combination of data that uses several different approaches to come to the conclusions presented. I have suggestions that I think would strengthen the manuscript:

      1) Can the authors add a supplemental table showing the top 20-30 genes up and down regulated in their Prox1 KOS? This would make these, and additional, data more tenable to readers.

      We would be happy to provide supplementary tables with candidate genes at both P8 and P12.

      2) It is interesting that loss of Prox1 or Elfn1 leads to phenotypes in multipolar but are not present or mild in bipolar VIP+ cells. The authors test different hypotheses, which they are able to refute and discuss some ideas for how multipolar cells may be more affected by loss of Elfn1, even when the transcript is lost in both multipolar and bipolar after Prox1 deletion. If there is any way to expand upon these ideas experimentally, I believe it would greatly strengthen the manuscript. I understand there is no perfect experiment due to a lack of tools and reagents but if there is a way to develop one of the following ideas or something similar, it would be beneficial:

      We thank the reviewer for the note.

      a) Would it be possible to co-fill VIPCre labeled cells with biocytin and a retroviral tracer? Then, after the retroviral tracer had time to label a presynaptic cell, assess whether these were preferentially different between bipolar and multipolar cell types, the latter morphology determined by the biocytin fill? This would test whether each VIP+ subtype is differentially targeted.

      Although this is a very elegant experiment and we would be excited to do it, we do feel that single-cell rabies virus tracing is technically very challenging and will take many months to troubleshoot before being able to acquire good data. Hence, we think it is beyond the scope of this study.

      b) Another biocytin possibility would be to trace filled VIP+ cells and assess whether the dendrites of multipolar and bipolar cells differentially targeted distinct cortical lamina and whether these lamina, in the same section or parallel, were enriched for mGluR7+ afferents.

      We thank the reviewer for their suggestion and we are planning on doing these kinds of experiments.

      Reviewer #3:

      In this work Stachiak and colleagues investigate the role of Prox1 on the development of VIP cells. Prox1 is expressed by the majority of GABAergic derived from the caudal ganglionic eminence (CGE), and as mentioned by the authors, Prox1 has been shown to be necessary for the differentiation, circuit integration, and maintenance of CGE-derived GABAergic cells. Here, Stachiak and colleagues show that removal of Prox1 in VIP cells leads to suppression of synaptic release probability onto cortical multipolar VIP cells in a mechanism dependent on Elfn1. This work is of interest for the field because it increases our understanding of differential synaptic maturation of VIP cells. The results are noteworthy, however the relevance of this manuscript would potentially be increased by addressing the following suggestions:

      1) Include histology to show when exactly Prox1 is removed from multipolar and bipolar VIP-expressing cells by using the VIP-Cre mouse driver.

      We can address this by performing an in-situ hybridization against Prox1 from P3 onwards (when Cre becomes active).

      2) Clarify if the statistical analysis is done using n (number of cells) or N (number of animals). The analysis between control and mutants (both Prox1 and Elfn1) need to be done across animals and not cells.

      Statistics for physiology were done across n (number of cells) while statistics for ISH are done across number of slices. We will clarify this point in the text and update the methods.

      Regarding the statistics for the ISH, these have been done across n (number of slices) for control versus KO tissue (N = 3 and N = 2 animals, respectively). We will add more animals to this analysis to compare by animal instead, although we do not expect any change in the results.

      Regarding the physiology, we would provide a two-pronged answer. We first of all feel that averaging synaptic responses for each animal would hide a good deal of the biological variability in PPR present in different cells (response Fig 1), the characterization of which is integral to the central findings of the paper. Secondly, to perform such analysis asked by the reviewer one would need to obtain recordings from ~10 animals or so per condition for each condition, which, to our knowledge, is something that is not standard when utilizing in vitro electrophysiological recordings from single cells. For example, in these very recent studies that have performed in vitro electrophysiological recordings all the statistics are performed using “n” number of cells and not the average of all the cells recorded per animal collapsed into a single data point. (Udakis, Pedrosa, Chamberlain, Clopath, & Mellor, 2020) https://www.nature.com/articles/s41467-020-18074-8

      (Horvath, Piazza, Monteggia, & Kavalali, 2020) https://elifesciences.org/articles/52852

      (Haas et al., 2018) https://elifesciences.org/articles/31755

      Nevertheless, we have now re-run the analysis grouping the cells and averaging the values we get per animal, since we have obtained our data from many animals. The results are more or less indistinguishable from the ones presented in the original submission, except for on p value that rose to 0.07 from 0.03 due to the lack of the required number of animals. We hope that the new plots and statistics presented herein address the concern put forward by the reviewer.

      Response Fig 1: A comparison of cell wise versus animal-wise analysis of synaptic physiology. Some cell to cell variability is hidden, and the reduction in numbers impacts the P values.

      (A) PPR of multipolar Prox1 Control for 14 cells from 9 animals (n/N=14/9) under baseline conditions and with MSOP, cell-wise comparison p = 0.02 , t = 2.74 and (B) animal-wise comparisons (p = 0.04, t stat = 2.45). Statistics: paired t-test.

      (C) PPR of multipolar Prox1 KO cells (n/N=9/8) under baseline conditions and with MSOP, cell-wise comparison p = 0.2, t = 1.33 and (D) animal-wise comparisons (p = 0.2, t stat = 1.56). Statistics: paired t-test. Comparisons for PPR of bipolar Prox1 Control (n/N=8/8) and KO cells (n/N=9/9) did not change.

      (E) PPR for Prox1 control (n/N=18/11) and KO (n/N=13/11) bipolar VIP cells, cell-wise comparison p = 0.3, t = 1.1 and (F) animal-wise comparisons (p = 0.4, t stat = 0.93). Statistics: t-test.

      (G) PPR of Elfn1 Control (n/N=12/4) and Het (n/N=12/4) bipolar VIP cells, cell-wise comparison p = 0.3, t = 1.06 and (H) animal-wise comparisons (p = 0.4, t stat = 0.93)

      (I) PPR of Prox1 control (n/N=33/18) and KO (n/N=19/14) multipolar VIP cells, cell-wise comparison p = 0.03, t = 2.17. and (J) animal-wise comparisons (p = 0.07, t stat = 1.99).

      (K) PPR of Elfn1 Control (n/N=14/6) and Het (n/N=20/8) multipolar VIP cells, cell-wise comparison p = 0.008, t = 2.84 and (L) animal-wise comparisons (p = 0.007, t stat = 3.23).

      3) Clarify what are the parameters used to identify bipolar vs multipolar VIP cells. VIP cells comprise a wide variety of transcriptomic subtypes, and in the absence of using specific genetic markers for the different VIP subtypes, the authors should either include the reconstructions of all recorded cells or clarify if other methods were used.

      We thank the reviewer for this comment. The cell parameter criteria will be amended in the methods: “Cell type was classified as bipolar vs. multipolar based on cell body morphology (ovoid vs. round) and number and orientation of dendritic processes emanating from it (2 or 3 dendrites perpendicular to pia (for bipolar) vs. 3 or more processes in diverse orientations (for multipolar). In addition, the laminar localization of the two populations differs, with multipolar cells found primarily in the upper layer 2, while bipolar cells are found throughout layers 2 and 3. Initial determination of cell classification was made prior to patching fluorescent-labelled cells, but whenever possible this initial assessment was confirmed with post-hoc verification of biocytin filled cells.”

      Reference:

      Dolan, J., & Mitchell, K. J. (2013). Mutation of Elfn1 in Mice Causes Seizures and Hyperactivity. PLOS ONE, 8(11), e80491. Retrieved from https://doi.org/10.1371/journal.pone.0080491

      Haas, K. T., Compans, B., Letellier, M., Bartol, T. M., Grillo-Bosch, D., Sejnowski, T. J., … Hosy, E. (2018). Pre-post synaptic alignment through neuroligin-1 tunes synaptic transmission efficiency. ELife, 7, e31755. https://doi.org/10.7554/eLife.31755

      Horvath, P. M., Piazza, M. K., Monteggia, L. M., & Kavalali, E. T. (2020). Spontaneous and evoked neurotransmission are partially segregated at inhibitory synapses. ELife, 9, e52852. https://doi.org/10.7554/eLife.52852

      Stachniak, T. J., Sylwestrak, E. L., Scheiffele, P., Hall, B. J., & Ghosh, A. (2019). Elfn1-Induced Constitutive Activation of mGluR7 Determines Frequency-Dependent Recruitment of Somatostatin Interneurons. The Journal of Neuroscience, 39(23), 4461 LP – 4474. https://doi.org/10.1523/JNEUROSCI.2276-18.2019

      Tomioka, N. H., Yasuda, H., Miyamoto, H., Hatayama, M., Morimura, N., Matsumoto, Y., … Aruga, J. (2014). Elfn1 recruits presynaptic mGluR7 in trans and its loss results in seizures. Nature Communications. https://doi.org/10.1038/ncomms5501

      Udakis, M., Pedrosa, V., Chamberlain, S. E. L., Clopath, C., & Mellor, J. R. (2020). Interneuron-specific plasticity at parvalbumin and somatostatin inhibitory synapses onto CA1 pyramidal neurons shapes hippocampal output. Nature Communications, 11(1), 4395. https://doi.org/10.1038/s41467-020-18074-8

    1. Author Response:

      Evaluation Summary:

      Since DBS of the habenula is a new treatment, these are the first data of its kind and potentially of high interest to the field. Although the study mostly confirms findings from animal studies rather than bringing up completely new aspects of emotion processing, it certainly closes a knowledge gap. This paper is of interest to neuroscientists studying emotions and clinicians treating psychiatric disorders. Specifically the paper shows that the habenula is involved in processing of negative emotions and that it is synchronized to the prefrontal cortex in the theta band. These are important insights into the electrophysiology of emotion processing in the human brain.

      The authors are very grateful for the reviewers’ positive comments on our study. We also thank all the reviewers for the comments which has helped to improve the manuscript.

      Reviewer #1 (Public Review):

      The study by Huang et al. report on direct recordings (using DBS electrodes) from the human habenula in conjunction with MEG recordings in 9 patients. Participants were shown emotional pictures. The key finding was a transient increase in theta/alpha activity with negative compared to positive stimuli. Furthermore, there was a later increase in oscillatory coupling in the same band. These are important data, as there are few reports of direct recordings from the habenula together with the MEG in humans performing cognitive tasks. The findings do provide novel insight into the network dynamics associated with the processing of emotional stimuli and particular the role of the habenula.

      Recommendations:

      How can we be sure that the recordings from the habenula are not contaminated by volume conduction; i.e. signals from neighbouring regions? I do understand that bipolar signals were considered for the DBS electrode leads. However, high-frequency power (gamma band and up) is often associated with spiking/MUA and considered less prone to volume conduction. I propose to also investigate that high-frequency gamma band activity recorded from the bipolar DBS electrodes and relate to the emotional faces. This will provide more certainty that the measured activity indeed stems from the habenula.

      We thank the reviewer for the comment. As the reviewer pointed out, bipolar macroelectrode can detect locally generated potentials, as demonstrated in the case of recordings from subthalamic nucleus and especially when the macroelectrodes are inside the subthalamic nucleus (Marmor et al., 2017). However, considering the size of the habenula and the size of the DBS electrode contacts, we have to acknowledge that we cannot completely exclude the possibility that the recordings are contaminated by volume conduction of activities from neighbouring areas, as shown in Bertone-Cueto et al. 2019. We have now added extra information about the size of the habenula and acknowledged the potential contamination of activities from neighbouring areas through volume conduction in the ‘Limitation’:

      "Another caveat we would like to acknowledge that the human habenula is a small region. Existing data from structural MRI scans reported combined habenula (the sum of the left and right hemispheres) volumes of ~ 30–36 mm3 (Savitz et al., 2011a; Savitz et al., 2011b) which means each habenula has the size of 2~3 mm in each dimension, which may be even smaller than the standard functional MRI voxel size (Lawson et al., 2013). The size of the habenula is also small relative to the standard DBS electrodes (as shown in Fig. 2A). The electrodes used in this study (Medtronic 3389) have electrode diameter of 1.27 mm with each contact length of 1.5 mm, and contact spacing of 0.5 mm. We have tried different ways to confirm the location of the electrode and to select the contacts that is within or closest to the habenula: 1.) the MRI was co-registered with a CT image (General Electric, Waukesha, WI, USA) with the Leksell stereotactic frame to obtain the coordinate values of the tip of the electrode; 2.) Post-operative CT was co-registered to pre-operative T1 MRI using a two-stage linear registration using Lead-DBS software. We used bipolar signals constructed from neighbouring macroelectrode recordings, which have been shown to detect locally generated potentials from subthalamic nucleus and especially when the macroelectrodes are inside the subthalamic nucleus (Marmor et al., 2017). Considering that not all contacts for bipolar LFP construction are in the habenula in this study, as shown in Fig. 2, we cannot exclude the possibility that the activities we measured are contaminated by activities from neighbouring areas through volume conduction. In particular, the human habenula is surrounded by thalamus and adjacent to the posterior end of the medial dorsal thalamus, so we may have captured activities from the medial dorsal thalamus. However, we also showed that those bipolar LFPs from contacts in the habenula tend to have a peak in the theta/alpha band in the power spectra density (PSD); whereas recordings from contacts outside the habenula tend to have extra peak in beta frequency band in the PSD. This supports the habenula origin of the emotional valence related changes in the theta/alpha activities reported here."

      We have also looked at gamma band oscillations or high frequency activities in the recordings. However, we didn’t observe any peak in high frequency band in the average power spectral density, or any consistent difference in the high frequency activities induced by the emotional stimuli (Fig. S1). We suspect that high frequency activities related to MUA/spiking are very local and have very small amplitude, so they are not picked up by the bipolar LFPs measured from contacts with both the contact area for each contact and the between-contact space quite large comparative to the size of the habenula.

      A

      B

      Figure S1. (A) Power spectral density of habenula LFPs across all time period when emotional stimuli were presented. The bold blue line and shadowed region indicates the mean ± SEM across all recorded hemispheres and the thin grey lines show measurements from individual hemispheres. (B) Time-frequency representations of the power response relative to pre-stimulus baseline for different conditions showing habenula gamma and high frequency activity are not modulated by emotional

      References:

      Savitz JB, Bonne O, Nugent AC, Vythilingam M, Bogers W, Charney DS, et al. Habenula volume in post-traumatic stress disorder measured with high-resolution MRI. Biology of Mood & Anxiety Disorders 2011a; 1(1): 7.

      Savitz JB, Nugent AC, Bogers W, Roiser JP, Bain EE, Neumeister A, et al. Habenula volume in bipolar disorder and major depressive disorder: a high-resolution magnetic resonance imaging study. Biological Psychiatry 2011b; 69(4): 336-43.

      Lawson RP, Drevets WC, Roiser JP. Defining the habenula in human neuroimaging studies. NeuroImage 2013; 64: 722-7.

      Marmor O, Valsky D, Joshua M, Bick AS, Arkadir D, Tamir I, et al. Local vs. volume conductance activity of field potentials in the human subthalamic nucleus. Journal of Neurophysiology 2017; 117(6): 2140-51.

      Bertone-Cueto NI, Makarova J, Mosqueira A, García-Violini D, Sánchez-Peña R, Herreras O, et al. Volume-Conducted Origin of the Field Potential at the Lateral Habenula. Frontiers in Systems Neuroscience 2019; 13:78.

      Figure 3: the alpha/theta band activity is very transient and not band-limited. Why refer to this as oscillatory? Can you exclude that the TFRs of power reflect the spectral power of ERPs rather than modulations of oscillations? I propose to also calculate the ERPs and perform the TFR of power on those. This might result in a re-interpretation of the early effects in theta/alpha band.

      We agree with the reviewer that the activity increase in the first time window with short latency after the stimuli onset is very transient and not band-limited. This raise the question that whether this is oscillatory or a transient evoked activity. We have now looked at this initial transient activity in different ways: 1.) We quantified the ERP in LFPs locked to the stimuli onset for each emotional valence condition and for each habenula. We investigated whether there was difference in the amplitude or latency of the ERP for different stimuli emotional valence conditions. As showing in the following figure, there is ERP with stimuli onset with a positive peak at 402 ± 27 ms (neutral stimuli), 407 ± 35 ms (positive stimuli), 399 ± 30 ms (negative stimuli). The flowing figure (Fig. 3–figure supplement 1) will be submitted as figure supplement related to Fig. 3. However, there was no significant difference in ERP latency or amplitude caused by different emotional valence stimuli. 2.) We have quantified the pure non-phase-locked (induced only) power spectra by calculating the time-frequency power spectrogram after subtracting the ERP (the time-domain trial average) from time-domain neural signal on each trial (Kalcher and Pfurtscheller, 1995; Cohen and Donner, 2013). This shows very similar results as we reported in the main manuscript, as shown in Fig. 3–figure supplement 2. These further analyses show that even though there were event related potential changes time locked around the stimuli onset, and this ERP did NOT contribute to the initial broad-band activity increase at the early time window shown in plot A-C in Figure 3. The figures of the new analyses and following have now been added in the main text:

      "In addition, we tested whether stimuli-related habenula LFP modulations primarily reflect a modulation of oscillations, which is not phase-locked to stimulus onset, or, alternatively, if they are attributed to evoked event-related potential (ERP). We quantified the ERP for each emotional valence condition for each habenula. There was no significant difference in ERP latency or amplitude caused by different emotional valence stimuli (Fig. 3–figure supplement 1). In addition, when only considering the non phase-locked activity by removing the ERP from the time series before frequency-time decomposition, the emotional valence effect (presented in Fig. 3–figure supplement 2) is very similar to those shown in Fig.3. These additional analyses demonstrated that the emotional valence effect in the LFP signal is more likely to be driven by non-phase-locked (induced only) activity."

      A

      B

      Fig. 3–figure supplement 1. Event-related potential (ERP) in habenula LFP signals in different emotional valence (neutral, positive and negative) conditions. (A) Averaged ERP waveforms across patients for different conditions. (B) Peak latency and amplitude (Mean ± SEM) of the ERP components for different conditions.

      Fig. 3–figure supplement 2. Non-phase-locked activity in different emotional valence (neutral, positive and negative) conditions (N = 18). (A) Time-frequency representation of the power changes relative to pre-stimulus baseline for three conditions. Significant clusters (p < 0.05, non-parametric permutation test) are encircled with a solid black line. (B) Time-frequency representation of the power response difference between negative and positive valence stimuli, showing significant increased activity the theta/alpha band (5-10 Hz) at short latency (100-500 ms) and another increased theta activity (4-7 Hz) at long latencies (2700-3300 ms) with negative stimuli (p < 0.05, non-parametric permutation test). (C) Normalized power of the activities at theta/alpha (5-10 Hz) and theta (4-7 Hz) band over time. Significant difference between the negative and positive valence stimuli is marked by a shadowed bar (p < 0.05, corrected for multiple comparison).

      References:

      Kalcher J, Pfurtscheller G. Discrimination between phase-locked and non-phase-locked event-related EEG activity. Electroencephalography and Clinical Neurophysiology 1995; 94(5): 381-4.

      Cohen MX, Donner TH. Midfrontal conflict-related theta-band power reflects neural oscillations that predict behavior. Journal of Neurophysiology 2013; 110(12): 2752-63.

      Figure 4D: can you exclude that the frontal activity is not due to saccade artifacts? Only eye blink artifacts were reduced by the ICA approach. Trials with saccades should be identified in the MEG traces and rejected prior to further analysis.

      We understand and appreciate the reviewer’s concern on the source of the activity modulations shown in Fig. 4D. We tried to minimise the eye movement or saccade in the recording by presenting all figures at the centre of the screen, scaling all presented figures to similar size, and presenting a white cross at the centre of the screen preparing the participants for the onset of the stimuli. Despite this, participants my still make eye movements and saccade in the recording. We used ICA to exclude the low frequency large amplitude artefacts which can be related to either eye blink or other large eye movements. However, this may not be able to exclude artefacts related to miniature saccades. As shown in Fig. 4D, on the sensor level, the sensors with significant difference between the negative vs. positive emotional valence condition clustered around frontal cortex, close to the eye area. However, we think this is not dominated by saccades because of the following two reasons:

      1.) The power spectrum of the saccadic spike artifact in MEG is characterized by a broadband peak in the gamma band from roughly 30 to 120 Hz (Yuval-Greenberg et al., 2008; Keren et al., 2010). In this study the activity modulation we observed in the frontal sensors are limited to the theta/alpha frequency band, so it is different from the power spectra of the saccadic spike artefact.

      2.) The source of the saccadic spike artefacts in MEG measurement tend to be localized to the region of the extraocular muscles of both eyes (Carl et al., 2012).We used beamforming source localisation to identify the source of the activity modulation reported in Fig. 4D. This beamforming analysis identified the source to be in the Broadmann area 9 and 10 (shown in Fig. 5). This excludes the possibility that the activity modulation in the sensor level reported in Fig. 4D is due to saccades. In addition, Broadman area 9 and 10, have previously been associated with emotional stimulus processing (Bermpohl et al., 2006), Broadman area 9 in the left hemisphere has also been used as the target for repetitive transcranial magnetic stimulation (rTMS) as a treatment for drug-resistant depression (Cash et al., 2020). The source localisation results, together with previous literature on the function of the identified source area suggest that the activity modulation we observed in the frontal cortex is very likely to be related to emotional stimuli processing.

      References:

      Yuval-Greenberg S, Tomer O, Keren AS, Nelken I, Deouell LY. Transient induced gamma-band response in EEG as a manifestation of miniature saccades. Neuron 2008; 58(3): 429-41.

      Keren AS, Yuval-Greenberg S, Deouell LY. Saccadic spike potentials in gamma-band EEG: characterization, detection and suppression. NeuroImage 2010; 49(3): 2248-63.

      Carl C, Acik A, Konig P, Engel AK, Hipp JF. The saccadic spike artifact in MEG. NeuroImage 2012; 59(2): 1657-67.

      Bermpohl F, Pascual-Leone A, Amedi A, Merabet LB, Fregni F, Gaab N, et al. Attentional modulation of emotional stimulus processing: an fMRI study using emotional expectancy. Human Brain Mapping 2006; 27(8): 662-77.

      Cash RFH, Weigand A, Zalesky A, Siddiqi SH, Downar J, Fitzgerald PB, et al. Using Brain Imaging to Improve Spatial Targeting of Transcranial Magnetic Stimulation for Depression. Biological Psychiatry 2020.

      The coherence modulations in Fig 5 occur quite late in time compared to the power modulations in Fig 3 and 4. When discussing the results (in e.g. the abstract) it reads as if these findings are reflecting the same process. How can the two effect reflect the same process if the timing is so different?

      As the reviewer pointed out correctly, the time window where we observed the coherence modulations happened quite late in time compared to the initial power modulations in the frontal cortex and the habenula (Fig. 4). And there was another increase in the theta band activities in the habenula area even later, at around 3 second after stimuli onset when the emotional figure has already disappeared. Emotional response is composed of a number of factors, two of which are the initial reactivity to an emotional stimulus and the subsequent recovery once the stimulus terminates or ceases to be relevant (Schuyler et al., 2014). We think these neural effects we observed in the three different time windows may reflect different underlying processes. We have discussed this in the ‘Discussion’:

      "These activity changes at different time windows may reflect the different neuropsychological processes underlying emotion perception including identification and appraisal of emotional material, production of affective states, and autonomic response regulation and recovery (Phillips et al., 2003a). The later effects of increased theta activities in the habenula when the stimuli disappeared were also supported by other literature showing that, there can be prolonged effects of negative stimuli in the neural structure involved in emotional processing (Haas et al., 2008; Puccetti et al., 2021). In particular, greater sustained patterns of brain activity in the medial prefrontal cortex when responding to blocks of negative facial expressions was associated with higher scores of neuroticism across participants (Haas et al., 2008). Slower amygdala recovery from negative images also predicts greater trait neuroticism, lower levels of likability of a set of social stimuli (neutral faces), and declined day-to-day psychological wellbeing (Schuyler et al., 2014; Puccetti et al., 2021)."

      References:

      Schuyler BS, Kral TR, Jacquart J, Burghy CA, Weng HY, Perlman DM, et al. Temporal dynamics of emotional responding: amygdala recovery predicts emotional traits. Social Cognitive and Affective Neuroscience 2014; 9(2): 176-81.

      Phillips ML, Drevets WC, Rauch SL, Lane R. Neurobiology of emotion perception I: The neural basis of normal emotion perception. Biological Psychiatry 2003a; 54(5): 504-14.

      Haas BW, Constable RT, Canli T. Stop the sadness: Neuroticism is associated with sustained medial prefrontal cortex response to emotional facial expressions. NeuroImage 2008; 42(1): 385-92.

      Puccetti NA, Schaefer SM, van Reekum CM, Ong AD, Almeida DM, Ryff CD, et al. Linking Amygdala Persistence to Real-World Emotional Experience and Psychological Well-Being. Journal of Neuroscience 2021: JN-RM-1637-20.

      Be explicit on the degrees of freedom in the statistical tests given that one subject was excluded from some of the tests.

      We thank the reviewers for the comment. The number of samples used for each statistics analysis are stated in the title of the figures. We have now also added the degree of freedom in the main text when parametric statistical tests such as t-test or ANOVAs have been used. When permutation tests (which do not have any degrees of freedom associated with it) are used, we have now added the number of samples for the permutation test.

      Reviewer #2 (Public Review):

      In this study, Huang and colleagues recorded local field potentials from the lateral habenula in patients with psychiatric disorders who recently underwent surgery for deep brain stimulation (DBS). The authors combined these invasive measurements with non-invasive whole-head MEG recordings to study functional connectivity between the habenula and cortical areas. Since the lateral habenula is believed to be involved in the processing of emotions, and negative emotions in particular, the authors investigated whether brain activity in this region is related to emotional valence. They presented pictures inducing negative and positive emotions to the patients and found that theta and alpha activity in the habenula and frontal cortex increases when patients experience negative emotions. Functional connectivity between the habenula and the cortex was likewise increased in this band. The authors conclude that theta/alpha oscillations in the habenula-cortex network are involved in the processing of negative emotions in humans.

      Because DBS of the habenula is a new treatment tested in this cohort in the framework of a clinical trial, these are the first data of its kind. Accordingly, they are of high interest to the field. Although the study mostly confirms findings from animal studies rather than bringing up completely new aspects of emotion processing, it certainly closes a knowledge gap.

      In terms of community impact, I see the strengths of this paper in basic science rather than the clinical field. The authors demonstrate the involvement of theta oscillations in the habenula-prefrontal cortex network in emotion processing in the human brain. The potential of theta oscillations to serve as a marker in closed-loop DBS, as put forward by the authors, appears less relevant to me at this stage, given that the clinical effects and side-effects of habenula DBS are not known yet.

      We thank the reviewers for the favourable comments about the implication of our study in basic science and about the value of our study in closing a knowledge gap. We agree that further studies would be required to make conclusions about the clinical effects and side-effects of habenula DBS.

      Detailed comments:

      The group-average MEG power spectrum (Fig. 4B) suggests that negative emotions lead to a sustained theta power increase and a similar effect, though possibly masked by a visual ERP, can be seen in the habenula (Fig. 3C). Yet the statistics identify brief elevations of habenula theta power at around 3s (which is very late), a brief elevation of prefrontal power a time 0 or even before (Fig. 4C) and a brief elevation of Habenula-MEG theta coherence around 1 s. It seems possible that this lack of consistency arises from a low signal-to-noise ratio. The data contain only 27 trails per condition on average and are contaminated by artifacts caused by the extension wires.

      With regard to the nature of the activity modulation with short latency after stimuli onset: whether this is an ERP or oscillation? We have now investigated this. In summary, by analysing the ERP and removing the influence of the ERP from the total power spectra, we didn’t observe stimulus emotional valence related modulation in the ERP, and the modulation related to emotional valence in the pure induced (non-phase-locked) power spectra was similar to what we have observed in the total power shown in Fig. 3. Therefore, we argue that the theta/alpha increase with negative emotional stimuli we observed in both habenula and prefrontal cortex 0-500 ms after stimuli onset are not dominated by visual or other ERP.

      With regard to the signal-to-noise ratio from only 27 trials per condition on average per participant: We have tried to clean the data by removing the trials with obvious artefacts characterised by increased measurements in the time domain over 5 times the standard deviation and increased activities across all frequency bands in the frequency domain. After removing the trials with artefacts, we have 27 trials per condition per subject on average. We agree that 27 trials per condition on average is not a high number, and increasing the number of trials would further increase the signal-to-noise ratio. However, our studies with EEG recordings and LFP recordings from externalised patients have shown that 30 trials was enough to identify reduction in the amplitude of post-movement beta oscillations at the beginning of visuomotor adaption in the motor cortex and STN (Tan et al., 2014a; Tan et al., 2014b). These results of motor error related modulation in the post-movement beta have been repeated by other studies from other groups. In Tan et al. 2014b, with simultaneous EEG and STN LFP measurements and a similar number of trials (around 30), we also quantified the time-course of STN-motor cortex coherence during voluntary movements. This pattern has also been repeated in a separate study from another group with around 50 trials per participant (Talakoub et al., 2016). In addition, similar behavioural paradigm (passive figure viewing paradigm) has been used in two previous studies with LFP recordings from STN from different patient groups (Brucke et al., 2007; Huebl et al., 2014). In both studies, a similar number of trials per condition around 27 was used. The authors have identified meaningful activity modulation in the STN by emotional stimuli. Therefore, we think the number of trials per condition was sufficient to identify emotional valence induced difference in the LFPs in the paradigm.

      We agree that the measurement of coherence can be more susceptible to noise and suffer from the reduced signal-to-noise ratio in MEG recording. In Hirschmann et al. 2013, 5 minutes of resting recording and 5 minutes of movement recording from 10 PD patients were used to quantify movement related changes in STN-cortical coherence and how this was modulated by levodopa (Hirschmann et al., 2013). Litvak et al. (2012) have identified movement-related changes in the coherence between STN LFP and motor cortex with recording with simultaneous STN LFP and MEG recordings from 17 PD patients and 20 trials in average per participant per condition (Litvak et al., 2012). With similar methods, van Wijk et al. (2017) used recordings from 9 patients and around on average in 29 trials per hand per condition, and they identified reduced cortico-pallidal coherence in the low-beta decreases during movement (van Wijk et al., 2017). So the trial number per condition participant we used in this study are comparable to previous studies.

      The DBS extension wires do reduce signal-to-noise ratio in the MEG recording. therefore the spatiotemporal Signal Space Separation (tSSS) method (Taulu and Simola, 2006) implemented in the MaxFilter software (Elekta Oy, Helsinki, Finland) has been applied in this study to suppress strong magnetic artifacts caused by extension wires. This method has been proved to work well in de-noising the magnetic artifacts and movement artifacts in MEG data in our previous studies (Cao et al., 2019; Cao et al., 2020). In addition, the beamforming method proposed by several studies (Litvak et al., 2010; Hirschmann et al., 2011; Litvak et al., 2011) has been used in this study. In Litvak et al., 2010, the artifacts caused by DBS extension wires was detailed described and the beamforming was demonstrated to effectively suppress artifacts and thereby enable both localization of cortical sources coherent with the deep brain nucleus. We have now added more details and these references about the data cleaning and the beamforming method in the main text. With the beamforming method, we did observe the standard movement-related modulation in the beta frequency band in the motor cortex with 9 trials of figure pressing movements, shown in the following figure for one patient as an example (Figure 5–figure supplement 1). This suggests that the beamforming method did work well to suppress the artefacts and help to localise the source with a low number of trials. The figure on movement-related modulation in the motor cortex in the MEG signals have now been added as a supplementary figure to demonstrate the effect of the beamforming.

      Figure 5–figure supplement 1. (A) Time-frequency maps of MEG activity for right hand button press at sensor level from one participant (Case 8). (B) DICS beamforming source reconstruction of the areas with movement-related oscillation changes in the range of 12-30 Hz. The peak power was located in the left M1 area, MNI coordinate [-37, -12, 43].

      References:

      Tan H, Jenkinson N, Brown P. Dynamic neural correlates of motor error monitoring and adaptation during trial-to-trial learning. Journal of Neuroscience 2014a; 34(16): 5678-88.

      Tan H, Zavala B, Pogosyan A, Ashkan K, Zrinzo L, Foltynie T, et al. Human subthalamic nucleus in movement error detection and its evaluation during visuomotor adaptation. Journal of Neuroscience 2014b; 34(50): 16744-54.

      Talakoub O, Neagu B, Udupa K, Tsang E, Chen R, Popovic MR, et al. Time-course of coherence in the human basal ganglia during voluntary movements. Scientific Reports 2016; 6: 34930.

      Brucke C, Kupsch A, Schneider GH, Hariz MI, Nuttin B, Kopp U, et al. The subthalamic region is activated during valence-related emotional processing in patients with Parkinson's disease. European Journal of Neuroscience 2007; 26(3): 767-74.

      Huebl J, Spitzer B, Brucke C, Schonecker T, Kupsch A, Alesch F, et al. Oscillatory subthalamic nucleus activity is modulated by dopamine during emotional processing in Parkinson's disease. Cortex 2014; 60: 69-81.

      Hirschmann J, Ozkurt TE, Butz M, Homburger M, Elben S, Hartmann CJ, et al. Differential modulation of STN-cortical and cortico-muscular coherence by movement and levodopa in Parkinson's disease. NeuroImage 2013; 68: 203-13.

      Litvak V, Eusebio A, Jha A, Oostenveld R, Barnes G, Foltynie T, et al. Movement-related changes in local and long-range synchronization in Parkinson's disease revealed by simultaneous magnetoencephalography and intracranial recordings. Journal of Neuroscience 2012; 32(31): 10541-53.

      van Wijk BCM, Neumann WJ, Schneider GH, Sander TH, Litvak V, Kuhn AA. Low-beta cortico-pallidal coherence decreases during movement and correlates with overall reaction time. NeuroImage 2017; 159: 1-8.

      Taulu S, Simola J. Spatiotemporal signal space separation method for rejecting nearby interference in MEG measurements. Physics in Medicine and Biology 2006; 51(7): 1759-68.

      Cao C, Huang P, Wang T, Zhan S, Liu W, Pan Y, et al. Cortico-subthalamic Coherence in a Patient With Dystonia Induced by Chorea-Acanthocytosis: A Case Report. Frontiers in Human Neuroscience 2019; 13: 163.

      Cao C, Li D, Zhan S, Zhang C, Sun B, Litvak V. L-dopa treatment increases oscillatory power in the motor cortex of Parkinson's disease patients. NeuroImage Clinical 2020; 26: 102255.

      Litvak V, Eusebio A, Jha A, Oostenveld R, Barnes GR, Penny WD, et al. Optimized beamforming for simultaneous MEG and intracranial local field potential recordings in deep brain stimulation patients. NeuroImage 2010; 50(4): 1578-88.

      Litvak V, Jha A, Eusebio A, Oostenveld R, Foltynie T, Limousin P, et al. Resting oscillatory cortico-subthalamic connectivity in patients with Parkinson's disease. Brain 2011; 134(Pt 2): 359-74.

      Hirschmann J, Ozkurt TE, Butz M, Homburger M, Elben S, Hartmann CJ, et al. Distinct oscillatory STN-cortical loops revealed by simultaneous MEG and local field potential recordings in patients with Parkinson's disease. NeuroImage 2011; 55(3): 1159-68.

      I doubt that the correlation between habenula power and habenula-MEG coherence (Fig. 6C) is informative of emotion processing. First, power and coherence in close-by time windows are likely to to be correlated irrespective of the task/stimuli. Second, if meaningful, one would expect the strongest correlation for the negative condition, as this is the only condition with an increase of theta coherence and a subsequent increase of theta power in the habenula. This, however, does not appear to be the case.

      The authors included the factors valence and arousal in their linear model and found that only valence correlated with electrophysiological effects. I suspect that arousal and valence scores are highly correlated. When fed with informative yet highly correlated variables, the significance of individual input variables becomes difficult to assess in many statistical models. Hence, I am not convinced that valence matters but arousal not.

      For the correlation shown in Fig. 6C, we used a linear mixed-effect modelling (‘fitlme’ in Matlab) with different recorded subjects as random effects to investigate the correlations between the habenula power and habenula-MEG coherence at an earlier window, while considering all trials together. Therefore the reported value in the main text and in the figure (k = 0.2434 ± 0.1031, p = 0.0226, R2 = 0.104) show the within subjects correlation that are consistent across all measured subjects. The correlation is likely to be mediated by emotional valence condition, as negative emotional stimuli tend to be associated with both high habenula-MEG coherence and high theta power in the later time window tend to happen in the trials with.

      The arousal scores are significantly different for the three valence conditions as shown in Fig. 1B. However, the arousal scores and the valence scores are not monotonically correlated, as shown in the following figure (Fig. S2). The emotional neutral figures have the lowest arousal value, but have the valence value sitting between the negative figures and the positive figures. We have now added the following sentence in the main text:

      "This nonlinear and non-monotonic relationship between arousal scores and the emotional valence scores allowed us to differentiate the effect of the valence from arousal."

      Table 2 in the main text show the results of the linear mixed-effect modelling with the neural signal as the dependent variable and the valence and arousal scores as independent variables. Because of the non-linear and non-monotonic relationship between the valence and arousal scores, we think the significance of individual input variables is valid in this statistical model. We have now added a new figure (shown below, Fig. 7) with scatter plots showing the relationship between the electrophysiological signal and the arousal and emotional valence scores separately using Spearman’s partial correlation analysis. In each scatter plot, each dot indicates the average measurement from one participant in one emotional valence condition. As shown in the following figure, the electrophysiological measurements linearly correlated with the valence score, but not with the arousal scores. However, the statistics reported in this figure considered all the dots together. The linear mixed effect modelling taking into account the interdependency of the measurements from the same participant. So the results reported in the main text using linear mixed effect modelling are statistically more valid, but supplementary figure here below illustrate the relationship.

      Figure S2. Averaged valence and arousal ratings (mean ± SD) for figures of the three emotional condition. (B) Scatter plots showing the relationship between arousal and valence scores for each emotional condition for each participant.

      Figure 7. Scatter plots showing how early theta/alpha band power increase in the frontal cortex (A), theta/alpha band frontal cortex-habenula coherence (B) and theta band power increase in habenula stimuli (C) changed with emotional valence (left column) and arousal (right column). Each dot shows the average of one participant in each categorical valence condition, which are also the source data of the multilevel modelling results presented in Table 2. The R and p value in the figure are the results of partial correlation considering all data points together.

      Page 8: "The time-varying coherence was calculated for each trial". This is confusing because coherence quantifies the stability of a phase difference over time, i.e. it is a temporal average, not defined for individual trials. It has also been used to describe the phase difference stability over trials rather than time, and I assume this is the method applied here. Typically, the greatest coherence values coincide with event-related power increases, which is why I am surprised to see maximum coherence at 1s rather than immediately post-stimulus.

      We thank the reviewer for pointing out this incorrect description. As the reviewer pointed out correctly, the method we used describe the phase difference stability over trials rather than time. We have now clarified how coherence was calculated and added more details in the methods:

      "The time-varying cross trial coherence between each MEG sensor and the habenula LFP was first calculated for each emotional valence condition. For this, time-frequency auto- and cross-spectral densities in the theta/alpha frequency band (5-10 Hz) between the habenula LFP and each MEG channel at sensor level were calculated using the wavelet transform-based approach from -2000 to 4000 ms for each trial with 1 Hz steps using the Morlet wavelet and cycle number of 6. Cross-trial coherence spectra for each LFP-MEG channel combination was calculated for each emotional valence condition for each habenula using the function ‘ft_connectivityanalysis’ in Fieldtrip (version 20170628). Stimulus-related changes in coherence were assessed by expressing the time-resolved coherence spectra as a percentage change compared to the average value in the -2000 to -200 ms (pre-stimulus) time window for each frequency."

      In the Morlet wavelet analysis we used here, the cycle number (C) determines the temporal resolution and frequency resolution for each frequency (F). The spectral bandwidth at a given frequency F is equal to 2F/C while the wavelet duration is equal to C/F/pi. We used a cycle number of 6. For theta band activities around 5 Hz, we will have the spectral bandwidth of 25/6 = 1.7 Hz and the wavelet duration of 6/5/pi = 0.38s = 380ms.

      As the reviewer noticed, we observed increased activities across a wide frequency band in both habenula and the prefrontal cortex within 500 ms after stimuli onset. But the increase of cross-trial coherence starts at around 300 ms. The increase of coherence in a time window without increase of power in either of the two structures indicates a phase difference stability across trials in the oscillatory activities from the two regions, and this phase difference stability across trials was not secondary to power increase.

      Reviewer #3 (Public Review):

      This paper describes the oscillatory activity of the habenula using local field potentials, both within the region and, through the use of MEG, in connection to the prefrontal cortex. The characteristics of this activity were found to vary with the emotional valence but not with arousal. Sheding light on this is relevant, because the habenula is a promising target for deep brain stimulation.

      In general, because I am not much on top of the literature on the habenula, I find difficult to judge about the novelty and the impact of this study. What I can say is that I do find the paper is well-written and very clear; and the methods, although quite basic (which is not bad), are sound and rigourous.

      We thank the reviewer for the positive comments about the potential implication of our study and on the methods we used.

      On the less positive side, even though I am aware that in this type of studies it is difficult to have high N, the very low N in this case makes me worry about the robustness and replicability of the results. I'm sure I have missed it and it's specified somewhere, but why is N different for the different figures? Is it because only 8 people had MEG? The number of trials seems also a somewhat low. Therefore, I feel the authors perhaps need to make an effort to make up for the short number of subjects in order to add confidence to the results. I would strongly recommend to bootstrap the statistical analysis and extract non-parametric confidence intervals instead of showing parametric standard errors whenever is appropriate. When doing that, it must be taken into account that each two of the habenula belong to the same person; i.e. one bootstraps the subjects not the habenula.

      We do understand and appreciate the concern of the reviewer on the low sample numbers due to the strict recruitment criteria for this very early stage clinical trial: 9 patients for bilateral habenula LFPs, and 8 patients with good quality MEGs. Some information to justify the number of trials per condition for each participant has been provided in the reply to the Detailed Comments 1 from Reviewer 2. The sample number used in each analysis was included in the figures and in the main text.

      We have used non-parametric cluster-based permutation approach (Maris and Oostenveld, 2007) for all the main results as shown in Fig. 3-5. Once the clusters (time window and frequency band) with significant differences for different emotional valence conditions have been identified, parametric statistical test was applied to the average values of the clusters to show the direction of the difference. These parametric statistics are secondary to the main non-parametric permutation test.

      In addition, the DICS beamforming method was applied to localize cortical sources exhibiting stimuli-related power changes and cortical sources coherent with deep brain LFPs for each subject for positive and negative emotional valence conditions respectively. After source analysis, source statistics over subjects was performed. Non-parametric permutation testing with or without cluster-based correction for multiple comparisons was applied to statistically quantify the differences in cortical power source or coherence source between negative and positive emotional stimuli.

      References:

      Maris E, Oostenveld R. Nonparametric statistical testing of EEG- and MEG-data. Journal of Neuroscience Methods 2007; 164(1): 177-90.

      Related to this point, the results in Figure 6 seem quite noisy, because interactions (i.e. coherence) are harder to estimate and N is low. For example, I have to make an effort of optimism to believe that Fig 6A is not just noise, and the result in Fig 6C is also a bit weak and perhaps driven by the blue point at the bottom. My read is that the authors didn't do permutation testing here, and just a parametric linear-mixed effect testing. I believe the authors should embed this into permutation testing to make sure that the extremes are not driving the current p-value.

      We have now quantified the coherence between frontal cortex-habenula and occipital cortex-habenula separately (please see more details in the reply to Reviewer 2 (Recommendations for the authors 6). The new analysis showed that the increase in the theta/alpha band coherence around 1 s after the negative stimuli was only observed between prefrontal cortex-habenula and not between occipital cortex-habenula. This supports the argument that Fig. 6A is not just noise.

    1. Author Response

      Reviewer #1:

      Hutchings et al. report an updated cryo-electron tomography study of the yeast COP-II coat assembled around model membranes. The improved overall resolution and additional compositional states enabled the authors to identify new domains and interfaces--including what the authors hypothesize is a previously overlooked structural role for the SEC31 C-Terminal Domain (CTD). By perturbing a subset of these new features with mutants, the authors uncover some functional consequences pertaining to the flexibility or stability of COP-II assemblies.

      Overall, the structural and functional work appears reliable, but certain questions and comments should be addressed prior to publication. However, this reviewer failed to appreciate the conceptual advance that warrants publication in a general biology journal like eLIFE. Rather, this study provides a valuable refinement of our understanding of COP-II that I believe is better suited to a more specialized, structure-focused journal.

      We agree that in our original submission our description of the experimental setup, indeed similar to previous work, did not fully capture the novel findings of this paper. Rather than being simply a higher resolution structure of the COPII coat, in fact we have discovered new interactions in the COPII assembly network, and we have probed their functional roles, significantly changing our understanding of the mechanisms of COPII-mediated membrane curvature. In the revised submission we have included additional genetic data that further illuminate this mechanism, and have rewritten the text to better communicate the novel aspects of our work.

      Our combination of structural, functional and genetic analyses goes beyond refining our textbook understanding of the COPII coat as a simple ‘adaptor and cage’, but rather it provides a completely new picture of how dynamic regulation of assembly and disassembly of a complex network leads to membrane remodelling.

      These new insights have important implications for how coat assembly provides structural force to bend a membrane but is still able to adapt to distinct morphologies. These questions are at the forefront of protein secretion, where there is debate about how different types of carriers might be generated that can accommodate cargoes of different size.

      Major Comments: 1) The authors belabor what this reviewer thinks is an unimportant comparison between the yeast reconstruction of the outer coat vertex with prior work on the human outer coat vertex. Considering the modest resolution of both the yeast and human reconstructions, the transformative changes in cryo-EM camera technology since the publication of the human complex, and the differences in sample preparation (inclusion of the membrane, cylindrical versus spherical assemblies, presence of inner coat components), I did not find this comparison informative. The speculations about a changing interface over evolutionary time are unwarranted and would require a detailed comparison of co-evolutionary changes at this interface. The simpler explanation is that this is a flexible vertex, observed at low resolution in both studies, plus the samples are very different.

      We do agree that our proposal that the vertex interface changes over evolutionary time is speculative and we have removed this discussion. We agree that a co-evolutionary analysis will be enlightening here, but is beyond the scope of the current work.

      We respectfully disagree with the reviewer’s interpretation that the difference between the two vertices is due to low resolution. The interfaces are clearly different, and the resolutions of the reconstructions are sufficient to state this. The reviewer’s suggestion that the difference in vertex orientation might be simply attributable to differences in sample, such as inclusion of the membrane, cylindrical versus spherical morphology, or presence of inner coat components were ruled out in our original submission: we resolved yeast vertices on spherical vesicles (in addition to those on tubes) and on membrane-less cages. These analyses clearly showed that neither the presence of a membrane, nor the change in geometry (tubular vs. spherical) affect vertex interactions. These experiments are presented in Supplementary Fig 4 (Supplementary Fig. 3 in the original version). Similarly, we discount that differences might be due to the presence or absence of inner coat components, since membrane-less cages were previously solved in both conditions and are no different in terms of their vertex structure (Stagg et al. Nature 2006 and Cell 2008).

      We believe it is important to report on the differences between the two vertex structures. Nevertheless, we have shifted our emphasis on the functional aspects of vertex formation and moved the comparison between the two vertices to the supplement.

      2) As one of the major take home messages of the paper, the presentation and discussion of the modeling and assignment of the SEC31-CTD could be clarified. First, it isn't clear from the figures or the movies if the connectivity makes sense. Where is the C-terminal end of the alpha-solenoid compared to this new domain? Can the authors plausibly account for the connectivity in terms of primary sequence? Please also include a side-by-side comparison of the SRA1 structure and the CTD homology model, along with some explanation of the quality of the model as measured by Modeller. Finally, even if the new density is the CTD, it isn't clear from the structure how this sub-stoichiometric and apparently flexible interaction enhances stability. Hence, when the authors wrote "when the [CTD] truncated form was the sole copy of Sec31 in yeast, cells were not viable, indicating that the novel interaction we detect is essential for COPII coat function." Maybe, but could this statement be a leap to far? Is it the putative interaction essential, or is the CTD itself essential for reasons that remain to be fully determined?

      The CTD is separated from the C-terminus of the alpha solenoid domain by an extended domain (~350 amino acids) that is predicted to be disordered, and contains the PPP motifs and catalytic fragment that contact the inner coat. This is depicted in cartoon form in Figures 3A and 7, and discussed at length in the text. This arrangement explains why no connectivity is seen, or expected. We could highlight the C-terminus of the alpha-solenoid domain to emphasize where the disordered region should emerge from the rod, but connectivity of the disordered domain to the CTD could arise from multiple positions, including from an adjacent rod.

      The reviewer’s point about the essentiality of the CTD being independent of its interaction with the Sec31 rod, is an important one. The basis for our model that the CTD enhances stability or rigidity of the coat is the yeast phenotype of Sec31-deltaCTD, which resembles that of a sec13 null. Both mutants are lethal, but rescued by deletion of emp24, which leads to more easily deformable membranes (Čopič et al. Science 2012). We agree that even if this model is true, the interaction of the CTD with Sec31 that our new structure reveals is not proven to drive rigidity or essentiality. We have tempered this hypothesis and added alternative possibilities to the discussion.

      We have included the SRA1 structure in Supplementary Fig 5, as requested, and the model z-score in the Methods. The Z-score, as calculated by the proSA-web server is -6.07 (see figure below, black dot), and falls in line with experimentally determined structures including that of the template (PDB 2mgx, z-score = -5.38).

      img

      3) Are extra rods discussed in Fig. 4 are a curiosity of unclear functional significance? This reviewer is concerned that these extra rods could be an in vitro stoichiometry problem, rather than a functional property of COP-II.

      This is an important point, that, as we state in the paper, cannot be answered at the moment: the resolution is too low to identify the residues involved in the interaction. Therefore we are hampered in our ability to assess the physiological importance of this interaction. We still believe the ‘extra’ rods are an important observation, as they clearly show that another mode of outer coat interaction, different from what was reported before, is possible.

      The concern that interactions visualised in vitro might not be physiologically relevant is broadly applicable to structural biology approaches. However, our experimental approach uses samples that result from active membrane remodelling under near-physiological conditions, and we therefore expect these to be less prone to artefacts than most in vitro reconstitution approaches, where proteins are used at high concentrations and in high salt buffer conditions.

      4) The clashsccore for the PDB is quite high--and I am dubious about the reliability of refining sidechain positions with maps at this resolution. In addition to the Ramchandran stats, I would like to see the Ramachandran plot as well as, for any residue-level claims, the density surrounding the modeled side chain (e.g. S742).

      The clashscore is 13.2, which, according to molprobity, is in the 57th percentile for all structures and in the 97th for structures of similar resolutions. We would argue therefore that the clashscore is rather low. In fact, the model was refined from crystal structures previously obtained by other groups, which had worse clashscore (17), despite being at higher resolution. Our refinement has therefore improved the clashscore. During refinement we have chosen restraint levels appropriate to the resolution of our map (Afonine et al., Acta Cryst D 2018)

      The Ramachandran plot is copied here and could be included in a supplemental figure if required. We make only one residue-level claim (S742), the density for which is indeed not visible at our resolution. We claim that S742 is close to the Sec23-23 interface, and do not propose any specific interactions. Nevertheless we have removed reference to S742 from the manuscript. We included this specific information because of the potential importance of this residue as a site of phosphorylation, thereby putting this interface in broader context for the general eLife reader.

      img

      Minor Comments:

      1) The authors wrote "To assess the relative positioning of the two coat layers, we analysed the localisation of inner coat subunits with respect to each outer coat vertex: for each aligned vertex particle, we superimposed the positions of all inner coat particles at close range, obtaining the average distribution of neighbouring inner coat subunits. From this 'neighbour plot' we did not detect any pattern, indicating random relative positions. This is consistent with a flexible linkage between the two layers that allows adaptation of the two lattices to different curvatures (Supplementary Fig 1E)." I do not understand this claim, since the pattern both looks far from random and the interactions depend on molecular interactions that are not random. Please clarify.

      We apologize for the confusion: the pattern of each of the two coats are not random. Our sentence refers to the positions of inner and outer coats relative to each other. The two lattices have different parameters and the two layers are linked by flexible linkers (the 350 amino acids referred to above). We have now clarified the sentence.

      2) Related to major point #1, the author wrote "We manually picked vertices and performed carefully controlled alignments." I do now know what it means to carefully control alignments, and fear this suggests human model bias.

      We used different starting references for the alignments, with the precise aim to avoid model bias. For both vesicle and cage vertex datasets, we have aligned the subtomograms against either the vertex obtained from tubules, or the vertex from previously published membrane-less cages. In all cases, we retrieved a structure that resembles the one on tubules, suggesting that the vertex arrangement we observe isn’t simply the result of reference bias. This procedure is depicted in Supplementary Fig 4 (Supplementary Fig. 3 in the original manuscript), but we have now clarified it also in the methods section.

      3) Why do some experiments use EDTA? I may be confused, but I was surprised to see the budding reaction employed 1mM GMPPNP, and 2.5mM EDTA (but no Magnesium?). Also, for the budding reaction, please replace or expand upon the "the 10% GUV (v/v)" with a mass or molar lipid-to-protein ratio.

      We regret the confusion. As stated in the methods, all our budding reactions are performed in the presence of EDTA and Magnesium, which is present in the buffer (at 1.2 mM). The reason is to facilitate nucleotide exchange, as reported and validated in Bacia et al., Scientific Reports 2011.

      Lipids in GUV preparations are difficult to quantify. We report the stock concentrations used, but in each preparation the amount of dry lipid that forms GUVs might be different, as is the concentration of GUVs after hydration. However since we analyse reactions where COPII proteins have bound and remodelled individual GUVs, we do not believe the protein/lipid ratio influences our structures.

      4) Please cite the AnchorMap procedure.

      We cite the SerialEM software, and are not aware of other citations specifically for the anchor map procedure.

      5) Please edit for typos (focussing, functionl, others)

      Done

      Reviewer #2:

      The manuscript describes new cryo-EM, biochemistry, and genetic data on the structure and function of the COPII coat. Several new discoveries are reported including the discovery of an extra density near the dimerization region of Sec13/31, and "extra rods" of Sec13/31 that also bind near the dimerization region. Additionally, they showed new interactions between the Sec31 C-terminal unstructured region and Sec23 that appear to bridge multiple Sec23 molecules. Finally, they increased the resolution of the Sec23/24 region of their structure compared to their previous studies and were able to resolve a previously unresolved L-loop in Sec23 that makes contact with Sar1. Most of their structural observations were nicely backed up with biochemical and genetic experiments which give confidence in their structural observations. Overall the paper is well-written and the conclusions justified.

      However, this is the third iteration of structure determination of the COPII coat on membrane with essentially the same preparation and methods. Each time, there has been an incremental increase in resolution and new discoveries, but the impact of the present study is deemed to be modest. The science is good, but it may be more appropriate for a more specialized journal. Areas of specific concern are described below.

      As described above, we respectfully disagree with this interpretation of the advance made by the current work. This work improves on previous work in many aspects. The resolution of the outer coat increases from over 40A to 10-12A, allowing visualisation of features that were not previously resolved, including a novel vertex arrangement, the Sec31 CTD, and the outer coat ‘extra rods’. An improved map of the inner coat also allows us to resolve the Sec23 ‘L-loop’. We would argue that these are not just extra details, but correspond to a suite of novel interactions that expand our understanding of the complex COPII assembly network. Moreover, we include biochemical and genetic experiments that not only back up our structural observations but bring new insights into COPII function. As pointed out in response to reviewer 1, we believe our work contributes a significant conceptual advance, and have modified the manuscript to convey this more effectively.

      1) The abstract is vague and should be re-written with a better description of the work.

      We have modified the abstract to specifically outline what we have done and the major new discoveries of this paper.

      2) Line 166 - "Surprisingly, this mutant was capable of tubulating GUVs". This experiment gets to one of the fundamental unknown questions in COPII vesiculation. It is not clear what components are driving the membrane remodeling and at what stages during vesicle formation. Isn't it possible that the tubulation activity the authors observe in vitro is not being driven at all by Sec13/31 but rather Sec23/24-Sar1? Their Sec31ΔCTD data supports this idea because it lacks a clear ordered outer coat despite making tubules. An interesting experiment would be to see if tubules form in the absence of all of Sec13/31 except the disordered domain of Sec31 that the authors suggest crosslinks adjacent Sec23/24s.

      This is an astute observation, and we agree with the reviewer that the source of membrane deformation is not fully understood. We favour the model that budding is driven significantly by the Sec23-24 array. To further support this, we have performed a new experiment, where we expressed Sec31ΔN in yeast cells lacking Emp24, which have more deformable membranes and are tolerant to the otherwise lethal deletion of Sec13. While Sec31ΔN in a wild type background did not support cell viability, this was rescued in a Δemp24 yeast strain, strongly supporting the hypothesis that a major contributor to membrane remodelling is the inner coat, with the outer coat becoming necessary to overcome membrane bending resistance that ensues from the presence of cargo. We now include these results in Figure 1.

      However, we must also take into account the results presented in Fig. 6, where we show that weakening the Sec23-24 interface still leads to budding, but only if Sec13-31 is fully functional, and that in this case budding leads to connected pseudo-spherical vesicles rather than tubes. When Sec13-31 assembly is also impaired, tubes appear unstructured. We believe this strongly supports our conclusions that both inner and outer coat interactions are fundamental for membrane remodelling, and it is the interplay between the two that determines membrane morphology (i.e. tubes vs. spheres).

      To dissect the roles of inner and outer coats even further, we have done the experiment that the reviewer suggests: we expressed Sec31768-1114, but the protein was not well-behaved and co-purified with chaperones. We believe the disordered domain aggregates when not scaffolded by the structured elements of the rod. Nonetheless, we used this fragment in a budding reaction, and could not see any budding. We did not include this experiment as it was inconclusive: the lack of functionality of the purified Sec31 fragment could be attributed to the inability of the disordered region to bind its inner coat partner in the absence of the scaffolding Sec13-31 rod. As an alternative approach, we have used a version of Sec31 that lacks the CTD, and harbours a His tag at the N-terminus (known from previous studies to partially disrupt vertex assembly). We think this construct is more likely to be near native, since both modifications on their own lead to functional protein. We could detect no tubulation with this construct by negative stain, while both control constructs (Sec31ΔCTD and Nhis-Sec31) gave tubulation. This suggests that the cross-linking function of Sec31 is not sufficient to tubulate GUV membranes, but some degree of functional outer coat organisation (either mediated by N- or C-terminal interactions) is needed. It is also possible that the lack of outer coat organisation might lead to less efficient recruitment to the inner coat and cross-linking activity. We have added this new observation to the manuscript.

      3) Line 191 - "Inspecting cryo-tomograms of these tubules revealed no lozenge pattern for the outer 192 coat" - this phrasing is vague. The reviewer thinks that what they mean is that there is a lack of order for the Sec13/31 layer. Please clarify.

      The reviewer is correct, we have changed the sentence.

      4) Line 198 - "unambiguously confirming this density corresponds to 199 the CTD." This only confirms that it is the CTD if that were the only change and the Sec13/31 lattice still formed. Another possibility is that it is density from other Sec13/31 that only appears when the lattice is formed such as the "extra rods". One possibility is that the density is from the extra rods. The reviewer agrees that their interpretation is indeed the most likely, but it is not unambiguous. The authors should consider cross-linking mass spectrometry.

      We have removed the word ‘unambiguously’, and changed to ‘confirming that this density most likely corresponds to the CTD’. Nonetheless, we believe that our interpretation is correct: the extra rods bind to a different position, and themselves also show the CTD appendage. In this experiment, the lack of the CTD was the only biochemical change.

      5) In the Sec31ΔCTD section, the authors should comment on why ΔCTD is so deleterious to oligomer organization in yeast when cages form so abundantly in preparations of human Sec13/31 ΔC (Paraan et al 2018).

      We have added a comment to address this. “Interestingly, human Sec31 proteins lacking the CTD assemble in cages, indicating that either the vertex is more stable for human proteins and sufficient for assembly, or that the CTD is important in the context of membrane budding but not for cage formation in high salt conditions.”

      6) The data is good for the existence of the "extra rods", but significance and importance of them is not clear. How can these extra densities be distinguished from packing artifacts due to imperfections in the helical symmetry.

      Please also see our response to point 3 from reviewer 1. Regarding the specific concern that artefacts might be a consequence of imperfection in the helical symmetry, we would argue such imperfections are indeed expected in physiological conditions, and to a much higher extent. For this reason interactions seen in the context of helical imperfections are likely to be relevant. In fact, in normal GTP hydrolysis conditions, we expect long tubes would not be able to form, and the outer coat to be present on a wide range of continuously changing membrane curvatures. We think that the ability of the coat to form many interactions when the symmetry is imperfect might be exactly what confers the coat its flexibility and adaptability.

      7) Figure 5 is very hard to interpret and should be redone. Panels B and C are particularly hard to interpret.

      We have made a new figure where we think clarity is improved.

      8) The features present in Sec23/24 structure do not reflect the reported resolution of 4.7 Å. It seems that the resolution is overestimated.

      We report an average resolution of 4.6 Å. In most of our map we can clearly distinguish beta strands, follow the twist of alpha helices and see bulky side chains. These features typically become visible at 4.5-5A resolution. We agree that some areas are worse than 4.6 Å, as typically expected for such a flexible assembly, but we believe that the average resolution value reported is accurate. We obtained the same resolution estimate using different software including relion, phenix and dynamo, so that is really the best value we can provide. To further convince ourselves that we have the resolution we claim, we sampled EM maps from the EMDB with the same stated resolution (we just took the 7 most recent ones which had an associated atomic model), and visualised their features at arbitrary positions. For both beta strands and alpha helices, we do not feel our map looks any worse than the others we have examined. We include a figure here.

      img

      9) Lines 315/316 - "We have combined cryo-tomography with biochemical and genetic assays to obtain a complete picture of the assembled COPII coat at unprecedented resolution (Fig. 7)"

      10) Figure 7. is a schematic model/picture the authors should reference a different figure or rephrase the sentence.

      We now refer to Fig 7 in a more appropriate place.

      Reviewer #3:

      The manuscript by Hutchings et al. describes several previously uncharacterised molecular interactions in the coats of COP-II vesicles by using a reconstituted coats of yeast COPI-II. They have improved the resolution of the inner coat to 4.7A by tomography and subtomogram averaging, revealing detailed interactions, including those made by the so-called L-loop not observed before. Analysis of the outer layer also led to new interesting discoveries. The sec 31 CTD was assigned in the map by comparing the WT and deletion mutant STA-generated density maps. It seems to stabilise the COP-II coats and further evidence from yeast deletion mutants and microsome budding reconstitution experiments suggests that this stabilisation is required in vitro. Furthermore, COP-II rods that cover the membrane tubules in right-handed manner revealed sometimes an extra rod, which is not part of the canonical lattice, bound to them. The binding mode of these extra rods (which I refer to here a Y-shape) is different from the canonical two-fold symmetric vertex (X-shape). When the same binding mode is utilized on both sides of the extra rod (Y-Y) the rod seems to simply insert in the canonical lattice. However, when the Y-binding mode is utilized on one side of the rod and the X-binding mode on the other side, this leads to bridging different lattices together. This potentially contributes to increased flexibility in the outer coat, which maybe be required to adopt different membrane curvatures and shapes with different cargos. These observations build a picture where stabilising elements in both COP-II layers contribute to functional cargo transport. The paper makes significant novel findings that are described well. Technically the paper is excellent and the figures nicely support the text. I have only minor suggestions that I think would improve the text and figure.

      We thank the reviewer for helpful suggestions which we agree improve the manuscript.

      Minor Comments:

      L 108: "We collected .... tomograms". While the meaning is clear to a specialist, this may sound somewhat odd to a generic reader. Perhaps you could say "We acquired cryo-EM data of COP-II induced tubules as tilt series that were subsequently used to reconstruct 3D tomograms of the tubules."

      We have changed this as suggested

      L 114: "we developed an unbiased, localisation-based approach". What is the part that was developed here? It seems that the inner layer particle coordinates where simply shifted to get starting points in the outer layer. Developing an approach sounds more substantial than this. Also, it's unclear what is unbiased about this approach. The whole point is that it's biased to certain regions (which is a good thing as it incorporates prior knowledge on the location of the structures).

      We have modified the sentence to “To target the sparser outer coat lattice for STA, we used the refined coordinates of the inner coat to locate the outer coat tetrameric vertices”, and explain the approach in detail in the methods.

      L 124: "The outer coat vertex was refined to a resolution of approximately ~12 A, revealing unprecedented detail of the molecular interactions between Sec31 molecules (Supplementary Fig 2A)". The map alone does not reveal molecular interactions; the main understanding comes from fitting of X-ray structures to the low-resolution map. Also "unprecedented detail" itself is somewhat problematic as the map of Noble et al (2013) of the Sec31 vertex is also at nominal resolution of 12 A. Furthermore, Supplementary Fig 2A does not reveal this "unprecedented detail", it shows the resolution estimation by FSC. To clarify, these points you could say: "Fitting of the Sec31 atomic model to our reconstruction vertex at 12-A resolution (Supplementary Fig 2A) revealed the molecular interactions between different copies of Sec31 in the membrane-assembled coat.

      We have changed the sentence as suggested.

      L 150: Can the authors exclude the possibility that the difference is due to differences in data processing? E.g. how the maps amplitudes have been adjusted?

      Yes, we can exclude this scenario by measuring distances between vertices in the right and left handed direction. These measurements are only compatible with our vertex arrangement, and cannot be explained by the big deviation from 4-fold symmetry seen in the membrane-less cage vertices.

      L 172: "that wrap tubules either in a left- or right-handed manner". Don't they do always both on each tubule? Now this sentence could be interpreted to mean that some tubules have a left-handed coat and some a right-handed coat.

      We have changed this sentence to clarify. “Outer coat vertices are connected by Sec13-31 rods that wrap tubules both in a left- and right-handed manner.”

      L276: "The difference map" hasn't been introduced earlier but is referred to here as if it has been.

      We now introduce the difference map.

      L299: Can "Secondary structure predictions" denote a protein region "highly prone to protein binding"?

      Yes, this is done through DISOPRED3, a feature include in the PSIPRED server we used for our predictions. The reference is: Jones D.T., Cozzetto D. DISOPRED3: precise disordered region predictions with annotated protein-binding activity Bioinformatics. 2015; 31:857–863. We have now added this reference to the manuscript.

      L316: It's true that the detail in the map of the inner coat is unprecedented and the model presented in Figure 7 is partially based on that. But here "unprecedented resolution" sounds strange as this sentence refers to a schematic model and not a map.

      We have changed this by moving the reference to Fig 7 to a more appropriate place

      L325: "have 'compacted' during evolution" -> remove. It's enough to say it's more compact in humans and less compact in yeast as there could have been different adaptations in different organisms at this interface.

      We have changed as requested. See also our response to reviewer 1, point 1.

      L327: What's exactly meant by "sequence diversity or variability at this density".

      We have now clarified: “Since multiple charge clusters in yeast Sec31 may contribute to this interaction interface (Stancheva et al., 2020), the low resolution could be explained by the fact that the density is an average of different sequences.”

      L606-607: The description of this custom data processing approach is difficult to follow. Why is in-plane flip needed and how is it used here?

      Initially particles are picked ignoring tube directionality (as this cannot be assessed easily from the tomograms due to the pseudo-twofold symmetry of the Sec23/24/Sar1 trimer). So the in plane rotation of inner coat subunit could be near 0 or 180°. For each tube, both angles are sampled (in-plane flip). Most tubes result in the majority of particles being assigned one of the two orientations (which is then assumed as the tube directionality). Particles that do not conform are removed, and rare tubes where directionality cannot be determined are also removed. We have re-written the description to clarify these points: “Initial alignments were conducted on a tube-by-tube basis using the Dynamo in-plane flip setting to search in-plane rotation angles 180° apart. This allowed to assign directionality to each tube, and particles that were not conforming to it were discarded by using the Dynamo dtgrep_direction command in custom MATLAB scripts”

      L627: "Z" here refers to the coordinate system of aligned particles not that of the original tomogram. Perhaps just say "shifted 8 pixels further away from the membrane".

      Changed as requested.

      L642-643: How can the "left-handed" and "right-handed" rods be separated here? These terms refer to the long-range organisation of the rods in the lattice it's not clear how they were separated in the early alignments.

      They are separated by picking only one subset using the dynamo sub-boxing feature. This extracts boxes from the tomogram which are in set positions and orientation relative to the average of previously aligned subtomograms. From the average vertex structure, we sub-box rods at 4 different positions that correspond to the centre of the rods, and the 2-fold symmetric pairs are combined into the same dataset. We have clarified this in the text: “The refined positions of vertices were used to extract two distinct datasets of left and right-handed rods respectively using the dynamo sub-boxing feature.”

      Figure 2B. It's difficult to see the difference between dark and light pink colours.

      We have changed colours to enhance the difference.

      Figure 3C. These panels report the relative frequency of neighbouring vertices at each position; "intensity" does not seem to be the right measure for this. You could say that the colour bar indicates the "relative frequency of neighbouring vertices at each position" and add detail how the values were scaled between 0 and 1. The same applies to SFigure 1E.

      Changed as requested.

      Figure 4. The COP-II rods themselves are relatively straight, and they are not left-handed or right-handed. Here, more accurate would be "architecture of COPII rods organised in a left-handed manner". (In the text the authors may of course define and then use this shorter expression if they so wish.) Panel 4B top panel could have the title "left-handed" and the lower panel should have the title "right-handed" (for consistency and clarity).

      We have now defined left- and right-handed rods in the text, and have changed the figure and panel titles as requested.

    1. Author response:

      The following is the authors’ response to the original reviews.

      Reviewer #1 (Public Review):

      Summary:

      The study conducted by the Schuldiner's group advances the understanding of mitochondrial biology through the utilization of their bi-genomic (BiG) split-GFP assay, which they had previously developed and reported. This research endeavors to consolidate the catalog of matrix and inner membrane mitochondrial proteins. In their approach, a genetic framework was employed wherein a GFP fragment (GFP1-10) is encoded within the mitochondrial genome. Subsequently, a collection of strains was created, with each strain expressing a distinct protein tagged with the GFP11 fragment. The reconstitution of GFP fluorescence occurs upon the import of the protein under examination into the mitochondria.

      We are grateful for the positive evaluation. We would like to clarify that the bi-genomic (BiG) split-GFP assay was developed by the labs of H. Becker and Roza Kucharzyk by highly laborious construction of the strain with mtDNA-encoded GFP<sub>1-10</sub> (Bader et al, 2020). 

      Strengths:

      Notably, this assay was executed under six distinct conditions, facilitating the visualization of approximately 400 mitochondrial proteins. Remarkably, 50 proteins were conclusively assigned to mitochondria for the first time through this methodology. The strains developed and the extensive dataset generated in this study serve as a valuable resource for the comprehensive study of mitochondrial biology. Specifically, it provides a list of 50 "eclipsed" proteins whose role in mitochondria remains to be characterized.

      Weaknesses:

      The work could include some functional studies of at least one of the newly identified 50 proteins.

      In response to this we have expanded the characterization of phenotypic effects resulting from changing the targeting signal and expression levels of the dually localized Gpp1 protein and expanded the data in Fig. 3, panels H and I.

      Reviewer #2 (Public Review):

      The authors addressed the question of how mitochondrial proteins that are dually localized or only to a minor fraction localized to mitochondria can be visualized on the whole genome scale. For this, they used an established and previously published method called BiG split-GFP, in which GFP strands 1-10 are encoded in the mitochondrial DNA and fused the GFP11 strand C-terminally to the yeast ORFs using the C-SWAT library. The generated library was imaged under different growth and stress conditions and yielded positive mitochondrial localization for approximately 400 proteins. The strength of this method is the detection of proteins that are dually localized with only a minor fraction within mitochondria, which so far has hampered their visualization due to strong fluorescent signals from other cellular localizations. The weakness of this method is that due to the localization of the GFP1-10 in the mitochondrial matrix, only matrix proteins and IM proteins with their C-termini facing the matrix can be detected. Also, proteins that are assembled into multimeric complexes (which will be the case for probably a high number of matrix and inner membrane-localized proteins) resulting in the C-terminal GFP11 being buried are likely not detected as positive hits in this approach. Taking these limitations into consideration, the authors provide a new library that can help in the identification of eclipsed protein distribution within mitochondria, thus further increasing our knowledge of the complete mitochondrial proteome. The approach of global tagging of the yeast genome is the logical consequence after the successful establishment of the BiG split-GFP for mitochondria. The authors also propose that their approach can be applied to investigate the topology of inner membrane proteins, however, for this, the inherent issue remains that it cannot be excluded that even the small GFP11 tag can impact on protein biogenesis and topology. Thus, the approach will not overcome the need to assess protein topology analysis via biochemical approaches on endogenous untagged proteins.

      Reviewer #3 (Public Review):

      Summary:

      Here, Bykov et al move the bi-genomic split-GFP system they previously established to the genomewide level in order to obtain a more comprehensive list of mitochondrial matrix and inner membrane proteins. In this very elegant split-GFP system, the longer GFP fragment, GFP1-10, is encoded in the mitochondrial genome and the shorter one, GFP11, is C-terminally attached to every protein encoded in the genome of yeast Saccharomyces cerevisiae. GFP fluorescence can therefore only be reconstituted if the C-terminus of the protein is present in the mitochondrial matrix, either as part of a soluble protein, a peripheral membrane protein, or an integral inner membrane protein. The system, combined with high-throughput fluorescence microscopy of yeast cells grown under six different conditions, enabled the authors to visualize ca. 400 mitochondrial proteins, 50 of which were not visualised before and 8 of which were not shown to be mitochondrial before. The system appears to be particularly well suited for analysis of dually localized proteins and could potentially be used to study sorting pathways of mitochondrial inner membrane proteins.

      Strengths:

      Many fluorescence-based genome-wide screens were previously performed in yeast and were central to revealing the subcellular location of a large fraction of yeast proteome. Nonetheless, these screens also showed that tagging with full-length fluorescent proteins (FP) can affect both the function and targeting of proteins. The strength of the system used in the current manuscript is that the shorter tag is beneficial for the detection of a number of proteins whose targeting and/or function is affected by tagging with full-length FPs.

      Furthermore, the system used here can nicely detect mitochondrial pools of dually localized proteins. It is especially useful when these pools are minor and their signals are therefore easily masked by the strong signals coming from the major, nonmitochondrial pools of the proteins.

      Weaknesses:

      My only concern is that the biological significance of the screen performed appears limited. The dataset obtained is largely in agreement with several previous proteomic screens but it is, unfortunately, not more comprehensive than them, rather the opposite. For proteins that were identified inside mitochondria for the first time here or were identified in an unexpected location within the organelle, it remains unclear whether these localizations represent some minor, missorted pools of proteins or are indeed functionally important fractions and/or productive translocation intermediates. The authors also allude to several potential applications of the system but do little to explore any of these directions.

      We agree with the reviewer that a single method may not be used for the construction of the complete protein inventory of an organelle or its sub-compartment. We suggest that the value of our assay is in providing a complementary view to the existing data and approaches. For example, we confirm the matrix localization of several proteins that were only found in the two proteomic data and never verified before (Vögtle et al, 2017; Morgenstern et al, 2017). Given that proteomics is a very sensitive technique and false positives are hard to completely exclude, our complementary verification is valuable.

      Reviewer #1 (Recommendations for the authors):

      In my opinion, the manuscript can be published as it is, and I would expect that future work will advance the functional properties of the newly found mitochondrial proteins.

      We thank the reviewer for their positive evaluation

      Reviewer #2 (Recommendations for the authors)

      (1) Due to the localization of the GFP1-10 in the matrix, only matrix and IM proteins with C-termini facing the matrix can be detected, this should be added e.g. in the heading of the first results part and discussed earlier in the manuscript. In addition, the limitation that assembly into protein complexes will likely preclude detection of matrix and IM proteins needs to be discussed.

      To address the first point, we edited the title of the first section to only mention the visualization of the matrix-facing proteome and remove the words “inner membrane”. We also clarified early in the Results section that we only consider the matrix-facing C-termini by extending the sentence early in the results section “To compare our findings with published data, we created a unified list of 395 proteins that are observed with high confidence using our assay indicating that their C-terminus is positioned in the matrix (Fig. 2 – figure supplement 1B-D, Table S1).” (P. 6 Lines 1-3). Concluding the comparison with the earlier proteomic studies we also added the sentence “Many proteins are missing because their C-termini are facing the IMS” (P.8 Line 2). 

      To address the second point concerning the possible interference of the complex assembly and protein detection by our assay, we conducted an additional analysis. The analysis takes advantage of the protein complexes with known structures where we could estimate if the C-terminus with the GFP<sub>11</sub> tag would be available for GFP1-10 binding. We added the additional figure (Figure 3 – figure supplement 2) and following text in the Results section (P.7 Lines 22-34): 

      “To examine the influence of protein complex assembly on the performance of the BiG Mito-Split assay we analyzed the published structures of the mitoribosome and ATP synthase (Desai et al, 2017; Srivastava et al, 2018; Guo et al, 2017) and classified all proteins as either having C-termini in, or out of,  the complex. There was no difference between the “in” and “out” groups in the percentage observed in the BiG Mito-Split collection (Fig. 3 – figure supplement 2A) suggesting that the majority of the GFP11tagged proteins have a chance to interact with GFP1-10 before (or instead of) assembling into the complex. PCR and western blot verification of eight strains with the tagged complex subunits for which we observed no signal showed that mitoribosomal proteins were incorrectly tagged or not expressed, and the ATP synthase subunits Atp7, Atp19, and Atp20 were expressed (Fig. 3 – Supplement 2B). Atp19 and Atp20 have their C-termini most likely oriented towards the IMS (Guo et al, 2017) while Atp7 is completely in the matrix and may be the one example of a subunit whose assembly into a complex prevents its detection by the BiG Mito-Split assay.”

      We also consider related points on the interference of the tag and the influence of protein essentiality in the replies to points 3) and 12) of these reviews.

      (2) The imaging data is of high quality, but the manuscript would greatly benefit from additional analysis to support the claims or hypothesis brought forward by the authors. The idea that the nonmitochondrial proteins are imported due to their high sequence similarity to MTS could be easily addressed at least for some of these proteins via import studies, as also suggested by the authors.

      The idea that non-mitochondrial proteins may be imported into mitochondria due to occasional sequence similarity was recently demonstrated experimentally by (Oborská-Oplová et al, 2025). We incorporate this information in the Discussion section as follows (P. 14 Lines 10-16):

      “It was also recently shown that the r-protein uS5 (encoded by RPS2 in yeast) has a latent MTS that is masked by a special mitochondrial avoidance segment (MAS) preceding it (Oborská-Oplová et al, 2025). The removal of the MAS leads to import of uS5 into mitochondria killing the cells. The case of uS5 is an example of occasional similarity between an r-protein and an MTS caused by similar requirements of positive charges for rRNA binding and mitochondrial import. It remains unclear if other r-proteins have a MAS and if there are other mechanisms that protect mitochondria from translocation of cytosolic proteins.”

      We also conducted additional analysis to substantiate the claim that ribosomal (r)-proteins are similar in their physico-chemical properties to MTS-containing mitochondrial proteins. For this we chose not to use prediction algorithms like TartgetP and MitoFates that were already trained on the same dataset of yeast proteins to discriminate cytosolic and mitochondrial localization. Instead, we extended the analysis earlier made by (Woellhaf et al, 2014) and calculated several different properties such as charge, hydrophobicity, hydrophobic moment and amino acid content for mitochondrial MTS-containing proteins, cytosolic non-ribosomal proteins, and r-proteins. The analysis showed striking similarity of r-proteins and mitochondrial proteins. We incorporate a new Figure 3 – figure supplement 3 and the following text in the Results section (P. 8 Lines14-22): 

      “Five out of eight proteins are components of the cytosolic ribosome (r-proteins). In agreement with previous reports (Woellhaf et al, 2014) we find that their unique properties, such as charge, hydrophobicity and amino acid content, are indeed more similar to mitochondrial proteins than to cytosolic ones (Fig. 3 – figure supplement 3). Additional experiments with heterologous protein expression and in vitro import will be required to confirm the mitochondrial import and targeting mechanisms of these eight non-mitochondrial proteins. The data highlights that out of hundreds of very abundant proteins with high prediction scores only few are actually imported and highlights the importance of the mechanisms that help to avoid translocation of wrong proteins (Oborská-Oplová et al, 2025).”

      To further prove the possibility of r-protein import into mitochondria we aimed to clone the r-proteins identified in this work for cell-free expression and import into purified mitochondria. Despite the large effort, we have succeeded in cloning and efficiently expressing only Rpl23a (Author response image 1 A). Rpl23a indeed forms proteinase-protected fractions in a membrane potential-dependent manner when incubated with mitochondria. The inverse import dynamics of Rpl23a could be either indicative of quick degradation inside mitochondria or of background signal during the import experiments (Author response image 1.A). To address the r-protein degradation possibility, we measured how does GFP signal change in the BiG Mito-Split diploid collection strains after blocking cytosolic translation with cycloheximide (CHX). For this we selected Mrpl12a, that had one of the highest signals. We did not detect any drop in fluorescence signal for Rpl12a and the control protein Mrpl6 (Author response image 1 B). This might indicate the lack of degradation, or the degradation of the whole protein except GFP<sub>11</sub> that remains connected to GFP<sub>1-10</sub>. Due to time constrains we could not perform all experiments for the whole set of potentially imported r-proteins. Since more experiments are required to clearly show the mechanisms of mitochondrial r-protein import, degradation, and toxicity, or possible moonlighting functions (such as import into mitochondria derived from pim1∆ strain, degradation assays, fractionations, and analyses with antibodies for native proteins) we decided not to include this new data into the manuscript itself.

      Author response image 1.

      The import of r-proteins into mitochondria and their stability. (A) Rpl23 was synthesized in vitro (Input), radiolabeled, and imported into mitochondria isolated from BY4741 strain as described before (Peleh et al, 2015); the import was performed for 5,10, or 15 minutes and mitochondria were treated with proteinase K (PK) to degrade nonimported proteins; some reactions were treated with the mix of valinomycin, antimycin, and oligomycin (VAO) to dissipate mitochondrial membrane potential; the proteins were visualized by SDS-PAGE and autoradiography (B) The strains from the diploid BiG Mito-Split collection were grown in YPD to mid-logarithmic growth phase, then CHX was added to block translation and cell aliquots were taken from the culture and analyzed by fluorescence microscopy at the indicated time points. Scale bar is 5 µm.

      (3) The claim that the approach can be used to assess the topology of inner membrane proteins is problematic as the C-terminal tag can alter the biogenesis pathway of the protein or impact on the translocation dynamics (in particular as the imaging method applied here does not allow for analysis of dynamics). The hypothesis that the biogenesis route can be monitored is therefore far-reaching. To strengthen the hypothesis the authors should assess if the C-terminal GFP11 influences protein solubility by assessing protein aggregation of e.g. Rip1.

      We agree with the reviewer that the tag and assembly of GFP<sub>1-10/11</sub> can further complicate the assessment of topology of the IM proteins that already have complex biogenesis routes (lateral transfer, conservative, and a Rip1-specific Bcs1 pathway). To emphasize that the assessment of the steady state topology needs to be backed up by additional biochemical approaches, we edited the beginning of the corresponding Results sections as follows (P. 11 Lines 2-6): 

      “Studying membrane protein biogenesis requires an accurate way to determine topology in vivo. The mitochondrial IM is one of the most protein-rich membranes in the cell supporting a wide variety of TMD topologies with complex biogenesis pathways. We aimed to find out if our BiG Mito-Split collection can accurately visualize the steady-state localization of membrane protein C-termini protruding into the matrix or trap protein transport intermediates” (inserted text is underlined).

      The collection that we studied by microscopy is diploid and contains one WT copy of each 3xGFP<sub>11</sub>tagged gene. To assess the influence of the tag on the protein function we performed growth assays with haploid strains which have one 3xGFP<sub>11</sub>-tagged gene copy and no GFP<sub>1-10</sub>. We find that Rip13xGFP<sub>11</sub> displays slower growth on glycerol at 30˚C and even slower at 37˚C while tagged Qcr8, Qcr9, and Qcr10 grow normally (Author response image 2 A). Based on the growth assays and microscopy it is not possible to conclude whether the “Qcr” proteins’ biogenesis is affected by the tag. It may be that laterally sorted proteins are functional with the tag and constitute the majority while only a small portion is translocated into the matrix, trapped and visualized with GFP<sub>1-10</sub>. In case of Rip1 it was shown that C-terminal tag can affect its interaction with the chaperone Mzm1 and promote Rip1 aggregation (Cui et al, 2012). The extent of Rip1 function disruption can be different and depends on the tag. We hypothesize that our split-assay may trap the pre-translocation intermediate of Rip1 and can be helpful to study its interactors. To test this, we performed anti-GFP immune-precipitation (IP) using GFP-Trap beads (Author response image 2 B).

      Author response image 2.

      The influence of 3x-GFP11 on the function and processing of the inner membrane proteins. (A) Drop dilution assays with haploid strains from C-SWAT 3xGFP<Sub>11</sub> library on fermentative (YPD) and respiratory (YPGlycerol) media at different temperatures. (B) Immuno-precipitation with GFP-Trap agarose was performed on haploid strain that has only Rip1-3xGFP<sub>11</sub> and on the diploid strain derived from this haploid mated with BiG Mito-Split strain containing mtGFP<sub>1-10</sub> and WT untagged Rip1 using the lysis (1% TX-100) and washing protocols provided by the manufacturer; the total (T) and eluted with the Laemmli buffer (IP) samples were analyzed by immunoblotting with polyclonal rabbit antibodies against GFP (only visualizes GFP<Sub>11</sub> in these samples) and Rip1 (visualizes both tagged and WT Rip1). Polyclonal home-made rabbit antisera for GFP and Rip1 were kindly provided by Johannes Herrmann (Kaiserslautern) and Thomas Becker (Bonn); the antisera were diluted 1:500 for decorating the membranes.

      We find that the haploid strain with Rip1-3xGFP<sub>11</sub> contains not only mature (m) and intermediate (i) forms but also an additional higher Mw band that we interpreted as precursor that was not cleaved by MPP. WT Rip1 in the diploid added two more lower Mw bands: (m) and (i) forms of the untagged Rip1. IP successfully enriched GFP<sub>1-10</sub> fragment as visualized by anti-GFP staining. Interestingly only the highest Mw Rip1-3xGFP<sub>11</sub> band was also enriched when anti-Rip1 antibodies were used to analyze the samples. This suggests that Rip1 precursor gets completely imported and interacts with GFP<sub>1-10</sub> and can be pulled down. It is however not processed. Processed Rip1 is not interacting with GFP<sub>1-10</sub>. Based on the literature we expect all Rip1 in the matrix to be cleaved by MPP including the one interacting with GFP. Due to this discrepancy, we did not include this data in the manuscript. This is however clear that the assay may be useful to analyze biogenesis intermediates of the IM and matrix proteins. To emphasize this, we added information on the C-terminal tagging of Rip1 in the Results section (P. 11 Lines 18-20):

      “It was shown that a C-terminal tag on Rip1 can prevent its interaction with the chaperone Mzm1 and promote aggregation in the matrix (Cui et al, 2012). It is also possible that our assay visualizes this trapped biogenesis intermediate.”

      We also added a note on biogenesis intermediates in the Discussion (P. 14 Line 36 onwards): 

      “It is possible that the proteins with C-termini that are translocated into the IMS from the matrix side can be trapped by the interaction with GFP<sub>1-10</sub>. In that case, our assay can be a useful tool to study these pre-translocation intermediates.”

      (4) The hypothesis that the method can reveal new substrates for Bcs1 is interesting, and it would strongly increase the relevance for the scientific community if this would be directly tested, e.g. by deleting BCS1 and testing if more IM proteins are then detected by interaction with the matrix GFP110.

      we attempted to move the BiG Mito-Split assay into haploid strains where BCS1 and other factors can be deleted, however, this was not successful. Since this was a big effort (We cloned 10 potential substrate proteins but none of them were expressed) we decided not to pursue this further.

      (5) The screening of six different growth conditions reflects the strength of the high-throughput imaging readout. However, the interpretation of the data and additional follow-up on this is rather short and would be a nice addition to the present manuscript. In addition, one wonders, what was the rationale behind these six conditions (e.g. DTT treatment)? The direct metabolic shift from fermentation to respiration to boost mitochondrial biogenesis would be a highly interesting condition and the authors should consider adding this in the present manuscript.

      we agree with the reviewer that the analysis of different conditions is a strength of this work. However, we did not reveal any clear protein groups with strong conditional import and thus it was hard to select a follow-up candidate. The selection of conditions was partially driven by the technical possibilities: the media change is challenging on the robotic system; heat shock conditions make microscope autofocus unstable; library strain growth on synthetic respiratory media is very slow and the media cannot be substituted with rich media due to its autofluorescence. However, the usage of the spinning disc confocal microscope allowed us to screen directly in synthetic oleate media which has a lot of background on widefield systems due to oil micelles. We extended the explanation of condition choice as follows (P. 4 Line 34 onwards): 

      “The diploid BiG Mito-Split collection was imaged in six conditions representing various carbon sources and a diversity of stressors the cells can adapt to: logarithmic growth on glucose as a control carbon source and oleic acid as a poorly studied carbon source; post-diauxic (stationary) phase after growth on glucose where mitochondria, are more active and inorganic phosphate (Pi) depletion that was recently described to enhance mitochondrial membrane potential (Ouyang et al, 2024); as stress conditions we chose growth on glucose in the presence of 1 mM dithiothreitol (DTT) that might interfere with the disulfide relay system in the IMS, and nitrogen starvation as a condition that may boost biosynthetic functions of mitochondria. DTT and nitrogen starvation were earlier used for a screen with the regular C’-GFP collection (Breker et al, 2013). Another important consideration for selecting the conditions was the technical feasibility to implement them on automated screening setups.”

      Reviewer #3 (Recommendations for the authors )

      (6) This is a very elegant and clearly written study. As mentioned above, my only concern is that the biological significance of the obtained data, at this stage, is rather limited. It would have been nice if the authors explored one of the potential applications of the system they propose. For example, it should be relatively easy to analyze whether Cox26, Qcr8, Qcr9, or Qcr10 are new substrates of Bsc1, as the authors speculate.

      we thank the reviewer for their positive feedback. We addressed the biological application of the screen by including new data on metabolite concentrations in the strains where Gpp1 N-terminus was mutated leading to loss of the mitochondrial form. We added panels H and I to Figure 4, the new Supplementary Table S2 and appended the description of these results at the end of the third Results subsection (P. 10 Lines 19-35). Our data now show a role for the mitochondrial fraction of Gpp1 which adds mechanistic insight into this dually localized protein.

      We also were interested in the applications of our system to the study of mitochondrial import. However, the study of Cox26, Qcr8, Qcr9, and Qcr10 was not successful (also related to point 4, Reviewer #2). We thus decided to investigate the import mechanisms of the poorly studied dually localized proteins Arc1, Fol3, and Hom6 (related to Figure 4 of the original manuscript). To this end, we expressed these proteins in vitro, radiolabeled, and performed import assays with purified mitochondria. Arc1 was not imported, Fol3 and Hom6 gave inconclusive results (Author response image 3). Since it is known that even some genuine fully or dually localized mitochondrial proteins such as Fum1 cannot be imported in vitro post-translationally (Knox et al, 1998), we cannot draw conclusions from these experiments and left them out of the revised manuscript. Additional investigation is required to clarify if there exist special cytosolic mechanisms for the import of these proteins that were not reconstituted in vitro such as co-translational import.

      Author response image 3.

      In vitro import of poorly studies dually localized proteins. Arc1, Fol3, and Hom6 were cloned into pGEM4 plasmid, synthesized in vitro (Input), radiolabeled, and imported into mitochondria isolated from BY4741 strain as described before (Peleh et al, 2015); the import was performed for 5,10, or 15 minutes and mitochondria were treated with proteinase K (PK) to degrade non-imported proteins; some reactions were treated with the mix of valinomycin, antimycin, and oligomycin (VAO) to dissipate mitochondrial membrane potential. The proteins were separated by SDS-PAGE and visualized by autoradiography.

      Minor comments:

      (7) It is unclear why the authors used the six growth conditions they used, and why for example a nonfermentable medium was not included at all.

      we address this shortcoming in the reply to the previous point 5 (Reviewer #2).

      (8) Page 2, line 17 - "Its" should be corrected to "its".

      Changed

      (9) Page 2, line 25 to the end of the paragraph - the authors refer to the TIM complex when actually the TIM23 complex is probably meant. Also, it would be clearer if the TIM22 complex was introduced as well, especially in the context of the sentence stating that "the IM is a major protein delivery destination in mitochondria".

      This was corrected.

      (10) Page 5, line 35 - "who´s" should be corrected to "whose".

      This was corrected.

      (11) Page 9, line 5 - "," after Gpp1 should probably be "and".

      This was corrected.

      (12) Page 11 - the authors discuss in several places the possible effects of tags and how they may interfere with "expression, stability and targeting of proteins". Protein function may also be dramatically affected by tags - a quick look into the dataset shows that several mitochondrial matrix and inner membrane proteins that are essential for cell viability were not identified in the screen, likely because their function is impaired.

      we agree with the reviewer that the influence of tags needs to be carefully evaluated. This is not always possible in the context of whole genomic screens. Sometimes, yeast collections (and proteomic datasets) can miss well-known mitochondrial residents without a clear reason. To address this important point we conducted an additional analysis to look specifically at the essential proteins. We indeed found that several of the mitochondrial proteins that are essential for viability were absent from the collection at the start, but for those present, their essentiality did not impact the likelihood to be detected in our assay. To describe the analysis we added the following text and a Fig. 3 – figure supplement 2. Results now read (P.7 Lines 8-21): 

      “Next, we checked the two categories of proteins likely to give biased results in high-throughput screens of tagged collections: proteins essential for viability, and molecular complex subunits. To look at the first category we split the proteomic dataset of soluble matrix proteins (Vögtle et al. 2017) into essential and non-essential ones according to the annotations in the Saccharomyces Genome Database (SGD) (Wong et al, 2023). We found that there was no significant difference in the proportion of detected proteins in both groups (17 and 20 % accordingly), despite essential proteins being less represented in the initial library (Fig. 3 – figure supplement 2A). From the three essential proteins of the (Vögtle et al. 2017) dataset for which the strains present in our library but showed no signal, two were nucleoporins Nup57 and Nup116, and one was a genuine mitochondrial protein Ssc1. Polymerase chain reaction (PCR) and western blot verification showed that the Ssc1 strain was incorrect (Fig. 3 – figure supplement 2B). We conclude that essential proteins are more likely to be absent or improperly tagged in the original C’-SWAT collection, but the essentiality does not affect the results of the BiG Mito-Split assay.” 

      Discussion (P. 13 Lines 23-26): 

      “We did not find that protein complex components or essential proteins are more likely to be falsenegatives. However, some essential proteins were absent from the collection to start with (Fig. 3 – figure supplement 2A). Thus, a small tag allows visualization of even complex proteins.” 

      From our data it is difficult to estimate the effect of tagging on protein function. We also addressed the effect of tagging Rip1 as well as performed growth assays on the tagged small “Qcr proteins” in the reply to point 3 (Reviewer #2). It is also difficult to estimate the effect of GFP<sub>1-10</sub> and <sub>11</sub> complex assembly on protein function since the presence of functional, unassembled GFP<sub>11</sub> tagged pool cannot be ruled out in our assay. 

      Other changes

      Figure and table numbers changed after new data additions.

      A sentence added in the abstract to highlight the additional experiments on Gpp1 function: “We use structure-function analysis to characterize the dually localized protein Gpp1, revealing an upstream start codon that generates a mitochondrial targeting signal and explore its unique function.”

      The reference to the PCR verification (Fig. 3 – Supplement 2B) of correct tagging of Ycr102c was added to the Results section (P.8 Line 6), western blot verification added on.

      Added the Key Resources Table at the beginning of the Methods section.

      Small grammar edits, see tracked changes.

      References:

      Bader G, Enkler L, Araiso Y, Hemmerle M, Binko K, Baranowska E, De Craene J-O, Ruer-Laventie J, Pieters J, Tribouillard-Tanvier D, et al (2020) Assigning mitochondrial localization of dual localized proteins using a yeast Bi-Genomic Mitochondrial-Split-GFP. eLife 9: e56649

      Cui T-Z, Smith PM, Fox JL, Khalimonchuk O & Winge DR (2012) Late-Stage Maturation of the Rieske Fe/S Protein: Mzm1 Stabilizes Rip1 but Does Not Facilitate Its Translocation by the AAA ATPase Bcs1. Mol Cell Biol 32: 4400–4409

      Desai N, Brown A, Amunts A & Ramakrishnan V (2017) The structure of the yeast mitochondrial ribosome. Science 355: 528–531

      Guo H, Bueler SA & Rubinstein JL (2017) Atomic model for the dimeric FO region of mitochondrial ATP synthase. Science 358: 936–940

      Knox C, Sass E, Neupert W & Pines O (1998) Import into Mitochondria, Folding and Retrograde Movement of Fumarase in Yeast. J Biol Chem 273: 25587–25593

      Morgenstern M, Stiller SB, Lübbert P, Peikert CD, Dannenmaier S, Drepper F, Weill U, Höß P, Feuerstein R, Gebert M, et al (2017) Definition of a High-Confidence Mitochondrial Proteome at Quantitative Scale. Cell Rep 19: 2836–2852

      Oborská-Oplová M, Geiger AG, Michel E, Klingauf-Nerurkar P, Dennerlein S, Bykov YS, Amodeo S, Schneider A, Schuldiner M, Rehling P, et al (2025) An avoidance segment resolves a lethal nuclear–mitochondrial targeting conflict during ribosome assembly. Nat Cell Biol 27: 336–346

      Peleh V, Ramesh A & Herrmann JM (2015) Import of Proteins into Isolated Yeast Mitochondria. In Membrane Trafficking: Second Edition, Tang BL (ed) pp 37–50. New York, NY: Springer

      Srivastava AP, Luo M, Zhou W, Symersky J, Bai D, Chambers MG, Faraldo-Gómez JD, Liao M & Mueller DM (2018) High-resolution cryo-EM analysis of the yeast ATP synthase in a lipid membrane. Science 360: eaas9699

      Vögtle F-N, Burkhart JM, Gonczarowska-Jorge H, Kücükköse C, Taskin AA, Kopczynski D, Ahrends R, Mossmann D, Sickmann A, Zahedi RP, et al (2017) Landscape of submitochondrial protein distribution. Nat Commun 8: 290

      Woellhaf MW, Hansen KG, Garth C & Herrmann JM (2014) Import of ribosomal proteins into yeast mitochondria. Biochem Cell Biol 92: 489–498

    1. Author Response:

      Reviewer #1 (Public Review):

      1. There was little comment on the strategy/mechanism that enabled subjects to readily attain Target I (MU 1 active alone), and then Target II (MU1 and MU2 active to the same relative degree). To accomplish this, it would seem that the peak firing rate of MU1 during pursuit of Target II could not exceed that during Target I despite an increased neural drive needed to recruit MU2. The most plausible explanation for this absence of additional rate coding in MU1 would be that associated with firing rate saturation (e.g., Fuglevand et al. (2015) Distinguishing intrinsic from extrinsic factors underlying firing rate saturation in human motor units. Journal of Neurophysiology 113, 1310-1322). It would be helpful if the authors might comment on whether firing rate saturation, or other mechanism, seemed to be at play that allowed subjects to attain both targets I and II.

      To place the cursor inside TII, both MU1 and MU2 must discharge action potentials at their corresponding average discharge rate during 10% MVC (± 10% due to the target radius and neglecting the additional gain set manually in each direction). Therefore, subjects could simply exert a force of 10% MVC to reach TII and would successfully place the cursor inside TII. However, to get to TI, MU1 must discharge action potentials at the same rate as during TII hits (i.e. average discharge rate at 10% MVC) while keeping MU2 silent. Based on the performance analysis in Fig 3D, subjects had difficulties moving the cursor towards TI when the difference in recruitment threshold between MU1 and MU2 was small (≤ 1% MVC). In this case, the average discharge rate of MU1 during 10% MVC could not be reached without activating MU2. As could be expected, reaching towards TI became more successful when the difference in recruitment threshold between MU1 and MU2 was relatively large (≥3% MVC). In this case, subjects were able to let MU1 discharge action potentials at its average discharge rate at 10% MVC without triggering activation of MU2 (it seems the discharge rate of MU1 saturated before the onset of MU2). Such behaviour can be observed in Fig. 2A. MUs with a lower recruitment threshold saturate their discharge rate before the force reaches 10% MVC. We adapted the Discussion accordingly to describe this behaviour in more detail.

      1. Figure 4 (and associated Figure 6) is nice, and the discovery of the strategy used by subjects to attain Target III is very interesting. One mechanism that might partially account for this behavior that was not directly addressed is the role inhibition may have played. The size principle also operates for inhibitory inputs. As such, small, low threshold motor neurons will tend to respond to a given amount of inhibitory synaptic current with a greater hyperpolarization than high threshold units. Consequently, once both units were recruited, subsequent gradual augmentation of synaptic inhibition (concurrent with excitation and broadly distributed) could have led to the situation where the low threshold unit was deactivated (because of the higher magnitude hyperpolarization), leaving MU2 discharging in isolation. This possibility might be discussed.

      We agree with the reviewer’s comment that inhibition might have played a critical role in succeeding to reach TIII. Hence, we have added this concept to our discussion.

      1. In a similar vein as for point 2 (above), the argument that PICs may have been the key mechanism enabling the attainment of target III, while reasonable, also seems a little hand wavy. The problem with the argument is that it depends on differential influences of PICs on motor neurons that are 1) low threshold, and 2) have similar recruitment thresholds. This seems somewhat unlikely given the broad influence of neuromodulatory inputs across populations of motor neurons.

      We agree with the reviewer’s point and reasoning that a mixture of neuromodulation and inhibition likely introduced the variability in MU activity we observed in this study. This comment is addressed in the answer to comment 3.

      Reviewer #2 (Public Review):

      [...]

      1. Some subjects seemed to hit TIII by repeatedly "pumping" the force up and down to increase the excitability of MU2 (this appears to happen in TIII trials 2-6 in Fig. 4 - c.f. p18 l30ff). It would be useful to see single-trial time series plots of MU1, MU2, and force for more example trials and sessions, to get a sense for the diversity of strategies subjects used. The authors might also consider providing additional analyses to test whether multiple "pumps" increased MU2 excitability, and if so, whether this increase was usually larger for MU2 than MU1. For example, they might plot the ratio of MU2 (and MU1) activation to force (or, better, the residual discharge rate after subtracting predicted discharge based on a nonlinear fit to the ramp data) over the course of the trial. Is there a reason to think, based on the data or previous work, that units with comparatively higher thresholds (out of a sample selected in the low range of <10% MVC) would have larger increases in excitability?


      We added a supplementary figure (Supplement 4) that visualizes additional trials from different conditions and subjects for TIII-instructed trials and noted this in the text.

      MU excitability might indeed be pronounced during repeated activations within a couple of seconds (see, for example, M. Gorassini, J. F. Yang, M. Siu, and D. J. Bennett, “Intrinsic Activation of Human Motoneurons: Reduction of Motor Unit Recruitment Thresholds by Repeated Contractions,” J. Neurophysiol., vol. 87, no. 4, pp. 1859–1866, 2002.). Such an effect, however, seems to be equally distributed to all active MUs. Moreover, we are not aware of any recent studies suggesting that MUs, within the narrow range of 0-10% MVC, may be excited differently by such a mechanism. Supplement 4C and D illustrate trials in which subjects performed multiple “pumps”. Visually, we could not find changes in the excitability specific to any of the two MUs nor that subjects explored repeated activation of MUs as a strategy to reach TIII. It seems subjects instead tried to find the precise force level which would allow them to keep MU2 active after the offset of MU1. We further discussed that PICs act very broadly on all MUs. The observed discharge patterns when successfully reaching TIII may likely be due to an interplay of broadly distributed neuromodulation and locally acting synaptic inhibition.

      1. I am somewhat surprised that subjects were able to reach TIII at all when the de-recruitment threshold for MU1 was lower than the de-recruitment threshold for MU2. It would be useful to see (A) performance data, as in Fig. 3D or 5A, conditioned on the difference in de-recruitment thresholds, rather than recruitment thresholds, and (B) a scatterplot of the difference in de-recruitment vs the difference in recruitment thresholds for all pairs.


      We agree that comparing the difference in de-recruitment threshold with the performance of reaching each target might provide valuable insights into the strategies used to perform the tasks. Hence, we added this comparison to Figure 4E at p. 16, l. 1. A scatterplot of the difference in de-recruitment threshold and the difference in recruitment threshold has been added to Supplement 3A. The Results section was modified in line with the above changes.

      1. Using MU1 / MU2 rates to directly control cursor position makes sense for testing for independent control over the two MUs. However, one might imagine that there could exist a different decoding scheme (using more than two units, nonlinearities, delay coordinates, or control of velocity instead of position) that would allow subjects to generate smooth trajectories towards all three targets. Because the authors set their study in a BCI context, they may wish to comment on whether more complicated decoding schemes might be able to exploit single-unit EMG for BCI control or, alternatively, to argue that a single degree of freedom in input fundamentally limits the utility of such schemes.


      This study aimed to assess whether humans can learn to decorrelate the activity between two MUs coming from the same functional MU pool during constraint isometric conditions. The biofeedback was chosen to encourage subjects to perform this non-intuitive and unnatural task. Transferring biofeedback on single MUs into an application, for example, BCI control, could include more advanced pre-processing steps. Not all subjects were able to navigate the cursor along both axes consistently (always hitting TI and TIII). However, the performance metric (Figure 4C) indicated that subjects became better over time in diverging from the diagonal and thus increased their moving range inside the 2D space for various combinations of MU pairs. Hence, a weighted linear combination of the activity of both MUs (for example, along the two principal components based on the cursor distribution) may enable subjects to navigate a cursor from one axis to another. Similarly, coadaptation methods or different types of biofeedback (auditory or haptic) may help subjects. Furthermore, using only two MUs to drive a cursor inside a 2-D space is prone to interference. Including multiple MUs in the control scheme may improve the performance even in the presence of noise. We have shown that the activation of a single MU pool exposed to a common drive does not necessarily obey rigid control. State-dependent flexible control due to variable intrinsic properties of single MUs may be exploited for specific applications, such as BCI. However, further research is necessary to understand the potentials and limits of such a control scheme.

      1. The conclusions of the present work contrast somewhat with those of Marshall et al. (ref. 24), who claim (for shoulder and proximal arm muscles in the macaque) that (A) violations of the "common drive" hypothesis were relatively common when force profiles of different frequencies were compared, and that (B) microstimulation of different M1 sites could independently activate either MU in a pair at rest. Here, the authors provide a useful discussion of (A) on p19 l11ff, emphasizing that independent inputs and changes in intrinsic excitability cannot be conclusively distinguished once the MU has been recruited. They may wish to provide additional context for synthesizing their results with Marshall et al., including possible differences between upper / lower limb and proximal / distal muscles, task structure, and species.

      The work by Marshall, Churchland and colleagues shows that when stimulating focally in specific sites in M1 single MUs can be activated, which may suggest a direct pathway from cortical neurons to single motor neurons within a pool. However, it remains to be shown if humans can learn to leverage such potential pathways or if the observations are limited to the artificially induced stimulus. The tibialis anterior receives a strong and direct cortical projection. Thus, we think that this muscle may be well suited to study whether subjects can explore such specific pathways to activate single MUs independently. However, it may very well be that the control of upper limbs show more flexibility than lower ones. However, we are not aware of any study that may provide evidence for a critical mismatch in the control of upper and lower limb MU pools. We have added this discussion to the manuscript.

      Reviewer #3 (Public Review):

      [...]

      Even if the online decomposition of motor units were performed perfectly, the visual display provided to subject smooths the extracted motor unit discharge rates over a very wide time window: 1625 msec. This window is significantly larger than the differences in recruitment times in many of the motor unit pairs being used to control the interface. So while it's clear that the subjects are learning to perform the task successfully, it's not clear to me that subjects could have used the provided visual information to receive feedback about or learn to control motor unit recruitment, even if individuated control of motor unit recruitment by the nervous system is possible. I am therefore not convinced that these experiments were a fair test of subjects' ability to control the recruitment of individual motor units.

      Regarding the validating of isolating motor units in the conditions analysed in this study, we have added a full new set of measurements with concomitant surface and intramuscular recordings during recruitment/derecruitment of motor units at variable recruitment speed. This provides a strong validation of the approach and of the accuracy of the online decomposition used in this study. Subjects received visual feedback on the activity of the selected MU pair, i.e. discharge behaviour of both MUs and the resulting cursor movement. This information was not clear from the initial submission and hence, we annotated the current version to clarify the biofeedback modalities. To further clarify the decoding of incoming MU1/MU2 discharge rates into cursor movement, we included Supplement 2. We also included a video that shows that the smoothing window on the cursor position does not affect the immediate cursor movement due to incoming spiking activity. For example, as shown in Supplement 2, for the initial offset of 0ms, the cursor starts moving along the axis corresponding to a sole activation of MU1 and immediately diverges from this axis when MU2 starts to discharge action potentials. We, therefore, think that the biofeedback provided to the subjects does allow exploration of single MU control.

      Along similar lines, it seems likely to me that subjects are using some other strategy to learn the task, quite possibly one based on control of over overall force at the ankle and/or voluntary recruitment of other leg/foot muscles. Each of these variables will presumably be correlated with the activity of the recorded motor units and the movement of the cursor on the screen. Moreover, because these variables likely change on a similar (or slower) timescale than differences in motor units recruitment or derecruitment, it seems to me that using such strategies, which do not reflect or require individuated motor unit recruitment, is a highly effective way to successfully complete the task given the particular experimental setup.

      In addition to being seated and restricted by an ankle dynamometer, subjects were instructed to only perform dorsiflexion of the ankle. Further, none of the subjects reported compensatory movements as a strategy to reach any of the targets. In addition, to be successfully utilised, such compensatory movements would need to influence various combinations of MUs tested in this study equally, even when they differ in size. Nevertheless, we acknowledge, as pointed out by the reviewer, that our setup has limitations. We only measured force in a single direction (i.e. ankle dorsiflexion) and did not track toe, hip or knee movements. Even though an instructor supervised leg movement throughout the experiment, it may be that very subtle and unknowingly compensatory movements have influenced the activity of the selected MUs. Hence, we updated the limitations section in the Discussion.

      To summarize my above two points, it seems like the author's argument is that absence of evidence (subjects do not perform individuated MU recruitment in this particular task) constitutes evidence of absence (i.e. is evidence that individuated recruitment is not possible for the nervous system or for the control of brain-machine interfaces). Therefore given the above-described issues regarding real-time feedback provided to subjects in the paper it is not clear to me that any strong conclusions can be drawn about the nervous system's ability or inability to achieve individuated motor unit recruitment.

      We hope that the above changes clarify the biofeedback modalities and their potential to provide subjects with the necessary information for exploring independent MU control. Our experiments aimed to investigate whether subjects can learn under constraint isometric conditions to decorrelate the activity between two MUs coming from the same functional pool. While it seemed that MU activity could be decorrelated, this almost exclusively happened (TIII-instructed trials) within a state-dependent framework, i.e. both MUs must be activated first before the lower threshold one is switched off. We did not observe flexible MU control based exclusively on a selective input to individual MUs (MU2 activated before MU1 during initial recruitment). That does not mean that such control is impossible. However, all successful control strategies that were voluntarily explored by the subjects to achieve flexible control were based on a common input and history-dependent activation of MUs. We have added these concepts to the discussion section.

      Second, to support the claims based on their data the authors must explain their online spike-sorting method and provide evidence that it can successfully discriminate distinct motor unit onset/offset times at the low latency that would be required to test their claims. In the current manuscript, authors do not address this at all beyond referring to their recent IEEE paper (ref [25]). However, although that earlier paper is exciting and has many strengths (including simultaneous recordings from intramuscular and surface EMGs), the IEEE paper does not attempt to evaluate the performance metrics that are essential to the current project. For example, the key metric in ref 25 is "rate-of-agreement" (RoA), which measures differences in the total number of motor unit action potentials sorted from, for example, surface and intramuscular EMG. However, there is no evaluation of whether there is agreement in recruitment or de-recruitment times (the key variable in the present study) for motor units measured both from the surface and intramuscularly. This important technical point must be addressed if any conclusions are to be drawn from the present data.

      We have taken this comment in high consideration, and we have performed a validation based on concomitant intramuscular and surface EMG decomposition in the exact experimental conditions of this study, including variations in the speed of recruitment and de-recruitment. This new validation fully supports the accuracy in of the methods used when detecting recruitment and de-recruitment of motor units.

      My final concern is that the authors' key conclusion - that the nervous system cannot or does not control motor units in an individuated fashion - is based on the assumption that the robust differences in de-recruitment time that subjects display cannot be due to differences in descending control, and instead must be due to changes in intrinsic motor unit excitability within the spinal cord. The authors simply assert/assume that "[derecruitment] results from the relative intrinsic excitability of the motor neurons which override the sole impact of the receive synaptic input". This may well be true, but the authors do not provide any evidence for this in the present paper, and to me it seems equally plausible that the reverse is true - that de-recrutiment might influenced by descending control. This line of argumentation therefore seems somewhat circular.

      When subjects were asked to reach TIII, which required the sole activation of a higher threshold MU, subjects almost exclusively chose to activate both MUs first before switching off the lower threshold MU. It may be that the lower de-recruitment threshold of MU2 was determined by descending inputs changing the excitability of either MU1 or MU2 (for example, see J. Nielsen, C. Crone, T. Sinkjær, E. Toft, and H. Hultborn, “Central control of reciprocal inhibition during fictive dorsiflexion in man,” Exp. brain Res., vol. 104, no. 1, pp. 99–106, Apr. 1995 or E. Jankowska, “Interneuronal relay in spinal pathways from proprioceptors,” Prog. Neurobiol., vol. 38, no. 4, pp. 335–378, Apr. 1992). Even if that is the case, it remains unknown why such a command channel that potentially changes the excitability of a single MU was not voluntarily utilized at the initial recruitment to allow for direct movement towards TIII (as direct movement was preferred for TI and TII). We cannot rule out that de-recruitment was affected by selective descending commands. However, our results match observations made in previous studies on intrinsic changes of MU excitability after MU recruitment. Therefore, even if descending pathways were utilized throughout the experiment to change, for example, MU excitability, subjects were not able to explore such pathways to change initial recruitment and achieve general flexible control over MUs. The updated discussion explains this line of reasoning.

      Reviewer #4 (Public Review):

      [...]

      1. Figure 6a nicely demonstrates the strategy used by subjects to hit target TIII. In this example, MU2 was both recruited and de-recruited after MU1 (which is the opposite of what one would expect based on the standard textbook description). The authors state (page 17, line 15-17) that even in the reverse case (when MU2 is de-recruited before MU1) the strategy still leads to successful performance. I am not sure how this would be done. For clarity, the authors could add a panel similar to panel A to this figure but for the case where the MU pairs have the opposite order of de-recruitment.

      We have added more examples of successful TIII-instructed trials in Supplement 4. Supplement 4C and D illustrate examples of subjects navigating the cursor inside TIII even when MU2 was de-recruited before MU1. As exemplarily shown, subjects also used the three-stage approach discussed in the manuscript. In contrast to successful trials in which MU2 was de-recruited after MU1 (for example, Supplement 4B), subjects required multiple attempts until finding a precise force level that allowed a continuous firing of MU2 while MU1 remained silent. We have added a possible explanation for such behaviour in the Discussion.

      1. The authors discuss a possible type of flexible control which is not evident in the recruitment order of MUs (page 19, line 27-28). This reasoning was not entirely clear to me. Specifically, I was not sure which of the results presented here needs to be explained by such mechanism.

      We have shown that subjects can decorrelate the discharge activity of MU1 and MU2 once both MUs are active (e.g. reaching TIII). Thus, flexible control of the MU pair was possible after the initial recruitment. Therefore, this kind of control seems strongly linked to a specific activation state of both MUs. We further elaborated on which potential mechanisms may contribute to this state-dependent control.

      1. The authors argue that using a well-controlled task is necessary for understanding the ability to control the descending input to MUs. They thus applied a dorsi-flexion paradigm and MU recordings from TA muscles. However, it is not clear to what extent the results obtained in this study can be extrapolated to the upper limb. Controlling the MUs of the upper limb could be more flexible and more accessible to voluntary control than the control of lower limb muscles. This point is crucial since the authors compare their results to other studies (Formento et al., bioRxiv 2021 and Marshall et al., bioRxiv 2021) which concluded in favor of the flexible control of MU recruitment. Since both studies used the MUs of upper limb muscles, a fair comparison would involve using a constrained task design but for upper limb muscles.

      We agree with the reviewer that our work differs from previous approaches, which also studied flexible MU control. We, therefore, added a paragraph to the limitation section of the Discussion.

      1. The authors devote a long paragraph in the discussion to account for the variability in the de-recruitment order. They mostly rely on PIC, but there is no clear evidence that this is indeed the case. Is it at all possible that the flexibility in control over MUs was over their recruitment threshold? Was there any change in de-recruitment of the MUs during learning (in a given recording session)?

      The de-recruitment threshold did not critically change when compared before and after the experiment on each day (difference in de-recruitment threshold before and after the experiment: -0.16 ± 2.28% MVC, we have now added this result to the Results section). Deviations from the classical recruitment order may be achieved by temporal (short-lived) changes in the intrinsic excitability of single MUs. We, therefore, extended our discussion on potential mechanisms that may explain the observed variability given all MUs receive the same common input.

      1. The need for a complicated performance measure (define on page 5, line 3-6) is not entirely clear to me. What is the correlation between this parameter and other, more conventional measures such as total-movement time or maximal deviation from the straight trajectory? In addition, the normalization process is difficult to follow. The best performance was measured across subjects. Does this mean that single subject data could be either down or up-regulated based on the relative performance of the specific subject? Why not normalize the single-subject data and then compare these data across subjects?

      We employed this performance metric to overcome shortcomings of traditional measures such as target hit count, time-to-target or deviation from the straight trajectory. Such problems are described in the illustration below for TIII-instructed trials (blue target). A: the duration of the trial is the same in both examples (left and right); however, on the left, the subject manages to keep the cursor close to the target-of-interest while on the right, the cursor is far away from the target centre of TIII. B: In both images the cursor has the same distance d to the target centre of TIII. However, on the left, the subject manages to switch off MU1 while keeping MU2 active, while on the right, both MUs are active. C: On the left, the subject manages to move the cursor inside the TIII before the maximum trial time was reached, while on the right, the subject moved the cursor up and down, not diverging from the ideal trajectory to the target centre but fails to place the cursor inside TIII within the duration of the trial. In all examples, using only one conventional measure fails to account for a higher performance value in the left scenario than in the right. Our performance metric combines several performance metrics such as time-to-target, distance from the target centre, and the discharge rate ratio between MU1 and MU2 via the angle 𝜑 and thus allows a more detailed analysis of the performance than conventional measures. The normalisation of the performance value was done to allow for a comparison across subjects. The best and worst performance was estimated using synthetic data mimicking ideal movement towards each target (i.e. immediate start from the target origin to the centre of the target, while the normalised discharge rate of the corresponding MU is set to 1). Since the target space is normalised for all subjects in the same manner (mean discharge rate of the corresponding MUs at 10 %MVC) this allows us to compare the performance between subjects, conditions and targets.

      1. Figure 3C appears to indicate that there was only moderate learning across days for target TI and TII. Even for target TIII there was some improvement but the peak performance in later days was quite poor. The fact that the MUs were different each day may have affected the subjects' ability to learn the task efficiently. It would be interesting to measure the learning obtained on single days.

      We have added an analysis that estimated the learning within a session per subject and target (Supplement 3C). In order to evaluate the strength of learning within-session, the Spearman correlation coefficient between target-specific performance and consecutive trials was calculated and averaged across conditions and days. The results suggest that there was little learning within sessions and no significant difference between targets. These results have now been added to the manuscript.

      1. On page 16 line 12-13, the authors describe the rare cases where subjects moved directly towards TIII. These cases apparently occurred when the recruitment threshold of MU2 was lower. What is the probable source of this lower recruitment level in these specific trials? Was this incidental (i.e., the trial was only successful when the MU threshold randomly decreased) or was there volitional control over the recruitment threshold? Did the authors test how the MU threshold changed (in percentages) over the course of the training day?

      We did not track the recruitment threshold throughout the session but only at the beginning and end. We could not identify any critical changes in the recruitment order (see Results section). However, our analysis indicated that during direct movements towards TIII, MU2 (higher threshold MU) was recruited at a lower force level during the initial ramp and thus had a temporary effective recruitment threshold below MU1. It is important to note that these direct movements towards TIII only occurred for pairs of MUs with a similar recruitment threshold (see Figure 6). One possible explanation for this temporal change in recruitment threshold could be altered excitability due to neuromodulatory effects such as PICs (see Discussion). We have added an analysis that shows that direct movements towards TIII occurred in most cases (>90%) after a preceding TII- or TIIIinstructed trial. Both of these targets-of-interest require activation of MU2. Thus, direct movement towards TIII was likely not the result of specific descending control. Instead, this analysis suggests that the PIC effect triggered at the preceding trial was not entirely extinguished when a trial ending in direct movement towards TIII started. Alternatively, the rare scenarios in which direct movements happened could be entirely random. Similar observations were made in previous biofeedback studies [31]. To clarify these points, we altered the manuscript.

    1. Author response:

      The following is the authors’ response to the original reviews.

      Reviewer #1 (Public review):

      Weaknesses:

      (1) Figure 10 outlines a mechanistic link between cyp17a2 and the sexual dimorphism the authors report for SVCV infection outcomes. The data presented on increased susceptibility of cyp17a2-/- mutant male zebrafish support this diagram, but this conclusion is fairly weak without additional experimentation in both males and females. The authors justify their decision to focus on males by stating that they wanted to avoid potential androgen-mediated phenotypes in the cpy17a2 mutant background (lines 152156), but this appears to be speculation. It also doesn't preclude the possibility of testing the effects of increased cyp17a2 expression on viral infection in both males and females. This is of critical importance if the authors intend to focus the study on sexual dimorphism, which is how the introduction and discussion are currently structured.

      Thank you for your suggestion. We have revised the relevant statements in the introduction and discussion sections accordingly. The cyp17a2 overexpression experiments were not conducted in both male and female individuals was primarily based on two reasons. First, our laboratory currently lacks the technical capability to achieve cyp17a2 overexpression at the organismal level, existing methodologies are limited to gene knockout via CRISPR-Cas9. Second, even if overexpression were feasible, subsequent comparisons would need to be restricted within sexes (i.e., female vs. female controls or male vs. male controls) to eliminate potential confounding effects of sex hormones. Such experimental outcomes would only demonstrate the antiviral function of Cyp17a2 itself rather than directly elucidate mechanisms underlying sexual dimorphism, which diverges from the central objective of this study.

      We fully agree with your perspective and have accordingly refined relevant discussions in the revised manuscript. Our conclusions now emphasize that "cyp17a2 is one of the factors contributing to sex-based differences in antiviral immunity" rather than implying that it "solely mediates the entire phenotypic divergence." These modifications have been incorporated into the resubmitted version (Lines 112-115).    

      (2) The authors present data indicating an unexpected link between cyp17a2 and ubiquitination pathways. It is unclear how a CYP450 family member would carry out such activities, and this warrants much more attention. One brief paragraph in the discussion (starting at line 448) mentions previous implications of CYP450 proteins in antiviral immunity, but given that most of the data presented in the paper attempt to characterize cyp17a2 as a direct interactor of ubiquitination factors, more discussion in the text should be devoted to this topic. For example, are there any known domains in this protein that make sense in this context? Discussion of this interface is more relevant to the study than the general overview of sexual dimorphism that is currently highlighted in the discussion and throughout the text.

      We are grateful to the reviewer for their suggestion to elaborate on this novel finding. The discussion on this point has been expanded significantly (Lines 448-460). It is acknowledged that Cyp17a2 is devoid of the canonical domains that are typically associated with the ubiquitination machinery (e.g., RING, U-box). The present study proposes that the endoplasmic reticulum (ER) localization of Cyp17a2, in conjunction with its capacity to function as a scaffold protein, is of paramount significance. By residing in the ER, Cyp17a2 is strategically positioned to interact with key immune regulators such as STING, which also localizes to the ER. It is hypothesized that Cyp17a2 facilitates the recruitment of E3 ligases (btr32) and deubiquitinates (USP8) to their substrates (STING and SVCV P protein, respectively) by providing a platform for protein-protein interactions, rather than directly catalyzing ubiquitination. This noncanonical, scaffolding role for a cytochrome P450 (CYP450) enzyme represents an exciting evolutionary adaptation in teleost immunity.

      (3) Figures 2-9 contain information that could be streamlined to highlight the main points the authors hope to make through a combination of editing, removal, and movement to supplemental materials. There is a consistent lack of clarity in these figures that could be improved by supplementing them with more text to accompany the supplemental figures. Using Figure 2 and an example, panel (A) could be removed as unnecessary, panel (B) could be exchanged for a volcano plot with examples highlighting why cyp17a2 was selected for further study and also the full dataset could be shared in a supplemental table, panel (C) could be modified to indicate why that particular subset was chosen for plotting along with an explanation of the scaling, panel (D) could be moved to supplemental because the point is redundant with panels (A) and (C), panel (E) could be presented as a heatmap, in panels (G) and (H) data from EPC cells could be moved to supplemental because it is not central to the phenotype under investigation, panels (J) to (L) and (N) to (P) could be moved to supplemental because they are redundant with the main points made in panels (M) and (Q). Similar considerations could be made with Figures 3-9.

      We thank the reviewer for these excellent suggestions to improve the clarity and focus of our figures. A comprehensive review of all figures has been conducted in accordance with the recommendations made. Figure 2A has been removed. Figure 2B (revised Figure 2A) has been replaced with a volcano plot highlighting cyp17a2 and the full dataset has been provided as supplementary Table S2. Figure 2C (revised Figure 2B) is now a heatmap with eight sex-related genes and an explanation of the scaling has been added to the revised figure legends. Several panels (D, G, H, J-L, N-P) have been moved to the supplementary information (now Figure S1). Figure 2E has been presented as a heatmap. The same approach to streamlining has been applied to Figures 3-9, with confirmatory or secondary data being moved to supplements in order to better emphasize the main conclusions. The figure legends and main text have been updated accordingly.

      (4) The data in Figure 3 (A)-(C) do not seem to match the description in the text. That is, the authors state that cyp17a2 overexpression increases interferon signaling activity in cells, but the figure shows higher increases in vector controls. Additionally, the data in panel (H) are not described. What genes were selected and why, and where are the data on the rest of the genes from this analysis? This should be shared in a supplemental table.

      We apologize for the lack of clarity. In Figures 3A-C, the vector control shows baseline activation due to the stimulants (poly I:C/SVCV), but the fold-increase is significantly greater in the Cyp17a2-overexpressing groups. We have re-plotted the data to more clearly represent the stimulant-induced activation over baseline and added statistical comparisons between the Vector and Cyp17a2 groups under each condition to highlight the enhancing effect of Cyp17a2. For Figure 3H (revised Figure 3F), the heatmap shows a curated set of IFN-stimulated genes (ISGs) most significantly regulated by Cyp17a2 based on our RNA-seq analysis. We have added a description in the revised figure legend and in the results section (Lines 837-840). The full list of differentially expressed genes from this analysis is now provided in Supplementary Table S3.

      (5) Some of the reagents described in the methods do not have cited support for the applications used in the study. For example, the antibody for TRIM11 (line 624, data in Figures 6 & 7) was generated for targeting the human protein. Validation for use of this reagent in zebrafish should be presented or cited. Furthermore, the accepted zebrafish nomenclature for this gene would be preferred throughout the text, which is bloodthirsty-related gene family, member 32.

      We thank the reviewer for raising this important point regarding reagent specificity. To address the concern about antibody validation in zebrafish, we performed the following verification steps. First, we aligned the antigenic sequence targeted by the Abclonal btr32 antibody (ABclonal, A13887) with orthologous sequences from zebrafish, which showed 45% protein sequence similarity (Author response image 1). More importantly, we conducted experimental validation by expressing Myc-tagged btr32 in EPC cells. Both the anti-Myc and the anti-btr32 antibodies detected a protein band at the same molecular weight. Furthermore, when a btr32-specific knockdown plasmid was introduced, the band recognized by the anti-btr32 antibody was significantly reduced (Author response image 2). These results support the specificity of the antibody in recognizing fish btr32. In accordance with the reviewer’s suggestion, we have also updated the gene nomenclature to “bloodthirsty-related gene family, member 32 (btr32)” throughout the manuscript.

      Author response image 1.

      Author response image 2.

      Reviewer #2 (Public review):

      Weaknesses:

      (1) Colocalization analyses (Figures 4G, 6I, 9D) require quantitative metrics (e.g., Pearson's coefficients) rather than representative images alone.

      We concur with the reviewer's assessment. We have now performed quantitative colocalization analysis (Pearson's coefficients) for all indicated figures (4G, 6I, 9D). The quantitative results are now presented within the figures themselves and described in the revised figure legends.

      (2) Figure 1 survival curves need annotated statistical tests (e.g., "Log-rank test, p=X.XX")

      The survival curves have now been annotated with the specific p-values from the Log-rank (Mantel-Cox) test (see revised Figures 1A, 2E).

      (3) Figure 2P GSEA should report exact FDR-adjusted *p*-values (not just "*p*<0.05").

      Figure 2P (revised Figure S1J) has been updated to include the exact FDR p-values for the presented GSEA plots.

      (4) Section 2 overextends on teleost sex-determination diversity, condensing to emphasize relevance to immune dimorphism would strengthen narrative cohesion.

      The section on teleost sex-determination diversity in the Discussion (lines 357-365) has been condensed, with a more direct focus on how this diversity provides a unique context for studying immune dimorphism independent of canonical sex chromosomes, as exemplified by the zebrafish model.

      (5) Limited discussion on whether this mechanism extends beyond Cyprinidae and its implications for teleost adaptation.

      The discussion has been expanded (lines 375-386) to address the potential conservation of this mechanism. It is acknowledged that cyp17a2 is a teleost-specific gene, and it is hypothesized that its function in antiviral immunity may signify an adaptive innovation within this extensively diverse vertebrate group. It is suggested that further research in other teleost families will be essential to ascertain the broader evolutionary significance of the present findings.

      Reviewer #2 (Recommendations for the authors):

      (1) Expand the Discussion to address why teleosts may have evolved male-biased immunity. Consider: pathogen pressure differentials in aquatic vs. terrestrial environments; trade-offs between immune investment and reproductive strategies (e.g., male-male competition); comparative advantages in external fertilization systems.

      We have expanded the discussion on lines 412-430, to address the potential conservation of this mechanism. We note that Cyp17a2 is a teleost-specific gene and speculate that its role in antiviral immunity represents an adaptive innovation within this highly diverse group of vertebrates. We propose that future studies of other teleost families are crucial for determining the broader evolutionary significance of our findings.

    1. /hyperpost/🌐/🧊/snarf-peergos.chat/

      Use this link to view the page in Peergs

      close the view and the enclosing folder is shown

      where the page can be edited using indy0pad.next

    1. Author response:

      The following is the authors’ response to the original reviews.

      Reviewer #1 (Public Reviews):

      Weaknesses:

      A limitation of the study is the reliance on standard techniques; however, this is a minor concern that does not diminish the overall impact or significance of the work.

      We agree that standard techniques were utilized. We believe this approach enhances the reliability and reproducibility of our findings. These methods are well-validated in the field and allow for robust interpretation of the results presented.

      Reviewer #2 (Public Reviews):

      Weaknesses: 

      (1) Clarify the strain background of the DBA/2J GPNMB+ mice: While DBA/2J GPNMB+ is described as a control, it would help to explicitly state whether these are transgenically rescued mice or another background strain. Are they littermates, congenic, or a separate colony?

      The following language was added to the manuscript, “The DBA/2J GPNMB+ mice are a coisogenic strain purchased from Jackson Laboratories. Jackon Laboratories generated these mice by knocking in the wild-type allele of Gpnmb into the DBA/2J background. By doing so, they rescued the phenotype of the DBA/2J mice. This description has been highlighted in our previous publications (Abdelmagid et al., 2014; Abdelmagid et al., 2015).”

      (2) Provide exact sample sizes and variance in all figure legends: Some figures (e.g., Figure 2 panels) do not consistently mention how many replicates were used (biological vs. technical) for each experimental group. Standardizing this across all panels would improve reproducibility.

      The manuscript has been updated to include replicates in each figure legend.

      (3) Expand on potential sex differences: The DMM model is applied only in male mice, which is noted in the methods. It would be helpful if the authors added 1-2 lines in the discussion acknowledging potential sex-based differences in OA progression and GPNMB function. 

      To our knowledge there are no sexbased differences in OA progression and GPNMB function in the literature. It was initially reported that only male C57BL/6J mice (Jackson Laboratories) develop OA following DMM however, recent literature has shown that both male and female mice develop the disease (Hwang et al., 2021; Ma et al., 2007). For the purpose of this manuscript, only male mice were used to provide preliminary results, however, we plan to repeat the included studies in female mice in the near future.  

      (4) Visual clarity in schematic (Figure 7): The proposed mechanism is helpful, but the text within the schematic is somewhat dense and could be made more readable with spacing or enlarged font. Also, label the MAPK/ERK pathway explicitly in panel B.

      We updated the schematic diagram in figure 7 and the figure legend.

      Reviewer #1 (Recommendations for the Authors):

      Several concerns must be addressed to improve the clarity and scientific rigor of the manuscript: 

      (1) Abstract: Specify which MMPs and MAPKs are modulated by osteoactivin.

      We specified the MMPs and clarified that GPNMB plays a role in pERK inhibition following inflammation induced by IL-1β stimulation. 

      (2) Human explant validation: The regulation of MMP-9, MMP-13, and IL-6 should be validated in the human cartilage explant model to support the claim that "GPNMB has an anti-inflammatory role in human primary chondrocytes" (line 123). Additionally, the anatomical origin of the explants must be stated.

      Thank you very much for the recommendation. We agree that validating the explant culture for MMP-9, MMP-13, and IL-6 would strengthen our data. Unfortunately, this experiment has been terminated and we no longer have access to the tissue. Human explants were obtained from discarded knee articular cartilage following arthroplasty. The manuscript has been updated to include this information.

      (3) DBA/2J GPNMB expression: GPNMB is known to be produced as a truncated protein in DBA/2J cells. The manuscript should address why its expression is reduced. Does this involve mRNA instability? Also, the nomenclature "DBA/2J GPNMB+" versus "DBA/2J" is confusing, especially since both mRNA and protein are still detectable, albeit at reduced levels. Figure 2C is not convincing; therefore, Figures 2C and 2D can be omitted.

      The following language was added to the manuscript, “Our results are consistent with the literature which shows that that the GPNMB gene in DBA/2J mice carries a nonsense mutation that leads to reduced RNA stability (Anderson et al., 2008).” We can appreciate that the nomenclature "DBA/2J GPNMB+" versus "DBA/2J" could be confusing. However, this is the standard language used in multiple publications, and we want to remain consistent with the literature. Based on your recommendation we have removed Figure 2 C and D and updated the methods and results sections accordingly.   

      (4) Figures 2J-L: The claim that gene expression changes are "significantly higher in DBA/2J animals compared to fold changes seen in chondrocytes from DBA/2J GPNMB+ controls" is not supported by the current presentation. The data should be plotted on the same graphs, and appropriate statistical analysis (e.g., two-way ANOVA) must be performed.

      Graphs for figure 2 have been updated and the appropriate analyses have been performed. 

      (5) Figure 6: The GPNMB expression data in the presence and absence of IL-1β at 0 and 10 minutes are missing.

      We apologize for the confusion. We corrected the mistake and removed the mention of the timepoints 0 and 10 minutes.  

      Reviewer #2 (Recommendations for the Authors):

      Consider unifying terminology around "GPNMB" and "osteoactivin": The term "osteoactivin" is used in some contexts and "GPNMB" in others. Since the focus is GPNMB's role in cartilage, suggest using a single term throughout to prevent confusion.

      Thank you for your comment. We include osteoactivin for clarification purposes once in the abstract, introduction and discussion. 

      In summary, we believe we have addressed all comments/concerns raised by the reviewers. We appreciate the opportunity to improve the quality of our manuscript.

      References

      Abdelmagid, S. M., Belcher, J. Y., Moussa, F. M., Lababidi, S. L., Sondag, G. R., Novak, K. M., Sanyurah, A. S., Frara, N. A., Razmpour, R., & Del Carpio-Cano, F. E. (2014). Mutation in osteoactivin decreases bone formation in vivo and osteoblast differentiation in vitro. The American journal of pathology, 184(3), 697-713. 

      Abdelmagid, S. M., Sondag, G. R., Moussa, F. M., Belcher, J. Y., Yu, B., Stinnett, H., Novak, K., Mbimba, T., Khol, M., Hankenson, K. D., Malcuit, C., & Safadi, F. F. (2015). Mutation in Osteoactivin Promotes Receptor Activator of NFκB Ligand (RANKL)-mediated Osteoclast Differentiation and Survival but Inhibits Osteoclast Function. J Biol Chem, 290(33), 2012820146. https://doi.org/10.1074/jbc.M114.624270  

      Anderson, M. G., Nair, K. S., Amonoo, L. A., Mehalow, A., Trantow, C. M., Masli, S., & John, S. W. (2008). GpnmbR 150Xallele must be present in bone marrow derived cells to mediate DBA/2J glaucoma. BMC genetics, 9(1), 1-14. 

      Hwang, H., Park, I., Hong, J., Kim, J., & Kim, H. (2021). Comparison of joint degeneration and pain in male and female mice in DMM model of osteoarthritis. Osteoarthritis and Cartilage, 29(5), 728738. 

      Ma, H.-L., Blanchet, T., Peluso, D., Hopkins, B., Morris, E., & Glasson, S. (2007). Osteoarthritis severity is sex dependent in a surgical mouse model. Osteoarthritis and Cartilage, 15(6), 695-700.

    1. Author Response

      Reviewer #1 (Public Review):

      Slusarczyk et al present a very well written manuscript focused on understanding the mechanisms underlying aging of erythrophagocytic macrophages in the spleen (RPM) and its relationship to iron loading with age. The manuscript is diffuse with a broad swath of data elements. Importantly, the manuscript demonstrates that RPM erythrophagocytic capacity is diminished with age, restored in iron restricted diet fed aged mice. In addition, the mechanism for declining RPM erythrophagocytic capacity appears to be ferroptosis-mediated, insensitive to heme as it is to iron, and occur independently of ROS generation. These are compelling findings. However, some of the data relies on conjecture for conclusion and a clear causal association is not clear. The main conclusion of the manuscript points to the accumulation of unavailable insoluble forms of iron as both causing and resulting from decreased RPM erythrophagocytic capacity.

      We are proposing that intracellular iron accumulation progresses first and leads to global proteotoxic damage and increased lipid peroxidation. This eventually triggers the death of a fraction of aging RPMs, thus promoting the formation of extracellular iron-rich protein aggregates. More explanation can be found below. Besides, iron loading suppresses the erythrophagocytic activity of RPMs, hence further contributing to their functional impairment during aging.

      In addition, the finding that IR diet leads to increased TF saturation in aged mice is surprising.

      We believe that this observation implies better mobilization of splenic iron stores, and corroborates our conclusion that mice that age on an iron-reduced diet benefit from higher iron bioavailability, although these differences are relatively mild. More explanation can be found in our replies to Reviewer #2.

      Furthermore, whether the finding in RPMs is intrinsic or related to RBC-related changes with aging is not addressed.

      We now addressed this issue and we characterized in more detail both iron and ROS levels in RBCs.

      Finally, these findings in a single strain and only female mice is intriguing but warrants tempered conclusions.

      We tempered the conclusions and provided a basic characterization of the RPM aging phenotype in Balb/c female mice.

      Major points:

      1) The main concern is that there is no clear explanation of why iron increases during aging although the authors appear to be saying that iron accumulation is both the cause of and a consequence of decreased RPM erythrophagocytic capacity. This requires more clarification of the main hypothesis on Page 4, line 17-18.

      We thank the reviewer for this comment. It was previously reported that iron accumulates substantially in the spleen during aging, especially in female mice (Altamura et al., 2014). Since RPMs are those cells that process most of the iron in the spleen, we aimed to explore what is the relationship between iron accumulation and RPM functions during aging. This investigation led us to uncover that indeed iron accumulation is both the cause and the consequence of RPM dysfunction. Specifically, we propose that intracellular iron loading of RPMs precedes extracellular deposition of iron in a form of protein-rich aggregates, driven by RPMs damage. To support this, we now show that the proteome of RPMs overlaps with those proteins that are present in the age-triggered aggregates (Fig. 3F). Furthermore, corroborating our model, we now demonstrate that transient iron loading of RPMs via iron-dextran injection (new Fig. 3G) leads to the formation of protein-rich aggregates, closely resembling those present in aged spleens (new Fig. 3H). This implies that high iron content in RPMs is indeed a major driving factor that leads to aggregation of their proteome and cell damage. Importantly, we now supported this model with studies using iRPMs. We demonstrated that iron loading and blockage of ferroportin by synthetic mini-hepcidin (PR73)(Stefanova et al., 2018) cause protein aggregation in iRPMs and lead to their decreased viability only in cells that were exposed to heat shock, a well-established trigger of proteotoxicity (new Fig. 5K and L). We propose that these two factors, namely age-triggered decrease in protein homeostasis and exposure to excessive iron levels, act in concert and render RPMs particularly sensitive to damage during aging (see also Discussion, p. 16).

      In parallel, our data imply that the increased iron content in aged RPMs drives their decreased erythrophagocytic activity, as we now better documented by more extensive in vitro experiments in iRPMs (new Fig 6E-H). We cannot exclude that some of the senescent splenic RBCs that are retained in the red pulp and evade erythrophagocytosis due to RPM defects in aging, may also contribute to the formation of the aggregates. This is supported by the fact that mice that lack RPMs as well exhibit iron loading in the spleen (Kohyama et al., 2009; Okreglicka et al., 2021), and that the proteome of aggregates overlaps to some extent with the proteome of erythrocytes (new Fig. 3F).

      We believe that during aging intracellular iron accumulation is chiefly driven by ferroportin downregulation, as also suggested by Reviewer#3. We now show that ferroportin drops significantly already in mice aged 4 and 5 months (new Fig. 4H), preceding most of the other impairments. This drop coincides with the increase in hepcidin expression, but if this is the sole reason for ferroportin suppression during early aging would require further investigation outside the scope of the present manuscript.

      In sum, to address this comment, we now modified the fragment of the introduction that refers to our hypothesis and major findings to be more clear (p. 4), we improved our manuscript by providing new data mentioned above and we added more explanation in the corresponding sections of the Results and Discussion.

      2) It is unclear if RPMs are in limited supply. Based on the introduction (page 4, line 13-15), they have limited self-renewal capacity and blood monocytes only partially replenished. Fig 4D suggests that there is a decrease in RPMs from aged mice. The %RPM from CD45+ compartment suggests that there may just be relatively more neutrophils or fewer monocytes recruited. There is not enough clarity on the meaning of this data point.

      Thank you for this comment. We fully agree that %RPMs of CD45+ splenocytes, although well-accepted in literature (Kohyama et al., 2009; Okreglicka et al., 2021), is only a relative number. Hence, we now included additional data and explanations regarding the loss of RPMs during aging.

      It was reported that the proportion of RPMs derived from bone marrow monocytes increases mildly but progressively during aging (Liu et al., 2019). This implies that due to the loss of the total RPM population, as illustrated by our data, the cells of embryonic origin are likely even more affected. We could confirm this assumption by re-analysis of the data from Liu et al. that we now included in the manuscript as Fig. 5E. These data clearly show that the representation of embryonically-derived RPMs drops more drastically than the percent of total RPMs, whereas the replenishment rate from monocytes is not affected significantly during aging. Consistent with this, we have not observed any robust change in the population of monocytes (F4/80-low, CD11b-high) or pre-RPMs (F4/80-high, CD11b-high) in the spleen at the age of 10 months (Figure 5-figure supplement 2A and B). We also have detected a mild decrease, not an increase, in the number of granulocytes (new Figure 5-figure supplement 2C). Furthermore, we measured in situ apoptosis marker and found a clear sign of apoptosis in the aged spleen (especially in the red pulp area), a phenotype that is less pronounced in mice on an IR diet (new Fig. 5O). This is consistent with the observation that apoptosis markers can be elevated in tissues upon ferroptosis induction (Friedmann Angeli et al., 2014) and that the proteotoxic stress in aged RPMs, which we now emphasized better in our manuscript, may also lead to apoptosis (Brancolini & Iuliano, 2020). Taken together, we strongly believe that the functional defect of embryonically-derived RPMs chiefly contributes to their shortage during aging.

      3) Anemia of aging is a complex and poorly understood mechanistically. In general, it is considered similar to anemia of chronic inflammation with increased Epo, mild drop in Hb, and erythroid expansion, similar to ineffective erythropoiesis / low Epo responsiveness. It is not surprising that IR diet did not impact this mild anemia. However, was the MCV or MCH altered in aged and IR aged mice?

      We now included the data for hematocrit, RBC counts, MCV, and MCH in Figure 1-figure supplement 5. Hematocrit shows a similar tendency as hemoglobin levels, but the values for RBC counts, MCV, and MCH seem not to be altered. We also show now that the erythropoietic activity in the bone marrow is not affected in aged versus young mice. Taken together, the anemic phenotype in female C57BL/6J mice at this age is very mild, which we emphasized in the main text, and is likely affected by other factors than serum iron levels (p. 6).

      4) Page 6, line 23 onward: the conclusion is that KC compensate for the decreased function of RPM in the spleen, based on the expansion of KC fraction in the liver. Is there evidence that KCs are engaged in more erythrophagocytosis in aged mice? Furthermore, iron accumulation in the liver with age does not demonstrate specifically enhanced erythrophagocytosis of KC. Please clarify why liver iron accumulation would not be simply a consequence of increased parenchymal iron similar to increased splenic iron with age, independent of erythrophagocytic activity in resident macrophages in either organ.

      Thanks for these questions. For the quantification of the erythrophagocytosis rate in KC, we show, as for the RPMs (Fig. 1K), the % of PKH67-positive macrophages, following transfusion of PKH67-stained stressed RBCs (Fig. 1M). The data implies a mild (not statistically significant) drop (of approx. 30%) in EP activity. We believe that it is overridden by a more pronounced (on average, 2-fold) increase in the representation of KCs (Fig. 1N). The mechanisms of iron accumulation between the spleen and the liver are very different. In the liver, we observed iron deposition in the parenchymal cells (not non-parenchymal, new Fig. 1P) that we currently characterizing in more detail in a parallel manuscript. Our data demonstrate a drop in transferrin saturation in aged mice. Hence, it is highly unlikely that aging would be hallmarked by the presence of circulating non-transferrin-bound iron that would be sequestered by hepatocytes, as shown previously (Jenkitkasemwong et al., 2015). Thus, the iron released locally by KCs is the most likely contributor to progressive hepatocytic iron loading during aging. The mechanism of iron delivery to hepatocytes from erythrophagocytosing KCs was demonstrated by Theurl et al.(Theurl et al., 2016), and we propose that it may be operational, although in a much more prolonged time scale, during aging. We now discussed this part better in our Results sections (p. 7).

      5) Unclear whether the effect on RPMs is intrinsic or extrinsic. Would be helpful to evaluate aged iRPMs using young RBC vs. young iRPMs using old RBCs.

      We are skeptical if the generation of iRPMs cells from aged mice would be helpful – these cells are a specific type of primary macrophage culture, derived from bone marrow monocytes with MCSF1, and exposed additionally to heme and IL-33 for 4 days. We do not expect that bone marrow monocytes are heavily affected by aging, and would thus recapitulate some aspects of aged RPMs from the spleen, especially after 8-day in vitro culture. However, to address the concerns of the reviewer, we now provide additional data regarding RBC fitness. Consistent with the time life-span experiment (Fig, 2A), we show that oxidative stress in RBCs is only increased in splenic, but not circulating RBCs (new Fig. 2C, replacing the old Fig. 2B and C). In addition, we show no signs of age-triggered iron loading in RBCs, either in the spleen (new Fig. 2F) or in the circulation (new Fig. 2B). Hence, we do not envision a possibility that RPMs become iron-loaded during aging as a result of erythrophagocytosis of iron-loaded RBCs. In support of this, we also have observed that during aging first RPMs’ FPN levels drop, afterward erythrophagocytosis rate decreases, and lastly, RBCs start to exhibit significantly increased oxidative stress (presented now in new Fig. 4H, J and K).

      6) Discussion of aggregates in the spleen of aged mice (Fig 2G-2K and Fig 3) is very descriptive and non-specific. For example, if the iron-rich aggregates are hemosiderin, a hemosiderin-specific stain would be helpful. This data specifically is correlatory and difficult to extract value from.

      Thanks for these comments. To the best of our knowledge Prussian blue Perls’ staining (Fig. 2J) is considered a hemosiderin staining. Our investigations aimed to better understand the nature and the origin of splenic iron deposits that to some extent are referred to as hemosiderin. Most importantly, as mentioned in our reply R1 Ad. 1. to assign causality to our data, we now demonstrated that iron accumulation in RPMs in response to iron-dextran (Fig. 3G) increases lipid peroxidation (Fig. 5F), tends to provoke RPMs depletion (Fig. 5G) and triggers the formation of protein-rich aggregates (new Fig. 3H). Of note, we assume that the loss of embryonically-derived RPMs in this model may be masked by simultaneous replenishment of the niche from monocytes, a phenomenon that may be addressed by future studies using Ms4a3-driven reporter mice (as shown for aged mice in our new Fig. 5E).

      7) The aging phenotype in RPMs appears to be initiated sometime after 2 months of age. However, there is some reversal of the phenotype with increasing age, e.g. Fig 4B with decreased lipid peroxidation in 9 month old relative to 6 month old RPMs. What does this mean? Why is there a partial spontaneous normalization?

      Thanks for this comment and questions. Indeed, the degree of lipid peroxidation exhibits some kinetics, suggestive of partial normalization. Of note, such a tendency is not evident for other aging phenotypes of RPMs, hence, we did not emphasize this in the original manuscript. However, in a revised version of the manuscript, we now present the re-analysis of the published data which implies that the number of embryonically-derived RPMs drops substantially between mice at 20 weeks and 36 weeks (new Fig. 5E). We think that the higher proportion of monocyte-derived RPMs in total RPM population later in aging (9 months) might be responsible for the partial alleviation of lipid peroxidation. We now discussed this possibility in the Results sections (p. 12).

      8) Does the aging phenotype in RPMs respond to ferristatin? It appears that NAC, which is a glutathione generator and can reverse ferroptosis, does not reverse the decreased RPM erythrophagocytic capacity observed with age yet the authors still propose that ferroptosis is involved. A response to ferristatin is a standard and acceptable approach to evaluating ferroptosis.

      We fully agree with the Reviewer that using ferristatin or Liproxstatin-1 would be very helpful to fully characterize a mechanism of RPMs depletion in mice. However, previous in vivo studies involving Liproxstatin-1 administration required daily injections of this ferroptosis inhibitor (Friedmann Angeli et al., 2014). This would be hardly feasible during aging. Regarding the experiments involving iron-dextran injection, using Liproxstatin-1 would require additional permission from the ethical committee which takes time to be processed and received. However, to address this question we now provide data from iRPMs cell cultures (new Fig.5 K-L). In essence, our results imply that both proteotoxic stress and iron overload act in concert to trigger cytotoxicity in RPM in vitro model. Interestingly, this phenomenon does not depend solely on the increased lipid peroxidation, but when we neutralize the latter with Liproxstatin-1, the cytotoxic effect is diminished (please, see also Results on p. 13 and Discussion p. 15/16).

      9) The possible central role for HO-1 in the pathophysiology of decreased RPM erythrophagocytic capacity with age is interesting. However, it is not clear how the authors arrived at this hypothesis and would be useful to evaluate in the least whether RBCs in young vs. aged mice have more hemoglobin as these changes may be primary drivers of how much HO-1 is needed during erythrophagocytosis.

      Thanks for this comment. We got interested in HO-1 levels based on the RNA sequencing data, which detected lower Hmox-1 expression in aged RPMs (Figure 3-figure supplement 1). We now show that the content of hemoglobin is not significantly altered in aged RBCs (MCH parameter, Figure 1-figure supplement 5E), hence we do not think that this is the major driver for Hmox-1 downregulation. Likewise, the levels of the Bach1 message, a gene encoding Hmox-1 transcriptional repressor, are not significantly altered according to RNAseq data. Hence, the reason for the transcriptional downregulation of Hmox-1 is not clear. Of note, HO-1 protein levels in the total spleen are higher in aged versus young mice, and we also detected a clear appearance of its nuclear truncated and enzymatically-inactive form (see a figure below, we opt not to include this in the manuscript for better clarity). The appearance of truncated HO-1 seems to be partially rescued by the IR diet. It is well established that the nuclear form of HO-1 emerges via proteolytic cleavage and migrates to the nucleus under conditions of oxidative stress (Mascaro et al., 2021). This additionally confirms that the aging spleen is hallmarked by an increased burden of ROS. Moreover, we also detected HO-1 as one of the components of the protein iron-rich aggregates. Thus, we propose that the low levels of the cytoplasmic enzymatically active form of HO-1 in RPMs (that we preferentially detect with our intracellular staining and flow cytometry) may be underlain by its nuclear translocation and sequestration in protein aggregates that evade antibody binding [this is also supported by our observation that the protein aggregates, despite the high content of ferritin (as indicated by MS analysis) are negative for L-ferritin staining. Of note, we also cannot exclude that other cell types in the aging spleen (eg. lymphocytes) express higher levels of HO-1 in response to splenic oxidative stress.

      Fig. Total splenic levels of HO-1 in young, aged IR and aged mice.

      Reviewer #2 (Public Review):

      Slusarczyk et al. investigate the functional impairment of red pulp macrophages (RPMs) during aging. When red blood cells (RBCs) become senescent, they are recycled by RPMs via erythrophagocytosis (EP). This leads to an increase in intracellular heme and iron both of which are cytotoxic. The authors hypothesize that the continuous processing of iron by RPMs could alter their functions in an age-dependent manner. The authors used a wide variety of models: in vivo model using female mice with standard (200ppm) and restricted (25ppm) iron diet, ex vivo model using EP with splenocytes, and in vitro model with EP using iRPMs. The authors found iron accumulation in organs but markers for serum iron deficiency. They show that during aging, RPMs have a higher labile iron pool (LIP), decreased lysosomal activity with a concomitant reduction in EP. Furthermore, aging RPMs undergo ferroptosis resulting in a non-bioavailable iron deposition as intra and extracellular aggregates. Aged mice fed with an iron restricted diet restore most of the iron-recycling capacity of RPMs even though the mild-anemia remains unchanged.

      Overall, I find the manuscript to be of significant potential interest. But there are important discrepancies that need to be first resolved. The proposed model is that during aging both EP and HO-1 expression decreases in RPMs but iron and ferroportin levels are elevated. In their model, the authors show intracellular iron-rich proteinaceous aggregates. But if HO-1 levels decrease, intracellular heme levels should increase. If Fpn levels increase, intracellular iron levels should decrease. How does LIP stay high in RPMs under these conditions? I find these to be major conflicting questions in the model.

      We thank the Reviewer for her/his valuable feedback. As we mentioned in our replies we can only assume that a small misunderstanding in the interpretation of the presented data underlies this comment. We show that ferroportin levels in RPMs (Fig. 1F) are modulated in a manner that fully reflects the iron status of these cells (both labile and total iron levels, Figs. 1H and I). FPN levels drop in aged RPMs and are rescued when mice are maintained on a reduced iron diet. As pointed out by Reviewer#3, and explained in our replies we believe that ferroportin levels are critical for the observed phenotypes in aging. We now described our data in a more clear way to avoid any potential misinterpretation (p.6).

      Reviewer #3 (Public Review):

      This is a comprehensive study of the effects of aging of the function of red pulp macrophages (RPM) involved in iron recycling from erythrocytes. The authors document that insoluble iron accumulates in the spleen, that RPM become functionally impaired, and that these effects can be ameliorated by an iron-restricted diet. The study is well written, carefully done, extensively documented, and its conclusions are well supported. It is a useful and important addition for at least three distinct fields: aging, iron and macrophage biology.

      The authors do not explain why an iron-restricted diet has such a strong beneficial effect on RPM aging. This is not at all obvious. I assume that the number of erythrocytes that are recycled in the spleen, and are by far the largest source of splenic iron, is not changed much by iron restriction. Is the iron retention time in macrophages changed by the diet, i.e. the recycled iron is retained for a short time when diet is iron-restricted (making hepcidin low and ferroportin high), and long time when iron is sufficient (making hepcidin high and ferroportin low)? Longer iron retention could increase damage and account for the effect. Possibly, macrophages may not empty completely of iron before having to ingest another senescent erythrocyte, and so gradually accumulate iron.

      We are very grateful to this Reviewer for emphasizing the importance of the iron export capacity of RPMs as a possible driver of the observed phenotypes. Indeed, as mentioned above, we now show in the revised version of the manuscript that ferroportin drops early during aging (revised Fig. 4). Importantly, we now also observed that iron loading and limitation of iron export from iRPMs via ferroportin aggravate the impact of heat shock (a well-accepted trigger of proteotoxicity) on both protein aggregation and cell viability (new Fig. 5K and L). Physiologically, recent findings show that aging promotes a global decrease in protein solubility [BioRxiv manuscript (Sui X. et al., 2022)], and it is very likely that the constant exposure of RPMs to high iron fluxes renders these specialized cells particularly sensitive to proteome instability. This could be further aggravated by a build-up of iron due to the drop of ferroportin early during aging, ultimately leading to the appearance of the protein aggregates as early as at 5 months of age in C57BL/6J females. Based on the new data, we emphasized this model in the revised version of the manuscript (please, see Discussion on p. 16)

    1. Author response:

      Reviewer #1 (Public Review):

      In this paper, Tompary & Davachi present work looking at how memories become integrated over time in the brain, and relating those mechanisms to responses on a priming task as a behavioral measure of memory linkage. They find that remotely but not recently formed memories are behaviorally linked and that this is associated with a change in the neural representation in mPFC. They also find that the same behavioral outcomes are associated with the increased coupling of the posterior hippocampus with category-sensitive parts of the neocortex (LOC) during a post-learning rest period-again only for remotely learned information. There was also correspondence in rest connectivity (posterior hippocampus-LOC) and representational change (mPFC) such that for remote memories specifically, the initial post-learning connectivity enhancement during rest related to longer-term mPFC representational change.

      This work has many strengths. The topic of this paper is very interesting, and the data provide a really nice package in terms of providing a mechanistic account of how memories become integrated over a delay. The paper is also exceptionally well-written and a pleasure to read. There are two studies, including one large behavioral study, and the findings replicate in the smaller fMRI sample. I do however have two fairly substantive concerns about the analytic approach, where more data will be required before we can know whether the interpretations are an appropriate reflection of the findings. These and other concerns are described below.

      Thank you for the positive comments! We are proud of this work, and we feel that the paper is greatly strengthened by the revisions we made in response to your feedback. Please see below for specific changes that we’ve made.

      1) One major concern relates to the lack of a pre-encoding baseline scan prior to recent learning.

      a) First, I think it would be helpful if the authors could clarify why there was no pre-learning rest scan dedicated to the recent condition. Was this simply a feasibility consideration, or were there theoretical reasons why this would be less "clean"? Including this information in the paper would be helpful for context. Apologies if I missed this detail in the paper.

      This is a great point and something that we struggled with when developing this experiment. We considered several factors when deciding whether to include a pre-learning baseline on day two. First, the day 2 scan session was longer than that of day 1 because it included the recognition priming and explicit memory tasks, and the addition of a baseline scan would have made the length of the session longer than a typical scan session – about 2 hours in the scanner in total – and we were concerned that participant engagement would be difficult to sustain across a longer session. Second, we anticipated that the pre-learning scan would not have been a ‘clean’ measure of baseline processing, but rather would include signal related to post-learning processing of the day 1 sequences, as multi-variate reactivation of learned stimuli have been observed in rest scans collected 24-hours after learning (Schlichting & Preston, 2014). We have added these considerations to the Discussion (page 39, lines 1047-1070).

      b) Second, I was hoping the authors could speak to what they think is reflected in the post-encoding "recent" scan. Is it possible that these data could also reflect the processing of the remote memories? I think, though am not positive, that the authors may be alluding to this in the penultimate paragraph of the discussion (p. 33) when noting the LOC-mPFC connectivity findings. Could there be the reinstatement of the old memories due to being back in the same experimental context and so forth? I wonder the extent to which the authors think the data from this scan can be reflected as strictly reflecting recent memories, particularly given it is relative to the pre-encoding baseline from before the remote memories, as well (and therefore in theory could reflect both the remote + recent). (I should also acknowledge that, if it is the case that the authors think there might be some remote memory processing during the recent learning session in general, a pre-learning rest scan might not have been "clean" either, in that it could have reflected some processing of the remote memories-i.e., perhaps a clean pre-learning scan for the recent learning session related to point 1a is simply not possible.)

      We propose that theoretically, the post-learning recent scan could indeed reflect mixture of remote and recent sequences. This is one of the drawbacks of splitting encoding into two sessions rather than combining encoding into one session and splitting retrieval into an immediate and delayed session; any rest scans that are collected on Day 2 may have signal that relates to processing of the Day 1 remote sequences, which is why we decided against the pre-learning baseline for Day 2, as you had noted.

      You are correct that we alluded to in our original submission when discussing the LOC-mPFC coupling result, and we have taken steps to discuss this more explicitly. In Brief, we find greater LOC-mPFC connectivity only after recent learning relative to the pre-learning baseline, and cortical-cortical connectivity could be indicative of processing memories that already have undergone some consolidation (Takashima et al., 2009; Smith et al., 2010). From another vantage point, the mPFC representation of Day 1 learning may have led to increased connectivity with LOC on Day 2 due to Day 1 learning beginning to resemble consolidated prior knowledge (van Kesteren et al., 2010). While this effect is consistent with prior literature and theory, it's unclear why we would find evidence of processing of the remote memories and not the recent memories. Furthermore, the change in LOC-mPFC connectivity in this scan did not correlate with memory behaviors from either learning session, which could be because signal from this scan reflects a mix of processing of the two different learning sessions. With these ideas in mind, we have fleshed out the discussion of the post-encoding ‘recent’ scan in the Discussion (page 38-39, lines 1039-1044).

      c) Third, I am thinking about how both of the above issues might relate to the authors' findings, and would love to see more added to the paper to address this point. Specifically, I assume there are fluctuations in baseline connectivity profile across days within a person, such that the pre-learning connectivity on day 1 might be different from on day 2. Given that, and the lack of a pre-learning connectivity measure on day 2, it would logically follow that the measure of connectivity change from pre- to post-learning is going to be cleaner for the remote memories. In other words, could the lack of connectivity change observed for the recent scan simply be due to the lack of a within-day baseline? Given that otherwise, the post-learning rest should be the same in that it is an immediate reflection of how connectivity changes as a function of learning (depending on whether the authors think that the "recent" scan is actually reflecting "recent + remote"), it seems odd that they both don't show the same corresponding increase in connectivity-which makes me think it may be a baseline difference. I am not sure if this is what the authors are implying when they talk about how day 1 is most similar to prior investigation on p. 20, but if so it might be helpful to state that directly.

      We agree that it is puzzling that we don’t see that hippocampal-LOC connectivity does not also increase after recent learning, equivalently to what we see after remote learning. However, the fact that there is an increase from baseline rest to post-recent rest in mPFC – LOC connectivity suggests that it’s not an issue with baseline, but rather that the post-recent learning scan is reflecting processing of the remote memories (although as a caveat, there is no relationship with priming).

      On what is now page 23, we were referring to the notion that the Day 1 procedure (baseline rest, learning, post-learning rest) is the most straightforward replication of past work that finds a relationship between hippocampal-cortical coupling and later memory. In contrast, the Day 2 learning and rest scan are less ‘clean’ of a replication in that they are taking place in the shadow of Day 1 learning. We have clarified this in the Results (page 23, lines 597-598).

      d) Fourth and very related to my point 1c, I wonder if the lack of correlations for the recent scan with behavior is interpretable, or if it might just be that this is a noisy measure due to imperfect baseline correction. Do the authors have any data or logic they might be able to provide that could speak to these points? One thing that comes to mind is seeing whether the raw post-learning connectivity values (separately for both recent and remote) show the same pattern as the different scores. However, the authors may come up with other clever ways to address this point. If not, it might be worth acknowledging this interpretive challenge in the Discussion.

      We thought of three different approaches that could help us to understand whether the lack of correlations in between coupling and behavior in the recent scan was due to noise. First, we correlated recognition priming with raw hippocampal-LOC coupling separately for pre- and post-learning scans, as in Author response image 1:

      Author response image 1.

      Note that the post-learning chart depicts the relationship between post-remote coupling and remote priming and between post-recent coupling and recent priming (middle). Essentially, post-recent learning coupling did not relate to priming of recently learned sequences (middle; green) while there remains a trend for a relationship between post-remote coupling and priming for remotely learned sequences (middle; blue). However, the significant relationship between coupling and priming that we reported in the paper (right, blue) is driven both by the initial negative relationship that is observed in the pre-learning scan and the positive relationship in the post-remote learning scan. This highlights the importance of using a change score, as there may be spurious initial relationships between connectivity profiles and to-be-learned information that would then mask any learning- and consolidation-related changes.

      We also reasoned that if comparisons between the post-recent learning scan and the baseline scan are noisier than between the post-remote learning and baseline scan, there may be differences in the variance of the change scores across participants, such that changes in coupling from baseline to post-recent rest may be more variable than coupling from baseline to post-remote rest. We conducted F-tests to compare the variance of the change in these two hippocampal-LO correlations and found no reliable difference (ratio of difference: F(22, 22) = 0.811, p = .63).

      Finally, we explored whether hippocampal-LOC coupling is more stable across participants if compared across two rest scans within the same imaging session (baseline and post-remote) versus across two scans across two separate sessions (baseline and post-recent). Interestingly, coupling was not reliably correlated across scans in either case (baseline/post-remote: r = 0.03, p = 0.89 Baseline/post-recent: r = 0.07, p = .74).

      Finally, we evaluated whether hippocampal-LOC coupling was correlated across different rest scans (see Author response image 2). We reasoned that if such coupling was more correlated across baseline and post-remote scans relative to baseline and post-recent scans, that would indicate a within-session stability of participants’ connectivity profiles. At the same time, less correlation of coupling across baseline and post-recent scans would be an indication of a noisier change measure as the measure would additionally include a change in individuals’ connectivity profile over time. We found that there was no difference in the correlation of hipp-LO coupling is across sessions, and the correlation was not reliably significant for either session (baseline/post-remote: r = 0.03, p = 0.89; baseline/post-recent: r = 0.07, p = .74; difference: Steiger’s t = 0.12, p = 0.9).

      Author response image 2.

      We have included the raw correlations with priming (page 25, lines 654-661, Supplemental Figure 6) as well as text describing the comparison of variances (page 25, lines 642-653). We did not add the comparison of hippocampal-LOC coupling across scans to the current manuscript, as an evaluation of stability of such coupling in the context of learning and reactivation seems out of scope of the current focus of the experiment, but we find this result to be worthy of follow-up in future work.

      In summary, further analysis of our data did not reveal any indication that a comparison of rest connectivity across scan sessions inserted noise into the change score between baseline and post-recent learning scans. However, these analyses cannot fully rule that possibility out, and the current analyses do not provide concrete evidence that the post-recent learning scan comprises signals that are a mixture of processing of recent and remote sequences. We discuss these drawbacks in the Discussion (page 39, lines 1047-1070).

      2) My second major concern is how the authors have operationalized integration and differentiation. The pattern similarity analysis uses an overall correspondence between the neural similarity and a predicted model as the main metric. In the predicted model, C items that are indirectly associated are more similar to one another than they are C items that are entirely unrelated. The authors are then looking at a change in correspondence (correlation) between the neural data and that prediction model from pre- to post-learning. However, a change in the degree of correspondence with the predicted matrix could be driven by either the unrelated items becoming less similar or the related ones becoming more similar (or both!). Since the interpretation in the paper focuses on change to indirectly related C items, it would be important to report those values directly. For instance, as evidence of differentiation, it would be important to show that there is a greater decrease in similarity for indirectly associated C items than it is for unrelated C items (or even a smaller increase) from pre to post, or that C items that are indirectly related are less similar than are unrelated C items post but not pre-learning. Performing this analysis would confirm that the pattern of results matches the authors' interpretation. This would also impact the interpretation of the subsequent analyses that involve the neural integration measures (e.g., correlation analyses like those on p. 16, which may or may not be driven by increased similarity among overlapping C pairs). I should add that given the specificity to the remote learning in mPFC versus recent in LOC and anterior hippocampus, it is clearly the case that something interesting is going on. However, I think we need more data to understand fully what that "something" is.

      We recognize the importance of understanding whether model fits (and changes to them) are driven by similarity of overlapping pairs or non-overlapping pairs. We have modified all figures that visualize model fits to the neural integration model to separately show fits for pre- and post-learning (Figure 3 for mPFC, Supp. Figure 5 for LOC, Supp. Figure 9 for AB similarity in anterior hippocampus & LOC). We have additionally added supplemental figures to show the complete breakdown of similarity each region in a 2 (pre/post) x 2 (overlapping/non-overlapping sequence) x 2 (recent/remote) chart. We decided against including only these latter charts rather than the model fits since the model fits strike a good balance between information and readability. We have also modified text in various sections to focus on these new results.

      In brief, the decrease in model fit for mPFC for the remote sequences was driven primarily by a decrease in similarity for the overlapping C items and not the non-overlapping ones (Supplementary Figure 3, page 18, lines 468-472).

      Interestingly, in LOC, all C items grew more similar after learning, regardless of their overlap or learning session, but the increase in model fit for C items in the recent condition was driven by a larger increase in similarity for overlapping pairs relative to non-overlapping ones (Supp. Figure 5, page 21, lines 533-536).

      We also visualized AB similarity in the anterior hippocampus and LOC in a similar fashion (Supplementary Figure 9).

      We have also edited the Methods sections with updated details of these analyses (page 52, lines 1392-1397). We think that including these results considerably strengthen our claims and we are pleased to have them included.

      3) The priming task occurred before the post-learning exposure phase and could have impacted the representations. More consideration of this in the paper would be useful. Most critically, since the priming task involves seeing the related C items back-to-back, it would be important to consider whether this experience could have conceivably impacted the neural integration indices. I believe it never would have been the case that unrelated C items were presented sequentially during the priming task, i.e., that related C items always appeared together in this task. I think again the specificity of the remote condition is key and perhaps the authors can leverage this to support their interpretation. Can the authors consider this possibility in the Discussion?

      It's true that only C items from the same sequence were presented back-to-back during the priming task, and that this presentation may interfere with observations from the post-learning exposure scan that followed it. We agree that it is worth considering this caveat and have added language in the Discussion (page 40, lines 1071-1086). When designing the study, we reasoned that it was more important for the behavioral priming task to come before the exposure scans, as all items were shown only once in that task, whereas they were shown 4-5 times in a random order in the post-learning exposure phase. Because of this difference in presentation times, and because behavioral priming findings tend to be very sensitive, we concluded that it was more important to protect the priming task from the exposure scan instead of the reverse.

      We reasoned, however, that the additional presentation of the C items in the recognition priming task would not substantially override the sequence learning, as C items were each presented 16 times in their sequence (ABC1 and ABC2 16 times each). Furthermore, as this reviewer suggests, the order of C items during recognition was the same for recent and remote conditions, so the fact that we find a selective change in neural representation for the remote condition and don’t also see that change for the recent condition is additional assurance that the recognition priming order did not substantially impact the representations.

      4) For the priming task, based on the Figure 2A caption it seems as though every sequence contributes to both the control and primed conditions, but (I believe) this means that the control transition always happens first (and they are always back-to-back). Is this a concern? If RTs are changing over time (getting faster), it would be helpful to know whether the priming effects hold after controlling for trial numbers. I do not think this is a big issue because if it were, you would not expect to see the specificity of the remotely learned information. However, it would be helpful to know given the order of these conditions has to be fixed in their design.

      This is a correct understanding of the trial orders in the recognition priming task. We chose to involve the baseline items in the control condition to boost power – this way, priming of each sequence could be tested, while only presenting each item once in this task, as repetition in the recognition phase would have further facilitated response times and potentially masked any priming effects. We agree that accounting for trial order would be useful here, so we ran a mixed-effects linear model to examine responses times both as a function of trial number and of priming condition (primed/control). While there is indeed a large effect of trial number such that participants got faster over time, the priming effect originally observed in the remote condition still holds at the same time. We now report this analysis in the Results section (page 14, lines 337-349 for Expt 1 and pages 14-15, lines 360-362 for Expt 2).

      5) The authors should be cautious about the general conclusion that memories with overlapping temporal regularities become neurally integrated - given their findings in MPFC are more consistent with overall differentiation (though as noted above, I think we need more data on this to know for sure what is going on).

      We realize this conclusion was overly simplistic and, in several places, have revised the general conclusions to be more specific about the nuanced similarity findings.

      6) It would be worth stating a few more details and perhaps providing additional logic or justification in the main text about the pre- and post-exposure phases were set up and why. How many times each object was presented pre and post, and how the sequencing was determined (were any constraints put in place e.g., such that C1 and C2 did not appear close in time?). What was the cover task (I think this is important to the interpretation & so belongs in the main paper)? Were there considerations involving the fact that this is a different sequence of the same objects the participants would later be learning - e.g., interference, etc.?

      These details can be found in the Methods section (pages 50-51, lines 1337-1353) and we’ve added a new summary of that section in the Results (page 17, lines 424- 425 and 432-435). In brief, a visual hash tag appeared on a small subset of images and participants pressed a button when this occurred, and C1 and C2 objects were presented in separate scans (as were A and B objects) to minimize inflated neural similarity due to temporal proximity.

      Reviewer #2 (Public Review):

      The manuscript by Tompary & Davachi presents results from two experiments, one behavior only and one fMRI plus behavior. They examine the important question of how to separate object memories (C1 and C2) that are never experienced together in time and become linked by shared predictive cues in a sequence (A followed by B followed by one of the C items). The authors developed an implicit priming task that provides a novel behavioral metric for such integration. They find significant C1-C2 priming for sequences that were learned 24h prior to the test, but not for recently learned sequences, suggesting that associative links between the two originally separate memories emerge over an extended period of consolidation. The fMRI study relates this behavioral integration effect to two neural metrics: pattern similarity changes in the medial prefrontal cortex (mPFC) as a measure of neural integration, and changes in hippocampal-LOC connectivity as a measure of post-learning consolidation. While fMRI patterns in mPFC overall show differentiation rather than integration (i.e., C1-C2 representational distances become larger), the authors find a robust correlation such that increasing pattern similarity in mPFC relates to stronger integration in the priming test, and this relationship is again specific to remote memories. Moreover, connectivity between the posterior hippocampus and LOC during post-learning rest is positively related to the behavioral integration effect as well as the mPFC neural similarity index, again specifically for remote memories. Overall, this is a coherent set of findings with interesting theoretical implications for consolidation theories, which will be of broad interest to the memory, learning, and predictive coding communities.

      Strengths:

      1) The implicit associative priming task designed for this study provides a promising new tool for assessing the formation of mnemonic links that influence behavior without explicit retrieval demands. The authors find an interesting dissociation between this implicit measure of memory integration and more commonly used explicit inference measures: a priming effect on the implicit task only evolved after a 24h consolidation period, while the ability to explicitly link the two critical object memories is present immediately after learning. While speculative at this point, these two measures thus appear to tap into neocortical and hippocampal learning processes, respectively, and this potential dissociation will be of interest to future studies investigating time-dependent integration processes in memory.

      2) The experimental task is well designed for isolating pre- vs post-learning changes in neural similarity and connectivity, including important controls of baseline neural similarity and connectivity.

      3) The main claim of a consolidation-dependent effect is supported by a coherent set of findings that relate behavioral integration to neural changes. The specificity of the effects on remote memories makes the results particularly interesting and compelling.

      4) The authors are transparent about unexpected results, for example, the finding that overall similarity in mPFC is consistent with a differentiation rather than an integration model.

      Thank you for the positive comments!

      Weaknesses:

      1) The sequence learning and recognition priming tasks are cleverly designed to isolate the effects of interest while controlling for potential order effects. However, due to the complex nature of the task, it is difficult for the reader to infer all the transition probabilities between item types and how they may influence the behavioral priming results. For example, baseline items (BL) are interspersed between repeated sequences during learning, and thus presumably can only occur before an A item or after a C item. This seems to create non-random predictive relationships such that C is often followed by BL, and BL by A items. If this relationship is reversed during the recognition priming task, where the sequence is always BL-C1-C2, this violation of expectations might slow down reaction times and deflate the baseline measure. It would be helpful if the manuscript explicitly reported transition probabilities for each relevant item type in the priming task relative to the sequence learning task and discussed how a match vs mismatch may influence the observed priming effects.

      We have added a table of transition probabilities across the learning, recognition priming, and exposure scans (now Table 1, page 48). We have also included some additional description of the change in transition probabilities across different tasks in the Methods section. Specifically, if participants are indeed learning item types and rules about their order, then both the control and the primed conditions would violate that order. Since C1 and C2 items never appeared together, viewing C1 would give rise to an expectation of seeing a BL item, which would also be violated. This suggests that our priming effects are driven by sequence-specific relationships rather than learning of the probabilities of different item types. We’ve added this consideration to the Methods section (page 45, lines 1212-1221).

      Another critical point to consider (and that the transition probabilities do not reflect) is that during learning, while C is followed either by A or BL, they are followed by different A or BL items. In contrast, a given A is always followed by the same B object, which is always followed by one of two C objects. While the order of item types is semi-predictable, the order of objects (specific items) themselves are not. This can be seen in the response times during learning, such that response times for A and BL items are always slower than for B and C items. We have explained this nuance in the figure text for Table 1.

      2) The choice of what regions of interest to include in the different sets of analyses could be better motivated. For example, even though briefly discussed in the intro, it remains unclear why the posterior but not the anterior hippocampus is of interest for the connectivity analyses, and why the main target is LOC, not mPFC, given past results including from this group (Tompary & Davachi, 2017). Moreover, for readers not familiar with this literature, it would help if references were provided to suggest that a predictable > unpredictable contrast is well suited for functionally defining mPFC, as done in the present study.

      We have clarified our reasoning for each of these choices throughout the manuscript and believe that our logic is now much more transparent. For an expanded reasoning of why we were motivated to look at posterior and not anterior hippocampus, see pages 6-7, lines 135-159, and our response to R2. In brief, past research focusing on post-encoding connectivity with the hippocampus suggests that posterior aspect is more likely to couple with category-selective cortex after learning neutral, non-rewarded objects much like the stimuli used in the present study.

      We also clarify our reasoning for LOC over mPFC. While theoretically, mPFC is thought to be a candidate region for coupling with the hippocampus during consolidation, the bulk of empirical work to date has revealed post-encoding connectivity between the hippocampus and category-selective cortex in the ventral and occipital lobes (page 6, lines 123-134).

      As for the use of the predictable > unpredictable contrast for functionally defining cortical regions, we reasoned that cortical regions that were sensitive to the temporal regularities generated by the sequences may be further involved in their offline consolidation and long-term storage (Danker & Anderson, 2010; Davachi & Danker, 2013; McClelland et al., 1995). We have added this justification to the Methods section (page 18, lines 454-460).

      3) Relatedly, multiple comparison corrections should be applied in the fMRI integration and connectivity analyses whenever the same contrast is performed on multiple regions in an exploratory manner.

      We now correct for multiple comparisons using Bonferroni correction, and this correction depends on the number of regions in which each analysis is conducted. Please see page 55, lines 1483-1490, in the Methods section for details of each analysis.

      Reviewer #3 (Public Review):

      The authors of this manuscript sought to illuminate a link between a behavioral measure of integration and neural markers of cortical integration associated with systems consolidation (post-encoding connectivity, change in representational neural overlap). To that aim, participants incidentally encoded sequences of objects in the fMRI scanner. Unbeknownst to participants, the first two objects of the presented ABC triplet sequences overlapped for a given pair of sequences. This allowed the authors to probe the integration of unique C objects that were never directly presented in the same sequence, but which shared the same preceding A and B objects. They encoded one set of objects on Day 1 (remote condition), another set of objects 24 hours later (recent condition) and tested implicit and explicit memory for the learned sequences on Day 2. They additionally collected baseline and post-encoding resting-state scans. As their measure of behavioral integration, the authors examined reaction time during an Old/New judgement task for C objects depending on if they were preceded by a C object from an overlapping sequence (primed condition) versus a baseline object. They found faster reaction times for the primed objects compared to the control condition for remote but not recently learned objects, suggesting that the C objects from overlapping sequences became integrated over time. They then examined pattern similarity in a priori ROIs as a measure of neural integration and found that participants showing evidence of integration of C objects from overlapping sequences in the medial prefrontal cortex for remotely learned objects also showed a stronger implicit priming effect between those C objects over time. When they examined the change in connectivity between their ROIs after encoding, they also found that connectivity between the posterior hippocampus and lateral occipital cortex correlated with larger priming effects for remotely learned objects, and that lateral occipital connectivity with the medial prefrontal cortex was related to neural integration of remote objects from overlapping sequences.

      The authors aim to provide evidence of a relationship between behavioral and neural measures of integration with consolidation is interesting, important, and difficult to achieve given the longitudinal nature of studies required to answer this question. Strengths of this study include a creative behavioral task, and solid modelling approaches for fMRI data with careful control for several known confounds such as bold activation on pattern analysis results, motion, and physiological noise. The authors replicate their behavioral observations across two separate experiments, one of which included a large sample size, and found similar results that speak to the reliability of the observed behavioral phenomenon. In addition, they document several correlations between neural measures and task performance, lending functional significance to their neural findings.

      Thank you for this positive assessment of our study!

      However, this study is not without notable weaknesses that limit the strength of the manuscript. The authors report a behavioral priming effect suggestive of integration of remote but not recent memories, leading to the interpretation that the priming effect emerges with consolidation. However, they did not observe a reliable interaction between the priming condition and learning session (recent/remote) on reaction times, meaning that the priming effect for remote memories was not reliably greater than that observed for recent. In addition, the emergence of a priming effect for remote memories does not appear to be due to faster reaction times for primed targets over time (the condition of interest), but rather, slower reaction times for control items in the remote condition compared to recent. These issues limit the strength of the claim that the priming effect observed is due to C items of interest being integrated in a consolidation-dependent manner.

      We acknowledge that the lack of a day by condition interaction in the behavioral priming effect should discussed and now discuss this data in a more nuanced manner. While it’s true that the priming effect emerges due to a slowing of the control items over time, this slowing is consistent with classic time-dependent effects demonstrating slower response times for more delayed memories. The fact that the response times in the primed condition does not show this slowing can be interpreted as a protection against this slowing that would otherwise occur. Please see page 29, lines 758-766, for this added discussion.

      Similarly, the interactions between neural variables of interest and learning session needed to strongly show a significant consolidation-related effect in the brain were sometimes tenuous. There was no reliable difference in neural representational pattern analysis fit to a model of neural integration between the short and long delays in the medial prefrontal cortex or lateral occipital cortex, nor was the posterior hippocampus-lateral occipital cortex post-encoding connectivity correlation with subsequent priming significantly different for recent and remote memories. While the relationship between integration model fit in the medial prefrontal cortex and subsequent priming (which was significantly different from that occurring for recent memories) was one of the stronger findings of the paper in favor of a consolidation-related effect on behavior, is it possible that lack of a behavioral priming effect for recent memories due to possible issues with the control condition could mask a correlation between neural and behavioral integration in the recent memory condition?

      While we acknowledge that lack of a statistically reliable interaction between neural measures and behavioral priming in many cases, we are heartened by the reliable difference in the relationship between mPFC similarity and priming over time, which was our main planned prediction. In addition to adding caveats in the discussion about the neural measures and behavioral findings in the recent condition (see our response to R1.1 and R1.4 for more details), we have added language throughout the manuscript noting the need to interpret these data with caution.

      These limitations are especially notable when one considers that priming does not classically require a period of prolonged consolidation to occur, and prominent models of systems consolidation rather pertain to explicit memory. While the authors have provided evidence that neural integration in the medial prefrontal cortex, as well as post-encoding coupling between the lateral occipital cortex and posterior hippocampus, are related to faster reaction times for primed objects of overlapping sequences compared to their control condition, more work is needed to verify that the observed findings indeed reflect consolidation dependent integration as proposed.

      We agree that more work is needed to provide converging evidence for these novel findings. However, we wish to counter the notion that systems consolidation models are relevant only for explicit memories. Although models of systems consolidation often mention transformations from episodic to semantic memory, the critical mechanisms that define the models involve changes in the neural ensembles of a memory that is initially laid down in the hippocampus and is taught to cortex over time. This transformation of neural traces is not specific to explicit/declarative forms of memory. For example, implicit statistical learning initially depends on intact hippocampal function (Schapiro et al., 2014) and improves over consolidation (Durrant et al., 2011, 2013; Kóbor et al., 2017).

      Second, while there are many classical findings of priming during or immediately after learning, there are several instances of priming used to measure consolidation-related changes to newly learned information. For instance, priming has been used as a measure of lexical integration, demonstrating that new word learning benefits from a night of sleep (Wang et al., 2017; Gaskell et al., 2019) or a 1-week delay (Tamminen & Gaskell, 2013). The issue is not whether priming can occur immediately, it is whether priming increases with a delay.

      Finally, it is helpful to think about models of memory systems that divide memory representations not by their explicit/implicit nature, but along other important dimensions such as their neural bases, their flexibility vs rigidity, and their capacity for rapid vs slow learning (Henke, 2010). Considering this evidence, we suggest that systems consolidation models are most useful when considering how transformations in the underlying neural memory representation affects its behavioral expression, rather than focusing on the extent that the memory representation is explicit or implicit.

      With all this said, we have added text to the discussion reminding the reader that there was no statistically significant difference in priming as a function of the delay (page 29, lines 764 - 766). However, we are encouraged by the fact that the relationship between priming and mPFC neural similarity was significantly stronger for remotely learned objects relative to recently learned ones, as this is directly in line with systems consolidation theories.

      References

      Abolghasem, Z., Teng, T. H.-T., Nexha, E., Zhu, C., Jean, C. S., Castrillon, M., Che, E., Di Nallo, E. V., & Schlichting, M. L. (2023). Learning strategy differentially impacts memory connections in children and adults. Developmental Science, 26(4), e13371. https://doi.org/10.1111/desc.13371

      Dobbins, I. G., Schnyer, D. M., Verfaellie, M., & Schacter, D. L. (2004). Cortical activity reductions during repetition priming can result from rapid response learning. Nature, 428(6980), 316–319. https://doi.org/10.1038/nature02400

      Durrant, S. J., Cairney, S. A., & Lewis, P. A. (2013). Overnight consolidation aids the transfer of statistical knowledge from the medial temporal lobe to the striatum. Cerebral Cortex, 23(10), 2467–2478. https://doi.org/10.1093/cercor/bhs244

      Durrant, S. J., Taylor, C., Cairney, S., & Lewis, P. A. (2011). Sleep-dependent consolidation of statistical learning. Neuropsychologia, 49(5), 1322–1331. https://doi.org/10.1016/j.neuropsychologia.2011.02.015

      Gaskell, M. G., Cairney, S. A., & Rodd, J. M. (2019). Contextual priming of word meanings is stabilized over sleep. Cognition, 182, 109–126. https://doi.org/10.1016/j.cognition.2018.09.007

      Henke, K. (2010). A model for memory systems based on processing modes rather than consciousness. Nature Reviews Neuroscience, 11(7), 523–532. https://doi.org/10.1038/nrn2850

      Kóbor, A., Janacsek, K., Takács, Á., & Nemeth, D. (2017). Statistical learning leads to persistent memory: Evidence for one-year consolidation. Scientific Reports, 7(1), 760. https://doi.org/10.1038/s41598-017-00807-3

      Kuhl, B. A., & Chun, M. M. (2014). Successful remembering elicits event-specific activity patterns in lateral parietal cortex. The Journal of Neuroscience, 34(23), 8051–8060. https://doi.org/10.1523/JNEUROSCI.4328-13.2014

      Richter, F. R., Chanales, A. J. H., & Kuhl, B. A. (2016). Predicting the integration of overlapping memories by decoding mnemonic processing states during learning. NeuroImage, 124, Part A, 323–335. https://doi.org/10.1016/j.neuroimage.2015.08.051

      Schapiro, A. C., Gregory, E., Landau, B., McCloskey, M., & Turk-Browne, N. B. (2014). The necessity of the medial-temporal lobe for statistical learning. Journal of Cognitive Neuroscience, 1–12. https://doi.org/10.1162/jocn_a_00578

      Schlichting, M. L., & Preston, A. R. (2014). Memory reactivation during rest supports upcoming learning of related content. Proceedings of the National Academy of Sciences, 111(44), 15845–15850. https://doi.org/10.1073/pnas.1404396111

      Smith, J. F., Alexander, G. E., Chen, K., Husain, F. T., Kim, J., Pajor, N., & Horwitz, B. (2010). Imaging systems level consolidation of novel associate memories: A longitudinal neuroimaging study. NeuroImage, 50(2), 826–836. https://doi.org/10.1016/j.neuroimage.2009.11.053

      Takashima, A., Nieuwenhuis, I. L. C., Jensen, O., Talamini, L. M., Rijpkema, M., & Fernández, G. (2009). Shift from hippocampal to neocortical centered retrieval network with consolidation. The Journal of Neuroscience, 29(32), 10087–10093. https://doi.org/10.1523/JNEUROSCI.0799-09.2009

      Tamminen, J., & Gaskell, M. G. (2013). Novel word integration in the mental lexicon: Evidence from unmasked and masked semantic priming. The Quarterly Journal of Experimental Psychology, 66(5), 1001–1025. https://doi.org/10.1080/17470218.2012.724694

      van Kesteren, M. T. R. van, Fernández, G., Norris, D. G., & Hermans, E. J. (2010). Persistent schema-dependent hippocampal-neocortical connectivity during memory encoding and postencoding rest in humans. Proceedings of the National Academy of Sciences, 107(16), 7550–7555. https://doi.org/10.1073/pnas.0914892107

      Wang, H.-C., Savage, G., Gaskell, M. G., Paulin, T., Robidoux, S., & Castles, A. (2017). Bedding down new words: Sleep promotes the emergence of lexical competition in visual word recognition. Psychonomic Bulletin & Review, 24(4), 1186–1193. https://doi.org/10.3758/s13423-016-1182-7

    1. Author Response:

      Reviewer #1:

      The manuscript by Lalanne and Li aims to provide an intuitive and quantitative understanding of the expression of translation factors (TFs) from first principles. The authors first find that the steady-state solutions for translation sub-processes are largely independent at optimality. With a coarse-grained model, the authors derive the optimal expression of translation factors for all important sub-processes. The authors show that intuitive scaling factors can explain the differential expression of translation factors.

      The results are impressive. However, as detailed in the major comments, the choice of some important parameters is not sufficiently justified in the current version. In particular, it is not clear to what extent parameter choice and rescaling was biased toward achieving a good agreement with the experimental data.

      Major comments:

      1) The work assumes that reaction times per TF are constant. That may be true at the highest growth rates, but it might not hold for conditions with lower growth rates. The data of Schmidt et al. (Nat. Biotechnol. 34, 104 (2016)) would allow to compare the predictions to proteome partitioning in E. coli across growth rates. It is ok to restrict the present work to maximal growth rates, but then this caveat should be made explicit. This last point also concerns ignoring the offset in the bacterial growth laws, which is only permissible at fast growth; that also should be stated more prominently in the manuscript; see also the legend of Fig. 1, "Our framework of flux optimization under proteome allocation constraint addresses what ribosome and translation factor abundances maximize growth rate".

      We see two distinct but related points made by the reviewer, which we address in turn.

      First, we thank the reviewer for highlighting the important and interesting point of the growth rate dependence of expression in components of the translational machinery, which encouraged us to investigate this aspect further. Leveraging other existing ribosome profiling datasets (which provide better quantitation than mass spectrometry data, see response to minor point #6 below) across multiple growth conditions and species, we compared the predicted optimal translation factor abundance in these conditions (using same formula for the optima). The new conditions and species now include E. coli at much slower growth rates, C. crescentus in two different media, and others. We found similar degrees of agreement between predicted and observed levels (shown in Figure 4-Figure supplement 1 ). One exception is aaRS in C. crescentus, and the discrepancy likely arises from a lack of quantification of tRNA abundance which is a parameter we use to predict the optimal aaRS levels.

      These additional data also provided another way to examine the model predictions. Specifically, we assessed the predicted square-root scaling of translation factor abundance with growth rate. While the expression stoichiometry remains constant across growth rates (see response to minor point #6 below), the overall abundance decreases following our predicted scaling (Figure 4-Figure supplement 2B). We now describe these new analyses and results in the main text (p. 7, line 216):

      "Analysis of tlF expression across slower growth conditions supports the derived square root dependence (Figure 4-Figure supplement 2)."

      The second point made by the reviewer pertains to the “offset in bacterial growth law” that corresponds to inactive ribosomes, which make up a substantial fraction of ribosomes at very slow growth rates. We note that the derivation of the optimality condition, equation 5, does not rely on all ribosomes being active. What is necessary is that that there is a direct proteomic trade-off between ribosomes and translation factors (see response to minor point 1 below). To rigorously place our work in the context of previous literature, we have replaced mention of ribosome with “active ribosome” (as well as in equation 1 and Figure 1), which we define as those functionally engaged in the translation cycle. We also formally include the proteome fraction of inactive ribosome in equations 2 and 3 leading to the optimality condition.

      2) The diffusion-limited regime considers only the free and idle reactants. For some translation factors, the free state only accounts for a small fraction of its total concentration. In this case, the diffusion-limited regime only explains a small fraction of the TFs. For example, most of EF-Ts may not be in its free state: in simulations with in vitro kinetics, free EF-Ts accounts for 6%-48% of its total concentration (Supplementary Data 3 in [21]). Can the authors use in vitro parameters (or other ways) to provide a rough estimate of the fraction of free TFs? Including this might allow to make quantitative statements about some of the deviations seen in Fig. 4, as most of the TFs are underestimated.

      We thank the reviewer for the suggestion that deviations between the diffusion-limited prediction and the observed abundance might be quantitatively explained by the finite catalytic activity of the respective factors. However, to do so requires accurate values of kcat, which are often not available. In the Supplement of the initial submission, we provided an example of the in vitro kcat being not compatible with the protein synthesis rates in vivo, which we have now moved to the main text (reproduced below).

      Another experimental approach that can feasibly be used to infer the bound fraction of translation factors in live cell is fluorescence microscopy of tagged proteins. Indeed, by quantifying the diffusive states of a tagged EF-Tu protein, Volkov et al (1) could estimate that <10% of EF-Tu was in its bound state, which is consistent with the agreement between our diffusion-limited prediction and observed abundance for that factor.

      We now discuss these possibilities and the facts about EF-Ts in a paragraph in the Discussion (p. 13, line 471):

      "Our optimization model can also be solved analytically in the non-diffusion-limited regime (Table 2), with the finite catalytic rate leading to an additional contribution of the form ∝ l 𝜆*/kcat. Recent detailed modeling of the EF-Ts cycle (Hu et al., 2020) estimated that a minor fraction (6 to 48%) of its abundance was in the free form in the cell, consistent with the large deviation we observe for this factor from our diffusion only prediction. However, the numerical values for these solutions are in general difficult to obtain because measurements of catalytic rates are sparse and often inconsistent with estimates of kinetics in live cells. As an example, the catalytic rates for aaRSs (Jeske et al., 2019) measured in vitro is ≈3 s-1 (median across different aaRSs), which is well below the minimal value of 15 s-1 required to sustain translation flux at the measured translation elongation rate (Appendix 5), suggesting substantial deviation between in vitro and in vivo kinetics. Although technically demanding, the fraction of free vs. bound factors can in principle be determined through live cell microscopy of tagged factors based on the partitioning the diffusive states of enzymes. Using that approach, (Volkov et al., 2018) estimated that EF-Tu was in its bound state <10% of the time (consistent with the agreement between our diffusion-limited prediction and the observed value for this factor)."

      3) "A factor-independent time τ_ind (e.g., peptidyl transfer), which does not come into play in our optimization framework, was added to account for additional steps making up the full elongation cycle." - what happened to this time? I couldn't find it anywhere else in the paper. What value was chosen, and by what rationale?

      We thank the reviewer for pointing out a lack of clarity in our presentation. The factor-independent time τind in fact did not appear in our optimization procedure at all (by virtue of obeying dτind/d𝜙TFi = 0 by definition), and was only included for generality to account for steps such as peptidyl transferase (extremely fast (2)). In line with the parsimony of our model, and to avoid any confusion, we have now removed this factor from our model and description altogether.

      4) Fig. 4: The agreement is very impressive, especially given the simplifying assumptions. However, there are some questions relating the choice of parameters.

      a) Were any parameters fitted? Which, how? What about τ_ind, for example (see above)?

      Our approach does not include any fitted parameter. We instead rely on biophysically measured quantities such as diffusion constants, protein sizes, tRNA abundances, cell doubling times (growth rates), and in vivo kinetic estimates. (In the line of Major Comment #3 above, we have removed τind for clarity.) We now include all quantities needed to predict the optimal translation factor abundances (using the formula listed in section “Summary of optimal solutions”, Table 2) in Appendix 5-Tables 1-3, including new Appendix 5-Tables 2-3, reproduced below.

      b) The "predicted" value for ribosomes is calculated from observed data (in a way described on p. S34 that I found incomprehensible, and would likely look very similar regardless of the predicted values for the TFs). According to the section "Equipartition between TF and corresponding ribosomes", the corresponding ribosomes can be quantified in the authors' scheme, too, by the method used for deriving optimal TF concentrations in equation 5. Why didn't the authors directly use the sum of these estimations as the optimal ribosome concentration in Fig. 4? In the current state, it does not seem fair to include the ribosome with the other predictions.

      We agree that the nature of the prediction for ribosomes was different than for other translation factors in our original manuscript in a way that might have lacked clarity. We now exclude ribosomes from Fig. 4 to avoid any possible confusion.

      It is interesting to directly estimate ribosome abundance using the equipartition principle. This estimation is however limited by the fact that the equipartition principle only accounts for ribosomes that are waiting for factor- dependent binding steps. Substantial fractions of ribosomes may be engaged at factor-free steps (e.g., peptidyl transfer catalyzed by ribosome itself) and factor-dependent catalytic steps after binding. Although the latter could be estimated using the observed tlF concentrations (by considering that the tlF in excess to the binding-limited predictions is sequestered in catalytic steps), the former is not estimated in our model. Furthermore, some other ribosomes may not be fully assembled yet or are inactive (3). Indeed, the predicted factor-dependent ribosome abundance using the equipartition principle with observed tlF abundances constitute a fraction (40%) of the measured total ribosome abundance.

      c) Predictions are for a specific growth rate (doubling time 21min). Was this growth rate also averaged over the three organisms? What were the individual values? These points would need to be discussed in the main text.

      The reviewer is correct. In the initial submission, we used the average growth rate of E. coli (doubling time 21.5±0.4 min), B. subtilis (doubling time 21±1 min), and V. natriegens (doubling time 19±1 min). A note has been added in the main text (p. 11, line 448):

      "We take the growth rate 𝜆* to be the average of the fast-growing species considered, corresponding to a doubling time of 21±1 min (E. coli: 21.5±1 min, B. subtilis: 21±1 min, V. natriegens: 19±1 min)."

      In addition, we now include predictions for different growth rates and compared them with several bacterial species grown in a wide range of conditions (Figure 4-Figure supplement 1) (see response to Major Comment #1 and to reviewer 2’s third request). These predictions and data are now included in Supplementary Files 1-4.

      5) In the same vein, in a footnote (!) to Table S4: "#For the ternary complex, the total mass of tRNA+EF-Tu was converted to an equivalent amino acid length." - I can see that this is important to get reasonable results, but it constitutes a major deviation from the strategy proclaimed throughout the main text: that the predicted effects result from a competition for fractions of the limited proteome. That rationale has to be changed (and explained in the main text), or the predictions in Fig. 4 should be based on calculations using only the protein part of TCs (i.e., EF-Tu).

      We are sorry for the confusion. The procedure of converting tRNA size to protein size was only used to estimate diffusion coefficients for the ternary complex (described in Appendix 5 Table 2), and not for the competition within the proteome. For factors for which no direct experimental estimates exist for in vivo diffusion coefficient, we used the relationship DA = (lTC/lA)1/3 DTC. The resulting estimated diffusion coefficients were then used to rescale the association rate inferred from in vivo measurements for the ternary complex (see response to point 6 below as well) to obtain association rates for other factors.

      6) S9: "we anchored our association rates to the estimated in vivo association rate for the ternary complex, 𝑘^𝑇𝐶 = 6.4 μM−1s−1 [13], and rescale the association rate by diffusion of related components" - in comparison, the diffusion limited k^TC is >100. If I understand this correctly, you simply rescale ALL on-rates by 100/6.4 = 15.6. If that is (qualitatively) correct, you would need to discuss this point (and the derivation of the scaling factor) explicitly in the main text.

      The reviewer is correct in his interpretation of our approach, and we are grateful for his remark as this led us to spot a mistake in our choice of parameter (capture radius R). Indeed, while the ternary complex as a largest physical dimension of about 10 nm (from structural data (4)), the appropriate capture radius is closer to 2 nm (size of the portion binding to the ribosome) (5). Correcting for the appropriate capture radius alone brings the estimate to 45 μM-1s-1 , which is however still several-fold higher than the measured value of 6.4 μM-1s-1. Whereas a part of this could be due to systematic overestimation of the diffusion coefficient, a large portion of the discrepancy is assuredly due to the many simplifying assumptions underlying the Smoluchowski estimate which serve to place an absolute upper bound on the reaction rate (perfectly/instantaneously absorbing spheres, and hence no notion of specific reaction position or molecular orientation).

      The estimate for capture radius R has been corrected (p. 47, line 1605) and a new sentence has now been included in the main text (p. 11, line 441):

      "Importantly, the absolute values of the optimal concentrations can be anchored by the association rate constant between TC and the ribosome obtained from translation elongation kinetic measurements in vivo (Dai et al., 2016). The latter was found to be several-fold smaller than the simplest and absolute upper bound of a Smoluchowski estimate of perfectly absorbing spheres (section Estimation of optimal abundances), and we assume that the rescaling factor is the same for all reactions."

    1. Author Response

      Reviewer #1 (Public Review):

      Iyer et al. address the problem of how cells exposed to a graded but noisy morphogen concentration are able to infer their position reliably, in other words how the positional information of a realistic morphogen gradient is decoded through cell-autonomous ligand processing. The authors introduce a model of a ligand processing network involving multiple ”branches” (receptor types) and ”tiers” (compartments where ligand-bound receptors can be located). Receptor levels are allowed to vary with distance from the source independently of the morphogen concentration. All rates, except for the ligand binding and unbinding rates, are potentially under feedback control. The authors assume that the cells can infer their position from the output of the signalling network in an optimal way. The resulting parameter space is then explored to identify optimal ”network architectures” and parameters, i.e. those that maximise the fidelity of the positional inference. The analysis shows how the presence of both specific and non-specific receptors, graded receptor expression and feedback loops can contribute to improving positional inference. These results are compared with known features of the Wnt signalling system in Drosophila wing imaginal disc.

      The authors are doing an interesting study of how feedback control of the signalling network reading a morphogen gradient can influence the precision of the read-out. The main strength of this work is the attention to the development of the mathematical framework. While the family of network architectures introduced here is not completely generic, there is enough flexibility to explore various features of realistic signalling systems. It is exciting to find that some network topologies are particularly efficient at reducing the noise in the morphogen gradient. The comparison with the Wnt system in Drosophila is also promising.

      Major comments:

      1) The authors assume that the cell estimates its position through the maximum a posteriori estimate, Eq.(5), which is a well-defined mathematical object; it seems to us however that whether the cell is actually capable of performing this measurement is uncertain (it is an optimal measurement in some sense, but there is no guarantee that the cell is optimal in that respect). Notably, this entails evaluating p(theta), which is a probability distribution over the entire tissue, so this estimate can not be done with purely local measurements. Can the authors comment on this and how the conclusions would change if a different position measurement was performed?

      This is indeed an important question. Our viewpoint is that if the cells were to use a maximum a posteriori (MAP) estimate (Eq. 5) to decode their positions, then what features of the channel architecture would lead to small errors in positional inference. Whether the maximum a posteriori estimate is employed by the cell, or some other estimate, is an important but difficult question to address. Our choice has been motivated by how this estimate has allowed the precise determination of developmental fates in the context of gap gene expression in Drosophila embryo [1, 2, 3]. We had earlier computed the inference error with a different estimate i.e.

      which computes the mean squared deviations of the inferred positions from the true position for each x, taking into account the entire distribution p(x∗|x). While the qualitative results are the same, the inference errors showed spurious jitters from outliers in sampling the noisy morphogen input distribution. This consistency might suggest that our qualitative results are insensitive to the choice of the estimate.

      Further, when evaluating the MAP estimate, the term p(θ) in the denominator serves as a normalisation factor to ensure p(x|θ) is a probability density. This is not strictly necessary for MAP estimation. Since p(θ) does not depend on x, the MAP estimate can be written as follows

      without the need for evaluating p(θ). In the case of a uniform prior, it would be equivalent to maximum likelihood estimate (MLE) i.e.

      2) One of the features of the signalling networks studied in the manuscript is the ability of the system to form a complex (termed a conjugated state, Q) made of two ligands L, one receptor and one nonsignalling receptor. While there are clear examples of a single ligand binding to two signalling receptors (e.g. Bmps), are there also known situations where such a complex with two ligands, one receptor, and one non-signalling receptor can form? In the Wnt example (Fig. 10a), it is not clear what this complex would be? In general, it would be great to have a more extended discussion of how the model hypothesis for the signalling networks could relate to real systems.

      This is a good suggestion. We have now added a discussion on the various possible realisations of the “conjugate state” Q in Section 3.6. We have also explored the various states in the context of different signalling contexts such as Dpp, Hh, Fgf in the Discussion section.

      The conjugated state ‘Q’ represents a combination of the readings from the two branches i.e. receptor types. This could be realised through processes like ligand exchange or complex formation, both in a shared spatial location such as a compartment. As discussed in the original manuscript (Section 3.6 of the revised manuscript), the ligand Wg in the Wg signalling pathway is internalised through two separate endocytic pathways associated with the receptor types - signalling receptor Frizzled (via Clathrin-mediated endocytosis (CME)) and non-signalling receptor HSPGs (via the CLIC/GEEC pathway (CLIC - (clathrin-independent carriers, GEEC - GPI-anchored protein-enriched early endosomal compartments)). Both pathways meet in a common early endosomal compartment where the ligands may be exchanged between the two receptors [4]. In a previous work by Hemalatha et al [4], we had shown that there are more Wg-DFz2 interactions in the endosomal compartment (measured through FRET) than on the cell surface. Therefore, the non-signalling receptors directing Wg through the CLIC/GEEC pathway titrate the amount of Wg interaction with the signalling receptor, DFz2.

      As mentioned in the original manuscript (Section 3.3 and subsection 4.2 of the Discussion in the revised manuscript), apart from Wg signalling, non-signalling receptors such as the HSPGs have also been proposed to act as co-receptors for Dpp, Hh, FGF (reviewed in [5, 6]). Although some ligands bind to the core protein of HSPG, the majority of the ligands bind to the negatively charged HS chains [7, 8]. Here, the coreceptors HSPGs aid in capturing diffusible ligands and presenting the same to signalling receptors (either on the cell surface or within endosomes).

      3) The authors consider feedback on reaction rates - it would seem natural to also consider feedback on the total number of receptors; notably, since there are known examples of receptors transcriptionally down-regulated by their ligands (e.g. Dpp/Tkv)? Also it is not clear in insets such as in Fig. 7b, if the concentration plotted corresponds to the concentration of receptors bound to ligands?

      As mentioned in the original manuscript (Section 2.2 of the revised manuscript), we have indeed considered control on reaction rates and receptors, although the control on the latter is done with the constraint of receptor profiles being monotonic. Further, while the control on reaction rates is considered via feedbacks explicitly, the control on receptors is done via an approach akin to the openloop control used in control theory. In reality, cellular control on receptors will involve transcriptional up- or down-regulation of receptor and thus warrant a feedback control approach – however, the timescales involved in such a control are different from the binding-unbinding and signalling timescales.

      Therefore, in the current work, we take the morphogen profile to be given i.e. independent of receptor concentrations, and we ask for the receptor concentrations that would help reduce the inference errors.

      Our predictions of increasing signalling receptor and decreasing non-signalling receptors in a twobranch channel architecture are consistent with the known transcriptional up-regulation of Dally/Dlp and down-regulation of Fz by Wg signalling [9].

      In a future work, we will extend the control on receptors to include feedbacks explicitly. Furthermore, the explicit feedback control on receptors may need to be considered concomitantly with the effect of receptors on morphogen dynamics (i.e. morphogen sculpting by receptors) along with the possibility of spatial correlations in receptor concentrations through neighbouring cell-cell interactions.

      As mentioned in the original manuscript (Section 2.2 of the revised manuscript), the variables ψ and φ stand for the total (bound + unbound) surface receptor concentrations of the signalling and the non-signalling receptors respectively. Therefore, the insets showing receptor profiles such as in Fig. 6b, 7b, and Appendix H Fig.8b,e correspond to the total surface receptor concentrations.

      4) The authors are clear about the fact that they consider the morphogen gradient to be fixed independently of the reaction network; however, that seems like a very strong assumption; in the Dpp morphogen gradient for instance over expression of the Tkv receptor leads to gradient shortening. Can the authors comment on this?

      This point is related to the earlier question 4. As discussed in the Discussion of the original manuscript (subsection 4.3 of the revised manuscript), we focus on finding the optimal receptor concentration profiles and reaction networks that enable precision and robustness in positional information from a given noisy morphogen profile. The framework and the optimisation scheme within it will prescribe different receptor profiles and reaction networks for different monotonically behaving, noisy morphogen profiles. It is possible that cells may achieve the optimal receptor concentrations via feedback control on production of the receptors.

      Broadly, morphogen dynamics depends on cell surface receptors, which could participate in both the inference and the sculpting of the morphogen profile, and factors independent of them such as extracellular degradation, transport and production, etc. In our present work, we have taken the receptors involved in sculpting and inference as being independent.

      In a more general case, feedback control on receptors will change the receptor concentrations as well as the morphogen profile. We are currently working on realising such a feedback control on receptors within the same broader information theoretic framework proposed in the current work.

      5) Fig. 10f is showing an exciting result on the change in endocytic gradient CV in the WT and in DN mutant of Garz. Can the authors check that the Wg morphogen gradient is not changing in these two conditions? And can they also show the original gradient, and not only its CV?

      The reviewer raises a legitimate concern – could the observed changes in CV upon perturbation of endocytic machinery be attributed to a systematic change in the mean levels of the endocytosed Wg alone? In the original manuscript (Appendix O Fig.17b,c of the revised manuscript), we show the normalised profiles of endocytic Wg in control and myr-Garz-DN cases. Here, in Fig.1 below, we show a comparison between the mean Wg concentrations (measured as fluorescence intensity) in control wing discs and discs wherein CLIC/GEEC endocytic pathway is removed using UAS-myr-Garz-DN. For clarity, we show the discs with largest and smallest fluorescence intensities from the control and myr-Garz-DN discs. It is hard to conclude that the mean concentrations are significantly different in the two cases.

      Reviewer #2 (Public Review):

      The work of Iyer et al. uses a computational approach to investigate how cells using multiple tiers of processing and multiple parallel receptor types allow more accurate reading of position from a noisy signal. Authors find that combining signaling and non-signaling types of receptors together with additional feedback increases the accuracy of positional readout against extrinsic noise that is conveyed in the morphogen signal. Further, extending the number of layers of signal processing counteracts the intrinsic stochasticity of the signal reading and processing steps. The mathematical formulation of the model is general but comprehensive in the way it handles the difference between branches and tiers for the processing of channels with feedbacks. The results of the model are presented from simple one-branch and one-tier architecture to two-branch and two-tier architecture with feedbacks. Interestingly authors find that adding more tiers results in only very small improvements in the accuracy of positional readout. The model is tested against a perturbation experiment that impairs one of the signaling branches in the Drosophila wing disc, but the comparison is only qualitative as further experiment-oriented work is planned in a separate paper.

      Strengths

      There is a clear statement of objectives, model, and how the model is evaluated. In particular, the objective is to find what number of receptor types and their concentrations for a given number of tiers and feedback types is resulting in the most accurate positional readout. The employed optimization procedure is capable to find signalling architectures that result in one cell diameter positional precision for most of the tissue with 3-4 cells at the tissue end that is most distant to the morphogen source. This demonstrates that employing additional complexity in signal processing results in a very accurate positional readout, which is comparable with estimates of positional precision obtained in other developmental systems (Petkova et al., Cell 2019, Zagorski et al., Science 2017).

      The optimal signalling architectures indicate that both signalling (specific) and non-signalling (nonspecific) receptors affect the precision of positional readout, but the contributions of each type of these receptors are qualitatively different. Even slight perturbation of signalling receptors drives the system out of optimum, resulting in a decrease in positional precision. In contrast, the non-signalling receptors could accommodate much larger perturbations. This observation could provide a biophysical explanation for how cross-talk between different morphogen species could be realized in a way that positional precision is kept at the optimum when morphogen signaling undergoes extrinsic and intrinsic perturbations.

      Last, the model formulation allows to specifically address perturbations of signalling and feedbacks, that could be explored to validate model predictions experimentally in Drosophila wing disc, but also in other developmental tissues. The authors present a proof-of-concept by obtaining consistent results of variation of output profiles in two-tier two-branch architectures with non-signaling branch removed and intensity profiles of Wg in wing disc where the CLIC/GEEC endocytic pathway was perturbed.

      Weaknesses

      The list of model parameters is long including more than 20 entries for two-tier two-branch architectures. This is expected, as the aim of the model is to describe the sophisticated signalling architecture mimicking the biological system. However, this also makes it very challenging or impossible to provide guiding principles or understanding of the system behaviour for the complete space of signalling architectures that optimize positional readout. Although, the employed optimization procedure finds solutions that exhibit very high positional accuracy, there is only very limited notion how these solutions depend on variation of different parameters. The authors do not address the following question, whether these solutions correspond to broad global optima in the space of all solutions, or were rather fine-tuned by the optimization procedure and are quite rare.

      It is unclear how contributions from the intrinsic noise affect the system behaviour compared to contributions from extrinsic noise. In principle, the two-branch one-tier architecture results in an already very accurate positional readout across the tissue. The adding of another tier seems to provide only a very weak improvement over a one-tier solution. It is possible that contributions from intrinsic noise for the investigated signalling architectures are only mildly affecting the system compared with contributions from extrinsic noise. Hence, it is difficult to assess whether the claim of reducing intrinsic noise by adding another tier is supported by the presented data, as the contributions from intrinsic noise could overall very weakly affect the positional readout.

      The optimal response of the channel to extrinsic and intrinsic noises is very distinct. As noted correctly by the reviewer, an additional tier provides only a marginal improvement in inference error due extrinsic noise (compare Fig.7 and Fig.8 in the revised manuscript). However, as shown in Fig.9c of the revised manuscript (same as in the original manuscript), adding an extra tier provides a substantial improvement in inference errors due to intrinsic noise.

      References

      [1] Gasper Tkacik, Julien O Dubuis, Mariela D Petkova, and Thomas Gregor. Positional information, positional error, and readout precision in morphogenesis: a mathematical framework. Genetics, 199:39– 59, 2015.

      [2] Mariela D Petkova, Gasper Tkacik, William Bialek, Eric F Wieschaus, and Thomas Gregor. Optimal decoding of cellular identities in a genetic network. Cell, 176:844–855, 2019.

      [3] Julien O Dubuis, Gaˇsper Tkaˇcik, Eric F Wieschaus, Thomas Gregor, and William Bialek. Positional information, in bits. Proceedings of the National Academy of Sciences, 110:16301–16308, 2013.

      [4] Anupama Hemalatha, Chaitra Prabhakara, and Satyajit Mayor. Endocytosis of wingless via a dynaminindependent pathway is necessary for signaling in drosophila wing discs. Proceedings of the National Academy of Sciences, 113:E6993–E7002, 2016.

      [5] Xinhua Lin. Functions of heparan sulfate proteoglycans in cell signaling during development. Development, 131:6009–6021, 2004.

      [6] Stephane Sarrazin, William C Lamanna, and Jeffrey D Esko. Heparan sulfate proteoglycans. Cold Spring Harbor perspectives in biology, 3(7):a004952, 2011.

      [7] Catherine A Kirkpatrick, Sarah M Knox, William D Staatz, Bethany Fox, Daniel M Lercher, and Scott B Selleck. The function of a drosophila glypican does not depend entirely on heparan sulfate modification. Developmental biology, 300(2):570–582, 2006.

      [8] Mariana I Capurro, Ping Xu, Wen Shi, Fuchuan Li, Angela Jia, and Jorge Filmus. Glypican-3 inhibits hedgehog signaling during development by competing with patched for hedgehog binding. Developmental cell, 14(5):700–711, 2008.

      [9] Kenneth M Cadigan, Matthew P Fish, Eric J Rulifson, and Roel Nusse. Wingless repression of drosophila frizzled 2 expression shapes the wingless morphogen gradient in the wing. Cell, 93(5):767–777, 1998.

    1. Author Response

      We thank the reviewers for their positive feedback and thoughtful suggestions that will improve our manuscript. Here we summarise our plan for immediate action. We will resubmit our manuscript once additional experiments have been performed to clarify all the major and minor concerns of the reviewers and the manuscript has been revised. At that point, we will respond to all reviewer’s points and highlight the changes made in the text.

      Reviewer #1 (Public Review):

      The authors have tried to correlate changes in the cellular environment by means of altering temperature, the expression of key cellular factors involved in the viral replication cycle, and small molecules known to affect key viral protein-protein interactions with some physical properties of the liquid condensates of viral origin. The ideas and experiments are extremely interesting as they provide a framework to study viral replication and assembly from a thermodynamic point of view in live cells.

      The major strengths of this article are the extremely thoughtful and detailed experimental approach; although this data collection and analysis are most likely extremely time-consuming, the techniques used here are so simple that the main goal and idea of the article become elegant. A second major strength is that in other to understand some of the physicochemical properties of the viral liquid inclusion, they used stimuli that have been very well studied, and thus one can really focus on a relatively easy interpretation of most of the data presented here.

      There are three major weaknesses in this article. The way it is written, especially at the beginning, is extremely confusing. First, I would suggest authors should check and review extensively for improvements to the use of English. In particular, the abstract and introduction are extremely hard to understand. Second, in the abstract and introduction, the authors use terms such as "hardening", "perturbing the type/strength of interactions", "stabilization", and "material properties", for just citing some terms. It is clear that the authors do know exactly what they are referring to, but the definitions come so late in the text that it all becomes confusing. The second major weakness is that there is a lack of deep discussion of the physical meaning of some of the measured parameters like "C dense vs inclusion", and "nuclear density and supersaturation". There is a need to explain further the physical consequences of all the graphs. Most of them are discussed in a very superficial manner. The third major weakness is a lack of analysis of phase separations. Some of their data suggest phase transition and/or phase separation, thus, a more in-deep analysis is required. For example, could they calculate the change of entropy and enthalpy of some of these processes? Could they find some boundaries for these transitions between the "hard" (whatever that means) and the liquid?

      The authors have achieved almost all their goals, with the caveat of the third weakness I mentioned before. Their work presented in this article is of significant interest and can become extremely important if a more detailed analysis of the thermodynamics parameters is assessed and a better description of the physical phenomenon is provided.

      We thank reviewer 1 for the comments and, in particular, for being so positive regarding the strengths of our manuscript and for raising concerns that will surely improve the manuscript. At this point, we propose the following actions to address the concerns of Reviewer 1:

      1) We will extensively revise the use of English, particularly, in the abstract and introduction, defining key terms as they come along in the text to make the argument clearer.

      2) We acknowledge the importance of discussing our data in more detail and we propose the following. We will discuss the graphs and what they mean as exemplified in the paragraph below.

      Regarding Figure 3 - As the concentration of vRNPs increases, we observe an increase in supersaturation until 12hpi. This means that contrary to what is observed in a binary mixture, in which the Cdilute is constant (Klosin et al., 2020), the Cdilute in our system increases with concentration. It has been reported that Cdilute increases in a multi-component system with bulk concentration (Riback et al., 2020). Our findings have important implications for how we think about the condensates formed during influenza infection. As the 8 different genomic vRNPs have a similar overall structure, they could, in theory, behave as a binary system between units of vRNPs and Rab11a. However, a change in Cdilute with concentration shows that our system behaves as a multi-component system. This means that the differences in length, RNA sequence and valency that each vRNP have are key for the integrity of condensates.

      3) The reviewer calls our attention to the lack of analysis of phase separations. We think that phase separation (or percolation coupled to phase separation) governs the formation of influenza A virus condensates. However, we think we ought to exert caution at this point as the condensates we are working with are very complex and that the physics of our system in cells may not be sufficient to claim phase separation without an in vitro reconstitution system. In fact, IAV inclusions contain cellular membranes, different vRNPs and Rab11a. So far, we can only speculate that the liquid character of IAV inclusions may arise from a network of interacting vRNPs that bridge several cognate vRNP-Rab11 units on flexible membranes, similarly to what happens in phase separated vesicles in neurological synapses. However, the speculative model for our system, although being supported by correlative light and electron microscopy, currently lacks formal experimental validation.

      For this reason, we thought of developing the current work as an alternative to explore the importance of the liquid material properties of IAV inclusions. By finding an efficient method to alter the material properties of IAV inclusions, we provide proof of principle that it is possible to impose controlled phase transitions that reduce the dynamics of vRNPs in cells and negatively impact progeny virion production. Despite having discussed these issues in the limitations of the study, we will make our point clearer.

      We are currently establishing an in vitro reconstitution system to formally demonstrate, in an independent publication, that IAV inclusions are formed by phase separation. For this future work, we teamed up with Pablo Sartori, a theorical physicist to derive in- depth analysis of the thermodynamics of the viral liquid condensates. Collectively, we think that cells have too many variables to derive meaningful physics parameters (such as entropy and enthalpy) as well as models and need to be complemented by in vitro systems. For example, increasing the concentration inside a cell is not a simple endeavour as it relies on cellular pathways to deliver material to a specific place. At the same time, the 8 vRNPs, as mentioned above, have different size, valency and RNA sequence and can behave very differently in the formation of condensates and maintenance of their material properties. Ideally, they should be analysed individually or in selected combinations. For the future, we will combine data from in vitro reconstitution systems and cells to address this very important point raised by the reviewer.

      From the paper on the section Limitations of the study: “Understanding condensate biology in living cells is physiologically relevant but complex because the systems are heterotypic and away from equilibria. This is especially challenging for influenza A liquid inclusions that are formed by 8 different vRNP complexes, which although sharing the same structure, vary in length, valency, and RNA sequence. In addition, liquid inclusions result from an incompletely understood interactome where vRNPs engage in multiple and distinct intersegment interactions bridging cognate vRNP-Rab11 units on flexible membranes (Chou et al., 2013; Gavazzi et al., 2013; Haralampiev et al., 2020; Le Sage et al., 2020; Shafiuddin & Boon, 2019; Sugita, Sagara, Noda, & Kawaoka, 2013). At present, we lack an in vitro reconstitution system to understand the underlying mechanism governing demixing of vRNP-Rab11a-host membranes from the cytosol. This in vitro system would be useful to explore how the different segments independently modulate the material properties of inclusions, explore if condensates are sites of IAV genome assembly, determine thermodynamic values, thresholds accurately, perform rheological measurements for viscosity and elasticity and validate our findings”.

      Reviewer #2 (Public Review):

      During Influenza virus infection, newly synthesized viral ribonucleoproteins (vRNPs) form cytosolic condensates, postulated as viral genome assembly sites and having liquid properties. vRNP accumulation in liquid viral inclusions requires its association with the cellular protein Rab11a directly via the viral polymerase subunit PB2. Etibor et al. investigate and compare the contributions of entropy, concentration, and valency/strength/type of interactions, on the properties of the vRNP condensates. For this, they subjected infected cells to the following perturbations: temperature variation (4, 37, and 42{degree sign}C), the concentration of viral inclusion drivers (vRNPs and Rab11a), and the number or strength of interactions between vRNPs using nucleozin a well-characterized vRNP sticker. Lowering the temperature (i.e. decreasing the entropic contribution) leads to a mild growth of condensates that does not significantly impact their stability. Altering the concentration of drivers of IAV inclusions impact their size but not their material properties. The most spectacular effect on condensates was observed using nucleozin. The drug dramatically stabilizes vRNP inclusions acting as a condensate hardener. Using a mouse model of influenza infection, the authors provide evidence that the activity of nucleozin is retained in vivo. Finally, using a mass spectrometry approach, they show that the drug affects vRNP solubility in a Rab11a-dependent manner without altering the host proteome profile.

      The data are compelling and support the idea that drugs that affect the material properties of viral condensates could constitute a new family of antiviral molecules as already described for the respiratory syncytial virus (Risso Ballester et al. Nature. 2021).

      Nevertheless, there are some limitations in the study. Several of them are mentioned in a dedicated paragraph at the end of a discussion. This includes the heterogeneity of the system (vRNP of different sizes, interactions between viral and cellular partners far from being understood), which is far from equilibrium, and the absence of minimal in vitro systems that would be useful to further characterize the thermodynamic and the material properties of the condensates.

      We thank reviewer 2 for highlighting specific details that need improving and raising such interesting questions to validate our findings. We will address all the minor comments of Reviewer 2. To address the comments of Reviewer 2, we propose the actions described in blue below each point raised that is written in italics.

      1) The concentrations are mostly evaluated using antibodies. This may be correct for Cdilute. However, measurement of Cdense should be viewed with caution as the antibodies may have some difficulty accessing the inner of the condensates (as already shown in other systems), and this access may depend on some condensate properties (which may evolve along the infection). This might induce artifactual trends in some graphs (as seen in panel 2c), which could, in turn, affect the calculation of some thermodynamic parameters.

      The concern of using antibodies to calculate Cdense is valid. We will address this concern by validating our results using a fluorescent tagged virus that has mNeon Green fused to the viral polymerase PA (PA-mNeonGreen PR8 virus). Like NP, PA is a component of vRNPs and labels viral inclusions, colocalising with Rab11 when vRNPs are in the cytosol without the need of using antibodies.

      This virus would be the best to evaluate inclusion thermodynamics, where it not an attenuated virus (Figure 1A below) with a delayed infection as demonstrated by the reduced levels of viral proteins (Figure 1B below). Consistently, it shows differences in the accumulation of vRNPs in the cytosol and viral inclusions form later in infection. After their emergence, inclusions behave as in the wild-type virus (PR8-WT), fusing and dividing (Figure 1C below) and displaying liquid properties. The differences in concentration may shift or alter thermodynamic parameters such as time of nucleation, nucleation density, inclusion maturation rate, Cdense, Cdilute. This is the reason why we performed the thermodynamics profiling using antibodies upon PR8-WT infection. For validating our results, and taking into account a possible delayed kinetics, and differenced that may occur because of reduced vRNP accumulation in the cytosol, this virus will be useful and therefore we will repeat the thermodynamics using it.

      As a side note, vRNPs are composed of viral RNA coated with several molecules of NP and each vRNP also contains 1 copy of the trimeric RNA dependent RNA polymerase formed by PA, PB1 and PB2. It is well documented that in the cytosol the vast majority of PA (and other components of the polymerase) is in the form of vRNPs (Avilov, Moisy, Munier, et al., 2012; Avilov, Moisy, Naffakh, & Cusack, 2012; Bhagwat et al., 2020; Lakdawala et al., 2014), and thus we can use this virus to label vRNPs on condensates to corroborate our studies using antibodies.

      Figure 1 – The PA- mNeonGreen virus is attenuated in comparison to the WT virus. A. Cells (A549) were infected or mock-infected with PR8 WT or PA- mNeonGreen (PA-mNG) viruses, at a multiplicity of infection (MOI) of 3, for the indicated times. Viral production was determined by plaque assay and plotted as plaque forming units (PFU) per milliliter (mL) ± standard error of the mean (SEM). Data are a pool from 2 independent experiments. B. The levels of viral PA, NP and M2 proteins and actin in cell lysates at the indicated time points were determined by western blotting. C. Cells (A549) were transfected with a plasmid encoding mCherry-NP and co-infected with PA-mNeonGreen virus for 16h, at an MOI of 10. Cells were imaged under time-lapse conditions starting at 16 hpi. White boxes highlight vRNPs/viral inclusions in the cytoplasm in the individual frames. The dashed white and yellow lines mark the cell nucleus and the cell periphery, respectively. The yellow arrows indicate the fission/fusion events and movement of vRNPs/ viral inclusions. Bar = 10 µm. Bar in insets = 2 µm.

      2) Although the authors have demonstrated that vRNP condensates exhibit several key characteristics of liquid condensates (they fuse and divide, they dissolve upon hypotonic shock or upon incubation with 1,6-hexanediol, FRAP experiments are consistent with a liquid nature), their aspect ratio (with a median above 1.4) is much higher than the aspect ratio observed for other cellular or viral liquid compartments. This is intriguing and might be discussed.

      IAV inclusions have been shown to interact with microtubules and the endoplasmic reticulum, that confers movement, and also undergo fusion and fission events. We propose that these interactions and movement impose strength and deform inclusions making them less spherical. To validate this assumption, we compared the aspect ratio of viral inclusions in the absence and presence of nocodazole (that abrogates microtubule-based movement). The data in figure 2 shows that in the presence of nocodazole, the aspect ratio decreases from 1.42±0.36 to 1.26 ±0.17, supporting our assumption.

      Figure 2 – Treatment with nocodazole reduces the aspect ratio of influenza A virus inclusions. Cells (A549) were infected PR8 WT and treated with nocodazole (10 µg/mL) for 2h time after which the movement of influenza A virus inclusions was captured by live cell imaging. Viral inclusions were segmented, and the aspect ratio measured by imageJ, analysed and plotted in R.

      3) Similarly, the fusion event presented at the bottom of figure 3I is dubious. It might as well be an aggregation of condensates without fusion.

      We will change this, thank you for the suggestion.

      4) The authors could have more systematically performed FRAP/FLAPh experiments on cells expressing fluorescent versions of both NP and Rab11a to investigate the influence of condensate size, time after infection, or global concentrations of Rab11a in the cell (using the total fluorescence of overexpressed GFP-Rab11a as a proxy) on condensate properties.

      We will try our best to be able to comply with this suggestion as we think it is important.

      Reviewer #3 (Public Review):

      This study aims to define the factors that regulate the material properties of the viral inclusion bodies of influenza A virus (IAV). In a cellular model, it shows that the material properties were not affected by lowering the temperature nor by altering the concentration of the factors that drive their formation. Impressively, the study shows that IAV inclusions may be hardened by targeting vRNP interactions via the known pharmacological modulator (also an IAV antiviral), nucleozin, both in vitro and in vivo. The study employs current state-of-the-art methodology in both influenza virology and condensate biology, and the conclusions are well-supported by data and proper data analysis. This study is an important starting point for understanding how to pharmacologically modulate the material properties of IAV viral inclusion bodies.

      We thank this reviewer for all the positive comments. We will address the minor issues brought to our attention entirely, including changing the tittle of the manuscript and we will investigate the formation and material properties of IAV inclusions in the presence and absence of nucleozin for the nucleozin escape mutant NP-Y289H.

      References

      Avilov, S. V., Moisy, D., Munier, S., Schraidt, O., Naffakh, N., & Cusack, S. (2012). Replication- competent influenza A virus that encodes a split-green fluorescent protein-tagged PB2 polymerase subunit allows live-cell imaging of the virus life cycle. J Virol, 86(3), 1433- 1448. doi:10.1128/JVI.05820-11

      Avilov, S. V., Moisy, D., Naffakh, N., & Cusack, S. (2012). Influenza A virus progeny vRNP trafficking in live infected cells studied with the virus-encoded fluorescently tagged PB2 protein. Vaccine, 30(51), 7411-7417. doi:10.1016/j.vaccine.2012.09.077

      Bhagwat, A. R., Le Sage, V., Nturibi, E., Kulej, K., Jones, J., Guo, M., . . . Lakdawala, S. S. (2020). Quantitative live cell imaging reveals influenza virus manipulation of Rab11A transport through reduced dynein association. Nat Commun, 11(1), 23. doi:10.1038/s41467-019-13838-3

      Chou, Y. Y., Heaton, N. S., Gao, Q., Palese, P., Singer, R. H., & Lionnet, T. (2013). Colocalization of different influenza viral RNA segments in the cytoplasm before viral budding as shown by single-molecule sensitivity FISH analysis. PLoS Pathog, 9(5), e1003358. doi:10.1371/journal.ppat.1003358

      Gavazzi, C., Yver, M., Isel, C., Smyth, R. P., Rosa-Calatrava, M., Lina, B., . . . Marquet, R. (2013). A functional sequence-specific interaction between influenza A virus genomic RNA segments. Proc Natl Acad Sci U S A, 110(41), 16604-16609. doi:10.1073/pnas.1314419110

      Haralampiev, I., Prisner, S., Nitzan, M., Schade, M., Jolmes, F., Schreiber, M., . . . Herrmann, A. (2020). Selective flexible packaging pathways of the segmented genome of influenza A virus. Nat Commun, 11(1), 4355. doi:10.1038/s41467-020-18108-1

      Klosin, A., Oltsch, F., Harmon, T., Honigmann, A., Julicher, F., Hyman, A. A., & Zechner, C. (2020). Phase separation provides a mechanism to reduce noise in cells. Science, 367(6476), 464-468. doi:10.1126/science.aav6691

      Lakdawala, S. S., Wu, Y., Wawrzusin, P., Kabat, J., Broadbent, A. J., Lamirande, E. W., . . . Subbarao, K. (2014). Influenza a virus assembly intermediates fuse in the cytoplasm. PLoS Pathog, 10(3), e1003971. doi:10.1371/journal.ppat.1003971

      Le Sage, V., Kanarek, J. P., Snyder, D. J., Cooper, V. S., Lakdawala, S. S., & Lee, N. (2020). Mapping of Influenza Virus RNA-RNA Interactions Reveals a Flexible Network. Cell Rep, 31(13), 107823. doi:10.1016/j.celrep.2020.107823

      Riback, J. A., Zhu, L., Ferrolino, M. C., Tolbert, M., Mitrea, D. M., Sanders, D. W., . . . Brangwynne, C. P. (2020). Composition-dependent thermodynamics of intracellular phase separation. Nature, 581(7807), 209-214. doi:10.1038/s41586-020-2256-2

      Shafiuddin, M., & Boon, A. C. M. (2019). RNA Sequence Features Are at the Core of Influenza a Virus Genome Packaging. J Mol Biol. doi:10.1016/j.jmb.2019.03.018

      Sugita, Y., Sagara, H., Noda, T., & Kawaoka, Y. (2013). Configuration of viral ribonucleoprotein complexes within the influenza A virion. J Virol, 87(23), 12879- 12884. doi:10.1128/JVI.02096-13

    1. Author Response

      Reviewer #1 (Public Review):

      The authors reveal dual regulatory activity of the complex nuclear receptor element (cNRE; contains hexads A+B+C) in cardiac chambers and its evolutionary origin using computational and molecular approaches. Building upon a previous observation that hexads A and B act as ventricular repressor sequences, in this study the authors identify a novel hexad C sequence with preferential atrial expression. The authors also reveal that the cNRE emerged from an endogenous viral element using comparative genomic approaches. The strength of this study is in a combination of in silico evolutionary analyses with in vivo transgenic assays in both zebrafish and mouse models. Rapid, transient expression assays in zebrafish together with assays using stable, transgenic mice demonstrate dual functionality of cNRE depending on the chamber context. This is especially intriguing given that the cNRE is present only in Galliformes and has originated likely through viral infection. Interestingly, there seem to be some species-specific differences between zebrafish and mouse models in expression response to mutations within the cNRE. Taken together, these findings bear significant implications for our understanding of dual regulatory elements in the evolutionary context of organ formation.

      We thank reviewer 1 for the thorough review and are very satisfied with his favorable view of our manuscript. We also thank reviewer 1 for suggestions and opportunities to further clarify some relevant issues.

      Reviewer #2 (Public Review):

      Nunes Santos et al. investigated the gene regulatory activity of the promoter of the quail myosin gene, SMyHC III, that is expressed specifically in the atria of the heart in quails. To do so, they computationally identified a novel 6-bp sequence within the promoter that is putatively bound by a nuclear receptor transcription factor, and hence is a putative regulatory sequence. They tested this sequence for regulatory activity using transgenic assays in zebrafish and mice, and subjected this sequence to mutagenesis to investigate whether gene regulatory effects are abrogated. They define this sequence, together with two additional known 6-bp regulatory sequences, as a novel regulatory sequence (denoted cNRE) necessary and sufficient for driving atrial-specific expression of SMyHC III. This cNRE sequence is shared across several galliform species but appears to be absent in other avian species. The authors find that there is sequence homology between the cNRE and several virus genomes, and they conclude that this regulatory sequence arose in the quail genome by viral integration.

      Strengths: The evolutionary origins of gene regulatory sequences and their impact on directing tissue-specific expression are of great interest to geneticists and evolutionary biologists. The authors of this paper attempt to bring this evolutionary perspective to the developmental biology question of how genes are differentially expressed in different chambers of the heart. The authors test for regulatory activity of the putative regulatory sequence they identified computationally in both zebrafish and mouse transgenic assays. The authors disrupt this sequence using deletions and mutagenesis, and introduce a tandem repeat of the sequence to a reporter gene to determine its consequences on chamber activity. These experiments demonstrate that the identified sequence has regulatory activity.

      We appreciate the thorough review of our manuscript and are very stimulated by the reviewer’s understanding of the contents we presented. We will take the liberty to comment after the reviewer’s considerations, in the hope to better answer the relevant points.

      Weaknesses: There are several decisions and assumptions that have been made by the authors, the reasons for which have not been articulated. Firstly, the rationale for the approach is not clear. The study is a follow-up to work previously performed by the authors which identified two 6-bp sequences important for controlling atrial-specific expression of the quail SMyHC III gene. This study appears to be motivated by the fact that these two sequences, bound by nuclear receptors, do not fully direct chamber-specific expression, and therefore this study aims to find additional regulatory sequences. It is assumed that any additional regulatory sequences should also be bound by nuclear receptors, and be 6-bp in length, and therefore the authors search for 6-bp sequences bound by nuclear receptors. It is not clear what the input sequence for this analysis was.

      Thank you for giving us the opportunity to clarify our rational. Our approach is justified by the natural progression in the understanding of the mechanisms involved in preferential atrial expression by the SMyHC III promoter. The groundwork was solidly laid down by Wang and colleagues (see references as below). They mapped potential atrial stimulators and ventricular repressors throughout the SMyHC III promoter using atrial and ventricular cultures, respectively. Wang and colleagues pinned down the relevant regulators. First between -840 and -680 bp upstream from the transcription start site, then inside this nucleotide stretch, then in the 72-bp fragment contained between -840 and -680 bp, then identified the ventricular repressor in Hexads A and B inside the 72-bp sequence (see references below). We, in this manuscript, contributed with the identification of Hexad C (immediately downstream of Hexads A and B) as a potential nuclear receptor binding site and as a bona fide atrial activator. In summary, our work represents a logical conclusion of previous work by Wang and colleagues. We continued the process of narrowing down sequences previously proven to contain atrial activators (that were unknown before our present work) and ventricular repressors (that were already described).

      Why did we use nuclear receptors as models for the putative cardiac chamber regulators binding to the cNRE? This is because previous work by Wang et al., 1996, 1998, 2001 and by Bruneau et al., 2001 showed that the 5’ portion of the cNRE (Hexads A and B) is indeed a hub for the integration of signals conveyed by nuclear receptors. Originally, Wang et al., 1996 showed that the VDR response element is a ventricular repressor acting via the 5’ portion of the cNRE. In a subsequent manuscript, Wang et al., 1998 showed that both RAR and VDR bind the 5’ portion of the cNRE. Bruneau et al., 2001 showed, by crossing IRX4 knockout mice with SMyHC III-HAP mice (Xavier-Neto et al., 1999), that IRX4 plays the role of a repressor of SMyHC III-HAP expression. Finally, Wang et al., 2001 showed that IRX4 interacts with RXR bound to the 5’ portion of the cNRE to inhibit ventricular expression.

      Why was the 3’ Hexad included as a research subject? Very early on in our work it was noted that 3’ of the original VDR response element (Hexads A and B), described by Wang et al., 1996 and 1998 as a ventricular repressor, there was a sequence (Hexad C) with almost equal binding potential to nuclear receptors as Hexads A and B (as initially judged on the basis of comparisons with canonical nuclear receptor binding sequences, but later on confirmed by in silico profiling of nuclear receptor binding, see below). This discovery prompted us to design point mutants in the 3’ portion of the cNRE to investigate whether Hexad C contained relevant regulators of heart chamber expression. These analyses revealed a strong atrial activator in the mouse (the missing atrial activator from Wang et al., 1996, 1998, 2001).

      Wang, G. F., Nikovits, W., Schleinitz, M., and Stockdale, F. E. (1996). Atrial chamber-specific expression of the slow myosin heavy chain 3 gene in the embryonic heart. J. Biol. Chem. 271, 19836-19845.

      Wang, G. F., Nikovits, W. Jr., Schleinitz, M., and Stockdale, F. E. (1998). A positive GATA element and a negative vitamin D receptorlike element control atrial chamber-specific expression of a slow myosin heavy-chain gene during cardiac morphogenesis. Mol. Cell Biol. 18, 6023-6034.

      Xavier-Neto, J., Neville, C. M., Shapiro, M. D., Houghton, L., Wang, G. F., Nikovits, W. Jr, Stockdale, F. E., and Rosenthal, N. (1999). A retinoic acid-inducible transgenic marker of sino-atrial development in the mouse heart. Development 126, 2677-2687.

      Bruneau, B. G., Bao, Z. Z., Fatkin, D., Xavier-Neto, J., Georgakopoulos, D., Maguire, C. T., Berul, C. I., Kass, D. A., Kuroski-de Bold, M. L., de Bold, A. J., Conner, D. A., Rosenthal, N., Cepko, C. L., Seidman, C. E., and Seidman, J. G. (2001). Cardiomyopathy in Irx4-deficient mice is preceded by abnormal ventricular gene expression. Mol. Cell Biol. 21, 1730-1736.

      Wang, G. F., Nikovits, W. Jr., Bao, Z.Z., and Stockdale, F.E. (2001). Irx4 forms an inhibitory complex with the vitamin D and retinoic X receptors to regulate cardiac chamber-specific slow MyHC3 expression. J Biol Chem. 276, 28835-28841.

      The methods section mentions the cNRE sequence, but this is their newly defined regulatory sequence based on the newly identified 6-bp sequence. It is therefore unclear why Hexad C was identified to be of interest, and not the GATA binding site for example, and whether other sequences in the promoter might have stronger effects on driving atrial-specific expression.

      As far as the existence of binding sites other than Hexads A, B, and C, we cannot, formally, exclude the possibility that there may be other relevant regulators of the SMyHC III gene. But we note that the sequences that we utilized were previously mapped through deletion mutant promoter approach by Wang et al., 1996 as the most powerful atrial activator(s) and ventricular repressor(s). We addressed these concerns in a new session entitled “Limitations of our work”.

      Concerning GATA regulation, Wang et al., 1996, 1998 characterized a GATA-4 site that drives generalized (atrial and ventricular) cardiac expression in quail cultures. However, we were unable to identify any relevant changes in cardiac expression in mutant GATA SMyHC III-HAP transgenic mouse lines produced with the same mutated promoter sequences described by Wang et al., 1996, 1998.

      Finding Hexad C as an atrial activator was an experimental finding. We identified it as such because we had two important inputs. First, in 1997, we consulted with Ralff Ribeiro, a specialist on nuclear receptors and he pointed out that downstream of the Hexad A + Hexad B VDRE/RARE (the ventricular repressor), there was a sequence with good potential for a nuclear receptor binding motif. This was exactly Hexad C. Then, we confirmed its potential for nuclear receptor binding by nuclear receptor profiling. After these two pieces of evidence, we thought that there was enough evidence to justify a mutant construct (Mut C). The experimental results we obtained in transgenic mice and zebrafish are consistent with the hypothesis that Hexad C does contain the long sought atrial activator predicted by Wang et al., 1996 in atrial cultures. This seems to be the most important atrial activator (a seven-fold activator) predicted by a deletion approach to be located between -840 and 680 bp in Wang et al., 1996.

      Wang, G. F., Nikovits, W., Schleinitz, M., and Stockdale, F. E. (1996). Atrial chamber-specific expression of the slow myosin heavy chain 3 gene in the embryonic heart. J. Biol. Chem. 271, 19836-19845.

      Wang, G. F., Nikovits, W. Jr., Schleinitz, M., and Stockdale, F. E. (1998). A positive GATA element and a negative vitamin D receptorlike element control atrial chamber-specific expression of a slow myosin heavy-chain gene during cardiac morphogenesis. Mol. Cell Biol. 18, 6023-6034.

      Indeed, the zebrafish transgenic assays use the 32 bp cNRE, while in the mouse transgenic assays, a 72 bp region is used. This choice of sequence length is not justified.

      As stated above, our rational was built as a continuation of the thorough work by Wang and colleagues in progressively narrowing down the location of relevant atrial stimulators and ventricular repressors. Throughout our work, we sought to obtain maximal coherence with previous studies (see references below) and to simultaneously probe cNRE function at an increased resolution. For that, we utilized previously described mutant SMyHC III promoter constructs (Wang et al., 1996) and introduced novel site-directed dinucleotide substitution mutants of individual Hexads in the SMyHC III promoter.

      Wang, G. F., Nikovits, W., Schleinitz, M., and Stockdale, F. E. (1996). Atrial chamber-specific expression of the slow myosin heavy chain 3 gene in the embryonic heart. J. Biol. Chem. 271, 19836-19845.

      Wang, G. F., Nikovits, W. Jr., Schleinitz, M., and Stockdale, F. E. (1998). A positive GATA element and a negative vitamin D receptorlike element control atrial chamber-specific expression of a slow myosin heavy-chain gene during cardiac morphogenesis. Mol. Cell Biol. 18, 6023-6034.

      Xavier-Neto, J., Neville, C. M., Shapiro, M. D., Houghton, L., Wang, G. F., Nikovits, W. Jr, Stockdale, F. E., and Rosenthal, N. (1999). A retinoic acid-inducible transgenic marker of sino-atrial development in the mouse heart. Development 126, 2677-2687.

      Bruneau, B. G., Bao, Z. Z., Fatkin, D., Xavier-Neto, J., Georgakopoulos, D., Maguire, C. T., Berul, C. I., Kass, D. A., Kuroski-de Bold, M. L., de Bold, A. J., Conner, D. A., Rosenthal, N., Cepko, C. L., Seidman, C. E., and Seidman, J. G. (2001). Cardiomyopathy in Irx4-deficient mice is preceded by abnormal ventricular gene expression. Mol. Cell Biol. 21, 1730-1736.

      Wang, G. F., Nikovits, W. Jr., Bao, Z.Z., and Stockdale, F.E. (2001). Irx4 forms an inhibitory complex with the vitamin D and retinoic X receptors to regulate cardiac chamber-specific slow MyHC3 expression. J Biol Chem. 276, 28835-28841.

      The decisions about which bases to mutate in the three hexads are also not clear. Why are the first two bases mutated in Hexad B and C and the whole region mutated in Hexad A? Is there a reason to believe these bases are particularly important?

      As for the reasons behind mutation of the first two bases in Hexad B and Hexad C, there were two:

      One reason is because these point mutations in Hexads B and C were planned after the publication of Wang et al., 1996, which defined the major role of Hexad A in ventricular repression. After this discovery, we decided that a higher level of resolution in our mutation approach would be a better way to search for additional regulators of SMyHC III expression, including the atrial regulator that was readily apparent from the results shown in Wang et al., 1996, but had not yet been described.

      The second reason is because the two first nucleotides (purines) in a nuclear-receptor binding hexad are critical for the interaction between target DNA and transcription factors of the nuclear receptor family. Substituting pyrimidines for purines in the two first positions of an hexad drastically reduces the affinity of a nuclear response element, and that is why we chose to use TT substitutions in our mutant constructs. Please refer to: Umesono et al., Cell, 1991 65: 12551266 for a review; Mader et al., J Biol Chem, 1993 268:591-600 for a mutation study; Rastinejad et al., EMBO J., 2000 19:1045-1054 for a crystallographic study (as well as additional references listed below).

      Mader, S., Chen, J. Y., Chen, Z., White, J., Chambon, P., and Gronemeyer, H. (1993). The patterns of binding of RAR, RXR and TR homo- and heterodimers to direct repeats are dictated by the binding specificites of the DNA binding domains. EMBO J. 12, 50295041.

      Ribeiro, R. C., Apriletti, J. W., Yen, P.M., Chin, W. W., and Baxter, J. D. (1994). Heterodimerization and deoxyribonucleic acid-binding properties of a retinoid X receptor-related factor. Endocrinology.135, 2076-2085.

      Zhao, Q., Chasse, S. A., Devarakonda, S., Sierk, M. L., Ahvazi, B., and Rastinejad, F. (2000). Structural basis of RXR-DNA interactions. J. Mol. Biol. 296, 509-520.

      Shaffer, P. L. and Gewirth, D. T. (2002). Structural basis of VDR-DNA interactions on direct repeat response elements. EMBO J. 21, 2242-2252.

      The control mutant also has effects on the chamber distribution of GFP expression.

      We note that, in the mouse, MutS did not produce any major changes from the typical wild type phenotypes linked to SMyHC III-HAP transgenic hearts. We concluded, based on our data, that the spacing mutant worked reasonably well as a negative mutation control in mice. We agree that it would have been particularly elegant if a spacing mutant designed for the mouse context worked in the exact same way in the zebrafish. However, the fact that there are slight differences in behavior for the mutated “spacing” constructs in species separated by, millions of years of independent evolution is not really surprising, given that the amino acid sequence of transcription factors can diverge and co-evolve with binding nucleotides and end up drifting quite substantially from an ancestral setup. As we reiterate below, we consider more fundamental the fact that the cNRE is actually able to bias cardiac expression towards a model of preferential atrial expression, even in the context of species separated by millions of years of independent evolution.

      Two claims in the paper have weak evidence. Firstly, the conclusion that the cNRE is necessary and sufficient for driving preferential expression in the atrium. Deleting the cNRE does reduce the amount of atrial reporter gene expression but there is not a "conversion" from atrial to ventricular expression as mentioned in line 205. Similarly, a fusion of 5 tandem repeats of the cNRE can induce expression of a ventricular gene in the atria (I'm assuming a single copy is insufficient), but does not abolish ventricular expression.

      We agree that our labelling of the cNRE is perhaps too strong, and we have toned it down accordingly to incorporate the much more equilibrated concept that the cNRE biases cardiac expression towards a model of preferential atrial expression.

      However, after the corrections suggested, we believe our assertion is now justified. We show that in the mouse, removal of the cNRE is followed by a major reduction of atrial expression coupled to the release of a low, but quite clear level of expression in the ventricles, when compared to the transgenic mouse harboring the wild type SMyHC III promoter. Note that, as expected, the relative power of the cNRE to establish preferential atrial expression is higher in the mouse (a mammal) than it is in the zebrafish (a teleost), which is biologically sound, as mammals and avians are closer, phylogenetically, than teleosts and avians. Yet, the direction of change of expression in atria and ventricles was exactly as expected, if a given motif responsible for preferential atrial expression was removed (the cNRE in our case), that is: marked reduction in atrial expression and small (albeit clearly evident) release of ventricular expression. We believe that these directional changes observed in species separated by millions of years of independent evolution constitute very good biological evidence for the role of the cNRE in driving preferential atrial expression.

      Concerning the 5x fusion of cNREs, we chose to produce this multimer for safety purposes only, because we did not want to risk performing incomplete experiments and having to repeat them. However, more to the point, we later compared the efficiency of one (1) versus five (5) cNRE copies in a cell culture context and the results were not different.

      Secondly, the authors claim that the cNRE regulatory sequence arose from viral integration into the genomes of galliform species. While this is an attractive mechanism for explaining novel regulatory sequences, the evidence for this is based purely on sequence homology to viral genomes. And this single observation is not robust as the significance of the sequence matches does not appear to be adjusted for sequence matches expected by chance. The "evolutionary pathway" leading to the direction of chamber-specific expression in the heart as highlighted in the abstract has therefore not been demonstrated.

      We agree with the reviewer. Because of space constraints, we decided to omit a substantial part of our work from the initial submission of the manuscript. We now include the relevant data in the revised version. We thus mapped the phylogenetic origins of the SMyHC III family of slow myosins and then established how and when the cNREs became topologically associated with the SMyHC III gene. To do that, we repeat masked all available sequences from avian SMyHC III orthologs. As it will become clear below, the cNRE is a rare sequence, rather than a low complexity repeat. Our search for cNREs outside of the quail context (Coturnix coturnix) followed two independent lines. First, we took a scaled, evolution-oriented approach. Initially, we looked for cNREs in species close to the quail (i.e., Galliformes) and then progressively farther, to include derived (i.e., Passeriformes) and basal avians (i.e., Paleognaths) as well as external groups such as crocodilians. While pursuing this line of investigation, it became clear that the cNRE was a rare form of repetitive element, which showed a conserved topological relationship with the SMyHC III gene (i.e., cNREs flanked the SMyHC III genes at 5’ and 3’ regions). Using this topological relationship as a character, we determined when it appeared during avian evolution and then set out to establish the likely origins of this rare repetitive motif. This search for the origins of the cNRE entailed comparisons to databases of repetitive genome elements, until the extreme telomeric nature of the SMyHC III gene became evident. This finding directed us to the fact that the hexad nature of the cNRE is reminiscent of the hexameric character of telomeric direct repeats. Because direct telomeric repeats are exactly featured in the genomes of avian DNA viruses that can infect the germline and integrate into the avian genome, we focused our search for the cNRE on the members of the subfamily Alphaherpesvirinae (Morissette & Flamand, 2010). In this search, we utilized the human herpes simplex virus 1 (HSV1) as a general model for herpes viruses, and a set of four (4) members of the Alphaherpesvirinae family that specifically infect Galliformes (i.e., GaHV1, the virus responsible for avian infectious laryngotracheitis in chicken, GaHV2, the Marek’s disease virus, GaHV3, a non-pathogenic virus, and MeHV1, the non-pathogenic Meleagrid herpesvirus 1 capable of infecting chicken and wild turkey) (Waidner et al., 2009). The search for cNREs in Alphaherpesvirinae was successful. We found six (6) cNRE hits in HSV1, one (1) in GaHV1, and none in MeHV1, GaHV2, and GaHV3. Our evolution-directed approach thus led to the direct recognition that cNREs can be found in the genomes of a family of viruses that contain members that infect avians and integrate their double-stranded DNA into the host germline (Morissette & Flamand, 2010). Therefore, as a second independent approach, as pointed out by the reviewer, we set out to further extend this proof of concept by broadening our search to all known sequenced viruses and perform an unbiased, internally consistent, and quantitative analysis of cNRE presence in viral genomes, as already reported in the initial submission of this manuscript.

      Reviewer #3 (Public Review):

      Summary:

      In this manuscript Nunes Santos et al. use a combination of computation and experimental methods to identify and characterize a cis-regulatory element that mediates expression of the quail Slow Myosin Heavy Chain III (SMyHC III) gene in the heart (specifically in the atria). Previous studies had identified a cis-regulatory element that can drive expression of SMyHC III in the heart, but not specifically (solely) in the atria, suggesting additional regulatory elements are responsible for the specific expression of SMyHC III in the atria as opposed to other elements of the heart. To identify these elements Nunes Santos et al. first used a bioinformatic approach to identify potentially functional nuclear receptor binding sites ("Hexads") in the SMyHC III promoter; previous studies had already shown that two of these Hexads are important for SMyHC III promoter function. They identified a previously unknown third Hexad within the promoter, and propose that the combination of these three (called the complex Nuclear Receptor Element or cNRE) is necessary and sufficient for specific atrial expression of SMyHC III. Next, they use experimental methods to functionally characterize the cNRE including showing that the quail SMyHC III promoter can drive green fluorescent protein (GFP) expression the atrium of developing zebrafish embryos and that the cNRE is necessary to drive the expression of the human alkaline phosphatase reporter gene (HAP) in transgenic mouse atria. Additional experiments show that the cNRE is portable regulatory element that can drive atrial expression and demonstrate the importance of the three Hexad parts. These data demonstrating that the cNRE mediates atrial-specific expression is well-done and convincing. The authors also note the possibility that the cNRE might be derived from an endogenous viral element but further data are needed to support the hypothesis that the cNRE is of viral origin.

      Strengths:

      1) The experimental work demonstrating that the cNRE is a regulatory element that can mediate the atrial-specific expression of SMyHC III.

      We thank reviewer 3 for this thorough appreciation of our work and are pleased with the evaluation of our manuscript’s potential.

      Weaknesses:

      1) Justification for use of different regulatory elements in the zebrafish (32 bp cNRE) and the mouse transgenic assays (72 bp cNRE), and discussion of the impact of this difference on the results/interpretation.

      In general, throughout our work, we sought to obtain maximal coherence with previous studies (see references below) and to simultaneously probe cNRE function at an increased resolution. For that, we utilized previously described mutant SMyHC III promoter constructs (Wang et al., 1996, 1998) and introduced novel site-directed dinucleotide substitution mutants of individual Hexads in the SMyHC III promoter. Actually, the 72-bp construct is not a 72-bp construct. It is a 5’ deletion construct that removed 72 bp from the 840 bp wild type SMyHC III construct, transforming it into a 768-bp SMyHC III promoter construct. Any directional changes observed in cardiac expression by the 768 bp as compared to the wild type promoter was interpreted in the context as missing regulators present in this 5’ 72 bp.

      Wang et al., 1996 and 1998 had already shown that Hexads A and B contained a functional VDRE/RARE, which acted as a ventricular repressor. Using the 768-bp SMyHC III promoter in mouse transgenic lines was thus a natural investigation step for us to evaluate whether regulation of the SMyHC III promoter in the mouse was similar in mice as compared to quail cardiac cultures. As shown in the manuscript, deletion of the 72 bp resulted in the release of a low level of expression in ventricles, consistent with the removal of a ventricular repressor (already described by Wang et al., 1996). It also showed a marked reduction in atrial transgene stimulation, suggesting the elimination of a very important atrial activator.

      In 1996, Wang and colleagues mapped an atrial activator to the sequence interval of 160 bp, between -840 and -680 bp (Wang et al., 1996). In our mouse transgenics, we reduced this interval to a mere 72 bp, between -840 to -768 bp. This was very useful information. Wang et al., 1998 showed that HF-1a, M-CAT, and E-box sites located between -840 and -808 bp did not influence atrial expression, so now we had a potential interval of only 40 bp between -808 and -768 bp. Further, our transgenic mice indicated that the GATA site located 3’ from Hexads A, B, and C (GATA site changed to a Sal I site at positions -749 to -743 bp) did not work as a general activator, as in the quail. Thus, the only good candidate for the atrial activator in mice inside the 40-bp fragment between -808 and -768 bp was the cNRE, with its three Hexads, A, B and the novel Hexad C. Because Hexads A plus B composed a functional VDRE/RARE that played a role in ventricular repression in the quail, we hypothesized that the atrial activator would be present in Hexad C. We then mutated the two first purines in Hexad C (the most important ones for nuclear receptor binding, please refer to Umesono et al., Cell, 1991 65: 1255-1266 for a review; Mader et al., J Biol Chem, 1993 268:591-600 for a mutation study; Rastinejad et al., EMBO J., 2000 19:1045-1054 for a crystallographic study as well as additional references listed below) and performed the experiments that demonstrated a profound reduction in atrial expression in the mouse context, revealing the long-sought atrial activator.

      Mader, S., Chen, J. Y., Chen, Z., White, J., Chambon, P., and Gronemeyer, H. (1993). The patterns of binding of RAR, RXR and TR homo- and heterodimers to direct repeats are dictated by the binding specificites of the DNA binding domains. EMBO J. 12, 50295041.

      Ribeiro, R. C., Apriletti, J. W., Yen, P.M., Chin, W. W., and Baxter, J. D. (1994). Heterodimerization and deoxyribonucleic acid-binding properties of a retinoid X receptor-related factor. Endocrinology.135, 2076-2085.

      Wang, G. F., Nikovits, W., Schleinitz, M., and Stockdale, F. E. (1996). Atrial chamber-specific expression of the slow myosin heavy chain 3 gene in the embryonic heart. J. Biol. Chem. 271, 19836-19845.

      Wang, G. F., Nikovits, W. Jr., Schleinitz, M., and Stockdale, F. E. (1998). A positive GATA element and a negative vitamin D receptorlike element control atrial chamber-specific expression of a slow myosin heavy-chain gene during cardiac morphogenesis. Mol. Cell Biol. 18, 6023-6034.

      Zhao, Q., Chasse, S. A., Devarakonda, S., Sierk, M. L., Ahvazi, B., and Rastinejad, F. (2000). Structural basis of RXR-DNA interactions. J. Mol. Biol. 296, 509-520.

      Shaffer, P. L. and Gewirth, D. T. (2002). Structural basis of VDR-DNA interactions on direct repeat response elements. EMBO J. 21, 2242-2252.

      2) Is the cNRE really "necessary and sufficient"? I define necessary and sufficient in this context as a regulatory element that fully recapitulates the expression of the target gene, so if the cNRE was "necessary and sufficient" to direct the appropriate expression of SMyHC III it should be able to drive expression of a reporter gene solely in the atria. While deletion of the cNRE does reduce expression of the reporter gene in atria it is not completely lost nor converted from atrial to ventricular expression (as I understand the study design would suggest should be the effect), similarly fusion of 5 repeats of the cNRE induces expression of a ventricular gene in the atria but also does not convert expression from ventricle to atria. This doesn't seem to satisfy the requirements of a "necessary and sufficient" condition. Perhaps a discussion of why the expectations for "necessary and sufficient" are not met but are still consistent would be beneficial here.

      We agree with your reasoning. Our description of the cNRE was perhaps too strong, and we have toned it down accordingly in the revised manuscript to incorporate a much more equilibrated concept that the cNRE biases cardiac expression towards a model of preferential atrial expression. After these corrections, we believe our novel assertion is justified. We show that in the mouse, removal of the cNRE is followed by a major reduction of atrial expression coupled to the release of a low, but quite clear level of expression in the ventricles, when compared to the transgenic mouse harboring the wild type SMyHC III promoter. Note that, as expected, the relative power of the cNRE to establish preferential atrial expression is higher in the mouse (a mammal) than it is in the zebrafish (a teleost), which is biologically sound, as mammals and avians are closer, phylogenetically, than teleosts and avians. Yet, the direction of change of expression in atria and ventricles was exactly as expected, if a given motif responsible for preferential atrial expression was removed (the cNRE in our case), that is: marked reduction in atrial expression and small (albeit evident) release of ventricular expression. We believe that these directional changes observed in species separated by millions of years of independent evolution constitute very good biological evidence for the role of the cNRE in driving preferential atrial expression.

      3) The claim that the cNRE is derived from a viral integration is not supported by the data. Specifically, the cNRE has sequence similarity to some viral genomes, but this need not be because of homology and can also be because of chance or convergence. Indeed, the region of the chicken genome with the cNRE does have repetitive elements but these are simple sequence repeats, such as (CTCTATGGGG)n and (ACCCATAGAG)n, and a G-rich low complexity region, rather than viral elements; The same is true for the truly genome. These data indicate that the cNRE is not derived from an endogenous virus but is a repetitive and low complexity region, these regions are expected to occur more frequently than expected for larger and more complex regions which would cause the BLAST E value to decrease and appear "significant”, but this is entirely expected because short alignments can have high E values by chance. (Also note that E values do not indicate statistical significance, rather they are the number of hits one can "expect" to see by chance when searching specific database.)

      We do understand the criticism, but we would like to advance another concept, based on a series of results that we obtained using bioinformatics-oriented and evolution-oriented analyses. We performed a cNRE scan in the Gallus gallus genome (galGal5), using varying numbers of nucleotide mismatches. When we searched the galGaL5 genome with coordinates matching the localization of cNREs obtained using matchPattern with up to 8 mismatches, only thirty-one (31) and thirty-four (34) hits were found in the 5’ and 3’ strands, respectively. This indicates that a cNRE match is a rather uncommon finding in the Gallus gallus genome.

      A more systematic profiling of genome occurrence versus nucleotide mismatch indicated that a significant upward inflexion in the relationship between number of cNRE hits and divergence from the original cNRE version (Coturnix coturnix) is recorded only at 12 mismatches or greater. At 8 mismatches, the total number of cNREs on each DNA strand varied little among all avian species examined, remaining close to the average (31+/- 2,2 cNREs for the 5’ strand, range 1748; 34 +/- 3,3 for the 3’ strand, range 14-64). Consistent with the idea that the cNRE is a specific regulatory motif, rather than an abundant, low complexity sequence, there are only two cNRE occurrences in chromosome 19, which harbors AMHC1, the Gallus gallus ortholog of the Coturnix coturnix SMyHC III gene.

      Figure 1: Number of cNRE hits to galGal5 according to maximum mismatches allowed: the cNRE is not an abundant low complexity sequence, but rather a rare repetitive sequence with a clear cutoff level of mismatches allowed. Consistent with this, there are only two (2) cNRE sequences in chromosome 19, the chromosome that contains the AMHC1 gene (the chicken ortholog of the quail SMyHC III gene). ## [1] chr19 [16510, 16541] * | 5’-CAAGGACAAAGAGGGGACAAAGAGGCGGAGGT-3 ## [2] chr19 [32821, 32852] * ‘5’-CAAGGACAAAGAGTGGACAAAGAGGCAGACGT-3

      In the evolutionary strategy, which we now include, we first mapped the phylogenetic origins of the SMyHC III family of slow myosins and then established how and when the cNREs became topologically associated with the SMyHC III gene. To do that we repeat masked all available sequences from avian SMyHC III orthologs. As it will become clear below, the cNRE is a rare sequence, rather than a low complexity repeat. Our search for cNREs outside of the quail context (Coturnix coturnix) followed two independent lines. First, we took a scaled, evolution-oriented approach. Initially, we looked for cNREs in species close to the quail (i.e., Galliformes) and then progressively farther, to include derived (i.e., Passeriformes) and basal avians (i.e., Paleognaths) as well as external groups such as crocodilians. While pursuing this line of investigation, it became clear that the cNRE was a rare form of repetitive element, which showed a conserved topological relationship with the SMyHC III gene (i.e., cNREs flanked the SMyHC III genes at 5’ and 3’ regions). Using this topological relationship as a character, we determined when it appeared during avian evolution, and then set out to establish the likely origins of this rare repetitive motif. This search for the origins of the cNRE entailed comparisons to databases of repetitive genome elements, until the extreme telomeric nature of the SMyHC III gene became evident. This finding directed us to the fact that the hexad nature of the cNRE is reminiscent of the hexameric character of telomeric direct repeats. Because direct telomeric repeats are exactly featured in the genomes of avian DNA viruses that can infect the germline and integrate into the avian genome (Morissette & Flamand, 2010), we focused our search for the cNRE on the members of the subfamily Alphaherpesvirinae. In this search, we utilized the human herpes simplex virus 1 (HSV1) as a general model for herpes viruses and a set of four (4) members of the Alphaherpesvirinae family that specifically infect Galliformes (i.e., GaHV1, the virus responsible for avian infectious laryngotracheitis in chickens, GaHV2, the Marek’s disease virus, GaHV3, a non-pathogenic virus and MeHV1, the non-pathogenic Meleagrid herpesvirus 1 capable of infecting chicken and wild turkey) (Waidner et al., 2009). The search for cNREs in Alphaherpesvirinae was successful. We found six (6) cNRE hits in HSV1 and one (1) cNRE was detected in GaHV1, but none in MeHV1, GaHV2, and GaHV3.

      Our evolution-directed approach thus led to the direct recognition that cNREs up to a cutoff mismatch value of 11 can be found in the genomes of a family of viruses that contain members that infect avians and integrate their double-stranded DNA into the host germline. Therefore, as a second independent approach, we set out to extend this proof of concept by broadening our search to all known sequenced viruses to perform an unbiased, internally consistent, and quantitative analysis of cNRE presence in viral genomes, as already reported in the initial submission of this manuscript.

    1. Author Response:

      Reviewer #1 (Public Review):

      In this study, Kuppan, Mitrovich, and Vahey investigated the impact of antibody specificity and virus morphology on complement activation by human respiratory syncytial virus (RSV). By quantifying the deposition of components of the complement system on RSV particles using high-resolution fluorescence microscopy, they found that antibodies that bind towards the apex of the RSV F protein in either the pre- or post-fusion conformation activated complement most efficiently. Additionally, complement deposition was biased towards globular RSV particles, which were frequently enriched in F in the post-fusion conformation compared to filamentous particles on which F exists predominantly in the pre-fusion conformation.

      Strengths:

      1) While many previous studies have examined the properties of antibodies that impact Fc-mediated effector functions, this study offers a conceptual advance in its demonstration that heterogeneity in virus particle morphology impacts complement activation. This novel finding will motivate further research on this topic both in the context of RSV and other viral infections.

      2) The use of site-specific labeling of viral proteins and high-resolution fluorescence microscopy represents a technical advance in monitoring interactions among different components of antiviral immune responses at the level of single virus particles.

      3) The paper is well written, data are clearly presented and support key claims of the paper with caveats appropriately acknowledged.

      We appreciate the reviewer’s supportive comments. In our revised manuscript, we have focused on improving clarity regarding the minor weaknesses noted below.

      Minor weaknesses:

      Working models and their implications could be clarified and extended. Specifically:

      1) The finding that globular particles enriched in F proteins in the post-fusion conformation (Fig 3F) are dominant targets of complement activation as measured by C3 deposition by not only post-F- but also pre-F-specific antibodies (Fig 4B, left) is interesting. This is despite the fact that, as expected, pre-F antibodies bind less efficiently to globular particles (Fig 4B, right). How do the authors reconcile these observations, given that C3 deposition seems to be IgG-concentration-dependent (Fig 2E)?

      The reviewer raises an excellent point: globular particles, which accumulate as the virus ages, contain more post-F and less pre-F than particles that have recently been shed from infected cells. These ‘aged’ particles nonetheless accumulate more C3 when incubated with pre-F mAbs than ‘younger’ particles, where the proportion of pre-F is higher. We attribute this to the lower surface curvature of globular particles: they accumulate more C3 in the presence of pre-F mAbs in spite of the reduced availability of pre-F epitopes. Figure 1C and 1F help to support this point. This data shows C3 deposition driven by different antibodies bound to particles enriched in either pre-F (Figure 1C) or post-F (Figure 1F). Importantly, for this experiment the conversion to post-F was driven in such a way that virion morphology is preserved (Figure 1E). In this case, we see a clear reduction in C3 deposition by pre-F mAbs on post-F particles (e.g. for CR9501, the percentage of C3-positive particles drops from 24% on pre-F virus to 6% on post-F-enriched virus). This demonstrates that, in the absence of other changes, conversion of pre-F to post-F reduces complement deposition by pre-F specific mAbs.

      Similarly, the reviewer correctly points out that reduced levels of antibody binding lead to lower levels of C3 deposition (Figure 2E); however, as in Figure 1, this data is collected from particles with the same morphologies. Thus, in the absence of additional factors, reduction in mAbs bound to pre-F leads to a reduction in C3 deposition driven by these mAbs. The fact that we observe the opposite trend when changes in particle morphology accompany changes in post-F abundance points to an important role for particle shape in activation of the classical pathway.

      2) Based on data in Figure 5-figure supplement 2, the authors argue that "large viruses are poised to evade complement activation when they emerge from cells as highly-curved filaments, but become substantially more susceptible as they age or their morphology is physically disrupted." Could the increase in C3 deposition be alternatively explained by a higher density of F proteins on larger particles instead of / in addition to a larger potential decrease in membrane curvature?

      We agree that the density of F on a virus – the number of F trimers per unit surface area - likely contributes to the efficiency of C3 deposition. In Figure 6 – figure supplement 2 (Figure 5 – figure supplement 2 in the original submission), we control for this potential effect by comparing viruses that have the same amount of F (as measured by fluorescence intensities of SrtA-labeled F) that are either in filamentous form or globular form (induced through osmotic swelling). The total amount of F per virus is preserved during swelling, and the membrane surface area will remain constant due to the limited ability of lipid bilayers to stretch7. As a result, the input material for these comparisons is the same in terms of F trimers per unit area, yet the C3:F ratio differs substantially. This leads us to conclude that the differences must be attributable to factors other than the density of F. Importantly, this does not mean that the amount of F per unit surface area does not matter for C3 deposition – only that this is not the effect we are observing here. We have added text (Line 299) to help clarify this point: “This effect is unlikely to arise due to changes in the abundance or density of F in the viral membrane, both of which will remain constant following swelling. Similarly, it does not appear to be purely related to size, as larger viral filaments show similar C3:F ratios as smaller viral filaments.”

      3) In the discussion, the authors acknowledge that the implications based on the findings are speculative. However, more clarity on the basis of these speculative models would be useful. For example, it is not clear how the findings directly inform the presented model of immunodominance hierarchies in infants.

      We agree that this was unclear in the original manuscript. We have rewritten paragraph 4 of the Discussion to clarify how our results may contribute to the changes in immunodominance that have been observed in RSV between infants and adults.

      Reviewer #2 (Public Review):

      This is an intriguing study that investigates the role of virus particle morphology on the ability of the first few components in the complement pathway to bind and opsonize RSV virions. The authors use primarily fluorescence microscopy with fluorescently tagged F proteins and fluorescently labeled antibodies and complement proteins (C3 and C4). They observed that antibodies against different epitopes exhibited different abilities to induce C3 binding, with a trend reflecting positioning of IgG Fc more distal to the viral membrane resulting in better complement "activation". They also compared the ability of C3 to deposit on virus produced from cells +/- CD55, which inhibits opsonization, and showed knockout led to greater C3 binding, indicating a role for this complement "defense protein" in RSV opsonization. They also examined kinetics of complement protein deposition (probed by C4 binding) to globular vs filamentous particles, observing that deposition occurred more rapidly to non-filaments.

      A better understanding of complement activation in response to viruses can lead to a more comprehensive understanding of the immune response to antigen both beneficial and detrimental, when dysfunctional, during infection as well as mechanisms of combating the viral infection. The study provides new mechanistic information for understanding the properties of an enveloped virus that can influence complement activation, at least in an in vitro setting. It remains to be determined whether these effects manifest in the considerably more complex setting of natural infection or even in the presence of a polyclonal antibody mixture.

      The studies are elegantly designed and carefully executed with reasonable checks for reproducibility and controls, which is important especially in a relatively complex and heterogeneous experimental system.

      We thank the reviewer for the insightful comments. We have revised the manuscript to help to clarify points of confusion and to address some of the technical points raised here.

      Specific points:

      1) "Complement activation" involves much more than C3 or C4 binding. Better to use more specific terminology relating to the observable (i.e. fluorescently labeled complement component binding)

      We agree with the reviewer. We have revised the manuscript throughout to make our language more accurate and precise.

      2) What is the rationalization for concentrations of antibodies used? What range was tested, and how dependent on antibody concentration were the observed complement deposition trends? How do they relate to physiological concentrations, and how would the presence of a more complex polyclonal response that is typically present (e.g. as the authors noted, the serum prior to antibody depletion already mediates complement activation) affect the complement activation trends? The neat, uniform display of Fc for monoclonals that were tested is likely to be quite garbled in more natural antibody response situations. This should be discussed.

      We have added discussion of antibody concentrations and possible differences between monoclonal and polyclonal responses to the revised manuscript. Below, we address the specific questions raised here by the reviewer.

      We chose to use antibody concentrations that are comparable to the concentrations of dominant clonotypes in post-vaccination serum1. Our goal in selecting relatively high antibody concentrations for our experiments was to focus on understanding the capacity of an antibody to drive complement deposition when it has reached maximum densities on RSV particles. This is discussed starting on Line 125 of Results, and in paragraph 2 of Discussion. Experiments testing a range of antibody concentrations would be valuable, but are likely to strongly reflect differences in the binding affinities of these antibodies, which have been characterized previously.

      Although we have not performed titrations for each of the antibodies tested due to the large number of conditions needed and the limited throughput of our experimental approach, the manuscript does present a dilution series for CR9501, the IgG1 mAb with the greatest potency in driving C3 deposition among those tested here. This data (shown in Figure 3E & F in the revised manuscript) shows that as the amount of antibody added in solution decreases over a 16-fold range, C3 deposition decreases as well. The decrease in C3 deposition is roughly commensurate with the reduction in antibody binding, reaching levels that are just above background at an antibody concentration of ~0.6μg/ml (1:800 dilution). We think it is likely that other activating antibodies would show similar trends, while antibodies that do not activate the classical pathway at saturating concentrations would be unlikely to do so across a range of lower concentrations.

      We agree with the reviewer that complement deposition driven by polyclonal antibodies is more complex than the monoclonal responses studied here. As discussed in paragraph 2 of our revised Discussion, one effect that polyclonal serum might have is to increase the density of Fcs on the virus by providing antibody mixtures that bind to multiple non-overlapping antigenic sites. We speculate that this would generally increase complement deposition, provided that sufficient antibodies are present that bind to productive antigenic sites (e.g. sites 0/ , II, and V).

      Finally, we note that we observe a similar phenomenon where globular particles are preferentially opsonized with C3 in our experiments with polyclonal serum where IgG and IgM have not been depleted (Figure R1). The major limitation of this data – which is resolved by using monoclonal antibodies – is the difficulty of determining to what extent this bias arises due to the epitopes targeted by the polyclonal serum versus the intrinsic sensitivity of the virus particles.

      Figure R1: RSV opsonized with polyclonal human serum. A similar bias towards globular particles (white dashed circles) is observed as in experiments with monoclonal antibodies.

      3) Are there artifacts or caveats resulting from immobilization of virus particles on the coverslips?

      As pointed out by the reviewer, a few possible artifacts or caveats could arise due to the immobilization of viruses on coverslips. These include (1) spurious binding of C1 or other complement components to the immobilizing antibody (3D3); (2) reduced access to viral antigens as a result of immobilization; and (3) inhibition of antibody-induced viral aggregation. We are able to rule out issues associated with (1), because we do not see attachment of C1 or C3 to the coverslip (i.e. outside regions occupied by virus particles). This is consistent with the fact that the antibodies are immobilized on the surface via a C-terminal biotin attached to the heavy chain, which would limit access for C1 binding and prevent the formation of Fc hexamers.

      Immobilization on coverslips could reduce the accessibility of a portion of the virus for binding by antibodies and complement proteins. This could effectively shield a portion of the viral surface from assembly of an activating complex, which we estimate requires ~35nm of clearance above the targeted epitope on F8. Importantly, the fraction of the viral surface area that would be shielded would vary for filaments and spheres; to determine if this could influence our results, we calculated the expected magnitude of this effect (Figure R2). To do this, we modeled the virus as being tethered to the surface via a 25nm linkage. This accounts for the length of the biotinylated PEG (~5-15nm for PEG2K, depending on the degree of extension), streptavidin (~5nm), and the anti-G antibody (~10-15nm including the biotinylated C-terminal linker). Although limited structural information is available for RSV G, the ~100 residue, heavily glycosylated region between the viral membrane and the 3D3 epitope likely extends above the height of F (~12nm). Our model assumes that a shell of thickness d surrounding the virus is necessary for antibody-C1 complexes to fit without clashing with the surface (this shell is shaded in gray in the schematic from Figure R2). Tracing the angles at which this shell clashes with the coverslip allows us to calculate the fraction of total surface area that is inaccessible for activation of the classical pathway. The results are plotted on the right side of Figure R2. The relative surface area accessible to a 35nm activating antibody-C1 complex differs between a filament and a sphere of equivalent surface area by about 15%. We conclude that this difference is modest compared to the ~5-fold difference in deposition kinetics we observe between viral filaments and spheres (Figure 4), or the 3- to 10-fold difference in relative C3 deposition we observe on larger filamentous particles after conversion to spheres (Figure 6 – figure supplement 2C).

      Finally, by performing experiments on immobilized viruses, we eliminate the possibility for antibody-dependent particle aggregation. While this was necessary for us to get interpretable results, the formation of viral aggregates could affect the dynamics and extent of complement deposition. For example, activation of the classical pathway on one particle in an aggregate could spread to non-activating particles through a “bystander effect”, as has been reported in other contexts9. We are interested in this question and have begun preliminary experiments in this direction; however, we believe that a definitive answer is outside the scope of this current work. To alert readers to this consideration, we have added this to paragraph 2 of the revised Discussion (Line 359).

      Figure R2: Estimating the surface accessibility of RSV particles bound to coverslips. Definition of variables: af: radius of cylindrical RSV filament; as: radius of spherical RSV particle of equivalent surface area (see Figure 6 – figure supplement 2A); d: distance needed above the viral surface to accommodate IgG-C1 activating complexes; h: height of viral surface above the coverslip; L: length of the viral filament.

      4) How is the "density of antigen" quantitated? What fraction of F or G is labeled? For fluorescence intensity measurements in general, how did the authors ensure their detection was in a linear sensitivity range for the detectors for the various fluorescent channels? Since quantitation of fluorescence intensities is important in this study, some discussion in methods would be valuable.

      We have performed this important additional characterization of our fluorescence system and our overall labeling and quantification strategy to address these concerns. The results of this characterization are now included in two new figure supplements in the revised manuscript (Figure 1 – figure supplements 2 & 3).

      5) The authors also show that the particle morphology, whether globular or filamentous, as well as relative size and resulting apparent curvature, correlate with ability of C3 to bind. Some link to the abundance of post-fusion F (post-F) is examined and discussed, but I found the back and forth discussion between morphology, C3 binding, and post-F abundance to be confusing and in need of clarification and streamlining. Is there a mechanistic link between morphology changes and post-F level increases? Are the two linked or coincidental (for example does pre-F interaction with matrix help stabilize that conformation, and if lost lead to spontaneous conversion to post-F?). Please clarify.

      Specifically, we have separated the discussion of pre-F versus post-F abundance and particle morphology into two different sections in Results, and we have rearranged Figures 4 and 5 (Figures 3 and 4 in the original submission) to improve clarity.

      Regarding the question of whether changes in morphology and the pre-F to post-F conversion are coincidental or mechanistically linked: the answer is not entirely clear, although we have collected new data that suggests a connection. We first want to note that the two effects are at least partly separable: brief treatment with a low osmolarity solution causes particle shape to change while preserving pre-F (Figure 6A & B), whereas treating with an osmotically balanced solution with low ionic strength converts pre-F to post-F without affecting virus shape (Figure 1E). However, we were motivated by the reviewer’s questions to look into this further. To determine if the change in viral shape may serve to destabilize the pre-F conformation over time, we compared the relative amounts of pre-F and post-F present in particles that were osmotically swollen to those that were not at 0h and at 24h. In these experiments, particles were swollen using a brief (~1 minute) exposure to low osmolarity conditions before returning them to PBS (Figure R3, left). As expected, we observe no immediate change in pre-F abundance following the brief osmotic shock (Figure R3, right: 0h time point), consistent with Figure 6B. After incubating the particles an additional 24h at 37oC, the post-F-to-pre-F ratio is ~3.5-fold higher in osmotically-swollen particles than in those where filamentous morphology was initially preserved (Figure R3, right: 24h time point). This supports the reviewer’s suggestion that interactions with the matrix may help to stabilize F in the prefusion conformation, since the conversion to post-F is faster when this interaction is disrupted. Whether or not this has any relevance for RSV entry into cells remains to be determined; however, it is worth noting that we observed no clear loss or gain of infectivity in RSV particles following osmotic swelling (Figure 6 – figure supplement 1A). Since this result may be of interest to readers, we have included this new data in Figure 6 – figure supplement 1B, and it is discussed briefly in Results (Line 250).

      Figure R3: Determining stability of pre-F following matrix detachment. Left: Experimental design. Right: Comparison of pre-F stability on untreated particles (gray) and particles subjected to brief osmotic swelling (magenta). Distributions show the ratio of post-F (ADI-14353) to pre-F (5C4) intensities per particle, combined for four biological replicates, sampled at 0h (immediately after swelling) and after an additional incubation at 37oC for 24h. Black points show median values for each individual replicate. P-values are determined from a two-sample T test.

      6) Since their conclusion is that curvature of the virus surface is a major influence on the ability of complement proteins to bind, I feel that some effort at modeling this effect based upon known structures is warranted. One might also anticipate then that there would be some epitope-dependent effect as a result of changes in curvature that may lead to an exaggeration of the epitope-specific effects for more highly curved particles perhaps than those with lower curvature? Is this true?

      The reviewer raises two excellent points: that it may be possible to gain insight into the mechanisms through which curvature dictates C1 binding and other aspects of complement activation through structural modeling, and that such a model may help to identify specific epitope effects that could contribute to curvature dependence.

      We developed simulations based on the geometry of RSV, F, and hexameric IgG to try to better understand how curvature may influence initiation of the classical pathway. This model is described in the Methods section (Modeling IgG hexamers on curved surfaces), and the results are discussed in the final two paragraphs of the Results section. In addition, we have included a new figure (Figure 7) to summarize the model’s predictions. This model corroborates the curvature sensitivity of IgG hexamer formation and suggests a possible intuitive explanation for our findings: high curvature effectively increases the distance between epitopes that sit high above the viral membrane, decreasing the likelihood of hexamer formation (Figure 7D). Regarding epitope specific effects, this model suggests that the further the epitope is above the viral membrane, the greater the effect that decreasing curvature will have. However, we find that epitopes closer to the membrane (e.g. those bound by 101F or ADI-19425) are overall very inefficient at activating the classical pathway, potentially due to steric obstruction of the formation of IgG hexamers. Thus, there may be an inherent tradeoff between overcoming steric obstruction (by binding to epitopes distal to the membrane) and sensitivity to surface curvature.

      It is important to note that this model is reductionist and does not include detailed structural information. Additional factors may be important for considering epitope-specific effects. For example, antibodies that bind equatorially on F (e.g. ADI-19425, which binds to antigenic site III), show minimal complement deposition in our experiments. However, particles whose curvature approaches the diameter of hexameric IgG or IgM (~20nm) may display these epitopes in a manner that is more accessible. If the curvature necessary to observe such an effect falls outside of the biologically accessible range, it would not be observable in our experiments. Nonetheless, it is possible that a different set of antibodies may drive complement deposition on highly-curved nanoparticle vaccines that are in development10. We have added this important point to the second paragraph of the Discussion.

      7) Line 265: it would be useful to confirm the increase C1 binding as a function of morphology as was done for antibody-angle of binding experiments.

      We believe that this data is shown in Figure 6B (Figure 5B in the original manuscript).

      Reviewer #3 (Public Review):

      Overall the manuscript is clearly written and the data are displayed well, with helpful diagrams in the figures to illustrate assays and RSV F epitopes. The engineering of the RSV strain to include a fluorescent reporter and tags on F and G that serve as substrates for fluorophore attachment is impressive and is a strength. The RSV literature is well cited and the interpretation of the results is consistent with structure/function data on RSV F and its interaction with antibodies. This reviewer is not an expert on the experiments performed in this manuscript, but they appear to be rigorously performed with appropriate controls. As such, the conclusions are justified by the data. One weakness is the extent to which the results regarding virion morphology are biologically relevant. Non-filamentous forms of the virion are generally obtained only in vitro as a result of virion purification or biochemical treatment. However, these results may be relevant for certain vaccine candidates, including the failed formalin-inactivated RSV vaccine that was evaluated in the late 1960s and caused vaccine-enhanced disease upon natural RSV infection.

      Thank you for these suggestions, which have helped us to better place our results regarding RSV morphology in the context of prior work. We agree with the reviewer that non-filamentous RSV particles are commonly obtained in vitro, and that this morphology does not reflect the structure of the virus as it is budding from infected cells. Our work has characterized the transition from filament to globular / amorphous form, with the finding that it can occur rapidly upon physical or chemical perturbations, as well as more gradually during natural aging: i.e. in the absence of handling or purification. We are also able to detect globular particles accumulating in cultured A549 cells, where no handling has occurred prior to observation (Figure 5 – figure supplement 1). While we do not currently know how well this reflects the tendency of RSV to undergo conversion from filament to sphere in vivo, we propose that it is plausible that such a transformation could occur. To distinguish between what we demonstrate and what we speculate, we write (Line 401): “Although more work is needed to understand the prevalence of globular particles during in vivo infection, our observations that these particles accumulate over time through the conversion of viral filaments – even under normal cell culture conditions - suggest that their presence in vivo is feasible, where the physical and chemical environment would be considerably harsher and more complex.”

      We agree with the reviewer that our results may have relevance towards understanding the failed formalin-inactivated vaccine trial. We have added this to paragraph 5 of the Discussion section.

    1. Author Response

      Reviewer #1 (Public Review):

      The study by Akter et al demonstrates that astrocyte-derived L-lactate plays a key role in schema memory formation and promotes mitochondrial biogenesis in the Anterior Cingulate Cortex (ACC).

      The main tool used by the authors is the DREADD technology that allows to pharmacologically activate receptors in a cell-specific manner. In the study, the authors used the DREADD technique to activate appropriately transfected astrocytes, a subtype of muscarinic receptor that is not normally present in cells. This receptor being coupled to a Gi-mediated signal transduction pathway inhibiting cAMP formation, the authors could demonstrate cell-(astrocyte) specific decreases in cAMP levels that result in decreased L-lactate production by astrocytes.

      Behaviorally this pharmacological manipulation results in impairments of schema memory formation and retrieval in the ACC in flavor-place paired associate paradigms. Such impairments are prevented by co-administration of L-lactate.

      The authors also show that activation of Gi signaling resulting in L-lactate decreased release by astrocytes impairs mitochondrial biogenesis in neurons in an L-lactate reversible manner.

      By using MCT 2 inhibitors and an NMDAR antagonist the authors conclude that the molecular mechanisms underlying the observed effects are mediated by L-lactate entering neurons through MCT2 transporters and involve NMDAR.

      Overall, the article's conclusions are warranted by the experimental evidence, but some weak points could be addressed which would make the conclusions even stronger.

      The number of animals in some of the experiments is on the low side (4 to 6).

      In the revised manuscript, we have increased the animal numbers in two key experimental groups (hM4Di-CNO and Control groups) of behavioral experiments. Now the animal numbers in different groups are as follows:

      • 15 rats in hM4Di-CNO group

      o Further divided into two subgroups for probe tests (PT1-4) conducted during flavor-place paired associate training; 8 rats in the hM4Di-CNO (saline) and 7 rats in the hM4Di-CNO (CNO) subgroups receiving I.P. saline or I.P. CNO, respectively, before these PTs.

      • 8 rats in the Control group

      • 7 rats in the Rescue group (hM4Di-CNO+L-lactate)

      • 4 rats in the Control-CNO group. Animal number in this group was not increased as it was apparent from these 4 rats that CNO alone was not impairing the PA learning and memory retrieval in these rats (AAV8-GFAP-mCherry injected). Their result was very similar to the control group. Additionally, in a previous study (Liu et al., 2022), we showed that CNO administration in the rats injected with AAV8-GFAP-mCherry into the hippocampus does not show any impairments in schema.

      Also, in the newly added open field test experiments to investigate the locomotor activity as suggested by the Reviewer #2, 8 rats were used in each group.

      The use of CIN to inhibit MCT2 is not optimal. Authors may want to decrease MCT2 expression by using antisense oligonucleotides.

      In the revised manuscript, we have conducted the experiment using MCT2 antisense oligodeoxynucleotide (ODN) as suggested.

      To test whether the L-lactate-induced neuronal mitochondrial biogenesis is dependent on MCT2, we bilaterally injected MCT2 antisense oligodeoxynucleotide (MCT2-ODN, n=8 rats, 2 nmol in 1 μl PBS per ACC) or scrambled ODN (SC-ODN, n=8 rats, 2 nmol in 1 μl PBS per ACC) into the ACC. After 11 hours, bilateral infusion of L-lactate (10 nmol, 1 μl) or ACSF (1 μl) was given into the ACC and the rats were kept in the PA event arena. After 60 mins (12 hours from MCT2-ODN or SC-ODN administration), the rats were sacrificed. As shown in Author response image 1B, SC-ODN+L-lactate group showed significantly increased relative mtDNA copy number compared to the SC-ODN+ACSF group (p<0.001, ANOVA followed by Tukey's multiple comparisons test). However, this effect was completely abolished in MCT2-ODN+L-lactate group, suggesting that MCT2 is required for the L-lactate-induced mitochondrial biogenesis in the ACC.

      We have integrated this new data and results in the revised manuscript.

      Author response image 1.

      Mitochondrial biogenesis by L-lactate is dependent on MCT2 and NMDAR. A. Experimental design to investigate whether MCT2 and NMDAR activity are required for L-lactate-induced mitochondrial biogenesis. B and C. mtDNA copy number abundance in the ACC of different rat groups relative to nDNA. Data shown as mean ± SD (n=4 rats in each group). ***p<0.001, ANOVA followed by Tukey's multiple comparisons test.

      The experiment using AVP to block NMDAR only partially supports the conclusions. Indeed, blocking NMDAR will knock down any response that involves these receptors, whether L-lactate is necessary or not.

      In the current study we found that Astrocytic Gi activation in the ACC reduced L-lactate level in the ECF of ACC which was also associated with decreased PGC-1α/SIRT3/ATPB/mtDNA abundance suggesting downregulation of mitochondrial biogenesis pathway. We also found that exogenous administration of L-lactate into the ACC of astrocytic Gi-activated rats rescued this downregulation. In line with this, in a recently published study (Akter et al., 2023), we found upregulation of mitochondrial biogenesis pathway in the hippocampus neurons of exogenous L-lactate-treated anesthetized rats. Another recent study has demonstrated that exercise-induced L-lactate release from skeletal muscle or I.P. injection of L-lactate can induce hippocampal PGC-1α (which is a master regulator of mitochondrial biogenesis) expression and mitochondrial biogenesis in mice (Park et al., 2021). Together, these results provide compelling evidence that L-lactate promotes mitochondrial biogenesis.

      L-lactate is known to promote expression of synaptic plasticity genes like Arc, c-Fos, and Zif268 in neurons (Yang et al., 2014). After entry into the neuronal cytoplasm, mainly through MCT2, it is converted into pyruvate by lactate dehydrogenase 1 (LDH1). This conversion also produces NADH, affecting the redox state of the neuron. NADH positively modulates the activity of NMDAR resulting in enhanced Ca2+ currents, the activation of intracellular signaling cascades, and the induction of the expression of plasticity-associated genes (Yang et al., 2014; Magistretti & Allaman, 2018). The study demonstrated that L-lactate–induced plasticity gene expression was abolished in the presence of NMDAR antagonists including D-APV (Yang et al., 2014). These results suggested that the MCT2 and NMDAR are key players in the regulation of L-lactate induced plasticity gene expression.

      In the current study, we investigated whether similar mechanisms might be involved in L-lactate-induced neuronal mitochondrial biogenesis. We now used MCT2 antisense oligodeoxynucleotide to decrease the expression of MCT2 (as mentioned in the previous response and Author response image 1B) and showed that MCT2 is necessary for L-lactate-induced mitochondrial biogenesis to manifest, indicating that L-lactate’s entry into the neuron is required. As mentioned before, after entry into neuron, L-lactate is converted into pyruvate by LDH, which also produce NADH, which in turn potentiates NMDAR activity. Therefore, we investigated whether NMDAR activity is required for L-lactate-induced mitochondrial biogenesis. We used D-APV to inhibit NMDAR (Author response image 1C) and found that L-lactate does not increase mtDNA copy number abundance if D-APV is given, suggesting that NMDAR activity is required for L-lactate to promote mitochondrial biogenesis.

      NMDAR serves diverse functions. Therefore, as mentioned by the reviewer, blocking NMDAR may knock down many such functions. While our current data only suggests the involvement of MCT2 and NMDAR in the upregulation of mitochondrial biogenesis by L-lactate, we have not investigated other mechanisms and pathways modulating mitochondrial biogenesis that are either dependent or independent of MCT2 and NMDAR activity. Further studies are needed in future to dissect and better understand this interesting observation. We have now clarified this in the discussion section of the manuscript.

      Is inhibition of glycogenolysis involved in the observed effects mediated by Gi signaling? Indeed, L-lactate is formed both by glycolysis and glycogenolysis. The authors could test whether the glycogen metabolism-inhibiting drug DAB would mimic the effects of Gi activation.

      In this study we have shown that astrocytic Gi activation in the ACC leads to a decrease in the cAMP and L-lactate. L-lactate is produced by glycogenolysis and glycolysis. cAMP in astrocytes acts as a trigger for L-lactate production (Choi et al., 2012; Horvat, Muhič, et al., 2021; Horvat, Zorec, et al., 2021; Zhou et al., 2021) by promoting glycogenolysis and glycolysis (Vardjan et al., 2018; Horvat, Muhič, et al., 2021; Horvat, Zorec, et al., 2021). Therefore, one promising explanation of reduced L-lactate level observed in our study is the reduction of L-lactate production in the astrocyte due to decreased glycogen metabolism as a result of decreased cAMP. We have now mentioned this in the discussion.

      DAB is an inhibitor of glycogen phosphorylase that suppresses L-lactate production. It was shown to impair memory by decreasing L-lactate (Newman et al., 2011; Suzuki et al., 2011; Iqbal et al., 2023). As we found that the impairment in the schema memory and mitochondrial biogenesis was associated with decreased L-lactate level in the ACC and that the exogenous L-lactate administration can rescue the impairments, it is likely that DAB will mimic the effect of Gi activation in terms of schema memory and mitochondrial biogenesis. However, further study is needed to confirm this.  

      Reviewer #2 (Public Review):

      The manuscript of Akter et al is an important study that investigates the role of astrocytic Gi signaling in the anterior cingulate cortex in the modulation of extracellular L-lactate level and consequently impairment in flavor-place associates (PA) learning. However, whereas some of the behavioral observations and signaling mechanism data are compelling, the conclusions about the effect on memory are inadequate as they rely on an experimental design that does not allow to differentiate acute or learning effect from the effect outlasting pharmacological treatments, i.e. effect on memory retention. With the addition of a few experiments, this paper would be of interest to the larger group of researchers interested in neuron-glia interactions during complex behavior.

      • Largely, I agree with the authors' conclusion that activating Gi signaling in astrocytes impairs PA learning, however, the effect on memory retrieval is not that obvious. All behavioral and molecular signaling effects described in this study are obtained with the continuous presence of CNO, therefore it is not possible to exclude the acute effect of Gi pathway activation in astrocytes. What will happen with memory on retrieval test when CNO is omitted selectively during early, middle, or late session blocks of PA learning?

      We have now added 8 more rats to the hM4Di-CNO group (i.e., the group with astrocytic Gi activation) to clarify the memory retrieval. These rats underwent flavor-place paired associate (PA) training similar to the previously described rats (n=7) of this group, that is they received CNO 30 minutes before and 30 minutes after the PA training sessions (S1-2, S4-8, S10-17). However, contrasting to the previous rats of this group which received CNO before PTs (PT1, PT2, PT3), we omitted the CNO (instead administered I.P. saline) selectively on these PTs conducted at the early, middle, and late stage of PA training, as suggested by the reviewer. These newly added rats did not show memory retrieval in these PTs, suggesting that the rats were not learning the PAs from the PA training sessions. See Author response image 2C-E, where this subgroup is denoted as hM4Di-CNO (Saline).

      We then continued more PA training sessions (S21 onwards, Author response image 2B) for these rats without CNO. They gradually learned the PAs. PTs (PT5, PT6, PT7; Author response image 2G-I) were done during this continuation phase of PA training; once without CNO (i.e., with I.P. saline instead), and another one with CNO. As seen in the Author response image 2H and 2I, they retrieved the memory when PT6 and PT7 were done without CNO. However, if these PTs were done with CNO, they could not retrieve the memory. Together these results suggest that ACC astrocytic Gi activation by CNO during PT can impair memory retrieval in rats which have already learned the PAs.

      As shown in the Author response image 2B, we replaced two original PAs with two new PAs (NPA 9 and 10) at S34. This was followed by PT8 (S35). As seen in Author response image 2J, these rats retrieved the NPA memory if the PT is done without CNO. However, they could not retrieve the NPA memory if the PT was done with CNO. This result suggests that ACC astrocytic Gi activation by CNO during PT can impair NPA memory retrieval.

      In summary, these data show that astrocytic Gi activation in the ACC can impair PA memory retrieval. We have integrated this new data and results in the revised manuscript.

      Author response image 2.

      A. PI (mean ± SD) during the acquisition of the six original PAs (OPAs) (S1-2, 4-8, 10-17) and new PAs (NPAs) (S19) of the control (n=8), hM4Di-CNO (n=15), and rescue (hM4Di-CNO+L-lactate) (n=7) groups. From S6 onwards, hM4Di-CNO group consistently showed lower PI compared to control. However, concurrent L-lactate administration into the ACC (rescue group) can rescue this impairment. B. PI (mean ± SD) of hM4Di-CNO group (n=8) from S21 onwards showing gradual increase in PI when CNO was withdrawn. C, D, and E. Non-rewarded PTs (PT1, PT2, and PT3 conducted on S3, S9, and S18, respectively) to test memory retrieval of OPAs for the control, hM4Di-CNO, and rescue groups. The percentage of digging time at the cued location relative to that at the non-cued locations are shown (mean ± SD). In both PT2 and PT3, the control group spent significantly more time digging the cued sand well above the chance level, indicating that the rats learned OPAs and could retrieve it. Contrasting to this, hM4Di-CNO group did not spend more time digging the cued sand well above the chance level irrespective of CNO administration before the PTs. The rescue group showed results similar to the hM4Di-CNO group if CNO is given without L-lactate. On the other hand, they showed results similar to the control group if L-lactate is concurrently given with CNO, indicating that this group learned OPAs and could retrieve it. p < 0.05, p < 0.01, p < 0.001, one-sample t-test comparing the proportion of digging time at the cued sand well with the chance level of 16.67%. F. Non-rewarded PT4 (S20) which was conducted after replacing two OPAs with two NPAs (NPA 7 & 8) in S19 for the control, hM4Di-CNO, and rescue groups. Results show that the control group spent significantly more time digging the new cued sand well above the chance level indicating that the rats learned the NPAs from S19 and could retrieve it in this PT. Contrasting to this, hM4Di-CNO group did not spend more time digging the new-cued sand well above the chance level irrespective of CNO administration before the PT. The rescue group showed results similar to the hM4Di-CNO group if CNO is given without L-lactate. On the other hand, they showed results similar to the control group if L-lactate is concurrently given with CNO indicating that this group learned NPAs from S19 and could retrieve it. p < 0.001, one-sample t-test comparing the proportion of digging time at the new cued sand well with the chance level of 16.67%. G, H, and I. Non-rewarded PTs (PT5, PT6, and PT7 conducted on S23, S27, and S33, respectively) to test memory retrieval of OPAs for the hM4Di-CNO group. In both PT6 and PT7, the rats spent significantly more time digging the cued sand well above the chance level if the tests are done without CNO, indicating that the rats learned the OPAs and could retrieve it. However, CNO prevented memory retrieval during these PTs. p < 0.001, one-sample t-test comparing the proportion of digging time at the cued sand well with the chance level of 16.67%. J. Non-rewarded PT4 (S35) which was conducted after replacing two OPAs with two NPAs (NPA 9 & 10) in S34 for the hM4Di-CNO group. Results show that the rats spent significantly more time digging the new cued sand well above the chance level if CNO was not given before the PT, indicating that the rats learned the NPAs from S34 and could retrieve it in this PT. However, if CNO is given before the PT, the retrieval is impaired. *p < 0.001, one-sample t-test comparing the proportion of digging time at the new cued sand well with the chance level of 16.67%.

      • I found it truly exciting that the administration of exogenous L-lactate is capable to rescue CNO-induced PA learning impairment, when co-applied. Would it be possible that this treatment has a sensitivity to a particular stage of learning (acquisition, consolidation, or memory retrieval) when L-lactate administration would be the most efficacious?

      The hM4Di-CNO group, when continued with PA training without CNO (S21-S32) (Author response image 2B), was able to learn the six original PAs (OPAs). In the PT7 done at S33 (Author response image 2I), this group of rats was able to retrieve the memory if the test was done without CNO but could not retrieve the memory if CNO was given. Similarly, the Rescue group (hM4Di-CNO+L-lactate) (Author response image 2A), which received both CNO and L-lactate during PA training sessions (S1-S17), they were able to learn the OPAs. And at PT3 done at S18 (Author response image 2E), these rats were able to retrieve the memory when the test was done with CNO+L-lactate but not if the test is done with only CNO. Together, these results clearly show that ACC astrocytic Gi activation with CNO impairs memory retrieval and exogenous L-lactate can rescue the impairment. Therefore, it can be concluded that the memory retrieval is sensitive to L-lactate.

      The PA learning is hippocampus-dependent. Over the course of repeated PA training, systems consolidation occurs in the ACC, after which the already learned PA memory (schema) becomes hippocampus-independent (Tse et al., 2007; Tse et al., 2011). A higher activation (indicated by expression of c-Fos) in the hippocampus relative to the ACC during the early period of schema development, and the reverse at the late stage was observed in our previous study (Liu et al., 2022). However, rapid assimilation of new PA into the ACC requires simultaneous activation/retrieval of previous schema from ACC and hippocampus dependent new PA learning (Tse et al., 2007; Tse et al., 2011). During new PA learning, increase of c-Fos neurons in both CA1 and ACC was detected (Liu et al., 2022).

      Our hM4Di-CNO group received CNO 30 mins before and after each PA training session in S1-S17 (Author response image 2A). Also, the Rescue group similarly received CNO+L-lactate before and after each PA training session in S1-S17. Therefore, while this study design allowed us to conclude that ACC astrocytic Gi activation impairs PA learning and that exogenous L-lactate can rescue the impairment, it does not allow clear differentiation of the effects of these treatments on memory acquisition and consolidation. Further studies are needed to investigate this.

      • The hypothesis that observed learning impairments could be associated with diminished mitochondrial biogenesis caused by decreased l-lactate in the result of astrocytic Gi-DREADDS stimulation is very appealing, but a few key pieces of evidence are missing. So far, the hypothesis is supported by experiments demonstrating reduced expression of several components of mitochondrial membrane ATP synthase and a decrease in relative mtDNA copy numbers in ACC of rats injected with Gi-DREADDs. L-lactate injections into ACC restored and even further increased the expression of the above-mentioned markers. Co-administration of NMDAR antagonist D-APV or MCT-2 (mostly neuronal) blocker 4-CIN with L-lactate, prevented L-lactate-induced increase in relative mtDNA copy. I am wondering how the interference with mitochondrial biogenesis is affecting neuronal physiology and if it would result in impaired PA learning or schema memory.

      The observation of diminished mitochondrial biogenesis in the astrocytic Gi-activated rats that showed impaired PA learning is exciting. However, our study does not provide experimental data on how mitochondrial biogenesis could be associated with impaired PA learning and schema memory. Results from several previous studies linked mitochondrial biogenesis and its regulators such as PGC-1α and SIRT3 to diverse neuronal and cognitive functions as described in the discussion section of the manuscript. In the revised manuscript, we have provided further discussion as follows to discuss potential mechanisms:

      “In this study, we have demonstrated that ACC astrocytic Gi activation impairs PA learning and schema formation, PA memory retrieval, and NPA learning and retrieval by decreasing L-lactate level in the ACC. Although we have shown that these impairments are associated with diminished expression of proteins of mitochondrial biogenesis, the precise mechanisms of how astrocytic Gi activation affects neuronal functions and schema memory remain to be elucidated. We previously demonstrated that neuronal inhibition in either the hippocampus or the ACC impairs PA learning and schema formation (Hasan et al., 2019). In another recent study (Liu et al., 2022), we showed that astrocytic Gi activation in the CA1 impaired PA training-associated CA1-ACC projecting neuronal activation. Yao et al. recently showed that reduction of astrocytic lactate dehydrogenase A (an enzyme that reversibly catalyze L-lactate production from pyruvate) in the dorsomedial prefrontal cortex reduces L-lactate levels and neuronal firing frequencies, promoting depressive-like behaviors in mice (Yao et al., 2023). These impairments could be rescued by L-lactate infusion. It is possible that the impairment in PA learning and schema observed in our study might have involved a similar functional consequence of reduced neuronal activity in the ACC neurons upon astrocytic Gi activation.

      Schema consolidation is associated with synaptic plasticity-related gene expression (such as Zif268, Arc) in the ACC (Tse et al., 2011). L-lactate, after entry into neurons, can be converted to pyruvate during which NADH is also produced, promoting synaptic plasticity-related gene expression by potentiating NMDA signaling in neurons (Yang et al., 2014; Margineanu et al., 2018). Furthermore, L-lactate acts as an energy substrate to fuel learning-induced de novo neuronal translation critical for long-term memory (Descalzi et al., 2019). On the other hand, mitochondria play crucial role in fueling local translation during synaptic plasticity (Rangaraju et al., 2019). Therefore, it could be hypothesized that the rescue of astrocytic Gi activation-mediated impairment of schema by exogenous L-lactate could have been mediated by facilitating synaptic plasticity-related gene expression by directly fueling the protein translation, potentiating NMDA signaling, as well as increasing mitochondrial capacity for ATP production by promoting mitochondrial biogenesis. Furthermore, the potential involvement of HCAR1, a receptor for L-lactate that may regulate neuronal activity (Bozzo et al., 2013; Tang et al., 2014; Herrera-López & Galván, 2018; Abrantes et al., 2019), cannot be excluded. Future research could explore these potential mechanisms, examining the interactions among them, and determining their relative contributions to schema. Our previous study also showed that ACC myelination is necessary for PA learning and schema formation, and that repeated PA training is associated with oligodendrogenesis in the ACC (Hasan et al., 2019). Oligodendrocytes facilitate fast, synchronized, and energy efficient transfer of information by wrapping axons in myelin sheath. Furthermore, they supply axons with glycolysis products, such as L-lactate, to offer metabolic support (Fünfschilling et al., 2012; Lee et al., 2012). The association of oligodendrogenesis and myelination with schema memory may suggest an adaptive response of oligodendrocytes to enhance metabolic support and neuronal energy efficiency during PA learning. Given the impairments in PA learning observed in the ACC astrocytic Gi-activated rats in the current study, it is reasonable to conclude that the direct metabolic support to axons provided by oligodendrocytes is not sufficient to rescue the schema impairments caused by decreased L-lactate levels upon astrocytic Gi activation. On the other hand, L-lactate was shown to be important for oligodendrogenesis and myelination (Sánchez-Abarca et al., 2001; Rinholm et al., 2011; Ichihara et al., 2017). Therefore, it is tempting to speculate that a decrease in L-lactate level may also impede oligodendrogenesis and myelination, consequently preventing the enhanced axonal support provided by oligodendrocytes and myelin during schema learning. Recently, a study has demonstrated that upon demyelination, mitochondria move from the neuronal cell body to the demyelinated axon (Licht-Mayer et al., 2020). Enhancement of this axonal response of mitochondria to demyelination, by targeting mitochondrial biogenesis and mitochondrial transport from the cell body to axon, protects acutely demyelinated axons from degeneration. Given the connection between schema and increased myelination, it remains an open question whether L-lactate-induced mitochondrial biogenesis plays a beneficial role in schema through a similar mechanism. Nevertheless, our results contribute to the mounting evidence of the glial role in cognitive functions and underscores the new paradigm in which glial cells are considered as integral players in cognitive functions alongside neurons. Disruption of neurons, myelin, or astrocytes in the ACC can disrupt PA learning and schema memory.”

      Reviewer #3 (Public Review):

      Akter et al. investigated how the astroglial Gi signaling pathway in the rat anterior cingulate cortex (ACC) affects cognitive functions, in particular schema memory formation. Using a stereotactic approach they intracranially introduced AAV8 vectors carrying mCherry-tagged hM4Di DREADD (Designer Receptor Exclusively Activated by Designer Drugs) under astrocyte selective GFAP promotor (AAV8-GFAP-hM4Di-mCherry) into the AAC region of the rat brain. hM4Di DREADD is a genetically modified form of the human M4 muscarinic (hM4) receptor insensitive to endogenous acetylcholine but is activated by the inert clozapine metabolite clozapine-N-oxide (CNO), triggering the Gi signaling pathway. The authors confirmed that hM4Di DREADD is selectively expressed in astrocytes after the application of the AAV8 vector by analysing the mCherry signals and immunolabeling of astrocytes and neurons in the ACC region of the rat brain. They activated hM4Di DREADD (Gi signalling) in astrocytes by intraperitoneal administration of CNO and measured cognitive functions in animals after CNO administration. Activation of Gi signaling in astrocytes by CNO application decreased paired-associate (PA) learning, schema formation, and memory retrieval in tested animals. This was associated with a decrease in cAMP in astrocytes and L-lactate in extracellular fluid as measured by immunohistochemistry in situ and in awake rats by microdialysis, respectively. Administration of exogenous L-lactate rescued the astroglial Gi-mediated deficits in PA learning, memory retrieval, and schema formation, suggesting that activation of astroglial Gi signalling downregulates L-lactate production in astrocytes and its transport to neurons affecting memory formation. Authors also show that expression level of proteins involved in mitochondrial biogenesis, which is associated with cognitive functions, is decreased in neurons, when Gi signalling is activated in astrocytes, and rescued when exogenous L-lactate is applied, suggesting the implication of astrocyte-derived L-lactate in the maintenance of mitochondrial biogenesis in neurons. The latter depended on lactate MCT2 transporter activity and glutamate NMDA receptor activity.

      The paper is very well written and discussed. The conclusions of this paper are well supported by the data. Although this is a study that uses established and previously published methodologies, it provides new insights into L-lactate signalling in the brain, particularly in AAC, and further confirms the role of astroglial L-lactate in learning and memory formation. It also raises new questions about the molecular mechanisms underlying astrocyte-derived L-lactate-mediated mitochondrial biogenesis in neurons and its contribution to schema memory formation.

      • The authors discuss astrocytic L-lactate signalling without considering the recently discovered L-lactate-sensitive Gs and Gi protein-coupled receptors in the brain, which are present in both astrocytes and neurons. The use of nonendogenous L-lactate receptor agonists (Compound 2, 3-chloro-5-hydroxybenzoic acid) would clarify the implication of L-lactate receptor signalling in schema memory formation.

      In the revised manuscript, we have included this point in the discussion section to mention the potential role of HCAR1 in schema memory as follows:

      “Schema consolidation is associated with synaptic plasticity-related gene expression (such as Zif268, Arc) in the ACC (Tse et al., 2011). L-lactate, after entry into neurons, can be converted to pyruvate during which NADH is also produced, promoting synaptic plasticity-related gene expression by potentiating NMDA signaling in neurons (Yang et al., 2014; Margineanu et al., 2018). Furthermore, L-lactate acts as an energy substrate to fuel learning-induced de novo neuronal translation critical for long-term memory (Descalzi et al., 2019). On the other hand, mitochondria play crucial role in fueling local translation during synaptic plasticity (Rangaraju et al., 2019). Therefore, it could be hypothesized that the rescue of astrocytic Gi activation-mediated impairment of schema by exogenous L-lactate could have been mediated by facilitating synaptic plasticity-related gene expression by directly fueling the protein translation, potentiating NMDA signaling, as well as increasing mitochondrial capacity for ATP production by promoting mitochondrial biogenesis. Furthermore, the potential involvement of HCAR1, a receptor for L-lactate that may regulate neuronal activity (Bozzo et al., 2013; Tang et al., 2014; Herrera-López & Galván, 2018; Abrantes et al., 2019), cannot be excluded. Future research could explore these potential mechanisms, examining the interactions among them, and determining their relative contributions to schema.”

      • The use of control animals transduced with an "empty" AAV9 vector (AAV8-GFAP-mCherry) compared with animals transduced with AAV8-GFAP-hM4Di-mCherry throughout the study would strengthen the results of this study, since transfection itself, as well as overexpression of the mCherry protein, may affect cell function.

      We thank the reviewer for pointing this. The schema experiment includes a control group (Control-CNO group) of rats injected with AAV8-GFAP-mCherry bilaterally into the ACC. As shown in Author response image 3, after habituation and pretraining, these rats were trained for PA learning similarly to the other groups. Before 30 mins and after 30 mins of each PA training session, they received I.P. CNO. The PA learning, schema formation, memory retrieval, NPA learning and retrieval, and latency (time needed to commence digging at the correct well) were similar to the control group of rats. This result is consistent with our previous study where rats bilaterally injected with AAV8-GFAP-mCherry into CA1 of hippocampus did not show impairments in PA learning and schema formation upon CNO treatment (Liu et al., 2022).

      Author response image 3.

      A. PI (mean ± SD) during the acquisition of the original six PAs (OPAs) (S1-2, 4-8, 10-17) and new PAs (NPAs) (S19) of the control (n=6) and control-CNO (n=4) groups. B. Non-rewarded PTs (PT1, PT2, and PT3 done on S3, S9, and S18, respectively) to test memory retrieval of OPAs for the control-CNO group. C. Non-rewarded PT4 (S20) which was done after replacing two OPAs with two NPAs (NPA 7 & 8) in S19 for the control-CNO group. D. Latency (in seconds) before commencing digging at the correct well for control and control-CNO groups. Data shown as mean ± SD.

      References

      Abrantes, H. d. C., Briquet, M., Schmuziger, C., Restivo, L., Puyal, J., Rosenberg, N., Rocher, A.-B., Offermanns, S., & Chatton, J.-Y. (2019). The Lactate Receptor HCAR1 Modulates Neuronal Network Activity through the Activation of Gα and Gβγ Subunits. The Journal of Neuroscience, 39(23), 4422-4433. https://doi.org/10.1523/jneurosci.2092-18.2019

      Akter, M., Ma, H., Hasan, M., Karim, A., Zhu, X., Zhang, L., & Li, Y. (2023). Exogenous L-lactate administration in rat hippocampus increases expression of key regulators of mitochondrial biogenesis and antioxidant defense [Original Research]. Frontiers in Molecular Neuroscience, 16. https://doi.org/10.3389/fnmol.2023.1117146

      Bozzo, L., Puyal, J., & Chatton, J.-Y. (2013). Lactate Modulates the Activity of Primary Cortical Neurons through a Receptor-Mediated Pathway. PLoS One, 8(8), e71721. https://doi.org/10.1371/journal.pone.0071721

      Choi, H. B., Gordon, G. R., Zhou, N., Tai, C., Rungta, R. L., Martinez, J., Milner, T. A., Ryu, J. K., McLarnon, J. G., Tresguerres, M., Levin, L. R., Buck, J., & MacVicar, B. A. (2012). Metabolic communication between astrocytes and neurons via bicarbonate-responsive soluble adenylyl cyclase. Neuron, 75(6), 1094-1104. https://doi.org/10.1016/j.neuron.2012.08.032

      Covelo, A., Eraso-Pichot, A., Fernández-Moncada, I., Serrat, R., & Marsicano, G. (2021). CB1R-dependent regulation of astrocyte physiology and astrocyte-neuron interactions. Neuropharmacology, 195, 108678. https://doi.org/https://doi.org/10.1016/j.neuropharm.2021.108678

      Descalzi, G., Gao, V., Steinman, M. Q., Suzuki, A., & Alberini, C. M. (2019). Lactate from astrocytes fuels learning-induced mRNA translation in excitatory and inhibitory neurons. Communications Biology, 2(1), 247. https://doi.org/10.1038/s42003-019-0495-2

      Endo, F., Kasai, A., Soto, J. S., Yu, X., Qu, Z., Hashimoto, H., Gradinaru, V., Kawaguchi, R., & Khakh, B. S. (2022). Molecular basis of astrocyte diversity and morphology across the CNS in health and disease. Science, 378(6619), eadc9020. https://doi.org/10.1126/science.adc9020

      Fünfschilling, U., Supplie, L. M., Mahad, D., Boretius, S., Saab, A. S., Edgar, J., Brinkmann, B. G., Kassmann, C. M., Tzvetanova, I. D., Möbius, W., Diaz, F., Meijer, D., Suter, U., Hamprecht, B., Sereda, M. W., Moraes, C. T., Frahm, J., Goebbels, S., & Nave, K.-A. (2012). Glycolytic oligodendrocytes maintain myelin and long-term axonal integrity. Nature, 485(7399), 517-521. https://doi.org/10.1038/nature11007

      Harris, R. A., Lone, A., Lim, H., Martinez, F., Frame, A. K., Scholl, T. J., & Cumming, R. C. (2019). Aerobic Glycolysis Is Required for Spatial Memory Acquisition But Not Memory Retrieval in Mice. eNeuro, 6(1). https://doi.org/10.1523/ENEURO.0389-18.2019

      Hasan, M., Kanna, M. S., Jun, W., Ramkrishnan, A. S., Iqbal, Z., Lee, Y., & Li, Y. (2019). Schema-like learning and memory consolidation acting through myelination. FASEB J, 33(11), 11758-11775. https://doi.org/10.1096/fj.201900910R

      Herrera-López, G., & Galván, E. J. (2018). Modulation of hippocampal excitability via the hydroxycarboxylic acid receptor 1. Hippocampus, 28(8), 557-567. https://doi.org/https://doi.org/10.1002/hipo.22958

      Horvat, A., Muhič, M., Smolič, T., Begić, E., Zorec, R., Kreft, M., & Vardjan, N. (2021). Ca2+ as the prime trigger of aerobic glycolysis in astrocytes. Cell Calcium, 95, 102368. https://doi.org/https://doi.org/10.1016/j.ceca.2021.102368

      Horvat, A., Zorec, R., & Vardjan, N. (2021). Lactate as an Astroglial Signal Augmenting Aerobic Glycolysis and Lipid Metabolism [Review]. Frontiers in Physiology, 12. https://doi.org/10.3389/fphys.2021.735532

      Ichihara, Y., Doi, T., Ryu, Y., Nagao, M., Sawada, Y., & Ogata, T. (2017). Oligodendrocyte Progenitor Cells Directly Utilize Lactate for Promoting Cell Cycling and Differentiation. J Cell Physiol, 232(5), 986-995. https://doi.org/10.1002/jcp.25690

      Iqbal, Z., Liu, S., Lei, Z., Ramkrishnan, A. S., Akter, M., & Li, Y. (2023). Astrocyte L-Lactate Signaling in the ACC Regulates Visceral Pain Aversive Memory in Rats. Cells, 12(1), 26. https://www.mdpi.com/2073-4409/12/1/26

      Jourdain, P., Rothenfusser, K., Ben-Adiba, C., Allaman, I., Marquet, P., & Magistretti, P. J. (2018). Dual action of L-Lactate on the activity of NR2B-containing NMDA receptors: from potentiation to neuroprotection. Sci Rep, 8(1), 13472. https://doi.org/10.1038/s41598-018-31534-y

      Kofuji, P., & Araque, A. (2021). G-Protein-Coupled Receptors in Astrocyte-Neuron Communication. Neuroscience, 456, 71-84. https://doi.org/10.1016/j.neuroscience.2020.03.025

      Lee, Y., Morrison, B. M., Li, Y., Lengacher, S., Farah, M. H., Hoffman, P. N., Liu, Y., Tsingalia, A., Jin, L., Zhang, P. W., Pellerin, L., Magistretti, P. J., & Rothstein, J. D. (2012). Oligodendroglia metabolically support axons and contribute to neurodegeneration. Nature, 487(7408), 443-448. https://doi.org/10.1038/nature11314

      Licht-Mayer, S., Campbell, G. R., Canizares, M., Mehta, A. R., Gane, A. B., McGill, K., Ghosh, A., Fullerton, A., Menezes, N., Dean, J., Dunham, J., Al-Azki, S., Pryce, G., Zandee, S., Zhao, C., Kipp, M., Smith, K. J., Baker, D., Altmann, D., Anderton, S. M., Kap, Y. S., Laman, J. D., Hart, B. A. t., Rodriguez, M., Watzlawick, R., Schwab, J. M., Carter, R., Morton, N., Zagnoni, M., Franklin, R. J. M., Mitchell, R., Fleetwood-Walker, S., Lyons, D. A., Chandran, S., Lassmann, H., Trapp, B. D., & Mahad, D. J. (2020). Enhanced axonal response of mitochondria to demyelination offers neuroprotection: implications for multiple sclerosis. Acta Neuropathologica, 140(2), 143-167. https://doi.org/10.1007/s00401-020-02179-x

      Liu, S., Wong, H. Y., Xie, L., Iqbal, Z., Lei, Z., Fu, Z., Lam, Y. Y., Ramkrishnan, A. S., & Li, Y. (2022). Astrocytes in CA1 modulate schema establishment in the hippocampal-cortical neuron network. BMC Biol, 20(1), 250. https://doi.org/10.1186/s12915-022-01445-6

      Magistretti, P. J., & Allaman, I. (2018). Lactate in the brain: from metabolic end-product to signalling molecule. Nat Rev Neurosci, 19(4), 235-249. https://doi.org/10.1038/nrn.2018.19

      Margineanu, M. B., Mahmood, H., Fiumelli, H., & Magistretti, P. J. (2018). L-Lactate Regulates the Expression of Synaptic Plasticity and Neuroprotection Genes in Cortical Neurons: A Transcriptome Analysis. Front Mol Neurosci, 11, 375. https://doi.org/10.3389/fnmol.2018.00375

      Netzahualcoyotzi, C., & Pellerin, L. (2020). Neuronal and astroglial monocarboxylate transporters play key but distinct roles in hippocampus-dependent learning and memory formation. Progress in Neurobiology, 194, 101888. https://doi.org/https://doi.org/10.1016/j.pneurobio.2020.101888

      Newman, L. A., Korol, D. L., & Gold, P. E. (2011). Lactate produced by glycogenolysis in astrocytes regulates memory processing. PLoS One, 6(12), e28427. https://doi.org/10.1371/journal.pone.0028427

      Park, J., Kim, J., & Mikami, T. (2021). Exercise-Induced Lactate Release Mediates Mitochondrial Biogenesis in the Hippocampus of Mice via Monocarboxylate Transporters. Front Physiol, 12, 736905. https://doi.org/10.3389/fphys.2021.736905

      Peterson, S. M., Pack, T. F., & Caron, M. G. (2015). Receptor, Ligand and Transducer Contributions to Dopamine D2 Receptor Functional Selectivity. PLoS One, 10(10), e0141637. https://doi.org/10.1371/journal.pone.0141637

      Rangaraju, V., Lauterbach, M., & Schuman, E. M. (2019). Spatially Stable Mitochondrial Compartments Fuel Local Translation during Plasticity. Cell, 176(1), 73-84.e15. https://doi.org/10.1016/j.cell.2018.12.013

      Rinholm, J. E., Hamilton, N. B., Kessaris, N., Richardson, W. D., Bergersen, L. H., & Attwell, D. (2011). Regulation of oligodendrocyte development and myelination by glucose and lactate. J Neurosci, 31(2), 538-548. https://doi.org/10.1523/JNEUROSCI.3516-10.2011

      Sánchez-Abarca, L. I., Tabernero, A., & Medina, J. M. (2001). Oligodendrocytes use lactate as a source of energy and as a precursor of lipids. Glia, 36(3), 321-329. https://doi.org/10.1002/glia.1119

      Suzuki, A., Stern, S. A., Bozdagi, O., Huntley, G. W., Walker, R. H., Magistretti, P. J., & Alberini, C. M. (2011). Astrocyte-neuron lactate transport is required for long-term memory formation. Cell, 144(5), 810-823.

      Tang, F., Lane, S., Korsak, A., Paton, J. F. R., Gourine, A. V., Kasparov, S., & Teschemacher, A. G. (2014). Lactate-mediated glia-neuronal signalling in the mammalian brain. Nature Communications, 5(1), 3284. https://doi.org/10.1038/ncomms4284

      Tauffenberger, A., Fiumelli, H., Almustafa, S., & Magistretti, P. J. (2019). Lactate and pyruvate promote oxidative stress resistance through hormetic ROS signaling. Cell Death Dis, 10(9), 653. https://doi.org/10.1038/s41419-019-1877-6

      Tse, D., Langston, R. F., Kakeyama, M., Bethus, I., Spooner, P. A., Wood, E. R., Witter, M. P., & Morris, R. G. (2007). Schemas and memory consolidation. Science, 316(5821), 76-82. https://doi.org/10.1126/science.1135935

      Tse, D., Takeuchi, T., Kakeyama, M., Kajii, Y., Okuno, H., Tohyama, C., Bito, H., & Morris, R. G. (2011). Schema-dependent gene activation and memory encoding in neocortex. Science, 333(6044), 891-895. https://doi.org/10.1126/science.1205274

      Vardjan, N., Chowdhury, H. H., Horvat, A., Velebit, J., Malnar, M., Muhič, M., Kreft, M., Krivec, Š. G., Bobnar, S. T., Miš, K., Pirkmajer, S., Offermanns, S., Henriksen, G., Storm-Mathisen, J., Bergersen, L. H., & Zorec, R. (2018). Enhancement of Astroglial Aerobic Glycolysis by Extracellular Lactate-Mediated Increase in cAMP [Original Research]. Frontiers in Molecular Neuroscience, 11. https://doi.org/10.3389/fnmol.2018.00148

      Vezzoli, E., Cali, C., De Roo, M., Ponzoni, L., Sogne, E., Gagnon, N., Francolini, M., Braida, D., Sala, M., Muller, D., Falqui, A., & Magistretti, P. J. (2020). Ultrastructural Evidence for a Role of Astrocytes and Glycogen-Derived Lactate in Learning-Dependent Synaptic Stabilization. Cereb Cortex, 30(4), 2114-2127. https://doi.org/10.1093/cercor/bhz226

      Wang, J., Tu, J., Cao, B., Mu, L., Yang, X., Cong, M., Ramkrishnan, A. S., Chan, R. H. M., Wang, L., & Li, Y. (2017). Astrocytic l-Lactate Signaling Facilitates Amygdala-Anterior Cingulate Cortex Synchrony and Decision Making in Rats. Cell Rep, 21(9), 2407-2418. https://doi.org/10.1016/j.celrep.2017.11.012

      Yang, J., Ruchti, E., Petit, J. M., Jourdain, P., Grenningloh, G., Allaman, I., & Magistretti, P. J. (2014). Lactate promotes plasticity gene expression by potentiating NMDA signaling in neurons. Proc Natl Acad Sci U S A, 111(33), 12228-12233. https://doi.org/10.1073/pnas.1322912111

      Yao, S., Xu, M.-D., Wang, Y., Zhao, S.-T., Wang, J., Chen, G.-F., Chen, W.-B., Liu, J., Huang, G.-B., Sun, W.-J., Zhang, Y.-Y., Hou, H.-L., Li, L., & Sun, X.-D. (2023). Astrocytic lactate dehydrogenase A regulates neuronal excitability and depressive-like behaviors through lactate homeostasis in mice. Nature Communications, 14(1), 729. https://doi.org/10.1038/s41467-023-36209-5

      Yu, X., Zhang, R., Wei, C., Gao, Y., Yu, Y., Wang, L., Jiang, J., Zhang, X., Li, J., & Chen, X. (2021). MCT2 overexpression promotes recovery of cognitive function by increasing mitochondrial biogenesis in a rat model of stroke. Anim Cells Syst (Seoul), 25(2), 93-101. https://doi.org/10.1080/19768354.2021.1915379

      Zhou, Z., Okamoto, K., Onodera, J., Hiragi, T., Andoh, M., Ikawa, M., Tanaka, K. F., Ikegaya, Y., & Koyama, R. (2021). Astrocytic cAMP modulates memory via synaptic plasticity. Proc Natl Acad Sci U S A, 118(3), e2016584118. https://doi.org/10.1073/pnas.2016584118

      Zhu, J., Hu, Z., Han, X., Wang, D., Jiang, Q., Ding, J., Xiao, M., Wang, C., Lu, M., & Hu, G. (2018). Dopamine D2 receptor restricts astrocytic NLRP3 inflammasome activation via enhancing the interaction of β-arrestin2 and NLRP3. Cell Death Differ, 25(11), 2037-2049. https://doi.org/10.1038/s41418-018-0127-2

    1. Author Response

      Reviewer #1 (Public Review):

      The authors convincingly show in this study the effects of the fas5 gene on changes in the CHC profile and the importance of these changes toward sexual attractiveness.

      The main strength of this study lies in its holistic approach (from genes to behaviour) showing a full and convincing picture of the stated conclusions. The authors succeeded in putting a very interdisciplinary set of experiments together to support the main claims of this manuscript.

      We appreciate the kind comments from the reviewer.

      The main weakness stems from the lack of transparency behind the statistical analyses conducted in the study. Detailed statistical results are never mentioned in the text, nor is it always clear what was compared to what. I also believe that some tests that were conducted are not adequate for the given data. I am therefore unable to properly assess the significance of the results from the presented information. Nevertheless, the graphical representations are convincing enough for me to believe that a revision of the statistics would not significantly affect the main conclusions of this manuscript.

      We apologize for neglecting a detailed description of statistical tests that were performed. We wrote additional paragraphs in the method part specifically explaining the statistical analyses (line 435-445; 489-502; 559-561; 586-591).

      The second major problem I had with the study was how it brushes over the somewhat contradicting results they found in males (Fig S2). These are only mentioned twice in the main text and in both cases as being "similarly affected", even though their own stats seem to indicate otherwise for many of the analysed compound groups. This also should affect the main conclusion concerning the effects of fas5 genes in the discussion, a more careful wording when interpreting the results is therefore necessary.

      Thank you for pointing this out. Though our focus clearly lay on the female CHC profiles as a function in sexual signaling has only been described thus far for them, we now elaborated the result and discussion for the fas5 RNAi male part (line 167-178; 258-268).

      Reviewer #2 (Public Review):

      Insects have long been known to use cuticular hydrocarbons for communication. While the general pathways for hydrocarbon synthesis have been worked out, their specificity and in particular the specificity of the different enzymes involved is surprisingly little understood. Here, the authors convincingly demonstrate that a single fatty acid synthase gene is responsible for a shift in the positions of methyl groups across the entire alkane spectrum of a wasp, and that the wasps males recognize females specifically based on these methyl group positions. The strength of the study is the combination of gene expression manipulations with behavioural observations evaluating the effect of the associated changes in the cuticular hydrocarbon profiles. The authors make sure that the behavioural effect is indeed due to the chemical changes by not only testing life animals, but also dead animals and corpses with manipulated cuticular hydrocarbons.

      I find the evidence that the hydrocarbon changes do not affect survival and desiccation resistance less convincing (due to the limited set of conditions and relatively small sample size), but the data presented are certainly congruent with the idea that the methyl alkane changes do not have large effects on desiccation.

      We appreciate the kind comments from the reviewer.

      Reviewer #3 (Public Review):

      In this manuscript, the authors are aiming to demonstrate that a fatty-acyl synthase gene (fas5) is involved in the composition of the blend of surface hydrocarbons of a parasitoid wasp and that it affects the sexual attractiveness of females for males. Overall, the manuscript reads very well, it is very streamlined, and the authors' claims are mostly supported by their experiments and observations.

      We appreciate the kind comments from the reviewer.

      However, I find that some experiments, information and/or discussion are absent to assess how the effects they observe are, at least in part, not due to other factors than fas5 and the methyl-branched (MB) alkanes. I'm also wondering if what the authors observe is only a change in the sexual attractiveness of females and not related to species recognition as well.

      We appreciate the interesting point that the reviewer raises in sexual attractiveness and species recognition and now expand upon this potential aspect in the discussion (lines 327-330). However, in this manuscript, we very much focused on the effect of fas5 knockdown on the conveyance of female sexual attractiveness in a single species (Nasonia vitripennis). Therefore, we argue that species recognition constitutes a different communication modality here, and we currently cannot infer whether and how species recognition is exactly encoded in Nasonia CHC profiles despite some circumstantial evidence for species-specificity (Buellesbach et al. 2013; Mair et al. 2017). Thus, we would like to refrain from any further speculation on species recognition before this can be unambiguously demonstrated, and remain within the mechanism of sexual attractiveness within a single species which we clearly show is mediated by the female MB-alkane fraction governed by the fatty acid synthase genes. We however still consider potential alternative explanations (e.g., n-alkenes acting as a deterrent of homosexual mating attempts).

      The authors explore the function of cuticular hydrocarbons (CHCs) and a fatty-acyl synthase in Nasonia vitripennis, a parasitic wasp. Using RNAi, they successfully knockdown the expression of the fas5 gene in wasps. The authors do not justify their choice of fatty-acyl synthase candidate gene. It would have been interesting to know if that is one of many genes they studied or if there was some evidence that drove them to focus their interest in fas5.

      In a previous study, 5 fas candidate genes orthologous to Drosophila melanogaster fas genes were identified and mapped in the genome of Nasonia vitripennis (Buellesbach et al. 2022). We actually investigated the effects of all of these fas genes on CHC variation, but only fas5 led to such a striking, traceable pattern shift. We are currently preparing another manuscript discussing the effects of the other fas genes, but decided to focus exclusively on fas5 here, due to its significance for revealing how sexual attractiveness can be encoded and conveyed in complex chemical profiles, maintained and governed by a surprisingly simple genetic basis.

      The authors observe large changes in the cuticular hydrocarbons (CHC) profile of male and females. These changes are mostly a reduction of some MB alkanes and an increase in others as well as an increase of n-alkene in fas5 knockdown females. For males fas5 knockdowns, the overall quantity of CHC is increased and consequently, multiple types of compounds are increased compared to wild-type, with only one compound appearing to decrease compared to wild-type. Insects are known to rely on ratios of compounds in blends to recognize odors. Authors address this by showing a plot of the relative ratios, but it seems to me that they do show statistical tests of those changes in the proportions of the different types of compounds. In the results section, the authors give percentages while referring to figures showing the absolute amount of CHCs. They should also test if the ratios are significantly different or not between experimental conditions. Similar data should be displayed for the males as well.

      We appreciate your suggestions. We kindly refer you to our response to reviewer 1, where we addressed the statistical tests. Specifically, we generated separate subplots to display the proportions of different compound classes and performed statistical tests to compare these proportions between different treatments for both males and females. Additionally, we have revised the results section to replace relative abundances with absolute quantity, as depicted in Figure 2C-G.

      Furthermore, the authors didn't use an internal standard to measure the quantity of CHCs in the extracts, which, to me, is the gold standard in the field. If I understood correctly, the authors check the abundance measured for known quantities of n-alkanes. I'm sure this method is fine, but I would have liked to be reassured that the quantities measured through this method are good by either testing some samples with an internal standard, or referring to work that demonstrates that this method is always accurate to assess the quantities of CHC in extracts of known volumes.

      We actually did include 7,5 ng/μl dodecane (C12) as an “internal” standard in the hexane resuspensions of all of our processed samples (line 456, Materials and Methods). This was primarily done to allow for visually inspecting and comparing the congruence of all chromatograms in the subsequent data analysis and immediately detect any variation from sample preparation, injection process and instrument fluctuation. In our study, we have a very elaborate and standardized CHC extraction method that the volume of solvent and duration for extraction are strictly controlled to minimize the variation from sample preparation steps. Furthermore, we calibrated each individual CHC compound quantity with a dilution series of external standards (C21-C40) of known concentration. By constructing a calibration curve based on this dilution series, we achieved the most accurate compound quantification, also taking into account and counteracting the generally diminishing quantities of compounds with higher chain lengths.

      The authors provide a sensible control for their RNAi experiments: targeting an unrelated gene, absent in N. vitripennis (the GFP). This allows us to see if the injection of RNAi might affect CHC profiles, which it appears to do in some cases in males, but not in females. The authors also show to the reader that their RNAi experiments do reduce the expression of the target gene. However, one of the caveats of their experiments, is that the authors don't provide evidence or information to allow the (non-expert) reader to assess whether the fas5 RNAi experiments did affect the expression of other fatty-acyl synthase genes. I'm not an expert in RNAi, so maybe this suggestion is not relevant, but it should, at least, be addressed somewhere in the manuscript that such off-target effects are very unlikely or impossible, in that case, or more generally.

      We acknowledge the reviewer’s concern about potential off-target effect of the fas5 knockdown. We actually did check initially for off-target effects on the other four previously published fas genes in N. vitripennis (Lammers et al. 2019; Buellesbach et al. 2022) and did not find any effects on their respective expressions. We now include these results as supplementary data (Figure 2-figure supplement 1). However, as mentioned in the cover letter to the editor, we discovered a previously uncharacterized fas gene in the most recent N. vitripennis genome assembly (NC_045761.1), fas6, most likely constituting a tandem gene duplication of fas5. These two genes turned out to have such high sequence similarity (> 90 %, Figure 2-figure supplement 2) that both were simultaneously downregulated by our fas5 dsRNAi construct, which we confirmed with qPCR and now incorporated into our manuscript (Fig. 2H). Therefore, we now explicitly mention that the knockdown affects both genes, and either one or both could have the observed phenotypic effects. Recognizing this RNAi off-target effect, we have now also incorporated a discussion of this issue in the appropriate section of the manuscript (line 364-377), as well as the potential off-target effects of our GFP dsRNAi controls (line 262-274).

      The authors observe that the modified CHCs profiles of RNAi females reduce courtship and copulation attempts, but not antennation, by males toward live and (dead) dummy females. They show that the MB alkanes of the CHC profile are sufficient to elicit sexual behaviors from males towards dummy females and that the same fraction from extracts of fas5 knockdown females does so significantly less. From the previous data, it seems that dummy females with fas5 female's MB alkanes profile elicit more antennation than CHC-cleared dummy females, but the authors do not display data for this type of target on the figure for MB alkane behavioral experiments.

      Actually similar proportions of males performed antennation behavior towards female dummies with MB alkane fraction of fas5 RNAi females and CHC-cleared female dummies (55% and 50%, respectively, see Author response image 1 for the corresponding parts of the sub-figures 3 E and 4 D). We did not deem it necessary to show the same data on CHC-cleared female dummies in Figure 3 as well.

      Author response image 1.

      Unfortunately, the authors don't present experiments testing the effect of the non-MB alkanes fractions of the CHC extracts on male behavior toward females. As such, they are not able to (and didn't) conclude that the MB-alkane is necessary to trigger the sexual behaviors of males. I believe testing this would have significantly enhanced the significance of this work. I would also have found it interesting for the authors to comment on whether they observe aggressive behavior of males towards females (live or dead) and/or whether such behavior is expected or not in inter-individual interactions in parasitoids wasps.

      In our experiment, we focus on the function of the MB-alkane fraction in female CHC profiles, and we comprehensibly demonstrate in figure 4 that the MB-alkane fraction from WT females alone is sufficient to trigger mating behavior coherent with that on alive and untreated female dummies. Therefore, we do not completely understand the reviewer’s concern about us not being ” able to (and didn't) conclude that the MB-alkane is necessary to trigger the sexual behaviors of males”. We appreciate the suggestion from the reviewer of testing the non-MB alkanes (n-alkanes and n-alkenes). However, due to the experimental procedure of separating the CHC compound class fractions through elution with molecular sieves, it was not possible for us to retrieve either the whole n-alkane or n-alkene fraction remaining bound to the sieves after separation). The role of n-alkenes in N. vitripennis is however considered in the discussion, as a deterrent for homosexual interactions between males (Wang et al. 2022a). Moreover, we did not observe aggressive behavior of males towards live or dead females.

      CHCs are used by insects to signal and/or recognize various traits of targets of interest, including species or groups of origin, fertility, etc. The authors claim that their experiments show the sexual attractiveness of females can be encoded in the specific ratio of MB alkanes. While I understand how they come to this conclusion, I am somewhat concerned. The authors very quickly discuss their results in light of the literature about the role of CHCs (and notably MB alkanes) in various recognition behaviors in Hymenoptera, including conspecific recognition. Previous work (cited by the authors) has shown that males recognize males from females using an alkene (Z9C31). As such, it remains possible that the "sexual attractiveness" of N. vitripennis females for males relies on them not being males and being from the right species as well. The authors do not address the question of whether the CHCs (and the MB alkanes in particular) of females signal their sex or their species. While I acknowledge that responding to this question is beyond the scope of this work, I also strongly believe that it should be discussed in the manuscript. Otherwise, non-specialist readers would not be able to understand what I believe is one of the points that could temper the conclusions from this work.

      We acknowledge the reviewer’s insight about the MB alkanes in signaling sex or species in N. vitripennis, and now include this aspect in our revised discussion (line 324-330). Moreover, we clearly demonstrate that n-alkenes have been reduced to minute trace components after our compound class separation, and the males still do not display courtship and copulation behaviors similar to WT females, thus strongly indicating that the n-alkenes do not play a role when relying solely on the changed MB-alkane patterns, further strengthening our main argument.

      References

      Benjamini, Y. and D. Yekutieli. 2001. The control of the false discovery rate in multiple testing under dependency. Ann. Stat. 29:1165-1188.

      Buellesbach, J., J. Gadau, L. W. Beukeboom, F. Echinger, R. Raychoudhury, J. H. Werren, and T. Schmitt. 2013. Cuticular hydrocarbon divergence in the jewel wasp Nasonia: Evolutionary shifts in chemical communication channels? J. Evol. Biol. 26:2467-2478.

      Buellesbach, J., C. Greim, and T. Schmitt. 2014. Asymmetric interspecific mating behavior reflects incomplete prezygotic isolation in the jewel wasp genus Nasonia. Ethology 120:834-843.

      Buellesbach, J., H. Holze, L. Schrader, J. Liebig, T. Schmitt, J. Gadau, and O. Niehuis. 2022. Genetic and genomic architecture of species-specific cuticular hydrocarbon variation in parasitoid wasps. Proc. R. Soc. B 289:20220336.

      Engl, T., N. Eberl, C. Gorse, T. Krüger, T. H. P. Schmidt, R. Plarre, C. Adler, and M. Kaltenpoth. 2018. Ancient symbiosis confers desiccation resistance to stored grain pest beetles. Mol. Ecol. 27:2095-2108.

      Ferveur, J. F., J. Cortot, K. Rihani, M. Cobb, and C. Everaerts. 2018. Desiccation resistance: effect of cuticular hydrocarbons and water content in Drosophila melanogaster adults. Peerj 6.

      Lammers, M., K. Kraaijeveld, J. Mariën, and J. Ellers. 2019. Gene expression changes associated with the evolutionary loss of a metabolic trait: lack of lipogenesis in parasitoids. BMC Genom. 20:309.

      Mair, M. M., V. Kmezic, S. Huber, B. A. Pannebakker, and J. Ruther. 2017. The chemical basis of mate recognition in two parasitoid wasp species of the genus Nasonia. Entomol. Exp. Appl. 164:1-15.

      Wang, Y., W. Sun, S. Fleischmann, J. G. Millar, J. Ruther, and E. C. Verhulst. 2022a. Silencing Doublesex expression triggers three-level pheromonal feminization in Nasonia vitripennis males. Proc. R. Soc. B 289:20212002.

      Wang, Z., J. P. Receveur, J. Pu, H. Cong, C. Richards, M. Liang, and H. Chung. 2022b. Desiccation resistance differences in Drosophila species can be largely explained by variations in cuticular hydrocarbons. eLife 11:e80859.

    1. Author Response:

      Reviewer #1 (Public Review):

      The manuscript provides very high quality single-cell physiology combined with population physiology to reveal distinctives roles for two anatomically dfferent LN populations in the cockroach antennal lobe. The conclusion that non-spiking LNs with graded responses show glomerular-restricted responses to odorants and spiking LNs show similar responses across glomeruli generally supported with strong and clean data, although the possibility of selective interglomerular inhibition has not been ruled out. On balance, the single-cell biophysics and physiology provides foundational information useful for well-grounded mechanistic understanding of how information is processed in insect antennal lobes, and how each LN class contributes to odor perception and behavior.

      Thank you for this positive feedback.

      Reviewer #2 (Public Review):

      The manuscript "Task-specific roles of local interneurons for inter- and intraglomerular signaling in the insect antennal lobe" evaluates the spatial distribution of calcium signals evoked by odors in two major classes of olfactory local neurons (LNs) in the cockroach P. Americana, which are defined by their physiological and morphological properties. Spiking type I LNs have a patchy innervation pattern of a subset of glomeruli, whereas non-spiking type II LNs innervate almost all glomeruli (Type II). The authors' overall conclusion is that odors evoke calcium signals globally and relatively uniformly across glomeruli in type I spiking LNs, and LN neurites in each glomerulus are broadly tuned to odor. In contrast, the authors conclude that they observe odor-specific patterns of calcium signals in type II nonspiking LNs, and LN neurites in different glomeruli display distinct local odor tuning. Blockade of action potentials in type I LNs eliminates global calcium signaling and decorrelates glomerular tuning curves, converting their response profile to be more similar to that of type II LNs. From these conclusions, the authors infer a primary role of type I LNs in interglomerular signaling and type III LNs in intraglomerular signaling.

      The question investigated by this study - to understand the computational significance of different types of LNs in olfactory circuits - is an important and significant problem. The design of the study is straightforward, but methodological and conceptual gaps raise some concerns about the authors' interpretation of their results. These can be broadly grouped into three main areas.

      1) The comparison of the spatial (glomerular) pattern of odor-evoked calcium signals in type I versus type II LNs may not necessarily be a true apples-to-apples comparison. Odor-evoked calcium signals are an order of magnitude larger in type I versus type II cells, which will lead to a higher apparent correlation in type I cells. In type IIb cells, and type I cells with sodium channel blockade, odor-evoked calcium signals are much smaller, and the method of quantification of odor tuning (normalized area under the curve) is noisy. Compare, for instance, ROI 4 & 15 (Figure 4) or ROI 16 & 23 (Figure 5) which are pairs of ROIs that their quantification concludes have dramatically different odor tuning, but which visual inspection shows to be less convincing. The fact that glomerular tuning looks more correlated in type IIa cells, which have larger, more reliable responses compared to type IIb cells, also supports this concern.

      We agree with the reviewer that "the comparison of the spatial (glomerular) pattern of odor-evoked calcium signals is not necessarily a true apples-to-apples comparison". Type I and type II LNs are different neuron types. Given their different physiology and morphology, this is not even close to a "true apples-to-apples comparison" - and a key point of the manuscript is to show just that.

      As we have emphasized in response to Essential Revision 1, the differences in Ca2+ signals are not an experimental shortcoming but a physiologically relevant finding per se. These data, especially when combined with the electrophysiological data, contribute to a better understanding of these neurons’ physiological and computational properties.

      It is physiologically determined that the Ca2+ signals during odorant stimulation in the type II LNs are smaller than in type I LNs. And yes, the signals are small because small postsynpathetic Ca2+ currents predominantly cause the signals. Regardless of the imaging method, this naturally reduces the signal-to-noise ratio, making it more challenging to detect signals. To address this issue, we used a well-defined and reproducible method for analyzing these signals. In this context, we do not agree with the very general criticism of the method. The reviewer questions whether the signals are odorant-induced or just noise (see also minor point 12). If we had recorded only noise, we would expect all tuning curves (for each odorant and glomerulus) to be the same. In this context, we disagree with the reviewer's statement that the tuning curves do not represent the Ca2+ signals in Figure 4 (ROI 4 and 15) and Figure 5 (ROI 16 and 23). This debate reflects precisely the kind of 'visual inspection bias' that our clearly defined analysis aims to avoid. On close inspection, the differences in Ca2+ signals can indeed be seen. Figure II (of this letter) shows the signals from the glomeruli in question at higher magnification. The sections of the recordings that were used for the tuning curves are marked in red.

      Figure II: Ca2+ signals of selected glomeruli that were questioned by the reviewer.

      2) An additional methodological issue that compounds the first concern is that calcium signals are imaged with wide-field imaging, and signals from each ROI likely reflect out of plane signals. Out of plane artifacts will be larger for larger calcium signals, which may also make it impossible to resolve any glomerular-specific signals in the type I LNs.

      Thank you for allowing us to clarify this point. The reviewer comment implies that the different amplitudes of the Ca2+ signals indicate some technical-methodological deficiency (poorly chosen odor concentration). But in fact, this is a key finding of this study that is physiologically relevant and crucial for understanding the function of the neurons studied. These very differences in the Ca2+ signals are evidence of the different roles these neurons play in AL. The different signal amplitudes directly show the distinct physiology and Ca2+ sources that dominate the Ca2+ signals in type I and type II LNs. Accordingly, it is impractical to equalize the magnitude of Ca2+ signals under physiological conditions by adjusting the concentration of odor stimuli.

      In the following, we address these issues in more detail: 1) Imaging Method 2) Odorant stimulation 3) Cell type-specific Ca2+ signals

      1) Imaging Method:

      Of course, we agree with the reviewer comment that out-of-focus and out-of-glomerulus fluorescence can potentially affect measurements, especially in widefield optical imaging in thick tissue. This issue was carefully addressed in initial experiments. In type I LNs, which innervate a subset of glomeruli, we detected fluorescence signals, which matched the spike pattern of the electrophysiological recordings 1:1, only in the innervated glomeruli. In the not innervated ROIs (glomeruli), we detected no or comparatively very little fluorescence, even in glomeruli directly adjacent to innervated glomeruli.

      To illustrate this, FIGURE I (of this response letter) shows measurements from an AL in which an uniglomerular projection neuron was investigated in an a set of experiments that were not directly related to the current study. In this experiment, a train of action potential was induced by depolarizing current. The traces show the action potential induced fluorescent signals from the innervated glomerulus (glomerulus #1) and the directly adjacent glomeruli.

      These results do not entirely exclude that the large Ca2+ signals from the innervated LN glomeruli may include out-of-focus and out-of-glomerulus fluorescence, but they do show that the bulk of the signal is generated from the recorded neuron in the respective glomeruli.

      Figure I: Simultaneous electrophysiological and optophysiological recordings of a uniglomerular projection using the ratiometric Ca2+ indicator fura-2. The projection neuron has its arborization in glomerulus 1. The train of action potentials was induced with a depolarizing current pulse (grey bar).

      2) Odorant Stimulation: It is important to note that the odorant concentration cannot be varied freely. For these experiments, the odorant concentrations have to be within a 'physiologically meaningful' range, which means: On the one hand, they have to be high enough to induce a clear response in the projection neurons (the antennal lobe output). On the other hand, however, the concentration was not allowed to be so high that the ORNs were stimulated nonspecifically. These criteria were met with the used concentrations since they induced clear and odorant-specific activity in projection neurons.

      3) Cell type-specific Ca2+ signals:

      The differences in Ca2+ signals are described and discussed in some detail throughout the text (e.g., page 6, lines 119-136; page 9, lines 193-198; page 10-11, lines 226-235; page 14-15, line 309-333). Briefly: In spiking type I LNs, the observed large Ca2+ signals are mediated mainly by voltage-depended Ca2+ channels activated by the Na+-driven action potential's strong depolarization. These large Ca2+ signals mask smaller signals that originate, for example, from excitatory synaptic input (i.e., evoked by ligand-activated Ca2+ conductances). Preventing the firing of action potentials can unmask the ligand-activated signals, as shown in Figure 4 (see also minor comments 8. and 10.). In nonspiking type II LNs, the action potential-generated Ca2+ signals are absent; accordingly, the Ca2+ signals are much smaller. In our model, the comparatively small Ca2+ signals in type II LNs are mediated mainly by (synaptic) ligand-gated Ca2+ conductances, possibly with contributions from voltage-gated Ca2+ channels activated by the comparatively small depolarization (compared with type I LNs).

      Accordingly, our main conclusion, that spiking LNs play a primary role in interglomerular signaling, while nonspiking LNs play an essential role in intraglomeular signaling, can be DIRECTLY inferred from the differences in odorant induced Ca2+ signals alone.

      a) Type I LN: The large, simultaneous, and uniform Ca2+ signals in the innervated glomeruli of an individual type I LN clearly show that they are triggered in each glomerulus by the propagated action potentials, which conclusively shows lateral interglomerular signal propagation.

      b) Type II LNs: In the type II LNs, we observed relatively small Ca2+ signals in single glomeruli or a small fraction of glomeruli of a given neuron. Importantly, the time course and amplitude of the Ca2+ signals varied between different glomeruli and different odors. Considering that type II LNs in principle, can generate large voltage-activated Ca2+ currents (larger that type I LNS; page 4, lines 82-86, Husch et al. 2009a,b; Fusca and Kloppenburg 2021), these data suggest that in type II LNs electrical or Ca2+ signals spread only within the same glomerulus; and laterally only to glomeruli that are electrotonically close to the odorant stimulated glomerulus.

      Taken together, this means that our conclusions regarding inter- and intraglomerular signaling can be derived from the simultaneously recorded amplitudes and the dynamics of the membrane potential and Ca2+ signals alone. This also means that although the correlation analyses support this conclusion nicely, the actual conclusion does not ultimately depend on the correlation analysis. We had (tried to) expressed this with the wording, “Quantitatively, this is reflected in the glomerulus-specific odorant responses and the diverse correlation coefficiiants across…” (page 10, lines 216-217) and “ …This is also reflected in the highly correlated tuning curves in type I LNs and low correlations between tuning curves in type II LNs”(page 13, lines 293-295).

      3) Apart from the above methodological concerns, the authors' interpretation of these data as supporting inter- versus intra-glomerular signaling are not well supported. The odors used in the study are general odors that presumably excite feedforward input to many glomeruli. Since the glomerular source of excitation is not determined, it's not possible to assign the signals in type II LNs as arising locally - selective interglomerular signal propagation is entirely possible. Likewise, the study design does not allow the authors to rule out the possibility that significant intraglomerular inhibition may be mediated by type I LNs.

      The reviewer addresses an important point. However, from the comment, we get the impression that he/she has not taken into account the entire data set and the DISCUSSION. In fact, this topic has already been discussed in some detail in the original version (page 12, lines 268-271; page 15-16; lines 358-374). This section even has a respective heading: "Inter- and intraglomerular signaling via nonspiking type II LNs" (page 15, line 338). We apologize if our explanations regarding this point were unclear, but we also feel that the reviewer is arguing against statements that we did not make in this way.

      a) In 11 out of 18 type II LNs we found 'relatively uncorrelated' (r=0.43±0.16, N=11) glomerular tuning curves. These experiments argue strongly for a 'local excitation' with restricted signal propagation and do not provide support for interglomerular signal propagation. Thus, these results support our interpretation of intraglomerular signaling in this set of neurons.

      b) In 7 out of 18 experiments, we observed 'higher correlated' glomerular tuning curves (r=0.78±0.07, N=7). We agree with the reviewer that this could be caused by various mechanisms, including simultaneous input to several glomeruli or by interglomerular signaling. Both possibilities were mentioned and discussed in the original version of the manuscript (page 12, lines 268-271; page 15-16; lines 358-374). In the Discussion, we considered the latter possibility in particular (but not exclusively) for the type IIa1 neurons that generate spikelets. Their comparatively stronger active membrane properties may be particularly suitable for selective signal transduction between glomeruli.

      c) We have not ruled out that local signaling exists in type I LNs – in addition to interglomerular signaling. The highly localized Ca2+ signals in type I LNs, which we observed when Na+ -driven action potential generation was prevented, may support this interpretation. However, we would like to reiterate that the simultaneous electrophysiological and optophysiological recordings, which show highly correlated glomerular Ca2+ dynamics that match 1:1 with the simultaneously recorded action potential pattern, clearly suggest interglomerular signaling. We also want to emphasize that this interpretation is in agreement with previous models derived from electrophysiological studies(Assisi et al., 2011; Fujiwara et al., 2014; Hong and Wilson, 2015; Nagel and Wilson, 2016; Olsen and Wilson, 2008; Sachse and Galizia, 2002; Wilson, 2013).

      In light of the reviewer's comment(s), we have modified the text to clarify these points (page 14, lines 317-319).

      Reviewer #3 (Public Review):

      To elucidate the role of the two types of LNs, the authors combined whole-cell patch clamp recordings with calcium imaging via single cell dye injection. This method enables to monitor calcium dynamics of the different axons and branches of single LNs in identified glomeruli of the antennal lobe, while the membrane potential can be recorded at the same time. The authors recorded in total from 23 spiking (type I LN) and 18 non-spiking (type II LN) neurons to a set of 9 odors and analyzed the firing pattern as well as calcium signals during odor stimulation for individual glomeruli. The recordings reveal on one side that odor-evoked calcium responses of type I LNs are odor-specific, but homogeneous across glomeruli and therefore highly correlated regarding the tuning curves. In contrast, odor-evoked responses of type II LNs show less correlated tuning patterns and rather specific odor-evoked calcium signals for each glomerulus. Moreover the authors demonstrate that both LN types exhibit distinct glomerular branching patterns, with type I innervating many, but not all glomeruli, while type II LNs branch in all glomeruli.

      From these results and further experiments using pharmacological manipulation, the authors conclude that type I LNs rather play a role regarding interglomerular inhibition in form of lateral inhibition between different glomeruli, while type II LNs are involved in intraglomerular signaling by developing microcircuits in individual glomeruli.

      In my opinion the methodological approach is quite challenging and all subsequent analyses have been carried out thoroughly. The obtained data are highly relevant, but provide rather an indirect proof regarding the distinct roles of the two LN types investigated. Nevertheless, the conclusions are convincing and the study generally represents a valuable and important contribution to our understanding of the neuronal mechanisms underlying odor processing in the insect antennal lobe. I think the authors should emphasize their take-home messages and resulting conclusions even stronger. They do a good job in explaining their results in their discussion, but need to improve and highlight the outcome and meaning of their individual experiments in their results section.

      Thank you for this positive feedback.

      References:

      Assisi, C., Stopfer, M., Bazhenov, M., 2011. Using the structure of inhibitory networks to unravel mechanisms of spatiotemporal patterning. Neuron 69, 373–386. https://doi.org/10.1016/j.neuron.2010.12.019

      Das, S., Trona, F., Khallaf, M.A., Schuh, E., Knaden, M., Hansson, B.S., Sachse, S., 2017. Electrical synapses mediate synergism between pheromone and food odors in Drosophila melanogaster . Proc Natl Acad Sci U S A 114, E9962–E9971. https://doi.org/10.1073/pnas.1712706114

      Fujiwara, T., Kazawa, T., Haupt, S.S., Kanzaki, R., 2014. Postsynaptic odorant concentration dependent inhibition controls temporal properties of spike responses of projection neurons in the moth antennal lobe. PLOS ONE 9, e89132. https://doi.org/10.1371/journal.pone.0089132

      Fusca, D., Husch, A., Baumann, A., Kloppenburg, P., 2013. Choline acetyltransferase-like immunoreactivity in a physiologically distinct subtype of olfactory nonspiking local interneurons in the cockroach (Periplaneta americana). J Comp Neurol 521, 3556–3569. https://doi.org/10.1002/cne.23371

      Fuscà, D., and Kloppenburg, P. (2021). Odor processing in the cockroach antennal lobe-the network components. Cell Tissue Res.

      Hong, E.J., Wilson, R.I., 2015. Simultaneous encoding of odors by channels with diverse sensitivity to inhibition. Neuron 85, 573–589. https://doi.org/10.1016/j.neuron.2014.12.040

      Husch, A., Paehler, M., Fusca, D., Paeger, L., Kloppenburg, P., 2009a. Calcium current diversity in physiologically different local interneuron types of the antennal lobe. J Neurosci 29, 716–726. https://doi.org/10.1523/JNEUROSCI.3677-08.2009

      Husch, A., Paehler, M., Fusca, D., Paeger, L., Kloppenburg, P., 2009b. Distinct electrophysiological properties in subtypes of nonspiking olfactory local interneurons correlate with their cell type-specific Ca2+ current profiles. J Neurophysiol 102, 2834–2845. https://doi.org/10.1152/jn.00627.2009

      Nagel, K.I., Wilson, R.I., 2016. Mechanisms Underlying Population Response Dynamics in Inhibitory Interneurons of the Drosophila Antennal Lobe. J Neurosci 36, 4325–4338. https://doi.org/10.1523/JNEUROSCI.3887-15.2016

      Neupert, S., Fusca, D., Kloppenburg, P., Predel, R., 2018. Analysis of single neurons by perforated patch clamp recordings and MALDI-TOF mass spectrometry. ACS Chem Neurosci 9, 2089–2096.

      Olsen, S.R., Bhandawat, V., Wilson, R.I., 2007. Excitatory interactions between olfactory processing channels in the Drosophila antennal lobe. Neuron 54, 89–103. https://doi.org/10.1016/j.neuron.2007.03.010

      Olsen, S.R., Wilson, R.I., 2008. Lateral presynaptic inhibition mediates gain control in an olfactory circuit. Nature 452, 956–960. https://doi.org/10.1038/nature06864

      Sachse, S., Galizia, C., 2002. Role of inhibition for temporal and spatial odor representation in olfactory output neurons: a calcium imaging study. J Neurophysiol. 87, 1106–17.

      Shang, Y., Claridge-Chang, A., Sjulson, L., Pypaert, M., Miesenbock, G., 2007. Excitatory Local Circuits and Their Implications for Olfactory Processing in the Fly Antennal Lobe. Cell 128, 601–612.

      Wilson, R.I., 2013. Early olfactory processing in Drosophila: mechanisms and principles. Annu Rev Neurosci 36, 217–241. https://doi.org/10.1146/annurev-neuro-062111-150533

      Yaksi, E., Wilson, R.I., 2010. Electrical coupling between olfactory glomeruli. Neuron 67, 1034–1047. https://doi.org/10.1016/j.neuron.2010.08.041

    1. Author Response

      Public Evaluation Summary

      The authors aim to tackle a fundamental question with their study: whether there is a direct age-associated increase of transcriptional noise. To investigate this question, they develop tools to analyze single-cell sequencing data from mouse and human aging datasets. Ultimately, application of their novel tool (Scallop) suggests that transcriptional noise does not change with age, changes in transcriptional noise can be attributed to other sources such as subtle shifts in cell identity. This study is in principle of broad interest, but it currently lacks a definitive demonstration of the robustness of Scallop. Systematic testing of this new package would ultimately strengthen the key conclusion of the work and give additional users more confidence when using the tool to estimate expression noise.

      We have now attempted to further demonstrate the robustness of Scallop by performing a more systematic analysis and a side-by-side comparison to other existing methods using a set of artificially generated datasets. These analyses have resulted in the inclusion of six supplementary figures that are presented in the subsections Scallop membership score accurately identifies transcriptionally noisy cells, Ability to detect noisy cells within cell types, Effect of cellular composition, Effect of dataset size, Effect of feature expression and Effect of cell type marker expression within the Results section of the revised manuscript.

      We have also included a supplementary figure showing an in-depth analysis of a dataset where ageassociated increase in transcriptional noise was detected using alternative methods, but whose closer dissection has revealed that the difference in noise is due to a single donor and to the choice of methods. We discuss this is in the subsection Distance-to-centroid methods detect transcriptionally stable cell subtypes as transcriptional noise within the Results section.

      Finally, we have revised the manuscript to clarify the main points raised by the reviewers: the definition of transcriptional noise, the reasoning behind the choice of the single-cell aging datasets and Leiden’s rationale. Also, we have expanded the description of the method to make the definition of membership score more clear to the readers, and discussed the implications of our main findings (a lack of evidence for age-related transcriptional noise) in the broader context of theories of aging.

      Reviewer #1 (Public Review):

      In the present study, Ibanez-Sole et al evaluate transcriptional noise across aging and tissues in several publicly available mouse and human datasets. Initially, the authors compare 4 generalized approaches to quantify transcriptional noise across cell types and later implement a new approach which uses iterative clustering to assess cellular noise. Based on implementation of this approach (scallop), the authors survey noise across seven sc-seq datasets relevant for aging. Here, the authors conclude that enhanced transcriptional noise is not a hallmark of aging, rather changes in cell identity and abundances, namely immune and endothelial cells. The development of new tools to quantify transcriptional noise from sc-seq data presents appeal, as these datasets are increasing exponentially. Further, the conclusion that increased transcriptional noise is not a defined aspect of aging is clearly an important contribution; however, given the provocative nature of this claim, more comprehensive and systematic analyses should be performed. In particular, the robustness and appeal of scallop is still not sufficiently demonstrated and given the complexity (multiple tissues, species and diverse relative age ranges) of datasets analyzed, a more thorough comparison should be performed. I list a few thoughts below:

      Initially, the authors develop Decibel, which centralizes noise quantification methods. The authors provide schematics shown in Fig 1, and compare noise estimates with aging in Fig 2 - Supplement 2. Since the authors emphasize the necessary use of scallop as a ”better” pipeline, more systematic comparisons to the other methods should be made side-by-side.

      We thank the reviewer for their positive assessment of the manuscript and their suggestions. We agree that side-by-side benchmarking of Scallop with the methods implemented in Decibel, as well as a more thorough analysis on the effect of different features such as dataset size, cellular composition, etc. might have on the output of Scallop will reinforce the main points of the manuscript. To experimentally respond to these requests, we took advantage of a set of four artificial datasets previously generated by us with the R package splatter (v1.10.1; as described in Ascensión et al. [1]). In the present work, we first run a side-by-side comparison between Scallop and two distance-to-centroid (DTC) methods on the four artificial datasets with increasing degrees of transcriptional noise present in them (the novel data are included as Figure 1 – Figure supplement 1 in the revised manuscript). Then, we compared Scallop to one DTC method regarding their ability to detect noisy cells in different cell types (Figure 1 – Figure supplement 2). Finally, we implemented four simulations to test the effect of the following features on the performance of Scallop: cellular composition (Figure 1 – Figure supplement 3), dataset size (Figure 1 – Figure supplement 4), number of genes (Figure 1 – Figure supplement 5) and marker gene expression (Figure 1 – Figure supplement 6). A summary of these results follows.

      Side-by-side comparison of Scallop vs DTC methods

      Each of the four artificial datasets used consists of 10K cells, from 9 populations, named Group1 to Group9, with the following relative abundances: 25, 20, 15, 10, 10, 7, 5.5, 4, and 3.5%, respectively. The four datasets only differ in the de.prob parameter used in their generation. The de.prob parameter determines the probability that a gene is differentially expressed between subpopulations within the dataset. The greater the de.prob value, the more differentially expressed genes there will be between clusters, meaning that the different cell types present in the dataset will cluster in a more robust way. Decreasing the value of de.prob results in datasets with noisy cells, with populations that do not have such a strong transcriptional signature. In order to study how Scallop can capture the degree of robustness with which cells of the same cell type cluster together, we selected four de.prob values (0.05, 0.016, 0.01 and 0.005) and measured transcriptional noise using Scallop and two DTC methods, the whole transcriptome-based Euclidean distance to cell type mean and the invariant gene-based Euclidean distance to tissue mean expression. These two methods were selected because GCL does not yield a transcriptional noise measure per cell, so no comparisons can be made with respect to the amount of noisy cells the method is able to detect within a cluster. Similarly, comparing Scallop to the ERCC spike in-based method was not possible for artificial datasets. Importantly, these analyses showed that Scallop, unlike DTC methods, was able to discern between the core transcriptionally stable cells within each cell type cluster from the more noisy cells that lie in between clusters (provided in the Figure 1 - Supplement 1 of revised manuscript).

      Effect of dataset features on the performance of Scallop

      We simulated five artificial datasets with the same nine cell type populations but whose relative abundances were different between datasets. We used the imbalance degree (ID) to measure class imbalance in each of them and to make sure that the selected cell compositions represented a wide range of imbalance degrees (to this end, we explored ID values between 1.2 and 5.3). The ID provides a normalized summary of the extent of class imbalance in a dataset in so-called ”multiclass” settings, that is to say, where more than two classes are present. It was specifically developed to improve the commonly used imbalance ratio (IR) measurement, whose calculation only considers the abundance of the most and the least popular classes and which gives the same summary for datasets with different numbers of minority classes. The presence of multiple minority classes is not uncommon in single-cell RNAseq datasets, as tissues might contain several rare cell types. We observed that the transcriptional noise measurements provided by Scallop were very robust to changes in imbalance degree (see Figure 1 - Supplement 3), both in qualitative and in quantitative terms. For instance, Group2 and Group8 were always detected as the most stable and noisiest cell types, respectively, regardless of their relative abundance in the dataset, and their average percentage of noise had little variation between different ID values: it ranged between 0-0.14% (Group2) and 16-18% (Group8).

      The effect of dataset size (number of cells) and the number of genes was evaluated by generating versions of an artificial dataset where cells/genes had been subsampled from an original artificial dataset (the one generated with de.prob=0.001). We tested datasets sized 1,000-10,000 cells and with a number of genes between 5,000 and 14,000. Dataset size had nearly no impact on the transcriptional noise measurements provided by Scallop (Figure 1 - Supplement 4 of the revised manuscript). The average percentage of transcriptional noise per cell type remained within a narrow range as we implemented a ten-fold increase in dataset size. Perhaps more strikingly, removing the expression of most genes did not substantially impact transcriptional noise measurements per cell type (Figure 1 - Supplement 5). The variation when removing half of the genes (7,000 genes) was minimal, and we did not see important changes in transcriptional noise measurements unless over 60% of the genes from the original dataset were removed. For example, Figure 1 - Supplement 5C shows that noise measurements suffer important variations when removing 8,000 and 9,000 genes (and therefore keeping 6,000 and 5,000 genes, respectively), but only some cell types (Groups 4, 7, 8 and 9) were affected by these variations.

      In order to measure the effect marker gene expression has on the membership with which cells are assigned to their cell type cluster, we ran a simulation where the top 10 markers for a cell type were removed from the dataset one by one, so that the first simulation lacked the expression of the Top1 marker, the second simulation had the effect of the first 2 markers removed (Top1 and Top2), and so on. Then, we ran Scallop on each of the resulting datasets and observed a steady increase in transcriptional noise associated with that cell type. This provided evidence that the strength of cell type marker expression in a cluster is directly related to its transcriptional stability (or lack of transcriptional noise). We included the result of this experiment in the revised version of the manuscript (Figure 1 - Supplement 6).

      In conclusion, by using artificially generated datasets where the ground truth (cell type labels, degree of noise, etc) was known, the newly provided systematic analyses showed that Scallop had a remarkably robust response to said changes in dataset features, further reinforcing the manuscript conclusions.

      For example, scallop noise estimates (Fig 2) compared to other euclidean distance-based measures (Fig 2 supplement 2) looks fairly similar.

      It is true that some datasets show similar trends regardless of the transcriptional noise quantification method. For instance, the murine brain dataset by Ximerakis et al. shows no overall change in noise between the age groups across different methods. However, we do observe important differences in other examples. This is the case of the human pancreas dataset by Enge et al. and the human skin dataset by Solé-Boldo et al., where not only the magnitude but also the directionality of the trend are different depending on the method used to measure noise. In the former, three methods (Scallop, invariant gene-based Euclidean distance to average tissue expression and GCL) show an age-related increase in noise, whereas one method (whole transcriptome-based Euclidean distance to the cell type mean) shows a decrease in noise. In the latter, two methods (Scallop and GCL) yield a decrease in noise and the two DTC methods measure a mild increase in noise. These inconsistencies can now be reconciled with our proposed explanation that said ”noise” may actually be referring to substantially different biology in the diverse experimental settings.

      Are downstream observations (ex lung immune composition changes more than noise) supported from these methods as well? If so, this would strengthen the overall conclusion on noise with age, but if not, it would be relevant to understand why.

      Studying changes in cell type composition in the lung and other aged tissues would be highly pertinent. Nevertheless, we have measured changes in cell type composition using only one method that is based on Generalized Linear Models, covered in the subsection Age-related cell type enrichment of the Methods. The methods that we have compared in our study (DTC methods, ERCC-based methods, GCL, etc.) were all designed to measure transcriptional noise, but not changes in cell type composition.

      Whether the effects of cell type composition changes are bigger than changes in noise for the rest of the methods used to measure noise was probably not clear enough in the original manuscript. We found no evidence for an increase in noise associated with aging, regardless of the method used. Although not included in the manuscript, we did generate heatmaps similar to the one shown in Figure 3B for each of the noise quantification methods. However, as the heatmap on the right side (the one showing cell type enrichment) was identical in each figure, we considered them to be redundant and decided not to include them, since they did not provide any additional insight besides giving more examples of lack of evidence for transcriptional noise, this time at the cell type level. We consider that the lack of evidence was already well demonstrated in the previous analyses (Figure 2 and Figure 2 - Supplement 2.

      Similarly, the ’validation of scallop seems mostly based on the ability to localize noisy vs stable cells in Fig 1 supplement 1 and relative robustness within dataset to input parameters (Fig 1 supplement 2). A more systematic analysis should be performed to robustly establish this method. For example, noise cell clustering comparisons across the 7 datasets used. In addition, the Levy et all 2020 implemented a pathway-based approach to validate. Specifically, surrogate genes were derived from GCL value where KEGG preservation was used as an output. Similar additional types of analyses should be performed in scallop.

      We believe that this legitimate concern is now solved with the newly included data. In particular, with the systematic comparison between Scallop and DTC methods on three artificially generated datasets with different degrees of transcriptional noise provided in Figure 1 - Supplement 2. The ability of Scallop to detect cells that are particularly noisy within a cell type, or cells that lie between cell types, may represent its biggest advantage with respect to other methods. DTC methods fail to discern between stable and noisy cells within cell types. Also, in our analysis, DTC methods were unable to distinguish between cell types that have a marked transcriptional program (which systematically cluster together) and those that have a less clear transcriptomic identity (which have at least part of their cells be assigned to other cell types across bootstrap iterations). However, comparing the performance of Scallop on the same datasets showed that our method was able distinguish between the two cases.

      The conclusion that immune and endothelial cell transcriptional shifts associate more with age than noise are quite compelling, but seem entirely restricted to the mouse and human lung datasets. It would be interesting to know if pan-tissues these same cell types enrich age-related effects or whether this phenomenon is localized.

      We agree with the reviewer that it would be very interesting to see whether a change in cell type composition (and particularly, an increase in abundance of immune cell types) is observed in aged tissues other than the lung. Qualitative cell type composition changes in the aging lung have been described in the literature [5]. Specifically, the higher abundance of immune cell types was observed in a single-nucleus RNAseq dataset of cardiopulmonary cells in Macaca fascicularis [6]. However, we believe that trying to answer the question whether this phenomenon holds in other tissues would require a systematic analysis of several datasets for each tissue with a sufficient number of donors/individuals in each of them. This is because our approach to measure age-associated cell type enrichment using generalized linear models relies heavily on having multiple biological replicates for each age group. Unfortunately, this is not the case for most published single-cell RNAseq datasets of aging. In any case, we have toned down the last sentence in the subsection Changes in the abundance of the immune and endothelial cell repertoires characterize the human aging lung by making it more clear that our claim regarding changes in the cellular composition of aged tissues is based on lung datasets (the text in italics represents what was added in the revised version of the manuscript):

      "Even though the evidence for changes in tissue composition are based on a single tissue, we hypothesize that these facts may have influenced previous analyses of transcriptional noise associated with aging."

      As discussed in the original manuscript, there is evidence published by other groups pointing out to pantissue changes in cellular composition with age, which undoubtedly will influence those analyses that did not pay attention to cellular composition changes in the datasets that they compared. Cellular composition is in fact a very important aspect that has been greatly overlooked. In fact, only one [7] out of the seven articles that had measured transcriptional noise in aging (the datasets used in Figure 2) had attempted to remove its effect by subsampling cells to balance compositions between age groups prior to their noise analysis. In any case, we do not believe this is the only phenomenon underlying the purported increase in transcriptional noise associated with age. Each dataset will most probably have different issues that the authors originally misread as an increase in noise or loss of cellular identity of a particular organ or tissue. As an additional example of such phenomena, we have now included a re-analysis of the data by Enge et al. [3] on ”noisy” β-cells in the aged human pancreas (Figure 5–Figure supplement 2 of the revised manuscript). In this case, rather than observing an age-dependent pattern, the 21-year-old donor presents much lower transcriptional noise values than the rest of the donors. However, there is no significant difference between the 22-year-old donor and the rest of the donors. We conclude that the statistically significant differences between the ”young” and ”old” age categories can be attributed to the abnormal noise values obtained for the 21-year-old donor, of uncertain origin. Finding out all causes of apparent transcriptional noise in other organs and tissues would be too lengthy, and certainly out of scope for the present manuscript.

      Related to these, there does not seem to be a specific rationale for why these datasets (the seven used in total or the lung for deep-dive), were selected. Clearly, many mouse and human sc-RNA-seq datasets exist with large variations in age so expanding the datasets analyzed and/or providing sufficient rationale as to why these ones are appearing for noise analyses would be helpful. For example, querying ”aging” across sc-seq datasets in Single cell portal yields 79 available datasets: https://singlecell.broadinstitute. org/single_cell?type=study&page=1&terms=aging&facets=organism_age%3A0%7C103%7Cyears.

      We now realize that the reasoning behind our selection of aging datasets was not sufficiently clear in the original manuscript. We thank the reviewer for pointing out this omission. We have made a more explicit reference to Appendices 2, 3, 4 and 6 in the revised manuscript. The seven selected scRNAseq datasets are those where transcriptional noise had originally been measured by the authors, using the computational methods that we later implemented in Decibel. Our aim was to first recapitulate previous reports of transcriptional noise using our novel method (Scallop). Thus, we downloaded all publicly available scRNAseq datasets of aged tissues where transcriptional noise had explicitly been measured. Some of them had reported an increase in transcriptional noise only in some cell types (for instance, the human aged pancreas dataset by Enge et al. [3]), whereas others found an increase in most cell types [7]. Appendix 2 summarizes the main features of those seven datasets (tissue, organism and number of cells) and provides information on whether an increase in transcriptional noise was observed in the original article where they were published. Additionally, the ”scope” column indicates where that increase was found (in which cell types), and the ”Method” column briefly describes the computational method used to measure transcriptional noise in that article. Appendix 3 provides information on the final datasets that were used in our analysis (Figure 2). Not every sample from the original dataset was included, so the inclusion criteria are specified there, as well as the number of cells, individuals and age of each of the cohorts. Appendix 4 shows the abnormal count distribution of two samples that were discarded from the Kimmel lung dataset. As for the selection of lung for the deep dive, the reason was that this was the organ with most datasets available, both for mouse and human. Appendix 6 provides information on the number of cells and donors per age cohort in the human lung datasets included in this study.

      We have included the following sentence in the Increased transcriptional noise is not a universal hallmark of aging subsection in the Results:

      "We provide a summary of the main characteristics of each dataset, as well as the findings regarding transcriptional noise obtained in each of the original studies, whether changes in transcriptional noise were restricted to particular cell types, and the computational method used to measure noise (see Appendix 2)."

      The analysis that noise is indistinguishable from cell fate shifts is compelling, but again relies on one specific example where alternative surfactant genes are used as markers. The same question arises if this observation holds up to other cell types within other organs. For example the human cell atlas contains over dozens of tissue with large variations in age (https://www.science.org/doi/10.1126/science. abl4290).

      We sympathize with this comment but hope that the reviewer will agree with us that providing an additional example of different phenomena originally reported as ”transcriptional noise” (in this case in aged human pancreas; see Figure 5 – Figure supplement 2), but actually reflecting something else, may be sufficient to prevent interested readers. In our opinion, it is likely that diverse phenomena will underlie the purported increases in transcriptional noise, and a re-analysis should be made case-by-case. We can only hope that researchers in the field re-analyze the available aging datasets in this new light.

      Reviewer #2 (Public Review):

      In this manuscript, Ibanez-Sole et al. focus on an important open question in ageing research; ”how does transcriptional noise increase at the cellular level?”. They developed two python toolkits, one for comparison of previously described methods to measure transcriptional noise, Decibel, and another one implementing a new method of variability measure based on cluster memberships, Scallop. Using published datasets and comparing multiple methods, they suggest that increased transcriptional noise is not a fundamental property of ageing, but instead, previous reports might have been driven by age-related changes in cell type compositions.

      I would like to congratulate the authors on openly providing all code and data associated with the manuscript. The authors did not restrict their paper to one dataset or one approach but instead provided a comprehensive analysis of diverse biology across murine and human tissues.

      While the results support their main conclusions, the lack of robustness/sensitivity measures for the methods used makes it difficult to judge the biology.The authors use real data to compare between methods but using synthetic data with known artificial ’variability’ across cell clusters can first establish the methods, which would make the results more convincing and easier to interpret. Despite the comprehensive analysis of biological data, a detailed prior description of how the methods behave against e.g. the number of cells in each cell type cluster, the number of cell types in the dataset, and % feature expression, would make the paper more convincing. Once the details of the method is provided, the python toolkit can be widely used, not limited to the ageing research community. I am also concerned that a definition of ’transcriptional noise’ (e.g. genome-wide noise, transcriptional dysregulation in cell-type-specific genes, noise in certain pathways) and its interpretation with regard to the biology of ageing is missing. Differences in different methods could be explained by the different biology they capture. Moreover, the interpretation of a lack of different types of variability may not be the same for the biology of ageing.

      Increased transcriptional noise is compatible with genomic instability, loss of proteostasis and epigenetic regulation. Showing a lack of consistent transcriptional noise can challenge the widespread assumptions about how these hallmarks affect the organism. Overall, I found the paper very interesting and central to the field of ageing biology. However, I believe it requires a more detailed description of the methods and interpretations in the context of biology and theories of ageing.

      We thank the reviewer for their positive assessment of the manuscript and their suggestions. We respond to each of the specific comments below.

      Major comments

      1) The concept of transcriptional noise is central to the manuscript; however, what the authors consider as transcriptional noise and why is not clear. Genome-wide vs. function or cell-type specific noise could have different implications for the biology of ageing. In line with this, a discussion of the findings in the context of theories of ageing is necessary to understand its implications.

      We thank the reviewer for pointing out the lack of clarity in this key point. The use of the ”transcriptional noise” term in the literature is quite heterogeneous, and we agree that the lack of a consensus definition may be confusing to the reader. For this reason, we adopted in the introduction the definition by Raser and O’Shea [8] as ”the measured level of variation in gene expression among cells supposed to be identical”, i.e. the sum of both intrinsic and extrinsic noise as previously defined by Swain and colleagues [9, 10]. In our opinion, this is generally what the literature of age-associated transcriptional noise is referring to.

      With Scallop, we aimed to translate this concept to the context of single-cell RNAseq datasets, where clusters obtained using a community detection algorithm are typically annotated as distinct cell types.

      Therefore, we aimed to measure transcriptional noise here defined as ”lack of membership to cell type clusters”. When running a clustering algorithm iteratively, if a cell is not unambiguously assigned to the same cluster, we consider it to be noisy. Conversely, when a cell consistently clusters with the same group of cells, we consider it to be stable. The membership score we use as a measure of stability is the frequency with which any given cell was assigned to the same cluster across all iterations.

      We have included in the Results section an explicit reference to the Methods subsection that explains how Scallop works in detail, so that the readers can easily find that information:

      "A detailed description of the three steps of the method (bootstrapping, cluster relabeling and computation of the membership score) is provided in the Scallop subsection in the Methods."

      Additionally, we have now realized that the formula to compute the membership score might be more easily understood if we renamed the freq_score as freq_score(c), to make it clear that each cell is assigned a score. Also, we have used n and m instead of i and j in this notation, to avoid confusing the readers with the notation used in the previous section, where i and j represented the i-th and j-th bootstrap iterations. Finally, we have included a small paragraph to clarify what each component of the formula refers to. Below we show the formula and text included in the Methods section of the revised manuscript:

      "Where |cn| is the number of times cell c was assigned to the n-th cluster, and Pm∈clusters |cm| is the sum of all assignments made on cell c, which is the same as the number of times cell c was clustered across bootstrap iterations."

      Thus, and in order to accommodate this reviewer’s concerns, we have now included this exact definition of how we measure noise plus a statement making clear that we refer to the sum of both intrinsic and extrinsic noise aspects, with no distinction among them.

      Similarly, we had discussed our findings in the framework of different theories of aging, such as their potential relationship to some of the established hallmarks of aging (genomic instability, epigenetic deregulation and loss of proteostasis), as well as with more recent theories of aging such as cell type imbalance in aged organs [11] and inter-tissue convergence [12]. However, it is now clear to us that this was not enough so we have now expanded these paragraphs to make our understanding of the work implications better understood. More specifically:

      "Our results suggest that transcriptional noise is not a bona fide hallmark of aging. Instead, we posit that previous analyses of noise in aging scRNAseq datasets have been confounded by a number of factors, including both computational methods used for analysis as well as other biology-driven sources of variability."

      2) While I found the suggested method, Scallop, quite exciting and valuable, I would suggest including a number of performance/robustness measures (primarily based on simulations) on how sensitive the method is to the number of cells in each cell type (cellular composition), misannotations, % feature expression (number of 0s) etc.:

      We have analyzed the effect of cellular composition and the percentage of feature expression by using artificially generated datasets (see Figure 1 - Supplements 3 and 5, respectively; and section Effect of dataset features on the performance of Scallop in the response to reviewer #1). Although studying the effect of misannotations on downstream analysis is important, we believe that Scallop was already designed so that its effects could be avoided, since the membership is measured for each cluster (and not for each cell type label). That is to say, a reference clustering is obtained at the beginning of the pipeline and memberships are computed using that output as a reference, which means Scallop noise values attributed to each cell are not affected by the original labeling of the dataset.

      The output of these analyses reinforced our original conclusions, and it is now included in the Results section:

      "In order to characterize and validate our method for transcriptional noise quantification, we conducted three types of analyses. First, we used artificially generated datasets containing various degrees of transcriptional noise to compare the performance of Scallop and DTC methods side-by-side, regarding their ability to measure transcriptional noise and detect noisy cells within cell types. Next, we ran simulations using artificial datasets in order to study the effect of a number of dataset features on the performance of Scallop: cellular composition, dataset size, number of genes and marker expression. Finally, we graphically evaluated the output of Scallop on a dataset of human T cells, we analyzed its robustness to its input parameters, and we studied the relationship between membership and robust marker expression, using a PBMC dataset."

      2.1) Most importantly, knowing that cell-type composition changes with age, it is important to know how sensitive community detection is to the number of cells in each cell type. While the average can be robust, I wonder if the size of the cell-type cluster affects membership (voting).

      We have included an analysis on a set of artificial datasets with different cellular compositions to evaluate the performance of Scallop in the presence of different degrees of class imbalance (see Figure 1 - Supplement 3). We explain the output of this analysis, which reinforces the algorithm’s robustness, in the Results section:

      "Next, we ran a series of simulations on artificially generated datasets to evaluate the performance of Scallop in the presence of different levels of class imbalance, dataset size, number of genes, and different degrees of expression of cell type markers. Our analysis showed that Scallop was remarkably robust to changes in cellular composition (see Figure 1 - Supplement 3). Both the average percentage of noise and the distribution remained unchanged for a wide range of class imbalance degrees. Similarly, altering the dataset size (number of cells) and the number of genes of an artificial dataset did not cause any major changes on the transcriptional noise values attributed to each cell type (see Figure 1 - Supplements 4 and 5). Additionally, we conducted an analysis where we identified the 10 most differentially expressed gene markers for a cell type and measured the transcriptional noise associated with that cell type as we removed the expression of those genes from the dataset (Figure 1 - Supplement 5). Transcriptional noise steadily increased as we removed the effect of the top marker genes that defined the cell type under study (see Figure 1 - Supplement 5B). This experiment provides further evidence on how strong marker expression is related to robust cell type identity and how the lack of it results in transcriptional noise."

      3) Although the Leiden algorithm is widely used by many single-cell clustering methods, since the proposed methodology is heavily dependent on clustering, I suggest including a description of the Leiden algorithm.

      We agree that understanding how community detection algorithms in general –and Leiden in particular– work is crucial to understand the core of the paper, so we have included a brief introduction to these methods in the Methods section, at the beginning of the Scallop subsection:

      Leiden is a graph-based community detection algorithm that was designed to improve the popular Louvain method [13]. Graph-community detection methods take a graph representation of a dataset. In the context of single-cell RNAseq data, shared nearest neighbor (SNN) graphs are commonly used. These are graphs whose nodes represent individual cells and edges connect pairs of cells that are part of the K-nearest neighbors of each other by some distance metric. The aim of community detection algorithms like Leiden is to find groups of nodes that are densely connected between them, by optimizing modularity. For a graph with C communities, the modularity (Q) is computed by taking, for each community (group of cells), the difference between the actual number of edges in that community (ei) and the number of expected edges in that community ( K2/1/2m).

      Where r is a resolution parameter (r > 0) that controls for the amount of communities: a greater resolution parameter gives more communities whereas a low resolution parameter fewer clusters. Since maximizing the modularity of a graph is an NP-hard problem, different heuristics are used, and Leiden has shown to outperform Louvain in this task both in terms of quality and speed [14]. However, users can choose to run the Louvain method instead by setting the parameter clustering="louvain" in the initialization of the Bootstrap object.

      3.1) Most importantly, the authors comment that they found stronger expression of cell-type specific markers in the cells with high membership values - is it already a product of the Leiden algorithm that it weighs highly variable (thus cell-type specific) features higher - resulting in better prediction of cell-types for cells with strong cell-marker expression? It is important to make a description of transcriptional noise at this stage as it could be genome-wide or more specific to cell-type markers. Can authors provide any support that their method can capture both?

      We agree with the reviewer that finding a stronger expression of cell-type markers in cells with high membership values is indeed something we expected. The graph representation of the dataset taken as input by Leiden is built after running highly variable gene detection and PCA. The neighbors of each cell are detected based on the expression of genes that are highly variable, as the reviewer pointed out, so genes that are differentially expressed between cells are more likely to contribute to the clusters found by Leiden.

      Whether Scallop measures genome-wide or cell type-specific noise (or a mixture of both) is a very interesting question. Clusters in single-cell RNA sequencing datasets are often mainly driven by the presence/absence of a few cell type markers, rather than changes in expression levels of broader sets of genes. Moreover, it has been shown that single-cell RNAseq datasets generally preserve the same population structure even after data binarization [15]. This is a consequence of the sparsity of single-cell RNAseq datasets. In our case, any difference in expression between one cluster vs the rest of the cells in the dataset –be it the expression of a gene that was not detected in the rest of the cells or a higher expression of a gene whose presence is weaker in other clusters– will certainly have an impact on the output of every downstream analysis, from clustering to dimensionality reduction. The influence of the expression of cell type-specific markers on Scallop membership has been demonstrated in several analyses. First, the simulation where we measured the impact of removing the 10 most defining markers for a particular cell type on transcriptional noise measurements (included in the Figure 1 - Supplement 6 of the revised manuscript). Also, Figure 5 provides evidence that the differential expression of a handful of genes (in this case, genes coding for surfactant proteins) can have an impact on the clustering solutions obtained for a set of human alveolar macrophages, and this in turn influences the membership scores obtained with Scallop. In essence, Scallop merely provides a measure of the robustness of clustering at the single-cell level, so any type of transcriptional noise might have an impact on Scallop memberships, provided it is sufficiently strong to influence the output of the clustering algorithm used. In other words, the fact Scallop membership captures a mixture of both types of noise (genome-wide and that associated with cell type-specific markers) is a consequence of the influence both types of noise have on clustering.

      4) The authors conclude that Scallop outperforms other methods through the analysis of biological data, where there is no positive and negative control. I suggest creating synthetic datasets (which could be based on real data), introducing different levels of noise artificially (considering biological constraints like max/min expression levels) and then testing the performance where the truth about each dataset is known. Otherwise, the definitions of noisy and stable cells, regardless of the method, are arbitrary.

      Our initial focus was on biological datasets, were no positive and negative controls regarding transcriptional noise could be used, but we agree in the need of including an analysis using simulations on artificial datasets. We analyzed artificially generated datasets with known degrees of transcriptional noise in order to evaluate the performance of Scallop on a setting where the ground truth is known beforehand. The way we modeled transcriptional noise was by tuning the de.prob parameter, which determines the probability that a gene will be differentially expressed between clusters. The creation of these datasets is explained in detail in the Methods section of the revised manuscript, and specifically in the subsections Performance of Scallop and two DTC methods on four artificial datasets with increasing transcriptional noise. and Ability to detect noisy cells within cell types.

      We have now included the following section in the Results:

      "We compared the output of Scallop and two DTC methods (the whole transcriptome-based Euclidean distance to average cell type expression and the invariant gene-based Euclidean distance to average tissue expression) on four artificially generated datasets containing various levels of transcriptional noise. The analysis showed that Scallop, unlike DTC methods, was able to discern between the core transcriptionally stable cells within each cell type cluster from the more noisy cells that lie in between clusters (see Figure 1 - Supplement 1). We then compared one of the DTC methods to Scallop regarding their ability to detect noisy cells within each of the cell types, by plotting the top 10% noisiest and top 10% most stable cells and (see Figure 1 - Supplement 2A). Analyzing the distribution of noise values for each cell type separately revealed that Scallop can distinguish between clusters that mainly consist of transcriptionally stable cells from noisier clusters that do not have such a distinct transcriptional signature (Figure 1 - Supplement 2B."

      Reviewer #3 (Public Review):

      In this manuscript, Ibáñez-Solé et al aim to clarify the answer to a very basic and important question that has gained a lot of attention in the past ∼5 years due to fast-increasing pace of research in the aging field and development/optimization of single-cell gene expression quantification techniques: how does noise in gene expression change during the course of cellular/tissue aging? As the authors clearly describe, there have been multiple datasets available in the literature but one could not say the same for the number of available analysis pipelines, especially a pipeline that quantifies membership of single cells to their assigned cell type cluster. To address these needs, Ibáñez-Solé et al developed: 1. a toolkit (named Decibel) to implement the common methods for the quantification of age-related noise in scRNAseq data; and 2. a method (named Scallop) for obtaining membership information for single-cells regarding their assigned celltype cluster. Their analyses showed that previously-published aging datasets had large variability between tissues and datasets, and importantly the author’s results show that noise-increase in aging could not be claimed as a universal phenotype (as previously suggested by various studies).

      We thank the reviewer for their positive assessment of the manuscript and their suggestions.

      Comments:

      1) In two relevant papers (doi.org/10.1038/s41467-017-00752-9anddoi.org/10.1016/j.isci. 2018.08.011), previous work had already shown what haploid/diploid genetic backgrounds could show in terms of intercellular/intracellular noise. Due to the direct nature of age/noise quantification in these papers, one cannot blame any computational pipeline-related issues for the ”unconventional” results. The authors should cite and sufficiently discuss the noise-related results of these papers in their Discussion section. These two papers collectively show how the specific gene, its protein half-life and ploidy can lead to similar/different noise outcomes.

      We agree that we have failed to mention and sufficiently discuss the effects of measuring transcriptional noise from data generated via destructive experimentation, where no longitudinal analyses are possible. As aforementioned in the response to other reviewers, the body of literature on transcriptional noise is quite wide and based on heterogeneous assumptions. We have focused our efforts in measuring actual noise in scRNAseq aging datasets, which by definition imply sampling of different cells and thus make assumptions at the population level. We believe our results provide a different and interesting perspective into transcriptional noise and aging, but we agree with this reviewer in the need to discuss our findings in the context of other attempts to measure transcriptional noise in a more direct way. We have now included a brief discussion of the work by Sarnoski et al. and Liu et al.. This point is explained in more detail later in the letter.

      2) While the authors correctly put a lot of emphasis on studying the same cell type or tissue for a faithful interpretation of noise-related results, they ignore another important factor: tracking the same cell over time instead of calculating noise from single-cell populations at supposedly-different age points. Obviously, scRNAseq cannot analyze the same cell twice, but inability to assess noise-in-aging in the same cell over time is still an important concern. Noise could/does affect the generation durations and therefore neighboring cells in the same cluster may not have experienced the same amount of mitotic aging, for example. Also, perhaps a cell has already entered senescence at early age in the same tissue. This caveat should be properly discussed.

      The distinction between intrinsic and extrinsic noise and the impossibility to discern between the two in destructive experiments is a relevant point that we have now included in the Discussion (the newly added text is shown in italics):

      "Transcriptional noise could be related to genomic instability [18], epigenetic deregulation [19, 20] or loss of proteostasis [21], all established hallmarks of aging. Some authors consider transcriptional noise to be a hallmark of aging in and of itself [22]. In any case, the origin of transcriptional noise is unclear, as it could arise from many different sources. Most importantly, it not possible to distinguish between intrinsic and extrinsic noise from a snapshot of cellular states, i.e., one cannot tell whether the observed differences between cells in a single-cell RNA experiment reflect time-dependent variations in gene expression or differences between cells across a population [23]. Interestingly, recent work by Liu et al. measuring intrinsic noise in S. cerevisiae showed that aging is associated with a steady decrease in noise, with a sudden increase in soon-to-die cells. Another longitudinal study found an increase extrinsic noise and a lack of change in intrinsic noise in diploid yeast [16]."

      Regarding the caveat of cells of individuals in the Young groups showing signs of aging, we can only agree that this is correct: there will be cells sampled that already show signs of cellular damage in the absence of chronological aging. However this applies to every study of aging that samples cells in a destructive manner and it is generally assumed by the field that this is a discrete phenomenon that does not affect the overall results in a meaningful way.

      3) Another weakness of this study is that the authors did not show the source/cause of decreasing/stable/increasing noise during aging. Understanding the source of loss of cell type identity is also important but this manuscript was about noise in aging, so it would have been nice if there could be some attempts to explain why noise is having this/that trend in differentially aged cell types in specific tissues.

      The reviewer raises here a very important point that we would like to discuss in detail. The papers that we have re-analyzed generally assume that an increase in transcriptional noise and a loss in cell type identity are equivalent terms. However, as this reviewer points out, you could theoretically have cells that lose their cell type identity without a concomitant increase in transcriptional noise, for instance by a sharp decrease in a limited number of marker genes that collectively define that cell within a given cell type/cluster. Thus, transcriptional noise can certainly arise from different sources and several mechanisms have been proposed to explain its presence in the context of cellular aging. We agree with the reviewer that discussing how transcriptional noise could be related to aging is of interest to the readers. However, as pointed out in the responses to similar concerns by the other reviewers, our main finding is that we don’t detect meaningful and reliable increases in transcriptional noise associated with cell aging. Instead, what we see is a number of different technical and biological issues/phenomena that have been interpreted as transcriptional noise. We hope this reviewer will agree that the manuscript now presents a full and robust story and that finding the causes of up/down ”noise” trends in the different datasets may be more appropriately tackled by follow up studies.

      4) In the discussion section, the authors say that ”Most importantly, Scallop measures transcriptional noise by membership to cell type-specific clusters which is a re-definition of the original formulation of noise by Raser and O’Shea.” It is not clear what the authors refer to by ”the original formulation of noise by Raser and O’Shea”. Intrinsic/extrinsic noise formulations?? Please be more specific.

      We thank the reviewer for pointing this out, since we agree that the sentence needed to be reformulated for the sake of clarity. What we meant by the definition by Raser and O’Shea was ”the measured level of variation in gene expression among cells supposed to be identical”, which does not make any distinction between intrinsic and extrinsic noise. Since their definition is previous to the development of single-cell technologies, we meant to state our attempt to bring this classic concept to the context of single-cell RNAseq. Nowadays, cell clusters produced by a community detection algorithm are given cell type annotations depending on their expression of known cell type markers. What Scallop aims to measure is the extent of membership each individual cell has for their cluster as evidence of its transcriptional stability. In order to make this point more clear, we have now rewritten the paragraph as follows:

      Most importantly, Scallop measures transcriptional noise by membership to cell type-specific clusters which is a re-definition of the original formulation of noise by Raser and O’Shea: measurable variation among cells that should share the same transcriptome. This is in stark contrast to measurements of noise including other phenomena (as demonstrated in Figure 5) by the distance-to-centroid methods prevalent in the literature.

      References

      [1] M. Alex Ascensión, Olga Ibáñez-Solé, Iñaki Inza, Ander Izeta, and Marcos J Araúzo-Bravo. Triku: A feature selection method based on nearest neighbors for single-cell data. GigaScience, 11, 2022. doi: 10.1093/gigascience/giac017.

      [2] M. Ximerakis, S. L. Lipnick, B. T. Innes, S. K. Simmons, X. Adiconis, D. Dionne, B. A. Mayweather, L. Nguyen, Z. Niziolek, C. Ozek, V. L. Butty, R. Isserlin, S. M. Buchanan, S. S. Levine, A. Regev, G. D. Bader, J. Z. Levin, and L. L. Rubin. Single-cell transcriptomic profiling of the aging mouse brain. Nat Neurosci, 22(10), 2019. doi: https://doi:10.1038/s41593-019-0491-3.

      [3] M. Enge, H. E. Arda, M. Mignardi, J. Beausang, R. Bottino, S. K. Kim, and S. R. Quake. Single-cell analysis of human pancreas reveals transcriptional signatures of aging and somatic mutation patterns. Cell, 171(2), 2017. doi: https://doi:10.1016/j.cell.2017.09.004.

      [4] L. Solé-Boldo, G. Raddatz, and S. et al. Schütz. Single-cell transcriptomes of the human skin reveal age-related loss of fibroblast priming. Commun Biol, 3(188), 2020. doi: https://doi.org/10.1038/ s42003-020-0922-4.

      [5] Jaime L. Schneider, Jared H. Rowe, Carolina Garcia-de Alba, Carla F. Kim, Arlene H. Sharpe, and Marcia C. Haigis. The aging lung: Physiology, disease, and immunity. Cell, 184(8):1990–2019, 2021. doi: 10.1016/j.cell.2021.03.005.

      [6] Shuai Ma, Shuhui Sun, Jiaming Li, Yanling Fan, Jing Qu, Liang Sun, Si Wang, Yiyuan Zhang, Shanshan Yang, Zunpeng Liu, and et al. Single-cell transcriptomic atlas of primate cardiopulmonary aging. Cell Research, 31(4):415–432, 2020. doi: 10.1038/s41422-020-00412-6.

      [7] I. Angelidis, L. M. Simon, and I. E. et al. Fernandez. An atlas of the aging lung mapped by single cell transcriptomics and deep tissue proteomics. Nature Communications, 2019. doi: https://doi.org/10. 1038/s41467-019-08831-9.

      [8] Jonathan M. Raser and Erin K. O’Shea. Noise in gene expression: origins, consequences, and control. Science, 309(5743):2010–2013, 2005. doi: 10.1126/science.1105891.

      [9] Michael B. Elowitz, Arnold J. Levine, Eric D. Siggia, and Peter S. Swain. Stochastic gene expression in a single cell. Science, 297:1183– 1186, 2002. doi: 10.1126/science.1070919.

      [10] Peter S. Swain, Michael B. Elowitz, and Eric D. Siggia. Intrinsic and extrinsic contributions to stochasticity in gene expression. Proc Natl Acad Sci U S A., 99:12795–12800, 2002. doi: 10.1073/pnas.162041399.

      [11] Alex Cagan, Adrian Baez-Ortega, Natalia Brzozowska, Federico Abascal, Tim H. H. Coorens, Mathijs A. Sanders, Andrew R. J. Lawson, Luke M. R. Harvey, Shriram Bhosle, David Jones, Raul E. Alcantara, Timothy M. Butler, Yvette Hooks, Kirsty Roberts, Elizabeth Anderson, Sharna Lunn, Edmund Flach, Simon Spiro, Inez Januszczak, Ethan Wrigglesworth, Hannah Jenkins, Tilly Dallas, Nic Masters, Matthew W. Perkins, Robert Deaville, Megan Druce, Ruzhica Bogeska, Michael D. Milsom, Björn Neumann, Frank Gorman, Fernando Constantino-Casas, Laura Peachey, Diana Bochynska, Ewan St. John Smith, Moritz Gerstung, Peter J. Campbell, Elizabeth P. Murchison, Michael R. Stratton, and Iñigo Martincorena. Somatic mutation rates scale with lifespan across mammals. Nature, 604: 517–524, 2022. doi: 10.1038/s41586-022-04618-z.

      [12] Hamit Izgi, Dingding Han, Ulas Isildak, Shuyun Huang, Ece Kocabiyik, Philipp Khaitovich, Mehmet Somel, and Handan Melike Dönertas. Inter-tissue convergence of gene expression during ageing suggests age-related loss of tissue and cellular identity. eLife, 11, 2022. doi: 10.7554/eLife.68048.

      [13] Vincent D Blondel, Jean-Loup Guillaume, Renaud Lambiotte, and Etienne Lefebvre. Fast unfolding of communities in large networks. Journal of Statistical Mechanics: Theory and Experiment, 2008(10): P10008, oct 2008. doi: 10.1088/1742-5468/2008/10/p10008. URL https://doi.org/10.1088/ 1742-5468/2008/10/p10008.

      [14] V. A. Traag, L. Waltman, and N. J. van Eck. From louvain to leiden: guaranteeing well-connected communities. Scientific Reports, 9, 2019. doi: https://doi.org/10.1038/s41598-019-41695-z.

      [15] Peng Qiu. Embracing the dropouts in single-cell rna-seq analysis. Nature Communications, 11(1), 2020. doi: 10.1038/s41467-020-14976-9.

      [16] Ethan A. Sarnoski, Ruijie Song, Ege Ertekin, Noelle Koonce, and Murat Acar. Fundamental characteristics of single-cell aging in diploid yeast. iScience, 7:96–109, 2018. doi: 10.1016/j.isci.2018.08.011.

      [17] Ping Liu, Ruijie Song, Gregory L. Elison, Weilin Peng, and Murat Acar. Noise reduction as an emergent property of single-cell aging. Nature Communications, 8(1), 2017. doi: 10.1038/s41467-017-00752-9.

      [18] Jan Vijg. From dna damage to mutations: All roads lead to aging. Ageing Res Rev., 68(101316), 2021. doi: 10.1016/j.arr.2021.101316.

      [19] Yuancheng Lu, Benedikt Brommer, Xiao Tian, Anitha Krishnan, Margarita Meer, Chen Wang, Daniel L. Vera, Qiurui Zeng, Doudou Yu, Michael S. Bonkowski, Jae-Hyun Yang, Songlin Zhou, Emma M. Hoffmann, Margarete M. Karg, Michael B. Schultz, Alice E. Kane, Noah Davidsohn, Ekaterina Korobkina, Karolina Chwalek, Luis A. Rajman, George M. Church, Konrad Hochedlinger, Vadim N. Gladyshev, Steve Horvath, Morgan E. Levine, Meredith S. Gregory-Ksander, Bruce R. Ksander, Zhigang He, and David A. Sinclair. Reprogramming to recover youthful epigenetic information and restore vision. Nature, 588(7836):124–129, 2020. doi: 10.1038/s41586-020-2975-4.

      [20] Giorgio Oliviero, Sergey Kovalchuk, Adelina Rogowska-Wrzesinska, Veit Schwämmle, and Ole N. Jensen. Distinct and diverse chromatin proteomes of ageing mouse organs reveal protein signatures that correlate with physiological functions. eLife, 11(e73524), 2022. doi: 10.7554/eLife.73524.

      [21] Jingyi Li, Yuxuan Zheng, Pengze Yan, Moshi Song, Si Wang, Liang Sun, Zunpeng Liu, Shuai Ma, Juan Carlos Izpisua Belmonte, Piu Chan, Qi Zhou, Weiqi Zhang, Guang-Hui Liu, Fuchou Tang, and Jing Qu. A single-cell transcriptomic atlas of primate pancreatic islet aging. Natl Sci Rev., 8(2): nwaa127, 2020. doi: 10.1093/nsr/nwaa127.

      [22] Alexander R. Mendenhall, George M. Martin, Matt Kaeberlein, and Rozalyn M. Anderson. Cellto-cell variation in gene expression and the aging process. Geroscience, 43(1):181–196, 2021. doi: 10.1007/s11357-021-00339-9.

      [23] Lucy Ham, Marcel Jackson, and Michael PH Stumpf. Pathway dynamics can delineate the sources of transcriptional noise in gene expression. eLife, 10, 2021. doi: 10.7554/elife.69324.

    1. Author Response

      Reviewer #1 (Public Review):

      The authors start the study with an interesting clinical observation, found in a small subset of prostate cancers: FOXP2-CPED1 fusion. They describe how this fusion results in enhanced FOXP2 protein levels, and further describe how FOXP2 increases anchorageindependent growth in vitro, and results in pre-malignant lesions in vivo. Intrinsically, this is an interesting observation. However, the mechanistic insights are relatively limited as it stands, and the main issues are described below.

      Main issues:

      1) While the study starts off with the FOXP2 fusion, the vast majority of the paper is actually about enhanced FOXP2 expression in tumorigenesis. Wouldn't it be more logical to remove the FOXP2 fusion data? These data seem quite interesting and novel but they are underdeveloped within the current manuscript design, which is a shame for such an exciting novel finding. Along the same lines, for a study that centres on the prostate lineage, it's not clear why the oncogenic potential of FOXP2 in mouse 3T3 fibroblasts was tested.

      We thank the reviewer very much for the comment. We followed the suggestion and added a set of data regarding the newly identified FOXP2 fusion in Figure 1 to make our manuscript more informative. We tested the oncogenic potential of FOXP2 in NIH3T3 fibroblasts because NIH3T3 cells are a widely used model to demonstrate the presence of transformed oncogenes2,3. In our study, we observed that when NIH3T3 cells acquired the exogenous FOXP2 gene, the cells lost the characteristic contact inhibition response, continued to proliferate and eventually formed clonal colonies. Please refer to "Answer to Essential Revisions #1 from the Editors” for details.

      2) While the FOXP2 data are compelling and convincing, it is not clear yet whether this effect is specific, or if FOXP2 is e.g. universally relevant for cell viability. Targeting FOXP2 by siRNA/shRNA in a non-transformed cell line would address this issue.

      We appreciate these helpful comments. Please refer to the "Answer to Essential Revisions #1 from the Editors” for details.

      3) Unfortunately, not a single chemical inhibitor is truly 100% specific. Therefore, the Foretinib and MK2206 experiments should be confirmed using shRNAs/KOs targeting MEK and AKT. With the inclusion of such data, the authors would make a very compelling argument that indeed MEK/AKT signalling is driving the phenotype.

      We thank the reviewer for highlighting this point and we agree with the reviewer’s point that no chemical inhibitor is 100% specific. In this study, we used chemical inhibitors to provide further supportive data indicating that FOXP2 confers oncogenic effects by activating MET signaling. We characterized a FOXP2-binding fragment located in MET and HGF in LNCaP prostate cancer cells by utilizing the CUT&Tag method. We also found that MET restoration partially reversed oncogenic phenotypes in FOXP2-KD prostate cancer cells. All these data consistently supported that FOXP2 activates MET signaling in prostate cancer. Please refer to the "Answer to Essential Revisions #2 from the Editors” and to the "Answer to Essential Revisions #7 from the Editors” for details.

      4) With the FOXP2-CPED1 fusion being more stable as compared to wild-type transcripts, wouldn't one expect the fusion to have a more severe phenotype? This is a very exciting aspect of the start of the study, but it is not explored further in the manuscript. The authors would ideally elaborate on why the effects of the FOXP2-CPED1 fusion seem comparable to the FOXP2 wildtype, in their studies.

      We thank the reviewer very much for the comment. We had quantified the number of colonies of FOXP2- and FOXP2-CPED1-overexpressing cells, and we found that both wildtype FOXP2 and FOXP2-CPED1 had a comparable putative functional influence on the transformation of human prostate epithelial cells RWPE-1 and mouse primary fibroblasts NIH3T3 (P = 0.69, by Fisher’s exact test for RWPE-1; P = 0.23, by Fisher’s exact test for NIH3T3). We added the corresponding description to the Results section in Line 487 on Page 22 in the tracked changes version of the revised manuscript. Please refer to the "Answer to Essential Revisions #5 from the Editors” for details.

      5) The authors claim that FOXP2 functions as an oncogene, but the most-severe phenotype that is observed in vivo, is PIN lesions, not tumors. While this is an exciting observation, it is not the full story of an oncogene. Can the authors justifiably claim that FOXP2 is an oncogene, based on these results?

      We appreciate the comment, and we made the corresponding revision in the revised manuscript. Please refer to the "Answer to Essential Revisions #3 from the Editors” for details.

      6) The clinical and phenotypic observations are exciting and relevant. The mechanistic insights of the study are quite limited in the current stage. How does FOXP2 give its phenotype, and result in increased MET phosphorylation? The association is there, but it is unclear how this happens.

      We appreciate this valuable suggestion. In the current study, we used the CUT&Tag method to explore how FOXP2 activated MET signaling in LNCaP prostate cancer cells, and we identified potential FOXP2-binding fragments in MET and HGF. Therefore, we proposed that FOXP2 activates MET signaling in prostate cancer through its binding to MET and METassociated gene. Please refer to the "Answer to Essential Revisions #2 from the Editors” for details.

      Reviewer #2 (Public Review):

      1) The manuscript entitled "FOXP2 confers oncogenic effects in prostate cancer through activating MET signalling" by Zhu et al describes the identification of a novel FOXP2CPED1 gene fusion in 2 out of 100 primary prostate cancers. A byproduct of this gene fusion is the increased expression of FOXP2, which has been shown to be increased in prostate cancer relative to benign tissue. These data nominated FOXP2 as a potential oncogene. Accordingly, overexpression of FOXP2 in nontransformed mouse fibroblast NIH-3T3 and human prostate RWPE-1 cells induced transforming capabilities in both cell models. Mechanistically, convincing data were provided that indicate that FOXP2 promotes the expression and/or activity of the receptor tyrosine kinase MET, which has previously been shown to have oncogenic functions in prostate cancer. Notably, the authors create a new genetically engineered mouse model in which FOXP2 is overexpressed in the prostatic luminal epithelial cells. Overexpression of FOXP2 was sufficient to promote the development of prostatic intraepithelial neoplasia (PIN) a suspected precursor to prostate adenocarcinoma and activate MET signaling.

      Strengths:

      This study makes a convincing case for FOXP2 as 1) a promoter of prostate cancer initiation and 2) an upstream regulator of pro-cancer MET signaling. This was done using both overexpression and knockdown models in cell lines and corroborated in new genetically engineered mouse models (GEMMs) of FOXP2 or FOXP2-CPED1 overexpression in prostate luminal epithelial cells as well as publicly available clinical cohort data.

      Major strengths of the study are the demonstration that FOXP2 or FOXP2-CPED1 overexpression transforms RWPE-1 cells to now grow in soft agar (hallmark of malignant transformation) and the creation of new genetically engineered mouse models (GEMMs) of FOXP2 or FOXP2-CPED1 overexpression in prostate luminal epithelial cells. In both mouse models, FOXP2 overexpression increased the incidence of PIN lesions, which are thought to be a precursor to prostate cancer. While FOXP2 alone was not sufficient to cause prostate cancer in mice, it is acknowledged that single gene alterations causing prostate cancer in mice are rare. Future studies will undoubtedly want to cross these GEMMs with established, relatively benign models of prostate cancer such as Hi-Myc or Pb-Pten mice to see if FOXP2 accelerates cancer progression (beyond the scope of this study).

      We appreciate these positive comments from the reviewer. We agree with the suggestion from the reviewer that it is worth exploring whether FOXP2 is able to cooperate with a known disease driver to accelerate the progression of prostate cancer. Therefore, we are going to cross Pb-FOXP2 transgenic mice with Pb-Pten KO mice to assess if FOXP2 is able to accelerate malignant progression.

      2) Weaknesses: It is unclear why the authors decided to use mouse fibroblast NIH3T3 cells for their transformation studies. In this regard, it appears likely that FOXP2 could function as an oncogene across diverse cell types. Given the focus on prostate cancer, it would have been preferable to corroborate the RWPE-1 data with another prostate cell model and test FOXP2's transforming ability in RWPE-1 xenograft models. To that end, there is no direct evidence that FOXP2 can cause cancer in vivo. The GEMM data, while compelling, only shows that FOXP2 can promote PIN in mice and the lone xenograft model chosen was for fibroblast NIH-3T3 cells.

      To determine the oncogenic activity of FOXP2 and the FOXP2-CPDE1 fusion, we initially used mouse primary fibroblast NIH3T3 for transformation experiments, because NIH3T3 cells are a widely used cell model to discover novel oncogenes2,3,10,11. Subsequently, we observed that overexpression of FOXP2 and its fusion variant drove RWPE-1 cells to lose the characteristic contact inhibition response, led to their anchorage-independent growth in vitro, and promoted PIN in the transgenic mice. During preparation of the revised manuscript, we tested the transformation ability of FOXP2 and FOXP2-CPED1 in RWPE1 xenograft models. We subcutaneously injected 2 × 106 RWPE-1 cells into the flanks of NOD-SCID mice. The NODSCID mice were divided into five groups (n = 5 mice in each group): control, FOXP2overexpressing (two stable cell lines) and FOXP2-CPED1- overexpressing (two cell lines) groups. The experiment lasted for 4 months. We observed that no RWPE-1 cell-injected mice developed tumor masses. We propose that FOXP2 and its fusion alone are not sufficient to generate the microenvironment suitable for RWPE-1-xenograft growth. Collectively, our data suggest that FOXP2 has oncogenic potential in prostate cancer, but is not sufficient to act alone as an oncogene.

      3) There is a limited mechanism of action. While the authors provide correlative data suggesting that FOXP2 could increase the expression of MET signaling components, it is not clear how FOXP2 controls MET levels. It would be of interest to search for and validate the importance of potential FOXP2 binding sites in or around MET and the genes of METassociated proteins. At a minimum, it should be confirmed whether MET is a primary or secondary target of FOXP2. The authors should also report on what happened to the 4-gene MET signature in the FOXP2 knockdown cell models. It would be equally significant to test if overexpression of MET can rescue the anti-growth effects of FOXP2 knockdown in prostate cancer cells (positive or negative results would be informative).

      We appreciate all the valuable comments. As suggested, we performed corresponding experiments, please refer to the " Answers to Essential Revisions #2 from the Editors”, to the "Answer to Essential Revisions #6 from the Editors”, and to the "Answer to Essential Revisions #7 from the Editors” for details.

      Reviewer #3 (Public Review):

      1) In this manuscript, the authors present data supporting FOXP2 as an oncogene in PCa. They show that FOXP2 is overexpressed in PCa patient tissue and is necessary and sufficient for PCa transformation/tumorigenesis depending on the model system. Overexpression and knock-down of FOXP2 lead to an increase/decrease in MET/PI3K/AKT transcripts and signaling and sensitizes cells to PI3K/AKT inhibition.

      Key strengths of the paper include multiple endpoints and model systems, an over-expression and knock-down approach to address sufficiency and necessity, a new mouse knock-in model, analysis of primary PCa patient tumors, and benchmarking finding against publicly available data. The central discovery that FOXP2 is an oncogene in PCa will be of interest to the field. However, there are several critically unanswered questions.

      1) No data are presented for how FOXP2 regulates MET signaling. ChIP would easily address if it is direct regulation of MET and analysis of FOXP2 ChIP-seq could provide insights.

      2) Beyond the 2 fusions in the 100 PCa patient cohort it is unclear how FOXP2 is overexpressed in PCa. In the discussion and in FS5 some data are presented indicating amplification and CNAs, however, these are not directly linked to FOXP2 expression.

      3) There are some hints that full-length FOXP2 and the FOXP2-CPED1 function differently. In SF2E the size/number of colonies between full-length FOXP2 and fusion are different. If the assay was run for the same length of time, then it indicates different biologies of the overexpressed FOXP2 and FOXP2-CPED1 fusion. Additionally, in F3E the sensitization is different depending on the transgene.

      We appreciate these valuable comments and constructive remarks. As suggested, we performed the CUT&Tag experiments to detect the binding of FOXP2 to MET, and to examine the association of CNAs of FOXP2 with its expression. Please refer to the " Answer to Essential Revisions #2 from the Editors" and the " Answer to Essential Revisions #4 from the Editors" for details. We also added detailed information to show the resemblance observed between FOXP2 fusion- and wild-type FOXP2-overexpressing cells. We added the corresponding description to the Results section in Line 487 on Page 22 in the tracked changes version of the revised manuscript. Please refer to the “Answer to Essential Revisions #5 from the Editors” for details.

      2) The relationship between FOXP2 and AR is not explored, which is important given 1) the critical role of the AR in PCa; and 2) the existing relationship between the AR and FOXP2 and other FOX gene members.

      We thank the reviewer very much for highlighting this point. We agree that it is important to examine the relationship between FOXP2 and AR. We therefore analyzed the expression dataset of 255 primary prostate tumors from TCGA and observed that the expression of FOXP2 was significantly correlated with the expression of AR (Spearman's ρ = 0.48, P < 0.001) (Figure 1. a). Next, we observed that both FOXP2- and FOXP2-CPED1overexpressing 293T cells had a higher AR protein abundance than control cells (Figure 1. b). In addition, shRNA-mediated FOXP2 knockdown in LNCaP cells resulted in a decreased AR protein level compared to that in control cells (Figure 1. c). However, we analyzed our CUT&Tag data and observed no binding of FOXP2 to AR (Figure 1. d). Our data suggest that FOXP2 might be associated with AR expression.

      Figure 1. a. AR expression in a human prostate cancer dataset (TCGA, Prostate Adenocarcinoma, Provisional; n = 493) classified by FOXP2 expression level (bottom 25%, low expression, n = 120; top 25%, high expression, n = 120; negative expression, n = 15). P values were calculated by the MannWhitney U test. The correlation between FOXP2 and AR expression was evaluated by determining the Spearman's rank correlation coefficient. b. Immunoblot analysis of the expression levels of AR in 293T cells with overexpression of FOXP2 or FOXP2-CPED1. c. Immunoblot analysis of the expression levels of AR in LNCaP cells with stable expression of the scrambled vector or FOXP2 shRNA. d. CUT&Tag analysis of FOXP2 association with the promoter of AR. Representative track of FOXP2 at the AR gene locus is shown.

      Reference

      1. Mayr C, Bartel DP. Widespread shortening of 3'UTRs by alternative cleavage and polyadenylation activates oncogenes in cancer cells. Cell. 2009 Aug 21;138(4):673-84.
      2. Gara SK, Jia L, Merino MJ, Agarwal SK, Zhang L, Cam M et al., Germline HABP2 Mutation Causing Familial Nonmedullary Thyroid Cancer. N Engl J Med. 2015 Jul 30;373(5):448-55.
      3. Kohno T, Ichikawa H, Totoki Y, Yasuda K, Hiramoto M, Nammo T et al., KIF5B-RET fusions in lung adenocarcinoma. Nat Med. 2012 Feb 12;18(3):375-7.
      4. Chen F, Byrd AL, Liu J, Flight RM, DuCote TJ, Naughton KJ et al., Polycomb deficiency drives a FOXP2-high aggressive state targetable by epigenetic inhibitors. Nat Commun. 2023 Jan 20;14(1):336.
      5. Kaya-Okur HS, Wu SJ, Codomo CA, Pledger ES, Bryson TD, Henikoff JG et al., CUT&Tag for efficient epigenomic profiling of small samples and single cells. Nat Commun. 2019 Apr 29;10(1):1930.
      6. Spiteri E, Konopka G, Coppola G, Bomar J, Oldham M, Ou J et al., Identification of the transcriptional targets of FOXP2, a gene linked to speech and language, in developing human brain. Am J Hum Genet. 2007 Dec;81(6):1144-57.
      7. Lai CS, Fisher SE, Hurst JA, Vargha-Khadem F, Monaco AP. A forkhead-domain gene is mutated in a severe speech and language disorder. Nature. 2001 Oct 4;413(6855):519-23.
      8. Hannenhalli S, Kaestner KH. The evolution of Fox genes and their role in development and disease. Nat Rev Genet. 2009 Apr;10(4):233-40.
      9. Shu W, Yang H, Zhang L, Lu MM, Morrisey EE. Characterization of a new subfamily of winged-helix/forkhead (Fox) genes that are expressed in the lung and act as transcriptional repressors. J Biol Chem. 2001 Jul 20;276(29):27488-97.
      10. Wang C, Liu H, Qiu Q, Zhang Z, Gu Y, He Z. TCRP1 promotes NIH/3T3 cell transformation by over-activating PDK1 and AKT1. Oncogenesis. 2017 Apr 24;6(4):e323.
      11. Suh YA, Arnold RS, Lassegue B, Shi J, Xu X, Sorescu D et al., Cell transformation by the superoxide-generating oxidase Mox1. Nature. 1999 Sep 2;401(6748):79-82.
    1. Author Response:

      Reviewer #3:

      Weaknesses:

      Previously it was suggested that mitochondrial biogenesis was increased with increased levels of GJA1-20k. Is this a difference in the cellular model (HEK) and do the changes in cell culture accurately recapitulate the changes seen in animals?

      The Reviewer is correct that GJA1-20k did not alter the mitochondrial biogenesis in HEK293 cells (Figure 1–figure supplement 2) whereas AAV9-transduced adult cardiomyocytes showed increased mitochondrial DNA copy number (Figure 1–figure supplement 2C), consistent with our previous study (Basheer et al., JCI insight, 2018). We expect that increased mitochondrial biogenesis is a function of chronic GJA1-20k overexpression in vivo, and thus a separate phenomenon from the acute mitochondrial fission which occurs within one minute of GJA1-20k accumulation around a mitochondrion (Figure 4). The HEK cell line, in which overexpressed GJA1-20k is present for a much shorter time, does not induce mitochondrial biogenesis (Figure 1–figure supplement 2), and thus is an excellent cellular model in which we can study GJA1-20k induced fission.

      The revised manuscript has been modified to include the above new data (Figure 1–figure supplement 2) and discussion:

      —Results section (lines 121 – 129): Previously we reported that GJA1-20k is involved in mitochondrial biogenesis (Basheer, Fu et al. 2018). Consistent with our previous study, AAV9-transduced adult cardiomyocytes showed increased mitochondrial DNA copy number and GJA1-20k deficient mice (Gja1M213L/M213L) had decreased copy number. However, exogenous GJA1-20k did not alter the mitochondrial biogenesis in HEK293 cells. Nor did exogenous GJA1-20k affect membrane potential or baseline ATP production (Figure 1–figure supplement 2A–C). In addition to mitochondrial DNA copy number, neither biogenesis nor mitophagy protein markers were altered in either GJA1-20k transfected HEK293 cells or Gja1M213L/M213L mouse hearts (Figure 1–figure supplement 2D – G).

      —Discussion section (lines 289 – 292): Yet the presence of GJA1-20k, while inducing mitochondrial fission and smaller mitochondria (Figure 1, 3 and 4), does not either reduce MFN1 or MFN2, activate DRP1, change membrane potential, ATP production, mitochondrial biogenesis, or mitophagy (Figure 2; Figure 1 – figure supplement 2).

      Mdivi-1 is not a selective Drp1 inhibitor. It is a Complex I inhibitor, leading to unintended changes in mitochondrial dynamics in response to ETC stress. Rather than Mdivi-1, a dominant negative Drp1 mutant K38A could be overexpressed to see whether this prevents GJA1-20k-mediated fission. If it still goes through, then I agree that Drp1 is not involved at all.

      We appreciate Reviewer #3’s thoughtful suggestion and, in this revised manuscript, we studied mitochondrial morphology in the presence of K38A. As seen in Figure 2C and D of the revised manuscript, K38A elongated mitochondria, as expected from inhibited Drp1 mediated fission. However, despite Drp1 inhibition by K38A, in the presence of GJA1-20k, mitochondria remain small, further supporting that GJA1-20k-mediated fission is DRP1-independent.

      —Results section (lines 140 – 150): To further investigate whether GJA1-20k induced reduction in mitochondrial size is dependent on DRP1, we analyzed mitochondrial morphology after inhibiting DRP1 by performing siRNA- mediated DRP1 knock-down (Figure 2—figure supplement 1A–C) or transfecting DRP1 dominant negative mutant (K38A), all with or without GJA1-20k transfection. With either method of DRP1 inhibition, the average area of individual mitochondria increased, consistent with inhibiting canonical fission (Figure 2C, D). In addition, K38A has more pronounced DRP1 inhibition which resulted in greater mitochondrial enlargement than siDRP1 (Figure 2C, D; Figure 2—figure supplement 1F). However, GJA1-20k acts epistatically to DRP1 loss or interference and prevents DRP1-mediated mitochondrial enlargement (Figure 2C–F; Figure 2— figure supplement 1B, C), indicating GJA1-20k can act at or downstream of DRP1.

      For the kinetics studies (see Fig 4), I think it is important to measure the timing of the actin recruitment and eventual fission when Drp1 is knocked down and/or when a DN mutant (K38A) is involved. Again, I do not trust the chemical inhibitor (Mdivi-1) data since this does not inhibit Drp1 activity.

      We would like to thank Reviewer #3 for suggesting we use an additional method of inhibiting Drp1. We analyzed real time actin dynamics under direct DRP1 knock-down. As seen in Mdivi-1 treatment, GJA1- 20k accumulated and then actin assembled around mitochondria and induced fission under DRP1 knockdown (Figure 4 and Video 1 of revised manuscript). The kinetic parameters of fission were also similar between Drp1 knockdown and Mdivi-1 treatment. The original Figure 4 and Video 1 and 2 have been moved to Figure 4–figure supplement 1 and Video 2 and 3, respectively, in order to accommodate the new Drp1 knockdown data (Figure 4 and Video 1).

      The revised manuscript has been modified to include the above new data (Figure 4; Video 1):

      —Results section (lines 198 – 219): Simultaneous use of fluorescently labelled actin, GJA1-20k, and mitochondria in live cells permit real time imaging of mitochondrial fission events at actin assembly sites. As seen in Video 1 and Figure 4B, GJA1-20k recruits actin to mitochondria, which results in fission. In Video 1, the actin network can be seen to develop around mitochondria and, coinciding with GJA1-20k intensity, forms an increasingly tight band across a mitochondrion which, within one minute, results in mitochondrial fission. The imaging in the bottom row of Figure 4B, and in the right column of Video 1 were obtained by multiplying GJA1-20k signal with actin signal, highlighting the locations at which GJA1-20k and actin are coincident. The respective line-scan profiles in Figure 4C indicate that mitochondrial fission occurs at points where the product of GJA1-20k and actin is the highest. Following accumulation of GJA1-20k and actin (red lines) at these points, a drop in mitochondrial signal (blue lines) is apparent when fission occurs. Fission (low point of blue lines) occurs approximately 45 seconds after co-accumulation of GJA1-20k and actin (high point of red lines, Figure 4C). Time to fission was computed from the time of peak GJA1-20k and actin intensity product, to the time of mitochondrial signal being reduced to background (Figure 4D–F). Statistically, this time to fission occurred at a median of 45 seconds, with a standard deviation of 11 seconds (Figure 4G). Note, the real time imaging shown in Video 1, and Figure 4 were performed under siDRP1. Therefore, the mitochondrial fission induced by cooperation between GJA1-20k and actin can be independent of canonical DRP1-mediated fission. To rule out inadvertent bias by siRNA, we used pharmacologic Mdivi-1 to inhibit DRP1 and, similar to the use of DRP1 siRNA, actin formed around mitochondria at GJA1-20k sites (Figure 4—figure supplement 1A–D) and fission occurred within a similar timescale (Video 2 and 3; Figure 4— figure supplement 1E–H).

      The assessment of the impact of ischemic stress with the heterozygous animal (M213L/WT) is hard to interpret. How reduced is the expression of GJA1-20k in these animals and how is mitochondrial function impacted based on Seahorse analysis? The mitochondrial morphology is not altered in these animals, so would mitochondrial function be largely unchanged as well? It is not clear how much GJA1-20k is needed to observe changes in mitochondrial shape and function, and comparisons with the homozygous mutant (M213L/M213L) are not the same, making it difficult to resolve the interpretation of these data.

      We appreciate Reviewer #3’s thoughtful and valuable comments. We previously reported that the heterozygous mutant (M213L/WT) expresses approximately half of GJA1-20k compared to WT (Figure 1 in Xiao and Shimura et al., J Clin Invest, 2020). Unfortunately, homozygous mutants die before adulthood, preventing effective comparison of GJA1-20k content on mitochondrial function in adult cardiomyocytes. To compare the impact of the amount of endogenous GJA1-20k on mitochondrial function, we added seahorse data from heterozygous neonatal CMs (Figure 5 C, D) and compared these data to seahorse data from neonatal cardiomyocytes from both wildtype and homozygous mutants. Even though there was no significant difference in mitochondrial size between WT and M213L/WT (Figure 5I, J; Figure 5–figure supplement 1A, B) under basal conditions, the seahorse OCR levels from M213L/WT myocytes is in between that of WT and homozygous (M213L/M213L) (Figure 5 C, D; Figure 5–figure supplement 1C) cardiomyocytes. Since GJA1-20k is a stress responsive peptide which increases under ischemic stress, in the present manuscript, we should like to emphasize that even a partial (50%) decrease in GJA1-20k expression induces mitochondrial fragility to oxidative stress. As shown in new Figure 5 I – L of the revised manuscript, the heterozygous mutant (M213L/WT) has more elongated mitochondria and a high distribution of damaged mitochondria post-I/R compared to WT, consistent with TTC staining, even with no change in mitochondrial size under basal conditions.

      The revised manuscript has been modified to include the above new data (Figure 5; Figure 5–figure supplement 1) and discussion:

      —Results section (lines 227 – 233) Similarly, maximal respiration is increased in neonatal CMs derived from GJA1-20k deficient Gja1M213L/M213L mice and maximal respiration for heterozygous Gja1M213L/WT mice is between that of WT and Gja1M213L/M213L (Figure 5C, D; Figure 5—figure supplement 1A, B). In addition, observing other OCR parameters, we found a decrease in ATP-linked respiration and reserve capacity in Gja1M213L/WT cardiomyocytes, and an increase in proton leak and non-mitochondrial respiration in Gja1M213L/M213L suggesting that there can be compensatory long-term effects of the Gja1 mutation (Figure 5—figure supplement 1C).

      —Results section (lines 241 – 250) However, remarkably, reduced GJA1-20k expression results in an almost complete cardiac infarction after I/R injury (Figure 5E, F). Moreover, ROS production after I/R injury was increased in Gja1M213L/WT mice compared to WT post-I/R (Figure 5G, H). There was no significant difference in mitochondria size at the basal condition between WT and Gja1M213L/WT mice adult CMs as with neonatal CMs (Figure 5I, J), whereas the mitochondria size was significantly increased after I/R injury and the heterozygous Gja1M213L/WT mice had larger mitochondria compared to WT mice post-I/R (Figure 5I, J). Interestingly, the area of mitochondrial matrix was also increased, suggesting loss of cristae in Gja1M213L/WT mice heart (Figure 5K, L). These data indicate that even partial deletion of GJA1-20k results in a profoundly impaired response to ischemic stress.

      —Discussion section (lines 350 – 357) Because GJA1-20k-induced fission is associated with less ROS production with oxidative stress (Figure 5 – figure supplement 1D, E), the endogenous generation of GJA1-20k and subsequent decreased ROS production could explain a major benefit of pre-conditioning. Of note, genetic GJA1-20k reduction increases infarct size and ROS production post-I/R injury (Figure 5E–H). In addition, the population of damaged mitochondria is significantly increased in heterozygous Gja1M213L/WT mouse heart post-I/R (Figure 5I–L). Therefore, GJA1-20k induced decreases in ROS production could limit the amount of I/R injury induced by myocardial infarction.

      It is still unclear to me how GJA1-20k is affecting mitochondrial size and function. Based on previous papers, this peptide localizes to the surface of mitochondria, but it is not clear how, or whether, it directly facilitates actin recruitment. The interplay with the endoplasmic reticulum (ER), which can nucleate actin at sites of mitochondrial fission, was not examined. If actin is driving membrane remodeling, is it mediated by ER crossover at these sites?

      We appreciate Reviewer #3’s thoughtful comment and suggestion. Our unpublished data indicate that GJA1-20k has an actin-binding domain, suggesting direct binding and actin dynamics regulation. As shown in Figure 3 in the present study, GJA1-20k recruits actin around mitochondria membrane and their interaction resulted in fission. In addition, as the Reviewer suggested, our preliminary data showed significant increase in ER network in GJA1-20k-transfected cells (Figure below). Therefore, there is the possibility that ER is also involved in GJA1-20k mediated mitochondrial fission, while further research will be required to reveal the detailed mechanisms. In the present manuscript, we would like to focus on the finding that actin is necessary for GJA1-20k-mediated mitochondrial fission but not DRP1.

      ER network association with mitochondria is increased in GJA1-20k-transfected cells. Left: Representative fixed cell images of HEK293 cells with GFP-tagged GST or GJA1-20k. ER and mitochondria were labeled by Protein disulfide-isomerase (PDI) and Tom20, respectively. Right: The quantification of Pearson’s correlation between PDI and mitochondria. The graph is expressed as mean ± SD. p values were determined by two-tailed Mann-Whitney U-test. ***p < 0.001.

      We have updated the Discussion section to point to this excellent consideration in the future.

      —Discussion section (lines 299 – 302) In addition to actin, the endoplasmic reticulum (ER) membrane can be involved in mitochondrial scission (Friedman, Lackner et al. 2011, Tandler, Hoppel et al. 2018). Future studies should be considered whether GJA1-20k induced actin cytoskeleton arrangements involves ER membrane as well.

    1. Author Response

      Reviewer #2 (Public Review):

      This paper by Angueyra, et al., adds to the field’s current understanding of photoreceptor specification and factors regulating opsin expression in vertebrates. Current models of specification of vertebrate photoreceptors are largely based on studies of mammals. However, a great number of animals including teleosts express a wider array of photoreceptor subtypes. Zebrafish for example have 4 distinct cone subtypes and rods. The approach is sound and the data are quite convincing. The only minor weaknesses are that the statistical analyses need to be revisited and the discussion should be a bit more focused.

      To identify differentially expressed transcription factors, the authors performed bulk RNA-seq of pooled, hand-sorted photoreceptors. The selection criterion was tightly controlled to limit unhealthy cells and cellular debris from other photoreceptors subtypes. The pooling of cells provided a considerable depth of sequencing, orders of magnitude better than scSeq. The authors identified known transcription factors and several that appear to be novel or their role has not been determined. The data are made available on the PIs website as is a program to access and compare the gene expression data.

      The authors then used CRISPR/Cas9 gene targeting of two known and several novel factors identified in their analysis for effects on cell fate decisions and opsin expression. Phenotyping performed on the injected larvae is possible, and the target genes were applied and sequenced to demonstrate the efficiency of the gene targeting. Targeting of 2 genes with know functions in photoreceptor specification in zebrafish, Tbx2b and Foxq2 resulted in the anticipated changes in cell fate, albeit, the strength of the alterations in cell fate in the F0 larvae appears to be less than the published phenotypes for the inherited alleles. Interestingly, the authors also identified the expression of an RH2 opsin in the SWS2 another cone type. The changes are subtle but important.

      The authors then targeted tbx2a, the function of which was not known. The result is quite interesting as it matches the increase of rods and decrease of UV cones observed in tbx2b mutants. However, the injected animals also showed RH2 opsin expression but are now in the LWS cone subtype. These data suggest that Tbx2 transcription factors repress misexpression of opsins in the wrong cell type.

      The authors also show that targeting additional differentially expressed factors does not affect photoreceptor fate or survival in the time frame investigated. These are important data to present. For these or any of the other targeted genes above, did the authors test for changes in photoreceptor number or survival?

      We have attempted to address this point, but the answer is not clear cut. We used activated caspase-3 inmmunolabeling as a marker of apoptosis (Lusk and Kwan 2022). At 5 dpf, the age we chose to make quantifications, we don’t see an increase in activated caspase-3 positive cells when we compare control and tbx2a F0 mutants (Reviewer Figure 1A-B). Labeled cells are very rare and located near the ciliary marginal zone irrespective of genotype. This suggests that there is no detectable active death at this late stage of development in tbx2 F0 mutants. Earlier in development, at 3 dpf, when photoreceptor subtypes first appear, there is also a normal wave of apoptosis in the retina (Blume et al. 2020; Biehlmaier, Neuhauss, and Kohler 2001), resulting in many cells positive for activated caspase-3; our preliminary quantifications don’t show a marked increase in the number of labeled cells in tbx2a F0 mutants, but we consider that it’s likely that subtle effects might be obscured by the physiological wave of apoptosis (Reviewer Figure 1C-D).

      Reviewer Figure 1 - Assessment of apoptosis in tbx2a F0 mutants. (A-B) Confocal images of 5 dpf larval eyes of control (A and A’) and tbx2a F0 mutants (B and B’) counterstained with DAPI (grey) and immunolabeled against activated Caspase 3 (yellow) show sparse and dim labeling, restricted to cells located in the ciliary marginal zone, without clear differences between groups. (C-D) Confocal images of 3 dpf larval eyes of control (C and C’) and tbx2a F0 mutants (D and D’) immunolabeled against activated Caspase 3 show many positive cells, located in all retinal layers, as expected from physiological apoptosis at this stage of development and without clear differences between groups.

      Furthermore, the additional single-cell RNA-seq datasets we have reanalyzed suggest that tbx2a and tbx2b are expressed by other retinal neurons and progenitors and not just photoreceptors (Reviewer Figure 2), further confounding attempts at the quantification of apoptosis specifically in photoreceptor progenitors.

      Reviewer Figure 2 – Expression of tbx2 paralogues across retinal cell types. The transcription factors tbx2a and tbx2b are expressed by many retinal cells. Plots show average counts across clusters in RNA-seq data obtained by Hoang et al. (2020).

      At this stage, we consider that fully resolving this issue is important and will require considerably more work, which we will pursue in the future using full germline mutants and live-imaging experiments.

      Reviewer #3 (Public Review):

      Angueyra et al. tried to establish the method to identify key factors regulating fate decisions in the retinal visual photoreceptor cells by combining transcriptomic and fast genome editing approaches. First, they isolated and pooled five subtypes of photoreceptor cells from the transgenic lines in each of which a specific subtype of photoreceptor cells are labeled by fluorescence protein, and then subjected them to RNA-seq analyses. Second, by comparing the transcriptome data, they extracted the list of the transcription factor genes enriched in the pooled samples. Third, they applied CRISPR-based F0 knockout to functionally identify transcription factor genes involved in cell fate decisions of photoreceptor subtypes. To benchmark this approach, they initially targeted foxq2 and nr2e3 genes, which have been previously shown to regulate S-opsin expression and S-cone cell fate (foxq2) and to regulate rhodopsin expression and rod fate (nr2e3). They then targeted other transcription factor genes in the candidate list and found that tbx2a and tbx2b are independently required for UV-cone specification. They also found that tbx2a expressed in the L-cone subtype and tbx2b expressed in L-cones inhibit M-opsin gene expression in the respective cone subtypes. From these data, the authors concluded that the transcription factors Tbx2a and Tbx2b play a central role in controlling the identity of all photoreceptor subtypes within the retina.

      Overall, the contents of this manuscript are well organized and technically sound. The authors presented convincing data, and carefully analyzed and interpreted them. It includes an evaluation of the presented data on cell-type specific transcriptome by comparing it with previously published ones. I think the current transcriptomic data will be a valuable platform to identify the genes regulating cell-type specific functions, especially in combination with the fast CRISPR-based in vivo screening methods provided here. I hope that the following points would be helpful for the authors to improve the manuscript appropriately.

      1) The manuscript uses the word “FØ” quite often without any proper definition. I wonder how “Ø” should be pronounced - zero or phi? This word is not common and has not been used in previous publications. I feel the phrase “F0 knockout,” which was used in the paper cited by the authors (Kroll et al 2021), is more straightforward. If it is to be used in the manuscript, please define “FØ” and “CRISPR-FØ screening” appropriately, especially in the abstract.

      We have made changes to replace “FØ” to “F0.” In our other citation (Hoshijima et al., 2019), “F0 embryo” was used throughout the paper. Following our references and Dr Kojima’s suggestion, we adopted “F0 mutant larva” as the most straightforward and less confusing term. We have also made changes in the abstract to define our approach more clearly and made appropriate changes throughout the manuscript.

      2) Figure 1-supplement 1 shows that opn1mw4 has quite high (normalized) FPKM in one of the S-cone samples in contrast to the least (or no) expression in the M-cone samples, in which opn1mw4 is expected to be detected. The authors should address a possible origin of this inconsistent result for opn1mw4 expression as well as a technical limitation of using the Tg(opn1mw2:egfp) line for detection of opn1mw4 expression in the GFP-positive cells.

      In Figure 1 - Supplement 1, we had attempted to provide a summarized figure of all phototransduction genes, but the big differences in expression levels — in particular, the high expression of opsins genes — forced us to use gene-by-gene normalization for display. Without normalization, the expression of opn1mw4 is very low across all samples, and its detection in that sole S-cone sample can likely be attributed to some degree of inherent noise in our methods. We have revised Figure 1 - Supplement 1: we find that we can avoid gene-by-gene normalization and still provide a good summary of the expression of phototransduction genes if the heatmap is broken down by gene families, which have more similar expression levels. In addition, we have added caveats to the use of the Tg(opn1mw2:egfp) line as our sole M-cone marker in the results section describing our RNA-seq approach, including our inability to provide data on Opn1mw4-expressing M cones.

      3) The manuscript lacks a description of the sampling time point. It is well known that many genes are expressed with daily (or circadian) fluctuation (cf. Doherty & Kay, 2010 Annu. Rev. Genet.). For example, the cone-specific gene list in Fig.2C includes a circadian clock gene, per3, whose expression was reported to fluctuate in a circadian manner in many tissues of zebrafish including the retina (Kaneko et al. 2006 PNAS). It appears to be cone-specific at this time point of sample collection as shown in Fig.2, but might be expressed in a different pattern at other time points (eg, rod expression). The authors should add, at least, a clear description of the sampling time points so as to make their data more informative.

      We have included this information in the materials and methods. We collected all our samples during the most active peak of the zebrafish circadian rhythm between 11am and 2pm (3h to 6h after light onset) to avoid the influence of circadian fluctuations in our analysis.

    1. Author Response:

      Reviewer #1:

      The largest concern with the manuscript is its use of resting-state recordings in Parkinson's Disease patients on and off levodopa, which the authors interpret as indicative of changes in dopamine levels in the brain but not indicative of altered movement and other neural functions. For example, when patients are off medication, their UPDRS scores are elevated, indicating they likely have spontaneous movements or motor abnormalities that will likely produce changed activations in MEG and LFP during "rest". Authors must address whether it is possible to study a true "resting state" in unmedicated patients with severe PD. At minimum this concern must be discussed in the manuscript.

      We agree that Parkinson’s disease can lead to unwanted movements such as tremor as well as hyperkinesias. This would of course be a deviation from a resting state in healthy subjects. However, such movements are part of the disease and occur unwillingly. The main tremor in Parkinson’s disease is a rest tremor and - as the name already suggests – it occurs while not doing anything. Therefore, such movements can arguably be considered part of the resting state of Parkinson’s disease. Resting state activity with and without medication is therefore still representative for changes in brain activity in Parkinson’s patients and indicative of alterations due to medication.

      To further investigate the effect of movement in our patients, we subdivided the UPDRS part 3 score into tremor and non-tremor subscores. For the tremor subscore we took the mean of item 15 and 17 of the UPDRS, whereas for the non-tremor subscore items 1, 2, 3, 9, 10, 12, 13, and 14 were averaged. Following Spiegel et al., 2007, we classified patients as akinetic-rigid (non-tremor score at least twice the tremor score), tremor-dominant (tremor score at least twice as large as the non-tremor score), and mixed type (for the remaining scores). Of the 17 patients, 1 was tremor dominant and 1 was classified as mixed type (his/her non-tremor score was greater than tremor score). None of our patients exhibited hyperkinesias during the recording. To exclude that our results are driven by tremor-related movement, we re-ran the HMM without the tremor-dominant and the mixed-type patient (see Figure R1 response letter).

      ON medication results for all HMM states remained the same. OFF medication results for the Ctx-Ctx and STN-STN state remained the same as well. The Ctx-STN state OFF medication was split into two states: Sensorimotor-STN connectivity was captured in one state and all other types of Ctx-STN connections were captured in another state (see Figure 1 response letter. The important point is that the biological conclusions stand across these solutions. Regardless, both with and without the two subjects a stable covariance matrix entailing sensorimotor-STN connectivity was determined, which is the main finding for the Ctx-STN state OFF medication.

      We therefore discuss this issue now within the limitation section (page 20):

      “Both motor impairment and motor improvement can cause movement during the resting state in PD. While such movement is a deviation from a resting state in healthy subjects, such movements are part of the disease and occur unwillingly. Therefore, such movements can arguably be considered part of the resting state of Parkinson’s disease. None of the patients in our cohort experienced hyperkinesia during the recording. All patients except for two were of the akinetic-rigid subtype. We verified that tremor movement is not driving our results. Recalculating the HMM states without these 2 subjects, even though it slightly changed some particular aspects of the HMM solution did not materially affect the conclusions.”

      Figure R1: States obtained after removing one tremor dominant and one mixed type patient from analysis. Panel C shows the split OFF medication cortico-STN state. Most of the cortico-STN connectivity is captured by the state shown in the top row (Figure 1 C OFF). Only the motor-STN connectivity in the alpha and beta band (along with a medial frontal-STN connection in the alpha band) is captured separately by the states labeled “OFF Split” (Figure 1 C OFF SPLIT).

      This reviewer was unclear on why increased "communication" in the medial OFC in delta and theta was interpreted as a pathological state indicating deteriorated frontal executive function. Given that the authors provide no evidence of poor executive function in the patients studied, the authors must at least provide evidence from other studies linking this feature with impaired executive function.

      If we understand the comment correctly it refers to the statement in the abstract “Dopaminergic medication led to communication within the medial and orbitofrontal cortex in the delta/theta frequency range. This is in line with deteriorated frontal executive functioning as a side effect of dopamine treatment in Parkinson’s disease”

      This statement is based on the dopamine overdose hypothesis reported in the Parkinson’s disease (PD) literature (Cools 2001; Kelly et al. 2009; MacDonald and Monchi 2011; Vaillancourt et al. 2013). We have elaborated upon the dopamine overdose hypothesis in the discussion on page 16. In short, dopaminergic neurons are primarily lost from the substantia nigra in PD, which causes a higher dopamine depletion in the dorsal striatal circuitry than within the ventral striatal circuits (Kelly et al. 2009; MacDonald and Monchi 2011). Thus, dopaminergic medication to treat the PD motor symptoms leads to increased dopamine levels in the ventral striatal circuits including frontal cortical activity, which can potentially explain the cognitive deficits observed in PD (Shohamy et al. 2005; George et al. 2013). We adjusted the abstract to read:

      “Dopaminergic medication led to coherence within the medial and orbitofrontal cortex in the delta/theta frequency range. This is in line with known side effects of dopamine treatment such as deteriorated executive functions in Parkinson’s disease.”

      In this article, authors repeatedly state their method allows them to delineate between pathological and physiological connectivity, but they don't explain how dynamical systems and discrete-state stochasticity support that goal.

      To recapitulate, the HMM divides a continuous time series into discrete states. Each state is a time-delay embedded covariance matrix reflecting the underlying connectivity between brain regions as well as the specific temporal dynamics in the data when such state is active. See Packard et al., (1980) for details about how a time-delay embedding characterises a linear dynamical system.

      Please note that the HMM was used as a data-driven, descriptive approach without explicitly assuming any a-priori relationship with pathological or physiological states. The relation between biology and the HMM states, thus, purely emerged from the data; i.e. is empirical. What we claim in this work is simply that the features captured by the HMM hold some relation with the physiology even though the estimation of the HMM was completely unsupervised (i.e. blind to the studied conditions). We have added this point also to the limitations of the study on page 19 and the following to the introduction to guide the reader more intuitively (page 4):

      “To allow the system to dynamically evolve, we use time delay embedding. Theoretically, delay embedding can reveal the state space of the underlying dynamical system (Packard et al., 1980). Thus, by delay-embedding PD time series OFF and ON medication we uncover the differential effects of a neurotransmitter such as dopamine on underlying whole brain connectivity.”

      Reviewer #2:

      Sharma et al. investigated the effect of dopaminergic medication on brain networks in patients with Parkinson's disease combining local field potential recordings from the subthalamic nucleus and magnetencephalography during rest. They aim to characterize both physiological and pathological spectral connectivity.

      They identified three networks, or brain states, that are differentially affected by medication. Under medication, the first state (termed hyperdopaminergic state) is characterized by increased connectivity of frontal areas, supposedly responsible for deteriorated frontal executive function as a side effect of medical treatment. In the second state (communication state), dopaminergic treatment largely disrupts cortico-STN connectivity, leaving only selected pathways communicating. This is in line with current models that propose that alleviation of motor symptoms relates to the disruption of pathological pathways. The local state, characterized by STN-STN oscillatory activities, is less affected by dopaminergic treatment.

      The authors utilize sophisticated methods with the potential to uncover the dynamics of activities within different brain network, which opens the avenue to investigate how the brain switches between different states, and how these states are characterized in terms of spectral, local, and temporal properties. The conclusions of this paper are mostly well supported by data, but some aspects, mainly about the presentation of the results, remain:

      We would like to thank the reviewer for his succinct and clear understanding of our work.

      1) The presentation of the results is suboptimal and needs improvement to increase readers' comprehension. At some points this section seems rather unstructured, some results are presented multiple times, and some passages already include points rather suitable for the discussion, which adds too much information for the results section.

      We have removed repetitions in the results sections and removed the rather lengthy introductory parts of each subsection. Moreover, we have now moved all parts, which were already an interpretation of our findings to the discussion.

      2) It is intriguing that the hyperdopaminergic state is not only identified under medication but also in the off-state. This is intriguing, especially with the results on the temporal properties of states showing that the time of the hyperdopaminergic state is unaffected by medication. When such a state can be identified even in the absence of levodopa, is it really optimal to call it "hyperdopaminergic"? Do the results not rather suggest that the identified network is active both off and on medication, while during the latter state its' activities are modulated in a way that could relate to side effects?

      The reviewer’s interpretations of the results pertaining to the hyper-dopaminergic state are correct. The states had been named post-hoc as explained in the results section. The hyper-dopaminergic state’s name derived from it showing the overdosing effects of dopamine. Of course, these results are only visible on medication. But off medication, this state also exists without exhibiting the effects of excess dopamine. To avoid confusion or misinterpretation of the findings and also following the relevant comment by reviewer 1, we renamed all states to be more descriptive:

      Hyperdopaminergic > Cortico-cortical state

      Communication > Cortico-STN state

      Local > STN-STN state.

      3) Some conclusions need to be improved/more elaborated. For example, the coherence of bilateral STN-STN did not change between medication off and on the state. Yet it is argued that a) "Since synchrony limits information transfer (Cruz et al. 2009; Cagnan, Duff, and Brown 2015; Holt et al. 2019) , local oscillations are a potential mechanism to prevent excessive communication with the cortex" (line 436) and b) "Another possibility is that a loss of cortical afferents causes local basal ganglia oscillations to become more pronounced" (line 438). Can these conclusions really be drawn if the local oscillations did not change in the first place?

      We apologize for the unclear description. Our conclusion was based on the following results:

      a) We state that STN-STN connectivity as measured by the magnitude of STN-STN coherence does not change OFF vs ON medication in the Cortico-STN state. This result is obtained using inter-medication analysis.

      b) But ON medication, STN-STN coherence in the Cortico-STN state was significantly different from mean coherence within the ON condition. These results are obtained using intra-medication analysis.

      Based on this, we conclude that in the Cortico-STN state, although OFF vs ON medication the magnitude of STN-STN coherence was unchanged, the STN-STN coherence was significantly different from mean coherence in the ON medication condition. The emergence of synchronous STN-STN activity may limit information exchange between STN and cortex ON medication.

      An alternative explanation for these findings might be a mechanism preventing connectivity between cortex and the STN ON medication. This missing interaction between STN and cortex might cause STN-STN oscillations to increase compared to the mean coherence within the ON state. Unfortunately, we cannot test such causal influences with our analysis.

      We have added the following discussion to the manuscript on page 17 in order to improve the exposition:

      “Bilateral STN–STN coherence in the alpha and beta band did not change in the cortico-STN state ON versus OFF medication (InterMed analysis). However, STN-STN coherence was significantly higher than the mean level ON medication (IntraMed analysis). Since synchrony limits information transfer (Cruz et al. 2009; Cagnan, Duff, and Brown 2015; Holt et al. 2019), the high coherence within the STN ON medication could prevent communication with the cortex. A different explanation would be that a loss of cortical afferents leads to increased local STN coherence. The causal nature of the cortico-basal ganglia interaction is an endeavour for future research.”

      Reviewer #3:

      In PD, pathological neuronal activity along the cortico-basal ganglia network notably consists in the emergence of abnormal synchronized oscillatory activity. Nevertheless, synchronous oscillatory activity is not necessarily pathological and also serve crucial cognitive functions in the brain. Moreover, the effect of dopaminergic medication on oscillatory network connectivity occurring in PD are still poorly understood. To clarify these issues, Sharma and colleagues simultaneously-recorded MEG-STN LFP signals in PD patients and characterized the effect of dopamine (ON and OFF dopaminergic medication) on oscillatory whole-brain networks (including the STN) in a time-resolved manner. Here, they identified three physiologically interpretable spectral connectivity patterns and found that cortico-cortical, cortico-STN, and STN-STN networks were differentially modulated by dopaminergic medication.

      Strengths:

      1) Both the methodological and experimental approaches used are thoughtful and rigorous.

      a) The use of an innovative data-driven machine learning approach (by employing a hidden Markov model), rather than hand-crafted analyses, to identify physiologically interpretable spectral connectivity patterns (i.e., distinct networks/states) is undeniably an added value. In doing so, the results are not biased by the human expertise and subjectivity, which make them even more solid.

      b) So far, the recurrent oscillatory patterns of transient network connectivity within and between the cortex and the STN reported in PD was evaluated/assessed to specific cortico-STN spectral connectivity. Conversely, whole-brain MEG studies in PD patients did not account for cortico-STN and STN-STN connectivity. Here, the authors studied, for the first time, the whole-brain connectivity including the STN (whole brain-STN approach) and therefore provide new evidence of the brain connectivity reported in PD, as well as new information regarding the effect of dopaminergic medication on the recurrent oscillatory patterns of transient network connectivity within and between the cortex and the STN reported in PD.

      2) Studying the temporal properties of the recurrent oscillatory patterns of transient network connectivity both ON and OFF medication is extremely important and provide interesting and crucial information in order to delineated pathological versus physiologically-relevant spectral brain connectivity in PD.

      We would like to thank the reviewer for their valuable feedback and correct interpretation of our manuscript.

      Weaknesses:

      1) In this study, the authors implied that the ON dopaminergic medication state correspond to a physiological state. However, as correctly mentioned in the limitations of the study, they did not have (for obvious reasons) a control/healthy group. Moreover, no one can exclude the emergence of compensatory and/or plasticity mechanisms in the brain of the PD patients related to the duration of the disease and/or the history of the chronic dopamine-replacement therapy (DRT). Duration of the disease and DRT history should be therefore considered when characterizing the recurrent oscillatory patterns of transient network connectivity within and between the cortex and the STN reported in PD, as well as when examining the effect of the dopaminergic medication on the functioning of these specific networks.

      We would like to thank the reviewer for pointing this out. We regressed duration of disease (year of measurement – year of onset) on the temporal properties of the HMM states. We found no relationship between any of the temporal properties and disease duration. Similarly, we regressed levodopa equivalent dosage for each subject on the temporal properties and found no relationship. We now discuss this point in the manuscript (page 20):

      “A further potential influencing factor might be the disease duration and the amount of dopamine patients are receiving. Both factors were not significantly related to the temporal properties of the states.”

      2) Here, the authors recorded LFPs in the STN activity. LFP represents sub-threshold (e.g., synaptic input) activity at best (Buzsaki et al., 2012; Logothetis, 2003). Recent studies demonstrated that mono-polar, but also bi-polar, BG LFPs are largely contaminated by volume conductance of cortical electroencephalogram (EEG) activity even when re-referenced (Lalla et al., 2017; Marmor et al., 2017). Therefore, it is likely that STN LFPs do not accurately reflect local cellular activity. In this study, the authors examined and measured coherence between cortical areas and STN. However, they cannot guarantee that STN signals were not contaminated by volume conducted signals from the cortex.

      We appreciate this concern and thank the reviewer for bringing it up. Marmor et al. (2017) investigated this on humans and is therefore most closely related to our research. They find that re-referenced STN recordings are not contaminated by cortical signals. Furthermore, the data in Lalla et al. (2017) is based on recordings in rats, making a direct transfer to human STN recordings problematic due to the different brain sizes. Since we re-referenced our LFP signals as recommended in the Marmor paper, we think that contamination due to cortical signals is relatively minor; see Litvak et al. (2011), Hirschmann et al. (2013), and Neumann et al. (2016) for additional references supporting this. That being said, we now discuss this potential issue in the paper on page 20.

      “Lastly, we recorded LFPs from within the STN –an established recording procedure during the implantation of DBS electrodes in various neurological and psychiatric diseases. Although for Parkinson patients results on beta and tremor activity within the STN have been reproduced by different groups (Reck et al. 2010, Litvak et al. 2011, Florin et al. 2013, Hirschmann et al. 2013, Neumann et al. 2016), it is still not fully clear whether these LFP signals are contaminated by volume-conducted cortical activity. However, while volume conduction seems to be a larger problem in rodents even after re-referencing the LFP signal (Lalla et al. 2017), the same was not found in humans (Marmor et al. 2017).”

      3) The methods and data processing are rigorous but also very sophisticated which make the perception of the results in terms of oscillatory activity and neural synchronization difficult.

      To aid intuition on how to interpret the result in light of the methods used, one can compare the analysis pipeline to a windowing approach. In a more standard approach, windows of different time length can be defined for different epochs within the time series and for each window coherence and connectivity can be determined. The difference in our approach is that we used an unsupervised learning algorithm to select windows of varying length based on recurring patterns of whole brain network activity. Within those defined windows we then determine the oscillatory properties via coherence and power – which is the same as one would do in a classical analysis. We have added an explanation of the concept of “oscillatory activity” within our framework to the introduction (page 2 footnote):

      “For the purpose of our paper, we refer to oscillatory activity or oscillations as recurrent, but transient frequency–specific patterns of network activity, even though the underlying patterns can be composed of either sustained rhythmic activity, neural bursting, or both (Quinn et al. 2019).”

      Moreover, we provide a more intuitive explanation of the analysis within the first section of the results (page 4):

      “Using an HMM, we identified recurrent patterns of transient network connectivity between the cortex and the STN, which we henceforth refer to as an ‘HMM state’. In comparison to classic sliding-window analysis, an HMM solution can be thought of as a data-driven estimation of time windows of variable length (within which a particular HMM state was active): once we know the time windows when a particular state is active, we compute coherence between different pairs of regions for each of these recurrent states.”

      4) Previous studies have shown that abnormal oscillations within the STN of PD patients are limited to its dorsolateral/motor region, thus dividing the STN into a dorsolateral oscillatory/motor region and ventromedial non-oscillatory/non-motor region (Kuhn et al. 2005; Moran et al. 2008; Zaidel et al. 2009, 2010; Seifreid et al. 2012; Lourens et al. 2013, Deffains et al., 2014). However, the authors do not provide clear information about the location of the LFP recordings within the STN.

      We selected the electrode contacts based on intraoperative microelectrode recordings (for details, see page 23). The first directional recording height after the entry into the STN was selected to obtain the three directional LFP recordings from the respective hemisphere. This practice has been proven to improve target location (Kochanski et al., 2019; Krauss et al., 2021). The common target area for DBS surgery is the dorsolateral STN. To confirm that the electrodes were actually located within this part of the STN, we now reconstructed the DBS location with Lead-DBS (Horn et al. 2019). All electrodes – except for one – were located within the dorsolateral STN (see figure 7 of the manuscript). To exclude that our results were driven by outlier, we reanalysed our data without this patient. No change in the overall connectivity pattern was observed (see figure R3 of the response letter).

      Figure R2: Lead DBS reconstruction of the location of electrodes in the STN for different subjects. The red electrodes have not been placed properly in the STN. The contacts marked in red represent the directional contacts from which the data was used for analysis.

      Figure R3: HMM states obtained after running the analysis without the subject with the electrode outside the STN.

      References:

      Buzsáki G, Anastassiou CA, Koch C. The origin of extracellular fields and currents-EEG, ECoG, LFP and spikes. Nat Rev Neurosci 2012; 13: 407–20.

      Cagnan H, Duff EP, Brown P. The relative phases of basal ganglia activities dynamically shape effective connectivity in Parkinson’s disease. Brain 2015; 138: 1667–78.

      Cools R. Enhanced or impaired cognitive function in Parkinson’s disease as a function of dopaminergic medication and task demands. Cereb Cortex 2001; 11: 1136–43.

      Cruz A V., Mallet N, Magill PJ, Brown P, Averbeck BB. Effects of dopamine depletion on network entropy in the external globus pallidus. J Neurophysiol 2009; 102: 1092–102.

      Florin E, Erasmi R, Reck C, Maarouf M, Schnitzler A, Fink GR, et al. Does increased gamma activity in patients suffering from Parkinson’s disease counteract the movement inhibiting beta activity? Neuroscience 2013; 237: 42–50.

      George JS, Strunk J, Mak-Mccully R, Houser M, Poizner H, Aron AR. Dopaminergic therapy in Parkinson’s disease decreases cortical beta band coherence in the resting state and increases cortical beta band power during executive control. NeuroImage Clin 2013; 3: 261–70.

      Hirschmann J, Özkurt TE, Butz M, Homburger M, Elben S, Hartmann CJ, et al. Differential modulation of STN-cortical and cortico-muscular coherence by movement and levodopa in Parkinson’s disease. Neuroimage 2013; 68: 203–13.

      Holt AB, Kormann E, Gulberti A, Pötter-Nerger M, McNamara CG, Cagnan H, et al. Phase-dependent suppression of beta oscillations in parkinson’s disease patients. J Neurosci 2019; 39: 1119–34.

      Horn A, Li N, Dembek TA, Kappel A, Boulay C, Ewert S, et al. Lead-DBS v2: Towards a comprehensive pipeline for deep brain stimulation imaging. Neuroimage 2019; 184: 293–316.

      Kelly C, De Zubicaray G, Di Martino A, Copland DA, Reiss PT, Klein DF, et al. L-dopa modulates functional connectivity in striatal cognitive and motor networks: A double-blind placebo-controlled study. J Neurosci 2009; 29: 7364–78.

      Kochanski RB, Bus S, Brahimaj B, Borghei A, Kraimer KL, Keppetipola KM, et al. The impact of microelectrode recording on lead location in deep brain stimulation for the treatment of movement disorders. World Neurosurg 2019; 132: e487–95.

      Krauss P, Oertel MF, Baumann-Vogel H, Imbach L, Baumann CR, Sarnthein J, et al. Intraoperative neurophysiologic assessment in deep brain stimulation surgery and its impact on lead placement. J Neurol Surgery, Part A Cent Eur Neurosurg 2021; 82: 18–26.

      Lalla L, Rueda Orozco PE, Jurado-Parras MT, Brovelli A, Robbe D. Local or not local: Investigating the nature of striatal theta oscillations in behaving rats. eNeuro 2017; 4: 128–45.

      Litvak V, Jha A, Eusebio A, Oostenveld R, Foltynie T, Limousin P, et al. Resting oscillatory cortico-subthalamic connectivity in patients with Parkinson’s disease. Brain 2011; 134: 359–74.

      MacDonald PA, MacDonald AA, Seergobin KN, Tamjeedi R, Ganjavi H, Provost JS, et al. The effect of dopamine therapy on ventral and dorsal striatum-mediated cognition in Parkinson’s disease: Support from functional MRI. Brain 2011; 134: 1447–63.

      MacDonald PA, Monchi O. Differential effects of dopaminergic therapies on dorsal and ventral striatum in Parkinson’s disease: Implications for cognitive function. Parkinsons Dis 2011; 2011: 1–18.

      Marmor O, Valsky D, Joshua M, Bick AS, Arkadir D, Tamir I, et al. Local vs. volume conductance activity of field potentials in the human subthalamic nucleus. J Neurophysiol 2017; 117: 2140–51.

      Neumann WJ, Degen K, Schneider GH, Brücke C, Huebl J, Brown P, et al. Subthalamic synchronized oscillatory activity correlates with motor impairment in patients with Parkinson’s disease. Mov Disord 2016; 31: 1748–51.

      Packard NH, Crutchfield JP, Farmer JD, Shaw RS. Geometry from a time series. Phys Rev Lett 1980; 45: 712–6.

      Quinn AJ, van Ede F, Brookes MJ, Heideman SG, Nowak M, Seedat ZA, et al. Unpacking Transient Event Dynamics in Electrophysiological Power Spectra. Brain Topogr 2019; 32: 1020–34.

      Reck C, Himmel M, Florin E, Maarouf M, Sturm V, Wojtecki L, et al. Coherence analysis of local field potentials in the subthalamic nucleus: Differences in parkinsonian rest and postural tremor. Eur J Neurosci 2010; 32: 1202–14.

      Shohamy D, Myers CE, Grossman S, Sage J, Gluck MA. The role of dopamine in cognitive sequence learning: Evidence from Parkinson’s disease. Behav Brain Res 2005; 156: 191–9.

      Spiegel J, Hellwig D, Samnick S, Jost W, Möllers MO, Fassbender K, et al. Striatal FP-CIT uptake differs in the subtypes of early Parkinson’s disease. J Neural Transm 2007; 114: 331–5.

      Vaillancourt DE, Schonfeld D, Kwak Y, Bohnen NI, Seidler R. Dopamine overdose hypothesis: Evidence and clinical implications. Mov Disord 2013; 28: 1920–9.

    1. Author Response

      Reviewer #1 (Public Review)

      [...] One potential issue is that the high myelination signal is associated with the compartment in V2 (pale stripes) which was not functionally defined itself but by the absence of specific functional activations. No difference was reported between those stripes that were defined functionally. Other explanations for the differential pattern of a qMRI signals, e.g. ROI distribution for presumed pale stripes is not evenly distributed (more foveal), ROIs with low activations due to some other factor show higher myelin-related signals, cannot be excluded based on the analysis presented.

      Indeed, it would have been advantageous to directly functionally delineate pale stripes in V2. Since we were not able to achieve this by fMRI, we needed an indirect method to infer pale stripe contributions in the analysis. We also added a statement in the discussion section to emphasize this more (p. 9, lines 286–288).

      Furthermore, different myelination between thin and thick stripes was not tested, since we did not have a concrete hypothesis on this. Despite the conflicting findings of stronger myelination in dark or pale CO stripes in the literature, no histological study stated myelination differences between dark CO thin and thick stripes. Therefore, our primary interest and hypothesis was lying in comparing the different myelination of thin/thick and pale stripes using MRI.

      Thank you very much for this comment about potential other sources of differential qMRI parameter patterns. Indeed, based on the original analysis we could not exclude that the absence of functional activation around the foveal representation may have biased our analysis. We therefore added a supporting analysis, in which we excluded the region around the foveal representation from the analysis. The excluded cortical region was kept consistent between participants by excluding the same eccentricity range in all maps. We added more details in the results section of the revised manuscript (p. 8, lines 189–202). In Figure 5-Supplement 1 and Figure 5-Supplement 3, results from this supporting analysis are shown which reproduced the primary findings from the main analysis, particularly the relatively higher myelination of pale stripes.

      ROI definitions solely based on fMRI activation amplitude have additional limitations. However, we find it unlikely that a small fMRI effect size and low contrast-to-noise ratio (i.e. stochastic cause of low statistical parameter values/”activation”) has impacted the results, since Figure 3 shows that we could achieve a high degree of reproducibility for each participant.

      We would note that the fact that we found consistent differences across MPM and MP2RAGE sessions makes some potential artifacts driving the differences unlikely. We also find it unlikely that systematic cerebral blood volume differences between stripes would have driven the results. A higher local blood volume would lead to increased BOLD responses but also to a higher R1 value due to the deoxy-hemoglobin induced relaxation, which is opposite to the observation of higher activity in the thick/thin stripes but lower R1 values.

      Further studies using other functional metrics (e.g. VASO, ASL etc.) may help us to even more clearly demonstrate specificity but were out of the scope of this already rather extensive study. Although we have added extensive further analyses in the revised manuscript such as controlling for foveal effects or registration performance, we did not see a possibility to fully exclude a systematic bias that might potentially be caused by unknown factors.

      Another theoretical and practical issue is the question of "ground truth" for the non-invasive qMRI measures, as the authors - as their starting point - roundly dismiss direct histological tissue studies as conflicting, rather than take a critical look at the merit of the conflicting study results and provide a best hypothesis. If so, they need to explain better how they calibrate their non-invasive MR measurements of myelin.

      We agree and have now further elaborated on the limits of specificity of the R1 and R2* signal as cortical myelin marker (p. 2, lines 68–88; p. 6, line 163; p. 8, line 216; p. 9, lines. 257–260). However, we still think that it is important for the reader to appreciate the conflicting results in histological studies using staining methods for myelin, which adds to the study’s background.

      We did not intend to give the impression that MRI provides the missing ground-truth to adjudicate histological controversies, but that it provides an alternative and additional view on the open questions. We changed the introduction to better reflect the aspect that the study offers a unique view by providing myelination proxies and functional measures in the same individual, which allows for direct comparison and investigation of structure-function relationships (see p. 2, lines 68–70; p. 3, lines 93–95), which is not accessible to any other approach. Nevertheless, we would like to note that R1 has been well established as a myelin marker under particular conditions (Kirilina et al., 2020; Mancini et al., 2020; Lazari and Lipp, 2021). It has also been widely used for cortical myelin mapping across a variety of populations, systems and field strengths. We added this statement to the introduction (see p. 2, lines 82-85). We note that we excluded volunteers with pathologies or neurological disorders from the study and their mean age was about 28 years. Thus, we had conditions comparable to previous (validation) studies.

      Because of the contradictory findings of histological studies, we could not further finesse the hypothesis beyond our previous a priori hypothesis that we expected differences in the myelin sensitive MRI metrics between the thin/thick versus pale stripes. To improve the contextual understanding, we added a paragraph in the discussion section covering in more depth how the MRI results relate to known histological findings (see pp. 8–9, lines 216–240).

      While this paper makes an important contribution to the question of the association of specific myelination patterns defining the columnar architecture in V2, it is not entirely clear whether the authors can fully resolve it with the data presented.

      Indeed, we agree that non invasive aggregate measures, such as the R1 metrics, offer limited specificity which precludes a fully conclusive inference about cortical myelination. We have further emphasized this on several occasions in the text (see p. 2, lines 68–88; p. 6, line 163; p. 8, line 216; p. 9, lines. 257–260). Since the correspondence of cortical myelin levels and R1 (and other metrics) is an active area of research, we expect that the understanding, sensitivity and specificity of R1 to cortical myelination will further improve. We note that the use of qMRI is a substantial advance over weighted MRI typically used, which suffers from lack of specificity due to instrumental idiosyncrasies and varying measurement conditions.

      Reviewer #2 (Public Review)

      [...] Unfortunately, this particular study seems to fall into an unhappy middle ground in terms of the conclusions that can be drawn: the relaxometry measures lack the specificity to be considered "ground truth", while the authors claim that the literature lacks consensus regarding the structures that are being studied. The authors propose that their results resolve whether or not stripes differ in their patterns of myelination, but R1 lacks the specificity to do this. While myelin is a primary driver of relaxation times in cortex, relaxometry cannot be considered to be specific to myelin. It is possible that the small observed changes in R1 are driven by myelin, but they could also reflect other tissue constituents, particularly given the small observed effect sizes. If the literature was clear on the pattern of myelination across stripes, this study could confirm that R1 measurements are sensitive to and consistent with this pattern. But the authors present the work as resolving the question of how myelination differs between stripes, which over-reaches what is possible with this method. As it stands, the measured differences in R1 between functionally-defined cortical regions are interesting, but require further validation (e.g., using invasive myelin staining).

      We agree that we have inadvertently overstated the specificity of R1 at several occasions in the text. We therefore toned down the statements concerning the correspondence between R1 and myelin throughout the manuscript (e.g. see p. 2, lines 68–88; p. 6, line 163; p. 8, line 216; p. 9, lines. 257–260).

      We also removed the phrase that gave the impression that MRI can conclusively resolve the conflicting results found in histological studies. In the Introduction, we changed the corresponding paragraph by emphasizing the alternative view, which can be obtained from MRI by the possibility to investigate structure-function relationships in the living human brain, which would not be possible by invasive myelin staining (see p. 2, lines 68–70; p. 3, lines 93–95).

      We acknowledge that – perhaps aside from electron microscopy – all common markers have shortcomings, which limit their specificity. For example, classic histology is not quantitative and resulted in conflicting results. It even includes the very fundamental issue, that the composition of myelin varies across the brain and within brain areas significantly (e.g., its lipid composition (González de San Román et al., 2018)). Thus, we regard the different invasive/non-invasive measures as complementary. R1 adds to this arsenal of measures and can be acquired non invasively. It has been shown to be a reliable myelin marker under certain circumstances. It follows the known myeloarchitecture patterns of the human brain, which was also checked for the data of the present study (see Figure 4 and Appendix 2). It is responsive to traumatic changes (Freund et al., 2019), development (Whitaker et al., 2016; Carey et al., 2018; Natu et al., 2019) and plasticity (Lazari et al., 2022). Since we studied healthy volunteers with no known pathologies that were sampled randomly from the population, we believe that the previous results generally apply and suggest sufficient specificity of the R1 marker. Of course, we cannot fully exclude bias due to unknown factors that have not been investigated/discovered by validation studies yet. However, in this case we expect that the systematic differences between stripe types would remain an important result most likely pointing to another interesting biological difference between stripes.

      While more research is needed to clarify the precise role of R1 for cortical myelin, we think that the meaningful determination of quantitative MR parameter within one cortical area is still interesting for the neuroscientific community.

      Moreover, the results make clear that R1 differences are not sufficiently strong to provide an independent measure of this structure (e.g., for segmentation of stripe). As such, one would still require fMRI to localise stripes, making it unclear what role R1 measures would play in future studies.

      Indeed, the observed small effect sizes in the present study still requires a functional localization with fMRI. We expected small effect sizes using R1 and R2* due to the known small inter-areal or intra-cortical differences of MRI myelin markers. Therefore, this study aimed at a proof-of-concept investigating whether intra-areal R1 differences at the spatial scale of columnar structures can be detected using non-invasive MRI. Our study shows that these differences can be seen but currently not at the single voxel level. We anticipate that with further improvements in sequence development and scanner hardware, high-resolution R1 estimates with sufficient SNR can be acquired making fMRI redundant (for this kind of investigations). Please see the reply to the next comment concerning the impact of using R1 in future studies.

      The Introduction concludes with the statement that "Whereas recent studies have explored cortical myelination ... using non-quantitative, weighted MR images... we showed for the first time myelination differences using MRI on a quantitative basis". As written, this sentence implies that others have demonstrated that simpler non-quantitative imaging can achieve the same aims as qMRI. Simply showing that a given method is able to achieve an aim would not be sufficient: the authors should demonstrate that this constitutes an important advance.

      Thank you for this comment. It goes to the heart of the concerns raised about specificity and sensitivity of MRI based myelin metrics. We elaborate here on the main advantage of using qMRI in our current study and why it is more specific than weighted MR imaging. However, we emphasize that a thorough comparison between qMRI and weighted MRI is highly complex and refer to our recent review paper on qMRI for further details (Weiskopf et al., 2021), which are beyond the scope of our paper. The signal in weighted MRI, even when optimally optimized to the tissue of interest, additionally depends on both inhomogeneities in the RF transmit and receive (bias) fields. Other methods like using a ratio image (T1w/T2w) can cancel out the receive field bias entirely (in the case of no subject movements between scans) but not the transmit field bias. This hampers the direct analysis and interpretation of signal differences between distant regions of the brain. For high resolution imaging applications, the usage of high magnetic fields such as 7 T is beneficial or even mandatory due to signal-to-noise (SNR) penalties. With increasing field strength, these inhomogeneities also apply to small regions as V2. For these cases, qMRI is advantageous since it provides metrics which are free from these technical biases, significantly improving the specificity. As high-field MRI has the potential to non invasively study the structure and function of the human brain at the spatial scale of cortical layers and cortical columns, we believe that the results of our current study, which successfully demonstrate the applicability of qMRI to robustly detect small differences at the level of columnar systems, is relevant for future studies in the field of neuroscience.

      We emphasized these considerations in the revised manuscript (see. p. 9, lines 273–285).

      The study includes a very small number of participants (n=4). The advantage of non-invasive in-vivo measurements, despite the fact that they are indirect measures, should be that one can study a reasonable number of subjects. So this low n seems to undermine that point. I rarely suggest additional data collection, but I do feel that a few more subjects would shore up the study's impact.

      The present study was conducted in line with a deep phenotyping study approach. That is, we focused on acquiring highly reliable datasets on individuals. We did not intend to capture the population variance, which is often the goal of other group studies, since low level and basic features such as stripes in V2 are expected to be present in all healthy individuals. Thus we traded off and prioritized test-retest measurements for fMRI sessions and using an alternative MP2RAGE acquisition over a larger number of individuals. This resulted in 6–7 scanning sessions on different days for each individual, summing up to 26 long scanning session in total. We also note that the used sample size is not smaller than in other studies with a similar research question. For example, another fMRI study investigating V2 stripes in humans used the same sample size of n=4 (Dumoulin et al., 2017).

      The paper overstates what can be concluded in a number of places. For example, the paper suggests that R1 and R2 are highly-specific to myelin in a number of places. For example, on p7 the text reads" "We tested whether different stripe types are differentially myelinated by comparing R1 and R2..." Relaxation times lack the specificity to definitively attribute these changes purely to myelin. Similarly, on p11: "Our study showed that pale stripes which exhibit lower oxidative metabolic activity according to staining with CO are stronger myelinated than surrounding gray matter in V2." This implies that the study directly links CO staining to myelination. In addition to using non-specific estimates of myelination, the study does not actually measure CO.

      We agree that we did not clearly point out the limitations of R1 myelin mapping. Therefore, we toned down the statements about the connection between cortical myelin and R1. The mentioned statements in the reviewer’s comment were changed accordingly (see p. 6, line 163; p. 11, lines 353–354). We also included a small paragraph to clarify the used terminology (color-selective thin stripes, disparity-selective thick stripes) in the manuscript (see p. 4, lines 110–114) to avoid the inadvertent conflation of CO staining and actually measured brain activity.

      I'm confused by the analysis in Figure 5. I can appreciate why the authors are keen to present a "tripartite" analysis (thick, thin, and pale stripes). But I find the gray curves confusing. As I understand it, the gray curves as generated include both the stripe of interest (red or blue plots) and the pale stripes. Why not just generate a three-way classification? Generating these plots in effect has already required hard classification of thin and thick stripes, so it is odd to create the gray plots, which mix two types of stripes. Alternatively, could you explicitly model the partial volume for a given cortical location (e.g., under the assumption that partial volume of thick and thin strips is indicated by the z-score) for the corresponding functional contrast? One could then estimate the relaxation times as a simple weighted sum of stripe-wise R1 or R2.

      Figure on weighted average of stripe-wise R1 and R2. (a) shows the weighted sum of R1 (de-meaned and de-curved) over all V2 voxels. z-scores from color-selective thin stripe experiments and disparity-selective thick stripes were used as weights in the left and middle group of bars, respectively. An intermediate threshold of zmax=1.96 was used, i.e., final weights were defined as weights=(z-1.96). Weights with z<0 were set to 0. For pale stripes (right group of bars), we used the maximum z-score value from thin and thick stripe measurements. We then set all weights with z≥1.96 to 0 and used the inverse as final weights. i.e., weights = -1 * (max(z)-1.96). (b) shows the same analysis for R2. Error bars indicate 1 standard error of the mean.

      (1) Yes, indeed. We agree that modeling the partial volume of each compartment (thin, thick and pale stripes) in each V2 voxel would be the most elegant approach. However, we note that z-scores between thin and thick stripe experiments may not reflect the voxel-wise partial volume effect, since they are a purely statistical measure and not a partial volume model. Having said this, we think that this general approach can give some additional insights and we provide results for a similar analysis here. We calculated the weighted sum of R1 and R2 values over all V2 voxels for each stripe compartment (thin, thick and pale stripes) independently (see above figure). For R1, we see the same pattern of R1 between stripe types as in the manuscript (Figure 5). Additionally, we show the differences here for each subject, which further demonstrates the reproducibility across subjects in our study. For R2, no clear pattern across subjects emerged, confirming the results in our manuscript. Since, this analysis did not add relavant new information to the manuscript, we refrained from adding this figure to the manuscript, in order not to overload it.

      (2) In our current study, we were not primarily interested in investigating differences between thin/thick stripes and pale stripes. While histological analysis found differences (though not consistent) between CO dark stripes (more myelinated, (Tootell et al., 1983)) and CO pale stripes (more myelinated, Krubitzer and Kaas, 1989)), no study stated myelin differences between CO dark stripes. This does not fully exclude the possibility of myelination differences but suggests that if myelination differences between CO dark stripes existed, they would presumably be smaller than differences between CO dark and CO pale stripes. Thus, it would be even more difficult to demonstrate than the hypothesis of this manuscript.

      Therefore, we decided to directly test two compartments against each other instead of modeling all three compartments within a single model. In our analysis, we thereby loosely followed the analysis methods described in Li et al. (2019), which compared myelin differences between thin/thick and pale stripes in macaques. We note that this demonstrates further consistency, since it is not trivial that both thick and thin stripes show lower R1 values than the pale stripes. For example, there may be no or opposite differences.

      (3) Just for clarification, the plots in Figure 5 show the comparison of R1 (or R2*) between two compartments in V2. The red (blue) curve includes the thin (thick) stripe of interest. The gray curve includes everything in V2 minus contributions from thick (thin) stripes of interest. If we take the thin stripe comparison as example (Figure 5a), then red contains the thin stripes of interest while gray contains everything minus the thick stripes. Therefore, assuming a tripartite stripe arrangement, the gray curve contains both thin and pale stripe contributions.

      References

      Carey D, Caprini F, Allen M, Lutti A, Weiskopf N, Rees G, Callaghan MF, Dick F. Quantitative MRI provides markers of intra-, inter-regional, and age-related differences in young adult cortical microstructure. Neuroimage 2018; 182:429–440.

      Dumoulin SO, Harvey BM, Fracasso A, Zuiderbaan W, Luijten PR, Wandell BA, Petridou N. In vivo evidence of functional and anatomical stripe-based subdivisions in human V2 and V3. Sci Rep 2017; 7:733.

      Freund P, Seif M, Weiskopf N, Friston K, Fehlings MG, Thompson AJ, Curt A. MRI in traumatic spinal cord injury: from clinical assessment to neuroimaging biomarkers. Lancet Neurol 2019; 18:1123–1135.

      González de San Román E, Bidmon H-J, Malisic M, Susnea I, Küppers A, Hübbers R, Wree A, Nischwitz V, Amunts K, Huesgen PF. Molecular composition of the human primary visual cortex profiled by multimodal mass spectrometry imaging. Brain Struct Func 2018; 223:2767–2783.

      Kirilina E, Helbling S, Morawski M, Pine K, Reimann K, Jankuhn S, Dinse J, Deistung A, Reichenbach JR, Trampel R, Geyer S, Müller L, Jakubowski N, Arendt T, Bazin P-L, Weiskopf N. Superficial white matter imaging: Contrast mechanisms and whole-brain in vivo mapping. Sci Adv 2020; 6:eaaz9281.

      Krubitzer LA, Kaas JH. Cortical integration of parallel pathways in the visual system of primates. Brain Res 1989; 478:161–165.

      Lazari A, Lipp I. Can MRI measure myelin? Systematic review, qualitative assessment, and meta-analysis of studies validating microstructural imaging with myelin histology. Neuroimage 2021; 230:117744.

      Lazari A, Salvan P, Cottaar M, Papp D, Rushworth MFS, Johansen-Berg H. Hebbian activity-dependent plasticity in white matter. Cell Rep 2022; 39:110951.

      Li X, Zhu Q, Janssens T, Arsenault JT, Vanduffel W. In Vivo Identification of Thick, Thin, and Pale Stripes of Macaque Area V2 Using Submillimeter Resolution (f)MRI at 3 T. Cereb 2019; 29:544–560.

      Mancini M, Karakuzu A, Cohen-Adad J, Cercignani M, Nichols TE, Stikov N. An interactive meta-analysis of MRI biomarkers of myelin. Elife 2020; 9:e61523.

      Natu VS, Gomez J, Barnett M, Jeska B, Kirilina E, Jaeger C, Zhen Z, Cox S, Weiner KS, Weiskopf N, Grill-Spector K. Apparent thinning of human visual cortex during childhood is associated with myelination. PNAS 2019; 116:20750–20759.

      Tootell RBH, Silverman MS, De Valois RL, Jacobs GH. Functional Organization of the Second Cortical Visual Area in Primates. Science 1983; 220:737–739.

      Weiskopf N, Edwards LJ, Helms G, Mohammadi S, Kirilina E. Quantitative magnetic resonance imaging of brain anatomy and in vivo histology. Nat Rev Phys 2021; 3:570–588.

      Whitaker KJ, Vértes PE, Romero-Garcia R, Váša F, Moutoussis M, Prabhu G, Weiskopf N, Callaghan MF, Wagstyl K, Rittman T, Tait R, Ooi C, Suckling J, Inkster B, Fonagy P, Dolan RJ, Jones PB, Goodyer IM, NSPN Consortium, Bullmore ET. Adolescence is associated with genomically patterned consolidation of the hubs of the human brain connectome. PNAS 2016; 113:9105–9110.

    1. Author Response

      Reviewer #1 (Public Review):

      Determination of the biomechanical forces and downstream pathways that direct heart valve morphogenesis is an important area of research. In the current study, potential functions of localized Yap signaling in cardiac valve morphogenesis were examined. Extensive immunostainings were performed for Yap expression, but Yap activation status as indicated by nuclear versus cytoplasmic localization, Yap dephosphorylation, or expression of downstream target genes was not examined.

      We thank the reviewer for appreciating the significance of this work, and we also thank the reviewer for the constructive suggestions. Following these suggestions, we have improved analysis of YAP activation status and used nuclear versus cytoplasmic localization to quantify YAP activation. To address the reviewer’s concerns, we have conducted extra qPCR analysis of YAP downstream target genes and YAP upstream genes in Hippo pathway. Please find the detailed revisions in our responses to the Recommendations for authors.

      The goal of the work was to determine Yap activation status relative to different mechanical environments, but no biomechanical data on developing heart valves were provided in the study.

      We appreciate the reviewer for raising this concern. We have previously published the biomechanical data of developing chick embryonic heart valves in the following study:

      Buskohl PR, Gould RA, Butcher JT. Quantification of embryonic atrioventricular valve biomechanics during morphogenesis. Journal of Biomechanics. 2012;45(5):895-902.

      In that study, we used micropipette aspiration to measure the nonlinear biomechanics (strain energy) of chick embryonic heart valves at different developmental stages. Here in this study, we used the same method to measure the strain energy of YAP activated/inhibited cushion explants and compared it to the data from our previous study. Our findings were summarized in the Results: “YAP inhibition elevated valve stiffness”, and the detailed measurements, including images and data, are presented in Figure S4.

      There are several major weaknesses that diminish enthusiasm for the study.

      1) The Hippo/Yap pathway activation leads to dephosphorylation of Yap, nuclear localization, and induced expression of downstream target genes. However, there are no data included in the study on Yap nuclear/cytoplasmic ratios, phosphorylation status, or activation of other Hippo pathway mediators. Analysis of Yap expression alone is insufficient to determine activation status since it is widely expressed in multiple cells throughout the valves. The specificity for activated Yap signaling is not apparent from the immunostainings.

      We thank the reviewer for pointing out this weakness. We have now implemented nuclear versus cytoplasmic localization as recommended to quantify YAP activation. We have also conducted additional experiments to analyze via qPCR YAP downstream target genes and YAP upstream genes in Hippo pathway. Please see the detailed revisions in our responses to the Recommendations for authors.

      2) The specific regionalized biomechanical forces acting on different regions of the valves were not measured directly or clearly compared with Yap activation status. In some cases, it seems that Yap is not present in the nuclei of endothelial cells surrounding the valve leaflets that are subject to different flow forces (Fig 1B) and the main expression is in valve interstitial subpopulations. Thus the data presented do not support differential Yap activation in endothelial cells subject to different fluid forces. There is extensive discussion of different forces acting on the valve leaflets, but the relationship to Yap signaling is not entirely clear.

      We thank the reviewer for these important questions. The region-specific biomechanics have been well mapped and studied, thanks to the help from Computational Fluid Dynamics supported by ultrasound velocity and pressure measurements. For example:

      Yalcin, H.C., Shekhar, A., McQuinn, T.C. and Butcher, J.T. (2011), Hemodynamic patterning of the avian atrioventricular valve. Dev. Dyn., 240: 23-35.

      Bharadwaj KN, Spitz C, Shekhar A, Yalcin HC, Butcher JT. Computational fluid dynamics of developing avian outflow tract heart valves. Ann Biomed Eng. 2012 Oct;40(10):2212-27. doi: 10.1007/s10439-012-0574-8.

      Ayoub S, Ferrari G, Gorman RC, Gorman JH, Schoen FJ, Sacks MS. Heart Valve Biomechanics and Underlying Mechanobiology. Compr Physiol. 2016 Sep 15;6(4):1743-1780.

      Salman HE, Alser M, Shekhar A, Gould RA, Benslimane FM, Butcher JT, et al. Effect of left atrial ligation-driven altered inflow hemodynamics on embryonic heart development: clues for prenatal progression of hypoplastic left heart syndrome. Biomechanics and Modeling in Mechanobiology. 2021;20(2):733-50.

      Ho S, Chan WX, Yap CH. Fluid mechanics of the left atrial ligation chick embryonic model of hypoplastic left heart syndrome. Biomechanics and Modeling in Mechanobiology. 2021;20(4):1337-51.

      Those studies have shown that USS develops on the inflow surface of valves while OSS develops on the outflow surface of valves, CS develops in the tip region of valves while TS develops in the regions of elongation and compaction. Here in this study, we mimic those forces in our in-vitro and ex-vivo models. This allows us to study the direct effect of specific force on the YAP activity in different cell lineages. The results showed that OSS promoted YAP activation in VECs while USS inhibited it, CS promoted YAP activation in VICs while TS inhibited it. This result well explained the spatiotemporal distribution of YAP activation in Figure 1. For example, nuclear YAP was mostly found in VECs on the fibrosa side, where OSS develops, and YAP was not expressed in the nuclei in VECs of the atrialis/ventricularis side, where USS develops. It is also worth noting that formation of OSS on the outflow side is slower, and thus the side specific YAP activation in VECs was not in effect at the early stage, from E11.5 to E14.5.

      3) The requirement for Yap signaling in heart valve remodeling as described in the title was not demonstrated through manipulation of Yap activity.

      With respect, it is unclear what the reviewer is asking for given no experiments are suggested nor an elaboration of alternative interpretations of our results that emphasize against YAP requirement. It has been previously shown that YAP signaling is required for early EMT stages of valvulogenesis using conditional YAP deletion in mice:

      Zhang H, von Gise A, Liu Q, Hu T, Tian X, He L, et al. Yap1 Is Required for Endothelial to Mesenchymal Transition of the Atrioventricular Cushion. Journal of Biological Chemistry. 2014;289(27):18681-92.

      Signaling roles for early regulators at these later fetal stages are different, sometimes opposite early EndMT stages, thus contraindicating reliance on these early data to explain later events:

      Bassen D, Wang M, Pham D, Sun S, Rao R, Singh R, et al. Hydrostatic mechanical stress regulates growth and maturation of the atrioventricular valve. Development. 2021;148(13).

      However, embryos with YAP deletion failed to form endocardial cushions and could not survive long enough for the study of its roles in later cushion growth and remodeling into valve leaflets. In this work,

      We first showed the localization of YAP activity and its direct link with local shear or pressure domains. Then we explicitly applied controlled gain and loss of function of YAP via specific molecules. We also applied critical mechanical gain or loss of function studies to demonstrate YAP mechanoactivation necessity and sufficiency to achieve growth and remodeling.

      Reviewer #2 (Public Review)

      This study by Wang et al. examines changes in YAP expression in embryonic avian cultured explants in response to high and low shear stress, as well as tensile and compressive stress. The authors show that YAP expression is increased in response to low, oscillatory shear stress, as well as high compressive stress conditions. Inhibition of YAP signaling prevents compressive stress-induced increases in circularity, decreased pHH3 expression, and increases VE-cadherin expression. On the other hand, YAP gain of function prevents tensile stress-induced decreases in pHH3 expression and VE-cadherin expansion. It also decreases the strain energy density of embryonic avian cushion explants. Finally, using an avian model of left atrial ligation, the authors demonstrate that unloaded regions within the primitive valve structures are associated with increased YAP expression, compared to regions of restricted flow where YAP expression is low. Overall, this study sheds light on the biomechanical regulation of YAP expression in developing valves.

      We thank the reviewer for the accurate summary and their enthusiasm for this work.

      Strengths of the manuscript include:

      • Novel insights into the dynamic expression pattern of YAP in valve cell populations during post-EMT stages of embryonic valvulogenesis.

      • Identify the positive regulation of YAP expression in response to low, oscillatory shear stress, as well as high compressive stress conditions.

      • Identify a link between YAP signaling in regulating stress-induced cell proliferation and valve morphogenesis.

      • The inclusion of the atrial left atrial ligation model is innovative, and the data showing distinguishable YAP expression levels between restricted, and non-restricted flow regions is insightful.

      We thank the reviewer for appreciating the strengths of this work.

      This is a descriptive study that focuses on changes in YAP expression following exposure to diverse stress conditions in embryonic avian cushion explants. Overall, the study currently lacks mechanistic insights, and conclusions based on data are highly over-interpreted, particularly given that the majority of experimental protocols rely on one method of readout.

      We thank the reviewer for constructive suggestions.

      Reviewer #3 (Public Review)

      In this manuscript, Wang et al. assess the role of wall shear stress and hydrostatic pressure during valve morphogenesis at stages where the valve elongates and takes shape. The authors elegantly demonstrate that shear and pressure have different effects on cell proliferation by modulating YAP signaling. The authors use a combination of in vitro and in vivo approaches to show that YAP signaling is activated by hydrostatic pressure changes and inhibited by wall shear stress.

      We thank the reviewer for their enthusiasm for the impact of our work.

      There are a few elements that would require clarification:

      1) The impact of YAP on valve stiffness was unclear to me. How is YAP signaling affecting stiffness? is it through cell proliferation changes? I was unclear about the model put forward:

      • Is it cell proliferation (cell proliferation fluidity tissue while non-proliferating tissue is stiffer?)

      • Is it through differential gene expression?

      This needs clarification.

      We thank the reviewer for raising this important question. Cell proliferation can affect valve stiffness but is a minor factor compared with ECM deposition and cell contractility Our micropipette aspiration data showed that the higher cell proliferation rate induced by YAP activation did lead to stiffer valves when compared to the controls. This may be because at the early stages, cells are more elastic than the viscous ECM. However, the stiffness of YAP activated valves were only about half of that of YAP inhibited valves, showing that the transcriptional level factor plays a more important role. This also suggests that YAP inhibited valves exhibited a more mature phenotype. An analogous role of YAP has also been found in cardiomyocytes. Many theories propose that in cardiomyocytes when YAP is activated the proliferation programs are turned on, while when YAP is inhibited the proliferation programs are turned off and maturation programs are released. Similarly, here we hypothesize that YAP works like a mechanobiological switch, converting mechanical signaling into the decision between growth and maturation. We have revised the Discussion to include this hypothesis.

      2) The model proposes an early asymmetric growth of the cushion leading to different shear forces (oscillatory vs unidirectional shear stress). What triggers the initial asymmetry of the cushion shape? is YAP involved?

      Although the initial geometry of the cushion model is symmetric, the force acting on it is asymmetric. The detailed numerical simulation of how the initial forces trigger the asymmetric morphogenesis can be found in our previous publication:

      Buskohl PR, Jenkins JT, Butcher JT. Computational simulation of hemodynamic-driven growth and remodeling of embryonic atrioventricular valves. Biomechanics and Modeling in Mechanobiology. 2012;11(8):1205-17.

      The color maps represent the dilatation rates when a) only pressure is applied, b) only shear stress is applied, and c) both pressure and shear stress are applied. It is such load that initiates an asymmetric morphological change, as shown in d). In addition, we believe YAP is involved during the initiation because it is directly nuclear activated by CS and OSS or cytoplasmically activated by TS and LSS.

      3) The differential expression of YAP and its correlation to cell proliferation is a little hard to see in the data presented. Drawings highlighting the main areas would help the reader to visualise the results better.

      We thank the reviewer for this helpful suggestion, we have improved the visualization of Figure 3C and Figure 4C with insets of higher magnification.

      4) The origin of osmotic/hydrostatic pressure in vivo. While shear is clearly dependent upon blood flow, it is less clear that hydrostatic pressure is solely dependent upon blood flow. For example, it has been proposed that ECM accumulation such as hyaluronic acid could modify osmotic pressure (see for example Vignes et al.PMID: 35245444). Could the authors clarify the following questions:

      • How blood flow affects osmotic pressure in vivo?

      • Is ECM a factor that could affect osmotic pressure in this system?

      We thank the reviewer for sharing this interesting study. The osmotic pressure plays a critical role in mechanotransduction and the development of many tissues including cardiovascular tissues and cartilage. As proposed in the reference, osmotic pressure is an interstitial force generated by cardiac contractility. Here in our study, the hydrostatic pressure is different, which is an external force applied by flowing blood. According to Bernoulli's law, when an incompressible fluid flows around a solid, the static pressure it applies on the solid is equal to its total pressure minus its dynamic pressure.

      Despite the difference, the osmotic pressure can mimic the effect of hydrostatic pressure in-vitro. The in-vitro osmotic pressure model has been widely used in cartilage research, for example:

      P. J. Basser, R. Schneiderman, R. A. Bank, E. Wachtel, and A. Maroudas, “Mechanical properties of the collagen network in human articular cartilage as measured by osmotic stress technique.,” Arch. Biochem. Biophys., vol. 351, no. 2, pp. 207–19, 1998.

      D. a. Narmoneva, J. Y. Wang, and L. a. Setton, “Nonuniform swelling-induced residual strains in articular cartilage,” J. Biomech., vol. 32, no. 4, pp. 401–408, 1999.

      C. L. Jablonski, S. Ferguson, A. Pozzi, and A. L. Clark, “Integrin α1β1 participates in chondrocyte transduction of osmotic stress,” Biochem. Biophys. Res. Commun., vol. 445, no. 1, pp. 184–190, 2014.

      Z. I. Johnson, I. M. Shapiro, and M. V. Risbud, “Extracellular osmolarity regulates matrix homeostasis in the intervertebral disc and articular cartilage: Evolving role of TonEBP,” Matrix Biol., vol. 40, pp. 10–16, 2014.

      When maturing cushions shift from GAGs dominated ECM to collagen dominated ECM, the water and ion retention capacity of the tissue would be greatly changed, and thus reducing the osmotic pressure. This could in turn accelerate the maturation of cushions. By contrast, the ECM of growing cushions remain GAGs dominated, which would delay maturation and prolong the growth.

      The revised second section of Results is as follows:

      Shear and hydrostatic stress regulate YAP activity

      In addition to the co-effector of the Hippo pathway, YAP is also a key mediator in mechanotransduction. Indeed, the spatiotemporal activation of YAP correlated with the changes in the mechanical environment. During valve remodeling, unidirectional shear stress (USS) develops on the inflow surface of valves, where YAP is rarely expressed in the nuclei of VECs (Figure 2A). On the other side, OSS develops on the outflow surface, where VECs with nuclear YAP localized. The YAP activation in VICs also correlated with hydrostatic pressure. The pressure generated compressive stress (CS) in the tips of valves, where VICs with nuclear YAP localized (Figure 2B). Whereas tensile stress (TS) was created in the elongated regions, where YAP was absent in VIC nuclei.

      To study the effect of shear stress on the YAP activity in VECs, we applied USS and OSS directly onto a monolayer of freshly isolated VECs. The VEC was obtained from AV cushions of chick embryonic hearts at HH25. The cushions were placed on collagen gels with endocardium adherent to the collagen and incubated to enable the VECs to migrate onto the gel. We then removed the cushions and immediately applied the shear flow to the monolayer for 24 hours. The low stress OSS (2 dyn/cm2) promoted YAP nuclear translocation in VEC (Figure 2C, E), while high stress USS (20 dyn/cm2) restrained YAP in cytoplasm.

      To study the effect of hydrostatic stress on the YAP activation in VICs, we used media with different osmolarities to mimic the CS and TS. CS was induced by hypertonic condition while TS was created by hypotonic condition, and the Unloaded (U) condition refers to the osmotically balanced media. Notably, in-vivo hydrostatic pressure is generated by flowing blood, while in-vivo osmotic pressure is generated by cardiac contractility and plays a critical role in the mechanotransduction during valve development (30). Despite the different in-vivo origination, the osmotic pressure provides a reliable model to mimic the hydrostatic pressure in-vitro (31). We cultured HH34 AV cushion explants under different loading conditions for 24 hours and found that the trapezoidal cushions adopted a spherical shape (Figure 2D). TS loaded cushions significantly compacted, and the YAP activation in VICs of TS loaded cushions was significantly lower than that in CS loaded VICs (Figure 2F).

    1. Author Response

      Reviewer #1 (Public Review):

      1-1. I do have some concerns that the differences in network clustering reported in Fig 6 may be due to noise and I think the comparisons against the HCP parcellation could be more robust. Specifically, with regard to the network clustering in Fig 6. The authors use a clustering algorithm (which is not explained) to cluster the parcels into different functional networks. They achieve this by estimating the mean time series for each parcel in each individual, which they then correlate between the n regions, to generate an nxn connectivity matrix. This they then binarise, before averaging across individuals within an age group. It strikes me that binarising before averaging will artificially reduce connections for which only a subset of individuals are set to zero. Therefore averaging should really occur before binarising. Then I think the stability of these clusters should be explored by creating random repeat and generation groups (as done for the original parcells) or just by bootstrapping the process. I would be interested to see whether after all this the observation that the posterior frontoparietal expands to include the parahippocampal gryus from 3-6 months and then disappears at 9 months - remains.

      We thank the reviewer for this insightful comment on our clustering process. For the step of “binarizing before averaging”, we followed the method proposed by Yeo et al (1). In this method, all correlation matrices are binarized according to the individual-specific thresholds. Specifically, each individual-specific threshold is determined according to the percentile, and only 10% of connections are kept and set to 1, while all other connections are set to 0. Yeo et al. (1) explained their motivation for doing so as “the binarization of the correlation matrix leads to significantly better clustering results, although the algorithm appears robust to the particular choice of the threshold”. We consider that the possible reason is that the binarization of connectivity in each individual offers a certain level of normalization so that each subject can contribute the same number of connections. If averaging occurs before binarizing, the actual connectivity contributed by different subjects would be different, which leads to bias. Meanwhile, we tested the stability of ‘binarizing first’ and ‘averaging first’, and the result is shown in Fig. R1 below. This figure suggests a similar conclusion as (1), where binarizing first before averaging leads to better clustering stability. We added the motivation of binarizing before averaging in the revised manuscript between line 577 and line 581.

      Fig. R1. The comparison of clustering stability of different methods. The red line refers to the clustering stability when binarizing the correlation matrices first and then averaging the matrices across individuals, while the blue line refers to the clustering stability when averaging the correlation matrices across individuals first and then binarizing the average matrix.

      For the final clustering results, we performed our clustering method using bootstrapping 100 times, and the final result is a majority voting of each parcel. The comparison of these two results is shown in Fig. R2. Overall, we do observe good repeatability between these two results. However, we also observed that some parcels show different patterns between the two results, especially for those parcels that are spatially located around the boundaries of networks or the medial wall. The pattern of the observation that “the posterior frontoparietal expands to include the parahippocampal gyrus from 3-6 months and then disappears at 9 months – remains” was not repeated in the bootstrapped results. These results might suggest that the clustering method is quite robust, the discovered patterns are relatively stable, and the differences between our original results and bootstrapping results might be caused by noises or inter-subject variabilities.

      Fig. R2. Top panel: the network clustering results using all data in the original manuscript. Bottom panel: the network clustering results using majority voting through 100 times of bootstrapping. Black circles and red arrows point to the parahippocampal gyrus, which was included in the posterior frontoparietal network, and is not well repeated in the bootstrapped results. (M: months)

      1-2. Then with regard to the comparison against the HCP parcellation, this is only qualitative. The authors should see whether the comparison is quantitatively better relative to the null clusterings that they produce.

      Thank you for this great suggestion! As suggested, we added this quantitative comparison using the Hausdorff distance. Similar to the comparison in parcel variance and homogeneity, the 1,000 null parcellations were created by randomly rotating our parcellation with small angles on the spherical surface 1,000 times. We compared our parcellation and the null parcellations by accordingly evaluating their Hausdorff distances to some specific areas of the HCP parcellation on the spherical space, including Brodmann's area 2, 3b, 4+3a, 44+45, V1, and MT+MST. The results are listed in Figure 4. From the results, we can observe that our parcellation generally shows statistically much lower Hausdorff distances to the HCP parcellation, suggesting that our parcellation generates parcel borders that are closer to HCP parcellations compared to the null parcellations.

      However, we noticed very few null parcellations that show smaller Hausdorff distances compared to our parcellation. A possible reason comes from our surface registration process with the HCP template purely based on cortical folding, without using functional gradient density maps, which are not available in the HCP template. As a result, this does not ensure high-quality functional alignment between our infant data and the HCP space, thus inevitably increasing the Hausdorff distance between our parcellation and the HCP parcellation.

      1-3. … not all individuals appear (from Fig 8) to be acquired exactly at the desired timepoints, so maybe the authors might comment on why they decided not to apply any kernel weighted or smoothing to their averaging? Pg. 8 'and parcel numbers show slight changes that follow a multi-peak fluctuation, with inflection ages of 9 and 18 months' explain - the parcels per age group vary - with age with peaks at 9 and 18 - could this be due to differences in the subject numbers, or the subjects that were scanned at that point?

      We do agree with the reviewer that subjects are not scanned at similar time points. This is designed in the data acquisition protocol to seamlessly cover the early postnatal stage so that we will have a quasi-continuous observation of the dynamic early brain development.

      We didn’t apply kernel weighted average or smoothing when generating the parcellation, as we would like each scan to contribute equally, and each parcellation map could be representative of the cohort of the covered age, instead of only part of them. Meanwhile, our final ‘age-common parcellation’ could be representative of all subjects from birth to 2 years of age. However, we do agree that the parcellation map that is only designed for the use of a specific age, e.g., 1-year-olds, kernel weighted average, or even a more restricted age range could be a more appropriate solution.

      For the parcel number that likely shows fluctuations with subject numbers, we added an experiment, where we randomly selected 100 scans by considering the minimum scan number in each age group using bootstrapping and repeated this process 100 times. The average parcel number of each age is reported in the following Table R1. We didn’t observe strong changes in parcel numbers when reducing scan numbers, which further demonstrates that our parcel numbers do not show a strong relation to subject numbers. However, the parcel number does not increase greatly from 18M to 24M in the bootstrapping results, so we modified the statement in the manuscript about the parcel number to ‘… all parcel numbers fall between 461 to 493 per hemisphere, where the parcel number attains a maximum at around 9 months and then reduces slightly and remains relatively stable afterward. …’, which can be found between line 121 and line 122.

      1-4. I also have some residual concerns over the number of parcels reported, specifically as to whether all of this represents fine-grained functional organisation, or whether some of it represents noise. The number of parcels reported is very high. While Glasser et al 2016 reports 360 as a lower bound, it seems unlikely that the number of parcels estimated by that method would greatly exceed 400. This would align with the previous work of Van Essen et al (which the authors cite as 53) which suggests a high bound of 400 regions. While accepting Eickhoff's argument that a more modular view of parcellation might be appropriate, these are infants with underdeveloped brain function.

      We thank the reviewer for this insightful comment. We agree that there might be noises for some of the parcels, as noises exist in each step, such as data acquisition, image processing, surface reconstruction, and registration, especially considering functional MRI is noisier than structural MRI. Though our experiments show that our parcellation is fine-grained and is suitable for the study of the infant brain functional development, it is hard to directly quantitatively validate as there is no ground truth available.

      Despite these, we are still motivated to create fine-grained parcellations, as with the increase of bigger and higher resolution imaging data and advanced computational methods, parcellations with more fine-grained regions are desired for downstream analyses, especially considering the hierarchical nature of the brain organization (2). And the main reason that our method generates much finer parcellation maps, is that both our registration and parcellation process is based on the functional gradient density, which characterizes a fine-grained feature map based on fMRI. This leads to both better inter-subject alignment in functional boundaries and finer region partitions. This strategy is different from Glasser et al (3), which jointly considers multimodal information for defining parcel boundaries, thus parcels revealed purely by functional MRI might be ignored in the HCP parcellation. We hope our parcellation framework can be a useful reference for this research direction. We added this discussion in the revised manuscript between line 268 and line 271.

      For the parcel number, even without performing surface registration based on fine-grained functional features, recent adult fMRI-based parcellations greatly increased parcel numbers, such as up to 1,000 parcels in Schaefer et al. (4), 518 parcels in Peng et al. (5), and 1,600 parcels in Zhao et al. (6). For infants, we do agree that the infant functional connectivity might not be as strong as in adults. However, there are opinions (7-9) that the basic units of functional organization are likely to present in infant brains, and brain functional development gradually shapes the brain networks. Therefore, the functional parcel units in infants could be possibly on a comparable scale to adults. Even so, we do agree that more research needs to be performed on larger datasets for better evaluations. We added this discussion in the revised manuscript between line 275 and line 280.

      1-5. Further comparisons across different subjects based on small parcels increases the chances of downstream analyses incorporating image registration noise, since as Glasser et al 2016 noted, there are many examples of topographic variation, which diffeomorphic registration cannot match. Therefore averaging across individuals would likely lose this granularity. I'm not sure how to test this beyond showing that the networks work well for downstream analyses but I think these issues should be discussed.

      We agree with the reviewer that averaging across individuals inevitably brings some registration errors to the parcellation, especially for regions with high topographic variation across subjects, which would lead to loss of granularity in these regions. We believe this is an important issue that exists in most methods on group-level parcellations, and the eventual solution might be individualized parcellation, which will be our future work. We added this discussion in the revised manuscript between line 288 and line 292.

      We also agree with the reviewer that downstream analyses are important evaluations for parcellations. We provided a beta version of our parcellation with 602 parcels (10) to our colleagues, and they tested our parcellation in the task of infant individual recognition across ages using functional connectivity, to explore infant functional connectome fingerprinting (10). We compared the performance of different parcellations with 602 ROIs (our beta version), 360 ROIs (HCP MMP parcellation (3)), and 68 ROIs (FreeSurfer parcellation (11)). The results (Fig. R3) show that our parcellation with a higher parcellation number yields better accuracy compared to other parcellations. We added a description of this downstream application in the discussion between line 284 and line 287.

      Fig. R3. The comparison of different parcellations for infant individual recognition across age based on functional connectivity (figure source: Hu et al. (10)). The parcellation with 602 ROIs is the beta version of our parcellation, 360 ROIs stands for HCP MMP parcellation (3) and 68 ROIs stands for the FreeSurfer parcellation (11). This downstream task shows that a higher parcellation number does lead to better accuracy in the application.

      1-6. Finally, I feel the methods lack clarity in some areas and that many key references are missing. In general I don't think that key methods should be described only through references to other papers. And there are many references, particular to FSL papers, that are missing.

      We thank the reviewer for this great suggestion. We added related references for FLIRT, FSL, MCFLIRT, and TOPUP For the alignment to the HCP 32k_LR space, we first aligned all subjects to the fsaverage space using spherical demons, and then used part of the HCP pipeline (12) to map the surface from the fsaverage space to HCP 164k_LR space, and downsampled to 32k_LR space. We modified this citation by referencing the HCP pipeline by Glasser et al. (12) instead and detailed this registration process in the revised manuscript between line 434 to line 440 in the revised manuscript and as below:

      “… The population-mean surface maps were mapped to the HCP 164k ‘fs_LR’ space using the deformation field that deforms the ‘fsaverage’ space to the ‘fs_LR’ space released by Van Essen et al. (13), which was obtained by landmark-based registration. By concatenating the three deformation fields of steps 1, 3, and 4, we directly warped all cortical surfaces from individual scan spaces to the HCP 164k_LR space and then resampled them to 32k_LR using the HCP pipeline (12), thus establishing vertex-to-vertex correspondences across individuals and ages …”

      Reviewer #2 (Public Review):

      2-1. Diminishing enthusiasm is the lack of focus in the result section, the frequent use of jargon, and figures that are often difficult to interpret. If those issues are addressed, the proposed atlas could have a high impact in the field especially as it is aligned with the template of the Human Connectome Project.

      We’d like to thank Reviewer #2 for the appreciation of our atlas. According to the reviewer’s suggestion, we went through the manuscript again by focusing on correcting the use of jargon, clarity in the result section, as well as figures and figure captions. We hope our corrections can help explain our work to a broader community. Our revisions are accordingly detailed in the following. Meanwhile, our parcellation maps have been aligned with the templates in HCP and FreeSurfer and made available via NITRC at: https://www.nitrc.org/projects/infantsurfatlas/.

      References

      1. B. Thomas Yeo, F. M. Krienen, J. Sepulcre, M. R. Sabuncu, D. Lashkari, M. Hollinshead, J. L. Roffman, J. W. Smoller, L. Zöllei, J. R. Polimeni, The organization of the human cerebral cortex estimated by intrinsic functional connectivity. Journal of neurophysiology 106, 1125-1165 (2011).

      2. S. B. Eickhoff, R. T. Constable, B. T. Yeo, Topographic organization of the cerebral cortex and brain cartography. NeuroImage 170, 332-347 (2018).

      3. M. F. Glasser, T. S. Coalson, E. C. Robinson, C. D. Hacker, J. Harwell, E. Yacoub, K. Ugurbil, J. Andersson, C. F. Beckmann, M. Jenkinson, S. M. Smith, D. C. Van Essen, A multi-modal parcellation of human cerebral cortex. Nature 536, 171-178 (2016).

      4. A. Schaefer, R. Kong, E. M. Gordon, T. O. Laumann, X.-N. Zuo, A. J. Holmes, S. B. Eickhoff, B. T. J. C. C. Yeo, Local-global parcellation of the human cerebral cortex from intrinsic functional connectivity MRI. 28, 3095-3114 (2018).

      5. L. Peng, Z. Luo, L.-L. Zeng, C. Hou, H. Shen, Z. Zhou, D. Hu, Parcellating the human brain using resting-state dynamic functional connectivity. Cerebral Cortex, (2022).

      6. J. Zhao, C. Tang, J. Nie, Functional parcellation of individual cerebral cortex based on functional mri. Neuroinformatics 18, 295-306 (2020).

      7. W. Gao, S. Alcauter, J. K. Smith, J. H. Gilmore, W. Lin, Development of human brain cortical network architecture during infancy. Brain Structure and Function 220, 1173-1186 (2015).

      8. W. Gao, H. Zhu, K. S. Giovanello, J. K. Smith, D. Shen, J. H. Gilmore, W. J. P. o. t. N. A. o. S. Lin, Evidence on the emergence of the brain's default network from 2-week-old to 2-year-old healthy pediatric subjects. 106, 6790-6795 (2009).

      9. K. Keunen, S. J. Counsell, M. J. J. N. Benders, The emergence of functional architecture during early brain development. 160, 2-14 (2017).

      10. D. Hu, F. Wang, H. Zhang, Z. Wu, Z. Zhou, G. Li, L. Wang, W. Lin, G. Li, U. U. B. C. P. Consortium, Existence of Functional Connectome Fingerprint during Infancy and Its Stability over Months. Journal of Neuroscience 42, 377-389 (2022).

      11. R. S. Desikan, F. Ségonne, B. Fischl, B. T. Quinn, B. C. Dickerson, D. Blacker, R. L. Buckner, A. M. Dale, R. P. Maguire, B. T. Hyman, An automated labeling system for subdividing the human cerebral cortex on MRI scans into gyral based regions of interest. Neuroimage 31, 968-980 (2006).

      12. M. F. Glasser, S. N. Sotiropoulos, J. A. Wilson, T. S. Coalson, B. Fischl, J. L. Andersson, J. Xu, S. Jbabdi, M. Webster, J. R. Polimeni, The minimal preprocessing pipelines for the Human Connectome Project. NeuroImage 80, 105-124 (2013).

    1. Author Response:

      Reviewer #1 (Public Review):

      The authors present a system that allows the measurement of OCR on diverse tissues. Using two optopes, one before the tissue under examination, and one after, allows the OCR to be measured as the difference between the concentration of O2 in the in-flow gas and the concentration of O2 in the out-flow gas. The system maintains the tissue at a set concentration of dissolved O2 so that experiments can be performed over a long period of time. The authors have provided ample data and full methods and their conclusions are most likely reliable.

      Currently, we know that O2 is critical for diverse physiological processes, however it is rarely as well controlled for as well as non-gas solutes such as glucose, as we lack methods to control its delivery and infer its consumption. By addressing this need, the authors contribute something valuable to the field, which will hopefully be built on by others. The authors have already begun to show the utility of their system by exploring the complicated biology of H2S. As delivering this gas in a controlled manner is hard, often people use NaHS instead. In line with previous studies (well cited by the authors), differences are observed.

      Specific points

      1) The gas control system is used with islets, INS-1 832/12 cells, retinas, and liver tissue, demonstrating its broad applicability.

      2) The system as a platform can have diverse extra measurement modalities attached to it, for example visible-wavelength absorbance and fluorescence. Metabolite concentrations in the tissue culture outflow could also be measured.

      3) The reduction state of cyt c and cyt c oxidase are measured from the second derivative of absorbance at 550 and 605 nm. Ideally, to reliably decompose these signals full spectra around 550-605 nm would be collected. As the authors are only using cytochrome reduction state as a qualitative measure and appear careful to avoid over-interpretation this method should be fine. However, the authors ought to show a representative time course including the fully oxidised and reduced states demonstrating this approach as making these measurements is demanding and will depend on the exact spectroscopic set-up. Without this information it is hard to judge the reliability of the paper.

      We appreciate giving us the latitude for a less robust measurement. However, we actually did do what you have suggested should be done. That is, with the Ocean Optics spectrophotometer, we measure the full light spectrum from 400 to 650. Using this spectral data, we calculate the first and second derivatives of the absorption. We have previously published our approach to spectral analysis, as well as the inclusion of the fully oxidized and reduced states (Sweet IR, G Khalil, AR Wallen, M Steedman, KA Schenkman, JA Reems, SE Kahn, JB Callis. Continuous measurement of oxygen consumption by pancreatic islets. Diabetes Tech. Ther. 4: 661-672, 2002; Sweet IR, Cook DL, DeJulio E, Wallen AR, Khalil G, Callis JB, Reems JA: Regulation of ATP/ADP in pancreatic islets. Diabetes 53:401-409. 2004), so we did not include all the details. In order to ensure that our description is clear, we have added a more thorough explanation that we used spectral analysis and not just data obtained as single wavelengths.

      Reviewer #2 (Public Review):

      The present project is an extension of prior work from this work group in which they describe a technological advancement to their published flow-culture system. Such improvements now incorporate technology that allows for metabolic characterization of mammalian tissues while precisely controlling the concentration of abundant gases (e.g., O2), as well as trace gases (e.g., H2S). The present article demonstrates the utility of this system in the context of hypoxia/re-oxygenation experiments, as well as exposure to H2S. Although the methodology described herein is clearly capable of detecting nuanced metabolic changes in response to variations in O2 or H2S, the lack of a head-to-head comparison with other techniques makes it difficult to discern the potential impact of the technology.

      We understand the benefit of comparing compare a new method with the currently utilized methods. However, the novelty of our methodology is that it is able to control the exposure of tissue to levels of both abundant and trace dissolved gas composition, functions that neither of these existing instruments provide. In addition, continuous flow of media allows maintenance and assessment of tissue models that cannot be accommodated by static or spinner systems. Since we are the first to report an entirely novel technology, the direct comparison to benchmarks is not possible. In the past, however, we have tested liver slices and retina in a Seahorse and the tissue died within 120 minutes presumably due to the lack of flow/reoxygenation in the tissue. In addition, islets placed in spinner systems such as the Oxygraph become fragmented and broken very rapidly. So, a head to head comparison on the tissue OCR response to changes in gas composition cannot be meaningfully carried out for the facets of our method that we highlighted. The methodology we present has capabilities that do not exist in any other commercially available system. We have stated this latter point in the last line of the second paragraph of the Introduction. Regarding the general reliability of the O2 consumption measurement: the unprecedented accuracy and stability of the O2 detectors and the ability of our flow system to maintain tissue for days while generating accurate and reproducible measurements of O2 consumption has previously been established (Sweet IR, Gilbert M, Sabek O, Fraga DW, Gaber AO, Reems JA. Glucose Stimulation of Cytochrome c Reduction and Oxygen Consumption as Assessment of Human Islet Quality. Transplantation 80: 1003- 1011, 2005; Neal AS, Rountree AM, Philips CW, Kavanagh TJ, Williams DP, Newham P, Khalil G, Cook DL, Sweet IR. Quantification of low-level drug effects using real-time, in vitro measurement of oxygen consumption rate. Toxicological Sciences 148: 594-602, 2015).

      In addition, diffusion gradients both in the bath, as well as the tissue itself likely impact the accuracy of the metabolic measurements. This is likely relevant for the liver slices experiments.

      We agree that there are certainly concentration gradients within tissue, and these are increased in the absence of capillary flow. Nonetheless, the gradients will certainly be less than what occurs in static systems. In general, optimal size of tissue pieces are a trade-off between potential for hypoxia if the tissue is too large, and a lack of untraumatized tissue if it is too small. We have added text to address this concern that these effects are to be considered when choosing the size and shape of the liver slices or other tissue models to place into the flow system.

      Following resection, liver tissue can be mechanically permeabilized (PMID: 12054447). In the present experiments, no controls were put in place to discern if the tissue was permeabilized. This could be checked by adding in adenylates and additional carbon substrates and assessing the impact on OCR. Similar controls likely need to be implemented for the islet and retina experiments.

      As we have used flow systems in the past to maintain islets and liver for 24 hours and more (Neal AS, Rountree AM, Kernan K, Van Yserloo B, Zhang H, Reed BJ, Osborne W, Wang W, Sweet IR. Real time imaging of intracellular hydrogen peroxide in pancreatic islets. Biochem. J. 473:4443-4456, 2016; Neal AS, Rountree AM, Philips CW, Kavanagh TJ, Williams DP, Newham P, Khalil G, Cook DL, Sweet IR. Quantification of low-level drug effects using real-time, in vitro measurement of oxygen consumption rate. Toxicological Sciences 148: p. 594-602, 2015) and based on stable OCR we concluded that the tissue is viable. However, it is possible that the membranes of some of the tissue would become permeabilized which would affect the responses to test compounds. We considered this issue from two perspectives. 1. Whether established models that we used to test the BaroFuse were prone to high cell permeability; and 2. Whether loading and maintenance of the tissue models in the fluidics system resulted in increased permeability. We did do experiments measuring the ADP responses in OCR by islets and retina within the fluidics system. Effects were observable but small. However, these results are not definitive, because it was difficult to know what the response in permeabilized tissue was (and permeabilizing tissue slices was difficult). We then used Propidium Iodide staining to visualize and quantify the level of permeability. In islets, the fluorescence in isolated islets before and after perifusion was negligible compared to that in islets permeabilized by H2O2 treatment (see below).

      Fig. 1. Staining of isolated rat islets with the indicator of cell membrane integrity propidium iodide. Islets were stained either before or after a 3-hour perifusion. As a positive control for PI staining, islets were treated with 500 uM H2O2 for 30 minutes and incubated overnight. Each data point was the average +/- SE for an n of 3.

      There was some fluorescence in retina and liver however, but it was difficult to interpret this data in terms of a fraction of the tissue that is permeabilized due to the fact that dye close to the surface of the tissue is preferentially imaged. So, we finally assessed the amount of permeabilized tissue in retina and liver by comparing uptake of 3H H2O and an extracellular marker C14 sucrose.

      Fig. 2. Fraction of tissue water space that is accessible to the extracellular marker sucrose. Left: Mouse retina. Right: Rat liver slice. Each data point was the average +/- SE for an n of 3.

      Extracellular water in liver and retina is well established to be about 25%, close to the volume of distribution of sucrose. Thus, we cannot rule out that there are a small percentage of cells that are permeabilized, but the vast majority are not.

      Additional comments are detailed below:

      -The experiments with H2S are particularly interesting, as this system does seem well suited to investigate the metabolic effects of H2S.

      Thanks! We are excited by the potential for this method to assess the effects of H2S and other trace gases.

      -The authors state the transient rise in O2 consumption was surprising; however, accumulation of succinate during ischemia and rapid oxidation upon reperfusion has been previously demonstrated (PMID: 32863205).

      This is an interesting paper which describes findings that speak to the role of succinate in supplying fuel that could drive the transient changes in O2 consumption observed following hypoxia. It would be an interesting experiment to perform our hypoxia-reoxygenation experiment in the absence and presence of the permeable malonate to see if the spike in O2 consumption following reoxygenation was absent in the presence of the drug. We have removed the word surprising and cited this paper.

      -In the paper, Zaprinast was used to block pyruvate uptake. However, the rationale to use this compound, as opposed to the more specific MPC inhibitor UK5099 is unclear.

      We could have used UK5099, but we had used Zaprinast in past studies (Du J, Cleghorn WM, Contreras L, Lindsay K, Rountree AM, Chertov AO, Turner SJ, Sahaboglu A, Linton J, Sadilek M, Satrústegui I, Sweet IR, Paquet-Durand F, Hurley JB. Inhibition of mitochondrial pyruvate transport by Zaprinast causes massive accumulation of aspartate at the expense of glutamate in retinas. J Biol. Chem, 288:36129-40, 2013) and so we knew that in our hands that it blocked pyruvate mitochondrial uptake and would therefore be a good test of the rapid transfer of pyruvate across the plasma membrane.

      -Throughout the paper, the authors list 'COVID-19' as a potential application. It is not clear how this technology could be used in the context of COVID-19.

      Reference to COVID-19 has been removed.

    1. Author Response:

      Reviewer #1 (Public Review):

      Overall, the authors have done a nice job covering the relevant literature, presenting a story out of complicated data, and performing many thoughtful analyses.

      However, I believe the paper requires quite major revisions.

      We thank the reviewer for their encouraging assessment of our manuscript. We are grateful for their valuable and especially detailed feedback that helped us to substantially improve our manuscript.

      Major issues:

      I do not believe the current results present a clear, comprehensible story about sleep and motor memory consolidation. As presented, sleep predicts an increase in the subsequent learning curve, but there is a negative relationship between learning curve and task proficiency change (which is, as far as I can tell, similar to "memory retention"). This makes it seem as if sleep predicts more forgetting on initial trials within the subsequent block (or worse memory retention) - is this true? Regardless of whether it is statistically true, there appears another story in these data that is being sacrificed to fit a story about sleep. To my eye, the results may first and foremost tell a circadian (rather than sleep) story. Examining the data in Figure 2A and 2B, it appears that every AM learning period has a higher learning curve (slope) than every PM period. While this could, of course, be due to having just slept, the main story gleaned from such a result is not a sleep effect on retention, which has been the emphasis on motor memory consolidation research in the last couple of decades, but on new learning. The fact that this effect appears present in the first session (juggling blocks 1-3 in adolescents and blocks 1-5 in adults) makes this seem the more likely story here, since it has less to do with "preparing one to re-learn" and more to do with just learning and when that learning is optimal. But even if it does not reach statistical significance in the first session alone, it remains a concern and, in my opinion, should be considered a focus in the manuscript unless the authors can devise a reason to definitively rule it out.

      Here is how I recommend the authors proceed on this point: include all sessions from all subjects into a mixed effect model, predicting the slope of the learning curve with time of day and age group as fixed effects and subjects as random effects:

      learning curve slope ~ AM/PM [AM (0) or PM (1)] + age [adolescent (0) or adult (1)] + (1|subject)

      …or something similar with other regressors of interest. If this is significant for AM/PM status, they should re-try the analysis using only the first session. If this is significant, then a sleep-centric story cannot be defended here at all, in my opinion. If it is not (which could simply result from low power, but the authors could decide this), the authors should decide if they think they can rule out circadian effects and proceed accordingly. I should note that, while to many, a sleep story would be more interesting or compelling, that is not my opinion, and I would not solely opt to reject this paper if it centered a time-of-day story instead.

      The authors need to work out precisely what is happening in the behavior here, and let the physiology follow that story. They should allow themselves to consider very major revisions (and drop the physiology) if that is most consistent with the data. As presented, I am very unclear of what to take away from the study.

      We thank the reviewer for the opportunity to further elaborate on our behavioral results. We agree that the interpretation of the behavior in the complex gross-motor task is not straight forward, which might be partly due to less controllability compared to for example finger-tapping tasks. The reviewer is correct that, initially sleep seems to predict more forgetting on initial trials within the subsequent block given the dip in task proficiency and a resulting increase in steepness of the learning curve after the sleep retention interval. Notably, this dip in performance after sleep has also been reported for finger-tapping tasks (cf. Eichenlaub et al, 2020). The performance dip is also present in the wake first group (Figure 2) after the first interval. This observation suggests that picking up the task again after a period of time comes at a cost. Interestingly, this performance dip is no longer present after the second retention interval indicating that the better the task proficiency the easier it is to pick up juggling again. In other words, juggling has been better consolidated after additional training. Critically, our results show, that participants with higher SO-spindle coupling strength have a lower dip in performance after the retention interval, thus indicating a learning advantage.

      Figure 2

      (A) Number of successful three-ball cascades (mean ± standard error of the mean [SEM]) of adolescents (circles) for the sleep-first (blue) and wake-first group (green) per juggling block. Grand average learning curve (black lines) as computed in (C) are superimposed. Dashed lines indicate the timing of the respective retention intervals that separate the three performance tests. Note that adolescents improve their juggling performance across the blocks. (B) Same conventions as in (A) but for adults (diamonds). Similar to adolescents, adults improve their juggling performance across the blocks regardless of group.

      We discuss the sleep effect on juggling in the discussion section (page 22 – 23, lines 502 – 514):

      "How relevant is sleep for real-life gross-motor memory consolidation? We found that sleep impacts the learning curve but did not affect task proficiency in comparison to a wake retention interval (Figure 2DE). Two accounts might explain the absence of a sleep effect on task proficiency. (1) Sleep rather stabilizes than improves gross-motor memory, which is in line with previous gross-motor adaption studies (Bothe et al, 2019; Bothe et al, 2020). (2) Pre-sleep performance is critical for sleep to improve motor skills (Wilhelm et al, 2012). Participants commonly reach asymptotic pre-sleep performance levels in finger tapping tasks, which is most frequently used to probe sleep effects on motor memory. Here we found that using a complex juggling task, participants do not reach asymptotic ceiling performance levels in such a short time. Indeed, the learning progression for the sleep-first and wake-first groups followed a similar trend (Figure 2AB), suggesting that more training and not in particular sleep drove performance gains."

      If indeed the authors keep the sleep aspect of this story, here are some comments regarding the physiology. The authors present several nice analyses in Figure 3. However, given the lack of behavioral difference between adolescents and adults (Fig 2D), they combine the groups when investigating behavior-physiology relationships. In some ways, then, Figure 3 has extraneous details to the point of motor learning and retention, and I believe the paper would benefit from more focus. If the authors keep their sleep story, I believe Figure 3 and 4 should be combined and some current figure panels in Figure 3 should be removed or moved to the supplementary information.

      We thank the reviewers for their suggestion and we agree that the figures of our manuscript would benefit from more focus. Therefore, we combined Figure 3 and 4 from the original manuscript into a revised Figure 3 in the updated version of the manuscript. In more detail, subpanels that explain our methodological approach can now be found in Figure 3 – figure supplement 1, while the updated Figure 3 now focuses on developmental changes in oscillatory dynamics and SO-spindle coupling strength as well as their relationship to gross-motor learning.

      Updated Figure 3:

      (A) Left: topographical distribution of the 1/f corrected SO and spindle amplitude as extracted from the oscillatory residual (Figure 3 – figure supplement 1A, right). Note that adolescents and adults both display the expected topographical distribution of more pronounced frontal SO and centro-parietal spindles. Right: single subject data of the oscillatory residual for all subjects with sleep data color coded by age (darker colors indicate older subjects). SO and spindle frequency ranges are indicated by the dashed boxes. Importantly, subjects displayed high inter-individual variability in the sleep spindle range and a gradual spindle frequency increase by age that is critically underestimated by the group average of the oscillatory residuals (Figure 3 – figure supplement 1A, right). (B) Spindle peak locked epoch (NREM3, co-occurrence corrected) grand averages (mean ± SEM) for adolescents (red) and adults (black). Inset depicts the corresponding SO-filtered (2 Hz lowpass) signal. Grey-shaded areas indicate significant clusters. Note, we found no difference in amplitude after normalization. Significant differences are due to more precise SO-spindle coupling in adults. (C) Top: comparison of SO-spindle coupling strength between adolescents and adults. Adults displayed more precise coupling than adolescents in a centro-parietal cluster. T-scores are transformed to z-scores. Asterisks denote cluster-corrected two-sided p < 0.05. Bottom: Exemplary depiction of coupling strength (mean ± SEM) for adolescents (red) and adults (black) with single subject data points. Exemplary single electrode data (bottom) is shown for C4 instead of Cz to visualize the difference. (D) Cluster-corrected correlations between individual coupling strength and overnight task proficiency change (post – pre retention) for adolescents (red, circle) and adults (black, diamond) of the sleep-first group (left, data at C4). Asterisks indicate cluster-corrected two-sided p < 0.05. Grey-shaded area indicates 95% confidence intervals of the trend line. Participants with a more precise SO-spindle coordination show improved task proficiency after sleep. Note that the change in task proficiency was inversely related to the change in learning curve (cf. Figure 2D), indicating that a stronger improvement in task proficiency related to a flattening of the learning curve. Further note that the significant cluster formed over electrodes close to motor areas. (E) Cluster-corrected correlations between individual coupling strength and overnight learning curve change. Same conventions as in (D). Participants with more precise SO-spindle coupling over C4 showed attenuated learning curves after sleep.

      and

      Figure 3 - figure supplement 1

      (A) Left: Z-normalized EEG power spectra (mean ± SEM) for adolescents (red) and adults (black) during NREM sleep in semi-log space. Data is displayed for the representative electrode Cz unless specified otherwise. Note the overall power difference between adolescents and adults due to a broadband shift on the y-axis. Straight black line denotes cluster-corrected significant differences. Middle: 1/f fractal component that underlies the broadband shift. Right: Oscillatory residual after subtracting the fractal component (A, middle) from the power spectrum (A, left). Both groups show clear delineated peaks in the SO (< 2 Hz) and spindle range (11 – 16 Hz) establishing the presence of the cardinal sleep oscillations in the signal. (B) Top: Spindle frequency peak development based on the oscillatory residuals. Spindle frequency is faster at all but occipital electrodes in adults than in adolescents. T-scores are transformed to z-scores. Asterisks denote cluster-corrected two-sided p < 0.05. Bottom: Exemplary depiction of the spindle frequency (mean ± SEM) for adolescents (red) and adults (black) with single subject data points at Cz. (C) SO-spindle co-occurrence rate (mean ± SEM) for adolescents (red) and adults (black) during NREM2 and NREM3 sleep. Event co-occurrence is higher in NREM3 (F(1, 51) = 1209.09, p < 0.001, partial eta² = 0.96) as well as in adults (F(1, 51) = 11.35, p = 0.001, partial eta² = 0.18). (D) Histogram of co-occurring SO-spindle events in NREM2 (blue) and NREM3 (purple) collapsed across all subjects and electrodes. Note the low co-occurring event count in NREM2 sleep. (E) Single subject (top) and group averages (bottom, mean ± SEM) for adolescents (red) and adults (black) of individually detected, for SO co-occurrence-corrected sleep spindles in NREM3. Spindles were detected based on the information of the oscillatory residual. Note the underlying SO-component (grey) in the spindle detection for single subject data and group averages indicating a spindle amplitude modulation depending on SO-phase. (F) Grand average time frequency plots (-2 to -1.5s baseline-corrected) of SO-trough-locked segments (corrected for spindle co-occurrence) in NREM3 for adolescents (left) and adults (right). Schematic SO is plotted superimposed in grey. Note the alternating power pattern in the spindle frequency range, showing that SO-phase modulates spindle activity in both age groups.

      Why did the authors use Spearman rather than Pearson correlations in Figure 4? Was it to reduce the influence of the outlier subject? They should minimally clarify and justify this, since it is less conventional in this line of research. And it would be useful to know if the relationship is significant with Pearson correlations when robust regression is applied. I see the authors are using MATLAB, and the robustfit toolbox (https://www.mathworks.com/help/stats/robustfit.html) is a simple way to address this issue.

      We thank the reviewers for their suggestion. We agree that when inspecting the scatter plots it looks like that the correlations could be severely influenced by two outliers in the adult group. Because this is an important matter, we recalculated all previously reported correlations without the two outliers (Figure R4, left column) and followed the reviewer’s suggestion to also compute robust regression (Figure R4, right column) and found no substantial deviation from our original results.

      In more detail, increase in task proficiency resulted in flattening of the learning curve when removing outliers (Figure R4A, rhos = -0.70, p < 0.001) and when applying robust regression analysis (Figure R4B, b = -0.30, t(67) = -10.89, rho = -0.80, p < 0.001). Likewise, higher coupling strength still predicted better task proficiency (mean rho = 0.35, p = 0.029, cluster-corrected) and flatter learning curves after sleep (rho = -0.44, p = 0.047, cluster-corrected) when removing the outliers (Figure R4CE) and when calculating robust regression (Figure R4DF, task proficiency: b = 82.32, t(40) = 3.12, rho = 0.45, p = 0.003; learning curve: b = -26.84, t(40) = -2.96, rho = -0.43, p = 0.005). Furthermore, we calculated spearman rank correlations and cluster-corrected spearman rank correlations in our original manuscript, to mitigate the impact of outliers, even though Pearson correlations are more widely used in the field. Therefore, we still report spearman rank correlations for single electrodes instead of robust correlations as it is more consistent with the cluster-correlation analyses.

      We now use robust trend lines instead of linear trend lines in our scatter plots. Further, we added the correlations without outliers (Figure R4ACE) to the supplements as Figure 2 – figure supplement 1D and Figure 3 – figure supplement 2 FG. These additional analyses are now reported in the results section of the revised manuscript (page 9, lines 186 – 191):

      "[…] we confirmed a strong negative correlation between the change (post retention values – pre retention values) in task proficiency and the change in learning curve after the retention interval (Figure 2F; rhos = -0.71, p < 0.001), which also remained strong after outlier removal (Figure 2 – figure supplement 1D). This result indicates that participants who consolidate their juggling performance after a retention interval show slower gains in performance."

      And (page 16, lines 343 – 346):

      "[…] Furthermore, our results remained consistent when including coupled spindle events in NREM2 (Figure 3 – figure supplement 2E) and after outlier removal (Figure 3 – figure supplement 2FG)."

      Furthermore, we now state that we specifically utilized spearman rank correlations to mitigate the impact of outliers in our analyses in the method section (page 35, lines 808 – 813)::

      "For correlational analyses we utilized spearman rank correlations (rhos; Figure 2F & Figure 3DE) to mitigate the impact of possible outliers as well as cluster-corrected spearman rank correlations by transforming the correlation coefficients to t-values (p < 0.05) and clustering in the space domain (Figure 3DE). Linear trend lines were calculated using robust regression."

      Figure R4

      (A) Spearman rank correlation between task proficiency change and learning curve change collapsed across adolescents (red dot) and adults (black diamonds) after removing two outlier subjects in the adult age group. Grey-shaded area indicates 95% confidence intervals of the robust trend line. (B) Robust regression of task proficiency change and learning curve change of the original sample. (C) Cluster-corrected correlations (right) between individual coupling strength and overnight task proficiency change (post – pre retention) after outlier removal (left, spearman correlation at C4, uncorrected). Asterisks indicate cluster-corrected two-sided p < 0.05. (D) Robust regression of coupling strength at C4 and task proficiency of the original sample. (E) Same conventions as in (C) but for overnight learning curve change. (F) Same conventions as in (D) but for overnight learning curve change.

      Additionally, with only a single night of recording data, it is impossible to disentangle possible trait-based sleep characteristics (e.g., Subject 1 has high SO-spindle coupling in general and retains motor memories well, but these are independent of each other) from a specific, state-based account (e.g., Subject 1's high SO-spindle coupling on night 1 specifically led to their improved retention or change in learning, etc., and this is unrelated to their general SO-spindle coupling or motor performance abilities). Clearly, many studies face this limitation, but this should be acknowledged.

      We thank the reviewers for their important remark. We agree that it is impossible to make a sound statement about whether our reported correlations represent trait- or state-based aspects of the sleep and learning relationship with the data that we have reported in the manuscript. However, while we are lacking a proper baseline condition without any task engagement, we still recorded polysomnography for all subjects during an adaptation night. Given the expected pronounced differences in sleep architecture between the adaptation nights and learning nights (see Table R3 for an overview collapsed across both age groups), we initially refrained from entering data from the adaptation nights into our original analyses, but we now fully report the data below. Note that the differences are driven by the adaptation night, where subjects first have to adjust to sleeping with attached EEG electrodes in a sleep laboratory.

      Table R3. Sleep architecture (mean ± standard deviation) for the adaptation and learning night collapsed across both age groups. Nights were compared using paired t-tests

      To further clarify whether subjects with high coupling strength have a motor learning advantage (i.e. trait-effect) or a learning induced enhancement of coupling strength is indicative for improved overnight memory change (i.e. state-effect), we ran additional analyses using the data from the adaptation night. Note that the coupling strength metric was not impacted by differences in event number and our correlations with behavior were not influenced by sleep architecture (please refer to our answer of issue #7 for the results).Therefore, we considered it appropriate to also utilize data from the adaptation night.

      First, we correlated SO-spindle coupling strength obtained from the adaptation night with the coupling strength in the learning night. We found that overall, coupling strength is highly correlated between the two measurements (mean rho across all channels = 0.55, Figure R5A), supporting the notion that coupling strength remains rather stable within the individual (i.e. trait), similar to what has been reported about the stable nature of sleep spindles as a “neural finger-print” (De Gennaro & Ferrara, 2003; De Gennaro et al, 2005; Purcell et al, 2017).

      To investigate a possible state-effect for coupling strength and motor learning, we calculated the difference in coupling strength between the two nights (learning night – adaptation night) and correlated these values with the overnight change in task proficiency and learning curve. We identified no significant correlations with a learning induced coupling strength change; neither for task proficiency nor learning curve change (Figure R5B). Note that there was a positive correlation of coupling strength change with overnight task proficiency change at Cz (Figure R5B, left), however it did not survive cluster-corrected correlational analysis (rhos = 0.34, p = 0.15). Combined, these results favor the conclusion that our correlations between coupling strength and learning rather reflect a trait-like relationship than a state-like relationship. This is in line with the interpretation of our previous studies that SO-spindle coupling strength reflects the efficiency and integrity of the neuronal pathway between neocortex and hippocampus that is paramount for memory networks and the information transfer during sleep (Hahn et al, 2020; Helfrich et al, 2019; Helfrich et al, 2018; Winer et al, 2019). For a comprehensive review please see Helfrich et al (2021), which argued that SO-spindle coupling predicts the integrity of memory pathways and therefore correlates with various metrics of behavioral performance or structural integrity.

      Figure R5

      (A) Topographical plot of spearman rank correlations of coupling strength in the adaptation night and learning night across all subjects. Overall coupling strength was highly correlated between the two measurements. (B) Cluster-corrected correlation between learning induced coupling strength changes (learning night – adaptation night) and overnight change in task proficiency (left) as well as learning curve (right). We found no significant clusters, although correlations showed similar trends as our original analyses, with more learning induced changes in coupling strength resulting in better overnight task proficiency and flattened learning curves.

      We have now added the additional state-trait analyses (Figure R5) to the updated manuscript as Figure 3 – figure supplement 2HI and report them in the results section (page 17, lines 361 – 375):

      "Finally, we investigated whether subjects with high coupling strength have a gross-motor learning advantage (i.e. trait-effect) or a learning induced enhancement of coupling strength is indicative for improved overnight memory change (i.e. state-effect). First, we correlated SO-spindle coupling strength obtained from the adaptation night with the coupling strength in the learning night. We found that overall, coupling strength is highly correlated between the two measurements (mean rho across all channels = 0.55, Figure 3 – figure supplement 2H), supporting the notion that coupling strength remains rather stable within the individual (i.e. trait). Second, we calculated the difference in coupling strength between the learning night and the adaptation night to investigate a possible state-effect. We found no significant cluster-corrected correlations between coupling strength change and task proficiency- as well as learning curve change (Figure 3 – figure supplement 2I).

      Collectively, these results indicate the regionally specific SO-spindle coupling over central EEG sensors encompassing sensorimotor areas precisely indexes learning of a challenging motor task."

      We further refer to these new results in the discussion section (page 23, lines 521 – 528):

      "Moreover, we found that SO-spindle coupling strength remains remarkably stable between two nights, which also explains why a learning-induced change in coupling strength did not relate to behavior (Figure 3 – figure supplement 2I). Thus, our results primarily suggest that strength of SO-spindle coupling correlates with the ability to learn (trait), but does not solely convey the recently learned information. This set of findings is in line with recent ideas that strong coupling indexes individuals with highly efficient subcortical-cortical network communication (Helfrich et al, 2021)."

      Additionally, we now provide descriptive data of the adaptation and learning night (Table R3) in the Supplementary file – table 1 and explicitly mention the adaptation night in the results section, which was previously only mentioned in the method section(page 6, lines 101 – 105):.

      "Polysomnography (PSG) was recorded during an adaptation night and during the respective sleep retention interval (i.e. learning night) except for the adult wake-first group (for sleep architecture descriptive parameters of the adaptation night and learning night as well as for adolescents and adults see Supplementary file – table 1 & 2)."

      Reviewer #2 (Public Review):

      In this study Hahn and colleagues investigate the role of Slow-oscillation spindle coupling for motor memory consolidation and the impact of brain maturation on these interactions. The authors employed a real-life gross-motor task, where adolescents and adults learned to juggle. They demonstrate that during post-learning sleep SO-spindles are stronger coupled in adults as compared to adolescents. The authors further show, that the strength of SO-spindle coupling correlates with overnight changes in the learning curve and task proficiency, indicating a role of SO-spindle coupling in motor memory consolidation.

      Overall, the topic and the results of the present study are interesting and timely. The authors employed state of the art analyse carefully taking the general variability of oscillatory features into account. It also has to be acknowledged that the authors moved away from using rather artificial lab-tasks to study the consolidation of motor memories (as it is standard in the field), adding ecological validity to their findings. However, some features of their analyses need further clarification.

      We thank the reviewer for their positive assessment of our manuscript. Incorporating the encouraging and helpful feedback, we believe that we substantially improved the clarity and robustness of our analyses.

      1) Supporting and extending previous work of the authors (Hahn et al, 2020), SO-spindle coupling over centro-parietal areas was stronger in adults as compared to adolescents. Despite these differences in the EEG results the authors collapsed the data of adults and adolescents for their correlational analyses (Fig. 4a and 4b). Why would the authors think that this procedure is viable (also given the fact that different EEG systems were used to record the data)?

      We thank the reviewers for the opportunity to clarify why we think it is viable to collapse the data of adolescents and adults for our correlational analyses. In the following we split our answers based on the two points raised by the reviewers: (1) electrophysiological differences (i.e. coupling strength) between the groups and (2) potential signal differences due to different EEG systems.

      1. Electrophysiological differences

      Upon inspecting the original Figure 4, it is apparent that the coupling strength of the combined sample does not form isolated clusters for each age group. In other words, while adult coupling strength is on the higher and adolescent coupling on the lower end due to the developmental increase in coupling strength we reported in the original Figure 3F, both samples overlap forming a linear trend. Second, when running the correlational analyses between coupling strength and task proficiency as well as learning curve separately for each age group, we found that they follow the same direction (Figure R3). Adolescents with higher coupling strength show better task proficiency (Figure R3A, rhos = 0.66, p = 0.005). This effect was also present when using robust regression (b = 109.97, t(15)=3.13, rho = 0.63, p = 0.007). Like adolescents, adults with higher coupling strength at C4 displayed better task proficiency after sleep (Figure R3B, rhos = 0.39, p = 0.053). This relationship was stronger when using robust regression (b = 151.36, t(23)=3.17, rho =0.56, p = 0.004). For learning curves, we found the expected negative correlation at C4 for adolescents (Figure R3C, rhos = -0.57, p = 0.020) and adults (Figure R3D, rhos = -0.44, p = 0.031). Results were comparable when using robust regression (adolescents: b = -59.58, t(15) = -2.94, rho = -0.60, p = 0.010; adults: b = -21.99, t(23 )= -1.71, rho = -0.37, p = 0.101).

      Taken together, these results demonstrate that adolescents and adults show the effects and the same direction at the same electrode, thus, making it highly unlikely that our results are just by chance and that our initial correlation analyses are just driven by one group.

      Additionally, we already controlled for age in our original analyses using partial correlations (also refer to our answer to issue #6). Hence, our additional analyses provide additional support that it is viable to collapse the analyses across both age groups even though they differ in coupling strength.

      1. Different EEG-systems

        The reviewers also raise the question whether our analyses might be impacted by the different EEG systems we used to record our data. This is an important concern especially when considering that cross-frequency coupling analyses can be severely confounded by differences in signal properties (Aru et al, 2015). In our sample, the strongest impact factor on signal properties is most likely age, given the broadband power differences in the power spectrum we found between the groups (original Figure 3A). Importantly, we also found a similar systematic power difference in our longitudinal study using the same ambulatory EEG system for both data recordings (Hahn et al, 2020). This is in line with numerous other studies demonstrating age related EEG power changes in broadband- as well as SO and sleep spindle frequency ranges (Campbell & Feinberg, 2016; Feinberg & Campbell, 2013; Helfrich et al, 2018; Kurth et al, 2010; Muehlroth et al, 2019; Muehlroth & Werkle-Bergner, 2020; Purcell et al, 2017). Therefore, we already had to take differences in signal property into account for our cross-frequency analyses. Regardless whether the underlying cause is an age difference or different signal-to-noise ratios of different EEG systems.

      To mitigate confounds in the signal, we used a data-driven and individualized approach detecting SO and sleep spindle events based on individualized frequency bands and a 75-percentile amplitude criterion relative to the underlying signal. Additionally we z-normalized all spindle events prior to the cross-frequency coupling analyses (Figure R3E). We found no amplitude differences around the spindle peak (point of SO-phase readout) between adolescents that were recorded with an ambulatory amplifier system (alphatrace) and adults that were recorded with a stationary amplifier system (neuroscan) using cluster-based random permutation testing. This was also the case for the SO-filtered (< 2 Hz) signal (Figure R3E, inset). Critically, the significant differences in amplitude from -1.4 to -0.8 s (p = 0.023, d = -0.73) and 0.4 to 1.5 s (p < 0.001, d = 1.1) are not caused by age related differences in power or different EEG-systems but instead by the increased coupling strength (i.e. higher coupling precision of spindles to SOs) in adults giving rise to a more pronounced SO-wave shape when averaging across spindle peak locked epochs.

      Consequently, our analysis pipeline already controlled for possible differences in signal property introduced through different amplifier systems. Nonetheless, we also wanted to directly compare the signal-to-noise ratio of the ambulatory and stationary amplifier systems. However, we only obtained data from both amplifier systems in the adult sleep first group, because we recorded EEG during the juggling learning phase with the ambulatory system in addition to the PSG with the stationary system. First, we computed the power spectra in the 1 to 49 Hz frequency range during the juggling learning phase (ambulatory) and during quiet wakefulness (stationary) for every subject in the adult sleep first group in 10-seconds segments. Next, we computed the signal-to-noise ratio (mean/standard deviation) of the power spectra per frequency across all segments. We only found a small negative cluster from 21.9 to 22.5 Hz (p = 0.042, d = 0.53; Figure R3F), which did not pertain our frequency-bands of interest. Critically, the signal-to-noise ratio of both amplifiers converged in the upper frequency bands approaching the noise floor, therefore, strongly supporting the notion that both systems in fact provided highly comparable estimates.

      In conclusion, both age groups display highly similar effects and direction when correlating coupling strength with behavior. Further, after individualization and normalization the analytical signal, we found no differences in signal properties that would confound the cross-frequency analysis. Lastly, we did not find systematic differences in signal-to-noise ratio between the different EEG-systems. Thus, we believe it is justified to collapse the data across all participants for the correlational analyses, as it combines both, the developmental aspect of enhanced coupling precision from adolescence to adulthood and the behavioral relevance for motor learning which we deem a critical research advance from our previous study.

      Figure R3

      (A) Cluster-corrected correlations (right) between individual coupling strength and overnight task proficiency change (post – pre retention) for adolescents of the sleep-first group (left, spearman correlation at C4, uncorrected). Asterisks indicate cluster-corrected two-sided p < 0.05. Grey-shaded area indicates 95% confidence intervals of the robust trend line. Participants with a more precise SO-spindle coordination show improved task proficiency after sleep. (B) Cluster-corrected correlation of coupling strength and overnight task proficiency change) for adults. Same conventions as in (A). Similar trend of higher coupling strength predicting better task proficiency after sleep (C) Cluster-corrected correlation of coupling strength and overnight learning curve change for adolescents. Same conventions as in (A). Higher coupling strength related to a flatter learning curve after sleep. (D) Cluster-corrected correlation of coupling strength and overnight learning curve change for adults. Same conventions as in (A). Higher coupling strength related to a flatter learning curve after sleep. (E) Spindle peak locked epoch (NREM3, co-occurrence corrected) grand averages (mean ± SEM) for adolescents (red) and adults (black). Inset depicts the corresponding SO-filtered (2 Hz lowpass) signal. Black lines indicate significant clusters. Note, we found no difference in amplitude after normalization. Significant differences are due to more precise SO-spindle coupling in adults. Spindle frequency is blurred due to individualized spindle detection. (F) Signal-to-noise ratio for the stationary EEG amplifier (green) during quiet wakefulness and for the ambulatory EEG amplifier (purple) during juggling training. Grey shaded area denotes cluster-corrected p < 0.05. Note that signal-to-noise ratio converges in the higher frequency ranges.

      We have now added Figure R3E as Figure 3B to the revised version of the manuscript to demonstrate that there were no systematic differences between the two age groups in the analytical signal due to the expected age related power differences or EEG-systems. Specifically, we now state in the results section (page 13 – 14, lines 282 – 294):

      "We assessed the cross frequency coupling based on z-normalized spindle epochs (Figure 3B) to alleviate potential power differences due to age (Figure 3 – figure supplement 1A) or different EEG-amplifier systems that could potentially confound our analyses (Aru et al, 2015). Importantly, we found no amplitude differences around the spindle peak (point of SO-phase readout) between adolescents and adults using cluster-based random permutation testing (Figure 3B), indicating an unbiased analytical signal. This was also the case for the SO-filtered (< 2 Hz) signal (Figure 3B, inset). Critically, the significant differences in amplitude from -1.4 to -0.8 s (p = 0.023, d = -0.73) and 0.4 to 1.5 s (p < 0.001, d = 1.1) are not caused by age related differences in power or different EEG-systems but instead by the increased coupling strength (i.e. higher coupling precision of spindles to SOs) in adults giving rise to a more pronounced SO-wave shape when averaging across spindle peak locked epochs."

      Further, we added the correlational analyses that we computed separately for the age groups (Figure R3A-D) to the revised manuscript (Figure 3 – figure supplement 2CD) as they further substantiate our claims about the relationship between SO-spindle coupling and gross-motor learning.

      We now refer to these analyses in the results section (page 16, lines 338 – 343):

      "Critically, when computing the correlational analyses separately for adolescents and adults, we identified highly similar effects at electrode C4 for task proficiency (Figure 3 – figure supplement 2C) and learning curve (Figure 3 – figure supplement 2D) in each group. These complementary results demonstrate that coupling strength predicts gross-motor learning dynamics in both, adolescents as well as adults, and further show that this effect is not solely driven by one group."

      2) The authors might want to explicitly show that the reported correlations (with regards to both learning curve and task proficiency change) are not driven by any outliers.

      We thank the reviewers for their suggestion. We agree that when inspecting the scatter plots it looks like that the correlations could be severely influenced by two outliers in the adult group. Because this is an important matter, we recalculated all previously reported correlations without the two outliers (Figure R4, left column) and followed the reviewer’s suggestion to also compute robust regression (Figure R4, right column) and found no substantial deviation from our original results.

      In more detail, increase in task proficiency resulted in flattening of the learning curve when removing outliers (Figure R4A, rhos = -0.70, p < 0.001) and when applying robust regression analysis (Figure R4B, b = -0.30, t(67) = -10.89, rho = -0.80, p < 0.001). Likewise, higher coupling strength still predicted better task proficiency (mean rho = 0.35, p = 0.029, cluster-corrected) and flatter learning curves after sleep (rho = -0.44, p = 0.047, cluster-corrected) when removing the outliers (Figure R4CE) and when calculating robust regression (Figure R4DF, task proficiency: b = 82.32, t(40) = 3.12, rho = 0.45, p = 0.003; learning curve: b = -26.84, t(40) = -2.96, rho = -0.43, p = 0.005). Furthermore, we calculated spearman rank correlations and cluster-corrected spearman rank correlations in our original manuscript, to mitigate the impact of outliers, even though Pearson correlations are more widely used in the field. Therefore, we still report spearman rank correlations for single electrodes instead of robust correlations as it is more consistent with the cluster-correlation analyses.

      We now use robust trend lines instead of linear trend lines in our scatter plots. Further, we added the correlations without outliers (Figure R4ACE) to the supplements as Figure 2 – figure supplement 1D and Figure 3 – figure supplement 2 FG. These additional analyses are now reported in the results section of the revised manuscript (page 9, lines 186 – 191):

      "[…] we confirmed a strong negative correlation between the change (post retention values – pre retention values) in task proficiency and the change in learning curve after the retention interval (Figure 2F; rhos = -0.71, p < 0.001), which also remained strong after outlier removal (Figure 2 – figure supplement 1D). This result indicates that participants who consolidate their juggling performance after a retention interval show slower gains in performance."

      And (page 16, lines 343 – 346):

      "[…] Furthermore, our results remained consistent when including coupled spindle events in NREM2 (Figure 3 – figure supplement 2E) and after outlier removal (Figure 3 – figure supplement 2FG)."

      Furthermore, we now state that we specifically utilized spearman rank correlations to mitigate the impact of outliers in our analyses in the method section (page 35, lines 808 – 813)::

      "For correlational analyses we utilized spearman rank correlations (rhos; Figure 2F & Figure 3DE) to mitigate the impact of possible outliers as well as cluster-corrected spearman rank correlations by transforming the correlation coefficients to t-values (p < 0.05) and clustering in the space domain (Figure 3DE). Linear trend lines were calculated using robust regression."

      Figure R4:

      (A) Spearman rank correlation between task proficiency change and learning curve change collapsed across adolescents (red dot) and adults (black diamonds) after removing two outlier subjects in the adult age group. Grey-shaded area indicates 95% confidence intervals of the robust trend line. (B) Robust regression of task proficiency change and learning curve change of the original sample. (C) Cluster-corrected correlations (right) between individual coupling strength and overnight task proficiency change (post – pre retention) after outlier removal (left, spearman correlation at C4, uncorrected). Asterisks indicate cluster-corrected two-sided p < 0.05. (D) Robust regression of coupling strength at C4 and task proficiency of the original sample. (E) Same conventions as in (C) but for overnight learning curve change. (F) Same conventions as in (D) but for overnight learning curve change.

      3) The sleep data of all participants (thus from both sleep first and wake first) were used to determine the features of SO-spindle coupling in adolescents and adults. Were there any differences between groups (sleep first vs. wake first)? This might be in interesting in general but especially because only data of the sleep first group entered the subsequent correlational analyses.

      We thank the reviewers for their remark. We agree that adding additional information about possible differences between the sleep first and wake first groups would allow for a more comprehensive assessment of the reported data. We did not explain our reasoning to include only the sleep first groups for the correlation analyses clearly enough in the original manuscript. Unfortunately, we can only report data for the adolescents in our sample, because we did not record polysomnography (PSG) for the adult wake first group. This is also one of the two reasons why we focused on the sleep first groups for our correlational analyses.

      Adolescents in the sleep first group did not differ from adolescents in the wake first group in terms of sleep architecture (except REM (%), which did not correlate with behavior [task proficiency: rho = -0.17, p = 0.28; learning curve: -0.02, p = 0.90]) as well as SO and sleep spindle event descriptive measures (see Table R2). Importantly, we found no differences in coupling strength between the two groups (Figure R2A).

      Table R2. Summary of sleep architecture and SO/spindle event descriptive measures (at electrode C4) of adolescents in the sleep first and wake first group (mean ± standard deviation). Independent t-tests were used for comparisons

      The second reason why we focused our analyses on sleep first was that adolescents in the wake first group had higher task proficiency after the sleep retention interval than the sleep first group (Figure R2A; t(23) = -2.24, p = 0.034). This difference in performance is directly explained by the additional juggling test that the wake first group performed at the time point of their learning night, which should be considered as additional training. Therefore, we excluded the wake first group from our correlational analyses because sleep and wake first group are not comparable in terms of juggling training during the night when we assessed SO-spindle coupling strength.

      Figure R2

      (A) Comparison of SO-spindle coupling strength in the adolescent sleep first (blue) and wake first (green) group using cluster-based random permutation testing (Monte-Carlo method, cluster alpha 0.05, max size criterion, 1000 iterations, critical alpha level 0.05, two-sided). Left: exemplary depiction of coupling strength at electrode C4 (mean ± SEM). Right: z-transformed t-values plotted for all electrodes obtained from the cluster test. No significant clusters emerged. (B) Comparison of task proficiency between sleep first and wake first group after the sleep retention interval (mean ± SEM). Adolescents in the wake first group had higher task proficiency given the additional juggling performance test, which also reflects additional training.

      These additional analyses (Figure R2) and the summary statistics of sleep architecture and SO/spindle event descriptives of adolescents in the sleep first and wake first group (Table R2), are now reported in the revised version of the manuscript as Figure 3 – figure supplement 2AB and Supplementary file – table 7. We now explicitly explain our rationale of why we only considered participants in the sleep first group for our correlational analyses in the results section (page 6, lines 101 – 105):

      "Polysomnography (PSG) was recorded during an adaptation night and during the respective sleep retention interval (i.e. learning night) except for the adult wake-first group (for sleep architecture descriptive parameters of the adaptation night and learning night as well as for adolescents and adults see Supplementary file – table 1 & 2)"

      And (page 15, lines 311 – 320):

      "[…] Furthermore, given that we only recorded polysomnography for the adults in the sleep first group and that adolescents in the wake first group showed enhanced task proficiency at the time point of the sleep retention interval due to additional training (Figure 3 – figure supplement 2A), we only considered adolescents and adults of the sleep-first group to ensure a similar level of juggling experience adolescents and adults of the sleep-first group to ensure a similar level of juggling experience (for summary statistics of sleep architecture and SO and spindle events of subjects that entered the correlational analyses see Supplementary file – table 6). Notably, we found no differences in electrophysiological parameters (i.e. coupling strength, event detection) between the adolescents of the wake first and sleep first group (Figure 3 – figure supplement 2B & Supplementary file – table 7)."

      4) To allow a more comprehensive assessment of the underlying data information with regards to general sleep descriptives (minutes, per cent of time spent in different sleep stages, overall sleep time etc.) as well as related to SOs, spindles and coupled events (e.g. number, density etc.) would be needed.

      We agree with the reviewers that additional information about sleep architecture and SO as well as sleep spindle characteristics are needed for a more comprehensive assessment of our data. We now added summary tables for sleep architecture and SO/spindle event descriptive measures for the whole sample (Table R4) and for the sleep first groups that we used for our correlational analyses (Table R5) to the supplementary material in the updated manuscript. It is important to note, that due to the longer sleep opportunity of adolescents that we provided to accommodate the overall higher sleep need in younger participants, adolescents and adults differed in most general sleep architecture markers and SO as well as sleep spindle descriptive measures. In addition, changes in sleep architecture are prominent during the maturational phase from adolescence to adulthood, which might introduce additional variance between the two age groups.

      Table R4. Summary of sleep architecture and SO/spindle event descriptive measures (at electrode C4) of adolescents and adults across the whole sample (mean ± standard deviation) in the learning night. Independent t-tests were used for comparisons

      Table R5. Summary of sleep architecture and SO/spindle event descriptive measures (at electrode C4) of adolescents and adults in the sleep first group (mean ± standard deviation) in the learning night. Independent t-tests were used for comparisons

      In order to ensure that our correlational analyses are not driven by these systematic differences between the two age groups, we used cluster-corrected partial correlations to control for sleep architecture markers (Figure R7) and SO/spindle descriptive measurements (Figure R8A). Critically, none of these possible confounders changed the pattern of our initial correlational analyses of coupling strength and task proficiency/learning curve. Additionally, we also controlled for differences in spindle event number by using a bootstrapped resampling approach. We randomly drew 200 spindle events in 100 iterations and subsequently recalculated the coupling strength for each subject. We found that resampled values and our original observation of coupling strength are almost perfectly correlated, indicating that differences in event number are unlikely to have an impact on coupling strength as long as there are at least 200 events (Figure R8B). Combined these analyses demonstrate that our correlations between coupling strength and behavior are not influenced by the reported differences in sleep architecture and SO/spindle descriptive measures.

      Figure 7R

      Summary of cluster-corrected partial correlations of coupling strength with task proficiency (left) and learning curve (right) controlling for possible confounding factors. Asterisks indicate location of the detected cluster. The pattern of initial results remained highly stable.

      Figure R8

      (A) Summary of cluster-corrected partial correlations of coupling strength with task proficiency (left) and learning curve (right) controlling SO/spindle descriptive measures at critical electrode C4. Asterisks indicate location of the detected cluster. The pattern of initial results remained highly stable. (B) Spearman correlation between resampled coupling strength (N = 200, 100 iterations) and original observation of coupling strength for adolescents (red circles) and adults (black diamonds), indicating that coupling strength is not influenced by spindle event number if at least 200 events are present. Grey-shaded area indicates 95% confidence intervals of the robust trend line.

      We now provide general sleep descriptives (Table R4 & R5) in the revised version of the manuscript as Supplementary file – table 2 & table 6. These data are referred to in the results section (page 6, lines 101 – 105):

      "Polysomnography (PSG) was recorded during an adaptation night and during the respective sleep retention interval (i.e. learning night) except for the adult wake-first group (for sleep architecture descriptive parameters of the adaptation night and learning night as well as for adolescents and adults see Supplementary file – table 1 & 2)."

      And (page 15, lines 311 – 318):

      "Furthermore, given that we only recorded polysomnography for the adults in the sleep first group and that adolescents in the wake first group showed enhanced task proficiency at the time point of the sleep retention interval due to additional training (Figure 3 – figure supplement 2A), we only considered adolescents and adults of the sleep-first group to ensure a similar level of juggling experience (for summary statistics of sleep architecture and SO and spindle events of subjects that entered the correlational analyses see Supplementary file – table 6)."

      The additional control analyses (Figure R7 & R8) are also now added to the revised manuscript as Figure 3 – figure supplement 3 & 4 in the results section (page 16, lines 356 – 360):

      "For a summary of the reported cluster-corrected partial correlations as well as analyses controlling for differences in sleep architecture see Figure 3 – figure supplement 3. Further, we also confirmed that our correlations are not influenced by individual differences in SO and spindle event parameters (Figure 3 – figure supplement 4)."

      5) The authors used a partial correlations to rule out that age drove the relationship between coupling strength, learning curve and task proficiency. It seems like this analysis was done specifically for electrode C4, after having already established that coupling strength at electrode C4 correlates in general with changes in the learning curve and task proficiency. I think the claim that results were not driven by age as confounding factor would be stronger if the authors used a cluster-corrected partial correlation in the first place (just as in the main analysis).

      The reviewers are correct that initially we only conducted the partial correlation for electrode C4. Following the reviewers suggestion we now additionally computed cluster-corrected partial correlations similar to our main analysis. Like in our original analyses, we found a significant positive central cluster (Figure R6A, mean rho = 0.40, p = 0.017) showing that higher coupling strength related to better task proficiency after sleep and a negative cluster-corrected correlation at C4 showing that higher coupling strength was related to flatter learning curves after sleep (Figure R6B, rho = -0.47, p = 0.049) also when controlling for age.

      Figure R6

      (A) Cluster-corrected partial correlation of individual coupling strength in the learning night and overnight change in task proficiency (post – pre retention) collapsed across adolescents and adults, controlling for age. Asterisks indicate cluster-corrected two-sided p < 0.05. A similar significant cluster to the original analysis (Figure 4A) emerged comprising electrodes Cz and C4. (B) Same conventions as in A. Like in the original analysis (Figure 4B) a negative correlation between coupling strength at C4 and learning curve change survived cluster-corrected partial correlations when controlling for age.

      We now always report cluster-corrected partial correlations when controlling for possible confounding variables in the updated version of the manuscript (also see answer to issue #7). A summary of all computed partial correlations including Figure R6 can now be found as Figure 3 – figure supplement 3 & 4 in the revised manuscript.

      Specifically we now state in the results section (page 16 – 17, lines 347 – 360):

      "To rule out age as a confounding factor that could drive the relationship between coupling strength, learning curve and task proficiency in the mixed sample, we used cluster-corrected partial correlations to confirm their independence of age differences (task proficiency: mean rho = 0.40, p = 0.017; learning curve: rhos = -0.47, p = 0.049). Additionally, given that we found that juggling performance could underlie a circadian modulation we controlled for individual differences in alertness between subjects due to having just slept. We partialed out the mean PVT reaction time before the juggling performance test after sleep from the original analyses and found that our results remained stable (task proficiency: mean rho = 0.37, p = 0.025; learning curve: rhos = -0.49, p = 0.040). For a summary of the reported cluster-corrected partial correlations as well as analyses controlling for differences in sleep architecture see Figure 3 – figure supplement 3. Further, we also confirmed that our correlations are not influenced by individual differences in SO and spindle event parameters (Figure 3 – figure supplement 4)."

      And in the methods section (page 35, lines 813 – 814):

      "To control for possible confounding factors we computed cluster-corrected partial rank correlations (Figure 3 – figure supplement 3 and 4)."

      References

      Aru, J., Aru, J., Priesemann, V., Wibral, M., Lana, L., Pipa, G., Singer, W. & Vicente, R. (2015) Untangling cross-frequency coupling in neuroscience. Curr Opin Neurobiol, 31, 51-61.

      Bothe, K., Hirschauer, F., Wiesinger, H. P., Edfelder, J., Gruber, G., Birklbauer, J. & Hoedlmoser, K. (2019) The impact of sleep on complex gross-motor adaptation in adolescents. Journal of Sleep Research, 28(4).

      Bothe, K., Hirschauer, F., Wiesinger, H. P., Edfelder, J. M., Gruber, G., Hoedlmoser, K. & Birklbauer, J. (2020) Gross motor adaptation benefits from sleep after training. J Sleep Res, 29(5), e12961.

      Campbell, I. G. & Feinberg, I. (2016) Maturational Patterns of Sigma Frequency Power Across Childhood and Adolescence: A Longitudinal Study. Sleep, 39(1), 193-201.

      Dayan, E. & Cohen, L. G. (2011) Neuroplasticity subserving motor skill learning. Neuron, 72(3), 443-54. De Gennaro, L. & Ferrara, M. (2003) Sleep spindles: an overview. Sleep Med Rev, 7(5), 423-40.

      De Gennaro, L., Ferrara, M., Vecchio, F., Curcio, G. & Bertini, M. (2005) An electroencephalographic fingerprint of human sleep. Neuroimage, 26(1), 114-22.

      Dinges, D. F., Pack, F., Williams, K., Gillen, K. A., Powell, J. W., Ott, G. E., Aptowicz, C. & Pack, A. I. (1997) Cumulative sleepiness, mood disturbance, and psychomotor vigilance performance decrements during a week of sleep restricted to 4-5 hours per night. Sleep, 20(4), 267-77.

      Dinges, D. F. & Powell, J. W. (1985) Microcomputer Analyses of Performance on a Portable, Simple Visual Rt Task during Sustained Operations. Behavior Research Methods Instruments & Computers, 17(6), 652-655.

      Eichenlaub, J. B., Biswal, S., Peled, N., Rivilis, N., Golby, A. J., Lee, J. W., Westover, M. B., Halgren, E. & Cash, S. S. (2020) Reactivation of Motor-Related Gamma Activity in Human NREM Sleep. Front Neurosci, 14, 449.

      Feinberg, I. & Campbell, I. G. (2013) Longitudinal sleep EEG trajectories indicate complex patterns of adolescent brain maturation. American Journal of Physiology - Regulatory, Integrative and Comparative Physiology, 304(4), R296-303.

      Hahn, M., Heib, D., Schabus, M., Hoedlmoser, K. & Helfrich, R. F. (2020) Slow oscillation-spindle coupling predicts enhanced memory formation from childhood to adolescence. Elife, 9.

      Helfrich, R. F., Lendner, J. D. & Knight, R. T. (2021) Aperiodic sleep networks promote memory consolidation. Trends Cogn Sci.

      Helfrich, R. F., Lendner, J. D., Mander, B. A., Guillen, H., Paff, M., Mnatsakanyan, L., Vadera, S., Walker, M. P., Lin, J. J. & T., K. R. (2019) Bidirectional prefrontal-hippocampal dynamics organize information transfer during sleep in humans. Nature Communications, 10(1), 3572.

      Helfrich, R. F., Mander, B. A., Jagust, W. J., Knight, R. T. & Walker, M. P. (2018) Old Brains Come Uncoupled in Sleep: Slow Wave-Spindle Synchrony, Brain Atrophy, and Forgetting. Neuron, 97(1), 221-230 e4.

      Killgore, W. D. (2010) Effects of sleep deprivation on cognition. Prog Brain Res, 185, 105-29.

      Kurth, S., Jenni, O. G., Riedner, B. A., Tononi, G., Carskadon, M. A. & Huber, R. (2010) Characteristics of sleep slow waves in children and adolescents. Sleep, 33(4), 475-80.

      Maris, E. & Oostenveld, R. (2007) Nonparametric statistical testing of EEG- and MEG-data. J Neurosci Methods, 164(1), 177-90.

      Muehlroth, B. E., Sander, M. C., Fandakova, Y., Grandy, T. H., Rasch, B., Shing, Y. L. & Werkle-Bergner, M. (2019) Precise Slow Oscillation-Spindle Coupling Promotes Memory Consolidation in Younger and Older Adults. Sci Rep, 9(1), 1940.

      Muehlroth, B. E. & Werkle-Bergner, M. (2020) Understanding the interplay of sleep and aging: Methodological challenges. Psychophysiology, 57(3), e13523.

      Niethard, N., Ngo, H. V. V., Ehrlich, I. & Born, J. (2018) Cortical circuit activity underlying sleep slow oscillations and spindles. Proceedings of the National Academy of Sciences of the United States of America, 115(39), E9220-E9229.

      Purcell, S. M., Manoach, D. S., Demanuele, C., Cade, B. E., Mariani, S., Cox, R., Panagiotaropoulou, G., Saxena, R., Pan, J. Q., Smoller, J. W., Redline, S. & Stickgold, R. (2017) Characterizing sleep spindles in 11,630 individuals from the National Sleep Research Resource. Nature Communications, 8, 15930.

      Van Dongen, H. P., Maislin, G., Mullington, J. M. & Dinges, D. F. (2003) The cumulative cost of additional wakefulness: dose-response effects on neurobehavioral functions and sleep physiology from chronic sleep restriction and total sleep deprivation. Sleep, 26(2), 117-26.

      Wilhelm, I., Metzkow-Meszaros, M., Knapp, S. & Born, J. (2012) Sleep-dependent consolidation of procedural motor memories in children and adults: the pre-sleep level of performance matters. Developmental Science, 15(4), 506-15.

      Winer, J. R., Mander, B. A., Helfrich, R. F., Maass, A., Harrison, T. M., Baker, S. L., Knight, R. T., Jagust, W. J. & Walker, M. P. (2019) Sleep as a potential biomarker of tau and beta-amyloid burden in the human brain. J Neurosci.

    1. Author Response:

      Reviewer #1:

      This work is aiming at the characterization of the molecular and kinetic mechanism of how three members of the SLC6 family of transporters, namely for dopamine (DAT), norepinephrine (NET), and serotonin (SERT), transport substrate across the membrane, and how the transport process is affected by cations. The authors use electrophysiology and sophisticated rapid solution exchange methods, in conjunction with fluorescence recordings from single cells, to correlate flux (from fluorescence) with electrical activity (from currents).

      The strength of the methods is based on the application of a kinetic method with high time resolution, allowing the isolation of fast processes in the transport mechanism, and their modeling using a kinetic multistep scheme. In particular useful is the combination with fluorescence recording from single cells, which allows the authors to measure flux and current in the same cell under voltage clamp conditions. This is an elegant approach to get information on the voltage dependence of substrate flux, which is difficult to obtain with other methods. As to the strength of the results, the data are generally of high quality, showing the kinetic and mechanistic similarities and differences between the three transporters under observation. Another strength is that the results are quantitatively represented by kinetic simulations, which appear to fit the experimental data well.

      The major weakness of the research is related to interpretation of the experimental results. While the authors propose a unified K+ interaction mechanism for the three transporters, DAT, NET and SERT, the proposed K+ association/dissociation mechanism is 1) highly unusual, and 2) not unique in the ability to explain the experimental data. As to point 1), the DAT mechanism (Fig. 7A) proposes a sequence of intracellular K+ association and dissociation steps. Since the intracellular [K+] remains constant, such a sequence requires a change of affinity for K+, which is initially high when K+ associates (33 microM according to the provided rate constants) and then has to be low for K+ dissociation (3.3 mM). Such an affinity change requires input of free energy, to promote K+ dissociation. From the provided rate constants and at room temperature this free energy change can be approximated as 11.4 kJ/mol. This is a large energy amount, in fact larger than what is stored in the physiological concentration gradient for one Na+ ion as a driving force for transport. It appears that the transporter would waste a lot of energy for no apparent benefit, with a futile K+ association/dissociation cycle, that would just generate heat.

      Therefore, while the authors have achieved their aim of quantitatively assessing transporter function and thorough description by a kinetic mechanism, their final proposed mechanism does not support all of the conclusions because it is by far from unique in being able to explain the data (point 2) above). While this may be true for other transport mechanisms proposed in the past, the mechanism proposed here is somewhat odd with respect to energy requirements. Thus, it would require extraordinary experimental proof to propose it in exclusion of other, maybe more plausible mechanisms.

      Despite these shortcomings, the potential impact of the work is high, because a unifying theory of cation interaction and stoichiometry of the monoamine transporter members of the SLC6 family has been missing in the literature. In addition, the elegant method of combining single cell electrophysiology and fluorescence flux measurements is impactful, especially in the whole cell recording method, allowing the control of intracellular ionic composition.

      We thank reviewer 1 for his comments on the kinetic modelling. We do not claim that the mechanism, which we propose, is unique in its ability to explain the data. However, we should like to argue that the proposed mechanism is plausible and parsimonious. We, much like reviewer 1, initially asked the question, whether a mechanism requiring an ion such as potassium to associate and subsequently dissociate from the same side of the transporter was energetically feasible. In fact, one of the main reasons for employing kinetic models was to address this specific issue.

      If detailed balance in a kinetic model is maintained (i.e., the product of the rates in the forward direction of a loop equals the product of the rates in the reverse direction), the model is energetically sound (i.e., such a model does not violate the laws of thermodynamics). It is true that for a spontaneous reaction to occur, the Gibbs free energy has to be negative. In a multistep process, however, this consideration only pertains to the “initial” and the “final” state. As long as the Gibbs free energy between these two states is negative the reaction will proceed, even if the Gibbs free energy between “intermediate” states is positive. This point is illustrated in the schemes below.

      Scheme (A) maps out the Gibbs free energy of the outer loop of the kinetic model of DAT (i.e., this path describes the conformational trajectory, which the transporter takes in the presence of intracellular K+- see scheme in Fig.7A of the manuscript). For calculating the Gibbs free energy of this loop, we assumed a pre-equilibrium condition (i.e., an extracellular and intracellular substrate concentration that we arbitrarily set to 10 μM and 100 nM, respectively) and the membrane voltage as 0 mV. As shown in the scheme, the Gibbs free energy between the “initial-left” and the “final-right” state is negative. Accordingly, the multistep reaction can proceed spontaneously.

      In scheme (B), we mapped out the Gibbs free energy for the same path and the same pre-equilibrium condition as shown in scheme (A); the only difference is that the membrane potential was now assumed to be -60 mV. This is to show that voltage is also a determining factor of the extent by which the Gibbs free energy changes.

      In Scheme (C), we mapped out the Gibbs free energy at equilibrium (the difference in Gibbs free energy between the “initial” and the “final” state is zero). This condition is met when the intracellular substrate concentration is 155 μM. At this intracellular substrate concentration, the energy stored in the substrate gradient notably matches exactly the energy of the Na+ gradient. The model therefore predicts that no energy is dissipated as heat, an observation that is in contrast to the concern raised by reviewer 1. We admit that the model can be criticized on this ground, because arguably, a realistic process is expected to dissipate energy as heat even if it involves a microscopic system (as is the case here). Determination of how much heat is generated in a transport cycle is, however, beyond the scope of the present manuscript and warrants a detailed study. In such a study, one could investigate if any heat loss generated can be compensated by, for instance, the occasional antiport of K+ by DAT, which, as we point out in the discussion, is possible. In this context, we stress that the energetic costs would have been much higher, if we had assumed non-obligatory antiport of K+ through DAT. Such a mechanism predicts that the K+ gradient is constantly dissipated in the absence of the substrate, which would indeed create the futile heat loss reviewer 1 is concerned about.

      An alternate hypothesis to the actions of intracellular K+ on the DAT transport cycle would be to propose the presence of a regulatory K+ binding site. We are reluctant to assume this mechanism for the simple reason that there is little evidence for such sites from the available crystal structures. The view that K+ binds to Na2 site in DAT, NET and SERT is consistent with our data (see Fig.5). These observations are aided by a previous study that shows K+ can bind to the Na2 site in DAT, as determined by extensive molecular dynamic simulations (Razavi et al., 2017, cited in the manuscript). By its very nature, the Na2 site cannot serve as a regulatory K+ binding site; for the transporter to proceed in the transport cycle, K+ must at some point dissociate from the Na2 site.

      On further scrutiny of our model for DAT, NET and SERT, we noticed that the extra and intracellular affinities for Na+ were set too high. We regret this oversight that arose because we had only simulated experiments in which the intracellular Na+ concentrations had been zero. The selected Na+ affinities would not have allowed the transporter to function properly at a physiological intracellular Na+ concentration (which is ~10 mM). We now rectified this problem by lowering the inner and outer Na+ affinity by a factor of 10. In Fig.7 of the main manuscript and supplementary figure 6, we have now replaced all previous simulations of the three transporters with the predictions of the newly amended model. As seen, the changes in the binding parameters for Na+ in the model could still account for the key findings of this study.

      Reviewer #2:

      Bhat et al. study transport mechanism of three members of the SLC6 family, i.e. DAT, NET and SERT, using a combination of cellular electrophysiology, fluorescence measurements - taking advantage of a fluorescent substrate (APP+) that can be transported by each of these different transporters - and kinetic modelling. They find that DAT, NET and SERT differ in intracellular K+ binding. In DAT and NET, intracellular K+ binding is transient, resulting in voltage-dependent transport. In contrast, SERT transports K+, and the addition of a charged substrate to the transport cycle makes serotonin transport voltage-independent.

      This is an extremely nice and interesting manuscript, based on a series of beautifully designed and executed experiments that are convincingly analyzed via a kinetic model. I have only some suggestions:

      1) Fig. 4: I find the description of Fig. 4 extremely difficult to understand. In clear contrast to the introductory sentence "Previous studies showed that Kin+ was antiported by SERT, but not by NET or DAT (Rudnick & Nelson, 1978; Gu et al., 1996; Erreger et al.,2008), SERT appears to be able to transport APP+ without K+ in Fig. 4. I was trying to understand this obvious discrepancy for a long time, until I found the authors coming back to this point in the discussion "However steady-state assessment of transporter mediated substrate uptake is hindered by the fact that all three monoamine transporters can also transport substrate in the absence of Kin+". This is a little late, and the author should address this point more explicitly in the result section, close to the description of Fig. 4.

      We agree with reviewer 2’s comments pertaining to the SERT data represented in Fig.4C. The observations made from this dataset seem confusing in the absence of any relevant context. We have added the following statements to clarify any discrepancy arising from Fig. 4 (lines 266-273): “Owing to the instrumental role of Kin+ in the catalytic cycle of SERT, the observed lack of difference in APP+ uptake profiles by SERT-expressing cells in the presence or absence of Kin+ seem contradictory. This discrepancy can be explained as follows: 1) SERT can alternatively antiport protons to complete its catalytic cycle (Keyes and Rudnick, 1982; Hasenhuetl et al. 2016) and 2) APP+ is a poor SERT substrate (as determined by lack of APP+ induced steady state currents, Fig. 2F and 3F) that may be shuttled into SERT-expressing cells at rates slower than the rate limiting isomerization of SERT from inward open to outward open state.”

      2) Throughout the whole manuscript I am missing statistical details in comparisons.

      Statistical details for comparisons, which were done on some data sets in Fig. 4, Fig.5 and Fig.6, have now been incorporated in the manuscript text.

      3) Since APP+ might also only bind to the transporter or even only bind to the cell membrane, the authors might want to look at how the time course of the cellular APP+ signal depends on the size of the cells or on the ratio of transport currents and capacitance. It is of course possible that the tested cells do not differ sufficiently in size to permit such comparison. The authors should at least comment on this possibiliy.

      We are working on monoclonal lines. Thus, the differences in cell size are small (between 25- 30 pF). In the new supplementary figure 1, we show that our (previously held) conjecture that the fast component represents membrane binding was wrong. In fact, analysis of the APP+ fluorescence in control cells (supplementary figure 1D) suggests that APP+ adherence to the plasma membrane does not contribute to significant fluorescence signal. We apologize for this misinterpretation and please refer to the responses to reviewer 1 for more details.

      4) Another set of results one might look at are the time courses of fluorescence decay after the end of the APP+ perfusion (Fig. 2 and 4). Substrate (APP+) outward transport should have a comparable voltage dependence as substrate uptake, moreover it should depend on the amount of substrate that entered to the cell before. Could the authors provide such result and use them to exclude specific/unspecific APP+ binding?

      In supplementary figure 1 (panel, A and C) and video files 1 and 2, we show that APP+ adheres to intracellular membranes of organelles. This has also been shown previously by others (Solis Jr. et al., 2012; Karpowicz Jr et al., 2013; Wilson et al., 2014, cited in the manuscript). Because these structures serve as sinks, there is no (or only little) free APP+, which is available for outward transport.

      Reviewer #3:

      The sodium-coupled biogenic transporters DAT, NET and SERT, terminate the synaptic actions of dopamine, norepinephrine and serotonin, respectively. They belong to the family of Neurotransmitter:sodium:symporters. These transporters have very similar sequences and this is reflected at the structural level as judged by similarity of the crystal structures of the outward-facing conformations DAT and SERT. However, earlier functional studies indicated that transport by SERT is electroneutral because the charges sodium ions and substrate moving into the cell are compensated by the outward movement of potassium ions (or protons) to complete the transport cycle. On the other hand, DAT and NET are electrogenic. Moreover, potassium ions are not extruded by these transporters and the Authors set out to investigate if the electrogenicity is related to difference in potassium handling between SERT and the two other biogenic transporters. This was done by analyzing the role of intracellular cations and voltage on substrate transport by the three biogenic amine transporters. This was achieved by the simultaneous recording of uptake of the fluorescent substrate APP+ and the current induced by this process under voltage-clamp conditions by single HEK293 cells expressing the transporters. The Authors found that even though uptake by NET and DAT did not require internal potassium, these transporters could actually interact with internal potassium as judged by the voltage dependence of the so-called peak current. This voltage dependence was very steep in the absence of both sodium and potassium. However, in the presence of either cation this voltage dependence became less steep when either of these cations was present in the internal milieu, indicating that not only sodium but also potassium could bind from the inside. The same result was obtained with SERT. However, uptake by SERT was found to be much less dependent on the membrane voltage than that by DAT and NET and was stimulated by internal potassium, consistent with the proposed electroneutrality of the former. The observations indicate that the structural similarity of the three biogenic amine transporters is also reflected in their ability to bind potassium, even though this cation can translocate to the outside only in SERT.

      Strengths:

      Development of a sophisticated technique to interrogate the mechanism of sodium coupled biogenic amine transport in single cells. Rigorous analysis of the data. Conclusions supported by the data. The methodology can be used to obtain novel insights into the mechanism of other transporters.

      Weaknesses:

      The presentation could be made more "user friendly" by explaining in more detail what is happening as we go through the data. For instance, peak and steady state currents are shown already in Figure 1, but an (too brief) explanation is only provided when describing Figure 5. A schematic in the first part of the Results would be useful. Some information of on the structural background should be provided as well as a full description of the transport cycle, namely the number of sodium ions translocated per cycle and the argument why chloride remains bound to the transporter throughout the cycle. The control that in contrast to potassium, lithium is inert should be performed not only for DAT, but also for the two other transporters.

      We thank Dr. Kanner for these recommendations. Regarding the role of Na+ and Cl- in the transport cycle of the monoamine transporters, we have briefly mentioned the same in the introduction as follows: “The crystal structure of both hSERT and dDAT show two bound Na+ ions. However, only one Na+ ion is thought to be released on the intracellular side in both transporters (Rudnick & Sandtner, 2019). Cl-, on the other hand, has been shown to play a modulatory role in the transport cycle of SERT and DAT, but Cl- is not essential for the transport stoichiometry (Erreger et al., 2008; Hasenhuetl et al., 2016).”

      As for the control experiments with Li+, we are very grateful to Dr. Kanner for his suggestions. En route to extending the observations, which we obtained with DAT in the presence of high intracellular Li+, to NET and SERT, we stumbled upon some unexpected results: while IV relations of peak currents with high intracellular Li+ or NMDG+ in NET were identical (similar to DAT), SERT gave us exactly the opposite profiles. IV relations of high intracellular Li+ in SERT were as shallow as those in the presence of high +++ intracellular K or high intracellular Na . This is indicative of intracellular Li binding to SERT, an observation not previously reported that further highlights the differences in DAT/NET and SERT in cation binding. We believe that our observations with Li+ and SERT could be expanded on in a separate story. We have accordingly changed the manuscript text in the Results and Discussion as follows:

      Results (lines 320-337):

      “Because the absence of Kin+ affected the slope of the IV-relation of the peak current, we surmised that potassium bound from the intracellular side not only to SERT but also possibly to DAT and NET. We explored this conjecture by determining the IV relation of peak currents through all three +++ transporters in the presence of lithium (Liin = 163 mM) instead of Kin . Li is believed to be an inert cation, because it does not support substrate translocation by SLC6 transporters. As expected, the IV relation of peak currents through DAT and NET were similar in the presence of 163 mM Lin+ to those recorded in the absence of Kin+ (cf., diamond and triangle symbol in Fig. 5J and 5K). These observations clearly indicate that Kin+ binds to both DAT and NET and rule out an alternative explanation, i.e. that the effect can be accounted for water and monovalent cations briefly occupying a newly available space in the inner vestibule. SERT, on the hand, show shallow IV relations of peak currents with high Liin+ when compared to those acquired in the absence of Kin+ (cf., diamond and triangle symbol in Fig. 5L). This is indicative of Liin+ binding to SERT on the intracellular side. The exact nature of Liin+ binding to SERT has not been reported previously and warrants further investigation. The IV relations of peak currents are similar in the presence of 163 mM Kin+ (Fig. 5A-C) and of 163 mM Nain+ (Fig. 5G-I) in DAT, NET and SERT (cf. circle and square symbols in Fig. 5J-L). This is consistent with the idea that Nain+ and Kin+ bind to overlapping sites in these transporters. “

      Discussion (lines 524-527):

      “Interestingly, differences between DAT/NET and SERT are further substantiated by the ability of SERT+ to bind to intracellular Li . The exact nature of this interaction is unknown and necessitates an in-depth investigation that is beyond the scope of this study.”

    1. Author Response

      Reviewer #1 (Public Review):

      This study explores the mechanisms responsible for reduced steroidogenesis of adrenocortical cells in a mouse model of systemic inflammation induced by LPS administration. Working from RNA and protein profiling data sets in adrenocortical tissue from LPS-treated mice they report that LPS perturbs the TCA cycle at the level of succinate dehydrogenase B (SDHB) impairing oxidative phosphorylation. Additional studies indicate these events are coupled to increased IL-1β levels which inhibit SDHB expression through DNA methyltransferase-dependent DNA methylation of the SDHB promoter.

      In general, these are interesting studies with some novel implications. I do, however, have concerns with some of the author's rather broad conclusions given the limitations of their experimental approach. The paper could be improved by addressing the following points:

      1) The limitations of using LPS as the model for systemic inflammation need to be explicitly described.

      We thank the Reviewer for this suggestion. Indeed, the LPS model has several limitations as a preclinical model of sepsis, which are outlined in the revised Discussion. Despite its limitations, we chose this model over other models of sepsis, such as the cecal slurry model, due to its high reproducibility, which enabled the here presented mechanistic studies.

      2) The initial in vivo findings, which support the proposed metabolic perturbation, are based on descriptive profiling data obtained at one time point following a single dose of LPS. The author's conclusion that the ultimate transcriptional pathway identified hinges critically on knowledge of the time course of this effect following LPS, which is not adequately addressed in the paper. How was this time and dose of LPS established and are there data from different dose and time points?

      We thank the Reviewer for raising this question, which we indeed addressed at the beginning of our studies in order to determine a suitable time point and dose of LPS treatment. We chose 6 h as a suitable starting time point to perform transcriptional analyses, based on the fact that LPS triggers transcriptional changes in the adrenal gland and other tissues within the range of few hours (1-3). Confirming our expectations we found 2,609 differentially expressed genes (Figure 1a) in the adrenal cortex of LPS-treated mice among which many were involved in cellular metabolism (Figure 1d,e, 2a-e, Table 1, Table 2). Acute transcriptional changes, which are more likely to reflect direct effects of inflammatory signals compared to changes occurring at later time points (for instance in the range of days), would allow us to mechanistically investigate the effects of inflammation in the adrenal gland, which was the purpose of our studies. Hence, we were guided by the transcriptional changes observed at 6 h of LPS treatment and established the hypothesis that disruption of the TCA cycle in adrenocortical cells is key in the impact of inflammation on adrenal function. Along this line, we analyzed the metabolomic profile of the adrenal gland at 6 and 24 h of LPS treatment. At 6 h succinate levels as well as the succinate / fumarate ratio remained unchanged (Author response image 1A), while at 24 h post-injection these were increased by LPS (Author response image 1B, Figure 2l,o,q). The time delay of the increase in succinate levels (observed at 24 h) following downregulation of Sdhb mRNA expression (at 6 h) can be explained by the time required for reduction of SDHB protein levels, which is dependent on the protein turnover suggested to be approximately 12 h in HeLa cells (4). Based on these findings, all further metabolomic analyses were performed at 24 h of LPS treatment.

      Author response image 1. LPS increases the succinate/fumarate ratio at 24 but not 6h. Mice were i.p. injected with 1 mg/kg LPS and 6 h (A) and 24 h (B) post-injection succinate and fumarate levels were determined by LC-MS/MS in the adrenal gland. n=8-10; data are presented as mean ± s.e.m. Statistical analysis was done with two-tailed Mann-Whitney test. *p < 0.05.

      Having established the most suitable time points of LPS treatments to observe induced transcriptional and metabolic changes, we set out to define the LPS dose to be used in subsequent experiments. The data shown in Author response image 1, were acquired after treatment with 1 mg/kg LPS. This is a dose that was previously reported to cause transcriptional re-profiling of the adrenal gland (1, 2). However, 5 mg/kg LPS, similarly to 1 mg/kg LPS, also reduced Sdhb, Idh1 and Idh2 expression at 4 h (Author response image 2A) and increased succinate and isocitrate levels at 24 h (Author response image 2B) in the adrenal gland. Given that the effects of 1 and 5 mg/kg LPS were similar, for animal welfare reasons we continued our studies with the lower dose.

      Author response image 2. Five mg/kg LPS downregulate Sdhb, Idh1 and Idh2 expression and increase succinate and isocitrate levels in the adrenal gland of mice. Sdhb, Idh1 and Idh2 expression (A) and succinate and isocitrate levels (B) were assessed in the adrenal gland of mice treated with 5 mg/kg LPS for 4 h (A) and 24 h (B). n=5; data are presented as mean ± s.d. Statistical analysis was done with two-tailed Mann-Whitney test. p < 0.05, *p < 0.01.

      3) Related to the point above, the authors data supporting a break in the TCA cycle would be strengthened direct biochemical assessment (metabolic flux analysis) of step kin the TCA cycle process impacted.

      We entirely agree with the Reviewer and considered performing TCA cycle metabolic flux analyses in adrenocortical cells. Unfortunately, the low yield of adrenocortical cells per mouse (approx. 3,000- 6,000) does not allow the performance of metabolic flux experiments, which require higher cell numbers per sample, several time points per condition and an adequate number of replicates per experiment. Moreover, NCI-H295R cells being adrenocortical carcinoma cells are expected to have substantially altered metabolic fluxes compared to normal cells. Since we wouldn’t have the capacity to confirm findings from metabolic flux experiments in NCI-H295R cells in primary adrenocortical cells, as we did for the rest of the experiments, we decided to not perform metabolic flux experiments in NCI-H295R cells. However, performing metabolic flux analyses in adrenocortical cells under inflammatory or other stress conditions remains an important future task that we will pursue upon establishment of a more suitable cell culture system.

      4) The proposed connection of DNMT and IL1 signaling to systemic inflammation and reduced steroidogenesis could be more firmly established by additional studies in adrenal cortical cells lacking these genes.

      We thank the Reviewer for this excellent suggestion. In the revised manuscript we strengthened the evidence for an IL-1β –DNMT1 link and show that DNMT1 deficiency blocks the effects of IL-1β on SDHB promoter methylation (Figure 6k), the succinate / fumarate ratio (Figure 6m), the oxygen consumption rate (Figure 6n) and steroidogenesis (Figure 6o-q) in adrenocortical cells. In order to validate the role of IL-1β in vivo, mice were simultaneously treated with LPS and Raleukin, an IL-1R antagonist. Treatment with Raleukin increased the SDH activity (Figure 6r), reduced succinate levels and the succinate / fumarate ratio (Figure 6s,t) and increased corticosterone production in LPS-treated mice (Figure 6u).

      Reviewer #2 (Public Review):

      The present manuscript provides a mechanistic explanation for an event in adrenal endocrinology: the resistance which develops during excessive inflammation relative to acute inflammation. The authors identify disturbances in adrenal mitochondria function that differentiate excessive inflammation. During severe inflammation the TCA in the adrenal is disrupted at the level of succinate production producing an accumulation of succinate in the adrenal cortex. The authors also provide a mechanistic explanation for the accumulation of succinate, they demonstrate that IL1b decreases expression of SDH the enzyme that degrades succinate through a methylation event in the SDH promoter. This work presents a solid explanation for an important phenomenon. Below are a few questions that should be resolved experimentally.

      1) The authors should confirm through direct biochemical assays of enzymatic activity that steroidogenesis enzyme activity is not impaired. Many of these enzymes are located in the mitochondria and their activity may be diminished due to the disturbed, high succinate environment of the cortical cell as opposed to the low ATP production.

      We thank the Reviewer for this question. The activity of the first and rate-limiting steroidogenic enzyme, cytochrome P450-side-chain-cleavage (SCC, CYP11A1) which generates pregnenolone from cholesterol, was recently shown to require intact SDH function (5). In agreement with this report we show that production of progesterone, the direct derivative of pregnenolone, is impaired upon SDH inhibition (Figure 5b,e,h). In addition, we assessed the activity of CYP11B1 (steroid 11β-hydroxylase), the enzyme catalyzing the conversion of 11-deoxycorticosterone to corticosterone, i.e. the last step of glucocorticoid synthesis, by determining the corticosterone and 11-deoxycorticosterone levels by LC-MS/MS and calculating the ratio of corticosterone to 11-deoxycorticosterone in ACTH-stimulated adrenocortical cells and explants. The corticosterone / 11-deoxycorticosterone ratio was not affected by Sdhb silencing in adrenocortical cells (Figure 5- Supplement 2g) nor did it change upon LPS treatment in adrenal explants (Figure 5- Supplement 2h), suggesting that CYP11B1 activity may not be altered upon SDH blockage. Hence, we propose that upon inflammation impairment of SDH function may disrupt at least the first steps of steroidogenesis (producing pregnenolone/progesterone), thereby diminishing production of all downstream adrenocortical steroids. This is now discussed in the revised manuscript.

      2) What is the effect of high ROS production? Is steroidogenesis resolved if ROS is pharmacologically decreased even if the reduction of ATP is not resolved?

      We thank the Reviewer for this suggestion, which helped us to broaden our findings. Indeed, ROS scavenging by the vitamin E analog Trolox (Figure 5n) partially reversed the inhibitory effect of DMM on steroidogenesis (Figure 5o,p), suggesting that impairment of SDH function impacts steroidogenesis also via enhanced ROS production (Figure 4g).

      3) Does increased intracellular succinate (through cell permeable succinate treatment) inhibit steroidogenesis even if there is not a blockage of OXPHOS?

      We suggest that SDH inhibition and succinate accumulation lead to reduced steroidogenesis due to impaired oxidative phosphorylation (Figure 4c,e, 5i), reduced ATP synthesis (Figure 4d, 5j-m) and increased ROS production (Figure 4g, 5o,p). Since SDH is part (complex II) of the electron chain transfer it cannot be decoupled from oxidative phosphorylation, thereby limiting the experimental means for addressing this question.

      4) It should be demonstrated the genetic loss of IL1 signaling in adrenal cortical cells results in a loss of the effect of LPS on reduced steroidogenesis and increased succinate accumulation.

      We thank the Reviewer for this suggestion. Development of a mouse line with genetic loss of Il-1r in adrenocortical cells was rather impossible during the short time of revisions. Instead, mice under LPS treatment were treated with the IL-1R antagonist, Raleukin, to study the in vivo effects of IL-1β in the adrenal gland. IL-1R antagonism increased SDH activity in the adrenal cortex (Figure 6r), decreased succinate levels and the succinate/fumarate ratio in the adrenal gland (Figure 6s,t) and enhanced corticosterone production (Figure 6u) in LPS-treated mice, supporting our hypothesis that IL-1β mediates the effects of systemic inflammation in the adrenal cortex.

      5) It should be demonstrated the genetic loss of IL1 signaling in adrenal cortical cells results in a loss of the effect of LPS on SDH activity and ATP production and SDH promoter methylation

      As outlined above, Raleukin treatment increased SDH activity in the adrenal cortex (Figure 6r) and decreased succinate levels and the succinate/fumarate ratio in the adrenal gland (Figure 6s,t) of mice treated with LPS. Furthermore, IL-1β reduced the ATP/ADP ratio (Figure 6e) and enhanced SDHB promoter methylation in NCI-H295R cells (Figure 6k).

      6) It should be shown that the silencing of DNMT eliminates or diminishes the effect of LPS on reduced steroidogenesis and increased succinate accumulation.

      We thank the Reviewer for this suggestion, which prompted us to strengthen the evidence for the implication of DNMT1 in the effects of LPS on adrenocortical cell metabolism and function. As mentioned above, development of a new mouse line, in this case bearing genetic loss of DNMT1 in adrenocortical cells, was considered impossible during the short time of revisions. Therefore, we assessed the role of DNMT1 by silencing it via siRNA transfections in primary adrenocortical cells and NCI-H295R cells. We show that DNMT1 silencing inhibits the effect of IL-1β on SDHB promoter methylation (Figure 6k), restores Sdhb expression (Figure 6l) and reduces the succinate/fumarate ratio in IL-1β treated adrenocortical cells (Figure 6m). Accordingly, DNMT1 silencing restores ACTH-induced production of corticosterone, 11-deoxycorticosterone and progesterone in IL-1β treated adrenocortical cells (Figure 6o-q). We chose to stimulate adrenocortical cells with IL-1β instead of LPS, as in vitro the effects of IL-1β were more robust than these of LPS (possibly due to a reduction of TLR4 expression or function in cultured adrenocortical cells) and in order to show the link between IL-1β and DNMT1.

      7) Does silencing of DNMT reduce OXPHOS in adrenal cortical cells?

      We measured the oxygen consumption rate in NCI-H295R cells, which were transfected with siRNA against DNMT1 and treated or not with IL-1β. IL-1β reduced the OCR in cells transfected with control siRNA, while DNMT1 silencing blunted the effect of IL-1β (Figure 6n).

      8) The effects of LPS on reduced adrenal steroidogenesis are not elaborated at the physiological level. The manuscript should demonstrate the ramifications of the adrenal function decreasing after LPS. Does CORT release become less pronounced after subsequent challenges? Does baseline CORT decrease at some point? No physiological consequences are shown. Similarly, these physiological consequences of decreased adrenal function should be dependent on decreased SDH activity and OXPHOS in adrenal cells and this should be demonstrated experimentally.

      We thank the Reviewer for raising this excellent question. Inflammation is a potent inducer of the Hypothalamus-Pituitary-Adrenal gland (HPA) axis, causing increased glucocorticoid production, a stress response leading to vital immune and metabolic adaptations. Accordingly, LPS treatment rapidly increases glucocorticoid production in mice (1, 6, 7). Reduced adrenal gland responsiveness to ACTH associates with decreased survival of septic mice (8). These preclinical findings stand in accordance with observations in septic patients, in which impairment of adrenal function correlates with high risk for death (9). Along this line, ACTH test was suggested to have prognostic value for identification of septic patients with high mortality risk (9, 10).

      In order to confirm impairment of the adrenal gland function in septic mice, animals were subjected to sepsis via administration of a high LPS dose (10 mg / kg) and treated with ACTH 24 h later. Indeed, the ACTH-induced increase in corticosterone levels was diminished in LPS-treated mice (Author response image 3). This finding was further confirmed in adrenal explants, in which LPS pre-treatment also blunted ACTH-stimulated corticosterone production (Figure 5s).

      Author response image 3. High LPS dose blunts the ACTH response in mice. C57BL/6J mice were i.p. injected with 10 mg/kg LPS or PBS and 24 h later they were i.p. injected with 1 mg/kg ACTH. One hour after ACTH administration blood was retroorbitally collected and corticosterone plasma levels were determined by LC-MS/MS. n=4-5; data are presented as mean ± s.d. Statistical analysis was done with two-tailed Mann-Whitney test. *p < 0.05.

      Given that purpose of our studies was to dissect the mechanisms underlying adrenal gland dysfunction in inflammation rather than analyzing the physiological consequences thereof, we chose not to follow these lines of investigations and concentrate on the role of cell metabolism in adrenocortical cells in the context of inflammation.

      References

      1. W. Kanczkowski, A. Chatzigeorgiou, M. Samus, N. Tran, K. Zacharowski, T. Chavakis, S. R. Bornstein, Characterization of the LPS-induced inflammation of the adrenal gland in mice. Mol Cell Endocrinol 371, 228-235 (2013).
      2. L. S. Chen, S. P. Singh, M. Schuster, T. Grinenko, S. R. Bornstein, W. Kanczkowski, RNA-seq analysis of LPS-induced transcriptional changes and its possible implications for the adrenal gland dysregulation during sepsis. J Steroid Biochem Mol Biol 191, 105360 (2019).
      3. V. I. Alexaki, G. Fodelianaki, A. Neuwirth, C. Mund, A. Kourgiantaki, E. Ieronimaki, K. Lyroni, M. Troullinaki, C. Fujii, W. Kanczkowski, A. Ziogas, M. Peitzsch, S. Grossklaus, B. Sonnichsen, A. Gravanis, S. R. Bornstein, I. Charalampopoulos, C. Tsatsanis, T. Chavakis, DHEA inhibits acute microglia-mediated inflammation through activation of the TrkA-Akt1/2-CREB-Jmjd3 pathway. Mol Psychiatry 23, 1410-1420 (2018).
      4. C. Yang, J. C. Matro, K. M. Huntoon, D. Y. Ye, T. T. Huynh, S. M. Fliedner, J. Breza, Z. Zhuang, K. Pacak, Missense mutations in the human SDHB gene increase protein degradation without altering intrinsic enzymatic function. FASEB J 26, 4506-4516 (2012).
      5. H. S. Bose, B. Marshall, D. K. Debnath, E. W. Perry, R. M. Whittal, Electron Transport Chain Complex II Regulates Steroid Metabolism. iScience 23, 101295 (2020).
      6. W. Kanczkowski, V. I. Alexaki, N. Tran, S. Grossklaus, K. Zacharowski, A. Martinez, P. Popovics, N. L. Block, T. Chavakis, A. V. Schally, S. R. Bornstein, Hypothalamo-pituitary and immune-dependent adrenal regulation during systemic inflammation. Proc Natl Acad Sci U S A 110, 14801-14806 (2013).
      7. W. Kanczkowski, A. Chatzigeorgiou, S. Grossklaus, D. Sprott, S. R. Bornstein, T. Chavakis, Role of the endothelial-derived endogenous anti-inflammatory factor Del-1 in inflammation-mediated adrenal gland dysfunction. Endocrinology 154, 1181-1189 (2013).
      8. C. Jennewein, N. Tran, W. Kanczkowski, L. Heerdegen, A. Kantharajah, S. Drose, S. Bornstein, B. Scheller, K. Zacharowski, Mortality of Septic Mice Strongly Correlates With Adrenal Gland Inflammation. Crit Care Med 44, e190-199 (2016).
      9. D. Annane, V. Sebille, G. Troche, J. C. Raphael, P. Gajdos, E. Bellissant, A 3-level prognostic classification in septic shock based on cortisol levels and cortisol response to corticotropin. JAMA 283, 1038-1045 (2000).
      10. E. Boonen, S. R. Bornstein, G. Van den Berghe, New insights into the controversy of adrenal function during critical illness. Lancet Diabetes Endocrinol 3, 805-815 (2015).
      11. C. C. Huang, Y. Kang, The transient cortical zone in the adrenal gland: the mystery of the adrenal X-zone. J Endocrinol 241, R51-R63 (2019).
    1. Author Response:

      Reviewer #1:

      The manuscript by Jasmien Orije and colleagues has used advanced Diffusion Tensor and Fixel-Based brain imaging methods to examine brain plasticity in male and female European starlings. Songbirds provide a unique animal model to interrogate how the brain controls a complex, learned behaviour: song. The authors used DT imaging to identify known and uncover new structural changes in grey and white matter in male and female brains. The choice of the European starling as a model songbird was smart as this bird has a larger brain to facilitate anatomical localization, clear sex differences in song behavior and well-characterized photoperiod-induced changes in reproductive state. The authors are commended for using both male and female starlings. The photoperiodic treatment used was optimal to capture the key changes in physiological state. The high sampling frequency provides the capability to monitor key changes in physiology, behaviour and brain anatomy. Two exciting findings was the increased role of cerebellum and hippocampal recruitment in female birds engaged in singing behaviour. The development of non-invasive, multi-sampling brain imaging in songbirds provides a major advancement for studies that seek to understand the mechanism that control the motivation and production of singing behavior. The methods described herein set the foundation to develop targeted hypotheses to study how the vocal learning, such as language, is processed in discrete brain regions. Overall, the data presented in the study is extensive and includes a comprehensive analyses of regulated changes in brain microstructural plasticity in male and female songbirds.

      Reviewer #2:

      Orije et al. employed diffusion weighted imaging to longitudinally monitor the plasticity of the song control system during multiple photoperiods in male and female starlings. The authors found that both sexes experience similar seasonal neuroplasticity in multisensory systems and cerebellum during the photosensitive phase. The authors' findings are convincing and rely on a set of well-designed longitudinal investigations encompassing previously validated imaging methods. The authors' identification of a putative sensitive window during which sensory and motor systems can be seasonally re-shaped in both sexes is an interesting finding that advances our understanding of the neural basis of seasonal structural neuroplasticity in songbirds.

      Overall, this is a strong paper whose major strengths are:

      1) The longitudinal and non-invasive measure of plasticity employed

      2) The use of two complementary MR assays of white matter microplasticity

      3) The careful experimental design

      4) The sound and balanced interpretation of the imaging findings

      I do not have any major criticism but just a few minor suggestions:

      1) Pp 6-7. While the comparative description of canonical DTI with respect to fixel-based analysis is well written and of interest to readers with formal training in MR imaging, I found this entire section (and especially the paragraphs in page 7) too technical and out of context in a manuscript that is otherwise fundamentally about neuroplasticity in song birds. The accessibility of this manuscript to non-MR experts could be improved by moving this paragraph into the methods section, or by including it as supplemental material.

      The main purpose of this section was to introduce and explain the diffusion parameters which are used throughout the rest of the paper. Furthermore, we wanted to familiarize the reader with the concept of the population based template and the different structures that can be visualized by them. We agree that the technical details might have distracted from this main message. Therefore, we have trimmed the technical details out of this section and left a short explanation of the biological relevance of the different diffusion parameters and the anatomical structures visible on the population template. The technical details that were taken out are now a part of the material and methods section.

      The section now reads as follows:

      In the current study, we analyzed the DWI scans in two distinct ways: 1) using the common approach of diffusion tensor derived metrics such as fractional anisotropy (FA) and; 2) using a novel method of fiber orientation distribution (FOD) derived fixel-based analysis. Both techniques infer the microstructural information based on the diffusion of water molecules, but they are conceptually different (table 1). Common DTI analysis extracts for each voxel several diffusion parameters, which are sensitive to various microstructural changes in both grey and white matter specified in table 1. Fixel-based analysis on the other hand explores both microscopic changes in apparent fiber density (FD) or macroscopic changes in fiber-bundle cross-section (log FC) (table 1). Positive fiber-bundle cross-section values indicate expansion, whereas negative values reflect shrinkage of a fiber bundle relative to the template (Raffelt, Tournier et al. 2017).

      A population-based template created for the fixel-based analysis can be used as a study based atlas in which many of the avian anatomical structures can be identified (figure 2). We recognize many of the white matter structures such as the different lamina, occipito-mesencephalic tract (OM) and optic tract (TrO) among others. Interestingly, many of the nuclei within the song control system (i.e. HVC, robust nucleus of the arcopallium (RA), lateral magnocellular nucleus of the anterior nidopallium (LMAN), and Area X), auditory system (i.e. intercollicular nucleus complex, nucleus ovoidalis) and visual system (i.e. entopallium, nucleus rotundus) are identified by the empty spaces between tracts. The applied fixel-based approach is inherently sensitive to changes in white matter and cannot report on the microstructure within grey matter like brain nuclei; but rather sheds light on the fiber tracts surrounding and interconnecting them. As such, it provides an excellent tool to investigate neuroplasticity of different brain networks, and in the case of a nodular song control system focusing on changes in the fibers surrounding the song control nuclei, referred to as HVC surr, RA surr and Area X surr.

      2) Similarly, many sections, especially results, are in my opinion too detailed and analytical. While the employed description has the benefit of being systematic and rigorous, the ensuing narrative tends to be very technical and not easily interpretable by non experts. I think the manuscript may be substantially shortened (by at least 20% e.g. by removing overly technical or analytical descriptions of all results and regions affected) without losing its appeal and impact, but instead gaining in strength and focus especially if the new result narrative were aimed to more directly address the interesting set of questions the authors define in the introductory sections.

      We rewrote the result section, taking out the statistic reporting when it was also reported in a figure to reduce the bulk of this section and make it more readable. We made some of the descriptions of the regions affected more approachable by replacing it with parts of the discussion. This way we incorporated some of the explanations why certain findings are unexpected or relevant, as suggested by reviewer #3. Parts of text that were originally in the discussion are indicated in purple.

      3) The possible effect of brain size has been elegantly controlled by using a medial split approach. Have the authors considered using tensor-based morphometry (i.e. using the 3D RARE scans they acquired) to account for where in the brain the small differences in brain size occur? That could be more informative and sensitive than a whole-brain volume quantification.

      We have taken into consideration to add tensor-based morphometry, but we feel that log FC calculated with MrTrix can provide a similar account of the localization of these brain differences. Both methods are based on the Jacobean warps created between the individual images and the population template. They only differ in the starting images they use (3D RARE images in tensor-based morphometry or diffusion weighted images in log FC metric of MrTrix3) and the fact that MrTrix3 limits itself to the volume changes along a certain tract.

      The log FC difference in figure 4 gives a similar account of the differences in brain size between both sexes. Additionally, figure 6 indicates the log FC differences between small and large brain birds.

      4) I think Figures Fig. 3 and Fig. 4 may benefit from a ROI-based quantification of parameters of interests across groups (similar to what has been done for Fig. 7 and its related Fig. 8). This could help readers assess the biological relevance of the parameter mapped. For instance, in Fig. 3, most FA differences are taking place in low FA (i.e. gray matter dense?) regions.

      We supplied the figures with extracted ROI-based parameters of figure 3 and figure 4. In line with this reasoning we also added the same kind of supplementary figures for figure 5 and 6.

      Figure 3 - figure supplement 1: Overview of the fractional anisotropy (FA) changes over time extracted from the relevant ROI-based clusters with significant sex differences. The grey area indicates the entire photosensitive period of short days (8L:16D). Significant sex differences are reported with their p-value under the respective ROI-based cluster. Different letters denote significant differences by comparison with each other in post-hoc t-tests with p < 0.05 (Tukey’s HSD correction for multiple comparisons) comparing the different time points to each other. If two time points share the same letter, the fractional anisotropy values are not significantly different from each other.

      Figure 4 – figure supplement 2: Overview of the fiber density (FD) changes over time extracted from the relevant ROI-based clusters with significant sex differences. The grey area indicates the entire photosensitive period of short days (8L:16D). Significant sex differences are reported with their p-value under the respective ROI-based cluster. Different letters denote significant differences by comparison with each other in post-hoc t-tests with p < 0.05 (Tukey’s HSD correction for multiple comparisons) comparing the different time points to each other. If two time points share the same letter, the FD values are not significantly different from each other. Abbreviations: surr, surroundings.

      Figure 4 –figure supplement 3: Overview of the fiber-bundle cross-section (log FC) changes over time extracted from the relevant ROI-based clusters with significant sex differences. The grey area indicates the entire photosensitive period of short days (8L:16D). Significant sex differences are reported with their p-value under the respective ROI-based cluster. Different letters denote significant differences by comparison with each other in post-hoc t-tests with p < 0.05 (Tukey’s HSD correction for multiple comparisons) comparing the different time points to each other. If two time points share the same letter, the log FC values are not significantly different from each other. Abbreviations: surr, surroundings.

      Figure 5 – figure supplement 1: Overview of the fractional anisotropy (FA) changes over time in extracted from the relevant ROI-based clusters with significant differences in brain size. The grey area indicates the entire photosensitive period of short days (8L:16D). Significant brain size differences are reported with their p-value under the respective ROI-based cluster. Different letters denote significant differences by comparison with each other in post-hoc t-tests with p < 0.05 (Tukey’s HSD correction for multiple comparisons) comparing the different time points to each other. If two time points share the same letter, the fractional anisotropy values are not significantly different from each other. Abbreviations: C, caudal; surr, surroundings.

      Figure 6- figure supplement 2: Overview of the fiber density (FD) changes over time in extracted from the relevant ROI-based clusters with significant differences in brain size. The grey area indicates the entire photosensitive period of short days (8L:16D). Significant brain size differences are reported with their p-value under the respective ROI-based cluster. Different letters denote significant differences by comparison with each other in post-hoc t-tests with p < 0.05 (Tukey’s HSD correction for multiple comparisons) comparing the different time points to each other. If two time points share the same letter, the FD values are not significantly different from each other. Abbreviations: C, caudal; surr, surroundings.

      Figure 6- figure supplement 3: Overview of the fiber-bundle cross-section (log FC) changes over time in extracted from the relevant ROI-based clusters with significant differences in brain size. The grey area indicates the entire photosensitive period of short days (8L:16D). Significant brain size differences are reported with their p-value under the respective ROI-based cluster. Different letters denote significant differences by comparison with each other in post-hoc t-tests with p < 0.05 (Tukey’s HSD correction for multiple comparisons) comparing the different time points to each other. If two time points share the same letter, the log FC values are not significantly different from each other. Abbreviations: C, caudal; surr, surroundings.

      5) In Abstract: "We longitudinally monitored the song and neuroplasticity in male.." Perhaps something should be specified after the "the song"? Did the authors mean "the neuroplasticity of song system"?

      No, this is not what we meant, we monitor song behavior and neuroplasticity independently. In our study, we do not limit ourselves to the neuroplasticity of the song system, but instead use a whole brain approach. The monitoring of the song behavior in itself might be useful for other songbird researchers.

      We clarified this in the abstract as follows:

      We longitudinally monitored the song behavior and neuroplasticity in male and female starlings during multiple photoperiods using Diffusion Tensor and Fixel-Based techniques.

      Reviewer #3:

      In their paper, Orije et al used MRI imaging to study sexual dimorphisms in brains of European starlings during multiple photoperiods and how this seasonal neuroplasticity is dependent in brain size, song rates and hormonal levels. The authors main findings include difference in hemispheric asymmetries between the sexes, multisensory neuroplasticity in the song control system and beyond it in both sexes and some dependence of singing behavior in females with large brains. The authors use different methods to quantify the changes in the MRI data to support various possible mechanisms that could be the basis of the differences they see. They also record the birds' song rates and hormonal levels to correlate the neural findings with biological relevant variables.

      The analysis is very impressive, taking into account the massive data set that was recorded and processed. Whole-brain data driven analysis prevented the authors from being biased to well-known sexually dimorphic brain areas. Sampling of a large number of subjects across many time points allowed for averaging in cases where individual measurements could not show statistical significance. The conclusions of the paper are mostly well supported by data (except of some confounds that the authors mention in the text). However, the extensive statistically significant results that are described in the paper, make it hard to follow at times.

      1) In the introduction the authors mention the pre optic area as a mediator for increase singing and therefore seasonal neuroplasticity. Did the authors find any differences in that area or other well know nuclei that are involved in courtship (PAG for example)?

      Interestingly, we did not detect any seasonal changes in the pre-optic area or PAG. Whereas prior studies reported volume changes in the POM within 1-2 days after testosterone administration in canaries (Shevchouk, Ball et al. 2019). In male European starlings, POM volumes changed seasonally, although this seems to depend on whether or not the males possessed a nest box (Riters, Eens et al. 2000). In our setup, our starlings are not provided with nest boxes. The lack of seasonal change in POM could have a biological reason, besides the limitations of our methodology. Since these are small regions and are grey matter like structures, they are less likely to be picked up with our diffusion MRI methods.

      2) Following the first comment, what is the minimum volume of an area of interest that could be detected using the voxel analysis?

      The up-sampled voxel size is (0.1750.1750.175) mm3. In the voxel-based statistical analysis a significance threshold is set at a cluster size of minimum 10 voxels: 0.05 mm3.

      3) It would be useful to have a figure describing the song system in European starlings and how the auditory areas, the cerebellum and the hippocampus are connected to it, before describing the results. It would make it easier for the broader community to make a better sense of the results.

      An additional figure was added to the introduction to give a schematic overview of the song control system, the auditory system and the proposed cerebellar and hippocampal projections. This scheme includes both a 2D, and a 3D representation as well as a movie of the 3D representation of the different nuclei and the tractography.

      Figure 1: Simplified overview of the experimental setup (A), schematic overview of the song control and auditory system of the songbird brain and the cerebellar and hippocampal connections to the rest of the brain (B) and unilateral DWI-based 3D representation of the different nuclei and the interconnecting tracts as deduced from the tractogram (C). Male and female starlings were measured repeatedly as they went through different photoperiods. At each time point, their songs were recorded, blood samples were collected and T2-weighted 3D anatomical and diffusion weighted images (DWI) were acquired. The 3D anatomical images were used to extract whole brain volume (A). The song control system is subdivided in the anterior forebrain pathway (blue arrows) and the song motor pathway (red arrows). The auditory pathway is indicated by green arrows. The orange arrows indicate the connection of the lateral cerebellar nucleus (CbL) to the dorsal thalamic region further connecting to the song control system as suggested by (Person, Gale et al. 2008, Pidoux, Le Blanc et al. 2018) (B,C). Nuclei in (C) are indicated in grey, the tractogram is color-coded according to the standard red-green-blue code (red = left-right orientation (L-R), blue = dorso-ventral (D-V) and green = rostro-caudal (R-C)). For abbreviations see abbreviation list.

      Figure 1 – figure supplement 1: Movie of the unilateral 3D representation of the different nuclei and the interconnecting tracts rotating along the vertical axis.

      4) In the results section the authors clearly describe which brain areas are sexually dimorphic or change during the photoperiod and what is the underlying reason for the difference. However, only in the discussion section it is clearer why some of those differences are expected or surprising. It would be useful to incorporate some of those explanations in the results section other than just having a long list of brain areas and metrics. For example, I found the involvement of visual and auditory areas in the female brain in the mating season very interesting.

      Next to the reductions in technical explanation suggested by reviewer #2, We replaced some of the description of significant regions with parts of the discussion and vice versa(indicated in purple). This way we incorporated some of the explanations why certain findings are unexpected or relevant. Furthermore, we added some extra info on the reason why these changes are relevant for the visual system and the cerebellum.

      In line 420: Neuroplasticity of the visual system could be relevant to prepare the birds for the breeding season, where visual cues like ultraviolet plumage colors are important for mate selection (Bennett, Cuthill et al. 1997).

      In line 424: This shows that multisensory neuroplasticity is not limited to the cerebrum, but also involves the cerebellum, something that has not yet been observed in songbirds.

    1. Author Response:

      Reviewer #1 (Public Review):

      This study demonstrates with analyical methods and simulations a new approach to estimate pairwise noise and signal correlations in two-photon calcium imaging data. This approach compensates for biases introduced by the dynamics of calcium signals, without deconvolution and for low trial numbers. Simulations based on idealized calcium signals demonstrate the efficiency of the method, and application to auditory cortex imaging data leads to mild changes in the results shown in the past based on less accurate estimates. This study has the merit to identify biases that can arise when evaluating noise and signal correlations across neurons with indirect signals. Moreover the solution provided, may become a useful addition to the neuroscientist's signal analysis toolbox. Noise and signal correlation are related to fonctional connectivity between neurons, and thereby give insights about the fonctional structure of the underlying network. They do not necessarily account for the full complexity of neural interactions but are used in numerous studies, which would be improved by this tool. A potential improvement of the study could be to indicate how this approach could be generalized to other neuron to neuron interaction measurements or data-driven neural network modeling.

      We would like to sincerely thank Reviewer 1 for his supportive stance towards our work, and for providing helpful feedback to improve our manuscript

      The main weakness of the study is that the efficency of the method is only assessed with simulated datasets. Finding real ground-truth data for a validation beyond that would be difficult if not impossible. However, authors could further convince the reader by showing the effect of relaxing certain assumptions of their surrogate data generation model (e.g. absence of temporal correlation in measurement noise), and show the robustness and limits of the methods.

      Thank you for this suggestion. Motivated by this comment, and a related comment by Reviewer 2, we have now substantially enhanced our performance analyses in the revised manuscript and compiled them in a new subsection titled “Analysis of Robustness with respect to Modeling Assumptions” for better clarity and consistency. In summary:

      1) We first examined the robustness of our proposed method with respect to model mismatch in the stimulus integration model. As suggested, we generated data according to a non-linear (i.e., quadratic sum of linear filters) receptive field model:

      but assumed a linear stimulus integration model in our inference procedure

      The comparison of the correlations estimated under this setting by each method are shown in Figure 2 – Figure Supplement 3. While the performance of our proposed signal correlation estimates under this setting degrade as compared to that in Figure 2 with no model mismatch, our proposed estimates still outperform the other methods and recovers the ground truth signal correlation structure reasonably well.

      It is noteworthy that the model mismatch in the stimulus integration component does not affect the accuracy of noise correlation estimates in our method, as is evident from the noise correlation estimates in Figure 2 – Figure Supplement 3. In comparison, the biases induced in the other methods due to model mismatch and various other factors such as observation noise, temporal blurring, undermining non-linear mappings between spikes and underlying covariates, results in significantly larger errors in both signal and noise correlation estimates.

      2) We incorporated our previous analysis of robustness with respect to calcium decay model mismatch in this subsection, which is shown in Figure 2 – Figure Supplement 4.

      3) In response to a related comment by Reviewer 2, we then performed extensive simulations to evaluate the effects of SNR and firing rate on the performance of our method. Overall, while the performance of all algorithms degrades at low SNR or firing rate values (SNR < 10 dB, firing rate < 0.5 Hz), our algorithm outperforms the existing methods in a wide range of SNR and firing rate values considered. The results are summarized in Figure 2 – Figure Supplement 5.

      4) Finally, we considered two observation noise model mismatch conditions, namely, white noise + low frequency drift and pink noise, similar to the treatment in Deneux et al. (2016). For each noise mismatch model, we also varied the SNR level and firing rate and compared the performance of the different algorithms as reported in Figure 2 – Figure Supplement 6. These new analyses demonstrate that our proposed estimates outperform the existing methods, under correlated generative noise models, and also with respect to varying levels of SNR and firing rate. As clearly evident in panels C and F of Figure 2 – Figure Supplement 6, even though the estimated calcium concentrations are contaminated by the temporally correlated fluctuations in observation noise, the putative spikes estimated as a byproduct of our iterative method closely match the ground truth spikes, which in turn results in accurate estimates of signal and noise correlations.

      To address this comment, we performed extensive simulations to evaluate the robustness of different algorithms under model mismatch conditions induced by 1) non-linearity in the stimulus integration model, 2) calcium decay, 3) SNR and firing rate, and 4) temporal correlation of observation noise. We have now compiled these results in a new subsection called “Analysis of Robustness with respect to Modeling Assumptions” (Pages 6-7).

      Also further intuitions about why this method outperform others would be of great help for the non-specialist readers.

      Thank you for this suggestion. There are two sources for the performance gap between our proposed method and existing approaches:

      1) Favorable soft decisions on the timing of spikes achieved by our method, as a byproduct of the iterative variational inference procedure: an accurate probabilistic decoding of spikes results in better estimates of the signal/noise correlations, and conversely having more accurate estimates of the signal/noise covariances improves the probabilistic characterization of spiking events. This is in contrast with both the Pearson and Two-Stage methods: in the Pearson method, spike timing is heavily blurred by the calcium decay; in the two-stage methods, erroneous hard (i.e., binary) decisions on the timing of spiking events result in biases that propagate to and contaminate the downstream signal and noise correlation estimation and thus result in significant errors.

      2) Explicit modeling of the non-linear mapping from stimulus and latent noise covariates to spiking through a canonical point process model (which is in turn tied to a two-photon observation model in a multi-tier Bayesian fashion) results in robust performance under limited number of trials and observation duration. As we have shown in Appendix 1, as the number of trials L and trial duration T tend to infinity, conventional notions of signal and noise correlation indeed recover the ground truth signal and noise correlations, as the biases induced by non-linearities average out across trial repetitions. However, as shown in Figure 2 - Figure supplement 2, in order to achieve comparable performance to our method using 20 trials, the conventional correlation estimates require ~1000 trials.

      To address this comment, we have now included the aforementioned items in the revised Discussion section, highlighting the key aspects of our method that makes it outperform existing approaches (Pages 17-18).

      Reviewer #2 (Public Review):

      This manuscript describes a new method for estimating signal and noise correlations from two-photon recordings of calcium activity in large neuronal networks. Unlike existing methods that first require inferring spikes from calcium transients before estimating the correlations, the proposed method performs the correlation estimation directly from the fluorescence traces. It treats the different inputs to each neuron as latent variables to be inferred from its observed fluorescence activity, and divides these inputs according to whether they are provided by stimulus-dependent (signal) or stimulus-independent (noise) inputs. The authors showed with simulations that proper definitions of signal and noise correlations based on these inferred variables converge with trial repetition much faster to the true correlations than conventional estimates. They are not sensitive to blurring produced by inaccurate spike deconvolution and are less prone to erroneously mixing the signal and noise components of the correlations. By applying this new method to real optical recordings from the auditory cortex of awake mice, the authors shed new light on the structure of the circuitry underlying the processing of sound information in this brain region. Circuits processing sound-related and sound-independent information appear to be more orthogonal than previously thought, with a spatial signature that changes between thalamorecipient layer 4 and supragranular layers 2/3.

      This is a mathematical manuscript that introduces a promising new analysis approach. It is designed to be applied to two-photon experiments, that typically produce recordings of calcium activity of several hundred of neurons simultaneously. Because of their massive parallel recordings, which do not rely on spike sorting to identify single units, these optical techniques naturally provide access to correlation between units. They have given rise to a field of active research that attempts to link these correlations to elementary functional circuits in the brain. However, as the authors point out, the low efficiency of spike inference from calcium traces raises the need for correlation estimation approaches that circumvent this problem, as the method presented here does. As such, it could have a significant impact if the community succeeds in using it (see below).

      We would like to sincerely thank Reviewer 2 for his/her supportive stance towards our work, and for providing helpful feedback to improve our manuscript.

      Weaknesses and strengths

      1) Public availability of the code implementing the new method is clearly necessary for the two-photon microscopy community to adopt it, and this is indeed the case at https://github.com/Anuththara-Rupasinghe/Signal-Noise-Correlation. However, it is also crucial that any end-user be able to get a clear picture of the conditions under which the method can or cannot be applied before diving in. The fact that such an applicability domain is not well defined is a major concern. Notably, each Real Data Study presented in the paper uses a preliminary selection of "highly active cells" (1rst study: N = 16; 2nd study: N = 10; 3rd study: N~20 per field), as the authors succinctly discuss that performance is expected to degrade "in the regime of extremely low spiking rate and high observation noise" (l. 518-519). But no precise criteria are provided to specify what is meant by "highly active cells". On the other hand, the authors also assume that there is at most one spiking event per time frame for each neuron, which seems to exclude bursting neurons. The latter assumption seems to be a challenge with respect to the example traces shown on Fig. 4C (F/F reaches 400%) and on Fig. 6C (F/F reaches 100%), considering that the GCaMP6s signal for a single spike is expected to peak below 10-20%. This forces the authors to take a scaling factor of the observations A = 1 x I (Real Data Study 1 and 3) or A = 0.75 x I (Real Data Study 2) compared to the A = 0.1 x I taken in the Simulation Studies. Therefore, it looks like if the Real Data Studies were performed on mainly bursting cells and each burst was counted as one spiking event. A detailed discussion of the usable range of firing rates, whether in spike or burst units, as well as the usable range of SNR should be added to the main text to allow future users to assess the suitability of their data for this analysis.

      Thank you for pointing out the issues related to the applicability domain of our method. We agree that clarifying the rationale behind our model parameter choices is key to facilitating its usage by future users. In response to this comment, we have made three major revisions:

      1) Adding a new subsection to the Methods and Materials called “Guidelines for model parameter settings” that includes our rationale and criteria for choosing the number of neurons (N), stim- ulus integration window length (R), observation noise covariance (Σ_w), scaling matrix A, state transition parameter (α), and mean of the latent noise process (μ_x);

      2) Inspecting the capability of our proposed method in compensating for rapid increase of firing rate;

      3) Performing extensive new simulations to evaluate the effect of SNR level and firing rate on the performance of our proposed method, included in a new subsection in the Results section called “Analysis of robustness with respect to modeling assumptions”.

      We will next describe these changes in a point-by-point fashion.

      -Criterion for selecting the number of neurons. While our proposed method scales-up well with the population size due to low-complexity update rules involved, including neurons with negligible spiking activity in the analysis would only increase the complexity and potentially contaminate the correlation estimates. Thus, we performed an initial pre-processing step to extract N neurons that exhibited at least one spiking event in at least half of the trials considered. This criterion is now clearly stated in the subsection “Guidelines for model parameter settings”. We have also reworded “highly active cells” to “responsive cells (according to the selection criterion described in Methods and Materials)” for clarity.

      -Evaluating the effects of SNR level and firing rate. We had previously noted that the performance degrades at low SNR and firing rate values, with little quantitative justification. In response to this comment, and a related comment by Reviewer 1, we performed extensive simulations to evaluate the robustness of the different methods under varying SNR levels, firing rates, and observation noise model mismatch (including white noise + drift and pink noise models). These results are included in a new subsection called “Analysis of robustness with respect to modeling assumptions” and shown in Figure 2 – Figure Supplement 5 and 6.

      While the performance of all methods (including ours) degrades at low SNR levels or firing rates (SNR < 10 dB, firing rate < 0.5 Hz), our proposed method outperforms the existing methods in a wide range of SNR and firing rate values and under the considered observation noise model mismatch conditions. To quantify this comparison, we have also indicated the mean and standard deviation of the relative performance gain of our proposed estimates across SNR levels and firing rates as insets in Figure 2 – Figure Supplement 5 and 6.

      -Choosing the scaling matrix A. In each case, we set A=aI, and estimated a by considering the average increase in fluorescence after the occurrence of isolated spiking events. Specifically, we derived the average fluorescence activity of multiple trials triggered to the spiking onset and set a as the increment in the magnitude of this average fluorescence immediately following the spiking event.

      -Compensation for rapid increase of firing rate. The comment of the reviewer regarding the sudden increase of ∆F/F in Fig. 4C prompted us to inspect the performance of the algorithm in such scenarios where the choice of A may underestimate the rapid increase of firing rate (e.g., A= I). In the new supplementary figure to Fig. 4, called Figure 4 – Figure Supplement 2, we show a zoomed-in view of the time-domain estimates of the latent processes obtained by our proposed method (replicated here for discussion):

      Notably, the fluorescence activity rises up to a magnitude of ∼ 14, while we have set a=1. Thus, as the reviewer pointed out, this activity is induced by a burst-like event due to successive closely-spaced spikes. Due to the low firing rate of A1 neurons, we believe this is not a bursting event (in the electrophysiological sense), but a rapid increase in firing rate that may result in the occurrence of more than one spike per frame. From the estimates of the latent calcium concentration (purple) and putative spikes (green), we clearly see that our proposed method is still capable of matching the observed fluorescence activity through two mitigatory mechanisms that we describe next:

      1) The proposed method predicts spiking events in adjacent time frames to compensate for rapid increase of firing rate (see the green trace following the vertical dashed line) and thus infers calcium concentration levels that match the observed fluorescence activity;

      2) Even though our generative model assumes that there is only one spiking event in a given time frame, this assumption is implicitly alleviated in our inference framework by relaxing the constraint

      as explained in the section Methods and Materials - Low-complexity parameter updates (Page 23). While this relaxation was performed in order to make the inverse problem tractable, we see that it in fact leads to improved estimation results under such settings, by allowing the putative spike magnitudes

      to be greater than 1, as it is also evident in the magnitude of the inferred spikes right after the rise of fluorescence activity (the horizontal dashed line corresponds to spiking magnitude equal to 1).

      We have now discussed this observation in the Results section (Page 10).

      To address this comment, we have added a new subsection to Methods called “Guidelines for model parameter settings” that includes our rationale and criteria for choosing key model parameters (Page 24), have performed new simulation studies to evaluate the effects of SNR and firing rate on the performance of the proposed method (Pages 6-7), and closely inspected the performance of our method under rapid increase of firing rate (Page 10).

      2) Another parameter seems to be set by the authors on a criterion that is unclear to me: the number of time lags R to be included in the sound stimulus vector st. It seems to act as a memory of the past trajectory of the stimulus and probably serves to enhance the effect of stimulus onset/offset relative to the rest of the sound presentation. It is consistent with the known tendency of neurons in the primary auditory cortex to respond to these abrupt changes in sound power. However, this R is set at 2 in the Simulation Study 1, whereas it is set at 25, in the Real Data Studies 1 and 3, and to 40 in the Real Data Study 2. What leads to these differences escaped to me and should be explained more clearly.

      Thank you for pointing out this lack of clarity in explaining the rationale behind choosing R. In addressing this comment, we have now added an entry in the new subsection “Guidelines for model parameter settings”. Furthermore, we have unified our choice of R in the three real data studies. We will explain these changes in a point-by-point fashion next.

      -Choice of R in simulation studies. The stimulus used in the simulation was a 6th-order autoregressive process whose present and immediate past values contributed to spiking in our generative model (i.e., R=2). Given that the ground truth value of R was known in the simulations, we used R=2 for inference as well.

      -Choice of R for real data application. The number of lags R considered in stimulus integration is a key parameter that can be set through data-driven approaches or using prior domain knowledge. Examples of common data-driven criteria include cross-validation, Akaike Information Criterion (AIC) and Bayesian Information Criterion (BIC), which balance the estimation accuracy and model complexity.

      To quantify the effect of R on model complexity, we first describe the stimulus encoding model in our framework. Suppose that the onset of the pth tone in the stimulus set (p=1,⋯,P , where P is the number of distinct tones) is given by a binary sequence

      The choice of R implies that the response at time t post-stimulus depends only on the R most recent time lags. As such, the effective stimulus at time t corresponding to tone p is given by

      By including all the P tones, the overall effective stimulus at the tth time frame is given by

      The stimulus modulation vector d_j would thus be RP-dimensional. As a result, the number of parameters (M=RP) to be estimated linearly increases with R. By using additional domain knowledge, we chose R to be large enough to capture the stimulus effects, and at the same time to be small enough to control the complexity of the algorithm.

      As an example, given that the typical response duration of mouse primary auditory neurons is < 1 s, with a sampling frequency of f_s=30 Hz, we surmised that a choice of R∼30 would suffice to capture the stimulus effects. We further examined the effect of varying R on the proposed correlation estimates in Figure 4 – Figure Supplement 1. As shown, small values of R (e.g., R = 1 or 10) may not be adequate to fully capture the effects of stimuli. By considering values of R in the range 25 − 50, we noticed that the correlation estimates remain stable. We thus chose R=25 for our real data analyses. Notably, the results of real data study 2 (that previously used R = 40) are nearly unchanged with the new choice of R=25, which is in accordance with our observation in Figure 4 – Figure Supplement 1.

      To address this comment, we have added a new subsection to Methods called “Guidelines for model parameter settings” (Page 24) that includes our rationale for choosing the stimulus integration window length R and have performed a new analysis to evaluate the effect of R on the performance of the proposed method in real data study 1 (Page 10).

      3) This memory of the past stimulus trajectory appears to be specific to the proposed method and is not accounted for in the 2-stage Pearson estimation, for example. Since it probably helps to reflect the common sensitivity of neurons to onset/offset, it alone provides an advantage to the proposed method over the 2-stage Pearson estimation. It would be instructive to also perform this comparison with R set to 1 to get an idea of the magnitude of this advantage.

      We agree that explicit modeling of stimulus integration is a key advantage of our proposed method in comparison to the conventional ones. We have now explained this virtue in the discussion of the role of R in real data study 1 (Page 10). Additionally, as explained in our responses to the previous comment, we have included a new analysis of the sensitivity of our proposed estimates to the choice of R as a supplementary figure to Figure 4. As the reviewer suggested, we see that R=1 indeed fails to capture the underlying structure in the signal correlations. However, when R is sufficiently large (R>20), the estimates become stable.

      To address this comment, we have now discussed the advantage of including the stimulus history in our model and probed the sensitivity of our estimates to the choice of R in Figure 4 – Figure Supplement 1 (Page 10).

      4) Finally, although the example of ground truth signal and noise correlation matrices taken to illustrate the method in the simulation study on Fig. 2A have been chosen to be with almost no overlap in their non-zero coefficients, there is no fundamental reason why this separation should be the rule for real data. These coefficients reflect the patterns of stimulus-dependent and stimulus-independent functional connectivity in the recorded network. As such, these patterns could have different degree of overlap, depending on the brain areas recorded. It is therefore particularly striking that the authors find in their data a strong dissimilarity and almost no covariance between signal and noise correlation coefficients, throughout all the different sets of experiments they present here (Fig. 4E, Table 1, 2, 3, and Fig. 6A&B). This makes a strong and compelling statement on the likely separation of the corresponding circuits in the primary auditory cortex of the mouse.

      We agree with the assessment of the reviewer. We suspect that some of the reported similari- ties between signal and noise correlations in existing literature could be due to leakage in estimating these two quantities, likely indued by limited number of trials, short observation duration, and undermining the effect of calcium dynamics and non-linearities.

      Likely impact on the field

      It is now well established that sound processing is modulated, even at the level of primary auditory cortex, by locomotion (Schneider et al. Nature 2018), task engagement (Fritz et al. Nat. Neurosci. 2003), or several other factors. Applying the proposed method to these situations could help understand how sound processing circuits are remodeled, without confounding other coexisting processes. In general, whenever a brain structure makes associations between multiple processes within the same network, the presence of multiple circuits makes the observation of correlations difficult to attribute to the signature of a single circuit. By significantly improving the estimation of signal and noise correlations, the proposed method should help distinguish the boundaries of these circuits as well as their intersections. The exploration of the role of many secondary sensory and associative cortical structures could be renewed by this work.

      We would like to thank Reviewer 2 again for his/her supportive stance towards our work and for fairly summarizing our contributions

    1. Author Response

      Reviewer #1:

      This is a very timely paper that addresses an important and difficult-to-address question in the decision-making field - the degree to which information leakage can be strategically adapted to optimise decisions in a task-dependent fashion. The authors apply a sophisticated suite of analyses that are appropriate and yield a range of very interesting observations. The paper centres on analyses of one possible model that hinges on certain assumptions about the nature of the decision process for this task which raises questions about whether leak adjustments are the only possible explanation for the current data. I think the conclusions would be greatly strengthened if they were supported by the application and/or simulation of alternative model structures.

      We thank the reviewer for this positive appraisal of our study. We now entirely agree with their central comment about whether leak adjustments are the only (or even the best) explanation for the current data. We hope that the additional modelling sections that we have discussed in response to main comment 1 above have strengthened the paper. We have responded point-by-point to their public review, as this contained their main recommendations for revision.

      The behavioural trends when comparing blocks with frequent versus rare response periods seem difficult to tally with a change in the leak. […] Are there other models that could reproduce such effects? For example, could a model in which the drift rate varies between Rare and Frequent trials do a similar or better job of explaining the data?

      We can see why the reviewer has advocated for a possible change of drift rate (or ‘gain’ applied to sensory evidence) between conditions to explain our behavioural findings. We found, however, that changes in drift rate could elicit qualitatively similar changes in integration kernels to changes in decision threshold:

      Author response image 1.

      Changes in gain applied to incoming sensory evidence (A parameter in model) have similar effects on recovered integration kernels from Ornstein-Uhlenbeck simulation as changes in decision threshold.

      The likely reason for this is that the overall probability of emitting a response at any point in the continuous decision process is determined by the ratio of accumulated evidence to decision threshold. A similar logic applies to effects on reactions times and detection probability (main figure 2): increasing sensory gain/decreasing decision threshold will lead to faster reaction times and increased detection probability during response periods.

      Both parameters may even have a similar effect on ‘false alarms’, because (as the reviewer notes below) false alarms in our paradigm are primarily being driven by the occurrence of stimulus changes as well as internal noise. In fact, the false alarm findings mean it is difficult to fully reconcile all of our behavioural findings in terms of changes in a single set of model parameters in the O-U process. It is possible that other changes not considered within our model (such as expectations of hazard rates of inter-response intervals leading to dynamic thresholds etc.) may have had a strong impact upon the resulting false alarm rates. A full exploration of different variations in O-U model (with varying urgency signals, hazard rates, etc.) is beyond the scope of this paper.

      For this reason, we have decided in our new modelling section to focus primarily on a single, well-established model (the O-U process) and explore how changes in leak and threshold affect task performance and the resulting integration kernels. We note that this is in line with the suggestion of reviewer #2, who focussed on similar behavioural findings to reviewer #1 but suggested that we look at decision threshold rather than drift rate as our primary focus.

      This ties in to a related query about the nature of the task employed by the authors. Due to the very significant volatility of the stimulus, it seems likely that the participants are not solely making judgments about the presence/absence of coherent motion but also making judgments about its duration (because strong coherent motion frequently occurs in the inter-target intervals). If that is so, then could the Rare condition equate to less evidence because there is an increased probability that an extended period of coherent motion could be an outlier generated from the noise distribution? Note that a drift rate reduction would also be expected to result in fewer hits and slower reaction times, as observed.

      As mentioned above, the rare and frequent targets are indeed matched in terms of the ease with which they can be distinguished from the intervening noise intervals. To confirm this, we directly calculated the variance (across frames) of the motion coherence presented during baseline periods and response periods (until response) in all four conditions:

      Author response image 2.

      The average empirical standard deviation of the stimulus stream presented during each baseline period (‘baseline’) and response period (‘trial’), separated by each of the four conditions (F = frequent response periods, R = rare, L = long response periods, S = short). Data were averaged across all response/baseline periods within the stimuli presented to each participant (each dot = 1 participant). Note that the standard deviation shown here is the standard deviation of motion coherence across frames of sensory evidence. This is smaller than the standard deviation of the generative distribution of ‘step’-changes in the motion coherence (std = 0.5 for baseline and 0.3 for response periods), because motion coherence remains constant for a period after each ‘step’ occurs.

      Some adjustment of the language used when discussing FAs seems merited. If I have understood correctly, the sensory samples encountered by the participants during the inter-response intervals can at times favour a particular alternative just as strongly (or more strongly) than that encountered during the response interval itself. In that sense, the responses are not necessarily real false alarms because the physical evidence itself does not distinguish the target from the non-target. I don't think this invalidates the authors' approach but I think it should be acknowledged and considered in light of the comment above regarding the nature of the decision process employed on this task.

      This is a good point. We hope that the reviewer will allow us to keep the term ‘false alarms’ in the paper, as it does conveniently distinguish responses during baseline periods from those during response periods, but we have sought to clarify the point that the reviewer makes when we first introduce the term.

      “Indeed, participants would occasionally make ‘false alarms’ during baseline periods in which the structure of the preceding noise stream mistakenly convinced them they were in a response period (see Figure 4, below). Indeed, this means that a ‘false alarm’ in our paradigm has a slightly different meaning than in most psychophysics experiments; rather than it referring to participants responding when a stimulus was not present, we use the term to refer to participants responding when there was no shift in the mean signal from baseline.”

      And:

      “The fact that evidence integration kernels naturally arise from false alarms, in the same manner as from correct responses, demonstrates that false alarms were not due to motor noise or other spurious causes. Instead, false alarms were driven by participants treating noise fluctuations during baseline periods as sensory evidence to be integrated across time, and the physical evidence preceding ‘false alarms’ need not even distinguish targets from non-targets.”

      The authors report that preparatory motor activity over central electrodes reached a larger decision threshold for RARE vs. FREQUENT response periods. It is not clear what identifies this signal as reflecting motor preparation. Did the authors consider using other effectorselective EEG signatures of motor preparation such as beta-band activity which has been used elsewhere to make inferences about decision bounds? Assuming that this central ERP signal does reflect the decision bounds, the observation that it has a larger amplitude at the response on Rare trials appears to directly contradict the kernel analyses which suggest no difference in the cumulative evidence required to trigger commitment.

      Thanks for this comment. First, we should simply comment that this finding emerged from an agnostic time-domain analysis of the data time-locked to button presses, in which we simply observed that the negative-going potential was greater (more negative) in RARE vs. FREQUENT trials. So it is simply the fact that it precedes each button press that we relate it to motor preparation; nonetheless, we note that (Kelly and O’Connell, 2013) found similar negative-going potentials at central sensors without applying CSD transform (as in this study). Like them, we would relate this potential to either the well-established Bereitschaftpotential or the contingent negative potential (CNV).

      We agree that many other studies have focussed on beta-band activity as another measure of motor preparation, and to make inferences about decision bounds. To investigate this, we used a Morlet wavelet transform to examine the time-varying power estimate at a central frequency of 20Hz (wavelet factor 7). We repeated the convolutional GLM analysis on this time-varying power estimate.

      We first examined average beta desynchonisation at a central cluster of electrodes (CPz, CP1, CP2, C1, Cz, C2) in the run-up to correct button presses during response periods. We found a reliable beta desynchonisation occurred, and, just as in the time-domain signal, this reached a greater threshold in the RARE trials than in the FREQUENT trials:

      Author response image 3.

      Beta desynchronisation prior to a correct response is greater over central electrodes in the RARE condition than in the FREQUENT condition.

      We agree with the reviewer that this is likely indicative of a change in decision threshold between rare and frequent trials. We also note that our new computational modelling of the O-U process suggests that this in fact reconciles well with the behavioural findings (changes in integration kernels). We now mention this at the relevant point in the results section:

      “As large changes in mean evidence are less frequent in the RARE condition, the increased neural response to |Devidence| may reflect the increased statistical surprise associated with the same magnitude of change in evidence in this condition. In addition, when making a correct response, preparatory motor activity over central electrodes reached a larger decision threshold for RARE vs. FREQUENT response periods (Figure 7b; p=0.041, cluster-based permutation test). We found similar effects in beta-band desynchronisation prior, averaged over the same electrodes; beta desynchronisation was greater in RARE than FREQUENT response periods. As discussed in the computational modelling section above, this is consistent with the changes in integration kernels between these conditions as it may reflect a change in decision threshold (figure 2d, 3c/d). It is also consistent with the lower detection rates and slower reaction times when response periods are RARE (figure 2 b/c).”

      We did also investigate the lateralised response (left minus right beta-desynchronisation, contrasted on left minus right responses). We found, however, that we were simply unable to detect a reliable lateralised signal in either condition using these lateralised responses. We suspect that this is because we have far fewer response periods than conventional trialbased EEG experiments of decision making, and so we did not have sufficient SNR to reliably detect this signal. This is consistent with standard findings in the literature, which report that the magnitude of the lateralised signal is far smaller than the magnitude of the overall beta desynchronisation (e.g. (Doyle et al., 2005))

      P11, the "absolute sensory evidence" regressor elicited a triphasic potential over centroparietal electrodes. The first two phases of this component look to have an occipital focus. The third phase has a more centroparietal focus but appears markedly more posterior than the change in evidence component. This raises the question of whether it is safe to assume that they reflect the same process.

      We agree. We have now referred to this as a ‘triphasic component over occipito-parietal cortex’ rather than centroparietal electrodes.

      Reviewer #2:

      Overall, the authors use a clever experimental design and approach to tackle an important set of questions in the field of decision-making. The manuscript is easy to follow with clear writing. The analyses are well thought-out and generally appropriate for the questions at hand. From these analyses, the authors have a number of intriguing results. So, there is considerable potential and merit in this work. That said, I have a number of important questions and concerns that largely revolve around putting all the pieces together. I describe these below.

      Thanks to the reviewer for their positive appraisal of the manuscript; we are obviously pleased that they found our work to have considerable potential and merit. We seek to address the main comments from their public review and recommendations below.

      1) It is unclear to what extent the decision threshold is changing between subjects and conditions, how that might affect the empirical integration kernel, and how well these two factors can together explain the overall changes in behavior.

      I would expect that less decay in RARE would have led to more false alarms, higher detection rates, and faster RTs unless the decision threshold also increased (or there was some other additional change to the decision process). The CPP for motor preparatory activity reported in Fig. 5 is also potentially consistent with a change in the decision threshold between RARE and FREQUENT. If the decision threshold is changing, how would that affect the empirical integration kernel? These are important questions on their own and also for interpreting the EEG changes.

      This important comment, alongside the comments of reviewer 1 above, made us carefully consider the effects of changes in decision threshold on the evidence integration kernel via simulation. As discussed above (in response to ‘essential revisions for the authors’), we now include an entirely new section on how changes in decision threshold and leak may affect the evidence integration kernel, and be used to optimise performance across the different sensory environments. In particular, we agree with the reviewer that the motor preparatory activity that differs between RARE and FREQUENT is consistent with a change in decision threshold, and our simulations have suggested that our behavioural findings on evidence integration are also consistent with this change as well. These are detailed on pp.1-4 of the rebuttal, above.

      2) The authors find an interesting difference in the CPP for the FREQUENT vs RARE conditions where they also show differences in the decay time constant from the empirical integration kernel. As mentioned above, I'm wondering what else may be different between these conditions. Do the authors have any leverage in addressing whether the decision threshold differs? What about other factors that could be important for explaining the CPP difference between conditions? Big picture, the change in CPP becomes increasingly interesting the more tightly it can be tied to a particular change in the decision process.

      We fully agree with the spirit of this comment, and we’ve tried much more carefully to consider what the influences of decision threshold and leak would be on our behavioural analyses. As discussed in the response to reviewer 1, we think that the negative-going potential at the time of responses (which is greater in RARE vs. FREQUENT, main figure 7b, and mirrored by equivalent changes in beta desynchronisation, see Reviewer Response Figure 5 above) are both reflective of a change in decision threshold between RARE and FREQUENT conditions. We have tried to make this link explicit in the revised results section:

      “As large changes in mean evidence are less frequent in the RARE condition, the increased neural response to |Devidence| may reflect the increased statistical surprise associated with the same magnitude of change in evidence in this condition. In addition, when making a correct response, preparatory motor activity over central electrodes reached a larger decision threshold for RARE vs. FREQUENT response periods (Figure 7b; p=0.041, cluster-based permutation test). We found similar effects in beta-band desynchronisation prior, averaged over the same electrodes; beta desynchronisation was greater in RARE than FREQUENT response periods. As discussed in the computational modelling section above, this is consistent with the changes in integration kernels between these conditions as it may reflect a change in decision threshold (figure 2d, 3c/d). It is also consistent with the lower detection rates and slower reaction times when response periods are RARE (figure 2 b/c).”

      I'll note that I'm also somewhat skeptical of the statements by the authors that large shifts in evidence are less frequent in the RARE compared to FREQUENT conditions (despite the names) - a central part of their interpretation of the associated CPP change. The FREQUENT condition obviously has more frequent deviations from the baseline, but this is countered to some extent by the experimental design that has reduced the standard deviation of the coherence for these response periods. I think a calculation of overall across-time standard deviation of motion coherence between the RARE and FREQUENT conditions is needed to support these statements, and I couldn't find that calculation reported. The authors could easily do this, so I encourage them to check and report it.

      See Author response image 2.

      3) The wide range of decay time constants between subjects and the correlation of this with another component of the CPP is also interesting. However, in trying to interpret this change in CPP, I'm wondering what else might be changing in the inter-subject behavior. For instance, it looks like there could be up to 4 fold changes in false alarm rates. Are there other changes as well? Do these correlate with the CPP? Similar to my point above, the changes in CPP across subjects become increasingly interesting the more tightly it can be tied to a particular difference in subject behavior. So, I would encourage the authors to examine this in more depth.

      Thanks for the interesting suggestion. We explored whether there might be any interindividual correlation in this measure with the false alarm rate across participants, but found that there was no such correlation. (See Author response image 4; plotting conventions are as in main figure 9).

      Author response image 4.

      No evidence of between-subject correlations in CPP responses and false alarm rates, in any of the four conditions.

      We hope instead that the extended discussion of how the integration kernel should be interpreted (in light of computational modelling) provides at least some increased interpretability of the between-subject effects that we report in figure 9.

      Reviewer #3 (Public Review):

      The main strength is in the task design which is novel and provides an interesting approach to studying continuous evidence accumulation. Because of the continuous nature of the task, the authors design new ways to look at behavioral and neural traces of evidence. The reverse-correlation method looking at the average of past coherence signals enables us to characterize the changes in signal leading to a decision bound and its neural correlate. By varying the frequency and length of the so-called response period, that the participants have to identify, the method potentially offers rich opportunities to the wider community to look at various aspects of decision-making under sensory uncertainty.

      We are pleased that the reviewer agrees with our general approach as a novel way of characterising various aspects of decision-making under uncertainty.

      The main weaknesses that I see lie within the description and rigor of the method. The authors refer multiple times to the time constant of the exponential fit to the signal before the decision but do not provide a rigorous method for its calculation and neither a description of the goodness of the fit. The variable names seem to change throughout the text which makes the argumentation confusing to the reader. The figure captions are incomplete and lack clarity.

      We apologise that some of our original submission was difficult to follow in places, and we are very grateful to the reviewer for their thorough suggestions for how this could be improved. We address these in turn below, and we hope that this answers their questions, and has also led to a significant improvement in the description and rigour of the methodology.

    1. Author Response:

      Reviewer #1:

      The paper uses a microfluidic-based method of cell volume measurement to examine single cell volume dynamics during cell spreading and osmotic shocks. The paper successfully shows that the cell volume is largely maintained during cell spreading, but small volume changes depend on the rate of cell deformation during spreading, and cell ionic homeostasis. Specifically, the major conclusion that there is a mechano-osmotic coupling between cell shape and cell osmotic regulation, I think, is correct. Moreover, the observation that fast deforming cell has a larger volume change is informative.

      The authors examined a large number of conditions and variables. It's a paper rich in data and general insights. The detailed mathematical model, and specific conclusions regarding the roles of ion channels and cytoskeleton, I believe, could be improved with further considerations.

      We thank the referee for the nice comment on our work and for the detailed suggestions for improving it.

      Major points of consideration are below.

      1) It would be very helpful if there is a discussion or validation of the FXm method accuracy. During spreading, the cell volume change is at most 10%. Is the method sufficiently accurate to consider 5-10% change? Some discussion about this would be useful for the reader.

      This is an important point and we are sorry if it was not made clear in our initial manuscript. We have now made it more clear in the text (p. 4 and Figure S1E and S1F).

      The important point is that the absolute accuracy of the volume measure is indeed in the 5 to 10% range, but the relative precision (repeated measures on the same cell) is much higher, rather in the 1% range, as detailed below based on experimental measures.

      1) Accuracy of absolute volume measurements. The accuracy of the absolute measure of the volume depends on several parameters which can vary from one experiment to the other: the exact height of the chamber, and the biological variability form one batch of cell to another (we found that the distribution of volumes in a population of cultured cells depends strongly on the details of the culture – seeding density, substrate, etc... - which we normalized as much as possible to reduce this variability, as described in previous articles, e.g. see2). To estimate this variability overall, the simplest is to compare the average volume of the cell population in different experiments, carried out in different chambers and on different days.

      Graph showing the initial average volume of cells +/- STD for 7 spreading experiments and 27 osmotic shock experiments, expressed as a % deviation from the average volume over all the experiments.

      The average deviation is of 10.9 +/- 8%

      2) Precision of relative volume measurements. When the same cell is imaged several times in a time-lapse experiment, as it is spreading on a substrate, or as it is swelling or shrinking during an osmotic shock, most of the variability occurring from one experiment to another does not apply. To experimentally assess the precision of the measure, we performed high time resolution (one image every 30 ms) volume measurements of 44 spread cells during 9 s. During this period of time, the volume of the cell should not change significantly, thus giving the precision of the measure.

      Graph showing the coefficient of variation of the volume (STD/mean) for each individual cell (n=44) across the almost 300 frames of the movie. This shows that on average the precision of volume measurements for the same cell is 0.97±0.21%. In addition, if more precision was needed, averaging several consecutive measures can further reduce the noise, a method which is very commonly used but that we did not have to apply to our dataset.

      We have included these results in the revised manuscript, since they might help the reader to estimate what can be obtained from this method of volume measurement. We also point the reviewer to previous research articles using this method and showing both population averages and time-lapse data2–8 . Another validation of our volume measurement method comes from the relative volume changes in response to osmotic shock (Ponder’s relation) measured with FXm, which gave results very similar to the numbers of previously published studies. We actually performed these experiments to validate our method, since the results are not novel.

      2) The role of cell active contraction (myosin dynamics) is completely neglected. The membrane tether tension results, LatA and Y-compound results all indicate that there is a large influence of myosin contraction during cell spreading. I think most would not be surprised by this. But the model has no contribution from cortical/cytoskeletal active stress. The authors are correct that the osmotic pressure is much larger than hydraulic pressure, which is related to active contraction. But near steady state volume, the osmotic pressure difference must be equal to hydraulic pressure difference, as demanded by thermodynamics. Therefore, near equilibrium they must be close to each other in magnitude. During cell spreading, water dynamics is near equilibrium (given the magnitude of volume change), and therefore is it conceptually correct to neglect myosin active contraction? BTW, 1 solute model does not imply equal osmolarity between cytoplasm and external media. 1 solute model with active contraction was considered before, e.g., ref. 17 and Tao, et al, Biophys. J. 2015, and the steady state solution gives hydraulic pressure difference equal to osmotic pressure difference.

      This is an excellent point raised by the referee. We have two types of answers for this. First an answer from an experimental point of view, which shows that acto-myosin contractility does not seem to play a direct role in the control of the cell volume, at least in the cells we used here. Based on these results we then propose a theoretical reason why this is the case. It contrasts with the view proposed in the articles mentioned by the referee for a reason which is not coming from the physical principles, with which we fully agree, but from the actual numbers, available in the literature, of the amount of the various types of osmolytes inside the cell. We give these points in more details below and we hope they will convince the referee. We also now mention them explicitly in the main text of the article (p. 6-7, Figure S3F) and in the Supplementary file with the model.

      A. Experimental results

      To test the effect of acto-myosin contraction on cell volume, we performed two experiments:

      1) We measured the volume of same cell before and after treatment with the Rho kinase ROCK inhibitor Y-27632, which decreases cortical contractility. The experiment was performed on cells plated on poly-L-Lysin (PLL), like osmotic shock experiments, a substrate on which cells adhere, allowing the change of solution, but do not spread and remain rounded. This allowed us to evaluate the effect of the drug. Cells were plated on PLL-coated glass. The change of medium itself (with control medium) induced a change of volume of less than 2%, similar to control osmotic shock experiments (maybe due to shear stress). When the cells were treated with Y-27, the change of volume was similar to the change with the control medium (now commented in the text p. 6-7, Figure S3F). To make the analysis more complete, we distinguished the cells that remained round throughout the experiment from the cells which slightly spread, since spreading could have an effect on volume. Indeed we observed that treatment with Y-27 induced more cells to spread (Figure S3F), probably because the cortex was less tensed, allowing the adhesive forces on PLL to induce more spreading9. Nevertheless, the spreading remained rather slow and the volume change of cells treated or not with Y-27 was not significantly different. This shows that, in the absence of fast spreading induced by Y-27, the reduction of contractility per se does not have any effect on the cell volume.

      Graphs showing proportion of cells that spread during the experiments (left); average relative volume of round (middle) and spread (right) control (N=3, n=77) and Y-27 treated cells (N=4, N=297).

      2) To evaluate the impact of a reduction of contractility in the total absence of adhesion, we measured the average volume of control cells versus cells which have been pretreated with Y-27, plated on a non-adhesive substrate (PLL-PEG treatment). This experiment showed that the volume of the cells evolved similarly in time for both conditions, proving that contractility per se has no effect on the cell volume or cell growth, in the absence of spreading.

      Graphs showing average relative volume of control (N=5, n=354) and Y-27 (N=3, n=292) treated cells plated on PLL-PEG (left); distributions of initial volume for control (middle) and Y-27 treated cells (right) represented on the left graph.

      Taken together these results show that inhibition of contractility per se does not significantly affect cell volume. It thus confirms our interpretation of our results on cell spreading that reduction of contractility has an effect on cell volume, specifically in the context of cell spreading, primarily because it affects the spreading speed.

      B. Theoretical interpretation

      In accordance with our experiments, in our model, the effect of contractility is implicitly included in the model because it modulates the spreading dynamics, which is an input to the model, i.e. through the parameters tau_a and A_0.

      We do not include the effect of contractility directly in the water transport equation because our quantitative estimates support that the contribution of the hydrostatic pressure to the volume (or the volume change) is negligible in comparison to the osmotic pressure, and this even for small variation near the steady-state volume. The main important point is that the concentration of ions inside the cell is actually much lower than outside of the cell10,11. The difference is about 100 mM and corresponds mostly to nonionic small trapped osmolytes, such as metabolites12. The osmotic pressure corresponding to this is about 10^5 Pa. Taking the cortical tension to be of order of 1 mN/m and cell size to be about ten microns we get a hydrostatic pressure difference of about 100 Pa due to cortical tension. A significant change in cell volume, of the order observed during cell spreading (let’s consider a ten percent decrease) will increase the osmotic pressure of the trapped nonionic osmolytes by 10^4 Pa (their number in the cell remaining identical). For this osmotic pressure to be balanced by an increase in the hydrostatic pressure, the cortical tension would need to increase by a factor of 100, which we consider to be unrealistic. Therefore, we find it reasonable to ignore the contribution of the hydrostatic pressure difference in the water flux equation. It is also consistent with the novel experiments presented above which show that inhibition of cortical contractility changes the cells volume below what can be detected by our measures (thus likely at maximum in the 1% range). This is now explained in the main text and Supplementary file.

      Regarding our minimal model required to define cell volume, the reason why we believe one solute model is not sufficient is fundamentally the same as above: the concentration of trapped osmolytes is comparable to the total osmolarity, which means that their contribution to the total osmotic pressure cannot be discarded. Secondly, within the simplest one solute model, the pump and leak dynamics fixes in inner osmolytes concentration but does not involve the actual cell size. The most natural term that depends on the size is the Laplace pressure (inversely proportional to the cell size in a spherical cell model). But as discussed above, this term may only permit osmotic pressure differences of the order of 100 Pa, corresponding to an osmolytes concentration difference of the order of 0.1 mM. That is only a tiny fraction of the external medium osmolarity, which is about 300 mM. Such a model could thus only work for extremely fine tuning of the pump and leak rates to values with less than about 1% variation. Furthermore, such a model could not explain finite volume changes upon osmotic shocks without involving huge (100-fold) cell surface tension variations, as discussed above. For these reasons, we believe that the one-solute model is not appropriate to describe our experiments, and we feel that a trapped population of nonionic osmolytes is needed to balance the osmolarity difference created by the solute pump and leak.

      In the revised version of the manuscript, we have now added a section in Supplementary file and in the main text, explaining in more detail this approximation.

      3) The authors considered the role of Na, K, and Cl in the model, and used pharmacological inhibitors of NHE exchanger. I think this part of the experiments and model are somewhat weak. I am not sure the conclusions drawn are robust. First there are many ion channels/pumps in regulating Na, K and Cl. The most important of which is NaK exchanger. NHE also involves H, and this is not in the model. The ion flux expressions in the model are also problematic. The authors correctly includes voltage and concentration dependences, but used a constant active term S_i in SM eq. 3 for active pumping. I am not sure this is correct. Ion pump fluxes have been studied and proposed expressions based on experimental data exist. A study of Na, K, Cl dynamics, and membrane voltage on cell volume dynamics was published in Yellen et al, Biophys. J. 2018. In that paper, they used different expressions based on previously proposed flux expressions. It might be correct that in small concentration differences, their expressions can be linearized or approximated to achieve similar expressions as here. But this point should be considered more carefully.

      We thank the reviewer for this comment. Indeed, we have not well justified our use of the NHE inhibitor EIPA. Our aim was not to directly affect the major ion pumps involved in volume regulation (which would indeed rather be the Na+/K+ exchanger), because that would likely strongly impact the initial volume of the cell and not only the volume response to spreading, making the interpretation more difficult. We based our choice on previous publication, e.g.13, showing that EIPA inhibited the main fast volume changes previously reported for cultured cells: it was shown to inhibit volume loss in spreading cells, as well as mitotic cell swelling14,15. Using EIPA, we also found that, while the initial volume was only slightly affected, the volume loss was completely abolished even in fast spreading cells (Y-27 and EIPA combined treatment, Figure S5H). This clearly proves that the volume loss behavior can be abolished, without changing the speed of spreading, which was our main aim with this experiment.

      The most direct effect of inhibiting NHE exchangers is to change the cell pH16,17, which, given the low number of H protons in the cell (negligible contribution to cells osmotic pressure), cannot affect the cell volume directly. A well-studied mechanism through which proton transport can have indirect effect on cell volume is through the effect of pH on ion transporters or due to the coupling between NHE and HCO3/Cl exchanger. The latter case is well studied in the literature18. In brief, the flux of proton out of the cell through the NHE due to Na gradient leads to an outflux of HC03 and an influx of Cl. The change in Cl concentration will have an effect on the osmolarity and cell volume.

      We thus performed hyperosmotic shocks with this drug and we found that, as expected, it had no effect on the immediate volume change (the Ponder’s relation), but affected the rate of volume recovery (combined with cell growth). Overall, the cells treated with EIPA showed a faster volume increase, which is what is expected if active pumping rate is reduced. This is in contrast with the above mentioned mechanism of volume regulation which will to lead to a reduced volume recovery of EIPA treated cells. This leads us to conclude that there is potentially another effect of NHE perturbation. Changing the pH will have a large impact on the functioning of many other processes, in particular, it can have an effect on ion transport16. Overall, the cells treated with EIPA showed a faster volume increase, which is what is expected if active pumping rate is reduced.

      On the model side, the referee correctly points out that there are many ion transporters that are known to play a role in volume regulation which are not included in Eq. 3. In the revised manuscript we now start with a more general ion transport equation. We show that the main equation (Eq.1 - or Supplementary file Eq.13) relating volume change to tension is not affected by this generalization. This is because we consider only the linear relation between the small changes in volume and tension. We note that the generic description of the PML (Supplementary file Eqs.1-6) can be seen as general and does not require the pump and channel rates to be constant; both \Lambda_i and S_i can be a function of potential and ion concentration along with membrane tension. It is only later in the analysis that we do make the assumption that these parameters only depend on tension. This point is now made clear in the Supplementary file.

      There is a huge body of work both theoretical and experimental in which the effect of different ion transporters on cell volume is analyzed. The aim of this work is not to provide an analysis of cell volume and the effect of various co-transporters but is rather limited to understanding the coupling between cell spreading, surface tension and cell volume.

      To analytically estimate the sign of the mechano-osmotic coupling parameter alpha we use a minimal model. For this we indeed take the pumps and channels to be constant. As it is again a perturbative expansion around the steady state concentration, electric potential, and volume, the expression of alpha can be easily computed for a model with more general ion transporters. This generalization will come at the cost of additional parameters in the alpha expression. We decided to keep the simpler transport model, the goal of this estimate is merely to show that the sign of alpha is not a given and depends on relative values of parameters. Even for the simple model we present, the sign of alpha could be changed by varying parameters within reasonable ranges.

      Given these points, and the clarification of the reasons to use EIPA in our experiments, a full mechanistic explanation of the effect of this drug is beyond the scope of this work. Because of this we are not analyzing the effect of EIPA on the model parameter alpha in detail. We now clarified our interpretation of these results in the main text of the article.

      Reviewer #2:

      The work by Venkova et al. addresses the role of plasma membrane tension in cell volume regulation. The authors study how different processes that exert mechanical stress on cells affect cell volume regulation, including cell spreading, cell confinement and osmotic shock experiments. They use live cell imaging, FXm (cell volume) and AFM measurements and perform a comparative approach using different cell lines. As a key result the authors find that volume regulation is associated with cell spreading rate rather than absolute spreading area. Pharmacological assays further identified Arp2/3 and NHE1 as molecular regulators of volume loss during cell spreading. The authors present a modified mechano-osmotic pump and leak model (PLM) based on the assumption of a mechanosensitive regulation of ion flux that controls cell volume.

      This work presents interesting data and theoretical modelling that contribute new insight into the mechanisms of cell volume regulation.

      We thank the referee for the nice comments on our work. We really appreciate the effort (s)he made to help us improve our article, including the careful inspection of the figures. We think our work is much improved thanks to his/her input.

      Reviewer #3:

      The study by Venkova and co-workers studies the coupling between cell volume and the osmotic balance of the cell. Of course, a lot of work as already been done on this subject, but the main specific contribution of this work is to study the fast dynamics of volume changes after several types of perturbations (osmotic shocks, cell spreading, and cell compression). The combination of volume dynamics at very high time resolution, and the robust fits obtained from an adapted Pump and Leak Model (PLM) makes the article a step-forward in our understanding of how cell volume is regulated during cell deformations. The authors clearly show that:

      -The rate at which cell deforms directly impacts the volume change

      -Below a certain deformation rate (either by cell spreading or external compression), the cells adapt fast enough not to change their volume. The plot dV/dt vs dA/dt shows a clear proportionality relation.

      -The theoretical description of volume change dynamics with the extended PLM makes the overall conclusions very solid.

      Overall the paper is very well written, contains an impressive amount of quantitative data, comparing several cell types and physiological and artificial conditions.

      We thank the referee for the positive comment on our work.

      My main concern about this study is related to the role of membrane tension. In the PLM model, the coupling of cell osmosis to cell deformation is made through the membrane-tension dependent activity of ion channels. While the role of ion channels is extensively tested, it brings some surprising results. Moreover, the tension is measured only at fixed time points, and the comparison to theoretical predictions is not always as convincing as expected: when comparing fig 6I and 6J, I see that predictions shows that EIPA (+ or - Y27), CK-666 (+ or - Y27) and Y27 alone should have lower tension than in the control conditions, and this is clearly not the case in fig 6J. But I would not like to emphasize too much on those discrepancies, as the drugs in the real case must have broad effects that may not be directly comparable to the theory.

      We apologize for the mislabeling of the Figure 6I (now Figure 5I). This plot shows the theoretical estimate for the difference in tension (in the units of homeostatic tension) between the case when the cell loses its volume upon spreading (as observed in experiments) compared to the hypothetical situation when the cell does not lose volume upon spreading (alpha = 0). The positive value of the tension difference predicts that the cell tension would have been higher if the cell were not losing volume upon spreading, which is the case for the treatments with EIPA and CK-666 (+ Y27) and corresponds to what we found experimentally.

      It thus matches our experimental observations for drug treatments which reduce or abolish the volume loss during spreading and correspond to higher tether force only at short time.

      We have corrected the figure and figure legend and explained it better in the text.

      But I wonder if the authors would have a better time showing that the dynamics of tension are as predicted by theory in the first place, as comparing theoretical predictions with experiments using drugs with pleiotropic effects may be hazardous.

      Actually, a recent publication (https://doi.org/10.1101/2021.01.22.427801) shows that tension follows volume changes during osmotic shocks, and overall find the same dynamics of volume changes than in this manuscript. I am thus wondering if the authors could use the same technique than describe in this paper (FLIM of flipper probe) in order to study the dynamics of tension in their system, or at least refer to this paper in order to support their claim that tension is the coupling factor between volume and deformation.

      As was suggested by the referee, we tried to use the FLIPPER probe. We first tried to reproduce osmotic shock experiments adding to the HeLa cells 4% of PEG400 (+~200 mOsm) or 50% of H20 (-~170 mOsm) and measuring the average probe lifetime before and after the shock. We found significantly lower probe lifetime for hyperosmotic condition compared with control, and non-significant, but slightly higher lifetime for hypoosmotic shock. The magnitude of lifetime changes was comparable with the study cited by the reviewer, but the quality of our measures did not allow us to have a better resolution. Next we measured average lifetime for control and CK-666+Y-27 treated cells 30 min and 3 h after plating, because we have highest tether force values for CK-666+Y-27 at 30 min. We did not see a change in lifetime in control cells between 30 min and 3 h (which also did not see with the tether pulling). Cells treated with CK-666+Y-27 showed a slightly lower lifetime values than control cells, but both 30 min and 3 h after plating, which means that it did not correspond to the transient effect of fast spreading but probably rather to the effect of the drugs on the measure.

      Graph showing FLIPPER lifetime before and after osmotic shock for HeLa cells plated on PLL- coated substrate. Left: control (N=3, n=119) and hyperosmotic shock (N=3, n=115); Right: control (N=3, n=101) and hypoosmotic shock (N=3, n=80). p-value are obtained by t-test.

      Graph showing FLIPPER lifetime for control just after the plating on PLL-coated glass (the same data for control shown at the previous graph), 30 min (control: N=3, n=88; Y-27+CK-666: N=3, n=130) and 3 h (control: N=3, n=78; Y-27+CK-666: N=3, n=142) after plating on fibronectin-coated glass. p-value are obtained by t-test.

      Because the cell to cell variability might mask the trend of single cell changes in lifetime during spreading, we also tried to follow the lifetime of individual cells every 5 min along the spreading. Most illuminated cells did not spread, while cells in non-illuminated fields of view spread well, suggesting that even with an image every 5 minutes and the lowest possible illumination, the imaging was too toxic to follow cell spreading in time. We could obtain measures for a few cells, which did not show any particular trend, but their spreading was not normal. So we cannot really conclude much from these experiments.

      Graph showing FLIPPER lifetime changes for 3 individual cells plated on fibronectin-coated glass (shown in blue, magenta and green) and average lifetime of cells from non-illuminated field (cyan, n=7)

      Our conclusions are the following:

      1) We are able to visualize some change in the lifetime of the probe for osmotic shock experiments, similar to the published results, but with a rather large cell to cell variability.

      2) The spreading experiments comparing 30 minutes and 3 hours, in control or drug treated cells did not reproduce the results we observed with tether pulling, with a global effect of the drugs on the measures at both 30 min and 3 hours.

      3) Following single cells in time led to too much toxicity and prevented normal spreading.

      We think that this technology, which is still in its early developments, especially in terms of the microscope setting that has to be used (and we do not have it in our Institute, so we had to go on a platform in another institute with limited time to experiment), cannot be implemented in the frame of the revision of this article to provide reliable results. We thus consider that these experiments are for further development of the work and are out of the scope of this study. It would be very interesting to study in details the comparison between the oldest and more established method of tether pulling and the novel method of the FLIPPER probe, during cell spreading and in other contexts. To our knowledge this has never been done so far, so it is not in the frame of this study that we can do it. It is not clear from the literature that the two methods would measure the same thing in all conditions even if they might match in some.

    1. Author Response

      Reviewer #3 (Public Review):

      Dysbiosis has a substantial impact on host physiology. Using the nematode C. elegans and E.coli as a model of host-microbe interactions, Yang et al. defined a mechanism by which the host deals with gut dysbiosis to maintain fitness. They found that accumulation of E. coli in the intestine secreted indole, a tryptophan metabolite, and activated the transcription factor DAF-16. DAF-16 induced the expression of lys-7 and lys-8, which in turn limited E. coli proliferation in the gut of worms and maintained the longevity of worms. Finally, these authors demonstrated that indole-activated DAF-16 via TRPA-1 in neurons of worms.

      This study revealed a new mechanism of host-microbe interaction. The concept of their work is of broad interest and the results they present are convincing. However, there are some issues that need to be addressed to support the conclusions.

      Major issues

      1) The authors isolated the crude extract from a high-performance liquid chromatograph (HPLC). A candidate compound was detected by activity-guided isolation and further identified as indole with mass spectrometry and NMR data. The HPLC fractionations and activity-guided isolation experiments should be described in more detail with a schematic figure to reveal how these experiments were performed and how indole was identified. Showing a chemical characterization of indole in Figure 2A is not sufficient for the evaluation of the results. Rather, a figure comparing the fraction 26th with standard indole by MS and NMR is more appealing.

      We appreciate the concerns of the reviewer. Activity-guided isolation was performed as follows: The crude extract of E. coli supernatant metabolites was divided into 45 fractions according to polarity using Ultimate 3000 HPLC (Thermofisher, Waltham, MA) coupled with automated fraction collector. After freeze-drying each fraction, 1 mg of metabolites were dissolved in DMSO for DAF-16 nuclear localization assay in worms (Please see new Supplementary Table S2). The 26th fraction with DAF-16 nuclear translocation-inducing activity was then separated on silica gel column (200-300 mesh) with a continuous gradient of decreasing polarity (100%, 70%, 50%, 30%, petroleum ether/acetone) to yield four fractions (26a-d). Only the fraction of 26b could induce DAF-16 nuclear translocation. Then the fraction was further separated using a Sephadex LH-20 column to yield 32 fractions. The 26b-11th fraction with DAF-16 nuclear translocation-inducing activity contained a single compound identified by thin layer chromatography, mass spectrometry and nuclear magnetic resonance (NMR). The compound exhibited a quasimolecular ion peak at m/z 181.0782 [M+H]+ in the positive APCI-MS, and was assigned to a molecular formula of C8H7N. A comparison of these 1H NMR and 13C NMR spectra with the data reported in the literature revealed that the compound was indole (Yagudaev, 1986). The figure shows the comparison of the 26b-11 fraction with the standard indole by MS (Author response image 1).

      Author response image 1.

      High resolution mass spectrum of the candidate compound and indole.

      2) DAF-16::GFP was mainly located in the cytoplasm of the intestine in worms expressing daf-16p::daf-16::gfp fed live E. coli OP50 on Day 1 (Figure 1A and 1B). The nuclear translocation of DAF-16 in the intestine was increased in worms fed live E. coli OP50 on Days 4 and 7, but not in age-matched WT worms fed heat-killed (HK) E. coli OP50 (Figure 1A and 1B). Since DAF-16 functions downstream of DAF-2, have the levels of DAF-2 been tested during aging on OP50 and (HK) OP50, or with and without indole supplementation?

      In response to the reviewer’s suggestion, we carried out the RT-PCR experiment in 4-day-old and 7-day-old worms. It has been shown that DAF-2 initiates a kinase cascade that leads to the phosphorylation and cytoplasmic retention of DAF-16. By contrast, a reduction in the DAF-2 signaling leads to the dephosphorylation of DAF-16, allowing its nuclear translocation. In response to the reviewer’s suggestion, we tested the expression of daf-2 in 4-day-old and 7-day-old worms fed with OP50 and (HK) OP50. We found that the mRNA levels of daf-2 were significantly increased in worms on days 4 and 7 in the presence of either live or dead E. coli OP50, compared with those in worms on day 1 (Author response image 2A). In addition, supplementation with indole did not alter the mRNA levels of daf-2 in young adult worms (Author response image 2B). To conclude, the activation of DAF-16 is independent of DAF-2.

      Author response image 2.

      DAF-16 nuclear translocationisindependent of DAF-2.(A) The mRNA levelsof daf-2weregradually increasedin worms with age.P< 0.01;*P< 0.001; ns, not significant. (B)The mRNA levelsof daf-2were not alteredaftertreatment withindole for 24 hours.ns, not significant.

      3) In lines 155-157, the author argued that the increase in the levels of indole in worms results from the intestinal accumulation of live E. coli OP50, rather than exogenous indole produced by E. coli OP50 on the NGM plates. However, the work also showed that supplementation with indole (50-200 μM) could significantly increase the indole levels in young adult worms on Day 1 (Figure 2-figure supplement 3B), which could induce nuclear translocation of DAF-16 in worms (Figure 2B). This result suggested that worms could take in indole from outside culturing environment. The concentration of indole in OP50 and (HK) OP50 could be measured.

      We appreciate the concerns of the reviewer. Reviewer #2 also pointed out this problem. In this study, our data showed that the levels of indole were 30.9, 71.9, and 105.9 nmol/g dry weight in worms fed live E. coli OP50 on days 1, 4, and 7, respectively (Figure 2C). This increase in the levels of indole in worms was accompanied by an increase in CFU of live E. coli OP50 in the intestine of worms with age (Figure 2C). In addition, we determined the levels of indole in worms fed HK E. coli OP50, and found that the levels of indole were 28.2, 31.6, and 36.1 nmol/g dry weight in worms fed HK E. coli OP50 on days 1, 4, and 7, respectively (Figure 2-figure supplement 3A). It should be noted that the levels of indole in worms fed dead E. coli OP50 on day 1 were comparable of those in worms fed live E. coli OP50 on day 1 (30.9 vs 28.2 nmol/g dry weight). However, the levels of indole were not increased in worms fed HK E. coli OP50 on days 4 and 7. Furthermore, the observation that DAF-16 was retained in the cytoplasm of the intestine in worms fed live E. coli OP50 on day 1 (Figure 1A and 1B) also indicated that indole produced by E. coli OP50 on the NGM plates is not enough to induce DAF-16 nuclear translocation. By contrast, supplementation with indole (50-200 μM) significantly increased the indole levels in worms on day 1 (Figure 2-figure supplement 3B), which could induce nuclear translocation of DAF-16 in worms (Figure 2B). Thus, the increase in the levels of indole in worms with age results from intestinal accumulation of live E. coli OP50, rather than indole produced by E. coli OP50 on the NGM plates.

      4) Recent work showed that the multicopy DAF-16 transgene acts differently from the single copy GFP knock in DAF-16 transgene. Which DAF-16 transgene was used in this work?

      The strain we used is TJ356. Its genotype has been described as zIs356 [daf-16p::daf-16a/b::GFP+rol-6(su1006)] (Lee, Hench, & Ruvkun, 2001; Lin, Hsin, Libina, & Kenyon, 2001), from the Caenorhabditis Genetics Center (CGC).

      5) In lines 190-193, the author argued that the supplementation with indole (100 M) inhibited the CFU of E. coli K-12 in WT worms, but not daf-16(mu86) mutants, on Days 4 and 7 (Figure 3H and 3I). These results suggest that endogenous indole is involved in maintaining a normal lifespan in worms. This is overstating. The data here more likely suggest that indole could inhibit the proliferation of E. coli through DAF-16.

      We really appreciate this reviewer’s preciseness. In response to the reviewer’s suggestion, we had changed "...indole is involved in maintaining a normal lifespan in worms" to "...indole produced by bacteria in the gut could inhibit the proliferation of E. coli via DAF-16 in worms".

      6) Sonowal (2017) reported that AHR mediates indole-promoted lifespan extension at 16 C. Yet this work argued that RNAi knockdown of ahr-1 did not affect the nuclear translocation of DAF-16 in worms fed E. coli K12 strain on Day 7 (Figure 4-figure supplement 1A) or young adult worms treated with indole (100 M) for 24 h. The difference between these two works should be discussed.

      We really appreciate this reviewer’s preciseness. It has been shown that AHR-1 mediates indole-promoted lifespan extension in worms at 16 C (Sonowal et al., 2017). However, our data show that AHR-1 is not involved in activation of DAF-16 by indole-induced nuclear translocation of DAF-16 at 20 C. This means that AHR-1 and TRPA-1-lifespan extension by indole are essentially different. In our study, indole is added to NGM plates when worms reached the young adult stage. In the study by Sonowal et al., indole is supplemented at the stage of L1 larva. In addition, lifespan of C. elegans varies at different temperatures (Xiao et al., 2013). Thus, indole may promote lifespan extension via different mechanisms, which is dependent on exposure time and temperature.

      7) Sonowal (2017) conducted mRNA profiling for worms growing on K12 and K12△tnaA. Is TRPA1 in their de-regulated gene list? Have other de-regulated genes been tested in this work?

      We appreciate the concerns of the reviewer. We found that TRPA-1 is not included in the de-regulated gene list. Sonowal et al. focus on the gene expression profiles in worms from L1 larvae to young adults, whereas we pay attention to gene expression profiles in worms from young adults to aged worms. Thus, we did not test the de-regulated genes in their work.

      8) How does indole activate TRPA1? In the absence of trpa1, what is the concentration of indole in worms? Since TRPA1 is a channel, is there any possibility that TRPA1 is involved in the transport of indole? It is really interesting and surprising that neuronal TRPA-1, but not intestinal TRPA-1, mediates the beneficial effect of indole. How does indole specifically activate TRPA-1 in neurons to preserve the longevity of worms?

      We appreciate the concerns of the reviewer. TRPA1 is a nonselective cation channel permeable to Ca2+, Na+, and K+ (Zygmunt & Hogestatt, 2014). It is unlikely that TRPA1 is capable of transporting heterocyclic organic compounds, such as indole.

      In response to the reviewer’s suggestion, we detected the content of indole in trpa-1(ok999) worms. We found that the levels of indole in trpa-1(ok999) worms were slightly increased in worms on days 4 and 7, compared to those in WT worms on days 4 and 7 (Author response image 3).

      Recently, Ye et al. have demonstrated that indole and indole-3-carboxaldehyde (IAld) are agonists of TRPA1, which is conserved in vertebrates (Ye et al., 2021). Thus, it is mostly likely that indole acts as an agonist of TRPA-1 in C. elegans by directly binding to TRPA-1. One possibility is that activation of TRPA-1 in neurons by indole could induce a pathway that release a neurotransmitter, which in turn triggers a signaling pathway to extend lifespan of worms via activating DAF-16 in a non-cell autonomous manner. In contrast, the activation of TRPA-1 in the intestine by indole is unable to release such a neurotransmitter. Indeed, TRPA1 induces the releasing of calcitonin gene-related peptide in perivascular sensory nerves, leading to membrane hyperpolarization and arterial dilation on smooth muscle cells (Talavera et al., 2020). Moreover, the activation of TRPA1 by indole and IAld induces the secretion of the neurotransmitter serotonin in zebrafish (Ye et al., 2021).

      Author response image 3.

      The indole levels in trpa-1 mutants are increased on days 4 and 7, compared with those in WT worms. *P < 0.05.

      9) How neuronal- and intestinal-specific knockdown of trpa-1 by RNAi was conducted? And what is the tissue-specific expression pattern of trap-1? Speculating how indole was transported to neuron cells is pretty appealing.

      We appreciate the concerns of the reviewer. SID-1 is required cell-autonomously for systemic RNAi (Winston, Molodowitch, & Hunter, 2002). Thus, the sid-1 mutants are resistant to RNAi in the neuronal- and intestinal-specific RNAi strains, sid-1 was expressed under control of the neuronal-specific unc-119 and the intestinal-specific vha-6 promoters, respectively. Although it has been reported that TRPA-1 is expressed in neurons, muscles, hypodermal cells, and the intestine, Xiao et al. proved that only TRPA-1 expressed in the intestine and neurons contributes to life extension at low temperature (Xiao et al., 2013). The transporter of indole has not been identified. In Arabidopsis, ATP-binding cassette (ABC) transporter G family 37(ABCG37) has been reported to transport a range of indole derivatives (Ruzicka et al., 2010). However, all fifteen C. elegans ABC transporters share less than 30% sequence identity with ABCG37. Thus, it is impossible to determine which one is the transport channel for indole and indole derivatives in C. elegans.

      10) Supplementation with indole only up-regulated the expression of lys-7 and lys-8 in worms subjected to intestinal-specific (Figure 7-figure supplement 2C), but not neuronal-specific, RNAi of trpa-1 (Figure 7-figure supplement 2D). If this is the case, should the addition of indole specifically induce the expression of lys-7p::gfp or lys-8p::gfp in neurons?

      We really appreciate this reviewer’s preciseness. Indeed, lys-7 and lys-8 are expressed in both neurons and the intestine (Author response image 4A and 7B). However, the expression of lys-8p::gfp and lys-7p::gfp in neurons was not altered in worms after treatment with indole or knockdown of trpa-1 by RNAi (Author response image 4C and 4D).

      Author response image 4.

      The expression of LYS-7 and LYS-8 in neurons is not altered after treatment with indole or knockdown of trpa-1 by RNAi. (A and C) Representative images of lys-7p::gfp (A) and lys-8p::gfp (C). Both lys-7 and lys-8 could be expressed in neurons and the intestine. (B and D) Quantification of fluorescent intensity of lys-7p::gfp (B) and lys-8p::gfp (D) in neurons. These results are means ± SD of three independent experiments. ns, not significant.

      11) The authors demonstrated that K-12△tnaA strain had undetectable tnaA mRNA or indole levels. Furthermore, the deletion of tnaA significantly inhibited the nuclear translocation of DAF-16 in worms. However, mutations in E. coli still have non-specific effects as there are several transposon insertions or polar mutations influencing downstream genes. The authors should demonstrate that only disruption of TnaA causes the failure of nuclear translocation of DAF-16.

      In response to the reviewer’s suggestion, we rescued the expression of tnaA in the K-12 △tnaA strain. As expected, the indole level of from the supernatant in the K12 △tnaA::tnaA strain cultures was 34.1 μmol/L, which was comparable of that in the K12 strain cultures (42.5 μmol/L)(new Figure 2-figure supplement 4D). In addition, DAF-16 nuclear accumulation was increased in worms grown in the K12 △tnaA::tnaA strain on days 4 and 7 (new Figure 2-figure supplement 4E).

    1. Author Response

      Reviewer #1 (Public Review):

      A clear strength of the present manuscript is its scientific rigor. The authors put a lot of emphasis on transparent reporting and pre-registered their hypotheses. The within-person experimental design is well constructed and deals upfront with several potential confounds. All in all, the experimental design allowed a replication and extension of findings related to evoked neural responses due to auditory presentation during sleep. Nevertheless, the exact neural mechanisms that should drive sleepdependent learning gains due to reactivation remain elusive. In part this is due to analytical choices - especially with regard to the phase-amplitude coupling analyses. For example, it remains to be established that there is a reliable coupling of SOs and SPs before any condition specific analyses appear appropriate.

      We thank the reviewer for these constructive remarks. We acknowledge that the description of the phase-amplitude coupling analyses lacked details in the initial submission and we therefore clarified the approach in the revised manuscript. Moreover, we followed the suggestion of the reviewer and performed additional analyses to test for coupling within each stimulation condition and at rest separately. Briefly, the results show a reliable coupling between the phase of the slow oscillations and the amplitude of the signal in the sigma band irrespective of the stimulation condition. These results are reported in Supplemental Figure S5 of the revised submission.

      Reviewer #2 (Public Review):

      The work by Nicolas et al. investigates neurophysiological processes in response to sound cues delivered during sleep. Importantly, the presented sound cues were previously associated with a motor sequence participants had to practice. By presenting the sound cues during sleep, performance in pressing the motor sequence was increased (targeted memory reactivation, TMR). At the neural level, presenting sound cues associated with a motor sequence resulted in a higher amplitude (of the evoked response as well as of spontaneous slow waves) than presenting sound cues without any association. Further, the precise interplay between slow and sigma oscillations correlated with the behavioural TMR benefit.

      This finding is of high interest. However, some aspects of the analyses have to be clarified and the interpretation of sigma oscillations protecting motor memory (by being nested in the trough of the slow oscillation peak) has to be more substantiated by further results.

      Strengths: The study is elegantly designed (within-subjects design) and allows for testing the proposed hypotheses. The study as a sleep study is well controlled for example by incorporating a habituation nap, by using actigraphy during three nights before the learning nap and by measuring vigilance objectively as well as subjectively.

      One of the biggest strengths of the study is its pre-registration. The authors did not just pre-registered the study but moreover highlight and justify any deviation from the pre-registration and state whether an analysis was planned or exploratory. Thus, the whole research process is very transparent and plausible.

      We thank the reviewer for these constructive and positive remarks. We acknowledge that some aspects of the analyses lacked details in the initial submission and we therefore clarified the approach in the revised manuscript. Additionally, we have thoroughly considered the reviewer’s suggestions with respect to the analyses and interpretation of the sigma oscillations data (see response to comment #2 below).

      Weaknesses: The interpretation of sigma oscillations protecting motor memories (i.e., sigma power towards unassociated sound cues is increased in the trough of an evoked potential) is not very well substantiated by the results.

      We thank the reviewer for giving us the opportunity to further examine the role of sigma oscillations (and their coupling with slow oscillations) in the protective processes discussed in the manuscript. Our results indeed suggest that when a control, unknown cue is presented to the sleeping brain, it might trigger protective mechanisms to prevent these “irrelevant” sensory stimuli to be processed and therefore disturb the ongoing consolidation process. Specifically, we speculated that SW-sigma coupling during exposure to unassociated sounds might prevent sound processing which would in turn be reflected by a decrease in the amplitude of the slow electrophysiological responses (i.e., smaller ERP and SWs) during non-associated sound intervals. In order to further examine this possibility, we performed exploratory analyses testing for potential relationships between the eventrelated phase-amplitude coupling (ERPAC) observed on unassociated conditions and slow electrophysiological responses (i.e., ERP and SWs). To do so, we extracted the ERPAC value during unassociated stimulation intervals in the time-frequency window where ERPAC was significantly greater for unassociated as compared to associated and rest conditions (i.e. from -0.5 to 0.5 sec and from 14 to 18 Hz, see Figure 6 in the main text). While the ERPAC during unassociated intervals did not correlate with the amplitude of the unassociated ERPs, it correlated negatively with the properties of the SWs detected during unassociated intervals. Specifically, the higher the ERPAC, the lower SW density (t = 2.9, df = 20, p-value = 0.004) and peak-to-peak amplitude (S = 2460, p-value = 0.037) during unassociated intervals. These analyses, albeit exploratory, provide further support to the protective mechanism discussed in the initial version of the manuscript. These results are now reported in the supplemental information (Supplemental Figure S9) and mentioned in the revised discussion to further substantiate the hypothesized protective mechanism (see p. 13, l. 46 of the revised manuscript).

      The motivation for some analysis decisions is not always clear. To highlight one example, it is unclear why the authors average the data across channels. Previous findings demonstrate that slow oscillations and sleep spindles vary across the scalp (Klinzing et al. (2016), Cox et al. (2017)). Thus, averaging across all channels potentially introduces more noise.

      We apologize for the lack of justification concerning the averaging procedures in the original manuscript. We now explain in the revised manuscript the motivation for averaging data across channels in our different analyses (see pages 21 and 23). Briefly, as our montage did not allow fine topographical analyses (only 6 EEG channels), we opted to average data across channels in order to decrease the dimensionality of the data. However, we agree with the reviewer that reporting channel level data is important. Therefore, for each analysis presented in the main text, the corresponding channel-level results are reported in the supplements (i.e., ERPs are shown in Supplemental Figure S2 and S4, correlation between targeted memory reactivation index and power modulation is depicted in Supplemental Figure S7, PAC difference at the negative peak of the SW is in Supplemental Figure S6 and PAC/TMR index correlation in Figure S8). Altogether, channel level data revealed that central – and to a lesser extent frontal - electrodes mainly contributed to the pattern of results revealed with averaged data reported in the main text.

      The description of some methods has to be more precise (for example the detection of slow waves and sleep spindles and specifically the phase coupling).

      We thank the reviewer for pointing that out. We have now revised the manuscript to provide the necessary details on the detection algorithms (Vallat & Walker, 2021) as well as on the event-related phase-amplitude coupling method (Voytek et al., 2013, Combrisson et al., 2020). We invite the reviewer to consult the responses to comments #13 and #16 below for detailed responses to these points.

      Reviewer #3 (Public Review):

      Nicolas et al. performed a nap study in healthy humans to examine the temporal dynamics of sleep oscillations during procedural memory consolidation. To this end, the authors used targeted memory reactivation (TMR) to re-expose participants during a nap to a sound cue previously associated with a finger tapping sequence. As control conditions serve (i) a second encoded sequence with a sound that is not played during sleep, (ii) a novel control cue not heard during prior wakefulness and (iii) so-called rest-periods during which no cueing was performed. Behaviorally, the authors confirm the beneficial effect of TMR as participants perform better (faster) on the reactivated sequence in comparison to the not-reactivated sequence after their nap and even after an additional night spent at home.

      Electroencephalography recordings acquired during the nap then revealed that TMR cues evoked stronger responses than control cues hinting a distinct processing of familiar and memory-related cues. This is supported by a general analysis 0.5 to 2 Hz slow waves, one fundamental sleep oscillation linked to memory consolidation, which showed higher densities during intervals of real-cueing. Interestingly, the density of 12-16 Hz sleep spindles was not influenced, however, their frequency decreased and amplitude increased. Finally, the authors assessed the coupling between slow waves and sleep spindles, which rather counter-intuitively showed an increased coupling during intervals cued with control sounds. Moreover, the stronger this coupling the higher the TMR benefit.

      Altogether, this data revealed an interesting slow wave-spindle dynamic underlying the processing of familiar and unfamiliar auditory cues and scrutinizes how these brain rhythms mediate memory consolidation

      Overall, this is a very well-designed experiment and I salute that it has been pre-registered and how transparent everything has been reported. Moreover, the utilization of a control sound during sleep is currently rarely taken advantage of during TMR study, while they can add important insights. While the analysis pipeline is appropriate and well-rounded, some aspects need to be clarified and extended.

      We would like to thank the reviewer for the time devoted to our manuscript and for the constructive comments about our work. We provide below detailed answers to the points raised by the reviewer.

      Response to control sounds. It is very surprising that the response to control sounds is, apart from an early evoked component around 100 ms, almost nonexistent. Auditory stimuli are overall known to normally evoke K-complexes and strong spindle responses. Could it be that for some reason control sounds were lower in volume or do they lead to a stronger habituation? Control analysis might help to ensure that there is really no confusion. For example, ERP at the beginning and end of each stimulation interval could be contrasted. Moreover, the authors state that sound cues were balanced across subjects. However, they also state that the volume was adapted for each sound individually. Additional data or statistics on these volumes, randomization and cued slow wave phase might be very helpful.

      We thank the reviewer for raising this point and for giving us the opportunity to elaborate on these aspects. The sound volume was indeed adjusted based on the perception level of each sound for each individual. As pointed out by the reviewer, this resulted in different absolute volumes for each sound and individual; however, all sounds were presented at the same percentage of detection thresholds across participants. Moreover, as the sound / condition associations were perfectly balanced in our experiment (each sound was associated to each condition 8 times), differences in sound volume - or frequency – cannot explain our pattern of results.

      Further, inspection of the ERP at the individual channel level (cf. Supplemental Figure S2) revealed that unassociated auditory cues can indeed elicit negative peak on some channels (Fz and C3 to a lesser extent). We invite the reviewer to refer to our response to comment #12 of reviewer #2 for a comparison with the relevant literature.

      In order to address the comment of the reviewer on potential habituation effects, we performed exploratory analyses on a subset of events. Specifically, we compared the ERPs computed across the 30 first vs. the 30 last cues presented during the nap within each condition (see Figure 1 below). CBP did not reveal any difference between early and late nap ERPs in any conditions (all p-values > 0.2). Importantly, the results observed within the unassociated condition are similar to what is reported in the main text across all trials. Altogether, these analyses suggest that the weaker responses to the unassociated sound are not due to habituation processes.

      Figure 1: Event-related Potentials early vs. late nap. Group average (and standard error) of potentials evoked by the 30 first (grey) and the 30 last (black) auditory cues of the nap from cue onset to 2.5 sec post-cue averaged across participants (left: associated cues; right: unassociated cues). CBP did not show any early vs. late differences in ERPs in any conditions.

      Last, with respect to the point on cued slow wave phase, we extracted the phase of the slow oscillation (0.5-2Hz) at which the auditory cues were sent in each condition separately (see Figure 2 below). We then tested whether the phases differed using Watson-Williams multi-sample test for equal means (Berens, 2009). Results showed no difference between the two conditions (F(1,46)= 0.6, p-value = 0.8), suggesting that the effects reported in the main text were not confounded by this factor.

      Figure 2: Phase of slow oscillation at stimulation. Phase in degrees of the SO at the associated (magenta) or unassociated (yellow) auditory cues.

      Discrete slow wave analysis. It is reported that the offline detection of slow waves yielded identical numbers across conditions, but this contradicts the later reported differences in densities. If this is true, it implies that the total time during which real cues and control cues were presented as well as the cueing paused (i.e., the rest intervals) differs within subjects. It needs to be ensured that effective stimulation times are comparable between subjects and are not confounded by unfair comparisons.

      There might be a misunderstanding on this point, as we did not compare the number of SWs between conditions but only SW density and amplitude. We assume that the reviewer is referring to the number of auditory cues sent during NREM that were indeed not different across conditions.

      Statistical results. Consistently across all cluster-based statistics, significant clusters somehow do not reflect the underlying colormaps. One would expect that significances are driven by clusters of greatest difference (Figure 6B and C). That something might be amiss, is reflected in the statement that a contrast of TFRs for real and control cues revealed no significant cluster, although this contrast shown in Figure 7a clear depicts two cluster with strong power differences (before 500 ms around 8 Hz, and after 500 ms around 20 Hz).

      Moreover, follow-up analysis revolving around sleep spindles are based on inconsistent frequency ranges. For one analysis a prior significant cluster is used (Figure 8) while for the other it is limited to 12- 16 Hz and a much shorter time window than the overall cluster (Figure 7), even in the pre-registered 1216 Hz window. Overall, these analyses should be checked and streamlined.

      We agree with the reviewer that time-frequency representations (TFR) of results can somehow be misleading as inter-subject variability is not represented. As such, clusters showing e.g. a high difference in PAC between conditions but also high inter-subject variability would be represented with warm colors in the TFR but would not be highlighted by the CBP statistics (as seen for example in Figure 6B and C). Instead, what is highlighted by CBP are effects that are consistent across participants and these effects can indeed be of lower amplitude in some cases.

      Concerning Figure 7, the initial time-frequency plot presented the power difference between conditions that was subsequently correlated with the TMR index while the statistical cluster showed the results of the correlation. As this was indeed confusing (see also our response to comment #10 below and to comments #26 and #27 of reviewer #2), we now show the rho values issued from the correlation between the power difference and the TMR index. We thank the reviewer for pointing this out, as the new representation improved the readability of the figure.

      Last, we want to thank the reviewer for pointing out the discrepancy regarding the procedure used to extract the data for the scatter plots shown in panel B of Figures 7 and 8 (referred to as “follow-up analyses” by the reviewer). We now extract the values in the significant clusters included in the preregistered frequency band (12-16 Hz) for both analyses presented in Figures 7 and 8. It is worth nothing though that this procedure was only used for illustration purposes and was therefore not a formal follow-up analysis. We acknowledge that the p-values displayed on the panel B plots of the original figures might be misleading with that regard, thus they were removed in the revised manuscript.

    1. Author Response

      Reviewer #1 (Public Review):

      This manuscript will interest cognitive scientists, neuroimaging researchers, and neuroscientists interested in the systems-level organization of brain activity. The authors describe four brain states that are present across a wide range of cognitive tasks and determine that the relative distribution of the brain states shows both commonalities and differences across task conditions.

      The authors characterized the low-dimensional latent space that has been shown to capture the major features of intrinsic brain activity using four states obtained with a Hidden Markov Model. They related the four states to previously-described functional gradients in the brain and examined the relative contribution of each state under different cognitive conditions. They showed that states related to the measured behavior for each condition differed, but that a common state appears to reflect disengagement across conditions. The authors bring together a state-of-the-art analysis of systemslevel brain dynamics and cognitive neuroscience, bridging a gap that has long needed to be bridged.

      The strongest aspect of the study is its rigor. The authors use appropriate null models and examine multiple datasets (not used in the original analysis) to demonstrate that their findings replicate. Their thorough analysis convincingly supports their assertion that common states are present across a variety of conditions, but that different states may predict behavioural measures for different conditions. However, the authors could have better situated their work within the existing literature. It is not that a more exhaustive literature review is needed-it is that some of their results are unsurprising given the work reported in other manuscripts; some of their work reinforces or is reinforced by prior studies; and some of their work is not compared to similar findings obtained with other analysis approaches. While space is not unlimited, some of these gaps are important enough that they are worth addressing:

      We appreciate the reviewer’s thorough read of our manuscript and positive comments on its rigor and implications. We agree that the original version of the manuscript insufficiently situated this work in the existing literature. We have made extensive revisions to better place our findings in the context of prior work. These changes are described in detail below.

      1) The authors' own prior work on functional connectivity signatures of attention is not discussed in comparison to the latest work. Neither is work from other groups showing signatures of arousal that change over time, particularly in resting state scans. Attention and arousal are not the same things, but they are intertwined, and both have been linked to large-scale changes in brain activity that should be captured in the HMM latent states. The authors should discuss how the current work fits with existing studies.

      Thank you for raising this point. We agree that the relationship between low-dimensional latent states and predefined activity and functional connectivity signatures is an important and interesting question in both attention research and more general contexts. Here, we did not empirically relate the brain states examined in this study and functional connectivity signatures previously investigated in our lab (e.g., Rosenberg et al., 2016; Song et al., 2021a) because the research question and methodological complexities deserved separate attention that go beyond the scope of this paper. Therefore, we conceptually addressed the reviewer’s question on how functional connectivity signatures of attention are related to the brain states that were observed here. Next, we asked how arousal relates to the brain states by indirectly predicting arousal levels of each brain state based on its activity patterns’ spatial resemblance to the predefined arousal network template (Goodale et al., 2021).

      Latent states and dynamic functional connectivity

      Previous work suggested that, on medium time scales (~20-60 seconds), changes in functional connectivity signatures of sustained attention (Rosenberg et al., 2020) and narrative engagement (Song et al., 2021a) predicted changes in attentional states. How do these attention-related functional connectivity dynamics relate to latent state dynamics, measured on a shorter time scale (1 second)?

      Theoretically, there are reasons to think that these measures are related but not redundant. Both HMM and dynamic functional connectivity provide summary measures of the whole-brain functional interactions that evolve over time. Whereas HMM identifies recurring low-dimensional brain states, dynamic functional connectivity used in our and others’ prior studies captures high-dimensional dynamical patterns. Furthermore, while the mixture Gaussian function utilized to infer emission probability in our HMM infers the states from both the BOLD activity patterns and their interactions, functional connectivity considers only pairwise interactions between regions of interests. Thus, with a theoretical ground that the brain states can be characterized at multiple scales and different methods (Greene et al., 2023), we can hypothesize that the both measures could (and perhaps, should be able to) capture brain-wide latent state changes. For example, if we were to apply kmeans clustering methods on the sliding window-based dynamic functional connectivity as in Allen et al. (2014), the resulting clusters could arguably be similar to the latent states derived from the HMM.

      However, there are practical reasons why the correspondence between our prior dynamic functional connectivity models and current HMM states is difficult to test directly. A time point-bytime point matching of the HMM state sequence and dynamic functional connectivity is not feasible because, in our prior work, dynamic functional connectivity was measured in a sliding time window (~20-60 seconds), whereas the HMM state identification is conducted at every TR (1 second). An alternative would be to concatenate all time points that were categorized as each HMM state to compute representative functional connectivity of that state. This “splicing and concatenating” method, however, disrupts continuous BOLD-signal time series and has not previously been validated for use with our dynamic connectome-based predictive models. In addition, the difference in time series lengths across states would make comparisons of the four states’ functional connectomes unfair.

      One main focus of our manuscript was to relate brain dynamics (HMM state dynamics) to static manifold (functional connectivity gradients). We agree that a direct link between two measures of brain dynamics, HMM and dynamic functional connectivity, is an important research question. However, due to some intricacies that needed to be addressed to answer this question, we felt that it was beyond the scope of our paper. We are eager, however, to explore these comparisons in future work which can more thoroughly address the caveats associated with comparing models of sustained attention, narrative engagement, and arousal defined using different input features and methods.

      Arousal, attention, and latent neural state dynamics

      Next, the reviewer posed an important question about the relationship between arousal, attention, and latent states. The current study was designed to assess the relationship between attention and latent state dynamics. However, previous neuroimaging work showed that low-dimensional brain dynamics reflect fluctuations in arousal (Raut et al., 2021; Shine et al., 2016; Zhang et al., 2023). Behavioral studies showed that attention and arousal hold a non-linear relationship, for example, mind-wandering states are associated with lower arousal and externally distracted states are associated with higher arousal, when both these states indicate low attention (Esterman and Rothlein, 2019; Unsworth and Robison, 2018, 2016).

      To address the reviewer’s suggestion, we wanted to test if our brain states reflected changes in arousal, but we did not collect relevant behavioral or physiological measures. Therefore, to indirectly test for relationships, we predicted levels of arousal in brain states by applying the “arousal network template” defined by Dr. Catie Chang’s group (Chang et al., 2016; Falahpour et al., 2018; Goodale et al., 2021). The arousal network template was created from resting-state fMRI data to predict arousal levels indicated by eye monitoring and electrophysiological signals. In the original study, the arousal level at each time point was predicted by the correlation between the BOLD activity patterns of each TR to the arousal template. The more similar the whole-brain activation pattern was to the arousal network template, the higher the participant was predicted to be aroused at that moment. This activity pattern-based model was generalized to fMRI data during tasks (Goodale et al., 2021).

      We correlated the arousal template to the activity patterns of the four brain states that were inferred by the HMM. The DMN state was positively correlated with the arousal template (r=0.264) and the SM state was negatively correlated with the arousal template (r=-0.303) (Author response image 1). These values were not tested for significance because they were single observations. While speculative, this may suggest that participants are in a high arousal state during the DMN state and a low arousal state during the SM state. Together with our results relating brain states to attention, it is possible that the SM state is a common state indicating low arousal and low attention. On the other hand, the DMN state, a signature of a highly aroused state, may benefit gradCPT task performance but not necessarily in engaging with a sitcom episode. However, because this was a single observation and we did not collect a physiological measure of arousal to validate this indirect prediction result, we did not include the result in the manuscript. We hope to more directly test this question in future work with behavioral and physiological measures of arousal.

      Author response image 1.

      Changes made to the manuscript

      Importantly, we agree with the reviewer that a theoretical discussion about the relationships between functional connectivity, latent states, gradients, as well as attention and arousal was a critical omission from the original Discussion. We edited the Discussion to highlight past literature on these topics and encourage future work to investigate these relationships.

      [Manuscript, page 11] “Previous studies showed that large-scale neural dynamics that evolve over tens of seconds capture meaningful variance in arousal (Raut et al., 2021; Zhang et al., 2023) and attentional states (Rosenberg et al., 2020; Yamashita et al., 2021). We asked whether latent neural state dynamics reflect ongoing changes in attention in both task and naturalistic contexts.”

      [Manuscript, page 17] “Previous work showed that time-resolved whole-brain functional connectivity (i.e., paired interactions of more than a hundred parcels) predicts changes in attention during task performance (Rosenberg et al., 2020) as well as movie-watching and story-listening (Song et al., 2021a). Future work could investigate whether functional connectivity and the HMM capture the same underlying “brain states” to bridge the results from the two literatures. Furthermore, though the current study provided evidence of neural state dynamics reflecting attention, the same neural states may, in part, reflect fluctuations in arousal (Chang et al., 2016; Zhang et al., 2023). Complementing behavioral studies that demonstrated a nonlinear relationship between attention and arousal (Esterman and Rothlein, 2019; Unsworth and Robison, 2018, 2016), future studies collecting behavioral and physiological measures of arousal can assess the extent to which attention explains neural state dynamics beyond what can be explained by arousal fluctuations.”

      2) The 'base state' has been described in a number of prior papers (for one early example, see https://pubmed.ncbi.nlm.nih.gov/27008543). The idea that it might serve as a hub or intermediary for other states has been raised in other studies, and discussion of the similarity or differences between those studies and this one would provide better context for the interpretation of the current work. One of the intriguing findings of the current study is that the incidence of this base state increases during sitcom watching, the strongest evidence to date is that it has a cognitive role and is not merely a configuration of activity that the brain must pass through when making a transition.

      We greatly appreciate the reviewer’s suggestion of prior papers. We were not aware of previous findings of the base state at the time of writing the manuscript, so it was reassuring to see consistent findings. In the Discussion, we highlighted the findings of Chen et al. (2016) and Saggar et al. (2022). Both studies highlighted the role of the base state as a “hub”-like transition state. However, as the reviewer noted, these studies did not address the functional relevance of this state to cognitive states because both were based on resting-state fMRI.

      In our revised Discussion, we write that our work replicates previous findings of the base state that consistently acted as a transitional hub state in macroscopic brain dynamics. We also note that our study expands this line of work by characterizing what functional roles the base state plays in multiple contexts: The base state indicated high attentional engagement and exhibited the highest occurrence proportion as well as longest dwell times during naturalistic movie watching. The base state’s functional involvement was comparatively minor during controlled tasks.

      [Manuscript, page 17-18] “Past resting-state fMRI studies have reported the existence of the base state. Chen et al. (2016) used the HMM to detect a state that had “less apparent activation or deactivation patterns in known networks compared with other states”. This state had the highest occurrence probability among the inferred latent states, was consistently detected by the model, and was most likely to transition to and from other states, all of which mirror our findings here. The authors interpret this state as an “intermediate transient state that appears when the brain is switching between other more reproducible brain states”. The observation of the base state was not confined to studies using HMMs. Saggar et al. (2022) used topological data analysis to represent a low-dimensional manifold of resting-state whole-brain dynamics as a graph, where each node corresponds to brain activity patterns of a cluster of time points. Topologically focal “hub” nodes were represented uniformly by all functional networks, meaning that no characteristic activation above or below the mean was detected, similar to what we observe with the base state. The transition probability from other states to the hub state was the highest, demonstrating its role as a putative transition state.

      However, the functional relevance of the base state to human cognition had not been explored previously. We propose that the base state, a transitional hub (Figure 2B) positioned at the center of the gradient subspace (Figure 1D), functions as a state of natural equilibrium. Transitioning to the DMN, DAN, or SM states reflects incursion away from natural equilibrium (Deco et al., 2017; Gu et al., 2015), as the brain enters a functionally modular state. Notably, the base state indicated high attentional engagement (Figure 5E and F) and exhibited the highest occurrence proportion (Figure 3B) as well as the longest dwell times (Figure 3—figure supplement 1) during naturalistic movie watching, whereas its functional involvement was comparatively minor during controlled tasks. This significant relevance to behavior verifies that the base state cannot simply be a byproduct of the model. We speculate that susceptibility to both external and internal information is maximized in the base state—allowing for roughly equal weighting of both sides so that they can be integrated to form a coherent representation of the world—at the expense of the stability of a certain functional network (Cocchi et al., 2017; Fagerholm et al., 2015). When processing rich narratives, particularly when a person is fully immersed without having to exert cognitive effort, a less modular state with high degrees of freedom to reach other states may be more likely to be involved. The role of the base state should be further investigated in future studies.”

      3) The link between latent states and functional connectivity gradients should be considered in the context of prior work showing that the spatiotemporal patterns of intrinsic activity that account for most of the structure in resting state fMRI also sweep across functional connectivity gradients (https://pubmed.ncbi.nlm.nih.gov/33549755/). In fact, the spatiotemporal dynamics may give rise to the functional connectivity gradients (https://pubmed.ncbi.nlm.nih.gov/35902649/). HMM states bear a marked resemblance to the high-activity phases of these patterns and are likely to be closely linked to them. The spatiotemporal patterns are typically obtained during rest, but they have been reported during task performance (https://pubmed.ncbi.nlm.nih.gov/30753928/) which further suggests a link to the current work. Similar patterns have been observed in anesthetized animals, which also reinforces the conclusion of the current work that the states are fundamental aspects of the brain's functional organization.

      We appreciate the comments that relate spatiotemporal patterns, functional connectivity gradients, and the latent states derived from the HMM. Our work was also inspired by the papers that the reviewer suggested, especially Bolt et al.’s (2022), which compared the results of numerous dimensionality and clustering algorithms and suggested three spatiotemporal patterns that seemed to be commonly supported across algorithms. We originally cited these studies throughout the manuscript, but did not discuss them comprehensively. We have revised the Discussion to situate our findings on past work that used resting-state fMRI to study low-dimensional latent brain states.

      [Manuscript, page 15-16] “This perspective is supported by previous work that has used different methods to capture recurring low-dimensional states from spontaneous fMRI activity during rest. For example, to extract time-averaged latent states, early resting-state analyses identified task-positive and tasknegative networks using seed-based correlation (Fox et al., 2005). Dimensionality reduction algorithms such as independent component analysis (Smith et al., 2009) extracted latent components that explain the largest variance in fMRI time series. Other lines of work used timeresolved analyses to capture latent state dynamics. For example, variants of clustering algorithms, such as co-activation patterns (Liu et al., 2018; Liu and Duyn, 2013), k-means clustering (Allen et al., 2014), and HMM (Baker et al., 2014; Chen et al., 2016; Vidaurre et al., 2018, 2017), characterized fMRI time series as recurrences of and transitions between a small number of states. Time-lag analysis was used to identify quasiperiodic spatiotemporal patterns of propagating brain activity (Abbas et al., 2019; Yousefi and Keilholz, 2021). A recent study extensively compared these different algorithms and showed that they all report qualitatively similar latent states or components when applied to fMRI data (Bolt et al., 2022). While these studies used different algorithms to probe data-specific brain states, this work and ours report common latent axes that follow a long-standing theory of large-scale human functional systems (Mesulam, 1998). Neural dynamics span principal axes that dissociate unimodal to transmodal and sensory to motor information processing systems.”

      Reviewer #2 (Public Review):

      In this study, Song and colleagues applied a Hidden Markov Model to whole-brain fMRI data from the unique SONG dataset and a grad-CPT task, and in doing so observed robust transitions between lowdimensional states that they then attributed to specific psychological features extracted from the different tasks.

      The methods used appeared to be sound and robust to parameter choices. Whenever choices were made regarding specific parameters, the authors demonstrated that their approach was robust to different values, and also replicated their main findings on a separate dataset.

      I was mildly concerned that similarities in some of the algorithms used may have rendered some of the inter-measure results as somewhat inevitable (a hypothesis that could be tested using appropriate null models).

      This work is quite integrative, linking together a number of previous studies into a framework that allows for interesting follow-up questions.

      Overall, I found the work to be robust, interesting, and integrative, with a wide-ranging citation list and exciting implications for future work.

      We appreciate the reviewer’s comments on the study’s robustness and future implications. Our work was highly motivated by the reviewer’s prior work.

      Reviewer #3 (Public Review):

      My general assessment of the paper is that the analyses done after they find the model are exemplary and show some interesting results. However, the method they use to find the number of states (Calinski-Harabasz score instead of log-likelihood), the model they use generally (HMM), and the fact that they don't show how they find the number of states on HCP, with the Schaeffer atlas, and do not report their R^2 on a test set is a little concerning. I don't think this perse impedes their results, but it is something that they can improve. They argue that the states they find align with long-standing ideas about the functional organization of the brain and align with other research, but they can improve their selection for their model.

      We appreciate the reviewer’s thorough read of the paper, evaluation of our analyses linking brain states to behavior as “exemplary”, and important questions about the modeling approach. We have included detailed responses below and updated the manuscript accordingly.

      Strengths:

      • Use multiple datasets, multiple ROIs, and multiple analyses to validate their results

      • Figures are convincing in the sense that patterns clearly synchronize between participants

      • Authors select the number of states using the optimal model fit (although this turns out to be a little more questionable due to what they quantify as 'optimal model fit')

      We address this concern on page 30-31 of this response letter.

      • Replication with Schaeffer atlas makes results more convincing

      • The analyses around the fact that the base state acts as a flexible hub are well done and well explained

      • Their comparison of synchrony is well-done and comparing it to resting-state, which does not have any significant synchrony among participants is obvious, but still good to compare against.

      • Their results with respect to similar narrative engagement being correlated with similar neural state dynamics are well done and interesting.

      • Their results on event boundaries are compelling and well done. However, I do not find their Chang et al. results convincing (Figure 4B), it could just be because it is a different medium that explains differences in DMN response, but to me, it seems like these are just altogether different patterns that can not 100% be explained by their method/results.

      We entirely agree with the reviewer that the Chang et al. (2021) data are different in many ways from our own SONG dataset. Whereas data from Chang et al. (2021) were collected while participants listened to an audio-only narrative, participants in the SONG sample watched and listened to audiovisual stimuli. They were scanned at different universities in different countries with different protocols by different research groups for different purposes. That is, there are numerous reasons why we would expect the model should not generalize. Thus, we found it compelling and surprising that, despite all of these differences between the datasets, the model trained on the SONG dataset generalized to the data from Chang et al. (2021). The results highlighted a robust increase in the DMN state occurrence and a decrease in the base state occurrence after the narrative event boundaries, irrespective of whether the stimulus was an audiovisual sitcom episode or a narrated story. This external model validation was a way that we tested the robustness of our own model and the relationship between neural state dynamics and cognitive dynamics.

      • Their results that when there is no event, transition into the DMN state comes from the base state is 50% is interesting and a strong result. However, it is unclear if this is just for the sitcom or also for Chang et al.'s data.

      We apologize for the lack of clarity. We show the statistical results of the two sitcom episodes as well as Chang et al.’s (2021) data in Figure 4—figure supplement 2 in our original manuscript. Here, we provide the exact values of the base-to-DMN state transition probability, and how they differ across moments after event boundaries compared to non-event boundaries.

      For sitcom episode 1, the probability of base-to-DMN state transition was 44.6 ± 18.8 % at event boundaries whereas 62.0 ± 10.4 % at non-event boundaries (FDR-p = 0.0013). For sitcom episode 2, the probability of base-to-DMN state transition was 44.1 ± 18.0 % at event boundaries whereas 62.2 ± 7.6 % at non-event boundaries (FDR-p = 0.0006). For the Chang et al. (2021) dataset, the probability of base-to-DMN state transition was 33.3 ± 15.9 % at event boundaries whereas 58.1 ± 6.4 % at non-event boundaries (FDR-p < 0.0001). Thus, our result, “At non-event boundaries, the DMN state was most likely to transition from the base state, accounting for more than 50% of the transitions to the DMN state” (pg 11, line 24-25), holds true for both the internal and external datasets.

      • The involvement of the base state as being highly engaged during the comedy sitcom and the movie are interesting results that warrant further study into the base state theory they pose in this work.

      • It is good that they make sure SM states are not just because of head motion (P 12).

      • Their comparison between functional gradient and neural states is good, and their results are generally well-supported, intuitive, and interesting enough to warrant further research into them. Their findings on the context-specificity of their DMN and DAN state are interesting and relate well to the antagonistic relationship in resting-state data.

      Weaknesses:

      • Authors should train the model on part of the data and validate on another

      Thank you for raising this issue. To the best of our knowledge, past work that applied the HMM to the fMRI data has conducted training and inference on the same data, including initial work that implemented HMM on the resting-state fMRI (Baker et al., 2014; Chen et al., 2016; Vidaurre et al., 2018, 2017) as well as more recent work that applied HMMs to the task or movie-watching fMRI (Cornblath et al., 2020; Taghia et al., 2018; van der Meer et al., 2020; Yamashita et al., 2021). That is, the parameters—emission probability, transition probability, and initial probability—were estimated from the entire dataset and the latent state sequence was inferred using the Viterbi algorithm on the same dataset.

      However, we were also aware of the potential problem this may have. Therefore, in our recent work asking a different research question in another fMRI dataset (Song et al., 2021b), we trained an HMM on a subset of the dataset (moments when participants were watching movie clips in the original temporal order) and inferred latent state sequence of the fMRI time series in another subset of the dataset (moments when participants were watching movie clips in a scrambled temporal order). To the best of our knowledge, this was the first paper that used different segments of the data to fit and infer states from the HMM.

      In the current study, we wanted to capture brain states that underlie brain activity across contexts. Thus, we presented the same-dataset training and inference procedure as our primary result. However, for every main result, we also showed results where we separated the data used for model fitting and state inference. That is, we fit the HMM on the SONG dataset, primarily report the inference results on the SONG dataset, but also report inference on the external datasets that were not included in model fitting. The datasets used were the Human Connectome Project dataset (Van Essen et al., 2013), Chang et al. (2021) audio-listening dataset, Rosenberg et al. (2016) gradCPT dataset, and Chen et al. (2017) Sherlock dataset.

      However, to further address the concern of the reviewer whether the HMM fit is reliable when applied to held-out data, we computed the reliability of the HMM inference by conducting crossvalidations and split-half reliability analysis.

      (1) Cross-validation

      To separate the dataset used for HMM training and inference, we conducted cross-validation on the SONG dataset (N=27) by training the model with the data from 26 participants and inferring the latent state sequence of the held-out participant.

      First, we compared the robustness of the model training by comparing the mean activity patterns of the four latent states fitted at the group level (N=27) with the mean activity patterns of the four states fitted across cross-validation folds. Pearson’s correlations between the group-level vs. cross-validated latent states’ mean activity patterns were r = 0.991 ± 0.010, with a range from 0.963 to 0.999.

      Second, we compared the robustness of model inference by comparing the latent state sequences that were inferred at the group level vs. from held-out participants in a cross-validation scheme. All fMRI conditions had mean similarity higher than 90%; Rest 1: 92.74 ± 5.02 %, Rest2: 92.74 ± 4.83 %, GradCPT face: 92.97 ± 6.41 %, GradCPT scene: 93.27 ± 5.76 %, Sitcom ep1: 93.31 ± 3.92 %, Sitcom ep2: 93.13 ± 4.36 %, Documentary: 92.42 ± 4.72 %.

      Third, with the latent state sequences inferred from cross-validation, we replicated the analysis of Figure 3 to test for synchrony of the latent state sequences across participants. The crossvalidated results were highly similar to manuscript Figure 3, which was generated from the grouplevel analysis. Mean synchrony of latent state sequences are as follows: Rest 1: 25.90 ± 3.81%, Rest 2: 25.75 ± 4.19 %, GradCPT face: 27.17 ± 3.86 %, GradCPT scene: 28.11 ± 3.89 %, Sitcom ep1: 40.69 ± 3.86%, Sitcom ep2: 40.53 ± 3.13%, Documentary: 30.13 ± 3.41%.

      Author response image 2.

      (2) Split-half reliability

      To test for the internal robustness of the model, we randomly assigned SONG dataset participants into two groups and conducted HMM separately in each. Similarity (Pearson’s correlation) between the two groups’ activation patterns were DMN: 0.791, DAN: 0.838, SM: 0.944, base: 0.837. The similarity of the covariance patterns were DMN: 0.995, DAN: 0.996, SM: 0.994, base: 0.996.

      Author response image 3.

      We further validated the split-half reliability of the model using the HCP dataset, which contains data of a larger sample (N=119). Similarity (Pearson’s correlation) between the two groups’ activation patterns were DMN: 0.998, DAN: 0.997, SM: 0.993, base: 0.923. The similarity of the covariance patterns were DMN: 0.995, DAN: 0.996, SM: 0.994, base: 0.996.

      Together the cross-validation and split-half reliability results demonstrate that the HMM results reported in the manuscript are reliable and robust to the way we conducted the analysis. The result of the split-half reliability analysis is added in the Results.

      [Manuscript, page 3-4] “Neural state inference was robust to the choice of 𝐾 (Figure 1—figure supplement 1) and the fMRI preprocessing pipeline (Figure 1—figure supplement 5) and consistent when conducted on two groups of randomly split-half participants (Pearson’s correlations between the two groups’ latent state activation patterns: DMN: 0.791, DAN: 0.838, SM: 0.944, base: 0.837).”

      • Comparison with just PCA/functional gradients is weak in establishing whether HMMs are good models of the timeseries. Especially given that the HMM does not explain a lot of variance in the signal (~0.5 R^2 for only 27 brain regions) for PCA. I think they don't report their own R^2 of the timeseries

      We agree with the reviewer that the PCA that we conducted to compare with the explained variance of the functional gradients was not directly comparable because PCA and gradients utilize different algorithms to reduce dimensionality. To make more meaningful comparisons, we removed the data-specific PCA results and replaced them with data-specific functional gradients (derived from the SONG dataset). This allows us to directly compare SONG-specific functional gradients with predefined gradients (derived from the resting-state HCP dataset from Margulies et al. [2016]). We found that the degrees to which the first two predefined gradients explained whole-brain fMRI time series (SONG: 𝑟! = 0.097, HCP: 0.084) were comparable to the amount of variance explained by the first two data-specific gradients (SONG: 𝑟! = 0.100, HCP: 0.086). Thus, the predefined gradients explain as much variance in the SONG data time series as SONG-specific gradients do. This supports our argument that the low-dimensional manifold is largely shared across contexts, and that the common HMM latent states may tile the predefined gradients.

      These analyses and results were added to the Results, Methods, and Figure 1—figure supplement 8. Here, we only attach changes to the Results section for simplicity, but please see the revised manuscript for further changes.

      [Manuscript, page 5-6] “We hypothesized that the spatial gradients reported by Margulies et al. (2016) act as a lowdimensional manifold over which large-scale dynamics operate (Bolt et al., 2022; Brown et al., 2021; Karapanagiotidis et al., 2020; Turnbull et al., 2020), such that traversals within this manifold explain large variance in neural dynamics and, consequently, cognition and behavior (Figure 1C). To test this idea, we situated the mean activity values of the four latent states along the gradients defined by Margulies et al. (2016) (see Methods). The brain states tiled the two-dimensional gradient space with the base state at the center (Figure 1D; Figure1—figure supplement 7). The Euclidean distances between these four states were maximized in the two-dimensional gradient space, compared to a chance where the four states were inferred from circular-shifted time series (p < 0.001). For the SONG dataset, the DMN and SM states fell at more extreme positions of the primary gradient than expected by chance (both FDR-p values = 0.004; DAN and SM states, FDRp values = 0.171). For the HCP dataset, the DMN and DAN states fell at more extreme positions on the primary gradient (both FDR-p values = 0.004; SM and base states, FDR-p values = 0.076). No state was consistently found at the extremes of the secondary gradient (all FDR-p values > 0.021).

      We asked whether the predefined gradients explain as much variance in neural dynamics as latent subspace optimized for the SONG dataset. To do so, we applied the same nonlinear dimensionality reduction algorithm to the SONG dataset’s ROI time series. Of note, the SONG dataset includes 18.95% rest, 15.07% task, and 65.98% movie-watching data whereas the data used by Margulies et al. (2016) was 100% rest. Despite these differences, the SONG-specific gradients closely resembled the predefined gradients, with significant Pearson’s correlations observed for the first (r = 0.876) and second (r = 0.877) gradient embeddings (Figure 1—figure supplement 8). Gradients identified with the HCP data also recapitulated Margulies et al.’s (2016) first (r = 0.880) and second (r = 0.871) gradients. We restricted our analysis to the first two gradients because the two gradients together explained roughly 50% of the entire variance of functional brain connectome (SONG: 46.94%, HCP: 52.08%), and the explained variance dropped drastically from the third gradients (more than 1/3 drop compared to second gradients). The degrees to which the first two predefined gradients explained whole-brain fMRI time series (SONG: 𝑟! = 0.097, HCP: 0.084) were comparable to the amount of variance explained by the first two data-specific gradients (SONG: 𝑟! = 0.100, HCP: 0.086; Figure 1—figure supplement 8). Thus, the low-dimensional manifold captured by Margulies et al. (2016) gradients is highly replicable, explaining brain activity dynamics as well as data-specific gradients, and is largely shared across contexts and datasets. This suggests that the state space of whole-brain dynamics closely recapitulates low-dimensional gradients of the static functional brain connectome.”

      The reviewer also pointed out that the PCA-gradient comparison was weak in establishing whether HMMs are good models of the time series. However, we would like to point out that the purpose of the comparison was not to validate the performance of the HMM. Instead, we wanted to test whether the gradients introduced by Margulies et al. (2016) could act as a generalizable lowdimensional manifold of brain state dynamics. To argue that the predefined gradients are a shared manifold, these gradients should explain SONG data fMRI time series as much as the principal components derived directly from the SONG data. Our results showed comparable 𝑟!, both in predefined gradient vs. data-specific PC comparisons and predefined gradient vs. data-specific gradient comparisons, which supported our argument that the predefined gradients could be the shared embedding space across contexts and datasets.

      The reviewer pointed out that the 𝑟2 of ~0.5 is not explaining enough variance in the fMRI signal. However, we respectfully disagree with this point because there is no established criterion for what constitutes a high or low 𝑟2 for this type of analysis. Of note, previous literature that also applied PCA to fMRI time series (Author response image 4A and 4B) (Lynn et al., 2021; Shine et al., 2019) also found that the cumulative explained variance of top 5 principal components is around 50%. Author response image 4C shows cumulative variances to which gradients explain the functional connectome of the resting-state fMRI data (Margulies et al., 2016).

      Author response image 4.

      Finally, the reviewer pointed out that the 𝑟! of the HMM-derived latent sequence to the fMRI time series should be reported. However, there is no standardized way of measuring the explained variance of the HMM inference. There is no report of explained variance in the traditional HMMfMRI papers (Baker et al., 2014; Chen et al., 2016; Vidaurre et al., 2018, 2017). Rather than 𝑟!, the HMM computes the log likelihood of the model fit. However, because log likelihood values are dependent on the number of data points, studies do not report log likelihood values nor do they use these metrics to interpret the goodness of model fit.

      To ask whether the goodness of the HMM fit was significant above chance, we compared the log likelihood of the HMM to the log likelihood distribution of the null HMM fits. First, we extracted the log likelihood of the HMM fit with the real fMRI time series. We iterated this 1,000 times when calculating null HMMs using the circular-shifted fMRI time series. The log likelihood of the real model was significantly higher than the chance distribution, with a z-value of 2182.5 (p < 0.001). This indicates that the HMM explained a large variance in our fMRI time series data, significantly above chance.

      • Authors do not specify whether they also did cross-validation for the HCP dataset to find 4 clusters

      We apologize for the lack of clarity. When we computed the Calinski-Harabasz score with the HCP dataset, three was chosen as the most optimal number of states (Author response image 5A). When we set K as 3, the HMM inferred the DMN, DAN, and SM states (Author response image 5C). The base state was included when K was set to 4 (Author response image 5B). The activation pattern similarities of the DMN, DAN, and SM states were r = 0.981, 0.984, 0.911 respectively.

      Author response image 5.

      We did not use K = 3 for the HCP data replication because we were not trying to test whether these four states would be the optimal set of states in every dataset. Although the CalinskiHarabasz score chose K = 3 because it showed the best clustering performance, this does not mean that the base state is not meaningful to this dataset. Likewise, the latent states that are inferred when we increase/decrease the number of states are also meaningful states. For example, in Figure 1—figure supplement 1, we show an example of the SONG dataset’s latent states when we set K to 7. The seven latent states included the DAN, SM, and base states, the DMN state was subdivided into DMN-A and DMN-B states, and the FPN state and DMN+VIS state were included. Setting a higher number of states like K = 7 would mean that we are capturing brain state dynamics in a higher dimension than when using K = 4. Because we are utilizing a higher number of states, a model set to K = 7 would inevitably capture a larger variance of fMRI time series than a model set to K = 4.

      The purpose of latent state replication with the HCP dataset was to validate the generalizability of the DMN, DAN, SM, and base states. Before characterizing these latent states’ relevance to cognition, we needed to verify that these latent states were not simply overfit to the SONG dataset. The fact that the HMM revealed a similar set of latent states when applied to the HCP dataset suggested that the states were not merely specific to SONG data.

      To make our points clearer in the manuscript, we emphasized that we are not arguing for the four states to be the exclusive states. We made edits to Discussion as follows.

      [Manuscript, page 16] “Our study adopted the assumption of low dimensionality of large-scale neural systems, which led us to intentionally identify only a small number of states underlying whole-brain dynamics. Importantly, however, we do not claim that the four states will be the optimal set of states in every dataset and participant population. Instead, latent states and patterns of state occurrence may vary as a function of individuals and tasks (Figure 1—figure supplement 2). Likewise, while the lowest dimensions of the manifold (i.e., the first two gradients) were largely shared across datasets tested here, we do not argue that it will always be identical. If individuals and tasks deviate significantly from what was tested here, the manifold may also differ along with changes in latent states (Samara et al., 2023). Brain systems operate at different dimensionalities and spatiotemporal scales (Greene et al., 2023), which may have different consequences for cognition. Asking how brain states and manifolds—probed at different dimensionalities and scales—flexibly reconfigure (or not) with changes in contexts and mental states is an important research question for understanding complex human cognition.”

      • One of their main contributions is the base state but the correlation between the base state in their Song dataset and the HCP dataset is only 0.399

      This is a good point. However, there is precedent for lower spatial pattern correlation of the base state compared to other states in the literature.

      Compared to the DMN, DAN, and SM states, the base state did not show characteristic activation or deactivation of functional networks. Most of the functional networks showed activity levels close to the mean (z = 0). With this flattened activation pattern, relatively low activation pattern similarity was observed between the SONG base state and the HCP base state.

      In Figure 1—figure supplement 6, we write, “The DMN, DAN, and SM states showed similar mean activity patterns. We refrained from making interpretations about the base state’s activity patterns because the mean activity of most of the parcels was close to z = 0”.

      A similar finding has been reported in a previous work by Chen et al. (2016) that discovered the base state with HMM. State 9 (S9) of their results is comparable to our base state. They report that even though the spatial correlation coefficient of the brain state from the split-half reliability analysis was the lowest for S9 due to its low degrees of activation or deactivation, S9 was stably inferred by the HMM. The following is a direct quote from their paper:

      “To the best of our knowledge, a state similar to S9 has not been presented in previous literature. We hypothesize that S9 is the “ground” state of the brain, in which brain activity (or deactivity) is similar for the entire cortex (no apparent activation or deactivation as shown in Fig. 4). Note that different groups of subjects have different spatial patterns for state S9 (Fig. 3A). Therefore, S9 has the lowest reproducible spatial pattern (Fig. 3B). However, its temporal characteristics allowed us to distinguish it consistently from other states.” (Chen et al., 2016)

      Thus, we believe our data and prior results support the existence of the “base state”.

      • Figure 1B: Parcellation is quite big but there seems to be a gradient within regions

      This is a function of the visualization software. Mean activity (z) is the same for all voxels within a parcel. To visualize the 3D contours of the brain, we chose an option in the nilearn python function that smooths the mean activity values based on the surface reconstructed anatomy.

      In the original manuscript, our Methods write, “The brain surfaces were visualized with nilearn.plotting.plot_surf_stat_map. The parcel boundaries in Figure 1B are smoothed from the volume-to-surface reconstruction.”

      • Figure 1D: Why are the DMNs further apart between SONG and HCP than the other states

      To address this question, we first tested whether the position of the DMN states in the gradient space is significantly different for the SONG and HCP datasets. We generated surrogate HMM states from the circular-shifted fMRI time series and positioned the four latent states and the null DMN states in the 2-dimensional gradient space (Author response image 6).

      Author response image 6.

      We next tested whether the Euclidean distance between the SONG dataset’s DMN state and the HCP dataset’s DMN state is larger than would be expected by chance (Author response image 7). To do so, we took the difference between the DMN state positions and compared it to the 1,000 differences generated from the surrogate latent states. The DMN states of the SONG and HCP datasets did not significantly differ in the Gradient 1 dimension (two-tailed test, p = 0.794). However, as the reviewer noted, the positions differed significantly in the Gradient 2 dimension (p = 0.047). The DMN state leaned more towards the Visual gradient in the SONG dataset, whereas it leaned more towards the Somatosensory-Motor gradient in the HCP dataset.

      Author response image 7.

      Though we cannot claim an exact reason for this across-dataset difference, we note a distinctive difference between the SONG and HCP datasets. Both datasets largely included resting-state, controlled tasks, and movie watching. The SONG dataset included 18.95% of rest, 15.07% of task, and 65.98% of movie watching. The task only contained the gradCPT, i.e., sustained attention task. On the other hand, the HCP dataset included 52.71% of rest, 24.35% of task, and 22.94% of movie watching. There were 7 different tasks included in the HCP dataset. It is possible that different proportions of rest, task, and movie watching, and different cognitive demands involved with each dataset may have created data-specific latent states.

      • Page 5 paragraph starting at L25: Their hypothesis that functional gradients explain large variance in neural dynamics needs to be explained more, is non-trivial especially because their R^2 scores are so low (Fig 1. Supplement 8) for PCA

      We address this concern on page 21-23 of this response letter.

      • Generally, I do not find the PCA analysis convincing and believe they should also compare to something like ICA or a different model of dynamics. They do not explain their reasoning behind assuming an HMM, which is an extremely simplified idea of brain dynamics meaning they only change based on the previous state.

      We appreciate this perspective. We replaced the Margulies et al.’s (2016) gradient vs. SONGspecific PCA comparison with a more direct Margulies et al.’s (2016) gradient vs. SONG-specific gradient comparison as described on page 21-23 of this response letter.

      More broadly, we elected to use HMM because of recent work showing correspondence between low-dimensional HMM states and behavior (Cornblath et al., 2020; Taghia et al., 2018; van der Meer et al., 2020; Yamashita et al., 2021). We also found the model’s assumption—a mixture Gaussian emission probability and first-order Markovian transition probability—to be the most suited to analyzing the fMRI time series data. We do not intend to claim that other data-reduction techniques would not also capture low-dimensional, behaviorally relevant changes in brain activity. Instead, our primary focus was identifying a set of latent states that generalize (i.e., recur) across multiple contexts and understanding how those states reflect cognitive and attentional states.

      Although a comparison of possible data-reduction algorithms is out of the scope of the current work, an exhaustive comparison of different models can be found in Bolt et al. (2022). The authors compared dozens of latent brain state algorithms spanning zero-lag analysis (e.g., principal component analysis, principal component analysis with Varimax rotation, Laplacian eigenmaps, spatial independent component analysis, temporal independent component analysis, hidden Markov model, seed-based correlation analysis, and co-activation patterns) to time-lag analysis (e.g., quasi-periodic pattern and lag projections). Bolt et al. (2022) writes “a range of empirical phenomena, including functional connectivity gradients, the task-positive/task-negative anticorrelation pattern, the global signal, time-lag propagation patterns, the quasiperiodic pattern and the functional connectome network structure, are manifestations of the three spatiotemporal patterns.” That is, many previous findings that used different methods essentially describe the same recurring latent states. A similar argument was made in previous papers (Brown et al., 2021; Karapanagiotidis et al., 2020; Turnbull et al., 2020).

      We agree that the HMM is a simplified idea of brain dynamics. We do not argue that the four number of states can fully explain the complexity and flexibility of cognition. Instead, we hoped to show that there are different dimensionalities to which the brain systems can operate, and they may have different consequences to cognition. We “simplified” neural dynamics to a discrete sequence of a small number of states. However, what is fascinating is that these overly “simplified” brain state dynamics can explain certain cognitive and attentional dynamics, such as event segmentation and sustained attention fluctuations. We highlight this point in the Discussion.

      [Manuscript, page 16] “Our study adopted the assumption of low dimensionality of large-scale neural systems, which led us to intentionally identify only a small number of states underlying whole-brain dynamics. Importantly, however, we do not claim that the four states will be the optimal set of states in every dataset and participant population. Instead, latent states and patterns of state occurrence may vary as a function of individuals and tasks (Figure 1—figure supplement 2). Likewise, while the lowest dimensions of the manifold (i.e., the first two gradients) were largely shared across datasets tested here, we do not argue that it will always be identical. If individuals and tasks deviate significantly from what was tested here, the manifold may also differ along with changes in latent states (Samara et al., 2023). Brain systems operate at different dimensionalities and spatiotemporal scales (Greene et al., 2023), which may have different consequences for cognition. Asking how brain states and manifolds—probed at different dimensionalities and scales—flexibly reconfigure (or not) with changes in contexts and mental states is an important research question for understanding complex human cognition.”

      • For the 25- ROI replication it seems like they again do not try multiple K values for the number of states to validate that 4 states are in fact the correct number.

      In the manuscript, we do not argue that the four will be the optimal number of states in any dataset. (We actually predict that this may differ depending on the amount of data, participant population, tasks, etc.) Instead, we claim that the four identified in the SONG dataset are not specific (i.e., overfit) to that sample, but rather recur in independent datasets as well. More broadly we argue that the complexity and flexibility of human cognition stem from the fact that computation occurs at multiple dimensions and that the low-dimensional states observed here are robustly related to cognitive and attentional states. To prevent misunderstanding of our results, we emphasized in the Discussion that we are not arguing for a fixed number of states. A paragraph included in our response to the previous comment (page 16 in the manuscript) illustrates this point.

      • Fig 2B: Colorbar goes from -0.05 to 0.05 but values are up to 0.87

      We apologize for the confusion. The current version of the figure is correct. The figure legend states, “The values indicate transition probabilities, such that values in each row sums to 1. The colors indicate differences from the mean of the null distribution where the HMMs were conducted on the circular-shifted time series.”

      We recognize that this complicates the interpretation of the figure. However, after much consideration, we decided that it was valuable to show both the actual transition probabilities (values) and their difference from the mean of null HMMs (colors). The values demonstrate the Markovian property of latent state dynamics, with a high probability of remaining in the same state at consecutive moments and a low probability of transitioning to a different state. The colors indicate that the base state is a transitional hub state by illustrating that the DMN, DAN, and SM states are more likely to transition to the base state than would be expected by chance.

      • P 16 L4 near-critical, authors need to be more specific in their terminology here especially since they talk about dynamic systems, where near-criticality has a specific definition. It is unclear which definition they are looking for here.

      We agree that our explanation was vague. Because we do not have evidence for this speculative proposal, we removed the mention of near-criticality. Instead, we focus on our observation as the base state being the transitional hub state within a metastable system.

      [Manuscript, page 17-18] “However, the functional relevance of the base state to human cognition had not been explored previously. We propose that the base state, a transitional hub (Figure 2B) positioned at the center of the gradient subspace (Figure 1D), functions as a state of natural equilibrium. Transitioning to the DMN, DAN, or SM states reflects incursion away from natural equilibrium (Deco et al., 2017; Gu et al., 2015), as the brain enters a functionally modular state. Notably, the base state indicated high attentional engagement (Figure 5E and F) and exhibited the highest occurrence proportion (Figure 3B) as well as the longest dwell times (Figure 3—figure supplement 1) during naturalistic movie watching, whereas its functional involvement was comparatively minor during controlled tasks. This significant relevance to behavior verifies that the base state cannot simply be a byproduct of the model. We speculate that susceptibility to both external and internal information is maximized in the base state—allowing for roughly equal weighting of both sides so that they can be integrated to form a coherent representation of the world—at the expense of the stability of a certain functional network (Cocchi et al., 2017; Fagerholm et al., 2015). When processing rich narratives, particularly when a person is fully immersed without having to exert cognitive effort, a less modular state with high degrees of freedom to reach other states may be more likely to be involved. The role of the base state should be further investigated in future studies.”

      • P16 L13-L17 unnecessary

      We prefer to have the last paragraph as a summary of the implications of this paper. However, if the length of this paper becomes a problem as we work towards publication with the editors, we are happy to remove these lines.

      • I think this paper is solid, but my main issue is with using an HMM, never explaining why, not showing inference results on test data, not reporting an R^2 score for it, and not comparing it to other models. Secondly, they use the Calinski-Harabasz score to determine the number of states, but not the log-likelihood of the fit. This clearly creates a bias in what types of states you will find, namely states that are far away from each other, which likely also leads to the functional gradient and PCA results they have. Where they specifically talk about how their states are far away from each other in the functional gradient space and correlated to (orthogonal) components. It is completely unclear to me why they used this measure because it also seems to be one of many scores you could use with respect to clustering (with potentially different results), and even odd in the presence of a loglikelihood fit to the data and with the model they use (which does not perform clustering).

      (1) Showing inference results on test data

      We address this concern on page 19-21 of this response letter.

      (2) Not reporting 𝑹𝟐 score

      We address this concern on page 21-23 of this response letter.

      (3) Not comparing the HMM model to other models

      We address this concern on page 27-28 of this response letter.

      (4) The use of the Calinski-Harabasz score to determine the number of states rather than the log-likelihood of the model fit

      To our knowledge, the log-likelihood of the model fit is not used in the HMM literature. It is because the log-likelihood tends to increase monotonically as the number of states increases. Baker et al. (2014) illustrates this problem, writing:

      “In theory, it should be possible to pick the optimal number of states by selecting the model with the greatest (negative) free energy. In practice however, we observe that the free energy increases monotonically up to K = 15 states, suggesting that the Bayes-optimal model may require an even higher number of states.”

      Similarly, the following figure is the log-likelihood estimated from the SONG dataset. Similar to the findings of Baker et al. (2014), the log-likelihood monotonically increased as the number of states increased (Author response image 8, right). The measures like AIC or BIC, which account for the number of parameters, also have the same issue of monotonic increase.

      Author response image 8.

      Because there is “no straightforward data-driven approach to model order selection” (Baker et al., 2014), past work has used different approaches to decide on the number of states. For example, Vidaurre et al. (2018) iterated over a range of the number of states to repeat the same HMM training and inference procedures 5 times using the same hyperparameters. They selected the number of states that showed the highest consistency across iterations. Gao et al. (2021) tested the clustering performance of the model output using the Calinski-Harabasz score. The number of states that showed the highest within-cluster cohesion compared to the across-cluster separation was selected as the number of states. Chang et al. (2021) applied HMM to voxels of the ventromedial prefrontal cortex using a similar clustering algorithm, writing: “To determine the number of states for the HMM estimation procedure, we identified the number of states that maximized the average within-state spatial similarity relative to the average between-state similarity”. In our previous paper (Song et al., 2021b), we reported both the reliability and clustering performance measures to decide on the number of states.

      In the current manuscript, the model consistency criterion from Vidaurre et al. (2018) was ineffective because the HMM inference was extremely robust (i.e., always inferring the exact same sequence) due to a large number of data points. Thus, we used the Calinski-Harabasz score as our criterion for the number of states selected.

      We agree with the reviewer that the selection of the number of states is critical to any study that implements HMM. However, the field lacks a consensus on how to decide on the number of states in the HMM, and the Calinski-Harabasz score has been validated in previous studies. Most importantly, the latent states’ relationships with behavioral and cognitive measures give strong evidence that the latent states are indeed meaningful states. Again, we are not arguing that the optimal set of states in any dataset will be four nor are we arguing that these four states will always be the optimal states. Instead, the manuscript proposes that a small number of latent states explains meaningful variance in cognitive dynamics.

      • Grammatical error: P24 L29 rendering seems to have gone wrong

      Our intention was correct here. To avoid confusion, we changed “(number of participantsC2 iterations)” to “(#𝐶!iterations, where N=number of participants)” (page 26 in the manuscript).

      Questions:

      • Comment on subject differences, it seems like they potentially found group dynamics based on stimuli, but interesting to see individual differences in large-scale dynamics, and do they believe the states they find mostly explain global linear dynamics?

      We agree with the reviewer that whether low-dimensional latent state dynamics explain individual differences—above and beyond what could be explained by the high-dimensional, temporally static neural signatures of individuals (e.g., Finn et al., 2015)—is an important research question. However, because the SONG dataset was collected in a single lab, with a focus on covering diverse contexts (rest, task, and movie watching) over 2 sessions, we were only able to collect 27 participants. Due to this small sample size, we focused on investigating group-level, shared temporal dynamics and across-condition differences, rather than on investigating individual differences.

      Past work has studied individual differences (e.g., behavioral traits like well-being, intelligence, and personality) using the HMM (Vidaurre et al., 2017). In the lab, we are working on a project that investigates latent state dynamics in relation to individual differences in clinical symptoms using the Healthy Brain Network dataset (Ji et al., 2022, presented at SfN; Alexander et al., 2017).

      Finally, the reviewer raises an interesting question about whether the latent state sequence that was derived here mostly explains global linear dynamics as opposed to nonlinear dynamics. We have two responses: one methodological and one theoretical. First, methodologically, we defined the emission probabilities as a linear mixture of Gaussian distributions for each input dimension with the state-specific mean (mean fMRI activity patterns of the networks) and variance (functional covariance across networks). Therefore, states are modeled with an assumption of linearity of feature combinations. Theoretically, recent work supports in favor of nonlinearity of large-scale neural dynamics, especially as tasks get richer and more complex (Cunningham and Yu, 2014; Gao et al., 2021). However, whether low-dimensional latent states should be modeled nonlinearly—that is, whether linear algorithms are insufficient at capturing latent states compared to nonlinear algorithms—is still unknown. We agree with the reviewer that the assumption of linearity is an interesting topic in systems neuroscience. However, together with prior work which showed how numerous algorithms—either linear or nonlinear—recapitulated a common set of latent states, we argue that the HMM provides a strong low-dimensional model of large-scale neural activity and interaction.

      • P19 L40 why did the authors interpolate incorrect or no-responses for the gradCPT runs? It seems more logical to correct their results for these responses or to throw them out since interpolation can induce huge biases in these cases because the data is likely not missing at completely random.

      Interpolating the RTs of the trials without responses (omission errors and incorrect trials) is a standardized protocol for analyzing gradCPT data (Esterman et al., 2013; Fortenbaugh et al., 2018, 2015; Jayakumar et al., 2023; Rosenberg et al., 2013; Terashima et al., 2021; Yamashita et al., 2021). The choice of this analysis is due to an assumption that sustained attention is a continuous attentional state; the RT, a proxy for the attentional state in the gradCPT literature, is a noisy measure of a smoothed, continuous attentional state. Thus, the RTs of the trials without responses are interpolated and the RT time courses are smoothed by convolving with a gaussian kernel.

      References

      Abbas A, Belloy M, Kashyap A, Billings J, Nezafati M, Schumacher EH, Keilholz S. 2019. Quasiperiodic patterns contribute to functional connectivity in the brain. Neuroimage 191:193–204.

      Alexander LM, Escalera J, Ai L, Andreotti C, Febre K, Mangone A, Vega-Potler N, Langer N, Alexander A, Kovacs M, Litke S, O’Hagan B, Andersen J, Bronstein B, Bui A, Bushey M, Butler H, Castagna V, Camacho N, Chan E, Citera D, Clucas J, Cohen S, Dufek S, Eaves M, Fradera B, Gardner J, Grant-Villegas N, Green G, Gregory C, Hart E, Harris S, Horton M, Kahn D, Kabotyanski K, Karmel B, Kelly SP, Kleinman K, Koo B, Kramer E, Lennon E, Lord C, Mantello G, Margolis A, Merikangas KR, Milham J, Minniti G, Neuhaus R, Levine A, Osman Y, Parra LC, Pugh KR, Racanello A, Restrepo A, Saltzman T, Septimus B, Tobe R, Waltz R, Williams A, Yeo A, Castellanos FX, Klein A, Paus T, Leventhal BL, Craddock RC, Koplewicz HS, Milham MP. 2017. Data Descriptor: An open resource for transdiagnostic research in pediatric mental health and learning disorders. Sci Data 4:1–26.

      Allen EA, Damaraju E, Plis SM, Erhardt EB, Eichele T, Calhoun VD. 2014. Tracking whole-brain connectivity dynamics in the resting state. Cereb Cortex 24:663–676.

      Baker AP, Brookes MJ, Rezek IA, Smith SM, Behrens T, Probert Smith PJ, Woolrich M. 2014. Fast transient networks in spontaneous human brain activity. Elife 3:e01867.

      Bolt T, Nomi JS, Bzdok D, Salas JA, Chang C, Yeo BTT, Uddin LQ, Keilholz SD. 2022. A Parsimonious Description of Global Functional Brain Organization in Three Spatiotemporal Patterns. Nat Neurosci 25:1093–1103.

      Brown JA, Lee AJ, Pasquini L, Seeley WW. 2021. A dynamic gradient architecture generates brain activity states. Neuroimage 261:119526.

      Chang C, Leopold DA, Schölvinck ML, Mandelkow H, Picchioni D, Liu X, Ye FQ, Turchi JN, Duyn JH. 2016. Tracking brain arousal fluctuations with fMRI. Proc Natl Acad Sci U S A 113:4518–4523.

      Chang CHC, Lazaridi C, Yeshurun Y, Norman KA, Hasson U. 2021. Relating the past with the present: Information integration and segregation during ongoing narrative processing. J Cogn Neurosci 33:1–23.

      Chang LJ, Jolly E, Cheong JH, Rapuano K, Greenstein N, Chen P-HA, Manning JR. 2021. Endogenous variation in ventromedial prefrontal cortex state dynamics during naturalistic viewing reflects affective experience. Sci Adv 7:eabf7129.

      Chen J, Leong YC, Honey CJ, Yong CH, Norman KA, Hasson U. 2017. Shared memories reveal shared structure in neural activity across individuals. Nat Neurosci 20:115–125.

      Chen S, Langley J, Chen X, Hu X. 2016. Spatiotemporal Modeling of Brain Dynamics Using RestingState Functional Magnetic Resonance Imaging with Gaussian Hidden Markov Model. Brain Connect 6:326–334.

      Cocchi L, Gollo LL, Zalesky A, Breakspear M. 2017. Criticality in the brain: A synthesis of neurobiology, models and cognition. Prog Neurobiol 158:132–152.

      Cornblath EJ, Ashourvan A, Kim JZ, Betzel RF, Ciric R, Adebimpe A, Baum GL, He X, Ruparel K, Moore TM, Gur RC, Gur RE, Shinohara RT, Roalf DR, Satterthwaite TD, Bassett DS. 2020. Temporal sequences of brain activity at rest are constrained by white matter structure and modulated by cognitive demands. Commun Biol 3:261.

      Cunningham JP, Yu BM. 2014. Dimensionality reduction for large-scale neural recordings. Nat Neurosci 17:1500–1509.

      Deco G, Kringelbach ML, Jirsa VK, Ritter P. 2017. The dynamics of resting fluctuations in the brain: Metastability and its dynamical cortical core. Sci Rep 7:3095.

      Esterman M, Noonan SK, Rosenberg M, Degutis J. 2013. In the zone or zoning out? Tracking behavioral and neural fluctuations during sustained attention. Cereb Cortex 23:2712–2723.

      Esterman M, Rothlein D. 2019. Models of sustained attention. Curr Opin Psychol 29:174–180.

      Fagerholm ED, Lorenz R, Scott G, Dinov M, Hellyer PJ, Mirzaei N, Leeson C, Carmichael DW, Sharp DJ, Shew WL, Leech R. 2015. Cascades and cognitive state: Focused attention incurs subcritical dynamics. J Neurosci 35:4626–4634.

      Falahpour M, Chang C, Wong CW, Liu TT. 2018. Template-based prediction of vigilance fluctuations in resting-state fMRI. Neuroimage 174:317–327.

      Finn ES, Shen X, Scheinost D, Rosenberg MD, Huang J, Chun MM, Papademetris X, Constable RT. 2015. Functional connectome fingerprinting: Identifying individuals using patterns of brain connectivity. Nat Neurosci 18:1664–1671.

      Fortenbaugh FC, Degutis J, Germine L, Wilmer JB, Grosso M, Russo K, Esterman M. 2015. Sustained attention across the life span in a sample of 10,000: Dissociating ability and strategy. Psychol Sci 26:1497–1510.

      Fortenbaugh FC, Rothlein D, McGlinchey R, DeGutis J, Esterman M. 2018. Tracking behavioral and neural fluctuations during sustained attention: A robust replication and extension. Neuroimage 171:148–164.

      Fox MD, Snyder AZ, Vincent JL, Corbetta M, Van Essen DC, Raichle ME. 2005. The human brain is intrinsically organized into dynamic, anticorrelated functional networks. Proc Natl Acad Sci U S A 102:9673–9678.

      Gao S, Mishne G, Scheinost D. 2021. Nonlinear manifold learning in functional magnetic resonance imaging uncovers a low-dimensional space of brain dynamics. Hum Brain Mapp 42:4510–4524.

      Goodale SE, Ahmed N, Zhao C, de Zwart JA, Özbay PS, Picchioni D, Duyn J, Englot DJ, Morgan VL, Chang C. 2021. Fmri-based detection of alertness predicts behavioral response variability. Elife 10:1–20.

      Greene AS, Horien C, Barson D, Scheinost D, Constable RT. 2023. Why is everyone talking about brain state? Trends Neurosci.

      Greene DJ, Marek S, Gordon EM, Siegel JS, Gratton C, Laumann TO, Gilmore AW, Berg JJ, Nguyen AL, Dierker D, Van AN, Ortega M, Newbold DJ, Hampton JM, Nielsen AN, McDermott KB, Roland JL, Norris SA, Nelson SM, Snyder AZ, Schlaggar BL, Petersen SE, Dosenbach NUF. 2020. Integrative and Network-Specific Connectivity of the Basal Ganglia and Thalamus Defined in Individuals. Neuron 105:742-758.e6.

      Gu S, Pasqualetti F, Cieslak M, Telesford QK, Yu AB, Kahn AE, Medaglia JD, Vettel JM, Miller MB, Grafton ST, Bassett DS. 2015. Controllability of structural brain networks. Nat Commun 6:8414.

      Jayakumar M, Balusu C, Aly M. 2023. Attentional fluctuations and the temporal organization of memory. Cognition 235:105408.

      Ji E, Lee JE, Hong SJ, Shim W (2022). Idiosyncrasy of latent neural state dynamic in ASD during movie watching. Poster presented at the Society for Neuroscience 2022 Annual Meeting.

      Karapanagiotidis T, Vidaurre D, Quinn AJ, Vatansever D, Poerio GL, Turnbull A, Ho NSP, Leech R, Bernhardt BC, Jefferies E, Margulies DS, Nichols TE, Woolrich MW, Smallwood J. 2020. The psychological correlates of distinct neural states occurring during wakeful rest. Sci Rep 10:1–11.

      Liu X, Duyn JH. 2013. Time-varying functional network information extracted from brief instances of spontaneous brain activity. Proc Natl Acad Sci U S A 110:4392–4397.

      Liu X, Zhang N, Chang C, Duyn JH. 2018. Co-activation patterns in resting-state fMRI signals. Neuroimage 180:485–494.

      Lynn CW, Cornblath EJ, Papadopoulos L, Bertolero MA, Bassett DS. 2021. Broken detailed balance and entropy production in the human brain. Proc Natl Acad Sci 118:e2109889118.

      Margulies DS, Ghosh SS, Goulas A, Falkiewicz M, Huntenburg JM, Langs G, Bezgin G, Eickhoff SB, Castellanos FX, Petrides M, Jefferies E, Smallwood J. 2016. Situating the default-mode network along a principal gradient of macroscale cortical organization. Proc Natl Acad Sci U S A 113:12574–12579.

      Mesulam MM. 1998. From sensation to cognition. Brain 121:1013–1052.

      Munn BR, Müller EJ, Wainstein G, Shine JM. 2021. The ascending arousal system shapes neural dynamics to mediate awareness of cognitive states. Nat Commun 12:1–9.

      Raut R V., Snyder AZ, Mitra A, Yellin D, Fujii N, Malach R, Raichle ME. 2021. Global waves synchronize the brain’s functional systems with fluctuating arousal. Sci Adv 7.

      Rosenberg M, Noonan S, DeGutis J, Esterman M. 2013. Sustaining visual attention in the face of distraction: A novel gradual-onset continuous performance task. Attention, Perception, Psychophys 75:426–439.

      Rosenberg MD, Finn ES, Scheinost D, Papademetris X, Shen X, Constable RT, Chun MM. 2016. A neuromarker of sustained attention from whole-brain functional connectivity. Nat Neurosci 19:165–171.

      Rosenberg MD, Scheinost D, Greene AS, Avery EW, Kwon YH, Finn ES, Ramani R, Qiu M, Todd Constable R, Chun MM. 2020. Functional connectivity predicts changes in attention observed across minutes, days, and months. Proc Natl Acad Sci U S A 117:3797–3807.

      Saggar M, Shine JM, Liégeois R, Dosenbach NUF, Fair D. 2022. Precision dynamical mapping using topological data analysis reveals a hub-like transition state at rest. Nat Commun 13.

      Schaefer A, Kong R, Gordon EM, Laumann TO, Zuo X-N, Holmes AJ, Eickhoff SB, Yeo BTT. 2018. Local-Global Parcellation of the Human Cerebral Cortex from Intrinsic Functional Connectivity MRI. Cereb Cortex 28:3095–3114.

      Shine JM. 2019. Neuromodulatory Influences on Integration and Segregation in the Brain. Trends Cogn Sci 23:572–583.

      Shine JM, Bissett PG, Bell PT, Koyejo O, Balsters JH, Gorgolewski KJ, Moodie CA, Poldrack RA. 2016. The Dynamics of Functional Brain Networks: Integrated Network States during Cognitive Task Performance. Neuron 92:544–554.

      Shine JM, Breakspear M, Bell PT, Ehgoetz Martens K, Shine R, Koyejo O, Sporns O, Poldrack RA. 2019. Human cognition involves the dynamic integration of neural activity and neuromodulatory systems. Nat Neurosci 22:289–296.

      Smith SM, Fox PT, Miller KL, Glahn DC, Fox PM, Mackay CE, Filippini N, Watkins KE, Toro R, Laird AR, Beckmann CF. 2009. Correspondence of the brain’s functional architecture during activation and rest. Proc Natl Acad Sci 106:13040–13045.

      Song H, Emily FS, Rosenberg MD. 2021a. Neural signatures of attentional engagement during narratives and its consequences for event memory. Proc Natl Acad Sci 118:e2021905118.

      Song H, Park B-Y, Park H, Shim WM. 2021b. Cognitive and Neural State Dynamics of Narrative Comprehension. J Neurosci 41:8972–8990.

      Taghia J, Cai W, Ryali S, Kochalka J, Nicholas J, Chen T, Menon V. 2018. Uncovering hidden brain state dynamics that regulate performance and decision-making during cognition. Nat Commun 9:2505.

      Terashima H, Kihara K, Kawahara JI, Kondo HM. 2021. Common principles underlie the fluctuation of auditory and visual sustained attention. Q J Exp Psychol 74:705–715.

      Tian Y, Margulies DS, Breakspear M, Zalesky A. 2020. Topographic organization of the human subcortex unveiled with functional connectivity gradients. Nat Neurosci 23:1421–1432.

      Turnbull A, Karapanagiotidis T, Wang HT, Bernhardt BC, Leech R, Margulies D, Schooler J, Jefferies E, Smallwood J. 2020. Reductions in task positive neural systems occur with the passage of time and are associated with changes in ongoing thought. Sci Rep 10:1–10.

      Unsworth N, Robison MK. 2018. Tracking arousal state and mind wandering with pupillometry. Cogn Affect Behav Neurosci 18:638–664.

      Unsworth N, Robison MK. 2016. Pupillary correlates of lapses of sustained attention. Cogn Affect Behav Neurosci 16:601–615.

      van der Meer JN, Breakspear M, Chang LJ, Sonkusare S, Cocchi L. 2020. Movie viewing elicits rich and reliable brain state dynamics. Nat Commun 11:1–14.

      Van Essen DC, Smith SM, Barch DM, Behrens TEJ, Yacoub E, Ugurbil K. 2013. The WU-Minn Human Connectome Project: An overview. Neuroimage 80:62–79.

      Vidaurre D, Abeysuriya R, Becker R, Quinn AJ, Alfaro-Almagro F, Smith SM, Woolrich MW. 2018. Discovering dynamic brain networks from big data in rest and task. Neuroimage, Brain Connectivity Dynamics 180:646–656.

      Vidaurre D, Smith SM, Woolrich MW. 2017. Brain network dynamics are hierarchically organized in time. Proc Natl Acad Sci U S A 114:12827–12832.

      Yamashita A, Rothlein D, Kucyi A, Valera EM, Esterman M. 2021. Brain state-based detection of attentional fluctuations and their modulation. Neuroimage 236:118072.

      Yeo BTT, Krienen FM, Sepulcre J, Sabuncu MR, Lashkari D, Hollinshead M, Roffman JL, Smoller JW, Zöllei L, Polimeni JR, Fisch B, Liu H, Buckner RL. 2011. The organization of the human cerebral cortex estimated by intrinsic functional connectivity. J Neurophysiol 106:1125–1165.

      Yousefi B, Keilholz S. 2021. Propagating patterns of intrinsic activity along macroscale gradients coordinate functional connections across the whole brain. Neuroimage 231:117827.

      Zhang S, Goodale SE, Gold BP, Morgan VL, Englot DJ, Chang C. 2023. Vigilance associates with the low-dimensional structure of fMRI data. Neuroimage 267.

    1. Author Response:

      Reviewer #1:

      The authors present an interesting concept for the mechanism of rash induction in EGFR inhibitor (EGFRi) treated rats. EGFRi causes production of pro-inflammatory factors in epidermal keratinocytes which may induce dedifferentiation and reduction of the dWAT compartment, presumably mediated via PPAR. Factors produced by dedifferentiated FB then recruit monocytes thereby inducing skin inflammation. This work is aiming to improve targeted cancer therapy efficiency and is therefore of potential clinical relevance.

      However, most of the conclusions drawn by the authors are based on correlations, e.g. between the amount of dWAT and rash intensity. Mechanistic data have been mainly generated in vitro. The exact order of events to formulate a definitive mechanistic proof in vivo for this hypothesis is missing. In particular, it is not clear which cells in the skin, apart from keratinocytes, are specifically targeted by EGFR inhibitors and/or by Rosiglitazone. The authors also do not show EGFR staining in adipocytes and its inhibition by Afa. The effects of Afa and Rosi on monocytes / macrophages are completely ignored by the authors. Additionally, some of the presented results are overinterpreted and not really supporting what is claimed.

      Most importantly, the whole study is based on inhibitor treatments. Afatinib for example is not only inhibiting EGFR but all other erbB family members and as such it represents a panErbB inhibitor and it is not clear whether the observed effects are induced by inhibition of EGFR of other erbB receptors which have been shown to have also effects in the skin. For further specification of the role of EGFR, other, more specific inhibitors should be used to confirm the basic concept along with genetic proof either in genetically engineered mice or by Crispr-mediated-deletion.

      To further support the hypotheses of the authors, the study needs to be further substantiated by mechanistic experiments and the clinical relevance should be strengthened by performing histologic analysis of skin samples of patients treated with EGFRi and respective analysis of rash and e.g. BMI etc.

      Thanks for your positive comments on the potential impact for cancer patients suffering EGFR inhibitor induced skin rash. We have carefully considered all comments from the reviewer and revised our manuscript accordingly. In the following section, we summarize our responses to each comment of the reviewer. We believe that our responses have well addressed all concerns from the reviewer.

      We agree with the reviewer’s comment that our research may need more direct mechanistic in vivo studies upon our in vitro results. In our research, we have collected evidence from previous studies and used various in vitro and ex vivo experiments to investigate our findings. However, the study was still limited by currently available technologies.

      In the revised version, we supplemented the pEGFR and pERK staining of adipocytes in Figure 3-figure supplement 1C. The levels of phospho-EGFR and ERK in dWAT were significantly decreased after EGFRi treatment.

      This study was inspired by the observations of the unusual dWAT reduction during EGFRi treatment, thus we focused on the investigation of dermal adipocytes. In addition, the roles of mastocytes, monocytes, and macrophages in EGFRi-induced cutaneous toxicity have been thought as responders to increased expressions of cytokines. Local depletion of macrophages and degranulated mastocytes just provided partial resolution, indicating a multifactorial and complicated pathology of cutaneous toxicity induced by anti-EGFR therapy(Lichtenberger et al., 2013; Mascia et al., 2013).

      In terms of some inappropriate descriptions, we agree with the reviewer that they will be more convincing if there is a direct assessment from genetically engineered mice. For example, we tried to establish the relationship between S. aureus infection and EGFRi-induced rash based on a well-accepted study from Lingjuan Zhang (Zhang et al., 2015). They reported that adipose precursor cells secret antimicrobial peptide cathelicidin during differentiation to against S. aureus infection. Mice with impaired adipogenesis were more susceptible to S. aureus infection. This conclusion gave us insights into the relationship between S. aureus infection and EGFRi-induced skin inflammation. Unfortunately, the anti-CAMP antibody was made by the author’s lab and there are no mature products that can recognize CAMP in rats. To provide more mechanistic evidences, we conducted qPCR experiments to study the transcriptional level of the Camp gene both in dWAT and dFB cells isolated from rat skin (Figure 3I and 3J). dWAT in Afa group showed a lower expression level of Camp compared with control group. In addition, in different differentiation stages of dFB in vitro, transcriptional levels of Camp were decreased by Afa treatment while increased by Rosi. In summary, the data we collected could verify the causal relationship between EGFRi-induced dWAT reduction and S. aureus infection to some extent. However, the limitation of the technology is an obstacle for us to provide more evidences. Thus, in the revised manuscript, we have edited our writing to make the statement not that strong.

      According to the clinical evidence, the rash can also be induced by many specific Erbb1 inhibitors. All three generations of EGFR inhibitors in the clinic have very high incidence rates of cutaneous toxicity (Supplementary file 1). In the revised version, we provided rash models induced by both first-generation EGFRi, Erlotinib, Gefitinib, and the third-generation EGFRi, Osimertinib. As shown in Figure 1-figure supplement 1D, the rash caused by Erlotinib, Gefitinib, and Osimertinib had the same phenotypes as Afatinib-induced rash.

      In summary, the current form of evidences should support our findings, even more direct mechanistic studies would be better. We are now seeking the opportunity for cooperation to build a dermal adipocyte knockout mouse model platform and hope to investigate the specific roles of dermal adipocytes in the future. We also plan to have cooperation with hospitals to explore the clinical evidence of patients receiving EGFR inhibitors.

      References:

      Lichtenberger BM, Gerber PA, Holcmann M, Buhren BA, Amberg N, Smolle V, Schrumpf H, Boelke E, Ansari P, Mackenzie C, Wollenberg A, Kislat A, Fischer JW, Röck K, Harder J, Schröder JM, Homey B, Sibilia M. 2013. Epidermal EGFR controls cutaneous host defense and prevents inflammation. Sci Transl Med 5.

      Mascia F, Lam G, Keith C, Garber C, Steinberg SM, Kohn E, Yuspa SH. 2013. Genetic ablation of epidermal EGFR reveals the dynamic origin of adverse effects of anti-EGFR therapy. Sci Transl Med 5.

      Zhang L, Guerrero-juarez CF, Hata T, Bapat SP, Ramos R, Plikus M V, Gallo RL. 2015. Dermal adipocytes protect against invasive Staphylococcus aureus skin infection. Science 347:67–72.

      Reviewer #2:

      Leying Chen et al. investigated the mechanism of EGFR inhibitor-induced rash. They find that atrophy of dermal white adipose tissue (dWAT), a highly plastic adipose tissue with various skin-specific functions, correlates with rash occurrence and exacerbation in a murine model. The data indicate that EGFR inhibition induces the dedifferentiation of dWAT and lipolysis , finally lead to dWAT reduction which is a hallmark of the pathophysiology of rash. Notably, they demonstrate that stimulating dermal adipocyte expansion with a high-fat diet (HFD) or the pharmacological PPARγ agonist rosiglitazone (Rosi) ameliorated the severity of rash. Therefore, PPARγ agonists may represent a promising new therapeutic strategy in the treatment of EGFRI-related skin disorders pending to be confirmed in further study.

      We greatly appreciate the reviewer for giving the above positive comments.

      The conclusions of this paper are mostly well supported by data, but some results need to be clarified and verified.

      1) PPAR signaling in the pathology of EGFRI-induced skin toxicity. In figure 2 , the results show Rosi reversed the dedifferentiation of dermal adipocytes induced by Afa. This may due to PPARγ upregulation but not be confirmed in the results. The relative genes expression in dWAT after treated with Afa and ROSi were not demonstrated in the results.

      We thank the reviewer for reminding us for additional experiment of PPARγ. In the revised version, we collected attatched-dWAT after 5-day Afa or Rosi treatment, and performed transcriptional experiment of Pparg. The expression level of Pparg was downregulated by Afa treatment and upregulated by Rosi treatment (Figure 2-figure supplement 1D).

      2) the effect of PPAR signaling on PDGFRA-PI3K-AKT pathway The AKT pathway is a key downstream target of EGFR kinase, so it is reasonable to see p-AKT1 and p-AKT2 levels were decreased by Afa (figure 3C) However, addition of Rosi to Afa significantly activated both AKT1 and AKT2 . What is the underlying mechanism for the results and whether it is related to the PPAR signaling pathway.

      Given the importance of the PI3K/AKT pathway in regulating AP and mature adipocyte biology(Jeffery et al., 2015), we used p-AKT to characterize the activation of dFBs. The mechanism of how modulating PPARγ affects AKT is still unknown. One study found that MAPK and PI3K are upregulated and activated by rosiglitazone that in turn might enhance adipogenesis(Fayyad et al., 2019). In skeletal muscle, PPARγ enhances insulin-stimulated PI3K and Akt activation(Marx et al., 2004). It is also reported rosiglitazone has a neuroprotection effect against oxidative stress. The PPARγ-rosiglitazone complex binds to the neurotrophic factor-α1 (NF-α1) promoter and activates the transcription of NF-α1 mRNA which is then translated to the protein. NF-α1 binds to a cognate receptor and activates the AKT and ERK pathways(Thouennon et al., 2015). Thus, further studies should be carried out to investigate the effects of rosiglitazone to PI3K/AKT pathway on adipogenesis.

      3) According to figure 3 F , 3G and 3H., authors draw a conclusion that " a lack of APs and mature dWAT impairs the maintenance of the host defense and hair growth in the skin" In my opinion, there are no results can directly prove this. According to figure 3H, the impairment of hair growth may be caused by EGFR inhibition of hair follicles.

      We appreciate the reviewer for pointing this important point out. We tried to establish the relationship between S. aureus infection and EGFRI-induced rash based on a well-accepted study from Lingjuan Zhang (Zhang et al., 2015). They reported that adipose precursor cells secret antimicrobial peptide cathelicidin during differentiation to against S. aureus infection. Mice with impaired adipogenesis were more susceptible to S. aureus infection. This conclusion gave us insights into the relationship between S. aureus infection and EGFRI-induced skin inflammation. Unfortunately, the anti-CAMP antibody was made by the author’s lab and there are no mature products that can recognize CAMP in rats. To provide more mechanistic evidences, we conducted qPCR experiments to study the transcriptional level of the Camp gene both in dWAT and dFB cells isolated from rat skin (Figure 3I and 3J). dWAT in Afa group showed a lower expression level of Camp compared with control group. In addition, in different differentiation stages of dFB in vitro, transcriptional levels of Camp were decreased by Afa treatment while increased by Rosi. In summary, the data we collected depending on the current technology could verify the causal relationship between EGFRI-induced dWAT reduction and S. aureus infection to some extent. However, we agree with the reviewer that this conclusion needs more direct evidence. Thus, in the revised manuscript, we have edited our writing to make the statement not that strong.

      Since recent reports have shown that dermal adipocytes have the capacity to support hair regeneration, we used this conclusion to characterize the function of dWAT. However, we agree with the reviewer that it needs more specific and direct experiments to verify the causality with dWAT. And we are seeking the opportunity for cooperation to build a dermal adipocyte knockout mouse model platform and hope to investigate the specific roles of dermal adipocytes in the future. In the revised manuscript, we also adjusted the statements.

      4) EGFRI stimulates keratinocytes (HaCaT cells) to produce lipolytic cytokines (IL-6) (Figure 4G). IL6 enhanced the lipolysis of differentiated dFB (Figure S4M) and C18 fatty acids were supposed to be released the cell matrix during lipolysis. In figure 4H, HaCaTcells supernatants and dFB supernatants were collected. IL-6 was supposed to increase in HaCaTcells supernatants and was confirmed in Figure 4SK and S4L.However, C18 fatty acids were not showed to be in the dFB supernatants in the study directly.

      We thank the reviewer for pointing this out. We conducted additional lipidomics of dFB supernatants. However, because the differentiation medium needs to be changed every two days, it is hard to accumulate enough FFAs. We collected supernatants on Day3, Day 6, and Day 9. They were all below the detection limit of mass spectrum. We agree with the reviewer that more evidences are needed to prove the correlation between C18 FFAs and lipolysis. Therefore, we performed a mass spectrometry analysis of skin tissues from Ctrl and Afa groups after 3-day treatment to confirm the releasing of C18 FFAs. The result showed an increased tendency of C18:2 and other FFAs in the Afa group (Figure 1 in response letter). However, this increase had no significant statistic difference. This might be due to the interference of sebaceous gland and dermal adipocytes. In consequence, we adjusted the descriptions in the revised manuscript to make this statement not that strong.

      Figure 1. C18 concentrations in skin tissues from Ctrl and Afa groups after 3-day treatment. n=3.

      References:

      Fayyad AM, Khan AA, Abdallah SH, Alomran SS, Bajou K, Khattak MNK. 2019. Rosiglitazone Enhances Browning Adipocytes in Association with MAPK and PI3-K Pathways During the Differentiation of Telomerase-Transformed Mesenchymal Stromal Cells into Adipocytes. Int J Mol Sci 20.

      Jeffery E, Church CD, Holtrup B, Colman L, Rodeheffer MS. 2015. Rapid depot-specific activation of adipocyte precursor cells at the onset of obesity. Nat Cell Biol 17:376–385.

      Marx N, Duez H, Fruchart J-C, Staels B. 2004. Peroxisome proliferator-activated receptors and atherogenesis: regulators of gene expression in vascular cells. Circ Res 94:1168–1178. Thouennon E, Cheng Y, Falahatian V, Cawley NX, Loh YP. 2015. Rosiglitazone-activated PPARγ induces neurotrophic factor-α1 transcription contributing to neuroprotection. J Neurochem 134:463–470.

      Zhang L, Guerrero-juarez CF, Hata T, Bapat SP, Ramos R, Plikus M V, Gallo RL. 2015. Dermal adipocytes protect against invasive Staphylococcus aureus skin infection. Science 347:67–72.

    1. Author Response

      Reviewer #1 (Public Review):

      This paper by Zhuang and colleagues seeks to answer an important clinical question by trying to come up with novel predictive biomarkers to predict high-risk T1 colorectal cancers that are at risk for nodal involvement. The current clinical features may both miss patients who underwent local therapy and who should have gone on to have surgery and patients for whom surgery was done based on risk features but perhaps unnecessarily. Using a training and validation set, they developed a protein-based classifier with an AUC of 0.825 based on mass spec analyses and proteomic analyses of patients with and without LN importantly linking biological rationale to the proteomic discoveries.

      In the training cohort, they took 105 candidate proteins reduced to 55, and did a validation in the training cohort first and then in two validation cohorts (one of which was prospective). They also looked at a 9-protein classifier which also performed well and furthermore looked at IHC for clinical ease.

      We appreciate the reviewers for the positive review and valuable comments. We have revised the manuscript according to the comments.

      Reviewer #2 (Public Review):

      The authors utilized a label-free LC-MS/MS analysis in formalin-fixed paraffin-embedded (FFPE) tumors from 143 LNM-negative and 78 LNM-positive patients with T1 CRC to identify protein biomarkers to determine LNM in T1 CRC.

      The authors used a fair number of clinical samples for the proteomics investigation. The experimental design is reasonable, and the statistical methods used in this manuscript are solid.

      The authors largely achieved their aims and the results supported their conclusion. The method used in this proteomic study can also be used for the proteomics analysis of other cancer types to identify diagnostic and prognostic biomarkers. In addition, the 9-marker panel has a potential clinical diagnosis practice in determining LNM in T1 CRC.

      Nevertheless, the authors need to justify their standards in selecting the biomarkers. For example, a p-value cut-off of 0.1 is not a usual criterion in similar proteomic studies. In addition, an identification frequency of 30% in patients seems not preferable for biomarker identification. The authors also need to justify the definition of fold change in the three subtypes with Kruskal-Walli's test. The authors need to describe more details on how they identified the 13 proteins from a 55-protein database. In addition, what is the connection between the final 9 proteins and the 19 proteins? What is the criterion to select 5 proteins for IHC validation from the 9 proteins?

      We appreciate the reviewers for the positive review and valuable comments. We have revised the manuscript according to the comments.

      The criteria and details of our standards in selecting are as follows.

      1) About p-value cut-off of 0.1:

      The purpose of this step is to screen appropriate variables for subsequent machine learning, rather than comparing differences between groups. The p-value cut-off of 0.1 is also a reliable strategy for variable selection in proteomics research. For example, it has been used in studies to predict the response to tumor necrosis factor-α inhibitors in rheumatoid arthritis (PMID: 28650254); the research about circadian clock in mouse liver (PMID: 29674717); the proteomic biomarker discovery in atherosclerosis (PMID: 15496433); and the proteomics and transcriptomics analysis in bacillus subtilis (PMID: 19948795).

      Based on reviewer’s suggestion, we used a cutoff of p-value 0.05 to screen for variables. In a training set of 70 lymph node-negative and 62 lymph node-positive cases, we identified 355 protein markers. We further incorporated these proteins into a lasso regression analysis and ultimately developed a lymph node metastasis prediction model consisting of 52 protein markers. We validated the model in VC1 and VC2, with AUC values of 1.000, 0.824, and 0.918 for the training set, VC1, and VC2, respectively, the predictive performance was slightly inferior to that of the model developed in this study (Figure 3- figure supplement 1C).

      2) About identification frequency of 30%:

      The analysis focusing on the proteins identified in > 30% of the samples has been applied in the previous published studies. For instance, the study of using proteomic biomarkers to build diagnostic model in lung cancer (PMID: 29576497), proteins identified in > 30% cohort samples were used for downstream analysis. In the study on the impact of Reptin on protein-protein interaction (PMID: 30862565) have demonstrated that proteins were required to have at least in > 30% of samples in order to be included in the proteome dataset.

      We compared our cohort with Jun Qin et al. and Bing Zhang et al., study published in Nature (PMID: 25043054), according to the number of the proteins detected in more than 10%, 20%, 30%, 40%, 50%, 60%, 70%, 80%, 90%, 100% of samples, respectively (Figure 2- figure supplement 1). The proportion proteins detected at different cutoff of the samples in the three cohort were, 10% (0.60, 0.94, 0.48), 20% (0.52, 0.83, 0.38), 30% (0.46,0.75, 0.31), 40% (0.41, 0.69, 0.26), 50% (0.37, 0.63, 0.23), 60% (0.33, 0.57, 0.18), 70% (0.29, 0.52, 0.15), 80% (0.25, 0.45, 0.11), 90% (0.19, 0.37, 0.11), 100% (0.07, 0.23, 0.10), respectively. The results showed that our cohort was reliable.

      To investigate the impacts of protein identification frequency cutoff in our study, we performed comparative pathway enrichment analysis of the differential expressed proteins (LNM+ vs. LNM-: p-value < 0.05, Wilcoxon rank-sum tests) under different observation percentiles, which were detected in more than 10%, more than 30% and more than 50% of samples, respectively. The results revealed that proteins from three thresholds (10%, 30% and 50%) represented similar pathway enrichment, such as mTOR signaling pathway and amino acid metabolism pathways were dominant in LNM-negative patients, coagulation cascades and Lipid metabolism pathways were overrepresented in the LNM-positive patients (Figure 2- figure supplement 1)

      Based on reviewer’s suggestion, we used a cutoff of 50% as identification frequency for variables. The lasso regression was carried out in training cohort (70 LNM-negative and 62 LNM-positive), with AUC of 0.999. The model was validated in VC1 and VC2, with AUC of 0.812 and 0.886, respectively. (Figure 2- figure supplement 1).

      3) About identification of the 13 proteins and the criterion to select 5 proteins for IHC validation from 55-protein database:

      The process of reducing the number of proteins from 55 to 13 and finally establishing a 5-molecule classifier based on the IHC score is as shown in Figure 1- figure supplement 2 in the revision. We first selected 19 proteins with [log2FC] > 1 or < -1 and p<0.05 (Wilcoxon rank-sum test) between the LNM-negative and LNM-positive in 221 patients from 55 proteins. Then we started looking for antibodies to these 19 proteins. We finally obtained 13 antibodies for further immunohistochemistry. We did immunohistochemical staining to the FFPE samples with 13 antibodies, and got the IHC score of each protein to build the single molecular prediction model by SPSS on ROC curve. For the principles of MS based proteomic and IHC stain are different, not all identified proteins can be converted into IHC. Finally, 5 IHC makers with p-value of IHC score less than 0.05 (Student’s t-test) were selected to build the IHC classifier using Logistic Regression. We also updated the description in the “Result” section in the revised manuscript (line 718-722, page 34-35 in the revision).

      4) About the connection between the final 9 proteins and the 19 proteins:

      To facilitate the clinical translation of the model, Multiple Logistic Regression was used to obtain 9 core proteins from 19 proteins (Figure 1- figure supplement 2 in the revision). We first performed logistic regression in 19 proteins, and eliminated 10 proteins with insignificant Estimate Std. Error z value (Pr (>|z|) > 0.05, and obtained 9 proteins with Pr(>|z|) < 0.05. After that, we carried out Binary Logistic Regression calculation again with 9 proteins to build the simplified classifier. We also updated the description in the “Materials and methods” section in the revised manuscript (line 1092, page 51 in the revision).

      5) About the definition of fold change in the three subtypes with Kruskal-Walli's test:

      The fold change in the three subtypes is the ratio of the mean of the expressions in each group (well to moderately differentiated adenocarcinoma, poorly differentiated adenocarcinoma and mucinous adenocarcinoma) to the mean of the other two group. Kruskal-Walli's test was performed between three subtypes.

      We also updated the description in the “Result” section in the revised manuscript (line 506-517, page 25 in the revision), and “Figure 1- figure supplement 2H in the revision”.

      Reviewer #3 (Public Review):

      This work provides a proteomic analysis of 132 early-stage (pT1) colorectal cancers (CRC) to attempt to identify proteins (or a signature pattern thereof) that might be used to predict the patient risk of lymph node metastases (LNM) and potentially stratify patients for further treatment or surveillance. The generated dataset is extensive and the methods appear solid. The work identifies a 55-protein signature that is strongly predictive of LNM in the training cohort and two validation cohorts and then generates two simplified classifiers: a 9-protein proteomic and a 5-protein immunohistochemical classifier. These also perform very well in predicting LNM. Loss of the small GTPase RHOT2 is identified as a poor prognostic factor and validated in a migration assay. The findings could allow better prognostication in CRC and, if confirmed and better validated and contextualized, might impact patient care.

      Strengths:

      A large training cohort of resected early-stage (pT1M0) CRCs was analyzed by rigorous methods including careful quantitative analysis. The data generated are unbiased and potentially useful. A number of proteins are found to be different between CRCs with and without lymph node metastases, which are used to train a machine learning model that performs flawlessly in predicting LNM in the training cohort and very well in predicting LNM in two validation cohorts. The authors then develop two simplified classifiers that might be more readily extended into clinical care: a 9-protein proteomic assay and a 5-protein immunohistochemical assay; both of these also perform well in predicting LNM. Because LNM is a key prognostic factor, and colectomy (which includes removal of lymph nodes needed to assess LNM) carries significant risk and morbidity, particularly in rectal cancer, classifiers like these are potentially interesting. Finally, the authors identify the loss of expression of RHOT2 as a novel prognostic factor.

      Weaknesses:

      Major points:

      The data are limited by a number of assumptions about metastasis, minimal contextualization of the results, and claims that are too strong given the data. Critically, the authors use the presence or absence of LNM as the study's only outcome; while LNM is a key predictor in CRC, it is uncommon in T1 CRC (generally 3-10%, 12% in this study), stochastic, inefficient, and incompletely identified by histologic evaluation. Larger resection (here, colectomy) removes both identified and occult LNM, which is probably best studied in randomized trials of lymphadenectomy in Japanese gastric cancer cohorts and should be better discussed. Critically, patient survival or disease-free survival would be more relevant outcomes. Further, absent longer-term data, many patients without identified LNM might nonetheless be high-risk and skew the cohorts. It is also not clear whether these findings would be generalizable to other early-stage colon cancers.

      The data are also not correlated with the genetics of the cases, which were not discussed.

      The results would benefit from the inclusion of standard-of-care MSI status. The classifiers would also be much more impactful if they were generalizable beyond T1 CRCs; this could be readily tested in public datasets.

      The authors explain the data as mechanistic, but, aside from one experiment modulating RHOT2 levels, they are fundamentally correlative and should be described as such.

      Although they focused on areas containing >80% tumor as judged by the reading pathologist, it is unclear whether the identified proteomic changes originate from the tumor or the microenvironment.

      The authors fail to properly contextualize the results or overstate the novelty of their study. A number of examples - the study is claimed as "the first proteomic study of T1 CRC" and "the first comprehensive proteomics study to focus on LNM in patients with submucosal T1 CRCs"; neither of these appears to be true, for example, Steffen et al. (Journal of Proteome Research, 2021, reference 18) may satisfy both of these, although the numbers are smaller. Many other results are reported without context, for example, proteomic characterization of mucinous carcinomas has been performed previously, a modest correlation in mucinous carcinoma is ascribed a large mechanistic role, and PDPN is discussed but is not contextualized as a protein that has been well-studied in the context of metastasis.

      The data on RHOT2 are promising but very preliminary. RHOT2 is described as ubiquitous in colorectal cancer cell lines; a brief search in Human Protein Atlas shows RHOT2 RNA and proteins are ubiquitously expressed throughout the body. While its loss appears potentially prognostic, it is unclear whether this is simply a surrogate for other features, such as loss of differentiation state, and whether this is unique to CRC; multivariate analysis would be important.

      We appreciate the reviewer for the constructive and insightful comments, which help to improve the quality of this manuscript. Here, we summarized the reviewer’s comments as following: (1) Lack of longer-term data and micrometastasis; (2) test the classifier in public datasets; (3) inclusion of standard genetics and gene alterations; (4) about the tumor purity of all tumor samples and whether the results were influenced by the tumor microenvironment; (5) contextualize the results; (6) multivariate analysis of RHOT2.

      1) Lack of longer-term data and micrometastasis:

      Thank the reviewer for the comments. We fully acknowledge the limitations of our study, including the uncertainty associated with the detection of lymph node micrometastasis and the lack of long-term survival data, which can impact the strength of our conclusions. We agree that LNM is a key predictor in CRC and that it is uncommon in T1 CRC, with a reported incidence of 3-10%. We acknowledge that larger resections, such as colectomy, are generally recommended for patients with T1 CRC with LNM due to the potential risk of metastasis. However, our study aimed to establish a predictive model for LNM in T1 CRC, which could potentially help guide clinical decision-making on whether additional surgery is needed after endoscopic resection, according to the current NCCN guidelines.

      We have taken following methods to address these limitations:

      • We matched propensity-score of patients to reduce confounding biases in our training cohort, and patients were prospectively enrolled in our validation cohort, which was designed as a single-blinded prospective study to enhance the rigor and reliability of our findings.

      • For the influence of micrometastases in our study. According to reviewer's suggestion, we discussed the reports related to lymph nodes micrometastases in Japanese gastric cancer cohorts (PMID: 17377930, 9070482), and at the same time, we consulted the articles about micrometastases in T1 CRC (PMID: 17661146, 16412600). There were about 5% pT1N0 gastric cancer patients have ITCs in LN, and 10% in pT1Nx CRC. The effect of MMs on prognosis in pT1N0 CRC is still unclear. The present of ITCs/MMs in LN may explain why there are nearly 13% (29 of 221) LNM-negative patients were classified into high-risk group by the prediction model in our study.

      We have also added a section to the “Discussion” in the revised manuscript to discuss the potential impact of these limitations on the interpretation of our findings (line 856-873, page 41) in the revision, as follow:

      “In this study, to ensure the accuracy of LN status of the enrolled patients, the dissected number of LN in all patients including both surgical resection and ESD was more than 12. However, the longer-term follow-up data, including DFS, PFS, etc., are not available, due to limitations in sample collection time and the prognosis of such patients needs to be tracked over long periods of time, and may impact the strength of our conclusions. To address this limitation, we used propensity-score matching to reduce confounding biases in our training cohort. Patients were prospectively enrolled in our validation cohort (VC2), which was designed as a single-blinded prospective study to enhance the rigor and reliability of our findings. Furthermore, the presence of isolated tumor cells (ITCs) or micrometastases (MMs) within regional LN are not considered, due to conventional histopathologic examination cannot detected them. According to previous studies, there were about 5% pT1N0 gastric cancer patients have ITCs in LN, and 10% in pT1Nx CRC. The effect of MMs on prognosis in pT1N0 CRC is still unclear. The present of ITCs/MMs in LN may explain why there are nearly 13% (29 of 221) LNM-negative patients were classified into high-risk group by the prediction model in our study. Our study would provide a valuable database and could help for clinical decision-making in the context of T1 CRC. We will continuously follow the prognosis of the patients, and the ITCs/MMs in LN also need to be further validated in the future studies.”

      In conclusion, we appreciate reviewer’s comments and acknowledge the limitations of our study. We believe that our study provides valuable insights into the development of a predictive model for LNM in T1 CRC, which could potentially aid in clinical decision-making according to the current NCCN guidelines.

      2) Test the classifier in public datasets:

      According to reviewer’s suggestions, we tested our classifier in two different public datasets, including the colon and rectal cancer study from CPTAC published in Nature (PMID: 25043054), and the metastatic colorectal cancer study published in Cancer Cell (PMID: 32888432). The detail was further discussed in “point-to-point responses R3 Q2.”.

      3) Standard genetics and gene alterations:

      According to reviewer’s suggestions, we assessed MSI status and CRC-associated gene mutations (RAS, BRAF and PIK3CA) in our cohort. The detail was further discussed in “point-to-point responses R3 Q1.”

      4) The influence of microenvironment:

      We apologized for not explaining it clearly. To the question of whether the differences between two groups (LNM+ and LNM-) are caused by tumor microenvironment or the tumor tissues, we firstly, used xCell (PMID: 29141660) to study the composition of the tumor microenvironment (Figure2-source data 4 in the revision). The results showed that there was no difference in the tumor microenvironment between the LNM-positive and negative groups (P > 0.05, Wilcoxon rank-sum test) (Figure RL1A). However, when we compared the xCell algorism-based cell deconvolution results between the LNM-positive and -negative groups, we found 8 microenvironment associated cell features differed in two groups (p<0.05) (Figure RL1B). LNM-positive patients were featured with Chondrocytes and Th1 cells. And the remaining 6 features are all high in LNM-negative patients, including, B cells, cDC, Myocytes, etc. Correspondingly, 7 immune cell markers were also observed to be significantly different between the two groups (Log2FC>1 or <-1, P > 0.05, Wilcoxon rank-sum test) (Figure RL1C).

      Secondly, we checked the expression profile of the signature proteins detected in our study by The Human Protein Atlas (HPA). Among 9404 identified proteins, 7852 (83.4%) have HPA’s CRC IHC staining data, and 6249 (79.6%) showed medium to high tumor-specific staining in CRC samples (Figure RL1D). Of the signature proteins up-regulated in LNM-positive patients (LNM+ vs. LNM-: log2FC > 1 and p<0.05, Wilcoxon rank-sum test), 76 of 84 (90.5%) have IHC staining data in HPA, and 63 (82.9%) showed medium to high tumor-specific staining in CRC samples (Figure RL1E). For specific proteins of LNM-negative patients (LNM+ vs. LNM-: log2FC <-1 and p<0.05, Wilcoxon rank-sum test), 72 of 82 (87.8%) have IHC staining data in HPA, and 60 (83.3%) showed medium to high tumor-specific staining in CRC samples (Figure RL1F).

      Finally, we reviewed again all H&E-stained slides of tumor tissues of patients involved in the study, and supplemented tumor purity values of tumor samples of all the patients in Figure1-source data 1. We compared the tumor purity between the LNM-positive (with average 87.75%) and negative patients (with average 88.27%). The result showed there was no difference between the two groups (P = 0.46, Student’s t-test), demonstrating the high purity and quality of the tumor tissues. (Figure1-supplementary figure 1J in the revision).

      These results indicate that, in our study the differences between LNM-positive and LNM-negative groups are mainly caused by tumor tissues. However, the tumor microenvironment may also play a critical but not direct role in T1 CRC development and progression.

      Figure RL1. A. Comparison of xCell scores of immune and microenvironment between the LNM-negative group (n= 143) and LNM-positive group (n= 78). B&C. Immune/stromal signatures identified from xCell, together with derived relative abundance of immune and stromal cell types. D, E, F. Identified signature proteins (D), LNM-positive group up-regulated proteins (E) and LNM-negative group up-regulated proteins (F) were mostly validated by HPA IHC Staining Data. G. Barplot for tumor purity between LNM-negative and -positive patients.

      5) Contextualize the results:

      According to the reviewer’s advice, we have made corresponding adjustments in the revised manuscript, for example:

      • “We have made a comprehensive proteomic study of T1 CRC and provides a reliable data source for future research. “(line 342, page 17 in the revision)

      -“Here, we present a comprehensive proteomic study to focus on LNM in patients with submucosal T1 CRCs.” (line 788, page 37 in the revision)

      With regard to the problem of results are reported without context, we have provided supplementary descriptions of the context of the results in the “Result” section of the revised manuscript, for example:

      • “Mucinous adenocarcinoma was considered to be a significant risk factor of LNM in T1 CRC (PMID: 31620912).” (line 498, page 24 in the revision)

      • “Mucinous adenocarcinoma of the colorectal is a lethal cancer with unknown molecular etiology and a high propensity to lymph node metastasis. Previous proteomic studies on mucinous adenocarcinoma have found the proteins associated with treatment response in rectal mucinous adenocarcinoma and mechanisms of metastases in mucinous salivary adenocarcinoma.” (PMID: 34990823, 28249646) (line 534-538, page 26 in the revision)

      • “Previous studies have shown that PDPN expression correlated with LNM in numerous cancers, especially in early oral squamous cell carcinomas.” (PMID: 21105028).” (line 570, page 27 in the revision)

      6) Multivariate analysis of RHOT2:

      RHOT2 and its paralog RHOT1 plays an important role in mitochondrial trafficking (PMID: 16630562). Although the function of RHOT2 in cancer is still unknown, the expression of RHOT1 affects metastasis in a variety of tumors, including pancreatic cancer (PMID: 26101710), gastric cancer (PMID: 35170374), small cell lung cancer (PMID: 33515563), etc. In addition, previous studies have found that Myc regulation of mitochondrial trafficking through RHOT1 and RHOT2 enables tumor cell motility and metastasis (PMID: 31061095).

      As shown in Figure 4, in our analysis of previous version, we found RHOT2 was significant down-regulated (Log2FC=-1.35; p=0.003, Wilcoxon rank-sum test) in LNM-positive patients compared with LNM-negative patients in our T1 CRC cohort and the low level of RHOT2 is related to low overall survival of patients with colon cancer in TCGA cohort. Knockdown of RHOT2 expression could markedly enhance the migration ability of colon cancer cells.

      In order to further explore the influence of RHOT2 on T1 CRC LNM, in addition to the previous results, we carried out the following analysis as shown in Figure4 in the revision.

      We, firstly, calculated the correlations between the expression of RHOT2 and other proteins in our cohort (Figure 4). 1,508 proteins were correlated significantly (P < 0.05, Spearman) with RHOT2, and 1,354 proteins showed a positive correlation (coefficient >0) with RHOT2, and 154 proteins were negatively correlated with RHOT2 (coefficient <0). However, when we performed GSEA in RHOT2-associated proteins to identify biological signatures impacted by RHOT2, most of the obtained pathways (p<0.01) showed NES less than 0, which means these pathways were mainly enriched in RHOT2-negative-correlated group, only “mitochondrion” (GOCC) had a positive correlation (Figure 4). As we known RHOT2 is an important protein involved in the regulation of mitochondrial dynamics and mitophagy (PMID: 16630562). This result indicates that the involvement of RHOT2 in regulation of mitochondrial function might contribute to the pathogenesis of metastasis in cancer, especially in early-stage CRC. Consistent with the previous results, RHOT2-negative-correlated group was significantly enriched for EMT (HALLMARK) and complement and coagulation cascades pathways. Proteins up-regulated in LNM-positive group (LNM+ vs. LNM-: Log2FC >0; p<0.05, Wilcoxon rank-sum test) were negatively correlated with RHOT2(p < 0.05, coefficient<0, Spearman), including CAP2, COL6A3, COL6A2, TNC, DPYSL3, PCOLCE and BGN in pathway EMT; and GUCY1B3, VWF and F13A1 in pathway complement and coagulation cascades (Figure 2E, L; Figure 4D in the revision). ECM, focal adhesion and Dilated cardiomyopathy (DCM) pathways were also enriched in negative-correlated group. Degradation of RHOT2 has already been reported to be associated with DCM (PMID: 31455181). Overall, combined with the previous results, RHOT2 may play an important role in T1 CRC LNM (Figure 4D in the revision.).

      As reviewer mentioned the data on RHOT2 are promising, but the understanding of it is preliminary. More analytical studies and experiments are needed in our future researches to understand the specific role and mechanism of RHOT2 in the process of tumor metastasis. In the revision, we discussed these limitations of our research.

    1. Author Response

      Reviewer #1 (Public Review):

      The central claim that the R400Q mutation causes cardiomyopathy in humans require(s) additional support.

      We regret that the reviewer interpreted our conclusions as described. Because of the extreme rarity of the MFN2 R400Q mutation our clinical data are unavoidably limited and therefore insufficient to support a conclusion that it causes cardiomyopathy “in humans”. Importantly, this is a claim that we did not make and do not believe to be the case. Our data establish that the MFN2 R400Q mutation is sufficient to cause lethal cardiomyopathy in some mice (Q/Q400a; Figure 4) and predisposes to doxorubicin-induced cardiomyopathy in the survivors (Q/Q400n; new data, Figure 7). Based on the clinical association we propose that R400Q may act as a genetic risk modifier in human cardiomyopathy.

      To avoid further confusion we modified the manuscript title to “A human mitofusin 2 mutation can cause mitophagic cardiomyopathy” and provide a more detailed discussion of the implications and limitations of our study on page 11).

      First, the claim of an association between the R400Q variant (identified in three individuals) and cardiomyopathy has some limitations based on the data presented. The initial association is suggested by comparing the frequency of the mutation in three small cohorts to that in a large database gnomAD, which aggregates whole exome and whole genome data from many other studies including those from specific disease populations. Having a matched control population is critical in these association studies.

      We have added genotyping data from the matched non-affected control population (n=861) of the Cincinnati Heart study to our analyses (page 4). The conclusions did not change.

      For instance, according to gnomAD the MFN2 Q400P variant, while not observed in those of European ancestry, has a 10-fold higher frequency in the African/African American and South Asian populations (0.0004004 and 0.0003266, respectively). If the authors data in table one is compared to the gnomAD African/African American population the p-value drops to 0.029262, which would not likely survive correction for multiple comparison (e.g., Bonferroni).

      Thank you for raising the important issue of racial differences in mutant allele prevalence and its association with cardiomyopathy. Sample size for this type of sub-group analysis is limited, but we are able to provide African-derived population allele frequency comparisons for both the gnomAD population and our own non-affected control group.

      As now described on page 4, and just as with the gnomAD population we did not observe MFN2 R400Q in any Caucasian individuals, either cardiomyopathy or control. Its (heterozygous only) prevalence in African American cardiomyopathy is 3/674. Thus, the R400Q minor allele frequency of 3/1,345 in AA cardiomyopathy compares to 10/24,962 in African gnomAD, reflecting a statistically significant increase in this specific population group (p=0.003308; Chi2 statistic 8.6293). Moreover, all African American non-affected controls in the case-control cohort were wild-type for MFN2 (0/452 minor alleles).

      (The source and characteristics of the subjects used by the authors in Table 1 is not clear from the methods.)

      The details of our study cohorts were inadvertently omitted during manuscript preparation. As now reported on pages 3 and 4, the Cincinnati Heart Study is a case-control study consisting of 1,745 cardiomyopathy (1,117 Caucasian and 628 African American) subjects and 861 non-affected controls (625 Caucasian and 236 African American) (Liggett et al Nat Med 2008; Matkovich et al JCI 2010; Cappola et al PNAS 2011). The Houston hypertrophic cardiomyopathy cohort [which has been screened by linkage analysis, candidate gene sequencing or clinical genetic testing) included 286 subjects (240 Caucasians and 46 African Americans) (Osio A et al Circ Res 2007; Li L et al Circ Res 2017).

      Relatedly, evaluation in a knock-in mouse model is offered as a way of bolstering the claim for an association with cardiomyopathy. Some caution should be offered here. Certain mutations have caused a cardiomyopathy in mice when knocked in have not been observed in humans with the same mutation. A recent example is the p.S59L variant in the mitochondrial protein CHCHD10, which causes cardiomyopathy in mice but not in humans (PMID: 30874923). While phenocopy is suggestive there are differences in humans and mice, which makes the correlation imperfect.

      We understand that a mouse is not a man, and as noted above we view the in vitro data in multiple cell systems and the in vivo data in knock-in mice as supportive for, not proof of, the concept that MFN2 R400Q can be a genetic cardiomyopathy risk modifier. As indicated in the following responses, we have further strengthened the case by including results from 2 additional, previously undescribed human MFN2 mutation knock-in mice.

      Additionally, the argument that the Mfn2 R400Q variant causes a dominant cardiomyopathy in humans would be better supported by observing of a cardiomyopathy in the heterozygous Mfn2 R400Q mice and not just in the homozygous Mfn2 R400Q mice.

      We are intrigued that in the previous comment the reviewer warns that murine phenocopies are not 100% predictive of human disease, and in the next sentence he/she requests that we show that the gene dose-phenotype response is the same in mice and humans. And, we again wish to note that we never argued that MFN2 R400Q “causes a dominant cardiomyopathy in humans.” Nevertheless, we understand the underlying concerns and in the revised manuscript we present data from new doxorubicin challenge experiments comparing cardiomyopathy development and myocardial mitophagy in WT, heterozygous, and surviving (Q/Q400n) homozygous Mfn2 R400Q KI mice (new Figure 7, panels E-G). Homozygous, but not heterozygous, R400Q mice exhibited an amplified cardiomyopathic response (greater LV dilatation, reduced LV ejection performance, exaggerated LV hypertrophy) and an impaired myocardial mitophagic response to doxorubicin. These in vivo data recapitulate new in vitro results in H9c2 rat cardiomyoblasts expressing MFN2 R400Q, which exhibited enhanced cytotoxicity (cell death and TUNEL labelling) to doxorubicin associated with reduced reactive mitophagy (Parkin aggregation and mitolysosome formation) (new Figure 7, panels A-D). Thus, under the limited conditions we have explored to date we do not observe cardiomyopathy development in heterozygous Mfn2 R400Q KI mice. However, we have expanded the association between R400Q, mitophagy and cardiomyopathy thereby providing the desired additional support for our argument that it can be a cardiomyopathy risk modifier.

      Relatedly, it is not clear what the studies in the KI mouse prove over what was already known. Mfn2 function is known to be essential during the neonatal period and the authors have previously shown that the Mfn2 R400Q disrupts the ability of Mfn2 to mediate mitochondrial fusion, which is its core function. The results in the KI mouse seem consistent with those two observations, but it's not clear how they allow further conclusions to be drawn.

      We strenuously disagree with the underlying proposition of this comment, which is that “mitochondrial fusion (is the) core function” of mitofusins. We also believe that our previous work, alluded to but not specified, is mischaracterized.

      Our seminal study defining an essential role for Mfn2 for perinatal cardiac development (Gong et al Science 2015) reported that an engineered MFN2 mutation that was fully functional for mitochondrial fusion, but incapable of binding Parkin (MFN2 AA), caused perinatal cardiomyopathy when expressed as a transgene. By contrast, another engineered MFN2 mutant transgene that potently suppressed mitochondrial fusion, but constitutively bound Parkin (MFN2 EE) had no adverse effects on the heart.

      Our initial description of MFN2 R400Q and observation that it exhibited impaired fusogenicity (Eschenbacher et al PLoS One 2012) reported results of in vitro studies and transgene overexpression in Drosophila. Importantly, a role for MFN2 in mitophagy was unknown at that time and so was not explored.

      A major point both of this manuscript and our work over the last decade on mitofusin proteins has been that their biological importance extends far beyond mitochondrial fusion. As introduced/discussed throughout our manuscript, MFN2 plays important roles in mitophagy and mitochondrial motility. Because this central point seems to have been overlooked, we have gone to great lengths in the revised manuscript to unambiguously show that impaired mitochondrial fusion is not the critical functional aspect that determines disease phenotypes caused by Mfn2 mutations. To accomplish this we’ve re-structured the experiments so that R400Q is compared at every level to two other natural MFN2 mutations linked to a human disease, the peripheral neuropathy CMT2A. These comparators are MFN2 T105M in the GTPase domain and MFN2 M376A/V in the same HR1 domain as MFN2 R400Q. Each of these human MFN2 mutations is fusion-impaired, but the current studies reveal that that their spectrum of dysfunction differs in other ways as summarized in Author response table 1:

      Author response table 1.

      We understand that it sounds counterintuitive for a mutation in a “mitofusin” protein to evoke cardiac disease independent of its appellative function, mitochondrial fusion. But the KI mouse data clearly relate the occurrence of cardiomyopathy in R400Q mice to the unique mitophagy defect provoked in vitro and in vivo by this mutation. We hope the reviewer will agree that the KI models provide fresh scientific insight.

      Additionally, the authors conclude that the effect of R400Q on the transcriptome and metabolome in a subset of animals cannot be explained by its effect on OXPHOS (based on the findings in Figure 4H). However, an alternative explanation is that the R400Q is a loss of function variant but does not act in a dominant negative fashion. According to this view, mice homozygous for R400Q (and have no wildtype copies of Mfn2) lack Mfn2 function and consequently have an OXPHOS defect giving rise to the observed transcriptomic and metabolomic changes. But in the rat heart cell line with endogenous rat Mfn2, exogenous of the MFN2 R400Q has no effect as it is loss of function and is not dominant negative.

      Our results in the original submission, which are retained in Figures 1D and 1E and Figure 1 Figure Supplement 1 of the revision, exclude the possibility that R400Q is a functional null mutant for, but not a dominant suppressor of, mitochondrial fusion. We have added additional data for M376A in the revision, but the original results are retained in the main figure panels and a new supplemental figure:

      Figure 1D reports results of mitochondrial elongation studies (the morphological surrogate for mitochondrial fusion) performed in Mfn1/Mfn2 double knock-out (DKO) MEFs. The baseline mitochondrial aspect ratio in DKO cells infected with control (b-gal containing) virus is ~2 (white bar), and increases to ~6 (i.e. ~normal) by forced expression of WT MFN2 (black bar). By contrast, aspect ratio in DKO MEFs expressing MFN2 mutants T105M (green bar), M376A and R400Q (red bars in main figure), R94Q and K109A (green bars in the supplemental figure) is only 3-4. For these results the reviewer’s and our interpretation agree: all of the MFN2 mutants studied are non-functional as mitochondrial fusion proteins.

      Importantly, Figure 1E (left panel) reports the results of parallel mitochondrial elongation studies performed in WT MEFs, i.e. in the presence of normal endogenous Mfn1 and Mfn2. Here, baseline mitochondrial aspect ratio is already normal (~6, white bar), and increases modestly to ~8 when WT MFN2 is expressed (black bar). By comparison, aspect ratio is reduced below baseline by expression of four of the five MFN2 mutants, including MFN2 R400Q (main figure and accompanying supplemental figure; green and red bars). Only MFN2 M376A failed to suppress mitochondrial fusion promoted by endogenous Mfns 1 and 2. Thus, MFN2 R400Q dominantly suppresses mitochondrial fusion. We have stressed this point in the text on page 5, first complete paragraph.

      Additionally, as the authors have shown MFN2 R400Q loses its ability to promote mitochondrial fusion, and this is the central function of MFN2, it is not clear why this can't be the explanation for the mouse phenotype rather than the mitophagy mechanism the authors propose.

      Please see our response #7 above beginning “We strenuously disagree...”

      Finally, it is asserted that the MFN2 R400Q variant disrupts Parkin activation, by interfering with MFN2 acting a receptor for Parkin. The support for this in cell culture however is limited. Additionally, there is no assessment of mitophagy in the hearts of the KI mouse model.

      The reviewer may have overlooked the studies reported in original Figure 5, in which Parkin localization to cultured cardiomyoblast mitochondria is linked both to mitochondrial autophagy (LC3-mitochondria overlay) and to formation of mito-lysosomes (MitoQC staining). These results have been retained and expanded to include MFN2 M376A in Figure 6 B-E and Figure 6 Figure Supplement 1 of the revised manuscript. Additionally, selective impairment of Parkin recruitment to mitochondria was shown in mitofusin null MEFs in current Figure 3C and Figure 3 Figure Supplement 1, panels B and C.

      The in vitro and in vivo doxorubicin studies performed for the revision further strengthen the mechanistic link between cardiomyocyte toxicity, reduced parkin recruitment and impaired mitophagy in MFN2 R400Q expressing cardiac cells: MFN2 R400Q-amplified doxorubicin-induced H9c2 cell death is associated with reduced Parkin aggregation and mitolysosome formation in vitro, and the exaggerated doxorubicin-induced cardiomyopathic response in MFN2 Q/Q400 mice was associated with reduced cardiomyocyte mitophagy in vivo, measured with adenoviral Mito-QC (new Figure 7).

      Reviewer #2 (Public Review):

      In this manuscript, Franco et al show that the mitofusin 2 mutation MFN2 Q400 impaires mitochondrial fusion with normal GTPase activity. MFN2 Q400 fails to recruit Parkin and further disrupts Parkin-mediated mitophagy in cultured cardiac cells. They also generated MFN2 Q400 knock-in mice to show the development of lethal perinatal cardiomyopathy, which had an impairment in multiple metabolic pathways.

      The major strength of this manuscript is the in vitro study that provides a thorough understanding in the characteristics of the MFN2 Q400 mutant in function of MFN2, and the effect on mitochondrial function. However, the in vivo MFN2 Q/Q400 knock-in mice are more troubling given the split phenotype of MFN2 Q/Q400a vs MFN2 Q/Q400n subtypes. Their main findings towards impaired metabolism in mutant hearts fail to distinguish between the two subtypes.

      Thanks for the comments. We do not fully understand the statement that “impaired metabolism in mutant hearts fails to distinguish between the two (in vivo) subtypes.” The data in current Figure 5 and its accompanying figure supplements show that impaired metabolism measured both as metabolomic and transcriptomic changes in the subtypes (orange Q400n vs red Q400a in Figure 5 panels A and D) are reflected in the histopathological analyses. Moreover, newly presented data on ROS-modifying pathways (Figure 5C) suggest that a central difference between Mfn2 Q/Q400 hearts that can compensate for the underlying impairment in mitophagic quality control (Q400n) vs those that cannot (Q400a) is the capacity to manage downstream ROS effects of metabolic derangements and mitochondrial uncoupling. Additional support for this idea is provided in the newly performed doxorubicin challenge experiments (Figure 7), demonstrating that mitochondrial ROS levels are in fact increased at baseline in adult Q400n mice.

      While the data support the conclusion that MFN2 Q400 causes cardiomyopathy, several experiments are needed to further understand mechanism.

      We thank the reviewer for agreeing with our conclusion that MFN2 Q400 can cause cardiomyopathy, which was the major issue raised by R1. As detailed below we have performed a great deal of additional experimentation, including on two completely novel MFN2 mutant knock-in mouse models, to validate the underlying mechanism.

      This manuscript will likely impact the field of MFN2 mutation-related diseases and show how MFN2 mutation leads to perinatal cardiomyopathy in support of previous literature.

      Thank you again. We think our findings have relevance beyond the field of MFN2 mutant-related disease as they provide the first evidence (to our knowledge) that a naturally occurring primary defect in mitophagy can manifest as myocardial disease.

    1. Author Response

      The following is the authors’ response to the current reviews.

      Reviewer #1 (Public Review):

      The authors present a number of deep learning models to analyse the dynamics of epithelia. In this way they want to overcome the time-consuming manual analysis of such data and also remove a potential operator bias. Specifically, they set up models for identifying cell division events and cell division orientation. They apply these tools to the epithelium of the developing Drosophila pupal wing. They confirm a linear decrease of the division density with time and identify a burst of cell division after healing of a wound that they had induced earlier. These division events happen a characteristic time after and a characteristic distance away from the wound. These characteristic quantities depend on the size of the wound.

      Strengths:

      The methods developed in this work achieve the goals set by the authors and are a very helpful addition to the toolbox of developmental biologists. They could potentially be used on various developing epithelia. The evidence for the impact of wounds on cell division is compelling.

      The methods presented in this work should prove to be very helpful for quantifying cell proliferation in epithelial tissues.

      We thank the reviewer for the positive comments!

      Reviewer #2 (Public Review):

      In this manuscript, the authors propose a computational method based on deep convolutional neural networks (CNNs) to automatically detect cell divisions in two-dimensional fluorescence microscopy timelapse images. Three deep learning models are proposed to detect the timing of division, predict the division axis, and enhance cell boundary images to segment cells before and after division. Using this computational pipeline, the authors analyze the dynamics of cell divisions in the epithelium of the Drosophila pupal wing and find that a wound first induces a reduction in the frequency of division followed by a synchronised burst of cell divisions about 100 minutes after its induction.

      Comments on revised version:

      Regarding the Reviewer's 1 comment on the architecture details, I have now understood that the precise architecture (number/type of layers, activation functions, pooling operations, skip connections, upsampling choice...) might have remained relatively hidden to the authors themselves, as the U-net is built automatically by the fast.ai library from a given classical choice of encoder architecture (ResNet34 and ResNet101 here) to generate the decoder part and skip connections.

      Regarding the Major point 1, I raised the question of the generalisation potential of the method. I do not think, for instance, that the optimal number of frames to use, nor the optimal choice of their time-shift with respect to the division time (t-n, t+m) (not systematically studied here) may be generic hyperparameters that can be directly transferred to another setting. This implies that the method proposed will necessarily require re-labeling, re-training and re-optimizing the hyperparameters which directly influence the network architecture for each new dataset imaged differently. This limits the generalisation of the method to other datasets, and this may be seen as in contrast to other tools developed in the field for other tasks such as cellpose for segmentation, which has proven a true potential for generalisation on various data modalities. I was hoping that the authors would try themselves testing the robustness of their method by re-imaging the same tissue with slightly different acquisition rate for instance, to give more weight to their work.

      We thank the referee for the comments. Regarding this particular biological system, due to photobleaching over long imaging periods (and the availability of imaging systems during the project), we would have difficulty imaging at much higher rates than the 2 minute time frame we currently use. These limitations are true for many such systems, and it is rarely possible to rapidly image for long periods of time in real experiments. Given this upper limit in framerate, we could, in principle, sample this data at a lower framerate, by removing time points of the videos but this typically leads to worse results. With some pilot data, we have tried to use fewer time intervals for our analysis but they always gave worse results. We found we need to feed the maximum amount of information available into the model to get the best results (i.e. the fastest frame rate possible, given the data available). Our goal is to teach the neural net to identify dynamic space-time localised events from time lapse videos, in which the duration of an event is a key parameter. Our division events take 10 minutes or less to complete therefore we used 5 timepoints in the videos for the deep learning model. If we considered another system with dynamic events which have a duration T when we would use T/t timepoints where t is the minimum time interval (for our data t=2min). For example if we could image every minute we would use 10 timepoints. As discussed below, we do envision other users with different imaging setups and requirements may need to retrain the model for their own data and to help with this, we have now provided more detailed instructions how to do this (see later).

      In this regard, and because the authors claimed to provide clear instructions on how to reuse their method or adapt it to a different context, I delved deeper into the code and, to my surprise, felt that we are far from the coding practice of what a well-documented and accessible tool should be.

      To start with, one has to be relatively accustomed with Napari to understand how the plugin must be installed, as the only thing given is a pip install command (that could be typed in any terminal without installing the plugin for Napari, but has to be typed inside the Napari terminal, which is mentioned nowhere). Surprisingly, the plugin was not uploaded on Napari hub, nor on PyPI by the authors, so it is not searchable/findable directly, one has to go to the Github repository and install it manually. In that regard, no description was provided in the copy-pasted templated files associated to the napari hub, so exporting it to the hub would actually leave it undocumented.

      We thank the referee for suggesting the example of (DeXtrusion, Villars et al. 2023). We have endeavoured to produce similarly-detailed documentation for our tools. We now have clear instructions for installation requiring only minimal coding knowledge, and we have provided a user manual for the napari plug-in. This includes information on each of the options for using the model and the outputs they will produce. The plugin has been tested by several colleagues using both Windows and Mac operating systems.

      Author response image 1.

      Regarding now the python notebooks, one can fairly say that the "clear instructions" that were supposed to enlighten the code are really minimal. Only one notebook "trainingUNetCellDivision10.ipynb" has actually some comments, the other have (almost) none nor title to help the unskilled programmer delving into the script to guess what it should do. I doubt that a biologist who does not have a strong computational background will manage adapting the method to its own dataset (which seems to me unavoidable for the reasons mentioned above).

      Within the README file, we have now included information on how to retrain the models with helpful links to deep learning tutorials (which, indeed, some of us have learnt from) for those new to deep learning. All Jupyter notebooks now include more comments explaining the models.

      Finally regarding the data, none is shared publicly along with this manuscript/code, such that if one doesn't have a similar type of dataset - that must be first annotated in a similar manner - one cannot even test the networks/plugin for its own information. A common and necessary practice in the field - and possibly a longer lasting contribution of this work - could have been to provide the complete and annotated dataset that was used to train and test the artificial neural network. The basic reason is that a more performant, or more generalisable deep-learning model may be developed very soon after this one and for its performance to be fairly compared, it requires to be compared on the same dataset. Benchmarking and comparison of methods performance is at the core of computer vision and deep-learning.

      We thank the referee for these comments. We have now uploaded all the data used to train the models and to test them, as well as all the data used in the analyses for the paper. This includes many videos that were not used for training but were analysed to generate the paper’s results. The link to these data sets is provided in our GitHub page (https://github.com/turleyjm/cell-division-dl- plugin/tree/main). In the folder for the data sets and in the GitHub repository, we have included the Jupyter notebooks used to train the models and these can be used for retraining. We have made our data publicly available at Zenodo dataset https://zenodo.org/records/10846684 (added to last paragraph of discussion). We have also included scripts that can be used to compare the model output with ground truth, including outputs highlighting false positives and false negatives. Together with these scripts, models can be compared and contrasted, both in general and in individual videos. Overall, we very much appreciate the reviewer’s advice, which has made the plugin much more user- friendly and, hopefully, easier for other groups to train their own models. Our contact details are provided, and we would be happy to advise any groups that would like to use our tools.


      The following is the authors’ response to the original reviews.

      Reviewer #1 (Public Review):

      The authors present a number of deep-learning models to analyse the dynamics of epithelia. In this way, they want to overcome the time-consuming manual analysis of such data and also remove a potential operator bias. Specifically, they set up models for identifying cell division events and cell division orientation. They apply these tools to the epithelium of the developing Drosophila pupal wing. They confirm a linear decrease of the division density with time and identify a burst of cell division after the healing of a wound that they had induced earlier. These division events happen a characteristic time after and a characteristic distance away from the wound. These characteristic quantities depend on the size of the wound.

      Strength:

      The methods developed in this work achieve the goals set by the authors and are a very helpful addition to the toolbox of developmental biologists. They could potentially be used on various developing epithelia. The evidence for the impact of wounds on cell division is solid.

      Weakness:

      Some aspects of the deep-learning models remained unclear, and the authors might want to think about adding details. First of all, for readers not being familiar with deep-learning models, I would like to see more information about ResNet and U-Net, which are at the base of the new deep-learning models developed here. What is the structure of these networks?

      We agree with the Reviewer and have included additional information on page 8 of the manuscript, outlining some background information about the architecture of ResNet and U-Net models.

      How many parameters do you use?

      We apologise for this omission and have now included the number of parameters and layers in each model in the methods section on page 25.

      What is the difference between validating and testing the model? Do the corresponding data sets differ fundamentally?

      The difference between ‘validating’ and ‘testing’ the model is validating data is used during training to determine whether the model is overfitting. If the model is performing well on the training data but not on the validating data, this a key signal the model is overfitting and changes will need to be made to the network/training method to prevent this. The testing data is used after all the training has been completed and is used to test the performance of the model on fresh data it has not been trained on. We have removed refence to the validating data in the main text to make it simpler and add this explanation to the methods. There is no fundamental (or experimental) difference between each of the labelled data sets; rather, they are collected from different biological samples. We have now included this information in the Methods text on page 24.

      How did you assess the quality of the training data classification?

      These data were generated and hand-labelled by an expert with many years of experience in identifying cell divisions in imaging data, to give the ground truth for the deep learning model.

      Reviewer #1 (Recommendations For The Authors):

      You repeatedly use 'new', 'novel' as well as 'surprising' and 'unexpected'. The latter are rather subjective and it is not clear based on what prior knowledge you make these statements. Unless indicated otherwise, it is understood that the results and methods are new, so you can delete these terms.

      We have deleted these words, as suggested, for almost all cases.

      p.4 "as expected" add a reference or explain why it is expected.

      A reference has now been included in this section, as suggested.

      p.4 "cell divisions decrease linearly with time" Only later (p.10) it turns out that you think about the density of cell divisions.

      This has been changed to "cell division density decreases linearly with time".

      p.5 "imagine is largely in one plane" while below "we generated a 3D z-stack" and above "our in vivo 3D image data" (p.4). Although these statements are not strictly contradictory, I still find them confusing. Eventually, you analyse a 2D image, so I would suggest that you refer to your in vivo data as being 2D.

      We apologise for the confusion here; the imaging data was initially generated using 3D z-stacks but this 3D data is later converted to a 2D focused image, on which the deep learning analysis is performed. We are now more careful with the language in the text.

      p.7 "We have overcome (...) the standard U-Net model" This paragraph remains rather cryptic to me. Maybe you can explain in two sentences what a U-Net is or state its main characteristics. Is it important to state which class you have used at this point? Similarly, what is the exact role of the ResNet model? What are its characteristics?

      We have included more details on both the ResNet and U-Net models and how our model incorporates properties from them on Page 8.

      p.8 Table 1 Where do I find it? Similarly, I could not find Table 2.

      These were originally located in the supplemental information document, but have been moved to the main manuscript.

      p.9 "developing tissue in normal homeostatic conditions" Aren't homeostatic and developing contradictory? In one case you maintain a state, in the other, it changes.

      We agree with the Reviewer and have removed the word ‘homeostatic’.

      p.9 "Develop additional models" I think 'models' refers to deep learning models, not to physical models of epithelial tissue development. Maybe you can clarify this?

      Yes, this is correct; we have phrased this better in the text.

      p.12 "median error" median difference to the manually acquired data?

      Yes, and we have made this clearer in the text, too.

      p.12 "we expected to observe a bias of division orientation along this axis" Can you justify the expectation? Elongated cells are not necessarily aligned with the direction of a uniaxially applied stress.

      Although this is not always the case, we have now included additional references to previous work from other groups which demonstrated that wing epithelial cells do become elongated along the P/D axis in response to tension.

      p.14 "a rather random orientation" Please, quantify.

      The division orientations are quantified in Fig. 4F,G; we have now changed our description from ‘random’ to ‘unbiased’.

      p.17 "The theories that must be developed will be statistical mechanical (stochastic) in nature" I do not understand. Statistical mechanics refers to systems at thermodynamic equilibrium, stochastic to processes that depend on, well, stochastic input.

      We have clarified that we are referring to non-equilibrium statistical mechanics (the study of macroscopic systems far from equilibrium, a rich field of research with many open problems and applications in biology).

      Reviewer #2 (Public Review):

      In this manuscript, the authors propose a computational method based on deep convolutional neural networks (CNNs) to automatically detect cell divisions in two-dimensional fluorescence microscopy timelapse images. Three deep learning models are proposed to detect the timing of division, predict the division axis, and enhance cell boundary images to segment cells before and after division. Using this computational pipeline, the authors analyze the dynamics of cell divisions in the epithelium of the Drosophila pupal wing and find that a wound first induces a reduction in the frequency of division followed by a synchronised burst of cell divisions about 100 minutes after its induction.

      In general, novelty over previous work does not seem particularly important. From a methodological point of view, the models are based on generic architectures of convolutional neural networks, with minimal changes, and on ideas already explored in general. The authors seem to have missed much (most?) of the literature on the specific topic of detecting mitotic events in 2D timelapse images, which has been published in more specialized journals or Proceedings. (TPMAI, CCVPR etc., see references below). Even though the image modality or biological structure may be different (non-fluorescent images sometimes), I don't believe it makes a big difference. How the authors' approach compares to this previously published work is not discussed, which prevents me from objectively assessing the true contribution of this article from a methodological perspective.

      On the contrary, some competing works have proposed methods based on newer - and generally more efficient - architectures specifically designed to model temporal sequences (Phan 2018, Kitrungrotsakul 2019, 2021, Mao 2019, Shi 2020). These natural candidates (recurrent networks, long-short-term memory (LSTM) gated recurrent units (GRU), or even more recently transformers), coupled to CNNs are not even mentioned in the manuscript, although they have proved their generic superiority for inference tasks involving time series (Major point 2). Even though the original idea/trick of exploiting the different channels of RGB images to address the temporal aspect might seem smart in the first place - as it reduces the task of changing/testing a new architecture to a minimum - I guess that CNNs trained this way may not generalize very well to videos where the temporal resolution is changed slightly (Major point 1). This could be quite problematic as each new dataset acquired with a different temporal resolution or temperature may require manual relabeling and retraining of the network. In this perspective, recent alternatives (Phan 2018, Gilad 2019) have proposed unsupervised approaches, which could largely reduce the need for manual labeling of datasets.

      We thank the reviewer for their constructive comments. Our goal is to develop a cell detection method that has a very high accuracy, which is critical for practical and effective application to biological problems. The algorithms need to be robust enough to cope with the difficult experimental systems we are interested in studying, which involve densely packed epithelial cells within in vivo tissues that are continuously developing, as well as repairing. In response to the above comments of the reviewer, we apologise for not including these important papers from the division detection and deep learning literature, which are now discussed in the Introduction (on page 4).

      A key novelty of our approach is the use of multiple fluorescent channels to increase information for the model. As the referee points out, our method benefits from using and adapting existing highly effective architectures. Hence, we have been able to incorporate deeper models than some others have previously used. An additional novelty is using this same model architecture (retrained) to detect cell division orientation. For future practical use by us and other biologists, the models can easily be adapted and retrained to suit experimental conditions, including different multiple fluorescent channels or number of time points. Unsupervised approaches are very appealing due to the potential time saved compared to manual hand labelling of data. However, the accuracy of unsupervised models are currently much lower than that of supervised (as shown in Phan 2018) and most importantly well below the levels needed for practical use analysing inherently variable (and challenging) in vivo experimental data.

      Regarding the other convolutional neural networks described in the manuscript:

      (1) The one proposed to predict the orientation of mitosis performs a regression task, predicting a probability for the division angle. The architecture, which must be different from a simple Unet, is not detailed anywhere, so the way it was designed is difficult to assess. It is unclear if it also performs mitosis detection, or if it is instead used to infer orientation once the timing and location of the division have been inferred by the previous network.

      The neural network used for U-NetOrientation has the same architecture as U-NetCellDivision10 but has been retrained to complete a different task: finding division orientation. Our workflow is as follows: firstly, U-NetCellDivision10 is used to find cell divisions; secondly, U-NetOrientation is applied locally to determine the division orientation. These points have now been clarified in the main text on Page 14.

      (2) The one proposed to improve the quality of cell boundary images before segmentation is nothing new, it has now become a classic step in segmentation, see for example Wolny et al. eLife 2020.

      We have cited similar segmentation models in our paper and thank the referee for this additional one. We had made an improvement to the segmentation models, using GFP-tagged E-cadherin, a protein localised in a thin layer at the apical boundary of cells. So, while this is primarily a 2D segmentation problem, some additional information is available in the z-axis as the protein is visible in 2-3 separate z-slices. Hence, we supplied this 3-focal plane input to take advantage of the 3D nature of this signal. This approach has been made more explicit in the text (Pages 14, 15) and Figure (Fig. 2D).

      As a side note, I found it a bit frustrating to realise that all the analysis was done in 2D while the original images are 3D z-stacks, so a lot of the 3D information had to be compressed and has not been used. A novelty, in my opinion, could have resided in the generalisation to 3D of the deep-learning approaches previously proposed in that context, which are exclusively 2D, in particular, to predict the orientation of the division.

      Our experimental system is a relatively flat 2D tissue with the orientation of the cell divisions consistently in the xy-plane. Hence, a 2D analysis is most appropriate for this system. With the successful application of the 2D methods already achieving high accuracy, we envision that extension to 3D would only offer a slight increase in effectiveness as these measurements have little room for improvement. Therefore, we did not extend the method to 3D here. However, of course, this is the next natural step in our research as 3D models would be essential for studying 3D tissues; such 3D models will be computationally more expensive to analyse and more challenging to hand label.

      Concerning the biological application of the proposed methods, I found the results interesting, showing the potential of such a method to automatise mitosis quantification for a particular biological question of interest, here wound healing. However, the deep learning methods/applications that are put forward as the central point of the manuscript are not particularly original.

      We thank the referee for their constructive comments. Our aim was not only to show the accuracy of our models but also to show how they might be useful to biologists for automated analysis of large datasets, which is a—if not the—bottleneck for many imaging experiments. The ability to process large datasets will improve robustness of results, as well as allow additional hypotheses to be tested. Our study also demonstrated that these models can cope with real in vivo experiments where additional complications such as progressive development, tissue wounding and inflammation must be accounted for.

      Major point 1: generalisation potential of the proposed method.

      The neural network model proposed for mitosis detection relies on a 2D convolutional neural network (CNN), more specifically on the Unet architecture, which has become widespread for the analysis of biology and medical images. The strategy proposed here exploits the fact that the input of such an architecture is natively composed of several channels (originally 3 to handle the 3 RGB channels, which is actually a holdover from computer vision, since most medical/biological images are gray images with a single channel), to directly feed the network with 3 successive images of a timelapse at a time. This idea is, in itself, interesting because no modification of the original architecture had to be carried out. The latest 10-channel model (U-NetCellDivision10), which includes more channels for better performance, required minimal modification to the original U-Net architecture but also simultaneous imaging of cadherin in addition to histone markers, which may not be a generic solution.

      We believe we have provided a general approach for practical use by biologists that can be applied to a range of experimental data, whether that is based on varying numbers of fluorescent channels and/or timepoints. We envisioned that experimental biologists are likely to have several different parameters permissible for measurement based on their specific experimental conditions e.g., different fluorescently labelled proteins (e.g. tubulin) and/or time frames. To accommodate this, we have made it easy and clear in the code on GitHub how these changes can be made. While the model may need some alterations and retraining, the method itself is a generic solution as the same principles apply to very widely used fluorescent imaging techniques.

      Since CNN-based methods accept only fixed-size vectors (fixed image size and fixed channel number) as input (and output), the length or time resolution of the extracted sequences should not vary from one experience to another. As such, the method proposed here may lack generalization capabilities, as it would have to be retrained for each experiment with a slightly different temporal resolution. The paper should have compared results with slightly different temporal resolutions to assess its inference robustness toward fluctuations in division speed.

      If multiple temporal resolutions are required for a set of experiments, we envision that the model could be trained over a range of these different temporal resolutions. Of course, the temporal resolution, which requires the largest vector would be chosen as the model's fixed number of input channels. Given the depth of the models used and the potential to easily increase this by replacing resnet34 with resnet50 or resnet101 the model would likely be able to cope with this, although we have not specifically tested this. (page 27)

      Another approach (not discussed) consists in directly convolving several temporal frames using a 3D CNN (2D+time) instead of a 2D, in order to detect a temporal event. Such an idea shares some similarities with the proposed approach, although in this previous work (Ji et al. TPAMI 2012 and for split detection Nie et al. CCVPR 2016) convolution is performed spatio-temporally, which may present advantages. How does the authors' method compare to such an (also very simple) approach?

      We thank the Reviewer for this insightful comment. The text now discusses this (on Pages 8 and 17). Key differences between the models include our incorporation of multiple light channels and the use of much deeper models. We suggest that our method allows for an easy and natural extension to use deeper models for even more demanding tasks e.g. distinguishing between healthy and defective divisions. We also tested our method with ‘difficult conditions’ such as when a wound is present; despite the challenges imposed by the wound (including the discussed reduction in fluorescent intensities near the wound edge), we achieved higher accuracy compared to Nie et al. (accuracy of 78.5% compared to our F1 score of 0.964) using a low-density in vitro system.

      Major point 2: innovatory nature of the proposed method.

      The authors' idea of exploiting existing channels in the input vector to feed successive frames is interesting, but the natural choice in deep learning for manipulating time series is to use recurrent networks or their newer and more stable variants (LSTM, GRU, attention networks, or transformers). Several papers exploiting such approaches have been proposed for the mitotic division detection task, but they are not mentioned or discussed in this manuscript: Phan et al. 2018, Mao et al. 2019, Kitrungrotaskul et al. 2019, She et al 2020.

      An obvious advantage of an LSTM architecture combined with CNN is that it is able to address variable length inputs, therefore time sequences of different lengths, whereas a CNN alone can only be fed with an input of fixed size.

      LSTM architectures may produce similar accuracy to the models we employ in our study, however due to the high degree of accuracy we already achieve with our methods, it is hard to see how they would improve the understanding of the biology of wound healing that we have uncovered. Hence, they may provide an alternative way to achieve similar results from analyses of our data. It would also be interesting to see how LTSM architectures would cope with the noisy and difficult wounded data that we have analysed. We agree with the referee that these alternate models could allow an easier inclusion of difference temporal differences in division time (see discussion on Page 20). Nevertheless, we imagine that after selecting a sufficiently large input time/ fluorescent channel input, biologists could likely train our model to cope with a range of division lengths.

      Another advantage of some of these approaches is that they rely on unsupervised learning, which can avoid the tedious relabeling of data (Phan et al. 2018, Gilad et al. 2019).

      While these are very interesting ideas, we believe these unsupervised methods would struggle under the challenging conditions within ours and others experimental imaging data. The epithelial tissue examined in the present study possesses a particularly high density of cells with overlapping nuclei compared to the other experimental systems these unsupervised methods have been tested on. Another potential problem with these unsupervised methods is the difficulty in distinguishing dynamic debris and immune cells from mitotic cells. Once again despite our experimental data being more complex and difficult, our methods perform better than other methods designed for simpler systems as in Phan et al. 2018 and Gilad et al. 2019; for example, analysis performed on lower density in vitro and unwounded tissues gave best F1 scores for a single video was 0.768 and 0.829 for unsupervised and supervised respectively (Phan et al. 2018). We envision that having an F1 score above 0.9 (and preferably above 0.95), would be crucial for practical use by biologists, hence we believe supervision is currently still required. We expect that retraining our models for use in other experimental contexts will require smaller hand labelled datasets, as they will be able to take advantage of transfer learning (see discussion on Page 4).

      References :

      We have included these additional references in the revised version of our Manuscript.

      Ji, S., Xu, W., Yang, M., & Yu, K. (2012). 3D convolutional neural networks for human action recognition. IEEE transactions on pattern analysis and machine intelligence, 35(1), 221-231. >6000 citations

      Nie, W. Z., Li, W. H., Liu, A. A., Hao, T., & Su, Y. T. (2016). 3D convolutional networks-based mitotic event detection in time-lapse phase contrast microscopy image sequences of stem cell populations. In Proceedings of the IEEE Conference on Computer Vision and Pattern Recognition Workshops (pp. 55-62).

      Phan, H. T. H., Kumar, A., Feng, D., Fulham, M., & Kim, J. (2018). Unsupervised two-path neural network for cell event detection and classification using spatiotemporal patterns. IEEE Transactions on Medical Imaging, 38(6), 1477-1487.

      Gilad, T., Reyes, J., Chen, J. Y., Lahav, G., & Riklin Raviv, T. (2019). Fully unsupervised symmetry-based mitosis detection in time-lapse cell microscopy. Bioinformatics, 35(15), 2644-2653.

      Mao, Y., Han, L., & Yin, Z. (2019). Cell mitosis event analysis in phase contrast microscopy images using deep learning. Medical image analysis, 57, 32-43.

      Kitrungrotsakul, T., Han, X. H., Iwamoto, Y., Takemoto, S., Yokota, H., Ipponjima, S., ... & Chen, Y. W. (2019). A cascade of 2.5 D CNN and bidirectional CLSTM network for mitotic cell detection in 4D microscopy image. IEEE/ACM transactions on computational biology and bioinformatics, 18(2), 396-404.

      Shi, J., Xin, Y., Xu, B., Lu, M., & Cong, J. (2020, November). A Deep Framework for Cell Mitosis Detection in Microscopy Images. In 2020 16th International Conference on Computational Intelligence and Security (CIS) (pp. 100-103). IEEE.

      Wolny, A., Cerrone, L., Vijayan, A., Tofanelli, R., Barro, A. V., Louveaux, M., ... & Kreshuk, A. (2020). Accurate and versatile 3D segmentation of plant tissues at cellular resolution. Elife, 9, e57613.

    1. Author Response

      Reviewer #1 (Public Review):

      High resolution mechanistic studies would be instrumental in driving the development of Cas7-11 based biotechnology applications. This work is unfortunately overshadowed by a recent Cell publication (PMID: 35643083) describing the same Cas7-11 RNA-protein complex. However, given the tremendous interest in these systems, it is my opinion that this independent study will still be well cited, if presented well. The authors obviously have been trying to establish a unique angle for their story, by probing deeper into the mechanism of crRNA processing and target RNA cleavage. The study is carried out rigorously. The current version of the manuscript appears to have been rushed out. It would benefit from clarification and text polishing.

      We thank the reviewer for the positive and helpful comments that have made the manuscript more impactful.

      To summarize the revisions, we have resolved the metal-dependence issue, updated the maps in both main and supplementary figures that support the model, re-organized the labels for clarity, and added the comparison between our and Kato et al.’ structures.

      In addition, we describe a new result with an isolated C7L.1 fragment that retains the processing and crRNA binding activities.

      Reviewer #2 (Public Review):

      In this manuscript, Gowswami et al. solved a cryo-EM structure of Desulfonema ishimotonii Cas7-11 (DiCas7-11) bound to a guiding CRISPR RNA (crRNA) and target RNA. Cas7-11 is of interest due to its unusual architecture as a single polypeptide, in contrast to other type III CRISPR-Cas effectors that are composed of several different protein subunits. The authors have obtained a high-quality cryo-EM map at 2.82 angstrom resolution, allowing them to build a structural model for the protein, crRNA and target RNA. The authors used the structure to clearly identify a catalytic histidine residue in the Cas7-11 Cas7.1 domain that is important for crRNA processing activity. The authors also investigated the effects of metal ions and crRNAtarget base pairing on target RNA cleavage. Finally, the authors used their structure to guide engineering of a compact version of Cas7-11 in which an insertion domain that is disordered in the cryo-EM map was removed. This compact Cas7-11 appears to have comparable cleavage activity to the full-length protein.

      The cryo-EM map presented in this manuscript is generally of high quality and the manuscript is very well illustrated. However, some of the map interpretation requires clarification (outlined below). This structure will be valuable as there is significant interest in DiCas7-11 for biotechnology. Indeed, the authors have begun to engineer the protein based on observations from the structure. Although characterization of this engineered Cas7-11 is limited in this study and similar engineering was also performed in a recently published paper (PMID 35643083), this proof-of-principle experiment demonstrates the importance of having such structural information.

      The biochemistry experiments presented in the study identify an important residue for crRNA processing, and suggest that target RNA cleavage is not fully metal-ion dependent. Most of these conclusions are based on straightforward structure-function experiments. However, some results related to target RNA cleavage are difficult to interpret as presented. Overall, while the cryo-EM data presented in this work is of high quality, both the structural model and the biochemical results require further clarification as outlined below.

      We thank the reviewer for the positive and helpful comments that have made the manuscript more impactful.

      To summarize the revisions, we have resolved the metal-dependence issue, updated the maps in both main and supplementary figures that support the model, re-organized the labels for clarity, and added the comparison between our and Kato et al.’ structures.

      In addition, we describe a new result with an isolated C7L.1 fragment that retains the processing and crRNA binding activities.

      1. The DiCas7-11 structure bound to target RNA was also recently reported by Kato et al. (PMID 35643083). The authors have not cited this work or compared the two structures. While the structures are likely quite similar, it is notable that the structure reported in the current paper is for the wild-type protein and the sample was prepared under reactive conditions, resulting in a partially cleaved target. Kato et al. used a catalytically dead version of Cas7-11 in which the target RNA should remain fully intact. Are there differences in the Cas7-11 structure observed in the presence of a partially cleaved target RNA in comparison to the Kato et al. structure? Such a comparison is appropriate given the similarities between the two reports. A figure comparing the two structures could be included in the manuscript.

      We have added a paragraph on page 12 that describe the differences in preparation of the two complexes and their structures. We observed minor differences in the overall protein structure (r.m.s.d. 0.918 Å for 8114 atoms) but did observe quite different interactions between the protein and the first 5’-tag nucleotide (U(-15) vs. G(-15)) due to the different constructs in pre-crRNA, which suggests an importance of U(-15) in forming the processing-competent active site. We added Figure 2-figure supplementary 3 that illustrates the similarities and the differences.

      2.The cryo-EM density map is of high quality, but some of the structural model is not fully supported by the experimental data (e.g. protein loops from the alphafold model were not removed despite lack of cryo-EM density). Most importantly, there is little density for the target RNA beyond the site 1 cleavage site, suggesting that the RNA was cleaved and the product was released. However, this region of the RNA was included in the structural model. It is unclear what density this region of the target RNA model was based on. Further discussion of the interpretation of the partially cleaved target RNA is necessary. Were 3D classes observed in various states of RNA cleavage and with varied density for the product RNAs?

      We should have made it clear in the Method that multiple maps were used in building the structure but only submitted the post-processed map to reviewers. When using the Relion 4.0’s local resolution estimation-generated map, we observed sufficient density for some of the regions the reviewer is referring to. For instance, the site 1 cleavage density does support the model for the two nucleotides beyond site 1 cleavage site (see the revised Figure 1 & Figure 1- figure supplement 3).

      However, there are protein loops that remain lack of convincing density. These include 134141 and 1316-1329 that are now removed from the final coordinate.

      The “partially cleaved target RNA” phrase is a result of weak density for nucleotides downstream of site 1 (+2 and +3) but clear density flanking site 2. This feature indicates that cleavage likely had taken place at site 1 but not site 2 in most of the particles went into the reconstruction. To further clarify this phrase, we added “The PFS region plus the first base paired nucleotide (+1*) are not observed.” on page 4 and better indicate which nucleotides are or are not built in our model in Figure 1.

      1. The authors argue that site 1 cleavage of target RNA is independent of metal ions. This is a potentially interesting result, but it is difficult to determine whether it is supported by the evidence provided in the manuscript. The Methods section only describes a buffer containing 10 mM MgCl2, but does not describe conditions containing EDTA. How much EDTA was added and was MgCl2 omitted from these samples? In addition, it is unclear whether the site 1 product is visible in Figures 2d and 3d. To my eye, the products that are present in the EDTA conditions on these gels migrated slightly slower than the typical site 1 product. This may suggest an alternate cleavage site or chemistry (e.g. cyclic phosphate is maintained following cleavage). Further experimental details and potentially additional experiments are required to fully support the conclusion that site 1 cleavage may be metal independent.

      As we pointed out in response to Reviewer 1’s #8 comment, this conclusion may have been a result of using an older batch of DiCas7-11 that contains degraded fragments.

      As shown in the attached figure below, “batch Y” was an older prep from our in-house clone and “batch X” is a newer prep from the Addgene purchased clone (gel on right), and they consistently produce metal-independent (batch Y) or metal-dependent (batch X) cleavage (gel on left). It is possible that the degraded fragments in batch Y carry a metal-independent cleavage activity that is absent in the more pure batch X.

      We further performed mass spectrometry analysis of two of the degraded fragments from batch Y (indicated by arrows below) and discovered that these are indeed part of DiCas7-11. We, however, cannot rationalize, without more experimental evidence, why these fragments might have generated metal-independent cleavage at site 1. Therefore, we simply updated all our cleavage results from the new and cleaner prep (batch X) (For instance, Figure 3c). As a result, all references to “metal-independence” were removed.

      With regard to the nature of cleaved products, we found both sites could be inhibited by specific 2’-deoxy modifications, consistent with the previous observation that Type III systems generate a 2’, 3’-cyclic product in spite of the metal dependence (for instance, see Hale, C. R., Zhao, P., Olson, S., Duff, M. O., Graveley, B. R., Wells, L., ... & Terns, M. P. (2009). RNA-guided RNA cleavage by a CRISPR RNA-Cas protein complex. Cell, 139(5), 945-956.)

      We added this rationale based on the new results and believe that these characterizations are now thorough and conclusive

      1. The authors performed an experiment investigating the importance of crRNA-target base pairing on cleavage activity (Figure 3e). However, negative controls for the RNA targets in the absence of crRNA and Cas7-11 were not included in this experiment, making it impossible to determine which bands on the gel correspond to substrates and which correspond to products. This result is therefore not interpretable by the reader and does not support the conclusions drawn by the authors.

      Our original gel image (below) does contain these controls but we did not include them for the figure due to space considerations (we should have included it as a supplementary figure). We have now completely updated Figure 3e with much better quality and controls. Both the older and the updated experiments show the same results.

      Original gel for Figure 3e containing controls.

    1. Author Response:

      Reviewer #1 (Public Review):

      This manuscript describes a series of behavioral experiments in which foraging rats are subjected to a novel fear conditioning paradigm. Different groups of animals receive a shock to the dorsal surface of the body paired with either tone, an artificial owl driven forward with pneumatic pressure, or a tone/owl combination. An additional control condition pairs tone with owl alone (ie no shock is delivered). In a subsequent test, only owl+shock and tone/owl+shock animals show increased latency to forage and a withdrawal response to tone (even though owl-shock rats do not experience tone during conditioning). The authors conclude that this tone response is due to sensitization and that fear conditioning does not occur in their experimental setup.

      This approach is intriguing and the issues raised by the manuscript are extremely important for the field to consider. However, there are many ways to interpret the results as they stand. One issue of primary importance is whether it can indeed be claimed that conditioning did not readily occur in the tone+shock group. The lack of a particular behavioral conditioned reaction does not equate to an absence of conditioning. It is possible that unseen (i.e. physiological) measures of conditioning, many of which were once standard DVs in the fear conditioning literature, are present in the tone+shock group. This possibility pushes against the claim made in the title and elsewhere. These claims should be softened.

      We agree with the reviewer and now acknowledge the following caveat in the discussion (pg. 10): “…although neither the tone-shock group nor the tone-owl group showed overt manifestations of fear conditioning (as measured by fleeing or freezing) to the tone that prevented a successful procurement of food, the possibility of physiological (e.g., cardiovascular, respiratory) changes associated with tone-induced fear (Steimer, 2002) cannot be excluded in these animals…”

      Because systemic, group-level retreat CRs are not noted in the tone+shock condition, it would indeed be important to establish if there are any experimental circumstances in which tone paired with a US applied to the dorsal surface of the body can produce consistent reactions (e.g. freezing) to tone alone. Though it may seem likely that tone + dorsal shock would indeed produce freezing in a different setting, this result should not be taken for granted - we've known since the 'noisy water' experiment (Garcia & Koelling, 1966) that not every CS pairs with every US and that association can indeed be selective. A positive control would be clarifying. If the authors could demonstrate that tone+dorsal shock produces freezing to tone in a commonly used fear conditioning setup (ie standard cubicle chamber) then the lack of a retreat CR in their naturalistic paradigm would gain added meaning.

      This is an excellent suggestion. As recommended, we performed a positive control experiment where naïve rats that underwent the same subcutaneous wire implant surgery were placed in a standard experimental chamber and presented with a delayed tone-shock pairing (same tone frequency/intensity and shock intensity/duration; the 24.1 s CS duration was based on the mean CS duration of tone-shock animals in the naturalistic fear conditioning experiment). As can be seen in Author response image 1 (Figure 4 in the revised manuscript) below, these animals exhibited reliable postshock freezing in a conditioning chamber (fear conditioning day 1) and tone CS-evoked freezing in a novel chamber (tone testing day 2), indicating that our original finding (i.e., no evidence of auditory and contextual fear conditioning in an ecologically-relevant environment) is unlikely due to a dorsal neck/body shock US per se.

      Author response image 1. Auditory fear conditioning in a standard experimental chamber. (A) Illustrations of a rat implanted with wires subcutaneously in the dorsal neck/body region undergoing successive days of habituation (10 min tethered, conditioning chamber), training (a single tone CS-shock US pairing), and tone testing (context shift). (B) Mean (crimson line) and individual (gray lines) percent freezing data from 8 rats (4 females, 4 males) during training in context A: 3 min baseline (BL1, BL2, BL3); 23.1 s epoch of tone (T) excluding 1 s overlap with shock (S); 1 min postshock (PS). (C) Mean and individual percent freezing data during tone testing in context B: 1 min baseline (BL1); 3 min tone (T1, T2, T3); 1 min post-tone (PT). (D) Mean + SEM (bar) and individual (dots) percent freezing to tone CS before (Train, T) and after (Test, T1) undergoing auditory fear conditioning (paired t-test; t(7) = -3.163, p = 0.016). * p < 0.05

      The altered withdrawal trajectory seen in owl+shock and tone/owl+shock groups occurs in neither the tone+shock nor the tone+owl group, introducing the possibility that it results from the specific pairing of owl and shock. Put differently - this response may indeed by an associative CR. Do altered withdrawal angles persist if animals that receive owl+shock are exposed to owl again the next day? Do manipulations of the owl and shock that diminish fear conditioning (e.g. unpairing of owl and shock stimuli) eliminate deflected withdrawal angles when the subject is exposed to owl alone? If so, it would cut against the interpretation that fear conditioning does not occur in the setup described here, and would instead demonstrate that it is indeed central to predatory defense. This interpretation is compatible with the effect of hippocampal lesion on freezing evoked by a live predator. Destruction of the rat hippocampus diminishes cat-evoked freezing - this is thought to occur because the rapid association of the cat's various features with threatening action is not formed by the rat (Fanselow, 2000, 2018). Even though this interpretation of the results differs from the authors', it in no way diminishes the interest of this work. This paradigm may indeed be a novel means by which to study rapidly acquired associations with ethological relevance. Follow-up experiments of the type described above are necessary to disambiguate opposing views of the current dataset.

      Whether “altered withdrawal angles persist if animals that receive owl+shock [a US-US pairing] are exposed to owl again the next day” is an interesting question, as it is conceivable that the owl US (Zambetti et al., 2019, iScience) can function as a CS to evoke anticipatory characteristic of the conditioned fear. This possibility is now mentioned as a caveat (pg. 10): “…the erratic escape trajectory behavior exhibited by owl-shock and tone/owl-shock animals may be indicative of rapid associative processes at work (Fanselow 2018). For example, the immediate-shock (and delayed shock-context shift) deficit in freezing (e.g., Fanselow 1986; Landeira-Fernandez et al., 2006) provides compelling evidence that postshock freezing is not a UR but rather a CR to the contextual representation CS that rapidly became associated with the footshock US. In a similar vein then the erratic escape CR topography in owl-shock and tone/owl-shock animals might represent a shift in ‘functional CR topography’ (Fanselow & Wassum 2016) resulting from the rapid association between some salient features of the owl and the dorsal neck/body shock. A rapid owl-shock association nevertheless cannot explain the owl-shock animals’ subsequent fleeing behavior to a novel tone (in the absence of owl), which likely reflects nonassociative fear.”

      Reviewer #2 (Public Review):

      This work is dealing with an interesting question whether a simple, one trial CS+US (Pavlovian) association occurs in a naturalistic environment. Pavlovian fear conditioning contains a repetition of a neutral sensory signal (tone, CS) which is paired with a mild US, usually foot-shock (<1 mA; thus, unpleasant rather than painful) and the CS+US association drives associative learning. In this paper, a single 2.5 mA electrical shock was paired with a novel 80 dB tone to monitor the occurrence of learning via measuring success rate and latency of foraging for food. Some animals experienced an owl-looming matched with the US, just before reaching the food. The authors placed hunger-motivated rats into a custom-built arena equipped with safe nest, gate, food zone as well as with a delivery of a self-controlled US (electrical shock in the neck muscle and/or owl-looming). The US was activated by the rats by approaching to the food. Thus, a conflicting situation was provoked where procuring the food is paired with an aversive conditioned signal. Four groups of rats were included in the experiments based on their conditioning types: tone+ shock, tone+ shock+ owl, shock+owl and tone+owl. Due to these conditioning procedures, none of the rat procured the food but fled to the nest. In contrast, in the retrieval phases (next two days), the tone-shock and tone-owl groups successfully procured the pellets but not the tone-shock-owl group during the conditioned tone presentation. Rats in the latter group fled to the nest upon tone presentation at the food zone. As the shock-owl animals (conditioned without tone) also fled to the nest triggered by (unfamiliar) tone presentation, their and the tone+shock+owl group's fled responses were assigned to be non-associative sensitization-like process. Furthermore, during the pre-tone trials, all groups showed similar behavior as in the tone test. These findings led the authors to conclude that classical Pavlovian fear conditioning may not present in an ecologically relevant environment.

      The raised question is relevant for broad audience of neuroscience and behavioral scientist. However, as the used fear conditioning paradigm is not a common one, it is difficult to interpret the finding. It is based on a single pairing of an unfamiliar, salient tone with a very strong (traumatizing?) electrical shock, delivered directly into the neck muscle and an innate signal (owl looming). In addition, as the tone presentation was followed by many events (gate opening, presence of food, shock and/or owl-looming) in front of the animals, it is hard to image what sort of tone association could be formed at all.

      We thank the reviewer for mentioning several important considerations. In regards to the shock amplitude used here, fear conditioning studies in rats have employed a wide range of numbers, durations and intensities of footshock; e.g., three footshocks: 1.0 mA/0.75-s and 4.0 mA/3-s (Fanselow 1984), 75 footshocks: 1 mA/2-s (Maren 1999; Zimmerman et al. 2007). Note also that 16-20 periorbital shocks (2.0 mA, 8 pulse train at 5 Hz) have been used in auditory fear conditioning in rats (Moita et al. 2003; Blair et al. 2005). Thus, it is unlikely that a single 2.5 mA dorsal neck/body shock (subcutaneous and not in the neck muscle) used in the present study is particularly traumatizing compared to higher intensity/longer duration (e.g., 4.0 mA/3-s) and far more numerous (e.g., 75) footshocks employed in fear conditioning studies.

      The relationship between footshock intensity and fear conditioning also warrants further discussion. Sigmundi, Bouton, and Bolles (1980) examined conditioned freezing in rats to 15 footshocks of 0.5, 1.0 and 2.0 mA intensities (0.5-s duration) and found that “[tone] CS-evoked freezing increased with US intensity.” In contrast, Fanselow (1984) observed relatively higher contextual freezing in rats subjected to three bouts of 1.0 mA/0.75-s than 4 mA/3-s footshocks. Irrespective, the animals that received three 4 mA/3-s footshocks still exhibited robust freezing. Based on the positive control experimental results (see above), it is unlikely that the present study’s failure to observe conditioned fear is due to the use of 2.5 mA shock intensity.

      As the animals in the present study underwent 5 baseline days of foraging (3 trials per day), they would have been habituated to the computer-controlled automated gate opening-closing and the presence of food by the time of tone-shock, tone-owl, owl-shock and tone-owl/shock events, making it unlikely that the tone would associate with the gate/food stimuli. In the employed delay conditioning configuration, the tone CS has greater temporal contiguity with the US (shock and/or owl) and the US is both novel and surprising relative to the other stimuli in the arena environment. Thus, it is more plausible that the tone CS would be associated with the intended US. In summary, we believe that if fear conditioning necessitates relatively sterile environmental settings in order to transpire, then fear conditioning would be implausible in the natural world filled with dynamic, complex stimuli.

      One could also argue that if a hungry animal does not try to collect food after an unpleasant, even a painful experience, then, it normally dies soon (thus, that is not a 'natural' behavior). The tone+shock and tone+owl groups showed similar behavioral features throughout the entire experiments and may reconcile the natural events: although these rats had had negative experience before, were still approaching to food zone due their hunger. Because of their motivation for food, the authors concluded that no association was formed. Based on this single measure, is it right to do so?

      In nature, prey animals adjust their foraging behavior to minimize danger (e.g., Stephens and Krebs 1986 Foraging Theory; Lima and Dill 1990 Can J Zool); thus, it is improbable that an aversive experience will lead to end of food seeking behavior leading to death. Indeed, Choi and Kim (2010 Proc Natl Acad Sci) employed a similar seminaturalistic environment (as the present study) and found that rats adjust their foraging behavior as a function of the predatory threat distance, consistent with the “predatory imminence” model (Fanselow and Lester 1988). Since only behavioral measures of fear were assessed (i.e., fleeing, latency to enter forage zone, pellet procurement), we now acknowledge a caveat in the discussion (see response to Reviewer 1’s comment 1). Note, however, that unlike the tone-shock paired animals that failed to flee to the tone CS and successfully procured the food pellet, the owl-shock animals exhibited robust fear behavior (promptly fled, ceasing foraging) to a novel tone.

      Reviewer #3 (Public Review):

      In this study, the authors aimed to test whether rats could be fear conditioned by pairing a subdermal electric shock to a tone, an owl-like approaching stimulus, or a combination of these in a naturalistic-like environment. The authors designed a task in which rats foraging for food were exposed to a tone paired to a shock, an owl-like stimulus, a combination of the owl and the shock, or paired the owl to a shock in a single trial. The authors indexed behaviors related to food approach after conditioning. The authors found that animals exposed to the owl-shock or the tone/owl-shock pairing displayed a higher latency to approach the food reward compared to animals that were presented with the tone-shock or the tone-owl pairing. These results suggest that pairing the owl with the shock was sufficient to induce inhibitory avoidance, whereas a single pairing of the tone-shock or the tone-owl was not. The authors concluded that standard fear conditioning does not readily occur in a naturalistic-like environment and that the inhibitory avoidance induced by the owl-shock pairing could be the result of increased sensitization rather than a fear association.

      Strengths:

      The manuscript is well-written, the behavioral assay is innovative, and the results are interesting. The inclusion of both males and females, and the behavioral sex comparison was commendable. The findings are timely and would be highly relevant to the field.

      Weaknesses:

      However, in its current state, this study does not provide convincing evidence to support their main claim that Pavlovian fear conditioning does not readily occur in naturalistic environments. The innovative task presented in this study is more akin to an inhibitory avoidance task rather than fear conditioning and should be reframed in such way.

      The reviewer’s comment is theoretically important in translating laboratory studies of fear to real world situations. Because our animals were engaged in a purposive/goal-oriented foraging behavior, that is, the leaving of nest in search of food in an open space brought about tone-shock, tone-owl, owl-shock and tone/owl shock outcomes, one can make the case that this is in principle an inhibitory avoidance (instrumental fear conditioning) task rather than a Pavlovian fear conditioning task. A pertinent question then is whether procedurally ‘pure’ laboratory Pavlovian conditioning tasks (i.e., displacing animals from their home cage to an experimental chamber and presenting CS and US) are possible in real world settings where behaviors of animals and humans are largely purposive/goal-oriented (Tolman 1948 Psychol Rev). It is generally accepted that “Outside the laboratory, stimulus [Pavlovian] learning and response [Instrumental] learning are almost inseparable (Bouton 2007 Learning and Behavior, pg. 28).” The goal of our study was to investigate whether widely-employed auditory fear conditioning readily produces associative fear memory that guides future behavior in animals performing naturalistic foraging behavior, and insofar as presenting a salient tone CS followed by an aversive shock US, the present study has a Pavlovian fear component.

      We thank the reviewer for raising this concern and have addressed the Pavlovian vs. Instrumental fear conditioning aspects of our study in the revised manuscript (pg. 10): “…there are obvious procedural differences between standard fear conditioning versus naturalistic fear conditioning. In the former paradigm, typically ad libitum fed animals are placed in an experimental chamber for a fixed time before receiving a CS-US pairing (irrespective of their ongoing behavior). Thus, the CS duration and ISI are constant across subjects. In our study, hunger-motivated rats searching for food must navigate to a fixed location in a large arena before experiencing a CS-US pairing (instrumental- or response-contingent). Because animals approach the US trigger zone at different latencies, the CS duration and ISI are variable across subjects.”

      References

      Bernstein, I. L., Vitiello, M. V., & Sigmundi, R. A. (1980). Effects of interference stimuli on the acquisition of learned aversions to foods in the rat. J Comp Physiol Psychol, 94(5), 921-931. doi:10.1037/h0077807

      Blair, H. T., Huynh, V. K., Vaz, V. T., Van, J., Patel, R. R., Hiteshi, A. K., . . . Tarpley, J. W. (2005). Unilateral storage of fear memories by the amygdala. J Neurosci, 25(16), 4198-4205. doi:10.1523/JNEUROSCI.0674-05.2005

      Bouton, M. E. (2007). Learning and Behavior: Sinauer Associates

      Choi, J. S., & Kim, J. J. (2010). Amygdala regulates risk of predation in rats foraging in a dynamic fear environment. Proc Natl Acad Sci U S A, 107(50), 21773-21777. doi:10.1073/pnas.1010079108

      Fanselow, M. S. (1984). Shock-induced analgesia on the formalin test: effects of shock severity, naloxone, hypophysectomy, and associative variables. Behav Neurosci, 98(1), 79-95. doi:10.1037//0735-7044.98.1.79

      Fanselow, M. S. (1986). Associative Vs Topographical Accounts of the Immediate Shock Freezing Deficit in Rats - Implications for the Response Selection-Rules Governing Species-Specific Defensive Reactions. Learning and Motivation, 17(1), 16-39. doi:Doi 10.1016/0023-9690(86)90018-4

      Fanselow, M. S. (2018). The Role of Learning in Threat Imminence and Defensive Behaviors. Curr Opin Behav Sci, 24, 44-49. doi:10.1016/j.cobeha.2018.03.003

      Fanselow, M. S., & Lester, L. S. (1988). A functional behavioristic approach to aversively motivated behavior: Predatory imminence as a determinant of the topography of defensive behavior: Lawrence Erlbaum Associates Inc.

      Fanselow, M. S., & Wassum, K. M. (2016). The Origins and Organization of Vertebrate Pavlovian Conditioning. Cold Spring Harbor Perspectives in Biology, 8(1). doi:ARTN a021717 10.1101/cshperspect.a021717

      Landeira-Fernandez, J., DeCola, J. P., Kim, J. J., & Fanselow, M. S. (2006). Immediate shock deficit in fear conditioning: effects of shock manipulations. Behav Neurosci, 120(4), 873-879. doi:10.1037/0735-7044.120.4.873

      Lima, S. L., & Dill, L. M. (1990). Behavioral Decisions Made under the Risk of Predation - a Review and Prospectus. Canadian Journal of Zoology, 68(4), 619-640. doi:DOI 10.1139/z90-092

      Maren, S. (1999). Neurotoxic basolateral amygdala lesions impair learning and memory but not the performance of conditional fear in rats. J Neurosci, 19(19), 8696-8703.

      Moita, M. A., Rosis, S., Zhou, Y., LeDoux, J. E., & Blair, H. T. (2003). Hippocampal place cells acquire location-specific responses to the conditioned stimulus during auditory fear conditioning. Neuron, 37(3), 485-497. doi:10.1016/s0896-6273(03)00033-3

      Sigmundi, R. A., Bouton, M. E., & Bolles, R. C. (1980). Conditioned Freezing in the Rat as a Function of Shock-Intensity and Cs Modality. Bulletin of the Psychonomic Society, 15(4), 254-256.

      Steimer, T. (2002). The biology of fear- and anxiety-related behaviors. Dialogues Clin Neurosci, 4(3), 231-249.

      Stephens, D. W., & Krebs, J. R. (1986). Foraging Theory: Princeton University Press.

      Tolman, E. C. (1948). Cognitive maps in rats and men. Psychol Rev, 55(4), 189-208. doi:10.1037/h0061626

      Zambetti, P. R., Schuessler, B. P., & Kim, J. J. (2019). Sex Differences in Foraging Rats to Naturalistic Aerial Predator Stimuli. iScience, 16, 442-452. doi:10.1016/j.isci.2019.06.011

      Zimmerman, J. M., Rabinak, C. A., McLachlan, I. G., & Maren, S. (2007). The central nucleus of the amygdala is essential for acquiring and expressing conditional fear after overtraining. Learn Mem, 14(9), 634-644. doi:10.1101/lm.607207

    1. Author Response:

      Reviewer #1 (Public Review):

      Overview

      This is a well-conducted study and speaks to an interesting finding in an important topic, whether ethological validity causes co-variation in gamma above and beyond the already present ethological differences present in systemic stimulus sensitivity.

      I like the fact that while this finding (seeing red = ethnologically valid = more gamma) seems to favor views the PI has argued for, the paper comes to a much simpler and more mechanistic conclusion. In short, it's good science.

      I think they missed a key logical point of analysis, in failing to dive into ERF <----> gamma relationships. In contrast to the modeled assumption that they have succeeded in color matching to create matched LGN output, the ERF and its distinct features are metrics of afferent drive in their own data. And, their data seem to suggest these two variables are not tightly correlated, so at very least it is a topic that needs treatment and clarity as discussed below.

      Further ERF analyses are detailed below.

      Minor concerns

      In generally, very well motived and described, a few terms need more precision (speedily and staircased are too inaccurate given their precise psychophysical goals)

      We have revised the results to clarify:

      "For colored disks, the change was a small decrement in color contrast, for gratings a small decrement in luminance contrast. In both cases, the decrement was continuously QUEST-staircased (Watson and Pelli, 1983) per participant and color/grating to 85% correct detection performance. Subjects then reported the side of the contrast decrement relative to the fixation spot as fast as possible (max. 1 s), using a button press."

      The resulting reaction times are reported slightly later in the results section.

      I got confused some about the across-group gamma analysis:

      "The induced change spectra were fit per participant and stimulus with the sum of a linear slope and up to two Gaussians." What is the linear slope?

      The slope is used as the null model – we only regarded gamma peaks as significant if they explained spectrum variance beyond any linear offsets in the change spectra. We have clarified in the Results:

      "To test for the existence of gamma peaks, we fit the per-participant, per-stimulus change spectra with three models: a) the sum of two gaussians and a linear slope, b) the sum of one Gaussian and a linear slope and c) only a linear slope (without any peaks) and chose the best-fitting model using adjusted R2-values."

      To me, a few other analyses approaches would have been intuitive. First, before averaging peak-aligned data, might consider transforming into log, and might consider making average data with measures that don't confound peak height and frequency spread (e.g., using the FWHM/peak power as your shape for each, then averaging).

      The reviewer comments on averaging peak-aligned data. This had been done specifically in Fig. 3C. Correspondingly, we understood the reviewer’s suggestion as a modification of that analysis that we now undertook, with the following steps: 1) Log-transform the power-change values; we did this by transforming into dB; 2) Derive FWHM and peak power values per participant, and then average those; we did this by a) fitting Gaussians to the per-participant, per-stimulus power change spectra, b) quantifiying FWHM as the Gaussian’s Standard Deviation, and the peak power as the Gaussian’s amplitude; 3) average those parameters over subjects, and display the resulting Gaussians. The resulting Gaussians are now shown in the new panel A in Figure 3-figure supplement 1.

      (A) Per-participant, the induced gamma power change peak in dB was fitted with a Gaussian added to an offset (for full description, see Methods). Plotted is the resulting Gaussian, with peak power and variance averaged over participants.

      Results seem to be broadly consistent with Fig. 3C.

      Moderate

      I. I would like to see a more precise treatment of ERF and gamma power. The initial slope of the ERF should, by typical convention, correlate strongly with input strength, and the peak should similarly be a predictor of such drive, albeit a weaker one. Figure 4C looks good, but I'm totally confused about what this is showing. If drive = gamma in color space, then these ERF features and gamma power should (by Occham's sledgehammer…) be correlated. I invoke the sledgehammer not the razor because I could easily be wrong, but if you could unpack this relationship convincingly, this would be a far stronger foundation for the 'equalized for drive, gamma doesn't change across colors' argument…(see also IIB below)…

      …and, in my own squinting, there is a difference (~25%) in the evoked dipole amplitudes for the vertically aligned opponent pairs of red- and green (along the L-M axis Fig 2C) on which much hinges in this paper, but no difference in gamma power for these pairs. How is that possible? This logic doesn't support the main prediction that drive matched differences = matched gamma…Again, I'm happy to be wrong, but I would to see this analyzed and explained intuitively.

      As suggested by the reviewer, we have delved deeper into ERF analyses. Firstly, we overhauled our ERF analysis to extract per-color ERF shape measures (such as timing and slope), added them as panels A and B in Figure 2-figure supplement 1:

      Figure 2-figure supplement 1. ERF and reaction time results: (A) Average pre-peak slope of the N70 ERF component (extracted from 2-12 ms before per-color, per-participant peak time) for all colors. (B) Average peak time of the N70 ERF component for all colors. […]. For panels A-C, error bars represent 95% CIs over participants, bar orientation represents stimulus orientation in DKL space. The length of the scale bar corresponds to the distance from the edge of the hexagon to the outer ring.

      We have revised the results to report those analyses:

      "The initial ERF slope is sometimes used to estimate feedforward drive. We extracted the per-participant, per-color N70 initial slope and found significant differences over hues (F(4.89, 141.68) = 7.53, pGG < 410 6). Specifically, it was shallower for blue hues compared to all other hues except for green and green-blue (all pHolm < 710-4), while it was not significantly different between all other stimulus hue pairs (all pHolm > 0.07, Figure 2-figure supplement 1A), demonstrating that stimulus drive (as estimated by ERF slope) was approximately equalized over all hues but blue.

      The peak time of the N70 component was significantly later for blue stimuli (Mean = 88.6 ms, CI95% = [84.9 ms, 92.1 ms]) compared to all (all pHolm < 0.02) but yellow, green and green-yellow stimuli, for yellow (Mean = 84.4 ms, CI95% = [81.6 ms, 87.6 ms]) compared to red and red-blue stimuli (all pHolm < 0.03), and fastest for red stimuli (Mean = 77.9 ms, CI95% = [74.5 ms, 81.1 ms]) showing a general pattern of slower N70 peaks for stimuli on the S-(L+M) axis, especially for blue (Figure 2-figure supplement 1B)."

      We also checked if our main findings (equivalence of drive-controlled red and green stimuli, weaker responses for S+ stimuli) are robust when controlled for differences in ERF parameters and added in the Results:

      "To attempt to control for potential remaining differences in input drive that the DKL normalization missed, we regressed out per-participant, per-color, the N70 slope and amplitude from the induced gamma power. Results remained equivalent along the L-M axis: The induced gamma power change residuals were not statistically different between red and green stimuli (Red: 8.22, CI95% = [-0.42, 16.85], Green: 12.09, CI95% = [5.44, 18.75], t(29) = 1.35, pHolm = 1.0, BF01 = 3.00).

      As we found differences in initial ERF slope especially for blue stimuli, we checked if this was sufficient to explain weaker induced gamma power for blue stimuli. While blue stimuli still showed weaker gamma-power change residuals than yellow stimuli (Blue: -11.23, CI95% = [-16.89, -5.57], Yellow: -6.35, CI95% = [-11.20, -1.50]), this difference did not reach significance when regressing out changes in N70 slope and amplitude (t(29) = 1.65, pHolm = 0.88). This suggests that lower levels of input drive generated by equicontrast blue versus yellow stimuli might explain the weaker gamma oscillations induced by them."

      We added accordingly in the Discussion:

      "The fact that controlling for N70 amplitude and slope strongly diminished the recorded differences in induced gamma power between S+ and S- stimuli supports the idea that the recorded differences in induced gamma power over the S-(L+M) axis might be due to pure S+ stimuli generating weaker input drive to V1 compared to DKL-equicontrast S- stimuli, even when cone contrasts are equalized.."

      Additionally, we made the correlation between ERF amplitude and induced gamma power clearer to read by correlating them directly. Accordingly, the relevant paragraph in the results now reads:

      "In addition, there were significant correlations between the N70 ERF component and induced gamma power: The extracted N70 amplitude was correlated across colors with the induced gamma power change within participants with on average r = -0.38 (CI95% = [-0.49, -0.28], pWilcoxon < 4*10-6). This correlation was specific to the gamma band and the N70 component: Across colors, there were significant correlation clusters between V1 dipole moment 68-79 ms post-stimulus onset and induced power between 28 54 Hz and 72 Hz (Figure 4C, rmax = 0.30, pTmax < 0.05, corrected for multiple comparisons across time and frequency)."

      II. As indicated above, the paper rests on accurate modeling of human LGN recruitment, based in fact on human cone recruitment. However, the exact details of how such matching was obtained were rapidly discussed-this technical detail is much more than just a detail in a study on color matching: I am not against the logic nor do I know of a flaw, but it's the hinge of the paper and is dealt with glancingly.

      A. Some discussion of model limitations

      B. Why it's valid to assume LGN matching has been achieved using data from the periphery: To buy knowledge, nobody has ever recorded single units in human LGN with these color stimuli…in contrast, the ERF is 'in their hands' and could be directly related (or not) to gamma and to the color matching predictions of their model.

      We have revised the respective paragraph of the introduction to read:

      "Earlier work has established in the non-human primate that LGN responses to color stimuli can be well explained by measuring retinal cone absorption spectra and constructing the following cone-contrast axes: L+M (capturing luminance), L-M (capturing redness vs. greenness), and S-(L+M) (capturing S-cone activation, which correspond to violet vs. yellow hues). These axes span a color space referred to as DKL space (Derrington, Krauskopf, and Lennie, 1984). This insight can be translated to humans (for recent examples, see Olkkonen et al., 2008; Witzel and Gegenfurtner, 2018), if one assumes that human LGN responses have a similar dependence on human cone responses. Recordings of human LGN single units to colored stimuli are not available (to our knowledge). Yet, sensitivity spectra of human retinal cones have been determined by a number of approaches, including ex-vivo retinal unit recordings (Schnapf et al., 1987), and psychophysical color matching (Stockman and Sharpe, 2000). These human cone sensitivity spectra, together with the mentioned assumption, allow to determine a DKL space for human observers. To show color stimuli in coordinates that model LGN activation (and thereby V1 input), monitor light emission spectra for colored stimuli can be measured to define the strength of S-, M-, and L-cone excitation they induce. Then, stimuli and stimulus background can be picked from an equiluminance plane in DKL space. "

      Reviewer #2 (Public Review):

      The major strengths of this study are the use of MEG measurements to obtain spatially resolved estimates of gamma rhythms from a large(ish) sample of human participants, during presentation of stimuli that are generally well matched for cone contrast. Responses were obtained using a 10deg diameter uniform field presented in and around the centre of gaze. The authors find that stimuli with equivalent cone contrast in L-M axis generated equivalent gamma - ie. that 'red' (+L-M) stimuli do not generate stronger responses than 'green (-L+M). The MEG measurements are carefully made and participants performed a decrement-detection task away from the centre of gaze (but within the stimulus), allowing measurements of perceptual performance and in addition controlling attention.

      There are a number of additional observations that make clear that the color and contrast of stimuli are important in understanding gamma. Psychophysical performance was worst for stimuli modulated along the +S-(L+M) direction, and these directions also evoked weakest evoked potentials and induced gamma. There also appear to be additional physiological asymmetries along non-cardinal color directions (e.g. Fig 2C, Fig 3E). The asymmetries between non-cardinal stimuli may parallel those seen in other physiological and perceptual studies and could be drawn out (e.g. Danilova and Mollon, Journal of Vision 2010; Goddard et al., Journal of Vision 2010; Lafer-Sousa et al., JOSA 2012).

      We thank the review for the pointers to relevant literature and have added in the Discussion:

      "Concerning off-axis colors (red-blue, green-blue, green-yellow and red-yellow), we found stronger gamma power and ERF N70 responses to stimuli along the green-yellow/red-blue axis (which has been called lime-magenta in previous studies) compared to stimuli along the red-yellow/green-blue axis (orange-cyan). In human studies varying color contrast along these axes, lime-magenta has also been found to induce stronger fMRI responses (Goddard et al., 2010; but see Lafer-Sousa et al., 2012), and psychophysical work has proposed a cortical color channel along this axis (Danilova and Mollon, 2010; but see Witzel and Gegenfurtner, 2013)."

      Similarly, the asymmetry between +S and -S modulation is striking and need better explanation within the model (that thalamic input strength predicts gamma strength) given that +S inputs to cortex appear to be, if anything, stronger than -S inputs (e.g. DeValois et al. PNAS 2000).

      We followed the reviewer’s suggestion and modified the Discussion to read:

      "Contrary to the unified pathway for L-M activation, stimuli high and low on the S-(L+M) axis (S+ and S ) each target different cell populations in the LGN, and different cortical layers within V1 (Chatterjee and Callaway, 2003; De Valois et al., 2000), whereby the S+ pathway shows higher LGN neuron and V1 afferent input numbers (Chatterjee and Callaway, 2003). Other metrics of V1 activation, such as ERPs/ERFs, reveal that these more numerous S+ inputs result in a weaker evoked potential that also shows a longer latency (our data; Nunez et al., 2021). The origin of this dissociation might lie in different input timing or less cortical amplification, but remains unclear so far. Interestingly, our results suggest that cortical gamma is more closely related to the processes reflected in the ERP/ERF: Stimuli inducing stronger ERF induced stronger gamma; and controlling for ERF-based measures of input drives abolished differences between S+ and S- stimuli in our data."

      Given that this asymmetry presents a potential exception to the direct association between LGN drive and V1 gamma power, we have toned down claims of a direct input drive to gamma power relationship in the Title and text and have refocused instead on L-M contrast.

      My only real concern is that the authors use a precomputed DKL color space for all observers. The problem with this approach is that the isoluminant plane of DKL color space is predicated on a particular balance of L- and M-cones to Vlambda, and individuals can show substantial variability of the angle of the isoluminant plane in DKL space (e.g. He, Cruz and Eskew, Journal of Vision 2020). There is a non-negligible chance that all the responses to colored stimuli may therefore be predicted by projection of the stimuli onto each individual's idiosyncratic Vlambda (that is, the residual luminance contrast in the stimulus). While this would be exhaustive to assess in the MEG measurements, it may be possible to assess perceptually as in the He paper above or by similar methods. Regardless, the authors should consider the implications - this is important because, for example, it may suggest that important of signals from magnocellular pathway, which are thought to be important for Vlambda.

      We followed the suggestion of the reviewer, performed additional analyses and report the new results in the following Results text:

      "When perceptual (instead of neuronal) definitions of equiluminance are used, there is substantial between-subject variability in the ratio of relative L- and M-cone contributions to perceived luminance, with a mean ratio of L/M luminance contributions of 1.5-2.3 (He et al., 2020). Our perceptual results are consistent with that: We had determined the color-contrast change-detection threshold per color; We used the inverse of this threshold as a metric of color change-detection performance; The ratio of this performance metric between red and green (L divided by M) had an average value of 1.48, with substantial variability over subjects (CI95% = [1.33, 1.66]).

      If such variability also affected the neuronal ERF and gamma power measures reported here, L/M-ratios in color-contrast change-detection thresholds should be correlated across subjects with L/M-ratios in ERF amplitude and induced gamma power. This was not the case: Change-detection threshold red/green ratios were neither correlated with ERF N70 amplitude red/green ratios (ρ = 0.09, p = 0.65), nor with induced gamma power red/green ratios (ρ = -0.17, p = 0.38)."

      Reviewer #3 (Public Review):

      This is an interesting article studying human color perception using MEG. The specific aim was to study differences in color perception related to different S-, M-, and L-cone excitation levels and especially whether red color is perceived differentially to other colors. To my knowledge, this is the first study of its kind and as such very interesting. The methods are excellent and manuscript is well written as expected this manuscript coming from this lab. However, illustrations of the results is not optimal and could be enhanced.

      Major

      The results presented in the manuscript are very interesting, but not presented comprehensively to evaluate the validity of the results. The main results of the manuscript are that the gamma-band responses to stimuli with absolute L-M contrast i.e. green and red stimuli do not differ, but they differ for stimuli on the S-(L+M) (blue vs red-green) axis and gamma-band responses for blue stimuli are smaller. These data are presented in figure 3, but in it's current form, these results are not well conveyed by the figure. The main results are illustrated in figures 3BC, which show the average waveforms for grating and for different color stimuli. While there are confidence limits for the gamma-band responses for the grating stimuli, there are no confidence limits for the responses to different color stimuli. Therefore, the main results of the similarities / differences between the responses to different colors can't be evaluated based on the figure and hence confidence limits should be added to these data.

      Figure 3E reports the gamma-power change values after alignment to the individual peak gamma frequencies, i.e. the values used for statistics, and does report confidence intervals. Yet, we see the point of the reviewer that confidence intervals are also helpful in the non-aligned/complete spectra. We found that inclusion of confidence intervals into Figure 3B,C, with the many overlapping spectra, renders those panels un-readable. Therefore, we included the new panel Figure 3-figure supplement 2A, showing each color’s spectrum separately:

      (A) Per-color average induced power change spectra. Banding shows 95% confidence intervals over participants. Note that the y-axis varies between colors.

      It is also not clear from the figure legend, from which time-window data is averaged for the waveforms.

      We have added in the legend:

      "All panels show power change 0.3 s to 1.3 s after stimulus onset, relative to baseline."

      The time-resolved profile of gamma-power changes are illustrated in Fig. 3D. This figure would a perfect place to illustrate the main results. However, of all color stimuli, these TFRs are shown only for the green stimuli, not for the red-green differences nor for blue stimuli for which responses were smaller. Why these TFRs are not showed for all color stimuli and for their differences?

      Figure 3-figure supplement 3. Per-color time-frequency responses: Average stimulus-induced power change in V1 as a function of time and frequency, plotted for each frequency.

      We agree with the reviewer that TFR plots can be very informative. We followed their request and included TFRs for each color as Figure 3-Figure supplement 3.

      Regarding the suggestion to also include TFRs for the differences between colors, we note that this would amount to 28 TFRs, one each for all color combinations. Furthermore, while gamma peaks were often clear, their peak frequencies varied substantially across subjects and colors. Therefore, we based our statistical analysis on the power at the peak frequencies, corresponding to peak-aligned spectra (Fig. 3c). A comparison of Figure 3C with Figure 3B shows that the shape of non-aligned average spectra is strongly affected by inter-subject peak-frequency variability and thereby hard to interpret. Therefore, we refrained from showing TFR for differences between colors, which would also lack the required peak alignment.

    1. Author Response:

      Joint Public Review:

      A highly robust result when investigating how neural population activity is impacted by performance in a task is that the trial to trial correlations (noise correlations) between neurons is reduced as performance increases. However the theoretical and experimental literature so far has failed to account for this robust link since reduced noise correlations do not systematically contribute to improved availability or transmission of information (often measured using decoding of stimulus identity). This paper sets out to address this discrepancy by proposing that the key to linking noise correlations to decoding and thus bridging the gap with performance is to rethink the decoders we use : instead of decoders optimized to the specific task imposed on the animal on any given trial (A vs B / B vs C / A vs C), they hypothesize that we should favor a decoder optimized for a general readout of stimulus properties (A vs B vs C).

      To test this hypothesis, the authors use a combination of quantitative data analysis and mechanistic network modeling. Data were recorded from neuronal populations in area V4 of two monkeys trained to perform an orientation change detection task, where the magnitude of orientation change could vary across trials, and the change could happen at cued (attended) or uncued (unattended) locations in the visual field. The model, which extends previous work by the authors, reproduces many basic features of the data, and both the model and data offer support for the hypothesis.

      The reviewers agreed that this is a potentially important contribution, that addresses a widely observed, but puzzling, relation between perceptual performance and noise correlations. The clarity of the hypothesis, and the combination of data analysis and computational modelling are two essential strengths of the paper.

      Overall this paper exhibits a new factor to be taken into account when analysing neural data : the choice of decoder and in particular how general or specific the decoder is. The fact that the generality of the decoder sheds light on the much debated question of noise correlations underscores its importance. The paper therefore opens multiple avenues for future research to probe this new idea, in particular for tasks with multiple stimuli dimensions.

      Nonetheless, as detailed below, the reviewers believe the manuscript clarity could be further improved in several points, and some additional analysis of the data would provide more straightforward test of the hypothesis.

      1. It would be important to verify that the model reproduces the correlation between noise and signal correlations since this is really a key argument leading to the author's hypothesis.

      We have incorporated this verification of the model into the manuscript, as referred to below in the Results:

      “Importantly, this model reproduces the correlation between noise and signal correlations (Figure 2–figure supplement 1) observed in electrophysiological data (Cohen & Maunsell, 2009; Cohen & Kohn, 2011). This correlation between the shared noise and the shared tuning is a key component of the general decoder hypothesis. We observed this strong relationship between noise and signal correlations in our recorded neurons (Figure 2–figure supplement 1A) as well as in our modeled data (Figure 2–figure supplement 1B). Using this model, we were able to measure the relationship between noise and signal correlations for varying strengths of attentional modulation. Consistent with the predictions of the general decoder hypothesis, attention weakened the relationship between noise and signal correlations (Figure 2–figure supplement 1C).”

      The new figure is as below:

      Figure 2–figure supplement 1. The model reproduces the relationship between noise and signal correlations that is key to the general decoder hypothesis. (A) As previously observed in electrophysiological data (Cohen & Maunsell, 2009; Cohen & Kohn, 2011), we observe a strong relationship between noise and signal correlations. During additional recordings collected during most recording sessions (for Monkey 1 illustrated here, n = 37 days with additional recordings), the monkey was rewarded for passively fixating the center of the monitor while Gabors with randomly interleaved orientations were flashed at the receptive field location (‘Stim 2’ location in Figure 1C). The presented orientations spanned the full range of stimulus orientations (12 equally spaced orientations from 0 to 330 degrees). We calculated the signal correlation for each pair of units based on their mean responses to each of the 12 orientations. We define the noise correlation for each pair of units as the average noise correlation for each orientation. The plot depicts signal correlation as a function of noise correlation across all recording sessions, binned into 8 equally sized sets of unit pairs. Error bars represent SEM. (B) The model reproduces the relationship between noise and signal correlations. Signal correlation is plotted as a function of noise correlation, binned into 20 equally sized sets of unit pairs (n = 2000 neurons), for each attentional modulation strength (green: least attended; yellow: most attended). The results were averaged over 50 tested orientations. (C) The slope of the relationship between noise and signal correlations (y-axis) decreases with increasing attentional modulation (x-axis). This suggests that noise is less aligned with signal correlation with increasing attentional modulation.

      2. Testing the hypothesis of the general decoder:<br /> 2.1 In the data, the authors compare mainly the specific (stimulus) decoder and the monkey's choice decoder. The general stimulus decoder is only considered in fig. 3f, because data across multiple orientations are available only for the cued condition, and therefore the general and specific decoders cannot be compared for changes between cued and uncued. However, the hypothesized relation between mean correlations and performance should also be true within a fixed attention condition (cued), comparing sessions with larger vs. smaller correlation. In other words, if the hypothesis is correct, you should find that performance of the "most general" decoder (as in fig. 3f) correlates negatively with average noise correlations, across sessions, more so than the "most specific" decoder.<br /> We have added a new supplementary figure to the manuscript:

      Figure 3–figure supplement 1. Based on the electrophysiological data, the performance of the monkey’s decoder was more related to mean correlated variability than the performance of the specific decoder within each attention condition. (A) Within the cued attention condition, the performance of the monkey’s decoder was more related to mean correlated variability (left plot; correlation coefficient: n = 71 days, r = -0.23, p = 0.058) than the performance of the specific decoder (right plot; correlation coefficient: r = 0.038, p = 0.75). The correlation coefficients associated with the two decoders were significantly different from each other (Williams’ procedure: t = 3.8, p = 1.5 x 10^-4). Best fit lines plotted in gray. Data from both monkeys combined (Monkey 1 data shown in orange: n = 44 days; Monkey 2 data shown in purple: n = 27 days) with mean correlated variability z-scored within monkey. (B) The data within the uncued attention condition showed a similar pattern, with the performance of the monkey’s decoder more related to mean correlated variability (n = 69 days, r = -0.20, p = 0.14) than the performance of the specific decoder (r = 0.085, p = 0.51; Williams’ procedure: t = 2.0, p = 0.049). Conventions as in (A) (Monkey 1: n = 42 days – see Methods for data exclusions as in Figure 3C; Monkey 2: n = 27 days).

      2.2 In figure 3f, a more straightforward and precise comparison is to use the stimulus decoders to predict the choice, and test whether the more specific or the more general can predict choices more accurately.

      We have added a new panel to Figure 3 (Figure 3G) that illustrates the results of this analysis comparing whether the specific or more-general decoders predict the monkey’s trial-by-trial choices more accurately:

      Figure 3… (G) The more general the decoder (x-axis), the better its performance predicting the monkey’s choices on the median changed orientation trials (y-axis; the proportion of leave-one-out trials in which the decoder correctly predicted the monkey’s decision as to whether the orientation was the starting orientation or the median changed orientation). Conventions as in (F) (see Methods for n values).

      The description of this new panel in the Results section is as below:

      “Further, the more general the decoder, the better it predicted the monkey’s trial-by-trial choices on the median changed orientation trials (Figure 3G).”

      The updated Methods section describing this new panel is as below:

      “For Figure 3G, we performanced analyses similar to those performed for Figure 3F, in that we tested each stimulus decoder: ‘1 ori’ decoders (n = 8 decoders; 1 specific decoder for either the first, second, fourth, or fifth largest changed orientation, for each of the 2 monkeys), ‘2 oris’ decoders (n = 12 decoders; 1 decoder for each of the 6 combinations of 2 changed orientations, for each of the 2 monkeys), ‘3 oris’ decoders (n = 8 decoders; 1 decoder for each of the 4 combinations of 3 changed orientations, for each of the 2 monkeys), and ‘4 oris’ decoders (n = 2 decoders; 1 decoder for the 1 combination of 4 changed orientations, for each of the 2 monkeys). However, unlike in Figure 3F, where the performance of the stimulus decoders was compared to the performance of the monkey’s decoder on the median orientation-change trials, here we calculated the performance of the stimulus decoder when tasked with predicting the trial-by-trial choices that the monkey made on the median orientation-change trials. We plotted the proportion of leave-one-out trials in which each decoder correctly predicted the monkey’s choice as to whether the orientation was the starting orientation or the median changed orientation.”

      3. The main goal of the manuscript is to determine the impact of noise correlations on various decoding schemes. The figures however only show how decoding co-varies with correlations, but a direct, more causal analysis of the effect of correlations on decoding seems to be missing. Such an analysis can be obtained by comparing decoding on simultaneously recorded activity with decoding on trial-shuffled activity, in which noise-correlations are removed.

      We have added the following Discussion section to address this point:

      “The purpose of this study was to investigate the relationship between mean correlated variability and a general decoder. We made an initial test of the overarching hypothesis that observers use a general decoding strategy in feature-rich environments by testing whether a decoder optimized for a broader range of stimulus values better matched the decoder actually used by the monkeys than a specific decoder optimized for a narrower range of stimulus values. We purposefully did not make claims about the utility of correlated variability relative to hypothetical situations in which correlated variability does not exist in the responses of a group of neurons, as we suspect that this is not a physiologically realistic condition. Studies that causally manipulate the level of correlated variability in neuronal populations to measure the true physiological and behavioral effects of increasing or decreasing correlated variability levels, through pharmacological or genetic means, may provide important insights into the impact of correlated variability on various decoding strategies.”

      4. How different are the four different decoders (specific/monkey, cued/uncued)? It would be interesting to see how much they overlap. More generally, the authors should discuss the alternative that attention modulates also the readout/decoding weights, rather than or in addition to modulating V4 activity.

      We have added the following to the manuscript:

      A fixed readout mechanism

      A prior study from our lab found that attention, rather than changing the neuronal weights of the observer’s decoder, reshaped neuronal population activity to better align with a fixed readout mechanism (Ruff & Cohen, 2019). To test whether the neuronal weights of the monkey’s decoder changed across attention conditions (attended versus unattended), Ruff and Cohen switched the neuronal weights across conditions, testing the stimulus information in one attention condition with the neuronal weights from the other. They found that even with the switched weights, the performance of the monkey’s decoder was still higher in the attended condition. The results of this study support the conclusion that attention reshapes neuronal activity so that a fixed readout mechanism can better read out stimulus information. In other words, differences in the performance of the monkey’s decoder across attention conditions may be due to differences in how well the neuronal activity aligns with a fixed decoder.

      Our study extends the findings of Ruff and Cohen to test whether that fixed readout mechanism is determined by a general decoding strategy. Our findings support the hypothesis that observers use a general decoding strategy in the face of changing stimulus and task conditions. Our findings do not exclude other potential explanations for the suboptimality of the monkey’s decoder, nor do they exclude the possibility that attention modulates decoder neuronal weights. However, our findings together with those of Ruff and Cohen shed light on why neuronal decoders are suboptimal in a manner that aligns the fixed decoder axis with the correlated variability axis (Ni et al., 2018; Ruff et al., 2018).”

      5. Quantifying the link between model and data :<br /> 5.1 the text providing motivation for the model could be improved. The motivation used in the manuscript is, essentially, that the model allows to extrapolate beyond the data (more stimuli, more repetitions, more neurons). The dangers of extrapolation beyond the range of the data are however well known. A model that extrapolates beyond existing data is useful to design new experiments and test predictions, but this is not done here. Because the manuscript is about information and decoding, a better motivation is the fact that this model takes an actual image as input, and produces tuning and covariance compatible with each other because they are constrained by an actual network that processes the input (as opposed to parametric models where tuning and covariance can be manipulated independently).

      We have modified the manuscript as below:

      “Here, we describe a circuit model that we designed to allow us to compare the specific and monkey’s decoders from our electrophysiological dataset to modeled ideal specific and general decoders. The primary benefit of our model is that it can take actual images as inputs and produce neuronal tuning and covariance that are compatible with each other because of constraints from the simulated network that processed the inputs (Huang et al., 2019). Parametric models in which tuning and covariance can be manipulated independently would not provide such constraints. In our model, the mean correlated variability of the population activity is restricted to very few dimensions, matching experimentally recorded data from visual cortex demonstrating that mean correlated variability occupies a low-dimensional subset of the full neuronal population space (Ecker et al., 2014; Goris et al., 2014; Huang et al., 2019; Kanashiro et al., 2017; Lin et al., 2015; Rabinowitz et al., 2015; Semedo et al., 2019; Williamson et al., 2016).”

      “Our study also demonstrates the utility of combining electrophysiological and circuit modeling approaches to studying neural coding. Our model mimicked the correlated variability and effects of attention in our physiological data. Critically, our model produced neuronal tuning and covariance based on the constraints of an actual network capable of processing images as inputs.”

      We have also removed the Results and Discussion text that suggested that the model allowed us to extrapolate beyond the data.

      5.2 The ring structure, and the orientation of correlations (Fig 2b) seem to be key ingredients of the model, but are they based on data, or ad-hoc assumptions?

      We have modified the manuscript to clarify this point, as below:

      “As the basis for our modeled general decoder, we first mapped the n-dimensional neuronal activity of our model in response to the full range of orientations to a 2-dimensional space. Because the neurons were tuned for orientation, we could map the n-dimensional population responses to a ring (Figure 2B, C). The orientation of correlations (the shape of each color cloud in Figure 2B) was not an assumed parameter, and illustrates the outcome of the correlation structure and dimensionality modeled by our data. In Figure 2B, we can see that the fluctuations along the radial directions are much larger than those along other directions for a given orientation. This is consistent with the low-dimensional structure of the modeled neuronal activity. In our model, the fluctuations of the neurons, mapped to the radial direction on the ring, were more elongated in the unattended state (Figure 2B) than in the attended state (Figure 2C).”

      5.3 In the model, the specific decoder is quite strongly linked to correlated variability and the improvement of the general decoder is clear but incremental (0.66 vs 0.83) whereas in the data there really is no correlation at all (Fig 3c). This is a bit problematic because the author's begin by stating that specific decoders cannot explain the link between noise correlations and accuracy but their specific decoder clearly shows a link.

      We appreciate this point and have modified the manuscript as below:

      “Indeed, we found that just as the performance of the physiological monkey’s decoder was more strongly related to mean correlated variability than the performance of the physiological specific decoder (Figure 3C; see Figure 3–figure supplement 1 for analyses per attention condition), the performance of the modeled general decoder was more strongly related to mean correlated variability than the performance of the modeled specific decoder (Figure 3D). We modeled much stronger relationships to correlated variability (Figure 3D) than observed with our physiological data (Figure 3C). We observed that the correlation with specific decoder performance was significant with the modeled data but not with the physiological data. This is not surprising as we saw attentional effects, albeit small ones, on specific decoder performance with both the physiological and the modeled data (Figure 3A, B). Even small attentional effects would result in a correlation between decoder performance and mean correlated variability with a large enough range of mean correlated variability values. It is possible that with enough electrophysiological data, the performance of the specific decoder would be significantly related to correlated variability, as well. As described above, our focus is not on whether the performance of any one decoder is significantly correlated with mean correlated variability, but on which decoder provides a better explanation of the frequently observed relationship between performance and mean correlated variability. The performance of the general decoder was more strongly related to mean correlated variability than the performance of the specific decoder.”

      “Our results suggest that the relationship between behavior and mean correlated variability is more consistent with observers using a more general strategy that employs the same neuronal weights for decoding any stimulus change.”

      6. General decoder: Some parts of the text (eg. Line 60, Line 413) refer to a decoder that accounts for discrimination along different stimulus dimensions (eg. different values of orientation, or different color of the visual input). But the results of the manuscripts are about a general decoder for multiple values along a single stimulus dimension. The disconnect should be discussed, and the relation between these two scenarios explained.

      We have modified the manuscript as below:

      “Here, we report the results of an initial test of this overarching hypothesis, based on a single stimulus dimension. We used a simple, well-studied behavioral task to test whether a more-general decoder (optimized for a broader range of stimulus values along a single dimension) better explained the relationship between behavior and mean correlated variability than a more-specific decoder (optimized for a narrower range of stimulus values along a single dimension). Specifically, we used a well-studied orientation change-detection task (Cohen & Maunsell, 2009) to test whether a general decoder for the full range of stimulus orientations better explained the relationship between behavior and mean correlated variability than a specific decoder for the orientation change presented in the behavioral trial at hand.

      This test based on a single stimulus dimension is an important initial test of the general decoder hypothesis because many of the studies that found that performance increased when mean correlated variability decreased used a change-detection task…”

      “We performed this initial test of the overarching general decoder hypothesis in the context of a change-detection task along a single stimulus dimension because this type of task was used in many of the studies that reported a relationship between perceptual performance and mean correlated variability (Cohen & Maunsell, 2009; 2011; Herrero et al., 2013; Luo & Maunsell, 2015; Mayo & Maunsell, 2016; Nandy et al., 2017; Ni et al., 2018; Ruff & Cohen, 2016; 2019; Verhoef & Maunsell, 2017; Yan et al., 2014; Zénon & Krauzlis, 2012). This simple and well-studied task provided an ideal initial test of our general decoder hypothesis.

      This initial test of the general decoder hypothesis suggests that a more general decoding strategy may explain observations in studies that use a variety of behavioral and stimulus conditions.”

      “This initial study of the general decoder hypothesis tested this idea in the context of a visual environment in which stimulus values only changed along a single dimension. However, our overarching hypothesis is that observers use a general decoding strategy in the complex and feature-rich visual scenes encountered in natural environments. In everyday environments, visual stimuli can change rapidly and unpredictably along many stimulus dimensions. The hypothesis that such a truly general decoder explains the relationship between perceptual performance and mean correlated variability is suggested by our finding that the modeled general decoder for orientation was more strongly related to mean correlated variability than the modeled specific decoder (Figure 3D). Future tests of a general decoder for multiple stimulus features would be needed to determine if this decoding strategy is used in the face of multiple changing stimulus features. Further, such tests would need to consider alternative hypotheses for how sensory information is decoded when observing multiple aspects of a stimulus (Berkes et al., 2009; Deneve, 2012; Lorteije et al., 2015). Studies that use complex or naturalistic visual stimuli may be ideal for further investigations of this hypothesis.”

      7. Some statements in the discussion such as l 354 "the relationship between behavior and mean correlated variability is explained by the hypothesis that observers use a general strategy" should be qualified : the authors clearly show that the general decoder amplifies the relationship but in their own data the relationship exists already with a specific decoder.

      We have modified the manuscript as below:

      “Our results suggest that the relationship between behavior and mean correlated variability is more consistent with observers using a more general strategy that employs the same neuronal weights for decoding any stimulus change.

      “Together, these results support the hypothesis that observers use a more general decoding strategy in scenarios that require flexibility to changing stimulus conditions.”

      “This initial test of the general decoder hypothesis suggests that a more general decoding strategy may explain observations in studies that use a variety of behavioral and stimulus conditions.”

      8. Low-Dimensionality, beginning of Introduction and end of Discussion: experimentally, cortical activity is low-dimensional, and the proposed model captures that. But some of the reviewers did not understand the argument offered for why this matters, for the relation between average correlations and performance. It seems that the dimensionality of the population covariance is not relevant: The point instead is that a change in amplitude of fluctuations along the f'f' direction necessarily impact performance of a "specific" decoder, whereas changes in all other dimensions can be accounted for by the appropriate weights of the "specific" decoder. On the other hand, changes in fluctuation strength along multiple directions may impact the performance of the "general" decoder.

      We have modified the manuscript as below:

      “These observations comprise a paradox because changes in this simple measure should have a minimal effect on information coding. Recent theoretical work shows that neuronal population decoders that extract the maximum amount of sensory information for the specific task at hand can easily ignore mean correlated noise (Kafashan et al., 2021; Kanitscheider et al., 2015b; Moreno-Bote et al., 2014; Pitkow et al., 2015; Rumyantsev et al., 2020; for review, see Kohn et al., 2016). Decoders for the specific task at hand can ignore mean correlated variability because it does not corrupt the dimensions of neuronal population space that are most informative about the stimulus (Moreno-Bote et al., 2014).”

      “Our results address a paradox in the literature. Electrophysiological and theoretical evidence supports that there is a relationship between mean correlated variability and perceptual performance (Abbott & Dayan, 1999; Clery et al., 2017; Haefner et al., 2013; Jin et al., 2019; Ni et al., 2018; Ruff & Cohen, 2019; reviewed by Ruff et al., 2018). Yet, a specific decoding strategy in which different sets of neuronal weights are used to decode different stimulus changes cannot easily explain this relationship (Kafashan et al., 2021; Kanitscheider et al., 2015b; Moreno-Bote et al., 2014; Pitkow et al., 2015; Rumyantsev et al., 2020; reviewed by Kohn et al., 2016). This is because specific decoders of neuronal population activity can easily ignore changes in mean correlated noise (Moreno-Bote et al., 2014).”

    1. Author Response:

      Reviewer #1 (Public Review):

      The introduction felt a bit short. I was hoping early on I think for a hint at what biotic and abiotic factors UV could be important for and how this might be important for adaptation. A bit more on previous work on the genetics of UV pigmentation could be added too. I think a bit more on sunflowers more generally (what petiolaris is, where natural pops are distributed, etc.) would be helpful. This seems more relevant than its status as an emoji, for example.

      We had opted to provide some of the relevant background in the corresponding sections of the manuscript, but agree that it would be beneficial to expand the introduction. In the revised version of the manuscript, we have modified the introduction and the first section of Results and Discussion to include more information about wild sunflowers, possible adaptive functions of floral UV patterns, and previous work on the genetic basis of floral UV patterning. More generally, we have strived to provide more background information throughout the manuscript.

      The authors present the % of Vp explained by the Chr15 SNP. Perhaps I missed it, but it might be nice to also present the narrow sense heritability and how much of Va is explained.

      Narrow sense heritability for LUVp is extremely high in our H. annuus GWAS population; four different software [EMMAX (Kang et al., Nat Genet 2010), GEMMA (Zhou and Stephens, Nat Genet. 2012), GCTA (Yang et al., Am J Hum Genet 2011) and BOLT_LMM (Loh et al., Nat Genet 2015)] provided h2 estimates of ~1. While it is possible that these estimates are somewhat inflated by the presence of a single locus of extremely large effect, all individuals in this populations were grown at the same time under the same conditions, and limited environmental effects would therefore be expected. The percentage of additive variance explained by HaMYB111 appears therefore to be equal to the percentage of phenotypic variance (~62%).

      We have included details in the Methods section – Genome-wide association mapping, and added this information to the relevant section of the main text:

      “The chromosome 15 SNP with the strongest association with ligule UV pigmentation patterns in H. annuus (henceforth “Chr15_LUVp SNP”) explained 62% of the observed phenotypic and additive variation (narrow-sense heritability for LUVp in this dataset is ~1).”

      A few lines of discussion about why the Chr15 allele might be observed at only low frequencies in petiolaris I think would be of interest - the authors appear to argue that the same abiotic factors may be at play in petiolaris, so why don't we see this allele at frequencies higher than 2%? Is it recent? Geographically localized?

      That is a very interesting observation, and we currently do not have enough data to provide a definitive answer to why that is. From GWAS, HaMYB111 does not seem to play a measurable role in controlling variation for LUVp in H. petiolaris; Even when we repeat the GWAS with MAF > 1%, so that the Chr15_LUVp SNP would be included in the analysis, there is no significant association between that SNP and LUVp (the significant association on chr. 15 seen in the Manhattan plot for H. petiolaris is ~20 Mbp downstream of HaMYB111). The rarity of the L allele in H. petiolaris could complicate detection of a GWAS signal; on the other hand, the few H. petiolaris individuals carrying the L allele have, on average, only marginally larger LUVp than the rest of the population (LL = 0.32 allele).

      The two most likely explanations for the low frequencies of the L allele in H. petiolaris are differences in alleles, or their effect, between H. annuus and H. petiolaris; or, as suggested by the reviewer, a recent introgression. In H. annuus, the Chr15_LUVp SNP is likely not the actual causal polymorphism affecting HaMYB111 activity, but is only in LD with it (or them); this association might be absent in H. petiolaris alleles. An alternative possibility is that downstream differences in the genetic network regulating flavonol glycosides biosynthesis mask the effect of different HaMYB111 alleles.

      H. annuus and H. petiolaris hybridize frequently across their range, so this could be a recent introgression that has not established itself; alternatively, physiological differences in H. petiolaris could make the L allele less advantageous, so the introgressed allele is simply being maintained by drift (or recurring hybridization). Further analysis of genetic and functional diversity at HaMYB111 in H. petiolaris will be required to differentiate between these possibilities.

      We have added a few sentences highlighting some of these possible explanations at the end the main text of the manuscript, which now reads:

      “Despite a more limited range of variation for LUVp, a similar trend (larger UV patterns in drier, colder environments) is present also in H. petiolaris (Figure 4 – figure supplement 4). Interestingly, while the L allele at Chr_15 LUVp SNP is present in H. petiolaris (Figure 1 – figure supplement 2), it is found only at a very low frequency, and does not seem to significantly affect floral UV patterns in this species (Figure 2a). This could represent a recent introgression, since H. annuus and H. petiolaris are known to hybridize in nature (Heiser, 1947, Yatabe et al., 2007). Alternatively, the Chr_15 LUVp SNP might not be associated with functional differences in HaMYB111 in H. petiolaris, or differences in genetic networks or physiology between H. annuus and H. petiolaris could mask the effect of this allele, or limit its adaptive advantage, in the latter species.“

      Page 14: It's unclear to me why there is any need to discretize the LUVp values for the analyses presented here. Seems like it makes sense to either 1) analyze by genotype of plant at the Chr15 SNP, if known, or 2) treat it as a continuous variable and analyze accordingly.

      We designed our experiment to be a comparison between three well-defined phenotypic classes, to reduce the experimental noise inherent to pollinator visitation trials. As a consequence, intermediate phenotypic classes (0.3 < LUVp < 0.5 and 0.8 < LUVp < 0.95) are not represented in the experiment, and therefore we believe that analyzing LUVp as a continuous variable would be less appropriate in this case. In the revised manuscript, we have provided a modified Figure 4 – figure supplement 1 in which individual data points are show (colour-coded by pollinator type), as well as a fitted lines showing the general trend across the data.

      The individuals in pollinator visitation experiments were not genotyped for the Chr15_LUVp SNP; while having that information might provide a more direct link between HaMYB111 and pollinator visitation rates, our main interest in this experiment was to test the possible adaptive effects of variation in floral UV pigmentation.

      Page 14: I'm not sure you can infer selection from the % of plants grown in the experiment unless the experiment was a true random sample from a larger metapopulation that is homogenous for pollinator preference. In addition, I thought one of the Ashman papers had actually argued for intermediate level UV abundance in the presence of UV?

      We have removed mentions of selection from the sentence - while the 110 populations included in our 2019 common garden experiment were selected to represent the whole range of H. annuus, we agree that the pattern we observe is at best suggestive. We have, however, kept a modified version of the sentence in the revised version of the manuscript, since we believe that is an interesting observation. The sentence now reads:

      “Pollination rates are known to be yield-limiting in sunflower (Greenleaf and Kremen, 2006), and a strong reduction in pollination could therefore have a negative effect on fitness; consistent with this plants with very small LUVp values were rare (~1.5% of individuals) in our common garden experiment, which was designed to provide a balanced representation of the natural range of H. annuus.”. (new lines 373-378)

      It is correct that Koski et al., Nature Plants 2015 found intermediate UV patterns to increase pollen viability in excised flowers of Argentina anserina exposed to artificial UV radiation. However, the authors also remark that larger UV patterns would probably be favoured in natural environments, in which UV radiation would be more than two times higher than in their experimental setting. Additionally, when using artificial flowers, they found that pollen viability increased linearly with the size of floral UV pattern.

      More generally, as we discuss later on in the manuscript, the pollen protection mechanism proposed in Koski et al., Nature Plants 2015 is unlikely to be as important in sunflower inflorescences, which are much flatter than the bowl- shaped flowers of A. anserina; consistent with this, and contrary to what was observed for A. anserina, we found no correlation between UV radiation and floral UV patterns in wild sunflowers (Figure 4c).

      I would reduce or remove the text around L316-321. If there's good a priori reason to believe flower heat isn't a big deal (L. 323) and the experimental data back that up, why add 5 lines talking up the hypothesis?

      We had fairly strong reasons to believe temperature might play an important role in floral UV pattern diversity: a link between flower temperature and UV patterns has been proposed before (Koski et al., Current Biol 2020); a very strong correlation exists between temperature and LUVp in our dataset; and, perhaps more importantly, inflorescence temperature is known to have a major effect on pollinator attraction (Atamian et al., Science 2016; Creux et al., New Phytol 2021). While it is known that UV radiation is not particularly energetic, we didn’t mean line 323 to imply that we were sure a priori that there wouldn’t be any effect of UV patterns of inflorescence temperature.

      In the revised manuscript, we have re-organized that section and provided the information reported in line 323 (UV radiation accounts for only 3-7% of the total radiation at earth level) before the experimental results, to clarify what our thought process was in designing those experiments. The paragraph now reads:

      “By absorbing more radiation, larger UV bullseyes could therefore contribute to increasing temperature of the sunflower inflorescences, and their attractiveness to pollinators, in cold climates. However, UV wavelengths represents only a small fraction (3-7%) of the solar radiation reaching the Earth surface (compared to >50% for visible wavelengths), and might therefore not provide sufficient energy to significantly warm up the ligules (Nunez et al., 1994). In line with this observation, different levels of UV pigmentation had no effect on the temperature of inflorescences or individual ligules exposed to sunlight (Figure 4e-g; Figure 4 – figure supplement 3).”

      Page 17: The discussion of flower size is interesting. Is there any phenotypic or genetic correlation between LUVP and flower size?

      This is a really interesting question! There is no obvious genetic correlation between LUVp and flower size – in GWAS, HaMYB111 is not associated to any of the floral characteristics we measured (flowerhead diameter; disk diameter; ligule length; ligule width; relative ligule size; see Todesco et al., Nature 2020). There is also no significant association between ligule length and LUVp (R^2 = 0.0024, P = 0.1282), and only a very weak positive association between inflorescence size and LUVp (R^2 = 0.0243, P = 0.00013; see attached figure). There is, however, a stronger positive correlation between LUVp and disk size (the disk being the central part of the sunflower inflorescence, composed of the fertile florets; R^2 = 0.1478. P = 2.78 × 10⁻²¹), and as a consequence a negative correlation between LUVp and relative ligule size (that is, the length of the ligule relative to the diameter of the whole inflorescence; R^2 = 0.1216, P = 1.46 × 10⁻¹⁷). This means that, given an inflorescence of the same size, plants with large LUVp values will tend to have smaller ligules and larger discs. Since the disk of sunflower inflorescences is uniformly UV- absorbing, this would further increase the size of UV-absorbing region in these inflorescences.

      While it is tempting to speculate that this might be connected with regulation of transpiration (meaning that plants with larger LUVp further reduce transpiration from ligules by having smaller ligules - relative ligule size is also positively correlated with summer humidity; R^2 = 0.2536, P = 2.86 × 10_-5), there are many other fitness-related factors that could determine inflorescence size, and disk size in particular (seed size, florets/seed number...). Additionally, in common garden experiments, flowerhead size (and plant size in general) is affected by flowering time, which is also one of the reason why we use LUVp to measure floral UV patterns instead of absolute measurements of bullseye size; in a previous work from our group in Helianthus argophyllus, size measurements for inflorescence and UV bullseye mapped to the same locus as flowering time, while genetic regulation of LUVp was independent of flowering time (Moyers et al., Ann Bot 2017). Flowering time in H. annuus is known to be strongly affected by photoperiod (Blackman et al., Mol Ecol 2011), meaning that the flowering time we measured in Vancouver might not reflect the exact flowering time in the populations of origin of those plants – with consequences on inflorescence size.

      In summary, there is an interesting pattern of concordance between floral UV pattern and some aspects of inflorescence morphology, but we think it would be premature to draw any inference from them. Measurements of inflorescence parameters in natural populations would be much more informative in this respect.

      Reviewer #2 (Public Review):

      The genetic analysis is rigorously conducted with multiple Helianthus species and accessions of H. annuus. The same QTL was inputed in two Helianthus species, and fine mapped to promotor regions of HaMyb111.

      While there is a significant association at the beginning of chr. 15 in the GWAS for H. petiolaris petiolaris, we should clarify that that peak is unfortunately ~20 Mbp away from HaMYB111. While it is not impossible that the difference is due to reference biases in mapping H. petiolaris reads to the cultivated H. annuus genome, the most conservative explanation is that those two QTL are unrelated. We have clarified this in the legend to Fig. 2 in the revised manuscript.

      The allelic variation of the TF was carefully mapped in many populations and accessions. Flavonol glycosides were found to correlate spatially and developmentally in ligules and correlate with Myb111 transcript abundances, and a downstream flavonoid biosynthetic gene. Heterologous expression in Arabidopsis in Atmyb12 mutants, showed that HaMyb111 to be able to regulate flavonol glycoside accumulations, albeit with different molecules than those that accumulate in Helianthus. Several lines of evidence are consistent with transcriptional regulation of myb111 accounting for the variation in bullseye size.

      Functional analysis examined three possible functional roles, in pollinator attraction, thermal regulation of flowers, and water loss in excised flowers (ligules?), providing support for the first and last, but not the second possible functions, confirming the results of previous studies on the pollinator attraction and water loss functions for flavonol glycosides. The thermal imaging work of dawn exposed flower heads provided an elegant falsification of the temperature regulation hypothesis. Biogeographic clines in bullseye size correlated with temperature and humidity clines, providing a confirmation of the hypothesis posed by Koski and Ashmann about the patterns being consistent with Gloger's rule, and historical trends from herbaria collections over climate change and ozone depletion scenarios. The work hence represents a major advance from Moyers et al. 2017's genetic analysis of bullseyes in sunflowers, and confirms the role established in Petunia for this Myb TF for flavonoid glycoside accumulations, in a new tissue, the ligule.

      Thank you. We have specified in the legend of Fig. 4i of the revised manuscript that desiccation was measured in individual detached ligules, and added further details about the experiment in the Methods section.

      While there is a correlation between pigmentation and temperature/humidity in our dataset, it goes in the opposite direction to what would be expected under Gloger’s rule – that is, we see stronger pigmentation in drier/colder environments, contrary to what is generally observed in animals. This is also contrary to what observed in Koski and Ashman, Nature Plants 2015, where the authors found that floral UV pigmentation increased at lower latitudes and higher levels of UV radiation. While possibly rarer, such “anti-Gloger” patterns have been observed in plants before (Lev-Yadun, Plant Signal Behav 2016).

      Weakness: The authors were not able to confirm their inferences about myb111 function through direct manipulations of the locus in sunflower.

      That is unfortunately correct. Reliable and efficient transformation of cultivated sunflower (much less of wild sunflower species) has eluded the sunflower community (including our laboratories) so far – see for example discussion on the topic in Lewi et al. Agrobacterium protocols 2016, and Sujatha et al. PCTOC 2012. We had therefore to rely on heterologous complementation in Arabidopsis; while this approach has limitations, we believe that its results, given also the similarity in expression patterns between HaMYB111 and AtMYB111, and in combination with the other experiments reported in our manuscript, make a convincing case that HaMYB111 regulates flavonol glycosides accumulation in sunflower ligules.

      Given that that the flavonol glycosides that accumulate in Helianthus are different from those regulated when the gene is heterologously expressed in Arabidopsis, the biochemical function of Hamyb111, while quite reasonable, is not completely watertight. The flavonol glycosides are not fully characterized (only Ms/Ms data are provided) and named only with cryptic abbreviations in the main figures.

      We believe that the fact that expression of HaMYB111 in the Arabidopsis myb111 mutant reproduces the very same pattern of flavonol glycosides accumulation found in wild type Col-0 is proof that its biochemical function is the same as that of the endogenous AtMYB111 gene – that is, HaMYB111 induces expression of the same genes involved in flavonol glycosides biosynthesis in Arabidopsis. Differences in function between HaMYB11 and AtMYB111 would have resulted in different flavonol profiles between wild type Col-0 and 35S::HaMYB111 myb111 lines. It should be noted that the known direct targets of AtMYB111 in Arabidopsis are genes involved in the production of the basic flavonol aglycone (Strake et al., Plant J 2007). Differences in flavonol glycoside profiles between the two species are likely due to broader differences between the genetic networks regulating flavonol biosynthesis: additional layers of regulation of the genes targeted by MYB111, or differential regulation (or presence/absence variation) of genes controlling downstream flavonol glycosylation and conversion between different flavonols.

      In the revised manuscript, we have added the full names of all identified peaks to the legend of Figures 3a,b,e.

      This and the differences in metabolite accumulations between Arabidopsis and Helianthus becomes a bit problematic for the functional interpretations. And here the authors may want to re-read Gronquist et al. 2002: PNAS as a cautionary tale about inferring function from the spatial location of metabolites. In this study, the Eisner/Meinwald team discovered that imbedded in the UV-absorbing floral nectar guides amongst the expected array of flavonoid glycosides, were isoprenilated phloroglucinols, which have both UV-absorbing and herbivore defensive properties. Hence the authors may want to re-examine some of the other unidentified metabolites in the tissues of the bullseyes, including the caffeoyl quinic acids, for alternative functional hypotheses for their observed variation in bullseye size (eg. herbivore defense of ligules).

      This is a good point, and we have included a mention of a more explicit mention possible role of caffeoyl quinic acid (CQA) as a UV pigment in the main text, as well as highlighted at the end of the manuscript other possible factors that could contribute to variation for floral UV patterns in wild sunflowers.

      We should note, however, that CQA plays a considerably smaller role than flavonols in explaining UV absorbance in UV-absorbing (parts of) sunflower ligules, and the difference in abundance with respect to UV-reflecting (parts of) ligules is much less obvious than for flavonols (height of the absorbance peak is reduced only 2-3 times in UV- reflecting tissues for CQA, vs. 7-70 fold reductions for individual quercetin glycosides). Therefore, flavonols are clearly the main pigment responsible for UV patterning in ligules. This is in contrast with the situation for Hypericum calycinum reported in Gronquist et al., PNAS 2002, were dearomatized isoprenylated phloroglucinols (DIPs) are much more abundant than flavonols in most floral tissue, including petals. The localization of DIPs accumulation, in reproductive organs and on the abaxial (“lower”) side of the petals (so that they would be exposed when the flower is closed), is also more consistent with a role in prevention of herbivory; no UV pigmentation is found on the adaxial (“upper”) part of petals in this species, which would be consistent with a role in pollinator attraction.

      The hypotheses regarding a role for the flavonoid glycosides regulated by Myb111 expression in transpirational mitigation and hence conferring a selective advantage under high temperatures and low and high humidities, are not strongly supported by the data provided. The water loss data from excised flowers (or ligules-can't tell from the methods descriptions) is not equivalent to measures of transpiration rates (the stomatal controlled release of water), which are better performed with intact flowers by porometry or other forms of gas-exchange measures. Excised tissues tend to have uncontrolled stomatal function, and elevated cuticular water loss at damaged sites. The putative fitness benefits of variable bullseye size under different humidity regimes, proposed to explain the observed geographical clines in bullseye size remain untested.

      We have clarified in the text and methods section that the desiccation experiments were performed on detached ligules. We agree that the results of this experiments do not constitute a direct proof that UV patterns/flavonol levels have an impact on plant fitness under different humidities in the wild – our aim was simply to provide a plausible physiological explanation for the correlation we observe between floral UV patterns and relative humidity. However, we do believe they are strongly suggestive of a role for floral flavonol/UV patterns in regulating transpiration, which is consistent with previous observations that flowers are a major source of transpiration in plants (Galen et al., Am Nat 2000, and other references in the manuscript). As suggested also by other reviewers, we have softened our interpretation of these result to clarify that they are suggestive, but not proof, of a connection between floral UV patterns, ligule transpiration and environmental humidity levels.

      “While desiccation rates are only a proxy for transpiration in field conditions (Duursma et al. 2019, Hygen et al. 1951), and other factors might affect ligule transpiration in this set of lines, this evidence (strong correlation between LUVp and summer relative humidity; known role of flavonol glycosides in regulating transpiration; and correlation between extent of ligule UV pigmentation and desiccation rates) suggests that variation in floral UV pigmentation in sunflowers is driven by the role of flavonol glycosides in reducing water loss from ligules, with larger floral UV patterns helping prevent drought stress in drier environments.” (new lines 462-469)

      Detached ligules were chosen to avoid confounding the results should differences in the physiology of the rest of the inflorescence/plant between lines also affect rates of water loss. Desiccation/water loss measurements were performed for consistency with the experiments reported in Nakabayashi et al Plant J. 2014, in which the effects of flavonol accumulation (through overexpression of AtMYB12) on water loss/drought resistance were first reported. It should also be noted that the use of detached organs to study the effect of desiccation on transpiration, water loss and drought responses is common in literature (see for example Hygen, Physiol Plant 1951; Aguilar et al., J Exp Bot 2000; Chen et al., PNAS 2011; Egea et al., Sci Rep 2018; Duursma et al., New Phytol 2019, among others). While removing the ligules create a more stressful/artificial situation, mechanical factors are likely to affect all ligules and leaves in the same way, and we can see no obvious reason why that would affect the small LUVp group more than the large LUVp group (individuals in the two groups were selected to represent several geographically unrelated populations).

      We have included some of the aforementioned references to the main text and Methods sections in the revised manuscript to support our use of this experimental setup.

      Alternative functional hypotheses for the observed variation in bullseye size in herbivore resistance or floral volatile release could also be mentioned in the Discussion. Are the large ligules involved in floral scent release?

      We have added sentences in the Results and Discussion, and Conclusions section in the revised manuscript to explore possible additional factors that could influence patterns of UV pigmentation across sunflower populations, including resistance to herbivory and floral volatiles. While some work has been done to characterize floral volatiles in sunflower (e.g. Etievant et al. J. Agric. Food Chem; Pham-Delegue et al. J. Chem. Ecol. 1989), to our knowledge the role of ligules in their production has not been investigates.

      In the revised manuscript, the section “A dual role for floral UV pigmentation” now includes the sentences:

      “Although pollinator preferences in this experiment could still affected by other unmeasured factors (nectar content, floral volatiles), these results are consistent with previous results showing that floral UV patterns play a major role in pollinator attraction (Horth et al., 2014, Koski ad Ashman, 2014, Rae and Vamosi, 2013, Sheehan et al., 2016).” (new lines 378-381)

      And the Conclusions sections includes the sentence:

      “It should be noted that, while we have examined some of the most likely factors explaining the distribution of variation for floral UV patterns in wild H. annuus across North America, other abiotic factors could play a role, as well as biotic ones (e.g. the aforementioned differences in pollinator assemblages, or a role of UV pigments in protection from herbivory (Gronquist et al., 2001)).” (new lines 540-544)

      Reviewer #3 (Public Review):

      Todesco et al undertake an ambitious study to understand UV-absorbing variation in sunflower inflorescences, which often, but not always display a "bullseye" pattern of UV-absorbance generated by ligules of the ray flowers. [...] I think this manuscript has high potential impact on science on both of these fronts.

      Thank you! We are aware that our experiments do not provide a direct link between UV patterns and fitness in natural populations (although we think they are strongly suggestive) and that, as pointed out also by other reviewers, there are other possible (unmeasured) factors that could explain or contribute to explain the patterns we observed. In the revised manuscript we have better characterized the aims and interpretation of our desiccation experiment, and modified the main text to acknowledge other possible factors affecting pollination preferences (nectar production, floral volatiles) and variation for floral UV patterns in H. annuus (pollinator assemblages, resistance to herbivory).

    1. Author Response:

      Reviewer #1:

      Salehinejad et al. run a battery of tests to investigate the effects of sleep deprivation on cortical excitability using TMS, LTP/LTD-like plasticity using tDCS, EEG-derived measures and behavioral task-performance. The study confirms evidence for sleep deprivation resulting in an increase in cortical excitability, diminishing LTP-like plasticity changes, increase in EEG theta band-power and worse task-performance. Additionally, a protocol usual resulting in LTD-like plasticity results in LTP-like changes in the sleep deprivation condition.

      We appreciate the reviewer's time for carefully reading our work and providing important suggestions/recommendations. In what follows, we addressed the comments one by one, revised the main text accordingly, and pasted the changes here as well.

      1) My main comment is regarding the motivation for executing this specific study setup, which did not become clear to me. It's a robust experimental design, with general approach quite similar to the (in the current manuscript heavily cited) Kuhn et al. 2016 study (which investigates cortical excitability, EEG markers, and changes in LTP mechanisms), with additional inclusion of LTD-plasticity measures. The authors list comprehensiveness as motivation, but the power of a comprehensive study like this would lie in being able to make comparisons across measures to identify new interrelations or interesting subgroups of participants differentially affected by sleep deprivations. These comparisons are presented in l. 322 and otherwise at the end of the supplementary material and the study does not seem to be designed with these as the main motivation in mind. Can the authors could comment on this & clarify their motivation? Maybe the authors can highlight in what way their study constitutes a methodological improvement and incorporates new aspects regarding hypothesis development as compared to e.g. Kuhn et al. 2016; currently, the authors highlight mainly the addition of LTD-plasticity protocols. Similarly, no motivation/context/hypotheses are given for saliva testing. There are a lot of different results, but e.g. the cortical excitability results are not discussed in depth, e.g. there is no effect on IO curve, but on other measures of excitability, the conclusion of that paragraph is only "our results demonstrate that corticocortical and corticospinal excitability are upscaled after sleep deprivation." There are some conflicting results regarding cortical excitability measures in the literature, possibly this could be discussed, so the reader can evaluate in what way the current study constitutes an improvement, for instance methodologically, over previous studies.

      Thank you for your comment/suggestion. The main motivation behind this study was to examine different physiological/behavioral/cognitive measures under sleep conditions and to provide a reasonably complete overview. This approach was not covered in detail by previous work, which is often limited to one or two pieces of behavioral and/or physiological evidence. Our study was not sufficiently powered to identify new interrelations between measures, because this was a secondary aim, although we found some relevant associations in exploratory analyses (i.e., association of motor learning with plasticity, and cortical excitability with memory and attention). Future studies, however, which are sufficiently powered for these comparisons, are needed to explore interrelations between physiological, and cognitive parameters more clearly and we stated this as a limitation (Page 22).

      That said, we agree that specific rationales of the study were not sufficiently clarified in the previous version. We rephrased and clarified respective motivations and rationales here:

      1) By comprehensive, we mean that we obtained measures from basic physiological parameters to behavior and higher-order cognition, which is not sufficiently covered so far. This includes also the exploration of expected associations between behavioral motor learning and plasticity measures, as well as excitability parameters and cognitive functions.

      2) In the Kuhn et al. (2016) study, cortical excitability was obtained by TMS intensity (single- pulse protocol) to elicit a predefined amplitude of the motor-evoked potential, which is a relatively unspecific parameter of corticospinal excitability. In the present study, cortical excitability was monitored by different TMS protocols, which cover not only corticospinal excitability, but also intracortical inhibition, facilitation, I-wave facilitation, and short-latency afferent inhibition, which allow more specific conclusions with respect to the involvement of cortical systems, neurotransmitters, and -modulators.

      3) Furthermore, Kuhn et al (2016) only investigated LTP-like, but not LTD-like plasticity. LTD- like plasticity was also not investigated in previous works to the best of our knowledge. LTD- like plasticity has however relevance for cognitive processing, and furthermore, knowledge about alterations of this kind of plasticity is important for mechanistic understanding of sleep- dependent plasticity alterations: The conversion of LTD-like to LTP-like plasticity under sleep deprivation is crucial for the interpretation of the study results as likely caused by cortical hyperactivity.

      4) Finally, an important motivation was to compare how brain physiology and cognition are differently affected by sleep deprivation, as compared to chronotype-dependent brain physiology, and cognitive performance, especially with respect to brain physiology, and performance at non-preferred times of the day. Our findings regarding the latter were recently published (Salehinejad et al., 2021) and comparisons of the present study with the published one have a novel, and important implications. Specifically, the results of both studies imply that the mechanistic background of sleep deprivation-, and non-optimal time of day performance- dependent reduced performance differs relevantly.

      We clarified these motivations in the introduction and discussion. Please see the revised text below:

      "The number of available studies about the impact of sleep deprivation on human brain physiology relevant for cognitive processes is limited, and knowledge is incomplete. With respect to cortical excitability, Kuhn et al. (2016) showed increased excitability under sleep deprivation via a global measure of corticospinal excitability, the TMS intensity needed to induce motor-evoked potentials of a specific amplitude. Specific information about the cortical systems, including neurotransmitters, and - modulators involved in these effects (e.g. glutamatergic, GABAergic, cholinergic), is however missing. The level of cortical excitability affects neuroplasticity, a relevant physiological derivate of learning, and memory formation. Kuhn and co-workers (2016) describe accordingly a sleep deprivation-dependent alteration of LTP-like plasticity in humans. The effects of sleep deprivation on LTD-like plasticity, which is required for a complete picture, have however not been explored so far. In the present study, we aimed to complete the current knowledge and explored also cognitive performance on those tasks which critically depend on cortical excitability (working memory, and attention), and neuroplasticity (motor learning) to gain mechanistic knowledge about sleep deprivation-dependent performance decline. Finally, we aimed to explore if the impact of sleep deprivation on brain physiology and cognitive performance differs from the effects of non-optimal time of day performance in different chronotypes, which we recently explored in a parallel study with an identical experimental design (Salehinejad et al., 2021). The use of measures of different modalities in this study allows us to comprehensively investigate the impact of sleep deprivation on brain and cognitive functions which is largely missing in the human literature."

      We added more details about the rationale for saliva sampling:

      "We also assessed resting-EEG theta/alpha, as an indirect measure of homeostatic sleep pressure, and examined cortisol and melatonin concentration to see how these are affected under sleep conditions, given the reported mixed effects in previous studies."

      We also rephrased the cortical excitability results. Please see the revised text below:

      "Taken together, our results demonstrate that glutamate-related intracortical excitability is upscaled after sleep deprivation. Moreover, cortical inhibition was decreased or turned into facilitation, which is indicative of enhanced cortical excitability as a result of GABAergic reduction. Corticospinal excitability did only show a trendwise upscaling, indicative for a major contribution of cortical, but not downstream excitability to this sleep deprivation-related enhancement."

      "The increase of cortical excitability parameters and the resultant synaptic saturation following sleep deprivation can explain the respective cognitive performance decline. It is, however, worth noting that our study was not powered to identify these correlations with sufficient reliability, and future studies that are powered for this aim are needed.

      Our findings have several implications. First, they show that sleep and circadian preference (i.e., chronotype) have functionally different impacts on human brain physiology and cognition. The same parameters of brain physiology and cognition were recently investigated at circadian optimal vs non-optimal time of day in two groups of early and late chronotypes (Salehinejad et al., 2021). While we found decreased cortical facilitation and lower neuroplasticity induction (same for both LTP and LTD) at the circadian nonpreferred time in that study (Salehinejad et al., 2021), in the present study we observed upscaled cortical excitability and a functionally different pattern of neuroplasticity alteration (i.e., diminished LTP-like plasticity induction and conversion of LTD- to LTP-like plasticity)."

      2) EEG-measures. In general, I find the presented evidence regarding a link between synaptic strength and human theta-power is weak. In humans, rhythmic theta activity can be found mostly in the form of midfrontal theta. Here, the largest changes seem to be in posterior electrodes (judging according to in Fig 4 bottom row), which will not capture rhythmic midfrontal theta in humans. Can the authors explain the scaling of the Fig. 4 top vs. bottom row, there seems to be a mismatch? No legend is given for the bottom row. The activity captured here is probably related to changes in nonrhythmic 1/f-type activity (which displays large changes relating to arousal: e.g. https://elifesciences.org/articles/55092. It would be of benefit to see a power spectrum for the EEG-measures to see the specific type of power changes across all frequencies & to verify that these are actually oscillatory peaks in individual subjects. As far as I understood, the referenced study Vyazovskiy et al., 2008 contains no information regarding theta as a marker for synaptic potentiation. The evidence that synaptic strength is captured by the specifically used measures needs to be strengthened or statements like "measured synaptic strength via the resting-EEG theta/alpha pattern" need to be more carefully stated.

      Thank you for this comment. We removed the Pz electrode from the figure and instead added F3 and F4 along with Fz and Cz to capture more mid-frontal regions. Please see the revised Figure 4. The top rows now include only midfrontal and midcentral areas (Fz, Cz, F3, F4), and show numerical comparisons of midfrontal theta which is significantly different across conditions (and larger after sleep deprivation). The purpose of the bottom figures, which are removed now, was just to provide an overall visual comparison of theta distribution across sleep conditions. However, we agree that the bottom-row figures are misleading because these just capture average theta band power without specifying midfrontal regions. We removed this part of the figure to prevent confusion. Please see below.

      Regarding the power spectrum, we also added new figures (4 g) showing how different frequency bands of the power spectrum are affected by sleep deprivation. Please see the revised Figure 4 below.

      Updated results, page 12-13:

      "In line with this, we investigated how sleep deprivation affects resting-state brain oscillations at the theta band (4-7 Hz), the beta band (15-30 Hz) as another marker of cortical excitability, vigilance and arousal (Eoh et al., 2005; Fischer et al., 2008) and the alpha band (8-14 Hz) which is important for cognition (e.g. memory, attention) (Klimesch, 2012). To this end, we analyzed EEG spectral power at mid-frontocentral electrodes (Fz, Cz, F3, F4) using a 4×2 mixed ANOVA. For theta activity, significant main effects of location (F1.71=18.68, p<0.001; ηp2=0.40) and sleep condition (F1=17.82, p<0.001; ηp2=0.39), but no interaction was observed, indicating that theta oscillations at frontocentral regions were similarly affected by sleep deprivation. Post hoc tests (paired, p<0.05) revealed that theta oscillations, grand averaged at mid-central electrodes, were significantly increased after sleep deprivation (p<0.001) (Fig. 4a,b). For the alpha band, the main effects of location (F1.49=12.92, p<0.001; ηp2=0.31) and sleep condition (F1=5.03, p=0.033; ηp2=0.15) and their interaction (F2.31=4.60, p=0.010; ηp2=0.14) were significant. Alpha oscillations, grand averaged at mid-frontocentral electrodes, were significantly decreased after sleep deprivation (p=0.033) (Fig. 4c,d). Finally, the analysis of beta spectral power showed significant main effects of location (F1.34=6.73, p=0.008; ηp2=0.19) and sleep condition (F1=6.98, p=0.013; ηp2=0.20) but no significant interaction. Beta oscillations, grand averaged at mid-frontocentral electrodes, were significantly increased after sleep deprivation (p=0.013) (Fig. 4e,f)."

      Fig. 4. Resting-state theta, alpha, and beta oscillations at electrodes Fz, Cz, F3 and F4. a,b Theta band activity was significantly higher after the sleep deprivation vs sufficient sleep condition (tFz=4.61, p<0.001; tCz=2.22, p=0.034; tF3=2.93, p=0.007; tF4=4.78, p<0.001). c,d, Alpha band activity was significantly lower at electrodes Fz and Cz (tFz=2.39, p=0.023; tCz=2.65, p=0.013) after the sleep deprivation vs the sufficient sleep condition. e,f, Beta band activity was significantly higher at electrodes Fz, Cz and F4 after sleep deprivation compared with the sufficient sleep condition (tFz=3.06, p=0.005; tCz=2.38, p= 0.024; tF4=2.25, p=0.032). g, Power spectrum including theta (4-7 Hz), alpha (8-14 Hz), and beta (15-30 Hz) bands at the electrodes Fz, Cz, F3 and F4 respectively. Data of one participant were excluded due to excessive noise. All pairwise comparisons for each electrode were calculated via post hoc Student’s t-tests (paired, p<0.05). n=29. Error bars represent s.e.m. ns = nonsignificant; Asterisks indicate significant differences. Boxes indicate the interquartile range that contains 50% of values (range from the 25th to the 75th percentile) and whiskers show the 1 to 99 percentiles.

      Regarding the reference, unfortunately, we were referring to a different work of the Vyazovskiy team. We meant Vyazovskiy et al. (2005). We removed this reference and the part that needed to be toned down from the introduction and added new relevant references while tuning down the statement about synaptic strength. Please see below:

      Revised text, Results, page 12:

      "So far, we found that sleep deprivation upscales cortical excitability, prevents induction of LTP-like plasticity, presumably due to saturated synaptic potentiation, and converts LTD- into LTP-like plasticity. Previous studies in animals (Vyazovskiy and Tobler, 2005; Leemburg et al., 2010) and humans (Finelli et al., 2000) have shown that EEG theta activity is a marker for homeostatic sleep pressure and increased cortical excitability (Kuhn et al., 2016)."

      3) In general, the authors generally do a good job pointing out multiple comparison corrected tests. In some cases, e.g. for their correlational analyses across measures, significant results are reported, but without a clearer discussion on what other tests were computed and how correction was applied, the evidence strength of these are hard to evaluate. Please check for all presented correlations.

      Thank you for your comment. For correlational analyses, no correction for multiple comparisons was computed, because these were secondary exploratory analyses. We state this now clearly in the manuscript. For the other analyses, the description of multiple comparisons is included below:

      Methods, pages 35-37:

      "For the TMS protocols with a double-pulse condition (i.e., SICI-ICF, I-wave facilitation, SAI), the resulting mean values were normalized to the respective single-pulse condition. First, mean values were calculated individually and then inter-individual means were calculated for each condition. For the I-O curves, absolute MEP values were used. To test for statistical significance, repeated-measures ANOVAs were performed with ISIs, TMS intensity (in I-O curve only), and condition (sufficient sleep vs sleep deprivation) as within-subject factors and MEP amplitude as the dependent variable. In case of significant results of the ANOVA, post hoc comparisons were performed using Bonferroni-corrected t-tests to compare mean MEP amplitudes of each condition against the baseline MEP and to contrast sufficient sleep vs sleep deprivation conditions. To determine if individual baseline measures differed within and between sessions, SI1mV and Baseline MEP were entered as dependent variables in a mixed-model ANOVA with session (4 levels) and condition (sufficient sleep vs sleep deprivation) as within-subject factors, and group (anodal vs cathodal) as between-subject factor. The mean MEP amplitude for each measurement time-point was normalized to the session’s baseline (individual quotient of the mean from the baseline mean) resulting in values representing either increased (> 1.0) or decreased (< 1.0) excitability. Individual averages of the normalized MEP from each time-point were then calculated and entered as dependent variables in a mixed-model ANOVA with repeated measures with stimulation condition (active, sham), time-point (8 levels), and sleep condition (normal vs deprivation) as within-subject factors and group (anodal vs cathodal) as between-subject factor. In case of significant ANOVA results, post hoc comparisons of MEP amplitudes at each time point were performed using Bonferroni-corrected t-tests to examine if active stimulation resulted in a significant difference relative to sham (comparison 1), baseline (comparison 2), the respective stimulation condition at sufficient sleepvs sleep deprivation (comparison 3), and the between-group comparisons at respective timepoints (comparison 4).

      The mean RT, RT variability and accuracy of blocks were entered as dependent variables in repeated-measures ANOVAs with block (5, vs 6, 6 vs 7) and condition (sufficient sleep vs sleep deprivation) as within-subject factors. Because the RT differences between blocks 5 vs 6 and 6 vs 7 were those of major interest, post hoc comparisons were performed on RT differences between these blocks using paired-sample t-tests (two-tailed, p<0.05) without correction for multiple comparisons. For 3-back, Stroop and AX-CPT tasks, mean and standard deviation of RT and accuracy were calculated and entered as dependent variables in repeated-measures ANOVAs with sleep condition (sufficient sleep vs sleep deprivation) as the within-subject factor. For significant ANOVA results, post hoc comparisons of dependent variables were performed using paired-sample t-tests (two-tailed, p<0.05) without correction for multiple comparisons.

      For the resting-state data, brain oscillations at mid-central electrodes (Fz, Cz, F3, F4) were analyzed with a 4×2 ANOVA with location (Fz, Cz, F3, F4) and sleep condition (sufficient sleep vs sleep deprivation) as the within-subject factors. For all tasks, individual ERP means were grand-averaged and entered as dependent variables in repeated-measures ANOVAs with sleep condition (sufficient sleep vs sleep deprivation) as the within-subject factor. Post hoc comparisons of grand-averaged amplitudes was performed using paired-sample t-tests (two-tailed, p<0.05) without correction for multiple comparisons.

      To assess the relationship between induced neuroplasticity and motor sequence learning, and the relationship between cortical excitability and cognitive task performance, we calculated Pearson correlations. For the first correlation, we used individual grand-averaged MEP amplitudes obtained from anodal and cathodal tDCS pooled for the time-points between 0, and 20 min after interventions, and individual motor learning performance (i.e. BL6-5 and BL6-7 RT difference) across sleep conditions. For the second correlation, we used individual grand-averaged MEP amplitudes obtained from each TMS protocol and individual accuracy/RT obtained from each task across sleep conditions. No correction for multiple comparisons was done for correlational analyses as these were secondary exploratory analyses."

      There are also inconsistencies like: " The average levels of cortisol and melatonin were lower after sleep deprivation vs sufficient sleep (cortisol: 3.51{plus minus}2.20 vs 4.85{plus minus}3.23, p=0.05; melatonin 10.50{plus minus}10.66 vs 16.07{plus minus}14.94, p=0.16)"

      The p-values are not significant here?

      Thank you for your comment. The p-value was only marginally significant for the cortisol level changes. We clarified this in the revision. Please see below:

      Revised text, page 19:

      "The average levels of cortisol and melatonin were numerically lower after sleep deprivation vs sufficient sleep (cortisol: 3.51±2.20 vs 4.85±3.23, p=0.056; melatonin 10.50±10.66 vs 16.07±14.94, p=0.16), but these differences were only marginally significant for the cortisol level and showed only a trendwise reduction for melatonin."

      Reviewer #2:

      This study represents the currently most comprehensive characterization of indices of synaptic plasticity and cognition in humans in the context of sleep deprivation. It provides further support for an interplay between the time course of synaptic strength/cortical excitability (homeostatic plasticity) and the inducibility of associative synaptic LTP- LTD-like plasticity. The study is of great interest, the translation of findings is of potential clinical relevance, the methods appear to be solid and the results are mostly convincing. I believe that the writing of the manuscript should be improved (e.g. quality of referencing), clearer framework and hypothesis, reduction of redundancies, and more precise discussion. However, all of these points can be addressed since the overall concept, design, conduct and findings are convincing and of great interest to the field of sleep research, but also more broader to the neurosciences, to clinicians and the public.

      We appreciate the reviewer's time for carefully reading our work and providing important suggestions/recommendations.

    1. Author Response:

      Reviewer #1 (Public Review):

      In this article, Bollmann and colleagues demonstrated both theoretically and experimentally that blood vessels could be targeted at the mesoscopic scale with time-of-flight magnetic resonance imaging (TOF-MRI). With a mathematical model that includes partial voluming effects explicitly, they outline how small voxels reduce the dependency of blood dwell time, a key parameter of the TOF sequence, on blood velocity. Through several experiments on three human subjects, they show that increasing resolution improves contrast and evaluate additional issues such as vessel displacement artifacts and the separation of veins and arteries.

      The overall presentation of the main finding, that small voxels are beneficial for mesoscopic pial vessels, is clear and well discussed, although difficult to grasp fully without a good prior understanding of the underlying TOF-MRI sequence principles. Results are convincing, and some of the data both raw and processed have been provided publicly. Visual inspection and comparisons of different scans are provided, although no quantification or statistical comparison of the results are included.

      Potential applications of the study are varied, from modeling more precisely functional MRI signals to assessing the health of small vessels. Overall, this article reopens a window on studying the vasculature of the human brain in great detail, for which studies have been surprisingly limited until recently.

      In summary, this article provides a clear demonstration that small pial vessels can indeed be imaged successfully with extremely high voxel resolution. There are however several concerns with the current manuscript, hopefully addressable within the study.

      Thank you very much for this encouraging review. While smaller voxel sizes theoretically benefit all blood vessels, we are specifically targeting the (small) pial arteries here, as the inflow-effect in veins is unreliable and susceptibility-based contrasts are much more suited for this part of the vasculature. (We have clarified this in the revised manuscript by substituting ‘vessel’ with ‘artery’ wherever appropriate.) Using a partial-volume model and a relative contrast formulation, we find that the blood delivery time is not the limiting factor when imaging pial arteries, but the voxel size is. Taking into account the comparatively fast blood velocities even in pial arteries with diameters ≤ 200 µm (using t_delivery=l_voxel/v_blood), we find that blood dwell times are sufficiently long for the small voxel sizes considered here to employ the simpler formulation of the flow-related enhancement effect. In other words, small voxels eliminate blood dwell time as a consideration for the blood velocities expected for pial arteries.

      We have extended the description of the TOF-MRA sequence in the revised manuscript, and all data and simulations/analyses presented in this manuscript are now publicly available at https://osf.io/nr6gc/ and https://gitlab.com/SaskiaB/pialvesseltof.git, respectively. This includes additional quantifications of the FRE effect for large vessels (adding to the assessment for small vessels already included), and the effect of voxel size on vessel segmentations.

      Main points:

      1) The manuscript needs clarifying through some additional background information for a readership wider than expert MR physicists. The TOF-MRA sequence and its underlying principles should be introduced first thing, even before discussing vascular anatomy, as it is the key to understanding what aspects of blood physiology and MRI parameters matter here. MR physics shorthand terms should be avoided or defined, as 'spins' or 'relaxation' are not obvious to everybody. The relationship between delivery time and slab thickness should be made clear as well.

      Thank you for this valuable comment that the Theory section is perhaps not accessible for all readers. We have adapted the manuscript in several locations to provide more background information and details on time-of-flight contrast. We found, however, that there is no concise way to first present the MR physics part and then introduce the pial arterial vasculature, as the optimization presented therein is targeted towards this structure. To address this comment, we have therefore opted to provide a brief introduction to TOF-MRA first in the Introduction, and then a more in-depth description in the Theory section.

      Introduction section:

      "Recent studies have shown the potential of time-of-flight (TOF) based magnetic resonance angiography (MRA) at 7 Tesla (T) in subcortical areas (Bouvy et al., 2016, 2014; Ladd, 2007; Mattern et al., 2018; Schulz et al., 2016; von Morze et al., 2007). In brief, TOF-MRA uses the high signal intensity caused by inflowing water protons in the blood to generate contrast, rather than an exogenous contrast agent. By adjusting the imaging parameters of a gradient-recalled echo (GRE) sequence, namely the repetition time (T_R) and flip angle, the signal from static tissue in the background can be suppressed, and high image intensities are only present in blood vessels freshly filled with non-saturated inflowing blood. As the blood flows through the vasculature within the imaging volume, its signal intensity slowly decreases. (For a comprehensive introduction to the principles of MRA, see for example Carr and Carroll (2012)). At ultra-high field, the increased signal-to-noise ratio (SNR), the longer T_1 relaxation times of blood and grey matter, and the potential for higher resolution are key benefits (von Morze et al., 2007)."

      Theory section:

      "Flow-related enhancement

      Before discussing the effects of vessel size, we briefly revisit the fundamental theory of the flow-related enhancement effect used in TOF-MRA. Taking into account the specific properties of pial arteries, we will then extend the classical description to this new regime. In general, TOF-MRA creates high signal intensities in arteries using inflowing blood as an endogenous contrast agent. The object magnetization—created through the interaction between the quantum mechanical spins of water protons and the magnetic field—provides the signal source (or magnetization) accessed via excitation with radiofrequency (RF) waves (called RF pulses) and the reception of ‘echo’ signals emitted by the sample around the same frequency. The T1-contrast in TOF-MRA is based on the difference in the steady-state magnetization of static tissue, which is continuously saturated by RF pulses during the imaging, and the increased or enhanced longitudinal magnetization of inflowing blood water spins, which have experienced no or few RF pulses. In other words, in TOF-MRA we see enhancement for blood that flows into the imaging volume."

      "Since the coverage or slab thickness in TOF-MRA is usually kept small to minimize blood delivery time by shortening the path-length of the vessel contained within the slab (Parker et al., 1991), and because we are focused here on the pial vasculature, we have limited our considerations to a maximum blood delivery time of 1000 ms, with values of few hundreds of milliseconds being more likely."

      2) The main discussion of higher resolution leading to improvements rather than loss presented here seems a bit one-sided: for a more objective understanding of the differences it would be worth to explicitly derive the 'classical' treatment and show how it leads to different conclusions than the present one. In particular, the link made in the discussion between using relative magnetization and modeling partial voluming seems unclear, as both are unrelated. One could also argue that in theory higher resolution imaging is always better, but of course there are practical considerations in play: SNR, dynamics of the measured effect vs speed of acquisition, motion, etc. These issues are not really integrated into the model, even though they provide strong constraints on what can be done. It would be good to at least discuss the constraints that 140 or 160 microns resolution imposes on what is achievable at present.

      Thank you for this excellent suggestion. We found it instructive to illustrate the different effects separately, i.e. relative vs. absolute FRE, and then partial volume vs. no-partial volume effects. In response to comment R2.8 of Reviewer 2, we also clarified the derivation of the relative FRE vs the ‘classical’ absolute FRE (please see R2.8). Accordingly, the manuscript now includes the theoretical derivation in the Theory section and an explicit demonstration of how the classical treatment leads to different conclusions in the Supplementary Material. The important insight gained in our work is that only when considering relative FRE and partial-volume effects together, can we conclude that smaller voxels are advantageous. We have added the following section in the Supplementary Material:

      "Effect of FRE Definition and Interaction with Partial-Volume Model

      For the definition of the FRE effect employed in this study, we used a measure of relative FRE (Al-Kwifi et al., 2002) in combination with a partial-volume model (Eq. 6). To illustrate the implications of these two effects, as well as their interaction, we have estimated the relative and absolute FRE for an artery with a diameter of 200 µm or 2 000 µm (i.e. no partial-volume effects at the centre of the vessel). The absolute FRE expression explicitly takes the voxel volume into account, and so instead of Eq. (6) for the relative FRE we used"

      Eq. (1)

      "Note that the division by M_zS^tissue⋅l_voxel^3 to obtain the relative FRE from this expression removes the contribution of the total voxel volume (l_voxel^3). Supplementary Figure 2 shows that, when partial volume effects are present, the highest relative FRE arises in voxels with the same size as or smaller than the vessel diameter (Supplementary Figure 2A), whereas the absolute FRE increases with voxel size (Supplementary Figure 2C). If no partial-volume effects are present, the relative FRE becomes independent of voxel size (Supplementary Figure 2B), whereas the absolute FRE increases with voxel size (Supplementary Figure 2D). While the partial-volume effects for the relative FRE are substantial, they are much more subtle when using the absolute FRE and do not alter the overall characteristics."

      Supplementary Figure 2: Effect of voxel size and blood delivery time on the relative flow-related enhancement (FRE) using either a relative (A,B) (Eq. (3)) or an absolute (C,D) (Eq. (12)) FRE definition assuming a pial artery diameter of 200 μm (A,C) or 2 000 µm, i.e. no partial-volume effects at the central voxel of this artery considered here.

      In addition, we have also clarified the contribution of the two definitions and their interaction in the Discussion section. Following the suggestion of Reviewer 2, we have extended our interpretation of relative FRE. In brief, absolute FRE is closely related to the physical origin of the contrast, whereas relative FRE is much more concerned with the “segmentability” of a vessel (please see R2.8 for more details):

      "Extending classical FRE treatments to the pial vasculature

      There are several major modifications in our approach to this topic that might explain why, in contrast to predictions from classical FRE treatments, it is indeed possible to image pial arteries. For instance, the definition of vessel contrast or flow-related enhancement is often stated as an absolute difference between blood and tissue signal (Brown et al., 2014a; Carr and Carroll, 2012; Du et al., 1993, 1996; Haacke et al., 1990; Venkatesan and Haacke, 1997). Here, however, we follow the approach of Al-Kwifi et al. (2002) and consider relative contrast. While this distinction may seem to be semantic, the effect of voxel volume on FRE for these two definitions is exactly opposite: Du et al. (1996) concluded that larger voxel size increases the (absolute) vessel-background contrast, whereas here we predict an increase in relative FRE for small arteries with decreasing voxel size. Therefore, predictions of the depiction of small arteries with decreasing voxel size differ depending on whether one is considering absolute contrast, i.e. difference in longitudinal magnetization, or relative contrast, i.e. contrast differences independent of total voxel size. Importantly, this prediction changes for large arteries where the voxel contains only vessel lumen, in which case the relative FRE remains constant across voxel sizes, but the absolute FRE increases with voxel size (Supplementary Figure 2). Overall, the interpretations of relative and absolute FRE differ, and one measure may be more appropriate for certain applications than the other. Absolute FRE describes the difference in magnetization and is thus tightly linked to the underlying physical mechanism. Relative FRE, however, describes the image contrast and segmentability. If blood and tissue magnetization are equal, both contrast measures would equal zero and indicate that no contrast difference is present. However, when there is signal in the vessel and as the tissue magnetization approaches zero, the absolute FRE approaches the blood magnetization (assuming no partial-volume effects), whereas the relative FRE approaches infinity. While this infinite relative FRE does not directly relate to the underlying physical process of ‘infinite’ signal enhancement through inflowing blood, it instead characterizes the segmentability of the image in that an image with zero intensity in the background and non-zero values in the structures of interest can be segmented perfectly and trivially. Accordingly, numerous empirical observations (Al-Kwifi et al., 2002; Bouvy et al., 2014; Haacke et al., 1990; Ladd, 2007; Mattern et al., 2018; von Morze et al., 2007) and the data provided here (Figure 5, 6 and 7) have shown the benefit of smaller voxel sizes if the aim is to visualize and segment small arteries."

      Note that our formulation of the FRE—even without considering SNR—does not suggest that higher resolution is always better, but instead should be matched to the size of the target arteries:

      "Importantly, note that our treatment of the FRE does not suggest that an arbitrarily small voxel size is needed, but instead that voxel sizes appropriate for the arterial diameter of interest are beneficial (in line with the classic “matched-filter” rationale (North, 1963)). Voxels smaller than the arterial diameter would not yield substantial benefits (Figure 5) and may result in SNR reductions that would hinder segmentation performance."

      Further, we have also extended the concluding paragraph of the Imaging limitation section to also include a practical perspective:

      "In summary, numerous theoretical and practical considerations remain for optimal imaging of pial arteries using time-of-flight contrast. Depending on the application, advanced displacement artefact compensation strategies may be required, and zero-filling could provide better vessel depiction. Further, an optimal trade-off between SNR, voxel size and acquisition time needs to be found. Currently, the partial-volume FRE model only considers voxel size, and—as we reduced the voxel size in the experiments—we (partially) compensated the reduction in SNR through longer scan times. This, ultimately, also required the use of prospective motion correction to enable the very long acquisition times necessary for 140 µm isotropic voxel size. Often, anisotropic voxels are used to reduce acquisition time and increase SNR while maintaining in-plane resolution. This may indeed prove advantageous when the (also highly anisotropic) arteries align with the anisotropic acquisition, e.g. when imaging the large supplying arteries oriented mostly in the head-foot direction. In the case of pial arteries, however, there is not preferred orientation because of the convoluted nature of the pial arterial vasculature encapsulating the complex folding of the cortex (see section Anatomical architecture of the pial arterial vasculature). A further reduction in voxel size may be possible in dedicated research settings utilizing even longer acquisition times and/or larger acquisition volumes to maintain SNR. However, if acquisition time is limited, voxel size and SNR need to be carefully balanced against each other."

      3) The article seems to imply that TOF-MRA is the only adequate technique to image brain vasculature, while T2 mapping, UHF T1 mapping (see e.g. Choi et al., https://doi.org/10.1016/j.neuroimage.2020.117259) phase (e.g. Fan et al., doi:10.1038/jcbfm.2014.187), QSM (see e.g. Huck et al., https://doi.org/10.1007/s00429-019-01919-4), or a combination (Bernier et al., https://doi.org/10.1002/hbm.24337​, Ward et al., https://doi.org/10.1016/j.neuroimage.2017.10.049) all depict some level of vascular detail. It would be worth quickly reviewing the different effects of blood on MRI contrast and how those have been used in different approaches to measure vasculature. This would in particular help clarify the experiment combining TOF with T2 mapping used to separate arteries from veins (more on this question below).

      We apologize if we inadvertently created the impression that TOF-MRA is a suitable technique to image the complete brain vasculature, and we agree that susceptibility-based methods are much more suitable for venous structures. As outlined above, we have revised the manuscript in various sections to indicate that it is the pial arterial vasculature we are targeting. We have added a statement on imaging the venous vasculature in the Discussion section. Please see our response below regarding the use of T2* to separate arteries and veins.

      "The advantages of imaging the pial arterial vasculature using TOF-MRA without an exogenous contrast agent lie in its non-invasiveness and the potential to combine these data with various other structural and functional image contrasts provided by MRI. One common application is to acquire a velocity-encoded contrast such as phase-contrast MRA (Arts et al., 2021; Bouvy et al., 2016). Another interesting approach utilises the inherent time-of-flight contrast in magnetization-prepared two rapid acquisition gradient echo (MP2RAGE) images acquired at ultra-high field that simultaneously acquires vasculature and structural data, albeit at lower achievable resolution and lower FRE compared to the TOF-MRA data in our study (Choi et al., 2020). In summary, we expect high-resolution TOF-MRA to be applicable also for group studies to address numerous questions regarding the relationship of arterial topology and morphometry to the anatomical and functional organization of the brain, and the influence of arterial topology and morphometry on brain hemodynamics in humans. In addition, imaging of the pial venous vasculature—using susceptibility-based contrasts such as T2-weighted magnitude (Gulban et al., 2021) or phase imaging (Fan et al., 2015), susceptibility-weighted imaging (SWI) (Eckstein et al., 2021; Reichenbach et al., 1997) or quantitative susceptibility mapping (QSM) (Bernier et al., 2018; Huck et al., 2019; Mattern et al., 2019; Ward et al., 2018)—would enable a comprehensive assessment of the complete cortical vasculature and how both arteries and veins shape brain hemodynamics.*"

      4) The results, while very impressive, are mostly qualitative. This seems a missed opportunity to strengthen the points of the paper: given the segmentations already made, the amount/density of detected vessels could be compared across scans for the data of Fig. 5 and 7. The minimum distance between vessels could be measured in Fig. 8 to show a 2D distribution and/or a spatial map of the displacement. The number of vessels labeled as veins instead of arteries in Fig. 9 could be given.

      We fully agree that estimating these quantitative measures would be very interesting; however, this would require the development of a comprehensive analysis framework, which would considerably shift the focus of this paper from data acquisition and flow-related enhancement to data analysis. As noted in the discussion section Challenges for vessel segmentation algorithms, ‘The vessel segmentations presented here were performed to illustrate the sensitivity of the image acquisition to small pial arteries’, because the smallest arteries tend to be concealed in the maximum intensity projections. Further, the interpretation of these measures is not straightforward. For example, the number of detected vessels for the artery depicted in Figure 5 does not change across resolutions, but their length does. We have therefore estimated the relative increase in skeleton length across resolutions for Figures 5 and 7. However, these estimates are not only a function of the voxel size but also of the underlying vasculature, i.e. the number of arteries with a certain diameter present, and may thus not generalise well to enable quantitative predictions of the improvement expected from increased resolutions. We have added an illustration of these analyses in the Supplementary Material, and the following additions in the Methods, Results and Discussion sections.

      "For vessel segmentation, a semi-automatic segmentation pipeline was implemented in Matlab R2020a (The MathWorks, Natick, MA) using the UniQC toolbox (Frässle et al., 2021): First, a brain mask was created through thresholding which was then manually corrected in ITK-SNAP (http://www.itksnap.org/) (Yushkevich et al., 2006) such that pial vessels were included. For the high-resolution TOF data (Figures 6 and 7, Supplementary Figure 4), denoising to remove high frequency noise was performed using the implementation of an adaptive non-local means denoising algorithm (Manjón et al., 2010) provided in DenoiseImage within the ANTs toolbox, with the search radius for the denoising set to 5 voxels and noise type set to Rician. Next, the brain mask was applied to the bias corrected and denoised data (if applicable). Then, a vessel mask was created based on a manually defined threshold, and clusters with less than 10 or 5 voxels for the high- and low-resolution acquisitions, respectively, were removed from the vessel mask. Finally, an iterative region-growing procedure starting at each voxel of the initial vessel mask was applied that successively included additional voxels into the vessel mask if they were connected to a voxel which was already included and above a manually defined threshold (which was slightly lower than the previous threshold). Both thresholds were applied globally but manually adjusted for each slab. No correction for motion between slabs was applied. The Matlab code describing the segmentation algorithm as well as the analysis of the two-echo TOF acquisition outlined in the following paragraph are also included in our github repository (https://gitlab.com/SaskiaB/pialvesseltof.git). To assess the data quality, maximum intensity projections (MIPs) were created and the outline of the segmentation MIPs were added as an overlay. To estimate the increased detection of vessels with higher resolutions, we computed the relative increase in the length of the segmented vessels for the data presented in Figure 5 (0.8 mm, 0.5 mm, 0.4 mm and 0.3 mm isotropic voxel size) and Figure 7 (0.16 mm and 0.14 mm isotropic voxel size) by computing the skeleton using the bwskel Matlab function and then calculating the skeleton length as the number of voxels in the skeleton multiplied by the voxel size."

      "To investigate the effect of voxel size on vessel FRE, we acquired data at four different voxel sizes ranging from 0.8 mm to 0.3 mm isotropic resolution, adjusting only the encoding matrix, with imaging parameters being otherwise identical (FOV, TR, TE, flip angle, R, slab thickness, see section Data acquisition). The total acquisition time increases from less than 2 minutes for the lowest resolution scan to over 6 minutes for the highest resolution scan as a result. Figure 5 shows thin maximum intensity projections of a small vessel. While the vessel is not detectable at the largest voxel size, it slowly emerges as the voxel size decreases and approaches the vessel size. Presumably, this is driven by the considerable increase in FRE as seen in the single slice view (Figure 5, small inserts). Accordingly, the FRE computed from the vessel mask for the smallest part of the vessel (Figure 5, red mask) increases substantially with decreasing voxel size. More precisely, reducing the voxel size from 0.8 mm, 0.5 mm or 0.4 mm to 0.3 mm increases the FRE by 2900 %, 165 % and 85 %, respectively. Assuming a vessel diameter of 300 μm, the partial-volume FRE model (section Introducing a partial-volume model) would predict similar ratios of 611%, 178% and 78%. However, as long as the vessel is larger than the voxel (Figure 5, blue mask), the relative FRE does not change with resolution (see also Effect of FRE Definition and Interaction with Partial-Volume Model in the Supplementary Material). To illustrate the gain in sensitivity to detect smaller arteries, we have estimated the relative increase of the total length of the segmented vasculature (Supplementary Figure 9): reducing the voxel size from 0.8 mm to 0.5 mm isotropic increases the skeleton length by 44 %, reducing the voxel size from 0.5 mm to 0.4 mm isotropic increases the skeleton length by 28 %, and reducing the voxel size from 0.4 mm to 0.3 mm isotropic increases the skeleton length by 31 %. In summary, when imaging small pial arteries, these data support the hypothesis that it is primarily the voxel size, not the blood delivery time, which determines whether vessels can be resolved."

      "Indeed, the reduction in voxel volume by 33 % revealed additional small branches connected to larger arteries (see also Supplementary Figure 8). For this example, we found an overall increase in skeleton length of 14 % (see also Supplementary Figure 9)."

      "We therefore expect this strategy to enable an efficient image acquisition without the need for additional venous suppression RF pulses. Once these challenges for vessel segmentation algorithms are addressed, a thorough quantification of the arterial vasculature can be performed. For example, the skeletonization procedure used to estimate the increase of the total length of the segmented vasculature (Supplementary Figure 9) exhibits errors particularly in the unwanted sinuses and large veins. While they are consistently present across voxel sizes, and thus may have less impact on relative change in skeleton length, they need to be addressed when estimating the absolute length of the vasculature, or other higher-order features such as number of new branches. (Note that we have also performed the skeletonization procedure on the maximum intensity projections to reduce the number of artefacts and obtained comparable results: reducing the voxel size from 0.8 mm to 0.5 mm isotropic increases the skeleton length by 44 % (3D) vs 37 % (2D), reducing the voxel size from 0.5 mm to 0.4 mm isotropic increases the skeleton length by 28 % (3D) vs 26 % (2D), reducing the voxel size from 0.4 mm to 0.3 mm isotropic increases the skeleton length by 31 % (3D) vs 16 % (2D), and reducing the voxel size from 0.16 mm to 0.14 mm isotropic increases the skeleton length by 14 % (3D) vs 24 % (2D).)"

      Supplementary Figure 9: Increase of vessel skeleton length with voxel size reduction. Axial maximum intensity projections for data acquired with different voxel sizes ranging from 0.8 mm to 0.3 mm (TOP) (corresponding to Figure 5) and 0.16 mm to 0.14 mm isotropic (corresponding to Figure 7) are shown. Vessel skeletons derived from segmentations performed for each resolution are overlaid in red. A reduction in voxel size is accompanied by a corresponding increase in vessel skeleton length.

      Regarding further quantification of the vessel displacement presented in Figure 8, we have estimated the displacement using the Horn-Schunck optical flow estimator (Horn and Schunck, 1981; Mustafa, 2016) (https://github.com/Mustafa3946/Horn-Schunck-3D-Optical-Flow). However, the results are dominated by the larger arteries, whereas we are mostly interested in the displacement of the smallest arteries, therefore this quantification may not be helpful.

      Because the theoretical relationship between vessel displacement and blood velocity is well known (Eq. 7), and we have also outlined the expected blood velocity as a function of arterial diameter in Figure 2, which provided estimates of displacements that matched what was found in our data (as reported in our original submission), we believe that the new quantification in this form does not add value to the manuscript. What would be interesting would be to explore the use of this displacement artefact as a measure of blood velocities. This, however, would require more substantial analyses in particular for estimation of the arterial diameter and additional validation data (e.g. phase-contrast MRA). We have outlined this avenue in the Discussion section. What is relevant to the main aim of this study, namely imaging of small pial arteries, is the insight that blood velocities are indeed sufficiently fast to cause displacement artefacts even in smaller arteries. We have clarified this in the Results section:

      "Note that correction techniques exist to remove displaced vessels from the image (Gulban et al., 2021), but they cannot revert the vessels to their original location. Alternatively, this artefact could also potentially be utilised as a rough measure of blood velocity."

      "At a delay time of 10 ms between phase encoding and echo time, the observed displacement of approximately 2 mm in some of the larger vessels would correspond to a blood velocity of 200 mm/s, which is well within the expected range (Figure 2). For the smallest arteries, a displacement of one voxel (0.4 mm) can be observed, indicative of blood velocities of 40 mm/s. Note that the vessel displacement can be observed in all vessels visible at this resolution, indicating high blood velocities throughout much of the pial arterial vasculature. Thus, assuming a blood velocity of 40 mm/s (Figure 2) and a delay time of 5 ms for the high-resolution acquisitions (Figure 6), vessel displacements of 0.2 mm are possible, representing a shift of 1–2 voxels."

      Regarding the number of vessels labelled as veins, please see our response below to R1.5.

      In the main quantification given, the estimation of FRE increase with resolution, it would make more sense to perform the segmentation independently for each scan and estimate the corresponding FRE: using the mask from the highest resolution scan only biases the results. It is unclear also if the background tissue measurement one voxel outside took partial voluming into account (by leaving a one voxel free interface between vessel and background). In this analysis, it would also be interesting to estimate SNR, so you can compare SNR and FRE across resolutions, also helpful for the discussion on SNR.

      The FRE serves as an indicator of the potential performance of any segmentation algorithm (including manual segmentation) (also see our discussion on the interpretation of FRE in our response to R1.2). If we were to segment each scan individually, we would, in the ideal case, always obtain the same FRE estimate, as FRE influences the performance of the segmentation algorithm. In practice, this simply means that it is not possible to segment the vessel in the low-resolution image to its full extent that is visible in the high-resolution image, because the FRE is too low for small vessels. However, we agree with the core point that the reviewer is making, and so to help address this, a valuable addition would be to compare the FRE for the section of a vessel that is visible at all resolutions, where we found—within the accuracy of the transformations and resampling across such vastly different resolutions—that the FRE does not increase any further with higher resolution if the vessel is larger than the voxel size (page 18 and Figure 5). As stated in the Methods section, and as noted by the reviewer, we used the voxels immediately next to the vessel mask to define the background tissue signal level. Any resulting potential partial-volume effects in these background voxels would affect all voxel sizes, introducing a consistent bias that would not impact our comparison. However, inspection of the image data in Figure 5 showed partial-volume effects predominantly within those voxels intersecting the vessel, rather than voxels surrounding the vessel, in agreement with our model of FRE.

      "All imaging data were slab-wise bias-field corrected using the N4BiasFieldCorrection (Tustison et al., 2010) tool in ANTs (Avants et al., 2009) with the default parameters. To compare the empirical FRE across the four different resolutions (Figure 5), manual masks were first created for the smallest part of the vessel in the image with the highest resolution and for the largest part of the vessel in the image with the lowest resolution. Then, rigid-body transformation parameters from the low-resolution to the high-resolution (and the high-resolution to the low-resolution) images were estimated using coregister in SPM (https://www.fil.ion.ucl.ac.uk/spm/), and their inverse was applied to the vessel mask using SPM’s reslice. To calculate the empirical FRE (Eq. (3)), the mean of the intensity values within the vessel mask was used to approximate the blood magnetization, and the mean of the intensity values one voxel outside of the vessel mask was used as the tissue magnetization."

      "To investigate the effect of voxel size on vessel FRE, we acquired data at four different voxel sizes ranging from 0.8 mm to 0.3 mm isotropic resolution, adjusting only the encoding matrix, with imaging parameters being otherwise identical (FOV, TR, TE, flip angle, R, slab thickness, see section Data acquisition). The total acquisition time increases from less than 2 minutes for the lowest resolution scan to over 6 minutes for the highest resolution scan as a result. Figure 5 shows thin maximum intensity projections of a small vessel. While the vessel is not detectable at the largest voxel size, it slowly emerges as the voxel size decreases and approaches the vessel size. Presumably, this is driven by the considerable increase in FRE as seen in the single slice view (Figure 5, small inserts). Accordingly, the FRE computed from the vessel mask for the smallest part of the vessel (Figure 5, red mask) increases substantially with decreasing voxel size. More precisely, reducing the voxel size from 0.8 mm, 0.5 mm or 0.4 mm to 0.3 mm increases the FRE by 2900 %, 165 % and 85 %, respectively. Assuming a vessel diameter of 300 μm, the partial-volume FRE model (section Introducing a partial-volume model) would predict similar ratios of 611%, 178% and 78%. However, if the vessel is larger than the voxel (Figure 5, blue mask), the relative FRE remains constant across resolutions (see also Effect of FRE Definition and Interaction with Partial-Volume Model in the Supplementary Material). To illustrate the gain in sensitivity to smaller arteries, we have estimated the relative increase of the total length of the segmented vasculature (Supplementary Figure 9): reducing the voxel size from 0.8 mm to 0.5 mm isotropic increases the skeleton length by 44 %, reducing the voxel size from 0.5 mm to 0.4 mm isotropic increases the skeleton length by 28 %, and reducing the voxel size from 0.4 mm to 0.3 mm isotropic increases the skeleton length by 31 %. In summary, when imaging small pial arteries, these data support the hypothesis that it is primarily the voxel size, not blood delivery time, which determines whether vessels can be resolved."

      Figure 5: Effect of voxel size on flow-related vessel enhancement. Thin axial maximum intensity projections containing a small artery acquired with different voxel sizes ranging from 0.8 mm to 0.3 mm isotropic are shown. The FRE is estimated using the mean intensity value within the vessel masks depicted on the left, and the mean intensity values of the surrounding tissue. The small insert shows a section of the artery as it lies within a single slice. A reduction in voxel size is accompanied by a corresponding increase in FRE (red mask), whereas no further increase is obtained once the voxel size is equal or smaller than the vessel size (blue mask).

      After many internal discussions, we had to conclude that deducing a meaningful SNR analysis that would benefit the reader was not possible given the available data due to the complex relationship between voxel size and other imaging parameters in practice. In detail, we have reduced the voxel size but at the same time increased the acquisition time by increasing the number of encoding steps—which we have now also highlighted in the manuscript. We have, however, added additional considerations about balancing SNR and segmentation performance. Note that these considerations are not specific to imaging the pial arteries but apply to all MRA acquisitions, and have thus been discussed previously in the literature. Here, we wanted to focus on the novel insights gained in our study. Importantly, while we previously noted that reducing voxel size improves contrast in vessels whose diameters are smaller than the voxel size, we now explicitly acknowledge that, for vessels whose diameters are larger than the voxel size reducing the voxel size is not helpful---since it only reduces SNR without any gain in contrast---and may hinder segmentation performance, and thus become counterproductive.

      "In general, we have not considered SNR, but only FRE, i.e. the (relative) image contrast, assuming that segmentation algorithms would benefit from higher contrast for smaller arteries. Importantly, the acquisition parameters available to maximize FRE are limited, namely repetition time, flip angle and voxel size. SNR, however, can be improved via numerous avenues independent of these parameters (Brown et al., 2014b; Du et al., 1996; Heverhagen et al., 2008; Parker et al., 1991; Triantafyllou et al., 2011; Venkatesan and Haacke, 1997), the simplest being longer acquisition times. If the aim is to optimize a segmentation outcome for a given acquisition time, the trade-off between contrast and SNR for the specific segmentation algorithm needs to be determined (Klepaczko et al., 2016; Lesage et al., 2009; Moccia et al., 2018; Phellan and Forkert, 2017). Our own—albeit limited—experience has shown that segmentation algorithms (including manual segmentation) can accommodate a perhaps surprising amount of noise using prior knowledge and neighborhood information, making these high-resolution acquisitions possible. Importantly, note that our treatment of the FRE does not suggest that an arbitrarily small voxel size is needed, but instead that voxel sizes appropriate for the arterial diameter of interest are beneficial (in line with the classic “matched-filter” rationale (North, 1963)). Voxels smaller than the arterial diameter would not yield substantial benefits (Figure 5) and may result in SNR reductions that would hinder segmentation performance."

      5) The separation of arterial and venous components is a bit puzzling, partly because the methodology used is not fully explained, but also partly because the reasons invoked (flow artefact in large pial veins) do not match the results (many small vessels are included as veins). This question of separating both types of vessels is quite important for applications, so the whole procedure should be explained in detail. The use of short T2 seemed also sub-optimal, as both arteries and veins result in shorter T2 compared to most brain tissues: wouldn't a susceptibility-based measure (SWI or better QSM) provide a better separation? Finally, since the T2* map and the regular TOF map are at different resolutions, masking out the vessels labeled as veins will likely result in the smaller veins being left out.

      We agree that while the technical details of this approach were provided in the Data analysis section, the rationale behind it was only briefly mentioned. We have therefore included an additional section Inflow-artefacts in sinuses and pial veins in the Theory section of the manuscript. We have also extended the discussion of the advantages and disadvantages of the different susceptibility-based contrasts, namely T2, SWI and QSM. While in theory both T2 and QSM should allow the reliable differentiation of arterial and venous blood, we found T2* to perform more robustly, as QSM can fail in many places, e.g., due to the strong susceptibility sources within superior sagittal and transversal sinuses and pial veins and their proximity to the brain surface, dedicated processing is required (Stewart et al., 2022). Further, we have also elaborated in the Discussion section why the interpretation of Figure 9 regarding the absence or presence of small veins is challenging. Namely, the intensity-based segmentation used here provides only an incomplete segmentation even of the larger sinuses, because the overall lower intensity found in veins combined with the heterogeneity of the intensities in veins violates the assumptions made by most vascular segmentation approaches of homogenous, high image intensities within vessels, which are satisfied in arteries (page 29f) (see also the illustration below). Accordingly, quantifying the number of vessels labelled as veins (R1.4a) would provide misleading results, as often only small subsets of the same sinus or vein are segmented.

      "Inflow-artefacts in sinuses and pial veins

      Inflow in large pial veins and the sagittal and transverse sinuses can cause flow-related enhancement in these non-arterial vessels. One common strategy to remove this unwanted signal enhancement is to apply venous suppression pulses during the data acquisition, which saturate bloods spins outside the imaging slab. Disadvantages of this technique are the technical challenges of applying these pulses at ultra-high field due to constraints of the specific absorption rate (SAR) and the necessary increase in acquisition time (Conolly et al., 1988; Heverhagen et al., 2008; Johst et al., 2012; Maderwald et al., 2008; Schmitter et al., 2012; Zhang et al., 2015). In addition, optimal positioning of the saturation slab in the case of pial arteries requires further investigation, and in particular supressing signal from the superior sagittal sinus without interfering in the imaging of the pial arteries vasculature at the top of the cortex might prove challenging. Furthermore, this venous saturation strategy is based on the assumption that arterial blood is traveling head-wards while venous blood is drained foot-wards. For the complex and convoluted trajectory of pial vessels this directionality-based saturation might be oversimplified, particularly when considering the higher-order branches of the pial arteries and veins on the cortical surface. Inspired by techniques to simultaneously acquire a TOF image for angiography and a susceptibility-weighted image for venography (Bae et al., 2010; Deistung et al., 2009; Du et al., 1994; Du and Jin, 2008), we set out to explore the possibility of removing unwanted venous structures from the segmentation of the pial arterial vasculature during data postprocessing. Because arteries filled with oxygenated blood have T2-values similar to tissue, while veins have much shorter T2-values due to the presence of deoxygenated blood (Pauling and Coryell, 1936; Peters et al., 2007; Uludağ et al., 2009; Zhao et al., 2007), we used this criterion to remove vessels with short T2* values from the segmentation (see Data Analysis for details). In addition, we also explored whether unwanted venous structures in the high-resolution TOF images—where a two-echo acquisition is not feasible due to the longer readout—can be removed based on detecting them in a lower-resolution image."

      "Removal of pial veins

      Inflow in large pial veins and the superior sagittal and transverse sinuses can cause a flow-related enhancement in these non-arterial vessels (Figure 9, left). The higher concentration of deoxygenated haemoglobin in these vessels leads to shorter T2 values (Pauling and Coryell, 1936), which can be estimated using a two-echo TOF acquisition (see also Inflow-artefacts in sinuses and pial veins). These vessels can be identified in the segmentation based on their T2 values (Figure 9, left), and removed from the angiogram (Figure 9, right) (Bae et al., 2010; Deistung et al., 2009; Du et al., 1994; Du and Jin, 2008). In particular, the superior and inferior sagittal and the transversal sinuses and large veins which exhibited an inhomogeneous intensity profile and a steep loss of intensity at the slab boundary were identified as non-arterial (Figure 9, left). Further, we also explored the option of removing unwanted venous vessels from the high-resolution TOF image (Figure 7) using a low-resolution two-echo TOF (not shown). This indeed allowed us to remove the strong signal enhancement in the sagittal sinuses and numerous larger veins, although some small veins, which are characterised by inhomogeneous intensity profiles and can be detected visually by experienced raters, remain."

      Figure 9: Removal of non-arterial vessels in time-of-flight imaging. LEFT: Segmentation of arteries (red) and veins (blue) using T_2^ estimates. RIGHT: Time-of-flight angiogram after vein removal.*

      Our approach also assumes that the unwanted veins are large enough that they are also resolved in the low-resolution image. If we consider the source of the FRE effect, it might indeed be exclusively large veins that are present in TOF-MRA data, which would suggest that our assumption is valid. Fundamentally, the FRE depends on the inflow of un-saturated spins into the imaging slab. However, small veins drain capillary beds in the local tissue, i.e. the tissue within the slab. (Note that due to the slice oversampling implemented in our acquisition, spins just above or below the slab will also be excited.) Thus, small veins only contain blood water spins that have experienced a large number of RF pulses due to the long transit time through the pial arterial vasculature, the capillaries and the intracortical venules. Hence, their longitudinal magnetization would be similar to that of stationary tissue. To generate an FRE effect in veins, “pass-through” venous blood from outside the imaging slab is required. This is only available in veins that are passing through the imaging slab, which have much larger diameters. These theoretical considerations are corroborated by the findings in Figure 9, where large disconnected vessels with varying intensity profiles were identified as non-arterial. Due to the heterogenous intensity profiles in large veins and the sagittal and transversal sinuses, the intensity-based segmentation applied here may only label a subset of the vessel lumen, creating the impression of many small veins. This is particularly the case for the straight and inferior sagittal sinus in the bottom slab of Figure 9. Nevertheless, future studies potentially combing anatomical prior knowledge, advanced segmentation algorithms and susceptibility measures would be capable of removing these unwanted veins in post-processing to enable an efficient TOF-MRA image acquisition dedicated to optimally detecting small arteries without the need for additional venous suppression RF pulses.

      6) A more general question also is why this imaging method is limited to pial vessels: at 140 microns, the larger intra-cortical vessels should be appearing (group 6 in Duvernoy, 1981: diameters between 50 and 240 microns). Are there other reasons these vessels are not detected? Similarly, it seems there is no arterial vasculature detected in the white matter here: it is due to the rather superior location of the imaging slab, or a limitation of the method? Likewise, all three results focus on a rather homogeneous region of cerebral cortex, in terms of vascularisation. It would be interesting for applications to demonstrate the capabilities of the method in more complex regions, e.g. the densely vascularised cerebellum, or more heterogeneous regions like the midbrain. Finally, it is notable that all three subjects appear to have rather different densities of vessels, from sparse (participant II) to dense (participant I), with some inhomogeneities in density (frontal region in participant III) and inconsistencies in detection (sinuses absent in participant II). All these points should be discussed.

      While we are aware that the diameter of intracortical arteries has been suggested to be up to 240 µm (Duvernoy et al., 1981), it remains unclear how prevalent intracortical arteries of this size are. For example, note that in a different context in the Duvernoy study (in teh revised manuscript), the following values are mentioned (which we followed in Figure 1):

      “Central arteries of the Iobule always have a large diameter of 260 µ to 280 µ, at their origin. Peripheral arteries have an average diameter of 150 µ to 180 µ. At the cortex surface, all arterioles of 50 µ or less, penetrate the cortex or form anastomoses. The diameter of most of these penetrating arteries is approximately 40 µ.”

      Further, the examinations by Hirsch et al. (2012) (albeit in the macaque brain), showed one (exemplary) intracortical artery belonging to group 6 (Figure 1B), whose diameter appears to be below 100 µm. Given these discrepancies and the fact that intracortical arteries in group 5 only reach 75 µm, we suspect that intracortical arteries with diameters > 140 µm are a very rare occurrence, which we might not have encountered in this data set.

      Similarly, arteries in white matter (Nonaka et al., 2003) and the cerebellum (Duvernoy et al., 1983) are beyond our resolution at the moment. The midbrain is an interesting suggesting, although we believe that the cortical areas chosen here with their gradual reduction in diameter along the vascular tree, provide a better illustration of the effect of voxel size than the rather abrupt reduction in vascular diameter found in the midbrain. We have added the even higher resolution requirements in the discussion section:

      "In summary, we expect high-resolution TOF-MRA to be applicable also for group studies, to address numerous questions regarding the relationship of arterial topology and morphometry to the anatomical and functional organization of the brain, and the influence of arterial topology and morphometry on brain hemodynamics in humans. Notably, we have focused on imaging pial arteries of the human cerebrum; however, other brain structures such as the cerebellum, subcortex and white matter are of course also of interest. While the same theoretical considerations apply, imaging the arterial vasculature in these structures will require even smaller voxel sizes due to their smaller arterial diameters (Duvernoy et al., 1983, 1981; Nonaka et al., 2003)."

      Regarding the apparent sparsity of results from participant II, this is mostly driven by the much smaller coverage in this subject (19.6 mm in Participant II vs. 50 mm and 58 mm in Participant I and III, respectively). The reduction in density in the frontal regions might indeed constitute difference in anatomy or might be driven by the presence or more false-positive veins in Participant I than Participant III in these areas. Following the depiction in Duvernoy et al. (1981), one would not expect large arteries in frontal areas, but large veins are common. Thus, the additional vessels in Participant I in the frontal areas might well be false-positive veins, and their removal would result in similar densities for both participants. Indeed, as pointed out in section Future directions, we would expect a lower arterial density in frontal and posterior areas than in middle areas. The sinuses (and other large false-positive veins) in Participant II have been removed as outlined and discussed in sections Removal of pial veins and Challenges for vessel segmentation algorithms, respectively.

      7) One of the main practical limitations of the proposed method is the use of a very small imaging slab. It is mentioned in the discussion that thicker slabs are not only possible, but beneficial both in terms of SNR and acceleration possibilities. What are the limitations that prevented their use in the present study? With the current approach, what would be the estimated time needed to acquire the vascular map of an entire brain? It would also be good to indicate whether specific processing was needed to stitch together the multiple slab images in Fig. 6-9, S2.

      Time-of-flight acquisitions are commonly performed with thin acquisition slabs, following initial investigations by Parker et al. (1991) to maximise vessel sensitivity and minimize noise. We therefore followed this practice for our initial investigations but wanted to point out in the discussion that thicker slabs might provide several advantages that need to be evaluated in future studies. This would include theoretical and empirical evaluations balancing SNR gains from larger excitation volumes and SNR losses due to more acceleration. For this study, we have chosen the slab thickness such as to keep the acquisition time at a reasonable amount to minimize motion artefacts (as outlined in the Discussion). In addition, due to the extreme matrix sizes in particular for the 0.14 mm acquisition, we were also limited in the number of data points per image that can be indexed. This would require even more substantial changes to the sequence than what we have already performed. With 16 slabs, assuming optimal FOV orientation, full-brain coverage including the cerebellum of 95 % of the population (Mennes et al., 2014) could be achieved with an acquisition time of (16  11 min 42 s = 3 h 7 min 12 s) at 0.16 mm isotropic voxel size. No stitching of the individual slabs was performed, as subject motion was minimal. We have added a corresponding comment in the Data Analysis.

      "Both thresholds were applied globally but manually adjusted for each slab. No correction for motion between slabs was applied as subject motion was minimal. The Matlab code describing the segmentation algorithm as well es the analysis of the two-echo TOF acquisition outlined in the following paragraph are also included in the github repository (https://gitlab.com/SaskiaB/pialvesseltof.git)."

      8) Some researchers and clinicians will argue that you can attain best results with anisotropic voxels, combining higher SNR and higher resolution. It would be good to briefly mention why isotropic voxels are preferred here, and whether anisotropic voxels would make sense at all in this context.

      Anisotropic voxels can be advantageous if the underlying object is anisotropic, e.g. an artery running straight through the slab, which would have a certain diameter (imaged using the high-resolution plane) and an ‘infinite’ elongation (in the low-resolution direction). However, the vessels targeted here can have any orientation and curvature; an anisotropic acquisition could therefore introduce a bias favouring vessels with a particular orientation relative to the voxel grid. Note that the same argument applies when answering the question why a further reduction slab thickness would eventually result in less increase in FRE (section Introducing a partial-volume model). We have added a corresponding comment in our discussion on practical imaging considerations:

      "In summary, numerous theoretical and practical considerations remain for optimal imaging of pial arteries using time-of-flight contrast. Depending on the application, advanced displacement artefact compensation strategies may be required, and zero-filling could provide better vessel depiction. Further, an optimal trade-off between SNR, voxel size and acquisition time needs to be found. Currently, the partial-volume FRE model only considers voxel size, and—as we reduced the voxel size in the experiments—we (partially) compensated the reduction in SNR through longer scan times. This, ultimately, also required the use of prospective motion correction to enable the very long acquisition times necessary for 140 µm isotropic voxel size. Often, anisotropic voxels are used to reduce acquisition time and increase SNR while maintaining in-plane resolution. This may indeed prove advantageous when the (also highly anisotropic) arteries align with the anisotropic acquisition, e.g. when imaging the large supplying arteries oriented mostly in the head-foot direction. In the case of pial arteries, however, there is not preferred orientation because of the convoluted nature of the pial arterial vasculature encapsulating the complex folding of the cortex (see section Anatomical architecture of the pial arterial vasculature). A further reduction in voxel size may be possible in dedicated research settings utilizing even longer acquisition times and a larger field-of-view to maintain SNR. However, if acquisition time is limited, voxel size and SNR need to be carefully balanced against each other."

      Reviewer #2 (Public Review):

      Overview

      This paper explores the use of inflow contrast MRI for imaging the pial arteries. The paper begins by providing a thorough background description of pial arteries, including past studies investigating the velocity and diameter. Following this, the authors consider this information to optimize the contrast between pial arteries and background tissue. This analysis reveals spatial resolution to be a strong factor influencing the contrast of the pial arteries. Finally, experiments are performed on a 7T MRI to investigate: the effect of spatial resolution by acquiring images at multiple resolutions, demonstrate the feasibility of acquiring ultrahigh resolution 3D TOF, the effect of displacement artifacts, and the prospect of using T2* to remove venous voxels.

      Impression

      There is certainly interest in tools to improve our understanding of the architecture of the small vessels of the brain and this work does address this. The background description of the pial arteries is very complete and the manuscript is very well prepared. The images are also extremely impressive, likely benefiting from motion correction, 7T, and a very long scan time. The authors also commit to open science and provide the data in an open platform. Given this, I do feel the manuscript to be of value to the community; however, there are concerns with the methods for optimization, the qualitative nature of the experiments, and conclusions drawn from some of the experiments.

      Specific Comments :

      1) Figure 3 and Theory surrounding. The optimization shown in Figure 3 is based fixing the flip angle or the TR. As is well described in the literature, there is a strong interdependency of flip angle and TR. This is all well described in literature dating back to the early 90s. While I think it reasonable to consider these effects in optimization, the language needs to include this interdependency or simply reference past work and specify how the flip angle was chosen. The human experiments do not include any investigation of flip angle or TR optimization.

      We thank the reviewer for raising this valuable point, and we fully agree that there is an interdependency between these two parameters. To simplify our optimization, we did fix one parameter value at a time, but in the revised manuscript we clarified that both parameters can be optimized simultaneously. Importantly, a large range of parameter values will result in a similar FRE in the small artery regime, which is illustrated in the optimization provided in the main text. We have therefore chosen the repetition time based on encoding efficiency and then set a corresponding excitation flip angle. In addition, we have also provided additional simulations in the supplementary material outlining the interdependency for the case of pial arteries.

      "Optimization of repetition time and excitation flip angle

      As the main goal of the optimisation here was to start within an already established parameter range for TOF imaging at ultra-high field (Kang et al., 2010; Stamm et al., 2013; von Morze et al., 2007), we only needed to then further tailor these for small arteries by considering a third parameter, namely the blood delivery time. From a practical perspective, a TR of 20 ms as a reference point was favourable, as it offered a time-efficient readout minimizing wait times between excitations but allowing low encoding bandwidths to maximize SNR. Due to the interdependency of flip angle and repetition time, for any one blood delivery time any FRE could (in theory) be achieved. For example, a similar FRE curve at 18 ° flip angle and 5 ms TR can also be achieved at 28 ° flip angle and 20 ms TR; or the FRE curve at 18 ° flip angle and 30 ms TR is comparable to the FRE curve at 8 ° flip angle and 5 ms TR (Supplementary Figure 3 TOP). In addition, the difference between optimal parameter settings diminishes for long blood delivery times, such that at a blood delivery time of 500 ms (Supplementary Figure 3 BOTTOM), the optimal flip angle at a TR of 15 ms, 20 ms or 25 ms would be 14 °, 16 ° and 18 °, respectively. This is in contrast to a blood delivery time of 100 ms, where the optimal flip angles would be 32 °, 37 ° and 41 °. In conclusion, in the regime of small arteries, long TR values in combination with low flip angles ensure flow-related enhancement at blood delivery times of 200 ms and above, and within this regime there are marginal gains by further optimizing parameter values and the optimal values are all similar."

      Supplementary Figure 3: Optimal imaging parameters for small arteries. This assessment follows the simulations presented in Figure 3, but in addition shows the interdependency for the corresponding third parameter (either flip angle or repetition time). TOP: Flip angles close to the Ernst angle show only a marginal flow-related enhancement; however, the influence of the blood delivery time decreases further (LEFT). As the flip angle increases well above the values used in this study, the flow-related enhancement in the small artery regime remains low even for the longer repetition times considered here (RIGHT). BOTTOM: The optimal excitation flip angle shows reduced variability across repetition times in the small artery regime compared to shorter blood delivery times.

      "Based on these equations, optimal T_R and excitation flip angle values (θ) can be calculated for the blood delivery times under consideration (Figure 3). To better illustrate the regime of small arteries, we have illustrated the effect of either flip angle or T_R while keeping the other parameter values fixed to the value that was ultimately used in the experiments; although both parameters can also be optimized simultaneously (Haacke et al., 1990). Supplementary Figure 3 further delineates the interdependency between flip angle and T_R within a parameter range commonly used for TOF imaging at ultra-high field (Kang et al., 2010; Stamm et al., 2013; von Morze et al., 2007). Note how longer T_R values still provide an FRE effect even at very long blood delivery times, whereas using shorter T_R values can suppress the FRE effect (Figure 3, left). Similarly, at lower flip angles the FRE effect is still present for long blood delivery times, but it is not available anymore at larger flip angles, which, however, would give maximum FRE for shorter blood delivery times (Figure 3, right). Due to the non-linear relationships of both blood delivery time and flip angle with FRE, the optimal imaging parameters deviate considerably when comparing blood delivery times of 100 ms and 300 ms, but the differences between 300 ms and 1000 ms are less pronounced. In the following simulations and measurements, we have thus used a T_R value of 20 ms, i.e. a value only slightly longer than the readout of the high-resolution TOF acquisitions, which allowed time-efficient data acquisition, and a nominal excitation flip angle of 18°. From a practical standpoint, these values are also favorable as the low flip angle reduces the specific absorption rate (Fiedler et al., 2018) and the long T_R value decreases the potential for peripheral nerve stimulation (Mansfield and Harvey, 1993)."

      2) Figure 4 and Theory surrounding. A major limitation of this analysis is the lack of inclusion of noise in the analysis. I believe the results to be obvious that the FRE will be modulated by partial volume effects, here described quadratically by assuming the vessel to pass through the voxel. This would substantially modify the analysis, with a shift towards higher voxel volumes (scan time being equal). The authors suggest the FRE to be the dominant factor effecting segmentation; however, segmentation is limited by noise as much as contrast.

      We of course agree with the reviewer that contrast-to-noise ratio is a key factor that determines the detection of vessels and the quality of the segmentation, however there are subtleties regarding the exact inter-relationship between CNR, resolution, and segmentation performance.

      The main purpose of Figure 4 is not to provide a trade-off between flow-related enhancement and signal-to-noise ratio—in particular as SNR is modulated by many more factors than voxel size alone, e.g. acquisition time, coil geometry and instrumentation—but to decide whether the limiting factor for imaging pial arteries is the reduction in flow-related enhancement due to long blood delivery times (which is the explanation often found in the literature (Chen et al., 2018; Haacke et al., 1990; Masaryk et al., 1989; Mut et al., 2014; Park et al., 2020; Parker et al., 1991; Wilms et al., 2001; Wright et al., 2013)) or due to partial volume effects. Furthermore, when reducing voxel size one will also likely increase the number of encoding steps to maintain the imaging coverage (i.e., the field-of-view) and so the relationship between voxel size and SNR in practice is not straightforward. Therefore, we had to conclude that deducing a meaningful SNR analysis that would benefit the reader was not possible given the available data due to the complex relationship between voxel size and other imaging parameters. Note that these considerations are not specific to imaging the pial arteries but apply to all MRA acquisitions, and have thus been discussed previously in the literature. Here, we wanted to focus on the novel insights gained in our study, namely that it provides an expression for how relative FRE contrast changes with voxel size with some assumptions that apply for imaging pial arteries.

      Further, depending on the definition of FRE and whether partial-volume effects are included (see also our response to R2.8), larger voxel volumes have been found to be theoretically advantageous even when only considering contrast (Du et al., 1996; Venkatesan and Haacke, 1997), which is not in line with empirical observations (Al-Kwifi et al., 2002; Bouvy et al., 2014; Haacke et al., 1990; Ladd, 2007; Mattern et al., 2018; von Morze et al., 2007).

      The notion that vessel segmentation algorithms perform well on noisy data but poorly on low-contrast data was mainly driven by our own experiences. However, we still believe that the assumption that (all) segmentation algorithms are linearly dependent on contrast and noise (which the formulation of a contrast-to-noise ratio presumes) is similarly not warranted. Indeed, the necessary trade-off between FRE and SNR might be specific to the particular segmentation algorithm being used than a general property of the acquisition. Please also note that our analysis of the FRE does not suggest that an arbitrarily high resolution is needed. Importantly, while we previously noted that reducing voxel size improves contrast in vessels whose diameters are smaller than the voxel size, we now explicitly acknowledge that, for vessels whose diameters are larger than the voxel size reducing the voxel size is not helpful---since it only reduces SNR without any gain in contrast---and may hinder segmentation performance, and thus become counterproductive. But we take the reviewer’s point and also acknowledge that these intricacies need to be mentioned, and therefore we have rephrased the statement in the discussion in the following way:

      "In general, we have not considered SNR, but only FRE, i.e. the (relative) image contrast, assuming that segmentation algorithms would benefit from higher contrast for smaller arteries. Importantly, the acquisition parameters available to maximize FRE are limited, namely repetition time, flip angle and voxel size. SNR, however, can be improved via numerous avenues independent of these parameters (Brown et al., 2014b; Du et al., 1996; Heverhagen et al., 2008; Parker et al., 1991; Triantafyllou et al., 2011; Venkatesan and Haacke, 1997), the simplest being longer acquisition times. If the aim is to optimize a segmentation outcome for a given acquisition time, the trade-off between contrast and SNR for the specific segmentation algorithm needs to be determined (Klepaczko et al., 2016; Lesage et al., 2009; Moccia et al., 2018; Phellan and Forkert, 2017). Our own—albeit limited—experience has shown that segmentation algorithms (including manual segmentation) can accommodate a perhaps surprising amount of noise using prior knowledge and neighborhood information, making these high-resolution acquisitions possible. Importantly, note that our treatment of the FRE does not suggest that an arbitrarily small voxel size is needed, but instead that voxel sizes appropriate for the arterial diameter of interest are beneficial (in line with the classic “matched-filter” rationale (North, 1963)). Voxels smaller than the arterial diameter would not yield substantial benefits (Figure 5) and may result in SNR reductions that would hinder segmentation performance."

      3) Page 11, Line 225. "only a fraction of the blood is replaced" I think the language should be reworded. There are certainly water molecules in blood which have experience more excitation B1 pulses due to the parabolic flow upstream and the temporal variation in flow. There is magnetization diffusion which reduces the discrepancy; however, it seems pertinent to just say the authors assume the signal is represented by the average arrival time. This analysis is never verified and is only approximate anyways. The "blood dwell time" is also an average since voxels near the wall will travel more slowly. Overall, I recommend reducing the conjecture in this section.

      We fully agree that our treatment of the blood dwell time does not account for the much more complex flow patterns found in cortical arteries. However, our aim was not do comment on these complex patterns, but to help establish if, in the simplest scenario assuming plug flow, the often-mentioned slow blood flow requires multiple velocity compartments to describe the FRE (as is commonly done for 2D MRA (Brown et al., 2014a; Carr and Carroll, 2012)). We did not intend to comment on the effects of laminar flow or even more complex flow patterns, which would require a more in-depth treatment. However, as the small arteries targeted here are often just one voxel thick, all signals are indeed integrated within that voxel (i.e. there is no voxel near the wall that travels more slowly), which may average out more complex effects. We have clarified the purpose and scope of this section in the following way:

      "In classical descriptions of the FRE effect (Brown et al., 2014a; Carr and Carroll, 2012), significant emphasis is placed on the effect of multiple “velocity segments” within a slice in the 2D imaging case. Using the simplified plug-flow model, where the cross-sectional profile of blood velocity within the vessel is constant and effects such as drag along the vessel wall are not considered, these segments can be described as ‘disks’ of blood that do not completely traverse through the full slice within one T_R, and, thus, only a fraction of the blood in the slice is replaced. Consequently, estimation of the FRE effect would then need to accommodate contribution from multiple ‘disks’ that have experienced 1 to k RF pulses. In the case of 3D imaging as employed here, multiple velocity segments within one voxel are generally not considered, as the voxel sizes in 3D are often smaller than the slice thickness in 2D imaging and it is assumed that the blood completely traverses through a voxel each T_R. However, the question arises whether this assumption holds for pial arteries, where blood velocity is considerably lower than in intracranial vessels (Figure 2). To answer this question, we have computed the blood dwell time , i.e. the average time it takes the blood to traverse a voxel, as a function of blood velocity and voxel size (Figure 2). For reference, the blood velocity estimates from the three studies mentioned above (Bouvy et al., 2016; Kobari et al., 1984; Nagaoka and Yoshida, 2006) have been added in this plot as horizontal white lines. For the voxel sizes of interest here, i.e. 50–300 μm, blood dwell times are, for all but the slowest flows, well below commonly used repetition times (Brown et al., 2014a; Carr and Carroll, 2012; Ladd, 2007; von Morze et al., 2007). Thus, in a first approximation using the plug-flow model, it is not necessary to include several velocity segments for the voxel sizes of interest when considering pial arteries, as one might expect from classical treatments, and the FRE effect can be described by equations (1) – (3), simplifying our characterization of FRE for these vessels. When considering the effect of more complex flow patterns, it is important to bear in mind that the arteries targeted here are only one-voxel thick, and signals are integrated across the whole artery."

      4) Page 13, Line 260. "two-compartment modelling" I think this section is better labeled "Extension to consider partial volume effects" The compartments are not interacting in any sense in this work.

      Thank you for this suggestion. We have replaced the heading with Introducing a partial-volume model (page 14) and replaced all instances of ‘two-compartment model’ with ‘partial-volume model’.

      5) Page 14, Line 284. "In practice, a reduction in slab …." "reducing the voxel size is a much more promising avenue" There is a fair amount on conjecture here which is not supported by experiments. While this may be true, the authors also use a classical approach with quite thin slabs.

      The slab thickness used in our experiments was mainly limited by the acquisition time and the participants ability to lie still. We indeed performed one measurement with a very experienced participant with a thicker slab, but found that with over 20 minutes acquisition time, motion artefacts were unavoidable. The data presented in Figure 5 were acquired with similar slab thickness, supporting the statement that reducing the voxel size is a promising avenue for imaging small pial arteries. However, we indeed have not provided an empirical comparison of the effect of slab thickness. Nevertheless, we believe it remains useful to make the theoretical argument that due to the convoluted nature of the pial arterial vascular geometry, a reduction in slab thickness may not reduce the acquisition time if no reduction in intra-slab vessel length can be achieved, i.e. if the majority of the artery is still contained in the smaller slab. We have clarified the statement and removed the direct comparison (‘much more’ promising) in the following way:

      "In theory, a reduction in blood delivery time increases the FRE in both regimes, and—if the vessel is smaller than the voxel—so would a reduction in voxel size. In practice, a reduction in slab thickness―which is the default strategy in classical TOF-MRA to reduce blood delivery time―might not provide substantial FRE increases for pial arteries. This is due to their convoluted geometry (see section Anatomical architecture of the pial arterial vasculature), where a reduction in slab thickness may not necessarily reduce the vessel segment length if the majority of the artery is still contained within the smaller slab. Thus, given the small arterial diameter, reducing the voxel size is a promising avenue when imaging the pial arterial vasculature."

      6) Figure 5. These image differences are highly exaggerated by the lack of zero filling (or any interpolation) and the fact that the wildly different. The interpolation should be addressed, and the scan time discrepancy listed as a limitation.

      We have extended the discussion around zero-filling by including additional considerations based on the imaging parameters in Figure 5 and highlighted the substantial differences in voxel volume. Our choice not to perform zero-filling was driven by the open question of what an ‘optimal’ zero-filling factor would be. We have also highlighted the substantial differences in acquisition time when describing the results.

      Changes made to the results section:

      "To investigate the effect of voxel size on vessel FRE, we acquired data at four different voxel sizes ranging from 0.8 mm to 0.3 mm isotropic resolution, adjusting only the encoding matrix, with imaging parameters being otherwise identical (FOV, TR, TE, flip angle, R, slab thickness, see section Data acquisition). The total acquisition time increases from less than 2 minutes for the lowest resolution scan to over 6 minutes for the highest resolution scan as a result."

      Changes made to the discussion section:

      "Nevertheless, slight qualitative improvements in image appearance have been reported for higher zero-filling factors (Du et al., 1994), presumably owing to a smoother representation of the vessels (Bartholdi and Ernst, 1973). In contrast, Mattern et al. (2018) reported no improvement in vessel contrast for their high-resolution data. Ultimately, for each application, e.g. visual evaluation vs. automatic segmentation, the optimal zero-filling factor needs to be determined, balancing image appearance (Du et al., 1994; Zhu et al., 2013) with loss in statistical independence of the image noise across voxels. For example, in Figure 5, when comparing across different voxel sizes, the visual impression might improve with zero-filling. However, it remains unclear whether the same zero-filling factor should be applied for each voxel size, which means that the overall difference in resolution remains, namely a nearly 20-fold reduction in voxel volume when moving from 0.8-mm isotropic to 0.3-mm isotropic voxel size. Alternatively, the same ’zero-filled’ voxel sizes could be used for evaluation, although then nearly 94 % of the samples used to reconstruct the image with 0.8-mm voxel size would be zero-valued for a 0.3-mm isotropic resolution. Consequently, all data presented in this study were reconstructed without zero-filling."

      7) Figure 7. Given the limited nature of experiment may it not also be possible the subject moved more, had differing brain blood flow, etc. Were these lengthy scans acquired in the same session? Many of these differences could be attributed to other differences than the small difference in spatial resolution.

      The scans were acquired in the same session using the same prospective motion correction procedure. Note that the acquisition time of the images with 0.16 mm isotropic voxel size was comparatively short, taking just under 12 minutes. Although the difference in spatial resolution may seem small, it still amounts to a 33% reduction in voxel volume. For comparison, reducing the voxel size from 0.4 mm to 0.3 mm also ‘only’ reduces the voxel volume by 58 %—not even twice as much. Overall, we fully agree that additional validation and optimisation of the imaging parameters for pial arteries are beneficial and have added a corresponding statement to the Discussion section.

      Changes made to the results section (also in response to Reviewer 1 (R1.22))

      "We have also acquired one single slab with an isotropic voxel size of 0.16 mm with prospective motion correction for this participant in the same session to compare to the acquisition with 0.14 mm isotropic voxel size and to test whether any gains in FRE are still possible at this level of the vascular tree."

      Changes made to the discussion section:

      "Acquiring these data at even higher field strengths would boost SNR (Edelstein et al., 1986; Pohmann et al., 2016) to partially compensate for SNR losses due to acceleration and may enable faster imaging and/or smaller voxel sizes. This could facilitate the identification of the ultimate limit of the flow-related enhancement effect and identify at which stage of the vascular tree does the blood delivery time become the limiting factor. While Figure 7 indicates the potential for voxel sizes below 0.16 mm, the singular nature of this comparison warrants further investigations."

      8) Page 22, Line 395. Would the analysis be any different with an absolute difference? The FRE (Eq 6) divides by a constant value. Clearly there is value in the difference as other subtractive inflow imaging would have infinite FRE (not considering noise as the authors do).

      Absolutely; using an absolute FRE would result in the highest FRE for the largest voxel size, whereas in our data small vessels are more easily detected with the smallest voxel size. We also note that relative FRE would indeed become infinite if the value in the denominator representing the tissue signal was zero, but this special case highlights how relative FRE can help characterize “segmentability”: a vessel with any intensity surrounded by tissue with an intensity of zero is trivially/infinitely segmentatble. We have added this point to the revised manuscript as indicated below.

      Following the suggestion of Reviewer 1 (R1.2), we have included additional simulations to clarify the effects of relative FRE definition and partial-volume model, in which we show that only when considering both together are smaller voxel sizes advantageous (Supplementary Material).

      "Effect of FRE Definition and Interaction with Partial-Volume Model

      For the definition of the FRE effect in this study, we used a measure of relative FRE (Al-Kwifi et al., 2002) in combination with a partial-volume model (Eq. 6). To illustrate the effect of these two definitions, as well as their interaction, we have estimated the relative and absolute FRE for an artery with a diameter of 200 µm and 2 000 µm (i.e. no partial-volume effects). The absolute FRE explicitly takes the voxel volume into account, i.e. instead of Eq. (6) for the relative FRE we used"

      Eq. (1)

      Note that the division by

      to obtain the relative FRE removes the contribution of the total voxel volume

      "Supplementary Figure 2 shows that, when partial volume effects are present, the highest relative FRE arises in voxels with the same size as or smaller than the vessel diameter (Supplementary Figure 2A), whereas the absolute FRE increases with voxel size (Supplementary Figure 2C). If no partial-volume effects are present, the relative FRE becomes independent of voxel size (Supplementary Figure 2B), whereas the absolute FRE increases with voxel size (Supplementary Figure 2D). While the partial-volume effects for the relative FRE are substantial, they are much more subtle when using the absolute FRE and do not alter the overall characteristics."

      Supplementary Figure 2: Effect of voxel size and blood delivery time on the relative flow-related enhancement (FRE) using either a relative (A,B) (Eq. (3)) or an absolute (C,D) (Eq. (12)) FRE definition assuming a pial artery diameter of 200 μm (A,C) or 2 000 µm, i.e. no partial-volume effects at the central voxel of this artery considered here.

      Following the established literature (Brown et al., 2014a; Carr and Carroll, 2012; Haacke et al., 1990) and because we would ultimately derive a relative measure, we have omitted the effect of voxel volume on the longitudinal magnetization in our derivations, which make it appear as if we are dividing by a constant in Eq. 6, as the effect of total voxel volume cancels out for the relative FRE. We have now made this more explicit in our derivation of the partial volume model.

      "Introducing a partial-volume model

      To account for the effect of voxel volume on the FRE, the total longitudinal magnetization M_z needs to also consider the number of spins contained within in a voxel (Du et al., 1996; Venkatesan and Haacke, 1997). A simple approximation can be obtained by scaling the longitudinal magnetization with the voxel volume (Venkatesan and Haacke, 1997) . To then include partial volume effects, the total longitudinal magnetization in a voxel M_z^total becomes the sum of the contributions from the stationary tissue M_zS^tissue and the inflowing blood M_z^blood, weighted by their respective volume fractions V_rel:"

      A simple approximation can be obtained by scaling the longitudinal magnetization with the voxel volume (Venkatesan and Haacke, 1997) . To then include partial volume effects, the total longitudinal magnetization in a voxel M_z^total becomes the sum of the contributions from the stationary tissue M_zS^tissue and the inflowing blood M_z^blood, weighted by their respective volume fractions V_rel:

      Eq. (4)

      For simplicity, we assume a single vessel is located at the center of the voxel and approximate it to be a cylinder with diameter d_vessel and length l_voxel of an assumed isotropic voxel along one side. The relative volume fraction of blood V_rel^blood is the ratio of vessel volume within the voxel to total voxel volume (see section Estimation of vessel-volume fraction in the Supplementary Material), and the tissue volume fraction V_rel^tissue is the remainder that is not filled with blood, or

      Eq. (5)

      We can now replace the blood magnetization in equation Eq. (3) with the total longitudinal magnetization of the voxel to compute the FRE as a function of vessel-volume fraction:

      Eq. (6)

      Based on your suggestion, we have also extended our interpretation of relative and absolute FRE. Indeed, a subtractive flow technique where no signal in the background remains and only intensities in the object are present would have infinite relative FRE, as this basically constitutes a perfect segmentation (bar a simple thresholding step).

      "Extending classical FRE treatments to the pial vasculature

      There are several major modifications in our approach to this topic that might explain why, in contrast to predictions from classical FRE treatments, it is indeed possible to image pial arteries. For instance, the definition of vessel contrast or flow-related enhancement is often stated as an absolute difference between blood and tissue signal (Brown et al., 2014a; Carr and Carroll, 2012; Du et al., 1993, 1996; Haacke et al., 1990; Venkatesan and Haacke, 1997). Here, however, we follow the approach of Al-Kwifi et al. (2002) and consider relative contrast. While this distinction may seem to be semantic, the effect of voxel volume on FRE for these two definitions is exactly opposite: Du et al. (1996) concluded that larger voxel size increases the (absolute) vessel-background contrast, whereas here we predict an increase in relative FRE for small arteries with decreasing voxel size. Therefore, predictions of the depiction of small arteries with decreasing voxel size differ depending on whether one is considering absolute contrast, i.e. difference in longitudinal magnetization, or relative contrast, i.e. contrast differences independent of total voxel size. Importantly, this prediction changes for large arteries where the voxel contains only vessel lumen, in which case the relative FRE remains constant across voxel sizes, but the absolute FRE increases with voxel size (Supplementary Figure 9). Overall, the interpretations of relative and absolute FRE differ, and one measure may be more appropriate for certain applications than the other. Absolute FRE describes the difference in magnetization and is thus tightly linked to the underlying physical mechanism. Relative FRE, however, describes the image contrast and segmentability. If blood and tissue magnetization are equal, both contrast measures would equal zero and indicate that no contrast difference is present. However, when there is signal in the vessel and as the tissue magnetization approaches zero, the absolute FRE approaches the blood magnetization (assuming no partial-volume effects), whereas the relative FRE approaches infinity. While this infinite relative FRE does not directly relate to the underlying physical process of ‘infinite’ signal enhancement through inflowing blood, it instead characterizes the segmentability of the image in that an image with zero intensity in the background and non-zero values in the structures of interest can be segmented perfectly and trivially. Accordingly, numerous empirical observations (Al-Kwifi et al., 2002; Bouvy et al., 2014; Haacke et al., 1990; Ladd, 2007; Mattern et al., 2018; von Morze et al., 2007) and the data provided here (Figure 5, 6 and 7) have shown the benefit of smaller voxel sizes if the aim is to visualize and segment small arteries."

      9) Page 22, Line 400. "The appropriateness of " This also ignores noise. The absolute enhancement is the inherent magnetization available. The results in Figure 5, 6, 7 don't readily support a ratio over and absolute difference accounting for partial volume effects.

      We hope that with the additional explanations on the effects of relative FRE definition in combination with a partial-volume model and the interpretation of relative FRE provided in the previous response (R2.8) and that Figures 5, 6 and 7 show smaller arteries for smaller voxels, we were able to clarify our argument why only relative FRE in combination with a partial volume model can explain why smaller voxel sizes are advantageous for depicting small arteries.

      While we appreciate that there exists a fundamental relationship between SNR and voxel volume in MR (Brown et al., 2014b), this relationship is also modulated by many more factors (as we have argued in our responses to R2.2 and R1.4b).

      We hope that the additional derivations and simulations provided in the previous response have clarified why a relative FRE model in combination with a partial-volume model helps to explain the enhanced detectability of small vessels with small voxels.

      10) Page 24, Line 453. "strategies, such as radial and spiral acquisitions, experience no vessel displacement artefact" These do observe flow related distortions as well, just not typically called displacement.

      Yes, this is a helpful point, as these methods will also experience a degradation of spatial accuracy due to flow effects, which will propagate into errors in the segmentation.

      As the reviewer suggests, flow-related artefacts in radial and spiral acquisitions usually manifest as a slight blur, and less as the prominent displacement found in Cartesian sampling schemes. We have added a corresponding clarification to the Discussion section:

      "Other encoding strategies, such as radial and spiral acquisitions, experience no vessel displacement artefact because phase and frequency encoding take place in the same instant; although a slight blur might be observed instead (Nishimura et al., 1995, 1991). However, both trajectories pose engineering challenges and much higher demands on hardware and reconstruction algorithms than the Cartesian readouts employed here (Kasper et al., 2018; Shu et al., 2016); particularly to achieve 3D acquisitions with 160 µm isotropic resolution."

      11) Page 24, Line 272. "although even with this nearly ideal subject behaviour approximately 1 in 4 scans still had to be discarded and repeated" This is certainly a potential source of bias in the comparisons.

      We apologize if this section was written in a misleading way. For the comparison presented in Figure 7, we acquired one additional slab in the same session at 0.16 mm voxel size using the same prospective motion correction procedure as for the 0.14 mm data. For the images shown in Figure 6 and Supplementary Figure 4 at 0.16 mm voxel size, we did not use a motion correction system and, thus, had to discard a portion of the data. We have clarified that for the comparison of the high-resolution data, prospective motion correction was used for both resolutions. We have clarified this in the Discussion section:

      "This allowed for the successful correction of head motion of approximately 1 mm over the 60-minute scan session, showing the utility of prospective motion correction at these very high resolutions. Note that for the comparison in Figure 7, one slab with 0.16 mm voxel size was acquired in the same session also using the prospective motion correction system. However, for the data shown in Figure 6 and Supplementary Figure 4, no prospective motion correction was used, and we instead relied on the experienced participants who contributed to this study. We found that the acquisition of TOF data with 0.16 mm isotropic voxel size in under 12 minutes acquisition time per slab is possible without discernible motion artifacts, although even with this nearly ideal subject behaviour approximately 1 in 4 scans still had to be discarded and repeated."

      12) Page 25, Line 489. "then need to include the effects of various analog and digital filters" While the analysis may benefit from some of this, most is not at all required for analysis based on optimization of the imaging parameters.

      We have included all four correction factors for completeness, given the unique acquisition parameter and contrast space our time-of-flight acquisition occupies, e.g. very low bandwidth of only 100 Hz, very large matrix sizes > 1024 samples, ideally zero SNR in the background (fully supressed tissue signal). However, we agree that probably the most important factor is the non-central chi distribution of the noise in magnitude images from multiple-channel coil arrays, and have added this qualification in the text:

      "Accordingly, SNR predictions then need to include the effects of various analog and digital filters, the number of acquired samples, the noise covariance correction factor, and—most importantly—the non-central chi distribution of the noise statistics of the final magnitude image (Triantafyllou et al., 2011)."

      Al-Kwifi, O., Emery, D.J., Wilman, A.H., 2002. Vessel contrast at three Tesla in time-of-flight magnetic resonance angiography of the intracranial and carotid arteries. Magnetic Resonance Imaging 20, 181–187. https://doi.org/10.1016/S0730-725X(02)00486-1

      Arts, T., Meijs, T.A., Grotenhuis, H., Voskuil, M., Siero, J., Biessels, G.J., Zwanenburg, J., 2021. Velocity and Pulsatility Measures in the Perforating Arteries of the Basal Ganglia at 3T MRI in Reference to 7T MRI. Frontiers in Neuroscience 15. Avants, B.B., Tustison, N., Song, G., 2009. Advanced normalization tools (ANTS). Insight j 2, 1–35. Bae, K.T., Park, S.-H., Moon, C.-H., Kim, J.-H., Kaya, D., Zhao, T., 2010. Dual-echo arteriovenography imaging with 7T MRI: CODEA with 7T. J. Magn. Reson. Imaging 31, 255–261. https://doi.org/10.1002/jmri.22019

      Bartholdi, E., Ernst, R.R., 1973. Fourier spectroscopy and the causality principle. Journal of Magnetic Resonance (1969) 11, 9–19. https://doi.org/10.1016/0022-2364(73)90076-0

      Bernier, M., Cunnane, S.C., Whittingstall, K., 2018. The morphology of the human cerebrovascular system. Human Brain Mapping 39, 4962–4975. https://doi.org/10.1002/hbm.24337

      Bouvy, W.H., Biessels, G.J., Kuijf, H.J., Kappelle, L.J., Luijten, P.R., Zwanenburg, J.J.M., 2014. Visualization of Perivascular Spaces and Perforating Arteries With 7 T Magnetic Resonance Imaging: Investigative Radiology 49, 307–313. https://doi.org/10.1097/RLI.0000000000000027

      Bouvy, W.H., Geurts, L.J., Kuijf, H.J., Luijten, P.R., Kappelle, L.J., Biessels, G.J., Zwanenburg, J.J.M., 2016. Assessment of blood flow velocity and pulsatility in cerebral perforating arteries with 7-T quantitative flow MRI: Blood Flow Velocity And Pulsatility In Cerebral Perforating Arteries. NMR Biomed. 29, 1295–1304. https://doi.org/10.1002/nbm.3306

      Brown, R.W., Cheng, Y.-C.N., Haacke, E.M., Thompson, M.R., Venkatesan, R., 2014a. Chapter 24 - MR Angiography and Flow Quantification, in: Magnetic Resonance Imaging. John Wiley & Sons, Ltd, pp. 701–737. https://doi.org/10.1002/9781118633953.ch24

      Brown, R.W., Cheng, Y.-C.N., Haacke, E.M., Thompson, M.R., Venkatesan, R., 2014b. Chapter 15 - Signal, Contrast, and Noise, in: Magnetic Resonance Imaging. John Wiley & Sons, Ltd, pp. 325–373. https://doi.org/10.1002/9781118633953.ch15

      Carr, J.C., Carroll, T.J., 2012. Magnetic resonance angiography: principles and applications. Springer, New York. Cassot, F., Lauwers, F., Fouard, C., Prohaska, S., Lauwers-Cances, V., 2006. A Novel Three-Dimensional Computer-Assisted Method for a Quantitative Study of Microvascular Networks of the Human Cerebral Cortex. Microcirculation 13, 1–18. https://doi.org/10.1080/10739680500383407

      Chen, L., Mossa-Basha, M., Balu, N., Canton, G., Sun, J., Pimentel, K., Hatsukami, T.S., Hwang, J.-N., Yuan, C., 2018. Development of a quantitative intracranial vascular features extraction tool on 3DMRA using semiautomated open-curve active contour vessel tracing: Comprehensive Artery Features Extraction From 3D MRA. Magn. Reson. Med 79, 3229–3238. https://doi.org/10.1002/mrm.26961

      Choi, U.-S., Kawaguchi, H., Kida, I., 2020. Cerebral artery segmentation based on magnetization-prepared two rapid acquisition gradient echo multi-contrast images in 7 Tesla magnetic resonance imaging. NeuroImage 222, 117259. https://doi.org/10.1016/j.neuroimage.2020.117259

      Conolly, S., Nishimura, D., Macovski, A., Glover, G., 1988. Variable-rate selective excitation. Journal of Magnetic Resonance (1969) 78, 440–458. https://doi.org/10.1016/0022-2364(88)90131-X

      Deistung, A., Dittrich, E., Sedlacik, J., Rauscher, A., Reichenbach, J.R., 2009. ToF-SWI: Simultaneous time of flight and fully flow compensated susceptibility weighted imaging. J. Magn. Reson. Imaging 29, 1478–1484. https://doi.org/10.1002/jmri.21673

      Detre, J.A., Leigh, J.S., Williams, D.S., Koretsky, A.P., 1992. Perfusion imaging. Magnetic Resonance in Medicine 23, 37–45. https://doi.org/10.1002/mrm.1910230106

      Du, Y., Parker, D.L., Davis, W.L., Blatter, D.D., 1993. Contrast-to-Noise-Ratio Measurements in Three-Dimensional Magnetic Resonance Angiography. Investigative Radiology 28, 1004–1009. Du, Y.P., Jin, Z., 2008. Simultaneous acquisition of MR angiography and venography (MRAV). Magn. Reson. Med. 59, 954–958. https://doi.org/10.1002/mrm.21581

      Du, Y.P., Parker, D.L., Davis, W.L., Cao, G., 1994. Reduction of partial-volume artifacts with zero-filled interpolation in three-dimensional MR angiography. J. Magn. Reson. Imaging 4, 733–741. https://doi.org/10.1002/jmri.1880040517

      Du, Y.P., Parker, D.L., Davis, W.L., Cao, G., Buswell, H.R., Goodrich, K.C., 1996. Experimental and theoretical studies of vessel contrast-to-noise ratio in intracranial time-of-flight MR angiography. Journal of Magnetic Resonance Imaging 6, 99–108. https://doi.org/10.1002/jmri.1880060120

      Duvernoy, H., Delon, S., Vannson, J.L., 1983. The Vascularization of The Human Cerebellar Cortex. Brain Research Bulletin 11, 419–480. Duvernoy, H.M., Delon, S., Vannson, J.L., 1981. Cortical blood vessels of the human brain. Brain Research Bulletin 7, 519–579. https://doi.org/10.1016/0361-9230(81)90007-1

      Eckstein, K., Bachrata, B., Hangel, G., Widhalm, G., Enzinger, C., Barth, M., Trattnig, S., Robinson, S.D., 2021. Improved susceptibility weighted imaging at ultra-high field using bipolar multi-echo acquisition and optimized image processing: CLEAR-SWI. NeuroImage 237, 118175. https://doi.org/10.1016/j.neuroimage.2021.118175

      Edelstein, W.A., Glover, G.H., Hardy, C.J., Redington, R.W., 1986. The intrinsic signal-to-noise ratio in NMR imaging. Magn. Reson. Med. 3, 604–618. https://doi.org/10.1002/mrm.1910030413

      Fan, A.P., Govindarajan, S.T., Kinkel, R.P., Madigan, N.K., Nielsen, A.S., Benner, T., Tinelli, E., Rosen, B.R., Adalsteinsson, E., Mainero, C., 2015. Quantitative oxygen extraction fraction from 7-Tesla MRI phase: reproducibility and application in multiple sclerosis. J Cereb Blood Flow Metab 35, 131–139. https://doi.org/10.1038/jcbfm.2014.187

      Fiedler, T.M., Ladd, M.E., Bitz, A.K., 2018. SAR Simulations & Safety. NeuroImage 168, 33–58. https://doi.org/10.1016/j.neuroimage.2017.03.035

      Frässle, S., Aponte, E.A., Bollmann, S., Brodersen, K.H., Do, C.T., Harrison, O.K., Harrison, S.J., Heinzle, J., Iglesias, S., Kasper, L., Lomakina, E.I., Mathys, C., Müller-Schrader, M., Pereira, I., Petzschner, F.H., Raman, S., Schöbi, D., Toussaint, B., Weber, L.A., Yao, Y., Stephan, K.E., 2021. TAPAS: An Open-Source Software Package for Translational Neuromodeling and Computational Psychiatry. Front. Psychiatry 12. https://doi.org/10.3389/fpsyt.2021.680811

      Gulban, O.F., Bollmann, S., Huber, R., Wagstyl, K., Goebel, R., Poser, B.A., Kay, K., Ivanov, D., 2021. Mesoscopic Quantification of Cortical Architecture in the Living Human Brain. https://doi.org/10.1101/2021.11.25.470023

      Haacke, E.M., Masaryk, T.J., Wielopolski, P.A., Zypman, F.R., Tkach, J.A., Amartur, S., Mitchell, J., Clampitt, M., Paschal, C., 1990. Optimizing blood vessel contrast in fast three-dimensional MRI. Magn. Reson. Med. 14, 202–221. https://doi.org/10.1002/mrm.1910140207

      Helthuis, J.H.G., van Doormaal, T.P.C., Hillen, B., Bleys, R.L.A.W., Harteveld, A.A., Hendrikse, J., van der Toorn, A., Brozici, M., Zwanenburg, J.J.M., van der Zwan, A., 2019. Branching Pattern of the Cerebral Arterial Tree. Anat Rec 302, 1434–1446. https://doi.org/10.1002/ar.23994

      Heverhagen, J.T., Bourekas, E., Sammet, S., Knopp, M.V., Schmalbrock, P., 2008. Time-of-Flight Magnetic Resonance Angiography at 7 Tesla. Investigative Radiology 43, 568–573. https://doi.org/10.1097/RLI.0b013e31817e9b2c

      Hirsch, S., Reichold, J., Schneider, M., Székely, G., Weber, B., 2012. Topology and Hemodynamics of the Cortical Cerebrovascular System. J Cereb Blood Flow Metab 32, 952–967. https://doi.org/10.1038/jcbfm.2012.39

      Horn, B.K.P., Schunck, B.G., 1981. Determining optical flow. Artificial Intelligence 17, 185–203. https://doi.org/10.1016/0004-3702(81)90024-2

      Huck, J., Wanner, Y., Fan, A.P., Jäger, A.-T., Grahl, S., Schneider, U., Villringer, A., Steele, C.J., Tardif, C.L., Bazin, P.-L., Gauthier, C.J., 2019. High resolution atlas of the venous brain vasculature from 7 T quantitative susceptibility maps. Brain Struct Funct 224, 2467–2485. https://doi.org/10.1007/s00429-019-01919-4

      Johst, S., Wrede, K.H., Ladd, M.E., Maderwald, S., 2012. Time-of-Flight Magnetic Resonance Angiography at 7 T Using Venous Saturation Pulses With Reduced Flip Angles. Investigative Radiology 47, 445–450. https://doi.org/10.1097/RLI.0b013e31824ef21f

      Kang, C.-K., Park, C.-A., Kim, K.-N., Hong, S.-M., Park, C.-W., Kim, Y.-B., Cho, Z.-H., 2010. Non-invasive visualization of basilar artery perforators with 7T MR angiography. Journal of Magnetic Resonance Imaging 32, 544–550. https://doi.org/10.1002/jmri.22250

      Kasper, L., Engel, M., Barmet, C., Haeberlin, M., Wilm, B.J., Dietrich, B.E., Schmid, T., Gross, S., Brunner, D.O., Stephan, K.E., Pruessmann, K.P., 2018. Rapid anatomical brain imaging using spiral acquisition and an expanded signal model. NeuroImage 168, 88–100. https://doi.org/10.1016/j.neuroimage.2017.07.062

      Klepaczko, A., Szczypiński, P., Deistung, A., Reichenbach, J.R., Materka, A., 2016. Simulation of MR angiography imaging for validation of cerebral arteries segmentation algorithms. Computer Methods and Programs in Biomedicine 137, 293–309. https://doi.org/10.1016/j.cmpb.2016.09.020

      Kobari, M., Gotoh, F., Fukuuchi, Y., Tanaka, K., Suzuki, N., Uematsu, D., 1984. Blood Flow Velocity in the Pial Arteries of Cats, with Particular Reference to the Vessel Diameter. J Cereb Blood Flow Metab 4, 110–114. https://doi.org/10.1038/jcbfm.1984.15

      Ladd, M.E., 2007. High-Field-Strength Magnetic Resonance: Potential and Limits. Top Magn Reson Imaging 18, 139–152. Lesage, D., Angelini, E.D., Bloch, I., Funka-Lea, G., 2009. A review of 3D vessel lumen segmentation techniques: Models, features and extraction schemes. Medical Image Analysis 13, 819–845. https://doi.org/10.1016/j.media.2009.07.011

      Maderwald, S., Ladd, S.C., Gizewski, E.R., Kraff, O., Theysohn, J.M., Wicklow, K., Moenninghoff, C., Wanke, I., Ladd, M.E., Quick, H.H., 2008. To TOF or not to TOF: strategies for non-contrast-enhanced intracranial MRA at 7 T. Magn Reson Mater Phy 21, 159. https://doi.org/10.1007/s10334-007-0096-9

      Manjón, J.V., Coupé, P., Martí‐Bonmatí, L., Collins, D.L., Robles, M., 2010. Adaptive non-local means denoising of MR images with spatially varying noise levels. Journal of Magnetic Resonance Imaging 31, 192–203. https://doi.org/10.1002/jmri.22003

      Mansfield, P., Harvey, P.R., 1993. Limits to neural stimulation in echo-planar imaging. Magn. Reson. Med. 29, 746–758. https://doi.org/10.1002/mrm.1910290606

      Masaryk, T.J., Modic, M.T., Ross, J.S., Ruggieri, P.M., Laub, G.A., Lenz, G.W., Haacke, E.M., Selman, W.R., Wiznitzer, M., Harik, S.I., 1989. Intracranial circulation: preliminary clinical results with three-dimensional (volume) MR angiography. Radiology 171, 793–799. https://doi.org/10.1148/radiology.171.3.2717754

      Mattern, H., Sciarra, A., Godenschweger, F., Stucht, D., Lüsebrink, F., Rose, G., Speck, O., 2018. Prospective motion correction enables highest resolution time-of-flight angiography at 7T: Prospectively Motion-Corrected TOF Angiography at 7T. Magn. Reson. Med 80, 248–258. https://doi.org/10.1002/mrm.27033

      Mattern, H., Sciarra, A., Lüsebrink, F., Acosta‐Cabronero, J., Speck, O., 2019. Prospective motion correction improves high‐resolution quantitative susceptibility mapping at 7T. Magn. Reson. Med 81, 1605–1619. https://doi.org/10.1002/mrm.27509

      Mennes, M., Jenkinson, M., Valabregue, R., Buitelaar, J.K., Beckmann, C., Smith, S., 2014. Optimizing full-brain coverage in human brain MRI through population distributions of brain size. NeuroImage 98, 513–520. https://doi.org/10.1016/j.neuroimage.2014.04.030 Moccia, S., De Momi, E., El Hadji, S., Mattos, L.S., 2018. Blood vessel segmentation algorithms — Review of methods, datasets and evaluation metrics. Computer Methods and Programs in Biomedicine 158, 71–91. https://doi.org/10.1016/j.cmpb.2018.02.001

      Mustafa, M.A.R., 2016. A data-driven learning approach to image registration. Mut, F., Wright, S., Ascoli, G.A., Cebral, J.R., 2014. Morphometric, geographic, and territorial characterization of brain arterial trees. International Journal for Numerical Methods in Biomedical Engineering 30, 755–766. https://doi.org/10.1002/cnm.2627

      Nagaoka, T., Yoshida, A., 2006. Noninvasive Evaluation of Wall Shear Stress on Retinal Microcirculation in Humans. Invest. Ophthalmol. Vis. Sci. 47, 1113. https://doi.org/10.1167/iovs.05-0218

      Nishimura, D.G., Irarrazabal, P., Meyer, C.H., 1995. A Velocity k-Space Analysis of Flow Effects in Echo-Planar and Spiral Imaging. Magnetic Resonance in Medicine 33, 549–556. https://doi.org/10.1002/mrm.1910330414

      Nishimura, D.G., Jackson, J.I., Pauly, J.M., 1991. On the nature and reduction of the displacement artifact in flow images. Magnetic Resonance in Medicine 22, 481–492. https://doi.org/10.1002/mrm.1910220255

      Nonaka, H., Akima, M., Hatori, T., Nagayama, T., Zhang, Z., Ihara, F., 2003. Microvasculature of the human cerebral white matter: Arteries of the deep white matter. Neuropathology 23, 111–118. https://doi.org/10.1046/j.1440-1789.2003.00486.x

      North, D.O., 1963. An Analysis of the factors which determine signal/noise discrimination in pulsed-carrier systems. Proceedings of the IEEE 51, 1016–1027. https://doi.org/10.1109/PROC.1963.2383

      Park, C.S., Hartung, G., Alaraj, A., Du, X., Charbel, F.T., Linninger, A.A., 2020. Quantification of blood flow patterns in the cerebral arterial circulation of individual (human) subjects. Int J Numer Meth Biomed Engng 36. https://doi.org/10.1002/cnm.3288

      Parker, D.L., Goodrich, K.C., Roberts, J.A., Chapman, B.E., Jeong, E.-K., Kim, S.-E., Tsuruda, J.S., Katzman, G.L., 2003. The need for phase-encoding flow compensation in high-resolution intracranial magnetic resonance angiography. J. Magn. Reson. Imaging 18, 121–127. https://doi.org/10.1002/jmri.10322

      Parker, D.L., Yuan, C., Blatter, D.D., 1991. MR angiography by multiple thin slab 3D acquisition. Magn. Reson. Med. 17, 434–451. https://doi.org/10.1002/mrm.1910170215

      Pauling, L., Coryell, C.D., 1936. The magnetic properties and structure of hemoglobin, oxyhemoglobin and carbonmonoxyhemoglobin. Proceedings of the National Academy of Sciences 22, 210–216. https://doi.org/10.1073/pnas.22.4.210

      Payne, S.J., 2017. Cerebral Blood Flow And Metabolism: A Quantitative Approach. World Scientific. Peters, A.M., Brookes, M.J., Hoogenraad, F.G., Gowland, P.A., Francis, S.T., Morris, P.G., Bowtell, R., 2007. T2* measurements in human brain at 1.5, 3 and 7 T. Magnetic Resonance Imaging 25, 748–753. https://doi.org/10.1016/j.mri.2007.02.014

      Pfeifer, R.A., 1930. Grundlegende Untersuchungen für die Angioarchitektonik des menschlichen Gehirns. Berlin: Julius Springer. Phellan, R., Forkert, N.D., 2017. Comparison of vessel enhancement algorithms applied to time-of-flight MRA images for cerebrovascular segmentation. Medical Physics 44, 5901–5915. https://doi.org/10.1002/mp.12560

      Pohmann, R., Speck, O., Scheffler, K., 2016. Signal-to-Noise Ratio and MR Tissue Parameters in Human Brain Imaging at 3, 7, and 9.4 Tesla Using Current Receive Coil Arrays. Magn. Reson. Med. 75, 801–809. https://doi.org/10.1002/mrm.25677

      Reichenbach, J.R., Venkatesan, R., Schillinger, D.J., Kido, D.K., Haacke, E.M., 1997. Small vessels in the human brain: MR venography with deoxyhemoglobin as an intrinsic contrast agent. Radiology 204, 272–277. https://doi.org/10.1148/radiology.204.1.9205259 Schmid, F., Barrett, M.J.P., Jenny, P., Weber, B., 2019. Vascular density and distribution in neocortex. NeuroImage 197, 792–805. https://doi.org/10.1016/j.neuroimage.2017.06.046

      Schmitter, S., Bock, M., Johst, S., Auerbach, E.J., Uğurbil, K., Moortele, P.-F.V. de, 2012. Contrast enhancement in TOF cerebral angiography at 7 T using saturation and MT pulses under SAR constraints: Impact of VERSE and sparse pulses. Magnetic Resonance in Medicine 68, 188–197. https://doi.org/10.1002/mrm.23226

      Schulz, J., Boyacioglu, R., Norris, D.G., 2016. Multiband multislab 3D time-of-flight magnetic resonance angiography for reduced acquisition time and improved sensitivity. Magn Reson Med 75, 1662–8. https://doi.org/10.1002/mrm.25774

      Shu, C.Y., Sanganahalli, B.G., Coman, D., Herman, P., Hyder, F., 2016. New horizons in neurometabolic and neurovascular coupling from calibrated fMRI, in: Progress in Brain Research. Elsevier, pp. 99–122. https://doi.org/10.1016/bs.pbr.2016.02.003

      Stamm, A.C., Wright, C.L., Knopp, M.V., Schmalbrock, P., Heverhagen, J.T., 2013. Phase contrast and time-of-flight magnetic resonance angiography of the intracerebral arteries at 1.5, 3 and 7 T. Magnetic Resonance Imaging 31, 545–549. https://doi.org/10.1016/j.mri.2012.10.023

      Stewart, A.W., Robinson, S.D., O’Brien, K., Jin, J., Widhalm, G., Hangel, G., Walls, A., Goodwin, J., Eckstein, K., Tourell, M., Morgan, C., Narayanan, A., Barth, M., Bollmann, S., 2022. QSMxT: Robust masking and artifact reduction for quantitative susceptibility mapping. Magnetic Resonance in Medicine 87, 1289–1300. https://doi.org/10.1002/mrm.29048

      Stucht, D., Danishad, K.A., Schulze, P., Godenschweger, F., Zaitsev, M., Speck, O., 2015. Highest Resolution In Vivo Human Brain MRI Using Prospective Motion Correction. PLoS ONE 10, e0133921. https://doi.org/10.1371/journal.pone.0133921

      Szikla, G., Bouvier, G., Hori, T., Petrov, V., 1977. Angiography of the Human Brain Cortex. Springer Berlin Heidelberg, Berlin, Heidelberg. https://doi.org/10.1007/978-3-642-81145-6

      Triantafyllou, C., Polimeni, J.R., Wald, L.L., 2011. Physiological noise and signal-to-noise ratio in fMRI with multi-channel array coils. NeuroImage 55, 597–606. https://doi.org/10.1016/j.neuroimage.2010.11.084

      Tustison, N.J., Avants, B.B., Cook, P.A., Zheng, Y., Egan, A., Yushkevich, P.A., Gee, J.C., 2010. N4ITK: Improved N3 Bias Correction. IEEE Transactions on Medical Imaging 29, 1310–1320. https://doi.org/10.1109/TMI.2010.2046908

      Uludağ, K., Müller-Bierl, B., Uğurbil, K., 2009. An integrative model for neuronal activity-induced signal changes for gradient and spin echo functional imaging. NeuroImage 48, 150–165. https://doi.org/10.1016/j.neuroimage.2009.05.051

      Venkatesan, R., Haacke, E.M., 1997. Role of high resolution in magnetic resonance (MR) imaging: Applications to MR angiography, intracranial T1-weighted imaging, and image interpolation. International Journal of Imaging Systems and Technology 8, 529–543. https://doi.org/10.1002/(SICI)1098-1098(1997)8:6<529::AID-IMA5>3.0.CO;2-C

      von Morze, C., Xu, D., Purcell, D.D., Hess, C.P., Mukherjee, P., Saloner, D., Kelley, D.A.C., Vigneron, D.B., 2007. Intracranial time-of-flight MR angiography at 7T with comparison to 3T. J. Magn. Reson. Imaging 26, 900–904. https://doi.org/10.1002/jmri.21097

      Ward, P.G.D., Ferris, N.J., Raniga, P., Dowe, D.L., Ng, A.C.L., Barnes, D.G., Egan, G.F., 2018. Combining images and anatomical knowledge to improve automated vein segmentation in MRI. NeuroImage 165, 294–305. https://doi.org/10.1016/j.neuroimage.2017.10.049

      Wilms, G., Bosmans, H., Demaerel, Ph., Marchal, G., 2001. Magnetic resonance angiography of the intracranial vessels. European Journal of Radiology 38, 10–18. https://doi.org/10.1016/S0720-048X(01)00285-6

      Wright, S.N., Kochunov, P., Mut, F., Bergamino, M., Brown, K.M., Mazziotta, J.C., Toga, A.W., Cebral, J.R., Ascoli, G.A., 2013. Digital reconstruction and morphometric analysis of human brain arterial vasculature from magnetic resonance angiography. NeuroImage 82, 170–181. https://doi.org/10.1016/j.neuroimage.2013.05.089

      Yushkevich, P.A., Piven, J., Hazlett, H.C., Smith, R.G., Ho, S., Gee, J.C., Gerig, G., 2006. User-guided 3D active contour segmentation of anatomical structures: Significantly improved efficiency and reliability. NeuroImage 31, 1116–1128. https://doi.org/10.1016/j.neuroimage.2006.01.015

      Zhang, Z., Deng, X., Weng, D., An, J., Zuo, Z., Wang, B., Wei, N., Zhao, J., Xue, R., 2015. Segmented TOF at 7T MRI: Technique and clinical applications. Magnetic Resonance Imaging 33, 1043–1050. https://doi.org/10.1016/j.mri.2015.07.002

      Zhao, J.M., Clingman, C.S., Närväinen, M.J., Kauppinen, R.A., van Zijl, P.C.M., 2007. Oxygenation and hematocrit dependence of transverse relaxation rates of blood at 3T. Magn. Reson. Med. 58, 592–597. https://doi.org/10.1002/mrm.21342

      Zhu, X., Tomanek, B., Sharp, J., 2013. A pixel is an artifact: On the necessity of zero-filling in fourier imaging. Concepts Magn. Reson. 42A, 32–44. https://doi.org/10.1002/cmr.a.21256

    1. Autho Response

      Reviewer #1 (Public Review):

      Here the authors aimed to gain insight into the role of Septin-7 in skeletal muscle biology using a novel and powerful mouse model of inducible muscle specific septin-7 deletion. They combine this with CRISPR/Cas9 and shRNA mediated manipulation of Septin-7 in C2C12 cells in vitro to explore its role in muscle progenitor morphology and proliferation. There are a variety of interesting observations, with clear phenotypes induced by the Septin-7 manipulation, including effects on body weight, muscle force production, mitochondrial morphology, and cell proliferation. However each area is somewhat superficially examined, and certain conclusions require additional validation for robust support. Additionally, mechanistic insight into Septin 7's role is limited. Therefore, while the phenotypes are likely of intrigue to both the muscle and septin community, to significantly advance the field will require additional experimentation.

      Specifically, it is currently difficult to distinguish between developmental and adult roles of Septin-7. The authors induce tamoxifen-mediated deletion at 1 month of age and examine muscle structure/function only at 4 months. By not studying early time points, it is difficult to determine whether particular phenotypes are directly due to Septin deletion or a secondary consequence of muscle atrophy and/or a decline in body weight. Further, by not inducing deletion at a later time point (i.e. after 2 months when muscle is generally matured), it is difficult to assess whether septin-7 plays a role in maintaining structure and function of mature muscle, or if its primary role is in muscle development.

      We have conducted a number of trials for knocking-down of Septin-7 expression. These included Tamoxifen treatment of Cre- pregnant mothers, shorter treatments starting at early after birth, and treatments of adult animals. While the former led to still-born offsprings, the later resulted in only a minor – less than 20% - reduction of Septin-7 expression. These long trials led us to, on the one hand, concentrate on the protocol used throughout the manuscript (where a significant, up to 50%, reduction in the expression of the protein could be achieved) and to, on the other hand, focus also on myogenic cells in culture. This selection was also substantiated by the finding that Septin-7 expression is the highest in neonatal muscles and declines with age until adulthood (but remains essentially constant until an age of 18 months for the mice examined). As an identical Tamoxifen treatment of littermate Cre- mice did not result in any of the presented alterations (as demonstrated in the Supplementary material) we can conclude that they are the consequence of Septin-7 down-regulation. We, nonetheless, completely agree with the Reviewer that some observations are most likely indirect, i.e., are due to the loss of muscle mass. These include, e.g., the altered shape of the vertebra and the consequent “hunchback” phenotype. However, this observation further supports our claim that Septin-7 is essential for proper development of a normal musculature in these animals.

      Further, the conclusion that septin-7 has an essential role in regeneration (seemingly based on expression increasing after injury) is unsupported and requires further experimentation where injury and regeneration is triggered in the absence of Septin-7 to establish a causative role.

      We agree with the Reviewer that a clear causative role of Septin-7 in muscle regeneration would require a substantial amount of further experimentation on Septin-7 knock-down animals. We, however, believe that this – detailed description of the changes in transcription factors and key regulatory proteins together with changes in morphology in Septin-7 KD animals following muscle injury – is beyond the scope of the present manuscript and should be presented as a separate study. In this manuscript, however, we provide the essential background to substantiate this claim. We describe that fusion of myogenic cells is severely hindered if Septin-7 expression is suppressed while Septin-7 is upregulated following muscle injury to the extent which is significantly more than what would be expected if it would be simply due to the production of new muscle fibers.

      Finally, there are intriguing observations in mitochondrial and myofiber organization and mitochondrial content; however further interrogation into additional relevant metrics of each, and at different time points of Septin-7 deletion, are needed to better understand these phenotypes and gain insight into Septin-7's role in their regulation.

      Accepting the concern of the Reviewer we have conducted additional experiments to enable the proper characterization of the morphology. Additional relevant metrics – Aspect Ratios and Form Factors – have been calculated and are now incorporated into the revised MS and are presented in Figure 5.

      Reviewer #2 (Public Review):

      This is a comprehensive work describing for the first time the location and importance of the cytoskeletal protein Septin-7 in skeletal muscle. The authors, using a Septin-7 conditional knockdown mouse model, the C2C12 cell line, and enzymatically isolated adult muscle fibers, explore the normal location of this protein in muscle fibers, the morphological alterations in conditioned knockdown conditions, the developmental alterations, and the functional alterations in terms of force production. The global picture that emerges shows Septin-7 as a fundamental brick in both muscle construction, development, and regeneration; all this leads to reinforcing the basically structural nature of this protein role.

      We thank the Reviewer for the appreciative words. We indeed believe that Septin-7 plays and important role in the proper organization and development of skeletal muscle. Even a partial knock-down of the protein at the early stages of life results in a severe loss in muscle mass accompanied by skeletal deformities. A complete knock-out of the protein results, at the myoblast level, in the inability of the cells to proliferate and form multinucleated cells confirming the essential role of this structural protein.

      Reviewer #3 (Public Review):

      This is an original study to explore the role of Septin-7, a cytoskeleton protein, in skeletal muscle physiology. The authors produced a unique mouse model with Septin-7 conditional knockdown specifically in skeletal muscle, which allowed them to examine the structure and function changes of skeletal muscle in response to the reduced protein expression level of Septin-7 in vivo and ex vivo at different development stages without the influence of other body parts with reduced Septin-7 expression. The study on the cellular model, C2C12 myoblast/myotubes with knockdown of Septin-7 expression, provided additional evidence of the importance of this cytoskeleton protein in regulating myoblast proliferation and differentiation. Majority of the data are supportive of the the major claim in this manuscript. However, additional key experiments and data analysis are needed to provide more mechanistic characterization of Septin-7 in muscle physiology.

      We would like to express our thanks to the Reviewer for the critical comments on our manuscript and for the valuable suggestions that help substantiate our claim, that Septin-7 is an essential part of the cytoskeletal network in skeletal muscle and plays an important role in muscle differentiation as well as in myoblast proliferation and fusion.

      A number of additional experiments were carried out to answer the comments/concerns of the Reviewer. Immunostaining of critical proteins (actin, myosin, and the L-type calcium channel) are now presented in Figure S4 for Cre+ animals. The T-tubules of enzymatically isolated fibers from these Septin-7 knock-down mice were also stained using Di-8-ANEPPS and the corresponding images are presented below. We describe how different Tamoxifen treatments at different time-points in the intra- and extra-uterine life of the animals resulted in the deletion of the SEPTIN 7 gene which ultimately led us to use the protocol (largest reduction with still viable mice) described in this manuscript. A more detailed description on how the fusion index, a clear marker a myotube differentiation, was conducted using desmin staining is now included and additional experiments (immunostaining and western blot) with MYH as suggested by the Reviewer are also presented. We carried out a thorough analysis of mitochondrial morphology (in line with the requirements of another Reviewer) and modified the corresponding figure in the revised MS accordingly.

      Major Concerns:

      1) The Septin-7 knockdown mouse model, the EM and IHC techniques are all established in the research group. It is a surprise to see that authors missed the opportunity to characterize the morphological changes in the T-tubule network, triad structure, the distribution of Ca release units (i.e., IHC of DHPR and RyR), and its co-localization with other key cytoskeletal proteins (i.e. actin) etc., in the muscle section or isolated muscle fibers.

      We appreciate the reviewer's valuable critical comments. Even if we were not able to fully comply with all the requests, we corrected as many of the mentioned shortcomings as possible, by correcting the errors and to prove our claims with further experiments. Please find our responses to each critical remark below.

      We conducted IHC staining on individual FDB fibers of C57Bl/6 mice presenting the distribution of skeletal muscle specific α-actinin, and RyR1 alongside with Septin-7 proteins (Figure 1E and F). As demonstrated in Figure 5E and F of the original MS (Figure 5 F and G in the revised version) normal triad structures were present both in Cre- and Cre+ muscle samples using EM analysis. However, the sarcomeres were distorted at places where large mitochondria appeared in Cre+ samples.

      As suggested, T-tubule staining by Di-8-ANEPPS was carried out on isolated FDB fibers from Cre- and Cre+ animals, which revealed no considerable differences between the two groups.

      Images present the T-tubule system of a single muscle fibers isolated from Cre- and Cre+ FDB muscle. Di-8-ANEPPS staining reveals no considerable difference between the two type of animals suggesting that the reduced Septin-7 expression does not alter the T-tubular system of skeletal muscle cells.

      To further investigate the key components of muscle contraction and EC coupling, we carried out immunostaining in isolated single fibers from FDB muscle originating from Cre+ and Cre- mice. Immunocytochemistry revealed no significant alteration of actin, myosin 4, and L-type calcium channel labeling comparing the two mouse strains (see Figure S4 in the revised version).

      2) The authors only studied one time point following the Tamoxifen treatment (4-month old with 3-month treatment). Based on Fig 2D, a significant body weight reduction was achieved after one month of the Tamoxifen treatment (at the age of 7 weeks), indicating a potential reduced muscle development at this age. Mice are considered fully matured at the age of 2 months. It will be more informative if the muscle samples and the in vivo and in vitro muscle activity are analyzed at this time point (7 or 8-week old), which should provide a direct answer if the knockdown of Septin-7 affects the muscle development. Additionally, a time dependent correlation of the level of Septin-7 knockdown with muscle function/morphology analysis should better define the role of Septin-7 in muscle development and function.

      We agree with the Reviewer that Septin-7 has presumably more pronounced effect in the early stage of muscle development, since we detected higher expression level of the protein in muscle samples isolated from newborn and young as compared with adult animals. We conducted preliminarily in vivo and in vitro force experiments on 2-month-old mice after 1 month of Tamoxifen treatment. The grip force already decreased significantly in Cre+ mice but the decrease in twitch and tetanic force of EDL and Sol did not reach significance. These experiments were followed by the analysis of Septin-7 level in the muscle samples which showed less than 20% of reduction on average in the samples of Cre+ mice. This suggested that a more robust suppression of Septin-7 is needed to reach significant reduction in in vitro force thus we decided to extend the Tamoxifen treatment to 3 months.

      3) Although the expression level of Septin-7 reduced during muscle development (Fig 1C), but its expression is still evident at the age of 4 months (Fig 1C and Fig S1F), indicating a potential role of Septin-7 in maintaining normal muscle function. It is important to examine whether the Tomaxifen treatment started after the muscle maturation at the age of 2-month old would affect the muscle structure and function. Particularly, these type of KD mice will be critical to answer if the KD will affect the regeneration rate following the muscle injury. The outcome will further test or support their claim of the essential roles of Septin-7 in muscle regeneration.

      We agree with the Reviewer opinion that Septin-7 presumably plays an essential role not only during the early development of skeletal muscle but also in the matured tissue. In our preliminary studies Septin-7 protein expression was determined in skeletal muscle samples from mice at different developmental stage. As presented in Figure 1C we observed decrease in Septin-7 protein expression from newborn to adult stages. The expression profile of Septin-7 was also investigated in samples from 2, 4, 6, 9, and 18-month-old mice and a significant decrease was observed in samples isolated from mice of 4, 6, 9, and 18 months of age (58±8; 48±9; 66±16; 54±9% relative to the 2-month-old muscles, respectively), however there were no considerable changes between samples after 4 months of age.

      In order to generate skeletal muscle specific, conditional Septin-7 knock-down animals, we applied Tamoxifen treatment at different developmental stages in our preliminary studies (see the table and figures below). When Cre- pregnant females were fed with Tamoxifen in the third trimester of pregnancy, it caused intrauterin lethality independent of the genotype. According to the animal ethics requirements we did not continue this experimental protocol. In the next stage of our initial experiments, 3 month-old mice were treated with both intraperitoneal injections for 5 consecutive days or Tamoxifen diet for 4 weeks. Here, only a moderate deletion of the exon4 was detected in SEPTIN 7 gene in Cre+ animals (data obtained from these mice are shown below).

      These findings and the observation of ontogenesis dependent expression of Septin-7 indicated its significance at the early stage of development and suggested that we should try to modify the gene expression at earlier age. Six weeks of diet supplemented with Tamoxifen generated well detectable exon deletion in younger (1-month-old) mice. Regarding these observations we decided to start the Tamoxifen-supplemented diet in younger (4-week-old) animals immediately after separation from the mother and we continued the treatment for a longer period (3 months) to be sure that exon deletion will be prominent in all Cre+ animals.

      Genetic modification of SEPTIN 7 gene following Tamoxifen treatment in mice mentioned above. RT-PCR

      Figure presents the presence of floxed sites at SEPTIN 7 gene (white arrow) and the deletion of exon4 (red arrows) in the appropriate DNA samples isolated from mice treated with Tamoxifen from different age and using different methods and period of Tamoxifen application. Exon4 deletions were less than 20%, therefore these trials were not continued. Numbers above each lane correspond to the animal ID-s presented in the table above. Q – m. quadriceps, B- m. biceps femoris, P – m. pectoralis.

      The knock-down of Septin-7 in the adult animals (where its expression is already low; see above) did not result in an appreciable further reduction. This led us to conclude that the role of Septin-7 is most pronounced in muscle development. In this framework, at the adult stage a possible function of Septin-7 in muscle regeneration following injury could be envisioned. This is demonstrated in Fiure 6 where we present that Septin-7 is upregulated following a mild injury. However, we believe, that a detailed examination of the role of Septin-7 in the regeneration is beyond the scope of the current manuscript and should be the basis of further studies.

      4) Regarding the impact of Septin-7 on differentiation, it could be problematic if the images with the resolution shown in Figure S4A-C were used for fusion index calculation. If those are just zoomed in representative images and the authors used other lower resolution, global view images for quantification, those images are needed to be shown. The authors may also need to elaborate on why they stained Desmin instead of MYH for quantification of the fusion index of myotubes (page 27). Desmin also marks mesenchymal cells.

      We apologize that the method used for fusion index calculation was not clear enough. Images in Figure S4A-C present the Septin-7 and actin cytoskeletal structure in proliferating myoblasts, before the induction of differentiation. Fusion index was determined in cultures where myotube differentiation was induced by reduced serum content (as described in Methods). We used desmin staining as the expression of this protein is present only in myotubes with 2 or more nuclei, where fusion of myoblasts has already started (see representative images below). Representative desmin-labeling images from control, scrambled and KD cultures are now included in Figure S5G at 5 days differentiated stage.

      Figure presents two examples (bottom row is now added to Figure S5 as panel G) of the desmin-specific immunostaining used for the calculation of fusion index in the different C2C12 cultures. Specific signals of desmin are present following the fusion of single nuclei myoblast into myotubes (green), while non-differentiated myoblasts did not show immunolabeling for desmin. Nuclei are stained with DAPI (blue).

      If Septin-7 is truly affecting differentiation, a decrease of MYH 2 expression can be readily detected by IHC or WB.

      We are grateful for the Reviewer´s suggestion. We have conducted immunocytochemistry and WB experiments in proliferating myoblasts and myotubes at day 5 of differentiation. As the figure below demonstrates, myosin heavy chain-specific immunolabeling could be detected only in differentiated samples, while myoblasts did not show positive signal. However, there is a significantly lower number of MYH2-positive myotubes in Septin-7 KD cultures as compared with the control and scrambled samples. In addition, we detected decreased WB signal for MYH2 in Septin-7 KD protein samples compared with their control counterparts.

      Figure presents the MYH2-specific immunostaining in the different C2C12 cultures. Specific signals of myosin heavy chain 2 (green) are present during myotube formation of differentiating cultures, however, less MYH2-positive myotubes are present in the Septin-7 KD cultures as a result of reduced capability of cells to fuse, here the DAPI-stained nuclei were only present. Proliferating myoblasts did not show specific immunolabeling for MYH2, as the confocal image and the appropriate part of the WB membranes show. We could also detect a decreased MYH2-specific labeling in Septin-7 KD samples as compared with the control ones using WB.

      Additionally, Septin-7 may also affect the migration or fusion of myoblasts instead of differentiation. The observation of altered cell morphology and filopodia/lamellipodia formation (Figure 3C) in Septin7-KD cells before differentiation also implies a potential role of Septin-7 in migration. This possibility should be at least discussed.

      We appreciate the Reviewer´s comment and suggestion. There are a few publication showing that alteration of septin (in some cases Septin-7) expression modifies the migration of different eukaryotic cell types, like in microvascular endothelial cells (PMID: 24451259), in human epithelial cells (PMID: 31905721), in neural crest cells (PMID: 2881782), and in human breast cancer or lung cancer cells (PMID: 27557506, 31558699, and 32516969). In the work of Li et al. (PMID:32382971) their findings revealed that miR-127-3p regulates myoblast proliferation by targeting Septin-7. In the present manuscript we described that Septin-7 modification alters myoblast fusion (Figure 3J), which is the accompanying phenomenon of differentiation. On the other hand, the effect of Septin-7 gene silencing on cell migration has been studied in detail and was presented to The Biophysical Society. The results are intended to be submitted as a separate manuscript.

      5) The image shown in Figure 5F does not support the pooled data showed in Figure 5C. The size of mitochondria is remarkably lager in Cre+ muscle (Fig 5E and 5F). The morphology of mitochondria in Cre+ muscle are apparently normal (Fig 5F), while the mitochondrial DNA content are drastically reduced (Figure 5H), which is an important discovery and deserved to be further confirmed by WB and/or qPCR for critical mitochondrial proteins (i.e. MTCOX, COXV, etc.).

      We thank the Reviewer for pointing out that the interpretation of images in Figure 5 was not clear enough. Based on this, and the on the clear request from the other Reviewer, a detailed evaluation of mitochondrial morphology was carried out and the panels of Figure 5 were redrawn and reorganized. The revised Figure 5 now presents the average Perimeter, the average Aspect Ratio, and the average Form Factor (panels C & H, for cross- & horizontal-sections, respectively), the relative distributions of the areas (panels D & I, for cross- & horizontal-sections, respectively), and the number of mitochondria normalized to fiber area (panel E, cross-sections). The mitochondrial DNA content is presented in panel J. As evidenced from these figures (and from the representative EM micro graphs), larger mitochondria, sometimes in large associations, are present in the muscles of Cre+ animals.

      Furthermore, gene expression of four essential mitochondrial proteins cytochrome oxidase 1 (COX1), cytochrome oxidase 2 (COX2), succinate dehydrogenase (SDH), and ATP synthase) were determined in RNA samples from different skeletal muscles of Cre- and Cre+ animals using qPCR. As the figure below demonstrates there was a tendency of decreased expression of the aforementioned genes in Cre+ muscle samples, however, significant difference between the Cre- and Cre+ data could not be detected.

      Figure represents the normalized mRNA expression of ATP synthase, SDH, COX1, and COX2 in Cre- (green) and Cre+ (red) samples isolated from m. quadriceps and m. pectoralis. Each gene expression was determined from 3 individual animals and a technical duplicate was used during the qPCR analysis. 36B4 gene encoding an acidic ribosomal phosphoprotein P0 was used as a normalizing gene.

      6) Figure 2 H & I: It is unclear whether the muscle force was normalized to the individual muscle weight.

      We are sorry about the incomplete representation and explanation of muscle force values. Figure 2F-I presents absolute force values without normalization to the cross sectional area. In order to answer the Reviewer´s comment the averages of normalized values are given in Table S3 in the modified manuscript.

      7) The IHC results in Figure 6B are confusing. There are no centrally located nuclei in the Pax7 alone image of Figure 6B but abundant in the Pax7 + H&E image. The brown color of DAB and the purple color of hematoxylin are hard to be distinguished.

      Images presenting the labeling of Pax7 (a transcription factor expressed in activated satellite cells) alone could not show centrally located nuclei, as the nuclei could only be visible when HE staining is applied. As the Reviewer mentioned brown color of DAB and the purple color of hematoxylin are sometimes difficult to distinguish, therefore, we first presented PAX7 expression visualized by DAB staining (localization was near the sarcolemma). In the next step we performed a double staining for PAX7 and HE to show both the cytoplasm and nuclei.

    1. Author Response:

      We have now revised the manuscript to address the helpful comments and criticisms from the reviewers. The revised manuscript includes additional experiments demonstrating that inclusion of Csn2/Cas9 in the in vitro assays does not suppress the disintegration activity of Cas1-Cas2 to favor integration. These additional factors do not confer strand selectivity on integration either. Furthermore, the results of integration reactions using substrates mimicking PAM-containing pre- spacers have also been added.

      New figures and figure modifications at a glance:

      1) The new Figure 2 shows Cas1-Cas2 reactions in a linear target site and the effects of Csn2 and/or Cas9 on proto-spacer insertion into this target (Reviewer 1).

      The original Figure 2 (with slight modifications) is now moved to ’Supplementary Data’ as Figure 2-figure supplement 2, and shows proto-spacer insertion by Cas1-Cas2 into a nicked linear target site (Reviewer 2). Figure 2 is the only one in the main set of figures that has been extensively modified.

      2) The new Figure 2-figure supplement 1 (under ‘Supplementary Data’) shows the effects of Csn2, Cas9 or both on proto-spacer integration-disintegration by Cas1-Cas2 when the target site is present in a supercoiled plasmid (Reviewer 1).

      3) The new Figure 4-figure supplement 1 lists the sequences of the full- and half-target sites used for the reactions shown in Figure 4 (Reviewer 2).

      4) The new Figure 2-figure supplement 3 shows the insertion properties of PAM-containing pre- spacer mimics in reactions with Cas1-Cas2 alone or supplemented with Csn2, Cas9 or both (Reviewer 1).

      5) The new Figure 6-figure supplement 1 gives a structural perspective of the trombone substrates used for the reactions shown in Figure 6B, C (Reviewer 1).

      6) The original Supplementary Figure S8 showing assays for PAM-specific cleavage by Cas1- Cas2 has been removed (Reviewer 1).

      7) There are no changes in the other figures under ‘Supplementary Data’, although several have new numbers consistent with the revisions made.

      Public Review (Reviewers #1 and #2):

      The present work is a critical extension of the in vitro biochemical activities of the Cas1- Cas2 complex described by Wright and Doudna (Nat Struct Mol Biol, 2016; 23: 876-883). We have kept all experimental conditions nearly identical to those used by these authors to make the results from the two studies directly comparable. Importantly, we now show that the prior model for proto-spacer integration into the CRISPR locus by Cas1-Cas2 is an oversimplification of a much more nuanced mechanism.

      While both reviewers recognize the importance of our findings in challenging the current thinking on the adaptation mechanism of CRISPR immunity, they express reservations as to whether the in vitro results recapitulate the in vivo mechanism of spacer acquisition. This seems to us to be too broad a criticism from which few (if any) biochemical experiments can be immune.

      Our key finding is that disintegration during the second step of proto-spacer integration generates a DNA structure that has all the hallmarks of a DNA damage intermediate that the bacterial repair machinery can readily process into an authentic integration product. We invoke no new or ad hoc mechanisms, and the model we propose fits neatly into the DNA gap-filling mechanisms known to operate in DNA transposition pathways.

      The proto-spacer is functionally a ‘micro-transposon’, whose shortness imposes severe torsional strain on the transposition intermediate that precedes the final integration product. In vitro experiments suggest that transcription is potentially capable of resolving this intermediate (Budhathoki et al., Nat Struct Mol Biol, 2020, 27: 489-99). In principle, replication can also accomplish this task. Our study now demonstrates that simply nicking the DNA (disintegration) is an equally effective solution for relieving the topological stress accompanying integration. DNA loose ends can then be readily tied up by the bacterial repair machinery.

      We concur with the concluding sentence of reviewer 2, “The simple conclusion that Cas1- Cas2 catalyzed hydrolysis of a phosphodiester may relieve strain and allow productive transposition to occur doesn’t get emphasized enough in my opinion.” We have now expanded on this point in the revised ‘Discussion’.

      Reviewer #1:

      In addition, the in vitro system used here is only partially reconstituted. The substrates lack a PAM sequence, which is necessary for protospacers to be incorporated in the correct orientation and may help direct the first integration event to the L-R junction. Presumably because of this all the reactions presented do not analyze the orientation of the incorporated prespacer sequence. Cas9 and Csn2 are also absent (as are other potentially required host factors), which are necessary for correct integration in vivo.

      1A. Strand specificity: The in vitro integration reactions with the Cas1-Cas2 complex were done using a protospacer of the optimal size (26 nt on each strand with the four 3’- proximal bases on each strand as unpaired). Either proto-spacer strand is equally competent to initiate the strand transfer reaction, as could be inferred from Figure 3 of the original submission. Here, reactions utilized modified proto-spacers that differed in their top and bottom strand lengths. They gave two insertion products (IP) each at the L-R (leader-repeat) and R-S (repeat-spacer) junctions of a normal target site. In modified targets in which integration was limited to just the L- R junction, two insertion products were formed. One panel of Figure 3 (which is retained in the revised manuscript) showing the four insertion products from the normal target (lane 10) and two from the modified targets (lanes 11-13) for a protospacer with 26 nt and 31 nt long strands is displayed below.

      The ability of either proto-spacer strand to initiate integration is now more directly shown in Figure 2 (new) of the revised manuscript. Here the labeled top or bottom strand of the proto- spacer (PS) gave insertion products (IP) at the L-R and R-S junctions of the target site. Panel B of Figure 2 (pasted below) demonstrates this result.

      1B. Cas9, Csn2 included reactions: The data for reactions containing Csn2 or Cas9 or both were not shown previously, as they did not alter Cas1-Cas2 activity by promoting strand specificity of integration or suppressing disintegration. These results are now shown in the revised Figure 2 (linear target) and the new Figure 2-figure supplement 1 (supercoiled target). Portions of these figures are shown below.

      The relevant revised text describing the lack of strand specificity to proto-spacer integration by Cas1-Cas2 and the Csn2/Cas9 effects on integration is pasted below.

      Page 15, lines 229-235.

      "Unlike orientation-specific proto-spacer integration in vivo, Cas1- Cas2 reactions in vitro showed no strand-specificity (Figure 2B). This bias-free insertion of the top or bottom strand from the proto-spacer was unchanged by the addition of Csn2 or Cas9 or both to the reactions (Figure 2C-E). These proteins, singly or in combiantion, also failed to stabilize proto-spacer integrations in the supercoiled plasmid target (Figure 2-figure supplement 1). Instead, they inhibited plasmid relaxation. Inhibition could occur at the level of integration per se or strand rotation during integration-disintegration"

      1C. PAM-containing substrates: We have now tested Cas1-Cas2 activity (with and without added Csn2 or Cas9 or both) on PAM-containing substrates that mimic ‘pre-spacers’, Figure 2- figure supplement 3 (new).

      In these substrates, a proto-spacer strand of the standard length (26 nt; lacking PAM or its complement) is inserted at the L-R junction with higher efficiency than the longer strand (containing PAM or its complement). Following the first integration at L-R, the pre-spacer mimics containing > 26 nt in one strand or both strands are inhibited in the second strand transfer to the R-S junction. A portion of Figure 2-figure supplement 3 illustrating theses points is shown below.

      The revised ‘Results’ section has the following added description of the activities of PAM- containing pre-spacer mimics.

      Pages 16-19, lines 265-297. Cas1-Cas2 activity on pre-spacer mimics carrying the PAM sequence

      "The strand cleavage and strand transfer steps of proto-spacer insertion at the CRISPR locus must engender safeguards against self-targeting of the inserted spacer as well as its non-functional orientation. However, no strand selectivity is seen in the in vitro Cas1-Cas2 reactions with already processed proto-spacers lacking the PAM sequence (Figures 2 and 3). By coordinating PAM- specific cleavage of a pre-spacer with transfer of this cleaved strand to the L-R junction, the inserted spacer will be in the correct orientation to generate a functional crRNA. To examine this possibility, we tested the integration characteristics of pre-spacer mimics containing the PAM sequence.

      The inclusion of PAM or PAM and its complement in the integration substrates (Figure 2- figure supplement 3A) did not confer strand specificity on reactions with Cas1-Cas2 alone or with added Csn2, Cas9 or both (Figure 2-figure supplement 3B-E). Optimal integration by Cas1-Cas2 occurred with the 26 nt strands of the native protospacer with their 4 nt 3’-overhangs (Figure 2- figure supplement 3B-E; lanes 2). The pre-spacer mimics containing one or both > 26 nt strands had reduced integration competence (Figure 2-figure supplement 3B-E; lanes 4). Even here, the 26 nt strand with the 4 nt overhang (Figure 2-figure supplement 3C; lane 4) was preferred in integration over the longer 29nt PAM-containing strand (Figure 2-figure supplement 3D; lane 4) or the 33 nt PAM complement-containing strand (Figure 2-figure supplement 3E; lane 4). In contrast to the processed proto-spacer that gave nearly equal integration at L-R and R-S, IP(L- R) ≈ IP(R-S) (Figure 2-figure supplement 3B-E; lanes 2), the longer pre-spacer mimics were inhibited in integration at R-S, IP(L-R) > IP(R-S) (Figure 2-figure supplement 3B-E lanes 4). This is the expected outcome if the initial strand transfer occurs at L-R, and a ruler-like mechanism orients the reactive 3’-hydroxyl for the second strand transfer at R-S. This sequential two-step scheme for proto-spacer integration is consistent with the results shown in Figure 3 as well. These reaction features were not modulated by Csn2 or Cas9 (Figure 2-figure supplement 3B-E; lanes 6 and 8), although Csn2 plus Cas9 was inhibitory (Figure 2-figure supplement 3B-E; lanes 10).

      There is no evidence for integration accompanying PAM-specific cleavage in our in vitro reactions. In the E. coli CRISPR system, Cas1-Cas2 is apparently sufficient for PAM-specific cleavage in vitro (22). By contrast, in the S. pyogenes system, cleavage is attributed to Cas9 or as yet uncharacterized bacterial nuclease(s) (35). The mechanism for generating an integration- proficient and orientation-specific proto-spacer, which may not be conserved among CRISPR systems, is poorly understood at this time."

    1. Author response:

      Reviewer #1 (Public Review):

      This is an important and very well conducted study providing novel evidence on the role of zinc homeostasis for the control of infection with the intracellular bacterium S. typhimurium also disentangling the underlying mechanisms and providing clear evidence on the importance of spatio-temporal distribution of (free) zinc within the cell.

      We thank the reviewer for the positive comments.

      1) It would be important to provide more information on the genotype of mice.

      As suggested by the reviewer, we have added the detailed genotype of Slc30a1flagEGFP/+ and Slc30a1fl/flLysMCre mice to the revised supplementary Figure supplement 10.

      2) It is rather unlikely that C57Bl6 mice survive up to two weeks after i.p. injection of 1x10E5 bacteria.

      According to the reviewer comment, we have tested survival rate using a group of our experimental animals and C57BL/6 wild type.

      The Salmonella stain is a gift from our friend, Professor Ge Bao-xue. We have sent this stain for genetic characterisation which we found 100% identity to Salmonella enterica Typhimurium with many strains originated from poultry. One of them is Salmonella enterica subsp. enterica serovar Typhimurium strain MeganVac1 (Accession: CP112994.1), a live attenuated stain. We hope that this would support the relationship between the high infectious dose and mice survive.

      Author response image 1.

      (A) Survival rate of Slc30a1fl/fl and Slc30a1fl/flLysMCre (n = 14-15/group) and (B) Survival rate of C57BL/6 wild type (n = 8) after Salmonella infection for two weeks. (C) A fulllength sequence (1,478 bases) of 16S rDNA genes sequences of Salmonella stain and (D) the sequencing electropherogram.

      3) To be sure that macrophages Slc30A1 fl/fl LysMcre mice really have an impaired clearance of bacteria it would be important to rule out an effect of Slc30A1 deletion of bacterial phagocytosis and containment (f.e. evaluation of bacterial numbers after 30 min of infection).

      As the reviewer advised, we have repeated the experiment and measured the bacterial numbers after 30 min of infection (dashed line in A). The results show that there is no statistical difference in the bacterial numbers after 30 min between Slc30a1fl/flLysMCre and Slc30a1fl/fl BMDMs. Therefore, the reduction of bacterial numbers after 24 hours occurs due to the impairment of intracellular pathogen-killing capacity as the reviewer pointed out.

      Author respnse image 2.

      (A) Time course of the intracellular pathogen-killing capacity of Salmonellainfected Slc30a1fl/flLysMCre and Slc30a1fl/fl BMDMs measured in colony-forming units per ml (n = 5). (B) Fold change in Salmonella survival (CFU/mL) at different time points from A. (C) Representative images of Salmonella colonies on solid agar medium at 24 hours. Data are represented as mean ± SEM. P values were determined using 2-tailed unpaired Student’s t-test. P<0.05, *P<0.01, and ns, not significant.

      4) Does the addition of zinc to macrophages negatively affect iNOS transcription as previously observed for the divalent metal iron and is a similar mechanism also employed (CEBPß/NF-IL6 modulation) (Dlaska M et al. J Immunol 1999)?

      The reviewer has raised an important point here since free zinc also play a role in multiple levels of cellular signaling components (Kembe et al., 2015). Dlaska and colleague reported that NF-IL6, a protein responsible for iNOS transcription is negatively regulated by iron perturbation under IFNg/LPS stimulation in macrophages (Dlaska and Weiss, 1999). As the reviewer suggested, our results showed that zinc supplementation decreases the iNOS expression in macrophages after Salmonella infection, suggesting that free zinc might play a role in iNOS regulation.

      However, in Slc30a1fl/flLysMCre macrophages, despite increase intracellular free zinc, lacking Slc30a1 also induces Mt1, a zinc reservoir which might negatively affect NO production (Schwarz et al., 1995) or alternatively inhibits iNOS through NF-kB pathway (Cong et al., 2016) as reported by previous studies. Therefore, we couldn’t rule out the possibility that defects in Salmonella clearance due to iNOS/NO inhibition may be caused by a complex combination of excess free zinc and overexpression of the zinc reservoir. To prove this hypothesis, further studies using the specific target, for example Mtfl/fliNOSfl/flLysMCre model might be needed to investigate the precision mechanism.

      Author response image 3.

      RT-qPCR analysis of mRNA encoding Nos2 in BMDMs after infected with Salmonella and Salmonella plus ZnSO4 (20 μM) for 4 h.

      Reference:

      Dlaska M, Weiss G. 1999. Central role of transcription factor NF-IL6 for cytokine and ironmediated regulation of murine inducible nitric oxide synthase expression. The Journal of Immunology. 162:6171-6177, PMID: 10229861

      Kambe T, Tsuji T, Hashimoto A, Itsumura N. 2015. The physiological, biochemical, and molecular roles of zinc transporters in zinc homeostasis and metabolism. Physiological Reviews. 95:749-784. https://doi: 10.1152/physrev.00035.2014, PMID: 26084690

      Schwarz MA, Lazo JS, Yalowich JC, Allen WP, Whitmore M, Bergonia HA, Tzeng E, Billiar TR, Robbins PD, Lancaster JR Jr, et al. 1995. Metallothionein protects against the cytotoxic and DNA-damaging effects of nitric oxide. Proceedings of the National Academy of Sciences of the United States of America. 92: 4452-4456. https://doi: 10.1073/pnas.92.10.4452, PMID: 7538671

      Cong W, Niu C, Lv L, Ni M, Ruan D, Chi L, Wang Y, Yu Q, Zhan K, Xuan Y, Wang Y, Tan Y, Wei T, Cai L, Jin L. 2016. Metallothionein prevents age-associated cardiomyopathy via inhibiting NF-κB pathway activation and associated nitrative damage to 2-OGD. Antioxidants & Redox Signaling. 25: 936-952. https://doi: 10.1089/ars.2016.6648, PMID: 27477335

      5) How does Zinc or TPEN supplementation to bacteria in LB medium affect the log growth of Salmonella?

      We found that zinc supplementation at both low (20 µM) and high (640 µM) concentrations negatively effects Salmonella growth, especially during log phase and stationary phase in the broth culture medium, but not TPEN (20 µM) supplementation. These indicates that high zinc conditions occur at cellular levels such as within phagosomes (Botella et al., 2011) can limit bacterial growth.

      Author response image 4.

      Growth curve (optical density, OD 600 nm) of Salmonella in LB medium at different concentrations of ZnSO4 and/or TPEN. Bar graph indicating Salmonella growth at specific time points. Each value was expressed as mean of triplicates for each testing and data were determined using 2-tailed unpaired Student’s t-test. P<0.05, P<0.01, **P<0.001 and ns, not significant.

      Reference:

      Botella H, Peyron P, Levillain F, Poincloux R, Poquet Y, Brandli I, Wang C, Tailleux L, Tilleul S, Charrière GM, Waddell SJ, Foti M, Lugo-Villarino G, Gao Q, Maridonneau-Parini I, Butcher PD, Castagnoli PR, Gicquel B, de Chastellier C, Neyrolles O. 2011. Mycobacterial p(1)-type ATPases mediate resistance to zinc poisoning in human macrophages. Cell Host Microbe. 10:248-59. https://doi: 10.1016/j.chom.2011.08.006, PMID: 21925112

      Reviewer #2 (Public Review):

      This paper explores the importance of zinc metabolism in host defense against the intracellular pathogen Salmonella Typhimurium. Using conditional mice with a deletion of the Slc30a1 zinc exporter, the authors show a critical role for zinc homeostasis in the pathogenesis of Salmonella. Specifically, mice deficient in Slc30a1 gene in LysM+ myeloid cells are hypersusceptible to Salmonella infection, and their macrophages show alter phenotypes in response to Salmonella. The study adds important new information on the role metal homeostasis plays in microbe host interactions. Despite the strengths, the manuscript has some weaknesses. The authors conclude that lack of slc30a1 in macrophages impairs nos2-dependent anti-Salmonella activity. However, this idea is not tested experimentally. In addition, the research presented on Mt1 is preliminary. The text related to Figure 7 could be deleted without affecting the overall impact of the findings.

      We thank the reviewer for his/her positive comments and constructive suggestions.

      Reviewer #3 (Public Review):

      Na-Phatthalung et al observed that transcripts of the zinc transporter Slc30a1 was upregulated in Salmonella-infected murine macrophages and in human primary macrophages therefore they sought to determine if, and how, Slc30a1 could contribute to the control of bacterial pathogens. Using a reporter mouse the authors show that Slc30a1 expression increases in a subset of peritoneal and splenic macrophages of Salmonella-infected animals. Specific deletion of Slc30a1 in LysM+ cells resulted in a significantly higher susceptibility of mice to Salmonella infection which, counter to the authors conclusions, is not explained by the small differences in the bacterial burden observed in vivo and in vitro. Although loss of Slc30a1 resulted in reduced iNOS levels in activated macrophages, the study lacks experiments that mechanistically link loss of NO-mediated bactericidal activity to Salmonella survival in Slc30a1 deficient cells. The additional deletion of Mt1, another zinc binding protein, resulted in even lower nitrite levels of activated macrophages but only modest effects on Salmonella survival. By combining genetic approaches with molecular techniques that measure variables in macrophage activation and the labile zinc pool, Na-Phattalung et al successfully demonstrate that Slc30a1 and metallothionein 1 regulate zinc homeostasis in order to modulate effective immune responses to Salmonella infection. The authors have done a lot of work and the information that Slc30a1 expression in macrophages contributes to control of Salmonella infection in mice is a new finding that will be of interest to the field. Whether the mechanism by which SLC30A1 controls bacterial replication and/or lethality of infection involves nitric oxide production by macrophages remains to be shown.

      We very much appreciate the reviewer’s detailed evaluation and suggestions. The manuscript has been revised thoroughly according to the reviewer’s advice.

    1. Author Response

      eLife assessment:

      This study addresses whether the composition of the microbiota influences the intestinal colonization of encapsulated vs unencapsulated Bacteroides thetaiotaomicron, a resident micro-organism of the colon. This is an important question because factors determining the colonization of gut bacteria remain a critical barrier in translating microbiome research into new bacterial cell-based therapies. To answer the question, the authors develop an innovative method to quantify B. theta population bottlenecks during intestinal colonization in the setting of different microbiota. Their main finding that the colonization defect of an acapsular mutant is dependent on the composition of the microbiota is valuable and this observation suggests that interactions between gut bacteria explains why the mutant has a colonization defect. The evidence supporting this claim is currently insufficient. Additionally, some of the analyses and claims are compromised because the authors do not fully explain their data and the number of animals is sometimes very small.

      Thank you for this frank evaluation. Based on the Reviewers’ comments, the points raised have been addressed by improving the writing (apologies for insufficient clarity), and by the addition of data that to a large extent already existed or could be rapidly generated. In particularly the following data has been added:

      1. Increase to n>=7 for all fecal time-course experiments

      2. Microbiota composition analysis for all mouse lines used

      3. Data elucidating mechanisms of SPF microbiome/ host immune mechanisms restriction of acapsular B. theta

      4. Short- versus long-term recolonization of germ-free mice with a complete SPF microbiota and assessment of the effect on B. theta colonization probability.

      5. Challenge of B. theta monocolonized mice with avirulent Salmonella to disentangle effects of the host inflammatory response from other potential explanations of the observations.

      6. Details of all inocula used

      7. Resequencing of all barcoded strains

      Additionally, we have improved the clarity of the text, particularly the methods section describing mathematical modeling in the main text. Major changes in the text and particularly those replying to reviewers comment have been highlighted here and in the manuscript.

      Reviewer #1 (Public Review):

      The study addresses an important question - how the composition of the microbiota influences the intestinal colonization of encapsulated vs unencapsulated B. theta, an important commensal organism. To answer the question, the authors develop a refurbished WITS with extended mathematical modeling to quantify B. theta population bottlenecks during intestinal colonization in the setting of different microbiota. Interestingly, they show that the colonization defect of an acapsular mutant is dependent on the composition of the microbiota, suggesting (but not proving) that interactions between gut bacteria, rather than with host immune mechanisms, explains why the mutant has a colonization defect. However, it is fairly difficult to evaluate some of the claims because experimental details are not easy to find and the number of animals is very small. Furthermore, some of the analyses and claims are compromised because the authors do not fully explain their data; for example, leaving out the zero values in Fig. 3 and not integrating the effect of bottlenecks into the resulting model, undermines the claim that the acapsular mutant has a longer in vivo lag phase.

      We thank the reviewer for taking time to give this details critique of our work, and apologies that the experimental details were insufficiently explained. This criticism is well taken. Exact inoculum details for experiment are now present in each figure (or as a supplement when multiple inocula are included). Exact microbiome composition analysis for OligoMM12, LCM and SPF microbiota is now included in Figure 2 – Figure supplement 1.

      Of course, the models could be expanded to include more factors, but I think this comment is rather based on the data being insufficiently clearly explained by us. There are no “zero values missing” from Fig. 3 – this is visible in the submitted raw data table (excel file Source Data 1), but the points are fully overlapped in the graph shown and therefore not easily discernable from one another. Time-points where no CFU were recovered were plotted at a detection limit of CFU (50 CFU/g) and are included in the curve-fitting. However, on re-examination we noticed that the curve fit was carried out on the raw-data and not the log-normalized data which resulted in over-weighting of the higher values. Re-fitting this data does not change the conclusions but provides a better fit. These experiments have now been repeated such that we now have >=7 animals in each group. This new data is presented in Fig. 3C and D and Fig. 3 Supplement 2.

      Limitations:

      1) The experiments do not allow clear separation of effects derived from the microbiota composition and those that occur secondary to host development without a microbiota or with a different microbiota. Furthermore, the measured bottlenecks are very similar in LCM and Oligo mice, even though these microbiotas differ in complexity. Oligo-MM12 was originally developed and described to confer resistance to Salmonella colonization, suggesting that it should tighten the bottleneck. Overall, an add-back experiment demonstrating that conventionalizing germ-free mice imparts a similar bottleneck to SPF would strengthen the conclusions.

      These are excellent suggestions and have been followed. Additional data is now presented in Figure 2 – figure supplement 8 showing short, versus long-term recolonization of germ-free mice with an SPF microbiota and recovering very similar values of beta, to our standard SPF mouse colony. These data demonstrate a larger total niche size for B. theta at 2 days post-colonization which normalizes by 2 weeks post-colonization. Independent of this, the colonization probability, is already equivalent to that observed in our SPF colony at day 2 post-colonization. Therefore, the mechanisms causing early clonal loss are very rapidly established on colonization of a germ-free mouse with an SPF microbiota. We have additionally demonstrated that SPF mice do not have detectable intestinal antibody titers specific for acapsular B. theta. (Figure 2 – figure supplement 7), such that this is unlikely to be part of the reason why acapsular B. theta struggles to colonize at all in the context of an SPF microbiota. Experiments were also carried to detect bacteriophage capable of inducing lysis of B. theta and acapsular B. theta from SPF mouse cecal content (Figure 2 – figure supplement 7). No lytic phage plaques were observed. However, plaque assays are not sensitive for detection of weakly lytic phage, or phage that may require expression of surface structures that are not induced in vitro. We can therefore conclude that the restrictive activity of the SPF microbiota is a) reconstituted very fast in germ-free mice, b) is very likely not related to the activity of intestinal IgA and c) cannot be attributed to a high abundance of strongly lytic bacteriophage. The simplest explanation is that a large fraction of the restriction is due to metabolic competition with a complex microbiota, but we cannot formally exclude other factors such as antimicrobial peptides or changes in intestinal physiology.

      2) It is often difficult to evaluate results because important parameters are not always given. Dose is a critical variable in bottleneck experiments, but it is not clear if total dose changes in Figure 2 or just the WITS dose? Total dose as well as n0 should be depicted in all figures.

      We apologized for the lack of clarity in the figures. Have added panels depicting the exact inoculum for each figure legend (or a supplementary figure where many inocula were used). Additionally, the methods section describing how barcoded CFU were calculated has been rewritten and is hopefully now clearer.

      3) This is in part a methods paper but the method is not described clearly in the results, with important bits only found in a very difficult supplement. Is there a difference between colonization probability (beta) and inoculum size at which tags start to disappear? Can there be some culture-based validation of "colonization probability" as explained in the mathematics? Can the authors contrast the advantages/disadvantages of this system with other methods (e.g. sequencing-based approaches)? It seems like the numerator in the colonization probability equation has a very limited range (from 0.18-1.8), potentially limiting the sensitivity of this approach.

      We apologized for the lack of clarity in the methods. This criticism is well taken, and we have re-written large sections of the methods in the main text to include all relevant detail currently buried in the extensive supplement.

      On the question of the colonization probability and the inoculum size, we kept the inoculum size at 107 CFU/ mouse in all experiments (except those in Fig.4, where this is explicitly stated); only changing the fraction of spiked barcoded strains. We verified the accuracy of our barcode recovery rate by serial dilution over 5 logs (new figure added: Figure 1 – figure supplement 1). “The CFU of barcoded strains in the inoculum at which tags start to disappear” is by definition closely related to the colonization probability, as this value (n0) appears in the calculation. Note that this is not the total inoculum size – this is (unless otherwise stated in Fig. 4) kept constant at 107 CFU by diluting the barcoded B. theta with untagged B. theta. Again, this is now better explained in all figure legends and the main text.

      We have added an experiment using peak-to-trough ratios in metagenomic sequencing to estimate the B. theta growth rate. This could be usefully employed for wildtype B. theta at a relatively early timepoint post-colonization where growth was rapid. However, this is a metagenomics-based technique that requires the examined strain to be present at an abundance of over 0.1-1% for accurate quantification such that we could not analyze the acapsular B. theta strain in cecum content at the same timepoint. These data have been added (Figure 3 – figure supplement 3). Note that the information gleaned from these techniques is different. PTR reveals relative growth rates at a specific time (if your strain is abundant enough), whereas neutral tagging reveals average population values over quite large time-windows. We believe that both approaches are valuable. A few sentences comparing the approaches have been added to the discussion.

      The actual numerator is the fraction of lost tags, which is obtained from the total number of tags used across the experiment (number of mice times the number of tags lost) over the total number of tags (number of mice times the number of tags used). Very low tag recovery (less than one per mouse) starts to stray into very noisy data, while close to zero loss is also associated with a low-information-to-noise ratio. Therefore, the size of this numerator is necessarily constrained by us setting up the experiments to have close to optimal information recovery from the WITS abundance. Robustness of these analyses is provided by the high “n” of between 10 and 17 mice per group.

      4) Figure 3 and the associated model is confusing and does not support the idea that a longer lag-phase contributes to the fitness defect of acapsular B.theta in competitive colonization. Figure 3B clearly indicates that in competition acapsular B. theta experiences a restrictive bottleneck, i.e., in competition, less of the initial B. theta population is contributed by the acapsular inoculum. There is no need to appeal to lag-phase defects to explain the role of the capsule in vivo. The model in Figure 3D should depict the acapsular population with less cells after the bottleneck. In fact, the data in Figure 3E-F can be explained by the tighter bottleneck experienced by the acapsular mutant resulting in a smaller acapsular founding population. This idea can be seen in the data: the acapsular mutant shedding actually dips in the first 12-hours. This cannot be discerned in Figure 3E because mice with zero shedding were excluded from the analysis, leaving the data (and conclusion) of this experiment to be extrapolated from a single mouse.

      We of course completely agree that this would be a correct conclusion if only the competitive colonization data is taken into account. However, we are also trying to understand the mechanisms at play generating this bottleneck and have investigated a range of hypotheses to explain the results, taking into account all of our data.

      Hypothesis 1) Competition is due to increased killing prior to reaching the cecum and commencing growth: Note that the probability of colonization for single B. theta clones is very similar for OligoMM12 mouse single-colonization by the wildtype and acapsular strains. For this hypothesis to be the reason for outcompetition of the acapsular strain, it would be necessary that the presence of wildtype would increase the killing of acapsular B. theta in the stomach or small intestine. The bacteria are at low density at this stage and stomach acid/small intestinal secretions should be similar in all animals. Therefore, this explanation seems highly unlikely

      Hypothesis 2) Competition between wildtype and acapsular B. theta occurs at the point of niche competition before commencing growth in the cecum (similar to the proposal of the reviewer). It is possible that the wildtype strain has a competitive advantage in colonizing physical niches (for example proximity to bacteria producing colicins). On the basis of the data, we cannot exclude this hypothesis completely and it is challenging to measure directly. However, from our in vivo growth-curve data we observe a similar delay in CFU arrival in the feces for acapsular B. theta on single colonization as in competition, suggesting that the presence of wildtype (i.e., initial niche competition) is not the cause of this delay. Rather it is an intrinsic property of the acapsular strain in vivo,

      Hypothesis 3) Competition between wildtype and acapsular B. theta is mainly attributable to differences in growth kinetics in the gut lumen. To investigate growth kinetics, we carried our time-courses of fecal collection from OligoMM12 mice single-colonized with wildtype or acapsular B. theta, i.e., in a situation where we observe identical colonization probabilities for the two strains. These date, shown now in Figure 3 C and D and Figure 3 – figure supplement 2, show that also without competition, the CFU of acapsular B. theta appear later and with a lower net growth rate than the wildtype. As these single-colonizations do not show a measurable difference between the colonization probability for the two strains, it is not likely that the delayed appearance of acapsular B. theta in feces is due to increased killing (this would be clearly visible in the barcode loss for the single-colonizations). Rather the simplest explanation for this observation is a bona fide lag phase before growth commences in the cecum. Interestingly, using only the lower net growth rate (assumed to be a similar growth rate but increased clearance rate) produces a good fit for our data on both competitive index and colonization probability in competition (Figure 3, figure supplement 5). This is slightly improved by adding in the observed lag-phase (Figure 3). It is very difficult to experimentally manipulate the lag phase in order to directly test how much of an effect this has on our hypothesis and the contribution is therefore carefully described in the new text.

      Please note that all data was plotted and used in fitting in Fig 3E, but “zero-shedding” is plotted at a detection limit and overlayed, making it look like only one point was present when in fact several were used. This was clear in the submitted raw data tables. To sure-up these observations we have repeated all time-courses and now have n>=7 mice per group.

      5) The conclusions from Figure 4 rely on assumptions not well-supported by the data. In the high fat diet experiment, a lower dose of WITS is required to conclude that the diet has no effect. Furthermore, the authors conclude that Salmonella restricts the B. theta population by causing inflammation, but do not demonstrate inflammation at their timepoint or disprove that the Salmonella population could cause the same effect in the absence of inflammation (through non-inflammatory direct or indirect interactions).

      We of course agree that we would expect to see some loss of B. theta in HFD. However, for these experiments the inoculum was ~109 CFUs/100μL dose of untagged strain spiked with approximately 30 CFU of each tagged strain. Decreasing the number of each WITS below 30 CFU leads to very high variation in the starting inocula from mouse-to-mouse which massively complicates the analysis. To clarify this point, we have added in a detection-limit calculation showing that the neutral tagging technique is not very sensitive to population contractions of less than 10-fold, which is likely in line with what would be expected for a high-fat diet feeding in monocolonized mice for a short time-span.

      This is a very good observation regarding our Salmonella infection data. We have now added the fecal lipocalin 2 values, as well as a group infected with a ssaV/invG double mutant of S. Typhimurium that does not cause clinical grade inflammation (“avirulent”). This shows 1) that the attenuated S. Typhimurium is causing intestinal inflammation in B. theta colonized mice and 2) that a major fraction of the population bottleneck can be attributed to inflammation. Interestingly, we do observe a slight bottleneck in the group infected with avirulent Salmonella which could be attributable either to direct toxicity/competition of Salmonella with B. theta or to mildly increased intestinal inflammation caused by this strain. As we cannot distinguish these effects, this is carefully discussed in the manuscript.

      6) Several of the experiments rely on very few mice/groups.

      We have increased the n to over 5 per group in all experiments (most critically those shown in Fig 3, Supplement 5). See figure legends for specific number of mice per experiment.

      Reviewer #2 (Public Review):

      The goal of this study was to understand population bottlenecks during colonization in the context of different microbial communities. Capsular polysaccharide mutants, diet, and enteric infection were also used paired to short-term monitoring of overall colonization and the levels of specific strains. The major strength of this study is the innovative approach and the significance of the overall research area.

      The first major limitation is the lack of clear and novel insight into the biology of B. theta or other gut bacterial species. The title is provocative, but the experiments as is do not definitively show that the microbiota controls the relative fitness of acapsular and wild-type strains or provide any mechanistic insights into why that would be the case. The data on diet and infection seem preliminary. Furthermore, many of the experiments conflict with prior literature (i.e., lack of fitness difference between acapsular and wild-type strain and lack of impact of diet) but satisfying explanations are not provided for the lack of reproducibility.

      In line with suggestions from Reviewer 1, the paper has undergone quite extensive re-writing to better explain the data presented and its consequences. Additionally, we now explicitly comment on apparent discrepancies between our reported data and the literature – for example the colonization defect of acapsular B. theta is only published for competitive colonizations, where we also observe a fitness defect so there is no actual conflict. Additionally, we have calculated detection limits for the effect of high-fat diet and demonstrate that a 10-fold reduction in the effective population size would not be robustly detected with the neutral tagging technique such that we are probably just underpowered to detect small effects, and we believe it is important to point out the numerical limits of the technique we present here. Additionally for the Figure 4 experiments, we have added data on colonization/competition with an avirulent Salmonella challenge giving some mechanistic data on the role of inflammation in the B. theta bottleneck.

      Another major limitation is the lack of data on the various background gut microbiotas used. eLife is a journal for a broad readership. As such, describing what microbes are in LCM, OligoMM, or SPF groups is important. The authors seem to assume that the gut microbiota will reflect prior studies without measuring it themselves.

      All gnotobiotic lines are bred as gnotobiotic colonies in our isolator facility. This is now better explained in the methods section. Additionally, 16S sequencing of all microbiotas used in the paper has been added as Figure 2 – figure supplement 1.

      I also did not follow the logic of concluding that any differences between SPF and the two other groups are due to microbial diversity, which is presumably just one of many differences. For example, the authors acknowledge that host immunity may be distinct. It is essential to profile the gut microbiota by 16S rRNA amplicon sequencing in all these experiments and to design experiments that more explicitly test the diversity hypotheses vs. alternatives like differences in the membership of each community or other host phenotypes.

      This is an important point. We have carried out a number of experiments to potentially address some issues here.

      1) We carried out B. theta colonization experiments in germ-free mice that had been colonized by gavage of SPF feces either 1 day prior to colonization of 2 weeks prior to colonization. While the shorter pre-colonization allowed B. theta to colonize to a higher population density in the cecum, the colonization probability was already reduced to levels observed in our SPF colony in the short pre-colonization. Therefore, the factors limiting B. theta establishment in the cecum are already established 1-2 days post-colonization with an SPF microbiota (Figure 2 - figure supplement 8). 2) We checked for the presence of secretory IgA capable of binding to the surface of live B. theta, compared to a positive control of a mouse orally vaccinated against B. theta. (Fig. 2, Supplement 7) and could find no evidence of specific IgA targeting B. theta in the intestinal lavages of our SPF mouse colony. 3) We isolated bacteriophage from the intestine of SPF mice and used this to infect lawns of B. theta wildtype and acapsular in vitro. We could not detect and plaque-forming phage coming from the intestine of SPF mice (Figure 2 – figure supplement 7).

      We can therefore exclude strongly lytic phage and host IgA as dominant driving mechanisms restricting B. theta colonization. It remains possible that rapidly upregulated host factors such as antimicrobial peptide secretion could play a role, but metabolic competition from the microbiota is also a very strong candidate hypothesis. The text regarding these experiments has been slightly rewritten to point out that colonization probability inversely correlates with microbiota complexity, and the mechanisms involved may involve both direct microbe-microbe interactions as well as host factors.

      Given the prior work on the importance of capsule for phage, I was surprised that no efforts are taken to monitor phage levels in these experiments. Could B. theta phage be present in SPF mice, explaining the results? Alternatively, is the mucus layer distinct? Both could be readily monitored using established molecular/imaging methods.

      See above: no plaque-forming phage could be recovered from the SPF mouse cecum content. The main replicative site that we have studied here, in mice, is the cecum which does not have true mucus layers in the same way as the distal colon and is upstream of the colon so is unlikely to be affected by colon geography. Rather mucus is well mixed with the cecum content and may behave as a dispersed nutrient source. There is for sure a higher availability of mucus in the gnotobiotic mice due to less competition for mucus degradation by other strains. However, this would be challenging to directly link to the B. theta colonization phenotype as Muc2-deficient mice develop intestinal inflammation.

      The conclusion that the acapsular strain loses out due to a difference of lag phase seems highly speculative. More work would be needed to ensure that there is no difference in the initial bottleneck; for example, by monitoring the level of this strain in the proximal gut immediately after oral gavage.

      This is an excellent suggestion and has been carried out. At 8h post-colonization with a high inoculum (allowing easy detection) there were identical low levels of B. theta in the upper and lower small intestine, but more B. theta wildtype than B. theta acapsular in the cecum and colon, consistent with commencement of growth for B. theta wildtype but not the acapsular strain at this timepoint. We have additionally repeated the single-colonization time-courses using our standard inoculum and can clearly see the delayed detection of acapsular B. theta in feces even in the single-colonization state when no increased bottleneck is observed. This can only be reasonably explained by a bona fide lag-phase extension for acapsular B. theta in vivo. These data also reveal and decreased net growth rate of acapsular B. theta. Interestingly, our model can be quite well-fitted to the data obtained both for competitive index and for colonization probability using only the difference in net growth rate. Adding the (clearly observed) extended lag-phase generates a model that is still consistent with our observations.

      Another major limitation of this paper is the reliance on short timepoints (2-3 days post colonization). Data for B. theta levels over 2 weeks or longer is essential to put these values in context. For example, I was surprised that B. theta could invade the gut microbiota of SPF mice at all and wonder if the early time points reflect transient colonization.

      It should be noted that “SPF” defines microbiota only on missing pathogens and not on absolute composition. Therefore, the rather efficient B. theta colonization in our SPF colony is likely due to a permissive composition and this is likely to be not at all reproducible between different SPF colonies (a major confounder in reproducibility of mouse experiments between institutions. In contrast the gnotobiotic colonies are highly reproducible). We do consistently see colonization of our SPF colony by wildtype B. theta out to at least 10 days post-inoculation (latest time-point tested) at similar loads to the ones observed in this work, indicating that this is not just transient “flow-through” colonization. Data included below:

      For this paper we were very specifically quantifying the early stages of colonization, also because the longer we run the experiments for, the more confounding features of our “neutrality” assumptions appear (e.g., host immunity selecting for evolved/phase-varied clones, within-host evolution of individual clones etc.). For this reason, we have used timepoints of a maximum of 2-3 days.

      Finally, the number of mice/group is very low, especially given the novelty of these types of studies and uncertainty about reproducibility. Key experiments should be replicated at least once, ideally with more than n=3/group.

      For all barcode quantification experiments we have between 10 and 17 mice per group. Experiments for the in vivo time-courses of colonization have been expanded to an “n” of at least 7 per group.

    1. Author Response:

      Reviewer #1 (Public Review):

      The authors report the generation of a mesoscale excitatory projectome from the ventrolateral prefrontal cortex (vlPFC) in the macaque brain by using AAV2/9-CaMKIIa-Tau-GFP labeling and imaging with high-throughput serial two-photon tomography. They present a novel data pipeline that integrates the STP data with macroscopic dMRI data from the same brain in a common 3D space, achieving a direct comparison of the two tracing methods. The analysis of the data revealed an interesting discrepancy between the high resolution STP data and the lower resolution dMRI data with respect to the extent of the frontal lobe projection through the inferior fronto-occipital fasciculus (IFOF) - the longest associative axon bundle in the human brain.

      The authors report the generation of a mesoscale excitatory projectome from the ventrolateral prefrontal cortex (vlPFC) in the macaque brain by using AAV2/9-CaMKIIa-Tau-GFP labeling and imaging with high-throughput serial two-photon tomography. They also present a novel data pipeline that integrates the STP data with macroscopic dMRI data from the same brain in a common 3D space, achieving a direct comparison of the two tracing methods. Overall the paper can serve as a how to example for analyzing large non-human primate brain data, though some parts of the paper can be improved and the interpretation of the data should also be further strengthened.

      We thank the reviewer for his positive evaluation of our manuscript.

      The methodological part should include more detail on image acquisition - speed of imaging, pixel residence time, total time for data acquisition of a single brain and data sizes. Also the time and hardware needed for the computational analysis should be included, including the registration to the common reference and the running time for the machine learning predictions - this should also include the F score for the axon detection.

      We thank the reviewer for pointing out these vital issues. We have added these technical details in the resubmitted manuscript.

      “High x-y resolution (0.95 μm/pixel) serial 2D images were acquired in the coronal plane at a z-interval of 200 μm across the entire macaque brain. The scanning time of a single field-of-view which contains 1024 by 1024 pixels was 1.629 s (i.e., pixel residence time was ~1.6 μs), as resulted in a continuous ~1 month scanning and ~5 TB STP tomography data for a single monkey brain.”

      “The data analysis was undertaken on a compute cluster with a 3.1 - 3.3 GHz 248 core CPU, 2.8 T of RAM, and 17472 CUDA cores.”

      “The total computational time for the machine learning predictions in one macaque brain was ~ 1.5 months.”

      “To evaluate overall classifier performance, the precision–recall F measure, also called F-score, was computed by using additional four labeled images as test sets. Higher accuracy performance achieved by the classifier often yield higher F-scores (94.41% ± 1.99%, mean ± S.E.M.).”

      “For registration to the 3D common space, it took half an hour approximately.”

      The discrepancy between the high resolution STP data and the lower resolution dMRI data with respect to the extent of the frontal lobe projection through the inferior fronto-occipital fasciculus seems puzzling. One would expect that the STP data would reveal more detail not less.. One possibility is that the Tau-GFP does not diffuse throughout the full axon arborization of the PFC neurons, resulting in a technical artifact. Can this be excluded to support the functional significance of the current data?

      We thank the reviewer for raising this important issue. We apologize for not providing sufficient details of the IFOF debate due to limited space and causing confusion. We have added literature background of the IFOF debate to the section of Introduction (also recommended by Reviewer #2). Thanks to the comments by Reviewer #2, the present finding provides direct support for the speculation that the IFOF of macaque monkeys may not exist in a mono-synaptic way.

      The AAV construct encoding cytoskeletal GFP (Tau-GFP) was used here to label all processes of the infected neuron, including axons and synaptic terminals. About 3 weeks of post-surgery survival time are usually sufficient to label intracerebral circuits in rodents (Lanciego and Wouterlood, 2020). We have extended the survival time to 2-3 months in order to achieve adequate labeling of axonal fibers and terminals in macaques.

      Regarding the extent of Tau-GFP diffuse, the STP images and high-resolution confocal microscopic analysis further showed differences in the morphology of axon fibers that populate the route and terminals of these axon fibers. Consistent with previous reports (Fuentes-Santamaria et al., 2009; Watakabe and Hirokawa, 2018), the axon fibers were thin and formed bouton-like varicosities in the terminal regions (MD, Figure 2—figure supplement 7D; caudate, Figure 2—figure supplement 7J; PFC, Figure 1—figure supplement 5A-D). Those results indicate that the Tau-GFP has reached axonal terminals.

      References:

      Fuentes-Santamaria V, Alvarado JC, McHaffie JG, Stein BE (2009) Axon Morphologies and Convergence Patterns of Projections from Different Sensory-Specific Cortices of the Anterior Ectosylvian Sulcus onto Multisensory Neurons in the Cat Superior Colliculus. Cereb Cortex 19:2902-2915.

      Lanciego JL, Wouterlood FG (2020) Neuroanatomical tract-tracing techniques that did go viral. Brain Struct Funct 225:1193-1224.

      Watakabe A, Hirokawa J (2018) Cortical networks of the mouse brain elaborate within the gray matter. Brain Struct Funct 223:3633-3652.

      Reviewer #2 (Public Review):

      The authors utilized viral vectors as neural tracers to delineate the connectivity map of the macaque vlPFC at the axonal level. There are three main goals of this study: 1) determine an effective viral vector for tract-tracing in the macaque brain, 2) delineate the detailed map of excitatory vlPFC projections to the rest of the brain, and 3) compare vlPFC connectivity between tracing and tractography results.

      We thank the reviewer for his/her constructive comments, to which we respond below.

      Accordingly, my comments are organized around each aim:

      1) This study demonstrates the advantage of viral tracing technique in targeting neuron type-specific pathways. The authors conducted injection experiments with three types of viral vectors and found success of AAV in labeling long-distance connections without causing fatal neurotoxicity in the monkey. This success extends the application of AAV from rodents to nonhuman primates. The fact that AAV specifically targets glutamatergic neurons makes it advantageous for mapping excitatory projections.

      Although the labeling efficacy of each viral vector type is described in the text, Fig. 2 does not present a clear comparison across viral vectors, despite such comparison for a thalamic injection in Fig. 2S. Without a comparable graph to Fig. 2E, it is unclear to what extent the VSV and lentivirus failed in labeling long-distance pathways.

      We thank the reviewer for the helpful suggestion. As suggested, we have added three new figures as Supplementary materials in the revised manuscript.

      Figure 2—figure supplement 2. Expression of GFP using VSV-△G injected into MD thalamus of the macaque brain. (A) GFP-labeled neurons were found in the MD thalamus ~5 days after injection of VSV-△G encoding Tau-GFP. (B) A magnified view illustrating the morphology of GFP-labeled neurons in the area outlined with a white box in (A). (C) Higher magnification view of GFP-positive axons.

      Figure 2—figure supplement 3. Expression of GFP using lentivirus injected into MD thalamus of the macaque brain. (A) Lentivirus construct was injected into the macaque thalamus and examined for transgene expression after ~9 months. (B) High power views of the dotted rectangle in panel A. (C) Magnified view of panel B. Note the presence of GFP-positive cells.

      Figure 2—figure supplement 4. Expression of GFP using AAV2/9 injected into MD thalamus of the macaque brain. (A) GFP-labeled axons were observed in the subcortical regions ~42 days after injection of AAV2/9 encoding Tau-GFP in MD thalamus. The inset shows the injection site in MD thalamus. Two dashed line boxes enclose the regions of interest: frontal white matter and ALIC, whose GFP signal are magnified in (B) and (C), respectively. (D) Higher magnification view of GFP-positive axons.

      2) The authors quantified connectivity strength by the GFP signal intensity using a machine-learning algorithm. Both the quantitative approach and the resulting excitatory projection map are important contributions to advancing our knowledge of vlPFC connectivity.

      However, several issues with the analysis lead to concerns about the connectivity result. First, the strength measure is based on axonal patterns in the terminal fields (which the authors refer to as "axon clusters"), detected by a machine-learning algorithm (page 25, lines 11-13). However, the actual synaptic connections are the small dot-looking signals in the background. These "green dots" are boutons on the dendritic trees. The density of boutons rather than the passing fibers reflects the density of synapses. The brief method description does not mention how the boutons are quantified, and it is unclear whether the signal was treated as the background noise and filtered out. Second, it is difficult for the reader to assess the robustness of the vlPFC connectivity patterns, due to these issues: i) It is unclear how many injection cases were used to generate the result reported in the subsection "Brain-wide excitatory projectome of vlPFC in macaques". The text mentions a singular "injection site" (page 8, line 12) and Fig. 4 shows a single site. However, there are three cases listed in Table 1. Is the result an average of all three cases? ii) Relatedly, it is unclear in which anatomical area the injection was placed for each case. Table 1 lists the site as "vlPFC" for all three cases, while the vlPFC contains areas 44, 45 and 12l. These areas have different projection patterns documented in the tract tracing literature. If different areas were injected in the three cases, they should be reported separately. iii) It is hard to compare the projection patterns with those reported in the literature. Conventionally, tract tracing studies report terminal fields by showing original labeling patterns in both cortical and subcortical regions without averaging within divided areas (see e.g. Petrides & Pandya, 2007, J Neurosci). It is hard to compare Fig. 3 with previous tract tracing studies to assess its robustness.

      We thank the reviewer for his/her constructive comments, to which we respond below.

      1). We appreciate the reviewer’s comment and sincerely apologize for not explaining this point clearly in our previous submission. The major concern is whether the axonal varicosities were likely to be treated as the background noise and removed by mistake. In fact, the dot-looking autofluorescence rather than the axonal varicosities were reduced through a machine-learning algorithm in segmentation. Hence we have provided new results and updated the “Materials and Methods” and “Discussion” sections in the revision accordingly.

      “Fluorescent images of primate (Abe et al., 2017) brain often contain high-intensity dot-looking background signal caused by accumulation of lipofuscin. Thanks to the broad emission spectrum of lipofuscin, dot-looking background and GFP-positive axonal varicosities are easily distinguishable from each other. For instance (Figure 1—figure supplement 4), axonal varicosities can be selectively excited in green channel, while dot-looking background lipofuscin usually present in both green channel and red channel. During quantitative analysis, a machine learning algorithm was adopted to reliably segment the GFP labelled axonal fibers including axonal varicosities, and remove the lipofuscin background (Arganda-Carreras et al., 2017; Gehrlach et al., 2020).”

      “One recent study compared results of terminal labelling using Synaptophysin-EGFP-expressing AAV (specifically labelling synaptic endings) with the cytoplasmic EGFP AAV (labelling axon fibers and synaptic endings). There was high correspondence between synaptic EGFP and cytoplasmic EGFP signals in target regions (Oh et al., 2014). Thus, we relied on quantifying GFP-positive pixels (containing signals from both axonal fibers and terminals) rather than the number of synaptic terminals, similarly done in recent reports (Oh et al., 2014; Gehrlach et al., 2020).”

      Figure 1—figure supplement 4. Difference between axonal varicosities and dot-looking background. STP images (A-D) and high-resolution confocal images (E-H) were acquired in green channel and the red channel. Synaptic terminals (indicated by white arrows) can be specifically excited in green channel, while dot-looking background lipofuscin (indicated by yellow arrows) can be visualized both in green channel and red channel. (C and G) No colocalization was found between axonal varicosities and dot-looking background. Axonal varicosities were easily distinguished from dot-looking background in the merged image. (D and H) The dot-looking autofluorescence rather than the axonal varicosities was reduced through a machine-learning algorithm.

      References:

      Abe H, Tani T, Mashiko H, Kitamura N, Miyakawa N, Mimura K, Sakai K, Suzuki W, Kurotani T, Mizukami H, Watakabe A, Yamamori T, Ichinohe N (2017) 3D reconstruction of brain section images for creating axonal projection maps in marmosets. J Neurosci Methods 286:102-113.

      Arganda-Carreras I, Kaynig V, Rueden C, Eliceiri KW, Schindelin J, Cardona A, Sebastian Seung H (2017) Trainable Weka Segmentation: a machine learning tool for microscopy pixel classification. Bioinformatics 33:2424-2426.

      Gehrlach DA, Weiand C, Gaitanos TN, Cho E, Klein AS, Hennrich AA, Conzelmann KK, Gogolla N (2020) A whole-brain connectivity map of mouse insular cortex. Elife 9.

      Oh SW et al. (2014) A mesoscale connectome of the mouse brain. Nature 508:207-214.

      2.1) We apologize for causing these confusions due to insufficient description in the main text. Now we have revised the description of the “Materials and Methods” section accordingly. Furthermore, we have made both the whole-brain serial two-photon data and high-resolution diffusion MRI data freely available to the community, as allows researchers in the field to perform further analyses that we have not done in the current study.

      “Three samples were injected with AAV in vlPFC, and two of them were able to be imaged with STP. Unfortunately, one sample became “loose” and fell off from the agar block after several weeks of imaging. So, the quantitative results were not shown in Figure 3.”

      2.2) We apologize for insufficient description of the precise location of the injection sites. We have revised the description of “Materials and Methods” section and provided a new figure to clarify the exact location of the injection sites.

      “Figure 3-4 and Figure 4—figure supplement 2-4 were derived from sample #8 with infected area in 45, 12l and 44 of vlPFC. Figure 1—figure supplement 6 was derived from sample #7 with infected area in 12l and 45 of vlPFC.”

      Figure 1—figure supplement 6. Representative fluorescent images showing injection site and major tracts of sample #7. (A) STP image of the injection site in vlPFC are shown overlaid with the monkey brain template (left hand side), mainly spanning areas 12l and 45a. (B) Confocal image of the AAV infected neurons (indicated by white arrows). (C-F) Representative confocal images of major tracts originating from vlPFC.

      2.3) We agree with the reviewer that most tract tracing studies report terminal fields by showing original labeling patterns. Several recent studies report the total volume of segmented GFP-positive pixels (Oh et al., 2014) or percentage of total labeled axons (Do et al., 2016; Gehrlach et al., 2020) to represent the connectivity strength, and other studies provide the projection density as well (Hunnicutt et al., 2016). We have provided both percentage of total labeled axons (Figure 3C right panel), projection density (Figure 3C left panel) and representative original fluorescent images (Figure. 4, Figure 4—figure supplement 2 and Figure 4—figure supplement 4) to demonstrate our projection data at different dimensions.

      References:

      Do JP, Xu M, Lee SH, Chang WC, Zhang S, Chung S, Yung TJ, Fan JL, Miyamichi K, Luo L, Dan Y (2016) Cell type-specific long-range connections of basal forebrain circuit. Elife 5.

      Gehrlach DA, Weiand C, Gaitanos TN, Cho E, Klein AS, Hennrich AA, Conzelmann KK, Gogolla N (2020) A whole-brain connectivity map of mouse insular cortex. Elife 9.

      Hunnicutt BJ, Jongbloets BC, Birdsong WT, Gertz KJ, Zhong H, Mao T (2016) A comprehensive excitatory input map of the striatum reveals novel functional organization. Elife 5.

      Oh SW et al. (2014) A mesoscale connectome of the mouse brain. Nature 508:207-214.

      3) Using the ground-truth from tract tracing to validate tractography results is a timely problem and this study showed promising consistency and discrepancy between the two modalities. Especially, the discrepancy between tracing and tractography data on the IFOF termination brings critical insights into a potential cross-species difference. The finding that IFOF does not reach the occipital cortex provides important support for the speculation that IFOF may not exist in monkeys (for a context of the IFOF debate see Schmahmann & Pandya, 2006, pp 445-446).

      I have minor concerns regarding the statistical robustness of the tracing-tractography comparison. The authors compared the vlPFC-CC-contralateral tract instead of a global connectivity pattern without justification. Why omitting other major tracts that connect with vlPFC? In addition, the results are shown for only one monkey, while two monkeys went through both tracer injection and dMRI scans. It is unclear how the results were chosen or whether the data were averaged.

      We apologize for not describing it clearly. The STP images were acquired in the coronal plane with high x-y resolution (0.95 μm/pixel), while the z resolution was relatively low (200 μm). The axonal connection information along z axis may be lost due to the present step size (relatively large) such that it is technically demanding to reconstruct the axonal density maps in sagittal or horizontal plane. Therefore, we focused on the vlPFC-CC-contralateral tract traveling along the coronal plane when quantifying the similarity coefficients along the anterior-posterior axis of the whole macaque brain, and omitted the tracts that were shown as dots in the coronal plane. We have revised it in the resubmitted manuscript.

      “GFP projection and probabilistic tract were plotted with the Dice coefficients and Pearson coefficients (R) along the anterior-posterior axis of the whole macaque brain. The Dice coefficients and Pearson coefficients were higher in dense projection regions, especially for the vlPFC-CC-contralateral tract (Figure 6A). To carry out a proof-of-principle investigation, we focused on the vlPFC-CC-contralateral tract that was reconstructed in 3D space by using STP and dMRI data, respectively.”

      With regard to the demonstration of dMRI data, we apologize for not making it clear in previous version. We have already revised Figure 6 and Figure 7 so that dMRI scans from different macaque monkeys were shown separately.

      Figure 6. Comparison of vlPFC connectivity profiles by STP tomography and diffusion tractography. (A) Percentage of projection, Probabilistic tracts, Dice coefficients and Pearson coefficients (R) were plotted along the anterior-posterior axis in the macaque brain. Blue and red colors indicate results of two dMRI data sets acquired from different macaque monkeys. (B, C) 3D visualization of the fiber tracts issued from the injection site in vlPFC to corpus callosum to the contralateral vlPFC by STP tomography and diffusion tractography. (D-F) Representative coronal slices of the diffusion tractography map and the axonal density map along the vlPFC-CC-contralateral tract, overlaid with the corresponding anatomical MR images. (G-J) GFP-labeled axon images as marked in Figure 6F were shown with magnified views. (H, J) correspond to high magnification images of the white boxes indicated in G and I, both of which presented a great deal of details about axonal morphology.

      Figure 7. Illustration of the inferior fronto-occipital fasciculus by diffusion tractography and STP. (A) The fiber tractography of IFOF (lateral view). Two inclusion ROIs at the external capsule (pink) and the anterior border of the occipital lobe (purple) were used and shown on the coronal plane. The IFOF stems from the frontal lobe, travels along the lateral border of the caudate nucleus and external/extreme capsule, forms a bowtie-like pattern and anchors into the occipital lobe. (B) The reconstructed traveling course of IFOF based on vlPFC projectome was shown in 3D space. (C) The Szymkiewicz-Simpson overlap coefficients between 2D coronal brain slices of the dMRI-derived IFOF tract and vlPFC projections were plotted along the anterior-posterior axis of the macaque brain. Blue and red colors indicate results of two dMRI data sets acquired from different macaque monkeys. Four cross-sectional slices (D-G) along the IFOF tracts were arbitrarily chosen to demonstrate the spatial correspondence between the diffusion tractography and axonal tracing of STP images. (D-G) The detected GFP signals (green) of vlPFC projectome and the IFOF tracts (red) obtained by diffusion tractography were overlaid on anatomical MRI images, with a magnified view of the box area. Evidently there was no fluorescent signal detected in the superior temporal area where the dMRI-derived IFOF tract passes through (G).

    1. Author Response

      Reviewer #1 (Public Review):

      The authors set out to extend modeling of bispecific engager pharmacology through explicit modelling of the search of T cells for tumour cells, the formation of an immunological synapse and the dissociation of the immunological synapse to enable serial killing. These features have not been included in prior models and their incorporation may improve the predictive value of the model.

      Thank you for the positive feedback.

      The model provides a number of predictions that are of potential interest- that loss of CD19, the target antigen, to 1/20th of its initial expression will lead to escape and that the bone marrow is a site where the tumour cells may have the best opportunity to develop loss variants due to the limited pressure from T cells.

      Thank you for the positive feedback.

      A limitation of the model is that adhesion is only treated as a 2D implementation of the blinatumomab mediated bridge between T cell and B cells- there is no distinct parameter related to the distinct adhesion systems that are critical for immunological synapse formation. For example, CD58 loss from tumours is correlated with escape, but it is not related to the target, CD19. While they begin to consider the immunological synapse, they don't incorporate adhesion as distinct from the engager, which is almost certainly important.

      We agree that adhesion molecules play critical roles in cell-cell interaction. In our model, we assumed these adhesion molecules are constant (or not showing difference across cell populations). This assumption made us to focus on the BiTE-mediated interactions.

      Revision: To clarify this point, we added a couple of sentences in the manuscript.

      “Adhesion molecules such as CD2-CD58, integrins and selectins, are critical for cell-cell interaction. The model did not consider specific roles played by these adhesion molecules, which were assumed constant across cell populations. The model performed well under this simplifying assumption”.

      In addition, we acknowledged the fact that “synapse formation is a set of precisely orchestrated molecular and cellular interactions. Our model merely investigated the components relevant to BiTE pharmacologic action and can only serve as a simplified representation of this process”.

      While the random search is a good first approximation, T cell behaviour is actually guided by stroma and extracellular matrix, which are non-isotropic. In a lymphoid tissue the stroma is optimised for a search that can be approximated as brownian, or more accurately, a correlated random walk, but in other tissues, particularly tumours, the Brownian search is not a good approximation and other models have been applied. It would be interesting to look at observations from bone marrow or other sites to determine the best approximating for the search related to BiTE targets.

      We agree that the tissue stromal factors greatly influence the patterns of T cell searching strategy. Our current model considered Brownian motion as a good first approximation for two reasons: 1) we define tissues as homogeneous compartments to attain unbiased evaluations of factors that influence BiTE-mediated cell-cell interaction, such as T cell infiltration, T: B ratio, and target expression. The stromal factors were not considered in the model, as they require spatially resolved tissue compartments to represent the gradients of stromal factors; 2) our model was primarily calibrated against in vitro data obtained from a “well-mixed” system that does not recapitulate specific considerations of tissue stromal factors. We did not obtain tissue-specific data to support the prediction of T cell movement. This is under current investigation in our lab. Therefore, we are cautious about assuming different patterns of T cell movement in the model when translating into in vivo settings. We acknowledged the limitation of our model for not considering the more physiologically relevant T-cell searching strategies.

      Revision: In the Discussion, we added a limitation of our model: “We assumed Brownian motion in the model as a good first approximation of T cell movement. However, T cells often take other more physiologically relevant searching strategies closely associated with many stromal factors. Because of these stromal factors, the cell-cell encounter probabilities would differ across anatomical sites.”

      Reviewer #3 (Public Review):

      Liu et al. combined mechanistic modeling with in vitro experiments and data from a clinical trial to develop an in silico model to describe response of T cells against tumor cells when bi-specific T cell engager (BiTE) antigens, a standard immunotherapeutic drug, are introduced into the system. The model predicted responses of T cell and target cell populations in vitro and in vivo in the presence of BiTEs where the model linked molecular level interactions between BiTE molecules, CD3 receptors, and CD19 receptors to the population kinetics of the tumor and the T- cells. Furthermore, the model predicted tumor killing kinetics in patients and offered suggestions for optimal dosing strategies in patients undergoing BiTE immunotherapy. The conclusions drawn from this combined approach are interesting and are supported by experiments and modeling reasonably well. However, the conclusions can be tightened further by making some moderate to minor changes in their approach. In addition, there are several limitations in the model which deserves some discussion.

      Strengths

      A major strength of this work is the ability of the model to integrate processes from the molecular scales to the populations of T cells, target cells, and the BiTE antibodies across different organs. A model of this scope has to contain many approximations and thus the model should be validated with experiments. The authors did an excellent job in comparing the basic and the in vitro aspects of their approach with in vitro data, where they compared the numbers of engaged target cells with T cells as the numbers of the BiTE molecules, the ratio of effector and target cells, and the expressions of the CD3 and CD19 receptors were varied. The agreement with the model with the data were excellent in most cases which led to several mechanistic conclusions. In particular, the study found that target cells with lower CD19 expressions escape the T cell killing.

      The in vivo extension of the model showed reasonable agreements with the kinetics of B cell populations in patients where the data were obtained from a published clinical trial. The model explained differences in B cell population kinetics between responders and non-responders and found that the differences were driven by the differences in the T cell numbers between the groups. The ability of the model to describe the in vivo kinetics is promising. In addition, the model leads to some interesting conclusions, e.g., the model shows that the bone marrow harbors tumor growth during the BiTE treatment. The authors then used the model to propose an alternate dosage scheme for BiTEs that needed a smaller dose of the drug.

      Thank you for the positive comments.

      Weaknesses

      There are several weaknesses in the development of the model. Multiscale models of this nature contain parameters that need to be estimated by fitting the model with data. Some these parameters are associated with model approximations or not measured in experiments. Thus, a common practice is to estimate parameters with some 'training data' and then test model predictions using 'test data'. Though Supplementary file 1 provides values for some of the parameters that appeared to be estimated, it was not clear which dataset were used for training and which for test. The confidence intervals of the estimated parameters and the sensitivity of the proposed in vivo dosage schemes to parameter variations were unclear.

      We agree with the reviewer on the model validation.

      Revision: To ensure reproducibility, we summarized model assumptions and parameter values/sources in the supplementary file 1. To mimic tumor heterogeneity and evolution process, we applied stochastic agent-based models, which are challenging to be globally optimized against the data. The majority of key parameters was obtained or derived from the literature. Details have been provided in the response to Reviewer 3 - Question 1. In our modeling process, we manually optimized sensitive coefficient (β) for base model using pilot in-vitro data and sensitive coefficient (β) for in-vivo model by re-calibrating against the in-vitro data at a low BiTE concentration. BiTE concentrations in patients (mostly < 2 ng/ml) is only relevant to the low bound of the concentration range we investigated in vitro (0.65-2000 ng/ml). We have added some clarification/limitation of this approach in the text (details are provided in the following question). We understand the concerns, but the agent-based modeling nature prevent us to do global optimization.

      The model appears to show few unreasonable behaviors and does not agree with experiments in several cases which could point to missing mechanisms in the model. Here are some examples. The model shows a surprising decrease in the T cell-target cell synapse formation when the affinity of the BiTEs to CD3 was increased; the opposite should have been more intuitive. The authors suggest degradation of CD3 could be a reason for this behavior. However, this probably could be easily tested by removing CD3 degradation in the model. Another example is the increase in the % of engaged effector cells in the model with increasing CD3 expressions does not agree well with experiments (Fig. 3d), however, a similar fold increase in the % of engaged effector cells in the model agrees better with experiments for increasing CD19 expressions (Fig. 3e). It is unclear how this can be explained given CD3 and CD19 appears to be present in similar copy numbers per cell (~104 molecules/cell), and both receptors bind the BiTE with high affinities (e.g., koff < 10-4 s-1).

      Thank you for pointing this out. The bidirectional effect of CD3 affinity on IS formation is counterintuitive. In a hypothetical situation when there is no CD3 downregulation, the bidirectional effect disappears (as shown below), consistent with our view that CD3 downregulation accounts for the counterintuitive behavior. We have included the simulation to support our point. From a conceptual standpoint, the inclusion of CD3 degradation means the way to maximize synapse formation is for the BiTE to first bind tumor antigen, after which the tumor-BiTE complex “recruits” a T cell through the CD3 arm.

      We agree that the model did not adequately capture the effect of CD3 expression at the highest BiTE concentration 100 ng/ml, while the effects at other BiTE concentrations were well captured (as shown below, left). The model predicted a much moderate effect of CD3 expression on IS formation at the highest concentration. This is partly because the model assumed rapid CD3 downregulation upon antibody engagement. We did a similar simulation as above, with moderate CD3 downregulation (as shown below, right). This increases the effect of CD3 expression at the highest BiTE concentration, consistent with experiments. Interestingly, a rapid CD3 downregulation rate, as we concluded, is required to capture data profiles at all other conditions. Considering BiTE concentration at 100 ng/ml is much higher than therapeutically relevant level in circulation (< 2 ng/ml), we did not investigate the mechanism underlying this inconsistent model prediction but we acknowledged the fact that the model under-predicted IS formation in Figure 3d. Notably, this discrepancy may rarely appear in our clinical predictions as the CD3 expression is low level and blood BiTE concentration is very low (< 2 ng/ml).

      Revision: we have made text adjustment to increase clarity on these points. In addition, we added: “The base model underpredicted the effect of CD3 expression on IS formation at 100 ng/ml BiTE concentration, which is partially because of the rapid CD3 downregulation upon BiTE engagement and assay variation across experimental conditions.”

      The model does not include signaling and activation of T cells as they form the immunological synapse (IS) with target cells. The formation IS leads to aggregation of different receptors, adhesion molecules, and kinases which modulate signaling and activation. Thus, it is likely the variations of the copy numbers of CD3, and the CD19-BiTE-CD3 will lead to variations in the cytotoxic responses and presumably to CD3 degradation as well. Perhaps some of these missing processes are responsible for the disagreements between the model and the data shown in Fig. 3. In addition, the in vivo model does not contain any development of the T cells as they are stimulated by the BiTEs. The differences in development of T cells, such as generation of dysfunctional/exhausted T cells could lead to the differences in responses to BiTEs in patients. In particular, the in vivo model does not agree with the kinetics of B cells after day 29 in non-responders (Fig. 6d); could the kinetics of T cell development play a role in this?

      We agree that intracellular signaling is critical to T cell activation and cytotoxic effects. IS formation, T cell activation, and cytotoxicity are a cascade of events with highly coordinated molecular and cellular interactions. Compared to the events of T cell activation and cytotoxicity, IS formation occurs at a relatively earlier time. As shown in our study, IS formation can occur at 2-5 min, while the other events often need hours to be observed. We found that IS formation is primarily driven by two intercellular processes: cell-cell encounter and cell-cell adhesion. The intracellular signaling would be initiated in the process of cell-cell adhesion or at the late stage of IS formation. We think these intracellular events are relevant but may not be the reason why our model did not adequately capture the profiles in Figure 3d at the highest BiTE concentrations. Therefore, we did not include intracellular signaling in the models. Another reason was that we simulated our models at an agent level to mimic the process of tumor evolution, which is computationally demanding. Intracellular events for each cell may make it more challenging computationally.

      T cell activation and exhaustion throughout the BiTE treatment is very complicated, time-variant and impacted by multiple factors like T cell status, tumor burden, BiTE concentration, immune checkpoints, and tumor environment. T cell proliferation and death rates are challenging to estimate, as the quantitative relationship with those factors is unknown. Therefore, T cell abundance (expansion) was considered as an independent variable in our model. T cell counts are measured in BiTE clinical trials. We included these data in our model to reveal expanded T cell population. Patients with high T cell expansion are often those with better clinical response. Notably, the T cell decline due to rapid redistribution after administration was excluded in the model. T cell abundance was included in the simulations in Figure 6 but not proof of concept simulations in Figure 7.

      In Figure 6d, kinetics of T cell abundance had been included in the simulations for responders and non-responders in MT103-211 study. Thus, the kinetics of T cell development can’t be used to explain the disagreement between model prediction and observation after day 29 in non-responders. The observed data is actually median values of B-cell kinetics in non-responders (N = 27) with very large inter-subject variation (baseline from 10-10000/μL), which makes it very challenging to be perfectly captured by the model. A lot of non-responders with severe progression dropped out of the treatment at the end of cycle 1, which resulted in a “more potent” efficacy in the 2nd cycle. This might be main reason for the disagreement.

      Variation in cytotoxic response was not included in our models. Tumor cells were assumed to be eradicated after the engagement with effecter cells, no killing rate or killing probability was implemented. This assumption reduced the model complexity and aligned well with our in-vitro and clinical data. Cytotoxic response in vivo is impacted by multiple factors like copy number of CD3, cytokine/chemokine release, tumor microenvironment and T cell activation/exhaustion. For example, the cytotoxic response and killing rate mediated by 1:1 synapse (ET) and other variants (ETE, TET, ETEE, etc.) are supposed to be different as well. Our model did not differentiate the killing rate of these synapse variants, but the model has quantified these synapse variants, providing a framework for us to address these questions in the future. We agree that differentiate the cytotoxic responses under different scenarios cell may improve model prediction and more explorations need to be done in the future.

      Revision: We added a discussion of the limitations which we believe is informative to future studies.

      “Our models did not include intracellular signaling processes, which are critical for T activation and cytotoxicity. However, our data suggests that encounter and adhesion are more relevant to initial IS formation. To make more clinically relevant predictions, the models should consider these intracellular signaling events that drive T cell activation and cytotoxic effects. Of note, we did consider the T cell expansion dynamics in organs as independent variable during treatment for the simulations in Figure 6. T cell expansion in our model is case-specific and time-varying.”

      References:

      Chen W, Yang F, Wang C, Narula J, Pascua E, Ni I, Ding S, Deng X, Chu ML, Pham A, Jiang X, Lindquist KC, Doonan PJ, Blarcom TV, Yeung YA, Chaparro-Riggers J. 2021. One size does not fit all: navigating the multi-dimensional space to optimize T-cell engaging protein therapeutics. MAbs 13:1871171. DOI: 10.1080/19420862.2020.1871171, PMID: 33557687

      Dang K, Castello G, Clarke SC, Li Y, AartiBalasubramani A, Boudreau A, Davison L, Harris KE, Pham D, Sankaran P, Ugamraj HS, Deng R, Kwek S, Starzinski A, Iyer S, Schooten WV, Schellenberger U, Sun W, Trinklein ND, Buelow R, Buelow B, Fong L, Dalvi P. 2021. Attenuating CD3 affinity in a PSMAxCD3 bispecific antibody enables killing of prostate tumor cells with reduced cytokine release. Journal for ImmunoTherapy of Cancer 9:e002488. DOI: 10.1136/jitc-2021-002488, PMID: 34088740

      Gong C, Anders RA, Zhu Q, Taube JM, Green B, Cheng W, Bartelink IH, Vicini P, Wang BPopel AS. 2019. Quantitative Characterization of CD8+ T Cell Clustering and Spatial Heterogeneity in Solid Tumors. Frontiers in Oncology 8:649. DOI: 10.3389/fonc.2018.00649, PMID: 30666298

      Mejstríková E, Hrusak O, Borowitz MJ, Whitlock JA, Brethon B, Trippett TM, Zugmaier G, Gore L, Stackelberg AV, Locatelli F. 2017. CD19-negative relapse of pediatric B-cell precursor acute lymphoblastic leukemia following blinatumomab treatment. Blood Cancer Journal 7: 659. DOI: 10.1038/s41408-017-0023-x, PMID: 29259173

      Samur MK, Fulciniti M, Samur AA, Bazarbachi AH, Tai YT, Prabhala R, Alonso A, Sperling AS, Campbell T, Petrocca F, Hege K, Kaiser S, Loiseau HA, Anderson KC, Munshi NC. 2021. Biallelic loss of BCMA as a resistance mechanism to CAR T cell therapy in a patient with multiple myeloma. Nature Communications 12:868. DOI: 10.1038/s41467-021-21177-5, PMID: 33558511

      Xu X, Sun Q, Liang X, Chen Z, Zhang X, Zhou X, Li M, Tu H, Liu Y, Tu S, Li Y. 2019. Mechanisms of relapse after CD19 CAR T-cell therapy for acute lymphoblastic leukemia and its prevention and treatment strategies. Frontiers in Immunology 10:2664. DOI: 10.3389/fimmu.2019.02664, PMID: 31798590

      Yoneyama T, Kim MS, Piatkov K, Wang H, Zhu AZX. 2022. Leveraging a physiologically-based quantitative translational modeling platform for designing B cell maturation antigen-targeting bispecific T cell engagers for treatment of multiple myeloma. PLOS Computational Biology 18: e1009715. DOI: 10.1371/journal.pcbi.1009715, PMID: 35839267

    1. Author Response

      Reviewer #1 (Public Review):

      This study examines the factors underlying the assembly of MreB, an actin family member involved in mediating longitudinal cell wall synthesis in rod-shaped bacteria. Required for maintaining rod shape and essential for growth in model bacteria, single molecule work indicates that MreB forms treadmilling polymers that guide the synthesis of new peptidoglycan along the longitudinal cell wall. MreB has proven difficult to work with and the field is littered with artifacts. In vitro analysis of MreB assembly dynamics has not fared much better as helpfully detailed in the introduction to this study. In contrast to its distant relative actin, MreB is difficult to purify and requires very specific conditions to polymerize that differ between groups of bacteria. Currently, in vitro analysis of MreB and related proteins has been mostly limited to MreBs from Gram-negative bacteria which have different properties and behaviors from related proteins in Gram-positive organisms.

      Here, Mao and colleagues use a range of techniques to purify MreB from the Gram-positive organism Geobacillus stearothermophilus, identify factors required for its assembly, and analyze the structure of MreB polymers. Notably, they identify two short hydrophobic sequences-located near one another on the 3-D structure-which are required to mediate membrane anchoring.

      With regard to assembly dynamics, the authors find that Geobacillus MreB assembly requires both interactions with membrane lipids and nucleotide binding. Nucleotide hydrolysis is required for interaction with the membrane and interaction with lipids triggers polymerization. These experiments appear to be conducted in a rigorous manner, although the salt concentration of the buffer (500mM KCl) is quite high relative to that used for in vitro analysis of MreBs from other organisms. The authors should elaborate on their decision to use such a high salt buffer, and ideally, provide insight into how it might impact their findings relative to previous work.

      Response 1.1. MreB proteins are notoriously difficult to maintain in a soluble form. Some labs deleted the N-terminal amphipathic or hydrophobic sequences to increase solubility, while other labs used full-length protein but high KCl concentration (300 mM KCl) (Harne et al, 2020; Pande et al., 2022; Popp et al, 2010; Szatmari et al, 2020). Early in the project, we tested many conditions and noticed that high KCl helped keeping a slightly better solubility of full length MreBGs, without the need for deleting a part of the protein. In addition, concentrations of salt > 100 mM would better mimic the conditions met by the protein in vivo. While 50-100 mM KCl is traditionally used in actin polymerization assays, physiological salt concentrations are around 100-150 mM KCl in invertebrates and vertebrates (Schmidt-Nielsen, 1975), around 50-250 in fungal and plant cells (Rodriguez-Navarro, 2000) and 200-300 mM in the budding yeast (Arino et al, 2010). However, cytoplasmic K+ concentration varies greatly (up to 800 mM) depending on the osmolality of the medium in both E. coli (Cayley et al, 1991; Epstein & Schultz, 1965; Rhoads et al, 1976), and B. subtilis, in which the basal intracellular concentration of KCl was estimated to be ~ 350 mM (Eisenstadt, 1972; Whatmore et al, 1990). 500 mM KCl can therefore be considered as physiological as 100 mM KCl for bacterial cells. Since we observed plenty of pairs of protofilaments at 500 mM KCl and this condition helped to avoid aggregation, we kept this high concentration as a standard for most of our experiments. Nonetheless, we had also performed TEM polymerization assays at 100 mM in line with most of MreB and F-actin in vitro literature, and found no difference in the polymerization (or absence of polymerization) conditions. This was indicated in the initial submission (e.g. M&M section L540 and footnote of Table S2) but since two reviewers bring it up as a main point, it is evident we failed at communicating it clearly, for which we apologize. This has been clarified in the revised version of the manuscript. We have also almost systematically added the 100 mM KCl concentration too as per reviewer #2 request and to conciliate our salt conditions with those used for some in vitro analysis of MreBs from other organisms (see also response to reviewer #2 comments 1A and 1B = Responses 2.1A, 2.1B below). We then decided to refer to the 100 mM KCl concentration as our “standard condition” in the revised version of the manuscript, but we compile and compare the results obtained at 500 mM too, as both concentrations are within the physiological range in Bacillus.

      Additionally, this study, like many others on MreB, makes much of MreB's relationship to actin. This leads to confusion and the use of unhelpful comparisons. For example, MreB filaments are not actin-like (line 58) any more than any polymer is "actin-like." As evidenced by the very beautiful images in this manuscript, MreB forms straight protofilaments that assemble into parallel arrays, not the paired-twisted polymers that are characteristic of F-actin. Generally, I would argue that work on MreB has been hindered by rather than benefitted from its relationship to actin (E.g early FP fusion data interpreted as evidence for an MreB endoskeleton supporting cell shape or depletion experiments implicating MreB in chromosome segregation) and thus such comparisons should be avoided unless absolutely necessary.

      Response 1.2. We completely agree with reviewer #1 regarding unhelpful comparisons of actin and MreB, and that work on MreB has been traditionally hindered from its relationship to eukaryotic actin. MreB is nonetheless a structural homolog of actin, with a close structural fold and common properties (polymerization into pairs of protofilaments, ATPase activity…). It still makes sense to refer to a protein with common features, common ancestry and widely studied as long as we don’t enclose our mind into a conceptual framework. This said, actin and MreB diverged very early in evolution, which may account for differences in their biochemical properties and cellular functions. Current data on MreB filaments confirm that they display F-actin-like and F-actin-unlike properties. We thank the reviewer for this insightful comment. We have revised the text to remove any inaccurate or unhelpful comparison to actin (in particular the ‘actin-like filaments’ statement, previously used once)

      Reviewer #2 (Public Review):

      The paper "Polymerization cycle of actin homolog MreB from a Gram-positive bacterium" by Mao et al. provides the second biochemical study of a gram-positive MreB, but importantly, the first study examines how gram-positive MreB filaments bind to membranes. They also show the first crystal structure of a MreB from a Gram-positive bacterium - in two nucleotide-bound forms, finally solving structures that have been missing for too long. They also elucidate what residues in Geobacillus MreB are required for membrane associations. Also, the QCM-D approach to monitoring MreB membrane associations is a direct and elegant assay.

      While the above findings are novel and important, this paper also makes a series of conclusions that run counter to multiple in vitro studies of MreBs from different organisms and other polymers with the actin fold. Overall, they propose that Geobacillus MreB contains biochemical properties that are quite different than not only the other MreBs examined so far but also eukaryotic actin and every actin homolog that has been characterized in vitro. As the conclusions proposed here would place the biochemical properties of Geobacillus MreB as the sole exception to all other actin fold polymers, further supporting experiments are needed to bolster these contrasting conclusions and their overall model.

      Response 2.0. We are grateful to reviewer #2 for stressing out the novelty and importance of our results. Most of our conclusions were in line with previous in vitro studies of MreBs (formation of pairs of straight filaments on a lipid layer, both ATP and GTP binding and hydrolysis, distortion of liposomes…), to the exception of the claimed requirement of NTP hydrolysis for membrane binding prior to polymerization based on the absence of pairs of filaments in free solution or in the presence of AMP-PNP in our experimental conditions (which we agree was not sufficient to make such a bold claim, see below). Thanks to the reviewer’s comments, we have performed many controls and additional experiments that lead us to refine our results and largely conciliate them with the literature. Please see the answer to the global review comments - our conclusions have been revised on the basis of our new data.

      1. (Difference 1) - The predominant concern about the in vitro studies that makes it difficult to evaluate many of their results (much less compare them to other MreB/s and actin homologs) is the use of a highly unconventional polymerization buffer containing 500(!) mM KCL. As has been demonstrated with actin and other polymers, the high KCl concentration used here (500mM) is certain to affect the polymerization equilibria, as increasing salt increases the hydrophobic effect and inhibits salt bridges, and therefore will affect the affinity between monomers and filaments. For example, past work has shown that high salt greatly changes actin polymerization, causing: a decreased critical concentration, increased bundling, and a greatly increased filament stiffness (Kang et al., 2013, 2012). Similarly, with AlfA, increased salt concentrations have been shown to increase the critical concentration, decrease the polymerization kinetics, and inhibit the bundling of AlfA filaments (Polka et al., 2009).

      A more closely related example comes from the previous observation that increasing salt concentrations increasingly slow the polymerization kinetics of B. subtilis MreB (Mayer and Amann, 2009). Lastly, These high salt concentrations might also change the interactions of MreB(Gs) with the membrane by screening charges and/or increasing the hydrophobic effect. Given that 500mM KCl was used throughout this paper, many (if not all) of the key experiments should be repeated in more standard salt concentration (~100mM), similar to those used in most previous in vitro studies of polymers.

      Response 2.1A. As per reviewer #2 request, we have done at 100 mM KCl too most experiments (TEM, cryo-EM, QCMD and ATPase assays) initially performed at 500 mM KCl only. The KCl concentration affects both membrane binding and filament stiffness as anticipated by the reviewer but the main conclusions are the same. The revised version of the manuscript compiles and compares the results obtained at both high and low [KCl], both concentrations being within the physiological range in Bacillus. Please see point 1 of the response to the global review comments and the first response to reviewer 1 (Response 1.1) for further elaboration.

      Please note that in Mayer & Amann, 2009 (B. subtilis MreB), light scattering in free solution was inversely proportional to the KCl concentration, with the higher light scattering signal at 0 mM KCl (!), a > 2-fold reduction below 30 mM KCl and no scatter at all at 250 mM, suggesting a “salting in” phenomenon (see also the “Other Points to address” answers 1A and 2, below) (Mayer & Amann, 2009). Since no effective polymer formation (e.g. polymers shown by EM) was demonstrated in these experiments, it cannot be excluded that KCl was simply preventing aggregation of B. subtilis MreB in solution, as we observe. For all their other light scattering experiments, the ‘standard polymerization condition’ used by Mayer & Amann was 0.2 mM ATP, 5 mM MgCl2, 1 mM EGTA and 10 mM imidazole pH 7.0, to which MreB (in 5 mM Tris pH 8.0) was added. No KCl was present in their ‘standard’ polymerization conditions.

      This would test if the many divergent properties of MreB(Gs) reported here arise from some difference in MreB(Gs) relative to other MreBs (and actin homologs), or if they arise from the 400mM difference in salt concentration between the studies. Critically, it would also allow direct comparisons to be made relative to previous studies of MreB (and other actin homologs) that used much lower salt, thereby allowing them to definitively demonstrate whether MreB(Gs) is indeed an outlier relative to other MreB and actin homologs. I would suggest using 100mM KCL, as historically, all polymerization assays of actin and numerous actin homologs have used 50-100mM KCL: 50mM KCl (for actin in F buffer) or 100mM KCl for multiple prokaryotic actin homologs and MreB (Deng et al., 2016; Ent et al., 2014; Esue et al., 2006, 2005; Garner et al., 2004 ; Polka et al., 2009 ; Rivera et al., 2011 ; Salje et al., 2011). Likewise, similar salt concentrations are standard for tubulin (80 mM K-Pipes) and FtsZ (100 mM KCl or 100mM KAc in HMK100 buffer).

      Response 2.1B. We appreciate the reviewer’s feedback on this point. Please note that, although actin polymerization assays are historically performed at 50-100 mM KCl and thus 100 mM KCl was used for other bacterial actin homologs (MamK, ParM and AlfA), MreB polymerization assays have previously been reported at 300 mM KCl too (Harne et al., 2020; Pande et al., 2022; Popp et al., 2010; Szatmari et al., 2020), which is closer to the physiological salt concentration in bacterial cells (see Response 1.1), but also in the absence of KCl (see above). As a matter of fact, we originally wanted to use a “standard polymerization condition” based on the literature on MreB, before realizing there was none: only half used KCl (the other half used NaCl, or no monovalent salt at all) and among these, KCl concentrations varied (out of 8 publications, 2 used 20 mM KCl, 2 used 50 mM KCl and 4 used 300 mM KCl).

      1. (Difference 2) - One of the most important differences claimed in this paper is that MreB(Gs) filaments are straight, a result that runs counter to the curved T. Maritima and C. crescentus filaments detailed by the Löwe group (Ent et al., 2014; Salje et al., 2011). Importantly, this difference could also arise from the difference in salt concentrations used in each study (500mM here vs. 100mM in the Löwe studies), and thus one cannot currently draw any direct comparisons between the two studies.

      One example of how high salt could be causing differences in filament geometry: high salts are known to greatly increase the bending stiffness of actin filaments, making them more rigid (Kang et al., 2013). Likewise, increasing salt is known to change the rigidity of membranes. As the ability of filaments to A) bend the membrane or B) Deform to the membrane depends on the stiffness of filaments relative to the stiffness of the membrane, the observed difference in the "straight vs. curved" conformation of MreB filaments might simply arise from different salt concentrations. Thus, in order to draw several direct comparisons between their findings and those of other MreB orthologs (as done here), the studies of MreB(GS) confirmations on lipids should be repeated at the same buffer conditions as used in the Löwe papers, then allowing them to be directly compared.

      Response 2.2. We fully agreed with reviewer #2 that the salts could be affecting the assay and did cryo-EM experiments also in the presence of 100 mM KCl as requested. The results unambiguously showed countless curved liposomes on the contact areas with MreB (Fig. 2F-G and Fig. 2-S5), very similar to what was reported for Thermotoga and Caulobacter MreBs by the Lowe group. Our results therefore confirm the previous findings that MreBs can bend lipids, and suggest that, indeed, high salt may increase filament stiffness as it has been shown for actin filaments. We are very grateful to reviewer #2 for his suggestion and for drawing our attention to the work of Kang et al, 2013. The different bending observed when varying the salt concentration raise relevant questions regarding the in vivo behavior of MreB, since KCl was shown to vary greatly depending on the medium composition. The manuscript has been updated accordingly in the Results (from L243) and Discussion sections (L585-595).

      1. (Difference 3) - The next important difference between MreB(Gs) and other MreBs is the claim that MreB polymers do not form in the absence of membranes.

      A) This is surprising relative to other MreBs, as MreBs from 1) T. maritime (multiple studies), E.coli (Nurse and Marians, 2013), and C. crescentus (Ent et al., 2014) have been shown to form polymers in solution (without lipids) with electron microscopy, light scattering, and time-resolved multi-angle light scattering. Notably, the Esue work was able to observe the first phase of polymer formation and a subsequent phase of polymer bundling (Esue et al., 2006) of MreB in solution. 2) Similarly, (Mayer and Amann, 2009) demonstrated B. subtilis MreB forms polymers in the absence of membranes using light scattering.

      Response 2.3A. The literature does convincingly show that Thermotoga MreB forms polymers in solution, without lipids (note that for Caulobacter MreB filaments were only reported in the presence of lipids, (van den Ent et al, 2014)). Assemblies reported in solution are bundles or sheets (included in at the earlier time points in the time-resolved EM experiments reported by Esue et al. 2006 mentioned by the reviewer – ‘2 minutes after adding ATP, EM revealed that MreB formed short filamentous bundles’) (Esue et al, 2006). However, and as discussed above (Response 2.1A), the light scattering experiments in Mayer et Amann, 2009 do not conclusively demonstrate the presence of polymers of B. subtilis MreB in solution (Mayer & Amann, 2009). We performed many light scattering experiments of B. subtilis MreB in solution in the past (before finding out that filaments were only forming in the presence of lipids), and got similar scattering curves (see two examples of DLS experiments in Author response image 1) in conditions in which NO polymers could ever been observed by EM while plenty of aggregates were present.

      Author response image 1.

      We did not consider these results publishable in the absence of true polymers observed by TEM. As pointed out on the interesting study from Nurse et al. (on E. coli MreB) (Nurse & Marians, 2013), one cannot rely only on light scattering only because non-specific aggregates would show similar patterns than polymers. Over the last two decades, about 15 publications showed polymers of MreB from several Gram-negative species, while none (despite the efforts of many) showed a single convincing MreB polymer from a Gram-positive bacterium by EM. A simple hypothesis is that a critical parameter was missing, and we present convincing evidence that lipids are critical for Geobacillus MreB to form pairs of filaments in the conditions tested. However, in solution too we do occasionally see pairs of filaments (Fig 2-S2), and also sheet-like structures among aggregates when the concentration of MreB is increased (Fig. 2-S2 and Fig. 3-S2). Thus, we agree with the reviewer that it cannot be claimed that Geobacillus MreB is unable to polymerize in the absence of lipids, but rather that lipids strongly stimulate its polymerization, condition depending.

      B) The results shown in figure 5A also go against this conclusion, as there is only a 2-fold increase in the phosphate release from MreB(Gs) in the presence of membranes relative to the absence of membranes. Thus, if their model is correct, and MreB(Gs) polymers form only on membranes, this would require the unpolymerized MreB monomers to hydrolyze ATP at 1/2 the rate of MreB in filaments. This high relative rate of hydrolysis of monomers compared to filaments is unprecedented. For all polymers examined so far, the rate of monomer hydrolysis is several orders of magnitude less than that of the filament. For example, actin monomers are known to hydrolyze ATP 430,000X slower than the monomers inside filaments (Blanchoin and Pollard, 2002; Rould et al., 2006).

      Response 2.3B. We agree with the reviewer. We have now found conditions where sheets of MreB form in solution (at high MreB concentration) in the presence of ADP and AMP-PNP. However, we have now added several controls that exclude efficient formation of polymers in solution in the presence of ATP at low concentrations of MreBGs (≤ 1.5 µM), the condition used for the malachite green assays. At these MreB concentrations, pairs of filaments are observed in the presence of lipids, but very unfrequently in solution, and sheets are not observed in solution either (Fig. 2-S2A, B). Yet, albeit puzzling, in these conditions Pi release is reproducibly observed in solution, reduced only ~ 2 to 3-fold relative to Pi release in the presence of lipids (Fig. 5A and Fig. 5-S1). A reinforcing observation is when the ATPase assays is performed at 100 mM KCl (Fig. 5A). In this condition MreB binding to lipids is increased relative to 500 mM KCl (Fig. 4-S4C), and the stimulation of the ATPase activity by the presence of lipids is also stronger that at 500 mM (Fig. 5-S1A). Further work is needed to characterize in detail the ATPase activity of MreB proteins, for which data in the literature is very scarce. We can’t exclude that MreB could nucleate in solution or form very unstable filaments that cannot be seen in our EM assay but consume ATP in the process. At the moment, the significance of the Pi released in solution is unknown and will require further investigation.

      C) Thus, there is a strong possibility that MreB(Gs) polymers are indeed forming in solution in addition to those on the membrane, and these "solution polymers" may not be captured by their electron microscopy assay. For example, high salt could be interfering with the absorption of filaments to glow discharged lacking lipids.

      Response 2.3C. We appreciate the reviewer’s insight about this critical point. Polymers presented in the original Fig. 2A were obtained at 500 mM KCl but we had tested the polymerization of MreB at 100 mM KCl as well, without noticing differences. We have nonetheless redone this quantitatively and used these data for the revised Fig. 2A, as we are now using 100 mM KCl as our standard polymerization condition throughout the revised manuscript. We also followed the other suggestion of the reviewer and tested glow discharged grids (a more classic preparation for soluble proteins) vs non-glow discharged EM grids, as well as a higher concentration of MreB. Grids are generally glow-discharged to make them hydrophilic in order to adsorb soluble proteins, but the properties of MreB (soluble but obviously presenting hydrophobic domains) made difficult to predict what support putative soluble polymers would preferentially interact with. Septins for example bind much better to hydrophobic grids despite their soluble properties (I. Adriaans, personal communication). Virtually no double filaments were observed in solution at either low or high [MreB]. The fact that in some conditions (high [MreB], other nucleotides) we were able to detect sheet-like structures excluded a technical issue that would prevent the detection of existing but “invisible” polymers here. We have added these new data in Fig. 2-S2.

      As indicated above, the reviewer’s comments made us realize that we could not state or imply that MreB cannot polymerize in the absence of lipids. As a matter of fact, we always saw some random filaments in the EM fields, both in solution and in the presence of non-hydrolysable analogues, at very low frequency (Fig. 2A). And we do see now sheets at high MreB concentration (Fig. 2-S2B). We could be just missing the optimal conditions for polymerisation in solution, while our phrasing gave the impression that no polymers could ever form in the absence of ATP or lipids. Therefore, we have:

      1) analyzed all TEM data to present it as semi-quantitative TEM, using our methodology originally implemented for the analysis of the mutants

      2) reworked the text to remove any issuing statements and to indicate that MreBGs was only found to bind to a lipid monolayer as a double protofilament in the presence of ATP/GTP but that this does not exclude that filaments may also form in other conditions.

      In order to definitively prove that MreB(Gs) does not have polymers in solution, the authors should:

      i) conduct orthogonal experiments to test for polymers in solution. The simplest test of polymerization might be conducting pelleting assays of MreB(Gs) with and without lipids, sweeping through the concentration range as done in 2B and 5a.

      Response 2.3Ci. Following reviewer #2 suggestion, we conducted a series of sedimentation assays in the presence and in the absence of lipids, at low (100 mM) and high (500 mM) salt, for both the wild-type protein and the three membrane-anchoring mutants (all at 1.3 µM). Sedimentation experiments in salt conditions preventing aggregation in solution (500 mM KCl) fitted with our TEM results: MreB wild-type pelleting increased in the presence of both ATP and lipids (Fig. R1). The sedimentation was further increased at 100 mM KCl, which would fit our other results indicating an increased interaction of MreB with the membrane. However, in addition to be poorly reproducible (in our hands), the approach does not discriminate between polymers and aggregates (or monomers bound to liposomes) and since MreB has a strong tendency to aggregate, we believe that the technique is ill-suited to reliably address MreB polymerization and prefer not to include sedimentation data in our manuscript. The recent work from Pande et al. (2022) illustrates well this issue since no sedimentation of MreB (at 2 µM) was observed in solution in conditions supporting polymerization (at 300 mM KCl): ‘the protein does not pellet on its own in the absence of liposome, irrespective of its polymerization state’, implying that sedimentation does not allow to detect MreB5 filaments in solution (Pande et al., 2022).

      ii) They also could examine if they see MreB filaments in the absence of lipids at 100mM salt (as was seen in both Löwe studies), as the high salt used here might block the charges on glow discharged grids, making it difficult for the polymer to adhere.

      See above, Response 2.3C

      iii) Likewise, the claim that MreB lacking the amino-terminus and the α2β7 hydrophobic loop "is required for polymerization" is questionable as if deleting these resides blocks membrane binding, the lack of polymers on the membrane on the grid is not unexpected, as these filaments that cannot bind the membrane would not be observable. Given these mutants cannot bind the membrane, mutant polymers could still indeed exist in solution, and thus pelleting assays should be used to test if non-membrane associated filaments composed of these mutants do or do not exist.

      Response 2.3Ciii. This is a fair point, we thank the reviewer for this remark. We did not mean to state or imply that the hydrophobic loop was required for polymerization per se, but that polymerization into double filaments only efficiently occurs upon membrane binding, which is mediated by the two hydrophobic sequences. We tested all three mutants by sedimentation as suggested by reviewer #2. In the salt condition that limits aggregation (500 mM KCl) the mutants did not pellet while the wild-type protein did (in the presence of lipids) (Fig. R2 below), in agreement with our EM data. We tested the absence of lipids on the mutant bearing the 2 deletions and observed that the (partial) sedimentation observed at low KCl concentration was ATP and lipid dependent (Fig. R3).

      Given our concerns about MreB sedimentation assays (see above, Response 2.3Ci), we prefer not to include these sedimentation data in our manuscript. Instead, we tested by TEM the possible polymerization of the mutants in solution (we only tested them in the presence of lipids in the initial submission). No filaments were detected in solution for any of the mutants (Fig. 4-S3A).

      A final note, the results shown in "Figure 1 - figure supplement 2, panel C" appear to directly refute the claim that MreB(Gs) requires lipids to polymerize. As currently written, it appears they can observe MreB(Gs) filaments on EM grids without lipids. If these experiments were done in the presence of lipids, the figure legend should be updated to indicate that. If these experiments were done in the absence of lipids, the claim that membrane association is required for MreB polymerizations should be revised.

      The TEM experiments show were indeed performed in the presence of lipids. We apologize for this was not clearly stated in the legend. To prevent all confusion, we have nevertheless removed these images in this figure since the polymerization conditions and lipid requirement are not yet presented when this figure is referred to in the text. We have instead added a panel with the calibration curve for the size exclusion profiles as per request of reviewer #3. The main point of this figure is to show the tendency of MreBGs to aggregate: analytical size-exclusion chromatography shows a single peak corresponding to the monomeric MreBGs, molecular weight ~ 37 KDa, in our purification conditions, but it can readily shift to a peak corresponding to high MW aggregates, depending on the protein concentration and/or storage conditions.

      1. (Difference 4) - The next difference between this study and previous studies of MreB and actin homologs is the conclusion that MreB(Gs) must hydrolyze ATP in order to polymerize. This conclusion is surprising, given the fact that both T. Maritima (Salje · 2011, Bean 2008) and B. subtilis MreB (Mayer 2009) have been shown to polymerize in the presence of ATP as well as AMP-PNP.

      Likewise, MreB polymerization has been shown to lag ATP hydrolysis in not only T. maritima MreB (Esue 2005), eukaryotic actin, and all other prokaryotic actin homologs whose polymerization and phosphate release have been directly compared: MamK (Deng et al., 2016), AlfA (Polka et al., 2009), and two divergent ParM homologs (Garner et al., 2004; Rivera et al., 2011). Currently, the only piece of evidence supporting the idea that MreB(Gs) must hydrolyze ATP in order to polymerize comes from 2 observations: 1) using electron microscopy, they cannot see filaments of MreB(Gs) on membranes in the presence of AMP-PNP or ApCpp, and 2) no appreciable signal increase appears testing AMPPNP- MreB(Gs) using QCM-D. This evidence is by no means conclusive enough to support this bold claim: While their competition experiment does indicate AMPPNP binds to MreB(Gs), it is possible that MreB(Gs) cannot polymerize when bound to AMPPNP.

      For example, it has been shown that different actin homologs respond differently to different non-hydrolysable analogs: Some, like actin, can hydrolyze one ATP analog but not the other, while others are able to bind to many different ATP analogs but only polymerize with some of one of them.

      Response 2.4. We agree with the reviewer, it is uncertain what analogs bind because they are quite different to ATP and some proteins just do not like them, they can change conditions such that filaments stop forming as well and be (theoretically) misleading. This is why we had tested ApCpp in addition to AMP-PNP as non-hydrolysable analog (Fig. 3A). As indicated above, our new complementary experiments (Fig. 3-S1B-D) now show that some rare (i.e. unfrequently and in limited amount) dual polymers are detected in the presence of ApCpp (Fig. 3A) and at high MreB concentration only in the presence of AMP-PNP (Fig. 3-S1B-D), suggesting different critical concentrations in the presence of alternative nucleotides. We have dampened our conclusions, in the light of our new data, and modified the discussion accordingly.

      Thus, to further verify their "hydrolysis is needed for polymerization" conclusion, they should:

      A. Test if a hydrolysis deficient MreB(Gs) mutant (such as D158A) is also unable to polymerize by EM.

      Response 2.4A. We thank the reviewer for this suggestion. As this conclusion has been reviewed on the basis of our new data (see previous response), testing putative ATPase deficient mutants is no longer required here. The study of ATPase mutants is planned for future studies (see Response 3.10 to reviewer #3).

      B. They also should conduct an orthogonal assay of MreB polymerization aside from EM (pelleting assays might be the easiest). They should test if polymers of ATP, AMP-PNP, and MreB(Gs)(D158A) form in solution (without membranes) by conducting pelleting assays. These could also be conducted with and without lipids, thereby also addressing the points noted above in point 3.

      Response 2.4B. Please see Response 2.3Ci above.

      C. Polymers may indeed form with ATP-gamma-S, and this non-hydrolysable ATP analog should be tested.

      Response 2.4C. It is fairly possible that ATP-γ-S supports polymerization since it is known to be partially hydrolysable by actin giving a mild phenotype (Mannherz et al, 1975). This molecule can even be a bona fide substrate for some ATPases (e.g. (Peck & Herschlag, 2003). Thus, we decided to exclude this “non-hydrolysable” analog and tested instead AMP-PNP and ApCpp. We know that ATP-γ-S has been and it is still frequently used, but we preferred to avoid it for the moment for the above-indicated reasons. We chose AMPPNP and AMPPCP instead because (1) they were shown to be completely non-hydrolysable by actin, in contrast to ATP-γ-S; (2) they are widely used (the most commonly used for structural studies; (Lacabanne et al, 2020), (3) AMPPNP was previously used in several publications on MreB (Bean & Amann, 2008; Nurse & Marians, 2013; Pande et al., 2022; Popp et al., 2010; Salje et al, 2011; van den Ent et al., 2014)and thus would allow direct comparison. AMPPCP was added to confirm the finding with AMP-PNP. There are many other analogs that we are planning to explore in future studies (see next Response, 2.4D).

      D. They could also test how the ADP-Phosphate bound MreB(Gs) polymerizes in bulk and on membranes, using beryllium phosphate to trap MreB in the ADP-Pi state. This might allow them to further refine their model.

      Response 2.4D. We plan to address the question of the transition state in depth in following-up work, using a series of analogs and mutants presumably affected in ATPase activity, both predicted and identified in a genetic screen. As indicated above, it is uncertain what analogs bind because they are quite different to ATP and some may bind but prevent filament formation. Thus, we anticipate that trying just one may not be sufficient, they can change conditions and be (theoretically) misleading and thus a thorough analysis is needed to address this question. Since our model and conclusions have been revised on the basis of our new data, we believe that these experiments are beyond the scope of the current manuscript.

      E. Importantly, the Mayer study of B. subtilis MreB found the same results in regard to nucleotides, "In polymerization buffer, MreB produced phosphate in the presence of ATP and GTP, but not in ADP, AMP, GDP or AMP-PNP, or without the readdition of any nucleotide". Thus this paper should be referenced and discussed

      Response 2.4E. We agree that Pi release was detected previously. We have added the reference (L121)

      1. (Difference 5) - The introduction states (lines 128-130) "However, the need for nucleotide binding and hydrolysis in polymerization remains unclear due to conflicting results, in vivo and in vitro, including the ability of MreB to polymerize or not in the presence of ADP or the non-hydrolysable ATP analog AMP-PNP."

      A) While this is a great way to introduce the problem, the statement is a bit vague and should be clarified, detaining the conflicting results and appropriate references. For example, what conflicting in vivo results are they referring to? Regarding "MreB polymerization in AMP-PNP", multiple groups have shown the polymerization of MreB(Tm) in the presence of AMP-PNP, but it is not clear what papers found opposing results.

      Response 2.5A. Thanks for the comment. We originally did not detail these ‘conflicting results’ in the Introduction because we were doing it later in the text, with the appropriate references, in particular in the Discussion (former L433-442). We have now removed this from the Discussion section and added a sentence in the introduction too (L123-130) quickly detailing the discrepancies and giving the references.

      • For more clarity, we have removed the “in vivo” (which referred to the distinct results reported for the presumed ATPase mutants by the Garner and Graumann groups) and focus on the in vitro discrepancies only.

      • These discrepancies are the following: while some studies showed indeed polymerization (as assessed by EM) of MreBTm in the presence of AMPPNP, the studies from Popp et al and Esue et al on T. maritima MreB, and of Nurse et al on E. coli MreB reported aggregation in the presence of AMP-PNP (Esue et al., 2006; Popp et al., 2010) or ADP (Nurse & Marians, 2013), or no assembly in the presence of ADP (Esue et al., 2006). As for the studies reporting polymerization in the presence of AMP-PNP by light scattering only (Bean & Amann, 2008; Gaballah et al, 2011; Mayer & Amann, 2009; Nurse & Marians, 2013), they could not differentiate between aggregates or true polymers and thus cannot be considered conclusive.

      B) The statement "However, the need for nucleotide binding and hydrolysis in polymerization remains unclear due to conflicting results, in vivo and in vitro, including the ability of MreB to polymerize or not in the presence of ADP or the non-hydrolyzable ATP analog AMP-PNP" is technically incorrect and should be rephrased or further tested.

      i. For all actin (or tubulin) family proteins, it is not that a given filament "cannot polymerize" in the presence of ADP but rather that the ADP-bound form has a higher critical concentration for polymer formation relative to the ATP-bound form. This means that the ADP polymers can indeed polymerize, but only when the total protein exceeds the ADP critical concentration. For example, many actin-family proteins do indeed polymerize in ADP: ADP actin has a 10-fold higher critical concentration than ATP actin, (Pollard, 1984) and the ADP critical concentrations of AlfA and ParM are 5X and 50X fold higher (respectively) than their ATP-bound forms(Garner et al., 2004; Polka et al., 2009)

      Response 2.5Bi. Absolutely correct. We apologize for the lack of accuracy of our phrasing and have corrected it (L123).

      ii. Likewise, (Mayer and Amann, 2009) have already demonstrated that B. subtilis MreB can polymerize in the presence of ADP, with a slightly higher critical concentration relative to the ATP-bound form.

      Response 2.5Bii. In Mayer and Amann, 2009, the same light scattering signal (interpreted as polymerization) occurred regardless of the nucleotide, and also in the absence of nucleotide (their Fig. 10) and ATP-, ADP- and AMP-PNP-MreB ‘displayed nearly indistinguishable critical concentrations’. They concluded that MreB polymerization is nucleotide-independent. Please see below (responses to ’Other points to address’) our extensive answer to the Mayer & Amann recurring point of reviewer #2

      Thus, to prove that MreB(Gs) polymers do not form in the presence of ADP would require one to test a large concentration range of ADP-bound MreB(Gs). They should test if ADP- MreB(Gs) polymerizes at the highest MreB(Gs) concentrations that can be assayed. Even if this fails, it may be the MreB(Gs) ADP polymerizes at higher concentrations than is possible with their protein preps (13uM). An even more simple fix would be to simply state MreB(Gs)-ADP filaments do not form beneath a given MreB(Gs) concentration.

      We agree with the reviewer. Our wording was overstating our conclusions. Based on our new quantifications (Fig. 3-S1B, D), we have rephrased the results section and now indicate that pairs of filaments are occasionally observed in the presence of ADP in our conditions across the range of MreB concentration that could be tested, suggesting a higher critical concentration for MreB-ADP (L310-312). Only at the highest MreB concentration, sheet- and ribbon-like structures were observed in the presence of ADP (Fig. 3-S2B).

      Other Points to address:

      1) There are several points in this paper where the work by Mayer and Amann is ignored, not cited, or readily dismissed as "hampered by aggregation" without any explanation or supporting evidence of that fact.

      We have cited the Mayer study where appropriate. However, we cannot cite it as proof of polymerization in such or such condition since their approach does not show that polymers were obtained in their conditions. Again, they based all their conclusions solely on light scattering experiments, which cannot differentiate between polymers and aggregates.

      A) Lines 100-101 - While the irregular 3-D formations seen formed by MreB in the Dersch 2020 paper could be interpreted as aggregates, stating that the results from specifically the Gaballah and Meyer papers (and not others) were "hampered by aggregation" is currently an arbitrary statement, with no evidence or backing provided. Overall, these lines (and others in the paper) dismiss these two works without giving any evidence to that point. Thus, they should provide evidence for why they believe all these papers are aggregation, or remove these (and other) dismissive statements.

      We apologize if our statements about these reports seemed dismissive or disrespectful, it was definitely not our intention. Light scattering shows an increase of size of particles over time, but there is no way to tell if the scattering is due to organized (polymers) or disorganized (aggregation) assemblies. Thus, it cannot be considered a conclusive evidence of polymerization without the proof that true filaments are formed by the protein in the conditions tested, as confirmed by EM for example. MreB is known to easily aggregate (see our size exclusion chromatography profiles and ones from Dersch 2020 (Dersch et al, 2020), and note that no chromatography profiles were shown in the Mayer report) and, as indicated above, we had similar light scattering results for MreB for years, while only aggregates could be observed by TEM (see above Response 2.3A). Several observations also suggest that aggregation instead of polymerization might be at play in the Mayer study, for example ‘polymerization’ occurring in salt-less buffer but ‘inhibited’ with as low as 100 mM KCl, which should rather be “salting in” (see below). We did not intend to be dismissive, but it seemed wrong to report their conclusions as conclusive evidence. We thought that we had cited these papers where appropriate but then explained that they show no conclusive proof of polymerization and why, but it is evident that we failed at communicating it clearly. We have reworked the text to remove any issuing and arbitrary statement about our concerns regarding these reports (e.g. L93 & L126).

      One important note - There are 2 points indicating that dismissing the Meyer and Amann work as aggregation is incorrect:

      1) the Meyer work on B. subtilis MreB shows both an ATP and a slightly higher ADP critical concentration. As the emergence of a critical concentration is a steady-state phenomenon arising from the association/dissociation of monomers (and a kinetically limiting nucleation barrier), an emergent critical concentration cannot arise from protein aggregation, critical concentrations only arise from a dynamic equilibrium between monomer and polymer.

      • Critical concentration for ATP, ADP or AMPPNP were described in Mayer & Amann (Mayer & Amann, 2009) as “nearly indistinguishable” (see Response 2.5Bii)
      • Protein aggregation depends on the solution (pH and ions), protein concentration and temperature. And above a certain concentration, proteins can become instable, thus a critical concentration for aggregation can emerge.

      2) Furthermore, Meyer observed that increased salt slowed and reduced B. subtilis MreB light scattering, the opposite of what one would expect if their "polymerization signal" was only protein aggregation, as higher salts should increase the rate of aggregation by increasing the hydrophobic effect.

      It is true that at high salt concentration proteins can precipitate, a phenomenon described as “salting out”. However, it is also true that salts help to solubilize proteins (“salting in”), and that proteins tend to precipitate in the absence of salt. Considering that the starting point of the Mayer and Amann experiment (Mayer & Amann, 2009) is the absence of salt (where they observed the highest scattering) and that they gradually reduce this scattering by increasing KCl (the scattering is almost abolished below 100 mM only!) it is plausible that a salting-in phenomenon might be at play, due to increased solubility of MreB by salt. In any case, this cannot be taken as a proof that polymerization rather than aggregation occurred.

      B) Lines 113-137 -The authors reference many different studies of MreB, including both MreB on membranes and MreB polymerized in solution (which formed bundles). However, they again neglect to mention or reference the findings of Meyer and Amann (Mayer and Amann, 2009), as it was dismissed as "aggregation". As B. subtilis is also a gram-positive organism, the Meyer results should be discussed.

      We did cite the Mayer and Amann paper but, as explained above, we cannot cite this study as an example of proven polymerization. We avoided as much as possible to polemicize in the text and cited this paper when possible. Again, we have reworked the text to avoid any issuing or dismissive statement. Also, we forgot mentioned this study at L121 as an example of reported ATPase activity, and this has now been corrected.

      2) Lines 387-391 state the rates of phosphate release relative to past MreB findings: "These rates of Pi release upon ATP hydrolysis (~ 1 Pi/MreB in 6 min at 53{degree sign}C) are comparable to those observed for MreBTm and MreB(Ec) in vitro". While the measurements of Pi release AND ATP hydrolysis have indeed been measured for actin, this statement does not apply to MreB and should be corrected: All MreB papers thus far have only measured Pi release alone, not ATP hydrolysis at the same time. Thus, it is inaccurate to state "rates of Pi release upon ATP hydrolysis" for any MreB study, as to accurately determine the rate of Pi release, one must measure: 1. The rate of polymer over time, 2) the rate of ATP hydrolysis, and 3) the rate of phosphate release. For MreB, no one has, so far, even measured the rates of ATP hydrolysis and phosphate release with the same sample.

      We completely agree with the reviewer, we apologize if our formulation was inaccurate. We have corrected the sentence (L479). Thank you for pointing out this mistake.

      3) The interpretation of the interactions between monomers in the MreB crystal should be more carefully stated to avoid confusion. While likely not their intention, the discussions of the crystal packing contacts of MreB can appear to assume that the monomer-monomer contacts they see in crystals represent the contacts within actual protofilaments. One cannot automatically assume the observations of monomer-monomer contacts within a crystal reflect those that arise in the actual filament (or protofilament).

      We agree, we thank the reviewer for his comments. We have revamped the corresponding paragraph.

      A) They state, "the apo form of MreBGs forms less stable protofilaments than its G- homologs ." Given filaments of the Apo form of MreB(GS) or b. subtilis have never been observed in solution, this statement is not accurate: while the contacts in the crystal may change with and without nucleotide, if the protein does not form polymers in solution in the apo state, then there are no "real" apo protofilaments, and any statements about their stability become moot. Thus this statement should be rephrased or appropriately qualified.

      see above.

      B) Another example: while they may see that in the apo MreB crystal, the loop of domain IB makes a single salt bridge with IIA and none with IIB. This contrasts with every actin, MreB, and actin homolog studied so far, where domain IB interacts with IIB. This might reflect the real contacts of MreB(Gs) in the solution, or it may be simply a crystal-packing artifact. Thus, the authors should be careful in their claims, making it clear to the reader that the contacts in the crystal may not necessarily be present in polymerized filaments.

      Again, we agree with the reviewer, we cannot draw general conclusions about the interactions between monomers from the apo form. We have rephrased this paragraph.

      4) lines 201-202 - "Polymers were only observed at a concentration of MreB above 0.55 μM (0.02 mg/mL)". Given this concentration dependence of filament formation, which appears the same throughout the paper, the authors could state that 0.55 μM is the critical concentration of MreB on membranes under their buffer conditions. Given the lack of critical concentration measurement in most of the MreB literature, this could be an important point to make in the field.

      Following reviewer’s #2 suggestion, we have now estimated the critical concentration (Cc=0.4485 µM) and reported it in the text. (L218).

      5) Both mg/ml and uM are used in the text and figures to refer to protein concentration. They should stick to one convention, preferably uM, as is standard in the polymer field.

      Sorry for the confusion. We have homogenized to MreB concentrations to µM throughout the text and figures.

      6) Lines 77-78 - (Teeffelen et al., 2011) should be referenced as well in regard to cell wall synthesis driving MreB motion.

      This has been corrected, sorry for omitting this reference.

      7) Line 90 - "Do they exhibit turnover (treadmill) like actin filaments?". This phrase should be modified, as turnover and treadmilling are two very different things. Turnover is the lifetime of monomers in filaments, while treadmilling entails monomer addition at one end and loss at the other. While treadmilling filaments cause turnover, there are also numerous examples of non-treadmilling filaments undergoing turnover: microtubules, intermediate filaments, and ParM. Likewise, an antiparallel filament cannot directionally treadmill, as there is no difference between the two filament ends to confer directional polarity.

      This is absolutely true, we apologize for our mistake. The sentence has been corrected (L82).

      8) Throughout the paper, the term aggregation is used occasionally to describe the polymerization shown in many previous MreB studies, almost all of which very clearly showed "bundled" filaments, very distinct entities from aggregates, as a bundle of polymers cannot form without the filaments first polymerizing on their own. Evidence to this point, polymerization has been shown to precede the bundling of MreB(Tm) by (Esue et al., 2005).

      We agree with reviewer #2 about polymers preceding bundles and “sheets”. However, we respectfully disagree that we used the word aggregation “throughout the paper” to describe structures that clearly showed polymers or sheets of filaments. A search (Ctrl-F: “aggreg”) reveals only 6 matches, 3 describing our own observations (L152, 163/5, and 1023/28), one referring to (Salje et al., 2011) (L107) but citing her claim that they observed aggregation (due to the N-terminus), and the last two (L100, L440) refer (again) to the Gaballah/Mayer/Dersch publications to say that aggregation could not be excluded in these reports as discussed above (Dersch et al., 2020; Gaballah et al., 2011; Mayer & Amann, 2009).

      9) lines 106-108 mention that "The N-terminal amphipathic helix of E. coli MreB (MreBEc) was found to be necessary for membrane binding. " This is not accurate, as Salje observed that one single helix could not cause MreB to mind to the membrane, but rather, multiple amphipathic helices were required for membrane association (Salje et al., 2011).

      Salje et al showed that in vivo the deletion of the helix abolishes the association of MreB to the membrane. This publication also shows that in vitro, addition of the helix to GFP (not to MreB) prompts binding to lipid vesicles, and that this was increased if there are 2 copies of the helix, but they could not test this directly in vitro with MreB (which is insoluble when expressed with its N-terminus). This prompted them to speculate that multiple MreBs could bind better to the membrane than monomers. However, this remained to be demonstrated. Additional hydrophobic regions in MreB such as the hydrophobic loop could participate to membrane anchoring but are absent in their in vitro assays with GFP.

      The Salje results imply that dimers (or further assemblies) of MreB drive membrane association, a point that should be discussed in regard to the question "What prompts the assembly of MreB on the inner leaflet of the cytoplasmic membrane?" posed on lines 86-87.

      We agree that this is an interesting point. As it is consistent with our results, we have incorporated it to our model (Fig. 6) and we are addressing it in the discussion L573-575.

      10) On lines 414-415, it is stated, "The requirement of the membrane for polymerization is consistent with the observation that MreB polymeric assemblies in vivo are membrane-associated only." While I agree with this hypothesis, it must be noted that the presence or absence of MreB polymers in the cytoplasm has not been directly tested, as short filaments in the cytoplasm would diffuse very quickly, requiring very short exposures (<5ms) to resolve them relative to their rate of diffusion. Thus, cytoplasmic polymers might still exist but have not been tested.

      This is also an interesting point. Indeed if a nucleated form, or very short (unbundled) polymers exist in the cytoplasm, they have not been tested by fluorescence microscopy. However, the polymers that localize at the membrane (~ 200 nm), if soluble, would have been detected in the cytoplasm by the work of reviewer #2, us or others.

      11) lines 429-431 state, "but polymerization in the presence of ADP was in most cases concluded from light scattering experiments alone, so the possibility that aggregation rather than ordered polymerization occurred in the process cannot be excluded."

      A) If an increased light scattering signal is initiated by the addition of ADP (or any nucleotide), that signal must come from polymerization or multimerization. What the authors imply is that there must be some ADP-dependent "aggregation" of MreB, which has not been seen thus far for any polymer. Furthermore, why would the addition of ADP initiate aggregation?

      We did not mean that ADP itself would prompt aggregation, but that the protein would aggregate in the buffer regardless of the presence of ADP or other nucleotides. The Mayer & Amann study claims that MreB “polymerization” is nucleotide-independent, as they got identical curves with ATP, ADP, AMPPNP and even with no nucleotides at all (Fig. 10 in their paper, pasted here) (Mayer & Amann, 2009).

      Their experiments with KCl are also remarkable as when they lowered the salt they got faster and faster “polymerization”, with the strongest light scattering signal in the absence of any salt. The high KCl concentration in which they got almost no more “polymers” was 75 mM KCl, and ‘polymerization was almost entirely inhibited at 100 mM’ (Fig. 7, pasted below). Yet the intracellular level of KCl in bacteria is estimated to be ~300 mM (see Response 1.1)

      B) Likewise, the statement "Differences in the purity of the nucleotide stocks used in these studies could also explain some of the discrepancies" is unexplained and confusing. How could an impurity in a nucleotide stock affect the past MreB results, and what is the precedent for this claim?

      We meant that the presence of ATP in the ADP stocks might have affected the outcome of some assays, generating the conflicting results existing in the literature. We agree this sentence was confusing, we have removed it.

      12) lines 467-469 state, "Thus, for both MreB and actin, despite hydrolyzing ATP before and after polymerization, respectively, the ADP-Pi-MreB intermediate would be the long-lived intermediate state within the filaments."

      A) For MreB, this statement is extremely speculative and unbiased, as no one has measured 1) polymerization, 2) ATP hydrolysis, and 3) phosphate release. For example, it could be that ATP hydrolysis is slow, while phosphate release is fast, as is seen in the actin from Saccharomyces cerevisiae.

      We agree that this was too speculative. This has been removed from the (extensively) modified Discussion section. Thanks for the comment.

      B) For actin, the statement of hydrolysis of ATP of monomer occurring "before polymerization" is functionally irrelevant, as the rate of ATP hydrolysis of actin monomers is 430,000 times slower than that of actin monomers inside filaments (Blanchoin and Pollard, 2002; Rould et al., 2006).

      We agree that the difference of hydrolysis rate between G-actin and F-actin implies that ATP hydrolysis occurs after polymerization. We are afraid that we do not follow the reviewer’s point here, we did not say or imply that ATP hydrolysis by actin monomers was functionally relevant.

      13) Lines 442-444. "On the basis of our data and the existing literature, we propose that the requirement for ATP (or GTP) hydrolysis for polymerization may be conserved for most MreBs." Again, this statement both here (and in the prior text) is an extremely bold claim, one that runs contrary to a large amount of past work on not just MreB, but also eukaryotic actin and every actin homolog studied so far. They come to this model based on 1) one piece of suggestive data (the behavior of MreB(GS) bound to 2 non-hydrolysable ATP analogs in 500mM KCL), and 2) the dismissal (throughout the paper) of many peer-reviewed MreB papers that run counter to their model as "aggregation" or "contaminated ATP stocks ." If they want to make this bold claim that their finding invalidates the work of many labs, they must back it up with further validating experiments.

      We respectfully disagree that our model was based on “one piece of suggestive data” and backed-up by dismissing most past work in the field. We only wanted to raise awareness about the conflicting data between some reports (listed in response 2.5a), and that the claims made by some publications are to be taken with caution because they only rely on light scattering or, when TEM was performed, showed only disorganized structures.

      This said, we clearly failed in proposing our model and we are sorry to see that we really annoyed the reviewer with our suspicion that the work by Mayer & Amann reports aggregation. As indicated above, we have amended our manuscript relative to this point. We also agree that our suggestion to generalize our findings to most MreBs was unsupported, and overstated considering how confusing some result from the literature are. We have refined our model and reworked the text to take on board the reviewer’s remarks as well as the new data generated during the revision process.

      We would like to thank reviewer #2 for his in-depth review of our manuscript.  

      Reviewer #3 (Public Review):

      The major claim from the paper is the dependence of two factors that determine the polymerization of MreB from a Gram-positive, thermophilic bacteria 1) The role of nucleotide hydrolysis in driving the polymerization. 2) Lipid bilayer as a facilitator/scaffold that is required for hydrolysis-dependent polymerization. These two conclusions are contrasting with what has been known until now for the MreB proteins that have been characterized in vitro. The experiments performed in the paper do not completely justify these claims as elaborated below.

      We understand the reviewer’ concerns in view of the existing literature on actin and Gram-negative MreBs. We may just be missing the optimal conditions for polymerisation in solution, while our phrasing gave the impression that polymers could never form in the absence of ATP or lipids. Our new data actually shows that MreBGs at higher concentration can assemble into bundle- and sheet-like structures in solution and in the presence of ADP/AMP-PNP. Pairs of filaments are however only observed in the presence of lipids for all conditions tested. As indicated in the answers to the global review comments, we have included our new data in the manuscript, revised our conclusions and claims about the lipid requirement and expanded on these points in the Discussion.

      Major comments:

      1) No observation of filaments in the absence of lipid monolayer can also be accounted due to the higher critical concentration of polymerization for MreBGS in that condition. It is seen that all the negative staining without lipid monolayer condition has been performed at a concentration of 0.05 mg/mL. It is important to check for polymerization of the MreBGS at higher concentration ranges as well, in order to conclusively state the requirement of lipids for polymerization.

      Response 3.1. 0.05 mg/ml (1.3µM) is our standard condition, and our leeway was limited by the rapid aggregation observed at higher MreB concentrations, as indicated in the text. We have now tested as well 0.25 mg/ml (6.5 µM - the maximum concentration possible before major aggregation occurs in our experimental conditions). At this higher concentration, we see some sheet-like structures in solution, confirming a requirement of a higher concentration of MreB for polymerization in these conditions (see the answers to the global review comments for more details)

      We thank the reviewer for pushing us to address this point. We have revised our conclusions accordingly.

      2) The absence of filaments for the non-hydrolysable conditions in the lipid layer could also be because the filaments that might have formed are not binding to the planar lipid layer, and not necessarily because of their inability to polymerize.

      Response 3.2. This is a fair point. To test the possibility that polymers would form but would not bind to the lipid layer we have now added additional semi-quantitative EM controls (for both the non-hydrolysable ATP analogs and the three ‘membrane binding’ deletion mutants) testing polymerization in solution (without lipids) and also using plasma-treated grids. These showed that in our standard polymerization conditions, virtually no polymers form in solution (Fig. 3-S1B and Fig. 4-S4A). Albeit at very low frequency, some dual protofilaments were however detected in the presence of ADP or AMP-PNP at the high MreB concentration (Fig. 3-S1D). At this high MreB concentration, the sheet-like structures occasionally observed in solution in the presence of ATP were frequent in the presence of ADP and very frequent in the presence of AMP-PNP (Fig. 3-S2B). We have revised our conclusions on the basis of these new data: MreBGs can form polymeric assemblies in solution and in the absence of ATP hydrolysis at a higher critical concentration than in the presence of ATP and lipids.

      See the answers to the global review comments (point 2) and Response 2.3C to reviewer #2 for more details.

      3) Given the ATPase activity measurements, it is not very convincing that ATP rather than ADP will be present in the structure. The ATP should have been hydrolysed to ADP within the structure. The structure is now suggestive that MreB is not capable of hydrolysis, which is contradictory to the ATP hydrolysis data.

      Response 3.3. We thank the reviewer for her insightful remarks about the MreB-ATP crystal structure. The electron density map clearly demonstrates the presence of 3 phosphates. However, as suggested by the reviewer, the density which was attributed to a Mg2+ ion was to be interpreted as a water molecule. The absence of Mg2+ in the crystal could thus explain why the ATP had not been hydrolyzed.

      References

      Arino J, Ramos J, Sychrova H (2010) Alkali metal cation transport and homeostasis in yeasts. Microbiology and molecular biology reviews 74: 95-120

      Bean GJ, Amann KJ (2008) Polymerization properties of the Thermotoga maritima actin MreB: roles of temperature, nucleotides, and ions. Biochemistry 47: 826-835

      Cayley S, Lewis BA, Guttman HJ, Record MT, Jr. (1991) Characterization of the cytoplasm of Escherichia coli K-12 as a function of external osmolarity. Implications for protein-DNA interactions in vivo. Journal of molecular biology 222: 281-300

      Dersch S, Reimold C, Stoll J, Breddermann H, Heimerl T, Defeu Soufo HJ, Graumann PL (2020) Polymerization of Bacillus subtilis MreB on a lipid membrane reveals lateral co-polymerization of MreB paralogs and strong effects of cations on filament formation. BMC Mol Cell Biol 21: 76

      Eisenstadt E (1972) Potassium content during growth and sporulation in Bacillus subtilis. Journal of bacteriology 112: 264-267

      Epstein W, Schultz SG (1965) Cation Transport in Escherichia coli: V. Regulation of cation content. J Gen Physiol 49: 221-234

      Esue O, Wirtz D, Tseng Y (2006) GTPase activity, structure, and mechanical properties of filaments assembled from bacterial cytoskeleton protein MreB. Journal of bacteriology 188: 968-976

      Gaballah A, Kloeckner A, Otten C, Sahl HG, Henrichfreise B (2011) Functional analysis of the cytoskeleton protein MreB from Chlamydophila pneumoniae. PloS one 6: e25129

      Harne S, Duret S, Pande V, Bapat M, Beven L, Gayathri P (2020) MreB5 Is a Determinant of Rod-to-Helical Transition in the Cell-Wall-less Bacterium Spiroplasma. Curr Biol 30: 4753-4762 e4757

      Kang H, Bradley MJ, McCullough BR, Pierre A, Grintsevich EE, Reisler E, De La Cruz EM (2012) Identification of cation-binding sites on actin that drive polymerization and modulate bending stiffness. Proceedings of the National Academy of Sciences of the United States of America 109: 16923-16927

      Lacabanne D, Wiegand T, Wili N, Kozlova MI, Cadalbert R, Klose D, Mulkidjanian AY, Meier BH, Bockmann A (2020) ATP Analogues for Structural Investigations: Case Studies of a DnaB Helicase and an ABC Transporter. Molecules 25

      Mannherz HG, Brehme H, Lamp U (1975) Depolymerisation of F-actin to G-actin and its repolymerisation in the presence of analogs of adenosine triphosphate. Eur J Biochem 60: 109-116

      Mayer JA, Amann KJ (2009) Assembly properties of the Bacillus subtilis actin, MreB. Cell motility and the cytoskeleton 66: 109-118

      Nurse P, Marians KJ (2013) Purification and characterization of Escherichia coli MreB protein. The Journal of biological chemistry 288: 3469-3475

      Pande V, Mitra N, Bagde SR, Srinivasan R, Gayathri P (2022) Filament organization of the bacterial actin MreB is dependent on the nucleotide state. The Journal of cell biology 221

      Peck ML, Herschlag D (2003) Adenosine 5 '-O-(3-thio)triphosphate (ATP-gamma S) is a substrate for the nucleotide hydrolysis and RNA unwinding activities of eukaryotic translation initiation factor eIF4A. Rna 9: 1180-1187

      Popp D, Narita A, Maeda K, Fujisawa T, Ghoshdastider U, Iwasa M, Maeda Y, Robinson RC (2010) Filament structure, organization, and dynamics in MreB sheets. The Journal of biological chemistry 285: 15858-15865

      Rhoads DB, Waters FB, Epstein W (1976) Cation transport in Escherichia coli. VIII. Potassium transport mutants. J Gen Physiol 67: 325-341

      Rodriguez-Navarro A (2000) Potassium transport in fungi and plants. Biochimica et biophysica acta 1469: 1-30

      Salje J, van den Ent F, de Boer P, Lowe J (2011) Direct membrane binding by bacterial actin MreB. Molecular cell 43: 478-487

      Schmidt-Nielsen B (1975) Comparative physiology of cellular ion and volume regulation. J Exp Zool 194: 207-219

      Szatmari D, Sarkany P, Kocsis B, Nagy T, Miseta A, Barko S, Longauer B, Robinson RC, Nyitrai M (2020) Intracellular ion concentrations and cation-dependent remodelling of bacterial MreB assemblies. Sci Rep-Uk 10

      van den Ent F, Izore T, Bharat TA, Johnson CM, Lowe J (2014) Bacterial actin MreB forms antiparallel double filaments. eLife 3: e02634

      Whatmore AM, Chudek JA, Reed RH (1990) The Effects of Osmotic Upshock on the Intracellular Solute Pools of Bacillus subtilis. Journal of general microbiology 136: 2527-2535

    1. Author Response

      Reviewer #1 (Public Review):

      Briggs et al use a combination of mathematical modelling and experimental validation to tease apart the contributions of metabolic and electronic coupling to the pancreatic beta cell functional network. A number of recent studies have shown the existence of functional beta cell subpopulations, some of which are difficult to fully reconcile with established electrophysiological theory. More generally, the contribution of beta cell heterogeneity (metabolism, differentiation, proliferation, activity) to islet function cannot be explained by existing combined metabolic/electrical oscillator models. The present studies are thus timely in modelling the islet electrical (structural) and functional networks. Importantly, the authors show that metabolic coupling primarily drives the islet functional network, giving rise to beta cell subpopulations. The studies, however, do not diminish the critical role of electrical coupling in dictating glucose responsiveness, network extent as well as longer-range synchronization. As such, the studies show that islet structural and functional networks both act to drive islet activity, and that conclusions on the islet structural network should not be made using measures of the functional network (and vice versa).

      Strengths:

      • State-of-the-art multi-parameter modelling encompassing electrical and metabolic components.

      • Experimental validation using advanced FRAP imaging techniques, as well as Ca2+ data from relevant gap junction KO animals.

      • Well-balanced arguments that frame metabolic and electrical coupling as essential contributors to islet function.

      • Likely to change how the field models functional connectivity and beta cell heterogeneity.

      Weaknesses:

      • Limitations of FRAP and electrophysiological gap junction measures not considered.

      • Limitations of Cx36 (gap junction) KO animals not considered.

      • Accuracy of citations should be improved in a few cases.

      We thank reviewer 1 for their positive comments, including the many strengths in the approaches, arguments and impact. We do note the weaknesses raised by the reviewer and have addressed them following the comments below.

      We would like to also note that when we refer to metabolic activity driving the functional network, we are not referring to metabolic coupling between beta cells. Rather we mean that two cells that show either high levels of metabolic activity (glycolytic flux) or that show similar levels metabolic activity will show increased synchronization and thus a functional network edge as compares to cells with elevated gap junction conductance. Increased metabolic activity would likely generate increased depolarizing currents that will provide an increased coupling current to drive synchronization; whereas similar metabolic activity would mean a given coupling current could more readily drive synchronized activity. We have substantially rewritten the manuscript to clarify this point.

      Reviewer #2 (Public Review):

      In their present work, Briggs et al. combine biophysical simulations and experimental recordings of beta cell activity with analyses of functional network parameters to determine the role played by gap-junctional coupling, metabolism, and KATP conductance in defining the functional roles that the cells play in the functional networks, assess the structure-function relationship, and to resolve an important current open question in the field on the role of so-called hub cells in islets of Langerhans.

      Combining differential equation-based simulations on 1000 coupled cells with demanding calcium, NAPDH, and FRAP imaging, as well as with advanced network analyses, and then comparing the network metrics with simulated and experimentally determined properties is an achievement in its own right and a major methodological strength. The findings have the potential to help resolve the issue of the importance of hub cells in beta cell networks, and the methodological pipeline and data may prove invaluable for other researchers in the community.

      However, methodologically functional networks may be based on different types of calcium oscillations present in beta cells, i.e., fast oscillations produced by bursts of electrical activity, slow oscillations produced by metabolic/glycolytic oscillations, or a mixture of both. At present, the authors base the network analyses on fast oscillations only in the case of simulated traces and on a mixture of fast and slow oscillations in the case of experimental traces. Since different networks may depend on the studied beta cell properties to a different extent (e.g., fast oscillation-based networks may, more importantly, depend on electrical properties and slow oscillationbased networks may more strongly depend on metabolic properties), it is important that in drawing the conclusions the authors separately address the influence of a cell's electrical and metabolic properties on its functional role in the network based on fast oscillations, slow oscillations, or a mixture of both.

      We thank reviewer 2 for their positive comments, including addressing the importance of this study as it pertains to islet biology and acknowledging methodological complexities of this study. We also thank the reviewer for their careful reading and providing useful comments. We have integrated each comment into the manuscript. Most importantly, we have now extended our analysis to both fast and slow oscillations by incorporating an additional mathematical model of coupled slow oscillations and performing additional experimental analysis of fast, slow, and mixed oscillations.

      Reviewer #3 (Public Review):

      Over the past decade, novel approaches to understanding beta cell connectivity and how that contributes to the overall function of the pancreatic islet have emerged. The application of network theory to beta cell connectivity has been an extremely useful tool to understand functional hierarchies amongst beta cells within an islet. This helps to provide functional relevance to observations from structural and gene expression data that beta cells are not all identical.

      There are a number of "controversies" in this field that have arisen from the mathematical and subsequent experimental identification of beta "hub" cells. These are small populations of beta cells that are very highly connected to other beta cells, as assessed by applying correlation statistics to individual beta cell calcium traces across the islet.

      In this paper Briggs et al set out to answer the following areas of debate:

      They use computational datasets, based on established models of beta cells acting in concert (electrically coupled) within an islet-like structure, to show that it is similarities in metabolic parameters rather than "structural" connections (ie proximity which subserves gap junction coupling) that drives functional network behaviour. Whilst the computational models are quite relevant, the fact that the parameters (eg connectivity coefficients) are quite different to what is measured experimentally, confirm the limitations of this model. Therefore it was important for the authors to back up this finding by performing both calcium and metabolic imaging of islet beta cells. These experimental data are reported to confirm that metabolic coupling was more strongly related to functional connectivity than gap junction coupling. However, a limitation here is that the metabolic imaging data confirmed a strong link between disconnected beta cells and low metabolic coupling but did not robustly show the opposite. Similarly, I was not convinced that the FRAP studies, which indirectly measured GJ ("structural") connections were powered well enough to be related to measures of beta cell connectivity.

      The group goes on to provide further analytical and experimental data with a model of increasing loss of GJ connectivity (by calcium imaging islets from WT, heterozygous (50% GJ loss), and homozygous (100% loss). Given the former conclusion that it was metabolic not GJ connectivity that drives small world network behaviour, it was surprising to see such a great effect on the loss of hubs in the homs. That said, the analytical approaches in this model did help the authors confirm that the loss of gap junctions does not alter the preferential existence of beta cell connectivity and confirms the important contribution of metabolic "coupling". One perhaps can therefore conclude that there are two types of network behaviour in an islet (maybe more) and the field should move towards an understanding of overlapping network communities as has been done in brain networks.

      Overall this is an extremely well-written paper which was a pleasure to read. This group has neatly and expertly provided both computational and experimental data to support the notion that it is metabolic but not "structural" ie GJ coupling that drives our observations of hubs and functional connectivity. However, there is still much work to do to understand whether this metabolic coupling is just a random epiphenomenon or somehow fated, the extent to which other elements of "structural" coupling - ie the presence of other endocrine cell types, the spatial distribution of paracrine hormone receptors, blood vessels and nerve terminals are also important.

      We thank reviewer 3 for their positive comments, including the methodology, writing style, and the importance of this paper to the broader islet community. We thank the reviewer for their very in-depth and helpful comments. We have addressed each comment below and made significant changes to the manuscript according. We conducted more FRAP experiments and separated results into slow, fast, and mixed oscillations. We included analysis of an additional computational model that simulates slow calcium oscillations. Additionally, we substantially rewrote the paper to clarify that we are not referring to metabolic coupling and speak on the broader implications of network theory and our findings.

      Reviewer #4 (Public Review):

      This manuscript describes a complex, highly ambitious set of modeling and experimental studies that appear designed to compare the structural and functional properties of beta cell subpopulations within the islet network in terms of their influence on network synchronization. The authors conclude that the most functionally coupled cell subpopulations in the islet network are not those that are most structurally coupled via gap junctions but those that are most metabolically active.

      Strengths of the paper include (1) its use of an interdisciplinary collection of methods including computer simulations, FRAP to monitor functional coupling by gap junctions, the monitoring of Ca2+ oscillations in single beta cells embedded in the network, and the use of sophisticated approaches from probability theory. Most of these methods have been used and validated previously. Unfortunately, however, it was not clear what the underlying premise of the paper actually is, despite many stated intentions, nor what about it is new compared to previous studies, an additional weakness.

      Although the authors state that they are trying to answer 3 critical questions, it was not clear how important these questions are in terms of significance for the field. For example, they state that a major controversy in the field is whether network structure or network function mediates functional synchronization of beta cells within the islet. However, this question is not much debated. As an example, while it is known that there can be long-range functional coupling in islets, no workers in the field believe there is a physical structure within islets that mediates this, unlike the case for CNS neurons that are known to have long projections onto other neurons. Beta cells within the islets are locally coupled via gap junctions, as stated repeatedly by the authors but these mediate short-range coupling. Thus, there are clearly functional correlations over long ranges but no structures, only correlated activity. This weakness raises questions about the overall significance of the work, especially as it seems to reiterate ideas presented previously.

      We thank reviewer 4 for their positive comments, including our multidisciplinary use of mathematical models and experimental imaging techniques. We have now included an additional model of slow oscillations (the Integrated Oscillator Model) to improve our conclusions. We also thank reviewer 4 for the insightful comments. We have carefully reviewed each comment and made significant changes to the manuscript accordingly. In particular, we have significantly rewritten the introduction and discussion attempting to clarify what is new in our manuscript and what is previously shown. Additionally, we agree with the reviewers’ sentiment that there is little debate over whether, for example, there are physical structures within the islet that mediate long-range functional connections. However, there is current debate over whether functional beta-cell subpopulations can dictate islet dynamics (see [11]–[13]). This debate can be framed by observing whether these functional subpopulations emerge from the islet due to physical connections (structural network) or something more nuisance (such as intrinsic dynamics). We have reframed the introduction and discussion to clarify this debate as well as more clearly state the premise of the paper.

      Specific Comments

      1). The authors state it is well accepted that the disruption of gap junctional coupling is a pathophysiological characteristic of diabetes, but this is not an opinion widely accepted by the field, although it has been proposed. The authors should scale back on such generalizations, or provide more compelling evidence to support such a claim.

      Thank you for pointing this out, we have provided more specific citations and changes the wording from “well accepted” to “has been documented”. See Discussion page 13 lines 415-416.

      2) The paper relies heavily on simulations performed using a version of the model of Cha et al (2011). While this is a reasonable model of fast bursting (e.g. oscillations having periods <1 min.), the Ca2+ oscillations that were recorded by the authors and shown in Fig. 2b of the manuscript are slow oscillations with periods of 5 min and not <1 min, which is a weakness of the model in the current context. Furthermore, the model outputs that are shown lack the well-known characteristics seen in real islets, such as fast-spiking occurring on prolonged plateaus, again as can be seen by comparing the simulated oscillations shown in Fig. 1d with those in Fig. 2b. It is recommended that the simulations be repeated using a more appropriate model of slow oscillations or at least using the model of Cha et al but employed to simulate in slower bursting.

      The reviewer raises an important point and caveat associated with our simulated model and experimental data. This point was also made by other reviewers, and a similar response to this comment can be found elsewhere in response to reviewer 2 point 6. To address this comment, we have performed several additional experiments and analyses:

      1) We collected additional Ca2+ (to identify the functional network and hubs) and FRAP data (to assess gap junction permeability) in islets which show either pure slow, pure fast, or mixed oscillations. We generated networks based on each time scale to compare with FRAP gap junction permeability data. We found that the conclusions of our first draft to be consistent across all oscillation types. There was no relationship between gap junction conductance, as approximated using FRAP, and normalized degree for slow (Figure 3j), fast (Figure 3 Supp 1d,e), or mixed (Figure 3 Supp 1g,h) oscillations. We also include discussion of these conclusions - See Results page 7 lines 184-186 and lines 188-191, Discussion page 12 lines 357-360.

      2) We also performed additional simulations with a coupled ‘Integrated Oscillator Model’ which shows slow oscillations because of metabolic oscillations (Figure 2). We compared connectivity with gap junction coupling and underlying cell parameters. In this case, there is an association between functional and structural networks, with highly-connected hub cells showing higher gap junction conductance (Figure 2f) but also low KATP channel conductance (gKATP) (Figure 2e). However, there are some caveats to these findings – given the nature of the IOM model, we were limited to simulating smaller islets (260 cells) and less heterogeneity in the calcium traces was observed. Additional analysis suggests the greater association between functional and structural networks in this model was a result of the smaller islets, and the association was also dependent on threshold (unlike in the Cha-Noma fast oscillator model) robust. These limitations and results are discussed further (Discussion page 11 lines 344-354).

      Additionally, in the IOM, the underlying cell dynamics of highly-connected hub cells are differentiated by KATP channel conductance (gKATP), which is different than in the fast oscillator model (differentiated by metabolism, kglyc). However this difference between models can be linked to differences in the way duty cycle is influenced by gKATP and kglyc (Figure 1h, Figure 2g). In each model there was a similar association between duty cycle and highly-connected hub cells. We also discuss these findings (Discussion page 11 lines 334-343).

      Overall these results and discussion with respect to the coupled IOM oscillator model can be found in Figure 2, Results page 6 lines 128-156 and Discussion page 11 lines 332-354.

      3) Much of the data analyzed whether obtained via simulation or through experiment seems to produce very small differences in the actual numbers obtained, as can be seen in the bar graphs shown in Figs. 1e,g for example (obtained from simulations), or Fig. 2j (obtained from experimental measurements). The authors should comment as to why such small differences are often seen as a result of their analyses throughout the manuscript and why also in many cases the observed variance is high. Related to the data shown, very few dots are shown in Figs. 1eg or Fig 4e and 4h even though these points were derived from simulations where 100s of runs could be carried out and many more points obtained for plotting. These are weaknesses unless specific and convincing explanations are provided.

      We thank the reviewer for these comments, which are similar to those of reviewer 2 (point 4) and reviewer 3 (point 6). Indeed there is some variability between cells in both simulations and experiments related to the metabolic activity in hubs and non-hubs. The variability points to potentially other factors being involved in determining hubs beyond simply kglyc, including a minor role for gap junction coupling structural network and potentially cell position and other intrinsic factors. We now discuss this point – see Discussion page 12 lines 364-266.

      The differences between hubs and nonhubs appear small because the value of kglyc is very small. For figure 1e, the average kglyc for nonhubs was 1.26x10⁻⁴ s-1 (which is the average of the distribution because most cells are non hubs) while the average kglyc for hubs was 1.4x10⁻⁴ s-1 which is about half of a standard deviation higher. The paired t-test controls for the small value of average kglyc.

      For simulation data each of the 5 dots corresponds to a simulated islet averaged over 1000 cells (or 260 cells for coupled IOM). The computational resources are high to generate such data so it is not feasible to conduct 100s of runs. Again, we note the comparisons between hubs and non-hubs are paired, and we find statistically significant differences for kglyc in figure 1 using only 5 paired data points. That we find these differences indicates the substantial difference between hubs and non-hubs. This is further supported all effect sizes being much greater than 0.8 for all significantly different findings (Cha Noma - kglyc: 2.85, gcoup: 0.82) (IOM: gKATP: 1.27, gcoup: 2.94) – We have included these effect sizes in the captions see Figure 1 and 2 captions (pages 34, 36)

      To consider all of the available data rather than the average across an entire islet, we created a kernel density estimate the kglyc for hubs and nonhubs created by concatenating every single cell in each of the five islets. A kstest results in a highly significant difference (P<0.0001) between these two distributions.

      Author response image 1.

      4) The data shown in Fig. 4i,j are intended to compare long-range synchronization at different distances along a string of coupled cells but the difference between the synchronized and unsynchronized cells for gcoup and Kglyc was subtle, very much so.

      Thank you for pointing out these subtle differences. The y-axis scale for i and j is broad to allow us to represent all distances on a single plot. After correction for multiple comparison, the differences were still statistically significant. As the reviewer mentioned in point 3, each plot contains only five data points, each of which represent the average of a single simulated islet, therefore we are not concerned about statistical significance coming from too large of a sample size. We also checked the differences between synchronized and nonsynchronized cell pairs in figure 4 panels e and h (now figure 5 e, h). These are the same data as i and j but normalized such that all of the distances could be averaged together. We again found statistical significance between synchronized and non-synchronized cell pairs. As can be seen in Author response image 2 the difference between synchronized and non-synchronized cell pairs is greater than the variability between simulated islets. Thus, in this case the variability is not substantial.

      Author response image 2.

      5) The data shown in Fig. 5 for Cx36 knockout islets are used to assess the influence of gap junctional coupling, which is reasonable, but it would be reassuring to know that loss of this gene has no effects on the expression of other genes in the beta cell, especially genes involved with glucose metabolism.

      This is an important point. Previous studies have assessed that no significant change in NAD(P)H is observed in Cx36 deficient islets – see Benninger et al J.Physiol 2011 [14]. Islet architecture is also retained. Further the insulin secretory response of dissociated Cx36 knockout beta cells is the same as that of dissociated wildtype beta cells, further indicating no significant defect in the intrinsic ability of the beta cell to release insulin – see Benninger et al J.Physiol 2011 [14]. We now Mention these findings in the discussion. See Discussion page 14 lines 459-464.

      6) In many places throughout the paper, it is difficult to ascertain whether what is being shown is new vs. what has been shown previously in other studies. The paper would thus benefit strongly from added text highlighting the novelty here and not just restating what is known, for instance, that islets can exhibit small-world network properties. This detracts from the strengths of the paper and further makes it difficult to wade through. Even the finding here that metabolic characteristics of the beta cells can infer profound and influential functional coupling is not new, as the authors proposed as much many years ago. Again, this makes it difficult to distill what is new compared to what is mainly just being confirmed here, albeit using different methods.

      Thank you for the suggestion, we have made significant modifications throughout the Introduction, Discussion and Results to be clearer about what is known from previous work and what is newly found in this manuscript.

      Reviewer #5 (Public Review):

      The authors use state-of-the-art computation, experiment, and current network analysis to try and disaggregate the impact of cellular metabolism driving cellular excitability and structural electrical connections through gap junctions on islet synchronization. They perform interesting simulations with a sophisticated mathematical model and compare them with closely associated experiments. This close association is impressive and is an excellent example of using mathematics to inform experiments and experimental results. The current conclusions, however, appear beyond the results presented. The use of functional connectivity is based on correlated calcium traces but is largely without an understood biophysical mechanism. This work aims to clarify such a mechanism between metabolism and structural connection and comes out on the side of metabolism driving the functional connectivity, but both are required and more nuanced conclusions should be drawn.

      We thank reviewer 5 for their positive comments, including our multifaceted experimental and computational techniques. We also found the reviewers careful reading and thoughtful comments to be very helpful and we have worked to integrate each comment into our manuscript. It is evident from the reviewer comments that we did not clearly explain what was meant by our conclusions concerning the functional network reflecting metabolism rather than gap junctions. We have conducted significant rewriting to show that we are not concluding that communication (metabolic or electric) occurs due to conduits other than gap junctions. Rather, our data suggest that the functional network (which reflects calcium synchronization) reflects intrinsic dynamics of the cells, which include metabolic rates, more than individual gap junction connections.

      References referred to in this response to reviewers document:

      [1] A. Stožer et al., “Functional connectivity in islets of Langerhans from mouse pancreas tissue slices,” PLoS Comput Biol, vol. 9, no. 2, p. e1002923, 2013.

      [2] N. L. Farnsworth, A. Hemmati, M. Pozzoli, and R. K. Benninger, “Fluorescence recovery after photobleaching reveals regulation and distribution of connexin36 gap junction coupling within mouse islets of Langerhans,” The Journal of physiology, vol. 592, no. 20, pp. 4431–4446, 2014.

      [3] C.-L. Lei, J. A. Kellard, M. Hara, J. D. Johnson, B. Rodriguez, and L. J. Briant, “Beta-cell hubs maintain Ca2+ oscillations in human and mouse islet simulations,” Islets, vol. 10, no. 4, pp. 151–167, 2018.

      [4] N. R. Johnston et al., “Beta cell hubs dictate pancreatic islet responses to glucose,” Cell metabolism, vol. 24, no. 3, pp. 389–401, 2016.

      [5] V. Kravets et al., “Functional architecture of pancreatic islets identifies a population of first responder cells that drive the first-phase calcium response,” PLoS Biology, vol. 20, no. 9, p. e3001761, 2022.

      [6] H. Ren et al., “Pancreatic α and β cells are globally phase-locked,” Nature Communications, vol. 13, no. 1, p. 3721, 2022.

      [7] A. Stožer et al., “From Isles of Königsberg to Islets of Langerhans: Examining the function of the endocrine pancreas through network science,” Frontiers in Endocrinology, vol. 13, p. 922640, 2022.

      [8] J. Zmazek et al., “Assessing different temporal scales of calcium dynamics in networks of beta cell populations,” Frontiers in physiology, vol. 12, p. 337, 2021.

      [9] M. E. Corezola do Amaral et al., “Caloric restriction recovers impaired β-cell-β-cell gap junction coupling, calcium oscillation coordination, and insulin secretion in prediabetic mice,” American Journal of Physiology-Endocrinology and Metabolism, vol. 319, no. 4, pp. E709–E720, 2020.

      [10] J. M. Dwulet, J. K. Briggs, and R. K. P. Benninger, “Small subpopulations of beta-cells do not drive islet oscillatory [Ca2+] dynamics via gap junction communication,” PLOS Computational Biology, vol. 17, no. 5, p. e1008948, May 2021, doi: 10.1371/journal.pcbi.1008948.

      [11] B. E. Peercy and A. S. Sherman, “Do oscillations in pancreatic islets require pacemaker cells?,” Journal of Biosciences, vol. 47, no. 1, pp. 1–11, 2022.

      [12] G. A. Rutter, N. Ninov, V. Salem, and D. J. Hodson, “Comment on Satin et al.‘Take me to your leader’: an electrophysiological appraisal of the role of hub cells in pancreatic islets. Diabetes 2020; 69: 830–836,” Diabetes, vol. 69, no. 9, pp. e10–e11, 2020.

      [13] L. S. Satin and P. Rorsman, “Response to comment on satin et al.‘Take me to your leader’: An electrophysiological appraisal of the role of hub cells in pancreatic islets. Diabetes 2020; 69: 830–836,” Diabetes, vol. 69, no. 9, pp. e12–e13, 2020.

      [14] R. K. Benninger, W. S. Head, M. Zhang, L. S. Satin, and D. W. Piston, “Gap junctions and other mechanisms of cell–cell communication regulate basal insulin secretion in the pancreatic islet,” The Journal of physiology, vol. 589, no. 22, pp. 5453–5466, 2011.

      [15] R. Fried, Erectile dysfunction as a cardiovascular impairment. Academic Press, 2014. [16] T. Pipatpolkai, S. Usher, P. J. Stansfeld, and F. M. Ashcroft, “New insights into KATP channel gene mutations and neonatal diabetes mellitus,” Nature Reviews Endocrinology, vol. 16, no. 7, pp. 378–393, 2020.

      [17] A. M. Notary, M. J. Westacott, T. H. Hraha, M. Pozzoli, and R. K. P. Benninger, “Decreases in Gap Junction Coupling Recovers Ca2+ and Insulin Secretion in Neonatal Diabetes Mellitus, Dependent on Beta Cell Heterogeneity and Noise,” PLOS Computational Biology, vol. 12, no. 9, p. e1005116, Sep. 2016, doi: 10.1371/journal.pcbi.1005116.

      [18] J. V. Rocheleau, G. M. Walker, W. S. Head, O. P. McGuinness, and D. W. Piston, “Microfluidic glucose stimulation reveals limited coordination of intracellular Ca2+ activity oscillations in pancreatic islets,” Pro ceedings of the National Academy of Sciences, vol. 101, no. 35, pp. 12899–12903, 2004. [19] R. K. Benninger, M. Zhang, W. S. Head, L. S. Satin, and D. W. Piston, “Gap junction coupling and calcium waves in the pancreatic islet,” Biophysical journal, vol. 95, no. 11, pp. 5048–5061, 2008.

    1. Author Response:

      Reviewer #1 (Public Review):

      Kursel et al. examined the evolution of synaptonemal complex proteins in C.elegans. While the sequence of the SC proteins evolved rapidly analysis of the structure of SC central region proteins from Caenorhabditis, Drosophila and mammalian species revealed that the length and placement of the coiled-coil domains, as well as overall protein length, were highly conserved across species. This conservation in the structure of coiled-coil proteins within the SC led to the proposal that the conserved structural parameters of the SC proteins and their coiled-coil domains could be used to identify central region components of the SC in species where components could not be identified on sequence conservation alone. Kursel et al demonstrated their parameters could be used to identify a transverse filament protein of the SC in the organism Pristionchus pacificus.

      Due to high sequence divergence identifying SC proteins in new model systems has been challenging. The identification by Kursel et al. of potential search parameters to identify these diverged proteins will be useful to the those who work on the synaptonemal complex. This approach has the potential to applicable to other types of proteins that show rapid sequence divergence. As the mammalian, fly, and worm SC proteins all displayed different lengths and placements of their coiled-coil domains within their SC proteins this approach is limited by the availability of related identified sequences to the model organism of interest. Additionally, this approach may still yield multiple candidates that fit the structural parameters which will require additional means to ultimately identify the protein of interest. The data in the manuscript supports the authors' claims of structural conservation within SC proteins but only additional applications of their search methods will reveal how useful it is to search for other types of proteins based on structural features.

      We thank the reviewer for their summary and feedback. We hope that with the ever-lowered costs of genome assembly and the expansion of CRISPR/Cas9 gene-editing capabilities, the pipeline we developed will be applicable to more clades and species. We agree that it will be interesting to expand our method beyond the SC. Going forward, we are excited to test whether it will enable us to identify other types of proteins, especially those that are part of condensates. In this light, our finding that centrosomal proteins are also enriched in the same evolutionary class as SC proteins is especially intriguing.

      Reviewer #2 (Public Review):

      In this article, Kursel and colleagues sought to identify evolutionary features of components of the SC the are evident in the absence of strict amino-acid conservation. After identifying three joint evolutionary properties of SC proteins - conservation of coiled-coil architecture, conservation of length and significant amino acid divergence - they show that these properties can be used to identify unknown SC proteins in divergent species. Overall, their general conclusion is very well supported and they do an excellent job functionally testing their approach by showing that one identified candidate for a novel SC protein in Pristionchus is in fact a component of the SC. In addition to providing new insight into the evolutionary forces that shape the evolution of SC proteins, this article provides new insight into how one might generally identify functionally similar or homologous proteins despite very deep divergence. Thus, this work has broader relevance to molecular evolution and evolution of protein structure.

      There are some places where smaller conclusions need more support. In particular, it is not entirely clear that this triple pattern - conservation of coiled-coil architecture, conservation of length and significant amino acid divergence - is broadly applicable to SC components beyond Dipterans and Nematodes. In particular, the pattern is weaker in Eutherian mammals. Some further investigation is needed to claim that the pattern is similar in mammals. In addition, it is not clear if coiled-coil conservation rather than simply having a coiled-coil domain is important as a mark of SC proteins. A comparison of coiled-coil conservation among proteins that have coiled-coil domains would be needed for this conclusion. Finally, there should be some additional clarification that not all nematode SC proteins have a pattern of insertion and deletion that is limited to regions outside of the coil-coil domains.

      We thank the reviewer for their appreciation of the broader impacts of our work to molecular evolution and for their suggestions for providing more support for our conclusions. We have addressed each of these points below (1. the evolutionary pattern in mammals, 2. the value of the coiled-coil conservation score, and 3. clarification of the indel analysis).

      1) As suggested, we have added dot plots comparing mammalian SC proteins to all other mammalian proteins for the three metrics central to this manuscript - amino acid substitutions per site, coiled-coil conservation scores and coefficient of variation of protein length. The plots (shown here) can be found in Figure 3 – figure supplement 4.

      These plots provide additional evidence that the evolutionary pattern of mammalian SC proteins is similar to (although weaker than) that of Caenorhabitis and Drosophila.

      In panel (A), we show the median amino acid substitutions per site of SC proteins is higher than other proteins in mammals, although the difference is not significant. We discuss two reasons why the divergence trend is weaker for mammalian SC proteins in the results. Briefly summarized they are, 1. The overall divergence of the mammalian proteome is less than that of the Caenorhabditis or Drosophila proteome, and 2. Mammalian SC proteins may face additional evolutionary constraints due to novel functions including mammalian-specific protein interactions.

      In panel (B), we show that mammalian SC proteins have a significantly higher coiled-coil conservation score than other proteins.

      In panel (C), we show coefficient of variation of protein length for mammalian SC proteins is not significantly different than other proteins. We hypothesize that this could be due to gene annotation errors which plague even very high-quality genomes. For example, we found annotation errors in 23 (18%) of the 125 Caenorhabditis SC proteins examined in this study. Uncorrected, these errors often read as large insertions or deletions, and artificially large coefficient of variation. We use L. africana SYCE3 to demonstrate how potential annotation errors could impact our measure of length variation in mammalian SC proteins. L. africana SYCE3 has conspicuous N- and C-terminal extensions not found in any other SYCE3. Excluding that single protein - L. africana SYCE3 – reduces the average length variation from 29% to 4% in the SYCE3 orthogroup, below the median of other proteins. Correspondingly, the median SC coefficient of variation of protein length drops from 20% (unfilled black circle) to 12% (dashed, unfilled circle). While systematic manual annotation of the Eutherian mammals proteomes is beyond the scope of this manuscript, we added in the Discussion explicit reference to the implications of annotation errors on our ability to systematically address evolutionary pressures affecting indels.

      2) We thank the reviewers for this important suggestion. Indeed, the inclusion of the few examples in Figure 2 were meant as demonstration rather than a statistical analysis. To create a group of proteins that would serve as appropriate control for conservation of the length and organization of the of coiled-coils, we selected orthogroups in which 90% of the proteins in the group had a coiled-coil domain of 21 amino acids or longer. This left 916 Caenorhabditis orthogroups including all SC proteins. We found that the median coiled-coil conservation score of SC proteins was significantly higher than that of the other coiled-coil proteins, confirming our comparisons to the entire proteome. We have included this analysis as a figure supplement to figure 2 (dot plot shown here and Figure 2 – figure supplement 1) and added text to the results and methods describing the analysis.

      More broadly, this result suggests that our coiled-coil conservation score is more informative than a binary measure of coiled-coil domain prediction (i.e. presence/absence of coiled-coil). The additional information contained in the coiled-coil conservation score likely comes from the fact that we take into account whether or not the coiled-coil domains are aligned across species; which reflects a higher degree of secondary structure conservation. We believe that future work to develop better measures of conservation of secondary structures will hone our ability to identify conservation of other protein classes.

      3) We have clarified this point in our revised manuscript, highlighting that when analyzed as a group, indels are excluded in coiled-coils of Caenorhabditis SC proteins, and that significance is also observed for specific SC proteins where enough indels are present to perform statistical tests. Two of the SC proteins, SYP-2 and SYP-3, had only two indels each, preventing us from performing tests of significance. We have also added text to the discussion directly addressing the limitations of automatically-assigned gene annotations on the ability to test evolutionary pressures on indels genome-wide.

      Reviewer #3 (Public Review):

      The manuscript "Unconventional conservation reveals structure-function relationships in the synaptonemal complex" by Kursel, Cope, and Rog, describes a novel bioinformatics analysis of proteins in the eukaryotic synaptonemal complex (SC). The SC is a highly conserved structure that links paired homologs in prophase of meiosis, and in most organisms is required for the successful completion of interhomolog recombination. An enigmatic feature of SC proteins is that they are highly diverged between organisms, to the point where they are nearly unrecognizable by sequence alone except among closely related organisms. Kursel et al show that within the Caenorhabditis family of nematodes, SC proteins show a reproducible pattern of coiled-coil segments and highly conserved overall length, while their primary sequences are extremely diverged. They use these findings to develop a method to identify new SC candidate proteins in a diverged nematode, Pristionchus pacificus, and confirm that one of these candidates is the main SC transverse filament protein in this organism. Finally, the authors expand their analysis to SC proteins in flies (Drosophila melanogaster and relatives) and eutherian mammals, and show similar findings in these protein families. In the discussion, the authors describe an interesting and compelling theory that the coiled coils of SC proteins directly support phase separation/condensation of these proteins to aid assembly of the SC superstructure.

      Overall, this work is well done, the findings are well-supported, and are of interest to meiosis researchers; especially those working directly on the SC. The manuscript is also well put-together: I could barely find a typo. From a broader perspective, however, I'm not convinced that the work provides a new paradigm for thinking about "conservation" in protein families and how to best detect it. Methods that use structural information to detect homology between highly diverged proteins beyond the capabilities of BLAST or even PSI-BLAST are well-developed (e.g. PHYRE2, HHPred, and others). The use of coiled-coil length as a metric for conservation, while it works nicely in the case of SC proteins, is likely to not be generalizable to other protein families. Even within SC proteins, the method does not seem to scale past specific families to, say, allow identification of homology between distantly-related eukaryotic groups (e.g. between Caenorhabditis and Drosophila or Caenorhabditis and eutherian mammals). To be fair, this failure to scale is not because of any limitation with the method; rather, simply that SC proteins diverge quickly through evolution. Overall, however, these limitations seem to limit the application of this method to the specialized case of SC proteins, thus limiting the audience and scope of the work.

      We appreciate the reviewer’s consideration of possible limitations of our study. However, we disagree that this method, and the insights gained from it, will be limited to SC proteins. A clear demonstration is that the centrosomal protein SPD-5 (Centrosomin in Drosophila, CdkRap2 in mammals) cannot be identified across clades using sequence homology despite performing a conserved and fundamental cellular function. We hypothesize that similar forces have shaped the evolution of SPD-5 and other centrosomal proteins that are enriched in the same evolutionary class as SC proteins (Figure 3 – figure supplement 1). Functional tests of these predictions will be an exciting area of future research.

      As this review notes, an exciting hypothesis stemming from our work is that proteins with diverged primary sequence and conserved secondary structures (coiled-coils, disordered protein domains or others) will be over-represented in condensates. Anecdotally this is indeed true, as both the SC and the centrosome were shown to be condensates. The burgeoning interest in condensates, and the development of tools to study them in vivo and in vitro, are bound to test the broad applicability of this hypothesis.

    1. Author Response:

      Evaluation Summary:

      The authors assessed multivariate relations between a dimensionality-reduced symptom space and brain imaging features, using a large database of individuals with psychosis-spectrum disorders (PSD). Demonstrating both high stability and reproducibility of their approaches, this work showed a promise that diagnosis or treatment of PSD can benefit from a proposed data-driven brain-symptom mapping framework. It is therefore of broad potential interest across cognitive and translational neuroscience.

      We are very grateful for the positive feedback and the careful read of our paper. We would especially like to thank the Reviewers for taking the time to read this lengthy and complex manuscript and for providing their helpful and highly constructive feedback. Overall, we hope the Editor and the Reviewers will find that our responses address all the comments and that the requested changes and edits improved the paper.

      Reviewer 1 (Public Review):

      The paper assessed the relationship between a dimensionality-reduced symptom space and functional brain imaging features based on the large multicentric data of individuals with psychosis-spectrum disorders (PSD).

      The strength of this study is that i) in every analysis, the authors provided high-level evidence of reproducibility in their findings, ii) the study included several control analyses to test other comparable alternatives or independent techniques (e.g., ICA, univariate vs. multivariate), and iii) correlating to independently acquired pharmacological neuroimaging and gene expression maps, the study highlighted neurobiological validity of their results.

      Overall the study has originality and several important tips and guidance for behavior-brain mapping, although the paper contains heavy descriptions about data mining techniques such as several dimensionality reduction algorithms (e.g., PCA, ICA, and CCA) and prediction models.

      We thank the Reviewer for their insightful comments and we appreciate the positive feedback. Regarding the descriptions of methods and analytical techniques, we have removed these descriptions out of the main Results text and figure captions. Detailed descriptions are still provided in the Methods, so that they do not detract from the core message of the paper but can still be referenced if a reader wishes to look up the details of these methods within the context of our analyses.

      Although relatively minors, I also have few points on the weaknesses, including i) an incomplete description about how to tell the PSD effects from the normal spectrum, ii) a lack of overarching interpretation for other principal components rather than only the 3rd one, and iii) somewhat expected results in the stability of PC and relevant indices.

      We are very appreciative of the constructive feedback and feel that these revisions have strengthened our paper. We have addressed these points in the revision as following:

      i) We are grateful to the Reviewer for bringing up this point as it has allowed us to further explore the interesting observation we made regarding shared versus distinct neural variance in our data. It is important to not confuse the neural PCA (i.e. the independent neural features that can be detected in the PSD and healthy control samples) versus the neuro-behavioral mapping. In other words, both PSD patients and healthy controls are human and therefore there are a number of neural functions that both cohorts exhibit that may have nothing to do with the symptom mapping in PSD patients. For instance, basic regulatory functions such as control of cardiac and respiratory cycles, motor functions, vision, etc. We hypothesized therefore that there are more common than distinct neural features that are on average shared across humans irrespective of their psychopathology status. Consequently, there may only be a ‘residual’ symptom-relevant neural variance. Therefore, in the manuscript we bring up the possibility that a substantial proportion of neural variance may not be clinically relevant. If this is in fact true then removing the shared neural variance between PSD and CON should not drastically affect the reported symptom-neural univariate mapping solution, because this common variance does not map to clinical features and therefore is orthogonal statistically. We have now verified this hypothesis quantitatively and have added extensive analyses to highlight this important observation made the the Reviewer. We first conducted a PCA using the parcellated GBC data from all 436 PSD and 202 CON (a matrix with dimensions 638 subjects x 718 parcels). We will refer to this as the GBC-PCA to avoid confusion with the symptom/behavioral PCA described elsewhere in the manuscript. This GBC-PCA resulted in 637 independent GBC-PCs. Since PCs are orthogonal to each other, we then partialled out the variance attributable to GBC-PC1 from the PSD data by reconstructing the PSD GBC matrix using only scores and coefficients from the remaining 636 GBC-PCs (GBˆCwoP C1). We then reran the univariate regression as described in Fig. 3, using the same five symptom PC scores across 436 PSD. The results are shown in Fig. S21 and reproduced below. Removing the first PC of shared neural variance (which accounted for about 15.8% of the total GBC variance across CON and PSD) from PSD data attenuated the statistics slightly (not unexpected as the variance was by definition reduced) but otherwise did not strongly affect the univariate mapping solution.

      We repeated the symptom-neural regression next with the first 2 GBC-PCs partialled out of the PSD data Fig. S22, with the first 3 PCs parsed out Fig. S23, and with the first 4 neural PCs parsed out Fig. S24. The symptom-neural maps remain fairly robust, although the similarity with the original βP CGBC maps does drop as more common neural variance is parsed out. These figures are also shown below:

      Fig. S21. Comparison between the PSD βP CGBC maps computed using GBC and GBC with the first neural PC parsed out. If a substantial proportion of neural variance is not be clinically relevant, then removing the shared neural variance between PSD and CON should not drastically affect the reported symptom-neural univariate mapping solution, because this common variance will not map to clinical features. We therefore performed a PCA on CON and PSD GBC to compute the shared neural variance (see Methods), and then parsed out the first GBC-PC from the PSD GBC data (GBˆCwoP C1). We then reran the univariate regression as described in Fig. 3, using the same five symptom PC scores across 436 PSD. (A) The βP C1GBC map, also shown in Fig. S10. (B) The first GBC-PC accounted for about 15.8% of the total GBC variance across CON and PSD. Removing GBC-PC1 from PSD data attenuated the βP C1GBC statistics slightly (not unexpected as the variance was by definition reduced) but otherwise did not strongly affect the univariate mapping solution. (C) Correlation across 718 parcels between the two βP C1GBC map shown in A and B. (D-O) The same results are shown for βP C2GBC to βP C5GBC maps.

      Fig. S22. Comparison between the PSD βP CGBC maps computed using GBC and GBC with the first two neural PCs parsed out. We performed a PCA on CON and PSD GBC and then parsed out the first three GBC-PC from the PSD GBC data (GBˆCwoP C1−2, see Methods). We then reran the univariate regression as described in Fig. 3, using the same five symptom PC scores across 436 PSD. (A) The βP C1GBC map, also shown in Fig. S10. (B) The second GBC-PC accounted for about 9.5% of the total GBC variance across CON and PSD. (C) Correlation across 718 parcels between the two βP C1GBC map shown in A and B. (D-O) The same results are shown for βP C2GBC to βP C5GBC maps.

      Fig. S23. Comparison between the PSD βP CGBC maps computed using GBC and GBC with the first three neural PCs parsed out. We performed a PCA on CON and PSD GBC and then parsed out the first three GBC-PC from the PSD GBC data (GBˆCwoP C1−3, see Methods). We then reran the univariate regression as described in Fig. 3, using the same five symptom PC scores across 436 PSD. (A) The βP C1GBC map, also shown in Fig. S10. (B) The second GBC-PC accounted for about 9.5% of the total GBC variance across CON and PSD. (C) Correlation across 718 parcels between the two βP C1GBC map shown in A and B. (D-O) The same results are shown for βP C2GBC to βP C5GBC maps.

      Fig. S24. Comparison between the PSD βP CGBC maps computed using GBC and GBC with the first four neural PCs parsed out. We performed a PCA on CON and PSD GBC and then parsed out the first four GBC-PC from the PSD GBC data (GBˆCwoP C1−4, see Methods). We then reran the univariate regression as described in Fig. 3, using the same five symptom PC scores across 436 PSD. (A) The βP C1GBC map, also shown in Fig. S10. (B) The second GBC-PC accounted for about 9.5% of the total GBC variance across CON and PSD. (C) Correlation across 718 parcels between the two βP C1GBC map shown in A and B. (D-O) The same results are shown for βP C2GBC to βP C5GBC maps.

      For comparison, we also computed the βP CGBC maps for control subjects, shown in Fig. S11. In support of the βP CGBC in PSD being circuit-relevant, we observed only mild associations between GBC and PC scores in healthy controls:

      Results: All 5 PCs captured unique patterns of GBC variation across the PSD (Fig. S10), which were not observed in CON (Fig. S11). ... Discussion: On the contrary, this bi-directional “Psychosis Configuration” axis also showed strong negative variation along neural regions that map onto the sensory-motor and associative control regions, also strongly implicated in PSD (1, 2). The “bi-directionality” property of the PC symptom-neural maps may thus be desirable for identifying neural features that support individual patient selection. For instance, it may be possible that PC3 reflects residual untreated psychosis symptoms in this chronic PSD sample, which may reveal key treatment neural targets. In support of this circuit being symptom-relevant, it is notable that we observed a mild association between GBC and PC scores in the CON sample (Fig. S11).

      ii) In our original submission we spotlighted PC3 because of its pattern of loadings on to hallmark symptoms of PSD, including strong positive loadings across Positive symptom items in the PANSS and conversely strong negative loadings on to most Negative items. It was necessary to fully examine this dimension in particular because these are key characteristics of the target psychiatric population, and we found that the focus on PC3 was innovative because it provided an opportunity to quantify a fully data-driven dimension of symptom variation that is highly characteristic of the PSD patient population. Additionally, this bi-directional axis captured shared variance from measures in other traditional symptoms factors, such the PANSS General factor and cognition. This is a powerful demonstration of how data-driven techniques such as PCA can reveal properties intrinsic to the structure of PSD-relevant symptom data which may in turn improve the mapping of symptom-neural relationships. We refrained from explaining each of the five PCs in detail in the main text as we felt that it would further complicate an already dense manuscript. Instead, we opted to provide the interpretation and data from all analyses for all five PCs in the Supplement. However, in response to the Reviewers’ thoughtful feedback that more focus should be placed on other components, we have expanded the presentation and discussion of all five components (both regarding the symptom profiles and neural maps) in the main text:

      Results: Because PC3 loads most strongly on to hallmark symptoms of PSD (including strong positive loadings across PANSS Positive symptom measures in the PANSS and strong negative loadings onto most Negative measures), we focus on this PC as an opportunity to quantify an innovative, fully data-driven dimension of symptom variation that is highly characteristic of the PSD patient population. Additionally, this bi-directional symptom axis captured shared variance from measures in other traditional symptoms factors, such the PANSS General factor and cognition. We found that the PC3 result provided a powerful empirical demonstration of how using a data-driven dimensionality-reduced solution (via PCA) can reveal novel patterns intrinsic to the structure of PSD psychopathology.

      iii) We felt that demonstrating the stability of the PCA solution was extremely important, given that this degree of rigor has not previously been tested using broad behavioral measures across psychosis symptoms and cognition in a cross-diagnostic PSD sample. Additionally, we demonstrated reproducibility of the PCA solution using independent split-half samples. Furthermore, we derived stable neural maps using the PCA solution. In our original submission we show that the CCA solution was not reproducible in our dataset. Following the Reviewers’ feedback, we computed the estimated sample sizes needed to sufficiently power our multivariate analyses for stable/reproducible solutions. using the methods in (3). These results are discussed in detail in our resubmitted manuscript and in our response to the Critiques section below.

      Reviewer 2 (Public Review):

      The work by Ji et al is an interesting and rather comprehensive analysis of the trend of developing data-driven methods for developing brain-symptom dimension biomarkers that bring a biological basis to the symptoms (across PANSS and cognitive features) that relate to psychotic disorders. To this end, the authors performed several interesting multivariate analyses to decompose the symptom/behavioural dimensions and functional connectivity data. To this end, the authors use data from individuals from a transdiagnostic group of individuals recruited by the BSNIP cohort and combine high-level methods in order to integrate both types of modalities. Conceptually there are several strengths to this paper that should be applauded. However, I do think that there are important aspects of this paper that need revision to improve readability and to better compare the methods to what is in the field and provide a balanced view relative to previous work with the same basic concepts that they are building their work around. Overall, I feel as though the work could advance our knowledge in the development of biomarkers or subject level identifiers for psychiatric disorders and potentially be elevated to the level of an individual "subject screener". While this is a noble goal, this will require more data and information in the future as a means to do this. This is certainly an important step forward in this regard.

      We thank the Reviewer for their insightful and constructive comments about our manuscript. We have revised the text to make it easier to read and to clarify our results in the context of prior works in the field. We fully agree that a great deal more work needs to be completed before achieving single-subject level treatment selection, but we hope that our manuscript provides a helpful step towards this goal.

      Strengths:

      • Combined analysis of canonical psychosis symptoms and cognitive deficits across multiple traditional psychosis-related diagnoses offers one of the most comprehensive mappings of impairments experienced within PSD to brain features to date
      • Cross-validation analyses and use of various datasets (diagnostic replication, pharmacological neuroimaging) is extremely impressive, well motivated, and thorough. In addition the authors use a large dataset and provide "out of sample" validity
      • Medication status and dosage also accounted for
      • Similarly, the extensive examination of both univariate and multivariate neuro-behavioural solutions from a methodological viewpoint, including the testing of multiple configurations of CCA (i.e. with different parcellation granularities), offers very strong support for the selected symptom-to-neural mapping
      • The plots of the obtained PC axes compared to those of standard clinical symptom aggregate scales provide a really elegant illustration of the differences and demonstrate clearly the value of data-driven symptom reduction over conventional categories
      • The comparison of the obtained neuro-behavioural map for the "Psychosis configuration" symptom dimension to both pharmacological neuroimaging and neural gene expression maps highlights direct possible links with both underlying disorder mechanisms and possible avenues for treatment development and application
      • The authors' explicit investigation of whether PSD and healthy controls share a major portion of neural variance (possibly present across all people) has strong implications for future brain-behaviour mapping studies, and provides a starting point for narrowing the neural feature space to just the subset of features showing symptom-relevant variance in PSD

      We are very grateful for the positive feedback. We would like to thank the Reviewers for taking the time to read this admittedly dense manuscript and for providing their helpful critique.

      Critiques:

      • Overall I found the paper very hard to read. There are abbreviation everywhere for every concept that is introduced. The paper is methods heavy (which I am not opposed to and quite like). It is clear that the authors took a lot of care in thinking about the methods that were chosen. That said, I think that the organization would benefit from a more traditional Intro, Methods, Results, and Discussion formatting so that it would be easier to parse the Results. The figures are extremely dense and there are often terms that are coined or used that are not or poorly defined.

      We appreciate the constructive feedback around how to remove the dense content and to pay more attention to the frequency of abbreviations, which impact readability. We implemented the strategies suggested by the Reviewer and have moved the Methods section after the Introduction to make the subsequent Results section easier to understand and contextualize. For clarity and length, we have moved methodological details previously in the Results and figure captions to the Methods (e.g. descriptions of dimensionality reduction and prediction techniques). This way, the Methods are now expanded for clarity without detracting from the readability of the core results of the paper. Also, we have also simplified the text in places where there was room for more clarity. For convenience and ease of use of the numerous abbreviations, we have also added a table to the Supplement (Supplementary Table S1).

      • One thing I found conceptually difficult is the explicit comparison to the work in the Xia paper from the Satterthwaite group. Is this a fair comparison? The sample is extremely different as it is non clinical and comes from the general population. Can it be suggested that the groups that are clinically defined here are comparable? Is this an appropriate comparison and standard to make. To suggest that the work in that paper is not reproducible is flawed in this light.

      This is an extremely important point to clarify and we apologize that we did not make it sufficiently clear in the initial submission. Here we are not attempting to replicate the results of Xia et al., which we understand were derived in a fundamentally different sample than ours both demographically and clinically, with testing very different questions. Rather, this paper is just one example out of a number of recent papers which employed multivariate methods (CCA) to tackle the mapping between neural and behavioral features. The key point here is that this approach does not produce reproducible results due to over-fitting, as demonstrated robustly in the present paper. It is very important to highlight that in fact we did not single out any one paper when making this point. In fact, we do not mention the Xia paper explicitly anywhere and we were very careful to cite multiple papers in support of the multivariate over-fitting argument, which is now a well-know issue (4). Nevertheless, the Reviewers make an excellent point here and we acknowledge that while CCA was not reproducible in the present dataset, this does not explicitly imply that the results in the Xia et al. paper (or any other paper for that matter) are not reproducible by definition (i.e. until someone formally attempts to falsify them). We have made this point explicit in the revised paper, as shown below. Furthermore, in line with the provided feedback, we also applied the multivariate power calculator derived by Helmer et al. (3), which quantitatively illustrates the statistical point around CCA instability.

      Results: Several recent studies have reported “latent” neuro-behavioral relationships using multivariate statistics (5–7), which would be preferable because they simultaneously solve for maximal covariation across neural and behavioral features. Though concerns have emerged whether such multivariate results will replicate due to the size of the feature space relative to the size of the clinical samples (4), Given the possibility of deriving a stable multivariate effect, here we tested if results improve with canonical correlation analysis (CCA) (8) which maximizes relationships between linear combinations of symptom (B) and neural features (N) across all PSD (Fig. 5A).

      Discussion: Here we attempted to use multivariate solutions (i.e. CCA) to quantify symptom and neural feature co- variation. In principle, CCA is well-suited to address the brain-behavioral mapping problem. However, symptom-neural mapping using CCA across either parcel-level or network-level solutionsin our sample was not reproducible even when using a low-dimensional symptom solution and parcellated neural data as a starting point. Therefore, while CCA (and related multivariate methods such as partial least squares) are theoretically appropriate and may be helped by regularization methods such as sparse CCA, in practice many available psychiatric neuroimaging datasets may not provide sufficient power to resolve stable multivariate symptom-neural solutions (3). A key pressing need for forthcoming studies will be to use multivariate power calculators to inform sample sizes needed for resolving stable symptom-neural geometries at the single subject level. Of note, though we were unable to derive a stable CCA in the present sample, this does not imply that the multivariate neuro-behavioral effect may not be reproducible with larger effect sizes and/or sample sizes. Critically, this does highlight the importance of power calculations prior to computing multivariate brain-behavioral solutions (3).

      • Why was PCA selected for the analysis rather than ICA? Authors mention that PCA enables the discovery of orthogonal symptom dimensions, but don't elaborate on why this is expected to better capture behavioural variation within PSD compared to non-orthogonal dimensions. Given that symptom and/or cognitive items in conventional assessments are likely to be correlated in one way or another, allowing correlations to be present in the low-rank behavioural solution may better represent the original clinical profiles and drive more accurate brain-behaviour mapping. Moreover, as alluded to in the Discussion, employing an oblique rotation in the identification of dimensionality-reduced symptom axes may have actually resulted in a brain-behaviour space that is more generalizable to other psychiatric spectra. Why not use something more relevant to symptom/behaviour data like a factor analysis?

      This is a very important point! We agree with the Reviewer that an oblique solution may better fit the data. For this reason, we performed an ICA as shown in the Supplement. We chose to show PCA for the main analyses here because it is a deterministic solution and the number of significant components could be computed via permutation testing. Importantly, certain components from the ICA solution in this sample were highly similar to the PCs shown in the main solution (Supplementary Note 1), as measured by comparing the subject behavioral scores (Fig. S4), and neural maps (Fig. S13). However, notably, certain components in the ICA and PCA solutions did not appear to have a one-to-one mapping (e.g. PCs 1-3 and ICs 1-3). The orthogonality of the PCA solution forces the resulting components to capture maximally separated, unique symptom variance, which in turn map robustly on to unique neural circuits. We observed that the data may be distributed in such a way that in the ICA highly correlated independent components emerge, which do not maximally separate the symptom variance associate with neural variance. We demonstrate this by plotting the relationship between parcel beta coefficients for the βP C3GBC map versus the βIC2GBC and βIC3GBC maps. The sigmoidal shape of the distribution indicates an improvement in the Z-statistics for the βP C3GBC map relative to the βIC2GBC and βIC3GBC maps. We have added this language to the main text Results:

      Notably, independent component analysis (ICA), an alternative dimensionality reduction procedure which does not enforce component orthogonality, produced similar effects for this PSD sample, see Supplementary Note 1 & Fig. S4A). Certain pairs of components between the PCA and ICA solutions appear to be highly similar and exclusively mapped (IC5 and PC4; IC4 and PC5) (Fig. S4B). On the other hand, PCs 1-3 and ICs 1-3 do not exhibit a one-to-one mapping. For example, PC3 appears to correlate positively with IC2 and equally strongly negatively with IC3, suggesting that these two ICs are oblique to the PC and perhaps reflect symptom variation that is explained by a single PC. The orthogonality of the PCA solution forces the resulting components to capture maximally separated, unique symptom variance, which in turn map robustly on to unique neural circuits. We observed that the data may be distributed in such a way that in the ICA highly correlated independent components emerge, which do not maximally separate the symptom variance associate with neural variance. We demonstrate this by plotting the relationship between parcel beta coefficients for the βP C3GBC map versus the βIC2GBC and βIC3GBC maps Fig. ??G). The sigmoidal shape of the distribution indicates an improvement in the Z-statistics for the βP C3GBC map relative to the βIC2GBC and βIC3GBC maps.

      Additionally, the Reviewer raises an important point, and we agree that orthogonal versus oblique solutions warrant further investigation especially with regards to other psychiatric spectra and/or other stages in disease progression. For example, oblique components may better capture dimensions of behavioral variation in prodromal individuals, as these individuals are in the early stages of exhibiting psychosis-relevant symptoms and may show early diverging of dimensions of behavioral variation. We elaborate on this further in the Discussion:

      Another important aspect that will require further characterization is the possibility of oblique axes in the symptom-neural geometry. While orthogonal axes derived via PCA were appropriate here and similar to the ICA-derived axes in this solution, it is possible that oblique dimensions more clearly reflect the geometry of other psychiatric spectra and/or other stages in disease progression. For example, oblique components may better capture dimensions of neuro-behavioral variation in a sample of prodromal individuals, as these patients are exhibiting early-stage psychosis-like symptoms and may show signs of diverging along different trajectories.

      Critically, these factors should constitute key extensions of an iteratively more robust model for indi- vidualized symptom-neural mapping across the PSD and other psychiatric spectra. Relatedly, it will be important to identify the ‘limits’ of a given BBS solution – namely a PSD-derived effect may not generalize into the mood spectrum (i.e. both the symptom space and the resulting symptom-neural mapping is orthogonal). It will be important to evaluate if this framework can be used to initialize symptom-neural mapping across other mental health symptom spectra, such as mood/anxiety disorders.

      • The gene expression mapping section lacks some justification for why the 7 genes of interest were specifically chosen from among the numerous serotonin and GABA receptors and interneuron markers (relevant for PSD) available in the AHBA. Brief reference to the believed significance of the chosen genes in psychosis pathology would have helped to contextualize the observed relationship with the neuro-behavioural map.

      We thank the Reviewer for providing this suggestion and agree that it will strengthen the section on gene expression analysis. Of note, we did justify the choice for these genes, but we appreciate the opportunity to expand on the neurobiology of selected genes and their relevance to PSD. We have made these edits to the text:

      We focus here on serotonin receptor subunits (HTR1E, HTR2C, HTR2A), GABA receptor subunits (GABRA1, GABRA5), and the interneuron markers somatostatin (SST) and parvalbumin (PVALB). Serotonin agonists such as LSD have been shown to induce PSD-like symptoms in healthy adults (9) and the serotonin antagonism of “second-generation” antipsychotics are thought to contribute to their efficacy in targeting broad PSD symptoms (10–12). Abnormalities in GABAergic interneurons, which provide inhibitory control in neural circuits, may contribute to cognitive deficits in PSD (13–15) and additionally lead to downstream excitatory dysfunction that underlies other PSD symptoms (16, 17). In particular, a loss of prefrontal parvalbumin-expression fast-spiking interneurons has been implicated in PSD (18–21).

      • What the identified univariate neuro-behavioural mapping for PC3 ("psychosis configuration") actually means from an empirical or brain network perspective is not really ever discussed in detail. E.g., in Results, "a high positive PC3 score was associated with both reduced GBC across insular and superior dorsal cingulate cortices, thalamus, and anterior cerebellum and elevated GBC across precuneus, medial prefrontal, inferior parietal, superior temporal cortices and posterior lateral cerebellum." While the meaning and calculation of GBC can be gleaned from the Methods, a direct interpretation of the neuro-behavioural results in terms of the types of symptoms contributing to PC3 and relative hyper-/hypo-connectivity of the DMN compared to e.g. healthy controls could facilitate easier comparisons with the findings of past studies (since GBC does not seem to be a very commonly-used measure in the psychosis fMRI literature). Also important since GBC is a summary measure of the average connectivity of a region, and doesn't provide any specificity in terms of which regions in particular are more or less connected within a functional network (an inherent limitation of this measure which warrants further attention).

      We acknowledge that GBC is a linear combination measure that by definition does not provide information on connectivity between any one specific pair of neural regions. However, as shown by highly robust and reproducible neurobehavioral maps, GBC seems to be suitable as a first-pass metric in the absence of a priori assumptions of how specific regional connectivity may map to the PC symptom dimensions, and it has been shown to be sensitive to altered patterns of overall neural connectivity in PSD cohorts (22–25) as well as in models of psychosis (9, 26). Moreover, it is an assumption free method for dimensionality reduction of the neural connectivity matrix (which is a massive feature space). Furthermore, GBC provides neural maps (where each region can be represented by a value, in contrast to full functional connectivity matrices), which were necessary for quantifying the relationship with independent molecular benchmark maps (i.e. pharmacological maps and gene expression maps). We do acknowledge that there are limitations to the method which we now discuss in the paper. Furthermore we agree with the Reviewer that the specific regions implicated in these symptom-neural relationships warrants a more detailed investigation and we plan to develop this further in future studies, such as with seed-based functional connectivity using regions implicated in PSD (e.g. thalamus (2, 27)) or restricted GBC (22) which can summarize connectivity information for a specific network or subset of neural regions. We have provided elaboration and clarification regarding this point in the Discussion:

      Another improvement would be to optimize neural data reduction sensitivity for specific symptom variation (28). We chose to use GBC for our initial geometry characterizations as it is a principled and assumption-free data-reduction metric that captures (dys)connectivity across the whole brain and generates neural maps (where each region can be represented by a value, in contrast to full functional connectivity matrices) that are necessary for benchmarking against molecular imaging maps. However, GBC is a summary measure that by definition does not provide information regarding connectivity between specific pairs of neural regions, which may prove to be highly symptom-relevant and informative. Thus symptom-neural relationships should be further explored with higher-resolution metrics, such as restricted GBC (22) which can summarize connectivity information for a specific network or subset of neural regions, or seed-based FC using regions implicated in PSD (e.g. thalamus (2, 27)).

      • Possibly a nitpick, but while the inclusion of cognitive measures for PSD individuals is a main (self-)selling point of the paper, there's very limited focus on the "Cognitive functioning" component (PC2) of the PCA solution. Examining Fig. S8K, the GBC map for this cognitive component seems almost to be the inverse for that of the "Psychosis configuration" component (PC3) focused on in the rest of the paper. Since PC3 does not seem to have high loadings from any of the cognitive items, but it is known that psychosis spectrum individuals tend to exhibit cognitive deficits which also have strong predictive power for illness trajectory, some discussion of how multiple univariate neuro-behavioural features could feasibly be used in conjunction with one another could have been really interesting.

      This is an important piece of feedback concerning the cognitive measure aspect of the study. As the Reviewer recognizes, cognition is a core element of PSD symptoms and the key reason for including this symptom into the model. Notably, the finding that one dimension captures a substantial proportion of cognitive performance-related variance, independent of other residual symptom axes, has not previously been reported and we fully agree that expanding on this effect is important and warrants further discussion. We would like to take two of the key points from the Reviewers’ feedback and expand further. First, we recognize that upon qualitative inspection PC2 and PC3 neural maps appear strongly anti-correlated. However, as demonstrated in Fig. S9O, PC2 and PC3 maps were anti-correlated at r=-0.47. For comparison, the PC2 map was highly anti-correlated with the BACS composite cognitive map (r=-0.81). This implies that the PC2 map in fact reflects unique neural circuit variance that is relevant for cognition, but not necessarily an inverse of the PC3.

      In other words, these data suggest that there are PSD patients with more (or less) severe cognitive deficits independent of any other symptom axis, which would be in line with the observation that these symptoms are not treatable with antipsychotic medication (and therefore should not correlate with symptoms that are treatable by such medications; i.e. PC3). We have now added these points into the revised paper:

      Results Fig. 1E highlights loading configurations of symptom measures forming each PC. To aid interpretation, we assigned a name for each PC based on its most strongly weighted symptom measures. This naming is qualitative but informed by the pattern of loadings of the original 36 symptom measures (Fig. 1). For example, PC1 was highly consistent with a general impairment dimension (i.e. “Global Functioning”); PC2 reflected more exclusively variation in cognition (i.e. “Cognitive Functioning”); PC3 indexed a complex configuration of psychosis-spectrum relevant items (i.e. “Psy- chosis Configuration”); PC4 generally captured variation mood and anxiety related items (i.e. “Affective Valence”); finally, PC5 reflected variation in arousal and level of excitement (i.e. “Agitation/Excitation”). For instance, a generally impaired patient would have a highly negative PC1 score, which would reflect low performance on cognition and elevated scores on most other symptomatic items. Conversely, an individual with a high positive PC3 score would exhibit delusional, grandiose, and/or hallucinatory behavior, whereas a person with a negative PC3 score would exhibit motor retardation, social avoid- ance, possibly a withdrawn affective state with blunted affect (29). Comprehensive loadings for all 5 PCs are shown in Fig. 3G. Fig. 1F highlights the mean of each of the 3 diagnostic groups (colored spheres) and healthy controls (black sphere) projected into a 3-dimensional orthogonal coordinate system for PCs 1,2 & 3 (x,y,z axes respectively; alternative views of the 3-dimensional coordinate system with all patients projected are shown in Fig. 3). Critically, PC axes were not parallel with traditional aggregate symptom scales. For instance, PC3 is angled at 45◦ to the dominant direction of PANSS Positive and Negative symptom variation (purple and blue arrows respectively in Fig. 1F). ... Because PC3 loads most strongly on to hallmark symptoms of PSD (including strong positive load- ings across PANSS Positive symptom measures in the PANSS and strong negative loadings onto most Negative measures), we focus on this PC as an opportunity to quantify an innovative, fully data-driven dimension of symptom variation that is highly characteristic of the PSD patient population. Additionally, this bi-directional symptom axis captured shared variance from measures in other traditional symptoms factors, such the PANSS General factor and cognition. We found that the PC3 result provided a powerful empirical demonstration of how using a data-driven dimensionality-reduced solution (via PCA) can reveal novel patterns intrinsic to the structure of PSD psychopathology.

      Another nitpick, but the Y axes of Fig. 8C-E are not consistent, which causes some of the lines of best fit to be a bit misleading (e.g. GABRA1 appears to have a more strongly positive gene-PC relationship than HTR1E, when in reality the opposite is true.)

      We have scaled each axis to best show the data in each plot but see how this is confusing and recognise the need to correct this. We have remade the plots with consistent axes labelling.

      • The authors explain the apparent low reproducibility of their multivariate PSD neuro-behavioural solution using the argument that many psychiatric neuroimaging datasets are too small for multivariate analyses to be sufficiently powered. Applying an existing multivariate power analysis to their own data as empirical support for this idea would have made it even more compelling. The following paper suggests guidelines for sample sizes required for CCA/PLS as well as a multivariate calculator: Helmer, M., Warrington, S. D., Mohammadi-Nejad, A.-R., Ji, J. L., Howell, A., Rosand, B., Anticevic, A., Sotiropoulos, S. N., & Murray, J. D. (2020). On stability of Canonical Correlation Analysis and Partial Least Squares with application to brain-behavior associations (p. 2020.08.25.265546). https://doi.org/10.1101/2020.08.25.265546

      We deeply appreciate the Reviewer’s suggestion and the opportunity to incorporate the methods from the Helmer et al. paper. We now highlight the importance of having sufficiently powered samples for multivariate analyses in our other manuscript first-authored by our colleague Dr. Markus Helmer (3). Using the method described in the above paper (GEMMR version 0.1.2), we computed the estimated sample sizes required to power multivariate CCA analyses with 718 neural features and 5 behavioral (PC) features (i.e. the feature set used throughout the rest of the paper):

      As argued in Helmer et al., rtrue is likely below 0.3 in many cases, thus the estimated sample size of 33k is likely a lower bound for the required sample size for sufficiently-powered CCA analyses using the 718+5 features leveraged throughout the univariate analyses in the present manuscript. This number is two orders of magnitude greater than our available sample (and at least one order of magnitude greater than any single existing clinical dataset). Even if rtrue is 0.5, a sample size of ∼10k would likely be required.

      As argued in Helmer et al., rtrue is likely below 0.3 in many cases, thus the estimated sample size of 33k is likely a lower bound for the required sample size for sufficiently-powered CCA analyses using the 718+5 features leveraged throughout the univariate analyses in the present manuscript. This number is two orders of magnitude greater than our available sample (and at least one order of magnitude greater than any single existing clinical dataset). Even if rtrue is 0.5, a sample size of ∼10k would likely be required. We also computed the estimated sample sizes required for 180 neural features (symmetrized neural cortical parcels) and 5 symptom PC features, consistent with the CCA reported in our main text:

      Assuming that rtrue is likely below 0.3, this minimal required sample size remains at least an order of magnitude greater than the size of our present sample, consistent with the finding that the CCA solution computed using these data was unstable. As a lower limit for the required sample size plausible using the feature sets reported in our paper, we additionally computed for comparison the estimated N needed with the smallest number of features explored in our analyses, i.e. 12 neural functional network features and 5 symptom PC features:

      These required sample sizes are closer to the N=436 used in the present sample and samples reported in the clinical neuroimaging literature. This is consistent with the observation that when using 12 neural and 5 symptom features (Fig. S15C) the detected canonical correlation r = 0.38 for CV1 is much lower (and likely not inflated due to overfitting) and may be closer to the true effect because with the n=436 this effect is resolvable. This is in contrast to the 180 neural features and 5 symptom feature CCA solution where we observed a null CCA effect around r > 0.6 across all 5 CVs. This clearly highlights the inflation of the effect in the situation where the feature space grows. There is no a priori plausible reason to believe that the effect for 180 vs. 5 feature mapping is literally double the effect when using 12 vs. 5 feature mapping - especially as the 12 features are networks derived from the 180 parcels (i.e. the effect should be comparable rather than 2x smaller). Consequently, if the true CCA effect with 180 vs. 5 features was actually in the more comparable r = 0.38, we would need >5,000 subjects to resolve a reproducible neuro-behavioral CCA map (an order of magnitude more than in the BSNIP sample). Moreover, to confidently detect effects if rtrue is actually less than 0.3, we would require a sample size >8,145 subjects. We have added this to the Results section on our CCA results:

      Next, we tested if the 180-parcel CCA solution is stable and reproducible, as done with PC-to-GBC univariate results. The CCA solution was robust when tested with k-fold and leave-site-out cross- validation (Fig. S16) likely because these methods use CCA loadings derived from the full sample. However, the CCA loadings did not replicate in non-overlapping split-half samples (Fig. 5L, see see Supplementary Note 4). Moreover, a leave-one-subject-out cross-validation revealed that removing a single subject from the sample affected the CCA solution such that it did not generalize to the left-out subject (Fig. 5M). This is in contrast to the PCA-to-GBC univariate mapping, which was substantially more reproducible for all attempted cross-validations relative to the CCA approach. This is likely because substantially more power is needed to resolve a stable multivariate neuro-behavioral effect with this many features. Indeed, a multivariate power analysis using 180 neural features and 5 symptom features, and assuming a true canonical correlation of r = 0.3, suggests that a minimal sample size of N = 8145 is needed to sufficiently detect the effect (3), an order of magnitude greater than the available sample size. Therefore, we leverage the univariate neuro-behavioral result for subsequent subject-specific model optimization and comparisons to molecular neuroimaging maps.

      Additionally, we added the following to Supplementary Note 4: Establishing the Reproducibility of the CCA Solution:

      Here we outline the details of the split-half replication for the CCA solution. Specifically, the full patient sample was randomly split (referred to as “H1” and “H2” respectively), while preserving the proportion of patients in each diagnostic group. Then, CCA was performed independently for H1 and H2. While the loadings for behavioral PCs and original behavioral items are somewhat similar (mean r 0.5) between the two CCAs in each run, the neural loadings were not stable across H1 and H2 CCA solutions. Critically, CCA results did not perform well for leave-one-subject-out cross-validation (Fig. 5M). Here, one patient was held out while CCA was performed using all data from the remaining 435 patients. The loadings matrices Ψ and Θ from the CCA were then used to calculate the “predicted” neural and behavioral latent scores for all 5 CVs for the patient that was held out of the CCA solution. This process was repeated for every patient and the final result was evaluated for reproducibility. As described in the main text, this did not yield reproducible CCA effects (Fig. 5M). Of note, CCA may yield higher reproducibility if the neural feature space were to be further reduced. As noted, our approach was to first parcellate the BOLD signal and then use GBC as a data-driven method to yield a neuro-biologically and quantitatively interpretable neural data reduction, and we additionally symmetrized the result across hemispheres. Nevertheless, in sharp contrast to the PCA univariate feature selection approach, the CCA solutions were still not stable in the present sample size of N = 436. Indeed, a multivariate power analysis (3) estimates that the following sample sizes will be required to sufficiently power a CCA between 180 neural features and 5 symptom features, at different levels of true canonical correlation (rtrue):

      To test if further neural feature space reduction may be improve reproducibility, we also evaluated CCA solutions with neural GBC parcellated according to 12 brain-wide functional networks derived from the recent HCP driven network parcellation (30). Again, we computed the CCA for all 36 item-level symptom as well as 5 PCs (Fig. S15). As with the parcel-level effects, the network-level CCA analysis produced significant results (for CV1 when using 36 item-level scores and for all 5 CVs when using the 5 PC-derived scores). Here the result produced much lower canonical correlations ( 0.3-0.5); however, these effects (for CV1) clearly exceeded the 95% confidence interval generated via random permutations, suggesting that they may reflect the true canonical correlation. We observed a similar result when we evaluated CCAs computed with neural GBC from 192 symmetrized subcortical parcels and 36 symptoms or 5 PCs (Fig. S14). In other words, data-reducing the neural signal to 12 functional networks likely averaged out parcel-level information that may carry symptom-relevant variance, but may be closer to capturing the true effect. Indeed, the power analysis suggests that the current sample size is closer to that needed to detect an effect with 12 + 5 features:

      Note that we do not present a CCA conducted with parcels across the whole brain, as the number of variables would exceed the number of observations. However, the multivariate power analysis using 718 neural features and 5 symptom features estimates that the following sample sizes would be required to detect the following effects:

      This analysis suggests that even the lowest bound of 10k samples exceeds the present available sample size by two orders of magnitude.

      We have also added Fig. S19, illustrating these power analyses results:

      Fig. S19. Multivariate power analysis for CCA. Sample sizes were calculated according to (3), see also https://gemmr.readthedocs.io/en/latest/. We computed the multivariate power analyses for three versions of CCA reported in this manuscript: i) 718 neural vs. 5 symptom features; ii) 180 neural vs. 5 symptom features; iii) 12 neural vs. 5 symptom features. (A) At different levels of features, the ratio of samples (i.e. subjects) required per feature to derive a stable CCA solution remains approximately the same across all values of rtrue. As discussed in (3), at rtrue = 0.3 the number of samples required per feature is about 40, which is much greater than the ratio of samples to features available in our dataset. (B) The total number of samples required (nreq)) for a stable CCA solution given the total number of neural and symptom features used in our analyses, at different values of rtrue. In general these required sample sizes are much greater than the N=436 (light grey line) PSD in our present dataset, consistent with the finding that the CCA solutions computed using our data were unstable. Notably, the ‘12 vs. 5’ CCA assuming rtrue = 0.3 requires only 700 subjects, which is closest to the N=436 (horizontal grey line) used in the present sample. This may be in line with the observation of the CCA with 12 neural vs 5 symptom features (Fig. S15C) that the canonical correlation (r = 0.38 for CV1) clearly exceeds the 95% confidence interval, and may be closer to the true effect. However, to confidently detect effects in such an analysis (particularly if rtrue is actually less than 0.3), a larger sample would likely still be needed.

      We also added the corresponding methods in the Methods section:

      Multivariate CCA Power Analysis. Multivariate power analyses to estimate the minimum sample size needed to sufficiently power a CCA were computed using methods described in (3), using the Genera- tive Modeling of Multivariate Relationships tool (gemmr, https://github.com/murraylab/ gemmr (v0.1.2)). Briefly, a model was built by: 1) Generating synthetic datasets for the two input data matrices, by sampling from a multivariate normal distribution with a joint covariance matrix that was structured to encode CCA solutions with specified properties; 2) Performing CCAs on these synthetic datasets. Because the joint covariance matrix is known, the true values of estimated association strength, weights, scores, and loadings of the CCA, as well as the errors for these four metrics, can also be computed. In addition, statistical power that the estimated association strength is different from 0 is determined through permutation testing; 3) Varying parameters of the generative model (number of features, assumed true between-set correlation, within-set variance structure for both datasets) the required sample size Nreq is determined in each case such that statistical power reaches 90% and all of the above described error metrics fall to a target level of 10%; and 4) Fitting and validating a linear model to predict the required sample size Nreq from parameters of the generative model. This linear model was then used to calculate Nreq for CCA in three data scenarios: i) 718 neural vs. 5 symptom features; ii) 180 neural vs. 5 symptom features; iii) 12 neural vs. 5 symptom features.

      • Given the relatively even distribution of males and females in the dataset, some examination of sex effects on symptom dimension loadings or neuro-behavioural maps would have been interesting (other demographic characteristics like age and SES are summarized for subjects but also not investigated). I think this is a missed opportunity.

      We have now provided additional analyses for the core PCA and univariate GBC mapping results, testing for effects of age, sex, and SES in Fig. S8. Briefly, we observed a significant positive relationship between age and PC3 scores, which may be because older patients (whom presumably have been ill for a longer time) exhibit more severe symptoms along the positive PC3 – Psychosis Configuration dimension. We also observed a significant negative relationship between Hollingshead index of SES and PC1 and PC2 scores. Lower PC1 and PC2 scores indicate poorer general functioning and cognitive performance respectively, which is consistent with higher Hollingshead indices (i.e. lower-skilled jobs or unemployment and fewer years of education). We also found significant sex differences in PC2 – Cognitive Functioning, PC4 – Affective Valence, and PC5 – Agitation/Excitement scores.

      Fig. S8. Effects of age, socio-economic status, and sex on symptom PCA solution. (A) Correlations between symptom PC scores and age (years) across N=436 PSD. Pearson’s correlation value and uncorrected p-values are reported above scatterplots. After Bonferroni correction, we observed a significant positive relationship between age and PC3 score. This may be because older patients have been ill for a longer period of time and exhibit more severe symptoms along the positive PC3 dimension. (B) Correlations between symptom PC scores and socio-economic status (SES) as measured by the Hollingshead Index of Social Position (31), across N=387 PSD with available data. The index is computed as (Hollingshead occupation score * 7) + (Hollingshead education score * 4); a higher score indicates lower SES (32). We observed a significant negative relationship between Hollingshead index and PC1 and PC2 scores. Lower PC1 and PC2 scores indicate poorer general functioning and cognitive performance respectively, which is consistent with higher Hollingshead indices (i.e. lower-skilled jobs or unemployment and fewer years of education). (C) The Hollingshead index can be split into five classes, with 1 being the highest and 5 being the lowest SES class (31). Consistent with (B) we found a significant difference between the classes after Bonferroni correction for PC1 and PC2 scores. (D) Distributions of PC scores across Hollingshead SES classes show the overlap in scores. White lines indicate the mean score in each class. (E) Differences in PC scores between (M)ale and (F)emale PSD subjects. We found a significant difference between sexes in PC2 – Cognitive Functioning, PC4 – Affective Valence, and PC5 – Agitation/Excitement scores. (F) Distributions of PC scores across M and F subjects show the overlap in scores. White lines indicate the mean score for each sex.

      Bibliography

      1. Jie Lisa Ji, Caroline Diehl, Charles Schleifer, Carol A Tamminga, Matcheri S Keshavan, John A Sweeney, Brett A Clementz, S Kristian Hill, Godfrey Pearlson, Genevieve Yang, et al. Schizophrenia exhibits bi-directional brain-wide alterations in cortico-striato-cerebellar circuits. Cerebral Cortex, 29(11):4463–4487, 2019.
      2. Alan Anticevic, Michael W Cole, Grega Repovs, John D Murray, Margaret S Brumbaugh, Anderson M Winkler, Aleksandar Savic, John H Krystal, Godfrey D Pearlson, and David C Glahn. Characterizing thalamo-cortical disturbances in schizophrenia and bipolar illness. Cerebral cortex, 24(12):3116–3130, 2013.
      3. Markus Helmer, Shaun D Warrington, Ali-Reza Mohammadi-Nejad, Jie Lisa Ji, Amber Howell, Benjamin Rosand, Alan Anticevic, Stamatios N Sotiropoulos, and John D Murray. On stability of canonical correlation analysis and partial least squares with application to brain-behavior associations. bioRxiv, 2020. .
      4. Richard Dinga, Lianne Schmaal, Brenda WJH Penninx, Marie Jose van Tol, Dick J Veltman, Laura van Velzen, Maarten Mennes, Nic JA van der Wee, and Andre F Marquand. Evaluating the evidence for biotypes of depression: Methodological replication and extension of. NeuroImage: Clinical, 22:101796, 2019.
      5. Cedric Huchuan Xia, Zongming Ma, Rastko Ciric, Shi Gu, Richard F Betzel, Antonia N Kaczkurkin, Monica E Calkins, Philip A Cook, Angel Garcia de la Garza, Simon N Vandekar, et al. Linked dimensions of psychopathology and connectivity in functional brain networks. Nature communications, 9(1):3003, 2018.
      6. Andrew T Drysdale, Logan Grosenick, Jonathan Downar, Katharine Dunlop, Farrokh Mansouri, Yue Meng, Robert N Fetcho, Benjamin Zebley, Desmond J Oathes, Amit Etkin, et al. Resting-state connectivity biomarkers define neurophysiological subtypes of depression. Nature medicine, 23(1):28, 2017.
      7. Meichen Yu, Kristin A Linn, Russell T Shinohara, Desmond J Oathes, Philip A Cook, Romain Duprat, Tyler M Moore, Maria A Oquendo, Mary L Phillips, Melvin McInnis, et al. Childhood trauma history is linked to abnormal brain connectivity in major depression. Proceedings of the National Academy of Sciences, 116(17):8582–8590, 2019.
      8. David R Hardoon, Sandor Szedmak, and John Shawe-Taylor. Canonical correlation analysis: An overview with application to learning methods. Neural computation, 16(12):2639–2664, 2004.
      9. Katrin H Preller, Joshua B Burt, Jie Lisa Ji, Charles H Schleifer, Brendan D Adkinson, Philipp Stämpfli, Erich Seifritz, Grega Repovs, John H Krystal, John D Murray, et al. Changes in global and thalamic brain connectivity in LSD-induced altered states of consciousness are attributable to the 5-HT2A receptor. eLife, 7:e35082, 2018.
      10. Mark A Geyer and Franz X Vollenweider. Serotonin research: contributions to understanding psychoses. Trends in pharmacological sciences, 29(9):445–453, 2008.
      11. H Y Meltzer, B W Massey, and M Horiguchi. Serotonin receptors as targets for drugs useful to treat psychosis and cognitive impairment in schizophrenia. Current pharmaceutical biotechnology, 13(8):1572–1586, 2012.
      12. Anissa Abi-Dargham, Marc Laruelle, George K Aghajanian, Dennis Charney, and John Krystal. The role of serotonin in the pathophysiology and treatment of schizophrenia. The Journal of neuropsychiatry and clinical neurosciences, 9(1):1–17, 1997.
      13. Francine M Benes and Sabina Berretta. Gabaergic interneurons: implications for understanding schizophrenia and bipolar disorder. Neuropsychopharmacology, 25(1):1–27, 2001.
      14. Melis Inan, Timothy J. Petros, and Stewart A. Anderson. Losing your inhibition: Linking cortical gabaergic interneurons to schizophrenia. Neurobiology of Disease, 53:36–48, 2013. ISSN 0969-9961. . What clinical findings can teach us about the neurobiology of schizophrenia?
      15. Samuel J Dienel and David A Lewis. Alterations in cortical interneurons and cognitive function in schizophrenia. Neurobiology of disease, 131:104208, 2019.
      16. John E Lisman, Joseph T Coyle, Robert W Green, Daniel C Javitt, Francine M Benes, Stephan Heckers, and Anthony A Grace. Circuit-based framework for understanding neurotransmitter and risk gene interactions in schizophrenia. Trends in neurosciences, 31(5):234–242, 2008.
      17. Anthony A Grace. Dysregulation of the dopamine system in the pathophysiology of schizophrenia and depression. Nature Reviews Neuroscience, 17(8):524, 2016.
      18. John F Enwright III, Zhiguang Huo, Dominique Arion, John P Corradi, George Tseng, and David A Lewis. Transcriptome alterations of prefrontal cortical parvalbumin neurons in schizophrenia. Molecular psychiatry, 23(7): 1606–1613, 2018.
      19. Daniel J Lodge, Margarita M Behrens, and Anthony A Grace. A loss of parvalbumin-containing interneurons is associated with diminished oscillatory activity in an animal model of schizophrenia. Journal of Neuroscience, 29(8): 2344–2354, 2009.
      20. Clare L Beasley and Gavin P Reynolds. Parvalbumin-immunoreactive neurons are reduced in the prefrontal cortex of schizophrenics. Schizophrenia research, 24(3):349–355, 1997.
      21. David A Lewis, Allison A Curley, Jill R Glausier, and David W Volk. Cortical parvalbumin interneurons and cognitive dysfunction in schizophrenia. Trends in neurosciences, 35(1):57–67, 2012.
      22. Alan Anticevic, Margaret S Brumbaugh, Anderson M Winkler, Lauren E Lombardo, Jennifer Barrett, Phillip R Corlett, Hedy Kober, June Gruber, Grega Repovs, Michael W Cole, et al. Global prefrontal and fronto-amygdala dysconnectivity in bipolar i disorder with psychosis history. Biological psychiatry, 73(6):565–573, 2013.
      23. Alex Fornito, Jong Yoon, Andrew Zalesky, Edward T Bullmore, and Cameron S Carter. General and specific functional connectivity disturbances in first-episode schizophrenia during cognitive control performance. Biological psychiatry, 70(1):64–72, 2011.
      24. Avital Hahamy, Vince Calhoun, Godfrey Pearlson, Michal Harel, Nachum Stern, Fanny Attar, Rafael Malach, and Roy Salomon. Save the global: global signal connectivity as a tool for studying clinical populations with functional magnetic resonance imaging. Brain connectivity, 4(6):395–403, 2014.
      25. Michael W Cole, Alan Anticevic, Grega Repovs, and Deanna Barch. Variable global dysconnectivity and individual differences in schizophrenia. Biological psychiatry, 70(1):43–50, 2011.
      26. Naomi R Driesen, Gregory McCarthy, Zubin Bhagwagar, Michael Bloch, Vincent Calhoun, Deepak C D’Souza, Ralitza Gueorguieva, George He, Ramani Ramachandran, Raymond F Suckow, et al. Relationship of resting brain hyperconnectivity and schizophrenia-like symptoms produced by the nmda receptor antagonist ketamine in humans. Molecular psychiatry, 18(11):1199–1204, 2013.
      27. Neil D Woodward, Baxter Rogers, and Stephan Heckers. Functional resting-state networks are differentially affected in schizophrenia. Schizophrenia research, 130(1-3):86–93, 2011.
      28. Zarrar Shehzad, Clare Kelly, Philip T Reiss, R Cameron Craddock, John W Emerson, Katie McMahon, David A Copland, F Xavier Castellanos, and Michael P Milham. A multivariate distance-based analytic framework for connectome-wide association studies. Neuroimage, 93 Pt 1:74–94, Jun 2014. .
      29. Alan J Gelenberg. The catatonic syndrome. The Lancet, 307(7973):1339–1341, 1976.
      30. Jie Lisa Ji, Marjolein Spronk, Kaustubh Kulkarni, Grega Repovš, Alan Anticevic, and Michael W Cole. Mapping the human brain’s cortical-subcortical functional network organization. NeuroImage, 185:35–57, 2019.
      31. August B Hollingshead et al. Four factor index of social status. 1975.
      32. Jaya L Padmanabhan, Neeraj Tandon, Chiara S Haller, Ian T Mathew, Shaun M Eack, Brett A Clementz, Godfrey D Pearlson, John A Sweeney, Carol A Tamminga, and Matcheri S Keshavan. Correlations between brain structure and symptom dimensions of psychosis in schizophrenia, schizoaffective, and psychotic bipolar i disorders. Schizophrenia bulletin, 41(1):154–162, 2015.
    1. Author Response

      Reviewer #1 (Public Review):

      Buglak et al. describe a role for the nuclear envelope protein Sun1 in endothelial mechanotransduction and vascular development. The study provides a full mechanistic investigation of how Sun1 is achieving its function, which supports the concept that nuclear anchoring is important for proper mechanosensing and junctional organization. The experiments have been well designed and were quantified based on independent experiments. The experiments are convincing and of high quality and include Sun1 depletion in endothelial cell cultures, zebrafish, and in endothelial-specific inducible knockouts in mice.

      We thank the reviewer for their enthusiastic comments and for noting our use of multiple model systems.

      Reviewer #2 (Public Review):

      Endothelial cells mediate the growth of the vascular system but they also need to prevent vascular leakage, which involves interactions with neighboring endothelial cells (ECs) through junctional protein complexes. Buglak et al. report that the EC nucleus controls the function of cell-cell junctions through the nuclear envelope-associated proteins SUN1 and Nesprin-1. They argue that SUN1 controls microtubule dynamics and junctional stability through the RhoA activator GEF-H1.

      In my view, this study is interesting and addresses an important but very little-studied question, namely the link between the EC nucleus and cell junctions in the periphery. The study has also made use of different model systems, i.e. genetically modified mice, zebrafish, and cultured endothelial cells, which confirms certain findings and utilizes the specific advantages of each model system. A weakness is that some important controls are missing. In addition, the evidence for the proposed molecular mechanism should be strengthened.

      We thank the reviewer for their interest in our work and for highlighting the relative lack of information regarding connections between the EC nucleus and cell periphery, and for noting our use of multiple model systems. We thank the reviewer for suggesting additional controls and mechanistic support, and we have made the revisions described below.

      Specific comments:

      1) Data showing the efficiency of Sun1 inactivation in the murine endothelial cells is lacking. It would be best to see what is happening on the protein level, but it would already help a great deal if the authors could show a reduction of the transcript in sorted ECs. The excision of a DNA fragment shown in the lung (Fig. 1-suppl. 1C) is not quantitative at all. In addition, the gel has been run way too short so it is impossible to even estimate the size of the DNA fragment.

      We agree that the DNA excision is not sufficient to demonstrate excision efficiency. We attempted examination of SUN1 protein levels in mutant retinas via immunofluorescence, but to date we have not found a SUN1 antibody that works in mouse retinal explants. We argue that mouse EC isolation protocols enrich but don’t give 100% purity, so that RNA analysis of lung tissue also has caveats. Finally, we contend that our demonstration of a consistent vascular phenotype in Sun1iECKO mutant retinas argues that excision has occurred. To test the efficiency of our excision protocol, we bred Cdh5CreERT2 mice with the ROSAmT/mG excision reporter (cells express tdTomato absent Cre activity and express GFP upon Cre-mediated excision (Muzumdar et al., 2007). Utilizing the same excision protocol as used for the Sun1iECKO mice, we see a significantly high level of excision in retinal vessels only in the presence of Cdh5CreERT2 (Reviewer Figure 1).

      Reviewer Figure 1: Cdh5CreERT2 efficiently excises in endothelial cells of the mouse postnatal retina. (A) Representative images of P7 mouse retinas with the indicated genotypes, stained for ERG (white, nucleus). tdTomato (magenta) is expressed in cells that have not undergone Cre-mediated excision, while GFP (green) is expressed in excised cells. Scale bar, 100μm. (B) Quantification of tdTomato fluorescence relative to GFP fluorescence as shown in A. tdTomato and GFP fluorescence of endothelial cells was measured by creating a mask of the ERG channel. n=3 mice per genotype. ***, p<0.001 by student’s two-tailed unpaired t-test.

      2) The authors show an increase in vessel density in the periphery of the growing Sun1 mutant retinal vasculature. It would be important to add staining with a marker labelling EC nuclei (e.g. Erg) because higher vessel density might reflect changes in cell size/shape or number, which has also implications for the appearance of cell-cell junctions. More ECs crowded within a small area are likely to have more complicated junctions. Furthermore, it would be useful and straightforward to assess EC proliferation, which is mentioned later in the experiments with cultured ECs but has not been addressed in the in vivo part.

      We concur that ERG staining is important to show any changes in nuclear shape or cell density in the post-natal retina. We now include this data in Figure1-figure supplement 1F-G. We do not see obvious changes in nuclear shape or number, though we do observe some crowding in Sun1iECKO retinas, consistent with increased density. However, when normalized to total vessel area, we do not observe a significant difference in the nuclear signal density in Sun1iECKO mutant retinas relative to controls.

      3) It appears that the loss of Sun1/sun1b in mice and zebrafish is compatible with major aspects of vascular growth and leads to changes in filopodia dynamics and vascular permeability (during development) without severe and lasting disruption of the EC network. It would be helpful to know whether the loss-of-function mutants can ultimately form a normal vascular network in the retina and trunk, respectively. It might be sufficient to mention this in the text.

      We thank the reviewer for pointing this out. It is true that developmental defects in the vasculature resulting from various genetic mutations are often resolved over time. We’ve made text changes to discuss viability of Sun1 global KO mice and lack of perduring effects in sun1 morphant fish, perhaps resulting from compensation by SUN2, which is partially functionally redundant with SUN1 in vivo (Lei et al., 2009; Zhang, et al., 2009) (p. 20).

      4) The only readout after the rescue of the SUN1 knockdown by GEF-H1 depletion is the appearance of VE-cadherin+ junctions (Fig. 6G and H). This is insufficient evidence for a relatively strong conclusion. The authors should at least look at microtubules. They might also want to consider the activation status of RhoA as a good biochemical readout. It is argued that RhoA activity goes up (see Fig. 7C) but there is no data supporting this conclusion. It is also not clear whether "diffuse" GEF-H1 localization translates into increased Rho A activity, as is suggested by the Rho kinase inhibition experiment. GEF-H1 levels in the Western blot in (Fig. 6- supplement 2C) have not been quantitated.

      We agree that analysis of RhoA activity and additional analysis of rescued junctions strengthens our conclusions, so we performed these experiments. New data (Figure 6IJ) shows that co-depletion of SUN1 and GEF-H1 rescues junction integrity as measured by biotin-matrix labeling. Interestingly, co-depletion of SUN1 and GEF-H1 does not rescue reduced microtubule density at the periphery (Figure 6-figure supplement 3BC), placing GEF-H1 downstream of aberrant microtubule dynamics in SUN1 depleted cells. This is consistent with our model (Figure 8) describing how loss of SUN1 leads to increased microtubule depolymerization, resulting in release and activation of GEF-H1 that goes on to affect actomyosin contractility and junction integrity. In addition, we include images of the junctions in GEF-H1 single KD (Figure 6-figure supplement 3BC) and quantify the western blot in Figure 6-figure supplement 3A.

      We performed RhoA activity assays and new data shows that SUN1 depletion results in increased RhoA activation, while co-depletion of SUN1 and GEF-H1 ameliorates this increase (Figure 6-figure supplement 2D). This is consistent with our model in which loss of SUN1 leads to increased RhoA activity via release of GEF-H1 from microtubules. In addition, we now cite a recent study describing that GEF-H1 is activated when unbound to microtubules, with this activation resulting in increased RhoA activity (Azoitei et al., 2019).

      5) The criticism raised for the GEF-H1 rescue also applies to the co-depletion of SUN1 and Nesprin-1. This mechanistic aspect is currently somewhat weak and should be strengthened. Again, Rho A activity might be a useful and quantitative biochemical readout.

      We respectfully point out that we showed that co-depletion of nesprin-1 and SUN1 rescues SUN1 knockdown effects via several readouts, including rescue of junction morphology, biotin labeling, microtubule localization at the periphery, and GEFH1/microtubule localization. We’ve moved this data to the main figure (Figure 7B-C, E-F) to better highlight these mechanistic findings. These results are consistent with our model that nesprin-1 effects are upstream of GEF-H1 localization. We also added results showing that nesprin-1 knockdown alone does not affect junction integrity, microtubule density, or GEF-H1/microtubule localization (Figure 7-figure supplement 1B-G).

      Reviewer #3 (Public Review):

      Here, Buglak and coauthors describe the effect of Sun1 deficiency on endothelial junctions. Sun1 is a component of the LINC complex, connecting the inner nuclear membrane with the cytoskeleton. The authors show that in the absence of Sun1, the morphology of the endothelial adherens junction protein VE-cadherin is altered, indicative of increased internalization of VE-cadherin. The change in VE-cadherin dynamics correlates with decreased angiogenic sprouting as shown using in vivo and in vitro models. The study would benefit from a stricter presentation of the data and needs additional controls in certain analyses.

      We thank the reviewer for their insightful comments, and in response we have performed the revisions described below.

      1) The authors implicate the changes in VE-cadherin morphology to be of consequence for "barrier function" and mention barrier function frequently throughout the text, for example in the heading on page 12: "SUN1 stabilizes endothelial cell-cell junctions and regulates barrier function". The concept of "barrier" implies the ability of endothelial cells to restrict the passage of molecules and cells across the vessel wall. This is tested only marginally (Suppl Fig 1F) and these data are not quantified. Increased leakage of 10kDa dextran in a P6-7 Sun1-deficient retina as shown here probably reflects the increased immaturity of the Sun1-deficient retinal vasculature. From these data, the authors cannot state that Sun1 regulates the barrier or barrier function (unclear what exactly the authors refer to when they make a distinction between the barrier as such on the one hand and barrier function on the other). The authors can, if they do more experiments, state that loss of Sun1 leads to increased leakage in the early postnatal stages in the retina. However, if they wish to characterize the vascular barrier, there is a wide range of other tissue that should be tested, in the presence and absence of disease. Moreover, a regulatory role for Sun1 would imply that Sun1 normally, possibly through changes in its expression levels, would modulate the barrier properties to allow more or less leakage in different circumstances. However, no such data are shown. The authors would need to go through their paper and remove statements regarding the regulation of the barrier and barrier function since these are conclusions that lack foundation.

      We thank the reviewer for pointing out that the language used regarding the function and integrity of the junctions is confusing, although we suggest that the endothelial cell properties measured by our assays are typically equated with “barrier function” in the literature. However, we have edited our language to precisely describe our results as suggested by the reviewer.

      2) In Fig 6g, the authors show that "depletion of GEF-H1 in endothelial cells that were also depleted for SUN1 rescued the destabilized cell-cell junctions observed with SUN1 KD alone". However, it is quite clear that Sun1 depletion also affects cell shape and cell alignment and this is not rescued by GEF-H1 depletion (Fig 6g). This should be described and commented on. Moreover please show the effects of GEF-H1 alone.

      We thank the reviewer for pointing out the effects on cell shape. SUN1 depletion typically leads to shape changes consistent with elevated contractility, but this is considered to be downstream of the effects quantified here. We updated the panel in Figure 6G to a more representative image showing cell shape rescue by co-depletion of SUN1 and GEF-H1. We present new data panels showing that GEF-H1 depletion alone does not affect junction integrity (Figure 6I-J). We also present new data showing that co-depletion of GEF-H1 and SUN1 does not rescue microtubule density at the periphery (Figure 6-figure supplement 3B-C), consistent with our model that GEF-H1 activation is downstream of microtubule perturbations induced by SUN1 loss.

      3) In Fig. 6a, the authors show rescue of junction morphology in Sun1-depleted cells by deletion of Nesprin1. The effect of Nesprin1 KD alone is missing.

      We thank the reviewer for this comment, and we now include new panels (Figure 7figure supplement 1B-G) demonstrating that Nesprin-1 depletion does not affect biotin-matrix labeling, peripheral microtubule density, or GEF-H1/microtubule localization absent co-depletion with SUN1. These findings are consistent with our model that Nesprin-1 loss does not affect cell junctions on its own because it is held in a non-functional complex with SUN1 that is not available in the absence of SUN1.

      References

      Azoitei, M. L., Noh, J., Marston, D. J., Roudot, P., Marshall, C. B., Daugird, T. A., Lisanza, S. L., Sandί, M., Ikura, M., Sondek, J., Rottapel, R., Hahn, K. M., Danuser, & Danuser, G. (2019). Spatiotemporal dynamics of GEF-H1 activation controlled by microtubule- and Src-mediated pathways. Journal of Cell Biology, 218(9), 3077-3097. https://doi.org/10.1083/jcb.201812073

      Denis, K. B., Cabe, J. I., Danielsson, B. E., Tieu, K. V, Mayer, C. R., & Conway, D. E. (2021). The LINC complex is required for endothelial cell adhesion and adaptation to shear stress and cyclic stretch. Molecular Biology of the Cell, mbcE20110698. https://doi.org/10.1091/mbc.E20-11-0698

      King, S. J., Nowak, K., Suryavanshi, N., Holt, I., Shanahan, C. M., & Ridley, A. J. (2014). Nesprin-1 and nesprin-2 regulate endothelial cell shape and migration. Cytoskeleton (Hoboken, N.J.), 71(7), 423–434. https://doi.org/10.1002/cm.21182

      Lei, K., Zhang, X., Ding, X., Guo, X., Chen, M., Zhu, B., Xu, T., Zhuang, Y., Xu, R., & Han, M. (2009). SUN1 and SUN2 play critical but partially redundant roles in anchoring nuclei in skeletal muscle cells in mice. PNAS, 106(25), 10207–10212.

      Muzumdar, M. D., Tasic, B., Miyamichi, K., Li, L., & Luo, L. (2007). A global doublefluorescent Cre reporter mouse. Genesis, 45(9), 593-605. https://doi.org/10.1002/dvg.20335

      Ueda, N., Maekawa, M., Matsui, T. S., Deguchi, S., Takata, T., Katahira, J., Higashiyama, S., & Hieda, M. (2022). Inner Nuclear Membrane Protein, SUN1, is Required for Cytoskeletal Force Generation and Focal Adhesion Maturation. Frontiers in Cell and Developmental Biology, 10, 885859. https://doi.org/10.3389/fcell.2022.885859

      Zhang, X., Lei, K., Yuan, X., Wu, X., Zhuang, Y., Xu, T., Xu, R., & Han, M. (2009). SUN1/2 and Syne/Nesprin-1/2 complexes connect centrosome to the nucleus during neurogenesis and neuronal migration in mice. Neuron, 64(2), 173–187. https://doi.org/10.1016/j.neuron.2009.08.018.

    1. Reviewer #2 (Public review):

      A summary of what the authors were trying to achieve.

      The authors aim to determine whether the gene Hsb17b7 is essential for hair cell function and, if so, to elucidate the underlying mechanism, specifically the HSB17B7 metabolic role in cholesterol biogenesis. They use animal, tissue, or data from zebrafish, mouse, and human patients.

      Strengths:

      (1) This is the first study of Hsb17b7 in the zebrafish (a previous report identified this gene as a hair cell marker in the mouse utricle).

      (2) The authors demonstrate that Hsb17b7 is expressed in hair cells of zebrafish and the mouse cochlea.

      (3) In zebrafish larvae, a likely KO of the Hsb17b7 gene causes a mild phenotype in an acoustic/vibrational assay, which also involves a motor response.

      (4) In zebrafish larvae, a likely KO of the Hsb17b7 gene causes a mild reduction in lateral line neuromast hair cell number and a mild decrease in the overall mechanotransduction activity of hair cells, assayed with a fluorescent dye entering the mechanotransduction channels.

      (5) When HSB17B7 is overexpressed in a cell line, it goes to the ER, and an increase in Cholesterol cytoplasmic puncta is detected. Instead, when a truncated version of HSB17B7 is overexpressed, HSB17B7 forms aggregates that co-localize with cholesterol.

      (6) It seems that the level of cholesterol in crista and neuromast hair cells decreases when Hsb17b7 is defective (but see comment below).

      Weakness:

      (1) The statement that HSD17B7 is "highly" expressed in sensory hair cells in mice and zebrafish seems incorrect for zebrafish:

      (a) The data do not support the notion that HSB17B7 is "highly expressed" in zebrafish. Compared to other genes (TMC1, TMIE, and others), the HSB17B7 level of expression in neuromast hair cells is low (Figure 1F), and by extension (Figure 1C), also in all hair cells. This interpretation is in line with the weak detection of an mRNA signal by ISH (Figure 1G I"). On this note, the staining reported in I" does not seem to label the cytoplasm of neuromast hair cells. An antisense probe control, along with a positive control (such as TMC1 or another), is necessary to interpret the ISH signal in the neuromast.

      (b) However, this is correct for mouse cochlear hair cells, based on single-cell RNA-seq published databases and immunostaining performed in the study. However, the specificity of the anti-HSD17B7 antibody used in the study (in immunostaining and western blot) is not demonstrated. Additionally, it stains some supporting cells or nerve terminals. Was that expression expected?

      (2) A previous report showed that HSD17B7 is expressed in mouse vestibular hair cells by single-cell RNAseq and immunostaining in mice, but it is not cited:

      Spatiotemporal dynamics of inner ear sensory and non-sensory cells revealed by single-cell transcriptomics.

      Jan TA, Eltawil Y, Ling AH, Chen L, Ellwanger DC, Heller S, Cheng AG.

      Cell Rep. 2021 Jul 13;36(2):109358. doi: 10.1016/j.celrep.2021.109358.

      (3) Overexpressed HSD17B7-EGFP C-terminal fusion in zebrafish hair cells shows a punctiform signal in the soma but apparently does not stain the hair bundles. One limitation is the consequence of the C-terminal EGFP fusion to HSD17B7 on its function, which is not discussed.

      (4) A mutant Zebrafish CRISPR was generated, leading to a truncation after the first 96 aa out of the 340 aa total. It is unclear why the gene editing was not done closer to the ATG. This allele may conserve some function, which is not discussed.

      (5) The hsd17b7 mutant allele has a slightly reduced number of genetically labeled hair cells (quantified as a 16% reduction, estimated at 1-2 HC of the 9 HC present per neuromast). On a note, it is unclear what criteria were used to select HC in the picture. Some Brn3C:mGFP positive cells are apparently not included in the quantifications (Figure 2F, Figure 5A).

      (6) The authors used FM4-64 staining to evaluate the hair cell mechanotransduction activity indirectly. They found a 40% reduction in labeling intensity in the HCs of the lateral line neuromast. Because the reduction of hair cell number (16%) is inferior to the reduction of FM4-64 staining, the authors argue that it indicates that the defect is primarily affecting the mechanotransduction function rather than the number of HCs. This argument is insufficient. Indeed, a scenario could be that some HC cells died and have been eliminated, while others are also engaged in this path and no longer perform the MET function. The numbers would then match. If single-cell staining can be resolved, one could determine the FM4-64 intensity per cell. It would also be informative to evaluate the potential occurrence of cell death in this mutant. On another note, the current quantification of the FM4-64 fluorescence intensity and its normalization are not described in the methods. More importantly, an independent and more direct experimental assay is needed to confirm this point. For example, using a GCaMP6-T2A-RFP allele for Ca2+ imaging and signal normalization.

      (7) The authors used an acoustic startle response to elicit a behavioral response from the larvae and evaluate the "auditory response". They found a significative decrease in the response (movement trajectory, swimming velocity, distance) in the hsd17b7 mutant. The authors conclude that this gene is crucial for the "auditory function in zebrafish".

      This is an overstatement:

      (a) First, this test is adequate as a screening tool to identify animals that have lost completely the behavioral response to this acoustic and vibrational stimulation, which also involves a motor response. However, additional tests are required to confirm an auditory origin of the defect, such as Auditory Evoked Potential recordings, or for the vestibular function, the Vestibulo-Ocular Reflex.

      (b) Secondly, the behavioral defects observed in the mutant compared to the control are significantly different, but the differences are slight, contained within the Standard Deviation (20% for velocity, 25% for distance). To this point, the Figure 2 B and C plots are misleading because their y-axis do not start at 0.

      (8) Overexpression of HSD17B7 in cell line HEI-OC1 apparently "significantly increases" the intensity of cholesterol-related signal using a genetically encoded fluorescent sensor (D4H-mCherry). However, the description of this quantification (per cell or per surface area) and the normalization of the fluorescent signal are not provided.

      (9) When this experiment is conducted in vivo in zebrafish, a reduction in the "DH4 relative intensity" is detected (same issue with the absence of a detailed method description). However, as the difference is smaller than the standard deviation, this raises questions about the biological relevance of this result.

      (10) The authors identified a deaf child as a carrier of a nonsense mutation in HSB17B7, which is predicted to terminate the HSB17B7 protein before the transmembrane domain. However, as no genetic linkage is possible, the causality is not demonstrated.

      (11) Previous results obtained from mouse HSD17B7-KO (citation below) are not described in sufficient detail. This is critical because, in this paper, the mouse loss-of-function of HSD17B7 is embryonically lethal, whereas no apparent phenotype was reported in heterozygotes, which are viable and fertile. Therefore, it seems unlikely that heterozygous mice exhibit hearing loss or vestibular defects; however, it would be essential to verify this to support the notion that the truncated allele found in one patient is causal.

      Hydroxysteroid (17beta) dehydrogenase 7 activity is essential for fetal de novo cholesterol synthesis and for neuroectodermal survival and cardiovascular differentiation in early mouse embryos.

      Jokela H, Rantakari P, Lamminen T, Strauss L, Ola R, Mutka AL, Gylling H, Miettinen T, Pakarinen P, Sainio K, Poutanen M.<br /> Endocrinology. 2010 Apr;151(4):1884-92. doi: 10.1210/en.2009-0928. Epub 2010 Feb 25.

      (12) The authors used this truncated protein in their startle response and FM4-64 assays. First, they show that contrary to the WT version, this truncated form cannot rescue their phenotypes when overexpressed. Secondly, they tested whether this truncated protein could recapitulate the startle reflex and FM4-64 phenotypes of the mutant allele. At the homozygous level (not mentioned by the way), it can apparently do so to a lesser degree than the previous mutant. Again, the differences are within the Standard Deviation of the averages. The authors conclude that this mutation found in humans has a "negative effect" on hearing, which is again not supported by the data.

      (13) The authors looked at the distribution of the HSB17B7 in a cell line. The WT version goes to the ER, while the truncated one forms aggregates. An interesting experiment consisted of co-expressing both constructs (Figure S6) to see whether the truncated version would mislocalize the WT version, which could be a mechanism for a dominant phenotype. However, this is not the case.

      (14) Through mass spectrometry of HSB17B7 proteins in the cell line, they identified a protein involved in ER retention, RER1. By biochemistry and in a cell line, they show that truncated HSB17B7 prevents the interaction with RER1, which would explain the subcellular localization.

      Hydroxysteroid (17beta) dehydrogenase 7 activity is essential for fetal de novo cholesterol synthesis and for neuroectodermal survival and cardiovascular differentiation in early mouse embryos.

      Jokela H, Rantakari P, Lamminen T, Strauss L, Ola R, Mutka AL, Gylling H, Miettinen T, Pakarinen P, Sainio K, Poutanen M.<br /> Endocrinology. 2010 Apr;151(4):1884-92. doi: 10.1210/en.2009-0928. Epub 2010 Feb 25.

      (15) Information and specificity validation of the HSB17B7 antibody are not presented. It seems that it is the same used on mice by IF and on zebrafish by Western. If so, the antibody could be used on zebrafish by IF to localize the endogenous protein (not overexpression as done here). Secondly, the specificity of the antibody should be verified on the mutant allele. That would bring confidence that the staining on the mouse is likely specific.

    1. Note: This response was posted by the corresponding author to Review Commons. The content has not been altered except for formatting.

      Learn more at Review Commons


      Reply to the reviewers

      Authors’ reply (____Ono et al)

      Review Commons Refereed Preprint #RC-2025-03137

      Reviewer #1 (Evidence, reproducibility and clarity (Required)):

      Ono et al addressed how condensin II and cohesin work to define chromosome territories (CT) in human cells. They used FISH to assess the status of CT. They found that condensin II depletion leads to lengthwise elongation of G1 chromosomes, while double depletion of condensin II and cohesin leads to CT overlap and morphological defects. Although the requirement of condensin II in shortening G1 chromosomes was already shown by Hoencamp et al 2021, the cooperation between condensin II and cohesin in CT regulation is a new finding. They also demonstrated that cohesin and condensin II are involved in G2 chromosome regulation on a smaller and larger scale, respectively. Though such roles in cohesin might be predictable from its roles in organizing TADs, it is a new finding that the two work on a different scale on G2 chromosomes. Overall, this is technically solid work, which reports new findings about how condensin II and cohesin cooperate in organizing G1 and G2 chromosomes.

      We greatly appreciate the reviewer’s supportive comments. The reviewer has accurately recognized our new findings concerning the collaborative roles of condensin II and cohesin in establishing and maintaining interphase chromosome territories.

      Major point:

      They propose a functional 'handover' from condensin II to cohesin, for the organization of CTs at the M-to-G1 transition. However, the 'handover', i.e. difference in timing of executing their functions, was not experimentally substantiated. Ideally, they can deplete condensin II and cohesin at different times to prove the 'handover'. However, this would require the use of two different degron tags and go beyond the revision of this manuscript. At least, based on the literature, the authors should discuss why they think condensin II and cohesin should work at different timings in the CT organization.

      We take this comment seriously, especially because Reviewer #2 also expressed the same concern. 

      First of all, we must admit that the basic information underlying the “handover” idea was insufficiently explained in the original manuscript. Let us make it clear below:

      • Condensin II bound to chromosomes and is enriched along their axes from anaphase through telophase (Ono et al., 2004; Hirota et al., 2004; Walther et al., 2018).
      • In early G1, condensin II is diffusely distributed within the nucleus and does not bind tightly to chromatin, as shown by detergent extraction experiments (Ono et al., 2013).
      • Cohesin starts binding to chromatin when the cell nucleus reassembles (i.e., during the cytokinesis stage shown in Fig. 1B), apparently replacing condensins I and II (Brunner et al., 2025).
      • Condensin II progressively rebinds to chromatin from S through G2 phase (Ono et al., 2013). The cell cycle-dependent changes in chromosome-bound condensin II and cohesin summarized above are illustrated in Fig. 1A. We now realize that Fig. 1B in the original manuscript was inconsistent with Fig. 1A, creating unnecessary confusion, and we sincerely apologize for this. The fluorescence images shown in the original Fig. 1B were captured without detergent extraction prior to fixation, giving the misleading impression that condensin II remained bound to chromatin from cytokinesis through early G1. This was not our intention. To clarify this, we have repeated the experiment in the presence of detergent extraction and replaced the original Fig. 1B with a revised panel. Figs. 1A and 1B are now more consistent with each other. Accordingly, we have modified the correspsonding sentences as follows:

      Although condensin II remains nuclear throughout interphase, its chromatin binding is weak in G1 and becomes robust from S phase through G2 (Ono et al., 2013). Cohesin, in contrast, replaces condensin II in early G1 (Fig. 1 B)(Abramo et al., 2019; Brunner et al., 2025), and establishes topologically associating domains (TADs) in the G1 nucleus (Schwarzer et al., 2017; Wutz et al., 2017)*. *

      While there is a loose consensus in the field that condensin II is replaced by cohesin during the M-to-G1 transition, it remains controversial whether there is a short window during which neither condensin II nor cohesin binds to chromatin (Abramo et al., 2019), or whether there is a stage in which the two SMC protein complexes “co-occupy” chromatin (Brunner et al., 2025). Our images shown in the revised Fig. 1B cannot clearly distinguish between these two possibilities.

      From a functional point of view, the results of our depletion experiments are more readily explained by the latter possibility. If this is the case, the “interplay” or “cooperation” rather than the “handover” may be a more appropriate term to describe the functional collaboration between condensin II and cohesin during the M-to-G1 transition. For this reason, we have avoided the use of the word “handover” in the revised manuscript. It should be emphasized, however, that given their distinct chromosome-binding kinetics, the cooperation of the two SMC complexes during the M-to-G1 transition is qualitatively different from that observed in G2. Therefore, the central conclusion of the present study remains unchanged.

      For example, a sentence in Abstract has been changed as follows:

      a functional interplay between condensin II and cohesin during the mitosis-to-G1 transition is critical for establishing chromosome territories (CTs) in the newly assembling nucleus.

      While the reviewer suggested one experiment, it is clearly beyond the scope of the current study. It should also be noted that even if such a cell line were available, the proposed application of sequential depletion to cells progressing from mitosis to G1 phase would be technically challenging and unlikely to produce results that could be interpreted with confidence.

      Other points:

      Figure 2E: It seems that the chromosome length without IAA is shorter in Rad21-aid cells than H2-aid cells or H2-aid Rad21-aid cells. How can this be interpreted? This comment is well taken. A related comment was made by Reviewer #3 (Major comment #2). Given the substantial genetic manipulations applied to establish multiple cell lines used in the present study, it is, strictly speaking, not straightforward to compare the -IAA controls between different cell lines. Such variations are most prominently observed in Fig. 2E, although they can also be observed to lesser extent in other experiments (e.g., Fig. 3E). This issue is inherently associated with all studies using genetically manipulated cell lines and therefore cannot be completely avoided. For this reason, we focus on the differences between -IAA and +IAA within each cell line, rather than comparing the -IAA conditions across different cell lines. In this sense, a sentence in the original manuscript (lines 178-180) was misleading. In the revised manuscript, we have modified the corresponding and subsequent sentence as follows:

      Although cohesin depletion had a marginal effect on the distance between the two site-specific probes (Fig.2, C and E), double depletion did not result in a significant change (Fig.2, D and E), consistent with the partial restoration of centromere dispersion (Fig. 1G).

      • *

      In addition, we have added a section entitled “Limitations of the study” at the end of the Discussion to address technical issues that are inevitably associated with the current approach.

      Figure 3: Regarding the CT morphology, could they explain further the difference between 'elongated' and 'cloud-like (expanded)'? Is it possible to quantify the frequency of these morphologies? In the original manuscript, we provided data that quantitatively distinguished between the “elongated” and “cloud-like” phenotypes. Specifically, Fig. 2E shows that the distance between two specific loci (Cen 12 and 12q15) is increased in the elongated phenotype but not in the cloud-like phenotype. In addition, the cloud-like morphology was clearly deviated from circularity, as indicated by the circularity index (Fig. 3F). However, because circularity can also decrease in rod-shaped chromosomes, these datasets alone may not be sufficiently convincing, as the reviewer pointed out. We have now included an additional parameter, the aspect ratio, defined as the ratio of an object’s major axis to its minor axis (new Fig. 3F). While this intuitive parameter was altered upon condensin II depletion and double depletion, again, we acknowledge that it is not sufficient to convincingly distinguish between the elongated and cloud-like phenotypes proposed in the original manuscript. For these reasons, in the revised manuscript, we have toned down our statements regarding the differences in CT morphology between the two conditions. Nonetheless, together with the data from Figs. 1 and 2, it is that the Rabl configuration observed upon condensin II depletion is further exacerbated in the absence of cohesin. Accordingly, we have modified the main text and the cartoon (Fig 3H) to more accurately depict the observations summarized above.

      Figure 5: How did they assign C, P and D3 for two chromosomes? The assignment seems obvious in some cases, but not in other cases (e.g. in the image of H2-AID#2 +IAA, two D3s can be connected to two Ps in the other way). They may have avoided line crossing between two C-P-D3 assignments, but can this be justified when the CT might be disorganized e.g. by condensin II depletion? This comment is well taken. As the reviewer suspected, we avoided line crossing between two sets of assignments. Whenever there was ambiguity, such images were excluded from the analysis. Because most chromosome territories derived from two homologous chromosomes are well separated even under the depleted conditions as shown in Fig. 6C, we did not encounter major difficulties in making assignments based on the criteria described above. We therefore remain confident that our conclusion is valid.

      That said, we acknowledge that our assignments of the FISH images may not be entirely objective. We have added this point to the “Limitations of the study” section at the end of the Discussion.

      Figure 6F: The mean is not indicated on the right-hand side graph, in contrast to other similar graphs. Is this an error? We apologize for having caused this confusion. First, we would like to clarify that the right panel of Fig. 6F should be interpreted together with the left panel, unlike the seemingly similar plots shown in Figs. 6G and 6H. In the left panel of Fig. 6F, the percentages of CTs that contact the nucleolus are shown in grey, whereas those that do not are shown in white. All CTs classified in the “non-contact” population (white) have a value of zero in the right panel, represented by the bars at 0 (i.e., each bar corresponds to a collection of dots having a zero value). In contrast, each CT in the “contact” population (grey) has a unique contact ratio value in the right panel. Because the right panel consists of two distinct groups, we reasoned that placing mean or median bars would not be appropriate. This was why no mean or median bars were shown in in the tight panel (The same is true for Fig. S5 A and B).

      That said, for the reviewer’s reference, we have placed median bars in the right panel (see below). In the six cases of H2#2 (-/+IAA), Rad21#2 (-/+IAA), Double#2 (-IAA), and Double#3 (-IAA), the median bars are located at zero (note that in these cases the mean bars [black] completely overlap with the “bars” derived from the data points [blue and magenta]). In the two cases of Double#2 (+IAA) and Double#3 (+IAA), they are placed at values of ~0.15. Statistically significant differences between -IAA and +IAA are observed only in Double#2 and Double#3, as indicated by the P-value shown on the top of the panel. Thus, we are confident in our conclusion that CTs undergo severe deformation in the absence of both condensin II and cohesin.

      Figure S1A: The two FACS profiles for Double-AID #3 Release-2 may be mixed up between -IAA and +IAA. The review is right. This inadvertent error has been corrected.

      The method section explains that 'circularity' shows 'how closely the shape of an object approximates a perfect circle (with a value of 1 indicating a perfect circle), calculated from the segmented regions'. It would be helpful to provide further methodological details about it. We have added further explanations regarding the circularity in Materials and Methods together with a citation (two added sentences are underlined below):

      To analyze the morphology of nuclei, CTs, and nucleoli, we measured “circularity,” a morphological index that quantifies how closely the shape of an object approximates a perfect circle (value =1). Circularity was defined as 4π x Area/Perimeter2, where both the area and perimeter of each segmented object were obtained using ImageJ. This index ranges from 0 to 1, with values closer to 1 representing more circular objects and lower values correspond to elongated or irregular shapes (Chen et al, 2017).

      Chen, B., Y. Wang, S. Berretta and O. Ghita. 2017. Poly Aryl Ether Ketones (PAEKs) and carbon-reinforced PAEK powders for laser sintering. J Mater Sci 52:6004-6019.

      Reviewer #1 (Significance (Required)):

      Ono et al addressed how condensin II and cohesin work to define chromosome territories (CT) in human cells. They used FISH to assess the status of CT. They found that condensin II depletion leads to lengthwise elongation of G1 chromosomes, while double depletion of condensin II and cohesin leads to CT overlap and morphological defects. Although the requirement of condensin II in shortening G1 chromosomes was already shown by Hoencamp et al 2021, the cooperation between condensin II and cohesin in CT regulation is a new finding. They also demonstrated that cohesin and condensin II are involved in G2 chromosome regulation on a smaller and larger scale, respectively. Though such roles in cohesin might be predictable from its roles in organizing TADs, it is a new finding that the two work on a different scale on G2 chromosomes. Overall, this is technically solid work, which reports new findings about how condensin II and cohesin cooperate in organizing G1 and G2 chromosomes.

      See our reply above.

      Reviewer #2 (Evidence, reproducibility and clarity (Required)):

      Summary:

      Ono et al use a variety of imaging and genetic (AID) depletion approaches to examine the roles of condensin II and cohesin in the reformation of interphase genome architecture in human HCT16 cells. Consistent with previous literature, they find that condensin II is required for CENP-A dispersion in late mitosis/early G1. Using in situ FISH at the centromere/q arm of chromosome 12 they then establish that condensin II removal causes lengthwise elongation of chromosomes that, interestingly, can be suppressed by cohesin removal. To better understand changes in whole-chromosome morphology, they then use whole chromosome painting to examine chromosomes 18 and 19. In the absence of condensin II, cells effectively fail to reorganise their chromosomes from rod-like structures into spherical chromosome territories (which may explain why CENP-A dispersion is suppressed). Cohesin is not required for spherical CT formation, suggesting condensin II is the major initial driver of interphase genome structure. Double depletion results in complete disorganisation of chromatin, leading the authors to conclude that a typical cell cycle requires orderly 'handover' from the mitotic to interphase genome organising machinery. The authors then move on to G2 phase, where they use a variety of different FISH probes to assess alterations in chromosome structure at different scales. They thereby establish that perturbation of cohesin or condensin II influences local and longer range chromosome structure, respectively. The effects of condensin II depletion become apparent at a genomic distance of 20 Mb, but are negligible either below or above. The authors repeat the G1 depletion experiment in G2 and now find that condensin II and cohesin are individually dispensable for CT organisation, but that dual depletion causes CT collapse. This rather implies that there is cooperation rather than handover per se. Overall this study is a broadly informative multiscale investigation of the roles of SMC complexes in organising the genome of postmitotic cells, and solidifies a potential relationship between condensin II and cohesin in coordinating interphase genome structure. The deeper investigation of the roles of condensin II in establishing chromosome territories and intermediate range chromosome structure in particular is a valuable and important contribution, especially given our incomplete understanding of what functions this complex performs during interphase.

      We sincerely appreciate the reviewer’s supportive comments. The reviewer has correctly acknowledged both the current gaps in our understanding of the role of condensin II in interphase chromosome organization and our new findings on the collaborative roles of condensin II and cohesin in establishing and maintaining interphase chromosome territories.

      Major comments:

      In general the claims and conclusions of the manuscript are well supported by multiscale FISH labelling. An important absent control is western blotting to confirm protein depletion levels. Currently only fluorescence is used as a readout for the efficiency of the AID depletion, and we know from prior literature that even small residual quantities of SMC complexes are quite effective in organising chromatin. I would consider a western blot a fairly straightforward and important technical control.

      Let me explain why we used immunofluorescence measurements to evaluate the efficiency of depletion. In our current protocol for synchronizing at the M-to-G1 transition, ~60% of control and H2-depleted cells, and ~30% of Rad21-depleted and co-depleted cells, are successfully synchronized in G1 phase. The apparently lower synchronization efficiency in the latter two groups is attributable to the well-documented mitotic delay caused by cohesin depletion. From these synchronized populations, early G1 cells were selected based on their characteristic morphologies (see the legend of Fig. 1C). In this way, we analyzed an early G1 cell population that had completed mitosis without chromosome segregation defects. We acknowledge that this represents a technically challenging aspect of M-to-G1 synchronization in HCT116 cells, whose synchronization efficiency is limited compared with that of HeLa cells. Nevertheless, this approach constitutes the most practical strategy currently available. Hence, immunofluorescence provides the only feasible means to evaluate depletion efficiency under these conditions.

      Although immunoblotting can, in principle, be applied to G2-arrested cell populations, we do not believe that information obtained from such experiments would affect the main conclusions of the current study. Please note that we carefully designed and performed all experiments with appropriate controls: H2 depletion, RAD21 depletion, and double depletion, with outcomes confirmed using independent cell lines (Double-AID#2 and Double-AID#3) whenever deemed necessary.

      We fully acknowledge the technical limitations associated with the AID-mediated depletion techniques, which are now described in the section entitled “Limitations of the study” at the end of the Discussion. Nevertheless, we emphasize that these limitations do not compromise the validity of our findings.

      I find the point on handover as a mechanism for maintaining CT architecture somewhat ambiguous, because the authors find that the dependence simply switches from condensin II to both condensin II and cohesin, between G1 and G2. To me this implies augmented cooperation rather than handover. I have two further suggestions, both of which I would strongly recommend but would consider desirable but 'optional' according to review commons guidelines.

      First of all, we would like to clarify a possible misunderstanding regarding the phrase “handover as a mechanism for maintaining CT architecture somewhat ambiguous”. In the original manuscript, we proposed handover as a mechanism for establishing G1 chromosome territories, not for maintaining CTs.

      That said, we take this comment very seriously, especially because Reviewer #1 also expressed the same concern. Please see our reply to Reviewer #1 (Major point).

      In brief, we agree with the reviewer that the word “handover” may not be appropriate to describe the functional relationship between condensin II and cohesin during the M-to-G1 transition. In the revised manuscript, we have avoided the use of the word “handover”, replacing it with “interplay”. It should be emphasized, however, that given their distinct chromosome-binding kinetics, the cooperation of the two SMC complexes during the M-to-G1 transition is qualitatively different from that observed in G2. Therefore, the central conclusion of the present study remains unchanged.

      For example, a sentence in Abstract has been changed as follows:

      a functional interplay between condensin II and cohesin during the mitosis-to-G1 transition is critical for establishing chromosome territories (CTs) in the newly assembling nucleus.

      Firstly, the depletions are performed at different stages of the cell cycle but have different outcomes. The authors suggest this is because handover is already complete, but an alternative possibility is that the phenotype is masked by other changes in chromosome structure (e.g. duplication/catenation). I would be very curious to see, for example, how the outcome of this experiment would change if the authors were to repeat the depletions in the presence of a topoisomerase II inhibitor.

      The reviewer’s suggestion here is somewhat vague, and it is unclear to us what rationale underlies the proposed experiment or what meaningful outcomes could be anticipated. Does the reviewer suggest that we perform topo II inhibitor experiments both during the M-to-G1 transition and in G2 phase, and then compare the outcomes between the two conditions?

      For the M-to-G1 transition, Hildebrand et at (2024) have already reported such experiments. They used a topo II inhibitor to provided evidence that mitotic chromatids are self-entangled and that the removal of these mitotic entanglements is required to establish a normal interphase nucleus. Our own preliminary experiments (not presented in the current manuscript) showed that ICRF treatment of cells undergoing the M-to-G1 transition did not affect post-mitotic centromere dispersion. The same treatment also had little effect on the suppression of centromere dispersion observed in condensin II-depleted cells.

      Under G2-arrested condition, because chromosome territories are largely individualized, we would expect topo II inhibition to affect only the extent of sister catenation, which is not the focus of our current study. We anticipate that inhibiting topo II in G2 would have only a marginal, if any, effect on the maintenance of chromosome territories detectable by our current FISH approaches.

      In any case, we consider the suggested experiment to be beyond the scope of the present manuscript, which focuses on the collaborative roles of condensin II and cohesin as revealed by multi-scale FISH analyses.

      Secondly, if the author's claim of handover is correct then one (not exclusive) possibility is that there is a relationship between condensin II and cohesin loading onto chromatin. There does seem to be a modest co-dependence (e.g. fig S4 and S7), could the authors comment on this?

      First of all, we wish to point out the reviewer’s confusion between the G2 experiments and the M-to-G1 experiments. Figs. S4 and S7 concern experiments using G2-arrested cells, not M-to-G1 cells in which a possible handover mechanism is discussed. Based on Fig. 1, in which the extent of depletion in M-to-G1 cells was tested, no evidence of “co-dependence” between H2 depletion and RAD21 depletion was observed.

      That said, as the reviewer correctly points out, we acknowledge the presence of marginal yet statistically significant reductions in the RAD21 signal upon H2 depletion (and vice versa) in G2-arrested cells (Figs. S4 and S7).

      Another control experiment here would be to treat fully WT cells with IAA and test whether non-AID labelled H2 or RAD21 dip in intensity. If they do not, then perhaps there's a causal relationship between condensin II and cohesin levels?

      According to the reviewer’s suggestion, we tested whether IAA treatment causes an unintentional decreases in the H2 or RAD21 signals in G2-arrested cells, and found that it is not the case (see the attached figure below).

      Thus, these data indicate that there is a modest functional interdependence between condensin II and cohesin in G2-arrested cells. For instance, condensin II depletion may modestly destabilize chromatin-bound cohesin (and vice versa). However, we note that these effects are minor and do not affect the overall conclusions of the study. In the revised manuscript, we have described these potentially interesting observations briefly as a note in the corresponding figure legends (Fig. S4).

      I recognise this is something considered in Brunner et al 2025 (JCB), but in their case they depleted SMC4 (so all condensins are lost or at least dismantled). Might bear further investigation.

      Methods:

      Data and methods are described in reasonable detail, and a decent number of replicates/statistical analyses have been. Documentation of the cell lines used could be improved. The actual cell line is not mentioned once in the manuscript. Although it is referenced, I'd recommend including the identity of the cell line (HCT116) in the main text when the cells are introduced and also in the relevant supplementary tables. Will make it easier for readers to contextualise the findings.

      We apologize for the omission of important information regarding the parental cell line used in the current study. The information has been added to Materials and Methods as well as the resource table.

      Minor comments:

      Overall the manuscript is well-written and well presented. In the introduction it is suggested that no experiment has established a causal relationship between human condensin II and chromosome territories, but this is not correct, Hoencamp et al 2021 (cell) observed loss of CTs after condensin II depletion. Although that manuscript did not investigate it in as much detail as the present study, the fundamental relationship was previously established, so I would encourage the authors to revise this statement.

      We are somewhat puzzled by this comment. In the original manuscript, we explicitly cited Hoencamp et al (2021) in support of the following sentences:

      • *

      (Lines 78-83 in the original manuscript)

      *Moreover, high-throughput chromosome conformation capture (Hi-C) analysis revealed that, under such conditions, chromosomes retain a parallel arrangement of their arms, reminiscent of the so-called Rabl configuration (Hoencamp et al., 2021). These findings indicate that the loss or impairment of condensin II during mitosis results in defects in post-mitotic chromosome organization. *

      • *

      That said, to make the sentences even more precise, we have made the following revision in the manuscript.

      • *

      (Lines 78- 82 in the revised manuscript)

      *Moreover, high-throughput chromosome conformation capture (Hi-C) analysis revealed that, under such conditions, chromosomes retain a parallel arrangement of their arms, reminiscent of the so-called Rabl configuration (Hoencamp et al., 2021). These findings,together with cytological analyses of centromere distributions, indicate that the loss or impairment of condensin II during mitosis results in defects in post-mitotic chromosome organization. *

      • *

      The following statement was intended to explain our current understanding of the maintenance of chromosome territories. Because Hoencamp et al (2021) did not address the maintenance of CTs, we have kept this sentence unchanged.

      • *

      (Lines 100-102 in the original manuscript)

      Despite these findings, there is currently no evidence that either condensin II, cohesin, or their combined action contributes to the maintenance of CT morphology in mammalian interphase cells (Cremer et al., 2020).

      • *

      • *

      Reviewer #2 (Significance (Required)):

      General assessment:

      Strengths: the multiscale investigation of genome architecture at different stages of interphase allow the authors to present convincing and well-analysed data that provide meaningful insight into local and global chromosome organisation across different scales.

      Limitations:

      As suggested in major comments.

      Advance:

      Although the role of condensin II in generating chromosome territories, and the roles of cohesin in interphase genome architecture are established, the interplay of the complexes and the stage specific roles of condensin II have not been investigated in human cells to the level presented here. This study provides meaningful new insight in particular into the role of condensin II in global genome organisation during interphase, which is much less well understood compared to its participation in mitosis.

      Audience:

      Will contribute meaningfully and be of interest to the general community of researchers investigating genome organisation and function at all stages of the cell cycle. Primary audience will be cell biologists, geneticists and structural biochemists. Importance of genome organisation in cell/organismal biology is such that within this grouping it will probably be of general interest.

      My expertise is in genome organization by SMCs and chromosome segregation.

      We appreciate the reviewer’s supportive comments. As the reviewer fully acknowledges, this study is the first systematic survey of the collaborative role of condensin II and cohesin in establishing and maintaining interphase chromosome territories. In particular, multi-scale FISH analyses have enabled us to clarify how the two SMC protein complexes contribute to the maintenance of G2 chromosome territories through their actions at different genomic scales. As the reviewer notes, we believe that the current study will appeal to a broad readership in cell and chromosome biology. The limitations of the current study mentioned by the reviewer are addressed in our reply above.

      Reviewer #3 (Evidence, reproducibility and clarity (Required)):

      Summary:

      The manuscript “Condensin II collaborates with cohesin to establish and maintain interphase chromosome territories" investigates how condensin II and cohesin contribute to chromosome organization during the M-to-G1 transition and in G2 phase using published auxin-inducible degron (AID) cell lines which render the respective protein complexes nonfunctional after auxin addition. In this study, a novel degron cell line was established that enables the simultaneous depletion of both protein complexes, thereby facilitating the investigation of synergistic effects between the two SMC proteins. The chromosome architecture is studied using fluorescence in situ hybridization (FISH) and light microscopy. The authors reproduce a number of already published data and also show that double depletion causes during the M-to-G1 transition defects on chromosome territories, producing expanded, irregular shapes that obscure condensin II-specific phenotypes. Findings in G2 cells point to a new role of condensin II for chromosome conformation at a scale of ~20Mb. Although individual depletion has minimal effects on large-scale CT morphology in G2, combined loss of both complexes produces marked structural abnormalities, including irregular crescent-shaped CTs displaced toward the nucleolus and increased nucleolus-CT contact. The authors propose that condensin II and cohesin act sequentially and complementarily to ensure proper post-mitotic CT formation and maintain chromosome architecture across genomic scales.

      We greatly appreciate the reviewer’s supportive comments. The reviewer has accurately recognized our new findings concerning the collaborative roles of condensin II and cohesin in the establishment and maintenance of interphase chromosome territories.

      Concenrs about statistics:

      • The authors provide the information on how many cells are analyzed but not the number of independent experiments. My concern is that there might variations in synchronization of the cell population and in the subsequent preparation (FISH) affecting the final result. We appreciate the reviewer’s important comment regarding the biological reproducibility of our experiments. As the reviewer correctly points out, variations in cell-cycle synchronization and FISH sample preparation can occur across experiments. To address this concern, we repeated the key experiments supporting our main conclusions (Figs. 3 and 6) two additional times, resulting in three independent biological replicas in total. All replicate experiments reproduced the major observations from the original analyses. These results further substantiated our original conclusion, despite the inevitable variability arising from cell synchronization or sample preparation in this type of experiments. In the revised manuscript, we have now explicitly indicated the number of biological replicates in the corresponding figures.

      The analyses of chromosome-arm conformation shown in Fig. 5 were already performed in three independent rounds of experiments, as noted in the original submission. In addition, similar results were already obtained in other analyses reported in the manuscript. For example, centromere dispersion was quantified using an alternative centromere detection method (related to Fig. 1), and distances between specific chromosomal sites were measured using different locus-specific probes (related to Figs. 2 and 4). In both cases, the results were consistent with those presented in the manuscript.

      • Statistically the authors analyze the effect of cells with induced degron vs. vehicle control (non-induced). However, the biologically relevant question is whether the data differ between cell lines when the degron system is induced. This is not tested here (cf. major concern 2 and 3). See our reply to major concerns 2 and 3.

      • Some Journal ask for blinded analysis of the data which might make sense here as manual steps are involved in the data analysis (e.g. line 626 / 627the convex hull of the signals was manually delineated, line 635 / 636 Chromosome segmentation in FISH images was performed using individual thresholding). However personally I have no doubts on the correctness of the work. We thank the reviewer for pointing out that some steps in our data analysis were performed manually, such as delineating the convex hull of signals and segmenting chromosomes in FISH and IF images using individual thresholds. These manual steps were necessary because signal intensities vary among cells and chromosomes, making fully automated segmentation unreliable. To ensure objectivity, we confirmed that the results were consistent across two independently established double-depletion cell lines, which produced essentially identical findings. In addition, we repeated the key experiments underpinning our main conclusions (Figs. 3 and 6) two additional times, and the results were fully consistent with the original analyses. Therefore, we are confident that our current data analysis approach does not compromise the validity of our conclusions. Finally, we appreciate the reviewer’s kind remark that there is no doubt regarding the correctness of our work.

      Major concerns:

      • Degron induction appears to delay in Rad21-AID#1 and Double-AID#1 cells the transition from M to G1, as shown in Fig. S1. After auxin treatment, more cells exhibit a G2 phenotype than in an untreated population. What are the implications of this for the interpretation of the experiments? In our protocol shown in Fig. 1C, cells were released into mitosis after G2 arrest, and IAA was added 30 min after release. It is well established that cohesin depletion causes a prometaphase delay due to spindle checkpoint activation (e.g., Vass et al, 2003, Curr Biol; Toyoda and Yanagida, 2006, MBoC; Peters et al, 2008, Genes Dev), which explains why cells with 4C DNA content accumulated, as judged by FACS (Fig. S1). The same was true for doubly depleted cells. However, a fraction of cells that escaped this delay progressed through mitosis and enter the G1 phase of the next cell cycle. We selected these early G1 cells and used them for down-stream analyses. This experimental procedure was explicitly described in the legends of Fig. 1C and Fig. S1A as follows:

      (Lines 934-937; Legend of Fig. 1C)

      From the synchronized populations, early G1cells were selected based on their characteristic morphologies (i.e., pairs of small post-mitotic cells) and subjected to downstream analyses. Based on the measured nuclear sizes (Fig. S2 G), we confirmed that early G1 cells were appropriately selected.

      (Lines 1114-1119; Legend of Fig. S1A)

      In this protocol, ~60% of control and H2-depleted cells, and ~30% of Rad21-depleted and co-depleted cells, were successfully synchronized in G1 phase. The apparently lower synchronization efficiency in the latter two groups is attributable to the well documented mitotic delay caused by cohesin depletion (Hauf et al., 2005; Haarhuis et al., 2013; Perea-Resa et al., 2020). From these synchronized populations, early G1 cells were selected based on their characteristic morphologies (see the legend of Fig. 1 C).

      • *

      Thus, using this protocol, we analyzed an early G1 cell population that had completed mitosis without chromosome segregation defects. We acknowledge that this represents a technically challenging aspect of synchronizing cell-cycle progression from M to G1 in HCT116 cells, whose synchronization efficiency is limited compared with that of HeLa cells. Nevertheless, this approach constitutes the most practical strategy currently available.

      • Line 178 "In contrast, cohesin depletion had a smaller effect on the distance between the two site-specific probes compared to condensin II depletion (Fig. 2, C and E)." The data in Fig. 2 E show both a significant effect of H2 and a significant effect of RAD21 depletion. Whether the absolute difference in effect size between the two conditions is truly relevant is difficult to determine, as the distribution of the respective control groups also appears to be different. This comment is well taken. Reviewer #1 has made a comment on the same issue. See our reply to Reviewer #1 (Other points, Figure 2E).

      In brief, in the current study, we should focus on the differences between -IAA and +IAA within each cell line, rather than comparing the -IAA conditions across different cell lines. In this sense, a sentence in the original manuscript (lines 178-180) was misleading. In the revised manuscript, we have modified the corresponding and subsequent sentence as follows:

      Although cohesin depletion had a marginal effect on the distance between the two site-specific probes (Fig.2, C and E), double depletion did not result in a significant change (Fig.2, D and E), consistent with the partial restoration of centromere dispersion (Fig. 1G).

      • In Figures 3, S3 and related text in the manuscript I cannot follow the authors' argumentation, as H2 depletion alone leads to a significant increase in the CT area (Chr. 18, Chr. 19, Chr. 15). Similar to Fig. 2, the authors argue about the different magnitude of the effect (H2 depletion vs double depletion). Here, too, appropriate statistical tests or more suitable parameters describing the effect should be used. I also cannot fully follow the argumentation regarding chromosome elongation, as double depletion in Chr. 18 and Chr. 19 also leads to a significantly reduced circularity. Therefore, the schematic drawing Fig. 3 H (double depletion) seems very suggestive to me. This comment is related to the comment above (Major comment #2). See our reply to Reviewer #1 (Other points, Figure 2E).

      It should be noted that, in Figure 3 (unlike in Figure 2), we did not compare the different magnitudes of the effect observed between H2 depletion and double depletion. Thus, the reviewer’s comment that “Similar to Fig. 2, the authors argue about the different magnitude of the effect (H2 depletion vs double depletion) ” does not accurately reflected our description.

      Moreover, while the distance between two specific loci (Fig. 2E) and CT circularity (Fig. 3G) are intuitively related, they represent distinct parameters. Thus, it is not unexpected that double depletion resulted in apparently different outcomes for the two measurements. Thus, the reviewer’s counter-argument is not strictly applicable here.

      That said, we agree with the reviewer that our descriptions here need to be clarified.

      The differences between H2 depletion and double depletion are two-fold: (1) centromere dispersion is suppressed upon H2 depletion, but not upon double depletion (Fig 1G); (2) the distance between Cen 12 and 12q15 increased upon H2 depletion, but not upon double depletion (Fig 2E).

      We have decided to remove the “homologous pair overlap” panel (formerly Fig. 3E) from the revised manuscript. Accordingly, the corresponding sentence has been deleted from the main text. Instead, we have added a new panel of “aspect ratio”, defined as the ratio of the major to the minor axis (new Fig. 3F). While this intuitive parameter was altered upon condensin II depletion and double depletion, again, we acknowledge that it is not sufficient to convincingly distinguish between the elongated and cloud-like phenotypes proposed in the original manuscript. For these reasons, in the revised manuscript, we have toned down our statements regarding the differences in CT morphology between the two conditions. Nonetheless, together with the data from Figs. 1 and 2, it is clear that the Rabl configuration observed upon condensin II depletion is further exacerbated in the absence of cohesin. Accordingly, we have modified the main text and the cartoon (Fig 3H) to more accurately depict the observations summarized above.

      • 5 and accompanying text. I agree with the authors that this is a significant and very interesting effect. However, I believe the sharp bends is in most cases an artifact caused by the maximum intensity projection. I tried to illustrate this effect in two photographs: Reviewer Fig. 1, side view, and Reviewer Fig. 2, same situation top view (https://cloud.bio.lmu.de/index.php/s/77npeEK84towzJZ). As I said, in my opinion, there is a significant and important effect; the authors should simply adjust the description. This comment is well taken. We appreciate the reviewer’s effort to help clarify our original observations. We have therefore added a new section entitled “Limitations of the study” to explicitly describe the constrains of our current approach. That said, as the reviewer also acknowledges, our observations remain valid because all experiments were performed with appropriate controls.

      Minor concerns:

      • I would like to suggest proactively discussing possible artifacts that may arise from the harsh conditions during FISH sample preparation. We fully agree with the reviewer’s concerns. For FISH sample preparation, we used relatively harsh conditions, including (1) fixation under a hypotonic condition (0.3x PBS), (2) HCl treatment, and (3) a denaturation step. We recognize that these procedures inevitably affect the preservation of the original structure; however, they are unavoidable in the standard FISH protocol. We also acknowledge that our analyses were limited to 2D structures based on projected images, rather than full 3D reconstructions. These technical limitations are now explicitly described in a new section entitled “Limitations of the study”, and the technical details are provided in Materials and Methods.

      • It would be helpful if the authors could provide the original data (microscopic image stacks) for download. We thank the reviewer for this suggestion and understand that providing the original image stacks could be of interest to readers. We agree that if the nuclei were perfectly spherical, as is the case for example in lymphocytes, 3D image stacks would contain much more information than 2D projections. However, as is typical for adherent cultured cells, including the HCT116-derived cells used in this study, the nuclei are flattened due to cell adhesion to the culture dish, with a thickness of only about one-tenth of the nuclear diameter (10–20 μm). Considering also the inevitable loss of structural preservation during FISH sample preparation, we were concerned that presenting 3D images might confuse rather than clarify. We therefore believe that representing the data as 2D projections, while explicitly acknowledging the technical limitations, provides the clearest and most interpretable presentation of our results. These limitations are now described in a new section of the manuscript.

      • The authors use a blind deconvolution algorithm to improve image quality. It might be helpful to test other methods for this purpose (optional). We thank the reviewer for this valuable suggestion and fully agree that it is a valid point. We recognize that alternative image enhancement methods can offer advantages, particularly for smaller structures or when multiple probes are analyzed simultaneously. In our study, however, the focus was on detecting whole chromosome territories (CTs) and specific chromosomal loci, which can be visualized clearly with our current FISH protocol combined with blind deconvolution. We therefore believe that the image quality we obtained is sufficient to support the conclusions of this manuscript.

      Reviewer #3 (Significance (Required)):

      Advance:

      Ono et al. addresses the important question on how the complex pattern of chromatin is reestablished after mitosis and maintained during interphase. In addition to affinity interactions (1,2), it is known that cohesin plays an important role in the formation and maintenance of chromosome organization interphase (3). However, current knowledge does not explain all known phenomena. Even with complete loss of cohesin, TAD-like structures can be recognized at the single-cell level (4), and higher structures such as chromosome territories are also retained (5). The function of condensin II during mitosis is another important factor that affects chromosome architecture in the following G1 phase (6). Although condensin II is present in the cell nucleus throughout interphase, very little is known about the role of this protein in this phase of the cell cycle. This is where the present publication comes in, with a new double degron cell line in which essential subunits of cohesin AND condensin can be degraded in a targeted manner. I find the data from the experiments in the G2 phase most interesting, as they suggest a previously unknown involvement of condensin II in the maintenance of larger chromatin structures such as chromosome territories.

      The experiments regarding the M-G1 transition are less interesting to me, as it is known that condensin II deficiency in mitosis leads to elongated chromosomes (Rabl configuration)(6), and therefore the double degradation of condensin II and cohesin describes the effects of cohesin on an artificially disturbed chromosome structure.

      For further clarification, we provide below a table summarizing previous studies relevant to the present work. We wish to emphasize three novel aspects of the present study. First, newly established cell lines designed for double depletion enabled us to address questions that had remained inaccessible in earlier studies. Second, to our knowledge, no study has previously reported condensin II depletion, cohesin depletion and double depletion in G2-arrested cells. Third, the present study represents the first systematic comparison of two different stages of the cell cycle using multiscale FISH under distinct depletion conditions. Although the M-to-G1 part of the present study partially overlaps with previous work, it serves as an important prelude to the subsequent investigations. We are confident that the reviewer will also acknowledge this point.

      cell cycle

      cond II depletion

      cohesin depletion

      double depletion

      M-to-G1

      Hoencamp et al (2021); Abramo et al (2019); Brunner et al (2025);

      this study

      Schwarzer et al (2017);

      Wutz et al (2017);

      this study

      this study

      G2

      this study

      this study

      this study

      Hoencamp et al (2021): Hi-C and imaging (CENP-A distribution)

      Abramo et al (2019): Hi-C and imaging

      Brunner et al (2025): mostly imaging (chromatin tracing)

      Schwarzer et al (2017); Wutz et al (2017): Hi-C

      this study: imaging (multi-scale FISH)

      General limitations:

      (1) Single cell imaging of chromatin structure typically shows only minor effects which are often obscured by the high (biological) variability. This holds also true for the current manuscript (cf. major concern 2 and 3).

      See our reply above.

      (2) A common concern are artefacts introduced by the harsh conditions of conventional FISH protocols (7). The authors use a method in which the cells are completely dehydrated, which probably leads to shrinking artifacts. However, differences between samples stained using the same FISH protocol are most likely due to experimental variation and not an artefact (cf. minor concern 1).

      See our reply above.

      • The anisotropic optical resolution (x-, y- vs. z-) of widefield microscopy (and most other light microscopic techniques) might lead to misinterpretation of the imaged 3D structures. This seems to be the cases in the current study (cf. major concern 4). See our reply above.

      • In the present study, the cell cycle was synchronized. This requires the use of inhibitors such as the CDK1 inhibitor RO-3306. However, CDK1 has many very different functions (8), so unexpected effects on the experiments cannot be ruled out. The current approaches involving FISH inevitably require cell cycle synchronization. We believe that the use of the CDK1 inhibitor RO-3306 to arrest the cell cycle at G2 is a reasonable choice, although we cannot rule out unexpected effects arising from the use of the drug. This issue has now been addressed in the new section entitled “Limitations of the study”.

      Audience:

      The spatial arrangement of genomic elements in the nucleus and their (temporal) dynamics are of high general relevance, as they are important for answering fundamental questions, for example, in epigenetics or tumor biology (9,10). The manuscript from Ono et al. addresses specific questions, so its intended readership is more likely to be specialists in the field.

      We are confident that, given the increasing interest in the 3D genome and its role in regulating diverse biological functions, the current manuscript will attract the broad readership of leading journals in cell biology.

      About the reviewer:

      By training I'm a biologist with strong background in fluorescence microscopy and fluorescence in situ hybridization. In recent years, I have been involved in research on the 3D organization of the cell nucleus, chromatin organization, and promoter-enhancer interactions.

      We greatly appreciate the reviewer’s constructive comments on both the technical strengths and limitations of our fluorescence imaging approaches, which have been very helpful in revising the manuscript. As mentioned above, we have decided to add a special paragraph entitled “Limitations of the study” at the end of the Discussion section to discuss these issues.

      All questions regarding the statistics of angularly distributed data are beyond my expertise. The authors do not correct their statistical analyses for "multiple testing". Whether this is necessary, I cannot judge.

      We thank the reviewer for raising this important point. In our study, the primary comparisons were made between -IAA and +IAA conditions within the same cell line. Accordingly, the figures report P-values for these pairwise comparisons.

      For the distance measurements, statistical evaluations were performed in PRISM using ANOVA (Kruskal–Wallis test), and the P-values shown in the figures are based on these analyses (Fig. 1, G and H; Fig. 2 E; Fig. 3 F and G; Fig. 4 F; Fig. 6 F [right]–H; Fig. S2 B and G; Fig. S3 D and H; Fig. S5 A [right] and B [right]; Fig. S8 B). While the manuscript focuses on pairwise comparisons between -IAA and +IAA conditions within the same cell line, we also considered potential differences across cell lines as part of the same ANOVA framework, thereby ensuring that multiple testing was properly addressed. Because cell line differences are not the focus of the present study, the corresponding results are not shown.

      For the angular distribution analyses, we compared -IAA and +IAA conditions within the same cell line using the Mardia–Watson–Wheeler test; these analyses do not involve multiple testing (circular scatter plots; Fig. 5 C–E and Fig. S6 B, C, and E–H). In addition, to determine whether angular distributions exhibited directional bias under each condition, we applied the Rayleigh test to each dataset individually (Fig. 5 F and Fig. S6 I). As these tests were performed on a single condition, they are also not subject to the problem of multiple testing. Collectively, we consider that the statistical analyses presented in our manuscript appropriately account for potential multiple testing issues, and we remain confident in the robustness of the results.

      Literature

      Falk, M., Feodorova, Y., Naumova, N., Imakaev, M., Lajoie, B.R., Leonhardt, H., Joffe, B., Dekker, J., Fudenberg, G., Solovei, I. et al. (2019) Heterochromatin drives compartmentalization of inverted and conventional nuclei. Nature, 570, 395-399. Mirny, L.A., Imakaev, M. and Abdennur, N. (2019) Two major mechanisms of chromosome organization. Curr Opin Cell Biol, 58, 142-152. Rao, S.S.P., Huang, S.C., Glenn St Hilaire, B., Engreitz, J.M., Perez, E.M., Kieffer-Kwon, K.R., Sanborn, A.L., Johnstone, S.E., Bascom, G.D., Bochkov, I.D. et al. (2017) Cohesin Loss Eliminates All Loop Domains. Cell, 171, 305-320 e324. Bintu, B., Mateo, L.J., Su, J.H., Sinnott-Armstrong, N.A., Parker, M., Kinrot, S., Yamaya, K., Boettiger, A.N. and Zhuang, X. (2018) Super-resolution chromatin tracing reveals domains and cooperative interactions in single cells. Science, 362. Cremer, M., Brandstetter, K., Maiser, A., Rao, S.S.P., Schmid, V.J., Guirao-Ortiz, M., Mitra, N., Mamberti, S., Klein, K.N., Gilbert, D.M. et al. (2020) Cohesin depleted cells rebuild functional nuclear compartments after endomitosis. Nat Commun, 11, 6146. Hoencamp, C., Dudchenko, O., Elbatsh, A.M.O., Brahmachari, S., Raaijmakers, J.A., van Schaik, T., Sedeno Cacciatore, A., Contessoto, V.G., van Heesbeen, R., van den Broek, B. et al. (2021) 3D genomics across the tree of life reveals condensin II as a determinant of architecture type. Science, 372, 984-989. Beckwith, K.S., Ødegård-Fougner, Ø., Morero, N.R., Barton, C., Schueder, F., Tang, W., Alexander, S., Peters, J.-M., Jungmann, R., Birney, E. et al. (2023) Nanoscale 3D DNA tracing in single human cells visualizes loop extrusion directly in situ. BioRxiv 8 of 9https://doi.org/10.1101/2021.04.12.439407. Massacci, G., Perfetto, L. and Sacco, F. (2023) The Cyclin-dependent kinase 1: more than a cell cycle regulator. Br J Cancer, 129, 1707-1716. Bonev, B. and Cavalli, G. (2016) Organization and function of the 3D genome. Nat Rev Genet, 17, 661-678. Dekker, J., Belmont, A.S., Guttman, M., Leshyk, V.O., Lis, J.T., Lomvardas, S., Mirny, L.A., O'Shea, C.C., Park, P.J., Ren, B. et al. (2017) The 4D nucleome project. Nature, 549, 219-226.

    2. Note: This preprint has been reviewed by subject experts for Review Commons. Content has not been altered except for formatting.

      Learn more at Review Commons


      Referee #3

      Evidence, reproducibility and clarity

      Summary:

      The manuscript „Condensin II collaborates with cohesin to establish and maintain interphase chromosome territories" investigates how condensin II and cohesin contribute to chromosome organization during the M-to-G1 transition and in G2 phase using published auxin-inducible degron (AID) cell lines which render the respective protein complexes nonfunctional after auxin addition. In this study, a novel degron cell line was established that enables the simultaneous depletion of both protein complexes, thereby facilitating the investigation of synergistic effects between the two SMC proteins. The chromosome architecture is studied using fluorescence in situ hybridization (FISH) and light microscopy. The authors reproduce a number of already published data and also show that double depletion causes during the M-to-G1 transition defects on chromosome territories, producing expanded, irregular shapes that obscure condensin II-specific phenotypes. Findings in G2 cells point to a new role of condensin II for chromosome conformation at a scale of ~20Mb. Although individual depletion has minimal effects on large-scale CT morphology in G2, combined loss of both complexes produces marked structural abnormalities, including irregular crescent-shaped CTs displaced toward the nucleolus and increased nucleolus-CT contact. The authors propose that condensin II and cohesin act sequentially and complementarily to ensure proper post-mitotic CT formation and maintain chromosome architecture across genomic scales.

      Concerns about statistics:

      (1) The authors provide the information on how many cells are analyzed but not the number of independent experiments. My concern is that there might variations in synchronization of the cell population and in the subsequent preparation (FISH) affecting the final result.

      (2) Statistically the authors analyze the effect of cells with induced degron vs. vehicle control (non-induced). However, the biologically relevant question is whether the data differ between cell lines when the degron system is induced. This is not tested here (cf. major concern 2 and 3).

      (3) Some Journal ask for blinded analysis of the data which might make sense here as manual steps are involved in the data analysis (e.g. line 626 / 627the convex hull of the signals was manually delineated, line 635 / 636 Chromosome segmentation in FISH images was performed using individual thresholding). However personally I have no doubts on the correctness of the work.

      Major concerns:

      (1) Degron induction appears to delay in Rad21-AID#1 an Double-AID#1 cells the transition from M to G1, as shown in Fig. S1. After auxin treatment, more cells exhibit a G2 phenotype than in an untreated population. What are the implications of this for the interpretation of the experiments?

      (2) Line 178 "In contrast, cohesin depletion had a smaller effect on the distance between the two site-specific probes compared to condensin II depletion (Fig. 2, C and E)." The data in Fig. 2 E show both a significant effect of H2 and a significant effect of RAD21 depletion. Whether the absolute difference in effect size between the two conditions is truly relevant is difficult to determine, as the distribution of the respective control groups also appears to be different.

      (3) In Figures 3, S3 and related text in the manuscript I cannot follow the authors' argumentation, as H2 depletion alone leads to a significant increase in the CT area (Chr. 18, Chr. 19, Chr. 15). Similar to Fig. 2, the authors argue about the different magnitude of the effect (H2 depletion vs double depletion). Here, too, appropriate statistical tests or more suitable parameters describing the effect should be used. I also cannot fully follow the argumentation regarding chromosome elongation, as double depletion in Chr. 18 and Chr. 19 also leads to a significantly reduced circularity. Therefore, the schematic drawing Fig. 3 H (double depletion) seems very suggestive to me.

      (4) Fig. 5 and accompanying text. I agree with the authors that this is a significant and very interesting effect. However, I believe the sharp bends is in most cases an artifact caused by the maximum intensity projection. I tried to illustrate this effect in two photographs: Reviewer Fig. 1, side view, and Reviewer Fig. 2, same situation top view (https://cloud.bio.lmu.de/index.php/s/77npeEK84towzJZ). As I said, in my opinion, there is a significant and important effect; the authors should simply adjust the description.

      Minor concerns:

      (1) I would like to suggest proactively discussing possible artifacts that may arise from the harsh conditions during FISH sample preparation..

      (2) It would be helpful if the authors could provide the original data (microscopic image stacks) for download

      (3) The authors use a blind deconvolution algorithm to improve image quality. It might be helpful to test other methods for this purpose (optional).

      Significance

      Advance:

      Ono et al. addresses the important question on how the complex pattern of chromatin is reestablished after mitosis and maintained during interphase. In addition to affinity interactions (1,2), it is known that cohesin plays an important role in the formation and maintenance of chromosome organization interphase (3). However, current knowledge does not explain all known phenomena. Even with complete loss of cohesin, TAD-like structures can be recognized at the single-cell level (4), and higher structures such as chromosome territories are also retained (5). The function of condensin II during mitosis is another important factor that affects chromosome architecture in the following G1 phase (6). Although condensin II is present in the cell nucleus throughout interphase, very little is known about the role of this protein in this phase of the cell cycle. This is where the present publication comes in, with a new double degron cell line in which essential subunits of cohesin AND condensin can be degraded in a targeted manner. I find the data from the experiments in the G2 phase most interesting, as they suggest a previously unknown involvement of condensin II in the maintenance of larger chromatin structures such as chromosome territories. The experiments regarding the M-G1 transition are less interesting to me, as it is known that condensin II deficiency in mitosis leads to elongated chromosomes (Rabl configuration)(6), and therefore the double degradation of condensin II and cohesin describes the effects of cohesin on an artificially disturbed chromosome structure.

      General limitations:

      (1) Single cell imaging of chromatin structure typically shows only minor effects which are often obscured by the high (biological) variability. This holds also true for the current manuscript (cf. major concern 2 and 3).

      (2) A common concern are artefacts introduced by the harsh conditions of conventional FISH protocols (7). The authors use a method in which the cells are completely dehydrated, which probably leads to shrinking artifacts. However, differences between samples stained using the same FISH protocol are most likely due to experimental variation and not an artefact (cf. minor concern 1).

      (3) The anisotropic optical resolution (x-, y- vs. z-) of widefield microscopy (and most other light microscopic techniques) might lead to misinterpretation of the imaged 3D structures. This seems to be the cases in the current study (cf. major concern 4).

      (4) In the present study, the cell cycle was synchronized. This requires the use of inhibitors such as the CDK1 inhibitor RO-3306. However, CDK1 has many very different functions (8), so unexpected effects on the experiments cannot be ruled out.

      Audience:

      The spatial arrangement of genomic elements in the nucleus and their (temporal) dynamics are of high general relevance, as they are important for answering fundamental questions, for example, in epigenetics or tumor biology (9,10). The manuscript from Ono et al. addresses specific questions, so its intended readership is more likely to be specialists in the field.

      About the reviewer: By training I'm a biologist with strong background in fluorescence microscopy and fluorescence in situ hybridization. In recent years, I have been involved in research on the 3D organization of the cell nucleus, chromatin organization, and promoter-enhancer interactions.

      All questions regarding the statistics of angularly distributed data are beyond my expertise. The authors do not correct their statistical analyses for "multiple testing". Whether this is necessary, I cannot judge.

      Literature

      1. Falk, M., Feodorova, Y., Naumova, N., Imakaev, M., Lajoie, B.R., Leonhardt, H., Joffe, B., Dekker, J., Fudenberg, G., Solovei, I. et al. (2019) Heterochromatin drives compartmentalization of inverted and conventional nuclei. Nature, 570, 395-399.
      2. Mirny, L.A., Imakaev, M. and Abdennur, N. (2019) Two major mechanisms of chromosome organization. Curr Opin Cell Biol, 58, 142-152.
      3. Rao, S.S.P., Huang, S.C., Glenn St Hilaire, B., Engreitz, J.M., Perez, E.M., Kieffer-Kwon, K.R., Sanborn, A.L., Johnstone, S.E., Bascom, G.D., Bochkov, I.D. et al. (2017) Cohesin Loss Eliminates All Loop Domains. Cell, 171, 305-320 e324.
      4. Bintu, B., Mateo, L.J., Su, J.H., Sinnott-Armstrong, N.A., Parker, M., Kinrot, S., Yamaya, K., Boettiger, A.N. and Zhuang, X. (2018) Super-resolution chromatin tracing reveals domains and cooperative interactions in single cells. Science, 362.
      5. Cremer, M., Brandstetter, K., Maiser, A., Rao, S.S.P., Schmid, V.J., Guirao-Ortiz, M., Mitra, N., Mamberti, S., Klein, K.N., Gilbert, D.M. et al. (2020) Cohesin depleted cells rebuild functional nuclear compartments after endomitosis. Nat Commun, 11, 6146.
      6. Hoencamp, C., Dudchenko, O., Elbatsh, A.M.O., Brahmachari, S., Raaijmakers, J.A., van Schaik, T., Sedeno Cacciatore, A., Contessoto, V.G., van Heesbeen, R., van den Broek, B. et al. (2021) 3D genomics across the tree of life reveals condensin II as a determinant of architecture type. Science, 372, 984-989.
      7. Beckwith, K.S., Ødegård-Fougner, Ø., Morero, N.R., Barton, C., Schueder, F., Tang, W., Alexander, S., Peters, J.-M., Jungmann, R., Birney, E. et al. (2023) Nanoscale 3D DNA tracing in single human cells visualizes loop extrusion directly in situ. BioRxiv https://doi.org/10.1101/2021.04.12.439407.
      8. Massacci, G., Perfetto, L. and Sacco, F. (2023) The Cyclin-dependent kinase 1: more than a cell cycle regulator. Br J Cancer, 129, 1707-1716.
      9. Bonev, B. and Cavalli, G. (2016) Organization and function of the 3D genome. Nat Rev Genet, 17, 661-678.
      10. Dekker, J., Belmont, A.S., Guttman, M., Leshyk, V.O., Lis, J.T., Lomvardas, S., Mirny, L.A., O'Shea, C.C., Park, P.J., Ren, B. et al. (2017) The 4D nucleome project. Nature, 549, 219-226.
    1. Annotation Types

      This is a very common concern for new Tailwind users, and the answer is twofold:

      1. No, you do not have to memorize all the classes. The developer workflow is built around powerful code editor tools that make this unnecessary.
      2. Yes, interactive editors like you described absolutely exist. They are excellent for certain workflows, especially for building pages quickly.

      Here is a detailed breakdown of the solutions available.


      Solution 1: The Standard Developer Workflow (Code Editor Extensions)

      This is how the vast majority of developers use Tailwind CSS. Instead of memorizing classes, you rely on an intelligent plugin in your code editor (like VS Code).

      The most essential tool is the Tailwind CSS IntelliSense extension for Visual Studio Code.

      This plugin solves the "memorization" problem in three specific ways:

      1. Autocomplete: You rarely type the full class name. You start typing a prefix, and the editor shows you all possible options.
        • If you type bg-, it will pop up a list of all available colors (bg-blue-500, bg-red-700, etc.), complete with a color swatch.
        • If you type p-, it will list all padding options (p-1, p-2, p-4, p-6, etc.).
      2. Hover-to-Preview: If you are unsure what a class does, you can hover your mouse over it. The plugin will show you the exact CSS it generates.
        • Hovering over p-4 will show a popup that says padding: 1rem;.
        • Hovering over rounded-lg will show border-radius: 0.5rem;.
        • This feature turns the editor into a powerful learning tool.
      3. Linting (Error Checking): The plugin will underline conflicting classes, helping you avoid mistakes. For example, if you accidentally type p-2 and p-4 on the same element, it will flag this as an issue because you are applying two different padding values.

      This workflow is not based on memory, but on a logical, discoverable system. The class names are consistent: * p is padding, m is margin. * t is top, b is bottom, l is left, r is right. * Therefore, pt-4 is padding-top of 1rem. This logic becomes second nature very quickly.


      Solution 2: Visual (WYSIWYG) Editors

      For the "PowerPoint-like" scenario you described, several tools provide a full graphical user interface (GUI) for styling with Tailwind. These are often called visual builders or page builders.

      With these tools, you would click an element, and then use a properties panel on the side to adjust its padding, color, or margin. The tool then writes the correct Tailwind HTML for you.

      Examples of these tools include:

      • Windframe: A visual editor and AI tool designed specifically for Tailwind CSS. It features a drag-and-drop interface and a properties panel to adjust styles, then exports production-ready code.
      • Pinegrow: A professional desktop web editor that has a dedicated Tailwind Visual Editor add-on. It allows you to visually edit your project and provides controls for all Tailwind properties.
      • Shuffle (and Tailwind.build): An online editor with a large library of pre-built UI components. It allows you to drag components onto a canvas, customize their styles with visual controls, and export the final HTML.
      • GrayGrids: Another online tool that functions as a "Tailwind CSS Website UI Builder" with drag-and-drop functionality.

      These tools are excellent for rapidly building landing pages or prototyping. The primary trade-off is that for complex, dynamic applications, many developers find it faster and more precise to work directly in the code using the IntelliSense plugin (Solution 1).


      Solution 3: Component Libraries (The Middle Ground)

      There is a third option that also reduces the need to "memorize" individual classes: using pre-built component libraries.

      The official Tailwind UI is the most popular example.

      This is not a visual editor, but a paid library of over 500+ professionally designed components (navbars, forms, buttons, page sections, etc.).

      • Your Workflow: Instead of building a complex form from 100 different utility classes, you find the form you need in the Tailwind UI library, copy its HTML, and paste it into your project.
      • How it Helps: This solves the problem by giving you large, complete, and perfectly-styled blocks, so you only need to make minor adjustments (like changing bg-blue-500 to bg-indigo-500) rather than building everything from scratch.

      Would you like me to elaborate on how to install and configure the Tailwind CSS IntelliSense plugin for VS Code?

    1. Reviewer #3 (Public review):

      Summary

      Following recent findings that exposure to natural sounds and anthropogenic noise before hatching affects development and fitness in an altricial songbird, this study attempts to estimate the hearing capacities of zebra finch nestlings and the perception of high frequencies in that species. It also tries to estimate whether airborne sound can make zebra finch eggs vibrate, although this is not relevant to the question.

      Strength

      That prenatal sounds can affect the development of altricial birds clearly challenges the long-held assumption that altricial avian embryos cannot hear. However, there is currently no data to support that expectation. Investigating the development of hearing in songbirds is therefore important, even though technically challenging. More broadly, there is accumulating evidence that some bird species use sounds beyond their known hearing range (especially towards high frequencies), which also calls for a reassessment of avian auditory perception.

      Weaknesses

      Rather than following validated protocols, the study presents many experimental flaws and two major methodological mistakes (see below), which invalidate all results on responses to frequency-specific tones in nestlings and those on vibration transmission to eggs, as well as largely underestimating hearing sensitivity. Accordingly, the study fails to detect a response in the majority of individuals tested with tones, including adults, and the results are overall inconsistent with previous studies in songbirds. The text throughout the preprint is also highly inaccurate, often presenting only part of the evidence or misrepresenting previous findings (both qualitatively and quantitatively; some examples are given below), which alters the conclusions.

      Conclusion and impact

      The conclusion from this study is not supported by the evidence. Even if the experiment had been performed correctly, there are well-recognised limitations and challenges of the method that likely explain the lack of response. The preprint fails to acknowledge that the method is well-known for largely underestimating hearing threshold (by 20-40dB in animals) and that it may not be suitable for a 1-gram hatchling. Unlike what is claimed throughout, including in the title, the failure to detect hearing sensitivity in this study does not invalidate all previous findings documenting the impacts of prenatal sound and noise on songbird development. The limitations of the approach and of this study are a much more parsimonious explanation. The incorrect results and interpretations, and the flawed representation of current knowledge, mean that this preprint regrettably creates more confusion than it advances the field.

      Detailed assessment

      For brevity, only some references are included below as examples, using, when possible, those cited in the preprint (DOI is provided otherwise). A full review of all the studies supporting the points below is beyond the scope of this assessment.

      (A) Hearing experiment

      The study uses the Auditory Brainstem Response (ABR), which measures minute electrical signals transmitted to the surface of the skull from the auditory nerve and nuclei in the brainstem. ABR is widely used, especially in humans, because it is non-invasive. However, ABR is also a lot less sensitive than other methods, and requires very specific experimental precautions to reliably detect a response, especially in extremely small animals and with high-frequency sounds, as here.

      (1) Results on nestling frequency sensitivity are invalid, for failing to follow correct protocols:

      The results on frequency testing in nestlings are invalid, since what might serve as a positive control did not work: in adults, no response was detected in a majority of individuals, at the core of their hearing range, with loud 95dB sounds (Figure S1), when testing frequency sensitivity with "tone burst".

      This is mostly because the study used a stimulation duration 5 times larger than the norm. It used 25ms tone bursts, when all published avian studies (in altricial or precocial birds) used stimulation of 5ms or less (when using subdermal electrodes as here; e.g., cited: Brittan-Powell et al 2004; not cited: Brittan-Powell et al 2002 (doi: 10.1121/1.1494807), Henry & Lucas 2008 (doi: 10.1016/j.anbehav.2008.08.003)). Long stimulations do not make sense and are indeed known to interfere with the detection of an ABR response, especially at high frequencies, as, for example, explicitly tested and stated in Lauridsen et al 2021 (cited).

      Adult response was then re-tested with a correct 5ms tone duration ("tone-pip"), which showed that, for the few individuals that responded to 25ms tones, thresholds were abnormally high (c.a. by 30dB; Figure 2C).<br /> Yet, no nestlings were retested with a correct protocol. There is therefore no valid data to support any conclusion on nestling frequency hearing. Under these circumstances, the fact that some nestlings showed a response to 25ms tones from day 8 would argue against them having very low sensitivity to sound.

      (2) Responses to clicks underestimate hearing onset by several days:

      Without any valid nestling responses to tones (see # 1), establishing the onset of hearing is not possible based on responses to clicks only, since responses to clicks occur at least 4 days after responses to tones during development (Saunders et al, 1973). Here, 60% of 4-day-old individuals responding to clicks means most would have responded to tones at and before 2 days post-hatch, had the experiment been done correctly.<br /> Responses to tones are indeed observed in other songbirds at 1day post-hatch (see #6).

      In budgerigars, hearing onset occurs before 5 days post hatch, since responses to both clicks and tones were detectable at the first age tested at 5dph (Brittan-Powell et al, 2004).

      (3) Experimental parameters chosen lower ABR detectability, specifically in younger birds:

      Very fast stimulus repetition rate inhibits the ABR response, especially in young:

      (a) The stimulus presentation rate (25 stim/ sec) is 6 times faster than zebra finch heat-calls, and 5 to 25 times faster than most previous studies in young birds (e.g., cited: Saunders et al 1973, 1974: 1 stim/sec or less; Katayama 1985: 3.3 clicks/sec; Brittan-Powell et al 2004: 4 stim/sec). Faster rates saturate the neurons and accordingly are known to decrease ABR amplitude and increase ABR latency, especially in younger animals with an immature nervous system. In birds, this occurs especially in the range from 5 to 30 stim/sec (e.g., cited: Saunder et al 1973, Brittan-Powell et al 2004). Values here with 25 rather than 1-4 stim/min are therefore underestimating true sensitivity.

      (b) Averaging over only 400 measures is insufficient to reliably detect weak ABR signals:

      The study uses 2 to 3 times fewer measures per stimulation type than the recommended value of 1,000 (e.g., Brittan-Powell et al 2002, 2024; Henry & Lucas 2008). This specifically affects the detection of weak signals, as in small hatchlings with tiny brains (adult zebra finches are 12-14g).

      (c) Body temperature is not specified and strongly affects the ABR:

      Controlling the body temperature of hatchlings of 1-4 grams (with a temperature probe under a 5mm-wide wing) would be very challenging. Low body temperature entirely eliminates the ABR, and even slight deviance from optimal temperature strongly increases wave latency and decreases wave amplitude (e.g., cited: Katayama 1985).

      (d) Other essential information is missing on parameters known to affect the ABR:

      This includes i) the weight of the animals, ii) whether and how the response signal was amplified and filtered, iii) how the automatised S/N>2 criteria compared to visual assessment for wave detection, and iv) what measures were taken to allow the correct placement of electrodes on hatchlings less than 5 grams.

      (4) Results in adults largely underestimate sensitivity at high frequencies, and are not the correct reference point:

      (a) Thresholds measured here at high frequencies for adults (using the correct stimulus duration, only done on adults) are 10-30dB higher than in all 3 other published ABR studies in adult zebra finches (cited: Zevin et al 2004; Amin et al 2007; not cited: Noirot et al 2011 (10.1121/1.3578452)), for both 4 and 6 kHz tone pips.

      (b) The underlying assumption used throughout the preprint that hearing must be adult-like to be functional in nestlings does not make sense. Slower and smaller neural responses are characteristic of immature systems, but it does not mean signals are not being perceived.

      (5) Failure to account for ABR underestimation leads to false conclusions:

      (a) Whether the ABR method is suitable to assess hearing in very small hatchlings is unknown. No previous avian study has used ABR before 5 days post-hatch, and all have used larger bird species than the zebra finch.

      (b) Even when performed correctly on large enough animals, the ABR systematically underestimates actual auditory sensitivity by 20-40 dB, especially at high frequencies, compared to behavioural responses (e.g., none cited: Brittan-Powell et al 2002, Henry & Lucas 2008, Noirot et al 2011). Against common practice, the preprint fails to account for this, leading to wrong interpretations. For example, in Figure 1G (comparing to heat call levels), actual hearing thresholds would be 30-40dB below those displayed. In addition, the "heat whistle" level displayed here (from the same authors) is 15dB lower than their second measure that they do not mention, and than measures obtained by others (unpublished data). When these two corrections are made - or even just the first one - the conclusion that heat-call sound levels are below the zebra finch hearing threshold does not hold.

      (c) Rather than making appropriate corrections, the preprint uses a reference in humans (L180), where ABR is measured using a much more powerful method (multi-array EEG) than in animals, and from a larger brain. The shift of "10-20dB" obtained in humans is not applicable to animals.

      (6) Results are inconsistent with previous findings in developing songbirds:

      As expected from all of the above, results and conclusions in the preprint are inconsistent with findings in other songbirds, which, using other methods, show for example, auditory sensitivity in:

      (a) zebra finch embryos, in response to song vs silence (not cited: Rivera et al 2018, doi: 10.1097/WNR.0000000000001187)

      (b) flycatcher hatchlings at 2-3d post hatch (first age tested), across a wide range of frequencies (0.3 to 5kHz), at low to moderate sound levels (45-65dB) (cited: Aleksandrov and Dmitrieva 1992, not cited: Korneeva et al 2006 (10.1134/S0022093006060056)).

      (c) songbird nestlings at 2-6d post hatch, which discriminate and behaviourally respond to relevant parental calls or even complex songs. This level of discrimination requires good hearing across frequencies (e.g., not cited: Korneeva et al 2006; Schroeder & Podos 2023 (doi: 10.1016/j.anbehav.2023.06.015)).

      (d) zebra finch nestlings at 13d post-hatch, which show adult-like processing of songs in the auditory cortex (CNM) (Schroeder & Remage‐Healey 2021, doi: 10.1002/dneu.22802).

      (e) zebra finch juveniles, which are able to perceive and learn song syllables at 5-7kHz (fundamental frequency) with very similar acoustic properties to heat calls, and also produced during inspiration (Goller & Daley 2001, doi: 10.1098/rspb.2001.1805).

      NONE of these results - which contradict results and claims in the preprint - are mentioned. Instead, the preprint focuses on very slow-developing species (parrots and owls), which take 2-4 times longer than songbirds to fledge (cited: Brittan-Powell et al 2004; Köppl & Nickel 2007; Kraemer et al 2017).

      (7) Results in figures are misreported in the text, and conclusions in the abstract and headers are not supported by the data:

      For example:

      (a) The data on Figure 1E shows that at 4 days old, 8 out of 13 nestlings (60%) responded to clicks, but the text says only 5/13 responded (L89). When 60% (4dph) and 90% (6dph) of individuals responded, the correct term would be that "most animals", rather than "some animals" responded (L89). Saying that ABR to loud sound appeared "in the majority only after one week" (L93) is also incorrect, given the data. It follows that the title of the paragraph is also erroneous.

      (b) The hearing threshold is underestimated by 40dB at 6 and 8Kz on Fig 2C, not by "10-20dB" as reported in the text (L178).

      (B) Egg vibration experiment

      (8) Using airborne sound to vibrate eggs is biologically irrelevant:

      The measurement of airborne sound levels to vibrate eggs misunderstands bone conduction hearing and is not biologically meaningful: zebra finch parents are in direct contact with the eggs when producing heat calls during incubation, not hovering in front of the nest. This misunderstanding affects all extrapolations from this study to findings in studies on prenatal communication.

      (C) Misrepresentation of current knowledge

      (9) Values from published papers are misreported, which reverses the conclusions:

      Most critical examples:

      (a) Preprint: "Zebra finch most sensitive hearing range of 1-to-4 kHz (Amin et al., 2007; Okanoya and Dooling, 1987; Yeh et al., 2023)" (L173).<br /> Actual values in the studies cited are:

      1-to-7kHz, in Amin et al 2007 (threshold [=50dB with ABR] is the same at 7kHz and 1KHz).

      1-to-6 kHz, in Okanoya and Dooling (the threshold [=30dB with behaviour] is actually lower at 6kHz than at 1KHz).

      1-to-7kHz, in Yeh et al (threshold [=35-38dB with behaviour] is the same at 7kHz and 1KHz).

      Note that zebra finch nestlings' begging calls peaking at 6kHz (Elie & Theunissen 2015, doi: 10.1007/s10071-015-0933-6), would fall 2kHz above the parents' best hearing range if it were only up to 4kHz.

      (b) The preprint incorrectly states throughout (e.g., L139, L163, L248) that heat-calls are 7-10kHz, when the actual value is 6-10kHz in the paper cited (Katsis et al, 2018).

      (c) Using the correct values from these studies, and heat-calls at 45 dB SLP (as measured by others (unpublished data), or as measured by the authors themselves, but which is not reported here (Anttonen et a,l 2025), the correct conclusion is that heat calls fall within the known zebra finch hearing range.

      (10) Published evidence towards high-frequency hearing, including in early development, is systematically omitted:

      (a) Other studies showing birds use high frequencies above the known avian hearing range are ignored. This includes oilbirds (7-23kHz; Brinklov et al 2017; by 1 of the preprint authors, doi: 10.1098/rsos.170255) and hummingbirds (10-20kHz; Duque et al 2020, doi: 10.1126/sciadv.abb9393), and in a lesser extreme, zebra finches' inspiratory song syllables at 5-7kHz (Goller & Dalley, 2001).

      (b) The discussion of anatomical development (L228-241) completely omits the well-known fact that the avian basilar papilla develops from high to low frequencies (i.e., base to apex), which - as many have pointed out - is opposite to the low-to-high development of sensitivity (e.g., cited: Cohen & Fermin 1978; Caus Capdevila et al 2021).

      (c) High frequency hearing in songbirds at hatching is several orders of magnitude better than in chickens and ducks at the same age, even though songbirds are altricial (e.g., at 4kHz, flycatcher: 47dB, chicken-duck: 90dB; at 5kHz, flycatcher: 65dB, chicken-duck: 115dB; Korneeva et al 2006, Saunders et al 1974). That is because Galliformes are low-frequency specialists, according to both anatomical and ecological evidence, with calls peaking at 0.8 to 1.2kHz rather than 2-6kHz in songbirds. It is incorrect to conclude that altricial embryos cannot perceive high frequencies because low-frequency specialist precocial birds do not (L250;261).

      The references used to support the statement on a very high threshold for precocial birds above 6kHz are also wrong (L250). Katayama 1985 did not test embryos, nor frequency tones. Neither of these two references tested ducks.

      (11) Incorrect statements do not reflect findings from the references cited

      For example:

      (a) "in altricial bird species hearing typically starts after hatching" (L12, in abstract), "with little to no functional hearing during embryonic stages (Woolley, 2017)." (L33).

      There is no evidence, in any species, to support these statements. This is only a - commonly repeated - assumption, not actually based on any data. On the contrary, the extremely limited evidence to date shows the opposite, with zebra finch embryos showing ZENK activation in the auditory cortex in response to song playback (Rivera et al, 2018, not cited).

      The book chapter cited (Woolley 2017) acknowledges this lack of evidence, and, in the context of song learning, provides as only references (prior to 2018), 2 studies showing that songbirds do not develop a normal song if the song tutor is removed before 10d post-hatch. That nestlings cannot memorise (to later reproduce) complex signals heard before d10 does not mean that they are deaf to any sound before day 10.

      Studies showing hearing in young songbird nestlings (see point 6 above) also contradict these statements.

      (b) "Zebra finch embryos supposedly are epigenetically guided to adapt to high temperatures by their parents high-frequency "heat calls" " (L36 and L135).

      This is an extremely vague and meaningless description of these results, which cannot be assessed by readers, even though these results are presented as a major justification for the present study. Rather than giving an interpretation of what "supposedly" may occur, it would be appropriate to simply synthesize the empirical evidence provided in these papers. They showed that embryonic exposure to heat-calls, as opposed to control contact calls, alters a suite of physiological and behavioural traits in nestlings, including how growth and cellular physiology respond to high temperatures. This also leads to carry-over effects on song learning and reproductive fitness in adulthood.

      (c) "The acoustic communication in precocial mallard ducks depends specifically on the low-frequency auditory sensitivity of the embryo (Gottlieb, 1975)" (L253)

      The study cited (Gottlieb, 1975) demonstrates exactly the opposite of this statement: it shows that duckling embryos, not only perceive high frequency sounds (relative to the species frequency range), but also NEED this exposure to display normal audition and behaviour post-hatch. Specifically, it shows that duckling embryos deprived of exposure to their own high-frequency calls (at 2 kHz), failed to identify maternal calls post-hatch because of their abnormal insensitivity to higher frequencies, which was later confirmed by directly testing their auditory perception of tones (Dimitrieva & Gottlieb, 1994).

      (12) Considering all of the mistakes and distortions highlighted above, it would be very premature to conclude, based on these results and statements, that altricial avian embryos are not sensitive to sound. This study provides no actual scientific ground to support this conclusion.

    1. Author response:

      The following is the authors’ response to the original reviews.

      Public Reviews:

      Reviewer #1 (Public Review):

      This paper investigates the physical mechanisms underlying cell intercalation, which then enables collective cell flows in confluent epithelia. The authors show that T1 transitions (the topological transitions responsible for cell intercalation) correspond to the unbinding of groups of hexatic topological defects. Defect unbinding, and hence cell intercalation and collective cell flows, are possible when active stresses in the tissue are extensile. This result helps to rationalize the observation that many epithelial cell layers have been found to exhibit extensile active nematic behavior.

      Strengths

      The authors obtain their results based on a combination of active hexanematic hydrodynamics and a multiphase field (MPF) model for epithelial layers, whose connection is a strength of the paper. With the hydrodynamic approach, the authors find the active flow fields produced around hexatic topological defects, which can drive defect unbinding. Using the MPF simulations, the authors show that T1 transitions tend to localize close to hexatic topological defects.

      We are grateful to Reviewer #1, for appreciating and highlighting the strengths of work.

      Weaknesses

      Citations are sometimes not comprehensive. Cases of contractile behavior found in collective cell flows, which would seemingly contradict some of the authors’ conclusions, are not discussed.

      I encourage the authors to address the comments and questions below.

      We are thankful to Reviewer #1, for their questions and comments. We have addressed them point by point below, and have amended the manuscript accordingly.

      (1) In Equation 1, what do the authors mean by the cluster’s size ℓ? How is this quantity defined? The calculations in the Methods suggest that ℓ indicates the distance between the p-atic defects and the center of the T1 cell cluster, but this is not clearly defined.

      We are thank Reviewer #1 for their question. We define the cluster size as the initial distance between the center of the quadrupole and any defect (see Methods). In a primary cell cluster, where cells themselves are the defects, the cluster’s size is the distance between the center of the central junction and the center of any cell in the cluster. Hence, this is half the diameter of an cell which, for example in a typical, confluent MDCK epithelial monolayer, would be about 10µm. We have added this clarification in the definition of the cluster size, above Eq. (1).

      (2) The multiphase field model was developed and reviewed already, before the Loewe et al. 2020 paper that the authors cite. Earlier papers include Camley et al. PNAS 2014, Palmieri et al. Sci. Rep. 2015, Mueller et al. PRL 2019, and Peyret et al. Biophys. J. 2019, as reviewed in Alert and Trepat. Annu. Rev. Condens. Matter Phys. 2020.

      We thank the referee for their suggestion to incorporate further MPF literature. We have done so in the amended manuscript.

      (3) At what time lag is the mean-squared displacement in Figure 3f calculated? How does the choice of a lag time affect these data and the resulting conclusions?

      The scatter plot in Fig. 3f was constructed by dividing the system into square subregions of size ∆ℓ = 35 l.u., each containing approximately 4 cells. For each subregion, we analyzed a time window of ∆t = 25 × 10<sup>3</sup> iterations, measuring both the normalized mean square displacement of cells (relative to the subregion area ∆ℓ<sup>2</sup>) and the average defect density. The normalized displacement is calculated as m.s.d. , where t∗ denotes the start time of the observation window. We chose the time window ∆t used to compute the mean square displacement to match the characteristic duration of T1 events and defect lifetimes in our simulations. Observation times much longer (∆t > 35 × 10<sup>3</sup>) than the typical T1 event duration would cause the two sets of data points to merge into a single group, suggesting no correlation between cell motility and defect density beyond defect life-time.

      (4) The authors argue that their results provide an explanation for the extensile behavior of cell layers. However, there are also examples of contractile behavior, such as in Duclos et al., Nat. Phys., 2017 and in P´erez-Gonz´alez et al., Nat. Phys., 2019. In both cases, collective cell flows were observed, which in principle require cell intercalations. How would these observations be rationalized with the theory proposed in this paper? Can these experiments and the theory be reconciled?

      The contractile or extensile nature of stress in epithelia depends crucially on the specific tissue type and its biological context. Different cell populations, depending on their position along the epithelial/mesenchymal spectrum, can exhibit either contractile or extensile behaviors. Our theory applies to tissues where hexatic order dominates at the cellular scale, particularly in confluent systems where neighbor exchanges occur primarily through T1 transitions. In contrast, the systems studied by Duclos et al., Nat. Phys. (2018) and Perez-Gonzalez et al. (Nat. Phys., 2019) exhibit nematic order at the cellular level, meaning their dynamics are governed by fundamentally different mechanisms. Since our framework is derived for hexatic-dominated tissues, it does not directly apply to those cases, though a hybrid hexanematic descriptions previously developed by some of the authors in Armengol-Collado et al. eLife 13:e86400 (2024) could help reconcile these observations. In general, a key distinction must be made between the contractility of individual cells and the extensile/contractile nature of the collective force network. To illustrate this, consider a cell exerting a 6- fold symmetric force distribution: each vertex force arises from an imbalance in junctional tensions with neighboring cells, which are themselves contractile due to actomyosin activity. However, the resulting vertex forces can be either contractile or extensile depending on network geometry and tension distribution. This is captured in our coarse-grained description [see Armengol-Collado et al. eLife 13:e86400 (2024)], where the active stress emerges from higher-order moments of cellular forces. Specifically, the deviatoric part of the hexatic active stress tensor , where is the cell radius, the number cell density and the intensity of cellular tension. The negative sign of the coefficient of the active stress shows that the active stress is extensile—consistently with observations in various epithelial systems (e.g., Saw et al., Nature 2017; Blanch-Mercader et al., Phys. Rev. Lett. 2018). Finally, we note that the connection between cellular-scale forces and large-scale extensility has been rationalized in other contexts, such as active nematics (Balasubramaniam et al., Nat. Mater. 2021).

      Reviewer #2 (Public Review):

      This paper studies the role of hexatic defects in the collective migration of epithelia. The authors emphasize that epithelial migration is driven by cell intercalation events and not just isolated T1 events, and analyze this through the lens of hexatic topological defects. Finally, the authors study the effect of active and passive forces on the dynamics of hexatic defects using analytical results, and numerical results in both continuum and phase-field models.

      The results are very interesting and highlight new ways of studying epithelial cell migration through the analysis of the binding and unbinding of hexatic defects.

      We are grateful to Reviewer #2, for their interest and for emphasizing the novelty of our work.

      Strengths

      (1) The authors convincingly argue that intercalation events are responsible for collective cell migration, and that these events are accompanied by the formation and unbinding of hexatic topological defects.

      (2) The authors clearly explain the dynamics of hexatic defects during T1 transitions, and demonstrate the importance of active and passive forces during cell migration.

      (3) The paper thoroughly studies the T1 transition through the viewpoint of hexatic defects. A continuum model approach to study T1 transitions in cell layers is novel and can lead to valuable new insights.

      We thank the Reviewer for their kind and supporting words, and for highlighting the clarity, persuasiveness, and thoroughness.

      Weaknesses

      (1) The authors could expand on the dynamics of existing hexatic defects during epithelial cell migration, in addition to how they are created during T1 transitions.

      We thank the referee for their comment. The detailed analysis of dislocation-pair unbinding modes and their statistical impact on the transition to collective migration is comprehensively addressed in our subsequent work Puggioni et al., arXiv:2502.09554. In the present study, we focus specifically on the fundamental mechanism enabling dislocation unbinding: active extensile stresses generate flows that drive dislocation pairs apart, while passive elastic stresses tend to pull them together (Krommydas et al., Phys. Rev. Lett. 2023; Armengol- Collado et al., arXiv:2502.13104). When active forces dominate over passive restoring forces, the dislocations unbind. This represents a crucial distinction from classical Berezinskii–Kosterlitz–Thouless or Kosterlitz–Thouless–Halperin–Nelson–Youn transitions, where thermal fluctuations drive defect unbinding. In our system, the process is fundamentally activity-driven. Nevertheless, the resulting state - characterized by unbound defects and collective migration - bears strong analogy to the melting transition in equilibrium systems. We emphasize that the dynamics of passive defects has been previously examined in Krommydas et al., Phys. Rev. Lett. 2023. A discussion of these aspects can be found in the Appendix “Numerical simulations of defect annihilation and unbinding”.

      (2) The different terms in the MPF model used to study cell layer dynamics are not fully justified. In particular, it is not clear why the model includes self-propulsion and rotational diffusion in addition to nematic and hexatic stresses, and how these quantities are related to each other.

      We thank the referee for their comment. The MPF model’s terms (e.g., self-propulsion, rotational diffusion), reflect the stochastic, deformable nature of cells as active droplets migrating with near-constant speed. We emphasize that self-propulsion is the only non-equilibrium mechanism in our model — no additional active stresses (nematic or hexatic) are imposed. We have clarified this point in the revised manuscript and expanded our discussion of the MPF model.

      (3) The authors could provide some physical intuition on what an active extensile or contractile term in the hexatic order parameter means, and how this is related to extensility and contractility in active nematics and/or for cell layers.

      We thank the referee for their comment. As we explain in the reply to comment [4] of Reviewer #1, the contractile or extensile nature of stress in epithelia depends crucially on the specific tissue type and its biological context. Different cell populations, depending on their position along the epithelial/mesenchymal spectrum, can exhibit either contractile or extensile behaviors. Our theory applies to tissues where hexatic order dominates at the cellular scale, particularly in confluent systems where neighbor exchanges occur primarily through T1 transitions. In contrast, the systems studied by Duclos et al., Nat. Phys. (2018) and Perez-Gonzalez et al. (Nat. Phys., 2019) exhibit nematic order at the cellular level, meaning their dynamics are governed by fundamentally different mechanisms. Since our framework is derived for hexatic-dominated tissues, it does not directly apply to those cases, though a hybrid hexanematic descriptions previously developed by some of the authors in Armengol-Collado et al. eLife 13:e86400 (2024) could help reconcile these observations. In general, a key distinction must be made between the contractility of individual cells and the extensile/contractile nature of the collective force network. To illustrate this, consider a cell exerting a 6-fold symmetric force distribution: each vertex force arises from an imbalance in junctional tensions with neighboring cells, which are themselves contractile due to actomyosin activity. However, the resulting vertex forces can be either contractile or extensile depending on network geometry and tension distribution. This is captured in our coarse-grained description [see Armengol-Collado et al. eLife 13:e86400 (2024)], where the active stress emerges from higher-order moments of cellular forces. Specifically, the deviatoric part of the hexatic active stress tensor , where is the cell radius, the number cell density and the intensity of cellular tension. The negative sign of the coefficient of the active stress shows that the active stress is extensile—consistently with observations in various epithelial systems (e.g., Saw et al., Nature 2017; Blanch-Mercader et al., Phys. Rev. Lett. 2018). Finally, we note that the connection between cellular-scale forces and large-scale extensility has been rationalized in other contexts, such as active nematics (Balasubramaniam et al., Nat. Mater. 2021).

      Recommendations for the Authors: Reviewer #2 (Recommendations for the Authors):

      (1) The authors point out that hexatic topological defects are produced in quadrupoles (L109). Does this also mean that these defects can be annihilated only in quadrupoles as well? In the same vein, are hexatic defects always bound in pairs, as suggested by the schematics, or is it possible to observe an isolated hexatic defect?

      We thank the referee for their question. Hexatic disclinations (the defect monopoles discussed in this work), much like electrons and positrons, can annihilate in any number of neutral charge configuration (dipole, quadrupole, octupole, etc.). Unbinding a pair of hexatic disinclination, however, costs much more energy than unbinding a quadrupole to dipoles. Hence isolated defects appear in abundance only in late, fully disordered phase, where the system has completely “melted”. For more details on how defect unbinding modes affect tissue dynamics, please see our subsequent work Puggioni et al., arXiv:2502.09554.

      (2) Could you clarify if the flows described in Figures 2(a)-(b), panel (i) are driven by a passive backflow term without activity? Could you compare the magnitudes of these flows compared to the typical active terms?

      We thank the referee for their question. In panel 2(b) there is only passive backflow. In 2(a) instead, both terms are included, and are in a regime of parameters where the active flow overcomes the active flow (and hence the active force overcomes the passive force as delineated in the discussions section). In turn, the magnitude of the passive flows, is studied in detail in our previous work Krommydas et al., (Phys. Rev. Lett. 2023).

      (3) Could you clarify how the continuum hexatic model and MPF model are related to each other? What are the similarities and differences in the dynamics of these models?

      We thank the referee for this insightful question. A key point of our work is precisely that the continuum hexatic model and the MPF (Multi-Phase Field) model are distinct in nature.

      The MPF model is an established agent-based framework used to simulate tissue dynamics at the cellular level. It captures individual cell behaviors and interactions through phase-field variables. In our work, we use the MPF model as a benchmark to extract statistical features of tissue dynamics, such as defect motion and orientational correlations. In contrast, our continuum hexatic model is a coarse-grained hydrodynamic theory that describes the dynamics of orientational order in active tissues. It is built on symmetry principles and conservation laws, and it does not rely on microscopic cell-level details. Instead, it captures the collective behavior of the system through a hexatic order parameter and its coupling to flow and activity.

      Despite their conceptual differences, the MPF model and our hydrodynamic theory exhibit similar statistical features. This agreement—also observed in the independent study by Jain et al. (Phys. Rev. Res. 2024)—provides strong support for the validity and generality of our continuum description.

      (4) When multiple references by the same author and year are cited using alphabets, the second alphabet is not in bold e.g. Giomi et al., 2022b, a in Line 75, and others.

      We are grateful to the referee carefully going through the manuscript and pointing out these typos. We have corrected them in the amended manuscript.

      Reviewer #3 (Public Review):

      In this manuscript, the authors discuss epithelial tissue fluidity from a theoretical perspective. They focus on the description of topological transitions whereby cells change neighbors (T1 transitions). They explain how such transitions can be described by following the fate of hexatic defects. They first focus on a single T1 transition and the surrounding cells using a hydrodynamic model of active hexatics. They show that successful T1 intercalations, which promote tissue fluidity, require a sufficiently large extensile hexatic activity in the neighborhood of the cells attempting a T1 transition. If such activity is contractile or not sufficiently extensile, the T1 is reversed, hexatic defects annihilate, and the epithelial network configuration is unchanged. They then describe a large epithelium, using a phase field model to describe cells. They show a correlation between T1 events and hexatic defects unbinding, and identify two populations of T1 cells: one performing T1 cycles (failed T1), and not contributing to tissue migration, and one performing T1 intercalation (successful T1) and leading to the collective cell migration.

      Strengths

      The manuscript is scientifically sound, and the variety of numerical and analytical tools they use is impressive. The approach and results are very interesting and highlight the relevance of hexatic order parameters and their defects in describing tissue dynamics.

      We thank the Reviewer for recognizing the scientific soundness of the manuscript, the breadth of numerical and analytical tools employed, as well as their interest in our work.

      Weaknesses

      (1) Goal and message of the paper. (a) In my opinion, the article is mainly theoretical and should be presented as such. For instance, their conclusions and the consequences of their analysis in terms of biology are not extremely convincing, although they would be sufficient for a theory paper oriented to physicists or biophysicists. The choice of journal and potential readership should be considered, and I am wondering whether the paper structure should be re-organized, in order to have side-by-side the methods and the results, for instance (see also below).

      We thank the referee for their criticism. In response, we have made an effort to reword certain parts of the manuscript. As with any theoretical study, the biological implications of our work can only be fully assessed through experimental validation — a prospect we look forward to. Nevertheless, we have submitted our work to the subsection of Physics of Life, which we believe is perfectly suited to our content.

      (b) Currently, the two main results sections are somewhat disconnected, because they use different numerical models, and because the second section only marginally uses the results from the first section to identify/distinguish T1.

      We thank the referee, for their comment. In the second section we are using statistics from the MPF model, to support the analytical and numerical findings of our hydrodynamic theory of cell intercalation. In the time between our submission, further qualitative evidence have been brought to light in the work of Jain et al. (Phys. Rev. Res. 2024).

      (2) Quite surprisingly, the authors use a cell-based model to describe the macroscopic tissuescale behavior, and a hydrodynamic model to describe the cell-based events. In particular, their hydrodynamic description (the active hexatic model) is supposed to be a coarse-grained description, valid to capture the mesoscopic physics, and yet, they use it to describe cellscale events (T1 transitions). For instance, what is the meaning of the velocity field they are discussing in Figure 2? This makes me question the validity of the results of their first part.

      We thank the referee for their comment. There are many excellent discrete models of epithelial tissues in the literature (e.g., Bi et al., Phys. Rev. X 2016; Pasupalak et al., Soft Matter 2020; Graner et al., Phys. Rev. Lett. 1992), each capturing essential biological features such as cell division, apoptosis and sorting. While these models have provided invaluable insights, our work takes a different approach by developing a continuum theory aimed at describing epithelial dynamics at two levels: (1) mesoscopic intercalation events and (2) macroscopic collective migration. Crucially, our goal is not to replicate a specific discrete model — which would risk constructing a “model of a model” — but rather to derive a hydrodynamic description of tissue dynamics grounded in symmetry principles and conservation laws. Along this logic, the velocity field in our theory should be interpreted as an Eulerian (continuum) velocity, representing the coarse-grained flow of the tissue rather than the Lagrangian motion of individual cells. This distinction is central to our framework, which operates at scales where cellular details are averaged out, yet retains the essential physics of hexatic order and active stresses. We validate our predictions against the Multiphase Field (MPF) model. [We thank Reviewer 1 for their suggestion to incorporate further MPF literature.] Furthermore, Jain et al. (Phys. Rev. Res. 2024) have used the MPF to predict flow patterns around T1 transitions and obtained results compatible with those of our hydrodynamic theory. From this comparison we can conclude that both the MPF and our theory are able to capture the same aspect of cell intercalation in epithelial layer. This, however, does not imply that other discrete models of epithelia can reproduce this aspect too, nor that our theory is specifically tailored to the MPF model. We have clarified these points in the revised manuscript and expanded our discussion of the MPF model.

      (3) The quality of the numerical results presented in the second part (phase field model) could be improved. (a) In terms of analysis of the defects. It seems that they have all the tools to compare their cell-resolved simulations and their predictions about how a T1 event translates into defects unbinding. However, their analysis in Figure 3e is relatively minimal: it shows a correlation between T1 cells and defects. But it says nothing about the structure and evolution of the defects, which, according to their first section, should be quite precise.

      We thank the referee for their comment. Further qualitative evidence have been brought to light in the work of Jain et al. (Phys. Rev. Res. 2024), were the exact flow pattern predicted by our hydrodynamic theory is obtained, in the MPF, around cells undergoing T1 rearrangements.

      (b) In terms of clarity of the presentation. For instance, in Figure 3f, they plot the mean-square displacement as a function of a defect density. I thought that MSD was a time-dependent quantity: they must therefore consider MSD at a given time, or averaged over time. They should be explicit about what their definition of this quantity is.

      We thank the referee for raising this point. As clarified in our response to Reviewer 1, point 3, the mean square displacement (MSD) plotted in Fig. 3f is computed over a fixed time window of ∆t = 25×103 iterations, chosen to match the typical duration of T1 events and defect lifetimes. [See also reply to Reviewer #1, point (3).] The MSD is normalized by the subregion area and averaged over time within each window. We have now made this explicit in the amended version of the manuscript.

      (c) In terms of statistics. For instance, Figure 3g is used to study the role of rotational diffusion on the average time between T1s. The error bars in this figure are huge and make their claims hardly supported. Their claim of a ”monotonic decay” of the average time between intercalations is also not fully supported given their statistics.

      We appreciate the Reviewer’s comment regarding the statistical robustness of Fig. 3g. While we acknowledge that the error bars are substantial – reflecting the inherent variability in cell intercalation dynamics – the yellow curve does exhibit a consistent downward trend in the average time between T1 transitions as rotational diffusion increases. This monotonic decrease is visible across the entire range of variation of the rotational diffusion Dr, and is statistically supported when considering the trend over independent simulations. To address this concern, we have revised the main text to adjusted the wording: instead of stating that “the former is a monotonically decreasing function of Dr,” we now write that “the former displays a decreasing trend with Dr,” which better reflects the statistical variability while preserving the observed behavior.

      Reviewer #3 (Recommendations for the Authors):

      (1) Section 1 is difficult to follow due to multiple reasons: early but delayed definitions, unclear use of T1 intercalation vs. T1 cycles, disconnected figures and unclear simulation descriptions. We recommend including simulation setup details earlier and restructuring the flow of arguments.

      We thank the referee for their comment. We have made an effort in rewording and clarifying things in our amended manuscript. We are slightly confused by what they mean by “early but delayed definitions”, if they could clarify, we would be happy to amend the position and phrasing of these definitions accordingly.

      (2) It could be useful to have an additional figure early on defining schematically hexatic defects and an illustration showing an epithelium (or a simulation), similar to what the authors have produced in some of their other publications on this topic.

      We thank the referee for their comment. Figures 3c and 3d show what a hexatic defect looks like in a simulation of the epithelium. Following the referee’s recommendation, we have added a note in the caption of figure 3, citing our work were we show the same defects in MDCK epithelial monolayers (Armengol et al., Nat. Phys. 2023).

      (3) Minor points and typos:

      Line 88: the bond between vertices shrinks, not the vertices.

      Figure 1: the 1/6 is displayed as 1 6 (fraction bar missing).

      Line 232: “and order” → “one/an order”.

      Line 237: Fig. 3g) → Fig. 3g

      Line 298: ”nu” and ”v” hard to distinguish in eLife font.

      Methods: define all notation clearly (e.g., tensor product exponent, D/Dt in Eq. 3c).

      Methods: ”cell orientation, coarse-graining and topological defects” section is difficult to follow, schematic would help.

      Line 457 onward: unclear how panels (ii-iv) of Fig. 2ab are obtained.

      Line 480 onward: not referenced in main text.

      Figure 2: “avalancHe” typo.

      Figure 2 caption: “cell intercalaTION” typo.

      Movies are neither referenced nor explained.

      Figure 5 and 6 are not referenced in the main text.

      We thank the referee for their detailed read of the paper. We have corrected all typos.

    1. En términos computacionales, mientras que BFGS requiere O(n2) memoria, L-BFGS-B reduce el costo a O(mn), con m≪n (típicamente 3≤m≤20).

      explicar el O(n^2)

    Annotators

    1. Author response:

      The following is the authors’ response to the original reviews.

      Reviewer #1 (Public review): 

      Summary: 

      In this work, van Paassen et al. have studied how CD8 T cell functionality and levels predict HIV DNA decline. The article touches on interesting facets of HIV DNA decay, but ultimately comes across as somewhat hastily done and not convincing due to the major issues. 

      (1) The use of only 2 time points to make many claims about longitudinal dynamics is not convincing. For instance, the fact that raw data do not show decay in intact, but do for defective/total, suggests that the present data is underpowered. The authors speculate that rising intact levels could be due to patients who have reservoirs with many proviruses with survival advantages, but this is not the parsimonious explanation vs the data simply being noisy without sufficient longitudinal follow-up. n=12 is fine, or even reasonably good for HIV reservoir studies, but to mitigate these issues would likely require more time points measured per person. 

      (1b) Relatedly, the timing of the first time point (6 months) could be causing a number of issues because this is in the ballpark for when the HIV DNA decay decelerates, as shown by many papers. This unfortunate study design means some of these participants may already have stabilized HIV DNA levels, so earlier measurements would help to observe early kinetics, but also later measurements would be critical to be confident about stability. 

      The main goal of the present study was to understand the relationship of the HIV-specific CD8 T-cell responses early on ART with the reservoir changes across the subsequent 2.5-year period on suppressive therapy. We have revised the manuscript in order to clarify this.  We chose these time points because the 24 week time point is past the initial steep decline of HIV DNA, which takes place in the first weeks after ART initiation. It is known that HIV DNA continues to decay for years after (Besson, Lalama et al. 2014, Gandhi, McMahon et al. 2017). 

      (2) Statistical analysis is frequently not sufficient for the claims being made, such that overinterpretation of the data is problematic in many places. 

      (2a) First, though plausible that cd8s influence reservoir decay, much more rigorous statistical analysis would be needed to assert this directionality; this is an association, which could just as well be inverted (reservoir disappearance drives CD8 T cell disappearance). 

      To correlate different reservoir measures between themselves and with CD8+ T-cell responses at 24 and 156 weeks, we now performed non-parametric (Spearman) correlation analyses, as they do not require any assumptions about the normal distribution of the independent and dependent variables. Benjamini-Hochberg corrections for multiple comparisons (false discovery rate, 0.25) were included in the analyses and did not change the results. 

      Following this comment we would like to note that the association between the T-cell response at 24 weeks and the subsequent decrease in the reservoir cannot be bi-directional (that can only be the case when both variables are measured at the same time point). Therefore, to model the predictive value of T-cell responses measured at 24 weeks for the decrease in the reservoir between 24 and 156 weeks, we fitted generalized linear models (GLM), in which we included age and ART regimen, in addition to three different measures of HIV-specific CD8+ T-cell responses, as explanatory variables, and changes in total, intact, and total defective HIV DNA between 24 and 156 weeks ART as dependent variables.

      (2b) Words like "strong" for correlations must be justified by correlation coefficients, and these heat maps indicate many comparisons were made, such that p-values must be corrected appropriately. 

      We have now used Spearman correlation analysis, provided correlation coefficients to justify the wording, and adjusted the p-values for multiple comparisons (Fig. 1, Fig 3., Table 2). Benjamini-Hochberg corrections for multiple comparisons (false discovery rate, 0.25) were included in the analyses and did not change the results.  

      (3) There is not enough introduction and references to put this work in the context of a large/mature field. The impacts of CD8s in HIV acute infection and HIV reservoirs are both deep fields with a lot of complexity. 

      Following this comment we have revised and expanded the introduction to put our work more in the context of the field (CD8s in acute HIV and HIV reservoirs). 

      Reviewer #2 (Public review): 

      Summary: 

      This study investigated the impact of early HIV specific CD8 T cell responses on the viral reservoir size after 24 weeks and 3 years of follow-up in individuals who started ART during acute infection. Viral reservoir quantification showed that total and defective HIV DNA, but not intact, declined significantly between 24 weeks and 3 years post-ART. The authors also showed that functional HIV-specific CD8⁺ T-cell responses persisted over three years and that early CD8⁺ T-cell proliferative capacity was linked to reservoir decline, supporting early immune intervention in the design of curative strategies. 

      Strengths: 

      The paper is well written, easy to read, and the findings are clearly presented. The study is novel as it demonstrates the effect of HIV specific CD8 T cell responses on different states of the HIV reservoir, that is HIV-DNA (intact and defective), the transcriptionally active and inducible reservoir. Although small, the study cohort was relevant and well-characterized as it included individuals who initiated ART during acute infection, 12 of whom were followed longitudinally for 3 years, providing unique insights into the beneficial effects of early treatment on both immune responses and the viral reservoir. The study uses advanced methodology. I enjoyed reading the paper. 

      Weaknesses: 

      All participants were male (acknowledged by the authors), potentially reducing the generalizability of the findings to broader populations. A control group receiving ART during chronic infection would have been an interesting comparison. 

      We thank the reviewer for their appreciation of our study. Although we had indeed acknowledged the fact that all participants were male, we have clarified why this is a limitation of the study (Discussion, lines 296-298). The reviewer raises the point that it would be useful to compare our data to a control group. Unfortunately, these samples are not yet available, but our study protocol allows for a control group (chronic infection) to ensure we can include a control group in the future.

      Reviewer #1 (Recommendations for the authors): 

      Minor: 

      On the introduction: 

      (1) One large topic that is mostly missing completely is the emerging evidence of selection on HIV proviruses during ART from the groups of Xu Yu and Matthias Lichterfeld, and Ya Chi Ho, among others. 

      Previously, it was only touched upon in the Discussion. Now we have also included this in the Introduction (lines 77-80).

      (2) References 4 and 5 don't quite match with the statement here about reservoir seeding; we don't completely understand this process, and certainly, the tissue seeding aspect is not known. 

      Line 61-62: references were changed and this paragraph was rewritten to clarify.

      (3) Shelton et al. showed a strong relationship with HIV DNA size and timing of ART initiation across many studies. I believe Ananwaronich also has several key papers on this topic. 

      References by Ananwaronich are included (lines 91-94).

      (4) "the viral levels decline within weeks of AHI", this is imprecise, there is a peak and a decline, and an equilibrium. 

      We agree and have rewritten the paragraph accordingly.

      (5) The impact of CD8 cells on viral evolution during primary infection is complex and likely not relevant for this paper. 

      We have left viral evolution out of the introduction in order to keep a focus on the current subject.

      (6) The term "reservoir" is somewhat polarizing, so it might be worth mentioning somewhere exactly what you think the reservoir is, I think, as written, your definition is any HIV DNA in a person on ART? 

      Indeed, we refer to the reservoir when we talk about the several aspects of the reservoir that we have quantified with our assays (total HIV DNA, unspliced RNA, intact and defective proviral DNA, and replication-competent virus). In most instances we try to specify which measurement we are referring to. We have added additional reservoir explanation to clarify our definition to the introduction (lines 55-58).

      (7) I think US might be used before it is defined. 

      We thank the reviewer for this notification, we have now also defined it in the Results section (line 131).

      (8) In Figure 1 it's also not clear how statistics were done to deal with undetectable values, which can be tricky but important. 

      We have now clarified this in the legend to Figure 2 (former Figure 1). Paired Wilcoxon tests were performed to test the significance of the differences between the time points. Pairs where both values were undetectable were always excluded from the analysis. Pairs where one value was undetectable and its detection limit was higher than the value of the detectable partner, were also excluded from the analysis. Pairs where one value was undetectable and its detection limit was lower than the value of the detectable partner, were retained in the analysis.

      In the discussion: 

      (1) "This confirms that the existence of a replication-competent viral reservoir is linked to the presence of intact HIV DNA." I think this statement is indicative of many of the overinterpretations without statistical justification. There are 4 of 12 individuals with QVOA+ detectable proviruses, which means there are 8 without. What are their intact HIV DNA levels? 

      We thank the reviewer for the question that is raised here. We have now compared the intact DNA levels (measured by IPDA) between participants with positive vs. negative QVOA output, and observed a significant difference. We rephrased the wording as follows: “We compared the intact HIV DNA levels at the 24-week timepoint between the six participants, from whom we were able to isolate replicating virus, and the fourteen participants, from whom we could not. Participants with positive QVOA had significantly higher intact HIV DNA levels than those with negative QVOA (p=0.029, Mann-Whitney test; Suppl. Fig. 3). Five of six participants with positive QVOA had intact DNA levels above 100 copies/106 PBMC, while thirteen of fourteen participants with negative QVOA had intact HIV DNA below 100 copies/106 PBMC (p=0.0022, Fisher’s exact test). These findings indicate that recovery of replication-competent virus by QVOA is more likely in individuals with higher levels of intact HIV DNA in IPDA, reaffirming a link between the two measurements.”

      (2) "To determine whether early HIV-specific CD8+ T-cell responses at 24 weeks were predictive for the change in reservoir size". This is a fundamental miss on correlation vs causation... it could be the inverse. 

      We thank the reviewer for the remark. We have calculated the change in reservoir size (the difference between the reservoir size at 24 weeks and 156 weeks ART) and analyzed if the HIVspecific CD8+ T-cell response at 24 weeks ART are predictive for this change. We do not think it can be inverse, as we have a chronological relationship (CD8+ responses at week 24 predict the subsequent change in the reservoir).

      (3) "This may suggest that active viral replication drives the CD8+ T-cell response." I think to be precise, you mean viral transcription drives CD8s, we don't know about the full replication cycle from these data. 

      We agree with the reviewer and have changed “replication” to “transcription” (line 280).

      (4) "Remarkably, we observed that the defective HIV DNA levels declined significantly between 24 weeks and 3 years on ART. This is in contrast to previous observations in chronic HIV infection (30)". I don't find this remarkable or in contrast: many studies have analyzed and/or modeled defective HIV DNA decay, most of which have shown some negative slope to defective HIV DNA, especially within the first year of ART. See White et al., Blankson et al., Golob et al., Besson et al., etc In addition, do you mean in long-term suppressed? 

      The point we would like to make is that,  compared to other studies, we found a significant, prominent decrease in defective DNA (and not intact DNA) over the course of 3 years, which is in contrast to other studies (where usually the decrease in intact is significant and the decrease in defective less prominent). We have rephrased the wording (lines 227-230) as follows:

      “We observed that the defective HIV DNA levels decreased significantly between 24 and 156 weeks of ART. This is different from studies in CHI, where no significant decrease during the first 7 years of ART (Peluso, Bacchetti et al. 2020, Gandhi, Cyktor et al. 2021), or only a significant decrease during the first 8 weeks on ART, but not in the 8 years thereafter, was observed (Nühn, Bosman et al. 2025).”

      Reviewer #2 (Recommendations for the authors): 

      (1) Page 4, paragraph 2 - will be informative to report the statistics here. 

      (2) Page 4, paragraph 4 - "General phenotyping of CD4+ (Suppl. Fig. 3A) and CD8+ (Supplementary Figure 3B) T-cells showed no difference in frequencies of naïve, memory or effector CD8+ T-cells between 24 and 156 weeks." - What did the CD4+ phenotyping show? 

      We thank the reviewer for the remark. Indeed, there were also no differences in frequencies of naïve, memory or effector CD4+ T-cells between 24 and 156 weeks. We have added this to the paragraph (now Suppl. Fig 4), lines 166-168.

      (3) Page 5, paragraph 3 - "Similarly, a broad HIV-specific CD8+ T-cell proliferative response to at least three different viral proteins was observed in the majority of individuals at both time points" - should specify n=? for the majority of individuals. 

      At time point 24 weeks, 6/11 individuals had a response to env, 10/11 to gag, 5/11 to nef, and 4/11 to pol. At 156 weeks, 8/11 to env, 10/11 to gag, 8/11 to nef and 9/11 to pol. We have added this to the text (lines 188-191).

      (4) Seven of 22 participants had non-subtype B infection. Can the authors explain the use of the IPDA designed by Bruner et. al. for subtype B HIV, and how this may have affected the quantification in these participants? 

      Intact HIV DNA was detectable in all 22 participants. We cannot completely exclude influence of primer/probe-template mismatches on the quantification results, however such mismatches could also have occurred in subtype B participants, and droplet digital PCR that IPDA is based on is generally much less sensitive to these mismatches than qPCR.

      (5) Page 7, paragraph 2 - the authors report a difference in findings from a previous study ("a decline in CD8 T cell responses over 2 years" - reference 21), but only provide an explanation for this on page 9. The authors should consider moving the explanation to this paragraph for easier understanding. 

      We agree with the reviewer that this causes confusion. Therefore, we have revised and changed the order in the Discussion.

      (6) Page 7, paragraph 2 - Following from above, the previous study (21) reported this contradicting finding "a decline in CD8 T cell responses over 2 years" in a CHI (chronic HIV) treated cohort. The current study was in an acute HIV treated cohort. The authors should explain whether this may also have resulted in the different findings, in addition to the use of different readouts in each study.

      We thank the reviewer for this attentiveness. Indeed, the study by Takata et al. investigates the reservoir and HIV-specific CD8+ T-cell responses in both the RV254/ SEARCH010 study who initiated ART during AHI and the RV304/ SEARCH013 who initiated ART during CHI. We had not realized that the findings of the decline in CD8 T cell responses were solely found in the RV304/ SEARCH013 (CHI cohort). It appears functional HIV specific immune responses were only measured in AHI at 96 weeks, so we have clarified this in the Discussion. 

      Besson, G. J., C. M. Lalama, R. J. Bosch, R. T. Gandhi, M. A. Bedison, E. Aga, S. A. Riddler, D. K. McMahon, F. Hong and J. W. Mellors (2014). "HIV-1 DNA decay dynamics in blood during more than a decade of suppressive antiretroviral therapy." Clin Infect Dis 59(9): 1312-1321.

      Gandhi, R. T., J. C. Cyktor, R. J. Bosch, H. Mar, G. M. Laird, A. Martin, A. C. Collier, S. A. Riddler, B. J. Macatangay, C. R. Rinaldo, J. J. Eron, J. D. Siliciano, D. K. McMahon and J. W. Mellors (2021). "Selective Decay of Intact HIV-1 Proviral DNA on Antiretroviral Therapy." J Infect Dis 223(2): 225-233.

      Gandhi, R. T., D. K. McMahon, R. J. Bosch, C. M. Lalama, J. C. Cyktor, B. J. Macatangay, C. R. Rinaldo, S. A. Riddler, E. Hogg, C. Godfrey, A. C. Collier, J. J. Eron and J. W. Mellors (2017). "Levels of HIV-1 persistence on antiretroviral therapy are not associated with markers of inflammation or activation." PLoS Pathog 13(4): e1006285.

      Nühn, M. M., K. Bosman, T. Huisman, W. H. A. Staring, L. Gharu, D. De Jong, T. M. De Kort, N. Buchholtz, K. Tesselaar, A. Pandit, J. Arends, S. A. Otto, E. Lucio De Esesarte, A. I. M. Hoepelman, R. J. De Boer, J. Symons, J. A. M. Borghans, A. M. J. Wensing and M. Nijhuis (2025). "Selective decline of intact HIV reservoirs during the first decade of ART followed by stabilization in memory T cell subsets." Aids 39(7): 798-811.

      Peluso, M. J., P. Bacchetti, K. D. Ritter, S. Beg, J. Lai, J. N. Martin, P. W. Hunt, T. J. Henrich, J. D. Siliciano, R. F. Siliciano, G. M. Laird and S. G. Deeks (2020). "Differential decay of intact and defective proviral DNA in HIV-1-infected individuals on suppressive antiretroviral therapy." JCI Insight 5(4).

    1. Reviewer #1 (Public review):

      This paper investigates how heparan sulfate (HS) engagement functions in the cellular entry of SARS-CoV-2. A prevailing model that has been developed over the last five years by work from many laboratories using a variety of biochemical, structural, and microscopic approaches is that HS acts a co-receptor for SARS-CoV-2; its binding to SARS-CoV-2 both concentrates virus on the surface of target cells and allosterically alters the spike protein to promote an "up/open" RBD conformation that enables engagement of the proteinaceous receptor human ACE2 on the cell surface (PMID: 32970989, 35926454, 38055954, 39401361, 40548749). These two events enable plasma membrane fusion (after a cleavage event promoted by plasma membrane TMPSS2) or endocytosis and subsequent pH-dependent fusion (which requires a cathepsin L-mediated cleavage of the spike).

      The authors in this study used a series of microscopy techniques, labeled pseudoviruses and authentic SARS-CoV-2 strains, and cells lacking or expressing HS and/or hACE2 to re-examine the specific stage(s) HS and hACE2 function in the entry process. They suggest that HS mediates SARS-CoV-2 cell-surface attachment and endocytosis, and that hACE2 functions "downstream" of this to facilitate productive infection. Their results also suggest that SARS-CoV-2 binds clusters of HS molecules projecting 60-410 nm, which act as docking sites for viral attachment. Blocking HS binding with pixantrone, a drug under clinical evaluation for cancer (due to its anti-topoisomerase II activity), inhibited SARS-CoV-2 Omicron JN.1 variant from attaching to and infecting human airway cells. The authors conclude that their work establishes a revised entry paradigm in which HS clusters mediate SARS-CoV-2 attachment and endocytosis, with ACE2 acting at some stage downstream. They speculate this idea might apply broadly to other viruses known to engage HS and has translational implications for developing antiviral agents that target HS interactions.

      The strengths of the interesting and technically well-executed study include the use of multiple high-resolution microscopy modalities, the tracking of labelled viruses, the use of both pseudoviruses and authentic SARS-CoV-2, and the use of primary airway cells. Nonetheless, there are issues that need to be addressed to buttress the proposed model compared to earlier ones. These include: (a) the distinction between macropinocytosis and receptor-mediated endocytosis and what this might mean for productive SARS-CoV-2 infection; (b) the need to account for TMPRSS2 expression and plasma membrane fusion; (c) addition of genetic studies in which hACE2 is expressed in cells lacking HS; (d) an unclear picture of exactly where downstream hACE2 functions; and (e) and a need for comparative/additional study of earlier SARS-CoV-2 variants, which preferentially fuse at the plasma membrane.

    1. Author response:

      The following is the authors’ response to the original reviews.

      Reviewer #1 (Public Review):

      Summary:

      In this manuscript, Bisht et al address the hypothesis that protein folding chaperones may be implicated in aggregopathies and in particular Tau aggregation, as a means to identify novel therapeutic routes for these largely neurodegenerative conditions.

      The authors conducted a genetic screen in the Drosophila eye, which facilitates the identification of mutations that either enhance or suppress a visible disturbance in the nearly crystalline organization of the compound eye. They screened by RNA interference all 64 known Drosophila chaperones and revealed that mutations in 20 of them exaggerate the Tau-dependent phenotype, while 15 ameliorated it. The enhancer of the degeneration group included 2 subunits of the typically heterohexameric prefoldin complex and other co-translational chaperones.

      The authors characterized in depth one of the prefoldin subunits, Pfdn5, and convincingly demonstrated that this protein functions in the regulation of microtubule organization, likely due to its regulation of proper folding of tubulin monomers. They demonstrate convincingly using both immunohistochemistry in larval motor neurons and microtubule binding assays that Pfdn5 is a bona fide microtubule-associated protein contributing to the stability of the axonal microtubule cytoskeleton, which is significantly disrupted in the mutants.

      Similar phenotypes were observed in larvae expressing Frontotemporal dementia with Parkinsonism on chromosome 17-associated mutations of the human Tau gene V377M and R406W. On the strength of the phenotypic evidence and the enhancement of the TauV377Minduced eye degeneration, they demonstrate that loss of Pfdn5 exaggerates the synaptic deficits upon expression of the Tau mutants. Conversely, the overexpression of Pfdn5 or Pfdn6 ameliorates the synaptic phenotypes in the larvae, the vacuolization phenotypes in the adult, and even memory defects upon TauV377M expression.

      Strengths

      The phenotypic analyses of the mutant and its interactions with TauV377M at the cell biological, histological, and behavioral levels are precise, extensive, and convincing and achieve the aims of characterization of a novel function of Pfdn5. 

      Regarding this memory defect upon V377M tau expression. Kosmidis et al (2010), PMID: 20071510, demonstrated that pan-neuronal expression of Tau<sup>V377M</sup> disrupts the organization of the mushroom bodies, the seat of long-term memory in odor/shock and odor/reward conditioning. If the novel memory assay the authors use depends on the adult brain structures, then the memory deficit can be explained in this manner. 

      (1) If the mushroom bodies are defective upon Tau<sup>V377M</sup>. expression, does overexpression of Pfdn5 or 6 reverse this deficit? This would argue strongly in favor of the microtubule stabilization explanation.

      We thank the reviewer for this insightful comment. Consistent with Kosmidis et al. (2010), we confirm that expression of hTau<sup>V377M</sup> disrupts the architecture of mushroom bodies.   In addition, we find, as suggested by the reviewer, that coexpression of either Pfdn5 or Pfdn6 with hTau<sup>V377M</sup> significantly restores the organization of the mushroom bodies. These new findings strongly support the hypothesis that Pfdn5 or Pfdn6 mitigate hTau<sup>V377M</sup> -induced memory deficits by preserving the structure of the mushroom body, likely through stabilizing the microtubule network. This data has now been included in the revised manuscript (Figure 7H-O).

      (2) The discovery that Pfdn5 (and 6 most likely) affects tauV377M toxicity is indeed a novel and important discovery for the Tauopathies field. It is important to determine whether this interaction affects only the FTDP-17-linked mutations or also WT Tau isoforms, which are linked to the rest of the Tauopathies. Also, insights on the mode(s) that Pfdn5/6 affect Tau toxicity, such as some of the suggestions above, are aiming at will likely be helpful towards therapeutic interventions.

      We agree that determining whether prefoldin modulates the toxicity of both mutant and wildtype Tau is critical for understanding its broader relevance to Tauopathies. We have now performed additional experiments required to address this issue. These new data show that loss of Pfdn5 also exacerbates toxicity associated with wildype Tau (hTau<sup>WT</sup>), in a manner similar to that observed with hTau<sup>V337M</sup> or hTau<sup>R406W</sup>. Specifically, overexpression of hTau<sup>WT</sup> in a Pfdn5 mutant background leads to Tau aggregate formation (Figure S7G-I), and coexpression of Pfdn5 with hTau<sup>WT</sup> reduces the associated synaptic defects (Figure S11F-L). These findings underscore a general role for Pfdn5 in modulating diverse Tauopathy-associated phenotypes and suggest that it could be a broadly relevant therapeutic target. 

      Weakness

      (3) What is unclear, however, is how Pfdn5 loss or even overexpression affects the pathological Tau phenotypes. Does Pfdn5 (or 6) interact directly with TauV377M? Colocalization within tissues is a start, but immunoprecipitations would provide additional independent evidence that this is so.

      We appreciate this important suggestion. To investigate a potential direct interaction between Pfdn5 and Tau<sup>V377M</sup>, we performed co-immunoprecipitation experiments using lysates from adult fly brain expressing hTau<sup>V337M</sup>. Under the conditions tested, we did not detect a direct physical interaction. While this does not support a direct interaction, it does not strongly refute it either. We note that Pfdn5 and Tau are colocalized within axons (Figure S13J-K). At this stage, we are unable to resolve the issue of direct vs indirect association. If indirect, then Tau and Pfdn5 act within the same subcellular compartments (axon); if direct, then either only a small fraction of the total cellular proteins is in the Tau-Pfdn5 complex and therefore difficult to detect in bulk protein westerns, or the interactions are dynamic or occur in conditions that we have not been able to mimic in vitro. 

      (4) Does Pfdn5 loss exacerbate Tau<sup>V377M</sup> phenotypes because it destabilizes microtubules, which are already at least partially destabilized by Tau expression? Rescue of the phenotypes by overexpression of Pfdn5 agrees with this notion. 

      However, Cowan et al (2010) pmid: 20617325 demonstrated that wildtype Tau accumulation in larval motor neurons indeed destabilizes microtubules in a Tau phosphorylation-dependent manner. So, is Tau<sup>V377M</sup> hyperphosphorylated in the larvae?? What happens to Tau<sup>V377M</sup> phosphorylation when Pfdn5 is missing and presumably more Tau is soluble and subject to hyperphosphorylation as predicted by the above?

      We completely agree that it is important to link Tau-induced phenotypes with the microtubule destabilization and phosphorylation state of Tau.   We performed immunostaining using futsch antibody to check the microtubule organization at the NMJ and observed a severe reduction in futsch intensity when Tau<sup>V337M</sup> was expressed in the Pfdn5 mutant (ElavGal4>Tau<sup>V337M</sup>; DPfdn5<sup>15/40</sup>), suggesting that Pfdn5 absence exacerbates the hTau<sup>V337M</sup> defects due to more microtubule destabilization (Figure S6F-J). 

      We have performed additional experiments to examine the phosphorylation state of hTau in Drosophila larval axons. Immunocytochemistry indicated that only a subset of hTau aggregates in Pfdn5 mutants (Elav-Gal4>Tau<sup>V337M</sup>; DPfdn5<sup>15/40</sup>) are recognized by phospho-hTau antibodies.   For instance, the AT8 antibody (targeting pSer202/pThr205) (Goedert et al., 1995) labelled only a subset of aggregates identified by the total hTau antibody (D5D8N) (Figure S9AE). Moreover, feeding these larvae (Elav-Gal4>Tau<sup>V337M</sup; DPfdn5<sup>15/40</sup>) with LiCl, which blocks GSK3b, still showed robust Tau aggregation (Figure S9F-J). 

      These results imply that: a) soluble phospho-hTau levels in Pfdn5 mutants are low and not reliably detected with a single phospholylation-specific antibody; b) Loss of Pfdn5 results in Tau aggregation in a hyperphosphorylation-independent manner similar to what has been reported earlier (LI et al. 2022); and c) the destabilization of microtubules in Elav-Gal4>Tau<sup>V337M</sup>; DPfdn5<sup>15/40</sup> results in Tau dissociation and aggregate formation. These data and conclusions have been incorporated into the revised manuscript.

      (5) Expression of WT human Tau (which is associated with most common Tauopathies other than FTDP-17) as Cowan et al suggest has significant effects on microtubule stability, but such Tauexpressing larvae are largely viable. Will one mutant copy of the Pfdn5 knockout enhance the phenotype of these larvae?? Will it result in lethality? Such data will serve to generalize the effects of Pfdn5 beyond the two FDTP-17 mutations utilized.

      We have now examined whether heterozygous loss of Pfdn5 (∆Pfdn5/+) enhances the effect of Tau expression. While each genotype (hTau<sup>V337M</sup>, hTau<sup>WT</sup> or ∆Pfdn5/+) alone is viable, Elav-Gal4 driven expression of hTau<sup>V337M</sup> or hTau<sup>WT</sup> in Pfdn5 heterozygous background does not cause lethality. 

      (6) Does the loss of Pfdn5 affect TauV377M (and WTTau) levels?? Could the loss of Pfdn5 simply result in increased Tau levels? And conversely, does overexpression of Pfdn5 or 6 reduce Tau levels?? This would explain the enhancement and suppression of Tau<sup>V377M</sup> (and possibly WT Tau) phenotypes. It is an easily addressed, trivial explanation at the observational level, which, if true, begs for a distinct mechanistic approach.

      To test whether Pfdn5 modulates Tau phenotypes by altering Tau protein levels, we performed western blot analysis under Pfdn5 or Pfdn6 overexpression conditions and observed no change in hTau<sup>V337M</sup> levels (Figure 6O). However, in the absence of Pfdn5, both hTau<sup>V337M</sup> and hTau<sup>WT</sup> form large, insoluble aggregates that are not detected in soluble lysates by standard western blotting but are visualized by immunocytochemistry (Figure S7G-I). Thus, the apparent reduction in Tau levels on western blots reflects a solubility shift, not an actual decrease in Tau expression. These findings argue against a simple model in which Pfdn5 regulates Tau abundance and instead support a mechanism in which Pfdn5 loss leads to change in Tau conformation, leading to its sequesteration away for already destabilized microtubules.  

      (7) Finally, the authors argue that Tau<sup>V377M</sup> forms aggregates in the larval brain based on large puncta observed especially upon loss of Pfdn5. This may be so, but protocols are available to validate this molecularly the presence of insoluble Tau aggregates (for example, pmid: 36868851) or soluble Tau oligomers, as these apparently differentially affect Tau toxicity. Does Pfdn5 loss exaggerate the toxic oligomers, and overexpression promote the more benign large aggregates??

      We have performed additional experiments to analyze the nature of these aggregates using 1,6-HD. The 1,6-hexanediol can dissolve the Tau aggregate seeds formed by Tau droplets, but cannot dissolve the stable Tau aggregates (WEGMANN et al. 2018). We observed that 5% 1,6hexanediol failed to dissolve these Tau aggregates (Figure S8), demonstrating the formation of stable filamentous flame-shaped NFT-like aggregates in the absence of Pfdn5 (Figure 5D and Figure S9).

      Reviewer #2 (Public review):

      Bisht et al detail a novel interaction between the chaperone, Prefoldin 5, microtubules, and taumediated neurodegeneration, with potential relevance for Alzheimer's disease and other tauopathies. Using Drosophila, the study shows that Pfdn5 is a microtubule-associated protein, which regulates tubulin monomer levels and can stabilize microtubule filaments in the axons of peripheral nerves. The work further suggests that Pfdn5/6 may antagonize Tau aggregation and neurotoxicity. While the overall findings may be of interest to those investigating the axonal and synaptic cytoskeleton, the detailed mechanisms for the observed phenotypes remain unresolved and the translational relevance for tauopathy pathogenesis is yet to be established. Further, a number of key controls and important experiments are missing that are needed to fully interpret the findings.

      The strength of this study is the data showing that Pfdn5 localizes to axonal microtubules and the loss-of-function phenotypic analysis revealing disrupted synaptic bouton morphology. The major weakness relates to the experiments and claims of interactions with Tau-mediated neurodegeneration. 

      In particular, it is unclear whether knockdown of Pfdn5 may cause eye phenotypes independent of Tau. 

      Our new experiments confirm that knockdown of Pfdn5 alone does not cause eye phenotypes.

      Further, the GMR>tau phenotype appears to have been incorrectly utilized to examine agedependent, neurodegeneration.

      In response, we have modulated and explained our conclusions in this regard as described later in our “rebuttal.”

      This manuscript argues that its findings may be relevant to thinking about mechanisms and therapies applicable to tauopathies; however, this is premature given that many questions remain about the interactions from Drosophila, the detailed mechanisms remain unresolved, and absent evidence that Tau and Pfdn may similarly interact in the mammalian neuronal context. Therefore, this work would be strongly enhanced by experiments in human or murine neuronal culture or supportive evidence from analyses of human data.

      The reviewer is correct that the impact would be greater if Pfdn5-Tau interactions were also examined in human tissue.   While we have not attempted these experiments ourselves, we hope that our observations will stimulate others to test the conservation of phenomena we describe. There are, however, several lines of circumstantial evidence from human Alzheimer’s disease datasets that implicate PFDN5 in disease pathology. For example, recent compilations and analyses of proteomic data show reductions of CCT components, TBCE, as well as Prefoldin subunits, including PFDN5, in AD tissue (HSIEH et al. 2019; TAO et al. 2020; JI et al. 2022; ASKENAZI et al. 2023; LEITNER et al. 2024; SUN et al. 2024). Furthermore, whole blood mRNA expression data from Alzheimer's patients revealed downregulation of PFDN5 transcript (JI et al. 2022). Together, these findings from human data are consistent with the roles of PFDN5 in suppressing diverse neurodegenerative processes. We have incorporated these points into the discussion section of the revised manuscript.

      Reviewer #1 (Recommendations for the authors):

      See public review for experimental recommendations focusing on the Tau Pfdn interactions.  I would refrain from using the word aggregates, I would call them puncta, unless there is molecular or visual (ie AFM) evidence that they are indeed insoluble aggregates.  Finally, although including the full genotypes written out below the axis in the bar graphs is appreciated, it nevertheless makes them difficult to read due to crowding in most cases and somewhat distracting from the figure. 

      In my opinion, a more reader-friendly manner of reporting the phenotypes will be highly helpful. For example, listing each component of the genotype on the left of each bar graph and adding a cross or a filled circle under the bar to inform of the full genotype of the animals used.

      As described in the response to the previous comment, we now have strong direct evidences to support our view that the observed puncta are stable Tau aggregates. Thus, we feel justified to use the term Tau-aggregates in preference to Tau puncta. 

      We have tried to write the genotypes to make them more reader-friendly.

      Reviewer #2 (Recommendations for the authors):

      (1) Lines 119-121: 35 modifiers from 64 seem like an unusually high hit rate. Are these individual genes or lines? Were all modifiers supported by at least 2 independent RNAi strains targeting non-overlapping sequences? A supplemental table should be included detailing all genes and specific strains tested, with corresponding results.

      We agree with the reviewer that 35 modifiers from 64 genes may be too high. However, since the genes knocked down in the study are chaperones, crucial for maintaining proteostasis, we may have got unusually high hits. The information related to individual genes and lines is provided in Supplemental Table 1. We have now included an additional Supplemental Table 3, which lists the genes and the RNAi lines used in Figure 1, detailing the sequence target information. The table also specifies the number of independent RNAi strains used and the corresponding results. 

      (2) Figure 1: The authors quantify the areas of ommatidial fusion and necrosis as degeneration, but it is difficult to appreciate the aberrations in the photos provided. Was any consideration given to also quantifying eye size?

      We have processed the images to enhance their contrast and make the aberrations clearer. The percentage of degenerated eye area (Figure 1M) was normalized with total eye area. The method for quantifying degenerated area has been explained in the materials and methods section.

      (3) Figure 1: a) Only enhancers of rough eyes are shown but no controls are included to evaluate whether knockdown of these genes causes eye toxicity in the absence of Tau. These are important missing controls. All putative Tau enhancers, including Pdn5/6, need to be tested with GMR-GAL4 independently of Tau to determine whether they cause a rough eye. In a previous publication from some of the same investigators (Raut et al 2017), knockdown of Pfdn using eyGAL4 was shown to induce severe eye morphology defects - this raises questions about the results shown here. 

      We agree that assessing the effects of HSP knockdown independent of Tau is essential to confirm modifier specificity. We have now performed these knockdowns, and the data are reported in Supplemental Table 1. For RNAi lines represented in Figure 1, which enhanced Tau-induced degeneration/eye developmental defect, except for one of the RNAi lines against Pfdn6 (GD34204), no detectable eye defects were observed when knocked down with GMR-Gal4 at 25°C, suggesting that enhancement is specific to the Tau background. 

      Use of a more eye-specific GMR-Gal4 driver at 25°C versus broader expressing ey-Gal4 at 29°C in prior work (Raut et al. 2017) likely reflects the differences in the eye morphological defects.

      (b) Besides RNAi, do the classical Pdn5 deletion alleles included in this work also enhance the tau rough eye when heterozygous? Please also consider moving the Pfdn5/6 overexpression studies to evaluate possible suppression of the Tau rough eye to Figure 1, as it would enhance the interpretation of these data (but see also below).

      GMR-Gal4 driven expression of hTau<sup>V337M</sup> or hTau<sup>WT</sup> in Pfdn5 heterozygous background does not enhance rough eye phenotype. 

      (4) For genes of special interest, such as Pdn5, and other genes mentioned in the results, the main figure, or discussion, it is also important to perform quantitative PCR to confirm that the RNAi lines used actually knock down mRNA expression and by how much. These studies will establish specificity.

      We agree that confirming RNAi efficiency via quantitative PCR (qPCR) is essential for validating the knockdown efficiency. We have now included qPCR data, especially for key modifiers, confirming effective knockdown (Figure S2).

      (5) Lines 235-238: how do you conclude whether the tau phenotype is "enhanced" when Pfdn5 causes a similar phenotype on its own? Could the combination simply be additive? Did overexpression of Pdn5 suppress the UAS-hTau NMJ bouton phenotype (see below)? 

      Although Pfdn5 mutants and hTau expression individually increase satellite boutons, their combination leads to a significantly more severe and additional phenotype, such as significantly decreased bouton size and increased bouton number, indicating an enhancing rather than purely additive interaction (Figure 4 and Figure S6C). Moreover, we now show that overexpression of Pfdn5 significantly suppressed the hTau<sup>V337M</sup>-induced NMJ phenotypes. This new data has been incorporated as Figure S11F-L in the revised manuscript. 

      Alternatively, did the authors consider reducing fly tau in the Pdn5 mutant background?

      In new additional experiments, we observe that double mutants for Drosophila Tau (dTau) and Pfdn5 also exhibit severe NMJ defects, suggesting genetic interactions between dTau and Pfdn5. This data is shown below for the reviewer.

      Author response image 1.

      A double mutant combination of dTau and Pfdn5 aggravates the synaptic defects at the Drosophila NMJ. (A-D') Confocal images of NMJ synapses at muscle 4 of A2 hemisegment showing synaptic morphology in (A-A') control, (B-B') ΔPfdn5<SUP>15/40</SUP>, (C-C') dTauKO/dTauKO (Drosophila Tau mutant), (D-D') dTauKO/dTauKO; ∆Pfdn5<SUP>15/40</SUP> double immunolabeled for HRP (green), and CSP (magenta). The scale bar in D for (A-D') represents 10 µm. 

      (6) It may be important to further extend the investigation to the actin cytoskeleton. It is noted that Pfdn5 also stabilizes actin. Importantly, tau-mediated neurodegeneration in Drosophila also disrupts the actin cytoskeleton, and many other regulators of actin modify tau phenotypes.

      We appreciate the suggestion to examine the actin cytoskeleton. While prior studies indicate that Pfdn5 might regulate the actin cytoskeleton and that Tau<sup>V377M</sup> hyperstabilizes the actin cytoskeleton, we did not observe altered actin levels in Pfdn5 mutants (Figure 2G). However, actin dynamics may represent an additional mechanism through which Pfdn5 might temporally influence Tauopathy. Future work will address potential actin-related mechanisms in Tauopathy.

      (7) Figure 2: in the provided images, it is difficult to appreciate the futsch loops. Please include an image with increased magnification. It appears that fly strains harboring a genomic rescue BAC construct are available for Pfdn-this would be a complementary reagent to test besides Pfdn overexpression.

      We have updated Figure 2 to include high magnification NMJ images as insets, clearly showing the Futsch loops. While we have not yet tested a genomic rescue BAC construct for Pfdn5, we plan to use the fly line harboring this construct in future work.

      (8) Figure 3: Some of the data is not adequately explained. The use of Ran as a loading control seems rather unusual. What is the justification? Pfdn appears to only partially co-localize with a-tubulin in the axon; can the authors discuss or explain this? Further, in Pfdn5 mutants, there appears to be a loss of a-tubulin staining (3b'); this should also be discussed.

      We appreciate the reviewer's concern regarding the choice of loading control for our Western blot analysis. Importantly, since Tubulin levels and related pathways were the focus of our analysis, traditional loading controls such as α- or β-tubulin or actin were deemed unsuitable due to potential co-regulation. Ran, a nuclear GTPase involved in nucleocytoplasmic transport, is not known to be transcriptionally or post-translationally regulated by Tubulin-associated signaling pathways. To ensure its reliability as a loading control, we confirmed by densitometric analysis that Ran expression showed minimal variability across all samples. Hence, we used Ran for accurate normalization in the Western blot data represented in this manuscript. We have also used GAPDH as a loading control and found no difference with respect to Ran as a loading control across samples.

      We appreciate the reviewer's comment regarding the interpretation of our Pearson's correlation coefficient (PCC) results. While the mean colocalization value of 0.6 represents a moderate positive correlation (MUKAKA 2012), which may not reach the conventional threshold for "high positive" colocalization (usually considered 0.7-0.9), it nonetheless indicates substantial spatial overlap between the proteins of interest. Importantly, colocalization analysis provides supportive but indirect evidence for molecular proximity.  To further validate the interaction, we performed a microtubule binding assay, which directly demonstrates the binding of Pfdn5 to stabilized microtubules.

      In accordance with the western blot analysis shown in Figure 2G-I, the levels of Tubulin are reduced in the Pfdn5 mutants (Figure 3B''). We have incorporated and discussed this in the revised manuscript.

      (9) Figure 4: Overexpression of Pfdn appears to rescue the supernumerary satellite bouton numbers induced by human Tau; however, interpretation of this experiment is somewhat complicated as it is performed in Pfdn mutant genetic background. Can overexpression of Pfdn on its own rescue the Tau bouton defect in an otherwise wildtype background?

      We have now coexpressed Pfdn5 and hTau<SUP>V337M</SUP> in an otherwise wild-type background. As shown in Figure S11F-L, Pfdn5 overexpression suppresses Tau-induced bouton defects. We have incorporated the data in the Results section to support the role of Pfdn5 as a modifier of Tau toxicity.

      (10) Lines 256-263 / Figure 5: (a) What exactly are these tau-positive structures (punctae) being stained in larval brains in Fig 5C-E? Most prior work on tau aggregation using Drosophila models has been done in the adult brain, and human wildtype or mutant Tau is not known to form significant numbers of aggregates in neurons (although aggregates have been described following glia tau expression). 

      Therefore, the results need to be further clarified. Besides the provided schematic, a zoomed-out image showing the whole larval brain is needed here for orientation. Have these aggregates been previously characterized in the literature? 

      We agree with the reviewer that the expression of the wildtype or mutant form of human Tau in Drosophila is not known to form aggregates in the larval brain, in contrast to the adult brain (JACKSON et al. 2002; OKENVE-RAMOS et al. 2024). Consistent with previous reports, we also observed that Tau expression on its own does not form aggregates in the Drosophila larval brain.

      However, in the absence of Pfdn5, microtubule disruption is severe, leading to reduced Taumicrotubule binding and formation of globular/round or flame-shaped tangles like aggregates in the larval brain. Previous studies have reported that 1,6-hexanediol can dissolve the Tau aggregate seeds formed by Tau droplets, but cannot dissolve the stable Tau aggregates (WEGMANN et al. 2018). We observed that 5% 1,6-Hexanediol failed to dissolve these Tau puncta, demonstrating the formation of stable aggregates in the absence of Pfdn5. Additionally, we now performed a Tau solubility assay and show that in the absence of Pfdn5, a significant amount of Tau goes in the pellet fraction, which could not be detected by phospho-specific AT8 Tau antibody (targeting pSer202/pThr205) but was detected by total hTau antibody (D5D8N) on the western blots (Figure S8). These data further reinforce our conclusion that  Pfdn5 prevents the transition of hTau from soluble and/or microtubule-associated state to an aggregated, insoluble, and pathogenic state. These new data have been incorporated into the revised manuscript.

      (b) Can additional markers (nuclei, cell membrane, etc.) be used to highlight whether the taupositive structures are present in the cell body or at synapses?

      We performed the co-staining of Tau and Elav to assess the aggregated Tau localization. We found that in the presence of Pfdn5, Tau is predominantly cytoplasmic and localised to the cell body and axons. In the absence of Pfdn5, Tau forms aggregates but is still localized to the cell body or axons. However, some of the aggregates are very large, and the subcellular localization could not be determined (Figure S8M-N'). These might represent brain regions of possible nuclear breakdown and cell death (JACKSON et al. 2002).

      (c) It would also be helpful to perform western blots from larval (and adult) brains examining tau protein levels, phospho-tau species, possible higher-molecular weight oligomeric forms, and insoluble vs. soluble species. These studies would be especially important to help interpret the potential mechanisms of observed interactions.

      Western blot analysis revealed that overexpression of Pfdn5 does not alter total Tau levels (Figure 6O). In Pfdn5 mutants, however, hTau<sup>V337M</sup> levels were reduced in the supernatant fraction and increased in the pellet fraction, indicating a shift from soluble monomeric Tau to aggregated Tau.

      (d) Does overexpression of Pdn5 (UAS-Pdn5) suppress the formation of tau aggregates? I would therefore recommend that additional experiments be performed looking at adult flies (perhaps in Pfdn5 heterozygotes or using RNAi due to the larval lethality of Pdn5 null animals).

      Overexpression of Pfdn5 significantly reduced Tau-aggregates (Elav-Gal4/UASTau<sup>V337M</sup>; UAS-Pfdn5; DPfdn5<sup>15/40</sup>) observed in Pfdn5 mutants (Figure 5E). Coexpression of Pfdn5 and hTau<sup>V337M</sup> suppresses the Tau aggregates/puncta in 30-day adult brain. Since heterozygous DPfdn<sup>15</sup>/+ did not show a reduction in Pfdn5 levels, we did not test the suppression of Tau aggregates in  DPfdn<sup>15</sup>/+; Elav>UAS-Pfdn5, UAS-Tau<sup>V337M</sup>.

      (11) Figure 6, panels A-N: The GMR>Tau rough eye is not a "neurodegenerative" but rather a predominantly developmental phenotype. It results from aberrant retinal developmental patterning and the subsequent secretion/formation of the overlying eye cuticle (lenslets). I am confused by the data shown suggesting a "shrinking eye size" and increasing roughened surface over time (a GMR>tau eye similar to that shown in panel B cannot change to appear like the one in panel H with aging). The rough eye can be quite variable among a population of animals, but it is usually fixed at the time the adult fly ecloses from the pupal case, and quite stable over time in an individual animal. Therefore, any suppression of the Tau rough eye seen at 30 days should be appreciable as soon as the animals eclose. These results need to be clarified. If indeed there is robust suppression of Tau rough eye, it may be more intuitive and clearer to include these data with Figure 1, when first showing the loss-of-function enhancement of the Tau rough eye. Also, why is Pfdn6 included in these experiments but not in the studies shown in Figures 2-5?

      We thank the reviewer for their careful and knowledgeable assessment of the GMR>Tau rough eye model. We appreciate the clarification that the rough eye phenotype could be “developmental” rather than neurodegenerative.”  Our initial observations regarding "shrinking eye size" and "increased surface roughness" clearly show age-related progression of structural change.   Such progression has been observed and reported by others (IIJIMA-ANDO et al. 2012; PASSARELLA AND GOEDERT 2018).   We observed an age-dependent increase in the number of fused ommatidia in GMR-Gal4 >Tau, which were rescued by Pfdn5 or Pfdn6 expression. We noted that adult-specific induction of hTau<sup>V337M</sup> adult flies using the Gal80<sup>ts</sup> and GMR-GeneSwitch (GMR-GS) systems was not sufficient to induce a significant eye phenotype; thus, early expression of Tau in the developing eye imaginal disc appears to be required for the adult progressive phenotype that we observe. We feel that it is inadequate to refer to this adult progressive phenotype as “developmental,” and while admittedly arguable whether this can be termed “degenerative.”   

      To address neurodegeneration more directly, we focused on 30-day-old adult fly brains and demonstrated that Pfdn5 overexpression suppresses age-dependent Tau-induced neurodegeneration in the central nervous system (Figure 6H-N and Figure S12). This supports our central conclusion regarding the neuroprotective role of Pfdn5 in age-associated Tau pathology. Since we found an enhancement in the Tau-induced synaptic and eye phenotypes by Pfdn6 knockdown, we also generated CRISPR/Cas9-mediated loss-of-function mutants for Pfdn6. However, loss of Pfdn6 resulted in embryonic/early first instar lethality, which precluded its detailed analysis at the larval stages.

      (12) Figure 6, panels O-T: the elav>tau image appears to show a different frontal section plane compared to the other panels. It is advisable to show images at a similar level in all panels since vacuolar pathology can vary by region. It is also useful to be able to see the entire brain at a lower power, but the higher power inset view is obscuring these images. I would recommend creating separate panels rather than showing them as insets.

      In the revised figure, we now display the low- and high-magnification images as separate, clearly labeled panels instead of using insets. This improves visibility of the brain morphology while providing detailed views of the vacuolar pathology (Figure 6H-L).

      (13) Figure 6/7: For the experiments in which Pfdn5/6 is overexpressed and possibly suppresses tau phenotypes (brain vacuoles and memory), it is important to use controls that normalize the number of UAS binding sites, since increased UAS sites may dilute GAL4 and reduced Tau expression levels/toxicity. Therefore, it would be advisable to compare with Elav>Tau flies that also include a chromosome with an empty UAS site or other transgenes, such as UAS-GFP or UAS-lacZ.

      We thank the reviewer for the suggestion. Now we have incorporated proper controls in the brain vacuolization, the mushroom body, and ommatidial fusion rescue experiments. Also, we have independently verified whether Gal4 dilution has any effect on the Tau phenotypes (Figure 6H-L, Figure 7, and Figure S11A-B).

      (14) Lines 311-312: the authors say vacuolization occurs in human neurodegenerative disease, which is not really true to my knowledge and definitely not stated in the citation they use. Please re-phrase.

      Now we have made the appropriate changes in the revised manuscript.

      (15) Figure 7: The authors claim that Pfdn5/6 expression does not impact memory behavior, but there in fact appears to be a decrease in preference index (panel D vs panel B). Does this result complicate the interpretation of the potential interaction with Tau (panel F). Are data from wildtype control flies available?

      In our memory assay, a decrease in performance index (PI) of the trained flies compared to the naïve flies indicates memory formation (normal memory in control flies, Figure 7B). In contrast, a lack of significant difference in PI indicates a memory defect (Figure 7C: hTau<sup>V337M</sup> overexpressed flies). "Decrease in preference index (panel D vs panel B)" is not a sign of memory defect; it may be interpreted as a better memory instead. Hence, neuronal overexpression of Pfdn5 (Figure 7D) or Pfdn6 (Figure 7E) in wildtype neurons does not cause memory deficits. In addition, coexpression of Pfdn5/6 and hTau<sup>V337M</sup> successfully rescues the Tau-induced memory defect (significant drop in PI compared to the PI of naïve flies in Figure 7F-G). Moreover, almost complete rescue of the Tau-induced mushroom body defect on Pfdn5 or Pfdn6 expression further establishes potential interaction between Pfdn5/6 and Tau. This data has been incorporated into the revised manuscript.

      The memory assay itself with extensive data on wildtype flies and various other genotype will shortly be submitted for publication in another manuscript (Majumder et al, manuscript under preparation); However, we can confirm for the reviewer that wildtype flies, trained and assayed by the protocol described, show a significant decrease in performance index compared to the naïve flies, indicative of strong learning and memory performance, very similar to the control genotype data shown in Figure 7B. 

      Additional minor considerations

      (16) Lines 50-52: there are many therapeutic interventions for treating tauopathies, but not curative or particularly effective ones.

      Now we have made the appropriate changes in the revised manuscript.

      (17) Lines 87-106 seem like a duplication of the abstract. Consider deleting or condensing.

      We have made the appropriate changes in the revised manuscript.

      (18) Where is pfdn5 expressed? Development v. adult? Neuron v. glia? Conservation?

      Prefoldin5 is expressed throughout development but strongly localized to the larval trachea and neuronal axons. Drosophila Pfdn5 shows 35% overall identity with human PFDN5. 

      (19) Liine 187: is pfdn5 truly "novel"?

      The role of Pfdn5 as microtubule-binding and stabilizing is a new finding and has not been predicted or described before. Hence, it is a novel neuronal microtubule-associated protein.  

      (20) Figure 5, panel F, genotype labels on the x-axis are confusing; consider simplifying to Control, DPfdn, and Rescue.

      We have made appropriate changes in the figure for better readability.

      (21) Figures 5/8: it might be preferable to use consistent colors for Tau/HRP--Tau is labeled green in Figure 5 and then purple in Figure 8.

      We have made these changes where possible. 

      (22) Lines 311-312: Vacuolar neuropathology is NOT typically observed in human Tauopathy.

      We thank the reviewer for pointing this out. We have made the appropriate changes in the revised manuscript.

      (23) Lines 328-349: The explanation could be made more clear. Naïve flies should not necessarily be called controls. Also, a more detailed explanation of how the preference index is computed would be helpful. Why are some datapoints negative values?

      (a) We have rewritten this paragraph to make the description and explanation clearer. The detailed method and formula to calculate the Preference index have been incorporated in the Materials and Methods section.

      (b) We have replaced the term Control with Naïve. 

      (c) Datapoints with negative values appeared in some of the 'Trained' group flies. It indicates that post-CuSO<sub>4</sub> training, some groups showed repulsion towards the otherwise attractive odor 2,3B. As 2,3B is an attractive odorant, naïve or control flies show attraction towards it compared to air, which is evident from a higher number of flies in the Odor arm (O) compared to that of the Air arm (A) of the Y-maze; thus, the PI [(O-A/O+A)*100] is positive in case of naïve fly groups. Training of the flies led to an association of the attractive odorant with bitter food, leading to a decrease of attraction, and even repulsion towards the odorant in a few instances, resulting in less fly count in the odor arm compared to the air arm. Hence, the PI becomes negative as (O-A) is negative in such instances. Thus, it is not an anomaly but indicates strong learning. 

      (24) Line 403: misspelling "Pdfn"

      We have corrected this.

      (25) Lines 423-425: recommend re-phrasing, since tauopathies are human diseases. Mice and other animal models may be susceptible to tau-mediated neuronal dysfunction but not Tauopathy, per see.

      We have made the appropriate changes in the revised manuscript.

      (26) Lines 468-469: "tau neuropathology" rather than "tau associated neuropathies".

      We have made the appropriate changes in the revised manuscript. 

      References

      Askenazi, M., T. Kavanagh, G. Pires, B. Ueberheide, T. Wisniewski et al., 2023 Compilation of reported protein changes in the brain in Alzheimer's disease. Nat Commun 14: 4466.

      Hsieh, Y. C., C. Guo, H. K. Yalamanchili, M. Abreha, R. Al-Ouran et al., 2019 Tau-Mediated Disruption of the Spliceosome Triggers Cryptic RNA Splicing and Neurodegeneration in Alzheimer's Disease. Cell Rep 29: 301-316 e310.

      Iijima-Ando, K., M. Sekiya, A. Maruko-Otake, Y. Ohtake, E. Suzuki et al., 2012 Loss of axonal mitochondria promotes tau-mediated neurodegeneration and Alzheimer's disease-related tau phosphorylation via PAR-1. PLoS Genet 8: e1002918.

      Jackson, G. R., M. Wiedau-Pazos, T. K. Sang, N. Wagle, C. A. Brown et al., 2002 Human wildtype tau interacts with wingless pathway components and produces neurofibrillary pathology in Drosophila. Neuron 34: 509-519.

      Ji, W., K. An, C. Wang and S. Wang, 2022 Bioinformatics analysis of diagnostic biomarkers for Alzheimer's disease in peripheral blood based on sex differences and support vector machine algorithm. Hereditas 159: 38.

      Leitner, D., G. Pires, T. Kavanagh, E. Kanshin, M. Askenazi et al., 2024 Similar brain proteomic signatures in Alzheimer's disease and epilepsy. Acta Neuropathol 147: 27.

      Li, L., Y. Jiang, G. Wu, Y. A. R. Mahaman, D. Ke et al., 2022 Phosphorylation of Truncated Tau Promotes Abnormal Native Tau Pathology and Neurodegeneration. Mol Neurobiol 59: 6183-6199.

      Mershin, A., E. Pavlopoulos, O. Fitch, B. C. Braden, D. V. Nanopoulos et al., 2004 Learning and memory deficits upon TAU accumulation in Drosophila mushroom body neurons. Learn Mem 11: 277-287.

      Mukaka, M. M., 2012 Statistics corner: A guide to appropriate use of correlation coefficient in medical research. Malawi Med J 24: 69-71.

      Okenve-Ramos, P., R. Gosling, M. Chojnowska-Monga, K. Gupta, S. Shields et al., 2024 Neuronal ageing is promoted by the decay of the microtubule cytoskeleton. PLoS Biol 22: e3002504.

      Passarella, D., and M. Goedert, 2018 Beta-sheet assembly of Tau and neurodegeneration in Drosophila melanogaster. Neurobiol Aging 72: 98-105.

      Sun, Z., J. S. Kwon, Y. Ren, S. Chen, C. K. Walker et al., 2024 Modeling late-onset Alzheimer's disease neuropathology via direct neuronal reprogramming. Science 385: adl2992.

      Tao, Y., Y. Han, L. Yu, Q. Wang, S. X. Leng et al., 2020 The Predicted Key Molecules, Functions, and Pathways That Bridge Mild Cognitive Impairment (MCI) and Alzheimer's Disease (AD). Front Neurol 11: 233.

      Wegmann, S., B. Eftekharzadeh, K. Tepper, K. M. Zoltowska, R. E. Bennett et al., 2018 Tau protein liquid-liquid phase separation can initiate tau aggregation. EMBO J 37.

    1. Author response:

      The following is the authors’ response to the original reviews

      Public Reviews:

      Reviewer #1 (Public review):

      One of the most novel things of the manuscript is the use of a relatively quick photoablation system. Could this technique be applied in other laboratories? While the revised manuscript includes more technical details as requested, the description remains difficult to follow for readers from a biology background. I recommend revising this section to improve clarity and accessibility for a broader scientific audience.

      As suggested, we have adapted the paragraph related to the photoablation technique in the Material & Method section, starting line 1147. We believe it is now easier to follow.

      The authors suggest that in the animal model, early 3h infection with Neisseria do not show increase in vascular permeability, contrary to their findings in the 3D in vitro model. However, they show a non-significant increase in permeability of 70 KDa Dextran in the animal xenograft early infection. As a bioengineer this seems to point that if the experiment would have been done with a lower molecular weight tracer, significant increases in permeability could have been detected. I would suggest to do this experiment that could capture early events in vascular disruption.

      Comparing permeability under healthy and infected conditions using Dextran smaller than 70 kDa is challenging. Previous research (1) has shown that molecules below 70 kDa already diffuse freely in healthy tissue. Given this high baseline diffusion, we believe that no significant difference would be observed before and after N. meningitidis infection, and these experiments were not carried out. As discussed in the manuscript, bacteria-induced permeability in mice occurs at later time points, 16h post-infection, as shown previously (2). As discussed in the manuscript, this difference between the xenograft model and the chip could reflect the absence of various cell types present in the tissue parenchyma or simply vessel maturation time.

      One of the great advantages of the system is the possibility of visualizing infection-related events at high resolution. The authors show the formation of actin in a honeycomb structure beneath the bacterial microcolonies. This only occurred in 65% of the microcolonies. Is this result similar to in vitro 2D endothelial cultures in static and under flow? Also, the group has shown in the past positive staining of other cytoskeletal proteins, such as ezrin, in the ERM complex. Does this also occur in the 3D system?

      We imaged monolayers of endothelial cells in the flat regions of the chip (the two lateral channels) using the same microscopy conditions (i.e., Obj. 40X N.A. 1.05) that have been used to detect honeycomb structures in the 3D vessels in vitro. We showed that more than 56% of infected cells present these honeycomb structures in 2D, which is 13% less than in 3D, and is not significant due to the distributions of both populations. Thus, we conclude that under both in vitro conditions, 2D and 3D, the amount of infected cells exhibiting cortical plaques is similar. These results are in Figure 4E and S4B.

      We also performed staining of ezrin in the chip and imaged both the 3D and 2D regions. Although ezrin staining was visible in 3D (Author response image 1), it was not as obvious as other markers under these infected conditions, and we did not include it in the main text. Interpretation of this result is not straightforward, as the substrate of the cells is different, and it would require further studies on the behavior of ERM proteins in these different contexts.

      Author response image 1.

      F-actin (red) and ezrin (yellow) staining after 3h of infection with N. meningitidis (green) in 2D (top) and 3D (bottom) vessel-on-chip models.

      Recommendation to the authors:

      Reviewer #1 (Recommendation to the authors):

      I appreciate that the authors addressed most of my comments, of special relevance are the change of the title and references to infection-on-chip. I think that the current choice of words better acknowledges the incipient but strong bioengineering infection community. I also appreciate the inclusion of a limitation paragraph that better frames the current work and proposes future advancements.

      The addition of more methodological details has improved the manuscript. Although as mentioned earlier the wording needs to be accessible for the biology community. I also appreciated the addition of the quantification of binding under the WSS gradient in the different geometries and shown in Fig 3H. However, the description of the figure and the legend is not clear. What does "vessel" mean on the graph and "normalized histograms ...(blue)" in the figure legend. Could the authors rephrase it?

      In Figure 3F, we investigated whether Neisseria meningitidis exhibits preferential sites of infection. We hypothesized that, if bacteria preferentially adhered to specific regions, the local shear stress at these sites would differ from the overall distribution. To test this, we compared the shear stress at bacterial adhesion sites in the VoC (orange dots and curve) with the shear stress along the entire vascular edges (blue dots and curve). The high Spearman correlation indicates that there is no distinct shear stress value associated with bacterial adhesion. This suggests that bacteria can adhere across all regions, independently of local shear stress. To enhance clarity, the legend of Figure 3 and the related text have been rephrased in the revised manuscript (L289-314).

      Line 415. Should reference to Fig S5B, not Fig 5B. Also, the titles in Supplementary Figure 4 and 5 are duplicated, and the description of the legend inf Fig S5 seems a bit off. A and B seem to be swapped.

      Indeed, the reference to the right figure has been corrected. Also, the title of Figure S4 has been adapted to its contents, and the legend of Figure S5 has been corrected.

      Reviewer #2 (Recommendation to the authors):

      Minor comments to the authors:

      Line 163 "they formed" instead of "formed".

      Line 212 "two days" instead of "two day"

      Line 269 a space between two words is missing.

      These three comments have been addressed in the revised manuscript.

      In addition, I appreciate answering the comments, especially those requiring hypothesizing about including further cells. However, when discussing which other cells could be relevant for the model (lines 631 to 632) it would be beneficial to discuss not only the role of those cells but also how could they be included in the model. I think for the reader, inclusion of further cells could be seen as a challenge or limitation, and addressing these technical points in the discussion could be helpful.

      We thank Reviewer #2 for the insightful suggestion. Indeed, the method of introducing cells into the VoC depends on their type. Fibroblasts and dendritic cells, which are resident tissue cells, should be embedded in the collagen gel before polymerization and UV carving. This requires careful optimization to preserve chip integrity, as these cells exert pulling forces while migrating within the collagen matrix. In contrast, T cells and macrophages should be introduced through the vessel lumen to mimic their circulation in vivo. Pericytes can be co-seeded with endothelial cells, as they have been shown to self-organize within a few hours post-seeding. These important informations are now included in the manuscript (L577-587).

      Reviewer #3 (Recommendation to the authors):

      Suggestions and Recommendations

      Some suggestions related to the VOC itself:

      Figure 1, Fig S1, paragraph starting line 1071: More information would be helpful for the laser photoablation. For instance, is a non-standard UV laser needed? Which form of UV light is used? What is the frequency of laser pulsing? How many pulses/how long is needed to ablate the region of interest?

      The photoablation process requires a focused UV-laser, with high frequency (10 kHz) to lower the carving time while providing the required intensity to degrade collagen gel. To carve a reproducible number of 30 µm-large vessels, we used a 2 µm-large laser beam at an energy of 10 mW and moved the stage (i.e., sample) at a maximum speed of 1 mm/s. This information has been added to the related paragraph starting on line 1147 of the revised manuscript.

      It is difficult to understand the geometry of the VOC. In Figure 1C, is the light coloration representing open space through which medium can flow, and the dark section the collagen? On a single chip, how many vessels are cut through the collagen? It looks as if at least two are cut in Figure 1C in the righthand photo.

      In Figure 1C, the light coloration is the Factin staining. The horizontal upper and lower parts are the 2D lateral channels that also contain endothelial cells, and are connected to inlets and outlets, respectively. In the middle, two vertically carved 3D vessels are shown in the confocal image.

      Technically, we designed the PDMS structures to allow carving of 1 to 3 channels, maximizing the number of vessels that can be imaged while minimizing any loss of permeability at the PDMS/collagen/cells interface. This information has been added in the revised manuscript (L. 1147).

      If multiple vessels are cut in the center channel between the lateral channels, how do you ensure that medium flow is even between all vessels? A single chip with multiple different vessel architectures through the center channel would be expected to have different hydrostatic resistance with different architectures, thereby causing differences in flow rates in each vessel.

      To ensure a consistent flow rate regardless of the number of carved vessels, we opted to control the flow rate directly across the chip with a syringe pump. During experiments, one inlet and one outlet were closed, and a syringe pump was used. Because the carved vessels are arranged in parallel (derivation), the flow rate remains the same in each vessel. If a pressure controller had been used instead, the flow would have been distributed evenly across the different channels. This has been added to the revised manuscript in the paragraph starting on line 1210.

      The figures imply that the laser ablation can be performed at depth within the collagen gel, rather than just etching the surface. If this is the case, it should be stated explicitly. If not, this needs to be clarified.

      One of the main advantages of the photoablation technique is carving the collagen gel in volume, and not only etching the surface. Thanks to the 3D UV degradation, we can form the 3D architecture surrounded by the bulk collagen. This has been added to the revised manuscript, lines 154-155.

      Is the in-vivo-like vessel architecture connected to the lateral channel at an oblique angle, or is the image turned to fit the entire structure? (Figure 1F and 3E). Is that why there is high shear stress at its junction with the lateral channel depicted in Figure 3E?

      All structures require connection to the lateral channels to ensure media circulation and nutrient supply. The in vivo-like design must be rotated to allow the upper and lower branches of the complex structure to pass between the fixed PDMS pillars. To remain consistent with the image and the flow direction, we have kept the same orientation as in the COMSOL simulation. This leads to a locally higher shear stress at the top of the architecture. This has been added in the revised manuscript, in the paragraph starting on line 1474.

      Figure S1F,G: In the legend, shapes are circles, not squares. On the graphs, what do the numbers in parentheses mean?

      Indeed, the terms "squares" have been replaced by "circles" in Figure 1. (1) and (2) refer to the providers of the collagen, FujiFilm and Corning, respectively. We have added this mention in the legend in Figure S1.

      Figure 3B: how do the images on the left and right differ? Each of the 4 images needs to be explained.

      The four images represent the infected VoC from different viewing angles, illustrating the three-dimensional spread of infection throughout the vessel. A more detailed description has been added in the legend of Figure 3.

      Figure S3C is not referenced but should be, likely before sentence starting on line 299.

      Indeed, the reference to Figure S3C has been added line 301 of the revised manuscript.

      Results in Figure 3 with the pilD mutant are very interesting. It is worth commenting in the Discussion about how T4P functionality in addition to the presence of T4P contributes to Nm infection, and how in the future this could be probed with pilT mutants.

      We thank Reviewer #3 for this relevant insight. Following adhesion, a key functionality of Neisseria meningitidis for colony formation and enhanced infection is twitching motility. As suggested, we have added in the Discussion the idea of using a PilT mutant, which can adhere but cannot retract its pili, in the VoC model to investigate the role of motility in colonization in vitro under flow conditions (L611–623).

      Which vessel design was used for the data presented in Figures 4, 5, and 6 and associated supplemental figures?

      Straight channels have been mostly used in figures 4, 5, and 6. Rarely, we used the branched in vivo-like designs to observe potential similar infection patterns to in vivo, and related neutrophil activity. This has been added in the revised manuscript, lines 1435-1439.

      Figure 4B-D: the images presented in Figure 4C are not representative of the averages presented in Figures 4B,D. For instance, the aggregates appear much larger and more elongated in the animal model in Figure 4C, but the animal model and VOC have the colony doubling time (implying same size) in Figure 4B, and same average aggregate elongation in Figure 4D.

      The images in Figure 4C were selected to illustrate the elongation of colonies quantified in Figure 4D. The elongation angles are consistent between both images and align with the channel orientation. Representative images of colony expansion over time, corresponding to Figure 4A and 4B, are provided in Figure S4A.

      Figures 4E-F: dextran does not appear to diffuse in the VOC in response to histamine in these images, yet there is a significant increase in histamine-induced permeability in Figure 4F. Dotted lines should be used to indicate vessel walls for histamine, and/or a more representative image should be selected. A control set of images should also be included for comparison.

      We thank Reviewer #3 for the insightful comment. We confirm that we have carefully selected representative images for the histamine condition and adjusted them to display the same range of gray levels. The apparent increase in permeability with histamine is explained by a slight rise in background fluorescence, combined with the smaller channel size shown in Figure 4E.

      Figure S4 title is a duplicate of Figure S5 and is unrelated to the content of Figure S4. Suggest rewording to mention changes in permeability induced by Nm infection in the VOC and animal model.

      Indeed, the title of Figure S4 did not correspond to its content. We have, thus, changed it in the revised manuscript.

      Line 489 "...our Vessel-on-Chip model has the potential to fully capture the human neutrophil response during vascular infections, in a species-matched microenvironment", is an overstatement. As presented, the VOC model only contains endothelial cells and neutrophils. Many other cell types and structures can affect neutrophil activity. Thus, it is an overstatement to claim that the model can fully capture the human neutrophil response.

      We agree with the Reviewer #3, that neutrophil activity is fully recapitulated with other cell types, such as platelets, pericytes, macrophages, dendritic cells, and fibroblasts, that secrete important molecules such as cytokines, chemokines, TNF-α, and histamine. In our simplified model we were able to reconstitute the complex interaction of neutrophils with endothelial cells and with bacteria. The text was modified accordingly.

      Supplemental Figure 6 - Does CD62E staining overlap with sites of Nm attachment

      E-selectin staining does not systematically colocalize with Neisseria meningitidis colonies although bacterial adhesion is required. Its overall induced expression is heterogeneous across the tissue and shows heterogeneity from cell to cell as seen in vivo.

      Line 475, Figure 6E- Phagocytosis of Nm is described, but it is difficult to see. An arrow should be added to make this clear. Perhaps the reference should have been to Figure 6G? Consider changing the colors in Figure 6G away from red/green to be more color-blind friendly.

      Indeed, the reference to the right figure is Figure 6G, where the phagocytosis event is zoomed in. We have changed it in the text. Adapting the color of this figure 6G would imply to also change all the color codes of the manuscript, as red has been used for actin and green for Neisseria meningitidis.

      Lines 621-632 - This important discussion point should be reworked. Some suggested references to cite and discuss include PMID: 7913984, 15186399, 17991045, 18640287, 19880493.

      We have introduced in the discussion parts the following references as suggested (3–7), and discussed more the importance of introducting of immune cells to study immune cell-bacteria interaction and related immune response (L659-678).

      Minor corrections:

      •  Line 8 - suggest "photoablation-generated" instead of "photoablation-based"

      •  Line 57- remove the word "either", or modify the sentence

      •  Sentence on lines 162-165 needs rewording

      •  Lines 204-205- "loss of vascular permeability" should read "increase in vascular permeability"

      •  Line 293- "Measured" shear stress, should be "computed", since it was not directly measured (according to the Materials & Methods)

      •  Line 304- "consistently" should be "consistent"

      •  Fig. 3 legend, second line: replace "our" with "the VoC"

      •  Line 371, change "our" to "the"

      •  Line 415- Figure 5B doesn’t appear to show 2-D data. Is this in Figure S5B? Some clarification is needed. The quantification of Nm vessel association in both the VOC and the animal model should be shown in Figure 5, for direct comparison.

      •  Supplementary Figure 5C: correlation coefficient with statistical significance should be calculated.

      •  Figure 6 title, rephrase to "The infected VOC model"

      •  Line 450, replace "important" with "statistically significant"

      •  Line 459, suggest rephrasing to "bacterial pilus-mediated adhesion"

      •  Line 533- grammar needs correction

      •  Line 589- should be "sheds"

      •  Line 1106- should be "pellet"

      •  Lines 1223-1224 - is the antibody solution introduced into the inlet of the VOC for staining? Please clarify.

      •  Line 1295-unclear why Figure 2B is being referenced here

      All the suggested minor corrections have been taken into account in the revised manuscript.

      References

      (1) Gyohei Egawa, Satoshi Nakamizo, Yohei Natsuaki, Hiromi Doi, Yoshiki Miyachi, and Kenji Kabashima. Intravital analysis of vascular permeability in mice using two-photon microscopy. Scientific Reports, 3(1):1932, Jun 2013. ISSN 2045-2322. doi: 10.1038/srep01932.

      (2) Valeria Manriquez, Pierre Nivoit, Tomas Urbina, Hebert Echenique-Rivera, Keira Melican, Marie-Paule Fernandez-Gerlinger, Patricia Flamant, Taliah Schmitt, Patrick Bruneval, Dorian Obino, and Guillaume Duménil. Colonization of dermal arterioles by neisseria meningitidis provides a safe haven from neutrophils. Nature Communications, 12(1):4547, Jul 2021. ISSN 2041-1723. doi: 10.1038/s41467-021-24797-z.

      (3) Katherine A. Rhodes, Man Cheong Ma, María A. Rendón, and Magdalene So. Neisseria genes required for persistence identified via in vivo screening of a transposon mutant library. PLOS Pathogens, 18(5):1–30, 05 2022. doi: 10.1371/journal.ppat.1010497.

      (4) Heli Uronen-Hansson, Liana Steeghs, Jennifer Allen, Garth L. J. Dixon, Mohamed Osman, Peter Van Der Ley, Simon Y. C. Wong, Robin Callard, and Nigel Klein. Human dendritic cell activation by neisseria meningitidis: phagocytosis depends on expression of lipooligosaccharide (los) by the bacteria and is required for optimal cytokine production. Cellular Microbiology, 6(7):625–637, 2004. doi: https://doi.org/10.1111/j.1462-5822.2004.00387.x.

      (5) M. C. Jacobsen, P. J. Dusart, K. Kotowicz, M. Bajaj-Elliott, S. L. Hart, N. J. Klein, and G. L. Dixon. A critical role for atf2 transcription factor in the regulation of e-selectin expression in response to non-endotoxin components of neisseria meningitidis. Cellular Microbiology, 18(1):66–79, 2016. doi: https://doi.org/10.1111/cmi.12483.

      (6) Andrea Villwock, Corinna Schmitt, Stephanie Schielke, Matthias Frosch, and Oliver Kurzai. Recognition via the class a scavenger receptor modulates cytokine secretion by human dendritic cells after contact with neisseria meningitidis. Microbes and Infection, 10(10):1158–1165, 2008. ISSN 1286-4579. doi: https://doi.org/10.1016/j.micinf.2008.06.009.

      (7) Audrey Varin, Subhankar Mukhopadhyay, Georges Herbein, and Siamon Gordon. Alternative activation of macrophages by il-4 impairs phagocytosis of pathogens but potentiates microbial-induced signalling and cytokine secretion. Blood, 115(2):353–362, Jan 2010. ISSN 0006-4971. doi: 10.1182/blood-2009-08-236711.

    1. self

      [/ 🧊/ ♖/ hyperpost/ ~/ indyweb/ 📓/ 20/ 25/ 11/ 3/ 🏛️](https://bafybeicbv7b4bpesh5wmnynftywhm2dzrswf6csndh2v4ndu2n3uuex4ny.ipfs.dweb.link/?filename=save%20string%20to%20local%20filesystem%20javascript%20-%20Brave%20Search%20(11_13_2025%208%EF%BC%9A27%EF%BC%9A28%20AM).html}

    1. P r o g n o s i s s h o u l d b e e s t a b l i s h e d b e f o r et r e a t m e n t i s s t a r t e d a n d b a s e d o n t h i sp r o g n o s i s y o u r t r e a t m e n t p l a n s h o u l d b ed o n e ...

      ① Prognosis should be established before treatment is started and based on this prognosis your treatment plan should be done (Prognoz, tedaviye başlamadan önce belirlenmelidir ve bu prognoza dayanarak tedavi planınız yapılmalıdır)

      Açıklama:

      Prognoz, hastalığın olası seyri ve tedaviye yanıtını öngörür.

    2. linical StepsTaking History &ExaminationFurther Investigations-if needed- Define the DiagnosisDetermine thePrognosis of thediseasePlan the TreatmentP r o g n o s i s is e s t a b l i s h e d AFTER t h e d i a g n o s i s is m a d e a n d BEFORE t h e t r e a t m e n tp l a n i s e s t a b l i s h e

      ① Clinical Steps (Klinik Adımlar)

      ② Taking History & Examination (Hastanın öyküsünü almak ve muayene yapmak)

      ③ Further Investigations — if needed (Gerekirse ileri tetkikler yapmak)

      ④ Define the Diagnosis (Tanıyı koymak)

      ⑤ Determine the Prognosis of the disease (Hastalığın prognozunu belirlemek)

      ⑥ Plan the Treatment (Tedavi planını yapmak)

      ⑦ Prognosis is established AFTER the diagnosis is made and BEFORE the treatment plan is established (Prognoz, tanı konulduktan sonra ve tedavi planı yapılmadan önce belirlenir)

    Annotators

    1. aiming to augment their own experiences and through that ended up uh augmenting uh what the rest of humanity can do.

      augmenting what the rest of humanity can do

    1. Author response:

      Reviewer #1

      We agree that further clarification how elevated exercise disrupts blastema formation would strengthen the manuscript. Our data suggests a major contribution of proliferation. Exercise reduced the fraction of proliferative cells at 3 dpa, consistent with disrupted HA production and downstream Yap signaling. This interpretation aligns with prior studies showing that proliferation contributes to blastema establishment and is not restricted to the outgrowth phase of fin regeneration (Poleo et al, 2001; Poss et al, 2002; Wang et al, 2019; Pfefferli et al, 2014; Hou et al, 2020). We will explore additional experiments to reinforce these insights into the cellular mechanisms underlying exercise-disrupted blastema formation.

      We acknowledge that our analysis of ray branching abnormalities is limited in the current manuscript. We focus our study on introducing the zebrafish swimming and regeneration model and then characterizing ECM and signaling changes accounting for disrupted blastema establishment. For completeness, we included the observation of skeletal patterning defects (branching delays and bone fusions) but without detailed analysis. We note that decreased expression of shha and Shh-pathway components following early exercise corresponds with the branching defects. However, we recognize exercise could have additional effects during the outgrowth  phase when branching morphogenesis actively occurs. Therefore, we will expand our discussion to outline future research directions related to exercise impacts on regenerative skeletal patterning.

      We will expand the Introduction and/or Discussion sections to provide more context on known HA roles across regeneration contexts, including in zebrafish fins. Finally, we will improve the text’s clarity and specificity throughout the manuscript, including to resolve or explain any apparent contradictions.

      Reviewer #2

      We appreciate the Reviewer's concern regarding the specificity of forced exercise as a model for mechanical loading. Forced exercise has been widely used in vivo to induce mechanical loading without the requirement for specialized implants or animal restraint, including in mouse (Wallace et al, 2015; Bomer et al, 2016), rat (Honda et al, 2003; Boerckel et al, 2011; Boerckel et al, 2012), and, most relevant to our study, zebrafish models (Fiaz et al, 2012; Fiaz et al, 2014; Suniaga et al, 2018). However, we will expand our discussion of this approach and ensure precise language distinguishing exercise from mechanical loading.

      We acknowledge the possibility that early shear stress disrupts the wound epidermis, which we will elaborate on in a revised Discussion. However, exercise-induced disruptions to the fin epidermis of early regenerates (1–2 dpa; Figure 2) typically resolve within one day, whereas fibroblast lineage cells still fail to establish a robust blastema. Therefore, sustained effects of mechanical loading and/or mechanosensation are likely major contributors to the observed regeneration phenotypes.

      We will explore whether HA acts as a general enhancer of fin regeneration by comparing blastemal HA supplementation vs. controls in non-exercised regenerating animals, if technically feasible. We will merge Figure S7 (HA supplementation) with Figure 5 (HA depletion) for clarity, as suggested.

      We will include a schematic and clear definitions for 'peripheral' and 'central' rays in a revised manuscript.

      Reviewer #3

      We included Hoechst and eosin fluorescent staining in the manuscript to show changes in tissue architecture following swimming exercise (Supplemental Figure 4). We will extend this histological analysis to include hematoxylin and eosin staining to provide additional tissue visualization.

      References

      Poleo G, Brown CW, Laforest L, Akimenko MA. Cell proliferation and movement during early fin regeneration in zebrafish. Dev Dyn. 2001 Aug;221(4):380-90.

      Poss KD, Nechiporuk A, Hillam AM, Johnson SL, Keating MT. Mps1 defines a proximal blastemal proliferative compartment essential for zebrafish fin regeneration. Development. 2002 Nov;129(22):5141-9.

      Wang YT, Tseng TL, Kuo YC, Yu JK, Su YH, Poss KD, Chen CH. Genetic Reprogramming of Positional Memory in a Regenerating Appendage. Curr Biol. 2019 Dec 16;29(24):4193-4207.e4.

      Pfefferli C, Müller F, Jaźwińska A, Wicky C. Specific NuRD components are required for fin regeneration in zebrafish. BMC Biol. 2014 Apr 29;12:30.

      Hou Y, Lee HJ, Chen Y, Ge J, Osman FOI, McAdow AR, Mokalled MH, Johnson SL, Zhao G, Wang T. Cellular diversity of the regenerating caudal fin. Sci Adv. 2020 Aug 12;6(33):eaba2084.

      Wallace IJ, Judex S, Demes B. Effects of load-bearing exercise on skeletal structure and mechanics differ between outbred populations of mice. Bone. 2015 Mar;72:1-8.

      Bomer N, Cornelis FM, Ramos YF, den Hollander W, Storms L, van der Breggen R, Lakenberg N, Slagboom PE, Meulenbelt I, Lories RJ. The effect of forced exercise on knee joints in Dio2(-/-) mice: type II iodothyronine deiodinase-deficient mice are less prone to develop OA-like cartilage damage upon excessive mechanical stress. Ann Rheum Dis. 2016 Mar;75(3):571-7.

      Honda A, Sogo N, Nagasawa S, Shimizu T, Umemura Y. High-impact exercise strengthens bone in osteopenic ovariectomized rats with the same outcome as Sham rats. J Appl Physiol (1985). 2003 Sep;95(3):1032-7.

      Boerckel JD, Kolambkar YM, Stevens HY, Lin AS, Dupont KM, Guldberg RE. Effects of in vivo mechanical loading on large bone defect regeneration. J Orthop Res. 2012 Jul;30(7):1067-75.

      Boerckel JD, Uhrig BA, Willett NJ, Huebsch N, Guldberg RE. Mechanical regulation of vascular growth and tissue regeneration in vivo. Proc Natl Acad Sci U S A. 2011 Sep 13;108(37):E674-80.

      Fiaz AW, Léon-Kloosterziel KM, Gort G, Schulte-Merker S, van Leeuwen JL, Kranenbarg S. Swim-training changes the spatio-temporal dynamics of skeletogenesis in zebrafish larvae (Danio rerio). PLoS One. 2012;7(4):e34072.

      Fiaz AW, Léon‐Kloosterziel KM, van Leeuwen JL, Kranenbarg S. Exploring the molecular link between swim‐training and caudal fin development in zebrafish (Danio rerio) larvae. Journal of Applied Ichthyology. 2014 Aug;30(4):753-61.

      Suniaga S, Rolvien T, Vom Scheidt A, Fiedler IAK, Bale HA, Huysseune A, Witten PE, Amling M, Busse B. Increased mechanical loading through controlled swimming exercise induces bone formation and mineralization in adult zebrafish. Sci Rep. 2018 Feb 26;8(1):3646.

    1. Author response:

      The following is the authors’ response to the previous reviews

      Public Reviews:

      Reviewer #1 (Public review):

      This study extends the previous interesting work of this group to address the potentially differential control of movement and posture. Their earlier work explored a broad range of data to make the case for a downstream neural integrator hypothesized to convert descending velocity movement commands into postural holding commands. Included in that data were observations from people with hemiparesis due to stroke. The current study uses similar data, but pushes into a different, but closely related direction, suggesting that these data may address the independence of these two fundamental components of motor control. I find the logic laid out in the second sentence of the abstract ("The paretic arm after stroke is notable for abnormalities both at rest and during movement, thus it provides an opportunity to address the relationships between control of reaching, stopping, and stabilizing") less then compelling, but the study does make some interesting observations. Foremost among them, is the relation between the resting force postural bias and the effect of force perturbations during the target hold periods, but not during movement. While this interesting observation is consistent with the central mechanism the authors suggest, it seems hard to me to rule out other mechanisms, including peripheral ones. These limitations should should be discussed.

      Thank you for summarizing our work. Note we have improved the logic in our abstract (…”providing an opportunity to ask whether control of these behaviors is independently affected in stroke”) based on your comments as outlined in our previous revision. We now extensively discuss limitations and potential alternative mechanisms in greater detail, in a dedicated section (lines 846-895; see response to reviewer 2 for further details).

      Reviewer #2 (Public review):

      Summary:

      Here the authors address the idea that postural and movement control are differentially impacted with stroke. Specifically, they examined whether resting postural forces influenced several metrics of sensorimotor control (e.g., initial reach angle, maximum lateral hand deviation following a perturbation, etc.) during movement or posture. The authors found that resting postural forces influenced control only following the posture perturbation for the paretic arm of stroke patients, but not during movement. They also found that resting postural forces were greater when the arm was unsupported, which correlated with abnormal synergies (as assessed by the Fugl-Meyer). The authors suggest that these findings can be explained by the idea that the neural circuitry associated with posture is relatively more impacted by stroke than the neural circuitry associated with movement. They also propose a conceptual model that differentially weights the reticulospinal tract (RST) and corticospinal tract (CST) to explain greater relative impairments with posture control relative to movement control, due to abnormal synergies, in those with stroke.

      Thank you for the brief but comprehensive summary. We would like to clarify one point: we do not suggest that our findings are necessarily due to the neural circuitry associated with posture being more impacted than the neural circuitry associated with movement. (rather, our conceptual model suggests that increased outflow through the (ipsilateral) RST, involved in posture, compensates for CST damage, at the expense of posture abnormalities spilling over into movement). Instead, we suggest that the neural circuitry for posture vs. movement control remains relatively separate in stroke, with impairments in posture control not substantially explaining impairments in movement control.

      Comments on revisions:

      The authors should be commended for being very responsive to comments and providing several further requested analyses, which have improved the paper. However, there is still some outstanding issues that make it difficult to fully support the provided interpretation.

      Thank you for appreciating our response to your earlier comments. We address the outstanding issues below.

      The authors say within the response, "We would also like to stress that these perturbations were not designed so that responses are directly compared to each other ***(though of course there is an *indirect* comparison in the sense that we show influence of biases in one type of perturbation but not the other)***." They then state in the first paragraph of the discussion that "Remarkably, these resting postural force biases did not seem to have a detectable effect upon any component of active reaching but only emerged during the control of holding still after the movement ended. The results suggest a dissociation between the control of movement and posture." The main issue here is relying on indirect comparisons (i.e., significant in one situation but not the other), instead of relying on direct comparisons. Using well-known example, just because one group / condition might display a significant linear relationship (i.e., slope_1 > 0) and another group / condition does not (slope_2 = 0), does not necessarily mean that the two groups / conditions are statistically different from one another [see Figure 1 in Makin, T. R., & Orban de Xivry, J. J. (2019). Ten common statistical mistakes to watch out for when writing or reviewing a manuscript. eLife, 8, e48175.].

      We agree and are well aware of the limitation posed by an indirect comparison – hence the language we used to comment on the data (“did not seem”, “suggest”, etc.). To address this limitation, we performed a more direct comparison of how the two types of perturbations (moving vs. holding) interact with resting biases. For this comparison, we calculated a Response Asymmetry Index (RAI):

      Above, 𝑟<sub>𝐴</sub> is the response on direction where resting bias is most-aligned with the perturbation, and 𝑟<sub>𝑂</sub> is the response on direction where resting bias is most-opposed to the perturbation.

      We calculated RAIs for two response metrics used for both moving and holding perturbations: maximum deviation and time to stabilization/settling time. For these two response metrics, positive RAIs indicate an asymmetry in line with an effect of resting bias.

      The idea behind the RAI is that, while the magnitude of responses may well differ between the two types of perturbations, this will be accounted for by the ratio used to calculate the asymmetry. The same approach has been used to assess symmetry/laterality across a variety of different modalities, such as gait asymmetry (Robinson et al., 1987), the relative fMRI activity in the contralateral vs. ipsilateral sensorimotor cortex while performing a motor task (Cramer et al., 1997), or the relative strength of ipsilateral vs. contralateral responses to transcranial magnetic stimulation (McPherson et al., 2018). Notably, the normalization also addresses potential differences in overall stiffness between holding vs. moving perturbations, which would similarly affect aligned and opposing cases (see our response to your following point).

      Figure 8 shows RAIs we obtained for holding (red) vs. moving/pulse (blue) perturbations. For the maximum deviation (left), there is more asymmetry for the holding case though the pvalue is marginal (p=0.088) likely due to the large variability in the pulse case (individual values shown in black dots). For time to stabilization/settling time (right) the difference is significant (p=0.0048). Together, these analyses indicate that resting biases interact substantially more with holding compared to movement control, in line with a relative independence between these two control modalities. We now include this panel as Figure 8, and describe it in Results (lines 587-611).

      Note that even a direct comparison does not prove that resting biases and active movement control are perfectly independent. We now discuss these issues in more depth, in the new Limitations section suggested by the Reviewer (lines 836-849).

      The authors have provided reasonable rationale of why they chose certain perturbation waveforms for different. Yet it still holds that these different waveforms would likely yield very different muscular responses making it difficult to interpret the results and this remains a limitation. From the paper it is unknown how these different perturbations would differentially influence a variety of classic neuromuscular responses, including short-range stiffness and stretch reflexes, which would be at play here.

      Much of the results can be interpreted when one considers classic neuromuscular physiology. In Experiment 1, differences in resting postural bias in supported versus unsupported conditions can readily be explained since there is greater muscle activity in the unsupported condition that leads to greater muscle stiffness to resist mechanical perturbations (Rack, P. M., & Westbury, D. R. (1974). The short-range stiffness of active mammalian muscle and its effect on mechanical properties. The Journal of physiology, 240(2), 331-350.). Likewise muscle stiffness would scale with changes in muscle contraction with synergies. Importantly for experiment 2, muscle stiffness is reduced during movement (Rack and Westbury, 1974) which may explain why resting postural biases do not seem to be impacting movement. Likewise, muscle spindle activity is shown to scale with extrafusal muscle fiber activity and forces acting through the tendon (Blum, K. P., Campbell, K. S., Horslen, B. C., Nardelli, P., Housley, S. N., Cope, T. C., & Ting, L. H. (2020). Diverse and complex muscle spindle afferent firing properties emerge from multiscale muscle mechanics. eLife, 9, e55177.). The concern here is that the authors have not sufficiently considered muscle neurophysiology, how that might relate to their findings, and how that might impact their interpretation. Given the differences in perturbations and muscle states at different phases, the concern is that it is not possible to disentangle whether the results are due to classic neurophysiology, the hypothesis they propose, or both. Can the authors please comment.

      It is possible that neuromuscular physiology may explain part of our results. However, this would not contradict our conceptual model.

      Regarding Experiment 1, it is possible that stiffness would scale with changes in background muscle contraction as the reviewer suggests. Indeed, Bennett and al.(Bennett et al., 1992) used brief perturbations on the wrist to assess elbow stiffness, finding that, during movement, stiffness was increased in positions with a higher gravity load (and, in general, in positions where the net muscle torque was higher). However, during posture maintenance (like in our Experiment 1), they found that stiffness did not vary with (elbow) position or gravity load (two characteristics of our findings in Experiment 1):

      “The observed stiffness variation was not simply due to passive tissue or other joint angle dependent properties, as stiffnesses measured during posture were position invariant. Note that the minimum stiffness found in posture was higher than the peak stiffness measured during movement, and did not change much with the gravity load.” (illustrated in Fig. 5 of that paper)

      We thus find it very unlikely that stiffness explains the difference between the supported vs. unsupported conditions in Experiment 1.

      Even if stiffness modulation between the supported vs. unsupported conditions could explain our finding of stronger posture biases in the latter case, it would not be incompatible with our interpretation of increased RST drive: increased stiffness would potentially magnify the effects of the RST drive we propose to drive these resting biases. It is possible that the increase in resting biases under conditions of increased muscle contraction (lack of arm support) is mediated through an increase in muscle stiffness. In other words, the increase in resting biases may not directly reflect additional RST outflow per se, but the scaling, through stiffness, of the same magnitude of RST outflow. Understanding this interaction was beyond the scope of our experiment design; in line with this, we briefly comment about it in our Limitations section.

      Regarding Experiment 2, stiffness has indeed been shown to be lower during movement, and we now comment the potential effect of this on our results in the “Limitations” section (lines 815-830, replicated below). Importantly, for the case of holding perturbations, the increased stiffness associated with holding would increase resistance to both extension and flexion-inducing perturbations. Thus, higher stiffness would be unlikely to explain our finding whereby resting biases resist or aggravate the effects of holding perturbations depending on perturbation direction. In addition, the framework in Blum et al., that describes how interactions between alpha and gramma drive can explain muscle activity patterns, does not rule out central neural control of stiffness: “muscle spindles have a unique muscle-within-muscle design such that their firing depends critically on both peripheral and central factors” (emphasis ours). It may be, for example, that gamma motoneurons controlling muscle spindles and stiffness are modulated from input from the reticular formation, making this a mechanism in line with our conceptual model.

      “Moreover, it has been shown that joint stiffness is reduced during movement compared to holding control (Rack and Westbury, 1974; Bennett et al., 1992). Along similar lines, muscle spindle activity – which may modulate stiffness – scales with extrafusal muscle fiber activity (such as muscle exertion involved in holding) and forces acting through the tendon (Blum et al., 2020). Such observations could, in principle, explain why we were unable to detect a relationship between resting biases and active movement control but we readily found a relationship between resting biases and active holding control: reduced joint stiffness during movement could scale down the influence of resting abnormalities. There are two issues with this explanation, however. First, it is debatable whether this should be considered an alternative explanation per se: stiffness modulation could be, in total or in part, the manifestation of a central movement/posture CST/RST mechanism similar to the one we propose in our conceptual model. For example, (Blum et al., 2020) argue that muscle spindle firing depends on both peripheral and central factors. Second, increased stiffness would not necessarily help detect differences in how active postural control responds to within-resting-posture vs. out-of-resting-posture perturbations. This is because an overall increase in stiffness would likely increase resistance to perturbations in any direction.”

      The authors should provide a limitations paragraph. They should address 1) how they used different perturbation force profiles, 2) the muscles were in different states which would change neuromuscular responses between trial phase / condition, 3) discuss a lack of direct statistical comparisons that support their hypothesis, and 4) provide a couple of paragraphs on classic neurophysiology, such as muscle stiffness and stretch reflexes, and how these various factors could influence the findings (i.e., whether they can disentangle whether the reported results are due to classic neurophysiology, the hypothesis they propose, or both).

      Thank you for your suggestion. We now discuss these points in a separate paragraph (lines 846895), bringing together our previous discussion on stretch reflexes, our description of different perturbation types, and the additional issues raised by the reviewer above.

      Recommendations for the authors:

      Reviewer #1 (Recommendations for the authors):

      The authors have responded well to all my concerns, save two minor points.

      Figure 2 appears to be unchanged, although they describe appropriate changes in the response letter.

      Thank you for catching this error – we now include the updated figure (further updated to use the terms near/distant in place of proximal/distal).

      I still take issue with the use of proximal and distal to describe the locations of targets. Taking definitions somewhat randomly from the internet, "The terms proximal and distal are used in structures that are considered to have a beginning and an end," and "Proximal and distal are anatomical terms used to describe the position of a body part in relation to another part or its origin." In any case, the hand does not become proximal just because you bring it to your chest. Why not simply stick to the common and clearly defined terms "near" and "distant"?

      Point taken. We have updated the paper to use the terms near/distant.

      Additional changes/corrections not outlined above

      We now include a link to the data and code supporting our findings (https://osf.io/hufy8/). In addition, we made several minor edits throughout the text to improve readability, and corrected occasional mislabeling of CCW and CW pulse data. Note that this correction did not alter the (lack of) relationship between resting biases and responses to perturbations during active movement.

      Response letter references

      Bennett D, Hollerbach J, Xu Y, Hunter I (1992) Time-varying stiffness of human elbow joint during cyclic voluntary movement. Exp Brain Res 88:433–442.

      Blum KP, Campbell KS, Horslen BC, Nardelli P, Housley SN, Cope TC, Ting LH (2020) Diverse and complex muscle spindle afferent firing properties emerge from multiscale muscle mechanics. Elife 9:e55177.

      Cramer SC, Nelles G, Benson RR, Kaplan JD, Parker RA, Kwong KK, Kennedy DN, Finklestein SP, Rosen BR (1997) A functional MRI study of subjects recovered from hemiparetic stroke. Stroke 28:2518–2527.

      McPherson JG, Chen A, Ellis MD, Yao J, Heckman C, Dewald JP (2018) Progressive recruitment of contralesional cortico-reticulospinal pathways drives motor impairment post stroke. J Physiol 596:1211–1225 Available at: https://doi.org/10.1113/JP274968.

      Rack PM, Westbury D (1974) The short range stiffness of active mammalian muscle and its effect on mechanical properties. J Physiol 240:331–350.

      Robinson R, Herzog W, Nigg BM (1987) Use of force platform variables to quantify the effects of chiropractic manipulation on gait symmetry. J Manipulative Physiol Ther 10:172–176.

      Williams PE, Goldspink G (1973) The effect of immobilization on the longitudinal growth of striated muscle fibres. J Anat 116:45.

    1. Reviewer #2 (Public review):

      This study aims to disentangle the contribution of sensory and motor processes (mapped onto the inverse and forward components of speech motor control models like DIVA) to production changes as a result of altered auditory feedback. After five experiments, the authors conclude that it is the motor compensation on the previous trial, and not the sensory error, that drives compensatory responses in subsequent trials.

      Assessment:

      The goal of this paper is great, and the question is timely. Quite a bit of work has gone into the study, and the technical aspects are sound. That said, I just don't understand how the current design can accomplish what the authors have set as their goal. This may, of course, be a misunderstanding on my part, so I'll try to explain my confusion below. If it is indeed my mistake, then I encourage the authors to dedicate some space to unpacking the logic in the Introduction, which is currently barely over a page long. They should take some time to lay out the logic of the experimental design and the dependent and independent variables, and how this design disentangles sensory and motor influences. Then clearly discuss the opposing predictions supporting sensory-driven vs. motor-driven changes. Given that I currently don't understand the logic and, consequently, the claims, I will focus my review on major points for now.

      Main issues

      (1) Measuring sensory change. As acknowledged by the authors, making a motor correction as a function of altered auditory feedback is an interactive process between sensory and motor systems. However, one could still ask whether it is primarily a change to perception vs. a change to production that is driving the motor correction. But to do this, one has to have two sets of measurements: (a) perceptual change, and (b) motor change. As far as I understand, the study has the latter (i.e., C), but not the former. Instead, the magnitude of perceptual change is estimated through the proxy of the magnitude of perturbation (P), but the two are not the same; P is a physical manipulation; perceptual change is a psychological response to that physical manipulation. It is theoretically possible that a physical change does not cause a psychological change, or that the magnitude of the two does not match. So my first confusion centers on the absence of any measure of sensory change in this study.

      To give an explicit example of what I mean, consider a study like Murphy, Nozari, and Holt (2024; Psychonomic Bulletin & Review). This work is about changes to production as a function of exposure to other talkers' acoustic properties - rather than your own altered feedback - but the idea is that the same sensory-motor loop is involved in both. When changing the acoustic properties of the input, the authors obtain two separate measures: (a) how listeners' perception changes as a function of this physical change in the acoustics of the auditory signal, and (b) how their production changes. This allows the authors to identify motor changes above and beyond perceptual changes. Perhaps making a direct comparison with this study would help the reader understand the parallels better.

      (2) A more fundamental issue for me is a theoretical one: Isn't a compensatory motor change ALWAYS a consequence of a perceptual change? I think it makes sense to ask, "Does a motor compensation hinge on a previous motor action or is sensory change enough to drive motor compensation?" This question has been asked for changed acoustics for self-produced speech (e.g., Hantzsch, Parrell, & Niziolek, 2022) and other-produced speech (Murphy, Holt, & Nozari, 2025), and in both cases, the answer has been that sensory changes alone are, in fact, sufficient to drive motor changes. A similar finding has been reported for the role of cerebellum in limb movements (Tseng et al., 2007), with a similar answer (note that in that study, the authors explicitly talk about "the addition" of motor corrections to sensory error, not one vs. the other as two independent factors. So I don't understand a sentence like "We found that motor compensation, rather than sensory errors, predicted the compensatory responses in the subsequent trials", which views motor compensations and sensory errors as orthogonal variables affecting future motor adjustments.

      In other words, there is a certain degree of seriality to the compensation process, with sensory changes preceding motor corrections. If the authors disagree with this, they should explain how an alternative is possible. If they mean something else, a comparison with the above studies and explaining the differences in positions would greatly help.

      (3) Clash with previous findings. I used the examples in point 2 to bring up a theoretical issue, but those examples are also important in that all three of them reach a conclusion compatible with one another and different from the current study. The authors do discuss Tseng et al.'s findings, which oppose their own, but dismiss the opposition based on limb vs. articulator differences. I don't find the authors reasoning theoretically convincing here, but more importantly, the current claims also oppose findings from speech motor studies (see citations in point 2), to which the authors' arguments simply don't apply. Strangely, Hantzsch et al.'s study has been cited a few times, but never in its most important capacity, which is to show that speech motor adaptation can take place after a single exposure to auditory error. Murphy et al. report a similar finding in the context of exposure to other talkers' speech.

      If the authors can convincingly justify their theoretical position in 2, the next step would be to present a thorough comparison with the results of the three studies above. If indeed there is no discrepancy, this comparison would help clarify it.

      References

      Hantzsch, L., Parrell, B., & Niziolek, C. A. (2022). A single exposure to altered auditory feedback causes observable sensorimotor adaptation in speech. eLife, 11, e73694.

      Murphy, T. K., Nozari, N., & Holt, L. L. (2024). Transfer of statistical learning from passive speech perception to speech production. Psychonomic Bulletin & Review, 31(3), 1193-1205.

      Murphy, T. K., Holt, L. L. & Nozari, N. (2025). Exposure to an Accent Transfers to Speech Production in a Single Shot. Preprint available at: https://papers.ssrn.com/sol3/papers.cfm?abstract_id=5196109.

      Tseng, Y. W., Diedrichsen, J., Krakauer, J. W., Shadmehr, R., & Bastian, A. J. (2007). Sensory prediction errors drive cerebellum-dependent adaptation of reaching. Journal of neurophysiology, 98(1), 54-62.

    1. <svg xmlns="http://www.w3.org/2000/svg" width="385" height="590" version="1.1"><rect width="1100" height="600" fill="#FFFFFF"/><g transform="translate(192.5,295)"><text text-anchor="middle" transform="translate(-46, -87)" style="font-size: 70px; user-select: none; cursor: default; font-family: Lato; fill: rgb(166, 65, 130);">origo</text><text text-anchor="middle" transform="translate(-19, -7)" style="font-size: 70px; user-select: none; cursor: default; font-family: Lato; fill: rgb(166, 65, 130);">folder</text><text text-anchor="middle" transform="translate(67, 98)" style="font-size: 43px; user-select: none; cursor: default; font-family: Lato; fill: rgb(166, 65, 130);">clues</text><text text-anchor="middle" transform="translate(-57, 31)" style="font-size: 43px; user-select: none; cursor: default; font-family: Lato; fill: rgb(166, 65, 130);">meta</text><text text-anchor="middle" transform="translate(90, 57)" style="font-size: 43px; user-select: none; cursor: default; font-family: Lato; fill: rgb(166, 65, 130);">reflective</text><text text-anchor="middle" transform="translate(-79, 93)" style="font-size: 43px; user-select: none; cursor: default; font-family: Lato; fill: rgb(166, 65, 130);">integral</text><text text-anchor="middle" transform="translate(4, -148)" style="font-size: 43px; user-select: none; cursor: default; font-family: Lato; fill: rgb(59, 50, 115);">autopoietic</text><text text-anchor="middle" transform="translate(-18, 142)" style="font-size: 43px; user-select: none; cursor: default; font-family: Lato; fill: rgb(59, 50, 115);">design</text><text text-anchor="middle" transform="translate(47, 163)" style="user-select: none; cursor: default; font-family: Lato; fill: rgb(59, 50, 115);">word</text><text text-anchor="middle" transform="translate(70, -57)" style="user-select: none; cursor: default; font-family: Lato; fill: rgb(59, 50, 115);">cloud</text><text text-anchor="middle" transform="translate(44, 14)" style="user-select: none; cursor: default; font-family: Lato; fill: rgb(59, 50, 115);">manually</text><text text-anchor="middle" transform="translate(-75, 170)" style="user-select: none; cursor: default; font-family: Lato; fill: rgb(59, 50, 115);">maintained</text><text text-anchor="middle" transform="translate(-40, 52)" style="user-select: none; cursor: default; font-family: Lato; fill: rgb(242, 236, 145);">outline</text><text text-anchor="middle" transform="translate(89, -6)" style="user-select: none; cursor: default; font-family: Lato; fill: rgb(242, 236, 145);">inter</text><text text-anchor="middle" transform="translate(81, -127)" style="user-select: none; cursor: default; font-family: Lato; fill: rgb(242, 236, 145);">related</text><text text-anchor="middle" transform="translate(-40, -187)" style="user-select: none; cursor: default; font-family: Lato; fill: rgb(242, 236, 145);">salient</text><text text-anchor="middle" transform="translate(68, -92)" style="user-select: none; cursor: default; font-family: Lato; fill: rgb(242, 236, 145);">words</text><text text-anchor="middle" transform="translate(124, -27)" style="user-select: none; cursor: default; font-family: Lato; fill: rgb(242, 158, 109);">adjacenses</text><text text-anchor="middle" transform="translate(91, 120)" style="user-select: none; cursor: default; font-family: Lato; fill: rgb(242, 158, 109);">neologism</text><text text-anchor="middle" transform="translate(-125, 119)" style="user-select: none; cursor: default; font-family: Lato; fill: rgb(242, 158, 109);">indwelling</text><text text-anchor="middle" transform="translate(34, -191)" style="user-select: none; cursor: default; font-family: Lato; fill: rgb(242, 158, 109);">gestalt</text><text text-anchor="middle" transform="translate(-100, 55)" style="user-select: none; cursor: default; font-family: Lato; fill: rgb(242, 158, 109);">focal</text><text text-anchor="middle" transform="translate(-113, -191)" style="user-select: none; cursor: default; font-family: Lato; fill: rgb(242, 158, 109);">subsidiary</text><text text-anchor="middle" transform="translate(-74, -212)" style="user-select: none; cursor: default; font-family: Lato; fill: rgb(242, 125, 114);">situational</text><text text-anchor="middle" transform="translate(-107, -69)" style="user-select: none; cursor: default; font-family: Lato; fill: rgb(242, 125, 114);">awareness</text><text text-anchor="middle" transform="translate(96, 185)" style="user-select: none; cursor: default; font-family: Lato; fill: rgb(242, 125, 114);">omni-optional</text><text text-anchor="middle" transform="translate(-43, 193)" style="user-select: none; cursor: default; font-family: Lato; fill: rgb(242, 125, 114);">co-evolutional</text><text text-anchor="middle" transform="translate(16, 211)" style="user-select: none; cursor: default; font-family: Lato; fill: rgb(242, 125, 114);">generative</text></g></svg>

    1. Regular Expressions Notepad++ regular expressions (“regex”) use the Boost regular expression library v1.85 (as of NPP v8.6.6), which was originally based on PCRE (Perl Compatible Regular Expression) syntax, only departing from it in very minor ways. Complete documentation on the precise implementation is to be found on the Boost pages for search syntax and replacement syntax. (Some users have misunderstood this paragraph to mean that they can use one of the regex-explainer websites that accepts PCRE and expect anything that works there to also work in Notepad++; this is not accurate. There are many different “PCRE” implimentations, and Boost itself does not claim to be “PCRE”, though both Boost and PCRE variants have the same origins in an early version of Perl’s regex engine. If your regex-explainer does not claim to use the same Boost engine as Notepad++ uses, there will be differences between the results from your chosen website and the results that Notepad++ gives.) The Notepad++ Community has a FAQ on other resources for regular expressions. Note: Regular expression “backward” search is disallowed due to sometimes surprising results. (For example, in the text to the test they travelled, a forward regex t\w+ will find 5 results; the same regex searching backward will find 17 matches.) If you really need this feature, please see Allow regex backward search to learn how to activate this option. Important Note: Syntax that works in the Find What: box for searching will not always work in the Replace with: box for replacement. There are different syntaxes. The Control Characters and Match by character code syntax work in both; other than that, see the individual sections for Searches vs Substitutions for which syntaxes are valid in which fields. Regex Special Characters for Searches In a regular expression (shortened into regex throughout), special characters interpreted are: Single-character matches . or \C ⇒ Matches any character. If you check the box which says . matches newline, or use the (?s) search modifier, then . or \C will match any character, including newline characters (\r or \n). With the option unchecked, or using the (?-s) search modifier, . or \C only match characters within a line, and do not match the newline characters. Any Unicode character within the Basic Multilingual Plane (BMP) (with a codepoint from U+0000 through U+FFFF) will be matched per these rules. Any Unicode character that is beyond the BMP (with a codepoint from U+10000 through U+10FFFF) will be matched as two separate characters instead, since the “surrogate code” uses two characters. (See the Match by Character Code section for more on how surrogate codes work.) \X ⇒ Matches a single non-combining character followed by any number (zero or more) combining characters. You can think of \X as a “. on steroids”: it matches the whole grapheme as a unit, not just the base character itself. This is useful if you have a Unicode encoded text with accents as separate, combining characters. For example, the letter ǭ̳̚, with four combining characters after the o, can be found either with the regex (?-i)o\x{0304}\x{0328}\x{031a}\x{0333} or with the shorter regex \X (the latter, being generic, matches more than just ǭ̳̚, inluding but not limited to ą̳̄̚ or o alone); if you want to limit the \X in this example to just match a possibly-modified o (so “o followed by 0 or more modifiers”), use a lookahead before the \X: (?=o)\X, which would match o alone or ǭ̳̚, but not ą̳̄̚. \$ , \( , \) , \* , \+ , \. , \? , \[ , \] , \\ , \| ⇒ Prefixing a special character with \ to “escape” the character allows you to search for a literal character when the regular expression syntax would otherwise have that character have a special meaning as a regex meta-character. The characters $ ( ) * + . ? [ ] \ | all have special meaning to the regex engine in normal circumstances; to get them to match as a literal (or to show up as a literal in the substitution), you will have to prefix them with the \ character. There are also other characters which are special only in certain circumstances (any time a character is used with a non-literal meaning throughout the Regular Expression section of this manual); if you want to match one of those sometimes-special characters as literal character in those situations, those sometimes-special characters will also have to be escaped in those situations by putting a \ before it. Please note: if you escape a normal character, it will sometimes gain a special meaning; this is why so many of the syntax items listed in this section have a \ before them. Match by character code It is possible to match any character using its character code. This allows searching for any character, even if you cannot type it into the Find box, or the Find box doesn’t seem to match your emoji that you want to search for. If you are using an ANSI encoding in your document (that is, using a character set like Windows 1252), you can use any character code with a decimal codepoint from 0 to 255. If you are using Unicode (one of the UTF-8 or UTF-16 encodings), you can actually match any Unicode character. These notations require knowledge of hexadecimal or octal versions of the character code. (You can find such character code information on most web pages about ASCII, or about your selected character set, and about UTF-8 and UTF-16 representations of Unicode characters.) \0ℕℕℕ ⇒ A single byte character whose code in octal is ℕℕℕ, where each ℕ is an octal digit. (That’s the number 0, not the letter o or O.) This notation works for for codepoints 0-255 (\0000 - \0377), which covers the full ANSI character set range, or the first 256 Unicode characters. For example, \0101 looks for the letter A, as 101 in octal is 65 in decimal, and 65 is the character code for A in ASCII, in most of the character sets, and in Unicode. \xℕℕ ⇒ Specify a single character with code ℕℕ, where each ℕ is a hexadecimal digit. What this stands for depends on the text encoding. This notation works for codepoints 0-255 (\x00 - \xFF), which covers the full ANSI character set range, or the first 256 Unicode characters. For instance, \xE9 may match an é or a θ depending on the character set (also known as the “code page”) in an ANSI encoded document. These next two only work with Unicode encodings (so the various UTF-8 and UTF-16 encodings): \x{ℕℕℕℕ} ⇒ Like \xℕℕ, but matches a full 16-bit Unicode character, which is any codepoint from U+0000 to U+FFFF. \x{ℕℕℕℕ}\x{ℕℕℕℕ} ⇒ For Unicode characters above U+FFFF, in the range U+10000 to U+10FFFF, you need to break the single 5-digit or 6-digit hex value and encode it into two 4-digit hex codes; these two codes are the “surrogate codes” for the character. For example, to search for the 🚂 STEAM LOCOMOTIVE character at U+1F682, you would search for the surrogate codes \x{D83D}\x{DE82}. If you want to know the surrogate codes for a given character, search the internet for “surrogate codes for character” (where character is the fancy Unicode character you need the codes for); the surrogate codes are equivalent to the two-word UTF-16 encoding for those higher characters, so UTF-16 tables will also work for looking this up. Any site or tool that you are likely to be using to find the U+###### for a given Unicode character will probably already give you the surrogate codes or UTF-16 words for the same character; if not, find a tool or site that does. You can also compute surrogate codes yourself from the character code, but only if you are comfortable with hexadecimal and binary. Skip the following bullets if you are prone to mathematics-based PTSD. Start with your Unicode U+######, calling the hexadecimal digits as PPWXYZ. The PP digits indicate the plane. subtract one and convert to the 4 binary bits pppp (so PP=01 becomes 0000, PP=0F becomes 1110, and PP=10 becomes 1111) Convert each of the other digits into 4 bits (W as wwww, X as xxvv, Y as yyyy, and Z as zzzz; you will see in a moment why two different characters are used in xxvv) Write those 20 bits in sequence: ppppwwwwxxvvyyyyzzzz Group into two equal groups: ppppwwwwxx and vvyyyyzzzz (you can see that the X ⇒ xxvv was split between the two groups, hence the notation) Before the first group, insert the binary digits 110110 to get 110110ppppwwwwxx, and split into the nibbles 1101 10pp ppww wwxx. Convert those nibbles to hex: it will give you a value from \x{D800} thru \x{DBFF}; this is the High Surrogate code Before the second group, insert the binary digits 110111 to get 110111vvyyyyzzzz, and split into the nibbles 1101 11vv yyyy zzzz. Convert those nibbles to hex: it will give you a value from \x{DC00} thru \x{DFFF}; this is the Low Surrogate code Combine those into the final \x{ℕℕℕℕ}\x{ℕℕℕℕ} for searching. For more on this, see the Wikipedia article on Unicode Planes, and the discussion in the Notepad++ Community Forum about how to search for non-ASCII characters Collating Sequences [[._col_.]] ⇒ The character the col “collating sequence” stands for. For instance, in Spanish, ch is a single letter, though it is written using two characters. That letter would be represented as [[.ch.]]. This trick also works with symbolic names of control characters, like [[.BEL.]] for the character of code 0x07. See also the discussion on character ranges. Control characters \a ⇒ The BEL control character 0x07 (alarm). \b ⇒ The BS control character 0x08 (backspace). This is only allowed inside a character class definition. Otherwise, this means “a word boundary”. \e ⇒ The ESC control character 0x1B. \f ⇒ The FF control character 0x0C (form feed). \n ⇒ The LF control character 0x0A (line feed). This is the regular end of line under Unix systems. \r ⇒ The CR control character 0x0D (carriage return). This is part of the DOS/Windows end of line sequence CR-LF, and was the EOL character on Mac 9 and earlier. OSX and later versions use \n. \t ⇒ The TAB control character 0x09 (tab, or hard tab, horizontal tab). \c☒ ⇒ The control character obtained from character ☒ by stripping all but its 5 lowest order bits. For instance, \cA and \ca both stand for the SOH control character 0x01. You can think of this as “\c means ctrl”, so \cA is the character you would get from hitting Ctrl+A in a terminal. (Note that \c☒ will not work if ☒ is outside of the Basic Multilingual Plane (BMP) – that is, it only works if ☒ is in the Unicode character range U+0000 - U+FFFF. The intention of \c☒ is to mnemonically escape the ASCII control characters obtained by typing Ctrl+☒, it is expected that you will use a simple ASCII alphanumeric for the ☒, like \cA or \ca.) Special Control escapes \R ⇒ Any newline sequence. Specifically, the atomic group (?>\r\n|\n|\x0B|\f|\r|\x85|\x{2028}|\x{2029}). Please note, this sequence might match one or two characters, depending on the text. Because its length is variable-width, it cannot be used in lookbehinds. Because it expands to a parentheses-based group with an alternation sequence, it cannot be used inside a character class. If you accidentally attempt to put it in a character class, it will be interpreted like any other literal-character escape (where \☒ is used to make sure that the next character is literal) meaning that the R will be taken as a literal R, without any special meaning. For example, if you try [\t\R]: you may be intending to say, “match any single character that’s a tab or a newline”, but what you are actually saying is “match the tab or a literal R”; to get what you probably intended, use [\t\v] for “a tab or any vertical spacing character”, or [\t\r\n] for “a tab or carriage return or newline but not any of the weird verticals”. Ranges or kinds of characters Character Classes [_set_] ⇒ This indicates a set of characters, for example, [abc] means any of the literal characters a, b or c. You can also use ranges by putting a hyphen between characters, for example [a-z] for any character from a to z. You can use a collating sequence in character ranges, like in [[.ch.]-[.ll.]] (these are collating sequences in Spanish). Certain characters require special treatment inside character classes: To use a literal - in a character class: Use it directly as the first or last character in the enclosing class notation, like [-abc] or [abc-]; OR use it “escaped” at any position, like [\-abc] or [a\-bc] . To use a literal ] in a character class: Use it directly right after the opening [ of the class notation, like []abc]; OR use it “escaped” at any position, like [\]abc] or [a\]bc] . To use a literal [ in a character class: Use it directly like any other character, like [ab[c]; “escaping” is not necessary, but is permissible, like [ab\[c] . This character is not special when used alone inside a class; however, there are cases where it is special in combination with another: If used with a colon in the order [: inside a class, it is the opening sequence for a named class (described below); if you want to include both a [ and a : inside the same character class, do not use them unescaped right next to each other; either change the order, like [:[], or escape one or both, like [\[:] or [[\:] or [\[\:] . If used with an equals sign in the order [= inside a class, it is the opening sequence for an equivalence class (described below); if you want to include both a [ and a = inside the same character class, do not use them unescaped right next to each other; either change the order, like [=[], or escape one or both, like [\[=] or [[\=] or [\[\=] . To use a literal \ in a character class, it must be doubled (i.e., \\) inside the enclosing class notation, like [ab\\c] . To use a literal ^ in a character class: Use it directly as any character but the first, such as [a^b] or [ab^]; OR use it “escaped” at any position, such as [\^ab] or [a\^b] or [ab\^] . [^_set_] ⇒ The complement of the characters in the set. For example, [^A-Za-z] means any character except an alphabetic character. Care should be taken with a complement list, as regular expressions are always multi-line, and hence [^ABC]* will match until the first A, B or C (or a, b or c if match case is off), including any newline characters. To confine the search to a single line, include the newline characters in the exception list, e.g. [^ABC\r\n]. [[:_name_:]] or [[:☒:]] ⇒ The whole character class named name. For many, there is also a single-letter “short” class name, ☒. Please note: the [:_name_:] and [:☒:] must be inside a character class [...] to have their special meaning. short full name description equivalent character class alnum letters and digits alpha letters h blank spacing which is not a line terminator [\t\x20\xA0] cntrl control characters [\x00-\x1F\x7F\x81\x8D\x8F\x90\x9D] d digit digits graph graphical character, so essentially any character except for control chars, \0x7F, \x80 l lower lowercase letters print printable characters [\s[:graph:]] punct punctuation characters [!"#$%&'()*+,\-./:;<=>?@\[\\\]^_{\|}~] s space whitespace (word or line separator) [\t\n\x0B\f\r\x20\x85\xA0\x{2028}\x{2029}] u upper uppercase letters unicode any character with code point above 255 [\x{0100}-\x{FFFF}] w word word characters [_\d\l\u] xdigit hexadecimal digits [0-9A-Fa-f] Note that letters include any unicode letters (ASCII letters, accented letters, and letters from a variety of other writing systems); digits include ASCII numeric digits, and anything else in Unicode that’s classified as a digit (like superscript numbers ¹²³…). Note that those character class names may be written in upper or lower case without changing the results. So [[:alnum:]] is the same as [[:ALNUM:]] or the mixed-case [[:AlNuM:]]. As stated earlier, the [:_name_:] and [:☒:] (note the single brackets) must be a part of a surrounding character class. However, you may combine them inside one character class, such as [_[:d:]x[:upper:]=], which is a character class that would match any digit, any uppercase, the lowercase x, and the literal _ and = characters. These named classes won’t always appear with the double brackets, but they will always be inside of a character class. If the [:_name_:] or [:☒:] are accidentally not contained inside a surrounding character class, they will lose their special meaning. For example, [:upper:] is the character class matching :, u, p, e, and r; whereas [[:upper:]] is similar to [A-Z] (plus other unicode uppercase letters) [^[:_name_:]] or [^[:☒:]] ⇒ The complement of character class named name or ☒ (matching anything not in that named class). This uses the same long names, short names, and rules as mentioned in the previous description. Character classes may not contain parentheses-based groups of any kind, including the special escape \R (which expands to a parentheses-based group when evaluated, even though \R doesn’t look like it contains parentheses). Character Properties These properties behave similar to named character classes, but cannot be contained inside a character class. \p☒ or \p{_name_} ⇒ Same as [[:☒:]] or [[:_name_:]], where ☒ stands for one of the short names from the table above, and name stands for one of the full names from above. For instance, \pd and \p{digit} both stand for a digit, just like the escape sequence \d does. \P☒ or \P{_name_} ⇒ Same as [^[:☒:]] or [^[:_name_:]] (not belonging to the class name). Character escape sequences \☒ ⇒ Where ☒ is one of d, w, l, u, s, h, v, described below. These single-letter escape sequences are each equivalent to a class from above. The lower-case escape sequence means it matches that class; the upper-case escape sequence means it matches the negative of that class. (Unlike the properties, these can be used both inside or outside of a character class.) Description Escape Sequence Positive Class Negative Escape Sequence Negative Class digits \d [[:digit:]] \D [^[:digit:]] word chars \w [[:word:]] \W [^[:word:]] lowercase \l [[:lower:]] \L [^[:lower:]] uppercase \u [[:upper:]] \U [^[:upper:]] word/line separators \s [[:space:]] \S [^[:space:]] horizontal space \h [[:blank:]] \H [^[:blank:]] vertical space \v see below \V Vertical space: This encompasses all the [[:space:]] characters that aren’t [[:blank:]] characters: The LF, VT, FF, CR , NEL control characters and the LS and PS format characters: 0x000A (line feed), 0x000B (vertical tabulation), 0x000C (form feed), 0x000D (carriage return), 0x0085 (next line), 0x2028 (line separator) and 0x2029 (paragraph separator). There isn’t a named class which matches. Note: despite its similarity to \v, even though \R matches certain vertical space characters, it is not a character-class-equivalent escape sequence (because it evaluates to a parentheses()-based expression, not a class-based expression). So while \d, \l, \s, \u, \w, \h, and \v are all equivalent to a character class and can be included inside another bracket[]-based character class, the \R is not equivalent to a character class, and cannot be included inside a bracketed[] character-class. Equivalence Classes [[=_char_=]] ⇒ All characters that differ from char by case, accent or similar alteration only. For example [[=a=]] matches any of the characters: A, À, Á, Â, Ã, Ä, Å, a, à, á, â, ã, ä and å. Multiplying operators + ⇒ This matches 1 or more instances of the previous character, as many as it can. For example, Sa+m matches Sam, Saam, Saaam, and so on. [aeiou]+ matches consecutive strings of vowels. * ⇒ This matches 0 or more instances of the previous character, as many as it can. For example, Sa*m matches Sm, Sam, Saam, and so on. ? ⇒ Zero or one of the last character. Thus Sa?m matches Sm and Sam, but not Saam. *? ⇒ Zero or more of the previous group, but minimally: the shortest matching string, rather than the longest string as with the “greedy” operator. Thus, m.*?o applied to the text margin-bottom: 0; will match margin-bo, whereas m.*o will match margin-botto. +? ⇒ One or more of the previous group, but minimally. {ℕ} ⇒ Matches ℕ copies of the element it applies to (where ℕ is any decimal number). {ℕ,} ⇒ Matches ℕ or more copies of the element it applies to. {ℕ,ℙ} ⇒ Matches ℕ to ℙ copies of the element it applies to, as much it can (where ℙ ≥ ℕ). {ℕ,}? or {ℕ,ℙ}? ⇒ Like the above, but minimally. *+ or ?+ or ++ or {ℕ,}+ or {ℕ,ℙ}+ ⇒ These so called “possessive” variants of greedy repeat marks do not backtrack. This allows failures to be reported much earlier, which can boost performance significantly. But they will eliminate matches that would require backtracking to be found. As an example, see how the matching engine handles the following two regexes: When regex “.*” is run against the text “abc”x : `“` matches `“` `.*` matches `abc”x` `”` doesn't match ( End of line ) => Backtracking `.*` matches `abc”` `”` doesn't match letter `x` => Backtracking `.*` matches `abc` `”` matches `”` => 1 overall match `“abc”` When regex “.*+”, with a possessive quantifier, is run against the text “abc”x : `“` matches `“` `.*+` matches `abc”x` ( catches all remaining characters ) `”` doesn't match ( End of line ) Notice there is no match at all in this version, because the possessive quantifier prevents backtracking to a possible solution. Anchors Anchors match a zero-length position in the line, rather than a particular character. ^ ⇒ This matches the start of a line (except when used inside a set, see above). $ ⇒ This matches the end of a line. \< ⇒ This matches the start of a word using Boost’s definition of words. \> ⇒ This matches the end of a word using Boost’s definition of words. \b ⇒ Matches either the start or end of a word. \B ⇒ Not a word boundary. It represents any location between two word characters or between two non-word characters. \A or \` ⇒ Matches the start of the file. \z or \' ⇒ Matches the end of the file. \Z ⇒ Matches like \z with an optional sequence of newlines before it. This is equivalent to (?=\v*\z), which departs from the traditional Perl meaning for this escape. \G ⇒ This “Continuation Escape” matches the end of the previous match, or matches the start of the text being matched if no previous match was found. In Find All or Replace All circumstances, this will allow you to anchor your next match at the end of the previous match. If it is the first match of a Find All or Replace All, and any time you use a single Find Next or Replace, the “end of previous match” is defined to be the start of the search area – the beginning of the document, or the current caret position, or the start of the highlighted text. Because of that, if you are using it in an alternation, where you want to say “find any occurrence of something after some prefix, or after a previous match), you will want to make sure that your prefix includes the start-of-file \A, otherwise the \G portion may accidentally match start-of-file when you don’t want that to occur. Capture Groups and Backreferences (_subset_) ⇒ Numbered Capture Group: Parentheses mark a part of the regular expression, also known as a subset expression or capture group. The string matched by the contents of the parentheses (indicated by subset in this example) can be re-used with a backreference or as part of a replace operation; see Substitutions, below. Groups may be nested. (?<name>_subset_) or (?'name'_subset_) ⇒ Named Capture Group: Names the value matched by subset as the group name. Please note that group names are case-sensitive. \ℕ, \gℕ, \g{ℕ}, \g<ℕ>, \g'ℕ', \kℕ, \k{ℕ}, \k<ℕ> or \k'ℕ' ⇒ Numbered Backreference: These syntaxes match the ℕth capture group earlier in the same expression. (Backreferences are used to refer to the capture group contents only in the search/match expression; see the Substitution Escape Sequences for how to refer to capture groups in substitutions/replacements.) A regex can have multiple subgroups, so \2, \3, etc. can be used to match others (numbers advance left to right with the opening parenthesis of the group). You can have as many capture groups as you need, and are not limited to only 9 groups (though some of the syntax variants can only reference groups 1-9; see the notes below, and use the syntaxes that explicitly allow multi-digit ℕ if you have more than 9 groups) Example: ([Cc][Aa][Ss][Ee]).*\1 would match a line such as Case matches Case but not Case doesn't match cASE. \ℕ ⇒ This form can only have ℕ as digits 1-9, so if you have more than 9 capture groups, you will have to use one of the other numbered backreference notations, listed in the next bullet point. Example: the expression \10 matches the contents of the first capture group \1 followed by the literal character 0”, not the contents of the 10th group. \gℕ, \g{ℕ}, \g<ℕ>, \g'ℕ', \kℕ, \k{ℕ}, \k<ℕ> or \k'ℕ' ⇒ These forms can handle any non-zero ℕ. For positive ℕ, it matches the ℕth subgroup, even if ℕ has more than one digit. \g10 matches the contents from the 10th capture group, not the contents from the first capture group followed by the literal 0. If you want to match a literal number after the contents of the ℕth capture group, use one of the forms that has braces, brackets, or quotes, like \g{ℕ} or \k'ℕ' or \k<ℕ>: For example, \g{2}3 matches the contents of the second capture group, followed by a literal 3, whereas \g23 would match the contents of the twenty-third capture group. For clarity, it is highly recommended to always use the braces or brackets form for multi-digit ℕ For negative ℕ, groups are counted backwards relative to the last group, so that \g{-1} is the last matched group, and \g{-2} is the next-to-last matched group. Please, note the difference between absolute and relative backreferences. For instance, an exact four-letters word palindrome can be matched with : the regex (?-i)\b(\w)(\w)\g{2}\g{1}\b, when using absolute (positive) coordinates the regex (?-i)\b(\w)(\w)\g{-1}\g{-2}\b, when using relative (negative) coordinates \g{name}, \g<name>, \g'name', \k{name}, \k<name> or \k'name' ⇒ Named Backreference: The string matching the subexpression named name. (As with the Numbered Backreferences above, these Named Backreferences are used to refer to the capture group contents only in the search/match expression; see the Substitution Escape Sequences for how to refer to capture groups in substitutions/replacements.)

      regular expression

    1. Note: This response was posted by the corresponding author to Review Commons. The content has not been altered except for formatting.

      Learn more at Review Commons


      Reply to the reviewers

      Overall Response.

      We would like to thank the reviewers for their analysis of the manuscript. From their comments it is clear that our manuscript was not. We completely rewrote the manuscript to focus on the central core question which was how does Adam13 regulates gene expression in general and TFap2a in particular leading to the expression of Calpain8 a protein required for CNC migration.

      The following model will be the central line of our story. It will address all of the proteins involved and mechanistical evidences that link Adam13 to one of its proven effector target Calpain8.

      • *

      *Reviewer #1 (Evidence, reproducibility and clarity (Required)): **

      In this manuscript, Pandey et al. show that the ADAM13 protein modulates histone modifications in cranical neural crest and that the Arid3a protein binds the Tfap2a promoter in an Adam13-dependent manner and has promoter-specific effects on transcription. Furthermore, they show that the Adam13 and human ADAM9 proteins associated with histone modifiers as well as proteins involved in RNA splicing. Although the manuscript is mostly clearly written and the figures well assembled, it reads like a couple of separate and unfinished stories.*

      I believe that our story line was not clear and that the overarching questions was not well stated. We have made every effort to change this in the revised manuscript. I would like to include a figure that explains the story.

      In short:

      1 We knew that Adam13 could regulate gene expression in CNC via its cytoplasmic domain.

      2 We also knew that this required Adam13 interaction with Arid3a and that a direct target with the transcription factor TFAP2a which in turn regulates functional targets that we had identified including the protocadherin PCNS and the protease Calpain8.

      Our goal was to understand the mechanism allowing Adam13 to regulate gene expression.

      3 This first part of this manuscript shows how Adam13 modulates Histone modification in vivo in the CNC globally as well as specifically on the Tfap2a promoter. This results I an Open chromatin.

      4 Using Chip we show that Adam13 and Arid3a both bind to the Tfap2a promoter and that Arid3a binding to the first ATG depends on Adam13.

      5 Using Luciferase reporter we show that both Adam13 and Arid3a can induce expression at the first ATG.

      *They show using immunocytochemistry and qPCR that ADAM13 knockouts in CNCs afffects histone modifications. Here ChIP-seq or Cut-n-Run experiments would be more appropriate and would result in a more comprehensive understanding of the changes mediated. *

      I agree but we did not have the fund and now I have nobody working in the lab to do this experiment. These are also likely to overlap with the RNAseq data that we have and would simply add more open leads. We selected to go after the only direct target that we know which is TFAP2a and focus on this gene to understand the mechanism.

      We believe that the Chip PCR experiment are sufficient for this story.

      *The immunohistochemistry assays should at least be verified further using western blotting or other more quantiative methods. *

      Immunofluorescence and statistical analysis is a valid quantification method. Western blot of CNC explants is not trivial and requires a large amount of material. Given the small overall change we also would not expect to be able to detect the change over the noise of western blot. The Chip PCR confirms our finding in a completely independent manner.

      *The authors then show that ADAM13 interacts with a number of histone modifiers such as KDM3B, KDM4B and KMT2A but strangely they do not follow up this interesting observation to map the interactions further (apart from a co-ip with KMT2A), the domains involved, the functional role of the interactions or how they mediate the changes in chromatin modifications. *

      We selected KMT2a because it is expressed in the Hek293T cells. KMT2D has been shown to regulate CNC development in Xenopus and is responsible for the Kabuki syndrome in human. We used aphafold to predict interaction and found that Adam13 interact with the Set domain. In addition we see multiple Set- containing domain protein in our mass spec data. The mass spec is done on Human hek293T cells that express a subset of KMT proteins. We now include evidence that Adam13 interact with the KMT2D SET domain (new figure 5D)

      The authors then show that ADAM13 affects expression of the TFAP2a gene in a promoter specific manner - affecting expression from S1 but not S2.

      It is the S1 but not S3. Adam13 has no effect on S2.

      • They further show that ADAM13 affects the binding of the Arid3 transcription fator to the S1-promoter but not to the S3 promoter. However, ADAM13 was present at both promoters. Absence of ADAM13 resulted in increased H3K9me2/3 and decreased H3K4me3 at the S1 promoter whereas only H3K4me3 was changed at the S2 promoter*

      S3 not S2*. Unfortunately, they do not show how this is mediated or through which binding elements this takes place. Why is ADAM13 present at both promoters but only affects Arid3 binding at S1? *

      We agree this is a very interesting question that could be the subject of an entire publication. Promoter deletion and mutation to identify which site are bound by and modulated by Adam13/Arid3a is not trivial.

      *The authors claim that transfecting Arid3a and Adam13 together further increases expression from a reporter (Fig 4E) but this is not true as no statistical comparison is done between the singly transfected and double transfected cells. *

      This is correct, there is a small increase that is not significant with both. The fact that both proteins can induce the promoter suggest but does not prove that they can have additive roles. The loss of function experiment shows that the human Arid3a expressed in Hek293T cells is important for Adam13 increases of S1. It is possible that the dose of the endogenous Arid3a is sufficient to get full activity of Adam13.* Then the authors surprisingly start investigating association of proteins with the two isoforms of TFAP2a which in the mind of this reviewer is a different question entirely. *

      We agree and have removed this part of the manuscript.

      *They find a number of proteins involved in splicing. And the observation that ADAM13 also interacts with splicing factors is really irrelevant in terms of the story that they are trying to tell. Transcription regulation and splicing are different processes and although both affect the final outcome, mRNA, they need to be investigated separately. The link is at least not very clear from the manuscript. Again, the effects on splicing are not further investigated through functional analysis and as presented the data presented is too open-ended and lacking in clarity. *

      We agree that beside the different activities of the TFap2a isoform, the rest of the splicing regulation could be a separate study. We were interested to understand how these two isoforms could activate Calpain8 so differently this is why we looked at LC/MS/MS. We have removed this part of the story from the manuscript.*

      Additional points: 1. In the abstract they propose that the ADAMs may act as extracellular sensors. This is not substantiated by the results. *

      As an extracellular protein translocating into the nucleus it is a possibility that we propose, but I agree this is not investigated in this manuscript. We will modify the text.* 2. Page 5, line 16: what is referred to by 6 samples 897 proteins? Were 6 samples analyzed for each condition? The number of repeats for the mass spec analysis is not clear from the text nor are the statistical parameters used to analyse the data. This is also true for the mass spec presented in the part on TFAP2aL-S1 and Adam13 regulate splicing. Statistics and repeats are not presented. *

      In general we provide biological triplicate and use the statistical function of Scaffold to identify proteins that are significantly enriched or absent in each samples.

      When we specify 6 samples it means 6 independent proteins samples were analyzed and used for our statistic. We use Scafold T-test with a p value less than 0.05. Peptides were identified with 95% confidence and proteins with 99% confidence.* 3. Page 6, line 19: set domain should be SET domain. *

      Yes* 4. The number of repeats in the RNA sequencing of the CNCs is not clear from the text. *

      Three biological replicates (Different batch of embryos from different females).* 5. The explanation of Figure C is a bit lacking. There are two forms of TFAP2a, L and S, but only one is presented in the figure. Do both forms have the extra S1-3 exons? Also, at the top of the figure it is not clear that the boxes are part of a continuous DNA sequence. Also, it is not clear which codon is not coding. *

      Xenopus laevis are pseudo tetraploid giving in most cases L and S genes in addition to the 2 alleles from being diploid. The TFAP2a gene structure is conserved between both aloalleles and is similar to the human gene. For promoter analysis and Chip PCR we chose one of the alloallele (L), given that the RNAseq data showed that both genes and variant behave the same in response to Adam13. This only becomes important in loss of function experiment in which both L and S version need to be knock down or Knock out.

      * In the sashimi plot there are green and pink shaded areas. What do they denote? What exactly is lacking in the MO13 mutant - seems that a particular exon is missing suggesting skipping?*

      MO13 is a morpholino that bocks the translation of Adam13 (Already characterized with >90% of the protein absent) but does not affect Adam13 mRNA expression.* 7. Page 11, line 9: „with either MbC or MbC and MO13" needs to be rephrased. *

      Will do *8. Page 11, line 19: „the c-terminus of....and S3) and" should be „the C-terminus of...and S3 and". ** 9. Page 15, line 10: substrateS 10. Page 16, line 23: the sentence „increases H3K9 to the promoter of the most upstream" needs revision. 11. Page 26, line 12: Here the authors say: „for two samples two-tail unpaired". What does this mean? Statistics should not be performed on fewer than three samples. In legnd to Figure 6 it indicates that T-test was performed on two samples. 12. The discussion should be shortened and simplified. 13. Figure 1 legend. How many images were quantitated for each condition? *

      At least 3 images per condition. For 3 independent experiments. (9 images per condition).* 14. Figure 2 has a strange order of panels where G is below B. 15. Figure 6 legend, line 12. „proteins that were significantly enriched in either of the 2 samples" is not very clear. What exactly does this mean?

      Reviewer #1 (Significance (Required)):

      If the authors follow up on either the transcription-part of the story, or the splicing part of the story, they are likely to have important results to present. However, in the present format the paper is lacking in focus as both issues are mixed together without a clear end-result. *

      We have entirely changed the paper according to these comments.

      *

      • *

      *Reviewer #2 (Evidence, reproducibility and clarity (Required)): **

      Panday et al seeks to determine the function of ADAM13 in regulating histone modifications, gene expression and splicing during cranial neural crest development. Specifically, the authors tested how Adam13, a metalloprotease, could modify chromatin by interaction with Arid3a and Tfap2a and RNA splicing and gene expression. They then utilize knockouts in Xenopus and HEK293T cells followed by immunofluorescence, IPs, BioID, luciferase assays, Mass spec and RNA assays. Although there is some strong data in the BioID and luciferase experiments, the manuscript tells multiple stories, linking together too many things to make a compelling story. The result is a paper that is very difficult to read and understand the take home message. In addition, some of the conclusions are not supported by the data. This unfortunately means it is not ready for publication. However, I have added below some suggestions that would strengthen the manuscript. My comments are below: *

      Clarity is clearly an issue here. The new version is entirely re-written.

      Here is the take home message:

      We knew that Adam13 could regulate gene expression via its cytoplasmic domain. One of the key targets was identified as Calpain8, a protein critical for CNC migration. We subsequently showed that Adam13 and Arid3a regulated Tfap2a expression which in turn regulated Calpain8.

      In this manuscript we investigated 1) how Adam13 regulates TFAP2a and 2) how Tfap2a controls Calpain8 expression.

      The take home message is that Adam13 bind to Histone methyl transferase and changes the histone methylation code overall in the CNC and in particular at the TFAP2a promoter. This results in more open chromatin. We further find that Adam13 binds to the Tfap2a promoter in vivo and is important for Arid3a binding to the first start. Tfap2a that include this N-terminus sequence regulates Capn8 expression.*

      Major comments: 1. I think it would be better to split out the chromatin modification function from the splicing in two separate papers. While there is a connection, having it all together makes the story difficult to follow. *

      Agree but I believe that the S1 vs S3 story of Tfap2a is important for the overall story. The new paper does not emphasize splicing.* 2. The immunofluorescence of H3K9me2/3, in Figure 1, 2, 3 following Adam13 knockdown is not convincing. There seems to be a strong edge effect especially in Figure 2 and 3. *

      The statistical analysis shows that the results, while modest, are significant (Three independent experiments using 3 different females and 3 explants for each condition were analyzed). The edge effect observed is eliminated by the mask that we use that normalize the expression to either DAPI or Snai2. The edge effect is seen in both control and KD as well. These are further confirmed by the Chip PCR on one direct target.

      Similarly the Arid3a expression in Supp Figure 1 if anything seems increased.

      We have previously shown that Arid3a expression is not affected by Adam13 KD (Khedgikar et al). Our point here is simply that the difference in Tfap2a cannot be explained by a decrease in Arid3a expression. It is not a critical figure and was eliminated in the new manuscript.

      *It would be better to quantify by western blot and not by fluorescent intensity since it is difficult to determine what a small change in fluorescent intensity means in vivo. *

      Not all antibodies used here work by western blot and the quantity of material required for western blot is much larger than IF. Given the small overall changes and the variability observed in Western blot it is not a viable alternative.

      IF is a quantitative method that has been used widely to assert increase or decrease of protein level or post translational modification. The fact that the same post translational modification that we see in cranial neural crest explants can also be seen by ChipPCR on the Tfap2a promoter confirm this observation.

      *Also, it does not say in the text or the figure legend what these are, Xenopus explants of CNC? *

      These are CNC explants. It is now clearly stated in the figure legend.* 3. The rationale for isolating KMT2A from the other chromatin modifiers in the dataset is not clear. *

      The new manuscript is clarifying that point. Because we are using Hek293T cells in this assay, which are human embryonic kidney derived instead of Xenopus Cranial neural crest cells, we are not interested in a specific protein but rather a family of protein that can modify histones (KMT and KDM). Our rational is if Adam13 can bind to KMT2 via the SET domain, it is likely to interact with KTM2 that are expressed in the CNC. KMT2A and D are expressed in the CNC. This is why we selected KMT2a here (Hek293T). We now include 1 co-IP with the Set domain of Xenopus KMT2D (new figure 5D)

      From the RNA-seq in Supp Figure 2 it is not changed as much as likely some of the others.

      The new manuscript addresses this point. We did not show or expect that the loss of Adam13 would affect mRNA expression of Kmt2.

      *Also, the arrow seems to indicate that it is right above the cutoff. What about other proteins with ATPase activity? That is the top hit in the Dot plot nuclear function. Would be helpful to write out Adam13 cytoplasm/nucleus here. *

      We have used another set of proteomics data that does not include the cytoplasmic/nuclear extract to simplify the results. We hope that the changes make it more obvious.

      Given that we are looking at Chromatin remodeling enzyme here we did not chose to investigate further in this report the ATPase. This is such a wide category that it could lead us away from the main story here.* 4. The splicing information, while interesting would be better as a different manuscript. The sashimi plot requires more explanation as written. *

      We agree and think that a simple representation of the fold change of the different isoform is more obvious. It is now a minor part of figure 1 and the legend has been improved to describe the method here.

      How do you tell if the interactions are changed from this?

      I do not understand this question. The sashimi plot indicate the read through from the mRNA that goes from one exon to the next quantifying the specific exon usage. It can therefore be quantified and compared between different conditions.

      • The authors argue there is a reduction of Tfap2a in Figure 3H but half the explant is not expressing sox9 in the Adam13 knockdown. How is this kind of experiment controlled when measure areas that don't have any fluorescence because of the nature of the explants? *

      We have removed this figure as we had already shown previously by western blot that Tfap2a protein decreased in MO13 embryos. As noted on the histogram, the fluorescence is only measured in Sox9 positive cells in each explant. Three independent experiments with 3 explants for each. We also have seen a decrease by Western blot and mRNA expression (Both RNAseq and realtime PCR). In most of our explants, the vast majority of the cells are positive for Snai2 and Sox9, while those that are negative are positive for Sox3 (data not shown here). There is always less signal in the center of the explant possibly due to the penetration of antibody or interference with the signal by the cells pigment or yolk autofluorescence. Our control explants have the same effect so our quantification is valid.* 5. The use of a germ line Xenopus mutant for Adam13 is great but how were these knockouts validated? *

      All of the KO were validated by sequencing, RNAseq and protein expression. These are now included in the supplemental figure 1.

      *More information is required here. The Chip-qPCR has a lot of variability between the samples, especially in the H3K9me2/3. *

      All ChipPCR were performed on Xenopus embryos. The variability is tested by statistical analysis and is either significant or not.

      Because these are in cell lines, this should be more consistent.

      They are not in cell lines but in Xenopus embryos.

      • In addition, it is difficult to understand what this means for cranial neural crest cells when assaying in HEK293T cells with the luciferase assay. *

      We use Luciferase assay in Hek293T cells to test if Xenopus protein can induce a specific reporter (Gain of function). We also use luciferase reporter in Xenopus to test if they can perceive the loss of a specific protein (For example Adam13).

      Our result show that Adam13 or Arid3a expression in Hek293T cells can induce the TFAP2S1 reporter. * 6. The migration assay shows only an example of what it looks like to have defective migration. But it would be better to show control embryos, embryos with Adam13 knockdown and what the rescues look like so the reader can make their own conclusion.*

      We can certainly include this but have published this assay in multiple publication before. The picture is a single example, the histogram shows that statistical validation.

      • The argument from the section above suggests the S1 isoform is the primary one but S3 in this assay also rescues, please explain what this result means since it seems to suggest that even though these isoforms have different activity the function is similar in terms of the ability to rescue defective migration. *

      The result in Hek293T cells shows that only TFAP2aS1 can induce Calpain8, while both S1 and S3 can partially rescue CNC migration in embryos lacking Adam13. The issue here is the dose of mRNA injected for each variant might be too high. Adam13 proteolytic activity is also critical, so we do not expect a complete rescue. The fact that S1 is significantly better at rescuing than S3 is relevant here. It is possible that if we were to decrease the dose of each mRNA we would find one in which S3 no longer rescues but S1 does.

      * The next section again talks about yet another protein Calpain-8. Here the authors use MO13 for luciferase assays instead of HEK293 cells. The authors do not explain why they decided to switch from cells to MO.*

      Calpain8 is one of the validate target of Adam13 that can rescue CNC migration (Cousin et al Dev Cell). We use the luciferase reporter corresponding to the Xenopus Capn8 reporter to show 1 in vivo that loss of Adam13 reduce its expression (Similar to the Capn8 gene). We then went in vitro using Hek293T cells for gain of function experiment that shows that only the Tfaps2S1 variant can induce it while S3 does not.

      We hope that the graphical summary and the new manuscript make this clear.* 8. The experiment to IP RNA supports only the correlation that Adam9 and Adam13 bind RNA and RNA binding proteins to regulate splicing. This conclusion presented is not supported by the data presented here. While there is a sentence about why Adam9 was chosen here, it would be preferred to focus on Adam13 as the rest of the manuscript is focused on Adam13. The conclusions are generalized to all ADAMs, but ADAM13 and ADAM9 are the only ADAMs investigated in the manuscript *

      This figure is no longer included. For each of the protein classes that we identify by Masspec we try to find a validation. RNA-IP is simply a validation that Adam13 and Adam9 can bind to complexes that include RNA in a cytoplasmic domain dependent fashion. The conclusion that Adam13 and possibly ADAM9 might be involved in regulating splicing is 1) that the protein associated with Adam13 are include multiple splicing factors, 2) that the RNAseq analysis shows abnormal splicing in CNC missing Adam13 and 3) that the form of TFAP2a induced by Adam13 (S1) associate significantly more with splicing factor than the S3 isoform.

      We agree that the generalization to other ADAM is not demonstrated here but only suggested. We selected ADAM9 and ADAM19 because we have shown that they can each rescue Adam13 function in the CNC. Unfortunately there are no ADAM19 antibody that work by IP on the market. We have tested multiple company and multiple cell lines.

      We believe that the ADAM9 experiment is critical to show that the protein associated with Adam13 are not simply the result of overexpressing a different species protein sin ADAM9 is the endogenous protein.*

      Minor comments 1. The manuscript using a lot of abbreviations (PCNS, NI, MO, SH3) and lingo that are unclear to a general reader. Please define acronyms when first used, as well as be clear on which model is being used in each experiment. *

      We have corrected this* 2. Similarly, the figures are not labeled such that a reader would be able to understand ie MO13 should be Adam13 knockdown etc. *

      We have corrected this in the legend

      • Please identify the genes on the heatmap and some highlighted genes from volcano plot from the RNA-seq.*

      The volcano plot is from MS/MS not RNAseq. We have list of all of the genes and/or proteins corresponding to each figure in tables

      We now have a figure from the RNAseq and a subset of genes of interest are show. *4. Why use the flag tag in Figure 5? *

      We used Flag-tagged construct to only immunoprecipitated the variants and not the endogenous TFPA2a in these experiments. Also we used RFP-Flag to eliminate any protein that bound to the tag or the antibody.

      This figure is no longer in the manuscript.* 5. Is the data in figure 4A-D the same as Supp. Figure 4A-D? *

      These are independent biological replicates of the same experiment.* 6. Please italicize gene symbols - e.g. "key transcription factors that exemplify CNC, such as the SOX9, FOXD3, SNAI1, SNAI2, and TFAP2 family". *

      We clearly have missed some, we are using italicized for gene, and regular for proteins. It might not be clear in the text when we are referring to genes and proteins. We will correct this in the rewrite. 7. Please review the manuscript for grammatical and typographical errors. * We have used all available software including Word and Grammarly. We will try to improve on the next version. **Cross-commenting**

      I think the two reviewers on one the same page on this manuscript.

      Reviewer #2 (Significance (Required)):

      If more solid, would be a conceptual advance in role of Adam13 in mediating chromatin modification and transcription factors, adds to exiting work from this lab, good for a specialize audience, my expertise is in in neural crest development, non-mammalian modes, epigenetic regulators.*

      • *
    2. Note: This preprint has been reviewed by subject experts for Review Commons. Content has not been altered except for formatting.

      Learn more at Review Commons


      Referee #1

      Evidence, reproducibility and clarity

      In this manuscript, Pandey et al. show that the ADAM13 protein modulates histone modifications in cranical neural crest and that the Arid3a protein binds the Tfap2a promoter in an Adam13-dependent manner and has promoter-specific effects on transcription. Furthermore, they show that the Adam13 and human ADAM9 proteins associated with histone modifiers as well as proteins involved in RNA splicing.

      Although the manuscript is mostly clearly written and the figures well assembled, it reads like a couple of separate and unfinished stories. They show using immunocytochemistry and qPCR that ADAM13 knockouts in CNCs afffects histone modifications. Here ChIP-seq or Cut-n-Run experiments would be more appropriate and would result in a more comprehensive understanding of the changes mediated. The immunohistochemistry assays should at least be verified further using western blotting or other more quantiative methods. The authors then show that ADAM13 interacts with a number of histone modifiers such as KDM3B, KDM4B and KMT2A but strangely they do not follow up this interesting observation to map the interactions further (apart from a co-ip with KMT2A), the domains involved, the functional role of the interactions or how they mediate the changes in chromatin modifications.

      The authors then show that ADAM13 affects expression of the TFAP2a gene in a promoter specific manner - affecting expression from S1 but not S2. They further show that ADAM13 affects the binding of the Arid3 transcription fator to the S1-promoter but not to the S3 promoter. However, ADAM13 was present at both promoters. Absence of ADAM13 resulted in increased H3K9me2/3 and decreased H3K4me3 at the S1 promoter whereas only H3K4me3 was changed at the S2 promoter. Unfortunately, they do not show how this is mediated or through which binding elements this takes place. Why is ADAM13 present at both promoters but only affects Arid3 binding at S1? The authors claim that transfecting Arid3a and Adam13 together further increases expression from a reporter (Fig 4E) but this is not true as no statistical comparison is done between the singly transfected and double transfected cells.

      Then the authors surprisingly start investigating association of proteins with the two isoforms of TFAP2a which in the mind of this reviewer is a different question entirely. They find a number of proteins involved in splicing. And the observation that ADAM13 also interacts with splicing factors is really irrelevant in terms of the story that they are trying to tell. Transcription regulation and splicing are different processes and although both affect the final outcome, mRNA, they need to be investigated separately. The link is at least not very clear from the manuscript. Again, the effects on splicing are not further investigated through functional analysis and as presented the data presented is too open-ended and lacking in clarity.

      Additional points:

      1. In the abstract they propose that the ADAMs may act as extracellular sensors. This is not substantiated by the results.
      2. Page 5, line 16: what is referred to by 6 samples 897 proteins? Were 6 samples analyzed for each condition? The number of repeats for the mass spec analysis is not clear from the text nor are the statistical parameters used to analyse the data. This is also true for the mass spec presented in the part on TFAP2aL-S1 and Adam13 regulate splicing. Statistics and repeats are not presented.
      3. Page 6, line 19: set domain should be SET domain.
      4. The number of repeats in the RNA sequencing of the CNCs is not clear from the text.
      5. The explanation of Figure C is a bit lacking. There are two forms of TFAP2a, L and S, but only one is presented in the figure. Do both forms have the extra S1-3 exons? Also, at the top of the figure it is not clear that the boxes are part of a continuous DNA sequence. Also, it is not clear which codon is not coding.
      6. In the sashimi plot there are green and pink shaded areas. What do they denote? What exactly is lacking in the MO13 mutant - seems that a particular exon is missing suggesting skipping?
      7. Page 11, line 9: „with either MbC or MbC and MO13" needs to be rephrased.
      8. Page 11, line 19: „the c-terminus of....and S3) and" should be „the C-terminus of...and S3 and".
      9. Page 15, line 10: substrateS
      10. Page 16, line 23: the sentence „increases H3K9 to the promoter of the most upstream" needs revision.
      11. Page 26, line 12: Here the authors say: „for two samples two-tail unpaired". What does this mean? Statistics should not be performed on fewer than three samples. In legnd to Figure 6 it indicates that T-test was performed on two samples.
      12. The discussion should be shortened and simplified.
      13. Figure 1 legend. How many images were quantitated for each condition?
      14. Figure 2 has a strange order of panels where G is below B.
      15. Figure 6 legend, line 12. „proteins that were significantly enriched in either of the 2 samples" is not very clear. What exactly does this mean?

      Significance

      If the authors follow up on either the transcription-part of the story, or the splicing part of the story, they are likely to have important results to present. However, in the present format the paper is lacking in focus as both issues are mixed together without a clear end-result.

    1. Author response:

      The following is the authors’ response to the previous reviews

      Public Reviews:

      Reviewer #1 (Public review):

      Summary:

      In this manuscript, the authors describe a new computational method (SegPore), which segments the raw signal from nanopore direct RNA-Seq data to improve the identification of RNA modifications. In addition to signal segmentation, SegPore includes a Gaussian Mixture Model approach to differentiate modified and unmodified bases. SegPore uses Nanopolish to define a first segmentation, which is then refined into base and transition blocks. SegPore also includes a modification prediction model that is included in the output. The authors evaluate the segmentation in comparison to Nanopolish and Tombo (RNA002) as well as f5c and Uncalled 4 (RNA004), and they evaluate the impact on m6A RNA modification detection using data with known m6A sites. In comparison to existing methods, SegPore appears to improve the ability to detect m6A, suggesting that this approach could be used to improve the analysis of direct RNA-Seq data.

      Strengths:

      SegPore address an important problem (signal data segmentation). By refining the signal into transition and base blocks, noise appears to be reduced, leading to improved m6A identification at the site level as well as for single read predictions. The authors provide a fully documented implementation, including a GPU version that reduces run time. The authors provide a detailed methods description, and the approach to refine segments appears to be new.

      Weaknesses:

      The authors show that SegPore reduces noise compared to other methods, however the improvement in accuracy appears to be relatively small for the task of identifying m6A. To run SegPore, the GPU version is essential, which could limit the application of this method in practice.

      As discussed in Paragraph 4 of the Discussion, we acknowledge that the improvement of SegPore combined with m6Anet over Nanopolish+m6Anet in bulk in vivo analysis is modest. This outcome is likely influenced by several factors, including alignment inaccuracies caused by pseudogenes or transcript isoforms, the presence of additional RNA modifications that can affect signal baselines, and the fact that m6Anet is specifically trained on Nanopolish-derived events. Additionally, the absence of a modification-free (in vitro transcribed) control sample in the benchmark dataset makes it challenging to establish true k-mer baselines.

      Importantly, these challenges do not exist for in vitro data, where the signal is cleaner and better defined. As a result, SegPore achieves a clear and substantial improvement at the single-molecule level, demonstrating the strength of its segmentation approach and its potential to significantly enhance downstream analyses. These results indicate that SegPore is particularly well suited for benchmarking and mechanistic studies of RNA modifications under controlled experimental conditions, and they provide a strong foundation for future developments.

      We also recognize that the current requirement for GPU acceleration may limit accessibility in some computational environments. To address this, we plan to further optimize SegPore in future versions to support efficient CPU-only execution, thereby broadening its applicability and impact.

      Reviewer #2 (Public review):

      Summary:

      The work seeks to improve detection of RNA m6A modifications using Nanopore sequencing through improvements in raw data analysis. These improvements are said to be in the segmentation of the raw data, although the work appears to position the alignment of raw data to the reference sequence and some further processing as part of the segmentation, and result statistics are mostly shown on the 'data-assigned-to-kmer' level.

      As such, the title, abstract and introduction stating the improvement of just the 'segmentation' does not seem to match the work the manuscript actually presents, as the wording seems a bit too limited for the work involved.

      The work itself shows minor improvements in m6Anet when replacing Nanopolish' eventalign with this new approach, but clear improvements in the distributions of data assigned per kmer. However, these assignments were improved well enough to enable m6A calling from them directly, both at site-level and at read-level.

      A large part of the improvements shown appear to stem from the addition of extra, non-base/kmer specific, states in the segmentation/assignment of the raw data, removing a significant portion of what can be considered technical noise for further analysis. Previous methods enforced assignment of (almost) all raw data, forcing a technically optimal alignment that may lead to suboptimal results in downstream processing as datapoints could be assigned to neighbouring kmers instead, while random noise that is assigned to the correct kmer may also lead to errors in modification detection.

      For an optimal alignment between the raw signal and the reference sequence, this approach may yield improvements for downstream processing using other tools.

      Additionally, the GMM used for calling the m6A modifications provides a useful, simple and understandable logic to explain the reason a modification was called, as opposed to the black models that are nowadays often employed for these types of tasks.

      Weaknesses:

      The manuscript suggests the eventalign results are improved compared to Nanopolish. While this is believably shown to be true (Table 1), the effect on the use case presented, downstream differentiation between modified and unmodified status on a base/kmer, is likely limited for during downstream modification calling the noisy distributions are often 'good enough'. E.g. Nanopolish uses the main segmentation+alignment for a first alignment and follows up with a form of targeted local realignment/HMM test for modification calling (and for training too), decreasing the need for the near-perfect segmentation+alignment this work attempts to provide. Any tool applying a similar strategy probably largely negates the problems this manuscript aims to improve upon. Should a use-case come up where this downstream optimisation is not an option, SegPore might provide the necessary improvements in raw data alignment.

      Thank you for this thoughtful comment. We agree that many current state-of-the-art (SOTA) methods perform well on benchmark datasets, but we believe there is still substantial room for improvement. Most existing benchmarks are based on limited datasets, primarily focusing on DRACH motifs in human and mouse transcriptomes. However, m6A modifications can also occur in non-DRACH motifs, where current models tend to underperform. Furthermore, other RNA modifications, such as pseudouridine, inosine, and m5C, remain less studied, and their detection is likely to benefit from more accurate and informative signal modeling.

      It is also important to emphasize that raw signal segmentation and RNA modification detection are fundamentally distinct tasks. SegPore focuses on improving the segmentation step by producing a cleaner and more interpretable signal, which provides a stronger foundation for downstream analyses. Even if RNA modification detection algorithms such as m6Anet can partially compensate for noisy segmentation in specific cases, starting from a more accurate signal alignment can still lead to improved accuracy, robustness, and interpretability—particularly in challenging scenarios such as non-canonical motifs or less characterized modifications.

      Scientific progress in this field is often incremental, and foundational improvements can have a significant long-term impact. By enhancing raw signal segmentation, SegPore contributes an essential building block that we expect will enable the development of more accurate and generalizable RNA modification detection algorithms as the community integrates it into more advanced workflows.

      Appraisal:

      The authors have shown their methods ability to identify noise in the raw signal and remove their values from the segmentation and alignment, reducing its influences for further analyses. Figures directly comparing the values per kmer do show a visibly improved assignment of raw data per kmer. As a replacement for Nanopolish' eventalign it seems to have a rather limited, but improved effect, on m6Anet results. At the single read level modification modification calling this work does appear to improve upon CHEUI.

      Impact:

      With the current developments for Nanopore based modification calling largely focusing on Artificial Intelligence, Neural Networks and the likes, improvements made in interpretable approaches provide an important alternative that enables deeper understanding of the data rather than providing a tool that plainly answers the question of wether a base is modified or not, without further explanation. The work presented is best viewed in context of a workflow where one aims to get an optimal alignment between raw signal data and the reference base sequence for further processing. For example, as presented, as a possible replacement for Nanopolish' eventalign. Here it might enable data exploration and downstream modification calling without the need for local realignments or other approaches that re-consider the distribution of raw data around the target motif, such as a 'local' Hidden Markov Model or Neural Networks. These possibilities are useful for a deeper understanding of the data and further tool development for modification detection works beyond m6A calling.

      Reviewer #3 (Public review):

      Summary:

      Nucleotide modifications are important regulators of biological function, however, until recently, their study has been limited by the availability of appropriate analytical methods. Oxford Nanopore direct RNA sequencing preserves nucleotide modifications, permitting their study, however many different nucleotide modifications lack an available base-caller to accurately identify them. Furthermore, existing tools are computationally intensive, and their results can be difficult to interpret.

      Cheng et al. present SegPore, a method designed to improve the segmentation of direct RNA sequencing data and boost the accuracy of modified base detection.

      Strengths:

      This method is well described and has been benchmarked against a range of publicly available base callers that have been designed to detect modified nucleotides.

      Weaknesses:

      However, the manuscript has a significant drawback in its current version. The most recent nanopore RNA base callers can distinguish between different ribonucleotide modifications, however, SegPore has not been benchmarked against these models.

      The manuscript would be strengthened by benchmarking against the rna004_130bps_hac@v5.1.0 and rna004_130bps_sup@v5.1.0 dorado models, which are reported to detect m5C, m6A_DRACH, inosine_m6A and PseU.

      A clear demonstration that SegPore also outperforms the newer RNA base caller models will confirm the utility of this method.

      Thank you for highlighting this important limitation. While Dorado, the new ONT basecaller, is publicly available and supports modification-aware basecalling, suitable public datasets for benchmarking m5C, inosine, m6A, and PseU detection on RNA004 are currently lacking. Dorado’s modification-aware models are trained on ONT’s internal data, which is not publicly released. Therefore, it is currently not feasible to directly evaluate or compare SegPore’s performance against Dorado for these RNA modifications.

      We would also like to emphasize that SegPore’s primary contribution lies in raw signal segmentation, which is an upstream and foundational step in the RNA modification detection pipeline. As more publicly available datasets for RNA004 modification detection become accessible, we plan to extend our work to benchmark and integrate SegPore with modification detection tasks on RNA004 data in future studies.

      Recommendations for the authors:

      Reviewer #2 (Recommendations for the authors):

      Comments based on Author Response

      “However, it is valid to compare them on the segmentation task, where SegPore exhibits better performance (Table 1).”

      This dodges the point of the actual use case of this approach, as Nanopolish indeed does not support calling modifications for this kind of data, but the general approach it uses might, if adapted for this data, nullify the gains made in the examples presented.

      We respectfully disagree with the comment that the advantages demonstrated by SegPore could be “nullified”. Although SegPore’s performance is indeed more modest in in vivo datasets, it shows substantially better performance than CHEUI in in vitro data, clearly demonstrating that improved segmentation directly contributes to more accurate RNA modification estimation.

      It is worth noting that CHEUI relies on Nanopolish’s segmentation results for m6A detection. Despite this, SegPore outperforms CHEUI, further supporting the conclusion that segmentation quality has a meaningful impact on downstream modification calling.

      In conclusion, based on our current experimental results, SegPore is particularly well suited for RNA modification analysis from in vitro transcribed data, where its improved segmentation provides a clear advantage over existing methods.

      Further comments

      (2) “(2) Page 3  employ models like Hidden Markov Models (HMM) to segment the signal, but they are prone to noise and inaccuracies”

      “That's the alignment/calling part, not the segmentation?”

      “Current methods, such as Nanopolish, employ models like Hidden Markov Models (HMM) to segment the signal”

      I get the impression the word 'segment' has a different meaning in this work than what I'm used to based on my knowledge around Nanopolish and Tombo, see the deeper code examples further down below.

      Additionally, in Nanopolish there is a clear segmentation step (or event detection) without any HMM, then a sort of dynamic timewarping step that aligns the segments and re-combines some segments into a single segment where necessary afterwards. I believe the HMM in Nanopolish is not used at all unless modification calling, but if you can point out otherwise I'm open for proof.

      Now I believe it is the meaning of 'segmenting the signal' that confuses me, and now the clarification makes it a bit odd as well:

      “Nanopolish and Tombo align the raw signal to the reference sequence to determine which portion of the signal corresponds to each k-mer. We define this process as the segmentation task, referred to as "eventalign" in Nanopolish.”

      So now it's clearly stated the raw signal is being 'aligned' and then the process is suddenly defined as the 'segmentation task', and again referred to as "eventalign". Why is it not referred to as the 'alignment task' instead?

      I understand the segmentation and alignment parts are closely connected but to me, it seems this work picks the wrong word for the problem being solved.

      “Unlike Nanopolish and Tombo, which directly align the raw signal to the reference sequence,…”

      Looking at their code, I believe both Nanopolish and Tombo actually do segment the data first (or "event detection"), then they align the segments/events they found, and finally multiple events aligned to the same section are merged. See for yourself:

      Nanopolish:

      https://github.com/jts/nanopolish/blob/master/src/nanopolish_squiggle_read.cpp<br /> Line 233:

      cpp

      trim_and_segment_raw(fast5_data.rt, trim_start, trim_end, varseg_chunk, varseg_thresh);

      event_table et = detect_events(fast5_data.rt, *ed_params);

      Line 270:

      cpp

      // align events to the basecalled read

      std::vector event_alignment = adaptive_banded_simple_event_align(*this, *this->base_model[strand_idx], read_sequence);

      Where event detection is further defined at line 268 here:

      https://github.com/jts/nanopolish/blob/master/src/thirdparty/scrappie/event_detection.c

      Tombo:

      https://github.com/nanoporetech/tombo/blob/master/tombo/resquiggle.py

      line 1162 and onwards shows a ‘segment_signal’ call and the results are used in a ‘find_adaptive_base_assignment’ call, where ‘segment_signal’ starting at line 1057 tries to find where the signal jumps from a series of similar values to another (start of a base change in the pore), stored in ‘valid_cpts’, and the ‘find_adaptive_base_assignment’ tries to align the resulting segment values to the expected series of values:

      python

      valid_cpts, norm_signal, new_scale_values = segment_signal(

      map_res, num_events, rsqgl_params, outlier_thresh, const_scale)

      event_means = ts.compute_base_means(norm_signal, valid_cpts)

      dp_res = find_adaptive_base_assignment(

      valid_cpts, event_means, rsqgl_params, std_ref, map_res.genome_seq,

      start_clip_bases=map_res.start_clip_bases,

      seq_samp_type=seq_samp_type, reg_id=map_res.align_info.ID)

      These implementations are also why I find the choice of words for what is segmentation and what is alignment a bit confusing in this work, as both Tombo and Nanopolish do a similar, clear segmentation step (or an "event detection" step), followed by the alignment of the segments they determined. The terminology in this work appears to deviate from these.

      We thank the reviewer for the detailed comments!

      First of all, we sincerely apologize for our earlier misunderstanding regarding how Nanopolish and Tombo operate. Based on a closer examination of their source codes, we now recognize that both tools indeed include a segmentation step based on change-point detection methods, after which the resulting segments are aligned to the reference sequence. We have revised the relevant text in the manuscript accordingly:

      - “Current methods, such as Nanopolish, employ change-point detection methods to segment the signal and use dynamic programming methods and HMM to align the derived segments to the reference sequence,”

      - “We define this process as the segmentation and alignment task (abbreviated as the segmentation task), which is referred to as “eventalign” in Nanopolish.”

      - “In SegPore, we segment the raw signal into small fragments using a Hierarchical Hidden Markov Model (HHMM) and align the mean values of these fragments to the reference, where each fragment corresponds to a sub-state of a k-mer. By contrast, Nanopolish and Tombo use change-point–based methods to segment the signal and employ dynamic programming approaches together with profile HMMs to align the resulting segments to the reference sequence.”

      Regarding terminology, we originally borrowed the term “segmentation” from speech processing, where it refers to dividing continuous audio signals into meaningful units. In the context of nanopore signal analysis, segmentation and alignment are often tightly coupled steps. Because of this and because our initial focus was on methodological development rather than terminology, we used the term “segmentation task” to describe the combined process of signal segmentation and alignment.

      However, we now recognize that this terminology may cause confusion. Changing every instance of “segmentation” to “segmentation and alignment” or “alignment” would require substantial rewriting of the manuscript. Therefore, in this revision, we have clearly defined “segmentation task” as referring to the combined process of segmentation and alignment. We apologize for any earlier confusion and will adopt the term “alignment” in future work for greater clarity.

      (3) I think I do understand the meaning, but I do not understand the relevance of the Aj bit in the last sentence. What is it used for?

      Based on the response and another close look at Fig1, it turns out the j refers to extremely small numbers 1 and 2 in step 3. You may want in improve readability for these.

      Thank you for the suggestion. We have added subscripts to all nucleotides in the reference sequence in Figure 1A and revised the legend to clarify the notation and improve readability. Specifically, we now include the following explanation:

      “For example, A<sub>j</sub> denotes the base ‘A’ at the j-th position on the reference sequence. In this example, A<sub>1</sub> and A<sub>2</sub> refer to the first and second occurrences of ‘A’ in the reference sequence, respectively. Accordingly, μ<sub>1</sub> and μ<sub>2</sub> are aligned to A<sub>1</sub>, while μ<sub>3</sub> is aligned to A<sub>2</sub>”.

      (6) “We chose to use the poly(A) tail for normalization because it is sequence-invariant- i.e., all poly(A) tails consist of identical k-mers, unlike transcript sequences which vary in composition. In contrast, using the transcript region for normalization can introduce biases: for instance, reads with more diverse k-mers (having inherently broader signal distributions) would be forced to match the variance of reads with more uniform k-mers, potentially distorting the baseline across k-mers.”

      While the next part states there was a benchmark showing SegPore still works without this normalization, I think this answer does not touch upon the underlying issue I'm trying to point out here.

      - The biases mentioned here due to a more diverse (or different) subsets of k-mers in a read indeed affects the variance of the signal overall.

      - As I pointed out in my earlier remark here, this can be resolved using an approach of 'general normalization', 'mapping to expected signal', 'theil-sen fitting of scale and offset', 're-mapping to expected signal', as Tombo and Nanopolish have implemented.<br /> - Alternatively, one could use the reference sequence (using the read mapping information) and base the expected signal mean and standard deviation on that instead.

      - The polyA tail stability as an indicator for the variation in the rest of the signal seems a questionable assumption to me. A 'noisy' pore could introduce a large standard deviation using the polyA tail without increasing the deviations on the signal induced by the variety of k-mers, rather it would be representative for the deviations measured within a single k-mer segment. I thought this possible discrepancy is to be expected from a worn out pore, hence I'd imagine reads sequenced later in a run to provide worse results using this method.

      In the current version it is not the statement that is unclear, it is the underlying assumption of how this works that I question.

      We thank the reviewer for raising this important point and for the insightful discussion. Our choice of using the poly(A) tail for normalization is based on the working hypothesis that the poly(A) signal reflects overall pore-level variability and provides a stable reference for signal scaling. We find this to be a practical and effective approach in most experimental settings.

      We agree that more sophisticated strategies, such as “general normalization” or iterative fitting to the expected signal (as implemented in Tombo and Nanopolish), could in principle generate a "better" normalization. However, these approaches are significantly more challenging to implement in practice. This is because signal normalization and alignment are mutually dependent processes: baseline estimates for k-mers influence alignment accuracy, while alignment accuracy, in turn, affects baseline calculation. This interdependence becomes even more complex in the presence of RNA modifications, which alter signal distributions and further confound model fitting.

      It is worth noting that this limitation is already evident in our results. As shown in Figure 4B (first and second k-mers), Nanopolish produces more dispersed baselines than SegPore, even for these unmodified k-mers, suggesting inherent limitations in its normalization strategy. Ideally, baselines for the same k-mer should remain highly consistent across different reads.

      In contrast, poly(A)-based normalization offers a simpler and more robust solution that avoids this circular dependency. Because poly(A) sequences are compositionally homogeneous, they enable reliable estimation of scaling parameters without assumptions about k-mer composition or modification state. Regarding the reviewer’s concern about pore instability, we mitigate this issue by including only high-quality, confidently mapped reads in our analysis, which reduces the likelihood of incorporating signals from degraded or “noisy” pores.

      We fully agree that exploring more advanced normalization strategies is an important direction for future work, and we plan to investigate such approaches as the field progresses.

      (8) “In the remainder of this paper, we refer to these resulting events as the output of eventalign analysis or the segmentation task.”

      Picking only one descriptor rather than two alternatives would be easier to follow (and I'd prefer the first).

      Thank you for the suggestion. We have revised the sentence to:

      “In the remainder of this paper, we refer to these resulting events as the output of eventalign analysis, which also represents the final output of the segmentation and alignment task.”

      (9) “Additionally, a complete explanation of how the weighted mean is computed is provided in Section 5.3 of Supplementary Note 1. It is derived from signal points that are assigned to a given 5mer.”

      I believe there's no more mention of a weighted mean, and I don't get any hits when searching for 'weight'. Is that intentional?

      We apologize for the misplacement of the formulas. We have updated Section 5.3 of Supplementary Note 1 to clarify the definition of the weighted mean. Because multiple current signal segments may be aligned to a single k-mer, we computed the weighted mean for each k-mer across these segments, where the weight corresponds to the number of data points assigned to “curr” state in each event.

      (17) Response: We revised the sentence to clarify the selection criteria: "For selected 5mers “that exhibit both a clearly unmodified and a clearly” “modified signal component”, “SegPore reports the modification rate at each site,” “as well as the modification state of that site on individual reads.””

      So is this the same set described on page 13 ln 343 or not?

      “Due to the differences between human (Supplementary Fig. S2A) and mouse (Supplementary Fig. S2B), only six 5mers were found to have m6A annotations in the test data's ground truth (Supplementary Fig. S2C). For a genomic location to be identified as a true m6A modification site, it had to correspond to one of these six common 5mers and have a read coverage of greater than 20.”

      I struggle to interpret the 'For selected 5mers' part, as I'm not sure if this is a selection I'm supposed to already know at this point in the text or if it's a set just introduced here. If the latter, removing the word 'selected' would clear it up for me.

      We apologize for the confusion. What we mean is that when pooling signals aligned to the same k-mer across different genomic locations and reads, only a subset of k-mers exhibit a bimodal distribution — one peak corresponding to the unmodified state and another to the modified state. Other k-mers show a unimodal distribution, making it impossible to reliably estimate modification levels. We refer to the subset of k-mers that display a bimodal distribution as the “selected” k-mers.

      The “selected k-mers” described on page 13, line 343, must additionally have ground truth labels available in both the training and test datasets. There are 10 k-mers with ground truth annotations in the training data and 11 in the test data, and only 6 of these k-mers are shared between the two datasets, therefore only those 6 overlapping k-mers are retained for evaluation. These 6 k-mers satisfy both criteria: (1) exhibiting a bimodal distribution and (2) having ground truth annotations in both training and test sets.

      To improve clarity, we have removed the term “selected” from the sentence.

      (21) "Tombo used the "resquiggle" method to segment the raw signals, and we standardized the segments using the “poly(A)” tail to ensure a fair comparison “(See” “preprocessing section in Materials and Methods)."”

      In the Materials and Methods:

      “The raw signal segment corresponding to the poly(A) tail is used to standardize the raw signal for each read.”

      I cannot find more detailed information here on what the standardization does, do you mean to refer to Supplementary Note 1, Section 3 perhaps?

      Thank you for pointing this out. Yes, the standardization procedure is described in detail in Supplementary Note 1, Section 3. Tombo itself does not segment and align the raw signal on the absolute pA scale, which can result in very large variance in the derived events if the raw signal is used directly. To ensure a fair comparison, we therefore applied the same preprocessing steps to Tombo’s raw signals as we did for SegPore, using only the event boundary information from Tombo while standardizing the signal in the same way.

      We have revised the sentence for clarity as follows:

      “Tombo used the "resquiggle" method to segment the raw signals, but the resulting signals are not reported on the absolute pA scale. To ensure a fair comparison with SegPore, we standardized the segments using the poly(A) tail in the same way as SegPore (See preprocessing section in Materials and Methods).”

      (22A) The table shown does help showing the benchmark is unlikely to be 'cheated'. However I am suprised to see the Avg std for Nanopolish and Tombo going up instead of down, as I'd expect the transition values to increase the std, and hence, removing them should decrease these values. So why does this table show the opposite?

      I believe this table is not in the main text or the supplement, would it not be a good idea to cover this point somewhere in the work?

      Thank you for this insightful comment. In response, we carefully re-examined our analysis and identified a bug in the code related to boundary removal for Nanopolish. We have now corrected this issue and included the updated results in Supplementary Table S1 of the revised manuscript. As shown in the updated table, the average standard deviations decrease after removing the boundary regions for both Nanopolish and Tombo.

      We have now included this table in Supplementary Table S1 in the revised manuscript and added the following clarification:

      “It is worth noting that the data points corresponding to the transition state between two consecutive 5-mers are not included in the calculation of the standard deviation in SegPore’s results in Table 1. However, their exclusion does not affect the overall conclusion, as there are on average only ~6 points per 5-mer in the transition state (see Supplementary Table S1 for more details).”

      (22B) As mentioned in 2), I'm happy there's a clear definition of what is meant but I found the chosen word a bit odd.

      We apologize for the earlier unclear terminology. We now refer to it as the segmentation and alignment task, abbreviated as the segmentation task.

      (23) Reading back I can gather that from the text earlier, but the summation of what is being tested is this:

      “including Tombo, MINES (31), Nanom6A (32), m6Anet, Epinano (33), and CHEUI (20). “

      next, the identifier "Nanopolish+m6Anet" is, aside from the figure itself, only mentioned in the discussion. Adding a line that explains that "Nanopolish+m6Anet" is the default method of running m6Anet and "SegPore+m6Anet" replaces the Nanopolish part for m6Anet with Segpore, rather than jumping straight to "SegPore+m6Anet", would clarify where this identifier came from.

      Thank you for the helpful suggestion. We have added the identifier to the revised manuscript as follows:

      “Given their comparable methodologies and input data requirements, we benchmarked SegPore against several baseline tools, including Tombo, MINES (31), Nanom6A (32), m6Anet, Epinano (33), and CHEUI (20). By default, MINES and Nanom6A use eventalign results generated by Tombo, while m6Anet, Epinano, and CHEUI rely on eventalign results produced by Nanopolish. In Fig. 3C, ‘Nanopolish+m6Anet’ refers to the default m6Anet pipeline, whereas ‘SegPore+m6Anet’ denotes a configuration in which Nanopolish’s eventalign results are replaced with those from SegPore.”

      (24) For completeness I'd expect tickmarks and values on the y-axis as well.

      Thank you for the suggestion. We have updated Figures 3A and 3B in the revised manuscript to include tick marks and values on the y-axis as requested.

      (25) Considering this statement and looking back at figure 3a and 3b, wouldn't this be easier to observe if the histograms/KDE's were plotted with overlap in a single figure?

      We appreciate the suggestion. However, we believe that overlaying Figures 3A and 3B into a single panel would make the visualization cluttered and more difficult to interpret.

      (29) Please change the sentence in the text to make that clear. As it is written now (while it's the same number of motifs, so one might guess it) it does not seem to refer to that particular set of motifs and could be a new selection of 6 motifs.

      We appreciate the suggestion and have revised the sentence for clarity as follows:

      “We evaluated m6A predictions using two approaches: (1) SegPore’s segmentation results were fed into m6Anet, referred to as SegPore+m6Anet, which works for all DRACH motifs and (2) direct m6A predictions from SegPore’s Gaussian Mixture Model (GMM), which is limited to the six selected 5-mers shown in Supplementary Fig. S2C that exhibit clearly separable modified and unmodified components in the GMM (see Materials and Methods for details). ”

      (31) I think we have a different interpretation of the word 'leverage', or perhaps what it applies to. I'd say it leverages the jiggling if there's new information drawn from the jiggling behaviour. It's taking it into account if it filters for it. The HHMM as far as I understand tries to identify the jiggles, and ignore their values for the segmentation etc. So while one might see this as an approach that "leverages the hypothesis", I don't see how this HHMM "leverages the jiggling property" itself.

      Thank you for the helpful suggestion. We have replaced the word “leverages” with “models” in the revised manuscript.

      New points

      pg6ln166: “…we extract the aligned raw signal segment and reference sequence segment from Nanopolish's events [...] we extract the raw signal segment corresponding to the transcript region for each input read based on Nanopolish's poly(A) detection results.”

      It is not clear as to why this different approach is applied for these two cases in this part of the text.

      Thank you for pointing this out. The two approaches refer to different preprocessing strategies for in vivo and in vitro data.

      For in vivo data, a large proportion of reads do not span the full-length transcript and often map only to a portion of the reference sequence. Moreover, because a single gene can generate multiple transcript isoforms, a read may align equally well to several possible transcripts. Therefore, we extract only the raw signal segment that corresponds to the mapped portion of the transcript for each read.

      In contrast, for in vitro data, the transcript sequence is known precisely. As a result, we can directly extract all raw signals following the poly(A) tail and align them to the complete reference sequence.

      pg10ln259: An important distinction from classical global alignment algorithms is that one or multiple base blocks may align with a single 5mer.”

      If there was usually a 1:1 mapping the alignment algorithm would be more or less a direct match, so I think the multiple blocks aligning to a 5mer thing is actually quite common.

      Thank you for the comment. The “classical global alignment algorithm” here refers to the Needleman–Wunsch algorithm used for sequence alignment. Our intention was to highlight the conceptual difference between traditional sequence alignment and nanopore signal alignment. In classical sequence alignment, each base typically aligns to a single position in the reference. In contrast, in nanopore signal alignment, one or multiple signal segments — corresponding to varying dwell times of the motor protein — can align to a single 5-mer.

      We have revised the sentence as follows:

      “An important distinction from classical global alignment algorithms (Needleman–Wunsch algorithm)……”

      pg13ln356: "dwell time" is not defined or used before, I guess it's effectively the number of raw samples per segment but this should be clarified.

      Thank you for pointing this out. We have now added a clear definition of dwell time in the text as follows:

      "such as the normalized mean μ_i, standard deviation σ_i, dwell time l_i (number of data points in the event)."

      pg13ln358: “Feature vectors from 80% of the genomic locations were used for training, while the remaining 20% were set aside for validation.”

      I assume these are selected randomly but this is not explicitly stated here and should be.

      Yes, they are randomly selected. We have revised the sentence as follows:

      “Feature vectors from a randomly selected 80% of the genomic locations were used for training, while the remaining 20% were set aside for validation.”

      pg18ln488: The manuscript now evaluates RNA004 and compares against f5c and Uncalled4. It mentions the differences between RNA004 and RNA002, namely kmer size and current levels, but does not explain where the starting reference model values for the RNA004 model come from: In pg18ln492 they state "RNA004 provides reference values for 9mers", then later they seem to use a 5mer parameter table (pg19ln508), are they re-using the same table from RNA002 or did they create a 5mer table from the 9mer reference table?

      We apologize for the confusion. The reference model table for RNA004 9-mers is obtained from f5c (the array named ‘rna004_130bps_u_to_t_rna_9mer_template_model_builtin_data’in  https://raw.githubusercontent.com/hasindu2008/f5c/refs/heads/master/src/model.h).

      Author response image 1.

      We have revised the subsection header “5-mer parameter table” in the Method to “5-mer & 9-mer parameter table” to highlight this and added a paragraph about how to obtain the 9-mer parameter table:

      “In the RNA004 data analysis (Table 2), we obtained the 9-mer parameter table from the source code of f5c (version 1.5). Specifically, we used the array named ‘rna004_130bps_u_to_t_rna_9mer_template_model_builtin_data’ from the following file: https://raw.githubusercontent.com/hasindu2008/f5c/refs/heads/master/src/model.h (accessed on 17 October 2025).”

      Also, in page 18 line 195, we added the following sentence:

      “The 9-mer parameter table in pA scale for RNA004 data provided by f5c (see Materials and Methods) was used in the analysis.”

      pg19ln520: “Additionally, due to the differences of the k-mer motifs between human and mouse (Supplementary Fig. S2), six shared 5mers were selected to demonstrate SegPore's performance in modification prediction directly.”

      "the differences" - in occurrence rates, as I gather from the supplementary figure, but it would be good to explicitly state it in this sentence itself too.

      Thank you for the helpful suggestion. We agree that the original sentence was vague. The main reason for selecting only six 5-mers is the difference in the availability of ground truth labels for specific k-mer motifs between human and mouse datasets. We have revised the sentence accordingly:

      “Additionally, due to the differences in the availability of ground truth labels for specific k-mer motifs between human and mouse (Supplementary Fig. S2), six shared 5-mers were selected to directly demonstrate SegPore’s performance in modification prediction.”

      pg24ln654: “SegPore codes current intensity levels”

      "codes" is meant to be "stores" I guess? Perhaps "encodes"?

      Thank you for the suggestion. We have now replaced it with “encodes” in the revised manuscript.

      Lastly, looking at the feedback from the other reviewers comment:

      The 'HMM' mentioned in line 184 looks fine to me, the HHMM is 2 HMM's in a hierarchical setup and the text now refers to one of these HMM layers. If this is to be changed it would need to state the layer (e.g. "the outer HHMM layer") throughout the text instead.

      We agree with this assessment and believe that the term “inner HMM” is accurate in this context, as it correctly refers to one of the two HMM layers within the HHMM structure. Therefore, we have decided to retain the current terminology.

      Reviewer #3 (Recommendations for the authors):

      I recommend the publication of this manuscript, provided that the following comments are addressed.

      Page 5, Preprocessing: You comment that the poly(A) tail provides a stable reference that is crucial for the normalisation of all reads. How would this step handle reads that have interrupted poly(A) tails (e.g. in the case of mRNA vaccines that employ a linker sequence)? Or cell types that express TENT4A/B, which can include transcripts with non-A residues in the poly(A) tail: https://www.science.org/doi/full/10.1126/science.aam5794.

      It depends on Nanopolish’s ability to reliably detect the poly(A) tail. In general, the poly(A) region produces a long stretch of signals fluctuating around a current level of ~108.9 pA (RNA002) with relatively stable variation, which allows it to be identified and used for normalization.

      For in vivo data, if the poly(A) tail is interrupted (e.g., due to non-A residues or linker sequences), two scenarios are possible:

      (1) The poly(A) tail may not be reliably detected, in which case the corresponding read will be excluded from our analysis.

      (2) Alternatively, Nanopolish may still recognize the initial uninterrupted portion of the poly(A) signal, which is typically sufficient in length and stability to be used for signal normalization.

      For in vitro data, the poly(A) tails are uninterrupted, so this issue does not arise.

      All analyses presented in this study are based exclusively on reads with reliably detected poly(A) tails.

      Page 7, 5mer parameter table: r9.4_180mv_70bps_5mer_RNA is an older kmer model (>2 years). How does your method perform with the newer RNA kmer models that do permit the detection of multiple ribonucleotide modifications? Addressing this comment would be beneficial, however I understand that it would require the generation of new data, as limited RNA004 datasets are available in the public domain.

      “r9.4_180mv_70bps_5mer_RNA” is the most widely used k-mer model for RNA002 data. Regarding the newer k-mer models, we believe the reviewer is referring to the “modification basecalling” models available in Dorado, which are specifically designed for RNA004 data. At present, SegPore can perform RNA modification estimation only on RNA002 data, as this is the platform for which suitable training data and ground truth annotations are available. Evaluating SegPore’s performance with the newer RNA004 modification models would require new datasets containing known modification sites generated with RNA004 chemistry. Since such data are currently unavailable, we have not yet been able to assess SegPore under these conditions. This represents an important future direction for extending and validating our method.

      The Methods and Results sections contain redundant information -please streamline the information in these sections and reduce the redundancy.

      We thank the reviewer for this suggestion and acknowledge that there is some overlap between the Methods and Results sections. However, we feel that removing these parts could compromise the clarity and readability of the manuscript, especially given that Reviewer 2 emphasized the need for clearer explanations. We therefore decided to retain certain methodological descriptions in the Results section to ensure that key steps are understandable without requiring the reader to constantly cross-reference the Methods.

      Minor comments

      Please be consistent when referring to k-mers and 5-mers (sometimes denoted as 5mers - please change to 5-mers throughout).

      We have revised the manuscript to ensure consistency and now use “5-mers” throughout the text.

      Introduction

      Lines 80 - 112: Please condense this section to roughly half the length (1-2 paragraphs). In general, the results described in the introduction should be very brief, as they are described in full in the results section.

      Thank you for the suggestion. We have condensed the original three paragraphs into a single, more concise paragraph as follows:

      "SegPore is a novel tool for direct RNA sequencing (DRS) signal segmentation and alignment, designed to overcome key limitations of existing approaches. By explicitly modeling motor protein dynamics during RNA translocation with a Hierarchical Hidden Markov Model (HHMM), SegPore segments the raw signal into small, biologically meaningful fragments, each corresponding to a k-mer sub-state, which substantially reduces noise and improves segmentation accuracy. After segmentation, these fragments are aligned to the reference sequence and concatenated into larger events, analogous to Nanopolish’s “eventalign” output, which serve as the foundation for downstream analyses. Moreover, the “eventalign” results produced by SegPore enhance interpretability in RNA modification estimation. While deep learning–based tools such as m6Anet classify RNA modifications using complex, non-transparent features (see Supplementary Fig. S5), SegPore employs a simple Gaussian Mixture Model (GMM) to distinguish modified from unmodified nucleotides based on baseline current levels. This transparent modeling approach improves confidence in the predictions and makes SegPore particularly well-suited for biological applications where interpretability is essential."

      Line 104: Please change "normal adenosine" to "adenosine".

      We have revised the manuscript as requested and replaced all instances of “normal adenosine” with “adenosine” throughout the text.

      Materials and Methods

      Line 176: Please reword "...we standardize the raw current signals across reads, ensuring that the mean and standard deviation of the poly(A) tail are consistent across all reads." To "...we standardize the raw current signals for each read, ensuring that the mean and standard deviation are consistent across the poly(A) tail region."

      We have changed sentence as requested.

      “Since the poly(A) tail provides a stable reference, we standardize the raw current signals for each read, ensuring that the mean and standard deviation are consistent across the poly(A) tail region.”

      Line 182: Please describe the RNA translocation hypothesis, as this is the first mention of it in the text. Also, why is the Hierachical Hidden Markov model perfect for addressing the RNA translocation hypothesis? Explain more about how the HHMM works and why it is a suitable choice.

      We have revised the sentence as requested:

      “The RNA translocation hypothesis (see details in the first section of Results) naturally leads to the use of a hierarchical Hidden Markov Model (HHMM) to segment the raw current signal.”

      The motivation of the HHMM is explained in detail in the the first section “RNA translocation hypothesis” of Results. As illustrated in Figure 2, the sequencing data suggest that RNA molecules may translocate back and forth (often referred to as jiggling) while passing through the nanopore. This behavior results in complex current fluctuations that are challenging to model with a simple HMM. The HHMM provides a natural framework to address this because it can model signal dynamics at two levels. The outer HMM distinguishes between two major states — base states (where the signal corresponds to a stable sub-state of a k-mer) and transition states (representing transitions from one base state to the next). Within each base state, an inner HMM models finer signal variation using three states — “curr”, “prev”, and “next” — corresponding to the current k-mer sub-states and its neighboring k-mer sub-states. This hierarchical structure captures both the stable signal patterns and the stochastic translocation behavior, enabling more accurate and biologically meaningful segmentation of the raw current signal.

      Line 184: do you mean HHMM? Please be consistent throughout the text.

      As explained in the previous response, the HHMM consists of two layers: an outer HMM and an inner HMM. The term “HMM” in line 184 is meant to be read together with “inner” at the end of line 183, forming the phrase “inner HMM.” It seems the reviewer may have overlooked this when reading the text.

      Line 203: please delete: "It is obviously seen that".

      We have removed the phrase “It is obviously seen that” from the sentence as requested. The revised sentence now reads:

      “The first part of Eq. 2 represents the emission probabilities, and the second part represents the transition probabilities.”

      Line 314, GMM for 5mer parameter table re-estimation: "Typically, the process is repeated three to five times until the5mer parameter table stabilizes." How is the stabilisation of the 5mer parameter table quantified? What is a reasonable cut-off that would demonstrate adequate stabilisation of the 5mer parameter table? Please add details of this to the text.

      We have revised the sentence to clarify the stabilization criterion as follows:

      “Typically, the process is repeated three to five times until the 5-mer parameter table stabilizes (when the average change of mean values of all 5-mers is less than 5e-3).”

      Results

      Line 377: Please edit to read "Traditional base calling algorithms such as Guppy and Albacore assume that the RNA molecule is translocated unidirectionally through the pore by the motor protein."

      We have revised the sentence as:

      “In traditional basecalling algorithms such as Guppy and Albacore, we implicitly assume that the RNA molecule is translocated through the pore by the motor protein in a monotonic fashion, i.e., the RNA is pulled through the pore unidirectionally.”

      Line 555, m6A identification at the site level: "For six selected m6A motifs, SegPore achieved an ROC AUC of 82.7% and a PR AUC of 38.7%, earning the third best performance compared with deep leaning methods m6Anet and CHEUI (Fig. 3D)." So SegPore performs third best of all deep learning methods. Do you recommend its use in conjunction with m6Anet for m6A detection? Please clarify in the text. This will help to guide users to possible best practice uses of your software.

      Thank you for the suggestion. We have added a clarification in the revised manuscript to guide users.

      “For practical applications, we recommend taking the intersection of m6A sites predicted by SegPore and m6Anet to obtain high-confidence modification sites, while still benefiting from the interpretability provided by SegPore’s predictions.”

      Figures.

      Figure 1A please refer to poly(A) tail, rather than polyA tail.

      We have updated it to poly(A) tail in the revised manuscript.

    1. Author response:

      The following is the authors’ response to the original reviews

      Reviewer #1 (Public review):

      SMC5/6 is a highly conserved complex able to dynamically alter chromatin structure, playing in this way critical roles in genome stability and integrity that include homologous recombination and telomere maintenance. In the last years, a number of studies have revealed the importance of SMC5/6 in restricting viral expression, which is in part related to its ability to repress transcription from circular DNA. In this context, Oravcova and colleagues recently reported how SMC5/6 is recruited by two mutually exclusive complexes (orthologs of yeast Nse5/6) to SV40 LT-induced PML nuclear bodies (SIMC/SLF2) and DNA lesions (SLF1/2). In this current work, the authors extend this study, providing some new results. However, as a whole, the story lacks unity and does not delve into the molecular mechanisms responsible for the silencing process. One has the feeling that the story is somewhat incomplete, putting together not directly connected results.

      Please see the introductory overview above.

      (1) In the first part of the work, the authors confirm previous conclusions about the relevance of a conserved domain defined by the interaction of SIMC and SLF2 for their binding to SMC6, and extend the structural analysis to the modelling of the SIMC/SLF2/SMC complex by AlphaFold. Their data support a model where this conserved surface of SIMC/SLF2 interacts with SMC at the backside of SMC6's head domain, confirming the relevance of this interaction site with specific mutations. These results are interesting but confirmatory of a previous and more complete structural analysis in yeast (Li et al. NSMB 2024). In any case, they reveal the conservation of the interaction. My major concern is the lack of connection with the rest of the article. This structure does not help to understand the process of transcriptional silencing reported later beyond its relevance to recruit SMC5/6 to its targets, which was already demonstrated in the previous study.

      Demonstrating the existence of a conserved interface between the Nse5/6-like complexes and SMC6 in both yeast and human is foundationally important, not confirmatory, and was not revealed in our previous study. It remains unclear how this interface regulates SMC5/6 function, but yeast studies suggest a potential role in inhibiting the SMC5/6 ATPase cycle. Nevertheless, the precise function of Nse5/6 and its human orthologs in SMC5/6 regulation remain undefined, largely due to technical limitations in available in vivo analyses. The SIMC1/SLF2/SMC6 complex structure likely extends to the SLF1/2/SMC6 complex, suggesting a unifying function of the Nse5/6-like complexes in SMC5/6 regulation, albeit in the distinct processes of ecDNA silencing and DNA repair. There have been no studies to date (including this one) showing that SIMC1-SLF2 is required for SMC5/6 recruitment to ecDNA. Our previous study showed that SIMC1 was needed for SMC5/6 to colocalize with SV40 LT antigen at PML NBs. Here we show that SIMC1 is required for ecDNA repression, in the absence of PML NBs, which was not anticipated.

      (2) In the second part of the work, the authors focus on the functionality of the different complexes. The authors demonstrate that SMC5/6's role in transcription silencing is specific to its interaction with SIMC/SLF2, whereas SMC5/6's role in DNA repair depends on SLF1/2. These results are quite expected according to previous results. The authors already demonstrated that SLF1/2, but not SIMC/SLF2, are recruited to DNA lesions. Accordingly, they observe here that SMC5/6 recruitment to DNA lesions requires SLF1/2 but not SIMC/SLF2. Likewise, the authors already demonstrated that SIMC/SLF2, but not SLF1/2, targets SMC5/6 to PML NBs. Taking into account the evidence that connects SMC5/6's viral resistance at PML NBs with transcription repression, the observed requirement of SIMC/SLF2 but not SLF1/2 in plasmid silencing is somehow expected. This does not mean the expectation has not to be experimentally confirmed. However, the study falls short in advancing the mechanistic process, despite some interesting results as the dispensability of the PML NBs or the antagonistic role of the SV40 large T antigen. It had been interesting to explore how LT overcomes SMC5/6-mediated repression: Does LT prevent SIMC/SLF2 from interacting with SMC5/6? Or does it prevent SMC5/6 from binding the plasmid? Is the transcription-dependent plasmid topology altered in cells lacking SIMC/SLF2? And in cells expressing LT? In its current form, the study is confirmatory and preliminary. In agreement with this, the cartoons modelling results here and in the previous work look basically the same.

      Our previous study only examined the localization of SLF1 and SIMC1 at DNA lesions. The localization of these subcomplexes alone should not be used to define their roles in SMC5/6 localization. Indeed, the field is split in terms of whether Nse5/6-like complexes are required for ecDNA binding/loading, or regulation of SMC5/6 once bound. 

      We agree, determining the potential mechanism of action of LT in overcoming SMC5/6-based repression is an important next step. We believe it is unlikely due to blocking of the SMC5/6SIMC1/SLF2 interface, since SIMC1-SLF2 is required for SMC5/6 to localize at LT-induced foci. It will require the identification of any direct interactions with SMC5/6 subunits, and better methods for assessing SMC5/6 loading and activity on ecDNAs. Unlike HBx, Vpr, and BNRF1 it does not appear to induce degradation of SMC5/6, making it a more complex and interesting challenge. Also, the dispensability of PML NBs in plasmid silencing versus viral silencing raises multiple important questions about SMC5/6’s repression mechanism. 

      (3) There are some points about the presented data that need to be clarified.

      Thank you, we have addressed these points below, within the Recommendations for authors section.

      Reviewer #2 (Public review):

      Oracová et al. present data supporting a role for SIMC1/SLF2 in silencing plasmid DNA via the SMC5/6 complex. Their findings are of interest, and they provide further mechanistic detail of how the SMC5/6 complex is recruited to disparate DNA elements. In essence, the present report builds on the author's previous paper in eLife in 2022 (PMID: 36373674, "The Nse5/6-like SIMC1-SLF2 complex localizes SMC5/6 to viral replication centers") by showing the role of SIMC1/SLF2 in localisation of the SMC5/6 complex to plasmid DNA, and the distinct requirements as compared to recruitment to DNA damage foci. Although the findings of the manuscript are of interest, we are not yet convinced that the new data presented here represents a compelling new body of work and would better fit the format of a "research advance" article. In their previous paper, Oracová et al. show that the recruitment of SMC5/6 to SV40 replication centres is dependent on SIMC1, and specifically, that it is dependent on SIMC1 residues adjacent to neighbouring SLF2.

      We agree. We submitted this manuscript as a “Research Advance”, not as a standalone research article, given that it is an extension of our previous “Research Article” (1).

      Other comments

      (1) The mutations chosen in Figure 1 are quite extensive - 5 amino acids per mutant. In addition, they are in many cases 'opposite' changes, e.g., positive charge to negative charge. Is the effect lost if single mutations to an alanine are made?

      The mutations were chosen to test and validate the predicted SIMC1-SLF2-SMC6 structure i.e. the contact point between the conserved patch of SIMC1-SLF2 and SMC6. Multiple mutations and charge inversions increased the chance of disrupting the extensive interface. In this respect, the mutations were successful and informative, confirming the requirement of this region in specifically contacting SMC6. Whilst alanine scanning mutations are possible, we believe that they would not add to, or detract from, our validation of the predicted SIMC1-SLF2-SMC6 interface.

      (2) In Figure 2c, it isn't clear from the data shown that the 'SLF2-only' mutations in SMC6 result in a substantial reduction in SIMC1/SLF2 binding.

      To clarify the difference between wild-type and SLF2-only mutations in SIMC1-SLF2 interaction, we have performed an image volume analysis. This shows that the SLF2-facing SMC6 mutant reduces its interaction with SIMC1 (to 44% of WT) and SLF2 (to 21% of WT). The reduction in both SIMC1 and SLF2 interaction with SMC6 SLF2-facing mutant is expected, since SIMC1 and SLF2 are an interdependent heterodimer.  

      Author response table 1.

      (3) In the GFP reporter assays (e.g. Figure 3), median fluorescence is reported - was there any observed difference in the percentage of cells that are GFP positive?

      Yes, as expected when the GFP plasmid is not actively repressed, the percent of GFP positive cells differs in each cell line – in the same trend as GFP intensity

      (4) The potential role of the large T antigen as an SMC5/6 evasion factor is intriguing. However, given the role of the large T antigen as a transcriptional activator, caution is required when interpreting enhanced GFP fluorescence. Antagonism of the SMC5/6 complex in this context might be further supported by ChIP experiments in the presence or absence of large T. Can large T functionally substitute for HBx or HIV-Vpr?

      We agree, the potential role of LT in SMC5/6 antagonism is interesting. We did state in the text “While LT is known to be a promiscuous transcriptional activator (2,3) that does not rule out a co-existing role in antagonizing SMC5/6. Indeed, these findings are reminiscent of HBx from HBV and Vpr of HIV-1, both of which are known promiscuous transcriptional activators that also directly antagonize SMC5/6 to relieve transcriptional repression (4-10).“ We have tried ChIP experiments, but found these to be unreliable in assessing SMC5/6 association with plasmid DNA. Given the many disparate targets of LT, HBx and Vpr (other than SMC5/6), it seems unlikely that LT could functionally substitute for HBx and Vpr in supporting HBV and HIV-1 infections. Whilst certainly an interesting future question, we believe it is beyond the scope of this study.

      (5) In Figure 5c, the apparent molecular weight of large T and SMC6 appears to change following transfection of GFP-SMC5 - is there a reason for this?

      We are not certain as to what causes the molecular weight shift, but it is not specifically related to GFPSMC5 transfection. Rather, it appears to be a general effect of the pulldown. Indeed, a very weak “background” band of LT is seen in the GFP only pulldown, which also runs at a “higher” molecular weight, as in the GFP-SMC5 pulldown. We believe that the effect is instead related to gel mobility in the wells that contain post pulldown proteins and different buffers. We have also seen similar effects using different protein-protein interaction pairs. 

      Reviewer #3 (Public review):

      Summary:

      This study by the Boddy and Otomo laboratories further characterizes the roles of SMC5/6 loader proteins and related factors in SMC5/6-mediated repression of extrachromosomal circular DNA. The work shows that mutations engineered at an AlphaFold-predicted protein-protein interface formed between the loader SLF2/SIMC1 and SMC6 (similar to the interface in the yeast counterparts observed by cryo-EM) prevent co-IP of the respective proteins. The mutations in SLF2 also hinder plasmid DNA silencing when expressed in SLF2-/- cell lines, suggesting that this interface is needed for silencing. SIMC1 is dispensable for recruitment of SMC5/6 to sites of DNA damage, while SLF1 is required, thus separating the functions of the two loader complexes. Preventing SUMOylation (with a chemical inhibitor) increases transcription from plasmids but does not in SLF2-deleted cell lines, indicating the SMC5/6 silences plasmids in a SUMOylation dependent manner. Expression of LT is sufficient for increased expression, and again, not additive or synergistic with SIMC1 or SLF2 deletion, indicating that LT prevents silencing by directly inhibiting 5/6. In contrast, PML bodies appear dispensable for plasmid silencing.

      Strengths:

      The manuscript defines the requirements for plasmid silencing by SMC5/6 (an interaction of Smc6 with the loader complex SLF2/SIMC1, SUMOylation activity) and shows that SLF1 and PML bodies are dispensable for silencing. Furthermore, the authors show that LT can overcome silencing, likely by directly binding to (but not degrading) SMC5/6.

      Weaknesses:

      (1) Many of the findings were expected based on recent publications.

      There have been no manuscripts describing the role of SIMC1-SLF2 in ecDNA silencing. There have been studies describing SLF2’s roles in ecDNA silencing, but these suggested SLF2 had an SLF1 independent role, with no mention of an alternate Nse5-like cofactor. Our earlier study in eLife (1) described the identification of SIMC1 as an Nse5-like cofactor for SLF2 but did not test potential roles of the complex in ecDNA silencing. Also, the apparent dispensability of PML NBs in plasmid silencing (in U2OS cells) was unexpected based on recent publications. Finally, SV40 LT has not previously been implicated in SMC5/6 inhibition, which may occur through novel mechanisms.

      (2) While the data are consistent with SIMC1 playing the main function in plasmid silencing, it is possible that SLF1 contributes to silencing, especially in the absence of SIMC1. This would potentially explain the discrepancy with the data reported in ref. 50. SLF2 deletion has a stronger effect on expression than SIMC1 deletion in many but not all experiments reported in this manuscript. A double mutant/deletion experiments would be useful to explore this possibility.

      It is interesting to note that the data in ref. 50 (11) is also at odds with that in ref. 45 (8) in terms of defining a role for SLF1 in the silencing of unintegrated HIV-1 DNA. The Irwan study showed that SLF1 deficient cells exhibit increased expression of a reporter gene from unintegrated HIV-1, whereas the Dupont study found that SLF1 deletion, unlike SLF2 deletion, has no effect. It is unclear what the basis of this discrepancy is. In line with the Dupont study, we found no effect of SLF1 deletion on plasmid expression (Figure 4B), whereas SLF2 deletion increased reporter expression (Figure 3A/B). It is possible that SLF1 could support some plasmid silencing in the absence of SIMC1, especially considering the gross structural similarity in their C-terminal Nse5-like domains. However, we have been unable to generate double-knockout SIMC1 and SLF1 cells to test such a possibility, and shSLF1 has been ineffective. 

      (3) SLF2 is part of both types of loaders, while SLF1 and SIMC1 are specific to their respective loaders. Did the authors observe differences in phenotypes (growth, sensitivities to DNA damage) when comparing the mutant cell lines or their construction? This should be stated in the manuscript.

      We have not observed significant differences in the growth rates of each cell line, and DNA damage sensitivities are as yet untested.   

      (4) It would be desirable to have control reporter constructs located on the chromosome for several experiments, including the SUMOylation inhibition (Figures 5A and 5-S2) and LT expression (Figure 5D) to exclude more general effects on gene expression.

      We have repeated all GFP reporter assays using integrated versus episomal plasmid DNA. A seminal study by Decorsière et al. (6) showed that SMC5/6 degradation by HBx of HBV increased transcription of episomal but not chromosomally integrated reporters. In line with this data, the deletion of SLF2 does not notably impact the expression of our GFP reporter construct when it is genomically integrated (Figure 3—figure supplement 1C).  

      Somewhat surprisingly, given the generally transcriptionally repressive roles of SUMO, inhibition of the SUMO pathway with SUMOi did not significantly impact the expression of our genomically integrated GFP reporter, versus the episomal plasmid (Figure 5—figure supplement 1C). Finally, the expression of SV40 LT, which enhances plasmid reporter expression (Figure 5D), also did not notably affect expression of the same reporter when located in the genome (Figure 5—figure supplement 3B). This is an interesting result, which is in line with an early study showing that HBx of HBV induces transcription from episomal, but not chromosomally integrated reporters (12). This further suggests that SV40 LT acts similarly to other early viral proteins like HBx and Vpr to counteract or bypass SMC5/6 restriction, amongst their multifaceted functions. Clearly, further analyses are needed to define mechanisms of LT in counteracting SMC5/6, but they do not appear to include complex degradation as seen with HBx and Vpr.  

      (5) Figure 5A: There appears to be an increase in GFP in the SLF2-/- cells with SUMOi? Is this a significant increase?

      No significant difference was found between WT, SIMC1-/- or SLF2-/- when treated with SUMOi (p>0.05). The p-value is 0.0857 (when comparing SLF2-/- to WT in the SUMOi condition) This is described in the figure legend to Figure 5.

      (6) The expression level of SFL2 mut1 should be tested (Figure 3B).

      Full length SLF2 (WT or mutants) has been undetectable by western analyses. However, truncated SLF2 mut1 expresses well and binds SIMC1 but not SMC6 (Figure 1C). Moreover, full length SLF2 mut1 expression was confirmed by qPCR – showing a somewhat higher expression level than SLF2 WT (Figure 3—figure supplement 1B).  

      Reviewer #1 (Recommendations for the authors):

      There are some points about the presented data that need to be clarified.

      (1) Figures 3, 4B, and 5. The authors should rule out the possibility that the reported effects on transcription were due to alterations in plasmid number. This is particularly important, taking into account the importance of SMC5/6 in DNA replication.

      We used qPCR to assess plasmid copy number versus genomic DNA in our cell lines, testing at 72 hours post transfection to avoid any impact of cytosolic DNA (13). Our qPCR data show that there is no significant impact on plasmid copy number across our cell lines i.e. WT and SLF2 null.  SMC5/6 has a positive role in DNA replication progression on the genome (e.g. (14)), so loss of SMC5/6 “targeting” in SIMC1 and SLF2 null cells would be unlikely to promote replication fork progression per se. 

      (2) Figure S1A. In contrast to the statement in the text, the SIMC1-combo control is affected in its binding to SLF2; however, it is not affected in its binding to SMC6. This is somehow unexpected because it suggests that the solenoid-like structure is not required for SMC6 binding, just specific patches at either SIMC or SLF2. This should be commented on.

      We appreciate the reviewer’s observation regarding the discrepancy between Figure S1A and the text. This was our oversight. The data show that SLF2 recovery was reduced in the pull-down with the SIMC1 combo control mutant, while SLF2 expression was unchanged. Because SLF2 or SIMC1 variants that fail to associate typically show poor expression (1), these findings suggest that the SIMC1 combo control mutant associates with SLF2, albeit more weakly. Since the mutations were introduced into surface residues of SIMC1, it is not immediately clear how they would weaken the interaction or destabilize the complex. In contrast, SMC6 was fully recovered with the SIMC1 combo control mutant, indicating that the SIMC1–SMC6 interaction remains stable without stoichiometric SLF2. This may reflect direct recognition of a SIMC1 binding epitope or stabilization of its solenoid structure by SMC6, although this interpretation remains uncertain given the unstable nature of free SIMC1 and SLF2. Alternatively, SMC6 may have co-sedimented with the SIMC1 combo control mutant together with SLF2, which was initially retained but subsequently lost during washing, whereas SMC6 remained due to its limited solubility in the absence of other SMC5/6 subunits. While further mechanistic analysis will require purified SMC5/6 components, our data support the AlphaFold-based model by demonstrating that SIMC1 mutations on the non–SMC6-contacting surface retain association with SMC6. The text has been revised accordingly.

      (3) The SLF2-only mutant has alterations that affect interactions with both SLF2 and SIMC1. Is it not another Mixed mutant?

      We appreciate the reviewer’s observation regarding the discrepancy between the mutant name (“SLF2only”) and its description (“while N947 forms salt bridges with SIMC1”). The previous statement was inaccurate due to a misinterpretation of several AlphaFold models. Across these models, the SIMC1– SLF2 interface residues remain largely consistent, but the SIMC1 residue R470 exhibits positional variability—contacting N947 in some models but not in others. Given this variability and the absence of an experimental structure, we have revised the text to avoid overinterpretation. Because the N947 side chain is oriented toward SLF2 and consistently forms polar contacts with the H1148 side chain and G1149 backbone, we have renamed this mutant “SLF2-facing,” which more accurately describes its modeled environment. The other mutants are likewise renamed “SIMC1-facing” and “SIMC1–SLF2groove-facing,” providing a clearer and more consistent description of the interface.

      (4) The SLF2-only mutant still displays clear interactions with SMC6. Can this be explained with the AlphaFold model?

      SIMC1 may contribute more substantially to SMC6 binding than SLF2, consistent with our mutagenesis results. However, the energetic contributions of individual residues or proteins cannot be quantitatively inferred from structural models alone. Comprehensive experimental and computational analyses would be required to address this point.

      (5) The conclusions about the role of SUMOylation are vague; it is already known that its general effect on transcription repression, and the authors already demonstrated that SIMC interacts with SUMO pathway factors. Concerning the epistatic effect, the experiment should be done at a lower inhibitor concentration; at 100 nM there is not much margin to augment according to the kinetics analysis in Figure S5.

      The SUMO pathway is indeed thought to be generally repressive for transcription. Notably, in response to a suggestion from Reviewer 3 (public review point 4), we have repeated several of our GFP expression assays using cells with the GFP reporter plasmid integrated into the genome (please see Figure 3—figure supplement 1C; Figure 5—figure supplement 1C; Figure 5—figure supplement 3B). This type of integrated reporter does not show elevated expression following inhibition of the SMC5/6 complex, unlike ecDNAs (6,10). Interestingly, SUMOi, LT expression, and SLF2 knockout also did not notably impact the expression of our integrated GFP reporter (Figure 3—figure supplement 1C; Figure 5—figure supplement 1C; Figure 5—figure supplement 3B, unlike that of the plasmid (ecDNA) reporter. Given the “general” inhibitory effect of SUMO on transcription, the SUMOi result was not expected, and it opens further interesting avenues for study. 

      In Figure 5—figure supplement 1A, 100 nM SUMOi increases reporter expression well below the highest SUMOi dose. We believe that the ~3-4 fold induction of GFP expression in SLF2 null cells, if independent of SUMOylation, should further increase GFP expression. The impact of SUMOylation on GFP reporter expression remains “vague”, but our data indicate that SMC5/6 operates within SUMO’s “umbrella” function and provides a starting point for more mechanistic dissection. 

      (6) Figure 5C. Why is the size different between Input versus GFP-PD?

      Please see our response to this question above: reviewer 2, point (5)

      Reviewer #2 (Recommendations for the authors):

      If further data could be provided to extend on that which is presented, then publication as a 'standalone research article' may be appropriate, but not in its present form.

      We submitted this manuscript as a “Research Advance” not as a standalone research article, given that it was an extension of our previous research article (1).

      Reviewer #3 (Recommendations for the authors):

      (1) The term 'LT' should be defined in the title

      We have updated the title accordingly.  

      (2) This reviewer found the nomenclature of the SMC6 mutants confusing (SIMC1-only...). Either rephrase or define more clearly in the text and the figures.

      We agree with the reviewer and have renamed the mutants as “SIMC1-facing”, “SLF2-facing,”, and “SIMC1–SLF2-groove-facing”.

      (3) The authors could better emphasize that LT blocks silencing in trans (not only on its cognate target sequence in cis). This is consistent with the observed direct binding to SMC5/6.

      We appreciate the suggestion to further emphasize the impact of LT on plasmid silencing. We did not want to overstate its impact at this time because we do not know if it directly binds SMC5/6 or indeed affects SMC5/6 function more broadly. LT expression like HBx, does cause induction of a DNA damage response, but we cannot at this point tie that response to SMC5/6 inhibition alone.

      (4) Figure 5 S1: the merge looks drastically different. Is DAPI omitted in the wt merge image?

      Thank you for noting this issue. We have corrected the image, which was impacted by the use of an underexposed DAPI image.  

      (5) Figure 1: how is the structure in B oriented relative to A? A visual guide would be helpful.

      We have added arrows to indicate the view orientation and rotational direction to turn A to B.

      (6) Line 126, unclear what "specificity" here means.

      We have revised the sentence without this word, which now starts with “To confirm the SIMC1-SMC6 interface, we introduced….”

      (7) Line 152, The statement implies that the conserved residues are needed for loader subunits interactions ('mediating the SIMC1-SLF2 interaction"). Does Figure 1C not show that the residues are not important? Please clarify.

      Thank you for noting this writing error. We have corrected the sentence to provide the intended meaning. It now reads "Collectively, these results confirm that the conserved surface patch of SIMC1SLF2 is essential for SMC6 binding.” 

      References

      (1) Oravcova M, Nie M, Zilio N, Maeda S, Jami-Alahmadi Y, Lazzerini-Denchi E, Wohlschlegel JA, Ulrich HD, Otomo T, Boddy MN. The Nse5/6-like SIMC1-SLF2 complex localizes SMC5/6 to viral replication centers. Elife. 2022;11. PMCID: PMC9708086

      (2) Sullivan CS, Pipas JM. T antigens of simian virus 40: molecular chaperones for viral replication and tumorigenesis. Microbiol Mol Biol Rev. 2002;66(2):179-202. PMCID: PMC120785

      (3) Gilinger G, Alwine JC. Transcriptional activation by simian virus 40 large T antigen: requirements for simple promoter structures containing either TATA or initiator elements with variable upstream factor binding sites. J Virol. 1993;67(11):6682-8. PMCID: PMC238107

      (4) Qadri I, Conaway JW, Conaway RC, Schaack J, Siddiqui A. Hepatitis B virus transactivator protein, HBx, associates with the components of TFIIH and stimulates the DNA helicase activity of TFIIH. Proc Natl Acad Sci U S A. 1996;93(20):10578-83. PMCID: PMC38195

      (5) Aufiero B, Schneider RJ. The hepatitis B virus X-gene product trans-activates both RNA polymerase II and III promoters. EMBO J. 1990;9(2):497-504. PMCID: PMC551692

      (6) Decorsiere A, Mueller H, van Breugel PC, Abdul F, Gerossier L, Beran RK, Livingston CM, Niu C, Fletcher SP, Hantz O, Strubin M. Hepatitis B virus X protein identifies the Smc5/6 complex as a host restriction factor. Nature. 2016;531(7594):386-9. 

      (7) Murphy CM, Xu Y, Li F, Nio K, Reszka-Blanco N, Li X, Wu Y, Yu Y, Xiong Y, Su L. Hepatitis B Virus X Protein Promotes Degradation of SMC5/6 to Enhance HBV Replication. Cell Rep. 2016;16(11):2846-54. PMCID: PMC5078993

      (8) Dupont L, Bloor S, Williamson JC, Cuesta SM, Shah R, Teixeira-Silva A, Naamati A, Greenwood EJD, Sarafianos SG, Matheson NJ, Lehner PJ. The SMC5/6 complex compacts and silences unintegrated HIV-1 DNA and is antagonized by Vpr. Cell Host Microbe. 2021;29(5):792-805 e6. PMCID: PMC8118623

      (9) Felzien LK, Woffendin C, Hottiger MO, Subbramanian RA, Cohen EA, Nabel GJ. HIV transcriptional activation by the accessory protein, VPR, is mediated by the p300 co-activator. Proc Natl Acad Sci U S A. 1998;95(9):5281-6. PMCID: PMC20252

      (10) Diman A, Panis G, Castrogiovanni C, Prados J, Baechler B, Strubin M. Human Smc5/6 recognises transcription-generated positive DNA supercoils. Nat Commun. 2024;15(1):7805. PMCID: PMC11379904

      (11) Irwan ID, Bogerd HP, Cullen BR. Epigenetic silencing by the SMC5/6 complex mediates HIV-1 latency. Nat Microbiol. 2022;7(12):2101-13. PMCID: PMC9712108

      (12) van Breugel PC, Robert EI, Mueller H, Decorsiere A, Zoulim F, Hantz O, Strubin M. Hepatitis B virus X protein stimulates gene expression selectively from extrachromosomal DNA templates. Hepatology. 2012;56(6):2116-24. 

      (13) Lechardeur D, Sohn KJ, Haardt M, Joshi PB, Monck M, Graham RW, Beatty B, Squire J, O'Brodovich H, Lukacs GL. Metabolic instability of plasmid DNA in the cytosol: a potential barrier to gene transfer. Gene Ther. 1999;6(4):482-97. 

      (14) Gallego-Paez LM, Tanaka H, Bando M, Takahashi M, Nozaki N, Nakato R, Shirahige K, Hirota T. Smc5/6-mediated regulation of replication progression contributes to chromosome assembly during mitosis in human cells. Mol Biol Cell. 2014;25(2):302-17. PMCID: PMC3890350

    1. Author response:

      The following is the authors’ response to the previous reviews

      Reviewer #1 (Public Review): 

      Summary: 

      This paper by Schommartz and colleagues investigates the neural basis of memory reinstatement as a function of both how recently the memory was formed (recent, remote) and its development (children, young adults). The core question is whether memory consolidation processes as well as the specificity of memory reinstatement differ with development. A number of brain regions showed a greater activation difference for recent vs. remote memories at the long versus shorter delay specifically in adults (cerebellum, PHG, LOC). A different set showed decreases in the same comparison, but only in children (precuneus, RSC). The authors also used neural pattern similarity analysis to characterize reinstatement, though still in this revised paper I have substantive concerns about how the analyses were performed. While scene-specific reinstatement decreased for remote memories in both children and adults, claims about its presence cannot be made given the analyses. Gist-level reinstatement was observed in children but not adults, but I also have concerns about this analysis. Broadly, the behavioral and univariate findings are consistent with the idea memory consolidation differs between children and adults in important ways, and takes a step towards characterizing how.

      Strengths: 

      The topic and goals of this paper are very interesting. As the authors note, there is little work on memory consolidation over development, and as such this will be an important data point in helping us begin to understand these important differences. The sample size is great, particularly given this is an onerous, multi-day experiment; the authors are to be commended for that. The task design is also generally well controlled, for example as the authors include new recently learned pairs during each session.  

      Weaknesses: 

      As noted above and in my review of the original submission, the pattern similarity analysis for both item and category-level reinstatement were performed in a way that is not interpretable given concerns about temporal autocorrelation within scanning run.Unfortunately these issues remain of concern in this revision because they were not rectified. Most of my review focuses on this analytic issue, though I also outline additional concerns. 

      (1) The pattern similarity analyses are largely uninterpretable due to how they were performed. 

      (a) First, the scene-specific reinstatement index: The authors have correlated a neural pattern during a fixation cross (delay period) with a neural pattern associated with viewing a scene as their measure of reinstatement. The main issue with this is that these events always occurred back-to-back in time. As such, the two patterns will be similar due simply to the temporal autocorrelation in the BOLD signal. Because of the issues with temporal autocorrelation within scanning run, it is always recommended to perform such correlations only across different runs. In this case, the authors always correlated patterns extracted from the same run, and which moreover have temporal lags that are perfectly confounded with their comparison of interest (i.e., from Fig 4A, the "scene-specific" comparisons will always be back-to-back, having a very short temporal lag; "set-based" comparisons will be dispersed across the run, and therefore have a much higher lag). The authors' within-run correlation approach also yields correlation values that are extremely high - much higher than would be expected if this analysis was done appropriately. The way to fix this would be to restrict the analysis to only cross-run comparisons, which is not possible given the design. 

      To remedy this, in the revision the authors have said they will refrain from making conclusions about the presence of scene-specific reinstatement (i.e., reinstatement above baseline). While this itself is an improvement from the original manuscript, I still have several concerns. First, this was not done thoroughly and at times conclusions/interpretations still seem to imply or assume the presence of scene reinstatement (e.g., line 979-985, "our research supports the presence of scene-specific reinstatement in 5-to-7-year-old children"; line 1138). 

      We thank the reviewers for pointing out that there are inconsistencies in our writing. We agree that we cannot make any claims about the baseline level of scene-specific reinstatement. To reiterate, our focus is on the changes in reinstatement over time (30 minutes, 24 hours, and two weeks after learning), which showed a robust decrease. Importantly, scenespecific reinstatement indices for recent items — tested on different days — did not significantly differ, as indicated by non-significant main effects of Session (all p > .323) and Session x ROI interactions (all p > .817) in either age group. This supports our claim that temporal autocorrelation is stable and consistent across conditions and that the observed decline in scene-specific reinstatement reflects a time-dependent change in remote retrieval. We have revised the highlighted passages, accordingly, emphasizing the delay-related decrease in scene-specific reinstatement rather than its absolute magnitude. 

      Second, the authors' logic for the neural-behavioural correlations in the PLSC analysis involved restricting to regions that showed significant reinstatement for the gist analysis, which cannot be done for the analogous scene-specific reinstatement analysis. This makes it challenging to directly compare these two analyses since one was restricted to a small subset of regions and only children (gist), while scene reinstatement included both groups and all ROIs. 

      We thank the reviewer for pointing this out and want to clarify that it was not our intention to directly compare these analyses. For the neural-behavioral correlations, we included only those regions identified based on gist-like representations baseline, whereas for scene-specific reinstatement, we included all regions due to the absence of such a baseline. The primary aim of the PLSC analysis was to identify a set of regions that, after a stringent permutation and bootstrapping procedure, form a latent variable that explains a significant proportion of variance in behavioral performance across all participants. 

      Third, it is also unclear whether children and adults' values should be directly comparable given pattern similarity can be influenced by many factors like motion, among other things. 

      We thank the reviewer for raising this important point. In our multivariate analysis, we included confounding regressors specifically addressing motion-related artefacts. Following recent best practices for mitigating motion-related confounding factors in both adult and pediatric fMRI data (Ciric et al., 2017; Esteban et al., 2020; Jones et al., 2021; Satterthwaite et al., 2013), we implemented the most effective motion correction strategies. 

      Importantly, our group × session interaction analysis focuses on relative changes in reinstatement over time rather than comparing absolute levels of pattern similarity between children and adults. This approach controls for potential baseline differences and instead examines whether the magnitude of delay-related changes differs across groups. We believe this warrants the comparison and ensures that our conclusions are not driven by group-level differences in baseline similarity or motion artifacts.

      My fourth concern with this analysis relates to the lack of regional specificity of the effects. All ROIs tested showed a virtually identical pattern: "Scene-specific reinstatement" decreased across delays, and was greater in children than adults. I believe control analyses are needed to ensure artifacts are not driving these effects. This would greatly strengthen the authors' ability to draw conclusions from the "clean" comparison of day 1 vs. day 14. (A) The authors should present results from a control ROI that should absolutely not show memory reinstatement effects (e.g., white matter?). Results from the control ROI should look very different - should not differ between children and adults, and should not show decreases over time. 

      (C) If the same analysis was performed comparing the object cue and immediately following fixation (rather than the fixation and the immediately following scene), the results should look very different. I would argue that this should not be an index of reinstatement at all since it involves something presented visually rather than something reinstated (i.e., the scene picture is not included in this comparison). If this control analysis were to show the same effects as the primary analysis, this would be further evidence that this analysis is uninterpretable and hopelessly confounded. 

      We appreciate the reviewer’s suggestion to strengthen the interpretation of our findings by including appropriate control analyses to rule out non-memory-related artifacts. In response, we conducted several control analyses, detailed below, which collectively support the specificity of the observed reinstatement effects. The report of the results is included in the manuscript (line 593-619).

      We checked that item reinstatement for incorrectly remembered trial did not show any session-related decline for any ROI. This indicates that the reinstatement for correctly remembered items is memory-related (see Fig. S5 for details). 

      We conducted additional analyses on three subregions of the corpus callosum (the body, genu, and splenium). The results of the linear mixed-effects models revealed no significant group effect (all p > .426), indicating no differences between children and adults. In contrast, all three ROIs showed a significant main effect of Session (all p < .001). However, post hoc analyses indicated that this effect was driven by differences between the recent and the Day 14 remote condition. The main contrasts of interest – recent vs. Day 1 remote and Day 1 remote vs. Day 14 remote – were not significant (all p > .080; see Table S10.4), suggesting that, unlike in other ROIs, there was no delay-related decrease in scene-specific reinstatement in these white matter regions.

      Then we repeated our analysis using the same procedure but replaced the “scene” time window with the “object” time window. The rationale for this control is that comparing the object cue to the immediately following fixation period should not reflect scene reinstatement, as the object and the reinstated scene rely on distinct neural representations. Accordingly, we did not expect a delay-related decrease in the reinstatement index. Consistent with this expectation, the analysis using the object – fixation similarity index – though also influenced by temporal autocorrelation – did not reveal any significant effect of session or delay in any ROI (all p > .059; see Table S9, S9.1).

      Together, these control analyses provide converging evidence that our findings are not driven by global or non-specific signal changes. We believe that these control analyses strengthen our interpretation about delay-related decrease in scene-specific reinstatement index. 

      (B) Do the recent items from day 1 vs. day 14 differ? If so, this could suggest something is different about the later scans (and if not, it would be reassuring). 

      The recent items tested on day 1 and day14 do not differ (all p. > .323). This effect remains stable across all ROIs.

      (b) For the category-based neural reinstatement: (1) This suffers from the same issue of correlations being performed within run. Again, to correct this the authors would need to restrict comparisons to only across runs (i.e., patterns from run 1 correlated with patterns for run 2 and so on). The authors in their response letter have indicated that because the patterns being correlated are not derived from events in close temporal proximity, they should not suffer from the issue of temporal autocorrelation. This is simply not true. For example, see the paper by Prince et al. (eLife 2022; on GLMsingle). This is not the main point of Prince et al.'s paper, but it includes a nice figure that shows that, using standard modelling approaches, the correlation between (same-run) patterns can be artificially elevated for lags as long as ~120 seconds (and can even be artificially reduced after that; Figure 5 from that paper) between events. This would affect many of the comparisons in the present paper. The cleanest way to proceed is to simply drop the within-run comparisons, which I believe the authors can do and yet they have not. Relatedly, in the response letter the authors say they are focusing mainly on the change over time for reinstatement at both levels including the gist-type reinstatement; however, this is not how it is discussed in the paper. They in fact are mainly relying on differences from zero, as children show some "above baseline" reinstatement while adults do not, but I believe there were no significant differences over time (i.e., the findings the authors said they would lean on primarily, as they are arguably the most comparable).  

      We thank the reviewer for this important comment regarding the potential inflation of similarity values due to within-run comparisons.

      To address the reviewer’s concern, we conducted an additional cross-run analysis for all correctly retrieved trials. The approach restricted comparisons to non-overlapping runs (run1run2, run2-run3, run1-run3). This analysis revealed robust gist-like reinstatement in children for remote Day 14 memories in the mPFC (p = .035) and vlPFC (p = .0007), in adults’ vlPFC remote Day 1 memories (p = .029), as well as in children and adults remote Day 1 memories in LOC (p < .02). A significant Session effect in both regions (mPFC: p = .026; vlPFC: p = .002) indicated increased reinstatement for long delay (Day 14) compared to short-delay and recent session (all p < .05). Given that the cross-run results largely replicate and reinforce the effects found previously with within-run, we believe that combining both sources of information is methodologically justified and statistically beneficial. Specifically, both approaches independently identified significant gist-like reinstatement in children’s mPFC and vlPFC (although within-run vlPFC effect (short delay: p = .038; long delay p = .047) did not survive multiple comparisons), particularly for remote memories. Including both withinrun and between-run comparisons increases the number of unique, non-repeated trial pairs, improving statistical power without introducing redundancy. While we acknowledge that same-run comparisons may be influenced by residual autocorrelation (as shown by Prince et al. 2022, eLife), we believe that our design mitigates this risk through consistency between within-run and cross-run results, long inter-trial intervals, and trial-wise estimation of activation. We have adjusted the manuscript, accordingly, reporting the combined analysis. We also report cross-run and within-run analysis separately in supplementary materials (Tables S12.1, S12.2, showing that they converge with the cross-run results and thus strengthen rather than dilute the findings. 

      As suggested, we now explicitly highlight the change over time as the central finding. We observe a clear increase in gist-like reinstatement from recent to remote memories in children, particularly in mPFC and vlPFC. These effects based on combined within- and cross-run comparisons, are now clearly stated in the main results and interpreted in the discussion accordingly. 

      (2) This analysis uses a different approach of comparing fixations to one another, rather than fixations to scenes. In their response letter and the revised paper, the authors do provide a bit of reasoning as to why this is the most sensible. However, it is still not clear to me whether this is really "reinstatement" which (in my mind) entails the re-evoking of a neural pattern initially engaged during perception. Rather, could this be a shared neural state that is category specific? 

      We thank the reviewer for raising this important conceptual point about whether our findings reflect reinstatement in the classical sense — namely, the reactivation of perceptual neural patterns — or a shared, category-specific state.

      While traditional definitions of reinstatement emphasize item-specific reactivation (e.g., Ritchey et al., 2013; Xiao et al., 2017) it is increasingly recognized that memory retrieval can also involve the reactivation of abstracted, generalized, or gist-like representations, especially as memories consolidate. Our analysis follows this view, aimed to capture how memory representations evolve over time, particularly in development.

      Several studies support this broader notion of gist-like reinstatement. For instance, Chen et al. (2017) showed that while event-specific patterns were reinstated across the default mode network and medial temporal lobe, inter-subject recall similarity exceeded encodingretrieval similarity, suggesting transformation and abstraction beyond perceptual reinstatement. Zhuang et al. (2021) further showed that loss of neural distinctiveness in the

      MTL over time predicted false memories, linking neural similarity to representational instability. This aligns with our finding that greater gist-like reinstatement is associated with lower memory accuracy.

      Ye et al. (2020) discuss how memory representations are reshaped post-encoding — becoming more differentiated, integrated, or weakened depending on task goals and neural resources. While their work focuses on adults, our previous findings (Schommartz et al., 2023) suggest that children’s neural systems (the same sample) are structurally immature, making them more likely to rely on gist-based consolidation (see Fandakova et al., 2019). Adults, by contrast, may retain more item-specific traces.

      Relatedly, St-Laurent & Buchsbaum (2019) show that with repeated encoding, neural memory representations become increasingly distinct from perception, suggesting that reinstatement need not mimic perception. We agree that reinstatement does not always reflect reactivation of low-level sensory patterns, particularly over long delays or in developing brains.

      Finally, while we did not correlate retrieval patterns directly with perceptual encoding patterns, we assessed neural similarity among retrieved items within vs. between categories, based on non-repeated, independently sampled trials. This approach is intended to capture the structure and delay-related transformation of mnemonic representations, especially in terms of how they become more schematic or gist-like over time. Our findings align conceptually with the results of Kuhl et al. (2012), who used MVPA to show that older and newer visual memories can be simultaneously reactivated during retrieval, with greater reactivation of older memories interfering with retrieval accuracy for newer memories. Their work highlights how overlapping category-level representations in ventral temporal cortex can reflect competition among similar memories, even in the absence of item-specific cues. In our developmental context, we interpret the increased neural similarity among category members in children as possibly reflecting such representational overlap or competition, where generalized traces dominate over item-specific ones. This pattern may reflect a shift toward efficient but less precise retrieval, consistent with developmental constraints on memory specificity and consolidation.

      In this context, we view our findings as evidence of memory trace reorganization — from differentiated, item-level representations toward more schematic, gist-like neural patterns (Sekeres et al., 2018), particularly in children. Our cross-run analyses further confirm that this is not an artifact of same-run correlations or low-level confounds. We have clarified this distinction and interpretation throughout the revised manuscript (see lines 144-158; 1163-1170).

      In any case, I think additional information should be added to the text to clarify that this definition differs from others in the literature. The authors might also consider using some term other than reinstatement. Again (as I noted in my prior review), the finding of no category-level reinstatement in adults is surprising and confusing given prior work and likely has to do with the operationalization of "reinstatement" here. I was not quite sure about the explanation provided in the response letter, as category-level reinstatement is quite widespread in the brain for adults and is robust to differences in analytic procedures etc. 

      We agree that our operationalization of "reinstatement" differs from more conventional uses of the term, which typically involve direct comparisons between encoding and retrieval phases, often with item-level specificity. As our analysis is based on similarity among retrieval-phase trials (fixation-based activation patterns) and focuses on within- versus between-category neural similarity, we agree that the term reinstatement may suggest a stronger encoding–retrieval mapping than we are claiming.

      To avoid confusion and overstatement, we have revised the terminology throughout the manuscript: we now refer to our measure as “gist-like representations” rather than “gist-like reinstatement.” This change better reflects the nature of our analysis — namely, that we are capturing shared neural patterns among category-consistent memories that may reflect reorganized or abstracted traces, especially after delay and in development.

      As the reviewer rightly points out, category-level reinstatement is well documented in adults (e.g., Kuhl & Chun, 2014; Tompary et al., 2020; Tompary & Davachi, 2017). The absence of such effects in our adult group may indeed reflect differences in study design, particularly our use of non-repeated, cross-trial comparisons based on fixation events. It may also reflect different consolidation strategies, with adults preserving more differentiated or item-specific representations, while children form more schematic or generalizable representations — a pattern consistent with our interpretation and supported by prior work (Fandakova et al., 2019; Sekeres et al., 2018) 

      We have updated the relevant sections of the manuscript (Results, Discussion (particularly lines 1163- 1184), and Figure captions) to clarify this terminology shift and explicitly contrast our approach with more standard definitions of reinstatement. We hope this revision provides the needed conceptual clarity while preserving the integrity of our developmental findings.

      (3) Also from a theoretical standpoint-I'm still a bit confused as to why gist-based reinstatement would involve reinstatement of the scene gist, rather than the object's location (on the screen) gist. Were the locations on the screen similar across scene backgrounds from the same category? It seems like a different way to define memory retrieval here would be to compare the neural patterns when cued to retrieve the same vs. similar (at the "gist" level) vs. different locations across object-scene pairs. This is somewhat related to a point from my review of the initial version of this manuscript, about how scene reinstatement is not necessary. The authors state that participants were instructed to reinstate the scene, but that does not mean they were actually doing it. The point that what is being measured via the reinstatement analyses is actually not necessary to perform the task should be discussed in more detail in the paper. 

      We appreciate the reviewer’s thoughtful theoretical question regarding whether our measure of “gist-like representations” might reflect reinstatement of spatial (object-location) gist, rather than scene-level gist. We would like to clarify several key points about our task design and interpretation:

      (1) Object locations were deliberately varied and context dependent.

      In our stimulus set, each object was embedded in a rich scene context, and the locations were distributed across six distinct possible areas within each scene, with three possible object placements per location. These placements were manually selected to ensure realistic and context-sensitive positioning of objects within the scenes. Importantly, locations were not fixed across scenes within a given category. For example, objects placed in “forest” scenes could appear in different screen locations across different scene exemplars (e.g., one in the bottom-left side, another floating above). Therefore, the task did not introduce a consistent spatial schema across exemplars from the same scene category that could give rise to a “location gist.”

      (2) Scene categories provided consistent high-level contextual information.

      By contrast, the scene categories (e.g., farming, forest, indoor, etc.) provided semantically coherent and visually rich contextual backgrounds that participants could draw upon during retrieval. This was emphasized in the instruction phase, where participants were explicitly encouraged to recall the whole scene based on the stories they created during learning (not just the object or its position). While we acknowledge that we cannot directly verify the reinstated content, this instruction aligns with prior studies showing that scene and context reinstatement can occur even without direct task relevance (e.g., Kuhl & Chun, 2014; Ritchey et al., 2013).

      (3) Our results are unlikely to reflect location-based reinstatement.

      If participants had relied on a “location gist” strategy, we would have expected greater neural similarity across scenes with similar spatial layouts, regardless of category. However, our design avoids this confound by deliberately varying locations across exemplars within categories. Additionally, our categorical neural similarity measure contrasted within-category vs. between-category comparisons — making it sensitive to shared contextual or semantic structure, not simply shared screen positions.

      Considering this, we believe that the neural similarity observed in the mPFC and vlPFC in children at long delay reflects the emergence of scene-level, gist-like representations, rather than low-level spatial regularities. Nevertheless, we now clarify this point in the manuscript and explicitly discuss the limitation that reinstatement of scene context was encouraged but not required for successful task performance.

      Future studies could dissociate spatial and contextual components of reinstatement more directly by using controlled spatial overlap or explicit location recall conditions. However, given the current task structure, location-based generalization is unlikely to account for the category-level similarity patterns we observe.

      (2) Inspired by another reviewer's comment, it is unclear to me the extent to which age group differences can be attributed to differences in age/development versus memory strength. I liked the other reviewer's suggestions about how to identify and control for differences in memory strength, which I don't think the authors actually did in the revision. They instead showed evidence that memory strength does seem to be lower in children, which indicates this is an interpretive confound. For example, I liked the reviewer's suggestion of performing analyses on subsets of participants who were actually matched in initial learning/memory performance would have been very informative. As it is, the authors didn't really control for memory strength adequately in my opinion, and as such their conclusions about children vs. adults could have been reframed as people with weak vs. strong memories. This is obviously a big drawback given what the authors want to conclude. Relatedly, I'm not sure the DDM was incorporated as the reviewer was suggesting; at minimum I think the authors need to do more work in the paper to explain what this means and why it is relevant. (I understand putting it in the supplement rather

      than the main paper, but I still wanted to know more about what it added from an interpretive perspective.) 

      We appreciate the reviewer’s thoughtful concerns regarding potential confounding effects of memory strength on the observed age group differences. This is indeed a critical issue when interpreting developmental findings.

      While we agree that memory strength differs between children and adults — and our own DDM-based analysis confirms this, mirroring differences observed in accuracy — we would like to emphasize that these differences are not incidental but rather reflect developmental changes in the underlying memory system. Given the known maturation of both structural and functional memory-related brain regions, particularly the hippocampus and prefrontal cortex, we believe it would be theoretically inappropriate to control for memory strength entirely, as doing so would remove variance that is central to the age-related neural effects we aim to understand.

      To address the reviewer's concern empirically, we conducted an additional control analysis in which we subsampled children to include only those who reached learning criterion after two cycles (N = 28 out of 49 children, see Table S1.1, S1.2, Figure S1, Table S9.1), thereby selecting a high-performing subgroup. Importantly, this subsample replicated behavioral and neural results to the full group. This further suggests that the observed age group differences are not merely driven by differences in memory strength.

      As abovementioned, the results of the DDM support our behavioral findings, showing that children have lower drift rates for evidence accumulation, consistent with weaker or less accessible memory representations. While these results are reported in the Supplementary Materials (section S2.1, Figure S2, Table S2), we agree that their interpretive relevance should be more clearly explained in the main text. We have therefore updated the Discussion section to explicitly state how the DDM results provide converging evidence for our interpretation that developmental differences in memory quality — not merely strategy or task performance — underlie the observed neural differences (see lines 904-926).

      In sum, we view memory strength not as a confound to be removed, but as a meaningful and theoretically relevant factor in understanding the emergence of gist-like representations in children. We have clarified this interpretive stance in the revised manuscript and now discuss the role of memory strength more explicitly in the Discussion.

      (3) Some of the univariate results reporting is a bit strange, as they are relying upon differences between retrieval of 1- vs. 14-day memories in terms of the recent vs. remote difference, and yet don't report whether the regions are differently active for recent and remote retrieval. For example in Figure 3A, neither anterior nor posterior hippocampus seem to be differentially active for recent vs. remote memories for either age group (i.e., all data is around 0). Precuneus also interestingly seems to show numerically recent>remote (values mostly negative), whereas most other regions show the opposite. This difference from zero (in either direction) or lack thereof seems important to the message. In response to this comment on the original manuscript, the authors seem to have confirmed that hippocampal activity was greater during retrieval than implicit baseline. But this was not really my question - I was asking whether hippocampus is (and other ROIs in this same figure are) differently engaged for recent vs. remote memories.

      We thank the reviewer for bringing up this important point. Our previous analysis showed that both anterior and posterior regions of the hippocampus, anterior parahippocampal gyrus and precuneus exhibited significant activation from zero in children and adults for correctly remembered items (see Fig. S2, Table S7 in Supplementary Materials). Based on your suggestion, our additional analysis showed: 

      (i) The linear mixed-effects model for correctly remembered items showed no significant interaction effects (group x session x memory age (recent, remote)) for the anterior hippocampus (all p > .146; see Table S7.1).

      (ii) For the posterior hippocampus, we observed a significant main effect of group (F(1,85),   = 5.62, p = .038), showing significantly lower activation in children compared to adults (b = .03, t = -2.34, p = .021). No other main or interaction effects were significant (all p > .08; see Table S7.1).

      (iii) For the anterior PHG, that also showed no significant remote > recent difference, the model showed that there was indeed no difference between remote and recent items across age groups and delays (all p > .194; Table S7.1). 

      Moreover, when comparing recent and remote hippocampal activation directly, there were no significant differences in either group (all FDR-adjusted p > .116; Table S7.2), supporting the conclusion that hippocampal involvement was stable across delays for successfully retrieved items. 

      In contrast, analysis of unsuccessfully remembered items showed that hippocampal activation was not significantly different from zero in either group (all FDR-adjusted p > .052; Fig. S2.1, Table S7.1), indicating that hippocampal engagement was specific to successful memory retrieval.

      To formally test whether hippocampal activation differs between remembered and forgotten items, we ran a linear mixed-effects model with Group, Memory Success (remembered vs. forgotten), and ROI (anterior vs. posterior hippocampus) as fixed effects. This model revealed a robust main effect of memory success (F(1,1198) = 128.27, p < .001), showing that hippocampal activity was significantly higher for remembered compared to forgotten items (b = .06, t(1207) = 11.29, p < .001; Table S7.3). 

      As the reviewer noted, precuneus activation was numerically higher for recent vs. remote items, and this was confirmed in our analysis. While both recent and remote retrieval elicited significantly above-zero activation in the precuneus (Table S7.2), activation for recent items was significantly higher than for remote items, consistent across both age groups.

      Taken together, these analyses support the conclusion that hippocampal involvement in successful retrieval is sustained across delays, while other ROIs such as the precuneus may show greater engagement for more recent memories. We have now updated the manuscript text ( lines 370-390) and supplementary materials to reflect these findings more clearly, as well as to clarify the distinction between activation relative to baseline and memory-agerelated modulation.

      (4) Related to point 3, the claims about hippocampus with respect to multiple trace theory feel very unsupported by the data. I believe the authors want to conclude that children's memory retrieval shows reliance on hippocampus irrespective of delay, presumably because this is a detailed memory task. However the authors have not really shown this; all they have shown is that hippocampal involvement (whatever it is) does not vary by delay. But we do not have compelling evidence that the hippocampus is involved in this task at all. That hippocampus is more active during retrieval than implicit baseline is a very low bar and does not necessarily indicate a role in memory retrieval. If the authors want to make this claim, more data are needed (e.g., showing that hippocampal activity during retrieval is higher when the upcoming memory retrieval is successful vs. unsuccessful). In the absence of this, I think all the claims about multiple trace theory supporting retrieval similarly across delays and that this is operational in children are inappropriate and should be removed. 

      We thank the reviewer for pointing this out. We agree that additional analysis of hippocampal activity during successful and unsuccessful memory retrieval is warranted. This will provide stronger support for our claim that strong, detailed memories during retrieval rely on the hippocampus in both children and adults. Our previously presented results on the remote > recent univariate signal difference in the hippocampus (p. 14-18; lines 433-376, Fig. 3A) show that this difference does not vary between children and adults, or between Day 1 and Day 14. Our further analysis showed that both anterior and posterior regions of the hippocampus exhibited significant activation from zero in children and adults for correctly remembered items (see Fig. S2, Table S7 in Supplementary Materials). Based on your suggestion, our recent additional analysis showed:

      (i) For forgotten items, we did not observe any activation significantly higher than zero in either the anterior or posterior hippocampus for recent and remote memory on Day 1 and Day 14 in either age group (all p > .052 FDR corrected; see Table S7.1, Fig. S2.1).

      (ii) After establishing no difference between recent and remote activation across and between sessions (Day 1, Day 14), we conducted another linear mixed-effects model with group x memory success (remembered, forgotten) x region (anterior hippocampus, posterior hippocampus), with subject as a random effect. The model showed no significant effects for the memory success x region interaction (F = 1.12(1,1198), p = .289) and no significant group x memory success x region interaction (F = .017(1,1198), p = .895). However, we observed a significant main effect of memory success (F = 128.27(1,1198), p < .001), indicating significantly higher hippocampal activation for remembered compared to forgotten items (b = .06, t = 11.29, p <.001; see Table S7.3).

      (iii) Considering the comparatively low number of incorrect trials for recent items in the adult group, we reran this analysis only for remote items. Similarly, the model showed no significant effects for the memory success x region interaction (F = .72(1,555), p = .398) and no significant group x memory success x region interaction (F = .14(1,555), p = .705). However, we observed a significant main effect of memory success (F = 68.03(1,555), p < .001), indicating significantly higher hippocampal activation for remote remembered compared to forgotten items (b = .07, t = 8.20, p <.001; see Table S7.3).

      Taken together, our results indicate that significant hippocampal activation was observed only for correctly remembered items in both children and adults, regardless of memory age and session. For forgotten items, we did not observe any significant hippocampal activation in either group or delay. Moreover, hippocampal activation was significantly higher for remembered compared to forgotten memories. This evidence supports our conclusions regarding the Multiple Trace and Trace Transformation Theories, suggesting that the hippocampus supports retrieval similarly across delays, and provides novel evidence that this process is operational in both children and adults. This aligns also with Contextual Bindings Theory, as well as empirical evidence by Sekeres, Winokur, & Moscovitch (2018), among others. We have added this information to the manuscript.

      (5) There are still not enough methodological details in the main paper to make sense of the results. Some of these problems were addressed in the revision but others remain. For example, a couple of things that were unclear: that initially learned locations were split, where half were tested again at day 1 and the other half at day 14; what specific criterion was used to determine to pick the 'well-learned' associations that were used for comparisons at different delay periods (object-scene pairs that participants remembered accurately in the last repetition of learning? Or across all of learning?). 

      We thank the reviewer for pointing this out. The initially learned object-scene associations on Day 0 were split in two halves based on  their categories before the testing. Specifically, half of the pairs from the first set and half of the pairs from the second set of 30 object-scene associations were used to create the set 30 remote pair for Day 1 testing. A similar procedure was repeated for the remaining pairs to create a set of remote object-scene associations for Day 14 retrieval. We tried to equally distribute the categories of pairs between the testing sets. We added this information to the methods section of the manuscript (see p. 47, lines 12371243). In addition, the sets of association for delay test on Day 1 and Day 14 were not based on their learning accuracy. Of note, the analysis of variance revealed that there was no difference in learning accuracy between the two sets created for delay tests in either age group (children: p = .23; adults  p = .06). These results indicate that the sets were comprised of items learned with comparable accuracy in both age groups. 

      (6) In still find the revised Introduction a bit unclear. I appreciated the added descriptions of different theories of consolidation, though the order of presented points is still a bit hard to follow. Some of the predictions I also find a bit confusing as laid out in the introduction. (1) As noted in the paper multiple trace theory predicts that hippocampal involvement will remain high provided memories retained are sufficiently high detail. The authors however also predict that children will rely more on gist (than detailed) memories than adults, which would seem to imply (combined with the MTT idea) that they should show reduced hippocampal involvement over time (while in adults, it should remain high). However, the authors' actual prediction is that hippocampus will show stable involvement over time in both kids and adults. I'm having a hard time reconciling these points. (2) With respect to the extraction of gist in children, I was confused by the link to Fuzzy Trace Theory given the children in the present study are a bit young to be showing the kind of gist extraction shown in the Brainerd & Reyna data. Would 5-7 year olds not be more likely to show reliance on verbatim traces under that framework? Also from a phrasing perspective, I was confused about whether gist-like information was something different from just gist in this sentence: "children may be more inclined to extract gist information at the expense of detailed or gist-like information." (p. 8) - is this a typo? 

      We thank the reviewer for this thoughtful observation. 

      Our hypothesis of stable hippocampal engagement over time was primarily based on Contextual Binding Theory (Yonelinas et al., 2019), and the MTT, supported by the evidence provided by Sekeres et al., 2018, which posits that the hippocampus continues to support retrieval when contextual information is preserved, even for older, consolidated memories. Given that our object-location associations were repeatedly encoded and tied to specific scene contexts, we believe that retrieval success for both recent and remote memories likely involved contextual reinstatement, leading to sustained hippocampal activity. Also in accordance with the MTT and related TTT, different memory representations may coexist, including detailed and gist-like memories. Therefore, we suggest that children may not rely on highly detailed item-specific memory, but rather on sufficiently contextualized schematic traces, which still engage the hippocampus. This distinction is now made clearer in the Introduction (see lines 223-236).

      We appreciate the reviewer’s point regarding Fuzzy Trace Theory (Brainerd & Reyna, 2002). Indeed, in classic FTT, young children are thought to rely more on verbatim traces due to immature gist extraction mechanisms (primarily from verbal material). However, we use the term “gist-like representations” to refer to schematic or category-level retrieval that emerges through structured, repeated learning (as in our task). This form of abstraction may not require full semantic gist extraction in the FTT sense but may instead reflect consolidation-driven convergence onto shared category-level representations — especially when strategic resources are limited. We now clarify this distinction and revise the ambiguous sentence with typo (“at the expense of detailed or gist-like information”) to better reflect our intended meaning (see p.8).

      (7) For the PLSC, if I understand this correctly, the profiles were defined for showing associations with behaviour across age groups. (1) As such, is it not "double dipping" to then show that there is an association between brain profile and behaviour-must this not be true by definition? If I am mistaken, it might be helpful to clarify this in the paper. (2) In addition, I believe for the univariate and scene-specific reinstatement analyses these profiles were defined across both age groups. I assume this doesn't allow for separate definition of profiles across the two group (i.e., a kind of "interaction"). If this is the case, it makes sense that there would not be big age differences... the profiles were defined for showing an association across all subjects. If the authors wanted to identify distinct profiles in children and adults they may need to run another analysis. 

      We thank the reviewer for this thoughtful comment. 

      (1) We agree that showing the correlation between the latent variable and behavior may be redundant, as the relationship is already embedded in the PLSC solution and quantified by the explained variance. Our intention was merely to visualize the strength of this relationship. In hindsight, we agree that this could be misinterpreted, and we have removed the additional correlation figure from the manuscript.

      We also see the reviewer’s point that, given the shared latent profile across groups, it is expected that the strength of the brain-behavior relationship does not differ between age groups. Instead, to investigate group differences more appropriately, we examined whether children and adults differed in their expression of the shared latent variable (i.e., brain scores). This analysis revealed that children showed significantly lower brain scores than adults both in short delay, t(83) = -4.227, p = .0001, and long delay, t(74) = -5.653, p < .001, suggesting that while the brain-behavior profile is shared, its expression varies by group. We have added this clarification to the Results section (p. 19-20) of the revised manuscript. 

      (2) Regarding the second point, we agree with the reviewer that defining the PLS profiles across both age groups inherently limits the ability to detect group-specific association, as the resulting latent variables represent shared pattern across the full sample. To address this, we conducted additional PLS analyses separately within each age group to examine whether distinct neural upregulation profiles (remote > recent) emerge for short and long delay conditions.

      These within-group analyses, however, were based on smaller subsamples, which reduced statistical power, especially when using bootstrapping to assess the stability of the profiles. For the short delay, although some regions reached significance, the overall latent variables did not reach conventional thresholds for stability (all p > .069), indicating that the profiles were not robust. This suggests that within-group PLS analyses may be underpowered to detect subtle effects, particularly when modelling neural upregulation (remote > recent), which may be inherently small.

      Nonetheless, when we exploratively applied PLSC separately within each group using recent and remote activity levels against the implicit baseline (rather than the contrast remote > recent) and its relation to memory performance, we observed significant and stable latent variables in both children and adults. This implies that such contrasts (vs. baseline) may be more sensitive and better suited to detect meaningful brain–behavior relationships within age groups. We have added this clarification to the Results sections of the manuscript to highlight the limitations of within-group contrasts for neural upregulation. 

      Author response image 1.

      (3) Also, as for differences between short delay brain profile and long delay brain profile for the scene-specific reinstatement - there are 2 regions that become significant at long delay that were not significant at a short delay (PC, and CE). However, given there are ceiling effects in behaviour at the short but not long delay, it's unclear if this is a meaningful difference or just a difference in sensitivity. Is there a way to test whether the profiles are statistically different from one another?

      We thank the reviewer for this comment. To better illustrate differential profiles also for high memory accuracy after immediate delay (30 minutes delay), we added the immediate (30 minutes delay) condition as a third reference point, given the availability of scene-specific reinstatement data at this time point. Interestingly, the immediate reinstatement profile revealed a different set of significant regions, with distinct expression patterns compared to both the short and long delay conditions. This supports the view that scene-specific reinstatement is not static but dynamically reorganized over time.

      Regarding the ceiling effect at short delay, we acknowledge this as a potential limitation. However, we note that our primary analyses were conducted across both age groups combined, and not solely within high-performing individuals. As such, the grouping may mitigate concerns that ceiling-level performance in a subset of participants unduly influenced the overall reinstatement profile. Moreover, we observed variation in neural reinstatement despite ceiling-level behavior, suggesting that the neural signal retains sensitivity to consolidation-related processes even when behavioral accuracy is near-perfect.

      While we agree that formal statistical comparisons of reinstatement profiles across delays (e.g., using representational profile similarity or interaction tests) could be an informative direction, we feel that this goes beyond the scope of the current manuscript. 

      (4) As I mentioned above, it also was not ideal in my opinion that all regions were included for the scene-specific reinstatement due to the authors' inability to have an appropriate baseline and therefore define above-chance reinstatement. It makes these findings really challenging to compare with the gist reinstatement ones. 

      We appreciate the reviewer’s comment and agree that the lack of a clearly defined baseline for scene-specific reinstatement limits our ability to determine whether these values reflect above-chance reinstatement. However, we would like to clarify that we do not directly compare the magnitude of scene-specific reinstatement to that of gist-like reinstatement in our analyses or interpretations. These two analyses serve complementary purposes: the scenespecific analysis captures trial-unique similarity (within-item reinstatement), while the gistlike analysis captures category-level representational structure (across items). Because they differ not only in baseline assumptions but also in analytical scope and theoretical interpretation, our goal was not to compare them directly, but rather to explore distinct but co-existing representational formats that may evolve differently across development and delay.

      (8) I would encourage the authors to be specific about whether they are measuring/talking about memory representations versus reinstatement, unless they think these are the same thing (in which case some explanation as to why would be helpful). For example, especially under the Fuzzy Trace framework, couldn't someone maintain both verbatim and gist traces of a memory yet rely more on one when making a memory decision? 

      We thank the reviewer for pointing out the importance of conceptual clarity when referring to memory representations versus reinstatement. We agree that these are distinct but related concepts: in our framework, memory representations refer to the neural content stored as a result of encoding and consolidation, whereas reinstatement refers to the reactivation of those representations during retrieval. Thus, reinstatement serves as a proxy for the underlying memory representation — it is how we measure or infer the nature (e.g., specificity, abstraction) of the stored content.

      Under Fuzzy Trace Theory, it is indeed possible for both verbatim and gist representations to coexist. Our interpretation is not that children lack verbatim traces, but rather that they are more likely to rely on schematic or gist-like representations during retrieval, especially after a delay. Our use of neural pattern similarity (reinstatement) reflects which type of representation is being accessed, not necessarily which traces exist in parallel.

      To avoid ambiguity, we have revised the manuscript to more explicitly distinguish between reinstatement (neural reactivation) and the representational format (verbatim vs. gist-like), especially in the framing of our hypotheses and interpretation of age group differences.

      (9) With respect to the learning criteria - it is misleading to say that "children needed between two to four learning-retrieval cycles to reach the criterion of 83% correct responses" (p. 9). Four was the maximum, and looking at the Figure 1C data it appears as though there were at least a few children who did not meet the 83% minimum. I believe they were included in the analysis anyway? Please clarify. Was there any minimum imposed for inclusion?

      We thank the reviewer for pointing this out. As stated in Methods Section (p. 50, lines 13261338) “These cycles ranged from a minimum of two to a maximum of four.<…> The cycles ended when participants provided correct responses to 83% of the trials or after the fourth cycle was reached.” We have corrected the corresponding wording in the Results section (line 286-289) to reflect this more accurately. Indeed, five children did not reach the 83% criterion but achieved final performance between 70 and 80% after the fourth learning cycle. These participants were included in this analysis for two main reasons:

      (1) The 83% threshold was established during piloting as a guideline for how many learningretrieval cycles to allow, not a strict learning criterion. It served to standardize task continuation, rather than to exclude participants post hoc.

      (2) The performance of these five children was still well above chance level (33%), indicating meaningful learning. Excluding them would have biased the sample toward higherperforming children and reduced the ecological validity of our findings. Including them ensures a more representative view of children’s performance under extended learning conditions.

      (10) For the gist-like reinstatement PLSC analysis, results are really similar a short and long delays and yet some of the text seems to implying specificity to the long delay. One is a trend and one is significant (p. 31), but surely these two associations would not be statistically different from one another?  

      We agree with the reviewer that the associations at short and long delays appeared similar. While a formal comparison (e.g., using a Z-test for dependent correlations) would typically be warranted, in the reanalyzed dataset only the long delay profile remains statistically significant, which limits the interpretability of such a comparison. 

      (11) As a general comment, I had a hard time tying all of the (many) results together. For example adults show more mature neocortical consolidation-related engagement, which the authors say is going to create more durable detailed memories, but under multiple trace theory we would generally think of neocortical representations as providing more schematic information. If the authors could try to make more connections across the different neural analyses, as well as tie the neural findings in more closely with the behaviour & back to the theoretical frameworks, that would be really helpful.  

      We thank the reviewer for this valuable suggestion. We have revised the discussion section to more clearly link the behavioral and neural findings and to interpret them in light of existing consolidation theories for better clarity. 

      Reviewer #2 (Public Review): 

      Schommartz et al. present a manuscript characterizing neural signatures of reinstatement during cued retrieval of middle-aged children compared to adults. The authors utilize a paradigm where participants learn the spatial location of semantically related item-scene memoranda which they retrieve after short or long delays. The paradigm is especially strong as the authors include novel memoranda at each delayed time point to make comparisons across new and old learning. In brief, the authors find that children show more forgetting than adults, and adults show greater engagement of cortical networks after longer delays as well as stronger item-specific reinstatement. Interestingly, children show more category-based reinstatement, however, evidence supports that this marker may be maladaptive for retrieving episodic details. The question is extremely timely both given the boom in neurocognitive research on the neural development of memory, and the dearth of research on consolidation in this age group. Also, the results provide novel insights into why consolidation processes may be disrupted in children. 

      We thank the reviewer for the positive evaluation.

      Comments on the revised version: 

      I carefully reviewed not only the responses to my own reviews as well as those raised by the other reviewers. While they addressed some of the concerns raised in the process, I think many substantive concerns remain. 

      Regarding Reviewer 1: 

      The authors point that the retrieval procedure is the same over time and similarly influenced by temporal autocorrelations, which makes their analysis okay. However, there is a fundamental problem as to whether they are actually measuring reinstatement or they are only measuring differences in temporal autocorrelation (or some non-linear combination of both). The authors further argue that the stimuli are being processed more memory wise rather than perception wise, however, I think there is no evidence for that and that perception-memory processes should be considered on a continuum rather than as discrete processes. Thus, I agree with reviewer 1 that these analyses should be removed. 

      We thank the reviewer for raising this important question. We would like to clarify a few key points regarding temporal autocorrelation and reinstatement.

      During the fixation window, participants were instructed to reinstate the scene and location associated with the cued object from memory. This task was familiar to them, as they had been trained in retrieving locations within scenes. Our analysis aims to compare the neural representations during this retrieval phase with those when participants view the scene, in order to assess how these representations change in similarity over time, as memories become less precise.

      We acknowledge that temporal proximity can lead to temporal autocorrelation. However, evidence suggests that temporal autocorrelation is consistent and stable across conditions (Gautama & Van Hulle, 2004; Woolrich et al., 2004). Shinn & Lagalwar (2021)further demonstrated that temporal autocorrelation is highly reliable at both the subject and regional levels. Given that we analyze regions of interest (ROIs) separately, potential spatial variability in temporal autocorrelation is not a major concern.

      No difference between item-specific reinstatement for recent items on day 1 and day 14 (which were merged) for further delay-related comparison also suggests that the reinstatement measure was stable for recent items even sampled at two different testing days. 

      Importantly, we interpret the relative change in the reinstatement index rather than its absolute value.

      In addition, when we conducted the same analysis for incorrectly retrieved memories, we did not observe any delay-related decline in reinstatement (see p. 25, lines 623-627). This suggests that the delay-related changes in reinstatement are specific to correctly retrieved memories. 

      Finally, our control analysis examining reinstatement between object and fixation time points (as suggested by Reviewer 1) revealed no delay-related effects in any ROI (see p.24, lines 605-612), further highlighting the specificity of the observed delay-related change in item reinstatement.

      We emphasize that temporal autocorrelation should be similar across all retrieval delays due to the identical task design and structure. Therefore, any observed decrease in reinstatement with increasing delay likely reflects a genuine change in the reinstatement index, rather than differences in temporal autocorrelation. Since our analysis includes only correctly retrieved items, and there is no perceptual input during the fixation window, this process is inherently memory-based, relying on mnemonic retrieval rather than sensory processing.

      We respectfully disagree with the reviewer's assertion that retrieval during the fixation period cannot be considered more memory-driven than perception-driven. At this time point, participants had no access to actual images of the scene, making it necessary for them to rely on mnemonic retrieval. The object cue likely triggered pattern completion for the learned object-scene association, forming a unique memory if remembered correctly(Horner & Burgess, 2013). This process is inherently mnemonic, as it is based on reconstructing the original neural representation of the scene (Kuhl et al., 2012; Staresina et al., 2013).

      While perception and memory processes can indeed be viewed as a continuum, some cognitive processes are predominantly memory-based, involving reconstruction rather than reproduction of previous experiences (Bartlett, 1932; Ranganath & Ritchey, 2012). In our task, although the retrieved material is based on previously encoded visual information, the process of recalling this information during the fixation period is fundamentally mnemonic, as it does not involve visual input. Our findings indicate that the similarity between memorybased representations and those observed during actual perception decreases over time, suggesting a relative change in the quality of the representations. However, this does not imply that detailed representations disappear; they may still be robust enough to support correct memory recall. Previous studies examining encoding-retrieval similarity have shown similar findings(Pacheco Estefan et al., 2019; Ritchey et al., 2013).

      We do not claim that perception and memory processes are entirely discrete, nor do we suggest that only perception is involved when participants see the scene. Viewing the scene indeed involves recognition processes, updating retrieved representations from the fixation period, and potentially completing missing or unclear information. This integrative process demonstrates the interrelation of perception and memory, especially in complex tasks like the one we employed.

      In conclusion, our task design and analysis support the interpretation that the fixation period is primarily characterized by mnemonic retrieval, facilitated by cue-triggered pattern completion, rather than perceptual processing. We believe this approach aligns with the current understanding of memory retrieval processes as supported by the existing literature.

      The authors seem to have a design that would allow for across run comparisons, however, they did not include these additional analyses. 

      Thank you for pointing this out. We ran as additional cross-run comparison. This results and further proceeding are reported in the comment for reviewer 1. 

      To address the reviewer’s concern, we conducted an additional cross-run analysis for all correctly retrieved trials. The approach restricted comparisons to non-overlapping runs (run1run2, run2-run3, run1-run3). This analysis revealed robust gist-like reinstatement in children for remote Day 14 memories in the mPFC (p = .035) and vlPFC (p = .0007), in adults’ vlPFC remote Day 1 memories (p = .029), as well as in children and adults remote Day 1 memories in LOC (p < .02). A significant Session effect in both regions (mPFC: p = .026; vlPFC: p = .002) indicated increased reinstatement for long delay (Day 14) compared to short-delay and recent session (all p < .05). Given that the cross-run results largely replicate and reinforce the effects found previously with within-run, we believe that combining both sources of information is methodologically justified and statistically beneficial. Specifically, both approaches independently identified significant gist-like reinstatement in children’s mPFC and vlPFC (although within-run vlPFC effect (short delay: p = .038; long delay p = .047) did not survive multiple comparisons), particularly for remote memories. Including both withinrun and between-run comparisons increases the number of unique, non-repeated trial pairs, improving statistical power without introducing redundancy. While we acknowledge that same-run comparisons may be influenced by residual autocorrelation(Prince et al., 2022), we believe that our design mitigates this risk through consistency between within-run and crossrun results, long inter-trial intervals, and trial-wise estimation of activation. We have adjusted the manuscript, accordingly, reporting the combined analysis. We also report cross-run and within-run analysis separately in supplementary materials (Tables S12.1, S12.2, showing that they converge with the cross-run results and thus strengthen rather than dilute the findings. 

      As suggested, we now explicitly highlight the change over time as the central finding. We observe a clear increase in gist-like reinstatement from recent to remote memories in children, particularly in mPFC and vlPFC. These effects based on combined within- and cross-run comparisons, are now clearly stated in the main results and interpreted in the discussion accordingly. 

      (1) The authors did not satisfy my concerns about different amounts of re-exposures to stimuli as a function of age, which introduces a serious confound in the interpretation of the neural data. 

      (2) Regarding Reviewer 1's point about different number of trials being entered into analysis, I think a more formal test of sub-sampling the adult trials is warranted. 

      (1) We thank the reviewer for pointing this out. Overall, children needed 2 to 4 learning cycles to improve their performance and reach the learning criteria, compared to 2 learning cycles in adults. To address the different amounts of re-exposure to stimuli between the age groups, we subsampled the child group to only those children who reached the learning criteria after 2 learning cycles. For this purpose, we excluded 21 children from the analysis who needed 3 or 4 learning cycles. This resulted in 39 young adults and 28 children being included in the subsequent analysis. 

      (i) We reran the behavioral analysis with the subsampled dataset (see Supplementary Materials,  Table S1.1, Fig. S1, Table S1.2). This analysis replicated the previous findings of less robust memory consolidation in children across all time delays. 

      (ii) We reran the univariate analysis (see in Supplementary Materials, Table S9.1). This analysis also replicated fully the previous findings. This indicates that the inclusion of child participants with greater material exposure during learning in the analysis of neural retrieval patterns did not affect the group differences in univariate neural results. 

      These subsampled results demonstrated that the amount of re-exposure to stimuli during encoding does not affect consolidation-related changes in memory retrieval at the behavioral and neural levels in children and adults across all time delays. We have added this information to the manuscript (line 343-348, 420-425). 

      (2) We appreciate Reviewer 1's suggestion to perform a formal test by sub-sampling the adult trials to match the number of trials in the child group. However, we believe that this approach may not be optimal for the following reasons:

      (i) Loss of Statistical Power: Sub-sampling the adult trials would result in a reduced sample size, potentially leading to a significant loss of statistical power and the ability to detect meaningful effects, particularly in a context where the adult group is intended to serve as a robust control or comparison group.

      (ii) Introducing sub-sampling could introduce variability that complicates the interpretation of results, particularly if the trial sub-sampling process does not fully capture the variability inherent in the original adult data.

      (iii) Robustness of Existing Findings: We have already addressed potential concerns about unequal trial numbers by conducting analyses that control for the number of learning cycles, as detailed in our supplementary materials. These analyses have shown that the observed effects are consistent, suggesting that the differences in trial numbers do not critically influence our findings.

      Given these considerations, we hope the reviewer understands our rationale and agrees that the current analysis is robust and appropriate for addressing the research questions.

      I also still fundamentally disagree with the use of global signals when comparing children to adults, and think this could very much skew the results. 

      We thank the reviewer for raising this important issue. To address this concern comprehensively, we have taken the following steps:

      (1) Overview of the literature support for global signal regression (GSR). A growing body of methodological and empirical research supports the inclusion of global signal repression as part of best practice denoising pipelines, particularly when analyzing pediatric fMRI data. Studies such as (Ciric et al., 2017; Parkes et al., 2018; J. D. Power et al., 2012, 2014; Power et al., 2012), and (Thompson et al., 2016) show that  GSR improves motion-related artifact removal. Critically, pediatric-specific studies (Disselhoff et al., 2025; Graff et al., 2022) conclude that pipelines including GSR are most effective for signal recovery and artifact removal in younger children. Graff et al. (2021) demonstrated that among various pipelines, GSR yielded the best noise reduction in 4–8-year-olds. Additionally, (Li et al., 2019; Qing et al., 2015) emphasized that GSR reduces artifactual variance without distorting the spatial structure of neural signals. (Ofoghi et al., 2021)demonstrated that global signal regression helps mitigate non-neuronal noise sources, including respiration, cardiac activity, motion, vasodilation, and scanner-related artifacts. Based on this and other recent findings, we consider GSR particularly beneficial for denoising paediatric  fMRI data in our study.

      (2) Empirical comparison of pipelines with and without GSR. We re-run the entire first-level univariate analysis using the pipeline that excluded the global signal regression. The resulting activation maps (see Supplementary Figure S3.2, S4.2, S5.2, S9.2) differed notably from the original pipeline. Specifically, group differences in cortical regions such as mPFC, cerebellum, and posterior PHG no longer reached significance, and the overall pattern of results appeared noisier. 

      (3) Evaluation of the pipeline differences. To further evaluate the impact of GSR, we conducted the following analyses:

      (a) Global signal is stable across groups and sessions. A linear mixed-effects model showed no significant main effects or interactions involving group or session on the global signal (F-values < 2.62, p > .11), suggesting that the global signal was not group- or session-dependent in our sample. 

      (b) Noise Reduction Assessment via Contrast Variability. We compared the variability (standard deviation and IQR) of contrast estimates across pipelines. Both SD (b = .070, p < .001) and IQR (b = .087, p < .001) were significantly reduced in the GSR pipeline, especially in children (p < .001) compared to adults (p = .048). This suggests that GSR reduces inter-subject variability in children, likely reflecting improved signal quality.

      (c) Residual Variability After Regressing Global Signal. We regressed out global signal post hoc from both pipelines and compared the residual variance. Residual standard deviation was significantly lower for the GSR pipeline (F = 199, p < .001), with no interaction with session or group, further indicating that GSR stabilizes the signal and attenuates non-neuronal variability.

      Conclusion

      In summary, while we understand the reviewer’s concern, we believe the empirical and theoretical support for GSR, especially in pediatric samples, justifies its use in our study. Nonetheless, to ensure full transparency, we provide full results from both pipelines in the Supplementary Materials and have clarified our reasoning in the revised manuscript.

      Reviewer #1 (Recommendations For The Authors): 

      (1) Some figures are still missing descriptions of what everything on the graph means; please clarify in captions. 

      We thank the reviewer for pointing this out. We undertook the necessary adjustments in the graph annotations. 

      (2) The authors conclude they showed evidence of neural reorganization of memory representations in children (p. 41). But the gist is not greater in children than adults, and also does not differ over time-so, I was confused about what this claim was based on? 

      We thank the reviewer for raising this question. Our results on gist-like reinstatements suggest that gist-like reinstatement was significantly higher in children compared to adults in the mPFC in addition to the child gist-like reinstatement indices being significantly higher than zero (see p.27-28). These results support our claim on neural reorganization of memory represenations in children. We hope this clarifies the issue. 

      References

      Bartlett, F. C. (1932). Remembering: A study in experimental and social psychology. Cambridge University Press.

      Brainerd, C. J., & Reyna, V. F. (2002). Fuzzy-Trace Theory: Dual Processes in Memory, Reasoning, and Cognitive Neuroscience (pp. 41–100). https://doi.org/10.1016/S00652407(02)80062-3

      Chen, J., Leong, Y. C., Honey, C. J., Yong, C. H., Norman, K. A., & Hasson, U. (2017). Shared memories reveal shared structure in neural activity across individuals. Nature Neuroscience, 20(1), 115–125. https://doi.org/10.1038/nn.4450

      Ciric, R., Wolf, D. H., Power, J. D., Roalf, D. R., Baum, G. L., Ruparel, K., Shinohara, R. T., Elliott, M. A., Eickhoff, S. B., Davatzikos, C., Gur, R. C., Gur, R. E., Bassett, D. S., & Satterthwaite, T. D. (2017). Benchmarking of participant-level confound regression strategies for the control of motion artifact in studies of functional connectivity. NeuroImage, 154, 174–187. https://doi.org/10.1016/j.neuroimage.2017.03.020

      Disselhoff, V., Jakab, A., Latal, B., Schnider, B., Wehrle, F. M., Hagmann, C. F., Held, U., O’Gorman, R. T., Fauchère, J.-C., & Hüppi, P. (2025). Inhibition abilities and functional brain connectivity in school-aged term-born and preterm-born children. Pediatric Research, 97(1), 315–324. https://doi.org/10.1038/s41390-024-03241-0

      Esteban, O., Ciric, R., Finc, K., Blair, R. W., Markiewicz, C. J., Moodie, C. A., Kent, J. D., Goncalves, M., DuPre, E., Gomez, D. E. P., Ye, Z., Salo, T., Valabregue, R., Amlien, I. K., Liem, F., Jacoby, N., Stojić, H., Cieslak, M., Urchs, S., … Gorgolewski, K. J. (2020). Analysis of task-based functional MRI data preprocessed with fMRIPrep. Nature Protocols, 15(7), 2186–2202. https://doi.org/10.1038/s41596-020-0327-3

      Fandakova, Y., Leckey, S., Driver, C. C., Bunge, S. A., & Ghetti, S. (2019). Neural specificity of scene representations is related to memory performance in childhood. NeuroImage, 199, 105–113. https://doi.org/10.1016/j.neuroimage.2019.05.050

      Gautama, T., & Van Hulle, M. M. (2004). Optimal spatial regularisation of autocorrelation estimates in fMRI analysis. NeuroImage, 23(3), 1203–1216.  https://doi.org/10.1016/j.neuroimage.2004.07.048

      Graff, K., Tansey, R., Ip, A., Rohr, C., Dimond, D., Dewey, D., & Bray, S. (2022). Benchmarking common preprocessing strategies in early childhood functional connectivity and intersubject correlation fMRI. Developmental Cognitive Neuroscience, 54, 101087. https://doi.org/10.1016/j.dcn.2022.101087

      Horner, A. J., & Burgess, N. (2013). The associative structure of memory for multi-element events. Journal of Experimental Psychology: General, 142(4), 1370–1383. https://doi.org/10.1037/a0033626

      Jones, J. S., the CALM Team, & Astle, D. E. (2021). A transdiagnostic data-driven study of children’s behaviour and the functional connectome. Developmental Cognitive Neuroscience, 52, 101027. https://doi.org/10.1016/j.dcn.2021.101027

      Kuhl, B. A., Bainbridge, W. A., & Chun, M. M. (2012). Neural Reactivation Reveals Mechanisms for Updating Memory. Journal of Neuroscience, 32(10), 3453–3461. https://doi.org/10.1523/JNEUROSCI.5846-11.2012

      Kuhl, B. A., & Chun, M. M. (2014). Successful Remembering Elicits Event-Specific Activity Patterns in Lateral Parietal Cortex. Journal of Neuroscience, 34(23), 8051–8060. https://doi.org/10.1523/JNEUROSCI.4328-13.2014

      Li, J., Kong, R., Liégeois, R., Orban, C., Tan, Y., Sun, N., Holmes, A. J., Sabuncu, M. R., Ge, T., & Yeo, B. T. T. (2019). Global signal regression strengthens association between resting-state functional connectivity and behavior. NeuroImage, 196, 126–141. https://doi.org/10.1016/j.neuroimage.2019.04.016

      Ofoghi, B., Chenaghlou, M., Mooney, M., Dwyer, D. B., & Bruce, L. (2021). Team technical performance characteristics and their association with match outcome in elite netball. International Journal of Performance Analysis in Sport, 21(5), 700–712. https://doi.org/10.1080/24748668.2021.1938424

      Pacheco Estefan, D., Sánchez-Fibla, M., Duff, A., Principe, A., Rocamora, R., Zhang, H., Axmacher, N., & Verschure, P. F. M. J. (2019). Coordinated representational reinstatement in the human hippocampus and lateral temporal cortex during episodic memory retrieval. Nature Communications, 10(1), 2255. https://doi.org/10.1038/s41467019-09569-0

      Parkes, L., Fulcher, B., Yücel, M., & Fornito, A. (2018). An evaluation of the efficacy, reliability, and sensitivity of motion correction strategies for resting-state functional MRI. NeuroImage, 171, 415–436. https://doi.org/10.1016/j.neuroimage.2017.12.073

      Power, J. D., Barnes, K. A., Snyder, A. Z., Schlaggar, B. L., & Petersen, S. E. (2012). Spurious but systematic correlations in functional connectivity MRI networks arise from subject motion. NeuroImage, 59(3), 2142–2154. https://doi.org/10.1016/j.neuroimage.2011.10.018

      Power, J. D., Mitra, A., Laumann, T. O., Snyder, A. Z., Schlaggar, B. L., & Petersen, S. E. (2014). Methods to detect, characterize, and remove motion artifact in resting state fMRI. NeuroImage, 84, 320–341. https://doi.org/10.1016/j.neuroimage.2013.08.048

      Power, S. D., Kushki, A., & Chau, T. (2012). Intersession Consistency of Single-Trial Classification of the Prefrontal Response to Mental Arithmetic and the No-Control State by NIRS. PLoS ONE, 7(7), e37791. https://doi.org/10.1371/journal.pone.0037791

      Prince, J. S., Charest, I., Kurzawski, J. W., Pyles, J. A., Tarr, M. J., & Kay, K. N. (2022). Improving the accuracy of single-trial fMRI response estimates using GLMsingle. ELife, 11. https://doi.org/10.7554/eLife.77599

      Qing, Z., Dong, Z., Li, S., Zang, Y., & Liu, D. (2015). Global signal regression has complex effects on regional homogeneity of resting state fMRI signal. Magnetic Resonance Imaging, 33(10), 1306–1313. https://doi.org/10.1016/j.mri.2015.07.011

      Ranganath, C., & Ritchey, M. (2012). Two cortical systems for memory-guided behaviour. Nature Reviews Neuroscience, 13(10), 713–726. https://doi.org/10.1038/nrn3338

      Ritchey, M., Wing, E. A., LaBar, K. S., & Cabeza, R. (2013). Neural Similarity Between Encoding and Retrieval is Related to Memory Via Hippocampal Interactions. Cerebral Cortex, 23(12), 2818–2828. https://doi.org/10.1093/cercor/bhs258

      Satterthwaite, T. D., Elliott, M. A., Gerraty, R. T., Ruparel, K., Loughead, J., Calkins, M. E., Eickhoff, S. B., Hakonarson, H., Gur, R. C., Gur, R. E., & Wolf, D. H. (2013). An improved framework for confound regression and filtering for control of motion artifact in the preprocessing of resting-state functional connectivity data. NeuroImage, 64, 240–256. https://doi.org/10.1016/j.neuroimage.2012.08.052

      Schommartz, I., Lembcke, P. F., Pupillo, F., Schuetz, H., de Chamorro, N. W., Bauer, M., Kaindl, A. M., Buss, C., & Shing, Y. L. (2023). Distinct multivariate structural brain profiles are related to variations in short- and long-delay memory consolidation across children and young adults. Developmental Cognitive Neuroscience, 59. https://doi.org/10.1016/J.DCN.2022.101192

      Sekeres, M. J., Winocur, G., & Moscovitch, M. (2018). The hippocampus and related neocortical structures in memory transformation. Neuroscience Letters, 680, 39–53. https://doi.org/10.1016/j.neulet.2018.05.006

      Shinn, L. J., & Lagalwar, S. (2021). Treating Neurodegenerative Disease with Antioxidants: Efficacy of the Bioactive Phenol Resveratrol and Mitochondrial-Targeted MitoQ and SkQ. Antioxidants, 10(4), 573. https://doi.org/10.3390/antiox10040573

      Staresina, B. P., Alink, A., Kriegeskorte, N., & Henson, R. N. (2013). Awake reactivation predicts memory in humans. Proceedings of the National Academy of Sciences, 110(52), 21159–21164. https://doi.org/10.1073/pnas.1311989110

      St-Laurent, M., & Buchsbaum, B. R. (2019). How Multiple Retrievals Affect Neural Reactivation in Young and Older Adults. The Journals of Gerontology: Series B, 74(7), 1086–1100. https://doi.org/10.1093/geronb/gbz075

      Thompson, G. J., Riedl, V., Grimmer, T., Drzezga, A., Herman, P., & Hyder, F. (2016). The Whole-Brain “Global” Signal from Resting State fMRI as a Potential Biomarker of Quantitative State Changes in Glucose Metabolism. Brain Connectivity, 6(6), 435–447. https://doi.org/10.1089/brain.2015.0394

      Tompary, A., & Davachi, L. (2017). Consolidation Promotes the Emergence of Representational Overlap in the Hippocampus and Medial Prefrontal Cortex. Neuron, 96(1), 228-241.e5. https://doi.org/10.1016/j.neuron.2017.09.005

      Tompary, A., Zhou, W., & Davachi, L. (2020). Schematic memories develop quickly, but are not expressed unless necessary. PsyArXiv.

      Woolrich, M. W., Behrens, T. E. J., Beckmann, C. F., Jenkinson, M., & Smith, S. M. (2004). Multilevel linear modelling for FMRI group analysis using Bayesian inference. NeuroImage, 21(4), 1732–1747. https://doi.org/10.1016/j.neuroimage.2003.12.023

      Xiao, X., Dong, Q., Gao, J., Men, W., Poldrack, R. A., & Xue, G. (2017). Transformed Neural Pattern Reinstatement during Episodic Memory Retrieval. The Journal of Neuroscience, 37(11), 2986–2998. https://doi.org/10.1523/JNEUROSCI.2324-16.2017

      Ye, Z., Shi, L., Li, A., Chen, C., & Xue, G. (2020). Retrieval practice facilitates memory updating by enhancing and differentiating medial prefrontal cortex representations. ELife, 9, 1–51. https://doi.org/10.7554/ELIFE.57023

      Yonelinas, A. P., Ranganath, C., Ekstrom, A. D., & Wiltgen, B. J. (2019). A contextual binding theory of episodic memory: systems consolidation reconsidered. Nature Reviews. Neuroscience, 20(6), 364–375. https://doi.org/10.1038/S41583-019-01504

      Zhuang, L., Wang, J., Xiong, B., Bian, C., Hao, L., Bayley, P. J., & Qin, S. (2021). Rapid neural reorganization during retrieval practice predicts subsequent long-term retention and false memory. Nature Human Behaviour, 6(1), 134–145.

      https://doi.org/10.1038/s41562-021-01188-4

    1. Author response:

      The following is the authors’ response to the original reviews.

      Reviewer #1 (Public review):

      Summary: 

      In this manuscript, the authors identified that

      (1) CDK4/6i treatment attenuates the growth of drug-resistant cells by prolongation of the G1 phase;

      (2) CDK4/6i treatment results in an ineffective Rb inactivation pathway and suppresses the growth of drugresistant tumors;

      (3) Addition of endocrine therapy augments the efficacy of CDK4/6i maintenance; 

      (4) Addition of CDK2i with CDK4/6 treatment as second-line treatment can suppress the growth of resistant cell; 

      (5) The role of cyclin E as a key driver of resistance to CDK4/6 and CDK2 inhibition.

      Strengths: 

      To prove their complicated proposal, the authors employed orchestration of several kinds of live cell markers, timed in situ hybridization, IF and Immunoblotting. The authors strongly recognize the resistance of CDK4/6 + ET therapy and demonstrated how to overcome it. 

      Weaknesses: 

      The authors need to underscore their proposed results from what is to be achieved by them and by other researchers. 

      Reviewer #2 (Public review): 

      Summary: 

      This study elucidated the mechanism underlying drug resistance induced by CDK4/6i as a single agent and proposed a novel and efficacious second-line therapeutic strategy. It highlighted the potential of combining CDK2i with CDK4/6i for the treatment of HR+/HER2- breast cancer.

      Strengths: 

      The study demonstrated that CDK4/6 induces drug resistance by impairing Rb activation, which results in diminished E2F activity and a delay in G1 phase progression. It suggests that the synergistic use of CDK2i and CDK4/6i may represent a promising second-line treatment approach. Addressing critical clinical challenges, this study holds substantial practical implications.

      Weaknesses: 

      (1) Drug-resistant cell lines: Was a drug concentration gradient treatment employed to establish drug-resistant cell lines? If affirmative, this methodology should be detailed in the materials and methods section. 

      We greatly appreciate the reviewer for raising this important question. In the revised manuscript, we have updated the methods section (“Drug-resistant cell lines”) to more precisely describe how the drug-resistant cell lines were established. 

      (2) What rationale informed the selection of MCF-7 cells for the generation of CDK6 knockout cell lines? Supplementary Figure 3. A indicates that CDK6 expression levels in MCF-7 cells are not notably elevated. 

      We appreciate the reviewer’s insightful question about the rationale for selecting MCF-7 cells to generate CDK6 knockout cell lines. This choice was guided by prior studies highlighting the significant role of CDK6 in mediating resistance to CDK4/6 inhibitors (21-24). Moreover, we observed a 4.6-fold increase in CDK6 expression in CDK4/6i resistant MCF-7 cells compared to their drug-naïve counterparts (Supplementary Figure 3A). While we did not detect notable differences in CDK4/6 activity between wild-type and CDK6 knockout cells under CDK4/6 inhibitor treatment, these findings point to a potential non-canonical function of CDK6 in conferring resistance to CDK4/6 inhibitors.  

      (3) For each experiment, particularly those involving mice, the author must specify the number of individuals utilized and the number of replicates conducted, as detailed in the materials and methods section. 

      We sincerely thank the reviewer for bringing this to our attention. In the revised manuscript, we have explicitly stated the number of replicates and mice used for each experiment as appropriate in figure legends and relevant text to ensure transparency and clarity. 

      (4) Could this treatment approach be extended to triple-negative breast cancer?

      We greatly appreciate the reviewer’s inquiry about extending our findings to triple-negative breast cancer (TNBC). Based on the data presented in Figure 1 and Supplementary Figure 2, which include the TNBC cell line MDA-MB-231, we expect that the benefits of maintaining CDK4/6 inhibitors could indeed be applicable to TNBC with an intact Rb/E2F pathway. Additionally, our recent paper (25) indicates a similar mechanism in TNBC.

      Reviewer #3 (Public review):

      Summary: 

      In their manuscript, Armand and colleagues investigate the potential of continuing CDK4/6 inhibitors or combining them with CDK2 inhibitors in the treatment of breast cancer that has developed resistance to initial therapy. Utilizing cellular and animal models, the research examines whether maintaining CDK4/6 inhibition or adding CDK2 inhibitors can effectively control tumor growth after resistance has set in. The key findings from the study indicate that the sustained use of CDK4/6 inhibitors can slow down the proliferation of cancer cells that have become resistant, and the combination of CDK2 inhibitors with CDK4/6 inhibitors can further enhance the suppression of tumor growth. Additionally, the study identifies that high levels of Cyclin E play a significant role in resistance to the combined therapy. These results suggest that continuing CDK4/6 inhibitors along with the strategic use of CDK2 inhibitors could be an effective strategy to overcome treatment resistance in hormone receptor-positive breast cancer.

      Strengths: 

      (1) Continuous CDK4/6 Inhibitor Treatment Significantly Suppresses the Growth of Drug-Resistant HR+ Breast Cancer: The study demonstrates that the continued use of CDK4/6 inhibitors, even after disease progression, can significantly inhibit the growth of drug-resistant breast cancer. 

      (2) Potential of Combined Use of CDK2 Inhibitors with CDK4/6 Inhibitors: The research highlights the potential of combining CDK2 inhibitors with CDK4/6 inhibitors to effectively suppress CDK2 activity and overcome drug resistance. 

      (3) Discovery of Cyclin E Overexpression as a Key Driver: The study identifies overexpression of cyclin E as a key driver of resistance to the combination of CDK4/6 and CDK2 inhibitors, providing insights for future cancer treatments. 

      (4) Consistency of In Vitro and In Vivo Experimental Results: The study obtained supportive results from both in vitro cell experiments and in vivo tumor models, enhancing the reliability of the research. 

      (5) Validation with Multiple Cell Lines: The research utilized multiple HR+/HER2- breast cancer cell lines (such as MCF-7, T47D, CAMA-1) and triple-negative breast cancer cell lines (such as MDA-MB-231), validating the broad applicability of the results.

      Weaknesses: 

      (1) The manuscript presents intriguing findings on the sustained use of CDK4/6 inhibitors and the potential incorporation of CDK2 inhibitors in breast cancer treatment. However, I would appreciate a more detailed discussion of how these findings could be translated into clinical practice, particularly regarding the management of patients with drug-resistant breast cancer. 

      Thank you to the reviewer for this crucial comment. In the revised Discussion, we've broadened our exploration of clinical translation. Specifically, we emphasize that ongoing CDK4/6 inhibition, although not fully stopping resistant tumors, significantly slows their growth and may offer a therapeutic window when combined with ET and CDK2 inhibition. We also note that these approaches may work best for patients without Rb loss or newly acquired resistance-driving mutations, and that cyclin E overexpression could be a biomarker to inform patient selection. These points together highlight that our findings provide a mechanistic understanding and potential framework for clinical trials testing maintenance CDK4/6i with selective addition of CDK2i as a secondline strategy in drug-resistant HR+/HER2- breast cancer.

      (2) While the emergence of resistance is acknowledged, the manuscript could benefit from a deeper exploration of the molecular mechanisms underlying resistance development. A more thorough understanding of how CDK2 inhibitors may overcome this resistance would be valuable. 

      We thank the reviewer for this valuable suggestion. In the revised manuscript, we have expanded our Discussion to more explicitly synthesize the molecular mechanisms of resistance and how CDK2 inhibitors counteract them. Specifically, we describe how sustained CDK4/6 inhibition drives a non-canonical route of Rb degradation, resulting in inefficient E2F activation and prolonged G1 phase progression. We also highlight the role of c-Myc in amplifying E2F activity and promoting resistance, and we show that continued ET mitigates this effect by suppressing c-Myc. Importantly, we demonstrate that CDK2 inhibition alone cannot fully suppress the growth of resistant cells, but when combined with CDK4/6 inhibition, it produces durable repression of E2F and Myc target gene programs and significantly delays the G1/S transition. Finally, we identify cyclin E overexpression as a key mechanism of escape from dual CDK4/6i + CDK2i therapy, suggesting its potential as a biomarker for patient stratification . Together, these findings provide a detailed mechanistic rationale for how CDK2 inhibition can overcome specific pathways of resistance in HR<sup>+</sup>/HER2<sup>-</sup> breast cancer.

      (3) The manuscript supports the continued use of CDK4/6 inhibitors, but it lacks a discussion on the long-term efficacy and safety of this approach. Additional studies or data to support the safety profile of prolonged CDK4/6 inhibitor use would strengthen the manuscript. 

      We appreciate the reviewer’s insightful comment. In the revised manuscript, we emphasize the longterm efficacy and safety considerations of sustained CDK4/6 inhibition. Clinical trial and retrospective data have shown that continued CDK4/6i therapy can extend progression-free survival in selected patients, while maintaining a favorable safety profile (26-28). We have updated the Discussion to highlight these findings more explicitly, underscoring that while prolonged CDK4/6 inhibition slows but does not fully arrest tumor growth, it remains a clinically viable strategy when balanced against its manageable toxicity profile.

      Reviewer #1 (Recommendations for the authors): 

      It is well known that the combination therapy of CDK4/6i and ET has therapeutic benefits in ER(+) HER2(-) advanced breast cancer. However, drug resistance is a problem, and second-line therapy to solve this problem has not been established. Although some parts of the research results are already reported, the authors confirmed them by employing live cell markers, and further proved and suggested how to overcome this resistance in detail. This part is considered novel. 

      Overall, this research manuscript is eligible to be accepted with the appropriate addressing of questions.

      (1)The effects and biochemical changes of combination therapy of CDK4/6i and CDK2i are already known in several papers. The author needs to highlight the differences between the author's research and that of otherresearchers. 

      We thank the reviewer for the opportunity to clarify the novelty of our findings in the context of prior studies on CDK4/6i and CDK2i combination therapy. In the revised manuscript, we have updated the Discussion section to more clearly delineate how our work extends and differs from existing research.

      Specifically, we now state:

      Page 12: The combination of CDK4/6i and ET has reshaped treatment for HR<sup>+</sup>/HER2<sup>-</sup> breast cancer (1-8). However, resistance commonly emerges, and no consensus second-line standard is established. Our data show that continued CDK4/6i treatment in drug-resistant cells engages a non-canonical, proteolysis-driven route of Rb inactivation, yielding attenuated E2F output and a pronounced delay in G1 progression (Figure 7G). Concurrent ET further deepens this blockade by suppressing c-Myc-mediated E2F amplification, thereby prolonging G1 and slowing population growth. Importantly, CDK2 inhibition alone was insufficient to control resistant cells. Robust suppression of CDK2 activity and resistant-cell growth required CDK2i in combination with CDK4/6i, consistent with prior reports supporting dual CDK targeting (9-16). Moreover, cyclin E, and in some contexts cyclin A, blunted the efficacy of the CDK4/6i and CDK2i combination by reactivating CDK2. Together, these findings provide a mechanistic rationale for maintaining CDK4/6i beyond progression and support testing ET plus CDK4/6i with the strategic addition of CDK2i, as evidenced by concordant in vitro and in vivo results.

      (2) Regarding Figures 3H and 3I, I wonder if it is live cell imaging results or if the authors counter each signal via timed IF staining slides? If live cell imaging is used, the authors need to present the methods. 

      We appreciate the reviewer’s question. Figures 3H and 3I derive from a live–fixed correlative pipeline rather than purely live imaging or independently timed IF slides. We first imaged asynchronously proliferating cells live for ≥48 h to (i) segment/track nuclei with H2B fluorescence, (ii) define mitotic exit (t = 0 at anaphase), and (iii) record CDK2 activity using a CDK2 KTR in the last live frame. Immediately after the live acquisition, we pulsed EdU (10 µM, 15 min) and fixed the same wells, photobleached fluorescent proteins (3% H₂O₂ + 20 mM HCl, 2 h, RT) to prevent crosstalk, and then performed click-chemistry EdU detection, IF for phospho-Rb (Ser807/811) and total Rb, and RNA FISH for E2F1. Fixed-cell readouts (p-Rb positivity, EdU incorporation, E2F1 mRNA puncta) were mapped back to each single cell’s live-derived time since mitosis and/or CDK2 activity, enabling the kinetic plots shown in Fig. 3H–I.

      To ensure transparency and reproducibility, we added detailed methods describing this workflow in the “Immunofluorescence and mRNA fluorescence in situ hybridization (FISH)” section under a dedicated “live– fixed pipeline” paragraph, and we cross-referenced acquisition and analysis parameters in “Live- and fixed-cell image acquisition” and “Image processing and analysis.” These updates specify: EdU pulse/fix conditions, photobleaching, antibodies/probes, imaging hardware and channels, segmentation/tracking, mitosis alignment, background correction, and how fixed readouts were binned/quantified as functions of time after mitosis and CDK2 activity.

      (3) Regarding Figure 3F, seven images were obtained in same fields? The author needs to describe the meaning of the white image and the yellow and blue image of the bottom in detail. 

      Thank you for raising this point. All seven panels in Fig. 3F are from the same field of view. The top row shows the raw channels (Hoechst, p-Rb, total Rb, and E2F1 RNA FISH). The bottom row shows the corresponding processed outputs from that field: (i) nuclear segmentation, (ii) phosphorylated Rb-status classification, and (iii) cell boundaries used for single-cell RNA-FISH quantification. We have revised the figure legend to make this explicit.

      (4) The author showed E2F mRNA by ISH, but in fact, RB does not suppress E2F mRNA but suppresses protein, so the author needs to confirm E2F at the protein level.

      We sincerely appreciate the reviewer’s thoughtful suggestion to examine E2F1 at the protein level. In our study, we focused on E2F1 mRNA expression because it is a well-established and biologically meaningful readout of E2F1 transcriptional activity. Due to its autoregulatory nature (17), the release of active E2F1 protein from Rb induces the transcription of E2F1 itself, creating a positive feedback loop. As a result, E2F1 mRNA abundance serves as a direct and reliable proxy for E2F1 protein activity (18-20). Thus, quantifying E2F1 mRNA provides a biologically relevant and mechanistic indicator of Rb-E2F pathway status. To clarify this rationale, we have updated the Results section and added references supporting our use of E2F1 mRNA as a readout for E2F1 activity.

      (5) Is it possible to synchronize cells (nocodazole shake-off, Double thymidine block) under the presence of cdk4/6i? If so, then the authors need to demonstrate the delay of G1 progression via immunoblotting. 

      We thank the reviewer for this constructive suggestion. To address it, we performed nocodazole synchronization followed by release and monitored cell-cycle progression in the presence or absence of CDK4/6 inhibition.

      Specifically, we added the following new datasets to the revised manuscript:

      Fig. 3L: Live single-cell trajectories of CDK4/6 and CDK2 activities alongside the Cdt1-degron reporter after 14 hours of nocodazole (250 nM) treatment and release. We compared the averaged traces of CDK4/6 and CDK2 activities and Cdt1 intensity in parental cells (gray) and resistant cells with (red) and without (blue) CDK4/6i maintenance. These data show suppressed and delayed CDK2 activation, as well as a right-shifted S-phase entry, particularly under continuous CDK4/6 inhibition.

      Fig. 3M: Fixed-cell EdU pulse-labeling at 4, 6, 8, 12, 16, and 24 h post-release further confirms a significant delay in S-phase entry and prolonged G1 duration in CDK4/6i-maintained cells compared with naïve and withdrawn conditions.

      Together, these results directly demonstrate the delay in G1 progression following synchronized mitotic exit under CDK4/6 inhibition.

      (6) In Figure 5C the authors showed a violin plot of c-Myc level. Is this Immunohistochemical staining? The authors need to clarify the methods.

      Thank you for flagging this. The c-Myc measurements in Fig. 5C are from immunofluorescence (IF), not IHC. We now state this explicitly in the legend.

      (7) Regarding Live cell immunofluorescence tracing of live-cell reporters, the author needs to clarify the methods (excitation, emission), name of instruments, and software used.

      To address this, we have expanded the “Live-cell, fixed-cell, and tumor tissue image acquisition” section in the Materials and Methods.

      (8) Lines 475 SF1A, the authors need to correct typos. Naïve Naïve.

      We greatly appreciate the reviewer’s attention to this detail and have ensured all typos have been addressed.  

      (9) The authors need to unify Cdt1-degron(legends) Vs Cdt1 degron (figures). 

      We greatly appreciate your attention to this discrepancy. Language referring to the Cdt1 degron has been unified between figures and legends. 

      Reviewer #3 (Recommendations for the authors):

      (1) While the manuscript discusses the selection of doses for CDK4/6 inhibitors and CDK2 inhibitors, there is a lack of detailed data on the dose-response relationship. Additional data on the effects of different doses would be beneficial. 

      We appreciate the reviewer’s important comment. To address it, we performed additional dose– response experiments testing a range of CDK4/6i and CDK2i concentrations. These analyses revealed a clear synergistic interaction between the two inhibitors. The new data are now presented in Figure 6G and Supplementary Figure 8F of the revised manuscript.

      (2) In clinical trials, the criteria for patient selection are crucial for interpreting study outcomes. A detailed description of the patient selection criteria should be provided.  

      We thank the reviewer for bringing this important point to our attention. In the revised manuscript, we have clarified the patient selection criteria relevant to the interpretation of clinical outcomes. Specifically, we note that retrospective analyses suggest patients with indolent disease and no prior chemotherapy may benefit most from continued CDK4/6i plus ET. Moreover, our data and others’ indicate that clinical benefit is expected in tumors retaining an intact Rb/E2F axis, while resistance-driving alterations (e.g., Rb loss, PIK3CA, ESR1, FGFR1–3, HER2, FAT1 mutations) are likely to limit efficacy. Finally, we highlight cyclin E overexpression as a potential biomarker of resistance to combined CDK4/6i and CDK2i, underscoring the need for biomarker-guided patient stratification. These additions provide a more detailed framework for patient selection in future clinical applications.

      References

      (1) Finn RS, Crown JP, Lang I, Boer K, Bondarenko IM, Kulyk SO, et al. The cyclin-dependent kinase 4/6 inhibitor palbociclib in combination with letrozole versus letrozole alone as first-line treatment of oestrogen receptor-positive, HER2-negative, advanced breast cancer (PALOMA-1/TRIO-18): a randomised phase 2 study. Lancet Oncol 2015;16:25-35

      (2) Finn RS, Martin M, Rugo HS, Jones S, Im S-A, Gelmon K, et al. Palbociclib and Letrozole in Advanced Breast Cancer. New England Journal of Medicine 2016;375:1925-36

      (3) Turner NC, Slamon DJ, Ro J, Bondarenko I, Im S-A, Masuda N, et al. Overall Survival with Palbociclib and Fulvestrant in Advanced Breast Cancer. New England Journal of Medicine 2018;379:1926-36

      (4) Dickler MN, Tolaney SM, Rugo HS, Cortés J, Diéras V, Patt D, et al. MONARCH 1, A Phase II Study of Abemaciclib, a CDK4 and CDK6 Inhibitor, as a Single Agent, in Patients with Refractory HR(+)/HER2(-) Metastatic Breast Cancer. Clin Cancer Res 2017;23:5218-24

      (5) Johnston S, Martin M, Di Leo A, Im S-A, Awada A, Forrester T, et al. MONARCH 3 final PFS: a randomized study of abemaciclib as initial therapy for advanced breast cancer. npj Breast Cancer 2019;5:5

      (6) Hortobagyi GN, Stemmer SM, Burris HA, Yap Y-S, Sonke GS, Hart L, et al. Overall Survival with Ribociclib plus Letrozole in Advanced Breast Cancer. New England Journal of Medicine 2022;386:94250

      (7) Slamon DJ, Neven P, Chia S, Fasching PA, De Laurentiis M, Im S-A, et al. Overall Survival with Ribociclib plus Fulvestrant in Advanced Breast Cancer. New England Journal of Medicine 2019;382:51424

      (8) Im S-A, Lu Y-S, Bardia A, Harbeck N, Colleoni M, Franke F, et al. Overall Survival with Ribociclib plus Endocrine Therapy in Breast Cancer. New England Journal of Medicine 2019;381:307-16

      (9) Pandey K, Park N, Park KS, Hur J, Cho YB, Kang M, et al. Combined CDK2 and CDK4/6 Inhibition Overcomes Palbociclib Resistance in Breast Cancer by Enhancing Senescence. Cancers (Basel) 2020;12

      (10) Freeman-Cook K, Hoffman RL, Miller N, Almaden J, Chionis J, Zhang Q, et al. Expanding control of the tumor cell cycle with a CDK2/4/6 inhibitor. Cancer Cell 2021;39:1404-21 e11

      (11) Dietrich C, Trub A, Ahn A, Taylor M, Ambani K, Chan KT, et al. INX-315, a selective CDK2 inhibitor, induces cell cycle arrest and senescence in solid tumors. Cancer Discov 2023

      (12) Al-Qasem AJ, Alves CL, Ehmsen S, Tuttolomondo M, Terp MG, Johansen LE, et al. Co-targeting CDK2 and CDK4/6 overcomes resistance to aromatase and CDK4/6 inhibitors in ER+ breast cancer. NPJ Precis Oncol 2022;6:68

      (13) Kudo R, Safonov A, Jones C, Moiso E, Dry JR, Shao H, et al. Long-term breast cancer response to CDK4/6 inhibition defined by TP53-mediated geroconversion. Cancer Cell 2024

      (14) Arora M, Moser J, Hoffman TE, Watts LP, Min M, Musteanu M, et al. Rapid adaptation to CDK2 inhibition exposes intrinsic cell-cycle plasticity. Cell 2023;186:2628-43 e21

      (15) Kumarasamy V, Wang J, Roti M, Wan Y, Dommer AP, Rosenheck H, et al. Discrete vulnerability to pharmacological CDK2 inhibition is governed by heterogeneity of the cancer cell cycle. Nature Communications 2025;16:1476

      (16) Dommer AP, Kumarasamy V, Wang J, O'Connor TN, Roti M, Mahan S, et al. Tumor Suppressors Condition Differential Responses to the Selective CDK2 Inhibitor BLU-222. Cancer Res 2025

      (17) Johnson DG, Ohtani K, Nevins JR. Autoregulatory control of E2F1 expression in response to positive and negative regulators of cell cycle progression. Genes & Development 1994;8:1514-25

      (18) Chung M, Liu C, Yang HW, Koberlin MS, Cappell SD, Meyer T. Transient Hysteresis in CDK4/6 Activity Underlies Passage of the Restriction Point in G1. Mol Cell 2019;76:562-73 e4

      (19) Kim S, Leong A, Kim M, Yang HW. CDK4/6 initiates Rb inactivation and CDK2 activity coordinates cell-cycle commitment and G1/S transition. Sci Rep 2022;12:16810

      (20) Yang HW, Chung M, Kudo T, Meyer T, Yang HW, Chung, Mingyu, Kudo T, et al. Competing memories of mitogen and p53 signalling control cell-cycle entry. Nature 2017;549:404-8

      (21) Yang C, Li Z, Bhatt T, Dickler M, Giri D, Scaltriti M, et al. Acquired CDK6 amplification promotes breast cancer resistance to CDK4/6 inhibitors and loss of ER signaling and dependence. Oncogene 2017;36:2255-64

      (22) Li Q, Jiang B, Guo J, Shao H, Del Priore IS, Chang Q, et al. INK4 Tumor Suppressor Proteins Mediate Resistance to CDK4/6 Kinase Inhibitors. Cancer Discov 2022;12:356-71

      (23) Ji W, Zhang W, Wang X, Shi Y, Yang F, Xie H, et al. c-myc regulates the sensitivity of breast cancer cells to palbociclib via c-myc/miR-29b-3p/CDK6 axis. Cell Death & Disease 2020;11:760

      (24) Wu X, Yang X, Xiong Y, Li R, Ito T, Ahmed TA, et al. Distinct CDK6 complexes determine tumor cell response to CDK4/6 inhibitors and degraders. Nature Cancer 2021;2:429-43

      (25) Kim S, Son E, Park HR, Kim M, Yang HW. Dual targeting CDK4/6 and CDK7 augments tumor response and anti-tumor immunity in breast cancer models. J Clin Invest 2025

      (26) Ravani LV, Calomeni P, Vilbert M, Madeira T, Wang M, Deng D, et al. Efficacy of Subsequent Treatments After Disease Progression on CDK4/6 Inhibitors in Patients With Hormone Receptor-Positive Advanced Breast Cancer. JCO Oncol Pract 2025;21:832-42

      (27) Martin JM, Handorf EA, Montero AJ, Goldstein LJ. Systemic Therapies Following Progression on Firstline CDK4/6-inhibitor Treatment: Analysis of Real-world Data. Oncologist 2022;27:441-6

      (28) Kalinsky K, Bianchini G, Hamilton E, Graff SL, Park KH, Jeselsohn R, et al. Abemaciclib Plus Fulvestrant in Advanced Breast Cancer After Progression on CDK4/6 Inhibition: Results From the Phase III postMONARCH Trial. J Clin Oncol 2025;43:1101-12

    1. Author response:

      The following is the authors’ response to the original reviews.

      Reviewer #1 (Public review):

      Summary:

      The Major Histocompatibility Complex (MHC) region is a collection of numerous genes involved in both innate and adaptive immunity. MHC genes are famed for their role in rapid evolution and extensive polymorphism in a variety of vertebrates. This paper presents a summary of gene-level gain and loss of orthologs and paralogs within MHC across the diversity of primates, using publicly available data.

      Strengths:

      This paper provides a strong case that MHC genes are rapidly gained (by paralog duplication) and lost over millions of years of macroevolution. The authors are able to identify MHC loci by homology across species, and from this infer gene duplications and losses using phylogenetic analyses. There is a remarkable amount of genic turnover, summarized in Figure 6 and Figure 7, either of which might be a future textbook figure of immune gene family evolution. The authors draw on state-of-the-art phylogenetic methods, and their inferences are robust insofar as the data might be complete enough to draw such conclusions.

      Weaknesses:

      One concern about the present work is that it relies on public databases to draw inferences about gene loss, which is potentially risky if the publicly available sequence data are incomplete. To say, for example, that a particular MHC gene copy is absent in a taxon (e.g., Class I locus F absent in Guenons according to Figure 1), we need to trust that its absence from the available databases is an accurate reflection of its absence in the genome of the actual organisms. This may be a safe assumption, but it rests on the completeness of genome assembly (and gene annotations?) or people uploading relevant data. This reviewer would have been far more comfortable had the authors engaged in some active spot-checking, doing the lab work to try to confirm absences at least for some loci and some species. Without this, a reader is left to wonder whether gene loss is simply reflecting imperfect databases, which then undercuts confidence in estimates of rates of gene loss.

      Indeed, just because a locus has not been confirmed in a species does not necessarily mean that it is absent. As we explain in the Figure 1 caption, only a few species have had their genomes extensively studied (gray background), and only for these species does the absence of a point in this figure mean that a locus is absent. The white background rows represent species that are not extensively studied, and we point out that the absence of a point does not mean that a locus is absent from the species, rather undiscovered. We have also added a parenthetical to the text to explain this (line 156): “Only species with rows highlighted in gray have had their MHC regions extensively studied (and thus only for these rows is the absence of a gene symbol meaningful).”

      While we agree that spot-checking may be a helpful next step, one of the goals of this manuscript is to collect and synthesize the enormous volume of MHC evolution research in the primates, which will serve as a jumping-off point for other researchers to perform important wet lab work.

      Some context is useful for comparing rates of gene turnover in MHC, to other loci. Changing gene copy numbers, duplications, and loss of duplicates, are common it seems across many loci and many organisms; is MHC exceptional in this regard, or merely behaving like any moderately large gene family? I would very much have liked to see comparable analyses done for other gene families (immune, like TLRs, or non-immune), and quantitative comparisons of evolutionary rates between MHC versus other genes. Does MHC gene composition evolve any faster than a random gene family? At present readers may be tempted to infer this, but evidence is not provided.

      Our companion paper (Fortier and Pritchard, 2025) demonstrates that the MHC is a unique locus in many regards, such as its evidence for deep balancing selection and its excess of disease associations. Thus, we expect that it is evolving faster than any random gene family. It would be interesting to repeat this analysis for other gene families, but that is outside of the scope of this project. Additionally, allele databases for other gene families are not nearly as developed, but as more alleles become available for other polymorphic families, a comparable analysis could become possible.

      We have added a paragraph to the discussion (lines 530-546) to clarify that we do not know for certain whether the MHC gene family is evolving rapidly compared to other gene families.

      While on the topic of making comparisons, the authors make a few statements about relative rates. For instance, lines 447-8 compare gene topology of classical versus non-classical genes; and line 450 states that classical genes experience more turnover. But there are no quantitative values given to these rates to provide numerical comparisons, nor confidence intervals provided (these are needed, given that they are estimates), nor formal statistical comparisons to confirm our confidence that rates differ between types of genes.

      More broadly, the paper uses sophisticated phylogenetic methods, but without taking advantage of macroevolutionary comparative methods that allow model-based estimation of macroevolutionary rates. I found the lack of quantitative measurements of rates of gene gain/loss to be a weakness of the present version of the paper, and something that should be readily remedied. When claiming that MHC Class I genes "turn over rapidly" (line 476) - what does rapidly mean? How rapidly? How does that compare to rates of genetic turnover at other families? Quantitative statements should be supported by quantitative estimates (and their confidence intervals).

      These statements refer to qualitative observations, so we cannot provide numerical values. We simply conclude that certain gene groups evolve faster or slower based on the species and genes present in each clade. It is difficult to provide estimates because of the incomplete sampling of genes that survived to the present day. In addition, the presence or absence of various orthologs in different species still needs to be confirmed, at which point it might be useful to be more quantitative. We have also added a paragraph to the discussion to address this concern and advocate for similar analyses of other gene families in the future when more data is available (lines 530-546).

      The authors refer to 'shared function of the MHC across species' (e.g. line 22); while this is likely true, they are not here presenting any functional data to confirm this, nor can they rule out neofunctionalization or subfunctionalization of gene duplicates. There is evidence in other vertebrates (e.g., cod) of MHC evolving appreciably altered functions, so one may not safely assume the function of a locus is static over long macroevolutionary periods, although that would be a plausible assumption at first glance.

      Indeed, we cannot assume that the function of a locus is static across time, especially for the MHC region. In our research, we read hundreds of papers that each focused on a small number of species or genes and gathered some information about them, sometimes based on functional experiments and sometimes on measures such as dN/dS. These provide some indication of a gene’s broad classification in a species or clade, even if the evidence is preliminary. Where possible, we used this preliminary evidence to give genes descriptors “classical,” “non-classical,” “dual characteristics,” “pseudogene,” “fixed”, or “unfixed.” Sometimes multiple individuals and haplotypes were analyzed, so we could even assign a minimum number of gene copies present in a species. We have aggregated all of these references into Supplementary Table 1 (for Class I/Figure 1) and Supplementary Table 2 (for Class II/Figure 2) along with specific details about which data points in these figures that each reference supports. We realize that many of these classifications are based on a small number of individuals or indirect measures, so they may change in the future as more functional data is generated.

      Reviewer #2 (Public review):

      Summary:

      The authors aim to provide a comprehensive understanding of the evolutionary history of the Major Histocompatibility Complex (MHC) gene family across primate species. Specifically, they sought to:

      (1) Analyze the evolutionary patterns of MHC genes and pseudogenes across the entire primate order, spanning 60 million years of evolution.

      (2) Build gene and allele trees to compare the evolutionary rates of MHC Class I and Class II genes, with a focus on identifying which genes have evolved rapidly and which have remained stable.

      (3) Investigate the role of often-overlooked pseudogenes in reconstructing evolutionary events, especially within the Class I region.

      (4) Highlight how different primate species use varied MHC genes, haplotypes, and genetic variation to mount successful immune responses, despite the shared function of the MHC across species.

      (5) Fill gaps in the current understanding of MHC evolution by taking a broader, multi-species perspective using (a) phylogenomic analytical computing methods such as Beast2, Geneconv, BLAST, and the much larger computing capacities that have been developed and made available to researchers over the past few decades, (b) literature review for gene content and arrangement, and genomic rearrangements via haplotype comparisons.

      (6) The authors overall conclusions based on their analyses and results are that 'different species employ different genes, haplotypes, and patterns of variation to achieve a successful immune response'.

      Strengths:

      Essentially, much of the information presented in this paper is already well-known in the MHC field of genomic and genetic research, with few new conclusions and with insufficient respect to past studies. Nevertheless, while MHC evolution is a well-studied area, this paper potentially adds some originality through its comprehensive, cross-species evolutionary analysis of primates, focus on pseudogenes and the modern, large-scale methods employed. Its originality lies in its broad evolutionary scope of the primate order among mammals with solid methodological and phylogenetic analyses.

      The main strengths of this study are the use of large publicly available databases for primate MHC sequences, the intensive computing involved, the phylogenetic tool Beast2 to create multigene Bayesian phylogenetic trees using sequences from all genes and species, separated into Class I and Class II groups to provide a backbone of broad relationships to investigate subtrees, and the presentation of various subtrees as species and gene trees in an attempt to elucidate the unique gene duplications within the different species. The study provides some additional insights with summaries of MHC reference genomes and haplotypes in the context of a literature review to identify the gene content and haplotypes known to be present in different primate species. The phylogenetic overlays or ideograms (Figures 6 and 7) in part show the complexity of the evolution and organisation of the primate MHC genes via the orthologous and paralogous gene and species pathways progressively from the poorly-studied NWM, across a few moderately studied ape species, to the better-studied human MHC genes and haplotypes.

      Weaknesses:

      The title 'The Primate Major Histocompatibility Complex: An Illustrative Example of GeneFamily Evolution' suggests that the paper will explore how the Major Histocompatibility Complex (MHC) in primates serves as a model for understanding gene family evolution. The term 'Illustrative Example' in the title would be appropriate if the paper aimed to use the primate Major Histocompatibility Complex (MHC) as a clear and representative case to demonstrate broader principles of gene family evolution. That is, the MHC gene family is not just one instance of gene family evolution but serves as a well-studied, insightful example that can highlight key mechanisms and concepts applicable to other gene families. However, this is not the case, this paper only covers specific details of primate MHC evolution without drawing broader lessons to any other gene families. So, the term 'Illustrative Example' is too broad or generalizing. In this case, a term like 'Case Study' or simply 'Example' would be more suitable. Perhaps, 'An Example of Gene Family Diversity' would be more precise. Also, an explanation or 'reminder' is suggested that this study is not about the origins of the MHC genes from the earliest jawed vertebrates per se (~600 mya), but it is an extension within a subspecies set that has emerged relatively late (~60 mya) in the evolutionary divergent pathways of the MHC genes, systems, and various vertebrate species.

      Thank you for your input on the title; we have changed it to “A case study of gene family evolution” instead.

      Thank you also for pointing out the potential confusion about the time span of our study. We have added “Having originated in the jawed vertebrates,” to a sentence in the introduction (lines 38-39). We have also added the sentence “Here, we focus on the primates, spanning approximately 60 million years within the over 500-million-year evolution of the family \citep{Flajnik2010}.“ to be more explicit about the context for our work (lines 59-61).

      Phylogenomics. Particular weaknesses in this study are the limitations and problems associated with providing phylogenetic gene and species trees to try and solve the complex issue of the molecular mechanisms involved with imperfect gene duplications, losses, and rearrangements in a complex genomic region such as the MHC that is involved in various effects on the response and regulation of the immune system. A particular deficiency is drawing conclusions based on a single exon of the genes. Different exons present different trees. Which are the more reliable? Why were introns not included in the analyses? The authors attempt to overcome these limitations by including genomic haplotype analysis, duplication models, and the supporting or contradictory information available in previous publications. They succeed in part with this multidiscipline approach, but much is missed because of biased literature selection. The authors should include a paragraph about the benefits and limitations of the software that they have chosen for their analysis, and perhaps suggest some alternative tools that they might have tried comparatively. How were problems with Bayesian phylogeny such as computational intensity, choosing probabilities, choosing particular exons for analysis, assumptions of evolutionary models, rates of evolution, systemic bias, and absence of structural and functional information addressed and controlled for in this study?

      We agree that different exons have different trees, which is exactly why we repeated our analysis for each exon in order to compare and contrast them. In particular, the exons encoding the binding site of the resulting protein (exons 2 and 3 for Class I and exon 2 for Class II) show evidence for trans-species polymorphism and gene conversion. These phenomena lead to trees that do not follow the species tree and are fascinating in and of themselves, which we explore in detail in our companion paper (Fortier and Pritchard, 2025). Meanwhile, the non-peptide-binding extracellular-domain-encoding exon (exon 4 for Class I and exon 3 for Class II) is comparably sized to the binding-site-encoding exons and provides an interesting functional contrast. As this exon is likely less affected by trans-species polymorphism, gene conversion, and convergent evolution, we present results from it most often in the main text, though we occasionally touch on differences between the exons. See lines 191-196, 223-226, and 407-414 for some examples of how we discuss the exons in the text. Additionally, all trees from all of these exons can be found in the supplement. 

      We agree that introns would valuable to study in this context. Even though the non--binding-site-encoding exons are probably *less* affected by trans-species polymorphism, gene conversion, and convergent evolution, they are still functional. The introns, however, experience much more relaxed selection, if any, and comparing their trees to those for the exons would be valuable and illuminating. We did not generate intron trees for two reasons. Most importantly, there is a dearth of data available for the introns; in the databases we used, there was often intron data available only for human, chimpanzee, and sometimes macaque, and only for a small subset of the genes. This limitation is at odds with the comprehensive, many-gene-many-species approach which we feel is the main novelty of this work. Secondly, the introns that *are* available are difficult to align. Even aligning the exons across such a highly-diverged set of genes and pseudogenes was difficult and required manual effort. The introns proved even more difficult to try to align across genes. In the future, when more intron data is available and sufficient effort is put into aligning them, it will be possible and desirable to do a comparable analysis. We also added a sentence to the “Data” section to briefly explain why we did not include introns (lines 134-135).

      We explain our Bayesian phylogenetics approach in detail in the Methods (lines 650-725), including our assumptions and our solutions to challenges specific to this application. For further explanation of the method itself, we suggest reading the original BEAST and BEAST2 papers (Drummond & Rambaut (2007), Drummond et al. (2012), Bouckaert et al. (2014), and Bouckaert et al. (2019)). Known structural and functional information helped us validate the alignments we used in this study, but the fact that such information is not fully known for every gene and species should not affect the method itself.

      Gene families as haplotypes. In the Introduction, the MHC is referred to as a 'gene family', and in paragraph 2, it is described as being united by the 'MHC fold', despite exhibiting 'very diverse functions'. However, the MHC region is more accurately described as a multigene region containing diverse, haplotype-specific Conserved Polymorphic Sequences, many of which are likely to be regulatory rather than protein-coding. These regulatory elements are essential for controlling the expression of multiple MHC-related products, such as TNF and complement proteins, a relationship demonstrated over 30 years ago. Non-MHC fold loci such as TNF, complement, POU5F1, lncRNA, TRIM genes, LTA, LTB, NFkBIL1, etc, are present across all MHC haplotypes and play significant roles in regulation. Evolutionary selection must act on genotypes, considering both paternal and maternal haplotypes, rather than on individual genes alone. While it is valuable to compile databases for public use, their utility is diminished if they perpetuate outdated theories like the 'birth-and-death model'. The inclusion of prior information or assumptions used in a statistical or computational model, typically in Bayesian analysis, is commendable, but they should be based on genotypic data rather than older models. A more robust approach would consider the imperfect duplication of segments, the history of their conservation, and the functional differences in inheritance patterns. Additionally, the MHC should be examined as a genomic region, with ancestral haplotypes and sequence changes or rearrangements serving as key indicators of human evolution after the 'Out of Africa' migration, and with disease susceptibility providing a measurable outcome. There are more than 7000 different HLA-B and -C alleles at each locus, which suggests that there are many thousands of human HLA haplotypes to study. In this regard, the studies by Dawkins et al (1999 Immunol Rev 167,275), Shiina et al. (2006 Genetics 173,1555) on human MHC gene diversity and disease hitchhiking (haplotypes), and Sznarkowska et al. (2020 Cancers 12,1155) on the complex regulatory networks governing MHC expression, both in terms of immune transcription factor binding sites and regulatory non-coding RNAs, should be examined in greater detail, particularly in the context of MHC gene allelic diversity and locus organization in humans and other primates.

      Thank you for these comments. To clarify that the MHC “region” is different from (and contains) the MHC “gene family” as we describe it, we changed a sentence in the abstract (lines 8-10) from “One large gene family that has experienced rapid evolution is the Major Histocompatibility Complex (MHC), whose proteins serve critical roles in innate and adaptive immunity.” to “One large gene family that has experienced rapid evolution lies within the Major Histocompatibility Complex (MHC), whose proteins serve critical roles in innate and adaptive immunity.” We know that the region is complex and contains many other genes and regulatory sequences; Figure 1 of our companion paper (Fortier and Pritchard, 2025) depicts these in order to show the reader that the MHC genes we focus on are just one part of the entire region.

      We love the suggestion to look at the many thousands of alleles present at each of the classical loci. This is the focus of our complimentary paper (Fortier and Pritchard, 2025) which explores variation at the allele level. In the current paper, we look mainly at the differences between genes and the use of different genes in different species.

      Diversifying and/or concerted evolution. Both this and past studies highlight diversifying selection or balancing selection model is the dominant force in MHC evolution. This is primarily because the extreme polymorphism observed in MHC genes is advantageous for populations in terms of pathogen defence. Diversification increases the range of peptides that can be presented to T cells, enhancing the immune response. The peptide-binding regions of MHC genes are highly variable, and this variability is maintained through selection for immune function, especially in the face of rapidly evolving pathogens. In contrast, concerted evolution, which typically involves the homogenization of gene duplicates through processes like gene conversion or unequal crossing-over, seems to play a minimal role in MHC evolution. Although gene duplication events have occurred in the MHC region leading to the expansion of gene families, the resulting paralogs often undergo divergent evolution rather than being kept similar or homozygous by concerted evolution. Therefore, unlike gene families such as ribosomal RNA genes or histone genes, where concerted evolution leads to highly similar copies, MHC genes display much higher levels of allelic and functional diversification. Each MHC gene copy tends to evolve independently after duplication, acquiring unique polymorphisms that enhance the repertoire of antigen presentation, rather than undergoing homogenization through gene conversion. Also, in some populations with high polymorphism or genetic drift, allele frequencies may become similar over time without the influence of gene conversion. This similarity can be mistaken for gene conversion when it is simply due to neutral evolution or drift, particularly in small populations or bottlenecked species. Moreover, gene conversion might contribute to greater diversity by creating hybrids or mosaics between different MHC genes. In this regard, can the authors indicate what percentage of the gene numbers in their study have been homogenised by gene conversion compared to those that have been diversified by gene conversion?

      We appreciate the summary, and we feel we have appropriately discussed both gene conversion and diversifying selection in the context of the MHC genes. Because we cannot know for sure when and where gene conversion has occurred, we cannot quantify percentages of genes that have been homogenized or diversified.  

      Duplication models. The phylogenetic overlays or ideograms (Figures 6 and 7) show considerable imperfect multigene duplications, losses, and rearrangements, but the paper's Discussion provides no in-depth consideration of the various multigenic models or mechanisms that can be used to explain the occurrence of such events. How do their duplication models compare to those proposed by others? For example, their text simply says on line 292, 'the proposed series of events is not always consistent with phylogenetic data'. How, why, when? Duplication models for the generation and extension of the human MHC class I genes as duplicons (extended gene or segmental genomic structures) by parsimonious imperfect tandem duplications with deletions and rearrangements in the alpha, beta, and kappa blocks were already formulated in the late 1990s and extended to the rhesus macaque in 2004 based on genomic haplotypic sequences. These studies were based on genomic sequences (genes, pseudogenes, retroelements), dot plot matrix comparisons, and phylogenetic analyses of gene and retroelement sequences using computer programs. It already was noted or proposed in these earlier 1999 studies that (1) the ancestor of HLA-P(90)/-T(16)/W(80) represented an old lineage separate from the other HLA class I genes in the alpha block, (2) HLA-U(21) is a duplicated fragment of HLA-A, (3) HLA-F and HLA-V(75) are among the earliest (progenitor) genes or outgroups within the alpha block, (4) distinct Alu and L1 retroelement sequences adjoining HLA-L(30), and HLA-N genomic segments (duplicons) in the kappa block are closely related to those in the HLA-B and HLA-C in the beta block; suggesting an inverted duplication and transposition of the HLA genes and retroelements between the beta and kappa regions. None of these prior human studies were referenced by Fortier and Pritchard in their paper. How does their human MHC class I gene duplication model (Fig. 6) such as gene duplication numbers and turnovers differ from those previously proposed and described by Kulski et al (1997 JME 45,599), (1999 JME 49,84), (2000 JME 50,510), Dawkins et al (1999 Immunol Rev 167,275), and Gaudieri et al (1999 GR 9,541)? Is this a case of reinventing the wheel?

      Figures 6 and 7 are intended to synthesize and reconcile past findings and our own trees, so they do not strictly adhere to the findings of any particular study and cannot fully match all studies. In the supplement, Figure 6 - figure supplement 1 and Figure 7 - figure supplement 1 duly credit all of the past work that went into making these trees. Most previous papers focus on just one aspect of these trees, such as haplotypes within a species, a specific gene or allelic lineage relationship, or the branching pattern of particular gene groups. We believe it was necessary to bring all of these pieces of evidence together. Even among papers with the same focus (to understand the block duplications that generated the current physical layout of the MHC), results differ. For example, Geraghty (1992), Hughes (1995), Kulski (2004)/Kulski (2005),  and Shiina (1999) all disagree on the exact branching order of the genes MHC-W, -P, and -T, and of MHC-G, -J, and -K. While the Kulski studies you pointed out were very thorough for their era, they still only relied on data from three species and one haplotype per species. Our work is not intended to replace or discredit these past works, simply build upon them with a larger set of species and sequences. We hope the hypotheses we propose in Figures 6 and 7 can help unify existing research and provide a more easily accessible jumping-off-point for future work.

      Results. The results are presented as new findings, whereas most if not all of the results' significance and importance already have been discussed in various other publications. Therefore, the authors might do better to combine the results and discussion into a single section with appropriate citations to previously published findings presented among their results for comparison. Do the trees and subsets differ from previous publications, albeit that they might have fewer comparative examples and samples than the present preprint? Alternatively, the results and discussion could be combined and presented as a review of the field, which would make more sense and be more honest than the current format of essentially rehashing old data.

      In starting this project, we found that a large barrier to entry to this field of study is the immense amount of published literature over 30+ years. It is both time-consuming and confusing to read up on the many nuances of the MHC genes, their changing names, and their evolution, making it difficult to start new, innovative projects. We acknowledge that while our results are not entirely novel, the main advantage of our work is that it provides a thorough, comprehensive starting point for others to learn about the MHC quickly and dive into new research. We feel that we have appropriately cited past literature in both the main text, appendices, and supplement, so that readers may dive into a particular area with ease.

      Minor corrections:

      (1) Abstract, line 19: 'modern methods'. Too general. What modern methods?

      To keep the abstract brief, the methods are introduced in the main text when each becomes relevant as well as in the methods section.

      (2) Abstract, line 25: 'look into [primate] MHC evolution.' The analysis is on the primate MHC genes, not on the entire vertebrate MHC evolution with a gene collection from sharks to humans. The non-primate MHC genes are often differently organised and structurally evolved in comparison to primate MHC.

      Thank you! We have added the word “primate” to the abstract (line 25).

      (3) Introduction, line 113. 'In a companion paper (Fortier and Pritchard, 2024)' This paper appears to be unpublished. If it's unpublished, it should not be referenced.

      This paper is undergoing the eLife editorial process at the same time; it will have a proper citation in the final version.

      (4) Figures 1 and 2. Use the term 'gene symbols' (circle, square, triangle, inverted triangle, diamond) or 'gene markers' instead of 'points'. 'Asterisks "within symbols" indicate new information.

      Thank you, the word “symbol” is much clearer! We have changed “points” to “symbols” in the captions for Figure 1, Figure 1 - figure supplement 1, Figure 2, and Figure 2 - figure supplement 1. We also changed this in the text (lines 157-158 and 170).

      (5) Figures. A variety of colours have been applied for visualisation. However, some coloured texts are so light in colour that they are difficult to read against a white background. Could darker colours or black be used for all or most texts?

      With such a large number of genes and species to handle in this work, it was nearly impossible to choose a set of colors that were distinct enough from each other. We decided to prioritize consistency (across this paper, its supplement, and our companion paper) as well as at-a-glance grouping of similar sequences. Unfortunately, this means we had to sacrifice readability on a white background, but readers may turn to the supplement if they need to access specific sequence names.

      (6) Results, line 135. '(Fortier and Pritchard, 2024)' This paper appears to be unpublished. If it's unpublished, it should not be referenced.

      Repeat of (3). This paper is undergoing the eLife editorial process at the same time; it will have a proper citation in the final version.

      (7) Results, lines 152 to 153, 164, 165, etc. 'Points with an asterisk'. Use the term 'gene symbols' (circle, square, triangle, inverted triangle, diamond) or 'gene markers' instead of 'points'. A point is a small dot such as those used in data points for plotting graphs .... The figures are so small that the asterisks in the circles, squares, triangles, etc, look like points (dots) and the points/asterisks terminology that is used is very confusing visually.

      Repeat of (4). Thank you, the word “symbol” is much clearer! We have changed “points” to “symbols” in the captions for Figure 1, Figure 1 - figure supplement 1, Figure 2, and Figure 2 - figure supplement 1. We also changed this in the text (lines 157-158 and 170).

      (8) Line 178 (BEA, 2024) is not listed alphabetically in the References.

      Thank you for catching this! This reference maps to the first bibliography entry, “SUMMARIZING POSTERIOR TREES.” We are unsure how to cite a webpage that has no explicit author within the eLife Overleaf template, so we will consult with the editor.

      (9) Lines 188-190. 'NWM MHC-G does not group with ape/OWM MHC-G, instead falling outside of the clade containing ape/OWM MHC-A, -G, -J and -K.' This is not surprising given that MHC-A, -G, -J, and -K are paralogs of each other and that some of them, especially in NWM have diverged over time from the paralogs and/or orthologs and might be closer to one paralog than another and not be an actual ortholog of OWM, apes or humans.

      We included this sentence to clarify the relationships between genes and to help describe what is happening in Figure 6. Figure 6 - figure supplement 1 includes all of the references that go into such a statement and Appendix 3 details our reasoning for this and other statements.

      (10) Line 249. Gene conversion: This is recombination between two different genes where a portion of the genes are exchanged with one another so that different portions of the gene can group within one or other of the two gene clades. Alternatively, the gene has been annotated incorrectly if the gene does not group within either of the two alternative clades. Another possibility is that one or two nucleotide mutations have occurred without a recombination resulting in a mistaken interpretation or conclusion of a recombination event. What measures are taken to avoid false-positive conclusions? How many MHC gene conversion (recombination) events have occurred according to the authors' estimates? What measures are taken to avoid false-positive conclusions?

      All of these possibilities are certainly valid. We used the program GENECONV to infer gene conversion events, but there is considerable uncertainty owing to the ages of the genes and the inevitable point mutations that have occurred post-event. Gene conversion was not the focus of our paper, so we did our best to acknowledge it (and the resulting differences between trees from different exons) without spending too much time diving into it. A list of inferred gene conversion events can be found in Figure 3 - source data 1 and Figure 4 - source data 1.

      (11) Lines 284-286. 'The Class I MHC region is further divided into three polymorphic blocks-alpha, beta, and kappa blocks-that each contains MHC genes but are separated by well-conserved non-MHC genes.' The MHC class I region was first designated into conserved polymorphic duplication blocks, alpha and beta by Dawkins et al (1999 Immunol Rev 167,275), and kappa by Kulski et al (2002 Immunol Rev 190,95), and should be acknowledged (cited) accordingly.

      Thank you for catching this! We have added these citations (lines 302-303)!

      (12) Lines 285-286. 'The majority of the Class I genes are located in the alpha-block, which in humans includes 12 MHC genes and pseudogenes.' This is not strictly correct for many other species, because the majority of class I genes might be in the beta block of new and old-world monkeys, and the authors haven't provided respective counts of duplication numbers to show otherwise. The alpha block in some non-primate mammalian species such as pigs, rats, and mice has no MHC class I genes or only a few. Most MHC class I genes in non-primate mammalian species are found in other regions. For example, see Ando et al (2005 Immunogenetics 57,864) for the pig alpha, beta, and kappa regions in the MHC class I region. There are no pig MHC genes in the alpha block.

      Yes, which is exactly why we use the phrase “in humans” in that particular sentence. The arrangement of the MHC in several other primate reference genomes is shown in Figure 1 - figure supplement 2.

      (13) Line 297 to 299. 'The alpha-block also contains a large number of repetitive elements and gene fragments belonging to other gene families, and their specific repeating pattern in humans led to the conclusion that the region was formed by successive block duplications (Shiina et al., 1999).' There are different models for successive block duplications in the alpha block and some are more parsimonious based on imperfect multigenic segmental duplications (Kulski et al 1999, 2000) than others (Shiina et al., 1999). In this regard, Kulski et al (1999, 2000) also used duplicated repetitive elements neighbouring MHC genes to support their phylogenetic analyses and multigenic segmental duplication models. For comparison, can the authors indicate how many duplications and deletions they have in their models for each species?

      We have added citations to this sentence to show that there are different published models to describe the successive block duplications (line 307). Our models in Figure 6 and Figure 7 are meant to aggregate past work and integrate our own, and thus they were not built strictly by parsimony. References can be found in Figure 6 - figure supplement 1 and Figure 7 - figure supplement 1.

      (14) Lines 315-315. 'Ours is the first work to show that MHC-U is actually an MHC-A-related gene fragment.' This sentence should be deleted. Other researchers had already inferred that MHC-U is actually an MHC-A-related gene fragment more than 25 years ago (Kulski et al 1999, 2000) when the MHC-U was originally named MHC-21.

      While these works certainly describe MHC-U/MHC-21 as a fragment in the 𝛼-block, any relation to MHC-A was by association only and very few species/haplotypes were examined. So although the idea is not wholly novel, we provide convincing evidence that not only is MHC-U related to MHC-A by sequence, but also that it is a very recent partial duplicate of MHC-A. We show this with Bayesian phylogenetic trees as well as an analysis of haplotypes across many more species than were included in those papers.  

      (15) Lines 361-362. 'Notably, our work has revealed that MHC-V is an old fragment.' This is not a new finding or hypothesis. Previous phylogenetic analysis and gene duplication modelling had already inferred HLA-V (formerly HLA-75) to be an old fragment (Kulski et al 1999, 2000).

      By “old,” we mean older than previous hypotheses suggest. Previous work has proposed that MHC-V and -P were duplicated together, with MHC-V deriving from an MHC-A/H/V ancestral gene and MHC-P deriving from an MHC-W/T/P ancestral gene (Kulski (2005), Shiina (1999)). However, our analysis (Figure 5A) shows that MHC-V sequences form a monophyletic clade outside of the MHC-W/P/T group of genes as well as outside of the MHC-A/B/C/E/F/G/J/K/L group of genes, which is not consistent with MHC-A and -V being closely related. Thus, we conclude that MHC-V split off earlier than the differentiation of these other gene groups and is thus older than previously thought. We explain this in the text as well (lines 317-327) and in Appendix 3.  

      (16) Line 431-433. 'the Class II genes have been largely stable across the mammals, although we do see some lineage-specific expansions and contractions (Figure 2 and Figure 2-gure Supplement 2).' Please provide one or two references to support this statement. Is 'gure' a typo?

      We corrected this typo, thank you! This conclusion is simply drawn from the data presented in Figure 2 and Figure 2 - figure supplement 2. The data itself comes from a variety of sources, which are already included in the supplement as Figure 2 - source data 1.

      (17) Line 437. 'We discovered far more "specific" events in Class I, while "broad-scale" events were predominant in Class II.' Please define the difference between 'specific' and 'broad-scale'.

      These terms are defined in the previous sentence (lines 466-469).

      450-451. 'This shows that classical genes experience more turnover and are more often affected by long-term balancing selection or convergent evolution.' Is balancing selection a form of divergent evolution that is different from convergent evolution? Please explain in more detail how and why balancing selection or convergent evolution affects classical and nonclassical genes differently.

      Balancing selection acts to keep alleles at moderate frequencies, preventing any from fixing in the population. In contrast, convergent evolution describes sequences or traits becoming similar over time even though they are not similar by descent. While we cannot know exactly what selective forces have occurred in the past, we observe different patterns in the trees for each type of gene. In Figures 1 and 2, viewers can see at first glance that the nonclassical genes (which are named throughout the text and thoroughly described in Appendix 3) appear to be longer-lived than the classical genes. In addition, lines 204-222 and 475-488 describe topological differences in the BEAST2 trees of these two types of genes. However, we acknowledge that it could be helpful to have additional, complimentary information about the classical vs. non-classical genes. Thus, we have added a sentence and reference to our companion paper (Fortier and Pritchard, 2025), which focuses on long-term balancing selection and draws further contrast between classical and non-classical genes. In lines 481-484, we added  “We further explore the differences between classical and non-classical genes in our companion paper, finding ancient trans-species polymorphism at the classical genes but not at the non-classical genes \citep{Fortier2025b}.”

      References

      Some references in the supplementary materials such as Alvarez (1997), Daza-Vamenta (2004), Rojo (2005), Aarnink (2014), Kulski (2022), and others are missing from the Reference list. Please check that all the references in the text and the supplementary materials are listed correctly and alphabetically.

      We will make sure that these all show up properly in the proof.

      Reviewer #3 (Public review):

      Summary:

      The article provides the most comprehensive overview of primate MHC class I and class II genes to date, combining published data with an exploration of the available genome assemblies in a coherent phylogenetic framework and formulating new hypotheses about the evolution of the primate MHC genomic region.

      Strengths:

      I think this is a solid piece of work that will be the reference for years to come, at least until population-scale haplotype-resolved whole-genome resequencing of any mammalian species becomes standard. The work is timely because there is an obvious need to move beyond short amplicon-based polymorphism surveys and classical comparative genomic studies. The paper is data-rich and the approach taken by the authors, i.e. an integrative phylogeny of all MHC genes within a given class across species and the inclusion of often ignored pseudogenes, makes a lot of sense. The focus on primates is a good idea because of the wealth of genomic and, in some cases, functional data, and the relatively densely populated phylogenetic tree facilitates the reconstruction of rapid evolutionary events, providing insights into the mechanisms of MHC evolution. Appendices 1-2 may seem unusual at first glance, but I found them helpful in distilling the information that the authors consider essential, thus reducing the need for the reader to wade through a vast amount of literature. Appendix 3 is an extremely valuable companion in navigating the maze of primate MHC genes and associated terminology.

      Weaknesses:

      I have not identified major weaknesses and my comments are mostly requests for clarification and justification of some methodological choices.

      Thank you so much for your kind and supportive review!

      Reviewer #1 (Recommendations for the authors):

      (1) Line 151: How is 'extensively studied' defined?

      Extensively studied is not a strict definition, but a few organisms clearly stand apart from the rest in terms of how thoroughly their MHC regions have been studied. For example, the macaque is a model organism, and individuals from many different species and populations have had their MHC regions fully sequenced. This is in contrast to the gibbon, for example, in which there is some experimental evidence for the presence of certain genes, but no MHC region has been fully sequenced from these animals.

      (2) Can you clarify how 'classical' and 'non-classical' MHC genes are being determined in your analysis?

      Classical genes are those whose protein products perform antigen presentation to T cells and are directly involved in adaptive immunity, while non-classical genes are those whose protein products do not do this. For example, these non-classical genes might code for proteins that interact with receptors on Natural Killer cells and influence innate immunity. The roles of these proteins are not necessarily conserved between closely related species, and experimental evidence is needed to evaluate this. However, in the absence of such evidence, wherever possible we have provided our best guess as to the roles of the orthologous genes in other species, presented in Figure 1 - source data 1 and Figure 2 - source data 1. This is based on whatever evidence is available at the moment, sometimes experimental but typically based on dN/dS ratios and other indirect measures.

      (3) I find the overall tone of the paper to be very descriptive, and at times meandering and repetitive, with a lot of similar kinds of statements being repeated about gene gain/loss. This is perhaps inevitable because a single question is being asked of each of many subsets of MHC gene types, and even exons within gene types, so there is a lot of repetition in content with a slightly different focus each time. This does not help the reader stay focused or keep track. I found myself wishing for a clearly defined question or hypothesis, or some rate parameter in need of estimation. I would encourage the authors to tighten up their phrasing, or consider streamlining the results with some better signposting to organize ideas within the results.

      We totally understand your critique, as we talk about a wide range of specific genes and gene groups in this paper. To improve readability, we have added many more signposting phrases and sentences:

      “Aside from MHC-DRB, …” (line 173)

      “Now that we had a better picture of the landscape of MHC genes present in different primates, we wanted to understand the genes’ relationships. Treating Class I, Class IIA, and Class IIB separately, ...” (line 179-180)

      “We focus first on the Class I genes.” (line 191)

      “... for visualization purposes…” (line195)

      “We find that sequences do not always assort by locus, as would be expected for a typical gene.” (lines 196-197)

      “... rather than being directly orthologous to the ape/OWM MHC-G genes.” (lines 201-202)

      “Appendix 3 explains each of these genes in detail, including previous work and findings from this study.“ (lines 202-203)

      “... (but not with NWM) …” (line 208)

      “While genes such as MHC-F have trees which closely match the overall species tree, other genes show markedly different patterns, …” (lines 212-213)

      “Thus, while some MHC-G duplications appear to have occurred prior to speciation events within the NWM, others are species-specific.” (lines 218-219)

      “... indicating rapid evolution of many of the Class I genes” (lines 220-221)

      “Now turning to the Class II genes, …“ (line 223)

      “(see Appendix 2 for details on allele nomenclature) “ (line 238)

      “(e.g. MHC-DRB1 or -DRB2)” (line 254)

      “...  meaning their names reflect previously-observed functional similarity more than evolutionary relatedness.” (lines 257-258)

      “(see Appendix 3 for more detail)” (line 311)

      “(a 5'-end fragment)” (line 324)

      “Therefore, we support past work that has deemed MHC-V an old fragment.” (lines 326-327)

      “We next focus on MHC-U, a previously-uncharacterized fragment pseudogene containing only exon 3.” (line 328-329)

      “However, it is present on both chimpanzee haplotypes and nearly all human haplotypes, and we know that these haplotypes diverged earlier---in the ancestor of human and gorilla. Therefore, ...” (lines 331-333)

      “Ours is the first work to show that MHC-U is actually an MHC-A-related gene fragment and that it likely originated in the human-gorilla ancestor.” (lines 334-336)  

      “These pieces of evidence suggest that MHC-K and -KL duplicated in the ancestor of the apes.” (lines 341-342)

      “Another large group of related pseudogenes in the Class I $\alpha$-block includes MHC-W, -P, and -T (see Appendix 3 for more detail).” (lines 349-350)

      “...to form the current physical arrangement” (lines 354)

      “Thus, we next focus on the behavior of this subgroup in the trees.” (line 358)

      “(see Appendix 3 for further explanation).” (line 369)

      “Thus, for the first time we show that there must have been three distinct MHC-W-like genes in the ape/OWM ancestor.” (lines 369-371)

      “... and thus not included in the previous analysis. ” (lines 376-377)

      “MHC-Y has also been identified in gorillas (Gogo-Y) (Hans et al., 2017), so we anticipate that Gogo-OLI will soon be confirmed. This evidence suggests that the MHC-Y and -OLI-containing haplotype is at least as old as the human-gorilla split. Our study is the first to place MHC-OLI in the overall story of MHC haplotype evolution“ (lines 381-384)

      “Appendix 3 explains the pieces of evidence leading to all of these conclusions (and more!) in more detail.” (lines 395-396)

      “However, looking at this exon alone does not give us a complete picture.” (lines 410-411)

      “...instead of with other ape/OWM sequences, …” (lines 413-414)

      “Figure 7 shows plausible steps that might have generated the current haplotypes and patterns of variation that we see in present-day primates. However, some species are poorly represented in the data, so the relationships between their genes and haplotypes are somewhat unclear.” (lines 427-429)

      “(and more-diverged)” (line 473)

      “(of both classes)” (line 476)

      “..., although the classes differ in their rate of evolution.”  (line 487-488)

      “Including these pseudogenes in our trees helped us construct a new model of $\alpha$-block haplotype evolution. “ (lines 517-518)

      (4) Line 480-82: "Notably...." why is this notable? Don't merely state that something is notable, explain what makes it especially worth drawing the reader's attention to: in what way is it particularly significant or surprising?

      We have changed the text from “Notably” to “In particular” (line 390) so that readers are expecting us to list some specific findings. Similarly, we changed “Notably” to “Specifically” (line 515).

      (5) The end of the discussion is weak: "provide context" is too vague and not a strong statement of something that we learned that we didn't know before, or its importance. This is followed by "This work will provide a jumping-off point for further exploration..." such as? What questions does this paper raise that merit further work?

      We have made this paragraph more specific and added some possible future research directions. It now reads “By treating the MHC genes as a gene family and including more data than ever before, this work enhances our understanding of the evolutionary history of this remarkable region. Our extensive set of trees incorporating classical genes, non-classical genes, pseudogenes, gene fragments, and alleles of medical interest across a wide range of species will provide context for future evolutionary, genomic, disease, and immunologic studies. For example, this work provides a jumping-off-point for further exploration of the evolutionary processes affecting different subsets of the gene family and the nuances of immune system function in different species. This study also provides a necessary framework for understanding the evolution of particular allelic lineages within specific MHC genes, which we explore further in our companion paper \citep{Fortier2025b}. Both studies shed light on MHC gene family evolutionary dynamics and bring us closer to understanding the evolutionary tradeoffs involved in MHC disease associations.” (lines 576-586)

      Reviewer #3 (Recommendations for the authors):

      (1) Figure 1 et seq. Classifying genes as having 'classical', 'non-classical' and 'dual' properties is notoriously difficult in non-model organisms due to the lack of relevant information. As you have characterised a number of genes for the first time in this paper and could not rely entirely on published classifications, please indicate the criteria you used for classification.

      The roles of these proteins are not necessarily conserved between closely related species, and experimental evidence is needed to evaluate this. However, in the absence of such evidence, wherever possible we have provided our best guess as to the roles of the orthologous genes in other species, presented in Figure 1 - source data 1 and Figure 2 - source data 1. This is based on whatever evidence is available at the moment, sometimes experimental but typically based on dN/dS ratios and other indirect measures.

      (2) Line 61 It's important to mention that classical MHC molecules present antigenic peptides to T cells with variable alphabeta T cell receptors, as non-classical MHC molecules may interact with other T cell subsets/types.

      Thank you for pointing this out; we have updated the text to make this clearer (lines 63-65). We changed “‘Classical’ MHC molecules perform antigen presentation to T cells---a key part of adaptive immunity---while ‘non-classical’ molecules have niche immune roles.” to “‘Classical’ MHC molecules perform antigen presentation to T cells with variable alphabeta TCRs---a key part of adaptive immunity---while ‘non-classical’ molecules have niche immune roles.”

      (3) Perhaps it's worth mentioning in the introduction that you are deliberately excluding highly divergent non-classical MHC molecules such as CD1.

      Thank you, it’s worth clarifying exactly what molecules we are discussing. We have added a sentence to the introduction (lines 38-43): “Having originated in the jawed vertebrates, this group of genes is now involved in diverse functions including lipid metabolism, iron uptake regulation, and immune system function (proteins such as zinc-𝛼2-glycoprotein (ZAG), human hemochromatosis protein (HFE), MHC class I chain–related proteins (MICA, MICB), and the CD1 family) \citep{Hansen2007,Kupfermann1999,Kaufman2022,Adams2013}. However, here we focus on…”

      (4) Line 94-105 This material presents results, it could be moved to the results section as it now somewhat disrupts the flow.

      We feel it is important to include a “teaser” of the results in the introduction, which can be slightly more detailed than that in the abstract.

      (5) Line 118-131 This opening section of the results sets the stage for the whole presentation and contains important information that I feel needs to be expanded to include an overview and justification of your methodological choices. As the M&M section is at the end of the MS (and contains limited justification), some information on two aspects is needed here for the benefit of the reader. First, as far as I understand, all phylogenetic inferences were based entirely on DNA sequences of individual (in some cases concatenated) exons. It would be useful for the reader to explain why you've chosen to rely on DNA rather than protein sequences, even though some of the genes you include in the phylogenetic analysis are highly divergent. Second, a reader might wonder how the "maximum clade credibility tree" from the Bayesian analysis compares to commonly seen trees with bootstrap support or posterior probability values assigned to particular clades. Personally, I think that the authors' approach to identifying and presenting representative trees is reasonable (although one might wonder why "Maximum clade credibility tree" and not "Maximum credibility tree" https://www.beast2.org/summarizing-posterior-trees/), since they are working with a large number of short, sometimes divergent and sometimes rather similar sequences - in such cases, a requirement for strict clade support could result in trees composed largely of polytomies. However, I feel it's necessary to be explicit about this and to acknowledge that the relationships represented by fully resolved bifurcating representative trees and interpreted in the study may not actually be highly supported in the sense that many readers might expect. In other words, the reader should be aware from the outset of what the phylogenies that are so central to the paper represent.

      We chose to rely on DNA rather than protein sequences because convergent evolution is likely to happen in regions that code for extremely important functions such as adaptive and innate immunity. Convergent evolution acts upon proteins while trans-species polymorphism retains ancient nucleotide variation, so studying the DNA sequence can help tease apart convergent evolution from trans-species polymorphism.

      As for the “maximum clade credibility tree”, this is a matter of confusing nomenclature. In the online reference guide (https://www.beast2.org/summarizing-posterior-trees/), the tree with the maximum product of the posterior clade probabilities is called the “maximum credibility tree” while the tree that has the maximum sum of posterior clade probabilities is called the “Maximum credibility tree”. The “Maximum credibility tree” (referring to the sum) appears to have only been named in this way in the first version of TreeAnnotator. However, the version of TreeAnnotator that I used lists the options “maximum clade credibility tree” and “maximum sum of clade probabilities”. So the context suggests that the “maximum clade credibility tree” option is actually maximizing the product. This “maximum clade credibility tree” is the setting I used for this project (in TreeAnnotator version 2.6.3).

      We agree that readers may not fully grasp what the collapsed trees represent upon first read. We have added a sentence to the beginning of the results (line 188-190) to make this more explicit.

      (6) Line 224, you're referring to the DPB1*09 lineage, not the DRB1*09 lineage.

      Indeed! We have changed these typos.

      (7) Line 409, why "Differences between MHC subfamilies" and not "Differences between MHC classes"?

      We chose the word “subfamilies” because we discuss the difference between classical and non-classical genes in addition to differences between Class I and Class II genes.

      (8) Line 529-544 This might work better as a table.

      We agree! This information is now presented as Table 1.

      (9) Line 547 MHC-DRB9 appears out of the blue here - please say why you are singling it out.

      Great point! We added a paragraph (lines 614-623) to explain why this was necessary.

      (10) Line 550-551 Even though you've screened the hits manually, it would be helpful to outline your criteria for this search.

      Thank you! We’ve added a couple of sentences to explain how we did this (lines 607-610).

      (11) Line 556-580 please provide nucleotide alignments as supplementary data so that the reader can get an idea of the actual divergence of the sequences that have been aligned together.

      Thank you! We’ve added nucleotide alignments as supplementary files.

      (12) Line 651-652 Why "Maximum clade credibility tree" and not "Maximum credibility tree"? 

      Repeat of (5). This is a matter of confusing nomenclature. In the online reference guide (https://www.beast2.org/summarizing-posterior-trees/), the tree with the maximum product of the posterior clade probabilities is called the “maximum credibility tree” while the tree that has the maximum sum of posterior clade probabilities is called the “Maximum credibility tree”. The “Maximum credibility tree” (referring to the sum) appears to have only been named in this way in the first version of TreeAnnotator. However, the version of TreeAnnotator that I used lists the options “maximum clade credibility tree” and “maximum sum of clade probabilities”. So the context suggests that the “maximum clade credibility tree” option is actually maximizing the product. This “maximum clade credibility tree” is the setting I used for this project (in TreeAnnotator version 2.6.3).

      (13) In the appendices, links to references do not work as expected.

      We will make sure these work properly when we receive the proofs.

    1. Author response:

      The following is the authors’ response to the original reviews.

      Reviewer #1 (Public Review):

      but see Franzius, Sprekeler, Wiskott, PLoS Computational Biology, 2007

      We have discussed the differences with this work in the response to Editor recommendations above.

      While the findings reported here are interesting, it is unclear whether they are the consequence of the specific model setting, and how well they would generalize.

      We have considered deep vision models across different architectures in our paper, which include traditional feedforward convolutional neural networks (VGG-16), convolutional neural networks with skip connections (ResNet-50) and the Vision Transformer (VIT) which employs self-attention instead of convolution as its core information processing unit.

      In particular, examining the pictures shown in Fig. 1A, it seems that local walls of the ’box’ contain strong oriented features that are distinct across different views. Perhaps the response of oriented visual filters can leverage these features to uniquely determine the spatial variable. This is concerning because this is a very specific setting that is unlikely to generalize.

      The experimental set up is based on experimental studies of spatial cognition in rodents. They are typically foraging in square or circular environments. Indeed, square environments will have more borders and corners that will provide information about the spatial environment, which is true in both empirical studies and our simulations. In any navigation task, and especially more realistic environments, visual information such as borders or landmarks likely play a major role in spatial information available to the agent. In fact, studies that do not consider sensory information to contribute to spatial information are likely missing a major part of how animals navigate.

      The prediction would be that place cells/head direction cells should go away in darkness. This implies that key aspects of functional cell types in the spatial cognition are missing in the current modeling framework.

      We addressed this comment in our response to the editor’s highlight. To briefly recap, we do not intend to propose a comprehensive model of the brain that captures all spatial phenomena, as we would not expect this from an object recognition network. Instead, we show that such a simple and nonspatial model can reproduce key signatures of spatial cells, raising important questions about how we interpret spatial cell types that dominate current research.

      Reviewer #2 (Public Review):

      The network used in the paper is still guided by a spatial error signal [...] one could say that the authors are in some way hacking this architecture and turning it into a spatial navigation one through learning.

      To be clear, the base networks we use do not undergo spatial error training. They have either been pre-trained on image classification tasks or are untrained. We used a standard neuroscience approach: training linear decoders on representations to assess the spatial information present in the network layers. The higher decoding errors in early layer representations (Fig. 2A) indicate that spatial information differs across layers—an effect that cannot be attributed to the linear decoder alone.

      My question is whether the paper is fighting an already won battle.

      Intuitive cell type discovery are still being celebrated. Concentrating on this kind of cell type discovery has broader implications that could be deleterious to the future of science. One point to note is that this issue depends on the area or subfield of neuroscience. In some subfields, papers that claim to find cell types with a strong claim of specific functions are relatively rare, and population coding is common (e.g., cognitive control in primate prefrontal cortex, neural dynamics of motor control). Although rodent neuroscience as a field is increasingly adopting population approaches, influential researchers and labs are still publishing “cell types” and in top journals (here are a few from 2017-2024: Goal cells (Sarel et al., 2017), Object-vector cells (Høydal et al., 2019), 3D place cells (Grieves et al., 2020), Lap cells (Sun et al., 2020), Goal-vector cells (Ormond and O’Keefe, 2022), Predictive grid cells (Ouchi and Fujisawa, 2024).

      In some cases, identification of cell types is only considered a part of the story, and there are analyses on behavior, neural populations, and inactivationbased studies. However, our view (and suggest this is shared amongst most researchers) is that a major reason these papers are reviewed and accepted to top journals is because they have a simple, intuitive “cell type” discovery headline, even if it is not the key finding or analysis that supports the insightful aspects of the work. This is unnecessary and misleading to students of neuroscience, related fields, and the public, it affects private and public funding priorities and in turn the future of science. Worse, it could lead the field down the wrong path, or at the least distribute attention and resources to methods and papers that could be providing deeper insights. Consistent with the central message of our work, we believe the field should prioritize theoretical and functional insights over the discovery of new “cell types”.

      Reviewer #3 (Public Review):

      The ability to linearly decode position from a large number of units is not a strong test of spatial information, nor is it a measure of spatial cognition

      Using a linear decoder to test what information is contained in a population of neurons available for downstream areas is a common technique in neuroscience (Tong and Pratte, 2012; DiCarlo et al., 2012) including spatial cells (e.g., Diehl et al. 2017; Horrocks et al. 2024). A linear decoder is used because it is a direct mapping from neurons to potential output behavior. In other words, it only needs to learn some mapping to link one set of neurons to another set which can “read out” the information. As such, it is a measure of the information contained in the population, and it is a lower bound of the information contained - as both biological and artificial neurons can do more complex nonlinear operations (as the activation function is nonlinear).

      We understand the reviewer may understand this concept but we explain it here to justify our position and for completeness of this public review.

      For example, consider the head direction cells in Figure 3C. In addition to increased activity in some directions, these cells also have a high degree of spatial nonuniformity, suggesting they are responding to specific visual features of the environment. In contrast, the majority of HD cells in the brain are only very weakly spatially selective, if at all, once an animal’s spatial occupancy is accounted for (Taube et al 1990, JNeurosci). While the preferred orientation of these cells are anchored to prominent visual cues, when they rotate with changing visual cues the entire head direction system rotates together (cells’ relative orientation relationships are maintained, including those that encode directions facing AWAY from the moved cue), and thus these responses cannot be simply independent sensory-tuned cells responding to the sensory change) (Taube et al 1990 JNeurosci, Zugaro et al 2003 JNeurosci, Ajbi et al 2023).

      As we have noted in our response to the editor, one of the main issues is how the criteria to assess what they are interested in is created in a subjective, and biased way, in a circular fashion (seeing spatial-like responses, developing criteria to determine a spatial response, select a threshold).

      All the examples the reviewer provides concentrate on strict criteria developed after finding such cells. What is the purpose of these cells for function, for behavior? Just finding a cell that looks like it is tuned to something does not explain its function. Neuroscience began with tuning curves in part due to methodological constraints, which was a promising start, but we propose that this is not the way forward.

      The metrics used by the authors to quantify place cell tuning are not clearly defined in the methods, but do not seem to be as stringent as those commonly used in real data. (e.g. spatial information, Skaggs et al 1992 NeurIPS).

      We identified place cells following the definition from Tanni et al. (2022), by one of the leading labs in the field. Since neurons in DNNs lack spikes, we adapted their criteria by focusing on the number of spatial bins in the ratemap rather than spike-based measures. However, our central argument is that the very act of defining spatial cells is problematic. Researchers set out to find place cells to study spatial representations, find spatially selective cells with subjective, qualitative criteria (sometimes combined with prior quantitative criteria, also subjectively defined), then try to fine-tune the criteria to more “stringent” criteria, depending on the experimental data at hand. It is not uncommon to see methodological sections that use qualitative judgments, such as: “To avoid bias ... we applied a loose criteria for place cells” Tanaka et al. (2018) , which reflects the lack of clarity for and subjectivity of place cell selection criteria.

      A simple literature survey reveals inconsistent criteria across studies. For place field selection, Dombeck et al. (2010) required mean firing rates exceeding 25% of peak rate, while Tanaka et al. (2018) used a 20% threshold. Speed thresholds also vary dramatically: Dombeck et al. (2010) calculated firing rates only when mice moved faster than 8.3 cm/s, whereas Tanaka et al. (2018) used 2 cm/s. Additional criteria differ further: Tanaka et al. (2018) required firing rates between 1-10 Hz and excluded cells with place fields larger than 1/3 of the area, while Dombeck et al. (2010) selected fields above 1.5 Hz, and Tanni et al. (2022) used a 10 spatial bins to 1/2 area threshold. As Dombeck et al. (2010) noted, differences in recording methods and place field definitions lead to varying numbers of identified place cells. Moreover, Grijseels et al. (2021) demonstrated that different detection methods produce vastly different place cell counts with minimal overlap between identified populations.

      This reflects a deeper issue. Unlike structurally and genetically defined cell types (e.g., pyramidal neurons, interneurons, dopamingeric neurons, cFos expressing neurons), spatial cells lack such clarity in terms of structural or functional specialization and it is unclear whether such “cell types” should be considered cell types in the same way. While scientific progress requires standardized definitions, the question remains whether defining spatial cells through myriad different criteria advances our understanding of spatial cognition. Are researchers finding the same cells? Could they be targeting different populations? Are they missing cells crucial for spatial cognition that they exclude due to the criteria used? We think this is likely. The inconsistency matters because different criteria may capture genuinely different neural populations or computational processes.

      Variability in definitions and criteria is an issue in any field. However, as we have stated, the deeper issue is whether we should be defining and selecting these cells at all before commencing analysis. By defining and restricting to spatial “cell types”, we risk comparing fundamentally different phenomena across studies, and worse, missing the fundamental unit of spatial cognition (e.g., the population).

      We have added a paragraph in Discussion (lines 357-366) noting the inconsistency in place cell selection criteria in the literature and the consequences of using varying criteria.

      We have also added a sentence (lines 354-356) raising the comparison of functionally defined spatial cell types with structurally and genetically defined cell types in the Discussion.

      Thus, the question is not whether spatially tuned cells are influenced by sensory information, but whether feed-forward sensory processing alone is sufficient to account for their observed turning properties and responses to sensory manipulations.

      These issues indicate a more significant underlying issue of scientific methodology relating to the interpretation of their result and its impact on neuroscientific research. Specifically, in order to make strong claims about experimental data, it is not enough to show that a control (i.e. a null hypothesis) exists, one needs to demonstrate that experimental observations are quantitatively no better than that control.

      Where the authors state that ”In summary, complex networks that are not spatial systems, coupled with environmental input, appear sufficient to decode spatial information.” what they have really shown is that it is possible to decode *some degree* of spatial information. This is a null hypothesis (that observations of spatial tuning do not reflect a ”spatial system”), and the comparison must be made to experimental data to test if the so-called ”spatial” networks in the brain have more cells with more reliable spatial info than a complex-visual control.

      We agree that good null hypotheses with quantitative comparisons are important. However, it is not clear that researchers in the field have not been using a null hypothesis, rather they make the assumption that these cell types exist and are functional in the way they assume. We provide one null hypothesis. The field can and should develop more and stronger null hypotheses.

      In our work, we are mainly focusing on criteria of finding spatial cells, and making the argument that simply doing this is misleading. Researcher develop criteria and find such cells, but often do not go further to assess whether they are real cell “types”, especially if they exclude other cells which can be misleading if other cells also play a role in the function of interest.

      But from many other experiments including causal manipulations (e.g. Robinson et al 2020 Cell, DeLauilleon et al 2015 Nat Neuro), which the authors conveniently ignore. Thus, I do not find their argument, as strongly stated as it is, to be well-supported.

      We acknowledge that there are several studies that have performed inactivation studies that suggest a strong role for place cells in spatial behavior. Most studies do not conduct comprehensive analyses to confirm that their place cells are in fact crucial for the behavior at hand.

      One question is how the criteria were determined. Did the researchers make their criteria based on what “worked”, so they did not exclude cells relevant to the behavior? What if their criteria were different, then the argument could have been that non-place cells also contribute to behavior.

      Another question is whether these cells are the same kinds of cells across studies and animals, given the varied criteria across studies? As most studies do not follow the same procedures, it is unclear whether we can generalize these results across cells and indeed, across task and spatial environments.

      Finally, does the fact that the place cells – the strongly selective cells with a place field – have a strong role in navigation provide any insight into the mechanism? Identifying cells by itself does not contribute to our understanding of how they work. Consistent with our main message, we argue that performing analyses and building computational models that uncover how the function of interest works is more valuable than simply naming cells.

      Finally, I find a major weakness of the paper to be the framing of the results in opposition to, as opposed to contributing to, the study of spatially tuned cells. For example, the authors state that ”If a perception system devoid of a spatial component demonstrates classically spatially-tuned unit representations, such as place, head-direction, and border cells, can ”spatial cells” truly be regarded as ’spatial’?” Setting aside the issue of whether the perception system in question does indeed demonstrate spatiallytuned unit representations comparable to those in the brain, I ask ”Why not?” This seems to be a semantic game of reading more into a name then is necessarily there. The names (place cells, grid cells, border cells, etc) describe an observation (that cells are observed to fire in certain areas of an animal’s environment). They need not be a mechanistic claim... This is evidenced by the fact that even within e.g. the place cell community, there is debate about these cells’ mechanisms and function (eg memory, navigation, etc), or if they can even be said to serve only a single function. However, they are still referred to as place cells, not as a statement of their function but as a history-dependent label that refers to their observed correlates with experimental variables. Thus, the observation that spatially tuned cells are ”inevitable derivatives of any complex system” is itself an interesting finding which *contributes to*, rather than contradicts, the study of these cells. It seems that the authors have a specific definition in mind when they say that a cell is ”truly” ”spatial” or that a biological or artificial neural network is a ”spatial system”, but this definition is not stated, and it is not clear that the terminology used in the field presupposes their definition.

      We have to agree to disagree with the reviewer on this point. Although researchers may reflect on their work and discuss what the mechanistic role of these cells are, it is widely perceived that cell type discovery is perceived as important to journals and funders due to its intuitive appeal and easy-tounderstand impact – even if there is no finding of interest to be reported. As noted in the comment above, papers claiming cell type discovery continue to be published in top journals and is continued to be funded.

      Our argument is that maybe “cell type” discovery research should not celebrated in the way it is, and in fact they shouldn’t be discovered when they are not genuine cell types like structural or genetic cell types. By using this term it make it appear like they are something they are not, which is misleading. They may be important cells, but providing a name like a “place” cell also suggests other cells are not encoding space - which is very unlikely to be true.

      In sum, our view is that finding and naming cells through a flawed theoretical lens that may not actually function as their names suggests can lead us down the wrong path and be detrimental to science.

      Reviewer #1 (Recommendations For The Authors):

      The novelty of the current study relative to the work by Franzius, Sprekeler, Wiskott (PLoS Computational Biology, 2007) needs to be carefully addressed. That study also modeled the spatial correlates based on visual inputs.

      Our work differs from Franzius et al. (2007) on both theoretical and experimental fronts. While both studies challenge the mechanisms underlying spatial cell formation, our theoretical contributions diverge. Franzius et al. (2007) assume spatial cells are inherently important for spatial cognition and propose a sensory-driven computational mechanism as an alternative to mainstream path integration frameworks for how spatial cells arise and support spatial cognition. In contrast, we challenge the notion that spatial cells are special at all. Using a model with no spatial grounding, we demonstrate that 1) spatial cells as naturally emerge from complex non-linear processing and 2) are not particularly useful for spatial decoding tasks, suggesting they are not crucial for spatial cognition.

      Our approach employs null models with fixed weights—either pretrained on classification tasks or entirely random—that process visual information non-sequentially. These models serve as general-purpose information processors without spatial grounding. In contrast, Franzius et al. (2007)’s model learns directly from environmental visual information, and the emergence of spatial cells (place or head-direction cells) in their framework depends on input statistics, such as rotation and translation speeds. Notably, their model does not simultaneously generate both place and head-direction cells; the outcome varies with the relative speed of rotation versus translation. Their sensory-driven model indirectly incorporates motion information through learning, exhibiting a time-dependence influenced by slow-feature analysis.

      Conversely, our model simultaneously produces units with place and headdirection cell profiles by processing visual inputs sampled randomly across locations and angles, independent of temporal or motion-related factors. This positions our model as a more general and fundamental null hypothesis, ideal for challenging prevailing theories on spatial cells due to its complete lack of spatial or motion grounding.

      Finally, unlike Franzius et al. (2007), who do not evaluate the functional utility of their spatial representations, we test whether the emergent spatial cells are useful for spatial decoding. We find that not only do spatial cells emerge in our non-spatial model, but they also fail to significantly aid in location or head-direction decoding. This is the central contribution of our work: spatial cells can arise without spatial or sensory grounding, and their functional relevance is limited. We have updated the manuscript to clarify the novelty of the current contribution to previous work (lines 324-335).

      In Fig. 2, it may be useful to plot the error in absolute units, rather than the normalized error. The direction decoding can be quantified in terms of degree Also, it would be helpful to compare the accuracy of spatial localization to that of the actual place cells in rodents.

      We argue it makes more sense and put comparison in perspective when we normalize the error by dividing the maximal error possible under each task. For transparency, we plot the errors in absolute physical units used by the Unity game engine in the updated Appendix (Fig. 1).

      Reviewer #2 (Recommendations For The Authors):

      Regarding the involvement of ’classified cells’ in decoding, I think a useful way to present the results would be to show the relationship between ’placeness’, ’directioness’ and ’borderness’ and the strength of the decoder weights. Either as a correlation or as a full scatter plot.

      We appreciate your suggestion to visualize the relationship between units’ spatial properties and their corresponding decoder weights. We believe it would be an important addition to our existing results. Based on the exclusion analyses, we anticipated the correlation to be low, and the additional results support this expectation.

      As an example, we present unit plots below for VGG-16 (pre-trained and untrained, at its penultimate layer with sampling rate equals 0.3; Author response image 1 and 2). Additional plots for various layers and across models are included in the supplementary materials (Fig. S12-S28). Consistently across conditions, we observed no significant correlations between units’ spatial properties (e.g., placeness) and their decoding weight strengths. These results further corroborate the conclusions drawn from our exclusion analyses.

      Reviewer #3 (Recommendations For The Authors):

      My main suggestions are that the authors: -perform manipulations to the sensory environment similar to those done in experimental work, and report if their tuned cells respond in similar ways -quantitatively compare the degree of spatial tuning in their networks to that seen in publicly available data -re-frame the discussion of their results to critically engage with and contribute to the field and its past work on sensory influences to these cells

      As we noted in our opening section, our model is not intended as a model of the brain. It is a non-spatial null model, and we present the surprising finding that even such a model contains spatial cell-like units if identified using criteria typically used in the field. This raises the question whether simply finding cells that show spatial properties is sufficient to grant the special status of “cell type” that is involved in the brain function of interest.

      Author response image 1.

      VGG-16 (pre-trained), penultimate layer units, show no apparent relationship between spatial properties and their decoder weight strengths.

      Author response image 2.

      VGG-16 (untrained), penultimate layer units, show no apparent relationship between spatial properties and their decoder weight strengths.

      Furthermore, our main simulations were designed to be compared to experimental work where rodents foraged around square environments in the lab. We did not do an extensive set of simulations as the purpose of our study is not to show that we capture exactly every single experimental finding, but rather raise the issues with the functional cell type definition and identification approach for progressing neuroscientific knowledge.

      Finally, as we note in more detail below, different labs use different criteria for identifying spatial cells, which depend both on the lab and the experimental design. Our point is that we can identify such cells using criteria set by neuroscientists, and that such cell types may not reflect any special status in spatial processing. Additional simulations that show less alignment with certain datasets will not provide support for or against our general message.

      References

      Banino A, Barry C, Uria B, Blundell C, Lillicrap T, Mirowski P, Pritzel A, Chadwick MJ, Degris T, Modayil J, Wayne G, Soyer H, Viola F, Zhang B, Goroshin R, Rabinowitz N, Pascanu R, Beattie C, Petersen S, Sadik A, Gaffney S, King H, Kavukcuoglu K, Hassabis D, Hadsell R, Kumaran D (2018) Vector-based navigation using grid-like representations in artificial agents. Nature 557(7705):429–433, DOI 10.1038/s41586-018-0102-6, URL http://www.nature.com/articles/s41586-018-0102-6

      DiCarlo JJ, Zoccolan D, Rust NC (2012) How Does the Brain Solve Visual Object Recognition? Neuron 73(3):415–434, DOI 10.1016/J.NEURON.2012.01.010, URL https://www.cell.com/neuron/fulltext/S0896-6273(12)00092-X

      Diehl GW, Hon OJ, Leutgeb S, Leutgeb JK (2017) Grid and Nongrid Cells in Medial Entorhinal Cortex Represent Spatial Location and Environmental Features with Complementary Coding Schemes. Neuron 94(1):83– 92.e6, DOI 10.1016/j.neuron.2017.03.004, URL https://linkinghub.elsevier.com/retrieve/pii/S0896627317301873

      Dombeck DA, Harvey CD, Tian L, Looger LL, Tank DW (2010) Functional imaging of hippocampal place cells at cellular resolution during virtual navigation. Nature Neuroscience 13(11):1433–1440, DOI 10.1038/nn.2648, URL https://www.nature.com/articles/nn.2648

      Ebitz RB, Hayden BY (2021) The population doctrine in cognitive neuroscience. Neuron 109(19):3055–3068, DOI 10.1016/j.neuron. 2021.07.011, URL https://linkinghub.elsevier.com/retrieve/pii/S0896627321005213

      Grieves RM, Jedidi-Ayoub S, Mishchanchuk K, Liu A, Renaudineau S, Jeffery KJ (2020) The place-cell representation of volumetric space in rats. Nature Communications 11(1):789, DOI 10.1038/s41467-020-14611-7, URL https://www.nature.com/articles/s41467-020-14611-7

      Grijseels DM, Shaw K, Barry C, Hall CN (2021) Choice of method of place cell classification determines the population of cells identified. PLOS Computational Biology 17(7):e1008835, DOI 10.1371/journal.pcbi.1008835, URL https://dx.plos.org/10.1371/journal.pcbi.1008835

      Horrocks EAB, Rodrigues FR, Saleem AB (2024) Flexible neural population dynamics govern the speed and stability of sensory encoding in mouse visual cortex. Nature Communications 15(1):6415, DOI 10.1038/s41467-024-50563-y, URL https://www.nature.com/articles/s41467-024-50563-y

      Høydal , Skytøen ER, Andersson SO, Moser MB, Moser EI (2019) Objectvector coding in the medial entorhinal cortex. Nature 568(7752):400– 404, DOI 10.1038/s41586-019-1077-7, URL https://www.nature.com/articles/s41586-019-1077-7

      Ormond J, O’Keefe J (2022) Hippocampal place cells have goal-oriented vector fields during navigation. Nature 607(7920):741–746, DOI 10.1038/s41586-022-04913-9, URL https://www.nature.com/articles/s41586-022-04913-9

      Ouchi A, Fujisawa S (2024) Predictive grid coding in the medial entorhinal cortex. Science 385(6710):776–784, DOI 10.1126/science.ado4166, URL https://www.science.org/doi/10.1126/science.ado4166

      Sarel A, Finkelstein A, Las L, Ulanovsky N (2017) Vectorial representation of spatial goals in the hippocampus of bats. Science 355(6321):176–180, DOI 10.1126/science.aak9589, URL https://www.science.org/doi/10.1126/science.aak9589

      Sun C, Yang W, Martin J, Tonegawa S (2020) Hippocampal neurons represent events as transferable units of experience. Nature Neuroscience 23(5):651–663, DOI 10.1038/s41593-020-0614-x, URL https://www.nature.com/articles/s41593-020-0614-x

      Tanaka KZ, He H, Tomar A, Niisato K, Huang AJY, McHugh TJ (2018) The hippocampal engram maps experience but not place. Science 361(6400):392–397, DOI 10.1126/science.aat5397, URL https://www.science.org/doi/10.1126/science.aat5397

      Tanni S, De Cothi W, Barry C (2022) State transitions in the statistically stable place cell population correspond to rate of perceptual change. Current Biology 32(16):3505–3514.e7, DOI 10.1016/j.cub. 2022.06.046, URL https://linkinghub.elsevier.com/retrieve/pii/S0960982222010089

      Tong F, Pratte MS (2012) Decoding Patterns of Human Brain Activity. Annual Review of Psychology 63(1):483–509, DOI 10.1146/annurev-psych-120710-100412, URL https://www.annualreviews.org/doi/10.1146/annurev-psych-120710-100412

    1. Note: This response was posted by the corresponding author to Review Commons. The content has not been altered except for formatting.

      Learn more at Review Commons


      Reply to the reviewers

      Reviewer 1, point 1: In general, the statistical analysis is not transparent. The size of the sample, i.e. the number of observations or data points, is never specified. This information is essential for further evaluation of the statistical details.

      The size of each sample quantified, given as number of ommatidia/number of retinas, is indicated in the figure legends. This must have escaped the attention of reviewer 1, so we have added a sentence in the legend of Fig. 2 to state it more clearly. We think that the figure legends are the best place to put this information for ease of comparison to the figures.

      *Reviewer 1, point 2: To gain a better understanding of chitin deposition, it would be beneficial to have data on Kkv overexpression in cone cells versus outer pigment cells. Does it cause reb/exp-like effects on chitin deposition and corneal lens formation? Furthermore, can the authors rule out the involvement of chitin synthase 2 in chitin matrix formation and the retention of the matrix in kkv knockdowns? *

      We will generate clones of cells that over-express Kkv in either central cells (cone and primary pigment cells) or lattice cells (secondary and tertiary pigment cells), using the same drivers that we used to over-express Reb, and will examine chitin secretion at 54 h after puparium formation (APF) and in adults.

      As there are no available mutations in Chitin synthase 2 (Chs2), we will knock it down with RNAi in all retinal cells using lGMR-GAL4 and look for corneal lens defects. However, we think that Chs2 is unlikely to contribute chitin to the corneal lens, because its expression is restricted to the digestive system, and because kkv knockdown essentially eliminates chitin from the corneal lens.

      *Reviewer 1, point 3: Recent results published by the authors regarding ZP domain proteins, such as dusky-like (dyl), have not been adequately discussed in the context of chitin secretion and Kkv expression, a matter that must be addressed. It has been demonstrated that dyl mutants do not affect Kkv expression, but chitin levels are reduced. Does Dyl exhibit Kkv-like phenotypes? Furthermore, what is the expression of Dyl or Dmupy in Kkv knockdowns? Is there any interaction between the ZP domain protein matrix and the chitin matrix required for lens formation? *

      In dyl mutants, chitin deposition is delayed, but it does accumulate later in development, so the phenotype is different from kkv mutants. We have clarified this in the manuscript (p. 6). To address the other points, we will examine the expression of Dyl and of Dumpy-YFP in mid-pupal and late pupal retinas in which kkv is knocked down in all cells with lGMR-GAL4. The ZP protein matrix is originally deposited before chitin secretion begins, so we will examine whether loss of chitin affects its later maintenance.

      *Reviewer 1, point 4: What is retained in the chitin matrix if chitin is missing in kkv knockdown? Is it the ZP domain matrix (see the above question) or are the chitin matrix proteins also involved, such as Obst-A, Obst-C (Gasp), Knk and others? Obst proteins are particularly essential for the regular packaging of chitin and thus for the formation of the chitin layer, which is shown in Fig. 1. Beyond this story, it would also be interesting to see how the aforementioned chitin matrix proteins (Obst-A, Obst-C (Gasp), Knk and others) impact lens formation. *

      Adult corneal lenses derived from kkv knockdown retinas do not contain chitin, but there is remaining corneal lens material. We do not think that this is the ZP domain matrix, as this is normally lost in late pupal development, but we will check whether Dpy-YFP is retained in kkv knockdown adults. We will try to detect Obst-A and Gasp proteins using available antibodies. However, this may not be successful, as we have found that antibodies do not penetrate the corneal lens well. Our transcriptomic studies have identified numerous secreted proteins that are expressed at high levels in the mid-pupal retina and could be components of the corneal lens. We may be able to detect some of these using fluorescently tagged forms, but it is possible that the currently available tools will not be sufficient to answer this question.

      We have begun to work on how some of these proteins affect corneal lens structure, but this will take a significant amount of time and we think it would work better as a separate manuscript. We see our current manuscript as a short and focused story about the importance of the source of chitin in determining corneal lens shape.

      *Reviewer 1, minor comment 1: Figure 1 is not easily comprehensible for those who are not already familiar with the subject of eye development. Fig -1A' please label the cone cells and pigment cells. *

      We have labeled these cells in Fig. 1A’’.

      *Reviewer 1, minor comment 2: Fig. 1H - The meaning of the abbreviations and numbers is not given in the legend. It would also be beneficial to include a meaningful cartoon illustrating the corneal lens situation before and after chitin secretion, as shown in Figure 3. *

      We have defined the abbreviations in the figure legend. Fig. 1H did show the corneal lens situation before, during and after chitin secretion, but we have added the cone and pigment cells to the 72 h APF and adult diagrams to make them more meaningful (now Fig. 1I).

      *Reviewer 1, minor comment 3: Fig.1 F when does the authors recognize a first chitin assembly as initial corneal lens at the eye and how does it look like? Chitin expression is high already at 54h APF, which means 20 hours earlier. *

      We think that the reviewer is asking when the chitin first starts to form a dome shape. We have added an orthogonal view of chitin in a 54 h APF retina viewed with LIGHTNING microscopy, showing that the external curvature is already present at this stage (new Fig. 1F).

      *Reviewer 1, minor comment 4: Page 6 / Fig 2E: cells autonomously synthesize chitin and no lateral diffusion. Please label which lens contains chitin and which not *

      Fig. 2E shows part of a retina in which kkv has been knocked down in all cells, so none of the corneal lenses contain chitin. We have clarified this in the legend to Fig. 2.

      *Reviewer 1, minor comment 5: Page 7: The authors state that reb/exp knockdown affects external and internal curvature. However, Fig. S1 statistics does not support this statement. *

      We were referring to the double knockdown, which Fig. 2L, M show is significant, and not to the single knockdowns quantified in Fig. S1. We have clarified this in the text.

      *Reviewer 1, minor comment 6: Fig.2 and Fig. S1: what is Chp (Chaoptin)? *

      We have stated in the legend to Fig. 2 that Chaoptin is a component of photoreceptor rhabdomeres.

      *Reviewer 1, minor comment 7: Fig. S1E,I: which part of the eye is marked by the chitin staining outside the cone and pigment cells? *

      Chitin is still present in the mechanosensory bristles in Fig.S1I, as these do not express lGMR-GAL4. We have stated this in the figure legend.

      *Reviewer 1, minor comment 8: Fig. 2 L,M, Why do exp/reb show different statistical results at outer angle in exp and reb knockdown when compared with the IGMR driver line, although chitin reduction is eliminated in exp knockdown already from 54h APF onwards? *

      The double knockdown of exp and reb has a more significant effect on the adult corneal lens outer angle than the single exp knockdown, even though the exp knockdown lacks chitin at 54 h APF. We believe that this is because Reb is sufficient for some chitin synthesis at later stages of development. This was mentioned in the text (p. 6) and we have added further clarification in the legend to Fig. S1.

      *Reviewer 1, minor comment 9: Fig 3 G-H: please clarify where the chitin reduction can be observed at the edge of adult corneal lens and provide comparable wt staining's. Fig. S2 D. What was the normalization and the sample number? *

      We have added a high magnification image of a mosaic ommatidium with one wild-type and one kkv knockdown edge, showing the region at the edge of the corneal lens in which chitin fluorescence was quantified and the central region used for the normalization (Fig. 3I). The sample numbers are given in the legend to Fig. S2D.

      Reviewer 1, minor comment 10: Page 6, last paragraph: I fully agree that ZP domain proteins may retain other corneal lens components. But deeper discussion is missing. It should be noted that the authors hypothesis fits well to the proposed function of the ZP matrix in providing chitin matrix adhesion to the underlying cell surface. A loss of the ZP domain protein Piopio causes loss of the chitin matrix as show recently in trachea and at epidermal tendon cells (Göpfert et al., 2025; https://www.sciencedirect.com/science/article/pii/S1742706125003733). Furthermore, a recent publication identifies ZPD proteins as modular units that establish the mechanical environment essential for nanoscale morphogenesis (Itakura et al., https://www.biorxiv.org/content/10.1101/2024.08.20.608778v1.full.pdf*). This should be cited and discussed accordingly.

      It could be that outer and inner part of the chitin is different in ultrastructure due to expression pattern. In dragonfly the surface morphology analysis by scanning electron microscopy revealed that the outer part of corneal lenses consisted of long chitin fibrils with regular arrays of papillary structures while the smoother inner part had concentric lamellated chitin formation with shorter chitin nanofibrils (Kaya et al., 2016; https://www.sciencedirect.com/science/article/pii/S0141813016303646?via%3Dihub#fig0020) . Thus, a ultrastructure analyses would be very beneficial, or at least a detailed discussion. *

      We have added a discussion of these points and papers to the text (p. 6 and 9). Although we are not specifically addressing differences between the inner and outer parts of the corneal lens in this manuscript, we have now included a high-resolution LIGHTNING image showing how the layered structure of the corneal lens is affected when chitin production by central cells is increased (Fig. 4F).

      *Reviewer 2, point 1: Adult corneal lenses lacking chitin still form a thin structure in kkv RNAi. The authors suggest that this may be due to the presence of the ZP domain proteins Dyl, Dpy and Pio. Immunostaining for these ZP domain proteins could provide supporting evidence. *

      To clarify, we meant to say that the earlier presence of the ZP domain matrix could retain components other than chitin in the corneal lens. The ZP domain proteins are no longer present in the adult. We have made this clearer in the text. As described under reviewer 1, points 3 and 4, we will examine Dyl and Dpy-YFP expression in kkv knockdown retinas at mid-pupal and adult stages, and we will also look at the expression of another ZP domain protein, Piopio.

      *Reviewer 2, minor comment 1: At 50 h APF, Kkv (Fig. 2B, B') and Reb (Fig. S1A, A') appear to be expressed at higher levels in lattice cells than in central cells, even though chitin is mainly present in the central cells at this time (Fig. 1B-B'). Discuss possible explanation for their expression pattern and their roles at this stage. *

      We agree that this is a surprising result. We have added a discussion of possible explanations, such as the lack of another component necessary for chitin secretion in lattice cells at this stage, or the presence of high levels of chitinases (p. 7).

      *Reviewer 2, minor comment 2: Fig. 1F and G: Indicate that the cryosection images represent single ommatidia, and label "external" and "internal" to help orient readers. *

      We have made these changes to the figure panels (now G and H), and indicated in the legend that they are single ommatidia.

      *Reviewer 2, minor comment 3: Figure 2. The cartoon diagram showing the angle measurement (currently Fig S1K) should be moved to the main figure to help readers understand the quantifications. *

      We have moved this diagram to Figure 2L.

      *Reviewer 2, minor comment 4: Figure 3H. It would be helpful to clearly mark the edge of the corneal lens in the chitin intensity image. *

      As described under reviewer 1, minor comment 9, we have added a high magnification picture showing the edge region used for chitin quantification (Fig. 3I), which should also address reviewer 2’s concern.

    1. Author response:

      The following is the authors’ response to the original reviews.

      Reviewer #1 (Public Review):

      (1) Discrepancies with previous findings need clarification, especially regarding the absence of similar behavioral effects in F1. Lack of discussion on the decision to modify paradigms instead of using the same model. Presentation of behavioral data in supplementary materials, with a recommendation to include behavioral quantification in main figures. Absence of quantification for freezing behavior, a crucial measure in fear conditioning.

      We agree, thank you. One of the major revisions we have made to this version of the manuscript is the addition of much more thorough analysis of our F1 behavior. While not captured by the (relatively gross) measure of the approach-avoid index, further analysis has highlighted interesting differences between the F1s of unpaired and paired offspring, and in an odor-specific manner. As these analyses have given rise to many new results and conclusions, we have attempted to adjust the manuscript to reflect the major change that we do, in fact, find effects in F1, if subtle. 

      Classical odor-shock pairing was used in both Dias & Ressler’s and our study to directly expand upon the findings of increase in cell number. This enabled our discovery of biasing of newborn OSNs. For our behavioral readouts, we chose to focus on the ethological behavior of avoidance. From our extensive behavioral analysis (Figures 5 & 6), we successfully identified several behavioral differences in the F1 offspring that had not previously been described.

      Reviewer #2 (Public Review):

      (1) The main weakness is the disconnect between the morphological changes reported and the lack of change in aversion to the odorant in F1 progeny. The authors also do not address the mechanisms underlying the inheritance of the phenotype, which may lie outside of the scope of the present study.

      Thank you for your comments. Our revised manuscript includes both new experiments and new analyses that probe the relationship between a change in cell number and a change in avoidance behavior, and we have revised the manuscript text to address this point directly. In short, we find both in the F0 generation (at extended time points) and in the F1, that an increase in cell number does not always correlate with avoidance behavior. However, we do find nuanced behavioral differences between the offspring of unpaired and paired fathers. Whether the increase in cell number in offspring is necessary to observe the behavioral changes is outside the scope of the current study, but certainly a question we are interested in answering in future work. 

      Reviewer #3 (Public Review):

      (1) In the abstract / summary, the authors raise expectations that are not supported by the data. For example, it is claimed that "increases in F0 were due to biased stem cell receptor choice." While an active field of study that has seen remarkable progress in the past decade, olfactory receptor gene choice and its relevant timing in particular is still unresolved. Here, Liff et al., do not pinpoint at what stage during differentiation the "biased choice" is made. 

      EdU is only taken into stem cells in the S phase, and differences in EdU-labeled M71 or MOR23 OSNs across fear conditioning groups indicates a biasing in subtype identity. We do not make claims regarding the exact stage of OSN maturation at which biasing may occur; rather, we demonstrate that the stem cells that were dividing during EdU administration are more likely to mature into an M71 OSN if a mouse receives paired acetophenone conditioning compared to unpaired or no conditioning (and similarly with MOR23 and lyral). This phenomenon must involve receptor choice, as that is the mechanism by which OSN subtypes form. 

      (2) Similarly, the concluding statement that the study provides "insight into the heritability of acquired phenotypes" is somewhat misleading. The experiments do not address the mechanisms underlying heritability. 

      We do not claim to provide direct insight into the mechanisms underlying heritability. Our experiments do provide insight into the heritability of acquired phenotypes, as we corroborate previous studies that this olfactory fear conditioning paradigm induces heritable changes in the nose and in behavior. We also demonstrate odor-specific behavioral differences in the offspring conditioned fathers, suggesting that the mechanisms underlying the specific behavioral phenotypes may be unique to the conditioning odorant, and not one universal mechanism. These results provide basic knowledge that will accelerate our ability to uncover the mechanisms driving heritable changes. 

      (3) The statement that "the percentage of newborn M71 cells is 4-5 times that of MOR23 may simply reflect differences in the birth rates of the two cell populations" should, if true, result in similar differences in the occurrence of mature OSNs with either receptor identity. According to Fig. 1H & J, however, this is not the case. 

      We have removed that statement from the manuscript, as subtype-specific differences in proliferation rates are not the focus of this study and we do not wish to make claims about it based on our EdU experiments. We do not compare our iDISCO cell density counts to EdU co-labeling counts nor ratio counts, as differences between M71 and MOR23 quantification in cleared tissue versus EdU uptake may simply reflect the inherent differences between methodologies. Our claims are solely within M71 cohorts and MOR23 cohorts. 

      (4) An important result is that Liff et al., in contrast to results from other studies, "do not observe the inheritance of odor-evoked aversion to the conditioned odor in the F1 generation." This discrepancy needs to be discussed. 

      This is discussed in the manuscript, and we report behavioral differences revealed by additional analyses. 

      (5) The authors speculate that "the increase in neurons responsive to the conditioned odor could enhance the sensitivity to, or the discrimination of, the paired odor in F0 and F1. This would enable the F1 population to learn that odor predicts shock with fewer training cycles or less odorant when trained with the conditioned odor." This is a fascinating idea that, in fact, could have been readily tested by Liff and coworkers. If this hypothesis were found true, this would substantially enhance the impact of the study for the field.

      We agree that additional F1 behavioral paradigms are a major next step to understand the functional behavioral differences that may emerge from an increase in specific OSN subtype. Due to the nontrivial amount of time and effort it requires to generate F1 offspring (on the order of many months), and because we do not test individual offspring in multiple behavioral assays (such that they are naïve to their father’s conditioning odor), these experiments are outside the scope of this current study. 

      Reviewer #1 (Recommendations For The Authors):

      (1) Considering that the authors are expanding upon the previous findings of Dias and Ressler (2014), it is crucial to clarify the discrepancies in the results between both works in the discussion. While I acknowledge the use of a different experimental design by the authors, if the premise assumes there is a universal mechanism for transgenerational acquired modification it prompts the question: Why don't we observe similar behavioral effects in F1 in the present model? This issue needs extensive discussion in the manuscript to advance the field's understanding of this topic. Additionally, I am also curious about the author's decision to modify the paradigms instead of using exactly the same model to further extend their findings on stem cells, for example. Could you please provide comments on this choice and elaborate on this aspect in the discussion? 

      We agree, thank you. One of the major revisions we have made to this version of the manuscript is the addition of much more thorough analysis of our F1 behavior. While not captured by the (relatively gross) measure of the approach-avoid index, further analysis has highlighted interesting differences between the F1s of unpaired and paired offspring, and in an odor-specific manner. As these analyses have given rise to many new results and conclusions, we have attempted to adjust the manuscript to reflect the major change that we do, in fact, find effects in F1, if subtle. 

      Classical odor-shock pairing was used in both Dias & Ressler’s and our study to directly expand upon the findings of increase in cell number. This enabled our discovery of biasing of newborn OSNs. For our behavioral readouts, we chose to focus on the ethological behavior of avoidance. From our extensive behavioral analysis (Figures 5 & 6), we successfully identified several behavioral differences in the F1 offspring that had not previously been described. We have revised the discussion section to elaborate on these decisions.

      We incorporated the behavioral data into the main figures and included a freezing metric to Figure 5 (F, J, & N). We did do an analysis of time spent freezing in the control vs. conditioned chamber, but since the F0 paired mice spend so little time in the conditioned odor chamber, they also spend most of their time freezing in the control odor chamber. Thus, we felt it was better to show the overall time spent freezing during the trial.

      (2) It is unclear why the authors chose to present all behavioral data to supplementary materials. I strongly recommend not only incorporating the behavioral data into the main figures but also expanding the behavioral quantification. It appears that the author dismissed the potential effects on F1 without a thorough exploration of animals' behaviors. The task contains valuable information that could be further investigated, potentially altering the findings or even the conclusions of the study. Notably, the absence of quantification for freezing behavior is incomprehensive. Freezing is a crucial measure in fear conditioning, and it's surprising that the authors did not mention it throughout the manuscript. I encourage the author to include freezing data in the analysis and other behavioral quantification as follows: a) freezing during odor presentation and ITI for conditioning days. b) freezing during odor preference test in all compartments. c) it is not very clear the design of the Odor preference behavioral testing. Is the odor presented in a discrete manner or the order is constantly presented in the compartment? Could the authors quantify the latency to avoid after the visit in the compartment? d) in the video it is very clear the animals are doing a lot of risk assessment, this could be also analyzed and included as a fear measure.  

      Thanks for the suggestion. We incorporated the behavioral data into the main figures and included a freezing metric to Figure 5 (F, J, & N). We did do an analysis of time spent freezing in the control vs. conditioned chamber, but since the F0 paired mice spend so little time in the conditioned odor chamber, they also spend most of their time freezing in the control odor chamber. Thus, we felt it was better to show the overall time spent freezing during the trial. In the methods section we describe that the odor is continuously bubbled into the chamber throughout the trial, but we have clarified this in the main text as well. As for further behavioral metrics like latencies and risk assessment, initial analyses have not shown anything in the F1 data that we wished to report here. Future work from the lab will investigate this further.

      (3) In the Dias and Ressler paper, a crucial difference exists between the models that could elucidate the absence of transgenerational effects on F1. In their study, the presence of the unconditioned stimulus (US) is consistent across all generations in the startle task. I am curious whether, in the present study, the authors considered pairing the F1 with a US-paired task in a protocol that does not induce fear conditioning (e.g., lower shock intensity or fewer pairings). Could this potentially lead to an increased response in the parental-paired offspring? Did the author consider this approach? I understand how extensive this experiment can be, therefore I'm not directly requesting, although it would be a fantastic achievement if the results are positive. Please consider discussing this fundamental difference in the manuscript. 

      To clarify, the F1 generation is presented with the unconditioned stimulus, just never conditioned with it. In these experiments, we were primarily interested in the F1’s naïve reaction to their father’s conditioning odorant, and whether the presentation of that odor in the absence of a stressor would lead to any fear-like behavioral responses.

      We have considered the experiments you have suggested and have ongoing projects in the lab further investigating F1 effects and whether their father’s experiences affect their ability to learn in conditioning tasks. Because of the amount of time and effort it requires to generate F1 offspring, and because we do not wish to test individual offspring in multiple assays, we do not present any of these experiments in the current manuscript. Ongoing work is looking into whether 1-day (vs. 3-day) conditioning is sufficient in the offspring of paired mice, and we appreciate the suggestion of subthreshold shock intensity. We will also clarify in the discussion that future work will try to answer these questions. 

      (4) If the videos were combined it would be better to appreciate the behavioral differences of paired vs unpaired. 

      Thank you for the suggestion, fixed. Video S1 is now a combination of unpaired and paired example videos. 

      (5) Figure 3E, is there an outlier in the paired group that is driving the difference? Please run an outlier test on the data if this has not been done. If already done, please express the stats. 

      We ran an outlier test using the ROUT method (Q=1%) and did not find any outliers to be removed. We also ran the same test on all other data and removed one mouse from the Acetophenone F1 Paired group in Figure 5 (also described in the Methods section). 

      (6) I understand that using the term "olfactory" twice in the title may seem redundant. However, the authors specifically demonstrate the effects of olfactory fear conditioning. I suggest including "odor-induced" before "fear conditioning" in the title for greater specificity and accuracy. This modification would better reflect the study's focus on olfactory fear conditioning, especially given the authors did not explore fear conditioning broadly (e.g., contextual, and auditory aspects were not examined). 

      Thank you for your feedback. We found “olfactory” twice as cumbersome. We have changed the title to “Fear conditioning biases olfactory sensory neuron expression across generations”, to more accurately highlight the importance of the olfactory sensory neuron expression, intergenerationally. 

      (7) The last page of the manuscript has a list of videos (8 videos), but only two were presented.

      We have made sure to include all 7 videos (videos 1 and 2 were combined) in this version.  

      Reviewer #2 (Recommendations For The Authors):

      (1) The analyses mentioned on lines 210-220 should be presented. 

      Thank you for the suggestion. We have removed this part of the manuscript as we do not have a large enough n to draw conclusions about cell longevity in this paper. Future studies in the lab will incorporate this analysis.

      Reviewer #3 (Recommendations For The Authors):

      (1) The manuscript contains several supplementary figures and movies that are not referred to in the main text. 

      All supplementary figures and movies are now referred to in the manuscript text.

      (2) In the abstract, the authors state that they "investigated changes in the morphology of the olfactory epithelium." I think that is (technically) not what they did. In fact, the authors do not show any morphometry of the epithelium (e.g., thickness, layers, etc.), but count the density of OSNs that share a specific receptor identity. Along the same lines, the authors state in the abstract that recent work has shown that conditioning is "resulting in increases in olfactory receptor frequencies." However, recent studies did not show increased "receptor frequencies", but changes in cell count. Whether (or not) receptor expression per OSN is also changed remains unknown (would be interesting though). 

      Yes, agreed. We changed “morphology” to “cellular composition.” We also changed any references to “receptor frequencies” to “olfactory sensory neuron frequencies.”

      (3) Reference 20 needs to be updated. 

      Thank you, updated.

      (4) l.52: the distribution of OSNs into (four) zones is a somewhat outdated concept as zonal boundaries are rather blurry. Generally, of course, dorsoventral differences are real. 

      Yes, we agree and changed the verbiage to “region” as opposed to “zone.” We mainly bring this up because it later becomes relevant that both M71 and MOR23 are expressed in the same (antero-dorsal) region and thus can be quantified with the same methodology.

      (5) Fig. 3B & C: the EdU background staining is quite peculiar. Any reason why the epithelium is mostly (with the sustentacular nuclei being a noticeable exception) devoid of background? 

      We use the ThermoFisher Click-iT Plus EdU kit (Invitrogen, C10638) and it has consistently produced very good signal to noise ratio.

      Responses to Editor’s note

      We thank the editor for their constructive suggestions. 

      (1) Should you choose to revise your manuscript, please include full statistical reporting including exact p-values wherever possible alongside the summary statistics (test statistic and df) and 95% confidence intervals. These should be reported for all key questions and not only when the p-value is less than 0.05. 

      Thank you for the suggestion. We created two supplementary tables with statistical reporting: Table S1 for the main figure statistics, and Table S2 for the supplementary figure statistics.

  6. social-media-ethics-automation.github.io social-media-ethics-automation.github.io
    1. [m1] Anya Kamenetz. Facebook's own data is not as conclusive as you think about teens and mental health. NPR, October 2021. URL: https://www.npr.org/2021/10/06/1043138622/facebook-instagram-teens-mental-health (visited on 2023-12-08). [m2] Anya Kamenetz. Selfies, Filters, and Snapchat Dysmorphia: How Photo-Editing Harms Body Image. Psychology Today, February 2020. URL: https://www.psychologytoday.com/us/articles/202002/selfies-filters-and-snapchat-dysmorphia-how-photo-editing-harms-body-image (visited on 2023-12-08). [m3] Terry Gross. Director Bo Burnham On Growing Up With Anxiety — And An Audience. NPR, July 2018. URL: https://www.npr.org/2018/07/18/630069876/director-bo-burnham-on-growing-up-with-anxiety-and-an-audience (visited on 2023-12-08). [m4] Sarah McQuate. 'I don't even remember what I read': People enter a 'dissociative state' when using social media. ScienceDaily, May 2022. URL: https://www.sciencedaily.com/releases/2022/05/220523135018.htm (visited on 2023-12-08). [m5] Robinson Meyer. Everything We Know About Facebook’s Secret Mood-Manipulation Experiment. The Atlantic, June 2014. URL: https://www.theatlantic.com/technology/archive/2014/06/everything-we-know-about-facebooks-secret-mood-manipulation-experiment/373648/ (visited on 2023-12-08). [m6] Digital detox. November 2023. Page Version ID: 1187412856. URL: https://en.wikipedia.org/w/index.php?title=Digital_detox&oldid=1187412856 (visited on 2023-12-08). [m7] Lauren Collee. The Great Offline. Real Life, December 2021. URL: https://reallifemag.com/the-great-offline/ (visited on 2023-12-08). [m8] Merriam-Webster. On ‘Doomsurfing’ and ‘Doomscrolling’. 2023. URL: https://www.merriam-webster.com/wordplay/doomsurfing-doomscrolling-words-were-watching (visited on 2023-12-08). [m9] Ethan Jacobs [@ethanjacobslaw]. OK doomscrolling is bad but have you SEEN the quality of the doom this week? January 2021. URL: https://twitter.com/ethanjacobslaw/status/1347434641540538368 (visited on 2023-12-08). [m10] 24-hour news cycle. November 2023. Page Version ID: 1184581615. URL: https://en.wikipedia.org/w/index.php?title=24-hour_news_cycle&oldid=1184581615 (visited on 2023-12-08). [m11] Trauma Dumping. August 2021. URL: https://knowyourmeme.com/memes/trauma-dumping (visited on 2023-12-08). [m12] Pamela B. Rutledge. How to Overcome Social Media Trauma Dumping. Psychology Today, September 2021. URL: https://www.psychologytoday.com/us/blog/positively-media/202109/how-overcome-social-media-trauma-dumping (visited on 2023-12-08). [m13] Factitious disorder imposed on self. November 2023. Page Version ID: 1184183450. URL: https://en.wikipedia.org/w/index.php?title=Factitious_disorder_imposed_on_self&oldid=1184183450 (visited on 2023-12-08). [m14] Róisín Lanigan. The Internet Has a Cancer-Faking Problem. The Atlantic, May 2019. URL: https://www.theatlantic.com/health/archive/2019/05/faking-cancer-online/588334/ (visited on 2023-12-08). [m15] Jules Montague. Münchausen by internet: the sickness bloggers who fake it online. The Guardian, April 2015. URL: https://www.theguardian.com/society/2015/apr/29/jules-gibson-munchausen-by-internet-sickness-bloggers-fake-it-whole-pantry (visited on 2023-12-08). [m16] What is self-harm? URL: https://www.mind.org.uk/information-support/types-of-mental-health-problems/self-harm/about-self-harm/ (visited on 2023-12-08). [m17] Juli Fraga. When Teens Cyberbully Themselves. NPR, April 2018. URL: https://www.npr.org/sections/health-shots/2018/04/21/604073315/when-teens-cyberbully-themselves (visited on 2023-12-08). [m18] ContraPoints. Contrapoints. URL: https://www.youtube.com/c/ContraPoints (visited on 2023-12-08). [m19] Incel. December 2023. Page Version ID: 1188569777. URL: https://en.wikipedia.org/w/index.php?title=Incel&oldid=1188569777 (visited on 2023-12-08). [m20] Chad. March 2012. URL: https://knowyourmeme.com/memes/chad (visited on 2023-12-08). [m21] Incel. December 2023. Page Version ID: 1188569777. URL: https://en.wikipedia.org/w/index.php?title=Incel&oldid=1188569777#Mass_murders_and_violence (visited on 2023-12-08). [m22] Rhitu Chatterjee. The new 988 mental health hotline is live. Here's what to know. NPR, July 2022. URL: https://www.npr.org/sections/health-shots/2022/07/15/1111316589/988-suicide-hotline-number (visited on 2023-12-08). [m23] Amanda Baughan. Make Peace with Social Media. Medium, May 2022. URL: https://amandabaughan.medium.com/make-peace-with-social-media-113877582006 (visited on 2023-12-08). [m24] Yim Register. Yim Register. URL: http://students.washington.edu/yreg/ (visited on 2023-12-08). [m25] MLEducation and YimRegister. Art/socialmediatips at main MLEducation/Art. 2021. URL: MLEducation/Art (visited on 2023-12-08). [m26] Casey Fiesler. What I Learned About the Internet From The Baby-Sitters Club. Slate, February 2017. URL: https://slate.com/technology/2017/02/what-i-learned-about-the-internet-from-the-baby-sitters-club.html (visited on 2023-12-08). [m27] Emily St. James. Trans Twitter and the beauty of online anonymity. Vox, September 2020. URL: https://www.vox.com/culture/21432987/trans-twitter-reddit-online-anonymity (visited on 2023-12-08). [m28] Jen Tribbet. Social Media Has Become A Place To Talk About Mental Illness. But Is That Helpful? NPR, November 2019. URL: https://www.npr.org/2019/11/13/779015105/social-media-has-become-a-place-to-talk-about-mental-illness-but-is-that-helpful (visited on 2023-12-08). [m29] Raisedbynarcissists: for the children of abusive parents. 2023. URL: https://www.reddit.com/r/raisedbynarcissists/?rdt=50656 (visited on 2023-12-08). [m30] Benjamin Goggin. Inside Facebook's suicide algorithm: Here's how the company uses artificial intelligence to predict your mental state from your posts. Business Insider, January 2019. URL: https://www.businessinsider.com/facebook-is-using-ai-to-try-to-predict-if-youre-suicidal-2018-12 (visited on 2023-12-08). [m31] Unalive. March 2022. URL: https://knowyourmeme.com/memes/unalive (visited on 2023-12-08). [m32] Christina Farr. Apple and UCLA kick off a three-year depression study. CNBC, August 2020. URL: https://www.cnbc.com/2020/08/04/apple-ucla-to-study-depression.html (visited on 2023-12-08). [m33] Kate Crawford. Time to regulate AI that interprets human emotions. Nature, 592(7853):167–167, April 2021. URL: https://www.nature.com/articles/d41586-021-00868-5 (visited on 2023-12-08), doi:10.1038/d41586-021-00868-5. [m34] Cheryl Teh. 'Every smile you fake' — an AI emotion-recognition system can assess how 'happy' China's workers are in the office. Insider, June 2021. URL: https://www.insider.com/ai-emotion-recognition-system-tracks-how-happy-chinas-workers-are-2021-6 (visited on 2023-12-08). [m35] C. L. Lynch. Invisible Abuse: ABA and the things only autistic people can see. NeuroClastic, March 2019. URL: https://neuroclastic.com/invisible-abuse-aba-and-the-things-only-autistic-people-can-see/ (visited on 2023-12-08). [m36] Gary Shkedy, Dalia Shkedy, and Aileen H. Sandoval-Norton. Long-term ABA Therapy Is Abusive: A Response to Gorycki, Ruppel, and Zane. Adv Neurodev Disord, 5(2):126–134, June 2021. URL: https://doi.org/10.1007/s41252-021-00201-1 (visited on 2023-12-08), doi:10.1007/s41252-021-00201-1. [m37] Neurodiversity. November 2023. Page Version ID: 1187185735. URL: https://en.wikipedia.org/w/index.php?title=Neurodiversity&oldid=1187185735 (visited on 2023-12-08). [m38] C. L. Lynch. “Autism is a Spectrum” Doesn’t Mean What You Think. NeuroClastic, May 2019. URL: https://neuroclastic.com/its-a-spectrum-doesnt-mean-what-you-think/ (visited on 2023-12-08). [m39] Alannah Oleson. Beyond “Average” Users: Building Inclusive Design Skills with the CIDER Technique. Bits and Behavior, October 2022. URL: https://medium.com/bits-and-behavior/beyond-average-users-building-inclusive-design-skills-with-the-cider-technique-413969544e6d (visited on 2023-12-08).

      I found [m23] “Make Peace with Social Media” by Amanda Baughan (2022) really interesting because it challenges the idea that social media is automatically bad for mental health. Instead of calling it an addiction, Baughan suggests treating it more like a relationship — one that you can manage, improve, and set boundaries for. I think this approach is a lot healthier than the “digital detox” mindset, which feels unrealistic for people who rely on social media for community or work.

      Her perspective connects to the “Healing your social media” section in the chapter, especially the idea of replacing “I should” with “I enjoy.” It made me realize that guilt-based thinking about screen time doesn’t help — awareness and intention do. Personally, this made me reflect on how I use social media to learn and connect with people who share my goals, rather than just scroll out of habit.

    1. Author response:

      The following is the authors’ response to the original reviews

      eLife Assessment

      This study provides a valuable contribution to understanding how negative affect influences food-choice decision making in bulimia nervosa, using a mechanistic approach with a drift diffusion model (DDM) to examine the weighting of tastiness and healthiness attributes. The solid evidence is supported by a robust crossover design and rigorous statistical methods, although concerns about low trial counts, possible overfitting, and the absence of temporally aligned binge-eating measures limit the strength of causal claims. Addressing modeling transparency, sample size limitations, and the specificity of mood induction effects, would enhance the study's impact and generalizability to broader populations.

      We thank the Editor and Reviewers for their summary of the strengths of our study, and for their thoughtful review and feedback on our manuscript. We apologize for the confusion in how we described the multiple steps performed to ensure that the hierarchical model reported in the main text was the best fit for the data but was not overfitted. Regarding “model transparency,” as described in our response to Reviewer 1 below, we have now more clearly explained (with references) that the use of hierarchical estimation procedures allows for information sharing across participants, which improves the reliability and stability of parameter estimates—even when the number of trials per individual is small. We have clarified for the less familiar reader how our Bayesian model selection criterion penalizes models with more parameters (e.g., more complex models).

      Details about model diagnostics, recoverability, and posterior predictive checks are all provided in the Supplementary Materials. We have clarified how these steps ensure that the parameters we estimate are identifiable and interpretable, while confirming that the model can reproduce key patterns in the data, ultimately supporting the validity of the winning model. Additionally, we have provided all scripts for estimating the models by linking to our public Github repository. Furthermore, we have edited language throughout to eliminate any implication of causal claims and acknowledged the limitation of the small sample size. Given these efforts, we are concerned that the current wording about “modeling transparency” in the public eLife Assessment may inadvertently misrepresent the modeling practices in our paper. Would it be possible to revise or remove that particular phrase to better reflect the steps we have taken? We believe this would help avoid confusion for readers.

      We have also taken additional steps to ensure that we have used “appropriate and validated methodology in line with current state-of-the-art," and we have added references to recent papers supporting our approaches.

      All changes in the revised text are marked in blue.

      Public Reviews:

      Reviewer #1 (Public review):

      Summary:

      Using a computational modeling approach based on the drift diffusion model (DDM) introduced by Ratcliff and McKoon in 2008, the article by Shevlin and colleagues investigates whether there are differences between neutral and negative emotional states in:

      (1) The timings of the integration in food choices of the perceived healthiness and tastiness of food options between individuals with bulimia nervosa (BN) and healthy participants.

      (2) The weighting of the perceived healthiness and tastiness of these options.

      Strengths:

      By looking at the mechanistic part of the decision process, the approach has the potential to improve the understanding of pathological food choices. The article is based on secondary research data.

      Weaknesses:

      I have two major concerns and a major improvement point.

      The major concerns deal with the reliability of the results of the DDM (first two sections of the Results, pages 6 and 7), which are central to the manuscript, and the consistency of the results with regards to the identification of mechanisms related to binge eating in BN patients (i.e. last section of the results, page 7).

      (1) Ratcliff and McKoon in 2008 used tasks involving around 1000 trials per participant. The Chen et al. experiment the authors refer to involves around 400 trials per participant. On the other hand, Shevlin and colleagues ask each participant to make two sets of 42 choices with two times fewer participants than in the Chen et al. experiment. Shevlin and colleagues also fit a DDM with additional parameters (e.g. a drift rate that varies according to subjective rating of the options) as compared to the initial version of Ratcliff and McKoon. With regards to the number of parameters estimated in the DDM within each group of participants and each emotional condition, the 5- to 10-fold ratio in the number of trials between the Shevlin and colleagues' experiment and the experiments they refer to (Ratcliff and McKoon, 2008; Chen et al. 2022) raises serious concerns about a potential overfitting of the data by the DDM. This point is not highlighted in the Discussion. Robustness and sensitivity analyses are critical in this case.

      We thank the Reviewer for their thoughtful critique. We agree that a limited number of trials can impede reliable estimation, which we acknowledge in the Discussion section. However, we used a hierarchical estimation approach which leverages group information to constrain individual-level estimates. This use of group-level parameters to inform individual-level estimates reduces overfitting and noise that can arise when trial counts are low, and the regularization inherent in hierarchical fitting prevents extreme parameter estimates that could arise from noisy or limited data (Rouder & Lu, 2005). As a result, hierarchical estimation has been repeatedly shown to work well in settings with low trial counts, including as few as 40 trials per condition (Lerche et al., 2017; Ratcliff & Childers, 2015; Wiecki et al., 2013). In addition, previous applications of the time-varying DDM to food choice task data has included experiments with as few as 60 trials per condition (Maier et al., 2020). We have added references to these more recent approaches and specifically note their advantages for the modeling of tasks with fewer trials. Finally, our successful parameter recovery described in the Supplementary Materials supports the robustness of the estimation procedure and the reliability of our results.

      The authors compare different DDMs to show that the DDM they used to report statistical results in the main text is the best according to the WAIC criterion. This may be viewed as a robustness analysis. However, the other DDM models (i.e. M0, M1, M2 in the supplementary materials) they used to make the comparison have fewer parameters to estimate than the one they used in the main text. Fits are usually expected to follow the rule that the more there are parameters to estimate in a model, the better it fits the data. Additionally, a quick plot of the data in supplementary table S12 (i.e. WAIC as a function of the number of parameters varying by food type in the model - i.e. 0 for M0, 2 for M1, 1 for M2 and 3 for M3) suggests that models M1 and potentially M2 may be also suitable: there is a break in the improvement of WAIC between model M0 and the three other models. I would thus suggest checking how the results reported in the main text differ when using models M1 and M2 instead of M3 (for the taste and health weights when comparing M3 with M1, for τS when comparing M3 with M2). If the differences are important, the results currently reported in the main text are not very reliable.

      We thank the Reviewer for highlighting that it would be helpful to explicitly note that we specifically selected WAIC as one of two methods to assess model fit because it penalizes for model complexity. We now explicitly state that, in addition to being more robust than other metrics like AIC or BIC when comparing hierarchical Bayesian models like those in the current study, model fit metrics like WAIC penalize for model complexity based on the number of parameters (Watanabe, 2010). Therefore, more complex models (i.e., those with more parameters) do not automatically have lower WAIC. Additionally, we now more clearly note that our second method to assess model fit, posterior predictive checks, demonstrate that only model M3 can reproduce key behavioral patterns present in the empirical data. As described in the Supplementary Materials, M1 and M2 miss key patterns in the data. In summary, we used best practices to assess model fit and reliability (Wilson & Collins, 2019): results from the WAIC comparison (which penalizes models with more parameters) and results from posterior predictive checks align in showing that M3 provided the best fit to our data. We have added a sentence to the manuscript to state this explicitly.

      (2) The second main concern deals with the association reported between the DDM parameters and binge eating episodes (i.e. last paragraph of the results section, page 7). The authors claim that the DDM parameters "predict" binge eating episodes (in the Abstract among other places) while the binge eating frequency does not seem to have been collected prospectively. Besides this methodological issue, the interpretation of this association is exaggerated: during the task, BN patients did not make binge-related food choices in the negative emotional state. Therefore, it is impossible to draw clear conclusions about binge eating, as other explanations seem equally plausible. For example, the results the authors report with the DDM may be a marker of a strategy of the patients to cope with food tastiness in order to make restrictive-like food choices. A comparison of the authors' results with restrictive AN patients would be of interest. Moreover, correlating results of a nearly instantaneous behavior (i.e. a couple of minutes to perform the task with the 42 food choices) with an observation made over several months (i.e. binge eating frequency collected over three months) is questionable: the negative emotional state of patients varies across the day without systematically leading patients to engage in a binge eating episode in such states.

      I would suggest in such an experiment to collect the binge craving elicited by each food and the overall binge craving of patients immediately before and after the task. Correlating the DDM results with these ratings would provide more compelling results. Without these data, I would suggest removing the last paragraph of the Results.

      We thank the Reviewer for these interesting and important suggestions, and we agree that claims about causal connections between our decision parameters and symptom severity metrics would be inappropriate. Per the Reviewer’s suggestions, we have eliminated the use of the word “predict” to describe the tested association with symptom metrics. We also agree that more time-locked associations with craving ratings and near-instantaneous behavior would be useful, and we have added this as an important direction for future research in the discussion. However, associating task-based behavior with validated self-report measures that assess symptom severity over long periods of time that precede the task visit (e.g., over the past 2 weeks in depression, over the past month in eating disorders) is common practice in computational psychiatry, psychiatric neuroimaging, and clinical cognitive neuroscience (Hauser et al., 2022; Huys et al., 2021; Wise et al., 2023), and this approach has been used several times specifically with food choice tasks (Dalton et al., 2020; Steinglass et al., 2015). We have revised the language throughout the manuscript to clarify: the results suggest that individuals whose task behavior is more reactive to negative affect tend to be the most symptomatic, but the results do not allow us to determine whether this reactivity causes the symptoms.

      In response to this Reviewer’s important point about negative affect not always producing loss-of-control eating in individuals with BN, we now explicitly note that while several studies employing ecological momentary assessments (EMA) have repeatedly shown that increases in negative affect significantly increase the likelihood of subsequent loss-of-control eating (Alpers & Tuschen-Caffier, 2001; Berg et al., 2013; Haedt-Matt & Keel, 2011; Hilbert & Tuschen-Caffier, 2007; Smyth et al., 2007), not all loss-of-control eating occurs in the context of negative affect. We further note that future studies should integrate food choice task data pre and post-affect inductions with measures capturing the specific frequency of loss of control eating episodes that occur during states of high negative affect.

      (3) My major improvement point is to tone down as much as possible any claim of a link with binge eating across the entire manuscript and to focus more on the restrictive behavior of BN patients in between binge eating episodes (see my second major concern about the methods). Additionally, since this article is a secondary research paper and since some of the authors have already used the task with AN patients, if possible I would run the same analyses with AN patients to test whether there are differences between AN (provided they were of the restrictive subtype) and BN.

      We appreciate the Reviewer’s very helpful suggestions. We have adjusted our language linking loss-of-control eating frequency with decision parameters, and we have added sentences focusing on the implications for the restrictive behavior of patients with BN between binge eating episodes. In the Supplementary Materials, we have added an analysis of the restraint subscale of the EDE-Q and confirmed no relationship with parameters of interest. While we agree additional analyses with AN patients would be of interest, this is outside the scope of the paper. Our team have collected data from individuals with AN using this task, but not with any affect induction or measure of affect. Therefore, we have added this important direction for future research to the discussion.

      Reviewer #2 (Public review):

      Summary:

      Binge eating is often preceded by heightened negative affect, but the specific processes underlying this link are not well understood. The purpose of this manuscript was to examine whether affect state (neutral or negative mood) impacts food choice decision-making processes that may increase the likelihood of binge eating in individuals with bulimia nervosa (BN). The researchers used a randomized crossover design in women with BN (n=25) and controls (n=21), in which participants underwent a negative or neutral mood induction prior to completing a food-choice task. The researchers found that despite no differences in food choices in the negative and neutral conditions, women with BN demonstrated a stronger bias toward considering the 'tastiness' before the 'healthiness' of the food after the negative mood induction.

      Strengths:

      The topic is important and clinically relevant and methods are sound. The use of computational modeling to understand nuances in decision-making processes and how that might relate to eating disorder symptom severity is a strength of the study.

      Weaknesses:

      The sample size was relatively small and may have been underpowered to find differences in outcomes (i.e., food choice behaviors). Participants were all women with BN, which limits the generalizability of findings to the larger population of individuals who engage in binge eating. It is likely that the negative affect manipulation was weak and may not have been potent enough to change behavior. Moreover, it is unclear how long the negative affect persisted during the actual task. It is possible that any increases in negative affect would have dissipated by the time participants were engaged in the decision-making task.

      We thank the Reviewer for their comments on the strengths of the paper, and for highlighting these important considerations regarding the sample demographics and the negative affect induction. As in the original paper that focused only on ultimate food choice behaviors, we now specifically acknowledge that the study was only powered to detect small to medium group differences in the effect of negative emotion on these final choice behaviors.

      Regarding the sample demographics, we agree that the study’s inclusion of only female participants is a limitation. Although the original decision for this sampling strategy was informed by data suggesting that bulimia nervosa is roughly six times more prevalent among females than males (Udo & Grilo, 2018), we now note in the discussion that our female-only sample limits the generalizability of the findings.

      We also agree with the Reviewer’s noted limitations of the negative mood induction, and based on the reviewer’s suggestions, we have expanded our original description of these limitations in the Discussion. Specifically, we now note that although the task was completed immediately after the affect induction, the study did not include intermittent mood assessments throughout the choice task, so it is unclear how long the negative affect persisted during the actual task.

      Reviewer #3 (Public review):

      Summary:

      The study uses the food choice task, a well-established method in eating disorder research, particularly in anorexia nervosa. However, it introduces a novel analytical approach - the diffusion decision model - to deconstruct food choices and assess the influence of negative affect on how and when tastiness and healthiness are considered in decision-making among individuals with bulimia nervosa and healthy controls.

      Strengths:

      The introduction provides a comprehensive review of the literature, and the study design appears robust. It incorporates separate sessions for neutral and negative affect conditions and counterbalances tastiness and healthiness ratings. The statistical methods are rigorous, employing multiple testing corrections.

      A key finding - that negative affect induction biases individuals with bulimia nervosa toward prioritizing tastiness over healthiness - offers an intriguing perspective on how negative affect may drive binge eating behaviors.

      Weaknesses:

      A notable limitation is the absence of a sample size calculation, which, combined with the relatively small sample, may have contributed to null findings. Additionally, while the affect induction method is validated, it is less effective than alternatives such as image or film-based stimuli (Dana et al., 2020), potentially influencing the results.

      We agree that the limited sample size and specific affect induction method may have contributed to the null model-agnostic behavioral findings. Based on this Reviewer’s and Reviewer 2’s comments, we have added these factors to our acknowledgements of limitations in the discussion.

      Another concern is the lack of clarity regarding which specific negative emotions were elicited. This is crucial, as research suggests that certain emotions, such as guilt, are more strongly linked to binge eating than others. Furthermore, recent studies indicate that negative affect can lead to both restriction and binge eating, depending on factors like negative urgency and craving (Leenaerts et al., 2023; Wonderlich et al., 2024). The study does not address this, though it could explain why, despite the observed bias toward tastiness, negative affect did not significantly impact food choices.

      We thank the Reviewer for raising these important points and possibilities. In the Supplementary Materials, we have added an additional analysis of the specific POMS subscales that comprise the total negative affect calculation that was reported in the original paper (Gianini et al., 2019). We also report total negative affect scores from the POMS in the main text. Ultimately, we found that, across both groups, the negative affect induction increased responses related to anger, confusion, depression, and tension while reducing vigor.

      We agree with the Reviewer that factors like negative urgency and cravings are relevant here. The study did not collect any measures of craving, and in response to Reviewer 1 and this Reviewer, we now note in the discussion that replication studies including momentary craving assessments will be important. While we do not have any measurements of cravings, we did measure negative urgency. The original paper (Gianini et al., 2019) did not find that negative urgency was related to restrictive food choices. We have now repeated those analyses, and we also were unable to find any meaningful patterns related to negative urgency. Nonetheless, we have added an analysis of negative urgency scores and decision parameters to the Supplementary Materials.

      Recommendations for the authors:

      Reviewer #1 (Recommendations for the authors):

      Please improve the description of the computational methods: the fit of the DDM, the difference between the models used in the DDM, and the difference between the DDM model and the models used in the linear mixed models (the word "model" is at the end confusing as it may refer either to the DDM or to the statistical analysis of the DDM parameters).

      We thank the Reviewer for highlighting the unclear language. We have updated the main text to clarify when the term “model” refers to the DDM itself versus the regression models assessing DDM parameters. As described above, we have clarified that both tests of model fit (WAIC and posterior predictive checks) suggest that Model 3 was the best fit to the data. We have also clarified the differences between the tested models in the Supplementary Materials.

      Please avoid reporting estimates of main effects in statistical models when an interaction is included: the estimates of the main effects may be heavily biased by the interaction term (this can be checked by re-running the model without the interaction term).

      We sincerely appreciate the Reviewer’s comment regarding the interpretation of main effects in the presence of significant interaction terms. In the revised manuscript, we no longer discuss significant main effects and instead focus on interpreting the interaction terms.

      Additionally, to help unpack interaction effects, we now include exploratory simple effects analyses in the supplementary materials. Simple effects analyses allow us to examine the effects of one independent variable at specific values of other independent variables (Aiken et al., 1991; Brambor et al., 2006; Jaccard & Turrisi, 2003; Winer et al., 1991).

      Supplementary tables S5 and S6 are excessive: there is no third-level interaction (supplementary tables S3 and S4) to justify a split between BN and healthy participants. Please perform rather a descending regression. Accordingly, the results reported in the second paragraph of page 7 should be entirely rewritten.

      We agree with the Reviewer’s suggestion that these tables are unnecessary. We have updated them to include details about simple effects analyses described above. We have revised the main text to reflect these changes.

      The words such as "predictive" indicating a causality link is used in several places in the manuscript including the supplementary materials while the experimental design does not allow such claims. This should be rephrased.

      We agree with the Reviewer that the term “predicted” in the main text improperly suggested a causal relationship between symptom severity and DDM parameters that our methods cannot evaluate. We have updated the main text with more appropriate language. However, our use of the term “predicted” in the Supplementary Materials refers to predicting the probability of a choice based on trial-level features which is standard use of the term in the computational cognitive modeling literature (Piray et al., 2019; Wilson & Collins, 2019; Zhang et al., 2020).

      The word "evaluated" appears twice in line 42 of the supplementary materials. Same with "in" at line 50.

      Thank you very much for highlighting this. We have removed the repeated words.

      Reviewer #2 (Recommendations for the authors):

      (1) I think it would be helpful if the authors noted in the Methods how long the food-choice task took. Prior research has suggested that in-lab mood inductions are very short-lasting (e.g., max 7 minutes) and it is likely that the task itself may have impacted the mood states of participants. Expanding on this in the Discussion/limitations seems important.

      The Reviewer raises an important point regarding the duration of our affect manipulation. Since we did not measure mood during or after the Food Choice Task, we cannot determine how long these effects persisted. We have added this limitation to the discussion section, noting that the absence of continuous affect measures following mood induction is a widespread limitation in the field.

      (2) Personally, I was a bit confused about what data the researchers were using to extrapolate information on whether or not participants were considering healthiness or tastiness. How was this operationalized? Is this an assumption being made based on how quickly someone chose a low-fat vs. high-fat food?

      We thank this Reviewer for highlighting that our models’ complexity warrants a more thorough explanation.

      Since we collected tastiness and healthiness attribute ratings during the first phase of the Food Choice Task, we can use those values to determine how these attribute values influence decision-making. Independently, foods were classified as low-fat or high-fat based on their objective properties (i.e., the percentage of calories from fat). However, the primary information we used to compute model parameters were participants’ attribute ratings, choices, and response times.

      In these models, the drift rate parameter captures the speed and direction of evidence accumulation. As the unsigned magnitude of the drift rate increases, the decision-maker is making up their mind more quickly. Once the evidence accumulates to a response boundary, the option associated with that boundary is selected. A positive drift rate means they are moving toward choosing one option (i.e., upper boundary), and a negative drift rate means they are moving toward choosing the other (i.e., lower boundary). In these decisions, decision-makers often consider multiple attributes, such as perceived healthiness and tastiness. Each of these attributes can influence the evidence accumulation process with different strengths, or weights.

      In addition, decision-makers do not consider all attributes at the same time. Inspired by earlier work on multi-attribute decision-making (Maier et al., 2020; Sullivan & Huettel, 2021), our modeling approach computes a parameter (i.e., relative attribute onset) which captures the time delay between when each attribute starts influencing the evidence accumulation process. This parameter gives us a way to estimate when decision-makers are considering different attributes, and tells us how much influence each attribute has, because if the attribute starts late, it has less time to influence the decision. These models use a piecewise drift rate function to describe how evidence changes over time within a trial: sometimes the decision maker only considers taste, sometimes only health, and other times both. Importantly, models with a relative attribute onset parameter can produce key behavioral patterns observed in mouse-tracking studies that models without this parameter are unable to replicate (Maier et al., 2020).

      In summary, the computational model describes decision-makers’ behaviors (what they would choose, and how fast they would choose) using different potential values of the drift weights and relative start time parameters. We then used Bayesian estimation methods to compare the model's predictions to the actual data. By examining how reaction times and choices change depending on the attribute values of the presented options, the model allows us to infer when each attribute is considered, and how strongly it influences the final choice.

      We have clarified this in the main text.

      Reviewer #3 (Recommendations for the authors):

      I wonder whether there were any measures concerning negative affect before and after the mood induction? This would make it clearer whether there was a significant change before and after. If different emotions were assessed, which emotion showed the strongest change?

      We thank the Reviewer for flagging this point. We realize that the main text did not make it clear that mood was assessed before and after the mood induction using the POMS (McNair et al., 1989). While these analyses were conducted and the results were reported in the original manuscript (Gianini et al., 2019), we now report them in the main text for completeness. Additionally, we added more details about how specific emotions changed by analyzing the subscales of the POMS in the Supplementary Materials. As mentioned above, we found that, across both groups, the negative affect induction increased responses related to anger, confusion, depression, and tension while reducing vigor.

      Thank you again for your consideration and for the reviewers’ comments and suggestions. We believe their incorporation has significantly strengthened the paper. In addition, thank you for the opportunity to publish our work in eLife. We look forward to hearing your response.

      References

      Aiken, L. S., West, S. G., & Reno, R. R. (1991). Multiple regression: Testing and interpreting interactions. Sage Publications, Inc.

      Alpers, G. W., & Tuschen-Caffier, B. (2001). Negative feelings and the desire to eat in bulimia nervosa. Eating Behaviors, 2(4), 339–352. https://doi.org/10.1016/S1471-0153(01)00040-X

      Berg, K. C., Crosby, R. D., Cao, L., Peterson, C. B., Engel, S. G., Mitchell, J. E., & Wonderlich, S. A. (2013). Facets of negative affect prior to and following binge-only, purge-only, and binge/purge events in women with bulimia nervosa. Journal of Abnormal Psychology, 122(1), 111–118. https://doi.org/10.1037/a0029703

      Brambor, T., Clark, W. R., & Golder, M. (2006). Understanding Interaction Models: Improving Empirical Analyses. Political Analysis, 14(1), 63–82. https://doi.org/10.1093/pan/mpi014

      Dalton, B., Foerde, K., Bartholdy, S., McClelland, J., Kekic, M., Grycuk, L., Campbell, I. C., Schmidt, U., & Steinglass, J. E. (2020). The effect of repetitive transcranial magnetic stimulation on food choice-related self-control in patients with severe, enduring anorexia nervosa. International Journal of Eating Disorders, 53(8), 1326–1336. https://doi.org/10.1002/eat.23267

      Gianini, L., Foerde, K., Walsh, B. T., Riegel, M., Broft, A., & Steinglass, J. E. (2019). Negative affect, dietary restriction, and food choice in bulimia nervosa. Eating Behaviors, 33, 49–54. https://doi.org/10.1016/j.eatbeh.2019.03.003

      Haedt-Matt, A. A., & Keel, P. K. (2011). Revisiting the affect regulation model of binge eating: A meta-analysis of studies using ecological momentary assessment. Psychological Bulletin, 137(4), 660–681. https://doi.org/10.1037/a0023660

      Hauser, T. U., Skvortsova, V., Choudhury, M. D., & Koutsouleris, N. (2022). The promise of a model-based psychiatry: Building computational models of mental ill health. The Lancet Digital Health, 4(11), e816–e828. https://doi.org/10.1016/S2589-7500(22)00152-2

      Hilbert, A., & Tuschen-Caffier, B. (2007). Maintenance of binge eating through negative mood: A naturalistic comparison of binge eating disorder and bulimia nervosa. International Journal of Eating Disorders, 40(6), 521–530. https://doi.org/10.1002/eat.20401

      Huys, Q. J. M., Browning, M., Paulus, M. P., & Frank, M. J. (2021). Advances in the computational understanding of mental illness. Neuropsychopharmacology, 46(1), 3–19. https://doi.org/10.1038/s41386-020-0746-4

      Jaccard, J., & Turrisi, R. (2003). Interaction effects in multiple regression (2nd ed.). Sage Publications, Inc.

      Lerche, V., Voss, A., & Nagler, M. (2017). How many trials are required for parameter estimation in diffusion modeling? A comparison of different optimization criteria. Behavior Research Methods, 49(2), 513–537. https://doi.org/10.3758/s13428-016-0740-2

      Maier, S. U., Raja Beharelle, A., Polanía, R., Ruff, C. C., & Hare, T. A. (2020). Dissociable mechanisms govern when and how strongly reward attributes affect decisions. Nature Human Behaviour, 4(9), Article 9. https://doi.org/10.1038/s41562-020-0893-y

      McNair, D., Lorr, M., & Droppleman, L. (1989). Profile of mood states (POMS).

      Piray, P., Dezfouli, A., Heskes, T., Frank, M. J., & Daw, N. D. (2019). Hierarchical Bayesian inference for concurrent model fitting and comparison for group studies. PLOS Computational Biology, 15(6), e1007043. https://doi.org/10.1371/journal.pcbi.1007043

      Ratcliff, R., & Childers, R. (2015). Individual differences and fitting methods for the two-choice diffusion model of decision making. Decision, 2(4), 237–279. https://doi.org/10.1037/dec0000030

      Rouder, J. N., & Lu, J. (2005). An introduction to Bayesian hierarchical models with an application in the theory of signal detection. Psychonomic Bulletin & Review, 12(4), 573–604. https://doi.org/10.3758/BF03196750

      Smyth, J. M., Wonderlich, S. A., Heron, K. E., Sliwinski, M. J., Crosby, R. D., Mitchell, J. E., & Engel, S. G. (2007). Daily and momentary mood and stress are associated with binge eating and vomiting in bulimia nervosa patients in the natural environment. Journal of Consulting and Clinical Psychology, 75(4), 629–638. https://doi.org/10.1037/0022-006X.75.4.629

      Steinglass, J., Foerde, K., Kostro, K., Shohamy, D., & Walsh, B. T. (2015). Restrictive food intake as a choice—A paradigm for study. International Journal of Eating Disorders, 48(1), 59–66. https://doi.org/10.1002/eat.22345

      Sullivan, N., & Huettel, S. A. (2021). Healthful choices depend on the latency and rate of information accumulation. Nature Human Behaviour, 5(12), Article 12. https://doi.org/10.1038/s41562-021-01154-0

      Udo, T., & Grilo, C. M. (2018). Prevalence and Correlates of DSM-5–Defined Eating Disorders in a Nationally Representative Sample of U.S. Adults. Biological Psychiatry, 84(5), 345–354. https://doi.org/10.1016/j.biopsych.2018.03.014

      Watanabe, S. (2010). Asymptotic Equivalence of Bayes Cross Validation and Widely Applicable Information Criterion in Singular Learning Theory. Journal of Machine Learning Research, 11, 3571–3594.

      Wiecki, T. V., Sofer, I., & Frank, M. J. (2013). HDDM: Hierarchical Bayesian estimation of the drift-diffusion model in Python. Frontiers in Neuroinformatics, 7. https://doi.org/10.3389/fninf.2013.00014

      Wilson, R. C., & Collins, A. G. (2019). Ten simple rules for the computational modeling of behavioral data. eLife, 8, e49547. https://doi.org/10.7554/eLife.49547

      Winer, B. J., Brown, D. R., & Michels, K. M. (1991). Statistical principles in experimental design (3rd ed). McGraw-Hill.

      Wise, T., Robinson, O. J., & Gillan, C. M. (2023). Identifying Transdiagnostic Mechanisms in Mental Health Using Computational Factor Modeling. Biological Psychiatry, 93(8), 690–703. https://doi.org/10.1016/j.biopsych.2022.09.034

      Zhang, L., Lengersdorff, L., Mikus, N., Gläscher, J., & Lamm, C. (2020). Using reinforcement learning models in social neuroscience: Frameworks, pitfalls and suggestions of best practices. Social Cognitive and Affective Neuroscience, 15(6), 695–707. https://doi.org/10.1093/scan/nsaa089

    1. Author response:

      The following is the authors’ response to the original reviews.

      Reviewer #1 (Public Review):

      Summary:

      In this study, Gu et al. employed novel viral strategies, combined with in vivo two-photon imaging, to map the tone response properties of two groups of cortical neurons in A1. The thalamocortical recipient (TR neurons) and the corticothalamic (CT neurons). They observed a clear tonotopic gradient among TR neurons but not in CT neurons. Moreover, CT neurons exhibited high heterogeneity of their frequency tuning and broader bandwidth, suggesting increased synaptic integration in these neurons. By parsing out different projecting-specific neurons within A1, this study provides insight into how neurons with different connectivity can exhibit different frequency response-related topographic organization.

      Strengths:

      This study reveals the importance of studying neurons with projection specificity rather than layer specificity since neurons within the same layer have very diverse molecular, morphological, physiological, and connectional features. By utilizing a newly developed rabies virus CSN-N2c GCaMP-expressing vector, the authors can label and image specifically the neurons (CT neurons) in A1 that project to the MGB. To compare, they used an anterograde trans-synaptic tracing strategy to label and image neurons in A1 that receive input from MGB (TR neurons).

      Weaknesses:

      Perhaps as cited in the introduction, it is well known that tonotopic gradient is well preserved across all layers within A1, but I feel if the authors want to highlight the specificity of their virus tracing strategy and the populations that they imaged in L2/3 (TR neurons) and L6 (CT neurons), they should perform control groups where they image general excitatory neurons in the two depths and compare to TR and CT neurons, respectively. This will show that it's not their imaging/analysis or behavioral paradigms that are different from other labs. 

      We thank the reviewer for these constructive suggestions. As recommended, we have performed control experiments that imaged the general excitatory neurons in superficial layers (shown below), and the results showed a clear tonotopic gradient, which was consistent with previous findings (Bandyopadhyay et al., 2010; Romero et al., 2020; Rothschild et al., 2010; Tischbirek et al., 2019), thereby validating the reliability of our imaging/analysis approach. The results are presented in a new supplemental figure (Figure 2- figure supplementary 3).

      Related publications:

      (1) Gu M, Li X, Liang S, Zhu J, Sun P, He Y, Yu H, Li R, Zhou Z, Lyu J, Li SC, Budinger E, Zhou Y, Jia H, Zhang J, Chen X. 2023. Rabies virus-based labeling of layer 6 corticothalamic neurons for two-photon imaging in vivo. iScience 26: 106625. DIO: https://doi.org/10.1016/j.isci.2023.106625, PMID: 37250327

      (2) Bandyopadhyay S, Shamma SA, Kanold PO. 2010. Dichotomy of functional organization in the mouse auditory cortex. Nat Neurosci 13: 361-8. DIO: https://doi.org/10.1038/nn.2490, PMID: 20118924

      (3) Romero S, Hight AE, Clayton KK, Resnik J, Williamson RS, Hancock KE, Polley DB. 2020. Cellular and Widefield Imaging of Sound Frequency Organization in Primary and Higher Order Fields of the Mouse Auditory Cortex. Cerebral Cortex 30: 1603-1622. DIO: https://doi.org/10.1093/cercor/bhz190, PMID: 31667491

      (4) Rothschild G, Nelken I, Mizrahi A. 2010. Functional organization and population dynamics in the mouse primary auditory cortex. Nat Neurosci 13: 353-60. DIO: https://doi.org/10.1038/nn.2484, PMID: 20118927

      (5) Tischbirek CH, Noda T, Tohmi M, Birkner A, Nelken I, Konnerth A. 2019. In Vivo Functional Mapping of a Cortical Column at Single-Neuron Resolution. Cell Rep 27: 1319-1326 e5. DIO: https://doi.org/10.1016/j.celrep.2019.04.007, PMID: 31042460

      Figures 1D and G, the y-axis is Distance from pia (%). I'm not exactly sure what this means. How does % translate to real cortical thickness?

      We thank the reviewer for this question. The distance of labeled cells from pia was normalized to the entire distance from pia to L6/WM border for each mouse, according to the previous study (Chang and Kawai, 2018). For all mice tested, the entire distance from pia to L6/WM border was 826.5 ± 23.4 mm (in the range of 752.9 to 886.1).

      Related publications:

      Chang M, Kawai HD. 2018. A characterization of laminar architecture in mouse primary auditory cortex. Brain Structure and Function 223: 4187-4209. DIO: https://doi.org/10.1007/s00429-018-1744-8, PMID: 30187193

      For Figure 2G and H, is each circle a neuron or an animal? Why are they staggered on top of each other on the x-axis? If the x-axis is the distance from caudal to rostral, each neuron should have a different distance? Also, it seems like it's because Figure 2H has more circles, which is why it has more variation, thus not significant (for example, at 600 or 900um, 2G seems to have fewer circles than 2H). 

      We sincerely appreciate the reviewer’s careful attention to the details of our figures. Each circle in the Figure 2G and H represents an individual imaging focal plane from different animals, and the median BF of some focal planes may be similar, leading to partial overlap. In the regions where overlap occurs, the brightness of the circle will be additive.

      Since fewer CT neurons, compared to TR neurons, responded to pure tones within each focal plane, as shown in Figure 2- figure supplementary 2, a larger number of focal planes were imaged to ensure a consistent and robust analysis of the pure tone response characteristics. The higher variance and lack of correlation in CT neurons is a key biological finding, not an artifact of sample size. The data clearly show a wide spread of median BFs at any given location for CT neurons, a feature absent in the TR population.

      Similarly, in Figures 2J and L, why are the circles staggered on the y-axis now? And is each circle now a neuron or a trial? It seems they have many more circles than Figure 2G and 2H. Also, I don't think doing a correlation is the proper stats for this type of plot (this point applies to Figures 3H and 3J).

      We regret any confusion have caused. In fact, Figure 2 illustrates the tonotopic gradient of CT and TR neurons at different scales. Specifically, Figures 2E-H present the imaging from the focal plane perspective (23 focal planes in Figures 2G, 40 focal planes in Figures 2H), whereas Figures 2I-L provide a more detailed view at the single-cell level (481 neurons in Figures 2J, 491 neurons in Figures 2L). So, Figures 2J and L do indeed have more circles than Figures 2G and H. The analysis at these varying scales consistently reveals the presence of a tonotopic gradient in TR neurons, whereas such a gradient is absent in CT neurons.

      We used Pearson correlation as a standard and direct method to quantify the linear relationship between a neuron's anatomical position and its frequency preference, which is widely used in the field to provide a quantitative measure (R-value) and a significance level (p-value) for the strength of a tonotopic gradient. The same statistical logic applies to testing for spatial gradients in local heterogeneity in Figure 3. We are confident that this is an appropriate and informative statistical approach for these data.

      What does the inter-quartile range of BF (IQRBF, in octaves) imply? What's the interpretation of this analysis? I am confused as to why TR neurons show high IQR in HF areas compared to LF areas, which means homogeneity among TR neurons (lines 213 - 216). On the same note, how is this different from the BF variability?  Isn't higher IQR equal to higher variability?

      We thank the reviewer for raising this important point. IQRBF, is a measure of local tuning heterogeneity. It quantifies the diversity of BFs among neighboring neurons. A small IQRBF means neighbors are similarly tuned (an orderly, homogeneous map), while a large IQRBF means neighbors have very different BFs (a disordered, heterogeneous map). (Winkowski and Kanold, 2013; Zeng et al., 2019).

      From the BF position reconstruction of all TR neurons (Figures 2I), most TR neurons respond to high-frequency sounds in the high-frequency (HF) region, but some neurons respond to low frequencies such as 2 kHz, which contributes to high IQR in HF areas. This does not contradict our main conclusion, that the TR neurons is significantly more homogeneous than the CT neurons. BF variability represents the stability of a neuron's BF over time, while IQR represents the variability of BF among different neurons within a certain range. (Chambers et al., 2023).

      Related publications:

      (1) Chambers AR, Aschauer DF, Eppler JB, Kaschube M, Rumpel S. 2023. A stable sensory map emerges from a dynamic equilibrium of neurons with unstable tuning properties. Cerebral Cortex 33: 5597-5612. DIO: https://doi.org/10.1093/cercor/bhac445, PMID: 36418925

      (2) Winkowski DE, Kanold PO. 2013. Laminar transformation of frequency organization in auditory cortex. Journal of Neuroscience 33: 1498-508. DIO: https://doi.org/10.1523/JNEUROSCI.3101-12.2013, PMID: 23345224

      (3) Zeng HH, Huang JF, Chen M, Wen YQ, Shen ZM, Poo MM. 2019. Local homogeneity of tonotopic organization in the primary auditory cortex of marmosets. Proceedings of the National Academy of Sciences of the United States of America 116: 3239-3244. DIO: https://doi.org/10.1073/pnas.1816653116, PMID: 30718428

      Figure 4A-B, there are no clear criteria on how the authors categorize V, I, and O shapes. The descriptions in the Methods (lines 721 - 725) are also very vague.

      We apologize for the initial vagueness and have replaced the descriptions in the Methods section. “V-shaped”: Neurons whose FRAs show decreasing frequency selectivity with increasing intensity. “I-shaped”: Neurons whose FRAs show constant frequency selectivity with increasing intensity. “O-shaped”: Neurons responsive to a small range of intensities and frequencies, with the peak response not occurring at the highest intensity level.

      To provide better visual intuition, we show multiple representative examples of each FRA type for both TR and CT neurons below. We are confident that these provide the necessary clarity and reproducibility for our analysis of receptive field properties.

      Author response image 1.

      Different FRA types within the dataset of TR and CT neurons. Each row shows 6 representative FRAs from a specific type. Types are V-shaped (‘V'), I-shaped (‘I’), and O-shaped (‘O’). The X-axis represents 11 pure tone frequencies, and the Y-axis represents 6 sound intensities.

      Reviewer #2 (Public Review):

      Summary:

      Gu and Liang et. al investigated how auditory information is mapped and transformed as it enters and exits an auditory cortex. They use anterograde transsynaptic tracers to label and perform calcium imaging of thalamorecipient neurons in A1 and retrograde tracers to label and perform calcium imaging of corticothalamic output neurons. They demonstrate a degradation of tonotopic organization from the input to output neurons.

      Strengths:

      The experiments appear well executed, well described, and analyzed.

      Weaknesses:

      (1) Given that the CT and TR neurons were imaged at different depths, the question as to whether or not these differences could otherwise be explained by layer-specific differences is still not 100% resolved. Control measurements would be needed either by recording (1) CT neurons in upper layers, (2) TR in deeper layers, (3) non-CT in deeper layers and/or (4) non-TR in upper layers.

      We appreciate these constructive suggestions. To address this, we performed new experiments and analyses.

      Comparison of TR neurons across superficial layers: we analyzed our existing TR neuron dataset to see if response properties varied by depth within the superficial layers. We found no significant differences in the fraction of tuned neurons, field IQR, or maximum bandwidth (BWmax) between TR neurons in L2/3 and L4. This suggests a degree of functional homogeneity within the thalamorecipient population across these layers. The results are presented in new supplemental figures (Figure 2- figure supplementary 4).

      Necessary control experiments.

      (1) CT neurons in upper layers. CT neurons are thalamic projection neurons that only exist in the deeper cortex, so CT neurons do not exist in upper layers (Antunes and Malmierca, 2021).

      (2) TR neurons in deeper layers. As we mentioned in the manuscript, due to high-titer AAV1-Cre virus labeling controversy (anterograde and retrograde labelling both exist), it is challenging to identify TR neurons in deeper layers.

      (3) non-CT in deeper layers and/or (4) non-TR in upper layers.

      To directly test if projection identity confers distinct functional properties within the same cortical layers, we performed the crucial control of comparing TR neurons to their neighboring non-TR neurons. We injected AAV1-Cre in MGB and a Cre-dependent mCherry into A1 to label TR neurons red. We then co-injected AAV-CaMKII-GCaMP6s to label the general excitatory population green.  In merged images, this allowed us to functionally image and directly compare TR neurons (yellow) and adjacent non-TR neurons (green). We separately recorded the responses of these neurons to pure tones using two-photon imaging. The results show that TR neurons are significantly more likely to be tuned to pure tones than their neighboring non-TR excitatory neurons. This finding provides direct evidence that a neuron's long-range connectivity, and not just its laminar location, is a key determinant of its response properties. The results are presented in new supplemental figures (Figure 2- figure supplementary 5).

      Related publications:

      Antunes FM, Malmierca MS. 2021. Corticothalamic Pathways in Auditory Processing: Recent Advances and Insights From Other Sensory Systems. Front Neural Circuits 15: 721186. DIO: https://doi.org/10.3389/fncir.2021.721186, PMID: 34489648

      (2) What percent of the neurons at the depths are CT neurons? Similar questions for TR neurons?

      We thank the reviewer for the comments. We performed histological analysis on brain slices from our experimental animals to quantify the density of these projection-specific populations. Our analysis reveals that CT neurons constitute approximately 25.47%\22.99%–36.50% of all neurons in Layer 6 of A1. In the superficial layers(L2/3 and L4), TR neurons comprise approximately 10.66%\10.53%–11.37% of the total neuronal population.

      Author response image 2.

      The fraction of CT and TR neurons. (A) Boxplots showing the fraction of CT neurons. N = 11 slices from 4 mice. (B) Boxplots showing the fraction of TR neurons. N = 11 slices from 4 mice.

      (3) V-shaped, I-shaped, or O-shaped is not an intuitively understood nomenclature, consider changing. Further, the x/y axis for Figure 4a is not labeled, so it's not clear what the heat maps are supposed to represent.

      The terms "V-shaped," "I-shaped," and "O-shaped" are an established nomenclature in the auditory neuroscience literature for describing frequency response areas (FRAs), and we use them for consistency with prior work. V-shaped: Neurons whose FRAs show decreasing frequency selectivity with increasing intensity. I-shaped: Neurons whose FRAs show constant frequency selectivity with increasing intensity. O-shaped: Neurons responsive to a small range of intensities and frequencies, with the peak response not occurring at the highest intensity level.

      (Rothschild et al., 2010). We have included a more detailed description in the Methods.

      The X-axis represents 11 pure tone frequencies, and the Y-axis represents 6 sound intensities. So, the heat map represents the FRA of neurons in A1, reflecting the responses for different frequencies and intensities of sound stimuli. In the revised manuscript, we have provided clarifications in the figure legend.

      (4) Many references about projection neurons and cortical circuits are based on studies from visual or somatosensory cortex. Auditory cortex organization is not necessarily the same as other sensory areas. Auditory cortex references should be used specifically, and not sources reporting on S1, and V1.

      We thank the reviewers for their valuable comments. We have made a concerted effort to ensure that claims about cortical circuit organization are supported by findings specifically from the auditory cortex wherever possible, strengthening the focus and specificity of our discussion.

      Reviewer #3 (Public Review):

      Summary:

      The authors performed wide-field and 2-photon imaging in vivo in awake head-fixed mice, to compare receptive fields and tonotopic organization in thalamocortical recipient (TR) neurons vs corticothalamic (CT) neurons of mouse auditory cortex. TR neurons were found in all cortical layers while CT neurons were restricted to layer 6. The TR neurons at nominal depths of 200-400 microns have a remarkable degree of tonotopy (as good if not better than tonotopic maps reported by multiunit recordings). In contrast, CT neurons were very heterogenous in terms of their best frequency (BF), even when focusing on the low vs high-frequency regions of the primary auditory cortex. CT neurons also had wider tuning.

      Strengths:

      This is a thorough examination using modern methods, helping to resolve a question in the field with projection-specific mapping.

      Weaknesses:

      There are some limitations due to the methods, and it's unclear what the importance of these responses are outside of behavioral context or measured at single timepoints given the plasticity, context-dependence, and receptive field 'drift' that can occur in the cortex.

      (1) Probably the biggest conceptual difficulty I have with the paper is comparing these results to past studies mapping auditory cortex topography, mainly due to differences in methods. Conventionally, the tonotopic organization is observed for characteristic frequency maps (not best frequency maps), as tuning precision degrades and the best frequency can shift as sound intensity increases. The authors used six attenuation levels (30-80 dB SPL) and reported that the background noise of the 2-photon scope is <30 dB SPL, which seems very quiet. The authors should at least describe the sound-proofing they used to get the noise level that low, and some sense of noise across the 2-40 kHz frequency range would be nice as a supplementary figure. It also remains unclear just what the 2-photon dF/F response represents in terms of spikes. Classic mapping using single-unit or multi-unit electrodes might be sensitive to single spikes (as might be emitted at characteristic frequency), but this might not be as obvious for Ca2+ imaging. This isn't a concern for the internal comparison here between TR and CT cells as conditions are similar, but is a concern for relating the tonotopy or lack thereof reported here to other studies.

      We sincerely thank the reviewer for the thoughtful evaluation of our manuscript and for your positive assessment of our work.

      (1)  Concern regarding Best Frequency (BF) vs. Characteristic Frequency (CF)

      Our use of BF, defined as the frequency eliciting the highest response averaged across all sound levels, is a standard and practical approach in 2-photon Ca²⁺ imaging studies. (Issa et al., 2014; Rothschild et al., 2010; Schmitt et al., 2023; Tischbirek et al., 2019). This method is well-suited for functionally characterizing large numbers of neurons simultaneously, where determining a precise firing threshold for each individual cell can be challenging.

      (2) Concern regarding background noise of the 2-photon setup

      We have expanded the Methods section ("Auditory stimulation") to include a detailed description of the sound-attenuation strategies used during the experiments. The use of a custom-built, double-walled sound-proof enclosure lined with wedge-shaped acoustic foam was implemented to significantly reduce external noise interference. These strategies ensured that auditory stimuli were delivered under highly controlled, low-noise conditions, thereby enhancing the reliability and accuracy of the neural response measurements obtained throughout the study.

      (3) Concern regarding the relationship between dF/F and spikes

      While Ca²⁺ signals are an indirect and filtered representation of spiking activity, they are a powerful tool for assessing the functional properties of genetically-defined cell populations. As you note, the properties and limitations of Ca²⁺ imaging apply equally to both the TR and CT neuron groups we recorded. Therefore, the profound difference we observed—a clear tonotopic gradient in one population and a lack thereof in the other—is a robust biological finding and not a methodological artifact.

      Related publications:

      (1) Issa JB, Haeffele BD, Agarwal A, Bergles DE, Young ED, Yue DT. 2014. Multiscale optical Ca2+ imaging of tonal organization in mouse auditory cortex. Neuron 83: 944-59. DIO: https://doi.org/10.1016/j.neuron.2014.07.009, PMID: 25088366

      (2) Rothschild G, Nelken I, Mizrahi A. 2010. Functional organization and population dynamics in the mouse primary auditory cortex. Nat Neurosci 13: 353-60. DIO: https://doi.org/10.1038/nn.2484, PMID: 20118927

      (3) Schmitt TTX, Andrea KMA, Wadle SL, Hirtz JJ. 2023. Distinct topographic organization and network activity patterns of corticocollicular neurons within layer 5 auditory cortex. Front Neural Circuits 17: 1210057. DIO: https://doi.org/10.3389/fncir.2023.1210057, PMID: 37521334

      (4) Tischbirek CH, Noda T, Tohmi M, Birkner A, Nelken I, Konnerth A. 2019. In Vivo Functional Mapping of a Cortical Column at Single-Neuron Resolution. Cell Rep 27: 1319-1326 e5. DIO: https://doi.org/10.1016/j.celrep.2019.04.007, PMID: 31042460

      (2) It seems a bit peculiar that while 2721 CT neurons (N=10 mice) were imaged, less than half as many TR cells were imaged (n=1041 cells from N=5 mice). I would have expected there to be many more TR neurons even mouse for mouse (normalizing by number of neurons per mouse), but perhaps the authors were just interested in a comparison data set and not being as thorough or complete with the TR imaging?

      As shown in the Figure 2- figure supplementary 2, a much higher fraction of TR neurons was "tuned" to pure tones (46% of 1041 neurons) compared to CT neurons (only 18% of 2721 neurons). To obtain a statistically robust and comparable number of tuned neurons for our core analysis (481 tuned TR neurons vs. 491 tuned CT neurons), it was necessary to sample a larger total population of CT neurons, which required imaging from more animals.

      (3) The authors' definitions of neuronal response type in the methods need more quantitative detail. The authors state: "Irregular" neurons exhibited spontaneous activity with highly variable responses to sound stimulation. "Tuned" neurons were responsive neurons that demonstrated significant selectivity for certain stimuli. "Silent" neurons were defined as those that remained completely inactive during our recording period (> 30 min). For tuned neurons, the best frequency (BF) was defined as the sound frequency associated with the highest response averaged across all sound levels.". The authors need to define what their thresholds are for 'highly variable', 'significant', and 'completely inactive'. Is best frequency the most significant response, the global max (even if another stimulus evokes a very close amplitude response), etc.

      We appreciate the reviewer's suggestions. We have added more detailed description in the Methods.

      Tuned neurons: A responsive neuron was further classified as "Tuned" if its responses showed significant frequency selectivity. We determined this using a one-way ANOVA on the neuron's response amplitudes across all tested frequencies (at the sound level that elicited the maximal response). If the ANOVA yielded a p-value < 0.05, the neuron was considered "Tuned”. Irregular neurons: Responsive neurons that did not meet the statistical criterion for being "Tuned" (i.e., ANOVA p-value ≥ 0.05) were classified as "Irregular”. This provides a clear, mutually exclusive category for sound-responsive but broadly-tuned or non-selective cells. Silent neurons: Neurons that were not responsive were classified as "Silent". This quantitatively defines them as cells that showed no significant stimulus-evoked activity during the entire recording session. Best frequency (BF): It is the frequency that elicited the maximal mean response, averaged across all sound levels.

      To provide greater clarity, we showed examples in the following figures.

      Author response image 3.

      Reviewer #1 (Recommendations For The Authors):

      (1) A1 and AuC were used exchangeably in the text.

      Thank you for pointing out this issue. Our terminological strategy was to remain faithful to the original terms used in the literature we cite, where "AuC" is often used more broadly. In the revised manuscript, we have performed a careful edit to ensure that we use the specific term "A1" (primary auditory cortex) when describing our own results and recording locations, which were functionally and anatomically confirmed.

      (2) Grammar mistakes throughout.

      We are grateful for the reviewer’s suggested improvement to our wording. The entire manuscript has undergone a thorough professional copyediting process to correct all grammatical errors and improve overall readability.

      (3) The discussion should talk more about how/why L6 CT neurons don't possess the tonotopic organization and what are the implications. Currently, it only says 'indicative of an increase in synaptic integration during cortical processing'...

      Thanks for this suggestion. We have substantially revised and expanded the Discussion section to explore the potential mechanisms and functional implications of the lack of tonotopy in L6 CT neurons.

      Broad pooling of inputs: We propose that the lack of tonotopy is an active computation, not a passive degradation. CT neurons likely pool inputs from a wide range of upstream neurons with diverse frequency preferences. This broad synaptic integration, reflected in their wider tuning bandwidth, would actively erase the fine-grained frequency map in favor of creating a different kind of representation.

      A shift from topography to abstract representation: This transformation away from a classic sensory map may be critical for the function of corticothalamic feedback. Instead of relaying "what" frequency was heard, the descending signal from CT neurons may convey more abstract, higher-order information, such as the behavioral relevance of a sound, predictions about upcoming sounds, or motor-related efference copy signals that are not inherently frequency-specific.’

      Modulatory role of the descending pathway: The descending A1-to-MGB pathway is often considered to be modulatory, shaping thalamic responses rather than driving them directly. A modulatory signal designed to globally adjust thalamic gain or selectivity may not require, and may even be hindered by, a fine-grained topographical organization.

      Reviewer #2 (Recommendations For The Authors):

      (1) Given that the CT and TR neurons were imaged at different depths, the question as to whether or not these differences could otherwise be explained by layer-specific differences is still not 100% resolved. Control measurements would be needed either by recording (1) CT neurons in upper layers (2) TR in deeper layers (3) non-CT in deeper layers and/or (4) non-TR in upper layers.

      We appreciate these constructive suggestions. To address this, we performed new experiments and analyses.

      Comparison of TR neurons across superficial layers: we analyzed our existing TR neuron dataset to see if response properties varied by depth within the superficial layers. We found no significant differences in the fraction of tuned neurons, field IQR, or maximum bandwidth (BWmax) between TR neurons in L2/3 and L4. This suggests a degree of functional homogeneity within the thalamorecipient population across these layers.

      Necessary control experiments.

      (1) CT neurons in upper layers. CT neurons are thalamic projection neurons that only exist in the deeper cortex, so CT neurons do not exist in upper layers (Antunes and Malmierca, 2021).

      (2) TR neurons in deeper layers. As we mentioned in the manuscript, due to high-titer AAV1-Cre virus labeling controversy (anterograde and retrograde labelling both exist), it is challenging to identify TR neurons in deeper layers.

      (3) non-CT in deeper layers and/or (4) non-TR in upper layers.

      To directly test if projection identity confers distinct functional properties within the same cortical layers, we performed the crucial control of comparing TR neurons to their neighboring non-TR neurons. We injected AAV1-Cre in MGB and a Cre-dependent mCherry into A1 to label TR neurons red. We then co-injected AAV-CaMKII-GCaMP6s to label the general excitatory population green.  In merged images, this allowed us to functionally image and directly compare TR neurons (yellow) and adjacent non-TR neurons (green). We separately recorded the responses of these neurons to pure tones using two-photon imaging. The results show that TR neurons are significantly more likely to be tuned to pure tones than their neighboring non-TR excitatory neurons. This finding provides direct evidence that a neuron's long-range connectivity, and not just its laminar location, is a key determinant of its response properties.

      Related publications:

      Antunes FM, Malmierca MS. 2021. Corticothalamic Pathways in Auditory Processing: Recent Advances and Insights From Other Sensory Systems. Front Neural Circuits 15: 721186. DIO: https://doi.org/10.3389/fncir.2021.721186, PMID: 34489648

      (3) V-shaped, I-shaped, or O-shaped is not an intuitively understood nomenclature, consider changing. Further, the x/y axis for Figure 4a is not labeled, so it's not clear what the heat maps are supposed to represent.

      The terms "V-shaped," "I-shaped," and "O-shaped" are an established nomenclature in the auditory neuroscience literature for describing frequency response areas (FRAs), and we use them for consistency with prior work. V-shaped: Neurons whose FRAs show decreasing frequency selectivity with increasing intensity. I-shaped: Neurons whose FRAs show constant frequency selectivity with increasing intensity. O-shaped: Neurons responsive to a small range of intensities and frequencies, with the peak response not occurring at the highest intensity level.

      (Rothschild et al., 2010). We have included a more detailed description in the Methods.

      The X-axis represents 11 pure tone frequencies, and the Y-axis represents 6 sound intensities. So, the heat map represents the FRA of neurons in A1, reflecting the responses for different frequencies and intensities of sound stimuli. In the revised manuscript, we have provided clarifications in the figure legend.

      (4) Many references about projection neurons and cortical circuits are based on studies from visual or somatosensory cortex. Auditory cortex organization is not necessarily the same as other sensory areas. Auditory cortex references should be used specifically, and not sources reporting on S1, V1.

      We thank the reviewers for their valuable comments. We have made a concerted effort to ensure that claims about cortical circuit organization are supported by findings specifically from the auditory cortex wherever possible, strengthening the focus and specificity of our discussion.

      Reviewer #3 (Recommendations For The Authors):

      I suggest showing some more examples of how different neurons and receptive field properties were quantified and statistically analyzed. Especially in Figure 4, but really throughout.

      We thank the reviewer for this valuable suggestion. To provide greater clarity, we have added more examples in the following figure.

    1. Author response:

      The following is the authors’ response to the original reviews.

      Reviewer #1 (Public review): 

      Overall, the conclusions of the paper are mostly supported by the data but may be overstated in some cases, and some details are also missing or not easily recognizable within the figures. The provision of additional information and analyses would be valuable to the reader and may even benefit the authors' interpretation of the data. 

      We thank the reviewer for the thoughtful and constructive feedback. We are pleased that the reviewer found the overall conclusions of our paper to be well supported by the data, and we appreciate the suggestions for improving figure clarity and interpretive accuracy. Below, we address each point with corresponding revisions.

      The conclusion that DREADD expression gradually decreases after 1.5-2 years is only based on a select few of the subjects assessed; in Figure 2, it appears that only 3 hM4Di cases and 2 hM3Dq cases are assessed after the 2-year timepoint. The observed decline appears consistent within the hM4Di cases, but not for the hM3Dq cases (see Figure 2C: the AAV2.1-hSyn-hM3Dq-IRES-AcGFP line is increasing after 2 years.) 

      We agree that our interpretation should be stated more cautiously, given the limited number of cases assessed beyond the two-year timepoint. In the revised manuscript, we have clarified in the Results that the observed decline is based on a subset of animals. We have also included a text stating that while a consistent decline was observed in hM4Di-expressing monkeys, the trajectory for hM3Dq expression was more variable with at least one case showing an increased signal beyond two years.

      Revised Results section:

      Lines 140, “hM4Di expression levels remained stable at peak levels for approximately 1.5 years, followed by a gradual decline observed in one case after 2.5 years, and after approximately 3 years in the other two cases (Figure 2B, a and e/d, respectively). Compared with hM4Di expression, hM3Dq expression exhibited greater post-peak fluctuations. Nevertheless, it remained at ~70% of peak levels after about 1 year. This post-peak fluctuation was not significantly associated with the cumulative number of DREADD agonist injections (repeated-measures two-way ANOVA, main effect of activation times, F<sub>(1,6)</sub> = 5.745, P = 0.054). Beyond 2 years post-injection, expression declined to ~50% in one case, whereas another case showed an apparent increase (Figure 2C, c and m, respectively).”

      Given that individual differences may affect expression levels, it would be helpful to see additional labels on the graphs (or in the legends) indicating which subject and which region are being represented for each line and/or data point in Figure 1C, 2B, 2C, 5A, and 5B. Alternatively, for Figures 5A and B, an accompanying table listing this information would be sufficient. 

      We thank the reviewer for these helpful suggestions. In response, we have revised the relevant figures (Fig. 1C, 2B, 2C, and 5) as noted in the “Recommendations for the authors”, including simplifying visual encodings and improving labeling. We have also updated Table 2 to explicitly indicate the animal ID and brain regions associated with each data point shown in the figures.

      While the authors comment on several factors that may influence peak expression levels, including serotype, promoter, titer, tag, and DREADD type, they do not comment on the volume of injection. The range in volume used per region in this study is between 2 and 54 microliters, with larger volumes typically (but not always) being used for cortical regions like the OFC and dlPFC, and smaller volumes for subcortical regions like the amygdala and putamen. This may weaken the claim that there is no significant relationship between peak expression level and brain region, as volume may be considered a confounding variable. Additionally, because of the possibility that larger volumes of viral vectors may be more likely to induce an immune response, which the authors suggest as a potential influence on transgene expression, not including volume as a factor of interest seems to be an oversight. 

      We thank the reviewer for raising this important issue. We agree that injection volume could act as a confounding variable, particularly since larger volumes were used in only handheld cortical injections. This overlap makes it difficult to disentangle the effect of volume from those of brain region or injection method. Moreover, data points associated with these larger volumes also deviated when volume was included in the model.

      To address this, we performed a separate analysis restricted to injections delivered via microinjector, where a comparable volume range was used across cases. In this subset, we included injection volume as additional factor in the model and found that volume did not significantly impact peak expression levels. Instead, the presence of co-expressed protein tags remained a significant predictor, while viral titer no longer showed a significant effect. These updated results have replaced the originals in the revised Results section and in the new Figure 5. We have also revised the Discussion to reflect these updated findings.

      The authors conclude that vectors encoding co-expressed protein tags (such as HA) led to reduced peak expression levels, relative to vectors with an IRES-GFP sequence or with no such element at all. While interesting, this finding does not necessarily seem relevant for the efficacy of long-term expression and function, given that the authors show in Figures 1 and 2 that peak expression (as indicated by a change in binding potential relative to non-displaced radioligand, or ΔBPND) appears to taper off in all or most of the constructs assessed. The authors should take care to point out that the decline in peak expression should not be confused with the decline in longitudinal expression, as this is not clear in the discussion; i.e. the subheading, "Factors influencing DREADD expression," might be better written as, "Factors influencing peak DREADD expression," and subsequent wording in this section should specify that these particular data concern peak expression only. 

      We appreciate this important clarification. In response, we have revised the title to "Protein tags reduce peak DREADD expression levels" in the Results section and “Factors influencing peak DREADD expression levels” in the Discussion section. Additionally, we specified that our analysis focused on peak ΔBP<sub>ND</sub> values around 60 days post-injection. We have also explicitly distinguished these findings from the later-stage changes in expression seen in the longitudinal PET data in both the Results and Discussion sections.

      Reviewer #1 (Recommendations for the authors):

      (1) Will any of these datasets be made available to other researchers upon request?

      All data used to generate the figures have been made publicly available via our GitHub repository (https://github.com/minamimoto-lab/2024-Nagai-LongitudinalPET.git). This has been stated in the "Data availability" section in the revised manuscript.

      (2) Suggested modifications to figures:

      a) In Figures 2B and C, the inclusion of "serotype" as a separate legend with individual shapes seems superfluous, as the serotype is also listed as part of the colour-coded vector

      We agree that the serotype legend was redundant since this information is already included in the color-coded vector labels. In response, we have removed the serotype shape indicators and now represent the data using only vector-construct-based color coding for clarity in Figure 2B and C.

      b) In Figures 3A and B, it would be nice to see tics (representing agonist administration) for all subjects, not just the two that are exemplified in panels C-D and F-H. Perhaps grey tics for the non-exemplified subjects could be used.

      In response, we have included black and white ticks to indicate all agonist administration across all subjects in Figure 3A and B, with the type of agonist clearly specified. 

      c) In Figure 4C, a Nissl- stained section is said to demonstrate the absence of neuronal loss at the vector injection sites. However, if the neuronal loss is subtle or widespread, this might not be easily visualized by Nissl. I would suggest including an additional image from the same section, in a non-injected cortical area, to show there is no significant difference between the injected and non-injected region.

      To better demonstrate the absence of neuronal loss at the injection site, we have included an image from the contralateral, non-injected region of the same section for comparison (Fig. 4C).

      d) In Figure 5A: is it possible that the hM3Dq construct with a titer of 5×10^13 gc/ml is an outlier, relative to the other hM3Dq constructs used?

      We thank the reviewer for raising this important observation. To evaluate whether the high-titer constructs represented a statistical outlier that might artifactually influence the observed trends, we performed a permutation-based outlier analysis. This assessment identified this point in question, as well as one additional case (titer 4.6 x 10e13 gc/ml, #255, L_Put), as significant outlier relative to the distribution of the dataset.

      Accordingly, we excluded these two data points from the analysis. Importantly, this exclusion did not meaningfully alter the overall trend or the statistical conclusions—specifically, the significant effect of co-expressed protein tags on peak expression levels remain robust. We have updated the Methods section to describe this outlier handling and added a corresponding note in the figure legend.

      Reviewer #2 (Public review): 

      Weaknesses 

      This study is a meta-analysis of several experiments performed in one lab. The good side is that it combined a large amount of data that might not have been published individually; the downside is that all things were not planned and equated, creating a lot of unexplained variances in the data. This was yet judiciously used by the authors, but one might think that planned and organized multicentric experiments would provide more information and help test more parameters, including some related to inter-individual variability, and particular genetic constructs. 

      We thank the reviewer for bringing this important point to our attention. We fully acknowledge that the retrospective nature of our dataset—compiled from multiple studies conducted within a single laboratory—introduces variability related to differences in injection parameters and scanning timelines. While this reflects the practical realities and constraints of long-term NHP research, we agree that more standardized and prospectively designed studies would better control such source of variances. To address this, we have added the following statement to the "Technical consideration" section in Discussion:

      Lines 297, "This study included a retrospective analysis of datasets pooled from multiple studies conducted within a single laboratory, which inherently introduced variability across injection parameters and scan intervals. While such an approach reflects real-world practices in long-term NHP research, future studies, including multicenter efforts using harmonized protocols, will be valuable for systematically assessing inter-individual differences and optimizing key experimental parameters."

      Reviewer #2 (Recommendations for the authors):

      I just have a few minor points that might help improve the paper:

      (1) Figure 1C y-axis label: should add deltaBPnd in parentheses for clarity.

      We have added “ΔBP<sub>ND</sub>” to the y-axis label for clarity.

      The choice of a sigmoid curve is the simplest clear fit, but it doesn't really consider the presence of the peak described in the paper. Would there be a way to fit the dynamic including fitting the peak?

      We agree that using a simple sigmoid curve for modeling expression dynamics is a limitation. In response to this and a similar comment from Reviewer #3, we tested a double logistic function (as suggested) to see if it better represented the rise and decline pattern. However, as described below, the original simple sigmoid curve was a better fit for the data. We have included a discussion regarding this limitation of this analysis. See Reviewer #3 recommendations (2) for details.

      The colour scheme in Figure 1C should be changed to make things clearer, and maybe use another dimension (like dotted lines) to separate hM4Di from hM3Dq.

      We have improved the visual clarity of Figure 1C by modifying the color scheme to represent vector construct and using distinct line types (dashed for hM4Di and solid for hM3Dq data) to separate DREADD type.

      (2) Figure 2

      I don't understand how the referencing to 100 was made: was it by selecting the overall peak value or the peak value observed between 40 and 80 days? If the former then I can't see how some values are higher than the peak. If the second then it means some peak values occurred after 80 days and data are not completely re-aligned.

      We thank the reviewer for the opportunity to clarify this point. The normalization was based on the peak value observed between 40–80 days post-injection, as this window typically captured the peak expression phase in our dataset (see Figure 1). However, in some long-term cases where PET scans were limited during this period—e.g., with one scan performing at day 40—it is possible that the actual peak occurred later. Therefore, instances where ΔBP<sub>ND</sub> values slightly exceeded the reference peak at later time points likely reflect this sampling limitation. We have clarified this methodological detail in the revised Results section to improve transparency.

      The methods section mentions the use of CNO but this is not in the main paper which seems to state that only DCZ was used: the authors should clarify this

      Although DCZ was the primary agonist used, CNO and C21 were also used in a few animals (e.g., monkeys #153, #221, and #207) for behavioral assessments. We have clarified this in the Results section and revised Figure 3 to indicate the specific agonist used for each subject. Additionally, we have updated the Methods section to clearly specify the use and dosage of DCZ, CNO, and C21, to avoid any confusion regarding the experimental design.

      Reviewer #3 (Public review): 

      Minor weaknesses are related to a few instances of suboptimal phrasing, and some room for improvement in time course visualization and quantification. These would be easily addressed in a revision. <br /> These findings will undoubtedly have a very significant impact on the rapidly growing but still highly challenging field of primate chemogenetic manipulations. As such, the work represents an invaluable resource for the community.

      We thank the reviewer for the positive assessment of our manuscript and for the constructive suggestions. We address each comment in the following point-by-point responses and have revised the manuscript accordingly.

      Reviewer #3 (Recommendations for the authors):

      (1) Please clarify the reasoning was, behind restricting the analysis in Figure 1 only to 7 monkeys with subcortical AAV injection?

      We focused the analysis shown in Figure 1 on 7 monkeys with subcortical AAV injections who received comparative injection volumes. These data were primary part of vector test studies, allowing for repeated PET scans within 150 days post-injection. In contrast, monkeys with cortical injections—including larger volumes—were allocated to behavioral studies and therefore were not scanned as frequently during the early phase. We will clarify this rationale in the Results section.

      (2) Figure 1: Not sure if a simple sigmoid is the best model for these, mostly peaking and then descending somewhat, curves. I suggest testing a more complex model, for instance, double logistic function of a type f(t) = a + b/(1+exp(-c*(t-d))) - e/(1+exp(-g*(t-h))), with the first logistic term modeling the rise to peak, and the second term for partial decline and stabilization

      We appreciate the reviewer’s thoughtful suggestion to use a double logistic function to better model both the rising and declining phases of the expression curve. In response to this and similar comments from Reviewer #1, we tested the proposed model and found that, while it could capture the peak and subsequent decline, the resulting fit appeared less biologically plausible (See below). Moreover, model comparison using BIC favored the original simple sigmoid model (BIC = 61.1 vs. 62.9 for the simple and double logistic model, respectively). This information has been included in the revised figure legend for clarity.

      Given these results, we retained the original simple sigmoid function in the revised manuscript, as it provides a sufficient and interpretable approximation of the early expression trajectory—particularly the peak expression-time estimation, which was the main purpose of this analysis. We have updated the Methods section to clarify our modeling and rationale as follows:

      Lines 530, "To model the time course of DREADD expression, we used a single sigmoid function, referencing past in vivo fluorescent measurements (Diester et al., 2011). Curve fitting was performed using least squares minimization. For comparison, a double logistic function was also tested and evaluated using the Bayesian Information Criterion (BIC) to assess model fit."

      We also acknowledge that a more detailed understanding of post-peak expression changes will require additional PET measurements, particularly between 60- and 120-days post-injection, across a larger number of animals. We have included this point in the revised Discussion to highlight the need for future work focused on finer-grained modeling of expression decline:

      Lines 317, “Although we modeled the time course of DREADD expression using a single sigmoid function, PET data from several monkeys showed a modest decline following the peak. While the sigmoid model captured the early-phase dynamics and offered a reliable estimate of peak timing, additional PET scans—particularly between 60- and 120-days post-injection—will be essential to fully characterize the biological basis of the post-peak expression trajectories.”

      Author response image 1.<br />

      (3) Figure 2: It seems that the individual curves are for different monkeys, I counted 7 in B and 8 in C, why "across 11 monkeys"? Were there several monkeys both with hM4Diand hM3Dq? Does not look like that from Table 1. Generally, I would suggest associating specific animals from Tables 1 and 2 to the panels in Figures 1 and 2.

      Some animals received multiple vector types, leading to more curves than individual subjects. We have revised the figure legends and updated Table 2 to explicitly relate each curve with the specific animal and brain region.

      (4) I also propose plotting the average of (interpolated) curves across animals, to convey the main message of the figure more effectively.

      We agree that plotting the mean of the interpolated expression curves would help convey the group trend. We added averaged curves to Figure 2BC.

      (5) Similarly, in line 155 "We assessed data from 17 monkeys to evaluate ... Monkeys expressing hM4Di were assessed through behavioral testing (N = 11) and alterations in neuronal activity using electrophysiology (N = 2)..." - please explain how 17 is derived from 11, 2, 5 and 1. It is possible to glean from Table 1 that it is the calculation is 11 (including 2 with ephys) + 5 + 1 = 17, but it might appear as a mistake if one does not go deep into Table 1.

      We have clarified in both the text and Table 1 that some monkeys (e.g., #201 and #207) underwent both behavioral and electrophysiological assessments, resulting in the overlapping counts. Specifically, the dataset includes 11 monkeys for hM4Di-related behavior testing (two of which underwent electrophysiology testing), 5 monkeys assessed for hM3Dq with FDG-PET, and 1 monkey assessed for hM3Dq with electrophysiology, totaling 19 assessments across 17 monkeys. We have revised the Results section to make this distinction more explicit to avoid confusion, as follows:

      Lines 164, "Monkeys expressing hM4Di (N = 11) were assessed through behavioral testing, two of which also underwent electrophysiological assessment. Monkeys expressing hM3Dq (N = 6) were assessed for changes in glucose metabolism via [<sup>18</sup>F]FDG-PET (N = 5) or alterations in neuronal activity using electrophysiology (N = 1).”

      (6) Line 473: "These stock solutions were then diluted in saline to a final volume of 0.1 ml (2.5% DMSO in saline), achieving a dose of 0.1 ml/kg and 3 mg/kg for DCZ and CNO, respectively." Please clarify: the injection volume was always 0.1 ml? then it is not clear how the dose can be 0.1 ml/kg (for a several kg monkey), and why DCZ and CNO doses are described in ml/kg vs mg/kg?

      We thank the reviewer for pointing out this ambiguity. We apologize for the oversight and also acknowledge that we omitted mention of C21, which was used in a small number of cases. To address this, we have revised the “Administration of DREADD agonist” section of the Methods to clearly describe the preparation, the volume, and dosage for each agonist (DCZ, CNO, and C21) as follows:

      Lines 493, “Deschloroclozapine (DCZ; HY-42110, MedChemExpress) was the primary agonist used. DCZ was first dissolved in dimethyl sulfoxide (DMSO; FUJIFILM Wako Pure Chemical Corp.) and then diluted in saline to a final volume of 1 mL, with the final DMSO concentration adjusted to 2.5% or less. DCZ was administered intramuscularly at a dose of 0.1 mg/kg for hM4Di activation, and at 1–3 µg/kg for hM3Dq activation. For behavioral testing, DCZ was injected approximately 15 min before the start of the experiment unless otherwise noted. Fresh DCZ solutions were prepared daily.

      In a limited number of cases, clozapine-N-oxide (CNO; Toronto Research Chemicals) or Compound 21 (C21; Tocris) was used as an alternative DREADD agonist for some hM4Di experiments. Both compounds were dissolved in DMSO and then diluted in saline to a final volume of 2–3 mL, also maintaining DMSO concentrations below 2.5%. CNO and C21 were administered intravenously at doses of 3 mg/kg and 0.3 mg/kg, respectively.”

      (7) Figure 5A: What do regression lines represent? Do they show a simple linear regression (then please report statistics such as R-squared and p-values), or is it related to the linear model described in Table 3 (but then I am not sure how separate DREADDs can be plotted if they are one of the factors)?

      We thank the reviewer for the insightful question. In the original version of Figure 5A, the regression lines represented simple linear fits used to illustrate the relationship between viral titer and peak expression levels, based on our initial analysis in which titer appeared to have a significant effect without any notable interaction with other factors (such as DREADD type).

      However, after conducting a more detailed analysis that incorporated injection volume as an additional factor and excluded cortical injections and statistical outliers (as suggested by Reviewer #1), viral titer was no longer found to significantly predict peak expression levels. Consequently, we revised the figure to focus on the effect of reporter tag, which remained the most consistent and robust predictor in our model.

      In the updated Figure 5, we have removed the relationship between viral titer and expression level with regression lines.

    1. Author response:

      The following is the authors’ response to the original reviews.

      Reviewer #1 (Public Review): 

      Summary: 

      The study by Klug et al. investigated the pathway specificity of corticostriatal projections, focusing on two cortical regions. Using a G-deleted rabies system in D1-Cre and A2a-Cre mice to retrogradely deliver channelrhodopsin to cortical inputs, the authors found that M1 and MCC inputs to direct and indirect pathway spiny projection neurons (SPNs) are both partially segregated and asymmetrically overlapping. In general, corticostriatal inputs that target indirect pathway SPNs are likely to also target direct pathway SPNs, while inputs targeting direct pathway SPNs are less likely to also target indirect pathway SPNs. Such asymmetric overlap of corticostriatal inputs has important implications for how the cortex itself may determine striatal output. Indeed, the authors provide behavioral evidence that optogenetic activation of M1 or MCC cortical neurons that send axons to either direct or indirect pathway SPNs can have opposite effects on locomotion and different effects on action sequence execution. The conclusions of this study add to our understanding of how cortical activity may influence striatal output and offer important new clues about basal ganglia function. 

      The conceptual conclusions of the manuscript are supported by the data, but the details of the magnitude of afferent overlap and causal role of asymmetric corticostriatal inputs on behavioral outcomes were not yet fully resolved. 

      We appreciate the reviewer’s thoughtful understanding and acknowledgment that the conceptual conclusion of asymmetric projections from the cortex to the striatum is well supported by our data. We also recognize the importance of further elucidating the extent of afferent overlap and the causal contributions of asymmetric corticostriatal inputs to behavioral outcomes. However, we respectfully note that current technical limitations pose significant challenges to addressing these questions with high precision.

      In response to the reviewer’s comments, we have now clarified the sample size, added proper analysis and elaborated on the experimental design to ensure that our conclusions are presented more transparently and are more accessible to the reader.

      After virally labeling either direct pathway (D1) or indirect pathway (D2) SPNs to optogenetically tag pathway-specific cortical inputs, the authors report that a much larger number of "non-starter" D2-SPNs from D2-SPN labeled mice responded to optogenetic stimulation in slices than "non-starter" D1 SPNs from D1-SPN labeled mice did. Without knowing the relative number of D1 or D2 SPN starters used to label cortical inputs, it is difficult to interpret the exact meaning of the lower number of responsive D2-SPNs in D1 labeled mice (where only ~63% of D1-SPNs themselves respond) compared to the relatively higher number of responsive D1-SPNs (and D2-SPNs) in D2 labeled mice. While relative differences in connectivity certainly suggest that some amount of asymmetric overlap of inputs exists, differences in infection efficiency and ensuing differences in detection sensitivity in slice experiments make determining the degree of asymmetry problematic. 

      Thank you for highlighting this point. As it lies at the core of our manuscript, we agree that it is essential to present it clearly and convincingly. As shown by the statistics (Fig. 2B-F), non-starter D1- and D2-SPNs appear to receive fewer projections from D1-projecting cortical neurons (Input D1-record D1, 0.63; Input D1-record D2, 0.40) compared to D2-projecting cortical neurons (Input D2 - record D1, 0.73; Input D2 -record D2, 0.79).

      While it is not technically feasible to quantify the number of infected cells in brain slices following electrophysiological recordings, we addressed this limitation by collecting data from multiple animals and restricting recordings to cells located within the injection sites. In Figure 2D, we used 7 mice in the D1-projecting to D1 EGFP(+) group, 8 mice in the D1-projecting to D2 EGFP(-) group, 10 mice in the D2-projecting to D2 EGFP(+) group, and 8 mice in the D2-projecting to D1 EGFP(-) group. In Figure 2G, the group sizes were as follows: 8 mice in the D1-projecting to D2 EGFP(+) group, 7 mice in the D1-projecting to D1 EGFP(-) group, 8 mice in the D2-projecting to D1 EGFP(+) group, and 10 mice in the D2-projecting to D2 EGFP(-) group. In both panels, connection ratios were compared using Fisher’s exact test. Comparisons were then made across experimental groups. Furthermore, as detailed in our Methods section (page 20, line 399-401), we assessed cortical expression levels prior to performing whole-cell recordings. Taken together, these precautions help ensure that the calculated connection ratios are unlikely to be confounded by differences in infection efficiency.

      It is also unclear if retrograde labeling of D1-SPN- vs D2-SPN- targeting afferents labels the same densities of cortical neurons. This gets to the point of specificity in the behavioral experiments. If the target-based labeling strategies used to introduce channelrhodopsin into specific SPN afferents label significantly different numbers of cortical neurons, might the difference in the relative numbers of optogenetically activated cortical neurons itself lead to behavioral differences? 

      Thank you for bringing this concern to our attention. While optogenetic manipulation has become a widely adopted tool in functional studies of neural circuits, it remains subject to several technical limitations due to the nature of its implementation. Factors such as opsin expression efficiency, optic fiber placement, light intensity, stimulation spread, and other variables can all influence the specificity and extent of neuronal activation or inhibition. As such, rigorous experimental controls are essential when interpreting the outcomes of optogenetic experiments.

      In our study, we verified both the expression of channelrhodopsin in D1- or D2-projecting cortical neurons and the placement of the optic fiber following the completion of behavioral testing. To account for variability, we compared the behavioral effects of optogenetic stimulation within the same animals, stimulated versus non-stimulated conditions, as shown in Figures 3 and 4. Moreover, Figure S3 includes important controls that rule out the possibility that the behavioral effects observed were due to direct activation of D1- or D2-SPNs in striatum or to light alone in the cortex.

      An additional point worth emphasizing is that the behavioral effects observed in the open field and ICSS tests cannot be attributed to differences in the number of neurons activated. Specifically, activation of D1-projecting cortical neurons promoted locomotion in the open field, whereas activation of D2-projecting cortical neurons did not. However, in the ICSS test, activation of both D1- and D2-projecting cortical neurons reinforced lever pressing. Given that only D1-SPN activation, but not D2-SPN activation, supports ICSS behavior, these effects are unlikely to result merely from differences in the number of neurons recruited.

      This rationale underlies our use of multiple behavioral paradigms to examine the functions of D1- and D2-projecting cortical neurons. By assessing behavior across distinct tasks, we aimed to approach the question from multiple angles and reduce the likelihood of spurious or confounding effects influencing our interpretation.

      In general, the manuscript would also benefit from more clarity about the statistical comparisons that were made and sample sizes used to reach their conclusions.

      We thank the reviewer for the valuable suggestion to improve the manuscript. In response, we have made the following changes and provided additional clarification:

      (1) In Figure 2D, we used 7 mice in the D1-projecting to D1 EGFP(+) group, 8 mice in the D1-projecting to D2 EGFP(-) group, 10 mice in the D2-projecting to D2 EGFP(+) group, and 8 mice in the D2-projecting to D1 EGFP(-) group. In Figure 2G, the group sizes were as follows: 8 mice in the D1-projecting to D2 EGFP(+) group, 7 mice in the D1-projecting to D1 EGFP(-) group, 8 mice in the D2-projecting to D1 EGFP(+) group, and 10 mice in the D2-projecting to D2 EGFP(-) group. In both panels, connection ratios were compared using Fisher’s exact test.

      (2) In Figure 3, we reanalyzed the data in panels O, P, R, and S using permutation tests to assess whether each individual group exhibited a significant ICSS learning effect. The figure legend has been revised accordingly as follows:

      (O-P) D1-SPN (red) but not D2-SPN stimulation (black) drives ICSS behavior in both the DMS (O: D1, n = 6, permutation test, slope = 1.5060, P = 0.0378; D2, n = 5, permutation test, slope = -0.2214, P = 0.1021; one-tailed Mann Whitney test, Day 7 D1 vs. D2, P = 0.0130) and the DLS (P: D1, n = 6, permutation test, slope = 28.1429, P = 0.0082; D2, n = 5, permutation test, slope = -0.3429, P = 0.0463; one-tailed Mann Whitney test, Day 7 D1 vs. D2, P = 0.0390). *, P < 0.05. (Q) Timeline of helper virus injections, rabies-ChR2 injections and optogenetic stimulation for ICSS behavior. (R-S) Optogenetic stimulation of the cortical neurons projecting to either D1- or D2-SPNs induces ICSS behavior in both the MCC (R: MCC-D1, n = 5, permutation test, Day1-Day7, slope = 2.5857, P = 0.0034; MCC-D2, n = 5, Day2-Day7, permutation test, slope = 1.4229, P = 0.0344; no significant effect on Day7, MCC-D1 vs. MCC-D2,  two-tailed Mann Whitney test, P = 0.9999) and the M1 (S: M1-D1, n = 5, permutation test, Day1-Day7, slope = 1.8214, P = 0.0259; M1-D2, n = 5, Day1-Day7, permutation test, slope = 1.8214, P = 0.0025; no significant effect on Day7, M1-D1 vs. M1-D2, two-tailed Mann Whitney test, P = 0.3810). n.s., not statistically significant.

      (3) In Figure 4, we have added a comparison against a theoretical percentage change of zero to better evaluate the net effect of each manipulation. The results showed that in Figure 4D, optogenetic stimulation of D1-projecting MCC neurons significantly increased the pressing rate, whereas stimulation of D2-projecting MCC neurons did not (MCC-D1: n = 8, one-sample two-tailed t-test, t = 2.814, P = 0.0131; MCC-D2: n = 7, t = 0.8481, P = 0.4117). In contrast, in Figure 4H, optogenetic stimulation of both D1- and D2-projecting M1 neurons significantly increased the sequence press rate (M1-D1: n = 6, one-sample two-tailed Wilcoxon signed-rank test, P = 0.0046; M1-D2: n = 7, P = 0.0479).

      Reviewer #2 (Public Review):

      Summary: 

      Klug et al. use monosynaptic rabies tracing of inputs to D1- vs D2-SPNs in the striatum to study how separate populations of cortical neurons project to D1- and D2-SPNs. They use rabies to express ChR2, then patch D1-or D2-SPNs to measure synaptic input. They report that cortical neurons labeled as D1-SPN-projecting preferentially project to D1-SPNs over D2-SPNs. In contrast, cortical neurons labeled as D2-SPN-projecting project equally to D1- and D2-SPNs. They go on to conduct pathway-specific behavioral stimulation experiments. They compare direct optogenetic stimulation of D1- or D2-SPNs to stimulation of MCC inputs to DMS and M1 inputs to DLS. In three different behavioral assays (open field, intra-cranial self-stimulation, and a fixed ratio 8 task), they show that stimulating MCC or M1 cortical inputs to D1-SPNs is similar to D1-SPN stimulation, but that stimulating MCC or M1 cortical inputs to D2-SPNs does not recapitulate the effects of D2-SPN stimulation (presumably because both D1- and D2-SPNs are being activated by these cortical inputs). 

      Strengths: 

      Showing these same effects in three distinct behaviors is strong. Overall, the functional verification of the consequences of the anatomy is very nice to see. It is a good choice to patch only from mCherry-negative non-starter cells in the striatum.

      Thank you for your profound understanding and appreciation of our manuscript’s design and the methodologies employed. In the realm of neuroscience, quantifying synaptic connections is a formidable challenge. While the roles of the direct and indirect pathways in motor control have long been explored, the mechanism by which upstream cortical inputs govern these pathways remains shrouded in mystery at the circuitry level.

      In the ‘Go/No-Go’ model, the direct and indirect pathways operate antagonistically; in contrast, the ‘Co-activation’ model suggests that they work cooperatively to orchestrate movement. These distinct theories raise a compelling question: Do these two pathways receive inputs from the same upstream cortical neurons, or are they modulated by distinct subpopulations? Answering this question could provide vital clues as to whether these pathways collaborate or operate independently.

      Previous studies have revealed both differences and similarities in the cortical inputs to direct and indirect pathways at population level. However, our investigation delves deeper to understand how a singular cortical input simultaneously drives these pathways, or might it regulate one pathway through distinct subpopulations? To address this, we employed rabies virus–mediated retrograde tracing from D1- or D2-SPNs and recorded non-starter SPNs to determine if they receive the same inputs as the starter SPNs. This approach allowed us to calculate the connection ratio and estimate the probable connection properties.

      Weaknesses: 

      One limitation is that all inputs to SPNs are expressing ChR2, so they cannot distinguish between different cortical subregions during patching experiments. Their results could arise because the same innervation patterns are repeated in many cortical subregions or because some subregions have preferential D1-SPN input while others do not.

      Thank you for raising this thoughtful concern. It is indeed not feasible to restrict ChR2 expression to a specific cortical region using the first-generation rabies-ChR2 system alone. A more refined approach would involve injecting Cre-dependent TVA and RG into the striatum of D1- or A2A-Cre mice, followed by rabies-Flp infection. Subsequently, a Flp-dependent ChR2 virus could be injected into the MCC or M1 to selectively label D1- or D2-projecting cortical neurons. This strategy would allow for more precise targeting and address many of the current limitations.

      However, a significant challenge lies in the cytotoxicity associated with rabies virus infection. Neuronal health begins to deteriorate substantially around 10 days post-infection, which provides an insufficient window for robust Flp-dependent ChR2 expression. We have tested several new rabies virus variants with extended survival times (Chatterjee et al., 2018; Jin et al., 2024), but unfortunately, they did not perform effectively or suitably in the corticostriatal systems we examined.

      In our experimental design, the aim is to delineate the connectivity probabilities to D1 or D2-SPNs from cortical neurons. Our hypothesis considered includes the possibility that similar innervation patterns could occur across multiple cortical subregions, or that some subregions might show preferential input to D1-SPNs while others do not, or a combination of both scenarios. This leads us to perform a series behavior test that using optogenetic activation of the D1- or D2-projecting cortical populations to see which could be the case.

      In the cortical areas we examined, MCC and M1, during behavioral testing, there is consistency with our electrophysiological results. Specifically, when we stimulated the D1-projecting cortical neurons either in MCC or in M1, mice exhibited facilitated local motion in open field test, which is the same to the activation of D1 SPNs in the striatum along (MCC: Fig 3C & D vs. I; M1: Fig 3F & G vs. L). Conversely, stimulation of D2-projecting MCC or M1 cortical neurons resulted in behavioral effects that appeared to combine characteristics of both D1- and D2-SPNs activation in the striatum (MCC: Fig 3C & D vs. J; M1: Fig 3F & G vs. M). The similar results were observed in the ICSS test. Our interpretation of these results is that the activation of D1-projecting neurons in the cortex induces behavior changes akin to D1 neuron activation, while activation of D2-projecting neurons in the cortex leads to a combined effect of both D1 and D2 neuron activation. This suggests that at least some cortical regions, the ones we tested, follow the hypothesis we proposed.

      There are also some caveats with respect to the efficacy of rabies tracing. Although they only patch non-starter cells in the striatum, only 63% of D1-SPNs receive input from D1-SPN-projecting cortical neurons. It's hard to say whether this is "high" or "low," but one question is how far from the starter cell region they are patching. Without this spatial indication of where the cells that are being patched are relative to the starter population, it is difficult to interpret if the cells being patched are receiving cortical inputs from the same neurons that are projecting to the starter population. Convergence of cortical inputs onto SPNs may vary with distance from the starter cell region quite dramatically, as other mapping studies of corticostriatal inputs have shown specialized local input regions can be defined based on cortical input patterns (Hintiryan et al., Nat Neurosci, 2016, Hunnicutt et al., eLife 2016, Peters et al., Nature, 2021).

      This is a valid concern regarding anatomical studies. Investigating cortico-striatal connectivity at the single-cell level remains technically challenging due to current methodological limitations. At present, we rely on rabies virus-mediated trans-synaptic retrograde tracing to identify D1- or D2-projecting cortical populations. This anatomical approach is coupled with ex vivo slice electrophysiology to assess the functional connectivity between these projection-defined cortical neurons and striatal SPNs. This enables us to quantify connection ratios, for example, the proportion of D1-projecting cortical neurons that functionally synapse onto non-starter D1-SPNs.

      To ensure the robustness of our conclusions, it is essential that both the starter cells and the recorded non-starter SPNs receive comparable topographical input from the cortex and other brain regions. Therefore, we carefully designed our experiments so that all recorded cells were located within the injection site, were mCherry-negative (i.e., non-starter cells), and were surrounded by ChR2-mCherry-positive neurons. This configuration ensured that the distance between recorded and starter cells did not exceed 100 µm, maintaining close anatomical proximity and thereby preserving the likelihood of shared cortical innervation within the examined circuitry.

      These methodological details are also described in the section on ex vivo brain slice electrophysiology, specifically in the Methods section, lines 396–399:

      “D1-SPNs (eGFP-positive in D1-eGFP mice, or eGFP-negative in D2-eGFP mice) or D2-SPNs (eGFP-positive in D2-eGFP mice, or eGFP-negative in D1-eGFP mice) that were ChR2-mCherry-negative, but in the injection site and surrounded by cells expressing ChR2-mCherry were targeted for recording.”

      This experimental strategy was implemented to control for potential spatial biases and to enhance the interpretability of our connectivity measurements.

      A caveat for the optogenetic behavioral experiments is that these optogenetic experiments did not include fluorophore-only controls.

      Thank you for bringing this to our attention. A fluorophore-only control is indeed a valuable negative control, commonly used to rule out effects caused by light exposure independent of optogenetic manipulation. In this study, however, comparisons were made between light-on and light-off conditions within the same animal. This within-subject design, as employed in recent studies (Geddes et al., 2018; Zhu et al., 2025), is considered sufficient to isolate the effects of optogenetic manipulation.

      Furthermore, as shown in Figure S3, we conducted an additional control experiment in which optogenetic stimulation was applied to M1, while ensuring that ChR2 expression was restricted to the striatum via targeted viral infection. This approach serves as a functional equivalent to the control you suggested. Importantly, we observed no effects that could be attributed solely to light exposure, further supporting the conclusion that the observed outcomes in our main experiments are due to targeted optogenetic manipulation, rather than confounding effects of illumination.

      Lastly, by employing an in-animal comparison, measuring changes between stimulated and non-stimulated trials, we account for subject-specific variability and strengthen the interpretability of our findings.

      Another point of confusion is that other studies (Cui et al, J Neurosci, 2021) have reported that stimulation of D1-SPNs in DLS inhibits rather than promotes movement.

      Thank you for bringing the study by Cui and colleagues to our attention. While that study has generated some controversy, other independent investigations have demonstrated that activation of D1-SPNs in DLS facilitates local motion and lever-press behaviors (Dong et al., 2025; Geddes et al., 2018; Kravitz et al., 2010).

      It is still worth to clarify. The differences in behavioral outcomes observed between our study and that of Cui et al. may be attributable to several methodological factors, including differences in both the stereotaxic targeting coordinates and the optical fiber specifications used for stimulation.

      Specifically, in our experiments, the dorsomedial striatum (DMS) was targeted at coordinates AP +0.5 mm, ML ±1.5 mm, DV –2.2 mm, and the DLS at AP +0.5 mm, ML ±2.5 mm, DV –2.2 mm. In contrast, Cui et al. targeted the DMS at AP +0.9 mm, ML ±1.4 mm, DV –3.0 mm and the DLS at AP +0.7 mm, ML ±2.3 mm, DV –3.0 mm. These coordinates correspond to sites that are slightly more rostral and ventral compared to our own. Even subtle differences in anatomical targeting can result in activation of distinct neuronal subpopulations, which may account for the differing behavioral effects observed during optogenetic stimulation.

      In addition, the optical fibers used in the two studies varied considerably. We employed fibers with a 200 µm core diameter and a numerical aperture (NA) of 0.37, whereas Cui et al. used fibers with a 250 µm core diameter and a higher NA of 0.66. The combination of a larger core and higher NA in their setup implies a broader spatial spread and deeper tissue penetration of light, likely resulting in activation of a larger neural volume. This expanded volume of stimulation may have engaged additional neural circuits not recruited in our experiments, further contributing to the divergent behavioral outcomes. Taken together, these differences in targeting and photostimulation parameters are likely key contributors to the distinct effects reported between the two studies.

      Reviewer #3 (Public Review): 

      In the manuscript by Klug and colleagues, the investigators use a rabies virus-based methodology to explore potential differences in connectivity from cortical inputs to the dorsal striatum. They report that the connectivity from cortical inputs onto D1 and D2 MSNs differs in terms of their projections onto the opposing cell type, and use these data to infer that there are differences in cross-talk between cortical cells that project to D1 vs. D2 MSNs. Overall, this manuscript adds to the overall body of work indicating that there are differential functions of different striatal pathways which likely arise at least in part by differences in connectivity that have been difficult to resolve due to difficulty in isolating pathways within striatal connectivity and several interesting and provocative observations were reported. Several different methodologies are used, with partially convergent results, to support their main points.

      However, I have significant technical concerns about the manuscript as presented that make it difficult for me to interpret the results of the experiments. My comments are below.

      Major:

      There is generally a large caveat to the rabies studies performed here, which is that both TVA and the ChR2-expressing rabies virus have the same fluorophore. It is thus essentially impossible to determine how many starter cells there are, what the efficiency of tracing is, and which part of the striatum is being sampled in any given experiment. This is a major caveat given the spatial topography of the cortico-striatal projections. Furthermore, the authors make a point in the introduction about previous studies not having explored absolute numbers of inputs, yet this is not at all controlled in this study. It could be that their rabies virus simply replicates better in D1-MSNs than D2-MSNs. No quantifications are done, and these possibilities do not appear to have been considered. Without a greater standardization of the rabies experiments across conditions, it is difficult to interpret the results.

      We thank the reviewer for raising these questions, which merit further discussion.

      Firstly, the primary aim of our study is to investigate the connectivity of the corticostriatal pathway. Given the current technical limitations, it is not feasible to trace all the striatal SPNs connected to a single cortical neuron. Therefore, we approached this from the opposite direction, starting from D1- or D2-SPNs to retrogradely label upstream cortical neurons, and then identifying their connected SPNs via functional synaptic recordings. To achieve this, we employed the only available transsynaptic retrograde method: rabies virus-mediated tracing. Because we crossed D1- or D2-GFP mice with D1- or A2A-Cre mice to identify SPN subtypes during electrophysiological recordings, the conventional rabies-GFP system could not be used to distinguish starter cells without conflicting with the GFP labeling of SPNs. To overcome this, we tagged ChR2 expression with mCherry. In this setup, we recorded from mCherry-negative D1- or D2-SPNs within the injection site and surrounded by mCherry-positive neurons. This ensures that the recorded neurons are topographically matched to the starter cell population and receive input from the same cortical regions. We acknowledge that TVA-only and ChR2-expressing cells are both mCherry-positive and therefore indistinguishable in our system. As such, mCherry-positive cells likely comprise a mixture of starter cells and TVA-only cells, representing a somewhat broader population than starter cells alone. Nevertheless, by restricting recordings to mCherry-negative SPNs within the injection site, it is ensured that our conclusions about functional connectivity remain valid and aligned with the primary objective of this study.

      Secondly, if rabies virus replication were significantly more efficient in D1-SPNs than in D2-SPNs, this would likely result in a higher observed connection probability in the D1-projecting group. However, we used consistent genetic strategies across all groups: D1-SPNs were defined as GFP-positive in D1-GFP mice and GFP-negative in D2-GFP mice, with D2-SPNs defined analogously. Recordings from both D1- and D2-SPNs were performed using the same methodology and under the same injection conditions within the same animals. This internal control helps mitigate the possibility that differential rabies infection efficiency biased our results.

      With these experimental safeguards in place, we found that 40% of D2-SPNs received input from D1-SPN-projecting cortical neurons, while 73% of D1-SPNs received input from D2-SPN-projecting cortical neurons. Although the ideal scenario would involve an even larger sample size to refine these estimates, the technical demands of post-rabies-infection electrophysiological recordings inherently limit throughput. Nonetheless, our approach represents the most feasible and accurate method currently available, and provides a significant advance in characterizing the functional connectivity within corticostriatal circuits.

      The authors claim using a few current clamp optical stimulation experiments that the cortical cells are healthy, but this result was far from comprehensive. For example, membrane resistance, capacitance, general excitability curves, etc are not reported. In Figure S2, some of the conditions look quite different (e.g., S2B, input D2-record D2, the method used yields quite different results that the authors write off as not different). Furthermore, these experiments do not consider the likely sickness and death that occurs in starter cells, as has been reported elsewhere. The health of cells in the circuit is overall a substantial concern that alone could invalidate a large portion, if not all, of the behavioral results. This is a major confound given those neurons are thought to play critical roles in the behaviors being studied. This is a major reason why first-generation rabies viruses have not been used in combination with behavior, but this significant caveat does not appear to have been considered, and controls e.g., uninfected animals, infected with AAV helpers, etc, were not included.

      We understand and appreciate the reviewer’s concern regarding the potential cytotoxicity of rabies virus infection. Indeed, this is a critical consideration when interpreting functional connectivity data. We have tested several newer rabies virus variants reported to support extended survival times (Chatterjee et al., 2018; Jin et al., 2024), but unfortunately, these variants did not perform reliably in the corticostriatal circuits we examined.

      Given these limitations, we relied on the rabies virus approach originally developed by Osakada et al. (Osakada et al., 2011), which demonstrated that neurons infected with rabies virus expressing ChR2 remain both viable and functional up to at least 10 days post-infection (Fig. 3, cited below). In our own experiments, we further validated the health and viability of cortical neurons, the presynaptic partners of SPNs, particularly around day 7 post-infection.

      To minimize the risk of viral toxicity, we performed ex vivo slice recordings within a conservative time window, between 4 and 8 days after infection, when the health of labeled neurons is well maintained. Moreover, the recorded SPNs were consistently mCherry-negative, indicating they were not directly infected by rabies virus, thus further reducing the likelihood of recording from compromised cells.

      Taken together, these steps help ensure that our synaptic recordings reflect genuine functional connectivity, rather than artifacts of viral toxicity. We hope this clarifies the rationale behind our experimental design.

      For the behavioral tests, including a naïve uninfected group and an AAV helper virus-only group as negative controls could be beneficial to isolate the specific impact of rabies virus infection. However, our primary focus is on the activation of selected presynaptic inputs to D1- or D2-SPNs by optogenetic method. Therefore, comparing stimulated versus non-stimulated trials within the same animal offers more direct and relevant results for our study objectives.

      It is also important to note that the ICSS test is particularly susceptible to the potential cytotoxic effects of rabies virus, as it spans a relatively extended period, from Day 4 to Day 12 post-infection. To mitigate this issue, we focused our analysis on the first 7 days of ICSS testing, thereby keeping the behavioral observations within 10 days post-rabies injection. This approach minimizes potential confounds from rabies-induced neurotoxicity while still capturing the relevant behavioral dynamics. Accordingly, we have revised Figure 3 and updated the statistical analyses to reflect this adjustment.

      The overall purity (e.g., EnvA-pseudotyping efficiency) of the RABV prep is not shown. If there was a virus that was not well EnvA-pseudotyped and thus could directly infect cortical (or other) inputs, it would degrade specificity.

      We agree that anatomical specificity is crucial for accurately labeling inputs to defined SPN populations in our study. The rabies virus strain employed here has been rigorously validated for its specificity in numerous previous studies from our group and others (Aoki et al., 2019; Klug et al., 2018; Osakada et al., 2011; Smith et al., 2016; Wall et al., 2013; Wickersham et al., 2007). For example, in a recent study by Aoki et al. (Aoki et al., 2019), we tested the same rabies virus strain by co-injecting the glycoprotein-deleted rabies virus and the TVA-expressing helper virus, without glycoprotein expressing AAV, into the SNr. As shown in Figure S1 (related to Figure 2), GFP expression was restricted to starter cells within the SNr, with no evidence of transsynaptic labeling in upstream regions such as the striatum, EPN, GPe, or STN (see panels F–H). These findings provide strong evidence that the rabies virus used in our experiments is properly pseudotyped and exhibits high specificity for starter cell labeling without off-target spread.

      We appreciate the reviewer’s emphasis on specificity, and we hope this clarification further supports the reliability of our anatomical tracing approach.

      While most of the study focuses on the cortical inputs, in slice recordings, inputs from the thalamus are not considered, yet likely contribute to the observed results. Related to this, in in vivo optogenetic experiments, technically, if the thalamic or other inputs to the dorsal striatum project to the cortex, their method will not only target cortical neurons but also terminals of other excitatory inputs. If this cannot be ruled it, stating that the authors are able to selectively activate the cortical inputs to one or the other population should be toned down.

      We agree with the reviewer that the thalamus is also a significant source of excitatory input to the striatum. However, current techniques do not allow for precise and exclusive labeling of upstream neurons in a given brain region, such as the cortex or thalamus. This technical limitation indeed makes it difficult to definitively determine whether inputs from these regions follow the same projection rules. Despite this, our findings show that stimulation of defined cortical populations, specifically, D1- or D2-projecting neurons in MCC and M1, elicits behavioral outcomes that closely mirror those observed in our ex vivo slice recordings, providing strong support for the cortical origin of the effects we observed.

      In our in vivo optogenetic experiments, we acknowledge that stimulating a specific cortical region may also activate axonal terminals from rabies-infected cortical or thalamic neurons. While somatic stimulation is generally more effective than terminal stimulation, we recognize the possibility that terminals on non-rabies-traced cortical neurons could be activated through presynaptic connections. To address this, we considered the finding of a previous study (Cruikshank et al., 2010), which demonstrated that while brief optogenetic stimulation (0.05 ms) of thalamo-cortical terminals can elicit few action potentials in postsynaptic cortical neurons, sustained terminal stimulation (500 ms) also results in only transient postsynaptic firing rather than prolonged activation (Fig. 3C, cited below). This suggests that cortical neurons exhibit only short-lived responses to continuous presynaptic stimulation of thalamic origin.

      In comparison, our behavioral paradigms employed prolonged optogenetic stimulation protocols- 20 Hz, 10 ms pulses for 15 s (open-field test), 1 s (ICSS), and 8 s (FR4/8)—which more closely resemble sustained stimulation conditions. Given these parameters, and the robust behavioral responses observed, it means that the effects are primarily mediated by activation of rabies-labeled, ChR2-expressing D1- or D2-projecting cortical neurons rather than indirect activation through thalamic input.

      We appreciate the reviewer’s valuable comment, and we have now incorporated this point into the revised manuscript (page 13, line 265 to 275) to more clearly address the potential contribution of thalamic inputs in our experimental design.

      The statements about specificity of connectivity are not well-founded. It may be that in the specific case where they are assessing outside of the area of injections, their conclusions may hold (e.g., excitatory inputs onto D2s have more inputs onto D1s than vice versa). However, how this relates to the actual site of injection is not clear. At face value, if such a connectivity exists, it would suggest that D1-MSNs receive substantially more overall excitatory inputs than D2s. It is thus possible that this observation would not hold over other spatial intervals. This was not explored and thus the conclusions are over-generalized. e.g., the distance from the area of red cells in the striatum to recordings was not quantified, what constituted a high level of cortical labeling was not quantified, etc. Without more rigorous quantification of what was being done, it is difficult to interpret the results. 

      We sincerely thank the reviewer for the thoughtful comments and critical insights into our interpretation of connectivity data. These concerns are valid and provide an important opportunity to clarify and reinforce our experimental design and conclusions.

      Firstly, as described in our previous response, all patched neurons were carefully selected to be within the injection site and in close proximity to ChR2-mCherry-positive cells. Specifically, the estimated distance from each recorded neuron to the nearest starter cells did not exceed 100 µm. This design choice was made to minimize variability associated with spatial distance or heterogeneity in viral expression, thereby allowing for a more consistent sampling of putatively connected neurons.

      Secondly, quantifying both the number of starter and input neurons would, in principle, provide a more comprehensive picture of connectivity. However, given the technical limitations of the current approach particularly when combining rabies tracing with functional recordings it is not feasible to obtain such precise cell counts. Instead, we focused on connection ratios derived from targeted electrophysiological recordings, which offer a reliable and practical means of estimating connectivity within these defined circuits.

      Thirdly, regarding the potential influence of rabies-labeled neurons beyond the immediate recording site: while we acknowledge that rabies tracing labels a broad set of upstream neurons, our analysis was confined to a well-defined and localized area. The analogy we find helpful here is that of a spotlight - our recordings were restricted to the illuminated region directly under the beam, where the projection pattern is fixed and interpretable, regardless of what lies outside that area. Although we cannot fully account for all possible upstream connections, our methodology was designed to minimize variability and maintain consistency in the region of interest, which we believe supports the robustness of our conclusions in the ex vivo slice recording experiment.

      We hope this additional explanation addresses the reviewer’s concerns and helps clarify the rationale of our experimental strategy.

      The results in figure 3 are not well controlled. The authors show contrasting effects of optogenetic stimulation of D1-MSNs and D2-MSNs in the DMS and DLS, results which are largely consistent with the canon of basal ganglia function. However, when stimulating cortical inputs, stimulating the inputs from D1-MSNs gives the expected results (increased locomotion) while stimulating putative inputs to D2-MSNs had no effect. This is not the same as showing a decrease in locomotion - showing no effect here is not possible to interpret.

      We apologize for any confusion and appreciate the opportunity to clarify this point. Our electrophysiological recordings demonstrated that D1-projecting cortical neurons preferentially innervate D1-SPNs in the striatum, whereas D2-projecting cortical neurons provide input to both D1- and D2-SPNs, without a clear preference. These synaptic connectivity patterns are further supported by our behavioral experiments: optogenetic stimulation of D1-projecting neurons in cortical areas such as MCC and M1 led to behavioral effects consistent with direct D1-SPN activation. In contrast, stimulation of D2-projecting cortical neurons produced behavioral outcomes that appeared to reflect a mixture of both D1- and D2-SPN activation.

      We acknowledge that interpreting negative behavioral findings poses inherent challenges, as it is difficult to distinguish between a true lack of effect and insufficient experimental manipulation. To mitigate this, we ensured that all animals included in the analysis exhibited appropriate viral expression and correctly placed optic fibers in the targeted regions. These controls help to confirm that the observed behavioral effects - or lack thereof - are indeed due to the activation of the intended neuronal populations rather than technical artifacts such as weak expression or fiber misplacement.

      As shown in Author response image 1 below, our verification of virus expression and fiber positioning confirms effective targeting in MCC and M1 of A2A-Cre mice. Therefore, we interpret the negative behavioral outcomes as meaningful consequences of specific neural circuit activation.

      Author response image 1.

      Confocal image from A2A-Cre mouse showing targeted optogenetic stimulation of D2-projecting cortical neurons in MCC or M1. ChR2-mCherry expression highlights D2-projecting neurons, selectively labeled via rabies-mediated tracing. Optic fiber placement is confirmed above the cortical region of interest. Image illustrates robust expression and anatomical specificity necessary for pathway-selective stimulation in behavioral assays.

      In light of their circuit model, the result showing that inputs to D2-MSNs drive ICSS is confusing. How can the authors account for the fact that these cells are not locomotor-activating, stimulation of their putative downstream cells (D2-MSNs) does not drive ICSS, yet the cortical inputs drive ICSS? Is the idea that these inputs somehow also drive D1s? If this is the case, how do D2s get activated, if all of the cortical inputs tested net activate D1s and not D2s? Same with the results in figure 4 - the inputs and putative downstream cells do not have the same effects. Given the potential caveats of differences in viral efficiency, spatial location of injections, and cellular toxicity, I cannot interpret these experiments.

      We apologize for any confusion in our previous explanation. In our behavioral experiments, the primary objective was to determine whether activation of D1- or D2-projecting cortical neurons would produce behavioral outcomes distinct from those observed with pure D1 or D2 activation.

      Our findings show that stimulation of D1-projecting cortical neurons produced behavioral effects closely resembling those of selective D1 activation in both open field and ICSS tests. This is consistent with our slice recording data, which revealed that D1-projecting cortical neurons exhibit a higher connection probability with D1-SPNs than with D2-SPNs.

      In contrast, interpreting the effects of D2-projecting cortical neuron stimulation is inherently more nuanced. In the open field test, activation of these neurons did not significantly modulate local motion. This could reflect a balanced influence of D1 activation, which facilitates movement, and D2 activation, which suppresses it - resulting in a net neutral behavioral outcome. In the ICSS test, the absence of a strong reinforcement effect typically associated with D2 activation, combined with partial reinforcement likely due to concurrent D1 activation, suggests that stimulation of D2-projecting neurons produces a mixed behavioral signal. This outcome supports the interpretation that these neurons synapse onto both D1- and D2-SPNs, leading to a blended behavioral response that differs from selective D1 or D2 activation alone.

      Together, these two behavioral assays offer complementary perspectives, providing a more complete view of how projection-specific cortical inputs influence striatal output and behavior.

      In Figure 4 of the current manuscript (as cited below), we show that optogenetic activation of MCC neurons projecting to D1-SPNs facilitates sequence lever pressing, whereas activation of MCC neurons projecting to D2-SPNs does not induce significant behavioral changes. Conversely, activation of M1 neurons projecting to either D1- or D2-SPNs enhances lever pressing sequences. These observations align with our prior findings (Geddes et al., 2018; Jin et al., 2014), where we demonstrated that in the striatum, D1-SPN activation facilitates ongoing lever pressing, whereas D2-SPN activation is more involved in suppressing ongoing actions and promoting transitions between sub-sequences, shown in Fig. 4 from (Geddes et al., 2018; Jin et al., 2014) and Fig. 5K from (Jin et al., 2014) . Taken together, the facilitation of lever pressing by D1-projecting MCC and M1 neurons is consistent with their preferential connectivity to D1-SPNs and their established behavioral role.

      What is particularly intriguing, though admittedly more complex, is the behavioral divergence observed upon activation of D2-SPN-projecting cortical neurons. Activation of D2-projecting MCC neurons does not alter lever pressing, possibly reflecting a counterbalancing effect from concurrent D1- and D2-SPN activation. In contrast, stimulation of D2-projecting M1 neurons facilitates lever pressing, albeit less robustly than their D1-projecting counterparts. This discrepancy may reflect regional differences in striatal targets, DMS for MCC versus DLS for M1, as also supported by our open field test results. Furthermore, our recent findings (Zhang et al., 2025) show that synaptic strength from Cg to D2-SPNs is stronger than to D1-SPNs, whereas the M1 pathway exhibits the opposite pattern. These data suggest that beyond projection ratios, synaptic strength also shapes cortico-striatal functional output. Thus, stronger D2-SPN synapses in the DMS may offset D1-SPN activation during MCC-D2 stimulation, dampening lever pressing increase. Conversely, weaker D2 synapses in the DLS may permit M1-D2 projections to facilitate behavior more readily.

      In summary, the behavioral outcomes of our optogenetic manipulations support the proposed asymmetric cortico-striatal connectivity model. While the effects of D2-projecting neurons are not uniform, they reflect varying balances of D1 and D2-SPN influence, which further underscores the asymmetrical connections of cortical inputs to the striatum.

      Recommendations For The Authors:

      Reviewer #1 (Recommendations For The Authors): 

      (1) What are the sample sizes for Fig S2? Some trends that are listed as nonsignificant look like they may just be underpowered. Related to this point, S2C indicates that PPR is statistically similar in all conditions. The traces shown in Figure 2 suggest that PPR is quite different in "Input D1"- vs "Input D2" projections. If there is indeed no difference, the exemplar traces should be replaced with more representative ones to avoid confusion. 

      Thank you for your suggestion. The sample size reported in Figure S2 corresponds to the neurons identified as connected in Figure 2. The representative traces shown in Figure 2 were selected based on their close alignment with the amplitude statistics and are intended to reflect typical responses. Given this, it is appropriate to retain the current examples as they accurately illustrate the underlying data.

      (2) Previous studies have described that SPN-SPN collateral inhibition is also asymmetric, with D2->D1 SPN connectivity stronger than the other direction. While cortical inputs to D2-SPNs may also strongly innervate D1-SPNs, it would be helpful to speculate on how collateral inhibition may further shape the biases (or lack thereof) reported here. 

      This would indeed be an interesting topic to explore. SPN-SPN mutual inhibition and/or interneuron inhibition may also play a role in the functional organization and output of the striatum. In the present study, we focused on the primary layer of cortico-striatal connectivity to examine how cortical neurons selectively connect to the striatal direct and indirect pathways, as these pathways have been shown to have distinct yet cooperative functions. To achieve this, we applied a GABAA receptor inhibitor to isolate only excitatory synaptic currents in SPNs, yielding the relevant results.

      To investigate additional circuit organization involving SPN-SPN mutual inhibition, the current available technique would involve single-cell initiated rabies tracing. This approach would help identify the starter SPN and the upstream SPNs that provide input to the starter cell, thereby offering a clearer understanding of the local circuit.

      (3) In Fig 3N-S there are no stats confirming that optogenetic stimulation does indeed increase lever pressing in each group (though it obviously looks like it does). It would be helpful to add statistics for this comparison, in addition to the between-group comparisons that are shown. 

      We thank the reviewer for this thoughtful suggestion. To assess whether optogenetic stimulation increases lever pressing in each group shown in Figures 3O, 3P, 3R, and 3S, we employed a permutation test (10,000 permutations). This non-parametric statistical method does not rely on assumptions about the underlying data distribution and is particularly appropriate for our analysis given the relatively small sample sizes.

      Additionally, in response to Reviewer 3’s concern regarding the potential cytotoxicity of rabies virus affecting behavioral outcomes during in vivo optogenetic stimulation experiments, we focused our analysis on Days 1 through 7 of the ICSS test. This time window remains within 10 days post-rabies infection, a period during which previous studies have reported minimal cytopathic effects (Osakada et al., 2011).

      Accordingly, we have updated Figure 3N-S and revised the associated statistical analyses in the figure legend as follows:

      (O-P) D1-SPN (red) but not D2-SPN stimulation (black) drives ICSS behavior in both the DMS (O: D1, n = 6, permutation test, slope = 1.5060, P = 0.0378; D2, n = 5, permutation test, slope = -0.2214, P = 0.1021; one-tailed Mann Whitney test, Day 7 D1 vs. D2, P = 0.0130) and the DLS (P: D1, n = 6, permutation test, slope = 28.1429, P = 0.0082; D2, n = 5, permutation test, slope = -0.3429, P = 0.0463; one-tailed Mann Whitney test, Day 7 D1 vs. D2, P = 0.0390). *, P < 0.05. (Q) Timeline of helper virus injections, rabies-ChR2 injections and optogenetic stimulation for ICSS behavior. (R-S) Optogenetic stimulation of the cortical neurons projecting to either D1- or D2-SPNs induces ICSS behavior in both the MCC (R: MCC-D1, n = 5, permutation test, Day1-Day7, slope = 2.5857, P = 0.0034; MCC-D2, n = 5, Day2-Day7, permutation test, slope = 1.4229, P = 0.0344; no significant effect on Day7, MCC-D1 vs. MCC-D2,  two-tailed Mann Whitney test, P = 0.9999) and the M1 (S: M1-D1, n = 5, permutation test, Day1-Day7, slope = 1.8214, P = 0.0259; M1-D2, n = 5, Day1-Day7, permutation test, slope = 1.8214, P = 0.0025; no significant effect on Day7, M1-D1 vs. M1-D2, two-tailed Mann Whitney test, P = 0.3810). n.s., not statistically significant.

      We believe this updated analysis and additional context further strengthen the validity of our conclusions regarding the reinforcement effects.

      (4) Line 206: mice were trained for "a few more days" is not a very rigorous description. It would be helpful to state the range of additional days of training. 

      We thank the reviewer for the suggestion. In accordance with the Methods section, we have now specified the number of days, which is 4 days, in the main text (line 207).

      (5) In Fig 4D,H, the statistical comparison is relative modulation (% change) by stimulation of D1- vs D2- projecting inputs. Please show statistics comparing the effect of stimulation on lever presses for each individual condition. For example, is the effect of MCC-D2 stimulation in panel D negative or not significant? 

      Thank you for your suggestion. Below are the statistical results, which we have also incorporated into the figure legend for clarity. To assess the net effects of each manipulation, we compared the observed percentage changes with a theoretical value of zero.

      In Figure 4D, optogenetic stimulation of D1-projecting MCC neurons significantly increased the pressing rate (MCC-D1, n = 8, one-sample two-tailed t-test, t = 2.814, P = 0.0131), whereas stimulation of D2-projecting MCC neurons did not produce a significant effect (MCC-D2, n = 7, one-sample two-tailed t-test, t = 0.8481, P = 0.4117).

      In contrast, Figure 4H shows that optogenetic stimulation of both D1- and D2-projecting M1 neurons significantly increased the sequence press rate (M1-D1, n = 6, one-sample two-tailed Wilcoxon signed-rank test, P = 0.0046; M1-D2, n = 7, one-sample two-tailed Wilcoxon signed-rank test, P = 0.0479).

      These analyses help clarify the distinct behavioral effects of manipulating different corticostriatal projections.

      (6) Are data in Fig 1G-H from a D1- or A2a- cre mouse? 

      The data in Fig 1G-H are from a D1-Cre mouse.

      (7) In Fig S3 it looks like there may actually be an effect of 20Hz simulation of D2-SPNs. Though it probably doesn't affect the interpretation. 

      As indicated by the statistics, there is a slight, but not statistically significant, decrease in local motion when 20 Hz stimulation is delivered to the motor cortex with ChR2 expression in D2-SPNs in the striatum.

      Reviewer #2 (Recommendations For The Authors): 

      The rabies tracing is referred to on several occasions as "new" but the reference papers are from 2011, 2013, and 2018. It is unclear what is new about the system used in the paper and what new feature is relevant to the experiments that were performed. Either clarify or remove "new" terminology. 

      Thank you for bringing this to our attention. We have revised the relevant text accordingly at line 20 in the Abstract, line 31 in the In Brief, line 69 in the Introduction, line 83 in the Results, and line 226 in the Discussion to improve clarity and accuracy.

      In Figure 2 D and G, D1 eGFP (+) and D2 eGFP(-) are plotted separately. These are the same cell type; therefore it may work best to combine that data. This could also be done for 'input to D2- Record D2' in panel D as well as 'input D1-Record D2' and 'input D2-Record D1' in panel G. Combining the information in panel D and G and comparing all 4 conditions to each other would give a better understanding of the comparison of functional connectivity between cortical neurons and D1 and D2 SPNs. 

      We thank the reviewer for the thoughtful suggestion. While presenting single bars for each condition (e.g., ‘input D1 - record D1’) might improve visual simplicity, it would obscure an important aspect of our experimental design. Specifically, we aimed to highlight that the comparisons between D1- and D2-projecting neurons to D1 and D2 SPNs were counterbalanced within the same animals - not just across different groups. By showing both D1-eGFP(+) and D2-eGFP(-), or vice versa, within each group and at similar proportions, we provide a more complete picture of the internal control built into our design. This format helps ensure the audience that our conclusions are not biased by group-level differences, but are supported by within-subject comparisons. Therefore, that the current presentation better could serve to communicate the rigor and balance of our experimental approach.

      The findings in Figure 2 are stated as D1 projecting excitatory inputs have a higher probability of targeting D1 SPNs while D2 projecting excitatory inputs target both D1 SPNs and D2 SPNs. It may be more clear to say that some cortical neurons project specifically to D1 SPNs while other cortical neurons project to both D1 and D2 SPNs equally. A better summary diagram could also help with clarity. 

      Thank you for bringing this up. The data we present reflect the connection probabilities of D1- or D2-projecting cortical neurons to D1 or D2 SPNs. One possible interpretation is like the reviewer said that a subset of cortical neurons preferentially target D1 SPNs, while others exhibit more balanced projections to both D1 and D2 SPNs. However, we cannot rule out alternative explanations - for example, that some D2-projecting neurons preferentially target D2 SPNs, or that the observed differences arise from the overall proportions of D1- and D2-projecting cortical neurons connecting to each striatal subtype.

      There are multiple possible patterns of connectivity that could give rise to the observed differences in connection ratios. Based on our current data, we can confidently conclude the existence of asymmetric cortico-striatal projections to the direct and indirect pathways, but the precise nature of this asymmetry will require further investigation.

      Figure 4 introduces the FR8 task, but there are similar takeaways to the findings from Figure 3. Is there another justification for the FR8 task or interesting way of interpreting that data that could add richness to the manuscript?

      The FR8 task is a self-initiated operant sequence task that relies on motor learning mechanisms, whereas the open field test solely assesses spontaneous locomotion. Furthermore, the sequence task enables us to dissect the functional role of specific neuronal populations in the initiation, maintenance, and termination of sequential movements through closed-loop optogenetic manipulations integrated into the task design. These methodological advantages underscore the rationale for including Figure 4 in the manuscript, as it highlights the unique insights afforded by this experimental paradigm.

      I am somewhat surprised to see that D1-SPN stimulation in DLS gave the results in Figure 3 F and P, as mentioned in the public review. These contrast with some previous results (Cui et al, J Neurosci, 2021). Any explanation? Would be useful to speculate or compare parameters as this could have important implications for DLS function.

      Thank you for raising this point. While Cui’s study has generated some debate, several independent investigations have consistently demonstrated that stimulation of D1-SPNs in the dorsolateral striatum (DLS) facilitates local motion and lever-press behaviors (Dong et al., 2025; Geddes et al., 2018; Kravitz et al., 2010). These findings support the functional role of D1-SPNs in promoting movement and motivated actions.

      The differences in behavioral outcomes observed between our study and that of Cui et al. may stem from several methodological factors, particularly related to anatomical targeting and optical stimulation parameters.

      Specifically, our experiments targeted the DMS at AP +0.5 mm, ML ±1.5 mm, DV –2.2 mm, and the DLS at AP +0.5 mm, ML ±2.5 mm, DV –2.2 mm. In contrast, Cui’s study targeted the DMS at AP +0.9 mm, ML ±1.4 mm, DV –3.0 mm, and the DLS at AP +0.7 mm, ML ±2.3 mm, DV –3.0 mm. These differences indicate that their targeting was slightly more rostral and more ventral than ours, which could have led to stimulation of distinct neuronal populations within the striatum, potentially accounting for variations in behavioral effects observed during optogenetic activation.

      In addition, the optical fibers used in the two studies differed markedly. We employed optical fibers with a 200 µm core diameter and a numerical aperture (NA) of 0.37. Cui’s study used fibers with a larger core diameter (250 µm) and a higher NA (0.66), which would produce a broader spread and deeper penetration of light. This increased photostimulation volume may have recruited a more extensive network of neurons, possibly including off-target circuits, thus influencing the behavioral outcomes in a manner not seen in our more spatially constrained stimulation paradigm.

      Taken together, these methodological differences, both in anatomical targeting and optical stimulation parameters, likely contribute to the discrepancies in behavioral results observed between the two studies. Our findings, consistent with other independent reports, support the role of D1-SPNs in facilitating movement and reinforcement behaviors under more controlled and localized stimulation conditions.

      Reviewer #3 (Recommendations For The Authors): 

      Minor: 

      The authors repeatedly state that they are using a new rabies virus system, but the system has been in widespread use for 16 years, including in the exact circuits the authors are studying, for over a decade. I would not consider this new. 

      Thank you for bringing this to our attention. We have revised the relevant text accordingly at line 20 in the Abstract, line 31 in the In Brief, line 69 in the Introduction, line 83 in the Results, and line 226 in the Discussion to improve clarity and accuracy.

      Figure 2G, how many mice were used for recordings?

      In Fig. 2G, we used 8 mice in the D1-projecting to D2 EGFP(+) group, 7 mice in the D1-projecting to D1 EGFP(-) group, 8 mice in the D2-projecting to D1 EGFP(+) group, and 10 mice in the D2-projecting to D2 EGFP(-) group.

      The amplitude of inputs was not reported in figure 2. This is important, as the strength of the connection matters. This is reported in Figure S2, but how exactly this relates to the presence or absence of connections should be made clearer.

      The amplitude data presented in Figure S2 summarize all recorded currents from confirmed connections, as detailed in the Methods section. A connection is defined by the presence of a detectable and reliable postsynaptic current with an onset latency of less than 10 ms following laser stimulation.

      Reference in the reply-to-review comments:

      Aoki, S., Smith, J.B., Li, H., Yen, X.Y., Igarashi, M., Coulon, P., Wickens, J.R., Ruigrok, T.J.H., and Jin, X. (2019). An open cortico-basal ganglia loop allows limbic control over motor output via the nigrothalamic pathway. Elife 8, e49995.

      Chatterjee, S., Sullivan, H.A., MacLennan, B.J., Xu, R., Hou, Y.Y., Lavin, T.K., Lea, N.E., Michalski, J.E., Babcock, K.R., Dietrich, S., et al. (2018). Nontoxic, double-deletion-mutant rabies viral vectors for retrograde targeting of projection neurons. Nat Neurosci 21, 638-646.

      Cruikshank, S.J., Urabe, H., Nurmikko, A.V., and Connors, B.W. (2010). Pathway-Specific Feedforward Circuits between Thalamus and Neocortex Revealed by Selective Optical Stimulation of Axons. Neuron 65, 230-245.

      Dong, J., Wang, L.P., Sullivan, B.T., Sun, L.X., Smith, V.M.M., Chang, L.S., Ding, J.H., Le, W.D., Gerfen, C.R., and Cai, H.B. (2025). Molecularly distinct striatonigral neuron subtypes differentially regulate locomotion. Nat Commun 16, 2710.

      Geddes, C.E., Li, H., and Jin, X. (2018). Optogenetic Editing Reveals the Hierarchical Organization of Learned Action Sequences. Cell 174, 32-43.

      Jin, L., Sullivan, H.A., Zhu, M., Lavin, T.K., Matsuyama, M., Fu, X., Lea, N.E., Xu, R., Hou, Y.Y., Rutigliani, L., et al. (2024). Long-term labeling and imaging of synaptically connected neuronal networks in vivo using double-deletion-mutant rabies viruses. Nat Neurosci 27, 373-383.

      Jin, X., Tecuapetla, F., and Costa, R.M. (2014). Basal ganglia subcircuits distinctively encode the parsing and concatenation of action sequences. Nat Neurosci 17, 423-430.

      Klug, J.R., Engelhardt, M.D., Cadman, C.N., Li, H., Smith, J.B., Ayala, S., Williams, E.W., Hoffman, H., and Jin, X. (2018). Differential inputs to striatal cholinergic and parvalbumin interneurons imply functional distinctions. Elife 7, e35657.

      Kravitz, A.V., Freeze, B.S., Parker, P.R.L., Kay, K., Thwin, M.T., Deisseroth, K., and Kreitzer, A.C. (2010). Regulation of parkinsonian motor behaviours by optogenetic control of basal ganglia circuitry. Nature 466, 622-626.

      Osakada, F., Mori, T., Cetin, A.H., Marshel, J.H., Virgen, B., and Callaway, E.M. (2011). New Rabies Virus Variants for Monitoring and Manipulating Activity and Gene Expression in Defined Neural Circuits. Neuron 71, 617-631.

      Smith, J.B., Klug, J.R., Ross, D.L., Howard, C.D., Hollon, N.G., Ko, V.I., Hoffman, H., Callaway, E.M., Gerfen, C.R., and Jin, X. (2016). Genetic-Based Dissection Unveils the Inputs and Outputs of Striatal Patch and Matrix Compartments. Neuron 91, 1069-1084.

      Wall, N.R., De La Parra, M., Callaway, E.M., and Kreitzer, A.C. (2013). Differential Innervation of Direct- and Indirect-Pathway Striatal Projection Neurons. Neuron 79, 347-360.

      Wickersham, I.R., Lyon, D.C., Barnard, R.J.O., Mori, T., Finke, S., Conzelmann, K.K., Young, J.A.T., and Callaway, E.M. (2007). Monosynaptic restriction of transsynaptic tracing from single, genetically targeted neurons. Neuron 53, 639-647.

      Zhang, B.B., Geddes, C.E., and Jin, X. (2025) Complementary corticostriatal circuits orchestrate action repetition and switching. Sci Adv, in press.

      Zhu, Z.G., Gong, R., Rodriguez, V., Quach, K.T., Chen, X.Y., and Sternson, S.M. (2025). Hedonic eating is controlled by dopamine neurons that oppose GLP-1R satiety. Science 387, eadt0773.

    1. Author response:

      The following is the authors’ response to the original reviews

      Reviewer #1 (Public review): 

      Overall, the manuscript reveals the role of actin polymerization to drive the fusion of myoblasts during adult muscle regeneration. This pathway regulates fusion in many contexts, but whether it was conserved in adult muscle regeneration remained unknown. Robust genetic tools and histological analyses were used to support the claims convincingly. 

      We very much appreciate the positive comments from this Reviewer.

      There are a few interpretations that could be adjusted. 

      The beginning of the results about macrophages traversing ghost fibers after regeneration was a surprise given the context in the abstract and introduction. These results also lead to new questions about this biology that would need to be answered to substantiate the claims in this section. Also, it is unclear the precise new information learned here because it seems obvious that macrophages would need to extravasate the basement membrane to enter ghost fibers and macrophages are known to have this ability. Moreover, the model in Figure 4D has macrophages and BM but there is not even mention of this in the legend. The authors may wish to consider removing this topic from the manuscript. 

      We appreciate this comment and acknowledge that the precise behavior of macrophages when they infiltrate and/or exit the ghost fibers during muscle regeneration is not the major focus of this study. However, we think that visualizing macrophages squeezing through tiny openings on the basement membrane to infiltrate and/or exit from the ghost fibers is valuable. Thus, we have moved the data from the original main Figure 2 to the new Figure S1. 

      Regarding the model in Figure 4D, we have removed the macrophages because the depicted model represents a stage after the macrophages’ exit from the ghost fiber. 

      Which Pax7CreER line was used? In the methods, the Jax number provided is the Gaka line but in the results, Lepper et al 2009 are cited, which is not the citation for the Gaka line. 

      The Pax7<sup>CreER</sup> line used in this study is the one generated in Lepper et al. 2009. We corrected this information in “Material and Methods” of the revised manuscript. 

      Did the authors assess regeneration in the floxed mice that do not contain Cre as a control? Or is it known these alleles do not perturb the function of the targeted gene? 

      We examined muscle regeneration in the floxed mice without Cre. As shown in Figure 1 below, none of the homozygous ArpC2<sup>fl/fl</sup>, N-WASP<sup>fl/fl</sup>, CYFIP1<sup>fl/fl</sup> or N-WASP<sup>fl/fl</sup>;CYFIP1<sup>fl/fl</sup> alleles affected  muscle regeneration, indicating that these alleles do not perturb the function of the targeted gene.  

      Author response image 1.

      The muscle regeneration was normal in mice with only floxed target gene(s). Cross sections of TA muscles were stained with anti-Dystrophin and DAPI at dpi 14. n = 3 mice of each genotype, and > 80 ghost fibers in each mouse were examined. Mean ± s.d. values are shown in the dot-bar plot, and significance was determined by two-tailed student’s t-test. ns: not significant. Scale bar: 100 μm.

      The authors comment: 'Interestingly, expression of the fusogenic proteins, MymK and MymX, was up-regulated in the TA muscle of these mice (Figure S4F), suggesting that fusogen overexpression is not able to rescue the SCM fusion defect resulted from defective branched actin polymerization.' It is unclear if fusogens are truly overexpressed because the analysis is performed at dpi 4 when the expression of fusogens may be decreased in control mice because they have already fused. Also, only two animals were analyzed and it is unclear if MymX is definitively increased. The authors should consider adjusting the interpretation to SCM fusion defect resulting from defective branched actin polymerization is unlikely to be caused by a lack of fusogen expression. 

      We agree with the Reviewer that fusogen expression may simply persist till later time points in fusion mutants without being up-regulated. We have modified our interpretation according to the Reviewer’s suggestion. 

      Regarding the western blots in the original Figure S4F, we now show one experiment from each genotype, and include the quantification of MymK and MymX protein levels from 3 animals in the revised manuscript (new Figure S5F-S5H). 

      Reviewer #1 (Recommendations for the authors): 

      (1) The ArpC2 cKO data could be presented in a clearer fashion. In the text, ArpC2 is discussed but in the figure, there are many other KOs presented and ArpC2 is the fourth one shown in the figure. The other KOs are discussed later. It may be worthwhile for the authors to rearrange the figures to make it easier for readers. 

      Thank you for this suggestion. We have rearranged the genotypes in the figures accordingly and placed ArpC2 cKO first. 

      The authors comment: 'Since SCM fusion is mostly completed at dpi 4.5 (Figure 1B) (Collins et al. 2024)'. This is not an accurate statement of the cited paper. While myofibers are formed by dpi 4.5 with centralized nuclei, there are additional fusion events through at least 21dpi. The authors should adjust their statement to better reflect the data in Collins et al 2024, which could include mentioning that primary fusions could be completed at dpi 4.5 and this is the process they are studying. 

      We have adjusted our statement accordingly in the revised manuscript.

      The authors comment: 'Consistent with this, the frequency distribution of SCM number per ghost fiber displayed a dramatic shift toward higher numbers in the ArpC2<sup>cKO</sup> mice (Figure S5C). These results indicate that the actin cytoskeleton plays an essential role in SCM fusion as the fusogenic proteins. Should it read 'These results indicate that the actin cytoskeleton plays AS an essential role in SCM fusion as the fusogenic proteins'? 

      Yes, and we adjusted this statement accordingly in the revised manuscript. 

      Minor comments 

      (1) In the results the authors state 'To induce genetic deletion of ArpC2 in satellites....'; 'satellites' is a term not typically used for satellite cells. 

      Thanks for catching this. We changed “satellites” to satellite cells.

      (2) In the next sentence, the satellite should be capitalized. 

      Done.

      (3) The cross-section area should be a 'cross-sectional area'. 

      Changed.

      Reviewer #2 (Public review):

      To fuse, differentiated muscle cells must rearrange their cytoskeleton and assemble actinenriched cytoskeletal structures. These actin foci are proposed to generate mechanical forces necessary to drive close membrane apposition and fusion pore formation. 

      While the study of these actin-rich structures has been conducted mainly in drosophila, the present manuscript presents clear evidence this mechanism is necessary for the fusion of adult muscle stem cells in vivo, in mice. 

      We thank this Reviewer for the positive comment.

      However, the authors need to tone down their interpretation of their findings and remember that genetic proof for cytoskeletal actin remodeling to allow muscle fusion in mice has already been provided by different labs (Vasyutina E, et al. 2009 PMID: 19443691; Gruenbaum-Cohen Y, et al., 2012 PMID: 22736793; Hamoud et al., 2014 PMID: 24567399). In the same line of thought, the authors write they "demonstrated a critical function of branched actin-propelled invasive protrusions in skeletal muscle regeneration". I believe this is not a premiere, since Randrianarison-Huetz V, et al., previously reported the existence of finger-like actin-based protrusions at fusion sites in mice myoblasts (PMID: 2926942) and Eigler T, et al., live-recorded said "fusogenic synapse" in mice myoblasts (PMID: 34932950). Hence, while the data presented here clearly demonstrate that ARP2/3 and SCAR/WAVE complexes are required for differentiating satellite cell fusion into multinucleated myotubes, this is an incremental story, and the authors should put their results in the context of previous literature. 

      In this study, we focused on elucidating the mechanisms of myoblast fusion during skeletal muscle regeneration, which remained largely unknown. Thus, we respectfully disagree with this Reviewer that “this is an incremental story” for the following reasons – 

      First, while we agree with this Reviewer that “genetic proof for cytoskeletal actin remodeling to allow muscle fusion in mice has already been provided by different labs”, most of the previous genetic studies, including ours (Lu et al. 2024), characterizing the roles of actin regulators (Elmo, Dock180, Rac, Cdc42, WASP, WIP, WAVE, Arp2/3) in mouse myoblast fusion were conducted during embryogenesis (Laurin et al. 2008; Vasyutina et al. 2009; Gruenbaum-Cohen et al. 2012; Tran et al. 2022; Lu et al. 2024), instead of during adult muscle regeneration, the latter of which is the focus of this study. 

      Second, prior to this study, several groups tested the roles of SRF, CaMKII theta and gemma, Myo10, and Elmo, which affect actin cytoskeletal dynamics, in muscle regeneration. These studies have shown that knocking out SRF, CaMKII, Myo10, or Elmo caused defects in mouse muscle regeneration, based on measuring the cross-sectional diameters of regenerated myofibers only (Randrianarison-Huetz et al. 2018; Eigler et al. 2021; Hammers et al. 2021; Tran et al. 2022). However, none of these studies visualized myoblast fusion at the cellular and subcellular levels during muscle regeneration in vivo. For this reason, it remained unclear whether the muscle regeneration defects in these mutants were indeed due to defects in myoblast fusion, in particular, defects in the formation of invasive protrusions at the fusogenic synapse. Thus, the previous studies did not demonstrate a direct role for the actin cytoskeleton, as well as the underlying mechanisms, in myoblast fusion during muscle regeneration in vivo.

      Third, regarding actin-propelled invasive protrusions at the fusogenic synapse, our previous study (Lu et al. 2024) revealed these structures by fluorescent live cell imaging and electron microscopy (EM) in cultured muscle cells, as well as EM studies in mouse embryonic limb muscle, firmly establishing a direct role for invasive protrusions in mouse myoblast fusion in cultured muscle cells and during embryonic development. Randrianarison-Huetz et al. (2018) reported the existence of finger-like actin-based protrusions at cell contact sites of cultured mouse myoblasts. It was unclear from their study, however, if these protrusions were at the actual fusion sites and if they were invasive (Randrianarison-Huetz et al. 2018). Eigler et al. (2021) reported protrusions at fusogenic synapse in cultured mouse myoblasts. It was unclear from their study, however, if the protrusions were actin-based and if they were invasive (Eigler et al. 2021). Neither Randrianarison-Huetz et al. (2018) nor Eigler et al. (2021) characterized protrusions in developing mouse embryos or regenerating adult muscle. 

      Taken together, to our knowledge, this is the first study to characterize myoblast fusion at the cellular and subcellular level during mouse muscle regeneration. We demonstrate that branched actin polymerization promotes invasive protrusion formation and myoblast fusion during the regeneration process. We believe that this work has laid the foundation for additional mechanistic studies of myoblast fusion during skeletal muscle regeneration.

      The citations in the original manuscript were primarily focused on previous in vivo studies of Arp2/3 and the actin nucleation-promoting factors (NPFs), N-WASP and WAVE (Richardson et al. 2007; Gruenbaum-Cohen et al. 2012), and of invasive protrusions mediating myoblast fusion in intact animals (Drosophila, zebrafish and mice) (Sens et al. 2010; Luo et al. 2022; Lu et al. 2024). We agree with this reviewer, however, that it would be beneficial to the readers if we provide a more comprehensive summary of previous literature, including studies of both intact animals and cultured cells, as well as studies of additional actin regulators upstream of the NPFs, such as small GTPases and their GEFs. Thus, we have significantly expanded our Introduction to include these studies and cited the corresponding literature in the revised manuscript.

      Reviewer #2 (Recommendations for the authors): 

      (1) I am concerned that the authors did not evaluate the efficiency of the target allele deletion efficiency following Pax7-CreER activation. The majority, if not all, of the published work focusing on this genetic strategy presents the knock-down efficiency using either genotyping PCR, immunolocalization, western-blot; etc... 

      (2) Can the authors provide evidence that the N-WASP, CYFIP1, and ARPC2 proteins are depleted in TAM-treated tissue? Alternatively, can the author perform RT-qPCR on freshly isolated MuSCs to validate the absence of N-WASP, CYFIP1, and ARPC2 mRNA expression?

      Thank you for these comments. We have assessed the target allele deletion efficiency with isolated satellite cells from TAM-injected mice in which Pax7-CreER is activated. Western blot analyses showed that the protein levels of N-WASP, CYFIP1, and ArpC2 significantly decreased in the satellite cells of knockout mice. Please see the new Figure S2.

      Reviewer #3 (Public review): 

      The manuscript by Lu et al. explores the role of the Arp2/3 complex and the actin nucleators NWASP and WAVE in myoblast fusion during muscle regeneration. The results are clear and compelling, effectively supporting the main claims of the study. However, the manuscript could benefit from a more detailed molecular and cellular analysis of the fusion synapse. Additionally, while the description of macrophage extravasation from ghost fibers is intriguing, it seems somewhat disconnected from the primary focus of the work. 

      Despite this, the data are robust, and the major conclusions are well supported. Understanding muscle fusion mechanism is still a widely unexplored topic in the field and the authors make important progress in this domain. 

      We appreciate the positive comments from this Reviewer.

      We agree with this Reviewer and Reviewer #1 that the macrophage study is not the primary focus of the work. However, we think that visualizing macrophages squeezing through tiny openings on the basement membrane to infiltrate and/or exit from the ghost fibers is valuable. Thus, we have moved the data from the original main Figure 2 to the new Figure S1. 

      I have a few suggestions that might strengthen the manuscript as outlined below.  

      (1) Could the authors provide more detail on how they defined cells with "invasive protrusions" in Figure 4C? Membrane blebs are commonly observed in contacting cells, so it would be important to clarify the criteria used for counting this specific event. 

      Thanks for this suggestion. We define invasive protrusions as finger-like protrusions projected by a cell into its fusion partner. Based on our previous studies (Sens et al. 2010; Luo et al. 2022; Lu et al. 2024), these invasive protrusions are narrow (with 100-250 nm diameters) and propelled by mechanically stiff actin bundles. In contrast, membrane blebs are spherical protrusions formed by the detachment of the plasma membrane from the underlying actin cytoskeleton. In general, the blebs are not as mechanically stiff as invasive protrusions and would not be able to project into neighboring cells. Thus, we do not think that the protrusions in Figure 4B are membrane blebs. We clarified the criteria in the text and figure legends of the revised manuscript.

      (2) Along the same line, please clarify what each individual dot represents in Figure 4C. The authors mention quantifying approximately 83 SCMs from 20 fibers. I assume each dot corresponds to data from individual fibers, but if that's the case, does this imply that only around four SCMs were quantified per fiber? A more detailed explanation would be helpful. 

      To quantitatively assess invasive protrusions in Ctrl and mutant mice, we analyzed 20 randomly selected ghost fibers per genotype. Within each ghost fiber, we examined randomly selected SCMs in a single cross section (a total of 83, 147 and 93 SCMs in Ctrl, ArpC2<sup>cKO</sup> and MymX<sup>cKO</sup> mice were examined, respectively). 

      In Figure 4C, each dot was intended to represent the percentage of SCMs with invasive protrusions in a single cross section of a ghost fiber. However, we mistakenly inserted a wrong graph in the original Figure 4C. We sincerely apologize for this error and have replaced it with the correct graph in the new Figure 4C.

      (3) Localizing ArpC2 at the invasive protrusions would be a strong addition to this study. Furthermore, have the authors examined the localization of Myomaker and Myomixer in ArpC2 mutant cells? This could provide insights into potential disruptions in the fusion machinery.

      We have examined the localization of the Arp2/3 complex on the invasive protrusions in cultured SCMs and included the data in Figure 4A of the original manuscript. Specifically, we showed enrichment of mNeongreen-tagged Arp2, a subunit of the Arp2/3 complex, on the invasive protrusions at the fusogenic synapse of cultured SCMs (see the enlarged panels on the right; also see supplemental video 4). The small size of the invasive protrusions on SCMs prevented a detailed analysis of the precise Arp2 localization along the protrusions.  Please see our recently published paper (Lu et al. 2024) for the detailed localization and function of the Arp2/3 complex during invasive protrusion formation in cultured C2C12 cells. 

      We have also attempted to localize the Arp2/3 complex in the regenerating muscle in vivo using an anti-ArpC2 antibody (Millipore, 07-227-I), which was used in many studies to visualize the Arp2/3 complex in cultured cells. Unfortunately, the antibody detected non-specific signals in the regenerating TA muscle of the ArpC2<sup>cKO</sup> animals. Thus, it cannot be used to detect specific ArpC2 signals in muscle tissues. Besides the specificity issue of the antibody, it is technically challenging to visualize invasive protrusions with an F-actin probe at the fusogenic synapses of regenerating muscle by light microscopy, due to the high background of F-actin signaling within the muscle cells. 

      Regarding the fusogens, we show that both are present in the TA muscle of the ArpC2<sup>cKO</sup> animals by western blot (Figure S5F-S5H). Thus, the fusion defect in these animals is not due to the lack of fusogen expression. Since the focus of this study is on the role of the actin cytoskeleton in muscle regeneration, the subcellular localization of the fusogens was not investigated in the current study. 

      (4) As a minor curiosity, can ArpC2 WT and mutant cells fuse with each other?

      Our previous work in Drosophila embryos showed that Arp2/3-mediated branched actin polymerization is required in both the invading and receiving fusion partners (Sens et al. 2010).  To address this question in mouse muscle cells, we co-cultured GFP<sup>+</sup> WT cells with mScarleti<sup>+</sup> WT (or mScarleti<sup>+</sup> ArpC2<sup>cKO</sup> cells) in vitro and assessed their ability to fuse with one another. We found that ArpC2<sup>cKO</sup> cells could barely fuse with WT cells (new Figure 3F and 3G), indicating that the Arp2/3-mediated branched actin polymerization is required in both fusion partners. This result is consistent with our findings in Drosophila embryos. 

      (5) The authors report a strong reduction in CSA at 14 dpi and 28 dpi, attributing this defect primarily to failed myoblast fusion. Although this claim is supported by observations at early time points, I wonder whether the Arp2/3 complex might also play roles in myofibers after fusion. For instance, Arp2/3 could be required for the growth or maintenance of healthy myofibers, which could also contribute to the reduced CSA observed, since regenerated myofibers inherit the ArpC2 knockout from the stem cells. Could the authors address or exclude this possibility? This is rather a broader criticism of how things are being interpreted in general beyond this paper. 

      This is an interesting question. It is possible that Arp2/3 may play a role in the growth or maintenance of healthy myofibers. However, the muscle injury and regeneration process may not be the best system to address this question because of the indispensable early step of myoblast fusion. Ideally, one may want to knockout Arp2/3 in myofibers of young healthy mice and observe fiber growth in the absence of muscle injury and compare that to the wild-type littermates. Since these experiments are out of the scope of this study, we revised our conclusion that the fusion defect in ArpC2<sup>cKO</sup> mice should account, at least in part, for the strong reduction in CSA at 14 dpi and 28 dpi, without excluding additional possibilities such as Arp2/3’s potential role in the growth or maintenance of healthy myofibers.  

      References:

      Eigler T, Zarfati G, Amzallag E, Sinha S, Segev N, Zabary Y, Zaritsky A, Shakked A, Umansky KB, Schejter ED et al. 2021. ERK1/2 inhibition promotes robust myotube growth via CaMKII activation resulting in myoblast-to-myotube fusion. Dev Cell 56: 3349-3363 e3346.

      Gruenbaum-Cohen Y, Harel I, Umansky KB, Tzahor E, Snapper SB, Shilo BZ, Schejter ED. 2012. The actin regulator N-WASp is required for muscle-cell fusion in mice. Proc Natl Acad Sci U S A 109: 11211-11216.

      Hammers DW, Hart CC, Matheny MK, Heimsath EG, Lee YI, Hammer JA, 3rd, Cheney RE, Sweeney HL. 2021. Filopodia powered by class x myosin promote fusion of mammalian myoblasts. Elife 10.

      Laurin M, Fradet N, Blangy A, Hall A, Vuori K, Cote JF. 2008. The atypical Rac activator Dock180 (Dock1) regulates myoblast fusion in vivo. Proc Natl Acad Sci U S A 105: 15446-15451.

      Lu Y, Walji T, Ravaux B, Pandey P, Yang C, Li B, Luvsanjav D, Lam KH, Zhang R, Luo Z et al. 2024. Spatiotemporal coordination of actin regulators generates invasive protrusions in cell-cell fusion. Nat Cell Biol 26: 1860-1877.

      Luo Z, Shi J, Pandey P, Ruan ZR, Sevdali M, Bu Y, Lu Y, Du S, Chen EH. 2022. The cellular architecture and molecular determinants of the zebrafish fusogenic synapse. Dev Cell 57: 1582-1597 e1586.

      Randrianarison-Huetz V, Papaefthymiou A, Herledan G, Noviello C, Faradova U, Collard L, Pincini A, Schol E, Decaux JF, Maire P et al. 2018. Srf controls satellite cell fusion through the maintenance of actin architecture. J Cell Biol 217: 685-700.

      Richardson BE, Beckett K, Nowak SJ, Baylies MK. 2007. SCAR/WAVE and Arp2/3 are crucial for cytoskeletal remodeling at the site of myoblast fusion. Development 134: 4357-4367.

      Sens KL, Zhang S, Jin P, Duan R, Zhang G, Luo F, Parachini L, Chen EH. 2010. An invasive podosome-like structure promotes fusion pore formation during myoblast fusion. J Cell Biol 191: 1013-1027.

      Tran V, Nahle S, Robert A, Desanlis I, Killoran R, Ehresmann S, Thibault MP, Barford D, Ravichandran KS, Sauvageau M et al. 2022. Biasing the conformation of ELMO2 reveals that myoblast fusion can be exploited to improve muscle regeneration. Nat Commun 13: 7077.

      Vasyutina E, Martarelli B, Brakebusch C, Wende H, Birchmeier C. 2009. The small G-proteins Rac1 and Cdc42 are essential for myoblast fusion in the mouse. Proc Natl Acad Sci U S A 106: 8935-8940.

    1. Author response:

      The following is the authors’ response to the original reviews.

      Reviewer #1 (Public Review):

      EnvA-pseudotyped glycoprotein-deleted rabies virus has emerged as an essential tool for tracing monosynaptic inputs to genetically defined neuron populations in the mammalian brain. Recently, in addition to the SAD B19 rabies virus strain first described by Callaway and colleagues in 2007, the CVS N2c rabies virus strain has become popular due to its low toxicity and high trans-synaptic transfer efficiency. However, despite its widespread use in the mammalian brain, particularly in mice, the application of this cell-type-specific monosynaptic rabies tracing system in zebrafish has been limited by low labeling efficiency and high toxicity. In this manuscript, the authors aimed to develop an efficient retrograde monosynaptic rabies-mediated circuit mapping tool for larval zebrafish. Given the translucent nature of larval zebrafish, whole-brain neuronal activities can be monitored, perturbed, and recorded over time. Introducing a robust circuit mapping tool for larval zebrafish would enable researchers to simultaneously investigate the structure and function of neural circuits, which would be of significant interest to the neural circuit research community. Furthermore, the ability to track rabies-labeled cells over time in the transparent brain could enhance our understanding of the trans-synaptic retrograde tracing mechanism of the rabies virus. 

      To establish an efficient rabies virus tracing system in the larval zebrafish brain, the authors conducted meticulous side-by-side experiments to determine the optimal combination of trans-expressed rabies G proteins, TVA receptors, and recombinant rabies virus strains. Consistent with observations in the mouse brain, the CVS N2c strain trans-complemented with N2cG was found to be superior to the SAD B19 combination, offering lower toxicity and higher efficiency in labeling presynaptic neurons. Additionally, the authors tested various temperatures for the larvae post-virus injection and identified 36℃ as the optimal temperature for improved virus labeling. They then validated the system in the cerebellar circuits, noting evolutionary conservation in the cerebellar structure between zebrafish and mammals. The monosynaptic inputs to Purkinje cells from granule cells were neatly confirmed through ablation experiments.

      However, there are a couple of issues that this study should address. Additionally, conducting some extra experiments could provide valuable information to the broader research field utilizing recombinant rabies viruses as retrograde tracers.

      (1) It was observed that many radial glia were labeled, which casts doubt on the specificity of trans-synaptic spread between neurons. The issues of transneuronal labeling of glial cells should be addressed and discussed in more detail. In this manuscript, the authors used a transgenic zebrafish line carrying a neuron-specific Cre-dependent reporter and EnvA-CVS N2c(dG)-Cre virus to avoid the visualization of virally infected glial cells. However, this does not solve the real issue of glial cell labeling and the possibility of a nonsynaptic spread mechanism.

      In agreement with the reviewer’s suggestion, we have incorporated a standalone section in the revised Discussion (page 9) to address the issue of transneuronal glial labeling, including its spatial distribution, temporal dynamics, potential mechanisms, and possible strategies for real resolution.

      Regarding the specificity of trans-synaptic spread between neurons, we have demonstrated that our transsynaptic tracing system reliably and specifically labels input neurons. Structurally, we only observed labeling of inferior olivary cells (IOCs) outside the cerebellum, which are the only known extracerebellar inputs to Purkinje cells (PCs), while all other traced neurons remained confined within the cerebellum throughout the observation period (see Figure 2G–I). Functionally, we verified that the traced neurons formed synaptic connections with the starter PCs (see Figure 2J–M). Together, these findings support the conclusion that our system enables robust and specific retrograde monosynaptic tracing of neurons in larval zebrafish.

      Regarding the transneuronal labeling of radial glia cells, we observed that their distribution closely correlates with the location of neuronal somata and dendrites (see Author response image 2). In zebrafish, radial glial cells are considered functional analogs of astrocytes and are often referred to as radial astroglia. The adjacent labeled astroglia may participate in tripartite synapses with the starter neurons and express viral receptors that enable RV particle entry at postsynaptic sites. This suggests that rabies-based tracing in zebrafish may serve as a valuable tool for identifying synaptically associated and functionally connected glia. Leveraging this approach to investigate glia–neuron interactions represents a promising direction for future research.

      In our system, the glial labeling diminishes at later larval stages, likely due to abortive infection (see Author response image 3 and relevant response). However, the eventual clearance of infection does not preclude the initial infection of glial cells, which may compete with neuronal labeling and reduce overall tracing efficiency. Notably, transneuronal infection of glial cells by RV has also been observed in mammals (Marshel et al., 2010). To minimize such off-target labeling, future work should focus on elucidating the mechanisms underlying glial susceptibility—such as receptor-mediated viral entry— and developing strategies to suppress receptor expression specifically in glia, thereby improving the specificity and efficiency of neuronal circuit tracing.

      In addition, wrong citations in Line 307 were made when referring to previous studies discovering the same issue of RVdG-based transneuronal labeling radial glial cells. "The RVdG-based transneuronal labeling of radial glial cells was commonly observed in larval zebrafish29,30".

      The cited work was conducted using vesicular stomatitis virus (VSV). A more thorough analysis and/or discussion on this topic should be included.

      We thank the reviewer for pointing out the citation inaccuracy. The referenced study employed vesicular stomatitis virus (VSV), which, like RV, is a member of the Rhabdoviridae family. We have revised the text accordingly—from "RVdG-based transneuronal labeling of radial glial cells…" to " Transneuronal labeling of radial glial cells mediated by VSV, a member of the Rhabdoviridae family like RV, has been commonly observed in larval zebrafish" (page 9, line 347).

      Several key questions should be addressed:

      Does the number of labeled glial cells increase over time? 

      Yes, as shown in Figure 2—figure supplement 1C and G, the number of labeled radial glial cells significantly increased from 2 to 6 days post-injection (dpi). This phenomenon has been addressed in the revised Discussion section (page 9, line 357).

      Do they increase at the same rate over time as labeled neurons?

      Although glial cell labeling continued to increase over time, we observed a slowdown in labeling rate between 6 and 10 dpi, as shown in Figure 2—figure supplement 1C and G. Therefore, we divided the timeline into two intervals (2–6 and 6–10 dpi) to compare the rate of increase in labeling between neurons and glia. The rate (R) was defined as the daily change in convergence index. To quantify the difference between neuronal and glial labeling rates, we calculated a labeling rate index: R<sub>g</sub>−R<sub>n</sub>, where R<sub>g</sub> and R<sub>n</sub> denote the rates for glia and neurons, respectively) (Author response image1). Our analysis revealed that, between 2 and 6 dpi, glial cells exhibited a higher labeling rate than neurons. However, this trend reversed between 6 and 10 dpi, with neurons surpassing glial cells in labeling rate. These findings have been included in the revised Discussion section (page 9).

      Author response image 1.

      Labeling rate index of glia and neurons across two time intervals. Data points represent the mean labeling rate index for each tracing strategy within each time interval. *P < 0.05 (nonparametric two-tailed Mann-Whitney test).  

      Are the labeled glial cells only present around the injection site?

      We believe the reviewer is inquiring whether labeled glial cells are spatially restricted to the vicinity of starter neurons. The initial infection is determined by the expression of TVA rather than the injection site. For example, injecting a high volume of virus into the anterior hindbrain resulted in the infection of TVA-expressing cells in distant regions, including the 109 tectum and posterior hindbrain (Author response image 2). 

      Regarding glial labeling, PC starter experiments showed that labeled glial cells (i.e. Bergmann glia) were predominantly localized within the cerebellum, likely due to the confinement of PC dendrites to this region. When using vglut2a to define starter neurons, glial labeling was frequently observed near the soma and dendrites of starter cells (14 out 114 of 17 cases; Author response image 2). These observations suggest that transneuronal labeled glial cells may be synaptically associated with the starter neurons. We have included this point in the revised Discussion section (page 9).

      Author response image 2.

      Location of transneuronal labeled glial cells. (a and b) Confocal images showing the right tectum (a) and posterior hindbrain (b) of different WT larvae expressing EGFP and TVA using UGNT in randomly sparse neurons (vglut2a<sup>+</sup>) and infected with CVSdGtdTomato[EnvA] (magenta) injected into the anterior hindbrain. Dashed yellow circles, starter neurons (EGFP<sup>+</sup>/tdTomato<sup>+</sup>); gray arrows, transneuronally labeled radial glia (tdTomato<sup>+</sup>/EGFP<sup>−</sup>); dashed white lines, tectum or hindbrain boundaries. C, caudal; R, rostral. Scale bars, 20 μm.

      Can the phenomenon of transneuronal labeling of radial glial cells be mitigated if the tracing is done in slightly older larvae?

      Yes, we agree. As elaborated in the following response, we hypothesize that the loss of fluorescence in radial glial cells at later developmental stages is due to abortive infection (see Author response image 3 and associated response). This supports the notion that abortive infection becomes increasingly pronounced as larvae mature, potentially explaining the negligible glial labeling observed in adult zebrafish (Dohaku et al., 2019; Satou et al., 2022). However, as noted in our response to the first comment, the disappearance of fluorescence does not indicate the absence of viral entry. Viral receptors may express on glial cells, allowing initial infection despite a failure in subsequent replication. Consequently, glial infection—though abortive—may still compete with neuronal infection and reduce tracing efficiency.

      What is the survival rate of the infected glial cells over time?

      We observed the disappearance of glial fluorescence after transneuronal labeling, while we did not observe punctate fluorescent debris typically indicative of apoptotic cell death. Therefore, we favor the hypothesis that the loss of glial fluorescence results from abortive infection rather than cell death. Abortive infection refers to a scenario in which viral replication is actively suppressed by host antiviral responses, preventing the production of infectious viral particles. For example, recent studies have shown that lab-attenuated rabies virus (RV) induces the accumulation of aberrant double-stranded DNA in astrocytes, which activates mitochondrial antiviral-signaling protein (MAVS) and subsequent interferon expression (Tian et al., 2018). This antiviral response inhibits RV replication, ultimately resulting in abortive infection. 

      In addition, we quantified the proportion of glial cells labeled at 2 dpi and 4dpi that retained fluorescence over time. By 6 dpi (approximately 11 dpf), glial labeling had largely diminished in both groups (Author response image 3). These results suggest that the decline in glial fluorescence is more closely linked to larval age than to the duration of glial infection, supporting the notion of abortive infection. This also addresses the reviewer’s earlier concern and indicates that glial labeling is mitigated in older larvae.

      Author response image 3.

      Fraction of glial cells with fluorescence retention. (a and b) Proportion of glial cells labeled at 2 dpi (a) and 4 dpi (b) that retained fluorescence over time. Data are from the CVS|N2cG|36°C group. In boxplots: center, median; bounds of box, first and third quartiles; whiskers, minimum and maximum values. n.s., not-significant; *P < 0.05, **P < 0.01 (nonparametric two-tailed Mann-Whitney test).

      If an infected glial cell dies due to infection or gets ablated, does the rabies virus spread from the dead glial cells?

      In our system, glial cells do not express the rabies glycoprotein (G). Therefore, even if glial cells are transneuronally infected, they cannot support viral budding or assembly of infectious particles due to the absence of G (Mebatsion et al., 1996), preventing further viral propagation to neighboring cells.

      If TVA and rabies G are delivered to glial cells, followed by rabies virus injection, will it lead to the infection of other glial cells or neurons?

      We have conducted experiments in which TVA and rabies G were specifically expressed in astroglia using the gfap promoter, followed by RVdG-mCherry[EnvA] injection. This resulted in initial infection of TVA-positive astroglia and occasional subsequent labeling of nearby TVA-negative astroglia (Author response image 4), suggesting astroglia-toastroglia transmission. Notably, no neuronal labeling was observed. This glial-to-glial spread is consistent with previous rabies tracing studies reporting similar phenomena involving the interaction of astrocytes with astrocytes and microglia (Clark et al., 2021). However, the underlying mechanism remains unclear, and we have discussed this in response to the first comment.

      Author response image 4.

      Viral tracing initiated from astroglia. (a) Confocal images of the tectum of a larva expressing EGFP and TVA using UGBT in randomly sparse astroglia (gfap<sup>+</sup>) and infected by SADdG-mCherry[EnvA] (magenta) injected into the anterior hindbrain.  (b) Confocal images of the posterior hindbrain of a larva expressing EGFP and TVA using UGNT in randomly sparse astroglia (gfap<sup>+</sup>) and infected by CVSdG-tdTomato[EnvA] (magenta) injected into the anterior hindbrain. Dashed yellow circles, starter astroglia (EGFP+/mCherry<su>+</sup> or EGFP<sup>+</sup>/tdTomato<sup>+</sup>); gray arrows, transneuronally labeled astroglia (tdTomato<sup>+</sup>/EGFP<sup>−</sup>); dashed white lines, tectum or hindbrain boundaries. C, caudal; R, rostral. Scale bars, 20 μm.<br />

      Answers to any of these questions could greatly benefit the broader research community.

      (2) The optimal virus tracing effect has to be achieved by raising the injected larvae at 36C. Since the routine temperature of zebrafish culture is around 28C, a more thorough characterization of the effect on the health of zebrafish should be conducted.

      Yes, 36°C is required to achieve optimal labeling efficiency. Although this is above the standard zebrafish culture temperature (28°C), previous work (Satou et al., 2022) and our observations indicate that this transient elevation does not adversely affect larval health within the experimental time window. 

      In the previous study, Satou et al. reported no temperature-dependent effects on swimming behavior, social interaction, or odor discrimination in adult fish maintained at 28°C and 36°C. In larvae, both non-injected and virus-injected fish showed a decrease in survival at later time points (7 dpi), with slightly increased mortality observed at elevated temperatures.

      In our study, we raised the same batch of non-virus-injected larvae at 28°C and 36°C, and found no mortality over a 10-day period. For CVS-N2c-injected larvae, electrode insertion caused injury, but survival rates remained around 80% at both temperatures (see Figure 3A). Moreover, we successfully maintained CVS-N2c-injected larvae at 36°C for over a month, indicating that elevated temperature does not adversely affect fish health. Notably, higher temperatures were associated with an accelerated developmental rate. 

      This point was briefly addressed in the previous version and has now been further elaborated in the revised Discussion section (page 8).

      (3) Given the ability of time-lapse imaging of the infected larval zebrafish brain, the system can be taken advantage of to tackle important issues of rabies virus tracing tools.

      a) Toxicity. 

      The toxicity of rabies viruses is an important issue that limits their application and affects the interpretation of traced circuits. For example, if a significant proportion of starter cells die before analysis, the traced presynaptic networks cannot be reliably assigned to a "defined" population of starter cells. In this manuscript, the authors did an excellent job of characterizing the effects of different rabies strains, G proteins derived from various strains, and levels of G protein expression on starter cell survival. However, an additional parameter that should be tested is the dose of rabies virus injection. The current method section states that all rabies virus preparations were diluted to 2x10^8 infection units per ml, and 2-5 nl of virus suspension was injected near the target cells. It would be interesting to know the impact of the dose/volume of virus injection on retrograde tracing efficiency and toxicity. Would higher titers of the virus lead to more efficient labeling but stronger toxicities? What would be the optimal dose/volume to balance efficiency and toxicity? Addressing these questions would provide valuable insights and help optimize the use of rabies viruses for circuit tracing.

      This is an important concern. Viral cytotoxicity is primarily driven by the level of viral transcription and replication, which inhibits host protein synthesis (Komarova et al., 2007). The RVdG-EnvA typically infects cells at a rate of one viral particle per cell (Zhang et al., 2024), suggesting that increasing viral concentration does not proportionally increase percell infection. Accordingly, viral titer and injection volume are unlikely to influence cytotoxicity at the single-cell level. In our experiments, injection volumes up to 20 nl (i.e., 4 to 10 times the standard injection volume) did not affect starter cell survival. However, higher titers or volumes may increase the number of initially infected starter cells, potentially leading to greater overall mortality in larval zebrafish.

      Similarly, given that rabies virus typically infects cells at one particle per cell, increasing viral titer alone is unlikely to enhance tracing efficiency once the virus type is fixed. In contrast, the level of G protein expression significantly influences tracing efficiency (see Figure 2D). However, excessive G protein expression reduces the survival of starter cells (see Figure 3D). Therefore, careful control of G protein levels is essential to balance tracing efficiency and cytotoxicity.

      Notably, regardless of whether infected cells undergo apoptosis or necrosis due to cytotoxicity, the resulting disruption of the plasma membrane severely impairs viral budding. As a result, the formation of intact, G protein-enveloped viral particles is prevented, limiting further infection of neighboring neurons.

      The latest second-generation ΔGL RV vectors (Jin et al., 2024), which lack both the G and L (viral polymerase) genes, have been shown to markedly reduce cytotoxicity. These improved tracing strategies may be explored in future zebrafish studies to further optimize labeling efficiency and cell viability.

      The issue of viral titer and volume has been addressed in the revised Discussion section (page 10).

      b) Primary starters and secondary starters: 

      Given that the trans-expression of TVA and G is widespread, there is the possibility of coexistence of starter cells from the initial infection (primary starters) and starter cells generated by rabies virus spreading from the primary starters to presynaptic neurons expressing G. This means that the labeled input cells could be a mixed population connected with either the primary or secondary starter cells.

      It would be immensely interesting if time-lapse imaging could be utilized to observe the appearance of such primary and secondary starter cells. Assuming there is a time difference between the initial appearance of these two populations, it may be possible to differentiate the input cells wired to these populations based on a similar temporal difference in their initial appearance. This approach could provide valuable insights into the dynamics of rabies virus spread and the connectivity of neural circuits.

      The reviewers suggestion is valuable. Regarding the use of Purkinje cells (PCs) as starter cells, we consider the occurrence of secondary PCs to be extremely rare. Although previous evidence suggests that PCs can form synaptic connections with one another (Chang et al., 2020), our sparse labeling strategy—typically involving fewer than 10 labeled cells— significantly reduces the likelihood of viral transmission between PC starter cells. In addition, if secondary starter PCs were frequently generated, we would expect increased tracing efficiency at 10 dpi compared to 6 dpi. However, our results show no significant difference (see Figure 2—figure supplement 1C and G). 

      Given the restricted expression of TVA and G in PCs, even if a limited number of secondary starters were generated, the labeled inputs would predominantly be granule cells (GCs), thereby preserving the cell-type identity of upstream inputs. While this raises a potential concern regarding an overestimation of the convergence index (CI). Notably, within the GC-PC circuit, individual GCs often project to multiple PCs. Consequently, a GC labeled via a secondary PC may also a bona fide presynaptic partner of the primary starter population. This overlap could mitigate the overestimation of CI. Taken together, we believe that the CI values reported in this study provide a reasonable approximation of monosynaptic connectivity.

      In scenarios where TVA and G are broadly expressed—for example, under the control of vglut2a promoter—secondary starter cells may arise frequently. In such cases, long-term time-lapse imaging in the zebrafish whole brain presents a promising strategy to distinguish primary and secondary starter cells, along with their respective input populations, based on the timing of their appearance. This approach potentially enables multi-step circuit tracing within individual animals. An alternative strategy is to use an EnvA-pseudotyped, G-competent rabies virus, which allows targeted initial infection while supporting multisynaptic propagation. When combined with temporally resolved imaging, this strategy could facilitate direct labeling of higher-order circuits and allow clear differentiation between multi-order inputs and the original starter population over time.

      In conclusion, we find this suggestion compelling and will explore these strategies in future studies to optimize and broaden the application of rabies virus-based circuit tracing.

      Reviewer #2 (Public Review):

      The study by Chen, Deng et al. aims to develop an efficient viral transneuronal tracing method that allows efficient retrograde tracing in the larval zebrafish. The authors utilize pseudotyped-rabies virus that can be targeted to specific cell types using the EnvA-TvA systems. Pseudotyped rabies virus has been used extensively in rodent models and, in recent years, has begun to be developed for use in adult zebrafish. However, compared to rodents, the efficiency of the spread in adult zebrafish is very low (~one upstream neuron labeled per starter cell). Additionally, there is limited evidence of retrograde tracing with pseudotyped rabies in the larval stage, which is the stage when most functional neural imaging studies are done in the field. In this study, the authors systematically optimized several parameters of rabies tracing, including different rabies virus strains, glycoprotein types, temperatures, expression construct designs, and elimination of glial labeling. The optimal configurations developed by the authors are up to 5-10 fold higher than more typically used configurations.

      The results are solid and support the conclusions. However, the methods should be described in more detail to allow other zebrafish researchers to apply this method in their own work.

      Additionally, some findings are presented anecdotally, i.e., without quantification or sufficient detail to allow close examinations. Lastly, there is concern that the reagents created by the authors will not be easily accessible to the zebrafish community.

      (1) The titer used in each experiment was not stated. In the methods section, it is stated that aliquots are stored at 2x10e8. Is it diluted for injection? Are all of the experiments in the manuscripts with the same titer?

      We injected all three viral vectors as undiluted stock aliquots. The titer for SADdGmCherry[EnvA], CVSdG-tdTomato[EnvA], and CVSdG-mCherry-2A-Cre[EnvA]) was 2 × 10<sup>8</sup>, 2 × 10<sup>8</sup>, and 3 × 10<sup>8</sup> infectious units/mL, respectively. This has been clarified in the updated Methods section (page 12).

      (2) The age for injection is quite broad (3-5 dpf in Fig 1 and 4-6 dpf in Fig 2). Given that viral spread efficiency is usually more robust in younger animals, describing the exact injection age for each experiment is critical.

      We appreciate the reviewer’s suggestions. For the initial experiments tracing randomly from neurons in Figure 1, the injection age was primarily 3–4 dpf, with a one-day difference. Due to the slower development of PCs, the injection age for experiments related to Figure 2,3, and 4, is mainly 5 dpf. To clarify the developmental stages at the time of injection for each experiment, we have  newly added tables (see Figure 1,2—table supplement 2) listing the number of fish used at each injection age for all experimental groups shown in Figure 1 and 2.

      (3) More details should be provided for the paired electrical stimulation-calcium imaging study. How many GC cells were tested? How many had corresponding PC cell responses? What is the response latency? For example, images of stimulated and recorded GCs and PCs should be shown.

      Yes, these are important details for the paired electrical stimulation-calcium imaging study. We stimulated 33 GCs from 32 animals and detected calcium responses in putative postsynaptic PCs in 15 cases. Among these, we successfully ablated the single GC in 11 pairs and observed a weakened calcium response in PCs following ablation (see Figure 2M). The response latency was determined as the first calcium imaging frame where ΔF/F exceeded the baseline (pre-stimulus average) by 3 times the standard deviation. Imaging was performed at 5 Hz, and as shown in Figure 2L, the calculated average response latency was 152 ± 35 ms (mean ± SEM), indicating an immediate response with calcium intensity from the first post-stimulus imaging frame consistently exceeding the threshold.

      We have added additional details to the Results (page 5), Discussion (page 9), and Methods (page 15) sections. A representative image showing both the stimulated GC and the recorded PC has been added to Figure 2 in the revised manuscript (see Figure 2K).

      (4) It is unclear how connectivity between specific PC and GC is determined for single neuron connectivity. In other images (Figure 4C), there are usually multiple starter cells and many GCs. It was not shown that the image resolution can establish clear axon dendritic contacts between cell pairs.

      In our experiments, sparse labeling typically results in 1–10 starter cells per fish. Regarding the case shown in Figure 4C (right column), only two PC starters were labeled, which simplifies the assignment of presynaptic inputs to individual PCs. Connectivity is determined based on clear axon-dendritic or axon-cell body apposition between GCs and PCs. We have accordingly added more details to the Methods (page 16) section regarding how we determined connectivity between specific PCs and GCs.

      Reviewer #2 (Recommendations For The Authors):

      To enable broader use of this technique, I would encourage the authors to submit their zebrafish lines, plasmids, and plasmid sequences to public repositories such as ZIRC and  Addgene. Additionally, there is no mention of how viral vectors will be shared.

      We have deposited the related zebrafish lines at CZRC (China Zebrafish Resource Center) and uploaded plasmid maps and sequences to Addgene. The viral vectors are available through BrainCase (Shenzhen, China). We have included the information in the revised manuscript.

      Reviewer #3 (Public Review):

      Summary:

      The authors establish reagents and define experimental parameters useful for defining neurons retrograde to a neuron of interest.

      Strengths:

      A clever approach, careful optimization, novel reagents, and convincing data together lead to convincing conclusions.

      Weaknesses: 

      In the current version of the manuscript, the tracing results could be better centered with  respect to past work, certain methods could be presented more clearly, and other approaches worth considering.

      Appraisal/Discussion:

      Trans-neuronal tracing in the larval zebrafish preparation has lagged behind rodent models,limiting "circuit-cracking" experiments. Previous work has demonstrated that pseudotyped rabies virus-mediated tracing could work, but published data suggested that there was considerable room for optimization. The authors take a major step forward here, identifying a number of key parameters to achieve success and establishing new transgenic reagents that incorporate modern intersectional approaches. As a proof of concept, the manuscript concludes with a rough characterization of inputs to cerebellar Purkinje cells. The work will be of considerable interest to neuroscientists who use the zebrafish model.

      Reviewer #3 (Recommendations For The Authors):

      The main limitations of the work are as follows:

      (1) The optimizations might differ for different neurons. Purkinje cells are noteworthy because they develop considerably during the time window detailed here, almost doubling in number between 7-14dpf. Presumably, connectivity follows. This sort of neurogenesis is much less common elsewhere. It would be useful to show similar results in, say, tectal neurons, which would have spatially-restricted retinal ganglion cells labelled.

      We acknowledge that Purkinje cells (PCs) undergo significant development between 7–14 dpf, which may influence synaptic connectivity and result in differences in tracing efficiency. However, all experimental conditions were standardized across groups, and the selection of starter PCs was unbiased, typically focusing on PCs in the lateral region of the CCe (corpus cerebelli) subregion, ensuring that the relative comparisons remain valid. 

      We agree that testing other neuronal populations would be valuable, as tracing efficiency is influenced by multiple factors, such as the number of endogenous inputs, synaptic maturation, and developmentally regulated synaptic strength. Tectal neurons, which receive spatially restricted retinal ganglion cell inputs, would be a suitable choice for further investigation. However, due to the various tectal cell types and the opacity of the eyeball, such studies present additional technical challenges and are beyond the scope of this paper.

      (2) The virus is delivered by means of microinjection near the cell. This is invasive and challenging for labs that dont routinely perform electrophysiology. It would be useful to know if coarser methods of viral delivery (e.g. intraventricular injection) would be successful. 

      Our protocol does not require the level of precision needed for electrophysiology. The procedure can be performed using a standard high-magnification upright (135× magnification, Nikon SMZ18) or inverted fluorescence microscope (200× magnification, Olympus IX51). The virus suspension was loaded into a glass micropipette with a ~10 µm tip diameter and directly microinjected into the target region using a micromanipulator. The procedure was comparable to embryonic microinjection in terms of precision and operational control. Notably, direct contact with the target cells is not necessary, as the injected virus solution can diffuse and effectively infect nearby cells.  

      We had attempted intraventricular injection as an alternative, but it failed to produce robust labeling, reinforcing the necessity for direct tissue injection. 

      We have now included additional methodological details in the Methods section (page 13). 

      (3) Because of the combination of transgenic lines, plasmid injection, and viral type, it is often confusing to follow exactly what is being done for a particular experiment. It would be useful to specify the transgenic background used for each experiment using standard nomenclature e.g. "Plasmids were injected into Tg(elavl3:GAL4) fish." This is particularly important for the experiments in Figure 4: it isnt clear what the background used for the sparse labels was. 

      Thank the reviewer for bringing this issue to our attention. In order to improve clarity, we have revised the figure legends to explicitly state the transgenic background, injected plasmids, and viral type used in each experiment, particularly for Figure 4. 

      (4) Plasmids should be deposited with Addgene along with maps specifying the particular "codon-optimized Tetoff" per 388. 

      We confirm that all plasmids, including those containing codon-optimized Tetoff constructs, have been uploaded to Addgene along with detailed maps.

      (5) It would be useful to know if there were more apoptotic cells after transfection -- an acridine orange or comparable assay is recommended, rather than loss of fluorescence. 

      We appreciate the reviewer’s suggestion to assess apoptosis using acridine orange staining or comparable assays. We agree that such methods can provide more direct detection of apoptotic events. However, we believe that the difference in cytotoxicity is already evident in our current data: SAD-infected cells exhibit greater loss than CVSinfected cells (see Figure 3D). This is consistent with previous observations in mice, where greater toxicity of SAD compared to CVS was demonstrated using propidium iodide (PI) staining in cultured cells (Reardon et al., 2016).

      (6) Line 219-228 Hibis lab has described the subtypes of granule cells in detail already; the work should discuss the tracings with respect to previous characterizations instead of limiting that work to a citation. 

      Thanks for the reminding of this point. We have expanded the Results section (page 6) to discuss the subtypes of GCs and PCs in relation to previously reported characterizations.

      (7) "Activities" is often used when "activity" is correct. The use of English in the manuscript is, by and large, excellent, but its worth running the text through software like Grammarly to catch the occasional error. 

      We have carefully edited the manuscript using professional language editing tools to correct any grammatical issues.

      (8) The experiments in 2J-2L would be more convincing if they were performed on inferior olive inputs as well -- especially given the small size of the granule cells. 

      We acknowledge the reviewers observation that granule cells (GCs) are relatively small, which may underline the finding that, out of 33 stimulated GCs, only 15 were capable of eliciting calcium responses in putative postsynaptic PCs. However, in all 11 pairs where a single GC was successfully ablated, we observed a weakened calcium response in PCs after the ablation (see Figure 2M), suggesting our tracing approach specifically identifies synaptically coupled neurons. We have clarified this point in the revised manuscript (page 5).

      We agree that verifying the IO inputs to PCs would strengthen the validity of our findings. However, in our experiments, the probability of tracing upstream IO cells was relatively low. This may be due to the developmental immaturity of the synapse and the fact that each PC typically receives input from a single IO cell. Additionally, the deep and distant anatomical location of the IO presents technical challenges for paired electrical stimulationcalcium imaging study. To address these limitations, we are currently exploring the integration of viral tracing and optogenetics to further investigate IO-PC connectivity in future studies.

      (9) It would be useful if the manuscript discussed the efficacy of trans-synaptic labelling. What fraction of granule cell / olivary inputs to a particular Purkinje cell do the authors think their method captures?

      This is an important point for assessing the efficacy of our trans-synaptic labeling. Ideally, electron microscopy (EM) data would provide the most precise evaluation. In the absence of EM data, we estimated the number of GCs, IOs and PCs using light microscopy-based cell counting. 

      At approximately 7 dpf, we manually counted 327 ± 14 PCs and 2318 ± 70 GCs in the Tg(2×en.cpce-E1B:tdTomato-CAAX) and Tg(cbln12:GAL4FF);Tg(5×UAS:EGFP) zebrafish cerebellum, across all subregions (Va, CCe, EG, and LCa). Given the developmental increase in the number of GCs and the fact that some GCs that have exclusively ipsilateral projections, and that a single PC would not receive input from all parallel fibers, we estimate that by 10–14 dpf, a single PC receives approximately 1000– 2000 GC inputs. Under optimal tracing conditions, we observed an average of 20 labeled GC inputs per PC, yielding a capture fraction of ~1–2%. Although this represents only a subset of total inputs, it is consistent with mammalian studies (Wall et al., 2010; Callaway et al., 2015), suggesting inherent limitations of this viral labeling approach.

      For IO inputs, we counted 325 ± 26 inferior olivary neurons in Tg(elavl3:H2B-GCaMP6s) fish. A single PC likely receives input from one IO neuron, though an IO neuron may innervate multiple PCs. Accordingly, the observed capture rate for IO inputs was lower (7 out of 248 starters). 

      Further optimization is required to enhance the tracing efficiency. We have now incorporated a Discussion on this point in the revised manuscript (page 8).

    1. Author response:

      The following is the authors’ response to the original reviews.

      Reviewer #1 (Public review):

      Summary:

      In this study, Ana Lapao et al. investigated the roles of Rab27 effector SYTL5 in cellular membrane trafficking pathways. The authors found that SYTL5 localizes to mitochondria in a Rab27A-dependent manner. They demonstrated that SYTL5-Rab27A positive vesicles containing mitochondrial material are formed under hypoxic conditions, thus they speculate that SYTL5 and Rab27A play roles in mitophagy. They also found that both SYTL5 and Rab27A are important for normal mitochondrial respiration. Cells lacking SYTL5 undergo a shift from mitochondrial oxygen consumption to glycolysis which is a common process known as the Warburg effect in cancer cells. Based on the cancer patient database, the author noticed that low SYTL5 expression is related to reduced survival for adrenocortical carcinoma patients, indicating SYTL5 could be a negative regulator of the Warburg effect and potentially tumorigenesis.

      Strengths:

      The authors take advantage of multiple techniques and novel methods to perform the experiments.

      (1) Live-cell imaging revealed that stably inducible expression of SYTL5 co-localized with filamentous structures positive for mitochondria. This result was further confirmed by using correlative light and EM (CLEM) analysis and western blotting from purified mitochondrial fraction.

      (2) In order to investigate whether SYTL5 and Rab27A are required for mitophagy in hypoxic conditions, two established mitophagy reporter U2OS cell lines were used to analyze the autophagic flux.

      Weaknesses:

      This study revealed a potential function of SYTL5 in mitophagy and mitochondrial metabolism. However, the mechanistic evidence that establishes the relationship between SYTL5/Rab27A and mitophagy is insufficient. The involvement of SYTL5 in ACC needs more investigation. Furthermore, images and results supporting the major conclusions need to be improved.

      We thank the reviewer for their constructive comments. We agree that a complete understanding of the mechanism by which SYTL5 and Rab27A are recruited to the mitochondria and subsequently involved in mitophagy requires further investigation. Here, we have shown that SYTL5 recruitment to the mitochondria requires both its lipid-binding C2 domains and the Rab27A-binding SHD domain (Figure 1G-H). This implies a coincidence detection mechanism for mitochondrial localisation of SYTL5.  Additionally, we find that mitochondrial recruitment of SYTL5 is dependent on the GTPase activity and mitochondrial localisation of Rab27A (Figure 2D-E). We also identified proteins linked to the cellular response to oxidative stress, reactive oxygen species metabolic process, regulation of mitochondrion organisation and protein insertion into mitochondrial membrane to be enriched in the SYTL5 interactome (Figure 3A and C).

      However, less details regarding the mitochondrial localisation of Rab27A are understood. To investigate this, we have now performed a mass spectrometry analysis to identify the interactome of Rab27A (see Author response table 1 below,). U2OS cells with stable expression of mScarlet-Rab27A or mScarlet only, were subjected to immunoprecipitation, followed by MS analysis.  Of the 32 significant Rab27A-interacting hits (compared to control), two of the hits are located in the inner mitochondrial membrane (IMM); ATP synthase F(1) complex subunit alpha (P25705), and mitochondrial very long-chain specific acyl-CoA dehydrogenase (VLCAD)(P49748). However, as these IMM proteins are not likely involved in mitochondrial recruitment of Rab27A, observed under basal conditions, we choose not to include these data in the manuscript. 

      It is known that other RAB proteins are recruited to the mitochondria. During parkin-mediated mitophagy, RABGEF1 (a guanine nucleotide exchange factor) is recruited through its ubiquitin-binding domain and directs mitochondrial localisation of RAB5, which subsequently leads to recruitment of RAB7 by the MON1/CCZ1 complex[1]. As already mentioned in the discussion (p. 12), ubiquitination of the Rab27A GTPase activating protein alpha (TBC1D10A) is reduced in the brain of Parkin KO mouse compared to controls[35], suggesting a possible connection of Rab27A with regulatory mechanisms that are linked with mitochondrial damage and dysfunction. While this an interesting avenue to explore, in this paper we will not follow up further on the mechanism of mitochondrial recruitment of Rab27A. 

      Author response table 1.

      Rab27A interactome. Proteins co-immunoprecipitated with mScarlet-Rab27A vs mScarlet expressing control. The data show average of three replicates. 

      To investigate the role of SYTL5 in the context of ACC, we acquired the NCI-H295R cell line isolated from the adrenal gland of an adrenal cancer patient. The cells were cultured as recommended from ATCC using DMEM/F-12 supplemented with NuSerum and ITS +premix. It is important to note that the H295R cells were adapted to grow as an adherent monolayer from the H295 cell line which grows in suspension. However, there can still be many viable H295R cells in the media. 

      We attempted to conduct OCR and ECAR measurements using the Seahorse XF upon knockdown of SYTL5 and/or Rab27A in H295R cells. For these assays, it is essential that the cells be seeded in a monolayer at 70-90% confluency with no cell clusters[4]. Poor adhesion of the cells can cause inaccurate measurements by the analyser. Unfortunately, the results between the five replicates we carried out were highly inconsistent, the same knockdown produced trends in opposite directions in different replicates. This is likely due to problems with seeding the cells. Despite our best efforts to optimise seeding number, and pre-coating the plate with poly-D-lysine[5] we observed poor attachment of cells and inability to form a monolayer. 

      To study the localisation of SYTL5 and Rab27A in an ACC model, we transduced the H295R cells with lentiviral particles to overexpress pLVX-SV40-mScarlet-I-Rab27A and pLVX-CMV-SYTL5-EGFP-3xFLAG. Again, this proved unsuccessful after numerous attempts at optimising transduction. 

      These issues limited our investigation into the role of SYTL5 in ACC to the cortisol assay (Supplementary Figure 6). For this the H295R cells were an appropriate model as they are able to produce an array of adrenal cortex steroids[6] including cortisol[7]. In this assay, measurements are taken from cell culture supernatants, so the confluency of the cells does not prevent consistent results as the cortisol concentration was normalised to total protein per sample. With this assay we were able to rule out a role for SYTL5 and Rab27A in the secretion of cortisol.  

      Another consideration when investigating the involvement of SYTL5 in ACC, is that in general ACC cells should have a low expression of SYTL5 as is seen from the patient expression data (Figure 6B).

      The reviewer also writes “Furthermore, images and results supporting the major conclusions need to be improved.”. We have tried several times, without success, to generate U2OS cells with CRISPR/Cas9-mediated C-terminal tagging of endogenous SYTL5 with mNeonGreen, using an approach that has been successfully implemented in the lab for other genes. This is likely due to a lack of suitable sgRNAs targeting the C-terminal region of SYTL5, which have a low predicted efficiency score and a large number of predicted off-target sites in the human genome including several other gene exons and introns (see Author response image 2). 

      We have also included new data (Supplementary Figure 4B) showing that some of the hypoxia-induced SYTL5-Rab27A-positive vesicles stain positive for the autophagy markers p62 and LC3B when inhibiting lysosomal degradation, further strengthening our data that SYTL5 and Rab27A function as positive regulators of mitophagy.  

      Reviewer #2 (Public review): 

      Summary:

      The authors provide convincing evidence that Rab27 and STYL5 work together to regulate mitochondrial activity and homeostasis.

      Strengths:

      The development of models that allow the function to be dissected, and the rigorous approach and testing of mitochondrial activity.

      Weaknesses:

      There may be unknown redundancies in both pathways in which Rab27 and SYTL5 are working which could confound the interpretation of the results.

      Suggestions for revision:

      Given that Rab27A and SYTL5 are members of protein families it would be important to exclude any possible functional redundancies coming from Rab27B expression or one of the other SYTL family members. For Rab27 this would be straightforward to test in the assays shown in Figure 4 and Supplementary Figure 5. For SYTL5 it might be sufficient to include some discussion about this possibility.

      We thank the reviewer for pointing out the potential redundancy issue for Rab27A and SYTL5. There are multiple studies demonstrating the redundancy between Rab27A and Rab27B. For example, in a study of the disease Griscelli syndrome, caused by Rab27A loss of function, expression of either Rab27A or Rab27B rescues the healthy phenotype indicating redundancy[8]. This redundancy however applies to certain function and cell types. In fact, in a study regarding hair growth, knockdown of Rab27B had the opposite effect to knockdown of Rab27A[9].

      In this paper, we conducted all assays in U2OS cells, in which the expression of Rab27B is very low. Human Protein Atlas reports expression of 0.5nTPM for Rab27B, compared to 18.4nTPM for Rab27A. We also observed this low level of expression of Rab27B compared to Rab27A by qPCR in U2OS cells. Therefore, there would be very little endogenous Rab27B expression in cells depleted of Rab27A (with siRNA or KO). In line with this, Rab27B peptides were not detected in our SYTL5 interactome MS data (Table 1 in paper). Moreover, as Rab27A depletion inhibits mitochondrial recruitment of SYTL5 and mitophagy, it is not likely that Rab27B provides a functional redundancy. It is possible that Rab27B overexpression could rescue mitochondrial localisation of SYTL5 in Rab27A KO cells, but this was not tested as we do not have any evidence for a role of Rab27B in these cells. Taken together, we believe our data imply that Rab27B is very unlikely to provide any functional redundancy to Rab27A in our experiments. 

      For the SYTL family, all five members are Rab27 effectors, binding to Rab27 through their SHD domain. Together with Rab27, all SYTL’s have been implicated in exocytosis in different cell types. For example, SYTL1 in exocytosis of azurophilic granules from neutrophils[10], SYTL2 in secretion of glucagon granules from pancreatic α cells[11], SYTL3 in secretion of lytic granules from cytotoxic T lymphocytes[12], SYTL4 in exocytosis of dense hormone containing granules from endocrine cells[13] and SYTL5 in secretion of the RANKL cytokine from osteoblasts[14]. This indicates a potential for redundancy through their binding to Rab27 and function in vesicle secretion/trafficking. However, one study found that different Rab27 effectors have distinct functions at different stages of exocytosis[15].

      Very little known about redundancy or hierarchy between these proteins. Differences in function may be due to the variation in gene expression profile across tissues for the different SYTL’s (see Author response image 1 below). SYTL5 is enriched in the brain unlike the others, suggesting possible tissue specific functions. There are also differences in the binding affinities and calcium sensitivities of the C2iA and C2B domains between the SYTL proteins[16].

      Author response image 1.

      GTEx Multi Gene Query for SYTL1-5

      All five SYTL’s are expressed in the U2OS cell line with nTPMs according to Human Protein Atlas of SYTL1: 7.5, SYTL2: 13.4, SYTL3:14.2, SYTL4: 8.7, SYTL5: 4.8. In line with this, in the Rab27A interactome, when comparing cells overexpressing mScarlet-Rab27A with control cells, we detected all five SYTL’s as specific Rab27A-interacting proteins (see Author response table 1 above). Whereas, in the SYTL5 interactome we did not detect any other SYTL protein (table 1 in paper), confirming that they do not form a complex with SYTL5. 

      We have included the following text in the discussion (p. 12): “SYTL5 and Rab27A are both members of protein families, suggesting possible functional redundancies from Rab27B or one of the other SYTL isoforms. While Rab27B has a very low expression in U2OS cells, all five SYTL’s are expressed. However, when knocking out or knocking down SYTL5 and Rab27A we observe significant effects that we presume would be negated if their isoforms were providing functional redundancies. Moreover, we did not detect any other SYTL protein or Rab27B in the SYTL5 interactome, confirming that they do not form a complex with SYTL5.”

      Suggestions for Discussion: 

      Both Rab27A and STYL5 localize to other membranes, including the endolysosomal compartments. How do the authors envisage the mechanism or cellular modifications that allow these proteins, either individually or in complex to function also to regulate mitochondrial funcYon? It would be interesYng to have some views.

      We agree that it would be interesting to better understand the mechanism involved in modulation of the localisation and function of SYTL5 and Rab27A at different cellular compartments, including the mitochondria. Here, we have shown that SYTL5 recruitment to the mitochondria involves coincidence detection, as both its lipid-binding C2 domains and the Rab27A-binding SHD domain are required (Figure 1G-H). Both these domains also seem required for localisation of SYTL5 to vesicles, and we can only speculate that binding to different lipids (Figure 1F) may regulate SYTL5 localisation. Additionally, we find that mitochondrial recruitment of SYTL5 is dependent on the GTPase activity and mitochondrial localisation of Rab27A (Figure 2D-E). However, this seems also the case for vesicular recruitment of SYTL5, although a few SYTL5-Rab27A (T23N) positive vesicles were seen (Figure 2E). 

      To characterise the mechanisms involved in mitochondrial localisation of Rab27A, we have performed mass spectrometry analysis to identify the interactome of Rab27A (see Author response table 1 above). U2OS cells with stable expression of mScarlet-Rab27A or mScarlet only were subjected to immunoprecipitation, followed by MS analysis.  Of the 32 significant Rab27A-interacting hits (compared to control), two of the hits localise in the inner mitochondrial membrane (IMM); ATP synthase F(1) complex subunit alpha (P25705), and mitochondrial very long-chain specific acyl-CoA dehydrogenase (VLCAD)(P49748). However, as these IMM proteins are not likely involved in mitochondrial recruitment of Rab27A, observed under basal conditions, we chose not to include these data in the manuscript. 

      It is known that other RAB proteins are recruited to the mitochondria by regulation of their GTPase activity. During parkin-mediated mitophagy, RABGEF1 (a guanine nucleotide exchange factor) is recruited through its ubiquitin-binding domain and directs mitochondrial localisation of RAB5, which subsequently leads to recruitment of RAB7 by the MON1/CCZ1 GEF complex[1]. As already mentioned in the discussion (p.12), ubiquitination of the Rab27A GTPase activating protein alpha (TBC1D10A) is reduced in the brain of Parkin KO mouse compared to controls[35], suggesting a possible connection of Rab27A with regulatory mechanisms that are linked with mitochondrial damage and dysfunction. While this an interesting avenue to explore, it is beyond the scope of this paper. 

      Our data suggest that SYTL5 functions as a negative regulator of the Warburg effect, the switch from OXPHOS to glycolysis. While both SYTL5 and Rab27A seem required for mitophagy of selective mitochondrial components, and their depletion leading to reduced mitochondrial respiration and ATP production, only depletion of SYTL5 caused a switch to glycolysis. The mechanisms involved are unclear, but we found several proteins linked to the cellular response to oxidative stress, reactive oxygen species metabolic process, regulation of mitochondrion organisation and protein insertion into mitochondrial membrane to be enriched in the SYTL5 interactome (Figure 3A and C).

      We have addressed this comment in the discussion on p.12 

      Reviewer #3 (Public review):

      Summary:

      In the manuscript by Lapao et al., the authors uncover a role for the Rab27A effector protein SYTL5 in regulating mitochondrial function and turnover. The authors find that SYTL5 localizes to mitochondria in a Rab27A-dependent way and that loss of SYTL5 (or Rab27A) impairs lysosomal turnover of an inner mitochondrial membrane mitophagy reporter but not a matrix-based one. As the authors see no co-localization of GFP/mScarlet tagged versions of SYTL5 or Rab27A with LC3 or p62, they propose that lysosomal turnover is independent of the conventional autophagy machinery. Finally, the authors go on to show that loss of SYTL5 impacts mitochondrial respiration and ECAR and as such may influence the Warburg effect and tumorigenesis. Of relevance here, the authors go on to show that SYTL5 expression is reduced in adrenocortical carcinomas and this correlates with reduced survival rates.

      Strengths:

      There are clearly interesting and new findings here that will be relevant to those following mitochondrial function, the endocytic pathway, and cancer metabolism.

      Weaknesses:

      The data feel somewhat preliminary in that the conclusions rely on exogenously expressed proteins and reporters, which do not always align.

      As the authors note there are no commercially available antibodies that recognize endogenous SYTL5, hence they have had to stably express GFP-tagged versions. However, it appears that the level of expression dictates co-localization from the examples the authors give (though it is hard to tell as there is a lack of any kind of quantitation for all the fluorescent figures). Therefore, the authors may wish to generate an antibody themselves or tag the endogenous protein using CRISPR.

      We agree that the level of SYTL5 expression is likely to affect its localisation. As suggested by the reviewer, we have tried hard, without success, to generated U2OS cells with CRISPR knock-in of a mNeonGreen tag at the C-terminus of endogenous SYTL5, using an approach that has been successfully implemented in the lab for other genes. This is likely due to a lack of suitable sgRNAs targeting the C-terminal region of SYTL5, which have a low predicted efficiency score and a large number of predicted off-target sites in the human genome including several other gene exons and introns (see Author response image 2). 

      Author response image 2.

      Overview of sgRNAs targeting the C-terminal region of SYTL5 

      Although the SYTL5 expression level might affect its cellular localization, we also found the mitochondrial localisation of SYTL5-EGFP to be strongly increased in cells co-expressing mScarletRab27A, supporting our findings of Rab27A-mediated mitochondrial recruitment of SYTL5. We have also included new data (Supplementary Figure 4B) showing that some of the hypoxia-induced SYTL5Rab27A-positive vesicles stain positive for the autophagy markers p62 and LC3B when inhibiting lysosomal degradation, further strengthening our data that SYTL5 and Rab27A function as positive regulators of mitophagy.  

      In relation to quantitation, the authors found that SYTL5 localizes to multiple compartments or potentially a few compartments that are positive for multiple markers. Some quantitation here would be very useful as it might inform on function. 

      We find that SYTL5-EGFP localizes to mitochondria, lysosomes and the plasma membrane in U2OS cells with stable expression of SYTL5-EGFP and in SYTL5/Rab27A double knock-out cells rescued with SYTL5EGFP and mScralet-Rab27A. We also see colocalization of SYTL5-EGFP with endogenous p62, LC3 and LAMP1 upon induction of mitophagy. However, as these cell lines comprise a heterogenous pool with high variability we do not believe that quantification of the overexpressing cell lines would provide beneficial information in this scenario. As described above, we have tried several times to generate SYTL5 knock-in cells without success.  

      The authors find that upon hypoxia/hypoxia-like conditions that punctate structures of SYTL5 and Rab27A form that are positive for Mitotracker, and that a very specific mitophagy assay based on pSu9-Halo system is impaired by siRNA of SYTL5/Rab27A, but another, distinct mitophagy assay (Matrix EGFP-mCherry) shows no change. I think this work would strongly benefit from some measurements with endogenous mitochondrial proteins, both via immunofluorescence and western blot-based flux assays. 

      In addition to the western blotting for different endogenous ETC proteins showing significantly increased levels of MTCO1 in cells depleted of SYTL5 and/or Rab27A (Figure 5E-F), we have now blotted for the endogenous mitochondrial proteins, COXIV and BNIP3L, in DFP and DMOG conditions upon knockdown of SYTL5 and/or Rab27A (Figure 5G and Supplementary Figure 5A). Although there was a trend towards increased levels, we did not see any significant changes in total COXIV or BNIP3L levels when SYTL5, Rab27A or both are knocked down compared to siControl. Blotting for endogenous mitochondrial proteins is however not the optimum readout for mitophagy. A change in mitochondrial protein level does not necessarily result from mitophagy, as other factors such as mitochondrial biogenesis and changes in translation can also have an effect. Mitophagy is a dynamic process, which is why we utilise assays such as the HaloTag and mCherry-EGFP double tag as these indicate flux in the pathway. Additionally, as mitochondrial proteins have different half-lives, with many long-lived mitochondrial proteins[17], differences in turnover rates of endogenous proteins make the results more difficult to interpret. 

      A really interesting aspect is the apparent independence of this mitophagy pathway on the conventional autophagy machinery. However, this is only based on a lack of co-localization between p62or LC3 with LAMP1 and GFP/mScarlet tagged SYTL5/Rab27A. However, I would not expect them to greatly colocalize in lysosomes as both the p62 and LC3 will become rapidly degraded, while the eGFP and mScarlet tags are relatively resistant to lysosomal hydrolysis. -/+ a lysosome inhibitor might help here and ideally, the functional mitophagy assays should be repeated in autophagy KOs. 

      We thank the reviewer for this suggestion. We have now repeated the colocalisation studies in cells treated with DFP with the addition of bafilomycin A1 (BafA1) to inhibit the lysosomal V-ATPase. Indeed, we find that a few of the SYTL5/Rab27A/MitoTracker positive structures also stain positive for p62 and LC3 (Supplementary Figure 4B). As expected, the occurrence of these structures was rare, as BafA1 was only added for the last 4 hrs of the 24 hr DFP treatment. However, we cannot exclude the possibility that there are two different populations of these vesicles.

      The link to tumorigenesis and cancer survival is very interesYng but it is not clear if this is due to the mitochondrially-related aspects of SYTL5 and Rab27A. For example, increased ECAR is seen in the SYTL5 KO cells but not in the Rab27A KO cells (Fig.5D), implying that mitochondrial localization of SYTL5 is not required for the ECAR effect. More work to strengthen the link between the two sections in the paper would help with future direcYons and impact with respect to future cancer treatment avenues to explore. 

      We agree that the role of SYTL5 in ACC requires future investigation. While we observe reduced OXPHOS levels in both SYTL5 and Rab27A KO cells (Figure 5B), glycolysis was only increased in SYTL5 KO cells (Figure 5D). We believe this indicates that Rab27A is being negatively regulated by SYTL5, as ECAR was unchanged in both the Rab27A KO and Rab27A/SYTL5 dKO cells. This suggests that Rab27A is required for the increase in ECAR when SYTL5 is depleted, therefore SYTL5 negatively regulates Rab27A. The mechanism involved is unclear, but we found several proteins linked to the cellular response to oxidative stress, reactive oxygen species metabolic process, regulation of mitochondrion organisation and protein insertion into mitochondrial membrane to be enriched in the SYTL5 interactome (Figure 3A and C).

      To investigate the link to cancer further, we tested the effect of knockdown of SYTL5 and/or Rab27A on the levels of mitochondrial ROS. ROS levels were measured by flow cytometry using the MitoSOX Red dye, together with the MitoTracker Green dye to normalise ROS levels to the total mitochondria. Cells were treated with the antioxidant N-acetylcysteine (NAC)[18] as a negative control and menadione as a positive control, as menadione induces ROS production via redox cycling[19]. We must consider that there is also a lot of autofluorescence from cells that makes it impossible to get a level of ‘zero ROS’ in this experiment. We did not see a change in ROS with knockdown of SYTL5 and/or Rab27A compared to the NAC treated or siControl samples (see Author response image 3 below). The menadione samples confirm the success of the experiment as ROS accumulated in these cells. Thus, based on this, we do not believe that low SYTL5 expression would affect ROS levels in ACC tumours.

      Author response image 3.

      Mitochondrial ROS production normalised to total mitochondria

      As discussed in our response to Reviewer #1, we tried hard to characterise the role of SYTL5 in the context of ACC using the NCI-H295R cell line isolated from the adrenal gland of an adrenal cancer patient. We attempted to conduct OCR and ECAR measurements using the Seahorse XF upon knockdown of SYTL5 and/or Rab27A in H295R cells without success, due to poor attachment of the cells and inability to form a monolayer. We also transduced the H295R cells with lentiviral particles to overexpress pLVX-SV40-mScarlet-I-Rab27A and pLVX-CMV-SYTL5-EGFP-3xFLAG to study the localisation of SYTL5 and Rab27A in an ACC model. Again, this proved unsuccessful after numerous attempts at optimising the transduction. These issues limited our investigation into the role of SYTL5 in ACC to the cortisol assay (Supplementary Figure 6). For this the H295R cells were an appropriate model as they are able to produce an array of adrenal cortex steroids[6] including cortisol[7] In this assay, measurements are taken from cell culture supernatants, so the confluency of the cells does not prevent consistent results as the cortisol concentration was normalised to total protein per sample. With this assay we were able to rule out a role for SYTL5 and Rab27A in the secretion of cortisol.  

      Another consideration when investigating the involvement of SYTL5 in ACC, is that in general ACC cells should have a low expression of SYTL5 as is seen from the patient expression data (Figure 6B).

      Further studies into the link between SYTL5/Rab27A and cancer are beyond the scope of this paper as we are limited to the tools and expertise available in the lab.

      References

      (1) Yamano, K. et al. Endosomal Rab cycles regulate Parkin-mediated mitophagy. eLife 7 (2018). https://doi.org:10.7554/eLife.31326

      (2) Carré, M. et al. Tubulin is an inherent component of mitochondrial membranes that interacts with the voltage-dependent anion channel. The Journal of biological chemistry 277, 33664-33669 (2002). https://doi.org:10.1074/jbc.M203834200

      (3) Hoogerheide, D. P. et al. Structural features and lipid binding domain of tubulin on biomimetic mitochondrial membranes. Proceedings of the National Academy of Sciences 114, E3622-E3631 (2017). https://doi.org:10.1073/pnas.1619806114

      (4) Plitzko, B. & Loesgen, S. Measurement of Oxygen Consumption Rate (OCR) and Extracellular Acidification Rate (ECAR) in Culture Cells for Assessment of the Energy Metabolism. Bio Protoc 8, e2850 (2018). https://doi.org:10.21769/BioProtoc2850

      (5) Yavin, E. & Yavin, Z. Attachment and culture of dissociated cells from rat embryo cerebral hemispheres on polylysine-coated surface. The Journal of cell biology 62, 540-546 (1974). https://doi.org:10.1083/jcb.62.2.540

      (6) Wang, T. & Rainey, W. E. Human adrenocortical carcinoma cell lines. Mol Cell Endocrinol 351, 5865 (2012). https://doi.org:10.1016/j.mce.2011.08.041

      (7) Rainey, W. E. et al. Regulation of human adrenal carcinoma cell (NCI-H295) production of C19 steroids. J Clin Endocrinol Metab 77, 731-737 (1993). https://doi.org:10.1210/jcem.77.3.8396576

      (8) Barral, D. C. et al. Functional redundancy of Rab27 proteins and the pathogenesis of Griscelli syndrome. J. Clin. Invest. 110, 247-257 (2002). https://doi.org:10.1172/jci15058

      (9) Ku, K. E., Choi, N. & Sung, J. H. Inhibition of Rab27a and Rab27b Has Opposite Effects on the Regulation of Hair Cycle and Hair Growth. Int. J. Mol. Sci. 21 (2020). https://doi.org:10.3390/ijms21165672

      (10) Johnson, J. L., Monfregola, J., Napolitano, G., Kiosses, W. B. & Catz, S. D. Vesicular trafficking through cortical actin during exocytosis is regulated by the Rab27a effector JFC1/Slp1 and the RhoA-GTPase–activating protein Gem-interacting protein. Mol. Biol. Cell 23, 1902-1916 (2012). https://doi.org:10.1091/mbc.e11-12-1001

      (11) Yu, M. et al. Exophilin4/Slp2-a targets glucagon granules to the plasma membrane through unique Ca2+-inhibitory phospholipid-binding activity of the C2A domain. Mol. Biol. Cell 18, 688696 (2007). https://doi.org:10.1091/mbc.e06-10-0914

      (12) Kurowska, M. et al. Terminal transport of lyXc granules to the immune synapse is mediated by the kinesin-1/Slp3/Rab27a complex. Blood 119, 3879-3889 (2012). https://doi.org:10.1182/blood-2011-09-382556

      (13) Zhao, S., Torii, S., Yokota-Hashimoto, H., Takeuchi, T. & Izumi, T. Involvement of Rab27b in the regulated secretion of pituitary hormones. Endocrinology 143, 1817-1824 (2002). https://doi.org:10.1210/endo.143.5.8823

      (14) Kariya, Y. et al. Rab27a and Rab27b are involved in stimulation-dependent RANKL release from secretory lysosomes in osteoblastic cells. J Bone Miner Res 26, 689-703 (2011). https://doi.org:10.1002/jbmr.268

      (15) Zhao, K. et al. Functional hierarchy among different Rab27 effectors involved in secretory granule exocytosis. Elife 12 (2023). https://doi.org:10.7554/eLife.82821

      (16) Izumi, T. Physiological roles of Rab27 effectors in regulated exocytosis. Endocr J 54, 649-657 (2007). https://doi.org:10.1507/endocrj.kr-78

      (17) Bomba-Warczak, E. & Savas, J. N. Long-lived mitochondrial proteins and why they exist. Trends in cell biology 32, 646-654 (2022). https://doi.org:10.1016/j.tcb.2022.02.001

      (18) Curtin, J. F., Donovan, M. & Cotter, T. G. Regulation and measurement of oxidative stress in apoptosis. Journal of Immunological Methods 265, 49-72 (2002). https://doi.org:https://doi.org/10.1016/S0022-1759(02)00070-4

      (19) Criddle, D. N. et al. Menadione-induced Reative Oxygen Species Generation via Redox Cycling Promotes Apoptosis of Murine Pancreatic Acinar Cells. Journal of Biological Chemistry 281, 40485-40492 (2006). https://doi.org:https://doi.org/10.1074/jbc.M607704200

    1. Author response:

      The following is the authors’ response to the original reviews.

      Reviewer #1 (Public Reviews):

      Weaknesses: 

      Overall I find the data presented compelling, but I feel that the number of observations is quite low (typically n=3-7 neurons, typically one per animal). While I understand that only a few slices can be obtained for the IPN from each animal, the strength of the novel findings would be more convincing with more frequent observations (larger n, more than one per animal). The findings here suggest that the authors have identified a novel mechanism for the normal function of neurotransmission in the IPN, so it would be expected to be observable in almost any animal. Thus,  it is not clear to me why the authors investigated so few neurons per slice and chose to combine different treatments into one group (e.g. Figure 2f), even if the treatments have the same expected effect.  

      This is a well taken suggestion. However, we must  point out that we do perform statistical analyses on the original datasets and we believe that our conclusions are justified as acknowledged by the Reviewer. As the Reviewer is aware,  the IPN is a small nucleus and with the slicing protocol used, we typically attain 1-2 slices per mouse that are suitable for recordings. Since most of the experiments in the manuscript deals with some form of pharmacological interrogation, we were reticent to use slices that are not naïve and therefore in general did not perform more than 1 cell recording per slice. Having said this, to comply with the Reviewer’s suggestion we have now performed additional experiments to increase the n number for certain experiments. We have amended all figures and legends to incorporate the additional data. We must point out that during the replotting of the data in the summary Figure 8i (previously Figure 7i) we noticed an error with the data representation of the TAC IPL data and have now corrected this oversight  

      Figure 2b,c. 

      500nM DAMGO effect on TAC IPL AMPAR EPSC – n increased from 5 to 9

      Figure 3g. 

      500nM DAMGO effect on CHAT IPR AMPAR EPSC – n increased from 8 to 16 Effect of CTAP on DAMGO on CHAT IPR AMPAR EPSC – n increased from 4 to 7

      Figure 3i. 

      500nm DAMGO or Met-enk effect in “silent” CHAT IPR AMPAR EPSC – n increased    from 7 to 9

      Figure 4e. 

      500nM DAMGO effect on ES coupling – Note: in the original version the n number was 5 and not 7 as written in the figure legend. We have now increased the n from 5 – 9.

      Figure 5e,f. 

      500nM DAMGO effect on TAC IPR AMPAR EPSC – n increased from 5 to 9

      Figure 7f.

      Effect of DHE on EPSC amplitude after application of DNQX/APV/4-AP or DTX-α – n increased from 7-9.

      Figure 7g.

      Emergence of nAChR EPSC after DTX – n increased from 4 to 7

      Figure 7i. 

      Effect of ambenonium on nAChR amplitude and charge – n increased from 4 to 7

      Supplementary Figure 3c and h

      Effect of DAMGO after DNQX – n increased from 4 to 7

      Effect of DNQX after DAMGO mediated potentiation – n increased from 3 to 5.

      Throughout the study (Figs. 3i, 7f and 8h in the revised manuscript)  we do indeed pool datasets that were amassed from different conditions since we were not directly investigating the possibility of any deviation in the extent of response between said treatments. For example, and as pointed out by the Reviewer, in Fig. 2F (now Fig. 3i) the use of DAMGO and met-ENK were merely employed to ascertain whether light-evoked synaptic transmission (ChATCre:ai32 mice) in cells that had no measurable EPSC could be pharmacologically “unsilenced” by mOR activation. Thus, the means by which mOR receptor was activated was not relevant to this specific question. Note: 2 more recordings are now added to this dataset (Fig. 3i) that were taken from ChATChR2/SSTCre:ai9 mice in response to the comment by this Reviewer below (“Are there baseline differences in the electrophysiological or morphological properties of these "silent" neurons compared to the responsive neurons?”).  Similarly, in the revised Fig.7f we pooled data investigating the pharmacological block of the EPSC that emerged following application of either DNQX/APV/4-AP or DNQX/APV/DTX. Low concentrations 4-AP or DTX were interchangeably employed to reveal the DNQX-insensitive EPSC that we go on to show is indeed the nAChR response. Finally, in Fig. 8h, we pooled data demonstrating a  lack of effect of DAMGO in potentiating  both the glutamatergic and cholinergic arms of synaptic transmission in the OPRM1 KO mice. Again, here we were only interested in determining whether removal of mOR expression prevented potentiation of transmission mediated by mHB ChAT neurons irrespective of neurotransmitter modality.  Thus, overall we were careful to only pool data in those instances where it  would not change the interpretation and hence conclusions reached. 

      There are also significant sex differences in nAChR expression in the IPN that might not be functionally apparent using the low n presented here. It would be helpful to know which of the recorded neurons came from each sex, rather than presenting only the pooled data.  

      As the reviewer correctly states there are veins of literature concerning a divergence, based on sex, of not only nicotinic receptor expression but also behaviors associated with nicotine addiction. However, we have reanalyzed our datasets focusing on the extent of the mOR potentiation of glutamatergic and cholinergic transmission mediated by mHB ChAT neurons in IPR  between male and female mice. Please refer to the Author response image 1 below. Although there is a possible trend towards a higher potentiation of nAChR in female mice, this was not found to be of statistical significance (see Author response image 1 below). We therefore chose not to split our data in the manuscript based on gender.

      Author response image 1.

      Comparison of the mOR (500nM DAMGO) mediated potentiation on evoked (a) AMPAR and (b) nAChR  EPSCs in IPR between male and female mice.  

      There are also some particularly novel observations that are presented but not followed up on, and this creates a somewhat disjointed story. For example, in Figure 2, the authors identify neurons in which no response is elicited by light stimulation of ChAT-neurons, but the application of DAMGO (mOR agonist) un-silences these neurons. Are there baseline differences in the electrophysiological or morphological properties of these "silent" neurons compared to the responsive neurons?  

      Unfortunately, we did not routinely measure intrinsic properties of the recorded postsynaptic neurons nor systematically recovered biocytin fills to assess morphology. Therefore, it remains unclear whether the  neurons in which there were none or minimal AMPAR-mediated EPSCs are distinct to the ones displaying measurable responses. The IPR is resident to GABAergic SST neurons that comprise the most numerous neuron type in this IPN subdivision. Although heavily outnumbered by the SST neurons there are additionally VGluT3+ glutamatergic neurons in IPN. The Reviewer is likely referring to a recent study investigating synaptic transmission specifically onto  SST+ and VGluT3+ neurons in IPN demonstrating that mHB cholinergic mediated glutamatergic input is “weaker” onto the glutamatergic neurons. Furthermore, in some instances synaptic transmission onto this latter population can be “unsilenced” by GABAB receptor activation in a similar manner to that seen with mOR activation in this manuscript when IPR neurons are blindly targeted(Stinson & Ninan, 2025).  Using a similar strategy as in this recent study(Stinson & Ninan, 2025), we now include experiments in which the ChATChR2 mouse was crossed with  a SSTCre:Ai14. This allowed for recording of postsynaptic EPSCs in directly identified SST IPR neurons. We demonstrate that DAMGO can indeed increase glutamatergic EPSCs and in 2 of the cells where light activation demonstrated no appreciable AMPAR EPSC upon maximal LED light activation, DAMGO clearly “unsilenced” transmission.  Thus, our additional analyses directly demonstrate that our original observations concerning mOR modulation extend to the mHb cholinergic AMPAR mediated input onto IPR SST neurons. This additional data is in the revised manuscript (Figure 3D-F, I). Future experimentation will be required to determine if the propensity of encountering a  “silent” input that can be converted to robust synaptic transmission by mOR differs between these two cell types. Furthermore, it will be of interest to investigate if any differences exist in the magnitude of the cholinergic input or the mOR mediated potentiation of co-transmission between postsynaptic SST GABA and glutamatergic neuronal subtypes. 

      Reviewer #2 (Public review)

      Weaknesses: 

      The genetic strategy used to target the mHb-IPN pathway (constitutive expression in all ChAT+ and Tac1+ neurons) is not specific to this projection.  

      This is an important point made. We are acutely aware that the source of the synaptic input in IPN mediated by conditional expression of ChR2 employing  using transgenic cre driver lines does not confer specificity to mHB. This is particularly relevant considering one of the novel observations here relates to  a previously unidentified functional input from TAC1 neurons to the IPR. At this juncture we would like to point the Reviewer to the publicly available Connectivity Atlas provided by the Allen Brain Institute (https://connectivity.brain-map.org/). With reference to mHB TAC1 neuronal output, targeted viral injection into the habenula of Tac1Cre mice allows conditional expression of EGFP to SP neurons as evidenced by the predominant expression of reported fluorescence in dorsal mHB (see Author response image 2 a,b below). Tracing the axonal projections to the IPN clearly demonstrates dense fibers in IPL as expected but also arborization in  IPR (Author response image 2 a,c) . This pattern is reminiscent of that seen in the transgenic Tac1Cre:ai9 or ai32 mice used in the current study (Figs. 1c, 2a, 5c). Closer inspection of the fibers in the IPR reveals putative synaptic bouton like structures as we have shown in Fig. 5a,b (Author response image 2 d below).

      Author response image 2.

      Sterotaxic viral injection into mHB pf Tac1Cre mice taken from Allen Brain connectivity atlas (Link to Connectivity Atlas for mHb SP neuronal projection pattern)

      These anatomical data suggest that part of the synaptic input to the IPR originates from mHB TAC1 neurons although we cannot fully discount additional synaptic input from other brain areas that may impinge on the IPR. Indeed, as the Reviewer points out, it is evident that other regions including the nucleus incertus send outputs to the IPN(Bueno et al., 2019; Liang et al., 2024; Lima et al., 2017). However, it is unclear if neuronal inputs from these alternate sources {Liang, 2024 #123;Lima, 2017 #33}{Bueno, 2019 #178} are glutamatergic in nature AND mediated by a TAC1/OPRM1-expressing neuronal population. Nevertheless, we have now modified text in the discussion to highlight the limitations of using a transgenic strategy (pg 12, para 1).

      In addition, a braking mechanism involving Kv1.2 has not been identified.

      It is unclear to what the Reviewer is referring to here. Although most of our experiments pertaining to the brake on cholinergic  transmission by potassium channels use low concentrations of 4-AP (50100M) which have been used to block Shaker Kv1 channels there although at these concentrations there are additional action at other K+-channels such as Kv3, for instance. However, we essentially demonstrate that a selective Kv1.1 and Kv1.2 antagonist dendrotoxin replicates the 4-AP effects. We have now also included RNAseq data demonstrating the relative expression levels of Kv1 channel mRNA in mHb ChAT neurons (KCNA1 through KCNA6; Figure 6b). The complete absence of KCNA1 yet a high expression level of KCNA2 transcripts highly suggests a central role of Kv1.2 in unmasking nAChR mediated synaptic transmission. 

      Reviewer #3 (Public review)

      Weaknesses:  

      The significance of the ratio of AMPA versus nACh EPSCs shown in Figure 6 is unclear since nAChR EPSCs measured in the K+ channel blockers are compared to AMPA EPSCs in control (presumably 4-AP would also increase AMPA EPSCs). 

      We understand the Reviewer’s concern regarding the calculation of nicotinic/AMPA ratios since they are measured under differing conditions i.e. absence and presence of 4-AP, respectively. As the reviewer correctly points point 4-AP likely increases the amplitude of the AMPA receptor mediated EPSC. However, our intention of calculating this ratio was not to ascertain a measure of relative strengths of fast glutamatergic vs cholinergic transmission onto a given postsynaptic IPN neuron per se. Rather, we used the ratio as a means to normalize the size of the nicotinic receptor EPSC to the strength of the light stimulation (using the AMPA EPSC as the normalizing factor) in each individual recording. This permits a more meaningful comparison across cells/slices/mice . We apologize for the confusion and have amended the text in the results section to reflect this (pg 9; para2).

      The mechanistic underpinnings of the most now  results are not pursued. For example, the experiments do not provide new insight into the differential effects of evoked and spontaneous glutamate/Ach release by Gi/o coupled mORs, nor the differential threshold for glutamate versus Ach release. 

      Our major goal of the current manuscript was to provide a much-needed roadmap outlining the effects of opioids in the habenulo-interpeduncular axis. Of course, a full understanding of the mechanisms underlying such complex opioid actions at the molecular level will be of great value. We feel that this is beyond the scope of this already quite result dense manuscript but will be essential if directed manipulation of the circuit is to be leveraged to alter maladaptive behaviors associated with addiction/emotion during adolescence and in adult. 

      The authors note that blocking Kv1 channels typically enhances transmitter release by slowing action potential repolarization. The idea that Kv1 channels serve as a brake for Ach release in this system would be strengthened by showing that these channels are the target of neuromodulators or that they contribute to activity-dependent regulation that allows the brake to be released. 

      The exact mechanistic underpinnings that can potentially titer Kv1.2 availability and hence nAChR transmission would be essential to shed light on potential in vivo conditions under which this arm of neurotransmission can be modulated. However, we feel that detailed mechanistic interrogation constitutes significant work but one that future studies should aim to achieve. Thus, it presently remains unclear under what physiological or pathological scenarios result in attenuation of Kv1.2 to subsequently promote nAChR mediated transmission but as mentioned in the existing discussion future work to decipher such mechanisms would be of great value.

      Reviewer #1 (Recommendations for the authors): 

      Overall I find this to be a very interesting and exciting paper, presenting novel findings that provide clarity for a problem that has persisted in the IPN field: that of the conundrum that light-evoked cholinergic signaling was challenging to observe despite the abundance of nAChRs in the IPN. 

      Major concerns: 

      (1) The n is quite low in most cases, and in many instances, data from one figure are replotted in another figure. Given that the findings presented here are expected in the normal condition, it should not be difficult to increase the n. A more robust number of observations would strengthen the novel findings presented here. 

      Please refer to the response to the public review above.

      (2) In general, I find the organization of the figures somewhat disjointed. Sometimes it feels as if parts of the information presented in the results are split between figures, where it would make more sense to be together in a figure. For example, all the histology for each of the lines is in Figure 1, but only ephys data for one line is included there. It would be more logical to include the histology and ephys data for each line in its own figure. It would also be helpful to show the overlap of mOR expression with Tac1-Cre and ChAT-Cre terminals in the IPN. Likewise, the summarized Tac1Cre:Ai32 IPR data is in Figure 4, but the individual data is in Figure 5. 

      We introduce both ChAT and TAC1 cre lines in Figure 1 as an overview particularly for those readers who are not entirely familiar with the distinct afferent systems operating with the habenulointerpeduncular pathway.  However, in compliance with the Reviewer’s suggestion we have now restructured the Figures. In the revised manuscript, the functional data pertaining to the various transmission modalities mediated by the distinct afferent systems impinging on the subdivision of the IPN tested are now split into their own dedicated figure as follows:

      Figure 2. 

      mOR effect on TAC1neuronal glutamatergic output in IPL.

      Figure 3. 

      mOR effect on CHAT neuronal glutamatergic output in IPR.

      Figure 5. 

      mOR effect on TAC1neuronal glutamatergic output in IPR.

      Figure 8.

      mOR effect on CHAT neuronal cholinergic output in IPC.

      Supp. Fig. 1 mOR effect on CHAT neuronal glutamatergic output in IPC.

      We thank the Reviewer for their suggestions regarding the style of the manuscript. The restructuring has now resulted in a much better flow of the presented data.

      (3) The discussion is largely satisfactory. However, a little more discussion of the integrative function of the IPN is warranted given the opposing effects of MOR activation in the Tac vs ChAT terminals, particularly in the context of both opioids and natural rewards. 

      We thank the reviewer for this comment. However, we feel the discussion is rather lengthy as is and therefore we refrained from including additional text.  

      Minor concerns: 

      (1)  The methods are missing key details. For example, the stock numbers of each of the strains of mice appear to have been left out. This is of particular importance for this paper as there are key differences between the ChAT-Cre lines that are available that would affect observed electrophysiological properties. As the authors indicate, the ChAT-ChR2 mice overexpress VAChT, while the ChAT-IRES-Cre mice do not have this problem. However, as presented it is unclear which mice are being used. 

      We apologize for the omission - the catalog numbers of the mice employed have now been included in the methods section.

      We have now clearly included in each figure panel (single trace examples and pooled data) from which mice the data are taken from – in some instances the pooled data are from the two CHAT mouse strains employed. Despite the tendency of the ChATChR2 mice to demonstrate more pronounced nAChR mediated transmission (Fig. 7h),  we justify pooling the data since we see no statistical significance in the effect of mOR activation on either potentiating AMPA or nAChR EPSCs (Please refer to response to Reviewer 2, Minor Concern point 2)

      (2) Likewise, antibody dilutions used for staining are presented as both dilution and concentration, which is not typical. 

      We thank the reviewer for pointing out this inconsistency. We have amended the text in the methods to include only the working dilution for all antibodies employed in the study.

      (3) There are minor typos throughout the manuscript. 

      All typos have been corrected.

      Reviewer #2 (Recommendations for the authors): 

      The authors provide a thorough investigation into the subregion, and cell-type effect of mu opioid receptor (MOR) signaling on neurotransmission in the medial habenula to interpeduncular nucleus circuit (mHb-IPN). This circuit largely comprises two distinct populations of neurons: mHb substance P (Tac1+) and cholinergic (ChAT+) neurons. Corroborating prior work, the authors report that Tac1+ neurons preferentially innervate the lateral IPN (IPL) and rostral IPN (IPR), while ChAT+ neurons preferentially innervate the central IPN (IPC) and IPR. The densest expression of MOR is observed in the IPL and MOR agonists produce a canonical presynaptic depression of glutamatergic neurotransmission in this region. Interestingly, MOR signaling in the ChAT+ mHb projection to the IPR potentiates light-evoked glutamate and acetylcholine-mediated currents (EPSC), and this effect is mediated by a MOR-induced inhibition of Kv2.1 channels. 

      Major concerns: 

      (1) The method used for expressing channelrhodopsin (ChR2) into cholinergic and neurokinin neurons in the mHb (Ai32 mice crossed with Cre-driver lines) has limitations because all Tac1+/ChAT+ inputs to the IPN express ChR2 in this mouse. Importantly, the IPN receives inputs from multiple brain regions besides the IPN-containing neurons capable of releasing these neurotransmitters (PMID: 39270652). Thus, it would be important to isolate the contributions of the mHb-IPN pathway using virally expressed ChR2 in the mHb of Cre driver mice. 

      Please refer to the response to the public review above. 

      (2) Figure 4: The authors conclude that the sEPSC recorded from IPR originate from Tac1+ mHbIPR projections. However, this cannot be stated conclusively without additional experimentation. For instance, an optogenetic asynchronous release experiment. For these experiments it would also be important to express ChR2 virus in the mHb in Tac1- and ChAT-Cre mice since glutamate originating from other brain regions could contribute to a change in asynchronous EPSCs induced by DAMGO. 

      This is a well taken point. The incongruent effect of DAMGO on evoked CHAT neuronal EPSC amplitude and sEPSC frequency prompted us  to consider the the possibility of differing effect of DAMGO on a  secondary input. We agree that we do not show directly if the sEPSCs originate from a TAC1 neuronal population. Therefore, we have tempered our wording with regards the origin of the sEPSCs and  have also restructured the Figure in question moving the sEPSC data into supplemental data (Supplemental Fig. 2) 

      (3) Figure 5D: lt would be useful to provide a quantitative measure in a few mice of mOR fluorescence across development (e.g. integrated density of fluorescence in IPR). 

      We have now included mOR expression density across development  (Fig. 6). Interestingly, the adult expression levels of mOR in the IPR are essentially reached at a very early developmental age (P10) yet we see stark differences in the role of mOR activation in modulating glutamatergic transmission mediated by mHB cholinergic neurons. Note: since we processed adult tissue (i.e. >p40) for these developmental analyses we utilized these slices to also include an analysis of the relative mOR expression density specifically in adults between the subdivisions of IPN in Fig. 1.

      (4) Figure 6B: It would be useful to quantify the expression of Kcna2 in ChAT and Tac1 neurons (e.g. using FISH). 

      We thank the Reviewer for this suggestion. We have now included mRNA expression levels available from publicly available 10X RNA sequencing dataset provided by the Allen Brain Institute (Figure 7b).  

      (5) It would be informative to examine what the effects of MOR activation are on mHb projections to the (central) . 

      In response to this suggestion, we now have included  additional data in the manuscript in putative IPC cells that clearly demonstrate a similar DAMGO elicited potentiation of AMPAR EPSC to that  seen in IPR. These data are now included in the revised manuscript  (Supplemental Fig. 1; Fig. 8i). 

      (6) What is the proposed link between MOR activation and the inhibition of Kv1.2 (e.g. beta-Arrestin signaling, G beta-gamma interaction with Kv1.2, PKA inhibition?) 

      We apologize for any confusion. We do not directly test whether the potentiation of EPSCs upon mOR activation occurs via inhibition of Kv1.2.Although we have not directly tested this possibility we find it an unlikely underlying cellular mechanism, especially for the potentiation of the cholinergic arm of neurotransmission since in the presence of DNQX/APV, the activation of mOR does not result in any emergence of any nAChR EPSC (see Supplementary Fig. 3a-c)

      Minor concerns: 

      (1) Methods: Jackson lab ID# for used mouse strains is missing. 

      We apologize for this omission and have now included the mouse strain catalog numbers.

      (2) The authors use data from both ChAT-Cre x Ai32 and ChAT-ChR2 mice. It would be helpful to show some comparisons between the lines to justify merging data sets for some of the analyses as there appear to be differences between the lines (e.g. Figure 6G). 

      This is a well taken point. We have now provided a figure for the Reviewer (see below) that illustrates the lack of  significant difference between the mOR mediated potentiation of both mHB CHAT neuronal AMPAR and nAChR transmission between the two mouse lines employed despite a divergence in the extent of glutamatergic vs cholinergic transmission shown in Fig. 7g (previously Figure 6g). We have chosen not to include this data in the revised manuscript.

      Author response image 3.

      Comparison of the mOR (500nM DAMGO) mediated potentiation on evoked AMPAR (a) and nAChR (b)EPSCs in IPR between ChATCre:Ai32  and ChATChR2 mice.

      (3)  Line 154: How was it determined that the EPSC is glutamatergic? 

      We apologize for any confusion. In the revised manuscript we now clearly point to the relevant figures (see Supplementary Figs. 2a and 3) in the Results section (pg. 4, para 2; pg 7, para 1; pg 8, para2) where we determine that both the sEPSCs and ChAT mediated light evoked EPSCs recorded under baseline conditions are totally blocked by DNQX and hence are exclusively AMPAR events 

      (4) It would be helpful to discuss the differences between GABA-B mediated potentiation of mHbIPN signaling and the current data in more detail. 

      We are unclear as to what differences the Reviewer is referring to. At least from the perspective of ChAT neuronal mediated synaptic transmission, other groups (and in the current study; Fig. 7h) have clearly shown that GABA<sub>B</sub> activation markedly potentiates synaptic transmission like mOR activation. Nevertheless, based on our novel findings it would be of interest to determine whether the influence of GABA<sub>B</sub> is inhibitory onto the TAC mediated input in IPR and whether there is a developmental regulation of this effect as we demonstrate upon mOR activation. These additional comparisons between the effect of the two Gi-linked receptors may shed light onto the similarity, or lack thereof, regarding the underlying cellular mechanisms. We now have included a few sentences in the discussion to highlight this (pg 11, para 1).

      Reviewer #3 (Recommendations for the authors): 

      The abstract was confusing at first read due to the complex language, particularly the sentence starting with... Further, specific potassium channels... 

      The authors might want to consider simplifying the description of the experiments and the results to clarify the content of the manuscript for readers who many only read the abstract. 

      We have altered the wording of the abstract and hope it is now more reader friendly.

      The opposite effect of mOR activation on spontaneous EPSCs versus electrical or ChR2-evoked EPSCs is very interesting and raises the issue of which measure is most physiologically relevant. For example, it is unclear whether sEPSCs arise primarily from cholinergic neurons (that are spontaneously active in the slice, Figure 3), and if so, does mOR activation suppress or enhance cholinergic neuron excitability and/or recruitment by ChR2? While a full analysis of this question is beyond the scope of this manuscript, the assumption that glutamate release assayed by electrical/ChR2 evoked transmission is the most physiologically relevant might merit some discussion since sEPSCs presumably also reflect action-potential dependent glutamate release. One wonders whether mORs hyperpolarize cholinergic neurons to reduce spontaneous spiking yet enhance fiber recruitment by ChR2 or an electrical stimulus (i.e. by removing Na channel inactivation). The authors have clearly stated that they do not know where the mORs are located, and that the effects arising from disinhibition are likely complex. But they also might discuss whether glutamate release following synchronous activation of a fiber pathway by ChR2 or electrode is more or less physiologically relevant than glutamate release assayed during spontaneous activity. It seems likely that an equivalent experiment to Figure 3D, E using spontaneous spiking of IPR neurons would show that spiking is reduced by mOR activation. 

      We thank the Reviewer for this comment. As pointed it would be of interest to dissect the “network” effect of mOR activation but as the Reviewer acknowledges this is beyond the scope of the current manuscript. The Reviewer is correct in postulating that mOR activation results in hyperpolarization of mHB ChAT neurons.  A recent study(Singhal et al 2025) demonstrate that a subpopulation of ChAT neurons undergoes a reduction in firing frequency following DAMGO application. This is corroborated by our own observations although we chose not to include this data in our current manuscript (but see below).

      Additionally, the Reviewer questions whether ChR2/electrical stimulation is physiological. This is a well taken point and of course the simultaneous activation of potentially all possible axonal release sites is not the mode under which the circuit operates. Nevertheless, our data clearly demonstrates the ability of mORs to modulate release under these circumstances that must reflect an impact on spontaneous action potential driven evoked release.  Although the suggested experiment  could shed light on the synaptic outcomes of mOR receptor activation on ES coupling of downstream IPN neurons. Interpretation of the outcome would be confounded by the fact that postsynaptic IPN neurons also express mORs . Thus,  we would not be able to isolate the effects of presynaptic changes in modulating ES coupling from any direct postsynaptic effect on the recorded cell when in current clamp. 

      Together these additional sites of action of mOR (i.e. mHB ChAT somatodendritic and postsynaptic IPN neuron) only serve to further highlight the complex nature of the actions of opioids on the habenulo-interpeduncular axis warranting  future work to fully understand the physiological and pathological effects on the habenulo-interpeduncular axis as a whole.

      The idea that Kv2.1 channels serve as a brake raises the question of whether they contribute to activity-dependent action potential broadening to facilitate Ach release during trains of stimuli. 

      This is an interesting suggestion and one that we had considered ourselves. Indeed, as the Reviewer is likely aware and as mentioned in the manuscript, previous studies have shown nAChR signaling can be revealed under conditions of multiple stimulations given at relatively high frequencies.  We therefore attempted to perform high frequency stimulation (20 stimulations at 25Hz and 50Hz) in the presence of ionotropic glutamatergic receptor antagonists DNQX and APV. We have now included this data in the revised manuscript (Supplementary Fig 3b). As shown, this failed to engage nAChR mediated synaptic transmission in our hands. Interestingly there is evidence from reduced expression systems demonstrating that Kv1.2 channels undergo use-dependent potentiation(Baronas et al., 2015) in contrast to that seen with other K+-channels. Whether this is the case for the axonal Kv1.2 channels on mHB axonal terminals in situ is not known but this may explain the inability to reveal nAChR EPSCs upon delivery of such stimulation paradigms.  

      References 

      Baronas, V. A., McGuinness, B. R., Brigidi, G. S., Gomm Kolisko, R. N., Vilin, Y. Y., Kim, R. Y., … Kurata, H. T. (2015). Use-dependent activation of neuronal Kv1.2 channel complexes. J Neurosci, 35(8), 3515-3524. doi:10.1523/JNEUROSCI.4518-13.2015

      Bueno, D., Lima, L. B., Souza, R., Goncalves, L., Leite, F., Souza, S., … Metzger, M. (2019). Connections of the laterodorsal tegmental nucleus with the habenular-interpeduncular-raphe system. J Comp Neurol, 527(18), 3046-3072. doi:10.1002/cne.24729

      Liang, J., Zhou, Y., Feng, Q., Zhou, Y., Jiang, T., Ren, M., … Luo, M. (2024). A brainstem circuit amplifies aversion. Neuron. doi:10.1016/j.neuron.2024.08.010

      Lima, L. B., Bueno, D., Leite, F., Souza, S., Goncalves, L., Furigo, I. C., … Metzger, M. (2017). Afferent and efferent connections of the interpeduncular nucleus with special reference to circuits involving the habenula and raphe nuclei. J Comp Neurol, 525(10), 2411-2442. doi:10.1002/cne.24217

      Singhal, S. M., Szlaga, A., Chen, Y. C., Conrad, W. S., & Hnasko, T. S. (2025). Mu-opioid receptor activation potentiates excitatory transmission at the habenulo-peduncular synapse. Cell Rep, 44(7), 115874. doi:10.1016/j.celrep.2025.115874

      Stinson, H.E., & Ninan, I. (2025). GABA(B) receptor-mediated potentiation of ventral medial habenula glutamatergic transmission in GABAergic and glutamatergic interpeduncular nucleus neurons. bioRxiv doi.10.1101/2025.01.03.631193

    1. Author response:

      The following is the authors’ response to the original reviews.

      Reviewer #1 (Public review):

      Summary:

      This manuscript investigated the mechanism underlying boundary formation necessary for proper separation of vestibular sensory end organs. In both chick and mouse embryos, it was shown that a population of cells abutting the sensory (marked by high Sox2 expression) /nonsensory cell populations (marked by Lmx1a expression) undergo apical expansion, elongation, alignment and basal constriction to separate the lateral crista (LC) from the utricle. Using Lmx1a mouse mutant, organ cultures, pharmacological and viral-mediated Rock inhibition, it was demonstrated that the Lmx1a transcription factor and Rock-mediated actomyosin contractility is required for boundary formation and LC-utricle separation.

      Strengths:

      Overall, the morphometric analyses were done rigorously and revealed novel boundary cell behaviors. The requirement of Lmx1a and Rock activity in boundary formation was convincingly demonstrated.

      Weaknesses:

      However, the precise roles of Lmx1a and Rock in regulating cell behaviors during boundary formation were not clearly fleshed out. For example, phenotypic analysis of Lmx1a was rather cursory; it is unclear how Lmx1a, expressed in half of the boundary domain, control boundary cell behaviors and prevent cell mixing between Lmx1a+ and Lmx1a- compartments? Well-established mechanisms and molecules for boundary formation were not investigated (e.g. differential adhesion via cadherins, cell repulsion via ephrin-Eph signaling). Moreover, within the boundary domain, it is unclear whether apical multicellular rosettes and basal constrictions are drivers of boundary formation, as boundary can still form when these cell behaviors were inhibited. Involvement of other cell behaviors, such as radial cell intercalation and oriented cell division, also warrant consideration. With these lingering questions, the mechanistic advance of the present study is somewhat incremental.

      We have acknowledged the lingering questions this referee points out in our Discussion and agree that the roles of differential cell adhesion and cell intercalation would be worth exploring in further studies. Despite these remaining questions, the conceptual advances are significant, since this study provides the first evidence that a tissue boundary forms in between segregating sensory organs in the inner ear (there are only a handful of embryonic tissues in which a tissue boundary has been found in vertebrates) and highlights the evolutionary conservation of this process. This work also provides a strong descriptive basis for any future study investigating the mechanisms of tissue boundary formation in the mouse and chicken embryonic inner ear. 

      Reviewer #2 (Public review):

      Summary:

      Chen et al. describe the mechanisms that separate the common pan-sensory progenitor region into individual sensory patches, which presage the formation of the sensory epithelium in each of the inner ear organs. By focusing on the separation of the anterior and then lateral cristae, they find that long supra-cellular cables form at the interface of the pansensory domain and the forming cristae. They find that at these interfaces, the cells have a larger apical surface area, due to basal constriction, and Sox2 is down-regulated. Through analysis of Lmx1 mutants, the authors suggest that while Lmx1 is necessary for the complete segregation of the sensory organs, it is likely not necessary for the initial boundary formation, and the down-regulation of Sox2.

      Strengths:

      The manuscript adds to our knowledge and provides valuable mechanistic insight into sensory organ segregation. Of particular interest are the cell biological mechanisms: The authors show that contractility directed by ROCK is important for the maintenance of the boundary and segregation of sensory organs.

      Weaknesses:

      The manuscript would benefit from a more in-depth look at contractility - the current images of PMLC are not too convincing. Can the authors look at p or ppMLC expression in an apical view? Are they expressed in the boundary along the actin cables? Does Y-27362 inhibit this expression?

      The authors suggest that one role for ROCK is the basal constriction. I was a little confused about basal constriction. Are these the initial steps in the thinning of the intervening nonsensory regions between the sensory organs? What happens to the basally constricted cells as this process continues?

      In our hands, the PMLC immunostaining gave a punctate staining in epithelial cells and was difficult to image and interpret in whole-mount preparations, which did not allow us to investigate its specific association to the actin-cable-like structures. It is a very valuable suggestion to try alternative methods of fixation to improve the quality of the staining and images in future work. 

      The basal constriction of the cells at the border of the sensory organs was not always clearly visible in freshly-fixed samples, and was absent in the majority of short-term organotypic cultures in control medium, which made it impossible to ascertain the role of ROCK in its formation using pharmacological approaches in vitro (see Figure 7 and corresponding Result section).  On the other hand, the overexpression of a dominant-negative form of ROCK (RCII-GFP) in ovo using RCAS revealed a persistence of basal constriction in transfected cells despite a disorganisation of the boundary domain (Figure 8). We conclude from these experiments that ROCK activity is not necessary for the formation and maintenance of the basal constriction. We also remain uncertain about the exact role of this basal constriction. It could be either a cause or consequence of the expansion of the apical surface of cells in the boundary domain, it could contribute to the limitation of cell intermingling and the formation of the actin-cable-like structure at the interface of Lmx1a-expressing and non-expressing cells, and may indeed prefigure some of the further changes in cell morphology occurring in non-sensory domains separating the sensory organs (cell flattening and constrictions of the epithelial walls in between sensory organs). 

      The steps the authors explore happen after boundaries are established. This correlates with a down-regulation of Sox2, and the formation of a boundary. What is known about the expression of molecules that may underlie the apparent interfacial tension at the boundaries? Is there any evidence for differential adhesion or for Eph-Ephrin signalling? Is there a role for Notch signalling or a role for Jag1 as detailed in the group's 2017 paper?

      Great questions. It is indeed likely that some form of differential cell tension and/or adhesion participates to the formation and maintenance of this boundary, and we have mentioned in the discussion some of the usual suspects (cadherins, eph/ephrin signalling,…) although it is beyond the scope of this paper to determine their roles in this context. 

      As we have discussed in this paper and in our 2017 study (see also Ma and Zhang, Development,  2015 Feb 15;142(4):763-73. doi: 10.1242/dev.113662) we believe that Notch signalling is maintaining prosensory character, and its down-regulation by Lmx1a/b expression is required for the specification of the non-sensory domains in between segregating sensory organs. Although we have not tested this directly in this study, any disruption in Notch signalling would be expected to affect indirectly the formation or maintenance of the boundary domain. 

      A comment on whether cellular intercalation/rearrangements may underlie some of the observed tissue changes.

      We have not addressed this topic directly in the present study but we have included a brief comment on the potential implication of cellular intercalation and rearrangements in the discussion: “It is also possible that the repositioning of cells through medial intercalation could contribute to the straightening of the boundary as well as the widening of the nonsensory territories in between sensory patches.”

      The change in the long axis appears to correlate with the expression of Lmx1a (Fig 5d). The authors could discuss this more. Are these changes associated with altered PCP/Vangl2 expression?

      We are not sure about the first point raised by the referee. We have quantified cell elongation and orientation in Lmx1a-GFP heterozygous and homozygous (null) mice, and our results suggest that the elongation of the cells occurs throughout the boundary domain, and is probably not dependent on Lmx1a expression (boundary cells are in fact more elongated in the Lmx1a mutant).  We have not investigated the expression of components of the planar cell polarity pathway. This is a very interesting suggestion, worth exploring in further studies.

      Reviewer #3 (Public review):

      Summary:

      Lmx1a is an orthologue of apterous in flies, which is important for dorsal-ventral border formation in the wing disc. Previously, this research group has described the importance of the chicken Lmx1b in establishing the boundary between sensory and non-sensory domains in the chicken inner ear. Here, the authors described a series of cellular changes during border formation in the chicken inner ear, including alignment of cells at the apical border and concomitant constriction basally. The authors extended these observations to the mouse inner ear and showed that these morphological changes occurred at the border of Lmx1a positive and negative regions, and these changes failed to develop in Lmx1a mutants. Furthermore, the authors demonstrated that the ROCK-dependent actomyosin contractility is important for this border formation and blocking ROCK function affected epithelial basal constriction and border formation in both in vitro and in vivo systems.

      Strengths:

      The morphological changes described during border formation in the developing inner ear are interesting. Linking these changes to the function of Lmx1a and ROCK dependent actomyosin contractile function are provocative.

      Weaknesses:

      There are several outstanding issues that need to be clarified before one could pin the morphological changes observed being causal to border formation and that Lmx1a and ROCK are involved.

      We have addressed the specific comments and suggestions of the reviewer below. We wish however to point out that we do not think that ROCK activity is required for the formation or maintenance of the basal constriction at the interface of Lmx1a-expressing and nonexpressing cells (see previous answer to referee #2)

      Reviewer #1 (Recommendations for the authors):

      Specific comments:

      (1) Figures 1 and 2, and related text. Based on the whole-mount images shown, the anterior otocyst appeared to be a stratified epithelium with multiple cell layers. If so, it should be clarified whether the x-y view of in the "apical" and "basal" plane are from cells residing in the apical and basal layers, respectively. Moreover, it would be helpful to include a "stage 4", a later stage to show if and when basal constrictions resolve.

      In fact, at these early stages of development, the otic epithelium is “pseudostratified”: it is formed by a single layer of irregularly shaped cells, each extending from the base to the apical aspect of the epithelium, but with their nuclei residing at distinct positions along this basal-apical axis as mitotic cells progress through the cell cycle.  The nuclei divide at the surface of the epithelium, then move back to the most basal planes within daughter cells during interphase. This process, known as interkinetic nuclear migration, has been well described in the embryonic neural tube and occurs throughout the developing otic epithelium (e.g. Orr, Dev Biol. 1975, 47,325-340, Ohta et al., Dev Biol. 2010 Sep 15;347(2):369–381. doi: 10.1016/j.ydbio.2010.09.002; ). Consequently, the nuclei visible in apical or basal planes in x-y views belong to cells extending from the base to the apex of the epithelium, but which are at different stages of the cell cycle. 

      We have not included a late stage of sensory organ segregation in this study (apart from a P0 stage in the mouse inner ear, see Figure 4) since data about later stages of sensory organ morphogenesis are available in other studies, including our Mann et al. eLife 2017 paper describing Lmx1a-GFP expression in the embryonic mouse inner ear.

      (2) Related to above, the observed changes in cell organization raised the possibility that the apical multicellular rosettes and basal constrictions observed in Stage 3 (and 2) could be intermediates of radial cell intercalations, which would lead to expansion of the space between sensory organs and thinning of the boundary domains. To see if it might be happening, it would be helpful to include DAPI staining to show the overall tissue architecture at different stages and use optical reconstruction to assess the thickness of the epithelium in the presumptive boundary domain over time.

      We agree with this referee. Besides cell addition by proliferation and/or changes in cell morphology, radial cell intercalations could indeed contribute to the spatial segregation of inner ear sensory organs (a brief statement on this possibility was added to the Discussion). It is clear from images shown in Figure 4 (and from other studies) that the non-sensory domain separating the cristae from the utricle gets flatter and its cells also enlarge as development proceeds. We do not think that DAPI staining is required to demonstrate this. Perhaps the best way to show that radial cell intercalations occur would be to perform liveimaging of the otic epithelium, but this is technically challenging in the mouse or chicken inner ear. An alternative model system might be the zebrafish inner ear, in which some liveimaging data have shown a progressive down-regulation of Jag1 expression during sensory organ segregation (and a flattening of “boundary domains”), suggesting a conservation of the basic mechanisms at play (Ma and Zhang, Development,  2015 Feb 15;142(4):763-73. doi: 10.1242/dev.113662).

      (3) Similarly, it would be helpful to include the DAPI counterstain in Figures 4, 7, and 8 to show the overall tissue architecture.

      We do not have DAPI staining for these particular images but in most cases, Sox2 immunostaining gives a decent indication of tissue morphology. 

      (4) Figure 2(z) and Figure 4d. The arrows pointing at the basal constrictions are obstructing the view of the basement membrane area, making it difficult to appreciate the morphological changes. They should be moved to the side. Can the authors comment whether they saw evidence for radial intercalations (e.g. thinning of the boundary domain) or partial unzippering of adjoining compartments along the basal constrictions?

      The arrows in Figure 2(z) and Figure 4d have been moved to the side of the panels. 

      See previous comment. Besides the presence of multicellular rosettes, we have not seen direct evidence of radial cell intercalation – this would be best investigated using liveimaging. As development proceeds, the epithelial domain separating adjoining sensory organs becomes wider. The cells that compose it gradually enlarge and flatten, as can be seen for example at P0 in the mouse inner ear (Figure 4g). 

      (5) Figures 3 and 5, and related text. It should be clarified whether the measurements were all taken from the surface cells. For Fig. 3e and 5d, the mean alignment angles of the cell long axis in the boundary regions should be provided in the text.

      The sensory epithelium in the otocyst is pseudostratified, hence, the measurement was taken from the surface of all epithelial cells labelled with F-actin. 

      We have added histograms representing the angular distribution of the cell long axis orientations in the boundary region to Figure 3 and Figure 5 Supplementary 1. We believe that this type of representation is more informative than the numerical value of the mean alignment angles of the cell long axis for defined sub-domains. 

      (6) It would be helpful to also quantify basal constrictions using the cell skeleton analysis. In addition, it would be helpful to show x-y views of cell morphology at the level of basal constrictions in the mouse tissue, similar to the chick otocyst shown in Figure 2.

      The data that we have collected do not allow a precise quantification of basal constrictions with cell skeleton analysis, due to the generally fuzzy nature of F-actin staining in the basal planes of the epithelium. However, we have followed the referee’s advice and analysed Factin staining in x-y views in the Lmx1a-GFP knock-in (heterozygous) mice. We found that the first signs of basal F-actin enrichment and multicellular actin-cable like structures at the interface of Lmx1a-positive and negative cells are visible at E11.5, and F-actin staining in the basal planes increases in intensity and extent at E13.5. (shown in new Figure 4 – Supplementary Figure 1).

      (7) Figure 5 and related text. It would be informative to analyze Lmx1a mutants at early stages (E11-E13) to pinpoint cell behavior defects during boundary formation.

      We chose the E15 stage because it is one at which we can unequivocally recognize and easily image and analyse the boundary domain from a cytoarchitectural point of view. We recognize that it would have been worth including earlier stages in this analysis but have not been able to perform these additional studies due to time constraints and unavailability of biological material. 

      (8) Figure 5-Figure S1, the quantifications suggest that Lmx1a loss had both cellautonomous and non-autonomous effects on boundary cell behaviors. This is an interesting finding, and its implication should be discussed.

      It is well-known that the absence of Lmx1a function induces a very complex (and variable) phenotype in terms of inner ear morphology and patterning defects. It is also clear from this study that the absence of Lmx1 causes non-cell autonomous defects in the boundary domain and we have already mentioned this in the discussion: “Finally, the patterning abnormalities in Lmx1a<sup>GFP/GFP</sup> samples occurred in both GFP-positive and negative territories, which points at some type of interaction between Lmx1a-expressing and nonexpressing cells, and the possibility that the boundary domain is also a signalling centre influencing the differentiation of adjacent territories.”

      (9) Figure 6 and related text. To correlate myosin II activity with boundary cell behaviors, it would be important to immunolocalize pMLC in the boundary domain in whole-mount otocyst preparations from stage 1 to stage 3.

      We tried to perform the suggested immunostaining experiments, but in our hands at least, the antibody used did not produce good quality staining in whole-mount preparations. We have therefore included images of sectioned otic tissue, which show some enrichment in pMLC immunostaining at the interface of segregating organs (Figure 6).

      (10) Figures 7 and 8. A caveat of long-term Rock inhibition is that it can affect cell proliferation and differentiation of both sensory and non-sensory cells, which would cause secondary effects on boundary formation. This caveat was not adequately addressed. For example, does Rock signaling control either the rate or the orientation of cell division to promote boundary formation? Together with the mild effect of acute Rock inhibition, the precise role of Rock signaling in boundary formation remains unclear.

      We absolutely agree that the exact function of ROCK could not be ascertained in the in vitro experiments, for the reasons we have highlighted in the manuscript (no clear effect in short term treatments, great level of tissue disorganisation in long-term treatments). This prompted us to turn to an in ovo approach. The picture remains uncertain in relation to the role of ROCK in regulating cell division/intercalation but we have been at least able to show a requirement for the maintenance of an organized and regular boundary. 

      (11) Figure 8. RCII-GFP likely also have non-autonomous effects on cell apical surface area. In 8d, it would be informative to include cell area quantifications of the GFP control for comparison.

      It is possible that some non-autonomous effects are produced by RCII-GFP expression, but these were not the focus of the present study and are not particularly relevant in the context of large patches of overexpression, as obtained with RCAS vectors. 

      We have added cell surface area quantifications of the control RCAS-GFP construct for comparison (Figure 8e).

      (12) The significance of the presence of cell divisions shown in Figure 9 is unclear. It would be informative to include some additional analysis, such as a) quantify orientation of cell divisions in and around the boundary domain and b) determine whether patterns of cell division in the sensory and nonsensory regions are disrupted in Lmx1a mutants.

      These are indeed fascinating questions, but which would require considerable work to answer and are beyond the scope of this paper. 

      Minor comments:

      (1) Figure 1. It should be clarified whether e', h' and k' are showing cortical F-actin of surface cells. Do the arrowheads in i' and l' correspond to the position of either of the arrowheads in h' and k', respectively?

      The epithelium in the otocyst is pseudostratified. Therefore, images e’, h’, k’ display F-actin labelling on the surface of tissue composed of a single cell layer. We have added arrows to images e”, h”, and k” to indicate the corresponding position of z-projections and included appropriate explanation in the legend of Figure 1: “Black arrows on the side of images e”, h”, and k” indicate the corresponding position of z-projections.”

      (2) Figure 3-Figure S1. Please mark the orientation of the images shown.

      We labelled the sensory organs in the figure to allow for recognizing the orientation. 

      (3) Figure 4. Orthogonal reconstructions should be labeled (z) to be consistent with other figures.

      We have corrected the labelling in the orthogonal reconstruction to (z). 

      (4) Figure 4g. It is not clear what is in the dark area between the two bands of Lmx1a+ cells next to the utricle and the LC. Are those cells Lmx1a negative? It is unclear whether a second boundary domain formed or the original boundary domain split into two between E15 and P0? Showing the E15 control tissue from Figure 5 would be more informative than P0.

      In this particular sample there seems to be a folding of the tissue (visible in z-reconstructions) that could affect the appearance of the projection shown in 4g. We believe the P0 is a valuable addition to the E15 data, showing a slightly later stage in the development of the vestibular organs.

      (5) Figure 5a, e. Magnified regions shown in b and f should be boxed correspondingly.

      This figure has been revised. We realized that the previous low-magnification shown in (e) (now h) was from a different sample than the one shown in the high-magnification view. The new figure now includes the right low-magnification sample (in h) and the regions shown in the high-magnification views have been boxed.

      (6) Figure 8f, h, j. Magnified regions shown in g, i and k should be boxed correspondingly.

      The magnified regions were boxed in Figure 8 f, h, and j. Additionally, black arrows have been placed next to images 8g", 8i", and 8k" to highlight the positions of the z-projections. An appropriate explanation has also been added to the figure legend.

      (9) Figure 8. It would be helpful to show merged images of GFP and F-actin, to better appreciate cell morphology of GFP+ and GFP- cells.

      As requested, we have added images showing overlap of GFP and F-actin channels in Figure 8.

      Reviewer #2 (Recommendations for the authors):

      The PMLC staining could be improved. Two decent antibodies are the p-MLC and pp-MLC antibodies from CST. pp-MLC works very well after TCA fixation as detailed in https://www.researchsquare.com/article/rs-2508957/latest . As phalloidin does not work well after TCA fixation, affadin works very well for segmenting cells.

      If the authors do not wish to repeat the pMLC staining, the details of the antibody used should be mentioned.

      We used mouse IgG1 Phospho-Myosin Light Chain 2 (Ser19) from Cell Signaling Technology (catalogue number #3675) in our immunohistochemistry for PMLC. This is one of the two antibodies recommended by the reviewer #2. Information about this antibody has now been included in material and methods. This antibody has been referenced by many manuscripts, but unfortunately, in our hands at least, it did not perform well in whole-mount preparations.

      A statement on the availability of the data should be included.

      We have included a statement on the data availability: “All data generated or analysed during this study is available upon request.”

      Reviewer #3 (Recommendations for the authors):

      Outstanding issues:

      (1) Morphological description: The apical alignment of epithelial cells at the border is clear but not the upward pull of the basal lamina. Very often, it seems to be the Sox2 staining that shows the upward pull better than the F-actin staining. Perhaps, adding an anti-laminin staining to indicate the basement membrane may help.

      Indeed, the upward pull of the basement membrane is not always very clear. We performed some anti-laminin immunostaining on mouse cryosections and provide below (Figure 1) an example of such experiment. The results appear to confirm an upward displacement of the basement membrane in the region separating the lateral crista from the utricle in the E13 mouse inner ear, but given the preliminary nature of these experiments, we believe that these results do not warrant inclusion in the manuscript. The term “pull” is somehow implying that the epithelial cells are responsible for the upward movement of the basement membrane, but since we do not have direct evidence that this is the case, we have replaced “pull” by “displacement” throughout the text. 

      (2) It is not clear how well the cellular changes are correlated with the timing of border formation as some of the ages shown in the study seem to be well after the sensory patches were separated and the border was established.

      For some experiments (for example E15 in the comparison of mouse Lmx1a-GFP heterozygous and homozygous inner ear tissue; E6 for the RCAS experiments), the early stages of boundary formation are not covered because we decided to focus our analysis on the late consequences of manipulating Lmx1a/ROCK activity in terms of sensory organ segregation. The dataset is more comprehensive for the control developmental series in the chicken and mouse inner ear. 

      (3) The Lmx1a data, as they currently stand could be explained by Lmx1a being required for non-sensory development and not necessarily border formation. Additionally, the relationship between ROCK and Lmx1a was not investigated. Since the investigators have established the molecular mechanisms of Lmx1 function using the chicken system previously, the authors could try to correlate the morphological events described here with the molecular evidence for Lmx1 functioning during border formation in the same chicken system. Right now, only the expression of Sox2 is used to correlate with the cellular events, and not Lmx1, Jag1 or notch.

      These are valid points. Exploring in detail the epistatic relationships between Notch signalling/Lmx1a/ROCK/boundary formation in the chicken model would be indeed very interesting but would require extensive work using both gain and loss-of-function approaches, combined with the analysis of multiple markers (Jag1/Sox2/Lmx1b/PMLC/Factin..). At this point, and in agreement with the referee’s comment, we believe that Lmx1a is above all required for the adoption of the non-sensory fate. The loss of Lmx1a function in the mouse inner ear produce defects in the patterning and cellular features of the boundary domain, but these may be late consequences of the abnormal differentiation of the nonsensory domains that separate sensory organs. Furthermore, ROCK activity does not appear to be required for Sox2 expression (i.e. adoption or maintenance of the sensory fate) since the overexpression of RCII-GFP does not prevent Sox2 expression in the chicken inner ear. This fits with a model in which Notch/Lmx1a regulate cell differentiation whilst ROCK acts independently or downstream of these factors during boundary formation. 

      Specific comments:

      (1) Figure 1. The downregulation of Sox2 is consistent between panels h and k, but not between panels e and h. The orthogonal sections showing basal constriction in h' and k' are not clear.

      The downregulation is noticeable along the lower edge of the crista shown in h; the region selected for the high-magnification view sits at an intermediate level of segregation (and Sox2 downregulation). 

      The basal constriction is not very clear in h, but becomes easier to visualize in k. We have displaced the arrow pointing at the constriction, which hopefully helps. 

      (2) Figure 2. Where was the Z axis taken from? One seems to be able to imagine the basal constriction better in the anti-Sox2 panel than the F-actin panel. A stain outlining the basement membrane better could help.

      Arrows have been added on the side of the horizontal views to mark the location of the zreconstruction. See our previous replies to comments addressing the upward displacement of the basement membrane.

      (3) Figure 4

      I question the ROI being chosen in this figure, which seems to be in the middle of a triad between LC, prosensory/utricle and the AC, rather than between AC and LC. If so, please revise the title of the figure. This could also account for the better evidence of the apical alignment in the upper part of the f panel.

      We have corrected the text. 

      In this figure, the basal constriction is a little clearer in the orthogonal cuts, but it is not clear where these sections were taken from.

      We have added black arrows next to images 4c’, 4f’, and 4i’ to indicate the positions of the zprojections.  

      By E13.5, the LC is a separate entity from the utricle, it makes one wonder how well the basal constriction is correlated with border formation. The apical alignment is also present by P0, which raises the question that the apical alignment and basal restriction may be more correlated with differentiation of non-sensory tissue rather than associated with border formation.

      We agree E13.5 is a relatively late stage, and the basal constriction was not always very pronounced. The new data included in the revised version include images of basal planes of the boundary domain at E11.5, which reveal F-actin enrichment and the formation of an actin-cable-like structure (Figure 4 suppl. Fig1). Furthermore, the chicken dataset shows that the changes in cell size, alignment, and the formation of actin-cable-like structure precede sensory patch segregation and are visible when Sox2 expression starts to be downregulated in prospective non-sensory tissue (Figure 1, Figure 2). Considering the results from both species, we conclude that these localised cellular changes occur relatively early in the sequence of events leading to sensory patch segregation, as opposed to being a late consequence of the differentiation of the non-sensory territories.  

      I don't follow the (x) cuts for panels h and I, as to where they were taken from and why there seems to be an epithelial curvature and what it was supposed to represent.

      We have added black arrows next to the panels 4c’, 4f’, and 4i’ to indicate the positions of the z-projections and modified the legend accordingly. The epithelial curvature is probably due to the folding of the tissue bordering the sensory organs during the manipulation/mounting of the tissue for imaging.

      (4) Figure 5 The control images do not show the apical alignment and the basal constriction well. This could be because of the age of choice, E15, was a little late. Unfortunately, the unclarity of the control results makes it difficult for illustrating the lack of cellular changes in the mutant. The only take-home message that one could extract from this figure is a mild mixing of Sox2 and Lmx1a-Gfp cells in the mutant and not much else. Also, please indicate the level where (x) was taken from.

      Black arrows have been placed next to images 5e and 5l to highlight the positions of the zprojections. The stage E15 chosen for analysis was appropriate to compare the boundary domains once segregation is normally completed. We believe the results show some differences in the cellular features of the boundary domain in the Lmx1a-null mouse, and we have in fact quantified this using Epitool in Figure 5 – Suppl. Fig 1. Cells are more elongated and better aligned in the Lmx1a-null than in the heterozygous samples.  

      (5) Figure 7. I think the cellular disruption caused by the ROCK inhibitor, shown in q', is too severe to be able to pin to a specific effect of ROCK on border formation. In that regard, the ectopic expression of the dominant negative form of ROCK using RCAS approach is better, even though because it is a replication competent form of RCAS, it is still difficult to correlate infected cells to functional disruption.

      We used a replication-competent construct to induce a large patch of infection, increasing our chances of observing a defect in sensory organ segregation and boundary formation. We agree that this approach does not allow us to control the timing of overexpression, but the mosaicism in gene expression, allowing us to compare in the same tissue large regions with/without perturbed ROCK activity, proved more informative than the pharmacological/in vitro experiments.

      (6) Figure 8. Outline the ROI of i in h, and k in j. Outline in k the comparable region in k'. In k", F-actin staining is not uniform. Indicate where (x) was taken from in K.

      The magnified regions were boxed in Figure 8 f, h, and j. Region outlined in figures k’-k” has also been outlined in corresponding region in figure k. Additionally, black arrows have been placed next to images 8g", 8i", and 8k" to highlight the positions of the z-projections. An appropriate explanation has also been added to the figure legend.

      Minor comments:

      (1) P.18, 1st paragraph, extra bracket at the end of the paragraph.

      Bracket removed

      (2) P.22, line 11, in ovo may be better than in vivo in this case.

      We agree, this has been corrected. 

      (3) P.25, be consistent whether it is GFP or EGFP.

      Corrected to GFP.

      (4) P.26, line 5. Typo on "an"

      Corrected to “and”

      Author response image 1.

      Expression of Laminin and Sox2 in the E13 mouse inner ear. a-a’’’) Low magnification view of the utricle, the lateral crista, and the non-sensory (Sox2-negative) domain separating these. Laminin staining is detected at relatively high levels in the basement membrane underneath the sensory patches. At higher magnification (b-b’’’), an upward displacement of the basement membrane (arrow) is visible in the region of reduced Sox2 expression, corresponding to the “boundary domain” (bracket). 

    1. Author response:

      The following is the authors’ response to the original reviews.

      Reviewer #1 (Public Review): 

      Summary: 

      LRRK2 protein is familially linked to Parkinson's disease by the presence of several gene variants that all confer a gain-of-function effect on LRRK2 kinase activity. 

      The authors examine the effects of BDNF stimulation in immortalized neuron-like cells, cultured mouse primary neurons, hIPSC-derived neurons, and synaptosome preparations from the brain. They examine an LRRK2 regulatory phosphorylation residue, LRRK2 binding relationships, and measures of synaptic structure and function. 

      Strengths: 

      The study addresses an important research question: how does a PD-linked protein interact with other proteins, and contribute to responses to a well-characterized neuronal signalling pathway involved in the regulation of synaptic function and cell health? 

      They employ a range of good models and techniques to fairly convincingly demonstrate that BDNF stimulation alters LRRK2 phosphorylation and binding to many proteins. Some effects of BDNF stimulation appear impaired in (some of the) LRRK2 knock-out scenarios (but not all). A phosphoproteomic analysis of PD mutant Knock-in mouse brain synaptosomes is included. 

      We thank this Reviewer for pointing out the strengths of our work. 

      Weaknesses: 

      The data sets are disjointed, conclusions are sweeping, and not always in line with what the data is showing. Validation of 'omics' data is very light. Some inconsistencies with the major conclusions are ignored. Several of the assays employed (western blotting especially) are likely underpowered, findings key to their interpretation are addressed in only one or other of the several models employed, and supporting observations are lacking. 

      We appreciate the Reviewer’s overall evaluaVon. In this revised version, we have provided several novel results that strengthen the omics data and the mechanisVc experiments and make the conclusions in line with the data.

      As examples to aid reader interpretation: (a) pS935 LRRK2 seems to go up at 5 minutes but goes down below pre-stimulation levels after (at times when BDNF-induced phosphorylation of other known targets remains very high). This is ignored in favour of discussion/investigation of initial increases, and the fact that BDNF does many things (which might indirectly contribute to initial but unsustained changes to pLRRK2) is not addressed.  

      We thank the Reviewer for raising this important point, which we agree deserves additional investigation. Although phosphorylation does decrease below pre-stimulation levels, a reduction is also observed for ERK/AKT upon sustained exposure to BDNF in our experimental paradigm (figure 1F-G). This phenomenon is well known in response to a number of extracellular stimuli and can be explained by mechanisms related to cellular negative feedback regulation, receptor desensitization (e.g. phosphorylation or internalization), or cellular adaptation. The effect on pSer935, however, is peculiar as phosphorylation goes below the unstimulated level, as pointed by the reviewer. In contrast to ERK and AKT whose phosphorylation is almost absent under unstimulated conditions (Figure 1F-G), the stoichiometry of Ser935 phosphorylation under unstimulated conditions is high. This observation is consistent with MS determination of relative abundance of pSer935 (e.g. in whole brain LRRK2 is nearly 100% phosphorylated at Ser935, see Nirujogi et al., Biochem J 2021).  Thus we hypothesized that the modest increase in phosphorylation driven by BDNF likely reflects a saturation or ceiling effect, indicating that the phosphorylation level is already near its maximum under resting conditions. Prolonged BDNF stimulation would bring phosphorylation down below pre-stimulation levels, through negative feedback mechanisms (e.g. phosphatase activity) explained above. To test this hypothesis, we conducted an experiment in conditions where LRRK2 is pretreated for 90 minutes with MLi-2 inhibitor, to reduce basal phosphorylation of S935. After MLi-2 washout, we stimulated with BDNF at different time points. We used GFP-LRRK2 stable lines for this experiment, since the ceiling effect was particularly evident (Figure S1A) and this model has been used for the interactomic study. As shown below (and incorporated in Fig. S1B in the manuscript), LRRK2 responds robustly to BDNF stimulation both in terms of pSer935 and pRABs. Phosphorylation peaks at 5-15 mins, while it decreases to unstimulated levels at 60 and 180 minutes. Notably, while the peak of pSer935 at 5-15 mins is similar to the untreated condition (supporting that Ser935 is nearly saturated in unstimulated conditions), the phosphorylation of RABs during this time period exceeds unstimulated levels. These findings support the notion that, under basal conditions, RAB phosphorylation is far from saturation. The antibodies used to detect RAB phosphorylation are the following: RAB10 Abcam # ab230261 e RAB8 (pan RABs) Abcam # ab230260.

      Given the robust response of RAB10 phosphorylation upon BDNF stimulation, we further investigated RAB10 phosphorylation during BDNF stimulation in naïve SH-SY5Y cells. We confirmed that the increase in pSer935 is coupled to increase in pT73-RAB10. Also in this case, RAB10 phosphorylation does not go below the unstimulated level, which aligns with the  low pRAB10 stoichiometry in brain (Nirujogi et al., Biochem J 2021). This experiment adds the novel and exciting finding that BDNF stimulation increases LRRK2 kinase activity (RAB phosphorylation) in neuronal cells. 

      Note that new supplemental figure 1 now includes: A) a comparison of LRRK2 pS935 and total protein levels before and after RA differentiation; B) differentiated GFP-LRRK2 SH-SY5Y (unstimulated, BDNF, MLi-2, BDNF+MLi-2); C) the kinetic of BDNF response in differentiated GFP-LRRK2 SH-SY5Y.

      (b) Drebrin coIP itself looks like a very strong result, as does the increase after BDNF, but this was only demonstrated with a GFP over-expression construct despite several mouse and neuron models being employed elsewhere and available for copIP of endogenous LRRK2. Also, the coIP is only demonstrated in one direction. Similarly, the decrease in drebrin levels in mice is not assessed in the other model systems, coIP wasn't done, and mRNA transcripts are not quantified (even though others were). Drebrin phosphorylation state is not examined.  

      We appreciate the Reviewer suggestions and provided additional experimental evidence supporting the functional relevance of LRRK2-drebrin interaction.

      (1) As suggested, we performed qPCR and observed that 1 month-old KO midbrain and cortex express lower levels of Dbn1 as compared to WT brains (Figure 5G). This result is in agreement with the western blot data (Figure 5H). 

      (2)To further validate the physiological relevance of LRRK2-drebrin interaction we performed two experiments:

      i) Western blots looking at pSer935 and pRab8 (pan Rab) in Dbn1 WT and knockout brains. As reported and quantified in Figure 2I, we observed a significant decrease in pSer935 and a trend decrease in pRab8 in Dbn1 KO brains. This finding supports the notion that Drebrin forms a complex with LRRK2 that is important for its activity, e.g. upon BDNF stimulation. 

      ii) Reverse co-immunoprecipitation of YFP-drebrin full-length, N-terminal domain (1-256 aa) and C-terminal domain (256-649 aa) (plasmids kindly received from Professor Phillip R. Gordon-Weeks, Worth et al., J Cell Biol, 2013) with Flag-LRRK2 co-expressed in HEK293T cells. As shown in supplementary Fig. S2C, we confirm that YFP-drebrin binds LRRK2, with the Nterminal region of drebrin appearing to be the major contributor to this interaction. This result is important as the N-terminal region contains the ADF-H (actin-depolymerising factor homology) domain and a coil-coil region known to directly bind actin (Shirao et al., J Neurochem 2017; Koganezawa et al., Mol Cell Neurosci. 2017). Interestingly, both full-length Drebrin and its truncated C-terminal construct cause the same morphological changes in Factin, indicating that Drebrin-induced morphological changes in F-actin are mediated by its N-terminal domains rather than its intrinsically disordered C-terminal region (Shirao et al., J Neurochem, 2017; Koganezawa et al., Mol Cell Neurosci. 2017). Given the role of LRRK2 in actin-cytoskeletal dynamics and its binding with multiple actin-related protein binding (Fig. 2 and Meixner et al., Mol Cell Proteomics. 2011; Parisiadou and Cai, Commun Integr Biol 2010), these results suggest the possibility that LRRK2 controls actin dynamics by competing with drebrin binding to actin and open new avenues for futures studies.

      (3) To address the request for examining drebrin phosphorylation state, we decided to perform another phophoproteomic experiment, leveraging a parallel analysis incorporated in our latest manuscript (Chen et al., Mol Theraphy 2025). In this experiment, we isolated total striatal proteins from WT and G2019S KI mice and enriched the phospho-peptides. Unlike the experiment presented in Fig. 7, phosphopeptides were enriched from total striatal lysates rather than synaptosomal fractions, and phosphorylation levels were normalized to the corresponding total protein abundance. This approach was intended to avoid bias toward synaptic proteins, allowing for the analysis of a broader pool of proteins derived from a heterogeneous ensemble of cell types (neurons, glia, endothelial cells, pericytes etc.). We were pleased to find that this new experiment confirmed drebrin S339 as a differentially phosphorylated site, with a 3.7 fold higher abundance in G2019S Lrrk2 KI mice. The fact that this experiment evidenced an increased phosphorylation stoichiometry in G2019S mice rather than a decreased is likely due to the normalization of each peptide by its corresponding total protein. Gene ontology analysis of differentially phosphorylated proteins using stringent term size (<200 genes) showed post-synaptic spines and presynaptic active zones as enriched categories (Fig. 3F). A SynGO analysis confirms both pre and postsynaptic categories, with high significance for terms related to postsynaptic cytoskeleton (Fig. 3G). As pointed, this is particularly interesting as the starting material was whole striatal tissue – not synaptosomes as previously – indicating that most significant phosphorylation differences occur in synaptic compartments. This once again reinforces our hypothesis that LRRK2 has a prominent role in the synapse. Overall, we confirmed with an independent phosphoproteomic analysis that LRRK2 kinase activity influences the phosphorylation state of proteins related to synaptic function, particularly postsynaptic cytoskeleton. For clarity in data presentation, as mentioned by the Reviewers, we removed Figure 7 and incorporated this new analysis in figure 3, alongside the synaptic cluster analysis. 

      Altogether, three independent OMICs approaches – (i) experimental LRRK2 interactomics in neuronal cells, (ii) a literature-based LRRK2 synaptic/cytoskeletal interactor cluster, and (iii) a phospho-proteomic analysis of striatal proteins from G2019S KI mice (to model LRRK2 hyperactivity) – converge to synaptic actin-cytoskeleton as a key hub of LRRK2 neuronal function.

      (c) The large differences in the CRISPR KO cells in terms of BDNF responses are not seen in the primary neurons of KO mice, suggesting that other differences between the two might be responsible, rather than the lack of LRRK2 protein. 

      Considering that some variability is expected for these type of cultures and across different species, any difference in response magnitude and kinetics could be attributed to the levels of TrKB  and downstream components expressed by the two cell types. 

      We are confident that differentiated SH-SY5Y cells provide a reliable model for our study as we could translate the results obtained in SH-SY5Y cells in other models. However, to rule out the possibility that the more pronounced effect observed in SH-SY5Y KO cells as respect to Lrrk2 KO primary neurons was due to CRISPR off-target effect, we performed an off-target analysis. Specifically, we selected the first 8 putative off targets exhibiting a CDF (Cutting Frequency Determination) off-target-score >0.2. 

      As shown in supplemental file 1, sequence disruption was observed only in the LRRK2 ontarget site in LRRK2 KO SH-SY5Y cells, while the 8 off-target regions remained unchanged across the genotypes and relative to the reference sequence. 

      (d) No validation of hits in the G2019S mutant phosphoproteomics, and no other assays related to the rest of the paper/conclusions. Drebrin phosphorylation is different but unvalidated, or related to previous data sets beyond some discussion. The fact that LRRK2 binding occurs, and increases with BDNF stimulation, should be compared to its phosphorylation status and the effects of the G2019S mutation. 

      As illustrated in the response to point (b), we performed a new phosphoproteomics investigation – with total striatal lysates instead of striatal synaptosomes and normalization phospho-peptides over total proteins – and found that S339 phosphorylation increases when LRRK2 kinase activity increases (G2019S). To address the request of validating drebrin phosphorylation, the main limitation is that there are no available antibodies against Ser339. While we tried phos-Tag gels in striatal lysates, we could not detect any reliable and specific signal with the same drebrin antibody used for western blot (Thermo Fisher Scientific: MA120377) due to technical limitations of the phosTag method. We are confident that phosphorylation at S339 has a physiological relevance, as it was identified 67 times across multiple proteomic discovery studies and they are placed among the most frequently phosphorylated sites in drebrin (https://www.phosphosite.org/proteinAction.action?id=2675&showAllSites=true).

      To infer a possible role of this phosphorylation, we looked at the predicted pathogenicity of using AlphaMissense (Cheng et al., Science 2023). included as supplementary figure (Fig. S3), aminoacid substitutions within this site are predicted not to be pathogenic, also due to the low confidence of the AlphaFold structure. 

      Ser339 in human drebrin is located just before the proline-rich region (PP domain) of the protein. This region is situated between the actin-binding domains and the C-terminal Homerbinding sequences and plays a role in protein-protein interactions and cytoskeletal regulation (Worth et al., J Cell Biol, 2013). Of interest, this region was previously shown to be the interaction site of adafin (ADFN), a protein involved in multiple cytoskeletal-related processes, including synapse formation and function by regulating puncta adherentia junctions, presynaptic differentiation, and cadherin complex assembly, which are essential for hippocampal excitatory synapses, spine formation, and learning and memory processes (Beaudoin, G. M., 3rd et al., J Neurosci, 2013). Of note, adafin is in the list of LRRK2 interacting proteins (https://www.ebi.ac.uk/intact/home), supporting a possible functional relevance of LRRK2-mediated drebrin phosphorylation in adafin-drebrin complex formation. This has been discussed in the discussion section.

      The aim of this MS analysis in G2019S KI mice – now included in figure 3 – was to further validate the crucial role of LRRK2 kinase activity in the context of synaptic regulation, rather than to discover and characterize novel substrates. Consequently, Figure 7 has been eliminated. 

      Reviewer #2 (Public Review):  

      Taken as a whole, the data in the manuscript show that BDNF can regulate PD-associated kinase LRRK2 and that LRRK2 modifies the BDNF response. The chief strength is that the data provide a potential focal point for multiple observations across many labs. Since LRRK2 has emerged as a protein that is likely to be part of the pathology in both sporadic and LRRK2 PD, the findings will be of broad interest. At the same time, the data used to imply a causal throughline from BDNF to LRRK2 to synaptic function and actin cytoskeleton (as in the title) are mostly correlative and the presentation often extends beyond the data. This introduces unnecessary confusion. There are also many methodological details that are lacking or difficult to find. These issues can be addressed. 

      We appreciate the Reviewer’s positive feedback on our study. We also value the suggestion to present the data in a more streamlined and coherent way. In response, we have updated the title to better reflect our overall findings: “LRRK2 Regulates Synaptic Function through Modulation of Actin Cytoskeletal Dynamics.” Additionally, we have included several experiments that we believe enhance and unify the study.

      (1) The writing/interpretation gets ahead of the data in places and this was confusing. For example, the abstract highlights prior work showing that Ser935 LRRK2 phosphorylation changes LRRK2 localization, and Figure 1 shows that BDNF rapidly increases LRRK2 phosphorylation at this site. Subsequent figures highlight effects at synapses or with synaptic proteins. So is the assumption that LRRK2 is recruited to (or away from) synapses in response to BDNF? Figure 2H shows that LRRK2-drebrin interactions are enhanced in response to BDNF in retinoic acid-treated SH-SY5Y cells, but are synapses generated in these preps? How similar are these preps to the mouse and human cortical or mouse striatal neurons discussed in other parts of the paper (would it be anticipated that BDNF act similarly?) and how valid are SHSY5Y cells as a model for identifying synaptic proteins? Is drebrin localization to synapses (or its presence in synaptosomes) modified by BDNF treatment +/- LRRK2? Or do LRRK2 levels in synaptosomes change in response to BDNF? The presentation requires re-writing to stay within the constraints of the data or additional data should be added to more completely back up the logic. 

      We thank the Reviewer for the thorough suggestions and comments. We have extensively revised the text to accurately reflect our findings without overinterpreting. In particular, we agree with the Reviewer that differentiated SH-SY5Y cells are not  identical to primary mouse or human neurons; however both neuronal models respond to BDNF. Supporting our observations, it is known that SH-SY5Y cells respond to BDNF.  In fact, a common protocol for differentiating SH-SY5Y cells involve BDNF in combination with retinoic acid (Martin et al., Front Pharmacol, 2022; Kovalevich et al., Methods in mol bio, 2013). Additionally, it has been reported that SH-SY5Y cells can form functional synapses (Martin et al., Front Pharmacol, 2022). While we are aware that BDNF, drebrin or LRRK2 can also affect non-synaptic pathways, we focused on synapses when moved to mouse models since: (i) MS and phosphoMS identified several cytoskeletal proteins enriched at the synapse, (ii) we and others have previously reported a role for LRRK2 in governing synaptic and cytoskeletal related processes; (iii) the synapse is a critical site that becomes dysfunctional in the early  stages of PD. We have now clarified and adjusted the text as needed. We have also performed additional experiments to address the Reviewer’s concern:

      (1) “Is the assumption that LRRK2 is recruited to (or away from) synapses in response to BDNF”? This is a very important point. There is consensus in the field that detecting endogenous LRRK2 in brain slices or in primary neurons via immunofluorescence is very challenging with the commercially available  antibodies (Fernandez et al., J Parkinsons Dis, 2022). We established a method in our previous studies to detect LRRK2 biochemically in synaptosomes (Cirnaru et al., Front Mol Neurosci, 2014; Belluzzi et al., Mol Neurodegener., 2016). While these data indicate LRRK2 is present in the synaptic compartments, it would be quite challenging to apply this method to the present study. In fact, applying acute BDNF stimulation in vivo and then isolate synaptosomes is a complex experiment beyond the timeframe of the revision due to the need of mouse ethical approvals. However, this is definitely an intriguing angle to explore in the future.

      (2)“Is drebrin localization to synapses (or its presence in synaptosomes) modified by BDNF treatment +/- LRRK2?” To try and address this question, we adapted a previously published assay to measure drebrin exodus from dendritic spines. During calcium entry and LTP, drebrin exits dendritic spines and accumulates in the dendritic shafts and cell body (Koganezawa et al., 2017). This facilitates the reorganization of the actin cytoskeleton (Shirao et al., 2017). Given the known role of drebrin and its interaction with LRRK2, we hypothesized that LRRK2 loss might affect drebrin relocalization during spine maturation.

      To test this, we treated DIV14 primary cortical neurons from Lrrk2 WT and KO mice with BDNF for 5, 15, and 24 hours, then performed confocal imaging of drebrin localization (Author response image 1). Neurons were transfected at DIV4 with GFP (cell filler) and PSD95 (dendritic spines) for visualization, and endogenous drebrin was stained with an anti-drebrin antibody. We then measured drebrin's overlap with PSD95-positive puncta to track its localization at the spine.

      In Lrrk2 WT neurons, drebrin relocalized from spines after BDNF stimulation, peaking at 15 minutes and showing higher co-localization with PSD95 at 24 hours, indicating the spine remodeling occurred. In contrast, Lrrk2 KO neurons showed no drebrin exodus. These findings support the notion that LRRK2's interaction with drebrin is important for spine remodeling via BDNF. However, additional experiments with larger sample sizes are needed, which were not feasible within the revision timeframe (here n=2 experiments with independent neuronal preparations, n=4-7 neurons analyzed per experiment). Thus, we included the relevant figure as Author response image 1 but chose not to add it in the manuscript (figure 3).

      Author response image 1.

      Lrrk2 affects drebrin exodus from dendritic spines. After the exposure to BDNF for different times (5 minutes, 15 minutes and 24 hours), primary neurons from Lrrk2 WT and KO mice have been transfected with GFP and PSD95 and stained for endogenous drebrin at DIV4. The amount of drebrin localizing in dentritic spines outlined by PSD95 has been assessed at DIV14. The graph shows a pronounced decrease in drebrin content in WT neurons during short time treatments and an increase after 24 hours. KO neurons present no evident variations in drebrin localization upon BDNF stimulation. Scale bar: 4 μm.<br />

      (2) The experiments make use of multiple different kinds of preps. This makes it difficult at times to follow and interpret some of the experiments, and it would be of great benefit to more assertively insert "mouse" or "human" and cell type (cortical, glutamatergic, striatal, gabaergic) etc. 

      We thank the Reviewer for pointing this out. We have now more clearly specified the cell type and species identity throughout the text to improve clarity and interpretation.

      (3) Although BDNF induces quantitatively lower levels of ERK or Akt phosphorylation in LRRK2KO preps based on the graphs (Figure 4B, D), the western blot data in Figure 4C make clear that BDNF does not need LRRK2 to mediate either ERK or Akt activation in mouse cortical neurons and in 4A, ERK in SH-SY5Y cells. The presentation of the data in the results (and echoed in the discussion) writes of a "remarkably weaker response". The data in the blots demand more nuance. It seems that LRRK2 may potentiate a response to BDNF that in neurons is independent of LRRK2 kinase activity (as noted). This is more of a point of interpretation, but the words do not match the images.  

      We thank the Reviewer for pointing this out. We have rephrased our data  presentation to better convey  our findings. We were not surprised to find that loss of LRRK2 causes only a reduction of ERK and AKT activation upon BDNF rather than a complete loss. This is because these pathways are complex and redundant and are activated by a number of cellular effectors. The fact that LRRK2 is one among many players whose function can be compensated by other signaling molecules is also supported by the phenotype of Lrrk2 KO mice that is measurable at 1 month but disappears with adulthood (4 and 18 months) (figure 5).

      Moreover, we removed the sentence “Of note, 90 mins of Lrrk2 inhibition (MLi-2) prior to BDNF stimulation did not prevent phosphorylation of Akt and Erk1/2, suggesting that LRRK2 participates in BDNF-induced phosphorylation of Akt and Erk1/2 independently from its kinase activity but dependently from its ability to be phosphorylated at Ser935 (Fig. 4C-D and Fig. 1B-C)” since the MLi-2 treatment prior to BDNF stimulation was not quantified and our new data point to an involvement of LRRK2 kinase activity upon BDNF stimulation.

      (4) Figure 4F/G shows an increase in PSD95 puncta per unit length in response to BDNF in mouse cortical neurons. The data do not show spine induction/dendritic spine density/or spine morphogenesis as suggested in the accompanying text (page 8). Since the neurons are filled/express gfp, spine density could be added or spines having PSD95 puncta. However, the data as reported would be expected to reflect spine and shaft PSDs and could also include some nonsynaptic sites. 

      The Reviewer is right. We have rephrased the text to reflect an increase in postsynaptic density (PSD) sites, which may include both spine and shaft PSDs, as well as potential nonsynaptic sites.

      (5) Experimental details are missing that are needed to fully interpret the data. There are no electron microscopy methods outside of the figure legend. And for this and most other microscopy-based data, there are few to no descriptions of what cells/sites were sampled, how many sites were sampled, and how regions/cells were chosen. For some experiments (like Figure 5D), some detail is provided in the legend (20 segments from each mouse), but it is not clear how many neurons this represents, where in the striatum these neurons reside, etc. For confocal z-stacks, how thick are the optical sections and how thick is the stack? The methods suggest that data were analyzed as collapsed projections, but they cite Imaris, which usually uses volumes, so this is confusing. The guide (sgRNA) sequences that were used should be included. There is no mention of sex as a biological variable. 

      We thank the Reviewer for pointing out this missing information. We have now included:

      (1) EM methods (page 24)

      (2) Methods for ICC and confocal microscopy now incorporates the Z-stack thickness (0.5 μm x 6 = 3 μm) on page 23.

      (3) Methods for Golgi-Cox staining now incorporates the Z-stack thickness and number of neurons and segments per neuron analyzed. 

      (4) The sex of mice is mentioned in the material and methods (page 17): “Approximately equal numbers of males and females were used for every experiment”.

      (6) For Figures 1F, G, and E, how many experimental replicates are represented by blots that are shown? Graphs/statistics could be added to the supplement. For 1C and 1I, the ANOVA p-value should be added in the legend (in addition to the post hoc value provided). 

      The blots relative to figure 1F,G and E are representative of several blots (at least n=5). The same redouts are part of figure 4 where quantifications are provided. We added the ANOVA p-value in the legend for figure 1C, 1I and 1K.

      (7) Why choose 15 minutes of BDNF exposure for the mass spec experiments when the kinetics in Figure 1 show a peak at 5 mins?  

      This is an important point. We repeated the experiment in GFP-LRRK2 SH-SY5Y cells (figure S1C) and included the 15 min time point. In addition to confirming that pSer935 increases similarly at 5 and 15 minutes, we also observed an increase in RAB phosphorylation at these time points. As mentioned in our response to Reviewer’s 1, we pretreated with MLi-2 for 90 minutes in this experiment to reduce the high basal phosphorylation stoichiometry of pSer935. 

      (8) The schematic in Figure 6A suggests that iPSCs were plated, differentiated, and cultured until about day 70 when they were used for recordings. But the methods suggest they were differentiated and then cryopreserved at day 30, and then replated and cultured for 40 more days. Please clarify if day 70 reflects time after re-plating (30+70) or total time in culture (70). If the latter, please add some notes about re-differentiation, etc. 

      We thank the reviewer for providing further clarity on the iPSC methodology. In the submitted manuscript 70DIV represents the total time in vitro and the process involved a cryostorage event at 30DIV, with a thaw of the cells and a further 40 days of maturation before measurement.  We have adjusted the methods in both the text and figure (new schematic) to clarify this.  The cryopreservation step has been used in other iPSC methods to great effect (Drummond et al., Front Cell Dev Biol, 2020). Due to the complexity and length of the iPSC neuronal differentiation process, cryopreservation represents a useful method with which to shorten and enhance the ability to repeat experiments and reduce considerable variation between differentiations. User defined differences in culture conditions for each batch of neurons thawed can usefully be treated as a new and separate N compared to the next batch of neurons.

      (9) When Figures 6B and 6C are compared it appears that mEPSC frequency may increase earlier in the LRRK2KO preps than in the WT preps since the values appear to be similar to WT + BDNF. In this light, BDNF treatment may have reached a ceiling in the LRRK2KO neurons.

      We thank the reviewer for his/her comment and observations about the ceiling effects. It is indeed possible that the loss of LRRK2 and the application of BDNF could cause the same elevation in synaptic neurotransmission. In such a situation, the increased activity as a result of BDNF treatment would be masked by the increased activity  observed as a result of LRRK2 KO. To better visualize the difference between WT and KO cultures and the possible ceiling effect, we merged the data in one single graph.  

      (10) Schematic data in Figures 5A and C and Figures 5B and E are too small to read/see the data. 

      We thank the Reviewer for this suggestion. We have now enlarged figure 5A and moved the graph of figure 5D in supplemental figure S5, since this analysis of spine morphology is secondary to the one shown in figure 5C.

      Reviewer #1 (Recommendations For The Authors): 

      Please forgive any redundancy in the comments, I wanted to provide the authors with as much information as I had to explain my opinion. 

      Primary mouse cortical neurons at div14, 20% transient increase in S935 pLRRK2 5min after BDNF, which then declines by 30 minutes (below pre-stim levels, and maybe LRRK2 protein levels do also). 

      In differentiated SHSY5Y cells there is a large expected increase in pERK and pAKT that is sustained way above pre-stim for 60 minutes. There is a 50% initial increase in pLRRK2 (but the blot is not very clear and no double band in these cells), which then looks like reduced well below pre-stim by 30 & 60 minutes. 

      We thank the Reviewer for bring up this important point. We have extensively addressed this issue in the public review rebuttal. In essence, the phosphorylation of Ser935 is near saturation under unstimulated conditions, as evidenced by its high basal stoichiometry, whereas Rab phosphorylation is far from saturation, showing an increase upon BDNF stimulation before returning to baseline levels. This distinction highlights that while pSer935 exhibits a ceiling effect due to its near-maximal phosphorylation at rest, pRab responds dynamically to BDNF, indicating low basal phosphorylation and a significant capacity for increase. Figure 1 in the rebuttal summarizes the new data collected. 

      GFP-fused overexpressed LRRK2 coIPs with drebrin, and this is double following 15 min BDNF. Strong result.

      We thank the Reviewer.

      BDNF-induced pAKT signaling is greatly impaired, and pERK is somewhat impaired, in CRISPR LKO SHSY5Y cells. In mouse primaries, both AKT and Erk phosph is robustly increased and sustained over 60 minutes in WT and LKO. This might be initially less in LKO for Akt (hard to argue on a WB n of 3 with huge WT variability), regardless they are all roughly the same by 60 minutes and even look higher in LKO at 60. This seems like a big disconnect and suggests the impairment in the SHSy5Y cells might have more to do with the CRISPR process than the LRRK2. Were the cells sequenced for off-target CRISPR-induced modifications?  

      Following the Reviewer suggestion – and as discussed in the public review section - we performed an off-target analysis. Specifically, we selected the first 8 putative off targets exhibiting a CDF (Cutting Frequency Determination) off-target-score >0.2. As shown in supplemental file 1, sequence disruption was observed only in the LRRK2 on-target site in LRRK2 KO SH-SY5Y cells, while the 8 off-target regions remained unchanged across the genotypes and relative to the reference sequence.  

      No difference in the density of large PSD-95 puncta in dendrites of LKO primary relative to WT, and the small (10%) increase seen in WT after BDNF might be absent in LKO (it is not clear to me that this is absent in every culture rep, and the data is not highly convincing). This is also referred to as spinogenesis, which has not been quantified. Why not is confusing as they did use a GFP fill... 

      The Reviewer is right that spinogenesis is not the appropriate term for the process analyzed. We replaced “spinogenesis” with “morphological alternation of dendritic protrusions” or “synapse maturation” which is correlated with the number of PSD95 positive puncta (ElHusseini et al., Science, 2000) . 

      There is a difference in the percentage of dendritic protrusions classified as filopodia to more being classified as thin spines in LKO striatal neurons at 1 month, which is not seen at any other age, The WT filopodia seems to drop and thin spine percent rise to be similar to LKO at 4 months. This is taken as evidence for delayed maturation in LKO, but the data suggest the opposite. These authors previously published decreased spine and increased filopodia density at P15 in LKO. Now they show that filopodia density is decreased and thin spine density increased at one month. How is that shift from increased to decreased filopodia density in LKO (faster than WT from a larger initial point) evidence of impaired maturation? Again this seems accelerated? 

      We agree with the Reviewer that the initial interpretation was indeed confusing. To adhere closely to our data and avoid overinterpretation – as also suggested by Reviewer 2 – we revised  the text and moved figure 5D to supplementary materials. In essence, our data point out to alterations in the structural properties of dendritic protrusions in young KO mice, specifically a reduction in  their size (head width and neck height) and a decrease in postsynaptic density (PSD) length, as observed with TEM. These findings suggest that LRRK2 is involved in morphological processes during spine development. 

      Shank3 and PSD95 mRNA transcript levels were reduced in the LKO midbrain, only shank3 was reduced in the striatum and only PSD was reduced in the cortex. No changes to mRNA of BDNF-related transcripts. None of these mRNA changes protein-validated. Drebrin protein (where is drebrin mRNA?) levels are reduced in LKO at 1&4 but not clearly at 18 months (seems the most robust result but doesn't correlate with other measures, which here is basically a transient increase (1m) in thin striatal spines).  

      As illustrated before, we performed qPCR for Dbn1 and found that its expression is significantly reduced in the cortex and midbrain and non-significantly reduced in the striatum (1 months old mice, a different cohort as those used for the other analysis in figure 5).  

      24h BDNF increases the frequency of mEPSCs on hIPSC-derived cortical-like neurons, but not LKO, which is already high. There are no details of synapse number or anything for these cultures and compares 24h treatment. BDNF increases mEPSC frequency within minutes PMC3397209, and acute application while recording on cells may be much more informative (effects of BDNF directly, and no issues with cell-cell / culture variability). Calling mEPSC "spontaneous electrical activity" is not standard.  

      We thank the reviewer for this point. We provided information about synapse number (Bassoon/Homer colocalization) in supplementary figure S7. The lack of response of LRRK2 KO cultures in terms of mEPSC is likely due to increase release probability as the number of synapses does not change between the two genotypes. 

      The pattern of LRRK2 activation is very disconnected from that of BDNF signalling onto other kinases. Regarding pLRRK2, s935 is a non-autophosph site said to be required for LRRK2 enzymatic activity, that is mostly used in the field as a readout of successful LRRK2 inhibition, with some evidence that this site regulates LRRK2 subcellular localization (which might be more to do with whether or not it is p at 935 and therefor able to act as a kinase). 

      The authors imply BDNF is activating LRRK2, but really should have looked at other sites, such as the autophospho site 1292 and 'known' LRRK2 substrates like T73 pRab10 (or other e.g., pRab12) as evidence of LRRK2 activation. One can easily argue that the initial increase in pLRRK2 at this site is less consequential than the observation that BDNF silences LRRK2 activity based on p935 being sustained to being reduced after 5 minutes, and well below the prestim levels... not that BDNF activates LRRK2. 

      As described above, we have collected new data showing that BDNF stimulation increases LRRK2 kinase activity toward its physiological substrates Rab10 and Rab8 (using a panphospho-Rab antibody) (Figure 1 and Figure S1). Additionally, we have also extensively commented the ceiling effect of pS935.

      BDNF does a LOT. What happens to network activity in the neural cultures with BDNF application? Should go up immediately. Would increasing neural activity (i.e., through depolarization, forskolin, disinhibition, or something else without BDNF) give a similar 20% increase in pS935 LRRK2? Can this be additive, or occluded? This would have major implications for the conclusions that BDNF and pLRRK2 are tightly linked (as the title suggests).  

      These are very valuable observations; however, they fall outside the scope and timeframe of this study. We agree that future research should focus on gaining a deeper mechanistic understanding of how LRRK2 regulates synaptic activity, including vesicle release probability and postsynaptic spine maturation, independently of BDNF.

      Figures 1A & H "Western blot analysis revealed a rapid (5 mins) and transient increase of Ser935 phosphorylation after BDNF treatment (Fig. 1B and 1C). Of interest, BDNF failed to stimulate Ser935 phosphorylation when neurons were pretreated with the LRRK2 inhibitor MLi-2" . The first thing that stands out is that the pLRRK2 in WB is not very clear at all (although we appreciate it is 'a pig' to work with, I'd hope some replicates are clearer); besides that, the 20% increase only at 5min post-BDNF stimulation seems like a much less profound change than the reduction from base at 60 and more at 180 minutes (where total LRRK2 protein is also going down?). That the blot at 60 minutes in H is representative of a 30% reduction seems off... makes me wonder about the background subtraction in quantification (for this there is much less pLRRK2 and more total LRRK2 than at 0 or 5). LRRK2 (especially) and pLRRK2 seem very sketchy in H. Also, total LRRK2 appears to increase in the SHSY5Y cell not the neurons, and this seems even clearer in 2 H. 

      To better visualize the dynamics of pS935 variation relative to time=0, we presented the data as the difference between t=0 and t=x. It clearly shows that pSe935 goes below prestimulation levels, whereas pRab10 does not. The large difference in the initial stoichiometry of these two phosphorylation is extensively discussed above.

      That MLi2 eliminates pLRRK2 (and seems to reduce LRRK2 protein?) isn't surprising, but a 90min pretreatment with MLi-2 should be compared to MLi-2's vehicle alone (MLi-2 is notoriously insoluble and the majority of diluents have bioactive effects like changing activity)... especially if concluding increased pLRRK2 in response to BDNF is a crucial point (when comparing against effects on other protein modifications such as pAKT). This highlights a second point... the changes to pERK and pAKT are huge following BDNF (nothing to massive quantities), whereas pLRRK2 increases are 20-50% at best. This suggests a very modest effect of BDNF on LRRK in neurons, compared to the other kinases. I worry this might be less consequential than claimed. Change in S1 is also unlikely to be significant... 

      These comments have been thoroughly addressed in the previous responses. Regarding fig. S1, we added an additional experiment (Figure S1C) in GFP-LRRK2 cells showing robust activation of LRRK2 (pS935, pRabs) at the timepoint of MS (15 min).

      "As the yields of endogenous LRRK2 purification were insufficient for AP-MS/MS analysis, we generated polyclonal SH-SY5Y cells stably expressing GFP-LRRK2 wild-type or GFP control (Supplementary Fig. 1)" . I am concerned that much is being assumed regarding 'synaptic function' from SHSY5Y cells... also overexpressing GFP-LRRK2 and looking at its binding after BDNF isn't synaptic function.  

      We appreciate the reviewer’s comment. We would like to clarify that the interactors enriched upon BDNF stimulation predominantly fall into semantic categories related to the synapse and actin cytoskeleton. While this does not imply that these interactors are exclusively synaptic, it suggests that this tightly interconnected network likely plays a role in synaptic function. This interpretation is supported by several lines of evidence: (1) previous studies have demonstrated the relevance of this compartment to LRRK2 function; (2) our new phosphoproteomics data from striatal lysate highlight enrichment of synaptic categories; and (3) analysis of the latest GWAS gene list (134 genes) also indicates significant enrichment of synapse-related categories. Taken together, these findings justify further investigation into the role of LRRK2 in synaptic biology, as discussed extensively in the manuscript’s discussion section.

      Figure 2A isn't alluded to in text and supplemental table 1 isn't about LRRK2 binding, but mEPSCs. 

      We have added Figure 2A and added supplementary .xls table 1, which refers to the excel list of genes with modulated interaction upon BDNF (uploaded in the supplemental material).

      We added the extension .xls also for supplementary table 2 and 3. 

      Figure 2A is useless without some hits being named, and the donut plots in B add nothing beyond a statement that "35% of 'genes' (shouldn't this be proteins?) among the total 207 LRRK2 interactors were SynGO annotated" might as well [just] be the sentence in the text. 

      We have now included the names of the most significant hits, including cytoskeletal and translation-related proteins, as well as known LRRK2 interactors. We decided to retain the donut plots, as we believe they simplify data interpretation for the reader, reducing the need to jump back and forth between the figures and the text.

      Validation of drebrin binding in 2H is great... although only one of 8 named hits; could be increased to include some of the others. A concern alludes to my previous point... there is no appreciable LRRK2 in these cells until GFP-LRRK2 is overexpressed; is this addressed in the MS? Conclusions would be much stronger if bidirectional coIP of these binding candidates were shown with endogenous (GFP-ve) LRRK2 (primaries or hIPSCs, brain tissue?) 

      To address the Reviewer’s concerns to the best of our abilities, we have added a blot in Supplemental figure S1A showing how the expression levels of LRRK2 increase after RA differentiation. Moreover, we have included several new data further strengthening the functional link between LRRK2 and drebrin, including qPCR of Dbn1 in one-month old Lrrk2 KO brains, western blots of Lrrk2 and Rab in Dbn1 KO brains, and co-IP with drebrin N- and Cterm domains. 

      Figures 3 A-C are not informative beyond the text and D could be useful if proteins were annotated. 

      To avoid overcrowding, proteins were annotated in A and the same network structure reported for synaptic and actin-related interactors. 

      Figure 4. Is this now endogenous LRRK2 in the SHSY5Y cells? Again not much LRRK2 though, and no pLRRK shown. 

      We confirm that these are naïve SH-SY5Y cells differentiated with RA and LRRK2 is endogenous. We did not assess pS935 in this experiment, as the primary goal was to evaluate pAKT and pERK1/2 levels. To avoid signal saturation, we loaded less total protein (30 µg instead of the 80 µg typically required to detect pS935). pS935 levels were extensively assessed in Figure 1. This experimental detail has now been added in the material and methods section (page 18).

      In C (primary neurons) There is very little increase in pLRRK2 / LRRK2 at 5 mins, and any is much less profound a change than the reduction at 30 & 60 mins. I think this is interesting and may be a more substantial consequence of BDNF treatment than the small early increase. Any 5 min increase is gone by 30 and pLRRK2 is reduced after. This is a disconnect from the timing of all the other pProteins in this assay, yet pLRRK2 is supposed to be regulating the 'synaptic effects'? 

      The first part of the question has already been extensively addressed. Regarding the timing, one possibility is that LRRK2 is activated upstream of AKT and ERK1/2, a hypothesis supported by the reduced activation of AKT and ERK1/2 observed in LRRK2 KO cells, as discussed in the manuscript, and in MLi-2 treated cells (Author response image 2). Concerning the synaptic effects, it is well established that synaptic structural and functional plasticity occurs downstream of receptor activation and kinase signaling cascades. These changes can be mediated by both rapid mechanisms (e.g., mobilization of receptor-containing endosomes via the actin cytoskeleton) and slower processes involving gene transcription of immediate early genes (IEGs). Since structural and functional changes at the synapse generally manifest several hours after stimulation, we typically assessed synaptic activity and structure 24 hours post-stimulation.

      Akt Erk1&2 both go up rapidly after BDNF in WT, although Akt seems to come down with pLRRK2. If they aren't all the same Akt is probably the most different between LKO and WT but I am very concerned about an n=3 for wb, wb is semi-quantitative at best, and many more than three replicates should be assessed, especially if the argument is that the increases are quantitively different between WT v KO (huge variability in WT makes me think if this were done 10x it would all look same). Moreover, this isn't similar to the LKO primaries  "pulled pups" pooled presumably. 

      Despite some variability in the magnitude of the pAKT/pERK response in naïve SH-SY5Y cells, all three independent replicates consistently showed a reduced response in LRRK2 KO cells, yielding a highly significant result in the two-way ANOVA test. In contrast, the difference in response magnitude between WT and LRRK2 KO primary cultures was less pronounced, which justified repeating the experiments with n=9 replicates. We hope the Reviewer acknowledges the inherent variability often observed in western blot experiments, particularly when performed in a fully independent manner (different cultures and stimulations, independent blots).

      To further strengthen the conclusion that this effect is reproducible and dependent on LRRK2 kinase activity upstream of AKT and ERK, we probed the membranes in figure 1H with pAKT/total AKT and pERK/total ERK. All things considered and consistent with our hypothesis, MLi-2 significantly reduced BDNF-mediated AKT and ERK1/2 phosphorylation levels (Author response image 2). 

      Author response image 2.

      Western blot (same experiments as in figure 1) was performed using antibodies against phospho-Thr202/185 ERK1/2, total ERK1/2 and phospho-Ser473 AKT, total AKT protein levels Retinoic acid-differentiated SH-SY5Y cells stimulated with 100 ng/mL BDNF for 0, 5, 30, 60 mins. MLi-2 was used at 500 nM for 90 mins to inhibit LRRK2 kinase activity.

      G lack of KO effect seems to be skewed from one culture in the plot (grey). The scatter makes it hard to read, perhaps display the culture mean +/- BDNF with paired bars. The fact that one replicate may be changing things is suggested by the weirdly significant treatment effect and no genotype effect. Also, these are GFP-filled cells, the dendritic masks should be shown/explained, and I'm very surprised no one counted the number (or type?) of protrusions, especially as the text describes this assay (incorrectly) as spinogenesis... 

      As suggested by the Reviewer we have replotted the results as bar graphs. Regarding the number of protrusions, we initially counted the number of GFP+ puncta in the WT and did not find any difference (Author response image 3). Due to our imaging setup (confocal microscopy rather than super-resolution imaging and Imaris 3D reconstruction), we were unable to perform a fine morphometric analysis. However, this was not entirely unexpected, as BDNF is known to promote both the formation and maturation of dendritic spines. Therefore, we focused on quantifying PSD95+ puncta as a readout of mature postsynaptic compartments. While we acknowledge that we cannot definitively conclude that each PSD95+ punctum is synaptically connected to a presynaptic terminal, the data do indicate an increase in the number of PSD95+ structures following BDNF stimulation.

      Author response image 3.

      GFP+ puncta per unit of neurite length (µm) in DIV14 WT primary neurons untreated or upon 24 hour of BDNF treatment (100 ng/ml). No significant difference were observed (n=3).

      Figure 5. "Dendritic spine maturation is delayed in Lrrk2 knockout mice". The only significant change is at 1 month in KO which shows fewer filopodia and increased thin spines (50% vs wt). At 4 months the % of thin spines is increased to 60% in both... Filopodia also look like 4m in KO at 1m... How is that evidence for delayed maturation? If anything it suggests the KO spines are maturing faster. "the average neck height was 15% shorter and the average head width was 27% smaller, meaning that spines are smaller in Lrrk2 KO brains" - it seems odd to say this before saying that actually there are just MORE thin spines, the number of mature "mushroom' is same throughout, and the different percentage of thin comes from fewer filopodia. This central argument that maturation is delayed is not supported and could be backwards, at least according to this data. Similarly, the average PSD length is likely impacted by a preponderance of thin spines in KO... which if mature were fewer would make sense to say delayed KO maturation, but this isn't the case, it is the fewer filopodia (with no PSD) that change the numbers. See previous comments of the preceding manuscript. 

      We agree that thin spines, while often considered more immature, represent an intermediate stage in spine development. The data showing an increase in thin spines at 1 month in the KO mice, along with fewer filopodia, could suggest a faster stabilization of these spines, which might indeed be indicative of premature maturation rather than delayed maturation. This change in spine morphology may indicate that the dynamics of synaptic plasticity are affected. Regarding the PSD length, as the Reviewer pointed out, the increased presence of thin spines in KO might account for the observed changes in PSD measurements, as thin spines typically have smaller PSDs. This further reinforces the idea that the overall maturation process may be altered in the KO, but not necessarily delayed. 

      We rephrase the interpretation of these data, and moved figure 5D as supplemental figure S4.

      "To establish whether loss of Lrrk2 in young mice causes a reduction in dendritic spines size by influencing BDNF-TrkB expression" - there is no evidence of this.  

      We agree and reorganized the text, removing this sentence.  

      Shank and PSD95 mRNA changes being shown without protein adds very little. Why is drebrin RNA not shown? Also should be several housekeeping RNAs, not one (RPL27)? 

      We measured Dbn1 mRNA, which shows a significant reduction in midbrain and cortex. Moreover we have now normalized the transcript levels against the geometrical means of three housekeeping genes (RPL27, actin, and GAPDH) relative abundance.

      Drebrin levels being lower in KO seems to be the strongest result of the paper so far (shame no pLRRK2 or coIP of drebrin to back up the argument). DrebrinA KO mice have normal spines, what about haploinsufficient drebrin mice (LKO seem to have half derbrin, but only as youngsters?)  

      As extensively explained in the public review, we used Dbn1 KO mouse brains and were able to show reduced Lrrk2 activity.

      Figure 6. hIPSC-derived cortical neurons. The WT 'cortical' neurons have a very low mEPSC frequency at 0.2Hz relative to KO. Is this because they are more or less mature? What is the EPSC frequency of these cells at 30 and 90 days for comparison? Also, it is very very hard to infer anything about mEPSC frequency in the absence of estimates of cell number and more importantly synapse number. Furthermore, where are the details of cell measures such as capacitance, resistance, and quality control e.g., Ra? Table s1 seems redundant here, besides suggesting that the amplitude is higher in KO at base. 

      We agree that the developmental trajectory of iPSC-derived neurons is critical to accurately interpreting synaptic function and plasticity. In response, we have included additional data now presented in the supplementary figure S7 and summarize key findings below:

      At DIV50, both WT and LRRK2 KO neurons exhibit low basal mEPSC activity (~0.5 Hz) and no response to 24 h BDNF stimulation (50 ng/mL).

      At DIV70 WT neurons show very low basal activity (~0.2 Hz), which increases ~7.5-fold upon BDNF treatment (1.5 Hz; p < 0.001), and no change in synapse number. KO neurons display elevated basal activity (~1 Hz) similar to BDNF-treated WT neurons, with no further increase upon BDNF exposure (~1.3 Hz) and no change in synapse number.

      At DIV90, no significant effect of BDNF in both WT and KO, indicating a possible saturation of plastic responses. The lack of BDNF response at DIV90 may be due to endogenous BDNF production or culture-based saturation effects. While these factors warrant further investigation (e.g., ELISA, co-culture systems), they do not confound the key conclusions regarding the role of LRRK2 in synaptic development and plasticity:

      LRRK2 Enables BDNF-Responsive Synaptic Plasticity. In WT neurons, BDNF induces a significant increase in neurotransmitter release (mEPSC frequency) with no reduction in synapse number. This dissociation suggests BDNF promotes presynaptic functional potentiation. KO neurons fail to show changes in either synaptic function or structure in response to BDNF, indicating that LRRK2 is required for activity-dependent remodeling.

      LRRK2 Loss Accelerates Synaptic Maturation. At DIV70, KO neurons already exhibit high spontaneous synaptic activity equivalent to BDNF-stimulated WT neurons. This suggests that LRRK2 may act to suppress premature maturation and temporally gate BDNF responsiveness, aligning with the differences in maturation dynamics observed in KO mice (Figure 5).  

      As suggested by the reviewer we reported the measurement of resistance and capacitance for all DIV (Table 1, supplemental material). A reduction in capacitance was observed in WT neurons at DIV90, which may reflect changes in membrane complexity. However, this did not correlate with differences in synapse number and is unlikely to account for the observed differences in mEPSC frequency. To control for cell number between groups, cell count prior to plating was performed (80k/cm2; see also methods) on the non-dividing cells to keep cell number consistent.

      The presence of BDNF in WT seems to make them look like LKO, in the rest of the paper the suggestion is that the LKO lack a response to BDNF. Here it looks like it could be that BDNF signalling is saturated in LKO, or they are just very different at base and lack a response.

      Knowing which is important to the conclusions, and acute application (recording and BDNF wash-in) would be much more convincing.

      We agree with the Reviewer’s point that saturation of BDNF could influence the interpretation of the data if it were to occur. However, it is important to note that no BDNF exists in the media in base control and KO neuronal culture conditions. This is  different from other culture conditions and allows us to investigate the effects of  BDNF treatment. Thus, the increased mEPSC frequency observed in KO neurons compared to WT neurons is defined only by the deletion of the gene and not by other extrinsic factors which were kept consistent between the groups. The lack of response or change in mEPSC frequency in KO is proposed to be a compensatory mechanism due to the loss of LRRK2. Of Note, LRRK2 as a “synaptic break” has already been described (Beccano-Kelly et al., Hum Mol Gen, 2015). However, a comprehensive analysis of the underlying molecular mechanisms will  require future studies beyond  with the scope of this paper.

      "The LRRK2 kinase substrates Rabs are not present in the list of significant phosphopeptides, likely due to the low stoichiometry and/or abundance" Likely due to the fact mass spec does not get anywhere near everything. 

      We removed this sentence in light of the new phosphoproteomic analysis.

      Figure 7 is pretty stand-alone, and not validated in any way, hard to justify its inclusion?  

      As extensively explained we removed figure 7 and included the new phospho-MS as part of figure. 3

      Writing throughout shows a very selective and shallow use of the literature.  

      We extensively reviewed the citations.

      "while Lrrk1 transcript in this region is relatively stable during development" The authors reference a very old paper that barely shows any LRRK1 mRNA, and no protein. Others have shown that LRRK1 is essentially not present postnatally PMC2233633. This isn't even an argument the authors need to make. 

      We thank the reviewer and included this more appropriate citation. 

      Reviewer #2 (Recommendations For The Authors): 

      Cyfip1 (Fig 3A) is part of the WAVE complex (page 13). 

      We thank the reviewer and specified it.

      The discussion could be more focused. 

      We extensively revised the discussion to keep it more focused.

      Note that we updated the GO ontology analyses to reflect the updated information present in g:Profiler.

      References.

      Nirujogi, R. S., Tonelli, F., Taylor, M., Lis, P., Zimprich, A., Sammler, E., & Alessi, D. R. (2021). Development of a multiplexed targeted mass spectrometry assay for LRRK2phosphorylated Rabs and Ser910/Ser935 biomarker sites. The Biochemical journal, 478(2), 299–326. https://doi.org/10.1042/BCJ20200930

      Worth, D. C., Daly, C. N., Geraldo, S., Oozeer, F., & Gordon-Weeks, P. R. (2013). Drebrin contains a cryptic F-actin-bundling activity regulated by Cdk5 phosphorylation. The Journal of cell biology, 202(5), 793–806. https://doi.org/10.1083/jcb.201303005

      Shirao, T., Hanamura, K., Koganezawa, N., Ishizuka, Y., Yamazaki, H., & Sekino, Y. (2017). The role of drebrin in neurons. Journal of neurochemistry, 141(6), 819–834. https://doi.org/10.1111/jnc.13988

      Koganezawa, N., Hanamura, K., Sekino, Y., & Shirao, T. (2017). The role of drebrin in dendritic spines. Molecular and cellular neurosciences, 84, 85–92. https://doi.org/10.1016/j.mcn.2017.01.004

      Meixner, A., Boldt, K., Van Troys, M., Askenazi, M., Gloeckner, C. J., Bauer, M., Marto, J. A., Ampe, C., Kinkl, N., & Ueffing, M. (2011). A QUICK screen for Lrrk2 interaction partners--leucine-rich repeat kinase 2 is involved in actin cytoskeleton dynamics. Molecular & cellular proteomics: MCP, 10(1), M110.001172. https://doi.org/10.1074/mcp.M110.001172

      Parisiadou, L., & Cai, H. (2010). LRRK2 function on actin and microtubule dynamics in Parkinson disease. Communicative & integrative biology, 3(5), 396–400. https://doi.org/10.4161/cib.3.5.12286

      Chen, C., Masotti, M., Shepard, N., Promes, V., Tombesi, G., Arango, D., Manzoni, C., Greggio, E., Hilfiker, S., Kozorovitskiy, Y., & Parisiadou, L. (2024). LRRK2 mediates haloperidol-induced changes in indirect pathway striatal projection neurons. bioRxiv : the preprint server for biology, 2024.06.06.597594. https://doi.org/10.1101/2024.06.06.597594

      Cheng, J., Novati, G., Pan, J., Bycroft, C., Žemgulytė, A., Applebaum, T., Pritzel, A.,Wong, L. H., Zielinski, M., Sargeant, T., Schneider, R. G., Senior, A. W., Jumper, J., Hassabis, D., Kohli, P., & Avsec, Ž. (2023). Accurate proteome-wide missense variant effect prediction with AlphaMissense. Science (New York, N.Y.), 381(6664), eadg7492. https://doi.org/10.1126/science.adg7492

      Beaudoin, G. M., 3rd, Schofield, C. M., Nuwal, T., Zang, K., Ullian, E. M., Huang, B., & Reichardt, L. F. (2012). Afadin, a Ras/Rap effector that controls cadherin function, promotes spine and excitatory synapse density in the hippocampus. The Journal of neuroscience : the official journal of the Society for Neuroscience, 32(1), 99–110. https://doi.org/10.1523/JNEUROSCI.4565-11.2012

      Fernández, B., Chittoor-Vinod, V. G., Kluss, J. H., Kelly, K., Bryant, N., Nguyen, A. P. T., Bukhari, S. A., Smith, N., Lara Ordóñez, A. J., Fdez, E., Chartier-Harlin, M. C., Montine, T. J., Wilson, M. A., Moore, D. J., West, A. B., Cookson, M. R., Nichols, R. J., & Hilfiker, S. (2022). Evaluation of Current Methods to Detect Cellular Leucine-Rich Repeat Kinase 2 (LRRK2) Kinase Activity. Journal of Parkinson's disease, 12(5), 1423–1447. https://doi.org/10.3233/JPD-213128

      Cirnaru, M. D., Marte, A., Belluzzi, E., Russo, I., Gabrielli, M., Longo, F., Arcuri, L., Murru, L., Bubacco, L., Matteoli, M., Fedele, E., Sala, C., Passafaro, M., Morari, M., Greggio, E., Onofri, F., & Piccoli, G. (2014). LRRK2 kinase activity regulates synaptic vesicle trafficking and neurotransmitter release through modulation of LRRK2 macromolecular complex. Frontiers in molecular neuroscience, 7, 49. https://doi.org/10.3389/fnmol.2014.00049

      Belluzzi, E., Gonnelli, A., Cirnaru, M. D., Marte, A., Plotegher, N., Russo, I., Civiero, L., Cogo, S., Carrion, M. P., Franchin, C., Arrigoni, G., Beltramini, M., Bubacco, L., Onofri, F., Piccoli, G., & Greggio, E. (2016). LRRK2 phosphorylates pre-synaptic Nethylmaleimide sensitive fusion (NSF) protein enhancing its ATPase activity and SNARE complex disassembling rate. Molecular neurodegeneration, 11, 1. https://doi.org/10.1186/s13024-015-0066-z

      Martin, E. R., Gandawijaya, J., & Oguro-Ando, A. (2022). A novel method for generating glutamatergic SH-SY5Y neuron-like cells utilizing B-27 supplement. Frontiers in pharmacology, 13, 943627. https://doi.org/10.3389/fphar.2022.943627

      Kovalevich, J., & Langford, D. (2013). Considerations for the use of SH-SY5Y neuroblastoma cells in neurobiology. Methods in molecular biology (Clifton, N.J.), 1078, 9–21. https://doi.org/10.1007/978-1-62703-640-5_2

      Drummond, N. J., Singh Dolt, K., Canham, M. A., Kilbride, P., Morris, G. J., & Kunath, T. (2020). Cryopreservation of Human Midbrain Dopaminergic Neural Progenitor Cells Poised for Neuronal Differentiation. Frontiers in cell and developmental biology, 8, 578907. https://doi.org/10.3389/fcell.2020.578907

      Tao, X., Finkbeiner, S., Arnold, D. B., Shaywitz, A. J., & Greenberg, M. E. (1998). Ca2+ influx regulates BDNF transcription by a CREB family transcription factor-dependent mechanism. Neuron, 20(4), 709–726. https://doi.org/10.1016/s0896-6273(00)810107

      El-Husseini, A. E., Schnell, E., Chetkovich, D. M., Nicoll, R. A., & Bredt, D. S. (2000). PSD95 involvement in maturation of excitatory synapses. Science (New York, N.Y.), 290(5495), 1364–1368.

      Glebov OO, Cox S, Humphreys L, Burrone J. Neuronal activity controls transsynaptic geometry. Sci Rep. 2016 Mar 8;6:22703. doi: 10.1038/srep22703. Erratum in: Sci Rep. 2016 May 31;6:26422. doi: 10.1038/srep26422. PMID: 26951792; PMCID: PMC4782104.

      Beccano-Kelly DA, Volta M, Munsie LN, Paschall SA, Tatarnikov I, Co K, Chou P, Cao LP, Bergeron S, Mitchell E, Han H, Melrose HL, Tapia L, Raymond LA, Farrer MJ, Milnerwood AJ. LRRK2 overexpression alters glutamatergic presynaptic plasticity, striatal dopamine tone, postsynaptic signal transduction, motor activity and memory. Hum Mol Genet. 2015 Mar 1;24(5):1336-49. doi: 10.1093/hmg/ddu543. Epub 2014 Oct 24. PMID: 25343991.

    1. Author response:

      The following is the authors’ response to the original reviews.

      Reviewer #1 (Public Review):

      Major concerns:

      (1) Is the direct binding of MCAK to the microtubule cap important for its in vivo function?

      a.The authors claim that their "study provides mechanistic insights into understanding the end-binding mechanism of MCAK". I respectfully disagree. My concern is that the paper offers limited insights into the physiological significance of direct end-binding for MCAK activity, even in vitro. The authors estimate that in the absence of other proteins in vitro, ~95% of MCAK molecules arrive at the tip by direct binding in the presence of ~ physiological ATP concentration (1 mM). In cells, however, the major end-binding pathway may be mediated by EB, with the direct binding pathway contributing little to none. This is a reasonable concern because the apparent dissociation constant measured by the authors shows that MCAK binding to microtubules in the presence of ATP is very weak (69 uM). This concern should be addressed by 1) calculating relative contributions of direct and EB-dependent pathways based on the affinities measured in this and other published papers and estimated intracellular concentrations. Although there are many unknowns about these interactions in cells, a modeling-based analysis may be revealing. 2) the recapitulation of these pathways using purifying proteins in vitro is also feasible. Ideally, some direct evidence should be provided, e.g. based on MCAK function-separating mutants (GDP-Pi tubulin binding vs. catalytic activity at the curled protofilaments) that contribution from the direct binding of MCAK to microtubule cap in EB presence is significant.

      We thank the reviewer for the thoughtful comments.

      (1) We think that the end-binding affinity of MCAK makes a significant contribution for its cellular functions. To elucidate this concept, we now use a simple model shown in Supplementary Appendix-2 (see pages 49-51, lines 1246-1316). In this model, we simplified MCAK and EB1 binding to microtubule ends by considering only these two proteins while neglecting other factors (e.g. XMAP215). Specifically, we considered two scenarios: one in which both proteins freely diffuse in the cytoplasm and another where MCAK is localized to specific cellular structures, such as the centrosome or centromere. Based on the modeling results, we argue that MCAK's functional impact at microtubule ends derives both from its intrinsic end-binding capacity and its ability to strengthen the EB1-mediated end association pathway.

      (2) We agree with the reviewer that MCAK exhibiting a lower end-binding affinity (69 µM) is indeed intriguing, as one might intuitively expect a stronger affinity, e.g. in the nanomolar range. Several factors may contribute to this observation. First, this could be partly due to the in vitro system employed, which may not perfectly replicate in vivo conditions, especially when considering cellular processes quantitatively. Variations in medium composition can significantly influence the binding state. For example, reducing salt concentration leads to a marked increase in MCAK’s binding affinity (Helenius et al., 2006; Maurer et al., 2011; McHugh et al., 2019). Additionally, while numerous binding events with short durations were detected, we excluded transient interactions from our analysis to facilitate quantification. This likely leads to an underestimation of the on-rate and, consequently, the binding affinity. Moreover, to minimize the interference of purification tags (His-tag), we ensured their complete removal during protein sample preparation. Previous studies reported that retaining the His-tag of MAPs affects the binding affinity to microtubules (Maurer et al., 2011; Zhu et al., 2009). Finally, a low affinity is not necessarily unexpected. Considering the microtubule end as a receptor with multiple binding sites for MCAK, the overall binding affinity is in the nanomolar range (260 nM). This does not necessarily contradict MCAK being a microtubule dynamics regulator as only a few MCAK molecules may suffice to induce microtubule catastrophe (as discussed on page 13, lines 408-441).

      (3) Ideally, we would search for mutants that specifically interfere with the binding of GDP-Pi-tubulin or the curled protofilaments. However, the mutant we tested significantly impacts the overall affinity of MCAK to microtubules (both end and lattice), making it challenging to isolate and discuss the function of MCAK with respect to the binding to GDP-Pi-tubulin alone. Additionally, we also think that the GDP-Pi-tubulin in the EB cap and the tubulin in the curved protofilaments may share structural similarities. For instance, the tubulin dimers in both states may be less compact compared to those in the lattice, which could explain why MCAK recognizes both simultaneously (Manka and Moores, 2018). However, this remains a conjecture, as there is currently no direct evidence to support it.

      b. As mentioned in the Discussion, preferential MCAK binding to tubulins near the MT tip may enhance MCAK targeting of terminal tubulins AFTER the MCAK has been "delivered" to the distal cap via the EB-dependent mechanism. This is a different targeting mechanism than the direct MCAK-binding. However, the measured binding affinity between MCAK and GMPCPP tubulins is so weak (69 uM), that this effect is also unlikely to have any impact because the binding events between MCAK and microtubule should be extremely rare. Without hard evidence, the arguments for this enhancement are very speculative.

      Please see our response to the comment No. 1. Additionally, we have revised our discussion to discuss the end-binding affinity of MCAK as well as its physiological relevance (please see page 13, lines 408-441; and see Supplementary Appendix-2 in pages 49-51, lines 1246-1316).

      (2) The authors do not provide sufficient justification and explanation for their investigation of the effects of different nucleotides in MCAK binding affinity. A clear summary of the nucleotide-dependent function of MCAK (introduction with references to prior affinity measurements and corresponding MCAK affinities), the justifications for this investigation, and what has been learned from using different nucleotides (discussion) should be provided. My take on these results is that by far the strongest effect on microtubule wall and tip binding is achieved by adding any adenosine, whereas differences between different nucleotides are relatively minor. Was this expected? What can be learned from the apparent similarity between ATP and AMPPNP effects in some assays (Fig 1E, 4C, etc) but not others (Fig 1D,F, etc)?

      We thank the reviewer for this suggestion. We have revised the manuscript accordingly, and below are the main points of our response

      (1) The experiment investigating the effects of different nucleotides on MCAK binding affinity was inspired by the previous studies demonstrating that kinesin-13 interactions with microtubules are highly dependent on their adenosine-bound states. For example, kinesin-13s tightly bind microtubules and prefer to form protofilament curls or rings with tubulin in the AMPPNP state, whereas kinesin-13s are considered to move along the microtubule lattice via one-dimensional diffusion in the ADP·Pi state (Asenjo et al., 2013; Benoit et al., 2018; Friel and Howard, 2011; Helenius et al., 2006). Based on these observations, we wondered whether MCAK's adenosine-bound states might similarly affect its binding preference for growing microtubule ends. We have made the motivation clear in the revised manuscript (please see page 7, lines 199-209).

      (2) Our main finding regarding the effects of nucleotides is that MCAK shows differential end-binding affinity and preference based on its nucleotide state. First, MCAK shows the greatest preference for growing microtubule ends in the ATP state, supporting the idea that diffusive MCAK (MCAK·ATP) can directly bind to growing microtubule ends. Second, MCAK·ATP also demonstrates a binding preference for GTPγS microtubules and the ends of GMPCPP microtubules. The similar trends in binding preference suggest that the affinity for GDP·Pi-tubulin and GTP-tubulin likely underpins MCAK’s preference for growing microtubule ends. To clarify these points, we have added further discussions in the manuscript (please see page 8, lines 230-233; page9, lines 258-270 and pages 13-14, lines 443-458).

      (3) It is not clear why the authors decided to use these specific mutant MCAK proteins to advance their arguments about the importance of direct tip binding. Both mutants are enzymatically inactive. Both show roughly similar tip interactions, with some (minor) differences. Without a clear understanding of what these mutants represent, the provided interpretations of the corresponding results are not convincing.

      We thank the reviewer for this comment. In the revised manuscript, we no longer draw conclusions about the importance of end-binding based on the mutant data. Instead, we think that the mutant data provide insights into the structural basis of the end-binding preference. Therefore, we have rewritten the results in this section to more accurately reflect these findings (please see page 10, lines 295-327).

      (4) GMPCPP microtubules are used in the current study to represent normal dynamic microtubule ends, based on some published studies. However, there is no consensus in the field regarding the structure of growing vs. GMPCPP-stabilized microtubule ends, which additionally may be sensitive to specific experimental conditions (buffers, temperature, age of microtubules, etc). To strengthen the authors' argument, Taxol-stabilized microtubules should be used as a control to test if the effects are specific. Additionally, the authors should consider the possibility that stronger MCAK binding to the ends of different types of microtubules may reflect MCAK-dependent depolymerization events on a very small scale (several tubulin rows). These nano-scale changes to tubulins and the microtubule end may lead to the accumulation of small tubulin-MCAK aggregates, as is seen with other MAPs and slowly depolymerizing microtubules. These effects for MCAK may also depend on specific nucleotides, further complicating the interpretation. This possibility should be addressed because it provides a different interpretation than presented in the manuscript.

      Regarding the two points raised here, our thoughts are as following

      (1) The end of GMPCPP-stabilized microtubules differs from that of growing microtubules, with the most obvious known difference being the absence of the region enriched in GDP-Pi-tubulin. We consider the end of GMPCPP microtubules as an analogue of the distal tip of growing microtubules, based on two key features: (1) curled protofilaments and (2) GMPCPP-tubulin, a close analogue of GTP-tubulin. Notably, both features are present at the ends of both GMPCPP-stabilized and growing microtubules. Moreover, we agree with the suggestion to use taxol-stabilized microtubules as a control. This would eliminate the second feature (absence of GTP-tubulin), allowing us to isolate the effect of the first feature. Therefore, we conducted this experiment, and our data showed that MCAK exhibits only a mild binding preference for the ends of taxol-stabilized microtubules, which is much less pronounced than for the ends of GMPCPP microtubules. This observation supports the idea that GMPCPP-stabilized ends closely resemble the growing ends of microtubules.

      (2) The reviewer suggested that stronger MCAK binding to the ends of different types of microtubules might reflect MCAK-dependent depolymerization events on a very small scale. This is an insightful possibility, which we had overlooked in the original manuscript. Fortunately, we performed the experiments at the single-molecule concentrations. Upon reviewing the raw data, we found that under ATP conditions, the binding events of MCAK were not cumulative (see Fig. X1 below) and showed no evidence of local accumulation of MCAK-tubulin aggregates.

      Author response image 1.

      The representative kymograph showing GFP-MCAK binding at the ends and lattice of GMPCPP microtubules in the presence of 1 mM ATP (10 nM GFP-MCAK), which corresponded to Fig. 5A. The arrow: the end-binding of MCAK. Vertical bar: 1 s; horizontal bar: 2 mm.

      (5) It would be helpful if the authors provided microtubule polymerization rates and catastrophe frequencies for assays with dynamic microtubules and MCAK in the presence of different nucleotides. The video recordings of microtubules under these conditions are already available to the authors, so it should not be difficult to provide these quantifications. They may reveal that microtubule ends are different (or not) under the examined conditions. It would also help to increase the overall credibility of this study by providing data that are easy to compare between different labs.

      We thank the reviewer for this suggestion. In the revised manuscript, we have provided data on the growth rates, which are similar across the different nucleotide states (Fig. s1). However, due to the short duration of our recordings (usually 5 minutes, but with a high frame rate, 10 fps), we did not observe many catastrophe events, which prevented us from quantifying catastrophe frequency using the current dataset. Since we measured the binding kinetics of MCAK during the growing phase of microtubules, the similar growth rates and microtubule end morphologies suggest that the microtubule ends are comparable across the different conditions.

      Reviewer #1 (Recommendations For The Authors):

      a. Please provide more details about how the microtubule-bound molecules were selected for analysis (include a description of scripts, selection criteria, and filters, if any). Fig 1A arrows do not provide sufficient information.

      We first measured the fluorescence intensity of each binding event. A probability distribution of these intensities was then constructed and fitted with a Gaussian function. A binding event was considered to correspond to a single molecule if its intensity fell within μ±2σ of the distribution. The details of the single-molecule screening process are now provided in the revised manuscript (see page17, lines 574-583).

      b. Evidence that MCAK is dimeric in solution should be provided (gel filtration results, controls for Figs1A - bleaching, or comparison with single GFP fluorophore).

      In the revised manuscript, we provide the gel filtration results of purified MCAK and other proteins used in this study. The elution volume of the peak for GFP-MCAK corresponded to a molecular weight range between 120 kDa (EB1-GFP dimer) and 260 kDa (XMAP215-GFP-his6), suggesting that GFP-MCAK exists as a dimer (~220 kDa) under experimental condition (please see Fig.s1 and page 5, lines 104-105). In addition, we also measured the fluorescence intensity of both MCAK<sup>sN+M</sup> and MCAK. MCAK<sup>sN+M</sup> is a monomeric mutant that contains the neck domain and motor domain (Wang et al., 2012). The average intensity of MCAK<sup>sN+M</sup> is 196 A.U., about 65% of that of MCAK (300 A.U.). These two measurements suggest that the purified MCAK used in this study exists dimers (see Fig. s1).

      c. Evidence that MCAK on microtubules represents single molecules should be provided (distribution of GFP brightness with controls - GFP imaged under identical conditions). Since assay buffers include detergent, which is not desirable, all controls should be done using the same assay conditions. The authors should rule out that their main results are detergent-sensitive.

      (1) Regarding if MCAK on microtubules represent single molecules: please refer to our responses to the two points above.

      (2) To rule out the effect of tween-20 (0.0001%, v/v), we performed additional control experiments. The results showed that it has no significant effect on microtubule-binding affinity of MCAK (see Figure below).

      Author response image 2.

      Tween-20 (0.0001%, v/v) has no significant effect on microtubule-binding affinity of MCAK. (A) The representative projection images of GFP-MCAK (5 nM) binding to taxol-stabled GDP microtubules in the presence of 1 mM AMPPNP with or without tween-20. The upper panel showed the results of the control experiments performed without MCAK. Scale bar: 5 mm. (B) Statistical quantification of the binding intensity of GFP-MCAK binding to GDP microtubules with or without tween-20 (53 microtubules from 3 assays and 70 microtubules from 3 assays, respectively). Data were presented as mean ± SEM. Statistical comparisons were performed using the two-tailed Mann-Whitney U test with Bonferroni correction, n.s., no significance.

      d. How did the authors plot single-molecule intensity distributions? I am confused as to why the intensity distribution for single molecules in Fig 1D and 2A looks so perfectly smooth, non-pixelated, and broader than expected for GFP wavelength. Please provide unprocessed original distributions, pixel size, and more details about how the distributions were processed.

      In the revised manuscript, we provided unprocessed original data in Fig. 1B and Fig. 2A. We thank the reviewer for pointing out this problem.

      e. Many quantifications are based on a limited number of microtubules and the number of molecules is not provided, starting from Fig 1D and down. Please provide detailed statistics and explain what is plotted (mean with SEM?) on each graph.

      We performed a thorough inspection of the manuscript and corrected the identified issues.

      f. Plots with averaged data should be supplemented with error bars and N should be provided in the legend. E.g. Fig 1C - average position of MT and peak positions.

      We agree with the reviewer. In the revised manuscript, we have made the changes accordingly (e.g. Fig. 2C).

      g. Detailed information should be provided about protein constructs used in this work including all tags. The use of truncated proteins or charged/bulky tags can modify protein-microtubule interactions.

      We agree with the reviewer. In the revised manuscript, we provide the information of all constructs (see Fig. s1 and the related descriptions in Methods, pages 15-16, lines 476-534).

      h. Line 515: We estimated that the accuracy of microtubule end tracking was ~6 nm by measuring the standard error of the distribution of the estimated error in the microtubule end position. - evidence should be provided using the conditions of this study, not the reference to the prior work by others.

      i. Line 520: We estimated that the accuracy of the measured position was ~2 nm by measuring the standard error of the fitting peak location". Please provide evidence.

      Point h-i: we now provide detailed descriptions of how to estimate tracking and measurement accuracy and error in our work. Please see pages 18-19, lines 626-645.

      j. Kymographs in Fig 5G are barely visible. Please provide single-channel greyscale images. What are the dim molecules diffusing on this microtubule?

      We have incorporated the changes suggested by the reviewer. We think that some of the dim signals may result from stochastic background noise, while others likely represent transient bindings of MCAK. The exposure time in our experiments was approximately 0.05 seconds; if the binding duration were shorter than this, the signal would be lower (i.e. the “dim” signals). It is important to note that in this study, we selected binding events lasting at least 2 consecutive frames, meaning transient binding events were not included. This point has been clarified in the Methods section (see page17, lines 573-583).

      k. Please provide a methods description for Fig 6. Did the buffer include 1 mM ATP? The presence of ATP would make these conditions more physiological. ATP concentration should be stated clearly in the main text or figure legend.

      The buffer contains ATP. In the revised manuscript, we have provided the methods for the experiments of microtubule dynamics assay, as well as the analysis of microtubule lifetimes and catastrophe frequency (see page 17, lines 561-572 and page 20, lines 685-690).

      l. Line 104: experiment was performed in BRB80 supplemented with 50 mM KCl and 1 mM ATP, providing a nearly physiological ion strength. Please provide a reference or add your calculations in Methods.

      We have provided references on page 5, lines 101-104 of our manuscript.

      m. What was the MCAK concentration in Figure 4? Did the microtubule shorten under any of these conditions?

      In these experiments, we used a very low concentration of MCAK and taxol-stabilized microtubules, so there’s no microtubule shortening observed here. ATP: 10 nM GFP-MCAK; AMPPNP: 1 nM GFP-MCAK; ADP: 10 nM GFP-MCAK; APO state: 0.1 nM GFP-MCAK.

      Other criticism:

      Text improvements are recommended in the Discussion. For example, line 348: Fourth, the loss of the binding preference.. suggests that the binding preference .. is required for the optimal .. preference.

      We thank the reviewer for pointing out this. In the revised manuscript, we conducted a thorough revision and review of the text.

      Reviewer #2 (Public Review):

      Summary:

      In this manuscript, Chen et al. investigate the localization of microtubule kinesin-13 MCAK to the microtubule ends. MCAK is a prominent microtubule depolymerase whose molecular mechanisms of action have been extensively studied by a number of labs over the last ~twenty years. Here, the authors use single-molecule approaches to investigate the precise localization of MCAK on growing microtubules and conclude that MCAK preferentially binds to a GDP-Pi-tubulin portion of the microtubule end. The conclusions are speculative and not well substantiated by the data, making the impact of the study in its current form rather limited. Specifically, greater effort should be made to define the region of MCAK binding on microtubule ends, as well as its structural characteristics. Given that MCAK has been previously shown to effectively tip-track growing microtubule ends through an established interaction with EB proteins, the physiological relevance of the present study is unclear. Finally, the manuscript does not cite or properly discuss a number of relevant literature references, the results of which should be directly compared and contrasted to those presented here.

      We thank the reviewer for the comments. As these suggestions are more thoroughly expressed in the following comments for authors, we will provide the responses in the corresponding sections, as shown below.

      Reviewer #2 (Recommendations For The Authors):

      Significant concerns:

      (1) Establishing the precise localization of MCAK wrt microtubule end is highly non-trivial. More details should be provided, including substantial supplementary data. In particular, the authors claim ~6 nm accuracy in microtubule end positioning - this should be substantiated by data showing individual overlaid microtubule end intensity profiles as well as fits with standard deviations etc. Furthermore, to conclude that MCAK binds behind XMAP215, the authors should look at the localization of the two proteins simultaneously, on the same microtubule end. Notably, EB binding profiles are well known to exponentially decay along the microtubule lattice - this is not very apparent from the presented data. If MCAK's autonomous binding pattern matches that of EB, we should be seeing an exponentially-decaying localization for MCAK as well? However, averaged MCAK signals seem to only be fitted to Gaussian. Note that the EB binding region (i.e. position and size of the EB comet) can be substantially modulated by increasing the microtubule growth rate - this can be easily accomplished by increasing tubulin concentrations or the addition of XMAP215 (e.g. see Maurer et al. Cur Bio 2014). Thus to establish that MCAK on its own binds the same region as EB, experiments that directly modulate the size and the position of this region should be added.

      (1) We thank the reviewer for this comment. Regarding the accuracy in microtubule end positioning, we now provide more details, and please see pages 18-19, lines 625-645 in the revised manuscript.

      (2) Regarding the relative localization of XMAP215 and MCAK, we performed additional experiments to record their colocalizations simultaneously, on the same microtubule end. Our results showed that MCAK predominantly binds behind XMAP215, with 14.5% appearing within the XMAP215’s binding region. Please see Fig. 2.D-E and lines 184-197 in the revised manuscript.

      (3) Regarding the exponential decay of the EB1 signal along microtubules, we observed that the position probability distribution measured in the present study follows a Gaussian distribution, and the expected exponential decay was not apparent. Since the exponential decay is thought to result from the time delay between tubulin polymerization and GTP hydrolysis, slower polymerization is expected to reduce this latency (Maurer et al., 2014). In our experiments, the growth rate was relatively low (~0.7 mm/min), much slower than the rate observed in cells, where the comet-shaped EB1 signal is most pronounced. The previous study has shown that the exponential decay of EB1 is more pronounced at growth rates exceeding 3 mm/min in vitro (Maurer et al., 2014). Therefore, we think that the relatively slow growth may account for the observed non-exponential decay distribution of the EB1 signals. The same reason may also explain the distribution of MCAK.

      (4) We agree with the reviewer’s suggestion that altering microtubule growth rate is a valid and effective approach to regulate the EB cap length. However, the conclusion that MCAK binds to the EB region is supported by three lines of evidence: (1) the localization of MCAK at the ends of microtubules, (2) new experimental data showing that MCAK binds to the proximal end of the XMAP215 site, and (3) the tendency of MCAK to bind GTPγS microtubules, similar to EB1. Based on these findings, we did not pursue additional experiments to modify the length of the EB cap.

      (2) Even if MCAK indeed binds behind XMAP215, there is no evidence that this region is defined by the GDP-Pi nucleotide state; it could still be curved protofilaments. GTPyS is an analogue of GTP - to what extent GTPyS microtubules exactly mimic the GDP-Pi-tubulin state remains controversial. Furthermore, nucleotide sensing for EB is thought to be achieved through its binding at the interface of four tubulin dimers. However MCAK's binding site is distinct, and it has been shown to recognize intradimer tubulin curvature. Thus it is not clear how MCAK would sense the nucleotide state. On the other hand, there is mounting evidence that the morphology of the growing microtubule end can be highly variable, and that curved protofilaments may be protruding off the growing ends for tens of nanometers or more, previously observed both by EM as well as by fluorescence (e.g. Mcintosh, Moores, Chretien, Odde, Gardner, Akhmanova, Hancock, Zanic labs). Thus, to establish that MCAK indeed localizes along the closed lattice, EM approaches should be used.

      First, we conducted additional experiments that demonstrate MCAK indeed binds behind XMAP215, supporting the conclusion that MCAK interacts with the EB cap (please see Fig. 2 in the revised manuscript). Second, our argument that MCAK preferentially binds to GDP-Pi tubulin is based on two observations: (1) the binding regions of MCAK overlap with those of EB1, and (2) MCAK preferentially binds to GTPγS microtubules, which are considered a close analogue of GDP-Pi tubulin. Third, understanding the structural basis of how MCAK senses the nucleotide state of tubulin is beyond the scope of the present study. However, inspired by the reviewer’s suggestion, we looked into the structure of the MCAK-tubulin complex. The L2 loop of MCAK makes direct contact with the interdimer interface (Trofimova et al., 2018; Wang et al., 2017), which could provide a structural basis for recognizing the changes induced by GTP hydrolysis. While this remains a hypothesis, it is certainly a promising direction for future research. Forth, we agree with the reviewer that an EM approach would be ideal for establishing that MCAK localizes along the closed lattice. However, this is not the focus of the current study. Instead, we argue that MCAK binds to the EB cap, where at least some lateral interactions are likely to have formed.

      (3) The physiological relevance of the study is rather questionable: MCAK has been previously established to be able to both diffuse along the microtubule lattice (e.g. Helenius et al.) as well as hitchhike on EBs (Gouveia et al.). Given the established localization of EBs to growing microtubule ends in cells, and apparently higher affinity of MCAK for EB vs. the microtubule end itself (although direct comparisons with the literature have not been reported here), the relevance of MCAK's autonomous binding to dynamic microtubule ends is dubious.

      We thank the reviewer for raising the importance of physiological relevance. Please refer to our response to the comment No.1 of reviewer 1. Briefly, we think that the end-binding affinity of MCAK makes a significant contribution for its cellular functions. To elucidate this concept, we now use a simple model shown in Supplementary Appendix-2 (see pages 49-51, lines 1246-1316). In this model, we simplified MCAK and EB1 binding to microtubule ends by considering only these two proteins while neglecting other factors (e.g. XMAP215). Specifically, we considered two scenarios: one in which both proteins freely diffuse in the cytoplasm and another where MCAK is localized to specific cellular structures, such as the centrosome or centromere. Based on the modeling results, we argue that MCAK's functional impact at microtubule ends derives both from its intrinsic end-binding capacity and its ability to strengthen the EB1-mediated end association pathway.

      (4) Finally, the study seriously lacks discussion of and comparison with the existing literature on this topic. There are major omissions in citing relevant literature, such as e.g. landmark study by Kinoshita et al. Science 2001. Several findings reported here directly contradict previous findings in the literature. Direct comparison with e.g. Gouveia et al findings, Helenius et al. findings, and others need to be included. For example, Gouveia et al reported that EB is necessary for MCAK plus-end-tracking in vitro (please see Figure 1 of their manuscript). The authors should discuss how they reconcile the differences in their findings when compared to this earlier study.

      We thank the reviewer for this helpful suggestion. In the revised manuscript, we have updated the text description and included comparative discussions with other relevant studies in the Discussion section. Specifically, we added comparisons with the research on XMAP215 in page 14, lines 459-472 (Barr and Gergely, 2008; Kinoshita et al., 2001; Tournebize et al., 2000). Additionally, we have compared our findings with those of Gouveia et al. and Helenius et al. regarding MCAK's preference for binding microtubule ends in page 6, lines 145-157 and page 13, 408-441, respectively (Gouveia et al., 2010; Helenius et al., 2006).

      Additional specific comments:

      Figure 1

      Gouveia et al. (Figure 1) reported that MCAK does not autonomously preferentially localize to growing tips. Specifically, Gouveia et al. found equal association rates of MCAK to both the lattice and the tip in the presence of EB3delT, an EB3 construct that does not directly interact with MCAK. How can these findings be reconciled with the results presented here?

      We are uncertain why there was no observed difference in the on-rates to the lattice and the end in the study by Gouveia et al. Even when considering only the known affinity of MCAK for curved protofilaments at the distal tip of growing microtubules, we would still expect to observe an end-binding preference. After carefully comparing the experimental conditions, we nevertheless identified some differences. First, we used a 160 nm tip size to calculate the on-rate (k<sub>on</sub>), whereas Gouveia et al. used a 450 nm tip. Using a longer tip size would naturally lead to a smaller(k<sub>on</sub>) value. Note that we chose 160 nm for several reasons: (i) a previous cryo-electron tomography study has elucidated that the sheet structures of dynamic microtubule ends have an average length of around 180 nm (Guesdon et al., 2016); (ii) Analysis of fluorescence signals at dynamic microtubule ends has demonstrated that the taper length at the microtubule end is less than 180 nm (Maurer et al., 2014); (iii) in the present study, we estimated that the length of MCAK's end-binding region is approximately 160 nm. Second, in Gouveia et al., single-molecule binding events were recorded in the presence of 75 nM EB3ΔT, which could potentially create a crowded environment at the tip, reducing MCAK binding. Third, as mentioned in our response to Reviewer 1, we took great care to minimize the interference from purification tags (e.g., His-tag) by ensuring their complete removal during protein preparation. Previous studies reported that retaining the His-tag of MAPs led to a significant increase in binding for microtubules (Maurer et al., 2011; Zhu et al., 2009). We believe that some of the factors mentioned above, or their combined effects, may account for the differences in these two observations.

      1C shows the decay of tubulin signal over several hundred nm - should show individual traces? How aligned? Doesn't this long decay suggest protruding protofilaments? (E.g. Odde/Gardner work).

      (1) In the revised manuscript, we now show individual traces (e.g. in Fig. 1B and Fig. 2A). The average trace for tubulin signal with standard deviation was shown in Fig. 2C.

      (2) The microtubule lattice was considered as a Gaussian wall and its end as a half-Gaussian in every frame. Use the peak position of the half-Gaussian of every frame to align and average microtubule end signals, during the dwell time. The average microtubule ends' half-Gaussion peak used as a reference to measure the intensity profile of individual single-molecule binding event in every frame (see page18, lines 607-624).

      (3) We think that the decay of tubulin signal results from the convolution of the tapered end structure and the point spread function. In the revised manuscript, we have updated the Figures to provide unprocessed original data in Fig. 1B and Fig. 2A.

      Please show absolute numbers of measurements in 1C (rather than normalized distribution only).

      In the revised manuscript, we have included the raw data for both tubulin and MCAK signals as part of the methods description. In Fig. 1, using normalized values allows for the simultaneous representation of microtubule and protein signals on a unified graph.

      How do the results in 1D-G compare with the previous literature? Particularly comparison of on-rates between this study and the Gouveia et al? Assuming 1 um = 1625 dimers, it appears that in the presence of EB3, the on-rate of MCAK to the tips reported in Gouveia et al. is an order of magnitude higher than reported here in the absence of EB3 (4.3 x 10E-4 vs. 2 x 10E-5). If so, and given the robust presence of EB proteins at growing microtubule ends in cells, this would invalidate the potential physiological relevance of the current study. Note that the dwell times measured in Gouveia et al. are also longer than those measured here.

      Note that in Gouveia et al, the concentration of mCherry-EB3 was 75 nM, about 187.5 times higher than that of MCAK (0.4 nM). The relative concentrations of these two proteins are not always the case in cells. Regarding the physiological relevance of the end-binding affinity of MCAK itself, please refer to our response to the point No.1 of Reviewer 1.

      Notably, Helenius et al reported a diffusion constant for MCAK of 0.38 um^2/s, which is more than an order of magnitude higher than reported here. The authors should comment on this!

      In the revised manuscript, we have provided an explanation for the difference in diffusion coefficient. Please see page 6, line 142-157. In short, low salt condition facilitates rapid diffusion of MCAK.

      Figure 2:

      This figure is critical and really depends on the analysis of the tubulin signal. Note significant variability in tubulin signal between presented examples in 2A. Also, while 2C looks qualitatively similar, there appears to be significant variability over the several hundred nm from the tip along the lattice. This is the crucial region; statistical significance testing should be presented. More detailed info, including SDs etc. is necessary.

      In the revised manuscript, we have provided raw data in Fig. 1B and Fig. 2A. Additionally, we have provided statistical analysis on the tubulin signals (Fig. 2C) and performed significance test. Please see page 5, lines 111-116 and page 7, lines 179-183 for detailed descriptions.

      Insights into the morphology of microtubule ends based on TIRF imaging have been previously gained in the literature, with reports of extended tip structures/protruding protofilaments (see e.g. Coombes et al. Cur Bio 2013, based on the methods of Demchouk et al. 2011). Such analysis should be performed here as well, if we are to conclude that nucleotide state alone, as opposed to the end morphology, specifies MCAK's tip localization.

      We appreciate the reviewer’s suggestion and agree that it provides a valid optical microscopy-based approach for estimating microtubule end morphology. However, this method did not establish a direct correlation between microtubule end morphology and tubulin nucleotide status. Therefore, we think that refining the measurement of microtubule end morphology will not necessarily provide more information to the understanding of tubulin nucleotide status at MCAK binding sites. Based on the available data in the present study, there are two main pieces of evidence supporting the idea that MCAK can sense tubulin nucleotide status: (1) the binding regions of MCAK and EB overlap significantly, and (2) MCAK shows a clear preference for binding to GTPγS microtubules, similar to EB1 (we provide a new control to support this, Fig. s4). Of course, we do not consider this to be a perfect set of evidence. As the reviewer has pointed out here and in other suggestions, future work should aim to further distinguish the nucleotide status of tubulin in the dynamic versus non-dynamic regions at the ends of microtubules, and to investigate the structural basis by which MCAK recognizes tubulin nucleotide status.

      EB comet profile should be clearly reproduced. MCAK should follow the comet profile.

      Please see our 3<sup>rd</sup> response to the point 1 of this reviewer.

      The conclusion that the MCAK binding region is larger than XMAP215 is not firm, based on the data presented. The authors state that 'the binding region of MCAK was longer than that of XMAP215'. What is the exact width of the region of the XMAP215 localization and how much longer is the MCAK end-binding region? Is this statistically significant?

      We have revised this part in the revised manuscript (page 6, lines 167-172). The position probability distributions of MCAK and XMAP215 were significantly different (K-S test, p< 10<sup>-5</sup>), and the binding region of MCAK (FWHM=185 nm) was significantly longer than that of XMAP215 (FWHM=123 nm).

      MCAK localization with AMPPNP should also be performed here. Even low concentrations of MCAK have been shown to induce microtubule catastrophe/end depolymerization. This will dramatically affect microtubule end morphology, and thus apparent positioning of MCAK at the end.

      In the end positioning experiment, we used a low concentration of MCAK (1 nM). Under this condition, microtubule dynamics remained unchanged, and the morphology of the microtubule ends was comparable across different conditions (with EB1, MCAK or XMAP215). Additionally, in the revised manuscript, we present a new experiment in which we recorded the localization of both MCAK and XMAP215 on the same microtubule. The results support the conclusion regarding their relative localization: most MCAK is found at the proximal end of the XMAP215 binding region, while approximately 15% of MCAK is located within the XMAP215 binding region. Please see Fig. 2D-E and page 7, lines 184-197 for the corresponding descriptions.

      Figure 3:

      For clearer presentation, projections showing two microtubule lattice types on the same image (in e.g. two different colors) should be shown first without MCAK, and then with MCAK.

      We thank the reviewer for this suggestion. We have adjusted the figure accordingly. Please see Fig. 4 in the revised manuscript.

      Please comment on absolute intensity values - scales seem to be incredibly variable.

      The fluorescence value presented here is the result of multiple images being summed. Therefore, the difference in absolute values is influenced not only by the binding affinity of MCAK in different states to microtubules, but also by the number of images used. In this analysis, we are not comparing MCAK in different states, but rather evaluating the binding ability of MCAK in the same state on different types of microtubules.

      Given that the authors conclude that MCAK binding mimics that of EB, EB intensity measurements and ratios on different lattice substrates should be performed as a positive control.

      We performed additional experiments with EB1, in the revised manuscript, we provide the data as a positive control (please see Fig. s4).

      Figure 4:

      MCAK-nucleotide dependence of GMPCPP microtubule-end binding has been previously established (see e.g. Helenius et al, others?) - what is new here? Need to discuss the literature. This would be more appropriate as a supplemental figure?

      In the present study, we reproduced the GMPCPP microtubule-end binding of MCAK in the AMPPNP state, as shown in several previous reports (Desai et al., 1999; Hertzer et al., 2006). Here, we also quantified the end to lattice binding preference, and our results showed that the nucleotide state-dependence shows the same trend as the binding preference of MCAK to the growing microtubule ends. Therefore, we prefer to keep this figure in the main text (Fig. 5).

      Figure 5:

      Please note that both MCAK mutants show an additional two orders of magnitude lower microtubule binding on-rates when compared to wt MCAK. This makes the analysis of preferential binding substrate for these mutants dubious.

      We agreed with this point. We have rewritten this part. Please see page 10, lines 295-327, in the revised manuscript.

      Figure 6:

      Combined effects of XMAP215 and XKCM1 (MCAK) have been previously explored in the landmark study by Kinoshita et al. Science 2001, which should be cited and discussed. Also note that Moriwaki et al. JCB 2016 explored the combined effects of XMA215 and MCAK - which should be discussed here and compared to the current results.

      We agree with the reviewer. We have revised the discussion on this part. Please see page 11, lines 329-342 and page 14, lines 459-472 in the revised manuscript.

      Please report quantification for growth rate and lifetime.

      In the revised manuscript, we provide all these data. Please see pages 11-12, lines 343-374.

      To obtain any new quantitative information on the combined effects of the two proteins, at the very minimum, the authors should perform a titration in protein concentration.

      We agree with the reviewer on this point. In our pilot experiments, we performed titration experiments to determine the appropriate concentrations of MCAK and XMAP215, respectively. We selected 50 nM for XMAP215, as it clearly enhances the growth rate and exhibits a mild promoting effect on catastrophe—two key effects of XMAP215 reported in previous studies (Brouhard et al., 2008; Farmer et al., 2021). Reducing the XMAP215 concentration eliminates the catastrophe-promoting effect, while increasing it would not much enhance the growth rate. For MCAK, we chose 20 nM, as it effectively promotes catastrophe; increasing the concentration beyond this point leads to no microtubule growth, at least in the MCAK-only condition. If there’s no microtubule growth, it would be difficult to quantify the parameters of microtubule dynamics, hindering a clear comparison of the combined versus individual effects. Therefore, we think that the concentrations used in this study are appropriate and representative. In the revised manuscript, we make this point clearer (see pages 11 and lines 329-342).

      Finally, the writing could be improved for overall clarity.

      We thank the reviewer for pointing out this. In the revised manuscript, we conducted a thorough revision and review of the text.

      Reviewer #3 (Public Review):

      The authors revisit an old question of how MCAK goes to microtubule ends, partially answered by many groups over the years. The authors seem to have omitted the literature on MCAK in the past 10-15 years. The novelty is limited due to what has previously been done on the question. Previous work showed MCAK targets to microtubule plus-ends in cells through association with EB proteins and Kif18b (work from Wordeman, Medema, Walczak, Welburn, Akhmanova) but none of their work is cited.

      We thank the reviewer for the suggestion. Some of the referenced work has already been cited in our manuscript, such as studies on the interaction between MCAK and EB1. However, other relevant literature had not been properly cited. In the revised manuscript, we have added further discussion on this topic in the context of existing findings. Please refer to pages 3-4, lines 68-85, and pages 13, lines 425-441.

      It is not obvious in the paper that these in vitro studies only reveal microtubule end targeting, rather than plus end targeting. MCAK diffuses on the lattice to both ends and its conformation and association with the lattice and ends has also been addressed by other groups-not cited here. I want to particularly highlight the work from Friel's lab where they identified a CDK phosphomimetic mutant close to helix4 which reduces the end preference of MCAK. This residue is very close to the one mutated in this study and is highly relevant because it is a site that is phosphorylated in vivo. This study and the mutant produced here suggest a charge-based recognition of the end of microtubules.

      Here the authors analyze this MCAK recognition of the lattice and microtubule ends, with different nucleotide states of MCAK and in the presence of different nucleotide states for the microtubule lattice. The main conclusion is that MCAK affinity for microtubules varies in the presence of different nucleotides (ATP and analogs) which was partially known already. How different nucleotide states of the microtubule lattice influence MCAK binding is novel. This information will be interesting to researchers working on the mechanism of motors and microtubules. However, there are some issues with some experiments. In the paper, the authors say they measure MCAK residency of growing end microtubules, but in the kymographs, the microtubules don't appear dynamic - in addition, in Figure 1A, MCAK is at microtubule ends and does not cause depolymerization. I would have expected to see depolymerization of the microtubule after MCAK targeting. The MCAK mutants are not well characterized. Do they still have ATPase activity? Are they folded? Can the authors also highlight T537 and discuss this?

      Finally, a few experiments are done with MCAK and XMAP215, after the authors say they have demonstrated the binding sites overlap. The data supporting this statement were not obvious and the conclusions that the effect of the two molecules are additive would argue against competing binding sites. Overall, while there are some interesting quantitative measurements of MCAK on microtubules - in particular in relation to the nucleotide state of the microtubule lattice - the insights into end-recognition are modest and do not address or discuss how it might happen in cells. Often the number of events is not recorded. Histograms with large SEM bars are presented, so it is hard to get a good idea of data distribution and robustness. Figures lack annotations. This compromises therefore their quantifications and conclusions. The discussion was hard to follow and needs streamlining, as well as putting their work in the context of what is known from other groups who produced work on this in the past few years.

      We thank the reviewer for the comments. Regarding the physiological relevance of the end-binding of MCAK itself, please refer to our response to the point No.1 of reviewer 1. Moreover, as we feel that other suggestions are more thoroughly expressed in the following comments for authors, we will provide the responses in the corresponding sections, as shown below.

      Reviewer #3 (Recommendations For The Authors):

      Why, on dynamic microtubules, is MCAK at microtubule plus ends and does not cause a catastrophe?

      At this concentration (10 nM MCAK with 16 mM tubulin in Fig. 1; 1 nM MCAK with 12 mM tubulin in Fig. 2), MCAK has little effect on microtubule dynamics in our experiments. Using TIRFM, we were able to observe individual MCAK binding events. Based on these observations, we think that in the current experimental condition, a single binding event of MCAK is insufficient to induce microtubule catastrophe; rather, it likely requires cumulative changes resulting from multiple binding events.

      Do the MCAK mutants still have ATPase activity?

      The ATPase activities of MCAK<sup>K525A</sup> and MCAK<sup>V298S</sup> are both reduced to about 1/3 of the wild-type (Fig. s6).

      The intensities of GFP are not all the same on the microtubule lattice (eg 1A). See blue and white arrowheads. The authors could be looking at multiple molecules of GFP-MCAK instead of single dimers. How do they account for this possibility?

      In the revised manuscript, we provide the gel filtration result of the purified MCAK, and the position of the peak corresponds to ~220 kDa, demonstrating that the purified MCAK in solution is dimeric (please see Fig.s1 and page 5, lines 101-103). We measured the fluorescence intensity of each binding event. A probability distribution of these intensities was then constructed and fitted with a Gaussian function. A binding event was considered to correspond to a single molecule if its intensity fell within μ±2σ of the distribution. The details of the single-molecule screening process are provided in the revised manuscript (see page 17, lines 574-583).

      In addition, we also measured the fluorescence intensity of both MCAK<sup>sN+M</sup> and MCAK. MCAK<sup>sN+M</sup> is a monomeric mutant that contains the neck domain and motor domain (Wang et al., 2012). The average intensity of MCAK<sup>sN+M</sup> is 196 A.U., about 65 % of that of MCAK (300 A.U.), suggesting that MCAK is a dimer (see Fig. s1). Moreover, we think that some of the dim signals may result from stochastic background noise, while others likely represent transient bindings of MCAK. The exposure time in our experiments was approximately 0.05 seconds; if the binding duration were shorter than this, the signal would be lower. It is important to note that in this study, we specifically selected binding events lasting at least 2 consecutive frames, meaning transient binding events were not included. This point has been clarified in the Methods section (see page 17, lines 568-569 and lines 574-583).

      Could the authors provide a kymograph of an MT growing, in the presence of MCAK+AMPPNP? Can MCAK track the cap?

      Under single-molecule conditions, we observed a single MCAK molecule briefly binding to the end of the microtubule. However, we did not record if MCAK at high concentrations could track microtubule ends under AMPPNP conditions.

      In the experiments in Figure 6, the authors should also show the localization of MCAK and XMAP215 at microtubule plus ends in their kymographs to show the two molecules overlap.

      Regarding the relative localization of XMAP215 and MCAK, we conducted additional experiments to record their colocalization simultaneously at the same microtubule end. Our results show that MCAK predominantly binds behind XMAP215, with 14.5% of MCAK binding within the XMAP215 binding region. Please see Fig. 2.D-E and page 7, lines 184-197 in the revised manuscript. However, we argue that the effects of XMAP215 and MCAK are additive, and their binding sites do not necessarily need to overlap for these effects to occur.

      The authors do not report what statistical tests are done in their graphs, and one concern is over error propagation of their data. Instead of bar graphs, showing the data points would be helpful.

      We have now shown all data points in the revised manuscript.

      MCAK+AMPPNP accumulates at microtubule ends. Appropriate quotes from previous work should be provided.

      We have made the revisions accordingly. Please see page 9, lines 273-276.

      Controls are missing. An SEC profile for all purified proteins should be presented. Also, the authors need to explain if they report the dimeric or monomeric concentration of MCAK, XMAP215, etc...

      We have provided the gel filtration result for all purified proteins in the revised manuscript (Fig.s1). Moreover, we now make it clear that the concentrations of MCAK and EB1 are monomeric concentration. Please see the legend for Fig. 1, line 893 in the revised manuscript.

      Figure 1: the microtubules don't look dynamic at all. This is also why the authors can record MCAK at microtubule ends, because their structure is not changing.

      The microtubules are dynamic, but they may appear non-dynamic due to the relatively slow growth rate and the high frame rate at which we are recording. We propose that individual binding events of MCAK induce structural changes at the nanoscopic or molecular scale, which are not detectable using TIRFM.

      I recommend the authors measure the Kon and Koff for single GFP-MCAK mutant molecules and provide the information alongside their normalized and averaged binding intensities of GFP-MCAK in Fig 5. Showing data points instead of bar graphs would be better.

      (1) We measured k<sub>on</sub> and dwell time for mutants at growing microtubule end. However, we did not perform single-molecule tracking for MCAK’s binding on stabilized microtubules. This is mainly because the superimposed signal on the stable microtubule already indicates the changes in the mutant's binding affinity to different microtubule structures, and moreover, the binding of the mutants is highly transient, making accurate single-molecule tracking and calculations difficult.

      (2) In the revised figure, we have included the data points in all plots.

      When discussing how Kinesin-13 interacts with the lattice, the authors should quote the papers that report the organization of full-length Kinesin-13 on tubulin heterodimers: Trofimova et al, 2018; McHugh et al 2019; Benoit et al, 2018. It would reinforce their model and account for the full-length protein, rather than just the motor domain.

      We thank the suggestion for the reviewer. In our manuscript, we have cited papers on full-length Kinesin-13 to discuss the interaction between MCAK and microtubule end-curved structure. Additionally, we have utilized the MCAK-tubulin crystal structure (PDB ID: 5MIO) in Fig. 6, as it depicts a human MCAK, which is consistent with the protein used in our study. This structure illustrates the interaction sites between MCAK and tubulin dimer, guiding our mutation studies on specific residues. Thus, we prefer to use the structure (PDB ID: 5MIO) in Fig.6.

      Figure 5A. What type of model is this? A PDB code is mentioned. Is this from an X-ray structure? If so, mention it.

      We have now included the structural information in the Figure legend (see page 37, lines 1045).

      Figure 5B. It is not possible to distinguish the different microtubule lattices (GTPyS, GDP, and GMPCPP). The experiment needs to be better labelled.

      We thank the reviewer for this comment. We have now rearranged the figure for better clarity (see Fig. 6).

      "Figure 5D: what are the statistical tests? I don't understand " The statistical comparisons were made versus the corresponding value of 848 GFP-MCAK".

      We have made this point clearer in the revised manuscript (see pages 38, line 1078-1080).

      What is the "EB cap"? This needs explaining.

      We provide this explanation for this, please see page 4, lines 87-89 in the revised manuscript.

      Work from Friel and co-workers showed MCAK T537E did not have depolymerizing activity and a reduced affinity for microtubule ends. The work of the authors should be discussed with respect to this previously published work.

      We thank the reviewer for this suggestion. In the revised manuscript, we have added discussions on this (see page 10, lines 303-307).

      The concentration of protein used in the assays is not always described.

      We have checked throughout the manuscript and made revisions accordingly.

      "Having revealed the novel binding sites of MCAK in dynamic microtubule ends " should be on "we wondered how MCAK may work ..with EB1". This is not addressed so should be removed. Instead, they can quote the work from Akhmanova's lab. Realistically this section should be rephrased as there are other plus-end targeting molecules that compete with MCAK, not just XMAP215 and EB1.

      We have rephrased this section as suggested by this reviewer to be more specific. Please see page 11, lines 329-342.

      What is AMPCPP?

      It should be “AMPPNP”

      Typos in Figure 5.

      Corrected

    1. Author response:

      The following is the authors’ response to the original reviews.

      Reviewer #1 (Public review):

      We thank the reviewer for his/her very positive comments.

      Reviewer #2 (Public review):

      We thank the reviewer for his/her positive evaluation. We plan to add RNAseq data of yeast wild-type and JDP mutant strains as more direct readout for the role of Apj1 in controlling Hsf1 activity. We agree with the reviewer that our study includes one major finding: the central role of Apj1 in controlling the attenuation phase of the heat shock response. In accordance with the reviewer we consider this finding highly relevant and interesting for a broad readership. We agree that additional studies are now necessary to mechanistically dissect how the diverse JDPs support Hsp70 in controlling Hsf1 activity. We believe that such analysis should be part of an independent study but we will indicate this aspect as part of an outlook in the discussion section of a revised manuscript.

      Reviewer #3 (Public review):

      We thank the reviewer for his/her suggestions. We agree that it is sometimes difficult to distinguish direct effects of JDP mutants on heat shock regulation from indirect ones, which can result from the accumulation of misfolded proteins that titrate Hsp70 capacity. We also agree that an in vitro reconstitution of Hsf1 displacement from DNA by Apj1/Hsp70 will be important, also to dissect Apj1 function mechanistically. We will add this point as outlook to the revised manuscript.

      Reviewer #1 (Recommendations for the authors): 

      (1) Can the authors submit the raw translatome data to a standard repository? Also, the data should be summarized in a supplemental Excel table. 

      We submitted the raw translatome data to the NCBI Gene Expression Omnibus and added the analyzed data sets (shown in Figures 1 and 5) as Supplementary Tables S4/S5 (excel sheets). We additionally included RNAseq analysis of yeast WT and JDP mutants set grown at 25°C, complementing and confirming our former translatome analysis (new Figure 5, Figure Supplement 2). Respective transcriptome raw data were also deposited at the NCBI Gene Expression Omnibus and analyzed data are available as Supplementary Table S7.

      (2) MW indicators need to be added to the Western Blot figures. 

      We added molecular weight markers to the Western Blot figures.

      (3) Can the authors please include the sequences of the primers used in all the RT-qPCR experiments? They mention they are in the supplemental information, but I couldn't locate them. 

      We added the sequences of the RT-qPCR primers as Supplementary Table S4.

      (4) Given the clear mechanism proposed, it would be nice if the authors could provide a nice summary figure. 

      We followed the suggestion of the reviewer and illustrate our main finding as new Figure 7.

      Reviewer #2 (Recommendations for the authors): 

      (1) As mentioned above, a co-IP experiment between Hsf1 and Ssa1/2 in APJ1 and apj1∆ cells, utilizing Hsf1 alleles with and without the two known binding sites, would cement the assignment of Apj1 in the Hsf1 regulatory circuit. 

      We agree with the reviewer that Hsf1-Ssa1/2 pulldown experiments, as done by Pincus and colleagues (1), will further specify the role of Apj1 in targeting Hsp70 to Hsf1 during the attenuation phase of the heat shock response. We have tried extensively such pulldown experiments to document dissociation of Ssa1/2 from Hsf1 upon heat shock in yeast wild-type cells. While we could specifically detect Ssa1/2 upon Hsf-HA1 pulldown, our results after heat shock were highly variable and inconclusive and did not allow us to probe for a role of Apj1 or the two known Ssa1/2 binding sites in the phase-specific targeting. We now discuss the potential roles of the two distinct Ssa1/2 binding sites for phase-specific regulation of Hsf1 activity in the revised manuscript (page 12, lanes 17-21).

      (2) Experiments in Figure 3 nicely localize CHIP reactions with known HSEs. A final confirmatory experiment utilizing a mutated HSE (another classic experiment in the field) would cement this finding and validate the motif and reporter-based analysis. 

      We thank the reviewer for this meaningful suggestions. We have done something like this by using the non-Hsf1 regulated gene BUD3, which lacks HSEs, as reference. We engineered a counterpart, termed “BUD3 HS-UAS”, which bears inserted HSEs, derived from the native UAS of HSP82, within the BUD3 UAS. We show that BUD3<sup>+</sup> lacking HSEs is not occupied by Hsf1 and Apj1 under either non-stress or heat shock conditions while BUD3-HSE is clearly occupied under both, paralleling Hsf1 and Apj1 occupancy of HSP82 (Figure 3E). We have renamed the engineered allele to “BUD3-HSE” to clarify the experimental design and output.

      (3) Page 8 - the ydj1-4xcga allele is introduced without explaining why it's needed, since ydj1∆ cells are viable. The authors should acknowledge the latter fact, then justify why the RQC depletion approach is preferred. Especially since the ydj1∆ mutant appears in Figure 5B. 

      ydj1∆ cells are viable, yet they grow extremely slowly at 25°C and hardly at 30°C,  making them difficult to handle. The RQC-mediated depletion of Ydj1 in ydj1-4xcga cells allows for solid growth at 30°C, facilitating strain handling and analysis of Ydj1 function. Importantly, ydj1-4xcga cells are still temperature-sensitive and exhibit the same deregulation of the heat shock response upon combination with apj1D as observed for ydj1∆ cells. Thus ydj1 knockout and knockdown cells do not differ in the relevant phenotypes reported here and we performed most of the analysis with  ydj1-4xcga cells due to their growth advantage. We added a respective explanation to the text (page 8, lanes 13-14) .

      (4) The authors raise the possibility that Sis1, Apj1, and Ydj1 may all be competing for access to Ssa1/2 at different phases of the HSR, and that access may be dictated by conformational changes in Hsf1. Given that there are at least two known Hsp70 binding sites that have negative regulatory activity in Hsf1, the possibility that domain-specific association governs the different roles should be considered. It is also unclear how the JDPs are associating with Hsf1 differentially if all binding is through Ssa1/2. 

      We thank the reviewer for the comment and will add the possibility of specific roles of the identified Hsp70 binding sites in regulating Hsf1 activity at the different phases of the heat shock response to the discussion section. Binding of Ssa1/2 to substrates (including Hsf1) is dependent on J-domain proteins (JDPs), which differ in substrate specificity. It is tempting to speculate that the distinct JDPs recognize different sites in Hsf1 and are responsible for mediating the specific binding of Ssa1/2 to either N- or C-terminal sites in Hsf1. Thus, the specific binding of a JDP to Hsf1 might dictate the binding to Ssa1/2 to either binding site. We discuss this aspect in the revised manuscript (page 12, lanes 17-21).

      (5) Figure 6 - temperature sensitivity of hsf1 and ydj1 mutants has been linked to defects in the cell wall integrity pathway rather than general proteostasis collapse. This is easily tested via plating on osmotically supportive media (i.e., 1M sorbitol) and should be done throughout Figure 6 to properly interpret the results.

      Our data indicate proteostasis breakdown in ydj1 cells by showing strongly altered localization of Sis1-GFP, pointing to massive protein aggregation (Figure 6 – Figure Supplement  1D).

      We followed the suggestion of the reviewer and performed spot tests in presence of 1 M sorbitol (see figure below). The presence of sorbitol is improving growth of ydj1-4xcga mutant cells at increased temperatures, in agreement with the remark of the reviewer. We, however, do not think that growth rescue by sorbitol is pointing to specific defects of the ydj1 mutant in cell wall integrity. Sorbitol functions as a chemical chaperone and has been shown to have protective effects on cellular proteostasis and to rescue phenotypes of diverse point mutants in yeast cells by facilitating folding of the respective mutant proteins and suppressing their aggregation (2-4). Thus sorbitol can broadly restore proteostasis, which can also explain its effects on growth of ydj1 mutants at increased temperatures. Therefore the readout of the spot test with sorbitol is not unambiguous and we therefore prefer not showing it in the manuscript.

      Author response image 1.

      Serial dilutions of indicated yeast strains were spotted on YPD plates without and with 1 M sorbitol and incubated at indicated temperatures for 2 days.<br />

      Reviewer #3 (Recommendations for the authors): 

      (1) Line 154: Can the authors, by analysis, offer an explanation for why HSR attenuation varies between genes for the sis1-4xcga strain? Is it, for example, a consequence of that a hypomorph and not a knock is used, a mRNA turnover issue, or that Hsf1 has different affinities for the HSEs in the promoters? 

      We used the sis1-4xcga knock-down strain because Sis1 is essential for yeast viability. The point raised by the reviewer is highly valid and we extensively thought about the diverse consequences of Sis1 depletion on levels of e.g. translated BTN2 (minor impact) and HSP104 (strong impact) mRNA. We meanwhile performed transcriptome analysis and confirmed the specific impact of Sis1 depletion on HSP104 mRNA levels, while BTN2 mRNA levels remained much less affected (new Figure 5 - Figure Supplement 2A/B). We compared numbers and spacings of HSEs in the respective target genes but could not identify obvious differences. Hsf1 occupancy within the UAS region of both BTN2 and HSP104 is very comparable at three different time points of a 39°C heat shock: 0, 5 and 120 min, arguing against different Hsf1 affinities to the respective HSEs (5). The molecular basis for the target-specific derepression upon Sis1 depletion thus remains to be explored. We added a respective comment to the revised version of the manuscript (page 12, lanes 3-8) .

      (2) Line 194: The analysis of ChIP-seq is not very elaborated in its presentation. How specific is this interaction? Can it be ruled out by analysis that it is simply the highly expressed genes after the HS that lead to Apj1 appearing there? More generally: Can the data in the main figure be presented to give a more unbiased genome-wide view of the results?

      We overall observed a low number of Apj1 binding events in the UAS of genes. The interaction of Apj1 with HSEs is specific as we do not observe Apj1 binding to the UAS of well-expressed non-heat shock genes. Similarly, Apj1 does not bind to ARS504 (Figure S3 – Figure Supplement 1). We extended the description of our ChIP-seq analysis procedures leading to the identification of HSEs as Apj1 target sites to make it easier to understand the data analysis. We additionally re-analysed the two Apj1 binding peaks that did not reveal an HSE in our original analysis. Using a modified setting we can identify a slightly degenerated HSE in the promoter region of the two genes (TMA10, RIE1) and changed Figure 3C accordingly. Notably, TMA10 is a known target gene of Hsf1. The expanded analysis is further documenting the specificity of the Apj1 binding peaks.

      (3) Line 215. Figure 3. The clear anticorrelation is puzzling. Presumably, Apj1 binds Hsf1 as a substrate, and then a straight correlation is expected: When Hsf1 substrate levels decrease at the promoters, also Apj1 signal is predicted to decrease. What explanations could there be for this? Is it, for example, that Hsf1 is not always available as a substrate on every promoter, or is Apj1 tied up elsewhere in the cell/nucleus early after HS? 

      We propose that Apj1 binds HSE-bound Hsf1 only after clearance of nuclear inclusions, which form upon heat stress. Apj1 thereby couples the restoration of nuclear proteostasis to the attenuation of the heat shock response. This explains the delayed binding of Apj1 to HSEs (via Hsf1), while Hsf1 shows highest binding upon activation of the heat shock response (early timepoints). Notably, the binding efficiency of Hsf1 and Apj1 (% input) largely differ, as we determine strong binding of Hsf1 five min post heat shock (30-40% of input), whereas maximal 3-4% of the input is pulled down with Apj1 (60 min post heat shock) (Figure 3D). Even at this late timepoint 10-20% of the input is pulled down with Hsf1. The diverse kinetics and pulldown efficiencies suggest that Apj1 displaces Hsf1 from HSEs and accordingly Hsf1 stays bound to HSEs in apj1D cells (Figure 4). This activity of Apj1 explains the anti-correlation: increased targeting of Apj1 to HSE-bound Hsf1 will lower the absolute levels of HSE-bound Hsf1. What we observe in the ChIP experiment at the individual timepoints is a snapshot of this reaction. Accordingly, at the last timepoint (120 min after heat shock ) analyzed, we observe low binding of both Hsf1 and Apj1 as the heat shock response has been shut down.

      (4) Line 253: "Sis-depleted".  

      We have corrected the mistake.

      (5) Line 332: Fig. 6C SIS1 OE from pRS315. A YIP would have been better, 20% of the cells will typically not express a protein with a CEN/ARS of the pRS-series so the Sis1 overexpression phenotype may be underestimated and this may impact on the interpretation. 

      We agree with the reviewer that Yeast Integrated Plasmids (YIP) represent the gold standard for complementation assays. We are not aware of a study showing that 20% of cells harboring pRS-plasmids do not express the encoded protein. The results shown in Fig. 8C/D demonstrate that even strong overproduction of Sis1 cannot restore Hsf1 activity control. This interpretation also will not be affected assuming that a certain percentage of these cells do not express Sis1. Nevertheless, we added a comment to the respective section pointing to the possibility that the Sis1 effect might be underestimated due to variations in Sis1 expression (page 11, lanes 15-19).

      (6) Figure 1C. Since n=2, a more transparent way of showing the data is the individual data points. It is used elsewhere in the manuscript, and I recommend it. 

      We agree that showing individual data points can enhance transparency, particularly with small sample sizes. However, the log2 fold change (log2FC) values presented in Figure 1C and other figures derived from ribosome profiling and RNAseq experiments were generated using the DESeq2 package. This DeSeq2 pipeline is widely used in analyzing differential gene expression and known for its statistical robustness. It performs differential expression analysis based on a model that incorporates normalization, dispersion estimation, and shrinkage of fold changes. The pipeline automatically accounts for biological, technical variability, and batch effects, thereby improving the reliability of results. These log2FC values are not directly calculated from log-transformed normalized counts of individual samples but are instead estimated from a fitted model comparing group means. Therefore, the individual values of replicates in DESeq2 log2FC cannot be shown.

      (7) Figure 1D. Please add the number of minutes on the X-axis. Figure legend: "Cycloheximide" is capitalized.  

      We revised the figure and figure legend as recommended.

      (8) Several figure panels: Statistical tests and SD error bars for experiments performed in duplicates simply feel wrong for this reviewer. I do recognize that parts of the community are calculating, in essence, quasi-p-values using parametric methods for experiments with far too low sample numbers, but I recommend not doing so. In my opinion, better to show the two data points and interpret with caution.

      We followed the advice of the reviewer and removed statistical tests for experiments based on duplicates.

      References

      (1) Krakowiak, J., Zheng, X., Patel, N., Feder, Z. A., Anandhakumar, J., Valerius, K. et al. (2018) Hsf1 and Hsp70 constitute a two-component feedback loop that regulates the yeast heat shock response eLife 7,

      (2) Guiberson, N. G. L., Pineda, A., Abramov, D., Kharel, P., Carnazza, K. E., Wragg, R. T. et al. (2018) Mechanism-based rescue of Munc18-1 dysfunction in varied encephalopathies by chemical chaperones Nature communications 9, 3986

      (3) Singh, L. R., Chen, X., Kozich, V., and Kruger, W. D. (2007) Chemical chaperone rescue of mutant human cystathionine beta-synthase Mol Genet Metab 91, 335-342

      (4) Marathe, S., and Bose, T. (2024) Chemical chaperone - sorbitol corrects cohesion and translational defects in the Roberts mutant bioRxiv  10.1101/2024.09.04.6109452024.2009.2004.610945

      (5) Pincus, D., Anandhakumar, J., Thiru, P., Guertin, M. J., Erkine, A. M., and Gross, D. S. (2018) Genetic and epigenetic determinants establish a continuum of Hsf1 occupancy and activity across the yeast genome Mol Biol Cell 29, 3168-3182

    1. Author response:

      The following is the authors’ response to the previous reviews.

      Reviewer #1:

      (1) Peptides were synthesized with fluorescein isothiocyanate (FITC) and Tat tag, and then PEGylated with methoxy PEG Succinimidyl Succinate.

      I have two concerns about the peptide design. First, FTIC was intended "for monitoring" (line 129), but was never used in the manuscript. Second, PEGylation targets the two lysine sidechains on the Tat, which would alter its penetration property.

      (1) We conducted an analysis of the cellular trafficking of FITC-tagged peptides following their permeabilization into cells.

      Author response image 1.

      However, we did not include it in the main text because it is a basic result.

      (2) As can be seen in the figure above, after pegylation and permeabilization, the cells were stained with FITC. It appears that this does not affect the ability to penetrate into the cells.

      (2) "Superdex 200 increase 10/300 GL column" (line 437) was used to isolate mono/di PEGylated PDZ and separate them from the residual PEG and PDZ peptide. "m-PEG-succinimidyl succinate with an average molecular weight of 5000 Da" (lines 133 and 134).

      To my knowledge, the Superdex 200 increase 10/300 GL column is not suitable and is unlikely to produce traces shown in Figure 1B.

      As Superdex 200 increase 10/300 GL featrues a fractionation range of 10,000 to 600,000 Da, we used it to fractionate PEGylated products including DiPEGylated PDZ (approx. 15 kDa) and MonoPEGylated PDZ (approx. 10 kDa) from residuals (PDZ and PEG), demonstrating successful isolation of PEGylated products (Figure 1C). Considering the molecular weights of PDZ and PEG are approximately 4.1 kDa and and 5.0 kDa, respectively, the late eluting peaks from SEC were likely to represent a mixed absorbance of PDZ and PEG at 215 nm.

      However, as the reviewer pointed out, it could be unreasonable to annotate peaks representing PDZ and PEG, respectively, from mixed absorbance detected in a region (11-12 min) beyond the fractionation range.

      In our revised manuscript, therefore, multiple peaks in the late eluting volume (11-12 min) were labeled as 'Residuals' all together. As a reference, the revised figure 1B includes a chromatogram of pure PDZ-WT under the same analytic condition.

      Therefore, we changed Fig.1B to new results.

      (3) "the in vivo survival effect of LPS and PDZ co-administration was examined in mice. The pretreatment with WT PDZ peptide significantly increased survival and rescued compared to LPS only; these effects were not observed with the mut PDZ peptide (Figure 2a)." (lines 159-160).

      Fig 2a is the weight curve only. The data is missing in the manuscript.

      We added the survived curve into Fig. 2A.

      (4) Table 1, peptide treatment on ALT and AST appears minor.

      In mice treated with LPS, levels of ALT and AGT in the blood are elevated, but these levels decrease upon treatment with WT PDZ. However, the use of mut PDZ does not result in significant changes. Figure 3A shows inflammatory cells within the central vein, yet no substantial hepatotoxicity is observed during the 5-day treatment with LPS. Normally, the ranges of ALT and AGT in C57BL6 mice are 16 ~ 200 U/L and 46 ~ 221 U/L, respectively, according to UCLA Diagnostic Labs. Therefore, the values in all experiments fall within these normal ranges. In summary, a 5-day treatment with LPS induces inflammation in the liver but is too short a duration to induce hepatotoxicity, resulting in lower values.

      (5) MitoTraker Green FM shouldn't produce red images in Figure 6.

      We changed new results (GREEN one) into Figs 6A and B.

      (6) Figure 5. Comparison of mRNA expression in PDZ-treated BEAS-2B cells. Needs a clearer and more detailed description both in the main text and figure legend. The current version is very hard to read.

      We changed Fig. 5A to new one to understand much easier and added more detailed results and figure legend.

      Results Section in Figure 5:

      we performed RNA sequencing analysis. The results of RNA-seq analysis showed the expression pattern of 24,424 genes according to each comparison combination, of which the results showed the similarity of 51 genes overlapping in 4 gene categories and the similarity between each comparison combination (Figure 5a). As a result, compared to the control group, it was confirmed that LPS alone, WT PDZ+LPS, and mut PDZ+LPS were all upregulated above the average value in each gene, and when LPS treatment alone was compared with WT PDZ+LPS, it was confirmed that they were averaged or downregulated. When comparing LPS treatment alone and mut PDZ+LPS, it was confirmed that about half of the genes were upregulated. Regarding the similarity between comparison combinations, the comparison combination with LPS…

      Figure 5 Legend Section:

      Figure 5. Comparison of mRNA expression in PDZ-treated BEAS-2B cells.

      BEAS-2B cells were treated with wild-type PDZ or mutant PDZ peptide for 24 h and then incubated with LPS for 2 h, after which RNA sequencing analysis was performed. (a) The heat map shows the general regulation pattern of about 51 inflammation-related genes that are differentially expressed when WT PDZ and mut PDZ are treated with LPS, an inflammatory substance. All samples are RED = upregulated and BLUE = downregulated relative to the gene average. Each row represents a gene, and the columns represent the values of the control group treated only with LPS and the WT PDZ and mut PDZ groups with LPS. This was used by converting each log value into a fold change value. All genes were adjusted to have the same mean and standard deviation, the unit of change is the standard deviation from the mean, and the color value range of each row is the same. (b) Significant genes were selected using Gene category chat (Fold change value of 2.00 and normalized data (log2) value of 4.00). The above pie chart shows the distribution of four gene categories when comparing LPS versus control, WT PDZ+LPS/LPS, and mut PDZ+LPS/LPS. The bar graph below shows RED=upregulated, GREEN=downregulated for each gene category, and shows the number of upregulated and downregulated genes in each gene category. (c) The protein-protein interaction network constructed by the STRING database differentially displays commonly occurring genes by comparing WT PDZ+LPS/LPS, mut PDZ+LPS/LPS, and LPS. These nodes represent proteins associated with inflammation, and these connecting lines denote interactions between two proteins. Different line thicknesses indicate types of evidence used in predicting the associations.

      Reviewer #2:

      (1) In this paper, the authors demonstrated the anti-inflammatory effect of PDZ peptide by inhibition of NF-kB signaling. Are there any results on the PDZ peptide-binding proteins (directly or indirectly) that can regulate LPS-induced inflammatory signaling pathway? Elucidation of the PDZ peptide-its binding partner protein and regulatory mechanisms will strengthen the author's hypothesis about the anti-inflammatory effects of PDZ peptide.

      As mentioned in the Discussion section, we believe it is crucial to identify proteins that directly interact with PDZ and regulate it. This direct interaction can modulate intracellular signaling pathways, so we plan to express GST-PDZ and induce binding with cellular lysates, then characterize it using the LC-Mass/Mass method. We intend to further research these findings and submit them for publication.

      (2) The authors presented interesting insights into the therapeutic role of the PDZ motif peptide of ZO-1. PDZ domains are protein-protein interaction modules found in a variety of species. It has been thought that many cellular and biological functions, especially those involving signal transduction complexes, are affected by PDZ-mediated interactions. What is the rationale for selecting the core sequence that regulates inflammation among the PDZ motifs of ZO-1 shown in Figure 1A?

      The rationale for selecting the core sequence that regulates inflammation among the PDZ motifs of ZO-1, as shown in Figure 1A, is grounded in the specific roles these motifs play in signal transduction pathways that are crucial for inflammatory processes. PDZ domains are recognized for their ability to function as scaffolding proteins that organize signal transduction complexes, crucial for modulating cellular and biological functions. The chosen core sequence is particularly important because it is conserved across ZO-1, ZO-2, and ZO-3, indicating a fundamental role in maintaining cellular integrity and signaling pathways. This conservation suggests that the sequence’s involvement in inflammatory regulation is not only significant in ZO-1 but also reflects a broader biological function across the ZO family.

      (3) In Figure 3, the authors showed the representative images of IHC, please add the quantification analysis of Iba1 expression and PAS-positive cells using Image J or other software. To help understand the figure, an indication is needed to distinguish specifically stained cells (for example, a dotted line or an arrow).

      We added the semi-quantitative results into Figs. 3d,e,f.

      Result section: The specific physiological mechanism by which WT PDZ peptide decreases LPS-induced systemic inflammation in mice and the signal molecules involved remain unclear. These were confirmed by a semi-quantitative analysis of Iba-1 immunoreactivity and PAS staining in liver, kidney, and lung,respectively (Figures 4d, e, and f). To examine whether WT PDZ peptide can alter LPS-induced tissue damage in the kidney, cell toxicity assay was performed (Figure 3g). LPS induced cell damage in the kidney, however, WT PDZ peptide could significantly alleviate the toxicity, but mut PDZ peptide could not. Because cytotoxicity caused by LPS is frequently due to ROS production in the kidney (Su et al., 2023; Qiongyue et al., 2022), ROS production in the mitochondria was investigated in renal mitochondria cells harvested from kidney tissue (Figure 3h)......

      Figure legend section: Indicated scale bars were 20 μm. (d,e,f) Semi-quantitative analysis of each are positive for Iba-1 in liver and kidney, and positive cells of PAS in lung, respectively. (g) After the kidneys were harvested, tissue lysates were used for MTT assay. (h) After.....

      (4) In Figure 6G, H, the authors confirmed the change in expression of the M2 markers by PDZ peptide using the mouse monocyte cell line Raw264.7. It would be good to add an experiment on changes in M1 and M2 markers caused by PDZ peptides in human monocyte cells (for example, THP-1).

      We thank you for your comments. To determine whether PDZ peptide regulates M1/M2 polarization in human monocytes, we examined changes in M1 and M2 gene expression in THP-1 cells. As a result, wild-type PDZ significantly suppressed the expression of M1 marker genes (hlL-1β, hIL-6, hIL-8, hTNF-ɑ), while increasing the expression of M2 marker genes (hlL-4, hIL-10, hMRC-1). However, mutant PDZ did not affect M1/M2 polarization. These results suggest that PDZ peptide can suppress inflammation by regulating M1/M2 polarization of human monocyte cells. These results are for the reviewer's reference only and will not be included in the main content.

      Author response image 2.

      Minor point:

      The use of language is appropriate, with good writing skills. Nevertheless, a thorough proofread would eliminate small mistakes such as:

      • line 254, " mut PDZ+LPS/LPS (45.75%) " → " mut PDZ+LPS/LPS (47.75%) "

      • line 296, " Figure 6f " → " Figure 6h "

      We changed these points into the manuscript.

    1. Author Response

      The following is the authors’ response to the original reviews.

      General response:

      We thank the reviewers for their thorough evaluation of our manuscript. Working on the raised concerns has improved the manuscript greatly. Specifically, the recommendations to clarify the adopted assumptions in the study strengthened the motivation for the study; further, following up some of the reviewers’ concerns with additional analyses validated our chosen measures and strengthened the compatibility of the findings with the predictions of the dynamic attending framework. Below, you will find our detailed point-by-point responses, along with information on specific revisions.

      The reviewers pointed out that study assumptions were unclear, some of the measures we chose were not well motivated, and the findings were not well enough explained considering possible alternatives. As suggested, we reformulated the introduction, explained the common assumptions of entrainment models that we adopted in the study, and further clarified how our chosen measures for the properties of the internal oscillators relate to these assumptions.

      We realized that the initial emphasis on the compatibility of the current findings with predictions of entrainment models might have led to the wrong impression that the current study aimed to test whether auditory rhythmic processing is governed by timekeeper or oscillatory mechanisms. However, testing these theoretical models to explain human behavior necessitates specific paradigms designed to compare the contrasting predictions of the models. A number of studies do so by manipulating regularity in a stimulus sequence or expectancy of stimulus onsets, or assessing the perceived timing of targets that follow a stimulus rhythm. Such paradigms allow testing the prediction that an oscillator, underlying perceptual timing, would entrain to a regular but not an irregular sequence. This would further lead to stronger expectancies at the peak of the oscillation, where 'attentional energy' is the highest. These studies report 'rhythmic facilitation', where targets that align with the peaks of the oscillation are better detected than those that do not (see Henry and Herrmann (2014) and Haegens and Zion Golumbic (2018) for reviews). Additionally, unexpected endings of standard intervals, preceded by a regular entraining sequence, lead to a biased estimation of subsequent comparison intervals, due to the contrast between the attentional oscillator's phase and a deviating stimulus onset (Barnes & Jones, 2000; Large & Jones, 1999; McAuley & Jones, 2003). Even a sequence rate that is the multiple of the to-be-judged standard and comparison intervals give rise to rhythmic facilitation (McAuley & Jones, 2003), and the expectancy of a stimulus onset modulates duration judgments. These findings are not compatible with predictions of timekeeper models as time intervals in these models are represented arbitrarily and are not affected by expectancy violations.

      In the current study, we adopted an entrainment approach to timing, rather than testing predictions of competing models. This choice was motivated by several aspects of entrainment models that align better with the aims of the current study. First, our focus was on understanding perception and production of rhythms, for which perception is better explained by entrainment models than by timekeeper models, which excel at explaining perception of isolated time intervals (McAuley, 2010). Moreover, we wanted to leverage the fact that entrainment models elegantly include parameters that can explain different aspects of timing abilities, and these parameters can be estimated in an individualized manner. For instance, the flexibility property of oscillators can be linked to the ability to adapt to changes in external context, while timekeeper or Bayesian timing approaches lack a specific mechanism to quantify temporal adaptation across perceptual and motor domains. Finally, that entrainment is observed across theoretical, behavioral, and neural levels renders entrainment models useful in explaining and generalizing behavior across different domains. Nevertheless, some results showed partial compatibility with predictions of the timekeeper models, such as the modulation of 'bestperformance rates' by the temporal context, observed in Experiment 1’ random-order sessions, where stimulus rates maximally differed across consecutive trials. However, given that the mean, standard deviation, and range of stimulus rates were identical across sessions, and timekeeper models assume no temporal adaptation in duration perception, we should have observed similar results across these sessions. Conversely, we found significant accuracy differences, biased duration judgments, and harmonic relationships between the best-performance rates. We elaborate more on these results with respect to their compatibility with the contrasting models of human temporal perception in the revised discussion.

      Responses to specific comments:

      (1.1) At times, I found it challenging to evaluate the scientific merit of this study from what was provided in the introduction and methods. It is not clear what the experiment assumes, what it evaluates, and which competing accounts or predictions are at play. While some of these questions are answered, clear ordering and argumentative flow is lacking. With that said, I found the Abstract and General Discussion much clearer, and I would recommend reformulating the early part of the manuscript based on the structure of those segments.

      Second, in my reading, it is not clear to what extent the study assumes versus demonstrates the entrainment of internal oscillators. I find the writing somewhat ambiguous on this count: on the one hand, an entrainment approach is assumed a priori to design the experiment ("an entrainment approach is adopted") yet a primary result of the study is that entrainment is how we perceive and produce rhythms ("Overall, the findings support the hypothesis that an oscillatory system with a stable preferred rate underlies perception and production of rhythm..."). While one could design an experiment assuming X and find evidence for X, this requires testing competing accounts with competing hypotheses -- and this was not done.

      We appreciate the reviewer’s concerns and suggestion to clarify the assumptions of the study and how the current findings relate to the predictions of competing accounts. To address these concerns:

      • We added the assumptions of the entrainment models that we adopted in the Introduction section and reformulated the motivation to choose them accordingly.

      • We clarified in the Introduction that the study’s aim was not to test the entrainment models against alternative theories of rhythm perception.

      • We added a paragraph in the General Discussion to further distinguish predictions from the competing accounts. Here we discussed the compatibility of the findings with predictions of both entrainment and timekeeper models.

      • We rephrased reasoning in the Abstract, Introduction, and General Discussion to further clarify the aims of the study, and how the findings support the hypotheses of the current study versus those of the dynamic attending theory.

      (1.2) In my view, more evidence is required to bolster the findings as entrainment-based regardless of whether that is an assumption or a result. Indeed, while the effect of previous trials into the behaviour of the current trial is compatible with entrainment hypotheses, it may well be compatible with competing accounts as well. And that would call into question the interpretation of results as uncovering the properties of oscillating systems and age-related differences in such systems. Thus, I believe more evidence is needed to bolster the entrainment hypothesis.

      For example, a key prediction of the entrainment model -- which assumes internal oscillators as the mechanism of action -- is that behaviour in the SMT and PTT tasks follows the principles of Arnold's Tongue. Specifically, tapping and listening performance should worsen systematically as a function of the distance between the presented and preferred rate. On a participant-by-participant, does performance scale monotonically with the distance between the presented and preferred rate? Some of the analyses hint at this question, such as the effect of 𝚫IOI on accuracy, but a recontextualization, further analyses, or additional visualizations would be helpful to demonstrate evidence of a tongue-like pattern in the behavioural data. Presumably, non-oscillating models do not follow a tongue-like pattern, but again, it would be very instructive to explicitly discuss that.

      We thank the reviewer for the excellent suggestion of assessing 'Arnold's tongue' principles in timing performance. We agree that testing whether timing performance forms a pattern compatible with an Arnold tongue would further support our assumption that the findings related to preferred rate stem from an entrainment-based mechanism. We rather refer to the ‘entrainment region’, (McAuley et al., 2006) that corresponds to a slice in the Arnold tongue at a fixed stimulus intensity that entrains the internal oscillator. In both representations of oscillator behavior across a range of stimulus rates, performance should systematically increase as the difference between the stimulus rate and the oscillator's preferred rate, namely, 'detuning' decreases. In response to the reviewer’s comment, we ran further analyses to test this key prediction of entrainment models. We assessed performance at stimulus rates that were faster and slower than an individual's preferred rate estimates from in Experiment 1. To do so, we ran logistic regression models on aggregated datasets from all participants and sessions, where normalized IOI, in trials where the stimulus rate was faster than the preferred rate estimate, and in those where it was slower, predicted accuracy. Stimulus IOIs were normalized within each direction (faster- versus slower-than-preferred rate) using z-score transformation, and the direction was coded as categorical in the model. We reasoned that a positive slope for conditions with stimulus rates faster than IOI, and a negative slope from conditions with slower rates, should indicate a systematic accuracy increase toward the preferred rate estimate. This is exactly what we found. These results revealed significant main effect for the IOI and a significant interaction between IOI and direction, indicating that accuracy increased towards the preferred rate at fast rates and decreased as the stimulus rate diverged from the preferred rate at slow rates. We added these results to the respective subsections of Experiment 1 Methods and Results, added a plot showing the slices of the regression surfaces to Figure 2B and elaborated on the results in Experiment 1 Discussion. As the number of trials in Experiment 2 was much lower (N = 81), we only ran these additional analyses in Experiment 1.

      (1.3) Fourth, harmonic structure in behaviour across tasks is a creative and useful metric for bolstering the entrainment hypothesis specifically because internal oscillators should display a preference across their own harmonics. However, I have some doubts that the analyses as currently implemented indicate such a relationship. Specifically, the main analysis to this end involves summing the residuals of the data closest to y=x, y=2*x and y=x/2 lines and evaluating whether this sum is significantly lower than for shuffled data. Out of these three dimensions, y=x does not comprise a harmonic, and this is an issue because it could by itself drive the difference of summed residuals with the shuffled data. I am uncertain whether rerunning the same analysis with the x=y dimension excluded constitutes a simple resolution because presumably there are baseline differences in the empirical and shuffled data that do not have to do with harmonics that would leak into the analysis. To address this, a simulation with ground truths could be helpful to justify analyses, or a different analysis that evaluates harmonic structure could be thought of.

      We thank the reviewer for pointing out the weakness of the permutation test we developed to assess the harmonic relationship between Experiment 1’s preferred rate estimates. Datapoints that fall on the y=x line indeed do not represent harmonic relationships. They rather indicate one-to-one correspondence between the axes, which is a stronger indicator of compatibility between the estimates. Maybe speaking to the reviewer’s point, standard correlation analyses were not significant, which would have been expected if the permutation results were being driven by the y=x relationship. This was the reason we developed the permutation test to include integer-ratio datapoints could also contribute.

      Based on reviewer’s comment, we ran additional analyses to assess the harmonic relationships between the estimates. The first analysis involved a circular approach. We first normalized each participant’s estimates by rescaling the slower estimate with respect to the faster one by division; and converted the values to radians, since a pair of values with an integer-ratio relationship should correspond to the same phase on a unit circle. Then, we assessed whether the resulting distribution of normalized values differed from a uniform distribution, using Rayleigh’s test, which was significant (p = .004). The circular mean of the distribution was 44 (SD = 53) degrees (M = 0.764, SD = 0.932 radians), indicating that the slower estimates were slightly slower than the fast estimate or its duplicates. As this distribution was skewed toward positive values due to the normalization procedure, we did not compare it against zero angle. Instead, we ran a second test, which was a modular approach. We first calculated how much the slower estimate deviated proportionally from the faster estimate or its multiples (i.e., subharmonics) by normalizing the estimates from both sessions by the faster estimate. The outcome measure was the modulus of the slower, relative to the faster estimate, divided by the faster estimate. Then, we ran a permutation test, shuffling the linear-order session estimates over 1000 iterations and taking the median percent deviation values for each iteration. The test statistic was significant (p = .004), indicating that the harmonic relationships we observed in the estimates were not due to chance or dependent on the assessment method. We added these details of additional analyses to assess harmonic relationships between the Experiment 1 preferred rate estimates in the Supplementary Information.

      (2.1) The current study is presented in the framework of the ongoing debate of oscillator vs. timekeeper mechanisms underlying perceptual and motor timing, and authors claim that the observed results support the former mechanism. In this line, every obtained result is related by the authors to a specific ambiguous (i.e., not clearly related to a biophysical parameter) feature of an internal oscillator. As pointed out by an essay on the topic (Doelling & Assaneo, 2021), claiming that a pattern of results is compatible with an "oscillator" could be misleading, since some features typically used to validate or refute such mechanisms are not well grounded on real biophysical models. Relatedly, a recent study (Doelling et al., 2022) shows that two quantitatively different computational algorithms (i.e., absolute vs relative timing) can be explained by the same biophysical model. This demonstrates that what could be interpreted as a timekeeper, or an oscillator can represent the same biophysical model working under different conditions. For this reason, if authors would like to argue for a given mechanism underlying their observations, they should include a specific biophysical model, and test its predictions against the observed behavior. For example, it's not clear why authors interpret the observation of the trial's response being modulated by the rate of the previous one, as an oscillator-like mechanism underlying behavior. As shown in (Doelling & Assaneo, 2021) a simple oscillator returns to its natural frequency as soon as the stimulus disappears, which will not predict the long-lasting effect of the previous trial. Furthermore, a timekeeper-like mechanism with a long enough integration window is compatible with this observation.

      Still, authors can choose to disregard this suggestion, and not testing a specific model, but if so, they should restrict this paper to a descriptive study of the timing phenomena.

      We thank the reviewer for their valuable suggestion of to include a biophysical model to further demonstrate the compatibility of the current findings with certain predictions of the model. While we acknowledge the potential benefits of implementing a biophysical model to understand the relationships between model parameters and observed behavior, this goes beyond the scope of the current study.

      We note that we have employed a modeling approach in a subsequent study to further explore how the properties and the resulting behavior of an oscillator map onto the patterns of human behavior we observed in the current study (Kaya & Henry, 2024, February 5). In that study, we fitted a canonical oscillator model, and several variants thereof, separately to datasets obtained from random-order and linear-order sessions of Experiment 1 of the current submission. The base model, adapted from McAuley and Jones (2003), assumed sustained oscillations within the trials of the experiment, and complete decay towards the preferred rate between the trials. We introduced a gradual decay parameter (Author response image 1A) that weighted between the oscillator's concurrent period value at the time of decay and its initial period (i.e., preferred rate). This parameter was implemented only within trials, between the standard stimulus sequence and comparison interval in Variant 1, between consecutive trials in Variant 2, and at both temporal locations in Variant 3. Model comparisons (Author response image 1B) showed that Variant 3 was the best-fitting model for both random- and linear-order datasets. Crucially, estimates for within- and between-trial decay parameters, obtained from Variant 3, were positively correlated, suggesting that oscillators gradually decayed towards their preferred rate at similar timescales after cessation of a stimulus.

      Author response image 1.

      (A) Illustration of the model fitted to Experiment 1 datasets and (B) model comparison results. In each trial, the model is initialized with a phase (ɸ) and period (P) value. A At the offset of each stimulus interval i, the model updates its phase (pink arrows) and period (blue arrows) depending on the temporal contrast (C) between the model state and stimulus onset and phase and period correction weights, Wɸ and Wp. Wdecaywithin updates the model period as a weighted average between the period calculated for the 5th interval, P5, and model’s preferred rate, P0. C, calculated at the offset of the comparison interval. Wdecaybetween parameter initializes the model period at the beginning of a new trial as a weighted average between the last period from the previous trial and P0. The base model’s assumptions are marked by asterisks, namely sustained oscillation during the silence (i=5), and complete decay between trials. B Left: The normalized probability of each model having the minimum BIC value across all models and across participants. Right: AICc, calculated from each model’s fit to participants’ single-session datasets. In both panels, random-order and linear-order sessions were marked in green and blue, respectively. B denotes the base model, and V1, V2 and V3 denote variants 1, 2 and 3, respectively.

      Although our behavioral results and modeling thereof must necessarily be interpreted as reflecting the mechanics of an attentional, but not a neural oscillator, these findings might shed light on the controversy in neuroscience research regarding the timeline of entrainment decay. While multiple studies show that neural oscillations can continue at the entrained rate for a number of cycles following entrainment (Bouwer et al., 2023; Helfrich et al., 2017; Lakatos et al., 2013; van Bree et al., 2021), different modeling approaches reveal mixed results on this phenomenon. Whereas Doelling and Assaneo (2021) show that a Stuart-Landau oscillator returns immediately back to its preferred rate after synchronizing to an external stimulus, simulations of other oscillator types suggest gradual decay toward the preferred rate (Large, 1994; McAuley, 1995; Obleser et al., 2017) or self-sustained oscillation at the external stimulus rate (Nachstedt et al., 2017).

      While the Doelling & Assaneo study (2021) provides insights on entrainment and behavior of the Stuart-Landau oscillator under certain conditions, the internal oscillators hypothesized by the dynamic attending theory might have different forms, therefore may not adhere to the behavior of a specific implementation of an oscillator model. Moreover, that a phase-coupled oscillator does not show gradual decay does not preclude that models with period tracking behave similarly. Adaptive frequency oscillators, for instance, are able to sustain the oscillation after the stimulus ceases (Nachstedt et al., 2017). Alongside with models that use Hebbian learning (Roman et al., 2023), the main implementations of the dynamic attending theory have parameters for period tracking and decay towards the preferred rate (Large, 1994; McAuley, 1995). In fact, the u-shaped pattern of duration discrimination sensitivity across a range of stimulus rates (Drake & Botte, 1993) is better explained by a decaying than a non-decaying oscillator (McAuley, 1995). To conclude, the literature suggests that the emergence of decay versus sustain behavior of the oscillators and the timeline of decay depend on the particular model used as well as its parameters and does therefore not offer a one-for-all solution.

      Reviewer #2 (Recommendations For The Authors):

      • Are the range, SD and mean of the random-order and linear-order sessions different? If so, why?

      Information regarding the SD and mean of the random-order and linear-order sessions was added to Experiment 1 Methods section.

      “While the mean (M = 599 ms), standard deviation (SD = 231 ms) and range (200, 998 ms) of the presented stimulus IOIs were identical between the sessions, the way IOI changed from trial to trial was different.“ (p. 5)

      • Perhaps the title could mention the age-related flexibility effect you demonstrate, which is an important contribution that without inclusion in the title could be missed in literature searches.

      We have changed the title to include age-related changes in oscillator flexibility. Thanks for the great suggestion.

      • Is the statistical analysis in Figure 4A between subjects? Shouldn't the analyses be within subjects?

      We have now better specified that the statistical analyses of Experiment 2’s preferred rate estimates were across the tasks, in Figure 4 caption.

      "Vertical lines above the box plots represent within-participants pairwise comparisons." (p. 17)

      • It says participants' hearing thresholds were measured using standard puretone audiometry. What threshold warranted participant exclusion and how many participants were excluded on the basis of hearing skills?

      We have now clarified that hearing threshold was not an exclusion criterion.

      "Participants were not excluded based on hearing threshold." (p. 11)

      • "Tapping rates from 'fastest' and 'slowest' FMT trials showed no difference between pre- and postsession measurements, and were additionally correlated across repeated measurements" - could you point to the statistics for this comparison?

      Table 2 includes the results from both experiments’ analyses on unpaced tapping. (p. 10)

      “The results of the pairwise comparisons between tapping rates from all unpaced tapping tasks across measurements are provided in Table 2.” (p. 15)

      • How was the loudness (dB) of the woodblock stimuli determined on a participant-by-participant basis? Please ignore if I missed this.

      Participants were allowed to set the volume to a comfortable level.

      "Participants then set the sound volume to a level that they found comfortable for completing the task." (p. 4)

      • Please spell out IOI, DEV, and other terms in full the first time they are mentioned in the manuscript.

      We added the descriptions of abbreviations before their initial mention.

      "In each experimental session, 400 unique trials of this task were presented, each consisting of a combination of the three main independent variables: the inter-onset interval, IOI; amount of deviation of the comparison interval from the standard, DEV, and the amount of change in stimulus IOI between consecutive trials, 𝚫IOI. We explain each of these variables in detail in the next paragraphs." (p. 4)

      • Small point: In Fig 1 sub-text, random order and linear order are explained in reverse order from how they are presented in the figure.

      We fixed the incompatibility between of Figure 1 content and caption.

      • Small point: I found the elaborate technical explanation of windowing methods, including alternatives that were not used, unnecessary.

      We moved the details of the smoothing analysis to the Supplementary Information.

      • With regard to the smoothing explanation, what is an "element"? Is this a sample? If so, what was the sampling rate?

      We reworded ‘element’ as ‘sample’. In the smoothing analyses, the sampling rate was the size of the convolution window, which was set to 26 for random-order, 48 for linear-order sessions.

      • Spelling/language error: "The pared-down", "close each other", "always small (+4 ms), than".

      We fixed the spelling errors.

      Reviewer #3 (Recommendations For The Authors):

      • My main concern is the one detailed as a weakness in the public review. In that direction, if authors decide to keep the mechanistic interpretation of the outcomes (which I believe is a valuable one) here I suggest a couple of models that they can try to adapt to explain the pattern of results:

      a. Roman, Iran R., et al. "Hebbian learning with elasticity explains how the spontaneous motor tempo affects music performance synchronization." PLOS Computational Biology 19.6 (2023): e1011154.

      b. Bose, Amitabha, Áine Byrne, and John Rinzel. "A neuromechanistic model for rhythmic beat generation." PLoS Computational Biology 15.5 (2019): e1006450.

      c. Egger, Seth W., Nhat M. Le, and Mehrdad Jazayeri. "A neural circuit model for human sensorimotor timing." Nature Communications 11.1 (2020): 3933.

      d. Doelling, K. B., Arnal, L. H., & Assaneo, M. F. (2022). Adaptive oscillators provide a hard-coded Bayesian mechanism for rhythmic inference. bioRxiv, 2022-06

      Thanks for the suggestion! Please refer to our response (2.1.) above. To summarize, although we considered a full, well-fleshed-out modeling approach to be beyond the scope of the current work, we are excited about and actively working on exactly this. Our modeling take is available as a preprint (Kaya & Henry, 2024, February 5).

      • Since the authors were concerned with the preferred rate they circumscribed the analysis to extract the IOI with better performance. Would it be plausible to explore how is the functional form between accuracy and IOI? This could shed some light on the underlying mechanism.

      Unfortunately, we were unsure about what the reviewer meant by the functional form between accuracy and IOI. We interpret it to mean a function that takes IOI as input and outputs an accuracy value. In that case, while we agree that estimating this function might indeed shed light on the underlying mechanisms, this type of analysis is beyond the scope of the current study. Instead, we refer the reviewer and reader to our modeling study (please see our response (2.1.) above) that includes a model which takes the stimulus conditions, including IOI, and model parameters for preferred rate, phase and period correction and within- and between-trial decay and outputs predicted accuracy for each trial. We believe that such modeling approach, as compared to a simple function, gives more insights regarding the relationship between oscillator properties and duration perception.

      • Is the effect caused by the dIOI modulated by the distance to the preferred frequency?

      We thank the reviewer for the recommendation. We measured flexibility by the oscillator's ability to adapt to on-line changes in the temporal context (i.e., effect of 𝚫IOI on accuracy), rather than by quantifying the range of rates with improved accuracy. Nevertheless, we acknowledge that distance to the preferred rate should decrease accuracy, as this is a key prediction of entrainment models. In fact, testing this prediction was recommended also by the other reviewer, in response to which we ran additional analyses. These analyses involved assessment of the relationship between accuracy and detuning. Specifically, we assessed accuracy at stimulus rates that were faster and slower than an individual's preferred rate estimates from in Experiment 1. We ran logistic regression models on aggregated datasets from all participants and sessions, where accuracy was predicted by z-scored IOI, from trials where the stimulus rate was faster than the preferred rate estimate, and in those where it was slower. The model had a significant main effect of IOI and an interaction between IOI and direction (i.e., whether stimulus rate was faster or slower than the preferred rate estimate), indicating that accuracy increased towards the preferred rate at fast rates and decreased as the stimulus rate diverged from the preferred rate at slow rates. We added information regarding this analysis to the respective subsections of Experiment 1 Methods and Results, added a plot showing the slices of the regression surfaces to Figure 2B and elaborated on the results in Experiment 1 Discussion. As the number of trials in Experiment 2 was insufficient, we only ran these additional analyses in Experiment 1. We agree that a range-based measure of oscillator flexibility would also index the oscillators’ adaptive abilities. However, the current paradigms were designed for assessment of temporal adaptation. Thus, comparison of the two approaches to measuring oscillator flexibility, which can be addressed in future studies, is beyond the scope of the current study.

      • Did the authors explore if the "motor component" (the difference between the motor and perceptual rates) is modulated by the participants age?

      In response to the reviewer’s comment, we correlated the difference between the motor and perceptual rates with age, which was nonsignificant.

      • Please describe better the slider and the keypress tasks. For example, what are the instructions given to the participant on each task, and how they differ from each other?

      We added the Experiment 2 instructions in Appendix A.

      • Typos: The caption in figure one reads 2 ms, while I believe it should say 200. Page 4 mentions that there are 400 trials and page 5 says 407.

      We fixed the typos.

      References

      Barnes, R., & Jones, M. R. (2000). Expectancy, attention, and time. Cogn Psychol, 41(3), 254-311. https://doi.org/10.1006/cogp.2000.0738

      Bouwer, F. L., Fahrenfort, J. J., Millard, S. K., Kloosterman, N. A., & Slagter, H. A. (2023). A Silent Disco: Differential Effects of Beat-based and Pattern-based Temporal Expectations on Persistent Entrainment of Low-frequency Neural Oscillations. J Cogn Neurosci, 35(6), 9901020. https://doi.org/10.1162/jocn_a_01985

      Doelling, K. B., Arnal, L. H., & Assaneo, M. F. (2022). Adaptive oscillators provide a hard-coded Bayesian mechanism for rhythmic inference. bioRxiv. https://doi.org/10.1101/2022.06.18.496664

      Doelling, K. B., & Assaneo, M. F. (2021). Neural oscillations are a start toward understanding brain activity rather than the end. PLoS Biol, 19(5), e3001234. https://doi.org/10.1371/journal.pbio.3001234

      Drake, C., & Botte, M. C. (1993). Tempo sensitivity in auditory sequences: evidence for a multiplelook model. Percept Psychophys, 54(3), 277-286. https://doi.org/10.3758/bf03205262

      Haegens, S., & Zion Golumbic, E. (2018). Rhythmic facilitation of sensory processing: A critical review. Neurosci Biobehav Rev, 86, 150-165. https://doi.org/10.1016/j.neubiorev.2017.12.002

      Helfrich, R. F., Huang, M., Wilson, G., & Knight, R. T. (2017). Prefrontal cortex modulates posterior alpha oscillations during top-down guided visual perception. Proc Natl Acad Sci U S A, 114(35), 9457-9462. https://doi.org/10.1073/pnas.1705965114

      Henry, M. J., & Herrmann, B. (2014). Low-Frequency Neural Oscillations Support Dynamic Attending in Temporal Context. Timing & Time Perception, 2(1), 62-86. https://doi.org/10.1163/22134468-00002011

      Kaya, E., & Henry, M. J. (2024, February 5). Modeling rhythm perception and temporal adaptation: top-down influences on a gradually decaying oscillator. https://doi.org/10.31234/osf.io/q9uvr

      Lakatos, P., Musacchia, G., O'Connel, M. N., Falchier, A. Y., Javitt, D. C., & Schroeder, C. E. (2013). The spectrotemporal filter mechanism of auditory selective attention. Neuron, 77(4), 750-761. https://doi.org/10.1016/j.neuron.2012.11.034

      Large, E. W. (1994). Dynamic representation of musical structure. The Ohio State University.

      Large, E. W., & Jones, M. R. (1999). The dynamics of attending: How people track time-varying events. Psychological Review, 106(1), 119-159. https://doi.org/Doi 10.1037/0033295x.106.1.119

      McAuley, J. D. (1995). Perception of time as phase: Toward an adaptive-oscillator model of rhythmic pattern processing Indiana University Bloomington].

      McAuley, J. D. (2010). Tempo and Rhythm. In Music Perception (pp. 165-199). https://doi.org/10.1007/978-1-4419-6114-3_6

      McAuley, J. D., & Jones, M. R. (2003). Modeling effects of rhythmic context on perceived duration: a comparison of interval and entrainment approaches to short-interval timing. J Exp Psychol Hum Percept Perform, 29(6), 1102-1125. https://doi.org/10.1037/0096-1523.29.6.1102

      McAuley, J. D., Jones, M. R., Holub, S., Johnston, H. M., & Miller, N. S. (2006). The time of our lives: life span development of timing and event tracking. J Exp Psychol Gen, 135(3), 348-367. https://doi.org/10.1037/0096-3445.135.3.348

      Nachstedt, T., Tetzlaff, C., & Manoonpong, P. (2017). Fast Dynamical Coupling Enhances Frequency Adaptation of Oscillators for Robotic Locomotion Control. Front Neurorobot, 11, 14. https://doi.org/10.3389/fnbot.2017.00014

      Obleser, J., Henry, M. J., & Lakatos, P. (2017). What do we talk about when we talk about rhythm? PLoS Biol, 15(9), e2002794. https://doi.org/10.1371/journal.pbio.2002794

      Roman, I. R., Roman, A. S., Kim, J. C., & Large, E. W. (2023). Hebbian learning with elasticity explains how the spontaneous motor tempo affects music performance synchronization. PLoS Comput Biol, 19(6), e1011154. https://doi.org/10.1371/journal.pcbi.1011154<br /> van Bree, S., Sohoglu, E., Davis, M. H., & Zoefel, B. (2021). Sustained neural rhythms reveal endogenous oscillations supporting speech perception. PLoS Biol, 19(2), e3001142. https://doi.org/10.1371/journal.pbio.3001142

    1. Author Response

      The following is the authors’ response to the original reviews.

      We would like to thank the reviewers for their thoughtful comments and constructive suggestions. Point-by-point responses to comments are given below:

      Reviewer #1 (Recommendations For The Authors):

      This manuscript provides an important case study for in-depth research on the adaptability of vertebrates in deep-sea environments. Through analysis of the genomic data of the hadal snailfish, the authors found that this species may have entered and fully adapted to extreme environments only in the last few million years. Additionally, the study revealed the adaptive features of hadal snailfish in terms of perceptions, circadian rhythms and metabolisms, and the role of ferritin in high-hydrostatic pressure adaptation. Besides, the reads mapping method used to identify events such as gene loss and duplication avoids false positives caused by genome assembly and annotation. This ensures the reliability of the results presented in this manuscript. Overall, these findings provide important clues for a better understanding of deep-sea ecosystems and vertebrate evolution.

      Reply: Thank you very much for your positive comments and encouragement.

      However, there are some issues that need to be further addressed.

      1. L119: Please indicate the source of any data used.

      Reply: Thank you very much for the suggestion. All data sources used are indicated in Supplementary file 1.

      1. L138: The demographic history of hadal snailfish suggests a significant expansion in population size over the last 60,000 years, but the results only show some species, do the results for all individuals support this conclusion?

      Reply: Thank you for this suggestion. The estimated demographic history of the hadal snailfish reveals a significant population increase over the past 60,000 years for all individuals. The corresponding results have been incorporated into Figure 1-figure supplements 8B.

      Author response image 1.

      (B) Demographic history for 5 hadal snailfish individuals and 2 Tanaka’s snailfish individuals inferred by PSMC. The generation time of one year for Tanaka snailfish and three years for hadal snailfish.

      1. Figure 1-figure supplements 8: Is there a clear source of evidence for the generation time of 1 year chosen for the PSMC analysis?

      Reply: We apologize for the inclusion of an incorrect generation time in Figure 1-figure supplements 8. It is important to note that different generation times do not change the shape of the PSMC curve, they only shift the curve along the axis. Due to the absence of definitive evidence regarding the generation time of the hadal snailfish, we have referred to Wang et al., 2019, assuming a generation time of one year for Tanaka snailfish and three years for hadal snailfish. The generation time has been incorporated into the main text (lines 516-517): “The generation time of one year for Tanaka snailfish and three years for hadal snailfish.”.

      1. L237: Transcriptomic data suggest that the greatest changes in the brain of hadal snailfish compared to Tanaka's snailfish, what functions these changes are specifically associated with, and how these functions relate to deep-sea adaptation.

      Reply: Thank you for this suggestion. Through comparative transcriptome analysis, we identified 3,587 up-regulated genes and 3,433 down-regulated genes in the brains of hadal snailfish compared to Tanaka's snailfish. Subsequently, we conducted Gene Ontology (GO) functional enrichment analysis on the differentially expressed genes, revealing that the up-regulated genes were primarily associated with cilium, DNA repair, protein binding, ATP binding, and microtubule-based movement. Conversely, the down-regulated genes were associated with membranes, GTP-binding, proton transmembrane transport, and synaptic vesicles, as shown in following table (Supplementary file 15). Previous studies have shown that high hydrostatic pressure induces DNA strand breaks and damage, and that DNA repair-related genes upregulated in the brain may help hadal snailfish overcome these challenges.

      Author response table 1.

      GO enrichment of expression up-regulated and down-regulated genes in hadal snailfish brain.

      We have added new results (Supplementary file 15) and descriptions to show the changes in the brains of hadal snailfish (lines 250-255): “Specifically, there are 3,587 up-regulated genes and 3,433 down-regulated genes in the brain of hadal snailfish compared to Tanaka snailfish, and Gene Ontology (GO) functional enrichment analyses revealed that up-regulated genes in the hadal snailfish are associated with cilium, DNA repair, and microtubule-based movement, while down-regulated genes are enriched in membranes, GTP-binding, proton transmembrane transport, and synaptic vesicles (Supplementary file 15).”

      1. L276: What is the relationship between low bone mineralization and deep-sea adaptation, and can low mineralization help deep-sea fish better adapt to the deep sea?

      Reply: Thank you for this suggestion. The hadal snailfish exhibits lower bone mineralization compared to Tanaka's snailfish, which may have facilitated its adaptation to the deep sea. On one hand, this reduced bone mineralization could have contributed to the hadal snailfish's ability to maintain neutral buoyancy without excessive energy expenditure. On the other hand, the lower bone mineralization may have also rendered their skeleton more flexible and malleable, enhancing their resilience to high hydrostatic pressure. Accordingly, we added the following new descriptions (lines 295-300): “Nonetheless, micro-CT scans have revealed shorter bones and reduced bone density in hadal snailfish, from which it has been inferred that this species has reduced bone mineralization (M. E. Gerringer et al., 2021); this may be a result of lowering density by reducing bone mineralization, allowing to maintain neutral buoyancy without expending too much energy, or it may be a result of making its skeleton more flexible and malleable, which is able to better withstand the effects of HHP.”

      1. L293: The abbreviation HHP was mentioned earlier in the article and does not need to be abbreviated here.

      Reply: Thank you for the correction. We have corrected the word. Line 315.

      1. L345: It should be "In addition, the phylogenetic relationships between different individuals clearly indicate that they have successfully spread to different trenches about 1.0 Mya".

      Reply: Thank you for the correction. We have corrected the word. Line 374.

      1. It is curious what functions are associated with the up-regulated and down-regulated genes in all tissues of hadal snailfish compared to Tanaka's snailfish, and what functions have hadal snailfish lost in order to adapt to the deep sea?

      Reply: Thank you for this suggestion. We added a description of this finding in the results section (lines 337-343): “Next, we identified 34 genes that are significantly more highly expressed in all organs of hadal snailfish in comparison to Tanaka’s snailfish and zebrafish, while only seven genes were found to be significantly more highly expressed in Tanaka’s snailfish using the same criterion (Figure 5-figure supplements 1). The 34 genes are enriched in only one GO category, GO:0000077: DNA damage checkpoint (Adjusted P-value: 0.0177). Moreover, five of the 34 genes are associated with DNA repair.” This suggests that up-regulated genes in all tissues in hadal snailfish are associated with DNA repair in response to DNA damage caused by high hydrostatic pressure, whereas down-regulated genes do not show enrichment for a particular function.

      Overall, the functions lost in hadal snailfish adapted to the deep sea are mainly related to the effects of the dark environment, which can be summarized as follows (lines 375-383): “The comparative genomic analysis revealed that the complete absence of light had a profound effect on the hadal snailfish. In addition to the substantial loss of visual genes and loss of pigmentation, many rhythm-related genes were also absent, although some rhythm genes were still present. The gene loss may not only come from relaxation of natural selection, but also for better adaptation. For example, the grpr gene copies are absent or down-regulated in hadal snailfish, which could in turn increased their activity in the dark, allowing them to survive better in the dark environment (Wada et al., 1997). The loss of gpr27 may also increase the ability of lipid metabolism, which is essential for coping with short-term food deficiencies (Nath et al., 2020).”

      Reviewer #2 (Recommendations For The Authors):

      I have pointed out some of the examples that struck me as worthy of additional thought/writing/comments from the authors. Any changes/comments are relatively minor.

      Reply: Thank you very much for your positive comments on this work.

      For comparative transcriptome analyses, reads were mapped back to reference genomes and TPM values were obtained for gene-level count analyses. 1:1 orthologs were used for differential expression analyses. This is indeed the only way to normalize counts across species, by comparing the same gene set in each species. Differential expression statistics were run in DEseq2. This is a robust way to compare gene expression across species and where fold-change values are reported (e.g. Fig 3, creatively by coloring the gene name) the values are best-practice.

      In other places, TPM values are reported (e.g. Fig 2D, Fig 4C, Fig 5A, Fig 4-Fig supp 4) to illustrate expression differences within a tissue across species. The comparisons look robust, although it is not made clear how the values were obtained in all cases. For example, in Fig 2D the TPM values appear to be from eyes of individual fish, but in Fig 4C and 5A they must be some kind of average? I think that information should be added to the figure legends.

      Of note: TPM values are sensitive to the shape of the RNA abundance distribution from a given sample: A small number of very highly expressed genes might bias TPM values downward for other genes. From one individual to another or from one species to another, it is not obvious to me that we should expect the same TPM distribution from the same tissues, making it a challenging metric for comparison across samples, and especially across species. An alternative measure of RNA abundance is normalized counts that can be output from DEseq2. See:

      Zhao, Y., Li, M.C., Konaté, M.M., Chen, L., Das, B., Karlovich, C., Williams, P.M., Evrard, Y.A., Doroshow, J.H. and McShane, L.M., 2021. TPM, FPKM, or normalized counts? A comparative study of quantification measures for the analysis of RNA-seq data from the NCI patient-derived models repository. Journal of translational medicine, 19(1), pp.1-15.

      If the authors would like to keep the TPM values, I think it would be useful for them to visualize the TPM value distribution that the numbers were derived from. One way to do this would be to make a violin plot for species/tissue and plot the TPM values of interest on that. That would give a visualization of the ranked value of the gene within the context of all other TPM values. A more highly expressed gene would presumably have a higher rank in context of the specific tissue/species and be more towards the upper tail of the distribution. An example violin plot can be found in Fig 6 of:

      Burns, J.A., Gruber, D.F., Gaffney, J.P., Sparks, J.S. and Brugler, M.R., 2022. Transcriptomics of a Greenlandic Snailfish Reveals Exceptionally High Expression of Antifreeze Protein Transcripts. Evolutionary Bioinformatics, 18, p.11769343221118347.

      Alternatively, a comparison of TPM and normalized count data (heatmaps?) would be of use for at least some of the reported TPM values to show whether the different normalization methods give comparable outputs in terms of differential expression. One reason for these questions is that DEseq2 uses normalized counts for statistical analyses, but values are expressed as TPM in the noted figures (yes, TPM accounts for transcript length, but can still be subject to distribution biases).

      Reply: Thank you for your suggestions. Following your suggestions, we modified Fig 2D, Fig 4C, Fig 4-Fig supp 4, and Fig 5-Fig supp 1, respectively. In the differential expression analyses, only one-to-one orthologues of hadal snailfish and Tanaka's snailfish can get the normalized counts output by DEseq2, so we showed the normalized counts by DEseq2 output for Fig 2D, Fig 4C, Fig 4-Fig supp 4, Fig 5-Fig supp 1, and for Fig 5A, since the copy number of fthl27 genes undergoes specific expansion in hadal snailfish, we visualized the ranking of all fthl27 genes across tissues by plotting violins in Fig 5-Fig supp 2.

      Author response image 2.

      (D) Log10-transformation normalized counts for DESeq2 (COUNTDESEQ2) of vision-related genes in the eyes of hadal snailfish and Tanka's snailfish. * represents genes significantly downregulated in hadal snailfish (corrected P < 0.05).

      Author response image 3.

      (C) The deletion of one copy of grpr and another copy of down-regulated expression in hadal snailfish. The relative positions of genes on chromosomes are indicated by arrows, with arrows to the right representing the forward strand and arrows to the left representing the reverse strand. The heatmap presented is the average of the normalized counts for DESeq2 (COUNTDESEQ2) in all replicate samples from each tissue. * represents tissue in which the grpr-1 was significantly down-regulated in hadal snailfish (corrected P < 0.05).

      Author response image 4.

      Expression of the vitamin D related genes in various tissues of hadal snailfish and Tanaka's snailfish. The heatmap presented is the average of the normalized counts for DESeq2 (COUNTDESEQ2) in all replicate samples from each tissue.

      Author response image 5.

      (B) Expression of the ROS-related genes in different tissues of hadal snailfish and Tanaka's snailfish. The heatmap presented is the average of the normalized counts for DESeq2 (COUNTDESEQ2) in all replicate samples from each tissue.

      Author response image 6.

      Ranking of the expression of individual copies of fthl27 gene in hadal snailfish and Tanaka's snailfish in various tissues showed that all copies of fthl27 in hadal snailfish have high expression. The gene expression presented is the average of TPM in all replicate samples from each tissue.

      Line 96: Which BUSCOs? In the methods it is noted that the actinopterygii_odb10 BUSCO set was used. I think it should also be noted here so that it is clear which BUSCO set was used for completeness analysis. It could even be informally the ray-finned fish BUSCOs or Actinopterygii BUSCOs.

      Reply: Thank you for this suggestion. We used Actinopterygii_odb10 database and we added the BUSCO set to the main text as follows (lines 92-95): “The new assembly filled 1.26 Mb of gaps that were present in our previous assembly and have a much higher level of genome continuity and completeness (with complete BUSCOs of 96.0 % [Actinopterygii_odb10 database]) than the two previous assemblies.”

      Lines 102-105: The medaka genome paper proposes the notion that the ancestral chromosome number between medaka, tetraodon, and zebrafish is 24. There may be other evidence of that too. Some of that evidence should be cited here to support the notion that sticklebacks had chromosome fusions to get to 21 chromosomes rather than scorpionfish having chromosome fissions to get to 24. Here's the medaka genome paper:

      Kasahara, M., Naruse, K., Sasaki, S., Nakatani, Y., Qu, W., Ahsan, B., Yamada, T., Nagayasu, Y., Doi, K., Kasai, Y. and Jindo, T., 2007. The medaka draft genome and insights into vertebrate genome evolution. Nature, 447(7145), pp.714-719.

      Reply: Thank you for your great suggestion. Accordingly, we modified the sentence and added the citation as follows (lines 100-105): “We noticed that there is no major chromosomal rearrangement between hadal snailfish and Tanaka’s snailfish, and chromosome numbers are consistent with the previously reported MTZ-ancestor (the last common ancestor of medaka, Tetraodon, and zebrafish) (Kasahara et al., 2007), while the stickleback had undergone several independent chromosomal fusion events (Figure 1-figure supplements 4).”

      Line 161-173: "Along with the expression data, we noticed that these genes exhibit a different level of relaxation of natural selection in hadal snailfish (Figure 2B; Figure 2-figure supplements 1)." With the above statment and evidence, the authors are presumably referring to gene losses and differences in expression levels. I think that since gene expression was not measured in a controlled way it may not be a good measure of selection throughout. The reported genes could be highly expressed under some other condition, selection intact. I find Fig2-Fig supp 1 difficult to interpret. I assume I am looking for regions where Tanaka’s snailfish reads map and Hadal snailfish reads do not, but it is not abundantly clear. Also, other measures of selection might be good to investigate: accumulation of mutations in the region could be evidence of relaxed selection, for example, where essential genes will accumulate fewer mutations than conditional genes or (presumably) genes that are not needed at all. The authors could complete a mutational/SNP analysis using their genome data on the discussed genes if they want to strengthen their case for relaxed selection. Here is a reference (from Arabidopsis) showing these kinds of effects:

      Monroe, J.G., Srikant, T., Carbonell-Bejerano, P., Becker, C., Lensink, M., Exposito-Alonso, M., Klein, M., Hildebrandt, J., Neumann, M., Kliebenstein, D. and Weng, M.L., 2022. Mutation bias reflects natural selection in Arabidopsis thaliana. Nature, 602(7895), pp.101-105.

      Reply: Thank you for pointing out this important issue. Following your suggestion, we have removed the mention of the down-regulation of some visual genes in the eyes of hadal snailfish and the results of the original Fig2-Fig supp 1 that were based on reads mapping to confirm whether the genes were lost or not. To investigate the potential relaxation of natural selection in the opn1sw2 gene in hadal snailfish, we conducted precise gene structure annotation. Our findings revealed that the opn1sw2 gene is pseudogenized in hadal snailfish, indicating a relaxation of natural selection. We have included this result in Figure 2-figure supplements 1.

      Author response image 7.

      Pseudogenization of opn1sw2 in hadal snailfish. The deletion changed the protein’s sequence, causing its premature termination.

      Accordingly, we have toned down the related conclusions in the main text as follows (lines 164-173): “We noticed that the lws gene (long wavelength) has been completely lost in both hadal snailfish and Tanaka’s snailfish; rh2 (central wavelength) has been specifically lost in hadal snailfish (Figure 2B and 2C); sws2 (short wavelength) has undergone pseudogenization in hadal snailfish (Figure 2-figure supplements 1); while rh1 and gnat1 (perception of very dim light) is both still present and expressed in the eyes of hadal snailfish (Figure 2D). A previous study has also proven the existence of rhodopsin protein in the eyes of hadal snailfish using proteome data (Yan, Lian, Lan, Qian, & He, 2021). The preservation and expression of genes for the perception of very dim light suggests that they are still subject to natural selection, at least in the recent past.”

      Line 161-170: What tissue were the transcripts derived from for looking at expression level of opsins? Eyes?

      Reply: Thank you for your suggestions. The transcripts used to observe the expression levels of optic proteins were obtained from the eye.

      Line 191: What does tmc1 do specifically?

      Reply: Thank you for this suggestion. The tmc1 gene encodes transmembrane channel-like protein 1, involved in the mechanotransduction process in sensory hair cells of the inner ear that facilitates the conversion of mechanical stimuli into electrical signals used for hearing and homeostasis. We added functional annotations for the tmc1 in the main text (lines 190-196): “Of these, the most significant upregulated gene is tmc1, which encodes transmembrane channel-like protein 1, involved in the mechanotransduction process in sensory hair cells of the inner ear that facilitates the conversion of mechanical stimuli into electrical signals used for hearing and homeostasis (Maeda et al., 2014), and some mutations in this gene have been found to be associated with hearing loss (Kitajiri, Makishima, Friedman, & Griffith, 2007; Riahi et al., 2014).”

      Line 208: "it is likely" is a bit proscriptive

      Reply: Thank you for this suggestion. We rephrased the sentence as follows (lines 213-215): “Expansion of cldnj was observed in all resequenced individuals of the hadal snailfish (Supplementary file 10), which provides an explanation for the hadal snailfish breaks the depth limitation on calcium carbonate deposition and becomes one of the few species of teleost in hadal zone.”

      Line 199: maybe give a little more info on exactly what cldnj does? e.g. "cldnj encodes a claudin protein that has a role in tight junctions through calcium independent cell-adhesion activity" or something like that.

      Reply: Thank you for this suggestion. We have added functional annotations for the cldnj to the main text (lines 200-204): “Moreover, the gene involved in lifelong otolith mineralization, cldnj, has three copies in hadal snailfish, but only one copy in other teleost species, encodes a claudin protein that has a role in tight junctions through calcium independent cell-adhesion activity (Figure 3B, Figure 3C) (Hardison, Lichten, Banerjee-Basu, Becker, & Burgess, 2005).”

      Lines 199-210: Paragraph on cldnj: there are extra cldnj genes in the hadal snailfish, but no apparent extra expression. Could the authors mention that in their analysis/discussion of the data?

      Reply: Thank you for your suggestions. Despite not observing significant changes in cldnj expression in the brain tissue of hadal snailfish compared to Tanaka's snailfish, it is important to consider that the brain may not be the primary site of cldnj expression. Previous studies in zebrafish have consistently shown expression of cldnj in the otocyst during the critical early growth phase of the otolith, with a lower level of expression observed in the zebrafish brain. However, due to the unavailability of otocyst samples from hadal snailfish in our current study, our findings do not provide confirmation of any additional expression changes resulting from cldnj amplification. Consequently, it is crucial to conduct future comprehensive investigations to explore the expression patterns of cldnj specifically in the otocyst of hadal snailfish. Accordingly, we added a discussion of this result in the main text (lines 209-214): “In our investigation, we found that the expression of cldnj was not significantly up-regulated in the brain of the hadal snailfish than in Tanaka’s snailfish, which may be related to the fact that cldnj is mainly expressed in the otocyst, while the expression in the brain is lower. However, due to the immense challenge in obtaining samples of hadal snailfish, the expression of cldnj in the otocyst deserves more in-depth study in the future.”

      Lines 225-231: I wonder whether low expression of a circadian gene might be a time of day effect rather than an evolutionary trait. Could the authors comment?

      Reply: Thank you for your suggestions. Previous studies have shown that the grpr gene is expressed relatively consistently in mouse suprachiasmatic nucleus (SCN) throughout the day (Figure 4-figure supplements 1) and we hypothesize that the low expression of grpr-1 gene expression in hadal snailfish is an evolutionary trait. We have modified this result in the main text (lines 232-242): “In addition, in the teleosts closely related to hadal snailfish, there are usually two copies of grpr encoding the gastrin-releasing peptide receptor; we noticed that in hadal snailfish one of them is absent and the other is barely expressed in brain (Figure 4C), whereas a previous study found that the grpr gene in the mouse suprachiasmatic nucleus (SCN) did not fluctuate significantly during a 24-hour light/dark cycle and had a relatively stable expression (Pembroke, Babbs, Davies, Ponting, & Oliver, 2015) (Figure 4-figure supplements 1). It has been reported that grpr deficient mice, while exhibiting normal circadian rhythms, show significantly increased locomotor activity in dark conditions (Wada et al., 1997; Zhao et al., 2023). We might therefore speculate that the absence of that gene might in some way benefit the activity of hadal snailfish under complete darkness.”

      Author response image 8.

      (B) Expression of the grpr in a 24-hour light/dark cycle in the mouse suprachiasmatic nucleus (SCN). Data source with http://www.wgpembroke.com/shiny/SCNseq.

      Line 253: What is gpr27? G protein coupled receptor?

      Reply: We apologize for the ambiguous description. Gpr27 is a G protein-coupled receptor, belonging to the family of cell surface receptors. We introduced gpr27 in the main text as follows (lines 270-273): “Gpr27 is a G protein-coupled receptor, belonging to the family of cell surface receptors, involved in various physiological processes and expressed in multiple tissues including the brain, heart, kidney, and immune system.”

      Line 253: Fig4 Fig supp 3 is a good example of pseudogenization!

      Reply: Thank you very much for your recognition.

      Line 279: What is bglap? It regulates bone mineralization, but what specifically does that gene do?

      Reply: We apologize for the ambiguous description. The bglap gene encodes a highly abundant bone protein secreted by osteoblasts that binds calcium and hydroxyapatite and regulates bone remodeling and energy metabolism. We introduced bglap in the main text as follows (lines 300-304): “The gene bglap, which encodes a highly abundant bone protein secreted by osteoblasts that binds calcium and hydroxyapatite and regulates bone remodeling and energy metabolism, had been found to be a pseudogene in hadal fish (K. Wang et al., 2019), which may contribute to this phenotype.”

      Line 299: Introduction of another gene without providing an exact function: acaa1.

      Reply: We apologize for the ambiguous description. The acaa1 gene encodes acetyl-CoA acetyltransferase 1, a key regulator of fatty acid β-oxidation in the peroxisome, which plays a controlling role in fatty acid elongation and degradation. We introduced acaa1 in the main text as follows (lines 319-324): “In regard to the effect of cell membrane fluidity, relevant genetic alterations had been identified in previous studies, i.e., the amplification of acaa1 (encoding acetyl-CoA acetyltransferase 1, a key regulator of fatty acid β-oxidation in the peroxisome, which plays a controlling role in fatty acid elongation and degradation) may increase the ability to synthesize unsaturated fatty acids (Fang et al., 2000; K. Wang et al., 2019).”

      Fig 5 legend: The DCFH-DA experiment is not an immunofluorescence assay. It is better described as a redox-sensitive fluorescent probe. Please take note throughout.

      Reply: Thank you for pointing out our mistakes. We corrected the word. Line 1048 and 1151 as follows: “ROS levels were confirmed by redox-sensitive fluorescent probe using DCFH-DA molecular probe in 293T cell culture medium with or without fthl27-overexpression plasmid added with H2O2 or FAC for 4 hours.”

      Line 326: Manuscript notes that ROS levels in transfected cells are "significantly lower" than the control group, but there is no quantification or statistical analysis of ROS levels. In the methods, I noticed the mention of flow cytometry, but do not see any data from that experiment. Proportion of cells with DCFH-DA fluorescence above a threshold would be a good statistic for the experiment... Another could be average fluorescence per cell. Figure 5B shows some images with green dots and it looks like more green in the "control" (which could better be labeled as "mock-transfection") than in the fthl27 overexpression, but this could certainly be quantified by flow cytometry. I recommend that data be added.

      Reply: Thank you for your suggestions. We apologize for the error in the main text, we used a fluorescence microscope to observe fluorescence in our experiments, not a flow cytometer. We have corrected it in the methods section as follows (lines 651-653): “ROS levels were measured using a DCFH-DA molecular probe, and fluorescence was observed through a fluorescence microscope with an optional FITC filter, with the background removed to observe changes in fluorescence.” Meanwhile, we processed the images with ImageJ to obtain the respective mean fluorescence intensities (MFI) and found that the MFI of the fthl27-overexpression cells were lower than the control group, which indicated that the ROS levels of the fthl27-overexpression cells were significantly lower than the control group. MFI has been added to Figure 5B.

      Author response image 9.

      ROS levels were confirmed by redox-sensitive fluorescent probe using DCFH-DA molecular probe in 293T cell culture medium with or without fthl27-overexpression plasmid added with H2O2 or FAC for 4 hours. Images are merged from bright field images with fluorescent images using ImageJ, while the mean fluorescence intensity (MFI) is also calculated using ImageJ. Green, cellular ROS. Scale bars equal 100 μm.

      Regarding the ROS experiment: Transfection of HEK293T cells should be reasonably straightforward, and the experiment was controlled appropriately with a mock transfection, but some additional parameters are still needed to help interpret the results. Those include: Direct evidence that the transfection worked, like qPCR, western blots (is the fthl27 tagged with an antigen?), coexpression of a fluorescent protein. Then transfection efficiency should be calculated and reported.

      Reply: Thank you for your suggestions. To assess the success of the transfection, we randomly selected a subset of fthl27-transfected HEK293T cells for transcriptome sequencing. This approach allowed us to examine the gene expression profiles and confirm the efficacy of the transfection process. As control samples, we obtained transcriptome data from two untreated HEK293T cells (SRR24835259 and SRR24835265) from NCBI. Subsequently, we extracted the fthl27 gene sequence of the hadal snailfish, along with 1,000 bp upstream and downstream regions, as a separate scaffold. This scaffold was then merged with the human genome to assess the expression levels of each gene in the three transcriptome datasets. The results demonstrated that the fthl27 gene exhibited the highest expression in fthl27-transfected HEK293T cells, while in the control group, the expression of the fthl27 gene was negligible (TPM = 0). Additionally, the expression patterns of other highly expressed genes were similar to those observed in the control group, confirming the successful fthl27 transfection. These findings have been incorporated into Figure 5-figure supplements 3.

      Author response image 10.

      (B) Reads depth of fthl27 gene in fthl27-transfected HEK293T cells and 2 untreated HEK293T cells (SRR24835259 and SRR24835265) transcriptome data. (C) Expression of each gene in the transcriptome data of fthl27-transfected HEK293T cells and 2 untreated HEK293T cells (SRR24835259 and SRR24835265), where the genes shown are the 4 most highly expressed genes in each sample.

      Lines 383-386: expression of DNA repair genes is mentioned, but not shown anywhere in the results?

      Reply: Thank you for your suggestions. Accordingly, we added a description of this finding in the results section (lines 337-343): “Next, we identified 34 genes that are significantly more highly expressed in all organs of hadal snailfish in comparison to Tanaka’s snailfish and zebrafish, while only seven genes were found to be significantly more highly expressed in Tanaka’s snailfish using the same criterion (Figure 5-figure supplements 1). The 34 genes are enriched in only one GO category, GO:0000077: DNA damage checkpoint (Adjusted P-value: 0.0177). Moreover, five of the 34 genes are associated with DNA repair.”. And we added the information in the Figure 5-figure supplements 1C.

      Author response image 11.

      (C) Genes were significantly more highly expressed in all tissues of the hadal snailfish compared to Tanaka's snailfish, and 5 genes (purple) were associated with DNA repair.

    1. Author response:

      The following is the authors’ response to the previous reviews.

      eLife assessment

      This important study explores infants' attention patterns in real-world settings using advanced protocols and cutting-edge methods. The presented evidence for the role of EEG theta power in infants' attention is currently incomplete. The study will be of interest to researchers working on the development and control of attention.

      Public Reviews:

      Reviewer #1 (Public Review):

      Summary:

      The paper investigates the physiological and neural processes that relate to infants' attention allocation in a naturalistic setting. Contrary to experimental paradigms that are usually employed in developmental research, this study investigates attention processes while letting the infants be free to play with three toys in the vicinity of their caregiver, which is closer to a common, everyday life context. The paper focuses on infants at 5 and 10 months of age and finds differences in what predicts attention allocation. At 5 months, attention episodes are shorter and their duration is predicted by autonomic arousal. At 10 months, attention episodes are longer, and their duration can be predicted by theta power. Moreover, theta power predicted the proportion of looking at the toys, as well as a decrease in arousal (heart rate). Overall, the authors conclude that attentional systems change across development, becoming more driven by cortical processes.

      Strengths:

      I enjoyed reading the paper, I am impressed with the level of detail of the analyses, and I am strongly in favour of the overall approach, which tries to move beyond in-lab settings. The collection of multiple sources of data (EEG, heart rate, looking behaviour) at two different ages (5 and 10 months) is a key strength of this paper. The original analyses, which build onto robust EEG preprocessing, are an additional feat that improves the overall value of the paper. The careful consideration of how theta power might change before, during, and in the prediction of attention episodes is especially remarkable. However, I have a few major concerns that I would like the authors to address, especially on the methodological side.

      Points of improvement

      (1) Noise

      The first concern is the level of noise across age groups, periods of attention allocation, and metrics. Starting with EEG, I appreciate the analysis of noise reported in supplementary materials. The analysis focuses on a broad level (average noise in 5-month-olds vs 10-month-olds) but variations might be more fine-grained (for example, noise in 5mos might be due to fussiness and crying, while at 10 months it might be due to increased movements). More importantly, noise might even be the same across age groups, but correlated to other aspects of their behaviour (head or eye movements) that are directly related to the measures of interest. Is it possible that noise might co-vary with some of the behaviours of interest, thus leading to either spurious effects or false negatives? One way to address this issue would be for example to check if noise in the signal can predict attention episodes. If this is the case, noise should be added as a covariate in many of the analyses of this paper. 

      We thank the reviewer for this comment. We certainly have evidence that even the most state-of-the-art cleaning procedures (such as machine-learning trained ICA decompositions, as we applied here) are unable to remove eye movement artifact entirely from EEG data (Haresign et al., 2021; Phillips et al., 2023). (This applies to our data but also to others’ where confounding effects of eye movements are generally not considered.) Importantly, however, our analyses have been designed very carefully with this explicit challenge in mind. All of our analyses compare changes in the relationship between brain activity and attention as a function of age, and there is no evidence to suggest that different sources of noise (e.g. crying vs. movement) would associate differently with attention durations nor change their interactions with attention over developmental time. And figures 5 and 7, for example, both look at the relationship of EEG data at one moment in time to a child’s attention patterns hundreds or thousands of milliseconds before and after that moment, for which there is no possibility that head or eye movement artifact can have systematically influenced the results.

      Moving onto the video coding, I see that inter-rater reliability was not very high. Is this due to the fine-grained nature of the coding (20ms)? Is it driven by differences in expertise among the two coders? Or because coding this fine-grained behaviour from video data is simply too difficult? The main dependent variable (looking duration) is extracted from the video coding, and I think the authors should be confident they are maximising measurement accuracy.

      We appreciate the concern. To calculate IRR we used this function (Cardillo G. (2007) Cohen's kappa: compute the Cohen's kappa ratio on a square matrix. http://www.mathworks.com/matlabcentral/fileexchange/15365). Our “Observed agreement” was 0.7 (std= 0.15). However, we decided to report the Cohen's kappa coefficient, which is generally thought to be a more robust measure as it takes into account the agreement occurring by chance. We conducted the training meticulously (refer to response to Q6, R3), and we have confidence that our coders performed to the best of their abilities.

      (2) Cross-correlation analyses

      I would like to raise two issues here. The first is the potential problem of using auto-correlated variables as input for cross-correlations. I am not sure whether theta power was significantly autocorrelated. If it is, could it explain the cross-correlation result? The fact that the cross-correlation plots in Figure 6 peak at zero, and are significant (but lower) around zero, makes me think that it could be a consequence of periods around zero being autocorrelated. Relatedly: how does the fact that the significant lag includes zero, and a bit before, affect the interpretation of this effect? 

      Just to clarify this analysis, we did include a plot showing autocorrelation of theta activity in the original submission (Figs 7A and 7B in the revised paper). These indicate that theta shows little to no autocorrelation. And we can see no way in which this might have influenced our results. From their comments, the reviewer seems rather to be thinking of phasic changes in the autocorrelation, and whether the possibility that greater stability in theta during the time period around looks might have caused the cross-correlation result shown in 7E. Again though we can see no way in which this might be true, as the cross-correlation indicates that greater theta power is associated with a greater likelihood of looking, and this would not have been affected by changes in the autocorrelation.

      A second issue with the cross-correlation analyses is the coding of the looking behaviour. If I understand correctly, if an infant looked for a full second at the same object, they would get a maximum score (e.g., 1) while if they looked at 500ms at the object and 500ms away from the object, they would receive a score of e.g., 0.5. However, if they looked at one object for 500ms and another object for 500ms, they would receive a maximum score (e.g., 1). The reason seems unclear to me because these are different attention episodes, but they would be treated as one. In addition, the authors also show that within an attentional episode theta power changes (for 10mos). What is the reason behind this scoring system? Wouldn't it be better to adjust by the number of attention switches, e.g., with the formula: looking-time/(1+N_switches), so that if infants looked for a full second, but made 1 switch from one object to the other, the score would be .5, thus reflecting that attention was terminated within that episode? 

      We appreciate this suggestion. This is something we did not consider, and we thank the reviewer for raising it. In response to their comment, we have now rerun the analyses using the new measure (looking-time/(1+N_switches), and we are reassured to find that the results remain highly consistent. Please see Author response image 1 below where you can see the original results in orange and the new measure in blue at 5 and 10 months.

      Author response image 1.

      (3) Clearer definitions of variables, constructs, and visualisations

      The second issue is the overall clarity and systematicity of the paper. The concept of attention appears with many different names. Only in the abstract, it is described as attention control, attentional behaviours, attentiveness, attention durations, attention shifts and attention episode. More names are used elsewhere in the paper. Although some of them are indeed meant to describe different aspects, others are overlapping. As a consequence, the main results also become more difficult to grasp. For example, it is stated that autonomic arousal predicts attention, but it's harder to understand what specific aspect (duration of looking, disengagement, etc.) it is predictive of. Relatedly, the cognitive process under investigation (e.g., attention) and its operationalization (e.g., duration of consecutive looking toward a toy) are used interchangeably. I would want to see more demarcation between different concepts and between concepts and measurements.

      We appreciate the comment and we have clarified the concepts and their operationalisation throughout the revised manuscript.

      General Remarks

      In general, the authors achieved their aim in that they successfully showed the relationship between looking behaviour (as a proxy of attention), autonomic arousal, and electrophysiology. Two aspects are especially interesting. First, the fact that at 5 months, autonomic arousal predicts the duration of subsequent attention episodes, but at 10 months this effect is not present. Conversely, at 10 months, theta power predicts the duration of looking episodes, but this effect is not present in 5-month-old infants. This pattern of results suggests that younger infants have less control over their attention, which mostly depends on their current state of arousal, but older infants have gained cortical control of their attention, which in turn impacts their looking behaviour and arousal.

      We thank the reviewer for the close attention that they have paid to our manuscript, and for their insightful comments.

      Reviewer #2 (Public Review):

      Summary:

      This manuscript explores infants' attention patterns in real-world settings and their relationship with autonomic arousal and EEG oscillations in the theta frequency band. The study included 5- and 10-month-old infants during free play. The results showed that the 5-month-old group exhibited a decline in HR forward-predicted attentional behaviors, while the 10-month-old group exhibited increased theta power following shifts in gaze, indicating the start of a new attention episode. Additionally, this increase in theta power predicted the duration of infants' looking behavior.

      Strengths:

      The study's strengths lie in its utilization of advanced protocols and cutting-edge techniques to assess infants' neural activity and autonomic arousal associated with their attention patterns, as well as the extensive data coding and processing. Overall, the findings have important theoretical implications for the development of infant attention.

      Weaknesses:

      Certain methodological procedures require further clarification, e.g., details on EEG data processing. Additionally, it would be beneficial to eliminate possible confounding factors and consider alternative interpretations, e,g., whether the differences observed between the two age groups were partly due to varying levels of general arousal and engagement during the free play.

      We thank the reviewer for their suggestions and have addressed them in our point-by-point responses below.

      Reviewer #3 (Public Review):

      Summary:

      Much of the literature on attention has focused on static, non-contingent stimuli that can be easily controlled and replicated--a mismatch with the actual day-to-day deployment of attention. The same limitation is evident in the developmental literature, which is further hampered by infants' limited behavioral repertoires and the general difficulty in collecting robust and reliable data in the first year of life. The current study engages young infants as they play with age-appropriate toys, capturing visual attention, cardiac measures of arousal, and EEG-based metrics of cognitive processing. The authors find that the temporal relations between measures are different at age 5 months vs. age 10 months. In particular, at 5 months of age, cardiac arousal appears to precede attention, while at 10 months of age attention processes lead to shifts in neural markers of engagement, as captured in theta activity.

      Strengths:

      The study brings to the forefront sophisticated analytical and methodological techniques to bring greater validity to the work typically done in the research lab. By using measures in the moment, they can more closely link biological measures to actual behaviors and cognitive stages. Often, we are forced to capture these measures in separate contexts and then infer in-the-moment relations. The data and techniques provide insights for future research work.

      Weaknesses:

      The sample is relatively modest, although this is somewhat balanced by the sheer number of data points generated by the moment-to-moment analyses. In addition, the study is cross-sectional, so the data cannot capture true change over time. Larger samples, followed over time, will provide a stronger test for the robustness and reliability of the preliminary data noted here. Finally, while the method certainly provides for a more active and interactive infant in testing, we are a few steps removed from the complexity of daily life and social interactions.

      We thank the reviewer for their suggestions and have addressed them in our point-by-point responses below.

      Reviewer #1 (Recommendations For The Authors):

      Here are some specific ways in which clarity can be improved:

      A. Regarding the distinction between constructs, or measures and constructs:

      i. In the results section, I would prefer to mention looking at duration and heart rate as metrics that have been measured, while in the introduction and discussion, a clear 1-to-1 link between construct/cognitive process and behavioural or (neuro)psychophysical measure can be made (e.g., sustained attention is measured via looking durations; autonomic arousal is measured via heart-rate). 

      The way attention and arousal were operationalised are now clarified throughout the text, especially in the results.

      ii. Relatedly, the "attention" variable is not really measuring attention directly. It is rather measuring looking time (proportion of looking time to the toys?), which is the operationalisation, which is hypothesised to be related to attention (the construct/cognitive process). I would make the distinction between the two stronger.

      This distinction between looking and paying attention is clearer now in the reviewed manuscript as per R1 and R3’s suggestions. We have also added a paragraph in the Introduction to clarify it and pointed out its limitations (see pg.5).

      B. Each analysis should be set out to address a specific hypothesis. I would rather see hypotheses in the introduction (without direct reference to the details of the models that were used), and how a specific relation between variables should follow from such hypotheses. This would also solve the issue that some analyses did not seem directly necessary to the main goal of the paper. For example:

      i. Are ACF and survival probability analyses aimed at proving different points, or are they different analyses to prove the same point? Consider either making clearer how they differ or moving one to supplementary materials.

      We clarified this in pg. 4 of the revised manuscript.

      ii. The autocorrelation results are not mentioned in the introduction. Are they aiming to show that the variables can be used for cross-correlation? Please clarify their role or remove them.

      We clarified this in pg. 4 of the revised manuscript.

      C. Clarity of cross-correlation figures. To ensure clarity when presenting a cross-correlation plot, it's important to provide information on the lead-lag relationships and which variable is considered X and which is Y. This could be done by labelling the axes more clearly (e.g., the left-hand side of the - axis specifies x leads y, right hand specifies y leads x) or adding a legend (e.g., dashed line indicates x leading y, solid line indicates y leading x). Finally, the limits of the x-axis are consistent across plots, but the limits of the y-axis differ, which makes it harder to visually compare the different plots. More broadly, the plots could have clearer labels, and their resolution could also be improved. 

      This information on what variable precedes/ follows was in the caption of the figures. However, we have edited the figures as per the reviewer’s suggestion and added this information in the figures themselves. We have also uploaded all the figures in higher resolution.

      D. Figure 7 was extremely helpful for understanding the paper, and I would rather have it as Figure 1 in the introduction. 

      We have moved figure 7 to figure 1 as per this request.

      E. Statistics should always be reported, and effects should always be described. For example, results of autocorrelation are not reported, and from the plot, it is also not clear if the effects are significant (the caption states that red dots indicate significance, but there are no red dots. Does this mean there is no autocorrelation?).

      We apologise – this was hard to read in the original. We have clarified that there is no autocorrelation present in Fig 7A and 7D.

      And if so, given that theta is a wave, how is it possible that there is no autocorrelation (connected to point 1)? 

      We thank the reviewer for raising this point. In fact, theta power is looking at oscillatory activity in the EEG within the 3-6Hz window (i.e. 3 to 6 oscillations per second). Whereas we were analysing the autocorrelation in the EEG data by looking at changes in theta power between consecutive 1 second long windows. To say that there is no autocorrelation in the data means that, if there is more 3-6Hz activity within one particular 1-second window, there tends not to be significantly more 3-6Hz activity within the 1-second windows immediately before and after.

      F. Alpha power is introduced later on, and in the discussion, it is mentioned that the effects that were found go against the authors' expectations. However, alpha power and the authors' expectations about it are not mentioned in the introduction. 

      We thank the reviewer for this comment. We have added a paragraph on alpha in the introduction (pg.4).

      Minor points:

      1. At the end of 1st page of introduction, the authors state that: 

      “How children allocate their attention in experimenter-controlled, screen-based lab tasks differs, however, from actual real-world attention in several ways (32-34). For example, the real-world is interactive and manipulable, and so how we interact with the world determines what information we, in turn, receive from it: experiences generate behaviours (35).”

      I think there's more to this though - Lab-based studies can be made interactive too (e.g., Meyer et al., 2023, Stahl & Feigenson, 2015). What remains unexplored is how infants actively and freely initiate and self-structure their attention, rather than how they respond to experimental manipulations.

      Meyer, M., van Schaik, J. E., Poli, F., & Hunnius, S. (2023). How infant‐directed actions enhance infants' attention, learning, and exploration: Evidence from EEG and computational modeling. Developmental Science, 26(1), e13259.

      Stahl, A. E., & Feigenson, L. (2015). Observing the unexpected enhances infants' learning and exploration. Science, 348(6230), 91-94.

      We thank the reviewer for this suggestion and added their point in pg. 4.

      (2) Regarding analysis 4:

      a. In analysis 1 you showed that the duration of attentional episodes changes with age. Is it fair to keep the same start, middle, and termination ranges across age groups? Is 3-4 seconds "middle" for 5-month-olds? 

      We appreciate the comment. There are many ways we could have run these analyses and, in fact, in other papers we have done it differently, for example by splitting each look in 3, irrespective of its duration (Phillips et al., 2023).

      However, one aspect we took into account was the observation that 5-month-old infants exhibited more shorter looks compared to older infants. We recognized that dividing each into 3 parts, regardless of its duration, might have impacted the results. Presumably, the activity during the middle and termination phases of a 1.5-second look differs from that of a look lasting over 7 seconds.

      Two additional factors that provided us with confidence in our approach were: 1) while the definition of "middle" was somewhat arbitrary, it allowed us to maintain consistency in our analyses across different age points. And, 2) we obtained a comparable amount of observations across the two time points (e.g. “middle” at 5 months we had 172 events at 5 months, and 194 events at 10 months).

      b. It is recommended not to interpret lower-level interactions if more complex interactions are not significant. How are the interaction effects in a simpler model in which the 3-way interaction is removed? 

      We appreciate the comment. We tried to follow the same steps as in (Xie et al., 2018). However, we have re-analysed the data removing the 3-way interaction and the significance of the results stayed the same. Please see Author response image 2 below (first: new analyses without the 3-way interactions, second: original analyses that included the 3-way interaction).

      Author response image 2.

      (3) Figure S1: there seems to be an outlier in the bottom-right panel. Do results hold excluding it? 

      We re-run these analyses as per this suggestion and the results stayed the same (refer to SM pg. 2).

      (4) Figure S2 should refer to 10 months instead of 12.

      We thank the reviewer for noticing this typo, we have changed it in the reviewed manuscript (see SM pg. 3). 

      (5) In the 2nd paragraph of the discussion, I found this sentence unclear: "From Analysis 1 we found that infants at both ages showed a preferred modal reorientation rate". 

      We clarified this in the reviewed manuscript in pg10

      (6) Discussion: many (infant) studies have used theta in anticipation of receiving information (Begus et al., 2016) surprising events (Meyer et al., 2023), and especially exploration (Begus et al., 2015). Can you make a broader point on how these findings inform our interpretation of theta in the infant population (go more from description to underlying mechanisms)? 

      We have extended on this point on interpreting frequency bands in pg13 of the reviewed manuscript and thank the reviewer for bringing it up.

      Begus, K., Gliga, T., & Southgate, V. (2016). Infants' preferences for native speakers are associated with an expectation of information. Proceedings of the National Academy of Sciences, 113(44), 12397-12402.

      Meyer, M., van Schaik, J. E., Poli, F., & Hunnius, S. (2023). How infant‐directed actions enhance infants' attention, learning, and exploration: Evidence from EEG and computational modeling. Developmental Science, 26(1), e13259.

      Begus, K., Southgate, V., & Gliga, T. (2015). Neural mechanisms of infant learning: differences in frontal theta activity during object exploration modulate subsequent object recognition. Biology letters, 11(5), 20150041.

      (7) 2nd page of discussion, last paragraph: "preferred modal reorientation timer" is not a neural/cognitive mechanism, just a resulting behaviour. 

      We agree with this comment and thank the reviewer for bringing it out to our attention. We clarified this in in pg12 and pg13 of the reviewed manuscript.

      Reviewer #2 (Recommendations For The Authors):

      I have a few comments and questions that I think the authors should consider addressing in a revised version. Please see below:

      (1) During preprocessing (steps 5 and 6), it seems like the "noisy channels" were rejected using the pop_rejchan.m function and then interpolated. This procedure is common in infant EEG analysis, but a concern arises: was there no upper limit for channel interpolation? Did the authors still perform bad channel interpolation even when more than 30% or 40% of the channels were identified as "bad" at the beginning with the continuous data? 

      We did state in the original manuscript that “participants with fewer than 30% channels interpolated at 5 months and 25% at 10 months made it to the final step (ICA) and final analyses”. In the revised version we have re-written this section in order to make this more clear (pg. 17).

      (2) I am also perplexed about the sequencing of the ICA pruning step. If the intention of ICA pruning is to eliminate artificial components, would it be more logical to perform this procedure before the conventional artifacts' rejection (i.e., step 7), rather than after? In addition, what was the methodology employed by the authors to identify the artificial ICA components? Was it done through manual visual inspection or utilizing specific toolboxes? 

      We agree that the ICA is often run before, however, the decision to reject continuous data prior to ICA was to remove the very worst sections of data (where almost all channels were affected), which can arise during times when infants fuss or pull the caps. Thus, this step was applied at this point in the pipeline so that these sections of really bad data were not inputted into the ICA. This is fairly widespread practice in cleaning infant data.

      Concerning the reviewer’s second question, of how ICA components were removed – the answer to this is described in considerable detail in the paper that we refer to in that setion of the manuscript. This was done by training a classifier specially designed to clean naturalistic infant EEG data (Haresign et al., 2021) and has since been employed in similar studies (e.g. Georgieva et al., 2020; Phillips et al., 2023).

      (3) Please clarify how the relative power was calculated for the theta (3-6Hz) and alpha (6-9Hz) bands. Were they calculated by dividing the ratio of theta or alpha power to the power between 3 and 9Hz, or the total power between 1 (or 3) and 20 Hz? In other words, what does the term "all frequency bands" refer to in section 4.3.7? 

      We thank the reviewer for this comment, we have now clarified this in pg. 22.

      (4) One of the key discoveries presented in this paper is the observation that attention shifts are accompanied by a subsequent enhancement in theta band power shortly after the shifts occur. Is it possible that this effect or alteration might be linked to infants' saccades, which are used as indicators of attention shifts? Would it be feasible to analyze the disparities in amplitude between the left and right frontal electrodes (e.g., Fp1 and Fp2, which could be viewed as virtual horizontal EOG channels) in relation to theta band power, in order to eliminate the possibility that the augmentation of theta power was attributable to the intensity of the saccades? 

      We appreciate the concern. Average saccade duration in infants is about 40ms (Garbutt et al., 2007). Our finding that the positive cross-correlation between theta and look duration is present not only when we examine zero-lag data but also when we examine how theta forwards-predicts attention 1-2 seconds afterwards seems therefore unlikely to be directly attributable to saccade-related artifact. Concerning the reviewer’s suggestion – this is something that we have tried in the past. Unfortunately, however, our experience is that identifying saccades based on the disparity between Fp1 and Fp2 is much too unreliable to be of any use in analysing data. Even if specially positioned HEOG electrodes are used, we still find the saccade detection to be insufficiently reliable. In ongoing work we are tracking eye movements separately, in order to be able to address this point more satisfactorily.

      (5) The following question is related to my previous comment. Why is the duration of the relationship between theta power and moment-to-moment changes in attention so short? If theta is indeed associated with attention and information processing, shouldn't the relationship between the two variables strengthen as the attention episode progresses? Given that the authors themselves suggest that "One possible interpretation of this is that neural activity associates with the maintenance more than the initiation of attentional behaviors," it raises the question of (is in contradiction to) why the duration of the relationship is not longer but declines drastically (Figure 6). 

      We thank the reviewer for raising this excellent point. Certainly we argue that this, together with the low autocorrelation values for theta documented in Fig 7A and 7D challenge many conventional ways of interpreting theta. We are continuing to investigate this question in ongoing work.

      (6) Have the authors conducted a comparison of alpha relative power and HR deceleration durations between 5 and 10-month-old infants? This analysis could provide insights into whether the differences observed between the two age groups were partly due to varying levels of general arousal and engagement during free play.

      We thank the reviewer for this suggestion. Indeed, this is an aspect we investigated but ultimately, given that our primary emphasis was on the theta frequency, and considering the length of the manuscript, we decided not to incorporate. However, we attached Author response image 3 below showing there was no significant interaction between HR and alpha band.

      Author response image 3.

      Reviewer #3 (Recommendations For The Authors):

      (1) In reading the manuscript, the language used seems to imply longitudinal data or at the very least the ability to detect change or maturation. Given the cross-sectional nature of the data, the language should be tempered throughout. The data are illustrative but not definitive. 

      We thank the reviewer for this comment. We have now clarified that “Data was analysed in a cross-sectional manner” in pg15.

      (2) The sample size is quite modest, particularly in the specific age groups. This is likely tempered by the sheer number of data points available. This latter argument is implied in the text, but not as explicitly noted. (However, I may have missed this as the text is quite dense). I think more notice is needed on the reliability and stability of the findings given the sample. 

      We have clarified this in pg16.

      (3) On a related note, how was the sample size determined? Was there a power analysis to help guide decision-making for both recruitment and choosing which analyses to proceed with? Again, the analytic approach is quite sophisticated and the questions are of central interest to researchers, but I was left feeling maybe these two aspects of the study were out-sprinting the available data. The general impression is that the sample is small, but it is not until looking at table s7, that it is in full relief. I think this should be more prominent in the main body of the study.

      We have clarified this in pg16.

      (4) The devotes a few sentences to the relation between looking and attention. However, this distinction is central to the design of the study, and any philosophical differences regarding what take-away points can be generated. In my reading, I think this point needs to be more heavily interrogated. 

      This distinction between looking and paying attention is clearer now in the reviewed manuscript as per R1 and R3’s suggestions. We have also added a paragraph in the Introduction to clarify it and pointed out its limitations (see pg.5).

      (5) I would temper the real-world attention language. This study is certainly a great step forward, relative to static faces on a computer screen. However, there are still a great number of artificial constraints that have been added. That is not to say that the constraints are bad--they are necessary to carry out the work. However, it should be acknowledged that it constrains the external validity. 

      We have added a paragraph to acknowledged limitations of the setup in pg. 14.

      (6) The kappa on the coding is not strong. The authors chose to proceed nonetheless. Given that, I think more information is needed on how coders were trained, how they were standardized, and what parameters were used to decide they were ready to code independently. Again, with the sample size and the kappa presented, I think more discussion is needed regarding the robustness of the findings. 

      We appreciate the concern. As per our answer to R1, we chose to report the most stringent calculator of inter-rater reliability, but other calculation methods (i.e., percent agreement) return higher scores (see response to R1).

      As per the training, we wrote an extensively detailed coding scheme describing exactly how to code each look that was handed to our coders. Throughout the initial months of training, we meet with the coders on a weekly basis to discuss questions and individual frames that looked ambiguous. After each session, we would revise the coding scheme to incorporate additional details, aiming to make the coding process progressively less subjective. During this period, every coder analysed the same interactions, and inter-rater reliability (IRR) was assessed weekly, comparing their evaluations with mine (Marta). With time, the coders had fewer questions and IRR increased. At that point, we deemed them sufficiently trained, and began assigning them different interactions from each other. Periodically, though, we all assessed the same interaction and meet to review and discuss our coding outputs.

    1. Author Response

      The following is the authors’ response to the original reviews.

      eLife assessment

      These ingenious and thoughtful studies present important findings concerning how people represent and generalise abstract patterns of sensory data. The issue of generalisation is a core topic in neuroscience and psychology, relevant across a wide range of areas, and the findings will be of interest to researchers across areas in perception, learning, and cognitive science. The findings have the potential to provide compelling support for the outlined account, but there appear other possible explanations, too, that may affect the scope of the findings but could be considered in a revision.

      Thank you for sending the feedback from the three peer reviewers regarding our paper. Please find below our detailed responses addressing the reviewers' comments. We have incorporated these suggestions into the paper and provided explanations for the modifications made.

      We have specifically addressed the point of uncertainty highlighted in eLife's editorial assessment, which concerned alternative explanations for the reported effect. In response to Reviewer #1, we have clarified how Exp. 2c and Exp. 3c address the potential alternative explanation related to "attention to dimensions." Further, we present a supplementary analysis to account for differences in asymptotic learning, as noted by Reviewer #2. We have also clarified how our control experiments address effects associated with general cognitive engagement in the task. Lastly, we have further clarified the conceptual foundation of our paper, addressing concerns raised by Reviewers #2 and #3.

      Reviewer #1 (Public Review):

      Summary:

      This manuscript reports a series of experiments examining category learning and subsequent generalization of stimulus representations across spatial and nonspatial domains. In Experiment 1, participants were first trained to make category judgments about sequences of stimuli presented either in nonspatial auditory or visual modalities (with feature values drawn from a two-dimensional feature manifold, e.g., pitch vs timbre), or in a spatial modality (with feature values defined by positions in physical space, e.g., Cartesian x and y coordinates). A subsequent test phase assessed category judgments for 'rotated' exemplars of these stimuli: i.e., versions in which the transition vectors are rotated in the same feature space used during training (near transfer) or in a different feature space belonging to the same domain (far transfer). Findings demonstrate clearly that representations developed for the spatial domain allow for representational generalization, whereas this pattern is not observed for the nonspatial domains that are tested. Subsequent experiments demonstrate that if participants are first pre-trained to map nonspatial auditory/visual features to spatial locations, then rotational generalization is facilitated even for these nonspatial domains. It is argued that these findings are consistent with the idea that spatial representations form a generalized substrate for cognition: that space can act as a scaffold for learning abstract nonspatial concepts.

      Strengths:

      I enjoyed reading this manuscript, which is extremely well-written and well-presented. The writing is clear and concise throughout, and the figures do a great job of highlighting the key concepts. The issue of generalization is a core topic in neuroscience and psychology, relevant across a wide range of areas, and the findings will be of interest to researchers across areas in perception and cognitive science. It's also excellent to see that the hypotheses, methods, and analyses were pre-registered.

      The experiments that have been run are ingenious and thoughtful; I particularly liked the use of stimulus structures that allow for disentangling of one-dimensional and two-dimensional response patterns. The studies are also well-powered for detecting the effects of interest. The model-based statistical analyses are thorough and appropriate throughout (and it's good to see model recovery analysis too). The findings themselves are clear-cut: I have little doubt about the robustness and replicability of these data.

      Weaknesses:

      I have only one significant concern regarding this manuscript, which relates to the interpretation of the findings. The findings are taken to suggest that "space may serve as a 'scaffold', allowing people to visualize and manipulate nonspatial concepts" (p13). However, I think the data may be amenable to an alternative possibility. I wonder if it's possible that, for the visual and auditory stimuli, participants naturally tended to attend to one feature dimension and ignore the other - i.e., there may have been a (potentially idiosyncratic) difference in salience between the feature dimensions that led to participants learning the feature sequence in a one-dimensional way (akin to the 'overshadowing' effect in associative learning: e.g., see Mackintosh, 1976, "Overshadowing and stimulus intensity", Animal Learning and Behaviour). By contrast, we are very used to thinking about space as a multidimensional domain, in particular with regard to two-dimensional vertical and horizontal displacements. As a result, one would naturally expect to see more evidence of two-dimensional representation (allowing for rotational generalization) for spatial than nonspatial domains.

      In this view, the impact of spatial pre-training and (particularly) mapping is simply to highlight to participants that the auditory/visual stimuli comprise two separable (and independent) dimensions. Once they understand this, during subsequent training, they can learn about sequences on both dimensions, which will allow for a 2D representation and hence rotational generalization - as observed in Experiments 2 and 3. This account also anticipates that mapping alone (as in Experiment 4) could be sufficient to promote a 2D strategy for auditory and visual domains.

      This "attention to dimensions" account has some similarities to the "spatial scaffolding" idea put forward in the article, in arguing that experience of how auditory/visual feature manifolds can be translated into a spatial representation helps people to see those domains in a way that allows for rotational generalization. Where it differs is that it does not propose that space provides a scaffold for the development of the nonspatial representations, i.e., that people represent/learn the nonspatial information in a spatial format, and this is what allows them to manipulate nonspatial concepts. Instead, the "attention to dimensions" account anticipates that ANY manipulation that highlights to participants the separable-dimension nature of auditory/visual stimuli could facilitate 2D representation and hence rotational generalization. For example, explicit instruction on how the stimuli are constructed may be sufficient, or pre-training of some form with each dimension separately, before they are combined to form the 2D stimuli.

      I'd be interested to hear the authors' thoughts on this account - whether they see it as an alternative to their own interpretation, and whether it can be ruled out on the basis of their existing data.

      We thank the Reviewer for their comments. We agree with the Reviewer that the “attention to dimensions” hypothesis is an interesting alternative explanation. However, we believe that the results of our control experiments Exp. 2c and Exp. 3c are incompatible with this alternative explanation.

      In Exp. 2c, participants are pre-trained in the visual modality and then tested in the auditory modality. In the multimodal association task, participants have to associate the auditory stimuli and the visual stimuli: on each trial, they hear a sound and then have to click on the corresponding visual stimulus. It is thus necessary to pay attention to both auditory dimensions and both visual dimensions to perform the task. To give an example, the task might involve mapping the fundamental frequency and the amplitude modulation of the auditory stimulus to the colour and the shape of the visual stimulus, respectively. If participants pay attention to only one dimension, this would lead to a maximum of 25% accuracy on average (because they would be at chance on the other dimension, with four possible options). We observed that 30/50 participants reached an accuracy > 50% in the multimodal association task in Exp. 2c. This means that we know for sure that at least 60% of the participants paid attention to both dimensions of the stimuli. Nevertheless, there was a clear difference between participants that received a visual pre-training (Exp. 2c) and those who received a spatial pre-training (Exp. 2a) (frequency of 1D vs 2D models between conditions, BF > 100 in near transfer and far transfer). In fact, only 3/50 participants were best fit by a 2D model when vision was the pre-training modality compared to 29/50 when space was the pre-training modality. Thus, the benefit of the spatial pre-training cannot be due solely to a shift in attention toward both dimensions.

      This effect was replicated in Exp. 3c. Similarly, 33/48 participants reached an accuracy > 50% in the multimodal association task in Exp. 3c, meaning that we know for sure that at least 68% of the participants actually paid attention to both dimensions of the stimuli. Again, there was a clear difference between participants who received a visual pre-training (frequency of 1D vs 2D models between conditions, Exp. 3c) and those who received a spatial pre-training (Exp. 3a) (BF > 100 in near transfer and far transfer).

      Thus, we believe that the alternative explanation raised by the Reviewer is not supported by our data. We have added a paragraph in the discussion:

      “One alternative explanation of this effect could be that the spatial pre-training encourages participants to attend to both dimensions of the non-spatial stimuli. By contrast, pretraining in the visual or auditory domains (where multiple dimensions of a stimulus may be relevant less often naturally) encourages them to attend to a single dimension. However, data from our control experiments Exp. 2c and Exp. 3c, are incompatible with this explanation. Around ~65% of the participants show a level of performance in the multimodal association task (>50%) which could only be achieved if they were attending to both dimensions (performance attending to a single dimension would yield 25% and chance performance is at 6.25%). This suggests that participants are attending to both dimensions even in the visual and auditory mapping case.”

      Reviewer #2 (Public Review):

      Summary:

      In this manuscript, L&S investigates the important general question of how humans achieve invariant behavior over stimuli belonging to one category given the widely varying input representation of those stimuli and more specifically, how they do that in arbitrary abstract domains. The authors start with the hypothesis that this is achieved by invariance transformations that observers use for interpreting different entries and furthermore, that these transformations in an arbitrary domain emerge with the help of the transformations (e.g. translation, rotation) within the spatial domain by using those as "scaffolding" during transformation learning. To provide the missing evidence for this hypothesis, L&S used behavioral category learning studies within and across the spatial, auditory, and visual domains, where rotated and translated 4-element token sequences had to be learned to categorize and then the learned transformation had to be applied in new feature dimensions within the given domain. Through single- and multiple-day supervised training and unsupervised tests, L&S demonstrated by standard computational analyses that in such setups, space and spatial transformations can, indeed, help with developing and using appropriate rotational mapping whereas the visual domain cannot fulfill such a scaffolding role.

      Strengths:

      The overall problem definition and the context of spatial mapping-driven solution to the problem is timely. The general design of testing the scaffolding effect across different domains is more advanced than any previous attempts clarifying the relevance of spatial coding to any other type of representational codes. Once the formulation of the general problem in a specific scientific framework is done, the following steps are clearly and logically defined and executed. The obtained results are well interpretable, and they could serve as a good stepping stone for deeper investigations. The analytical tools used for the interpretations are adequate. The paper is relatively clearly written.

      Weaknesses:

      Some additional effort to clarify the exact contribution of the paper, the link between analyses and the claims of the paper, and its link to previous proposals would be necessary to better assess the significance of the results and the true nature of the proposed mechanism of abstract generalization.

      (1) Insufficient conceptual setup: The original theoretical proposal (the Tolman-Eichenbaum-Machine, Whittington et al., Cell 2020) that L&S relate their work to proposes that just as in the case of memory for spatial navigation, humans and animals create their flexible relational memory system of any abstract representation by a conjunction code that combines on the one hand, sensory representation and on the other hand, a general structural representation or relational transformation. The TEM also suggests that the structural representation could contain any graph-interpretable spatial relations, albeit in their demonstration 2D neighbor relations were used. The goal of L&S's paper is to provide behavioral evidence for this suggestion by showing that humans use representational codes that are invariant to relational transformations of non-spatial abstract stimuli and moreover, that humans obtain these invariances by developing invariance transformers with the help of available spatial transformers. To obtain such evidence, L&S use the rotational transformation. However, the actual procedure they use actually solved an alternative task: instead of interrogating how humans develop generalizations in abstract spaces, they demonstrated that if one defines rotation in an abstract feature space embedded in a visual or auditory modality that is similar to the 2D space (i.e. has two independent dimensions that are clearly segregable and continuous), humans cannot learn to apply rotation of 4-piece temporal sequences in those spaces while they can do it in 2D space, and with co-associating a one-to-one mapping between locations in those feature spaces with locations in the 2D space an appropriate shaping mapping training will lead to the successful application of rotation in the given task (and in some other feature spaces in the given domain). While this is an interesting and challenging demonstration, it does not shed light on how humans learn and generalize, only that humans CAN do learning and generalization in this, highly constrained scenario. This result is a demonstration of how a stepwise learning regiment can make use of one structure for mapping a complex input into a desired output. The results neither clarify how generalizations would develop in abstract spaces nor the question of whether this generalization uses transformations developed in the abstract space. The specific training procedure ensures success in the presented experiments but the availability and feasibility of an equivalent procedure in a natural setting is a crucial part of validating the original claim and that has not been done in the paper.

      We thank the Reviewer for their detailed comments on our manuscript. We reply to the three main points in turn.

      First, concerning the conceptual grounding of our work, we would point out that the TEM model (Whittington et al., 2020), however interesting, is not our theoretical starting point. Rather, as we hope the text and references make clear, we ground our work in theoretical work from the 1990/2000s proposing that space acts as a scaffold for navigating abstract spaces (such as Gärdenfors, 2000). We acknowledge that the TEM model and other experimental work on the implication of the hippocampus, the entorhinal cortex and the parietal cortex in relational transformations of nonspatial stimuli provide evidence for this general theory. However, our work is designed to test a more basic question: whether there is behavioural evidence that space scaffolds learning in the first place. To achieve this, we perform behavioural experiments with causal manipulation (spatial pre-training vs no spatial pre-training) have the potential to provide such direct evidence. This is why we claim that:

      “This theory is backed up by proof-of-concept computational simulations [13], and by findings that brain regions thought to be critical for spatial cognition in mammals (such as the hippocampal-entorhinal complex and parietal cortex) exhibit neural codes that are invariant to relational transformations of nonspatial stimuli. However, whilst promising, this theory lacks direct empirical evidence. Here, we set out to provide a strong test of the idea that learning about physical space scaffolds conceptual generalisation.“

      Second, we agree with the Reviewer that we do not provide an explicit model for how generalisation occurs, and how precisely space acts as a scaffold for building representations and/or applying the relevant transformations to non-spatial stimuli to solve our task. Rather, we investigate in our Exp. 2-4 which aspects of the training are necessary for rotational generalisation to happen (and conclude that a simple training with the multimodal association task is sufficient for ~20% participants). We now acknowledge in the discussion the fact that we do not provide an explicit model and leave that for future work:

      “We acknowledge that our study does not provide a mechanistic model of spatial scaffolding but rather delineate which aspects of the training are necessary for generalisation to happen.”

      Finally, we also agree with the Reviewer that our task is non-naturalistic. As is common in experimental research, one must sacrifice the naturalistic elements of the task in exchange for the control and the absence of prior knowledge of the participants. We have decided to mitigate as possible the prior knowledge of the participants to make sure that our task involved learning a completely new task and that the pre-training was really causing the better learning/generalisation. The effects we report are consistent across the experiments so we feel confident about them but we agree with the Reviewer that an external validation with more naturalistic stimuli/tasks would be a nice addition to this work. We have included a sentence in the discussion:

      “All the effects observed in our experiments were consistent across near transfer conditions (rotation of patterns within the same feature space), and far transfer conditions (rotation of patterns within a different feature space, where features are drawn from the same modality). This shows the generality of spatial training for conceptual generalisation. We did not test transfer across modalities nor transfer in a more natural setting; we leave this for future studies.”

      (2) Missing controls: The asymptotic performance in experiment 1 after training in the three tasks was quite different in the three tasks (intercepts 2.9, 1.9, 1.6 for spatial, visual, and auditory, respectively; p. 5. para. 1, Fig 2BFJ). It seems that the statement "However, our main question was how participants would generalise learning to novel, rotated exemplars of the same concept." assumes that learning and generalization are independent. Wouldn't it be possible, though, that the level of generalization depends on the level of acquiring a good representation of the "concept" and after obtaining an adequate level of this knowledge, generalization would kick in without scaffolding? If so, a missing control is to equate the levels of asymptotic learning and see whether there is a significant difference in generalization. A related issue is that we have no information on what kind of learning in the three different domains was performed, albeit we probably suspect that in space the 2D representation was dominant while in the auditory and visual domains not so much. Thus, a second missing piece of evidence is the model-fitting results of the ⦰ condition that would show which way the original sequences were encoded (similar to Fig 2 CGK and DHL). If the reason for lower performance is not individual stimulus difficulty but the natural tendency to encode the given stimulus type by a combo of random + 1D strategy that would clarify that the result of the cross-training is, indeed, transferring the 2D-mapping strategy.

      We agree with the Reviewer that a good further control is to equate performance during training. Thus, we have run a complementary analysis where we select only the participants that reach > 90% accuracy in the last block of training in order to equate asymptotic performance after training in Exp. 1. The results (see Author response image 1) replicates the results that we report in the main text: there is a large difference between groups (relative likelihood of 1D vs. 2D models, all BF > 100 in favour of a difference between the auditory and the spatial modalities, between the visual and the spatial modalities, in both near and far transfer, “decisive” evidence). We prefer not to include this figure in the paper for clarity, and because we believe this result is expected given the fact that 0/50 and 0/50 of the participants in the auditory and visual condition used a 2D strategy – thus, selecting subgroups of these participants cannot change our conclusions.

      Author response image 1.

      Results of Exp. 1 when selecting participants that reached > 90% accuracy in the last block of training. Captions are the same as Figure 2 of the main text.

      Second, the Reviewer suggested that we run the model fitting analysis only on the ⦰ condition (training) in Exp. 1 to reveal whether participants use a 1D or a 2D strategy already during training. Unfortunately, we cannot provide the model fits only in the ⦰ condition in Exp. 1 because all models make the same predictions for this condition (see Fig S4). However, note that this is done by design: participants were free to apply whatever strategy they want during training; we then used the generalisation phase with the rotated stimuli precisely to reveal this strategy. Further, we do believe that the strategy used by the participants during training and the strategy during transfer are the same, partly because – starting from block #4 – participants have no idea whether the current trial is a training trial or a transfer trial, as both trial types are randomly interleaved with no cue signalling the trial type. We have made this clear in the methods:

      “They subsequently performed 105 trials (with trialwise feedback) and 105 transfer trials including rotated and far transfer quadruplets (without trialwise feedback) which were presented in mixed blocks of 30 trials. Training and transfer trials were randomly interleaved, and no clue indicated whether participants were currently on a training trial or a transfer trial before feedback (or absence of feedback in case of a transfer trial).”

      Reviewer #3 (Public Review):

      Summary:

      Pesnot Lerousseau and Summerfield aimed to explore how humans generalize abstract patterns of sensory data (concepts), focusing on whether and how spatial representations may facilitate the generalization of abstract concepts (rotational invariance). Specifically, the authors investigated whether people can recognize rotated sequences of stimuli in both spatial and nonspatial domains and whether spatial pre-training and multi-modal mapping aid in this process.

      Strengths:

      The study innovatively examines a relatively underexplored but interesting area of cognitive science, the potential role of spatial scaffolding in generalizing sequences. The experimental design is clever and covers different modalities (auditory, visual, spatial), utilizing a two-dimensional feature manifold. The findings are backed by strong empirical data, good data analysis, and excellent transparency (including preregistration) adding weight to the proposition that spatial cognition can aid abstract concept generalization.

      Weaknesses:

      The examples used to motivate the study (such as "tree" = oak tree, family tree, taxonomic tree) may not effectively represent the phenomena being studied, possibly confusing linguistic labels with abstract concepts. This potential confusion may also extend to doubts about the real-life applicability of the generalizations observed in the study and raises questions about the nature of the underlying mechanism being proposed.

      We thank the Reviewer for their comments. We agree that we could have explained ore clearly enough how these examples motivate our study. The similarity between “oak tree” and “family tree” is not just the verbal label. Rather, it is the arrangement of the parts (nodes and branches) in a nested hierarchy. Oak trees and family trees share the same relational structure. The reason that invariance is relevant here is that the similarity in relational structure is retained under rigid body transformations such as rotation or translation. For example, an upside-down tree can still be recognised as a tree, just as a family tree can be plotted with the oldest ancestors at either top or bottom. Similarly, in our study, the quadruplets are defined by the relations between stimuli: all quadruplets use the same basic stimuli, but the categories are defined by the relations between successive stimuli. In our task, generalising means recognising that relations between stimuli are the same despite changes in the surface properties (for example in far transfer). We have clarify that in the introduction:

      “For example, the concept of a “tree” implies an entity whose structure is defined by a nested hierarchy, whether this is a physical object whose parts are arranged in space (such as an oak tree in a forest) or a more abstract data structure (such as a family tree or taxonomic tree). [...] Despite great changes in the surface properties of oak trees, family trees and taxonomic trees, humans perceive them as different instances of a more abstract concept defined by the same relational structure.”

      Next, the study does not explore whether scaffolding effects could be observed with other well-learned domains, leaving open the question of whether spatial representations are uniquely effective or simply one instance of a familiar 2D space, again questioning the underlying mechanism.

      We would like to mention that Reviewer #2 had a similar comment. We agree with both Reviewers that our task is non-naturalistic. As is common in experimental research, one must sacrifice the naturalistic elements of the task in exchange for the control and the absence of prior knowledge of the participants. We have decided to mitigate as possible the prior knowledge of the participants to make sure that our task involved learning a completely new task and that the pre-training was really causing the better learning/generalisation. The effects we report are consistent across the experiments so we feel confident about them but we agree with the Reviewer that an external validation with more naturalistic stimuli/tasks would be a nice addition to this work. We have included a sentence in the discussion:

      “All the effects observed in our experiments were consistent across near transfer conditions (rotation of patterns within the same feature space), and far transfer conditions (rotation of patterns within a different feature space, where features are drawn from the same modality). This shows the generality of spatial training for conceptual generalisation. We did not test transfer across modalities nor transfer in a more natural setting; we leave this for future studies.”

      Further doubt on the underlying mechanism is cast by the possibility that the observed correlation between mapping task performance and the adoption of a 2D strategy may reflect general cognitive engagement rather than the spatial nature of the task. Similarly, the surprising finding that a significant number of participants benefited from spatial scaffolding without seeing spatial modalities may further raise questions about the interpretation of the scaffolding effect, pointing towards potential alternative interpretations, such as shifts in attention during learning induced by pre-training without changing underlying abstract conceptual representations.

      The Reviewer is concerned about the fact that the spatial pre-training could benefit the participants by increasing global cognitive engagement rather than providing a scaffold for learning invariances. It is correct that the participants in the control group in Exp. 2c have poorer performances on average than participants that benefit from the spatial pre-training in Exp. 2a and 2b. The better performances of the participants in Exp. 2a and 2b could be due to either the spatial nature of the pre-training (as we claim) or a difference in general cognitive engagement. .

      However, if we look closely at the results of Exp. 3, we can see that the general cognitive engagement hypothesis is not well supported by the data. Indeed, the participants in the control condition (Exp. 3c) have relatively similar performances than the other groups during training. Rather, the difference is in the strategy they use, as revealed by the transfer condition. The majority of them are using a 1D strategy, contrary to the participants that benefited from a spatial pre-training (Exp 3a and 3b). We have included a sentence in the results:

      “Further, the results show that participants who did not experience spatial pre-training were still engaged in the task, but were not using the same strategy as the participants who experienced spatial pre-training (1D rather than 2D). Thus, the benefit of the spatial pre-training is not simply to increase the cognitive engagement of the participants. Rather, spatial pre-training provides a scaffold to learn rotation-invariant representation of auditory and visual concepts even when rotation is never explicitly shown during pre-training.”

      Finally, Reviewer #1 had a related concern about a potential alternative explanation that involved a shift in attention. We reproduce our response here: we agree with the Reviewer that the “attention to dimensions” hypothesis is an interesting (and potentially concerning) alternative explanation. However, we believe that the results of our control experiments Exp. 2c and Exp. 3c are not compatible with this alternative explanation.

      Indeed, in Exp. 2c, participants are pre-trained in the visual modality and then tested in the auditory modality. In the multimodal association task, participants have to associate the auditory stimuli and the visual stimuli: on each trial, they hear a sound and then have to click on the corresponding visual stimulus. It is necessary to pay attention to both auditory dimensions and both visual dimensions to perform well in the task. To give an example, the task might involve mapping the fundamental frequency and the amplitude modulation of the auditory stimulus to the colour and the shape of the visual stimulus, respectively. If participants pay attention to only one dimension, this would lead to a maximum of 25% accuracy on average (because they would be at chance on the other dimension, with four possible options). We observed that 30/50 participants reached an accuracy > 50% in the multimodal association task in Exp. 2c. This means that we know for sure that at least 60% of the participants actually paid attention to both dimensions of the stimuli. Nevertheless, there was a clear difference between participants that received a visual pre-training (Exp. 2c) and those who received a spatial pre-training (Exp. 2a) (frequency of 1D vs 2D models between conditions, BF > 100 in near transfer and far transfer). In fact, only 3/50 participants were best fit by a 2D model when vision was the pre-training modality compared to 29/50 when space was the pre-training modality. Thus, the benefit of the spatial pre-training cannot be due solely to a shift in attention toward both dimensions.

      This effect was replicated in Exp. 3c. Similarly, 33/48 participants reached an accuracy > 50% in the multimodal association task in Exp. 3c, meaning that we know for sure that at least 68% of the participants actually paid attention to both dimensions of the stimuli. Again, there was a clear difference between participants who received a visual pre-training (frequency of 1D vs 2D models between conditions, Exp. 3c) and those who received a spatial pre-training (Exp. 3a) (BF > 100 in near transfer and far transfer).

      Thus, we believe that the alternative explanation raised by the Reviewer is not supported by our data. We have added a paragraph in the discussion:

      “One alternative explanation of this effect could be that the spatial pre-training encourages participants to attend to both dimensions of the non-spatial stimuli. By contrast, pretraining in the visual or auditory domains (where multiple dimensions of a stimulus may be relevant less often naturally) encourages them to attend to a single dimension. However, data from our control experiments Exp. 2c and Exp. 3c, are incompatible with this explanation. Around ~65% of the participants show a level of performance in the multimodal association task (>50%) which could only be achieved if they were attending to both dimensions (performance attending to a single dimension would yield 25% and chance performance is at 6.25%). This suggests that participants are attending to both dimensions even in the visual and auditory mapping case.”

      Conclusions:

      The authors successfully demonstrate that spatial training can enhance the ability to generalize in nonspatial domains, particularly in recognizing rotated sequences. The results for the most part support their conclusions, showing that spatial representations can act as a scaffold for learning more abstract conceptual invariances. However, the study leaves room for further investigation into whether the observed effects are unique to spatial cognition or could be replicated with other forms of well-established knowledge, as well as further clarifications of the underlying mechanisms.

      Impact:

      The study's findings are likely to have a valuable impact on cognitive science, particularly in understanding how abstract concepts are learned and generalized. The methods and data can be useful for further research, especially in exploring the relationship between spatial cognition and abstract conceptualization. The insights could also be valuable for AI research, particularly in improving models that involve abstract pattern recognition and conceptual generalization.

      In summary, the paper contributes valuable insights into the role of spatial cognition in learning abstract concepts, though it invites further research to explore the boundaries and specifics of this scaffolding effect.

      Reviewer #1 (Recommendations For The Authors):

      Minor issues / typos:

      P6: I think the example of the "signed" mapping here should be "e.g., ABAB maps to one category and BABA maps to another", rather than "ABBA maps to another" (since ABBA would always map to another category, whether the mapping is signed or unsigned).

      Done.

      P11: "Next, we asked whether pre-training and mapping were systematically associated with 2Dness...". I'd recommend changing to: "Next, we asked whether accuracy during pre-training and mapping were systematically associated with 2Dness...", just to clarify what the analyzed variables are.

      Done.

      P13, paragraph 1: "only if the features were themselves are physical spatial locations" either "were" or "are" should be removed.

      Done.

      P13, paragraph 1: should be "neural representations of space form a critical substrate" (not "for").

      Done.

      Reviewer #2 (Recommendations For The Authors):

      The authors use in multiple places in the manuscript the phrases "learn invariances" (Abstract), "formation of invariances" (p. 2, para. 1), etc. It might be just me, but this feels a bit like 'sloppy' wording: we do not learn or form invariances, rather we learn or form representations or transformations by which we can perform tasks that require invariance over particular features or transformation of the input such as the case of object recognition and size- translation- or lighting-invariance. We do not form size invariance, we have representations of objects and/or size transformations allowing the recognition of objects of different sizes. The authors might change this way of referring to the phenomenon.

      We respectfully disagree with this comment. An invariance occurs when neurons make the same response under different stimulation patterns. The objects or features to which a neuron responds is shaped by its inputs. Those inputs are in turn determined by experience-dependent plasticity. This process is often called “representation learning”. We think that our language here is consistent with this status quo view in the field.

      Reviewer #3 (Recommendations For The Authors):

      • I understand that the objective of the present experiment is to study our ability to generalize abstract patterns of sensory data (concepts). In the introduction, the authors present examples like the concept of a "tree" (encompassing a family tree, an oak tree, and a taxonomic tree) and "ring" to illustrate the idea. However, I am sceptical as to whether these examples effectively represent the phenomena being studied. From my perspective, these different instances of "tree" do not seem to relate to the same abstract concept that is translated or rotated but rather appear to share only a linguistic label. For instance, the conceptual substance of a family tree is markedly different from that of an oak tree, lacking significant overlap in meaning or structure. Thus, to me, these examples do not demonstrate invariance to transformations such as rotations.

      To elaborate further, typically, generalization involves recognizing the same object or concept through transformations. In the case of abstract concepts, this would imply a shared abstract representation rather than a mere linguistic category. While I understand the objective of the experiments and acknowledge their potential significance, I find myself wondering about the real-world applicability and relevance of such generalizations in everyday cognitive functioning. This, in turn, casts some doubt on the broader relevance of the study's results. A more fitting example, or an explanation that addresses my concerns about the suitability of the current examples, would be beneficial to further clarify the study's intent and scope.

      Response in the public review.

      • Relatedly, the manuscript could benefit from greater clarity in defining key concepts and elucidating the proposed mechanism behind the observed effects. Is it plausible that the changes observed are primarily due to shifts in attention induced by the spatial pre-training, rather than a change in the process of learning abstract conceptual invariances (i.e., modifications to the abstract representations themselves)? While the authors conclude that spatial pre-training acts as a scaffold for enhancing the learning of conceptual invariances, it raises the question: does this imply participants simply became more focused on spatial relationships during learning, or might this shift in attention represent a distinct strategy, and an alternative explanation? A more precise definition of these concepts and a clearer explanation of the authors' perspective on the mechanism underlying these effects would reduce any ambiguity in this regard.

      Response in the public review.

      • I am wondering whether the effectiveness of spatial representations in generalizing abstract concepts stems from their special nature or simply because they are a familiar 2D space for participants. It is well-established that memory benefits from linking items to familiar locations, a technique used in memory training (method of loci). This raises the question: Are we observing a similar effect here, where spatial dimensions are the only tested familiar 2D spaces, while the other 2 spaces are simply unfamiliar, as also suggested by the lower performance during training (Fig.2)? Would the results be replicable with another well-learned, robustly encoded domain, such as auditory dimensions for professional musicians, or is there something inherently unique about spatial representations that aids in bootstrapping abstract representations?

      On the other side of the same coin, are spatial representations qualitatively different, or simply more efficient because they are learned more quickly and readily? This leads to the consideration that if visual pre-training and visual-to-auditory mapping were continued until a similar proficiency level as in spatial training is achieved, we might observe comparable performance in aiding generalization. Thus, the conclusion that spatial representations are a special scaffold for abstract concepts may not be exclusively due to their inherent spatial nature, but rather to the general characteristic of well-established representations. This hypothesis could be further explored by either identifying alternative 2D representations that are equally well-learned or by extending training in visual or auditory representations before proceeding with the mapping task. At the very least I believe this potential explanation should be explored in the discussion section.

      Response in the public review.

      I had some difficulty in following an important section of the introduction: "... whether participants can learn rotationally invariant concepts in nonspatial domains, i.e., those that are defined by sequences of visual and auditory features (rather than by locations in physical space, defined in Cartesian or polar coordinates) is not known." This was initially puzzling to me as the paragraph preceding it mentions: "There is already good evidence that nonspatial concepts are represented in a translation invariant format." While I now understand that the essential distinction here is between translation and rotation, this was not immediately apparent upon first reading. This crucial distinction, especially in the context of conceptual spaces, was not clearly established before this point in the manuscript. For better clarity, it would be beneficial to explicitly contrast and define translation versus rotation in this particular section and stress that the present study concerns rotations in abstract spaces.

      Done.

      • The multi-modal association is crucial for the study, however to my knowledge, it is not depicted or well explained in the main text or figures (Results section). In my opinion, the details of this task should be explained and illustrated before the details of the associated results are discussed.

      We have included an illustration of a multimodal association trial in Fig. S3B.

      Author response image 2.

      • The observed correlation between the mapping task performance and the adoption of a 2D strategy is logical. However, this correlation might not exclusively indicate the proposed underlying mechanism of spatial scaffolding. Could it also be reflective of more general factors like overall performance, attention levels, or the effort exerted by participants? This alternative explanation suggests that the correlation might arise from broader cognitive engagement rather than specifically from the spatial nature of the task. Addressing this possibility could strengthen the argument for the unique role of spatial representations in learning abstract concepts, or at least this alternative interpretation should be mentioned.

      Response in the public review.

      • To me, the finding that ~30% of participants benefited from the spatial scaffolding effect for example in the auditory condition merely through exposure to the mapping (Fig 4D), without needing to see the quadruplets in the spatial modality, was somewhat surprising. This is particularly noteworthy considering that only ~60% of participants adopted the 2D strategy with exposure to rotated contingencies in Experiment 3 (Fig 3D). How do the authors interpret this outcome? It would be interesting to understand their perspective on why such a significant effect emerged from mere exposure to the mapping task.

      • I appreciate the clarity Fig.1 provides in explaining a challenging experimental setup. Is it possible to provide example trials, including an illustration that shows which rotations produce the trail and an intuitive explanation that response maps onto the 1D vs 2D strategies respectively, to aid the reader in better understanding this core manipulation?

      • I like that the authors provide transparency by depicting individual subject's data points in their results figures (e.g. Figs. 2 B, F, J). However, with an n=~50 per condition, it becomes difficult to intuit the distribution, especially for conditions with higher variance (e.g., Auditory). The figures might be more easily interpretable with alternative methods of displaying variances, such as violin plots per data point, conventional error shading using 95%CIs, etc.

      • Why are the authors not reporting exact BFs in the results sections at least for the most important contrasts?

      • While I understand why the authors report the frequencies for the best model fits, this may become difficult to interpret in some sections, given the large number of reported values. Alternatives or additional summary statistics supporting inference could be beneficial.

      As the Reviewer states, there are a large number of figures that we can report in this study. We have chosen to keep this number at a minimum to be as clear as possible. To illustrate the distribution of individual data points, we have opted to display only the group's mean and standard error (the standard errors are included, but the substantial number of participants per condition provides precise estimates, resulting in error bars that can be smaller than the mean point). This decision stems from our concern that including additional details could lead to a cluttered representation with unnecessary complexity. Finally, we report what we believe to be the critical BFs for the comprehension of the reader in the main text, and choose a cutoff of 100 when BFs are high (corresponding to the label “decisive” evidence, some BFs are larger than 1012). All the exact BFs are in the supplementary for the interested readers.

    1. Author response:

      The following is the authors’ response to the original reviews.

      Reviewer #1 (Public Review):

      Summary:

      The manuscript considers a mechanistic extension of MacArthur's consumer-resource model to include chasing down food and potential encounters between the chasers (consumers) that lead to less efficient feeding in the form of negative feedback. After developing the model, a deterministic solution and two forms of stochastic solutions are presented, in agreement with each other. Finally, the model is applied to explain observed coexistence and rank-abundance data.

      We thank the reviewer for the accurate summary of our manuscript.

      Strengths:

      The application of the theory to natural rank-abundance curves is impressive. The comparison with the experiments that reject the competitive exclusion principle is promising. It would be fascinating to see if in, e.g. insects, the specific interference dynamics could be observed and quantified and whether they would agree with the model.

      The results are clearly presented; the methods adequately described; the supplement is rich with details.

      There is much scope to build upon this expansion of the theory of consumer-resource models. This work can open up new avenues of research.

      We appreciate the reviewer for the very positive comments. We have followed many of the suggestions raised by the reviewer, and the manuscript is much improved as a result.

      Following the reviewer’s suggestions, we have now used Shannon entropies to quantify the model comparison with experiments that reject the Competitive Exclusion Principle (CEP). Specifically, for each time point of each experimental or model-simulated community, we calculated the Shannon entropies using the formula:

      , where is the probability that a consumer individual belongs to species C<sub>i</sub> at the time stamp of t. The comparison of Shannon entropies in the time series between those of the experimental data and SSA results shown in Fig. 2D-E is presented in Appendix-fig. 7C-D. The time averages and standard deviations (δH) of the Shannon entropies for these experimental or SSA model-simulated communities are as follows:

      , ; ,

      , , .

      Meanwhile, we have calculated the time averages and standard deviations (δC<sub>i</sub>) of the species’ relative/absolute abundances for the experimental or SSA model-simulated communities shown in Fig. 2D-E, which are as follows:

      , ; , ; , , , , where the superscript “(R)” represents relative abundances.

      From the results of Shannon entropies shown in Author response image 1 (which are identical to those of Appendix-fig. 7C-D) and the quantitative comparison of the time average and standard deviation between the model and experiments presented above, it is evident that the model results in Fig. 2D-E exhibit good consistency with the experimental data. They share roughly identical time averages and standard deviations in both Shannon entropies and the species' relative/absolute abundances for most of the comparisons. All these analyses are included in the appendices and mentioned in the main text.

      Author response image 1.

      Shannon Entropies of the experimental data and SSA results in Fig. 2D-E, redrawn from Appendix-fig. 7C-D.

      Weaknesses:

      I am questioning the use of carrying capacity (Eq. 4) instead of using nutrient limitation directly through Monod consumption (e.g. Posfai et al. who the authors cite). I am curious to see how these results hold or are changed when Monod consumption is used.

      We thank the reviewer for raising this question. To explain it more clearly, the equation combining the third equation in Eq. 1 and Eq. 4 of our manuscript is presented below as Eq. R1:

      where x<sub>il</sub> represents the population abundance of the chasing pair C<sub>i</sub><sup>(P)</sup> ∨ R<sub>l</sub><sup>(P)</sup>, κ<sub>l</sub> stands for the steady-state population abundance of species R<sub>l</sub> (the carrying capacity) in the absence of consumer species. In the case with no consumer species, then x<sub>il</sub> \= 0 since C<sub>i</sub> \= 0 (i\=1,…,S<sub>C</sub>), thus R<sub>l</sub> = κ<sub>l</sub> when R<sub>l</sub> = 0.

      Eq. R1 for the case of abiotic resources is comparable to Eq. (1) in Posfai et al., which we present below as Eq. R2:

      where c<sub>i</sub> represents the concentration of nutrient i, and thus corresponds to our R<sub>l</sub> ; n<sub>σ</sub>(t) is the population of species σ, which corresponds to our C<sub>i</sub> ; s<sub>i</sub> stands for the nutrient supply rate, which corresponds to our ζl ; µi denotes the nutrient loss rate, corresponding to our is the coefficient of the rate of species σ for consuming nutrient i, which corresponds to our in Posfai et al. is the consumption rate of nutrient i by the population of species σ, which corresponds to our x<sub>il</sub>.

      In Posfai et al., is the Monod function: and thus

      In our model, however, since predator interference is not involved in Posfai et al., we need to analyze the form of x<sub>il</sub> presented in the functional form of x<sub>il</sub> ({R<sub>l</sub>},{C<sub>i</sub>}) in the case involving only chasing pairs. Specifically, for the case of abiotic resources, the population dynamics can be described by Eq. 1 combined with Eq. R1:

      where and . For convenience, we consider the case of S<sub>R</sub> \=1 where the Monod form was derived (Monod, J. (1949). Annu. Rev. Microbiol., 3, 371-394.). From , we have

      where , and l =1. If the population abundance of the resource species is much larger than that of all consumer species (i.e., ), then,

      and R<sub>l</sub><sup>(F)</sup> ≈ R<sub>l</sub>. Combined with R5, and noting that C<sub>i</sub> \= C<sub>i</sub>(F) + xil we can solve for x<sub>il</sub> :

      with l =1 since S<sub>R</sub> \=1. Comparing Eq. R6 with Eq. R3, and considering the symbol correspondence explained in the text above, it is now clear that our model can be reduced to the Monod consumption form in the case of S<sub>R</sub> \=1 where the Monod form was derived from.

      Following on the previous comment, I am confused by the fact that the nutrient consumption term in Eq. 1 and how growth is modeled (Eq. 4) are not obviously compatible and would be hard to match directly to experimentally accessible quantities such as yield (nutrient to biomass conversion ratio). Ultimately, there is a conservation of mass ("flux balance"), and therefore the dynamics must obey it. I don't quite see how conservation of mass is imposed in this work.

      We thank the reviewer for raising this question. Indeed, the population dynamics of our model must adhere to flux balance, with the most pertinent equation restated here as Eq. R7:

      Below is the explanation of how Eq. R7, and thus Eqs. 1 and 4 of our manuscript, adhere to the constraint of flux balance. The interactions and fluxes between consumer and resource species occur solely through chasing pairs. At the population level, the scenario of chasing pairs among consumer species C<sub>i</sub> and resource species R<sub>l</sub> is presented in the follow expression:

      where the superscripts "(F)" and "(P)" represent the freely wandering individuals and those involved in chasing pairs, respectively, "(+)" stands for the gaining biomass of consumer C<sub>i</sub> from resource R<sub>l</sub>. In our manuscript, we use x<sub>l</sub> to represent the population abundance (or equivalently, the concentration, for a well-mixed system with a given size) of the chasing pair C<sub>i</sub><sup>(P)</sup> ∨ R<sub>l</sub><sup>(P)</sup>, and thus, the net flow from resource species R<sub>l</sub> to consumer species C<sub>i</sub> per unit time is k<sub>il</sub>x<sub>il</sub>. Noting that there is only one R<sub>l</sub> individual within the chasing pair C<sub>i</sub><sup>(P)</sup> ∨ R<sub>l</sub><sup>(P)</sup>, then the net effect on the population dynamics of species is −k<sub>il</sub>x<sub>il</sub>. However, since a consumer individual from species C<sub>i</sub> could be much heavier than a species R<sub>l</sub> individual, and energy dissipation would be involved from nutrient conversion into biomass, we introduce a mass conversion ratio w<sub>l</sub> in our manuscript. For example, if a species C<sub>i</sub> individual is ten times the weight of a species R<sub>l</sub> individual, without energy dissipation, the mass conversion ratio wil should be 1/10 (i.e., wil \= 0.1 ), however, if half of the chemical energy is dissipated into heat from nutrient conversion into biomass, then w<sub>l</sub> \= 0.1 0.5× = 0.05. Consequently, the net effect of the flux from resource species _R_l to consumer species C<sub>i</sub> per unit time on the population dynamics is , and flux balance is clearly satisfied.

      For the population dynamics of a consumer species C<sub>i</sub>, we need to consider all the biomass influx from different resource species, and thus there is a summation over all species of resources, which leads to the term of in Eq. R7. Similarly, for the population dynamics of a resource species R<sub>l</sub>, we need to lump sum all the biomass outflow into different consumer species, resulting in the term of in Eq. R7.

      Consequently, Eq. R7 and our model satisfy the constraint of flux balance.

      These models could be better constrained by more data, in principle, thereby potential exists for a more compelling case of the relevance of this interference mechanism to natural systems.

      We thank the reviewer for raising this question. Indeed, our model could benefit from the inclusion of more experimental data. In our manuscript, we primarily set the parameters by estimating their reasonable range. Following the reviewer's suggestions, we have now specified the data we used to set the parameters. For example, in Fig. 2D, we set 𝐷<sub>2</sub>\=0.01 with τ=0.4 days, resulting in an expected lifespan of Drosophila serrata in our model setting of 𝜏⁄𝐷<sub>2</sub>\= 40 days, which roughly agrees with experimental data showing that the average lifespan of D. serrata is 34 days for males and 54 days for females (lines 321-325 in the appendices; reference: Narayan et al. J Evol Biol. 35: 657–663 (2022)). To explain biodiversity and quantitatively illustrate the rank-abundance curves across diverse communities, the competitive differences across consumer species, exemplified by the coefficient of variation of the mortality rates - a key parameter influencing the rank-abundance curve, were estimated from experimental data in the reference article (Patricia Menon et al., Water Research (2003) 37, 4151) using the two-sigma rule (lines 344-347 in the appendices).

      Still, we admit that many factors other than intraspecific interference, such as temporal variation, spatial heterogeneity, etc., are involved in breaking the limits of CEP in natural systems, and it is still challenging to differentiate each contribution in wild systems. However, for the two classical experiments that break CEP (Francisco Ayala, 1969; Thomas Park, 1954), intraspecific interference could probably be the most relevant mechanism, since factors such as temporal variation, spatial heterogeneity, cross-feeding, and metabolic tradeoffs are not involved in those two experimental systems.

      The underlying frameworks, B-D and MacArthur are not properly exposed in the introduction, and as a result, it is not obvious what is the specific contribution in this work as opposed to existing literature. One needs to dig into the literature a bit for that.

      The specific contribution exists, but it might be more clearly separated and better explained. In the process, the introduction could be expanded a bit to make the paper more accessible, by reviewing key features from the literature that are used in this manuscript.

      We thank the reviewer for these very insightful suggestions. Following these suggestions, we have now added a new paragraph and revised the introduction part of our manuscript (lines 51-67 in the main text) to address the relevant issues. Our paper is much improved as a result.

      Reviewer #2 (Public Review):

      Summary:

      The manuscript by Kang et al investigates how the consideration of pairwise encounters (consumer-resource chasing, intraspecific consumer pair, and interspecific consumer pair) influences the community assembly results. To explore this, they presented a new model that considers pairwise encounters and intraspecific interference among consumer individuals, which is an extension of the classical Beddington-DeAngelis (BD) phenomenological model, incorporating detailed considerations of pairwise encounters and intraspecific interference among consumer individuals. Later, they connected with several experimental datasets.

      Strengths:

      They found that the negative feedback loop created by the intraspecific interference allows a diverse range of consumer species to coexist with only one or a few types of resources. Additionally, they showed that some patterns of their model agree with experimental data, including time-series trajectories of two small in-lab community experiments and the rank-abundance curves from several natural communities. The presented results here are interesting and present another way to explain how the community overcomes the competitive exclusion principle.

      We appreciate the reviewer for the positive comments and the accurate summary of our manuscript.

      Weaknesses:

      The authors only explore the case with interspecific interference or intraspecific interference exists. I believe they need to systematically investigate the case when both interspecific and intraspecific interference exists. In addition, the text description, figures, and mathematical notations have to be improved to enhance the article's readability. I believe this manuscript can be improved by addressing my comments, which I describe in more detail below.

      We thank the reviewer for these valuable suggestions. We have followed many of the suggestions raised by the reviewer, and the manuscript is much improved as a result.

      (1) In nature, it is really hard for me to believe that only interspecific interference or intraspecific interference exists. I think a hybrid between interspecific interference and intraspecific interference is very likely. What would happen if both the interspecific and intraspecific interference existed at the same time but with different encounter rates? Maybe the authors can systematically explore the hybrid between the two mechanisms by changing their encounter rates. I would appreciate it if the authors could explore this route.

      We thank the reviewer for raising this question. Indeed, interspecific interference and intraspecific interference simultaneously exist in real cases. To differentiate the separate contributions of inter- and intra-specific interference on biodiversity, we considered different scenarios involving inter- or intra-specific interference. In fact, we have also considered the scenario involving both inter- and intra-specific interference in our old version for the case of S<sub>C</sub> = 2 and S<sub>R</sub> = 1, where two consumer species compete for one resource species (Appendix-fig. 5, and lines 147-148, 162-163 in the main text of the old version, or lines 160-161, 175-177 in the new version).

      Following the reviewer’s suggestions, we have now systematically investigated the cases of S<sub>C</sub> = 6, S<sub>R</sub> = 1, and S<sub>C</sub> = 20, S<sub>R</sub> = 1, where six or twenty consumer species compete for one resource species in scenarios involving chasing pairs and both inter- and intra-specific interference using both ordinary differential equations (ODEs) and stochastic simulation algorithm (SSA). These newly added ODE and SSA results are shown in Appendix-fig. 5 F-H, and we have added a new paragraph to describe these results in our manuscript (lines 212-215 in the main text). Consistent with our findings in the case of S<sub>C</sub> = 2 and S<sub>R</sub> = 1, the species coexistence behavior in the cases of both S<sub>C</sub> = 6, S<sub>R</sub> = 1, and S<sub>C</sub> = 20, S<sub>R</sub> = 1 is very similar to those without interspecific interference: all consumer species coexist with one type of resources at constant population densities in the ODE studies, and the SSA results fluctuate around the population dynamics of the ODEs.

      As for the encounter rates of interspecific and intraspecific interference, in fact, in a well-mixed system, these encounter rates can be derived from the mobility rates of the consumer species using the mean field method. For a system with a size of L2, the interspecific encounter rate between consumer species C<sub>i</sub> and C<sub>j</sub> (ij) is please refer to lines 100-102, 293-317 in the main text, and see also Appendix-fig. 1), where r<sup>(I)</sup> is the upper distance for interference, while v<sub>C<sub>i</sub></sub> and v<sub>C<sub>j</sub></sub> represent the mobility rates of species C<sub>i</sub> and C<sub>j</sub>, respectively. Meanwhile, the intraspecific encounter rates within species C<sub>i</sub> and species C<sub>j</sub> are and , respectively.

      Thus, once the intraspecific encounter rates a’<sub>ii</sub> are a’<sub>jj</sub> given, the interspecific encounter rate between species C<sub>i</sub> and C<sub>j</sub> is determined. Consequently, we could not tune the encounter rates of interspecific and intraspecific interference at will in our study, especially noting that for clarity reasons, we have used the mortality rate as the only parameter that varies among the consumer species throughout this study. Alternatively, we have made a systematic study on analyzing the influence of varying the separate rate and escape rate on species coexistence in the case of two consumers competing for a single type of resources (see Appendix-fig. 5A).

      (2) In the first two paragraphs of the introduction, the authors describe the competitive exclusion principle (CEP) and past attempts to overcome the CEP. Moving on from the first two paragraphs to the third paragraph, I think there is a gap that needs to be filled to make the transition smoother and help readers understand the motivations. More specifically, I think the authors need to add one more paragraph dedicated to explaining why predator interference is important, how considering the mechanism of predator interference may help overcome the CEP, and whether predator interference has been investigated or under-investigated in the past. Then building upon the more detailed introduction and movement of predator interference, the authors may briefly introduce the classical B-D phenomenological model and what are the conventional results derived from the classical B-D model as well as how they intend to extend the B-D model to consider the pairwise encounters.

      We thank the reviewer for these very insightful suggestions. Following these suggestions, we have added a new paragraph and revised the introduction part of our paper (lines 51-67 in the main text). Our manuscript is significantly improved as a result.

      (3) The notations for the species abundances are not very informative. I believe some improvements can be made to make them more meaningful. For example, I think using Greek letters for consumers and English letters for resources might improve readability. Some sub-scripts are not necessary. For instance, R^(l)_0 can be simplified to g_l to denote the intrinsic growth rate of resource l. Similarly, K^(l)_0 can be simplified to K_l. Another example is R^(l)_a, which can be simplified to s_l to denote the supply rate. In addition, right now, it is hard to find all definitions across the text. I would suggest adding a separate illustrative box with all mathematical equations and explanations of symbols.

      We thank the reviewer for these very useful suggestions. We have now followed many of the suggestions to improve the readability of our manuscript. Given that we have used many English letters for consumers and there are already many symbols of English and Greek letters for different variables and parameters in the appendices, we have opted to use Greek letters for parameters specific to resource species and English letters for those specific to consumer species. Additionally, we have now added Appendix-tables 1-2 in the appendices (pages 16-17 in the appendices) to illustrate the symbols used throughout our manuscript.

      (4) What is the f_i(R^(F)) on line 131? Does it refer to the growth rate of C_i? I noticed that f_i(R^(F)) is defined in the supplementary information. But please ensure that readers can understand it even without reading the supplementary information. Otherwise, please directly refer to the supplementary information when f_i(R^(F)) occurs for the first time. Similarly, I don't think the readers can understand \Omega^\prime_i and G^\prime_i on lines 135-136.

      We thank the reviewer for raising these questions. We apologize for not illustrating those symbols and functions clearly enough in our previous version of the manuscript. f<sub>i</sub>R<sup>(F)</sup>⟯ is a function of the variable R<sup>(F)</sup> with the index i, which is defined as and for i=2. Following the reviewer’s suggestions, we have now added clear definitions for symbols and functions and resolved these issues. The definitions of \Omega_i, \Omega^\prime_i, G, and G^\prime are overly complex, and hence we directly refer to the Appendices when they occur for the first time in the main text.

      Reviewer #3 (Public Review):

      Summary:

      A central question in ecology is: Why are there so many species? This question gained heightened interest after the development of influential models in theoretical ecology in the 1960s, demonstrating that under certain conditions, two consumer species cannot coexist on the same resource. Since then, several mechanisms have been shown to be capable of breaking the competitive exclusion principle (although, we still lack a general understanding of the relative importance of the various mechanisms in promoting biodiversity).

      One mechanism that allows for breaking the competitive exclusion principle is predator interference. The Beddington-DeAngelis is a simple model that accounts for predator interference in the functional response of a predator. The B-D model is based on the idea that when two predators encounter one another, they waste some time engaging with one another which could otherwise be used to search for resources. While the model has been influential in theoretical ecology, it has also been criticized at times for several unusual assumptions, most critically, that predators interfere with each other regardless of whether they are already engaged in another interaction. However, there has been considerable work since then which has sought either to find sets of assumptions that lead to the B-D equation or to derive alternative equations from a more realistic set of assumptions (Ruxton et al. 1992; Cosner et al. 1999; Broom et al. 2010; Geritz and Gyllenberg 2012). This paper represents another attempt to more rigorously derive a model of predator interference by borrowing concepts from chemical reaction kinetics (the approach is similar to previous work: Ruxton et al. 1992). The main point of difference is that the model in the current manuscript allows for 'chasing pairs', where a predator and prey engage with one another to the exclusion of other interactions, a situation Ruxton et al. (1992) do not consider. While the resulting functional response is quite complex, the authors show that under certain conditions, one can get an analytical expression for the functional response of a predator as a function of predator and resource densities. They then go on to show that including intraspecific interference allows for the coexistence of multiple species on one or a few resources, and demonstrate that this result is robust to demographic stochasticity.

      We thank the reviewer for carefully reading our manuscript and for the positive comments on the rigorously derived model of predator interference presented in our paper. We also appreciate the reviewer for providing a thorough introduction to the research background of our study, especially the studies related to the BeddingtonDeAngelis model. We apologize for our oversight in not fully appreciating the related study by Ruxton et al. (1992) at the time of our first submission. Indeed, as suggested by the reviewer, Ruxton et al. (1992) is relevant to our study in that we both borrowed concepts from chemical reaction kinetics. Now, we have reworked the introduction and discussion sections of our manuscript, cited, and acknowledged the contributions of related works, including Ruxton et al. (1992).

      Strengths:

      I appreciate the effort to rigorously derive interaction rates from models of individual behaviors. As currently applied, functional responses (FRs) are estimated by fitting equations to feeding rate data across a range of prey or predator densities. In practice, such experiments are only possible for a limited set of species. This is problematic because whether a particular FR allows stability or coexistence depends on not just its functional form, but also its parameter values. The promise of the approach taken here is that one might be able to derive the functional response parameters of a particular predator species from species traits or more readily measurable behavioral data.

      We appreciate the reviewer's positive comments regarding the rigorous derivation of our model. Indeed, all parameters of our model can be derived from measurable behavioral data for a specific set of predator species.

      Weaknesses:

      The main weakness of this paper is that it devotes the vast majority of its length to demonstrating results that are already widely known in ecology. We have known for some time that predator interference can relax the CEP (e.g., Cantrell, R. S., Cosner, C., & Ruan, S. 2004).

      While the model presented in this paper differs from the functional form of the B-D in some cases, it would be difficult to formulate a model that includes intraspecific interference (that increases with predator density) that does not allow for coexistence under some parameter range. Thus, I find it strange that most of the main text of the paper deals with demonstrating that predator interference allows for coexistence, given that this result is already well known. A more useful contribution would focus on the extent to which the dynamics of this model differ from those of the B-D model.

      We appreciate the reviewer for raising this question and apologize for not sufficiently clarifying the contribution of our manuscript in the context of existing knowledge upon our initial submission. We have now significantly revised the introduction part of our manuscript (lines 51-67 in the main text) to make this clearer. Indeed, with the application of the Beddington-DeAngelis (B-D) model, several studies (e.g., Cantrell, R. S., Cosner, C., & Ruan, S. 2004) have already shown that intraspecific interference promotes species coexistence, and it is certain that the mechanism of intraspecific interference could lead to species coexistence if modeled correctly. However, while we acknowledge that the B-D model is a brilliant phenomenological model of intraspecific interference, for the specific research topic of our manuscript on breaking the CEP and explaining the paradox of the plankton, it is highly questionable regarding the validity of applying the B-D model to obtain compelling results.

      Specifically, the functional response in the B-D model of intraspecific interference can be formally derived from the scenario involving only chasing pairs without consideration of pairwise encounters between consumer individuals (Eq. S8 in Appendices; related references: Gert Huisman, Rob J De Boer, J. Theor. Biol. 185, 389 (1997) and Xin Wang and Yang-Yu Liu, iScience 23, 101009 (2020)). Since we have demonstrated that the scenario involving only chasing pairs is under the constraint of CEP (see lines 139-144 in the main text and Appendix-fig. 3A-C; related references: Xin Wang and Yang-Yu Liu, iScience 23, 101009 (2020)), and given the identical functional response mentioned above, it is thus highly questionable regarding the validity of the studies relying on the B-D model to break CEP or explain the paradox of the plankton.

      Consequently, one of the major objectives of our manuscript is to resolve whether the mechanism of intraspecific interference can truly break CEP and explain the paradox of the plankton in a rigorous manner. By modeling intraspecific predator interference from a mechanistic perspective and applying rigorous mathematical analysis and numerical simulations, our work resolves these issues and demonstrates that intraspecific interference enables a wide range of consumer species to coexist with only one or a handful of resource species. This naturally breaks CEP, explains the paradox of plankton, and quantitatively illustrates a broad spectrum of experimental results.

      For intuitive understanding, we introduced a functional response in our model (presented as Eq. 5 in the main text), which indeed involves approximations. However, to rigorously break the CEP or explain the paradox of plankton, all simulation results in our study were directly derived from equations 1 to 4 (main text), without relying on the approximate functional response presented in Eq. 5.

      The formulation of chasing-pair engagements assumes that prey being chased by a predator are unavailable to other predators. For one, this seems inconsistent with the ecology of most predator-prey systems. In the system in which I work (coral reef fishes), prey under attack by one predator are much more likely to be attacked by other predators (whether it be a predator of the same species or otherwise). I find it challenging to think of a mechanism that would give rise to chased prey being unavailable to other predators. The authors also critique the B-D model: "However, the functional response of the B-D model involving intraspecific interference can be formally derived from the scenario involving only chasing pairs without predator interference (Wang and Liu, 2020; Huisman and De Boer, 1997) (see Eqs. S8 and S24). Therefore, the validity of applying the B-D model to break the CEP is questionable.".

      We appreciate the reviewer for raising this question. We fully agree with the reviewer that in many predator-prey systems (e.g., coral reef fishes as mentioned by the reviewer, wolves, and even microbial species such as Myxococcus xanthus; related references: Berleman et al., FEMS Microbiol. Rev. 33, 942-957 (2009)), prey under attack by one predator can be targeted by another predator (which we term as a chasing triplet) or even by additional predator individuals (which we define as higher-order terms). However, since we have already demonstrated in a previous study (Xin Wang, Yang-Yu Liu, iScience 23, 101009 (2020)) from a mechanistic perspective that a scenario involving chasing triplets or higher-order terms can naturally break the CEP, while our manuscript focuses on whether pairwise encounters between individuals can break the CEP and explain the paradox of plankton, we deliberately excluded confounding factors that are already known to promote biodiversity, just as we excluded prevalent factors such as cross-feeding and temporal variations in our model.

      However, the way "chasing pairs" are formulated does result in predator interference because a predator attacking prey interferes with the ability of other predators to encounter the prey. I don't follow the author's logic that B-D isn't a valid explanation for coexistence because a model incorporating chasing pairs engagements results in the same functional form as B-D.

      We thank the reviewer for raising this question, and we apologize for not making this point clear enough at the time of our initial submission. We have now revised the related part of our manuscript (lines 56-62 in the main text) to make this clearer.

      In our definition, predator interference means the pairwise encounter between consumer individuals, while a chasing pair is formed by a pairwise encounter between a consumer individual and a resource individual. Thus, in these definitions, a scenario involving only chasing pairs does not involve pairwise encounters between consumer individuals (which is our definition of predator interference).

      We acknowledge that there can be different definitions of predator interference, and the reviewer's interpretation is based on a definition of predator interference that incorporates indirect interference without pairwise encounters between consumer individuals. We do not wish to argue about the appropriateness of definitions. However, since we have proven that scenarios involving only chasing pairs are under the constraint of CEP (see lines 139-144 in the main text and Appendix-fig. 3A-C; related references: Xin Wang and Yang-Yu Liu, iScience 23, 101009 (2020)), while the functional response of the B-D model can be derived from the scenario involving only chasing pairs without consideration of pairwise encounters between consumer individuals (Eq. S8 in Appendices; related references: Gert Huisman, Rob J De Boer, J. Theor. Biol. 185, 389 (1997) and Xin Wang and Yang-Yu Liu, iScience 23, 101009 (2020)), it is thus highly questionable regarding the validity of applying the B-D model to break CEP.

      More broadly, the specific functional form used to model predator interference is of secondary importance to the general insight that intraspecific interference (however it is modeled) can allow for coexistence. Mechanisms of predator interference are complex and vary substantially across species. Thus it is unlikely that any one specific functional form is generally applicable.

      We thank the reviewer for raising this issue. We agree that the general insight that intraspecific predator interference can facilitate species coexistence is of great importance. We also acknowledge that any functional form of a functional response is unlikely to be universally applicable, as explicit functional responses inevitably involve approximations. However, we must reemphasize the importance of verifying whether intraspecific predator interference can truly break CEP and explain the paradox of plankton, which is one of the primary objectives of our study. As mentioned above, since the B-D model can be derived from the scenario involving only chasing pairs (Eq. S8 in Appendices; related references: Gert Huisman, Rob J De Boer, J. Theor. Biol. 185, 389 (1997) and Xin Wang and Yang-Yu Liu, iScience 23, 101009 (2020)), while we have demonstrated that scenarios involving only chasing pairs are subject to the constraint of CEP (see lines 139-144 in the main text and Appendix-fig. 3A-C; related references: Xin Wang and Yang-Yu Liu, iScience 23, 101009 (2020)), it is highly questionable regarding the validity of applying the B-D model to break CEP.

      Recommendations for the authors:

      Reviewer #1 (Recommendations For The Authors):

      I do not see any code or data sharing. They should exist in a prominent place. The authors should make their simulations and the analysis scripts freely available to download, e.g. by GitHub. This is always true but especially so in a journal like eLife.

      We appreciate the reviewer for these recommendations. We apologize for our oversight regarding the unsuccessful upload of the data in our initial submission, as the data size was considerable and we neglected to double-check for this issue. Following the reviewer’s recommendation, we have now uploaded the code and dataset to GitHub (accessible at https://github.com/SchordK/Intraspecific-predator-interference-promotesbiodiversity-in-ecosystems), where they are freely available for download.

      The introduction section should include more background, including about BD but also about consumer-resource models. Part of the results section could be moved/edited to the introduction. You should try that the results section should contain only "new" stuff whereas the "old" stuff should go in the introduction.

      We thank the reviewer for these recommendations. Following these suggestions, we have now reorganized our manuscript by adding a new paragraph to the introduction section (lines 51-62 in the main text) and revising related content in both the introduction and results sections (lines 63-67, 81-83 in the main text).

      I found myself getting a little bogged down in the general/formal description of the model before you go to specific cases. I found the most interesting part of the paper to be its second half. This is a dangerous strategy, a casual reader may miss out on the most interesting part of the paper. It's your paper and do what you think is best, but my opinion is that you could improve the presentation of the model and background to get to the specific contribution and specific use case quickly and easily, then immediately to the data. You can leave the more general formulation and the details to later in the paper or even the appendix. Ultimately, you have a simple idea and a beautiful application on interesting data-that is your strength I think, and so, I would focus on that.

      We appreciate the reviewer for the positive comments and valuable suggestions. Following these recommendations, we have revised the presentation of the background information to clarify the contribution of our manuscript, and we have refined our model presentation to enhance clarity. Meanwhile, as we need to address the concerns raised by other reviewers, we continue to maintain systematic investigations for scenarios involving different forms of pairwise encounters in the case of S<sub>C</sub> = 2 and S<sub>R</sub> = 1 before applying our model to the experimental data.

      Reviewer #2 (Recommendations For The Authors):

      (1) I believe the surfaces in Figs. 1F-H corresponds to the zero-growth isoclines. The authors should directly point it out in the figure captions and text descriptions.

      We thank the reviewer for this suggestion, and we have followed it to address the issue.

      (2) After showing equations 1 or 2, I believe it will help readers understand the mechanism of equations by adding text such as "(see Fig. 1B)" to the sentences following the equations.

      We appreciate the reviewer's suggestion, and we have implemented it to address the issue.

      (3) Lines 12, 129 143 & 188: "at steady state" -> "at a steady state"

      (4) Line 138: "is doom to extinct" -> "is doomed to extinct"

      (5) Line 170: "intraspecific interference promotes species coexistence along with stochasticity" -> "intraspecific interference still robustly promotes species coexistence when stochasticity is considered"

      (6) Line 190: "The long-term coexistence behavior are exemplified" -> "The long-term coexistence behavior is exemplified"

      (7) Line 227: "the coefficient of variation was taken round 0.3" -> "the coefficient of variation was taken around 0.3"?

      (8) Line 235: "tend to extinct" -> "tend to be extinct"

      We thank the reviewer for all these suggestions, and we have implemented each of them to revise our manuscript.

      Reviewer #3 (Recommendations For The Authors):

      I think this would be a much more useful paper if the authors focused on how the behavior of this model differs from existing models rather than showing that the new formation also generates the same dynamics as the existing theory.

      We thank the reviewers for this suggestion, and we apologize for not explaining the limitations of the B-D model and the related studies on the topic of CEP clearly enough at the time of our initial submission. As we have explained in the responses above, we have now revised the introduction part of our manuscript (lines 5167 in the main text) to make it clear that since the functional response in the B-D model can be derived from the scenario involving only chasing pairs without consideration of pairwise encounters between consumer individuals, while we have demonstrated that a scenario involving only chasing pairs is under the constraint of CEP, it is thus highly questionable regarding the validity of the studies relying on the B-D model to break CEP or explain the paradox of the plankton. Consequently, one of the major objectives of our manuscript is to resolve whether the mechanism of intraspecific interference can truly break CEP and explain the paradox of the plankton in a rigorous manner. By modeling from a mechanistic perspective, we resolve the above issues and quantitatively illustrate a broad spectrum of experimental results, including two classical experiments that violate CEP and the rank-abundance curves across diverse ecological communities.

      Things that would be of interest:

      What are the conditions for coexistence in this model? Presumably, it depends heavily on the equilibrium abundances of the consumers and resources as well as the engagement times/rates.

      We thank the reviewer for raising this question. We have shown that there is a wide range of parameter space for species coexistence in our model. Specifically, for the case involving two consumer species and one resource species (S<sub>C</sub> = 2 and S<sub>R</sub> \= 1), we have conducted a systematic study on the parameter region for promoting species coexistence. For clarity, we set the mortality rate 𝐷<sub>i</sub> (i = 1, 2) as the only parameter that varies with the consumer species, and the order of magnitude of all model parameters was estimated from behavioral data. The results for scenarios involving intraspecific predator interference are shown in Appendix-figs. 4B-D, 5A, 6C-D and we redraw some of them here as Fig. R2, including both ODEs and SSA results, wherein Δ = (𝐷<sub>1</sub>-𝐷<sub>2</sub>)/ 𝐷<sub>2</sub> represents the competitive difference between the two consumer species. For example, Δ =1 means that species C2 is twice the competitiveness of species C<sub>1</sub>. In Fig. R2 (see also Appendix-figs. 4B-D, 5A, 6C-D), we see that the two consumer species can coexist with a large competitive difference in either ODEs and SSA simulation studies.

      Author response image 2.

      The parameter region for two consumer species coexisting with one type of abiotic resource species (S<sub>C</sub> =2 and S<sub>R</sub> \=1). (A) The region below the blue surface and above the red surface represents stable coexistence of the three species at constant population densities. (B) The blue region represents stable coexistence at a steady state for the three species. (C) The color indicates (refer to the color bar) the coexisting fraction for long-term coexistence of the three species. Figure redrawn from Appendixfigs. 4B, 6C-D.

      For systems shown in Fig. 3A-D, where the number of consumer species is much larger than that of the resource species, we set each consumer species with unique competitiveness through a distinctive 𝐷<sub>i</sub> (i =1,…, S<sub>C</sub>). In Fig. 3A-D (see also Appendix fig. 10), we see that hundreds of consumer species may coexist with one or three types of resources when the coefficient of variation (CV) of the consumer species’ competitiveness was taken around 0.3, which indicates a large parameter region for promoting species coexistence.

      Is there existing data to estimate the parameters in the model directly from behavioral data? Do these parameter ranges support the hypothesis that predator interference is significant enough to allow for the coexistence of natural predator populations?

      We appreciate the reviewer for raising this question. Indeed, the parameters in our model were primarily determined by estimating their reasonable range from behavioral data. Following the reviewer's suggestions, we have now specified the data we used to set the parameters. For instance, in Fig. 2D, we set 𝐷<sub>2</sub>\=0.01 with τ=0.4 Day, resulting in an expected lifespan of Drosophila serrata in our model setting of 𝜏⁄𝐷<sub>2</sub>\= 40 days, which roughly agrees with experimental behavioral data showing that the average lifespan of D. serrata is 34 days for males and 54 days for females (lines 321325 in the appendices; reference: Narayan et al. J Evol Biol. 35: 657–663 (2022)). To account for competitive differences, we set the mortality rate as the only parameter that varies among the consumer species. As specified in the Appendices, the CV of the mortality rate is the only parameter that was used to fit the experiments within the range of 0.15-0.43. This parameter range (i.e., 0.15-0.43) was directly estimated from experimental data in the reference article (Patricia Menon et al., Water Research 37, 4151(2003)) using the two-sigma rule (lines 344-347 in the appendices).

      Given the high consistency between the model results and experiments shown in Figs. 2D-E and 3C-D, where all the key model parameters were estimated from experimental data in references, and considering that the rank-abundance curves shown in Fig. 3C-D include a wide range of ecological communities, there is no doubt that predator interference is significant enough to allow for the coexistence of natural predator populations within the parameter ranges estimated from experimental references.

      Bifurcation analyses for the novel parameters of this model. Does the fact that prey can escape lead to qualitatively different model behaviors?

      Author response image 3.

      Bifurcation analyses for the separate rate d’<sub>i</sub> and escape rate d<sub>i</sub> (i =1, 2) of our model in the case of two consumer species competing for one abiotic resource species (S<sub>C</sub> =2 and S<sub>R</sub> \=1). (A) A 3D representation: the region above the blue surface signifies competitive exclusion where C<sub>1</sub> species extinct, while the region below the blue surface and above the red surface represents stable coexistence of the three species at constant population densities. (B) a 2D representation: the blue region represents stable coexistence at a steady state for the three species. Figure redrawn from Appendix-fig. 4C-D.

      We appreciate the reviewer for this suggestion. Following this suggestion, we have conducted bifurcation analyses for the separate rate d’<sub>i</sub> and escape rate d<sub>i</sub> of our model in the case where two consumer species compete for one resource species (S<sub>C</sub> =2 and S<sub>R</sub> \=1). Both 2D and 3D representations of these results have been included in Appendix-fig. 4, and we redraw them here as Fig. R3. In Fig. R3, we set the mortality rate 𝐷<sub>i</sub> (i =1, 2) as the only parameter that varies between the consumer species, and thus Δ = _(D1-𝐷<sub>2</sub>)/𝐷<sub>2</sub> represents the competitive difference between the two species.

      As shown in Fig. R3A-B, the smaller the escape rate d<sub>i</sub>, the larger the competitive difference Δ tolerated for species coexistence at steady state. A similar trend is observed for the separate rate d’<sub>i</sub>. However, there is an abrupt change for both 2D and 3D representations at the area where d’<sub>i</sub> =0, since if d’<sub>i</sub> =0, all consumer individuals would be trapped in interference pairs, and then no consumer species could exist. On the contrary, there is no abrupt change for both 2D and 3D representations at the area where d<sub>i</sub>\=0, since even if d<sub>i</sub>\=0, the consumer individuals could still leave the chasing pair through the capture process.

      Figures: I found the 3D plots especially Appendix Figure 2 very difficult to interpret. I think 2D plots with multiple lines to represent predator densities would be more clear.

      We thank the reviewer for this suggestion. Following this suggestion, we have added a 2D diagram to Appendix-fig. 2.