What happens when every company has access to the same model? The best riders win.
大多数人认为AI差异化将来自底层模型的独特性,但作者认为当所有公司都能访问相同模型时,真正的竞争将在于'驾驭者'的能力。这挑战了AI战略中模型差异化的主流观点,暗示真正的竞争优势将来自于如何使用这些模型。
What happens when every company has access to the same model? The best riders win.
大多数人认为AI差异化将来自底层模型的独特性,但作者认为当所有公司都能访问相同模型时,真正的竞争将在于'驾驭者'的能力。这挑战了AI战略中模型差异化的主流观点,暗示真正的竞争优势将来自于如何使用这些模型。
Like a mustang, AI is powerful but wild. Harnessing the power means domestication.
大多数人将AI视为需要驯服的工具,但作者将其比作野生的马,暗示AI本质上是一种无法完全控制的自然力量。这种比喻挑战了AI作为完全可控工具的主流认知,暗示我们需要接受其不可预测性。
The end of the software era is the beginning of the harness era.
大多数人认为软件将随着AI而进化,但作者认为软件时代实际上已经结束,取而代之的是'驾驭'(harness)时代。这种观点挑战了技术发展的主流叙事,暗示我们正在从创造软件工具转向驯服AI系统。
The best advice I ever heard on pricing a product was that your customer should suck air through their teeth and then say yes. Uber's budget overrun and Microsoft's seat cancellations look like that effect playing out in practice.
大多数人认为AI成本超支是企业采用AI失败的迹象,但作者将其重新诠释为产品市场契合的证据。这一观点挑战了主流叙事,将企业的预算危机和取消服务视为定价成功的标志,而非AI失败的信号,这与大多数媒体报道的基调相反。
API revenue is becoming less important. Over the past two years my impression has been that OpenAI made more of their income from subscription revenue while Anthropic made more from their API.
大多数人认为AI公司的主要收入来源是API调用和订阅服务,但作者提出一个反直觉的观点:API收入正变得不那么重要。AI公司正在转向直接面向企业的产品,绕过中间商(如Cursor和GitHub Copilot),这改变了整个AI行业的商业模式和收入结构。
Coding agents really did change everything. These are tools which burn vastly more tokens, but are also quickly becoming daily drivers for the work carried out by extremely well-compensated professionals.
大多数人认为ChatGPT等通用AI助手已经实现了产品市场契合,但作者认为真正带来商业突破的是代码编写代理工具。这一观点挑战了主流认知,因为ChatGPT拥有数亿用户,而作者认为只有专业领域的代码代理才能创造足够的收入来支撑AI公司的巨额基础设施成本。
In this paper, we demonstrate that even the correlational data provides little support for a direct link between societal gender equality and psychological gender differentiation. After accounting for cultural confounds, we found no positive correlation and thereby no gender-equality paradox. What we find instead appears to be a Simpson’s paradox.If gender equality led men and women to express their innate differences, there is no a priori reason to expect different results when one compares Asian countries with each other, relative to when one compares Asian and Western countries, for instance.§§ In reality, however, the global association disappears or reverses within cultural clusters (i.e., a Simpson’s paradox).
neat!
The game becomes a battle of wits rather than a lottery of dice rolls.
Interestingly this kind of still allows for a battle of wits but in a fair way.
The Real Cost of Owning a Home
The worst job interview I ever had
.find()). Users debated whether failing to recall minor syntax during high-stress situations is a fair reason to disqualify candidates, noting that poor interviewers focus heavily on specific trivia while good interviewers focus on holistic engineering processes.As an example of what someone in this position might do, let’s consider this story from Steve Krenzel, who was a software engineer at Twitter from 2015-2017.
When I imagine putting myself in this situation, I imagine that it's terrifying to be able to flag an issue like this and escalate it to a higher authority. But it's also important to recognize that the work you do can cause huge rippling effects, many of which can be harmful. If Steve can do it, we can too!
While AI can enhance the defense and protection of civilians, it can also lower the threshold for the use of force, shield people from responsibility and foster a culture in which the enemy is reduced to a statistic and the victim to “collateral damage.”


The U.S. and Israel's air war with Iran has killed thousands since it started nearly three months ago. But few attacks have left a deeper mark than the strike on a school in Southern Iran on the war's opening day.
More than 150 people were killed when airstrikes hit the school in Minab, most of them children. And there is little dispute that the missiles were American-made.
Added to this invisible labor is the even harsher work of extracting the resources required for the production of the devices and microprocessors on which AI depends. In some regions of the world, children and adolescents work in dangerous conditions, crushing the materials from which rare earth elements are extracted. The bodies of these people are scarred, injured and worn down so that computational flow may continue uninterruptedly.
Sadly this has been the case long before what's currently known as AI existed.
move beyond the current metrics of development — which for more than eighty years have been tied to the concept of Gross Domestic Product (GDP) — since these metrics almost systematically neglect aspects essential to the overall wellbeing of people and the environment.
Human Development Index (HDI): Created by the UN, this index scores countries based on a geometric mean of three core capabilities: health (life expectancy), education, and standard of living (Gross National Income per capita).
Genuine Progress Indicator (GPI): This metric starts with economic data but adjusts it by adding positive factors (like volunteer work) and deducting social and environmental costs (such as crime, pollution, and the loss of natural resources).
Gross National Happiness (GNH): Pioneered by Bhutan, this evaluates sustainable development, cultural preservation, good governance, and community vitality rather than focusing strictly on material wealth.
The UN's Sustainable Development Goals (SDGs): A broader global dashboard of 17 indicators ranging from zero poverty and clean energy to gender equality.
The problem of unemployment
We definitely do not want to cause unemployment or lower the amount of faculty needed to teach, guide and mentor students. I also do not want to be engaged in a process that helps us reduce staff.
“while AI promises to boost productivity by taking over mundane tasks, it frequently forces workers to adapt to the speed and demands of machines, rather than machines being designed to support those who work. As a result, contrary to the advertised benefits of AI, current approaches to technology can paradoxically de-skill workers, subject them to automated surveillance and relegate them to rigid and repetitive tasks.
It can also force workers to deal with very tough and complex tasks all day, allowing for no breaks, when mundane tasks are automated. They might also need to review AI output and be overwhelmed by data generation.
Many educators already report signs of dehumanization, where people may “know many things” but struggle to find direction in their lives, partly due to an inability to connect information with deeper knowledge or maintain a sense of purpose.
cultivation a vocation in the students, approaching their growth holistically.
Without presuming to exhaust this theme, I would like to propose five paths toward daily and public responsibility: the need to disarm words, building peace through justice, adopting the perspective of victims, cultivating a healthy realism and reviving dialogue and multilateralism.
In the section 'We can all do our part"
When people limit themselves to looking only at their own sector, they may deceive themselves into believing they are performing actions that are morally neutral and avoid questions about the ultimate ends that guide certain experiments. In this way, they risk cooperating — perhaps unknowingly — with questionable projects that fuel new forms of violence, manipulation and dominance.
Interesting implied argument for the liberal arts toolbox.
These criteria give rise to certain non-negotiable requirements. First, all systems used in a war setting must guarantee the possibility of retracing and reconstructing decision-making processes, so that accountability and blame are not collapsed into “the machine.” Second, the decision to use lethal force cannot be delegated to opaque or automated processes, but must remain under effective, self-aware and responsible human control. Finally, it is imperative to establish a shared framework — also at the international level — in order to curb the technological arms race and ensure robust protection for civilians and the infrastructures necessary for their survival.
Criteria for the AI-assisted use of force. (Might be interesting to ask whether these should apply to non-war situations as well, like police or private security use of force.)
Today, more than ever, without prejudice to the right to self-defense in the strictest sense, it is important to reaffirm that the “just war” theory, which has all too often been used to justify any kind of war, is now outdated.
This is the guiding principle for technological processes: it is not enough for artificial intelligence to make us more efficient or connected; it must also serve to build a universal human family, with shared rights and duties, where digital proximity becomes a real opportunity for encounter and mutual care.
While AI can enhance the defense and protection of civilians, it can also lower the threshold for the use of force, shield people from responsibility and foster a culture in which the enemy is reduced to a statistic and the victim to “collateral damage.”
Interesting to connect these impacts to the "hybrid forms" of warfare 2 sentences above, like cyberattack and information ops.
Although there was not always consistency in practice — given that slavery was long tolerated before being unequivocally condemned — there has been a continuous affirmation throughout history of the dignity of every human being, created in the image of God, even if it took eighteen centuries for its full incompatibility with slavery to be explicitly recognized. This constitutes a wound in Christian memory, one from which we cannot consider ourselves detached. [176] It is impossible not to feel deep sorrow when contemplating the immense suffering and humiliation endured by so many in stark contrast to their immeasurable dignity as persons infinitely loved by the Lord. For this, in the name of the Church, I sincerely ask for pardon.
"Past popes have apologized for Christians’ involvement in the trans-Atlantic slave trade. But no pope has ever publicly acknowledged, much less apologized for, the role that past popes themselves played in giving European sovereigns explicit authority to subjugate and enslave “infidels.”" - NBC News
There is an urgent need to promote technologies that strengthen interior freedom by fostering education in digital sobriety
First time I've heard the term "digital sobriety"
For young people, job insecurity is particularly devastating.
Connects to the "pipeline problem" where AI solutions destroy entry-level jobs, thereby also destroying the path to midcareer jobs...
In practical terms, in the age of AI and robotics, ensuring that the economy favors human dignity means adopting certain criteria for firm action. First, transparency and accountability: when data and algorithms influence credit distribution, personnel selection or access to services and opportunities, it is necessary that decisions be understandable, contestable and subject to oversight, so that individuals are not reduced to mere profiles. Second, inclusion and access: the benefits of innovation must be paired with investments in skills, infrastructure and essential services to ensure that technology does not widen the gap between those who have and those who have not. Finally, measures to ensure equity: taxation, social protection and industrial policies must correct the imbalances created by the concentration of wealth and power. Indeed, these criteria do not constitute a curb on innovation; instead they make it civilized and humane.
Suggests regulation along the lines of algorithmic/data transparency & accountability, investing the profits of innovation in education and essential services, and laws and policies which check the concentration of wealth and power.
Finance for its own sake is fundamentally different from finance aimed at the development, creation and evolution of work.
Calling for investment, not speculation
One viable path is, first of all, to establish social criteria for innovation. Here, every introduction of automation and AI should be accompanied by verifiable measures to protect the employment, retraining and participation of workers. In this way, technology will be oriented toward freeing up human time and capabilities, rather than producing exclusion.
Work remains a fundamental dimension of the human experience, for not only is it a means of sustenance, but it is also a context for expression, relationships and contributing to the community. Therefore, the problems related to work extend beyond the income necessary for family survival. A society that guarantees employment to only a small fraction of the population, despite having a high level of technical development, risks exposing many to forced inactivity, a lack of responsibility and the absence of daily tasks and stimuli, resulting in human and cultural impoverishment.
Can't help but read this and think about retirees, children, homemakers, etc... how do things like "volunteering" or "chores" relate to "work" in this sense?
current approaches to technology can paradoxically de-skill workers, subject them to automated surveillance and relegate them to rigid and repetitive tasks. The need to keep up with the pace of technology can erode workers’ sense of agency and stifle the innovative abilities they are expected to bring to their work
Meanwhile, the organization of schools, physical spaces, evaluation methods and the role of teachers themselves must be rethought in order to promote an authentically integral education that addresses every dimension of the person.
Educating people about the use of AI, then, involves teaching them to decide when and for what purpose it ought not to be used. The speed and ease with which answers or summaries can be obtained risk extinguishing the desire to ask questions, which is a process that bears fruit only over time.
This section is connecting specific discernment about when AI is not the best tool for a given job (or as too central a part of an information diet) with a general avoidance of technology and specifically social media platforms.
We must therefore promote an ecology of communication. On the level of public policy, this entails establishing norms so that the decision-making behind content selection and its development becomes more transparent and protects personal data. Regarding social and cultural aspects, this requires a strengthening of intermediary organizations, serious journalism and forums for debate, where reasoned argumentation and verification carry greater weight than immediate reaction. For families and schools, there is a growing need for new educational awareness and for formation concerning the proper and critical use of digital tools, AI and online commercial and financial platforms. In universities, the principal challenge lies in the integration of knowledge, cultivating both the capacity to connect and synthesize knowledge in order to grasp complexity, and the skills necessary to verify facts.
In light of the principles of the Church’s Social Doctrine, the digital transformation invites us to rediscover truth as a common good, to protect the dignity of work and to safeguard freedom against all forms of dependence and commercialization.
Herein lies the radical departure from Promethean dreams: what saves humanity is not enhanced self-sufficiency, but a relationship that liberates, a communion that transforms.
One might as easily say Procrustean dreams.
the organization of schools, physical spaces, evaluation methods and the role of teachers themselves must be rethought in order to promote an authentically integral education that addresses every dimension of the person.
the old modality of lecture based classroom needs to be done away with, finally.
an anti-human vision. In that vision, the fullness of life is equated with having more, reducing weakness, eliminating uncertainty and exerting total control. When efficiency becomes the ultimate measure of value, human beings are tempted to see themselves as a project to be optimized rather than as persons called to relationship and communion.
The second major challenge is pedagogical. Many educational systems struggle to keep pace with change and to support the integral development of students. The advance of information technologies and AI is rapidly rendering curricula obsolete that were designed for a different era.
How do we maintain pedagogical effectiveness, excitement, and appreciation for learning, while constantly dealing with an ever changing technology paradigm? We can focus on fundamentals.
n many nations, Governments have not yet invested the necessary resources for guaranteeing a quality education for all, whether by adequately supporting the public school system or by assisting private institutions that offer this essential service. When a substantial portion of education, at various levels, is entrusted to private institutions, access to schooling may become overly dependent on families’ financial means, especially in the absence of adequate public support.
Properly funded public education or access to high quality private education is important to maintain an a truth-loving populace.
exercise restraint in the use of AI and to protect our young people from the promise of the perfect machine, from that subtle temptation which renders human thought seemingly superfluous precisely when it is most needed.
Big fan of being on the record as to not turn every class into a prompt engineering class.
As Plato wrote, the deepest and most important things are learned only after much time and effort, by engaging in discussion with others, “striking upon” ideas and experiences together like flint until the spark of understanding is kindled within us.
We continue to advocate for the proper use of discussion board activities. It is a shame we couldn't get the discussion boards done for Dr. George's class; but the factor of learner-to-learner or student-to-student interaction has to become a requirement in all courses. In order to successfully strike conversations and reach at the truth.
The speed and ease with which answers or summaries can be obtained risk extinguishing the desire to ask questions, which is a process that bears fruit only over time.
hmmm
Educating people about the use of AI, then, involves teaching them to decide when and for what purpose it ought not to be used.
what are the ethical boundaries of AI.
principal challenge lies in the integration of knowledge, cultivating both the capacity to connect and synthesize knowledge in order to grasp complexity, and the skills necessary to verify facts.
digital and informational literacy.
The content that circulates within digital environments shapes how people perceive the world and introduces into the collective consciousness images and narratives that direct our desires and influence our daily choices. This is “not a parallel or purely virtual world,” [145] since what originates online now becomes a part of people’s lives, especially of the youngest.
The internet is part of the real world and should be treated as such!
Our task today is not only ethical or technical. It is ecological in the deepest sense, for it concerns a new dimension of our common home. AI is already an environment in which we are immersed, as well as a force with which we must engage. For this reason, merely regulating it is insufficient; it must be disarmed, welcoming and accessible.
"Disarming" not merely as standing down from hostility and dominance but an active commitment to accessibility and hospitality.
Moreover, ownership of data cannot be left solely in private hands but must be appropriately regulated. Data is the product of many contributors and should not be treated as something to be sold off or entrusted to a select few. It is necessary to think creatively in order to manage data as a common or shared good, in a spirit of participation, as Saint John Paul II already suggested regarding collective goods. [128]
Data as a "collective good". (I suspect the fine points of the distinction between "public good" and "collective good" may be important here.)
For AI to respect human dignity and truly serve the common good, responsibility must be clearly defined at every stage: from those who design and develop these systems to those who use them and rely on them for concrete decisions. In many cases, however, the internal processes leading to a result remain opaque, making it harder to assign responsibility and correct errors. This is where accountability becomes crucial: the possibility of identifying who must “account” for decisions, justify them, monitor them, and, when necessary, challenge them and remedy any harm caused.
Passage starts with "For AI to respect" and ends with "identifying who must account for decisions". Rhetorically, starts from the premise that AI could respect but quickly changes focus from tool to designer/developer/user.
Here, the danger is not so much that a person may believe they are communicating with another person, but rather that they may gradually lose the very desire to form genuine human connections.
Connect to other parts of the document which are trying to thread the needle between individual choices and social identities and group rights. And maybe also to the concentration of platform power. It's a problem when people try to opt out of sharing not only our goods but our personhood.
Even when these tools are described as capable of “learning,” their way of doing so is different from that of a human person. It is not the experience of those who allow themselves to be shaped by life and grow over time through choices, mistakes, forgiveness and fidelity. Rather, it is a form of statistical adaptation based on data and feedback, which can be very effective, but does not imply inner growth.
Whole paragraph is good on the difference between "data processing" by AI and human intelligence/understanding/wisdom. Really intrigued here by the idea that forgiveness and fidelity are keys to learning.
Faced with this concentration of power in the digital world, the criteria for judgment and discernment in this new situation are the noble principles of Social Doctrine: the inalienable dignity of the human person, the common good, the universal destination of goods, subsidiarity, solidarity and social justice. They demand that we assess whether the power of digital infrastructures and algorithms truly fosters participation and responsibility, protects the vulnerable, ensures fair access to opportunities and remains directed toward the good of all.
If technological development advances without a corresponding ethical and social progress, the result may be an increase in means without a growth in humanity: “having more” without “being more.”
Again, the call for discernment rather than providing stable answers.
More power does not necessarily imply something better. In this respect, the words of Romano Guardini remain relevant: “Contemporary man has not been trained to use power well.”
Interesting challenge there for education. How should we be teaching (training?) each other "to use power well"?
In his Encyclical Laudato Si’, Pope Francis denounced the growing dominance of a technocratic paradigm [119] in our globalized world: the tendency to let the logic of efficiency, control and profit alone shape personal, social and economic decisions.
I am convinced that the concrete way of living out social relationships in the light of the Gospel is not established once and for all, but remains a task entrusted, from generation to generation, to the Christian community.
The whole encyclical is doing interesting work explicating deep principles for ethical behavior while acknowledging the need for individual actions to be evaluated in context.
Todd Spangler. Elon Musk Says He’s ‘Obviously Overpaying’ for Twitter in \$44 Billion Deal but Sees Huge Upside Long-Term. Variety, October 2022. URL: https://variety.com/2022/digital/news/elon-musk-twitter-obviously-overpaying-deal-1235409500/ (visited on 2023-12-10).
Interesting he said this because the long term change he was talking about is using the platform for political influence. If a political figure can use a huge platform like this to their advantage, then they might be against putting heavy restrictions on the platform because it doesn't help them. It's situations like these that cause problems for everyone.
Version 3 of this preprint has been peer-reviewed and recommended by Peer Community in Ecology.<br /> See the peer reviews and the recommendation.
So, what Meta does to make money (that is, how shareholders get profits), is that they collect data on their users to make predictions about them (e.g., demographics, interests, etc.). Then they sell advertisements, giving advertisers a large list of categories that they can target for their ads.
Exploitation by big companies like this is very harmful to the public in more ways than one. I also feel that this issue is deeply political. Big companies like to lobby the government to try to get policies turned to their favor. But these policies are what would keep the public safe. But currently, it works more in favor of big companies.
enumeration
the action of establishing a count or making a detailed, ordered list of items.
Skoove, Piano Marvel, Flowkey and the ABRSM tools use standard staff notation; Simply Piano uses a scrolling-note display rather than fixed staff.
Skoove, Piano Marvel, Flowkey, and the ABRSM tools use standard staff notation; Simply Piano uses a scrolling-note display rather than fixed staff.
the teacher's involvement and whether
the teacher's involvement, and whether
Because Soundslice notation depends on what the teacher imports, it presents whatever the source score uses, which for piano repertoire is standard staff. It works in any browser, so acoustic compatibility is a non-issue: the student simply plays and records. The cost is time, as the setup investment is significant and Soundslice is not suitable for independent student use without that teacher preparation.
Because Soundslice notation depends on what the teacher imports, it presents whatever the source score uses, which, for piano repertoire, is standard staff. It works in any browser, so acoustic compatibility is not an issue: the student simply plays and records. The cost is time, as the setup investment is significant, and Soundslice is not suitable for independent student use without that teacher preparation
Teacher visibility is the point of Soundslice, and it is the deepest here in one specific sense: the content is fully teacher-authored, students submit
Teacher visibility is the upside of Soundslice, and it is the deepest here in one specific sense: the content is fully teacher-authored. Students submit
Instead a teacher imports scores from MusicXML, PDF or other standard notation formats, then adds looping, slow-down and part-muting tools, and can sync their own recording against the score so the student hears exactly how a passage should sound.
Instead, a teacher imports scores from MusicXML, PDF, or other standard notation formats, then adds looping, slow-down, and part-muting tools, and can sync their own recording with the score, giving students a reference for interpretation, timing, and phrasing directly from their teacher rather than an algorithm.
The ABRSM Digital Tools are exam-preparation apps rather than general practice platforms, and for ABRSM candidates they are precisely targeted at the syllabus. Rather than one app, ABRSM offers five separate tools at £4.99 to £7.99 each, all directly aligned to the 2025/2026 ABRSM syllabus.
The ABRSM Digital Tools are exam-preparation apps rather than general practice platforms, and are designed specifically around the ABRSM syllabus. Rather than a single app, ABRSM offers five separate tools priced between £4.99 and £7.99 each, all directly aligned with the 2025/2026 ABRSM syllabus.
Simply Piano is the most effective onboarding tool here for absolute beginners, while being the weakest on notation literacy. It uses a scrolling-note display that moves towards a keyboard graphic rather than standard staff notation, so a student learns to follow the app's visual cue rather than to read fixed staff
Simply Piano is the most effective onboarding tool here for absolute beginners, but also the weakest in developing notation literacy. It uses a scrolling-note display that moves towards a keyboard graphic instead of standard staff notation, so a student learns to follow the app's visual cue rather than read fixed notation.
The app shows standard notation alongside professional hand-video clips that demonstrate fingering, which is genuinely useful for students who learn by watching as well as reading.
The app shows standard notation alongside professional hand-play video clips that demonstrate fingering, which is genuinely useful for students who learn by watching as well as by reading
Piano Marvel is the platform for a teacher who wants direct curriculum control and whose students play on MIDI instruments.
Piano Marvel is the platform for a teacher who wants direct curriculum control and whose students play on MIDI-enabled instruments.
Where Skoove offers least is teacher visibility: there is no dashboard, so a teacher cannot assign specific lessons or see practice logs from inside the app. In practice this suits a model where the student drives independent practice and the teacher checks results in the lesson
Where Skoove offers the least is teacher visibility: there is no dashboard, so a teacher cannot assign specific lessons or see practice logs from inside the app. In practice, this suits a model in which the student drives independent practice, and the teacher checks the results during the lesson.
rhythm correction and acoustic playing in one app without asking the teacher to configure anything
rhythm correction, and acoustic playing in one app without asking the teacher to configure anything
Students will use practice apps with or without a teacher's recommendation, so the only useful question is which ones support what happens in lessons rather than working against it. Consumer reviews optimise for song libraries and star ratings, metrics that say little about whether a student arrives able to read music or keep time. A working teacher needs four narrower answers: does the app build notation literacy, does it correct rhythm and not just pitch, does it function on an ordinary acoustic piano, and can the teacher see and shape home practice. This comparison applies those four criteria to all six platforms, in the same way, so the differences between them are visible at a glance.
Students will use practice apps with or without a teacher's recommendation, so the only useful question is not which apps are popular, but which ones support what happens in lessons rather than work against it. Consumer reviews tend to optimise for song libraries and star ratings, metrics that say little about whether a student arrives able to read music or keep time.
A working teacher needs four narrower answers: does the app build notation literacy, does it correct rhythm as well as pitch, does it function on an ordinary acoustic piano, and can the teacher see and shape home practice? This comparison consistently applies the four criteria to all six platforms, so the differences between them are visible at a glance.
Utilizing the region’s many waterways, they developed trade routes stretching from Canada to Louisiana.
What does the Hopewell cultures trade networks show about how advanced their society was?
To feed its population, Tenochtitlán invented Chinampas: floating gardens built on barges made of reeds and filled with fertile soil. Lake water constantly irrigated these chinampas, which are still in use and can be seen today in the Xochimilco district of Mexico City.
I thought this was interesting.
And some of our soldiers even asked whether the things that we saw were not a dream?
What made Tenochtitlan seem so impressive and unusual to the Spanish soldiers?
Sea levels were about 360 feet lower than they are at present, so a landmass as wide as Alaska was exposed that connected what is now eastern Siberia with what is now western North America
How did the lower sea levels during the ice age make it possible for people to migrate from Asia to North America?
SV inventories,
But we do want some database structure for the content.
Give both tools the same one-hour task: create a sample template_map.csv from three approved, non-confidential documents and produce a lawyer-readable Markdown summary. Compare setup friction, edit quality, citations to source files, and how easy it is to resume the work later.
this seems like a good test
Qualitative card sorts help researchers understand why users place cards into specific groupings. Researchers often ask users to think out loud to understand their mental models and the reasons behind their groupings. Researchers need to recruit at least 15 participants for this approach. Quantitative card sorts help researchers understand the statistical validity of common groupings. It focuses on how many times people grouped certain cards together. For quantitative studies, we recommend at least 30–50 participants to ensure that results are generalizable to a broader population. If you still aren’t seeing consistent patterns, recruit more participants for the study. Recruiting participants who represent your target audience or current user base is crucial. Aim for a diverse set of participants to ensure a representative sample.
Both of these types of card sorts are very important in their own ways with both giving out different results and different understandings.
e impersonal, sometimes characterized as “dismissive and arrogant”
can we get rid of the extra space between sometimes and characterized?
any of the early academic studies of religion in the USSR focused on the repression of religious institutionsand believers—and for good reason. Soviet Communism devastated religious life in the USSR. The Bolsheviksdestroyed religious institutions, nationalized religious property, imprisoned and murdered clergy andbelievers, uprooted religious communities, and con�ned religious life to an increasingly narrow private spher
GOOD FOR EMA!
n his in�uential book The Origin of Russian Communism, originally publishedin 1937, Berdiaev wrote that Communism’s “militant atheism” and “implacably hostile attitude” to religion was“no accidental phenomenon,” but “the very essence of the communist general outlook on life.”
Communists sought to replace christian religious participation for secular participation
eLife Assessment
This manuscript presents a useful mean-field model for a network of Hodgkin-Huxley neurons retaining the equations for ion exchange between the intracellular and extracellular space. The mean-field model derived in this work relies on approximations and heuristic arguments that, on the one hand, allow a closed-form derivation of the mean-field equations, but also raise questions about their justifications and the degree to which the results agree with experiments as well as direct numerical simulations. While the revised manuscript is much improved, reviewers continue to question the methodology for reducing model dimensionality and therefore the evidence for the utility of this approach remains incomplete at present.
Reviewer #1 (Public review):
Summary:
In this manuscript the authors derive a mean-field model for a network of Hodgkin-Huxley neurons retaining the equations for ion exchange between the intracellular and extracellular space.<br /> The mean-field model derived in this work relies on approximations and heuristic arguments that, on the one hand, allow a closed-form derivation of the mean-field equations, and on the other hand restrict its validity to a limited regime of activity corresponding to quasi-synchronous neuronal populations. Therefore, rather than an exact mean-field representation, the model provides a description of a mesoscopic population of connected neurons driven by ion exchange dynamics.
Strengths:
The idea of deriving a mean-field model which relates the slow-timescale biophysical mechanism of ion exchange and transportation in the brain to the fast-timescale electrical activities of large neuronal ensembles.
Weaknesses:
The idea underlying this work is not completely implemented in practice.
The derived mean field model do not show a one-to-one correspondence with the neural network simulations, except in strongly synchronous regimes. The agreement with the in vitro experiment is hardly evident, both for the mean-field model and for the network model. The assumptions made to derive the closed-form equations of the mean field model have not been justified by any biological reason, they just allow for the mathematical derivation. The final form of the mean-field equations do not clarify whether or not microscopic variables are used together with macroscopic variables in an inconsistent mixture.
Comments on revisions:
The main weaknesses I listed in the first report are still present, since the authors did not answer my questions on a solid basis. I report the list for completeness:
(1) It seems that the reduction methodology that is employed is not the most suitable one for the single-neuron model they are considering.<br /> (2) The formulation of the mean-field derivation is unnecessarily complicated. It could be heavily simplified by following previously published approaches to derive biologically realistic neural masses.<br /> (3) The model seems to work only for highly synchronized situations and not for the standard asynchronous evolution usually observed in neural circuits.
Therefore, my statement remains unchanged.
Reviewer #2 (Public review):
Summary:
The authors aiming in developing a neural mass model characterized by few collective variables mimicking the dynamics of a network of Hodgkin - Huxley neurons encompassing ion-exchange mechanisms. They describe in details the derivation of the mean-field model , then they compare experimental results obtained for the hippocampus of a mice with the neural network simulations and the mean-field results. Furthermore, they report a bifurcation analysis of the developed model and simulation of a small network containing various coupled neural masses, somehow moving towards the simulation of an entire connectome.
Strengths:
The author attempts to develop a mean-field model for a globally coupled network of heterogeneous Hodgkin-Huxley neurons with explicit ion exchange mechanism between the cell interior and exterior.
Weaknesses:
(1) They do not employ the reduction methodology more suited for the single neuron model they consider.<br /> (2) Their derivation of the neural mass model is based on several assumptions, and not all well justified.<br /> (3) Their formulation of the mean-field derivation is unnecessary complicated, it can be strongly simplified by following previously published approaches to derive biologically realistic neural masses.<br /> (4) Their model seems to work only for highly synchronized situations and not for the standard asynchronous evolution usually observed in neural circuits.
General Statements:
The authors honestly declared the many limitations of their approach, once assumed this the results of the mean-field are somehow inconsistent with the neural network simulations as expected.
The authors suggest to employ this model for the simulations on the whole connectome to follow seizure propagation, however I believe that a simpler model, as the Epileptor, remains superior in this respect to this model. That indeed includes biophysical parameters but their correspondence with the ones employed in the network dynamics remain elusive, due to the many assumptions required to derive this mean field model. Furthermore it is more complicated than the Epileptor, I do not think that the present model will be largely employed by the community.
Comments on revisions:
The authors have corrected mistakes present in the manuscript and put a correct list of references.
However, they refuse
(1) To simplify the formulation of the model, the model contains unnecessary complications, as I have clearly written in my report, the authors agree, but they do not want to change the formulation;
(2) To derive the mean field model in a simpler way, as possible, and as I asked many times in my Referee report, this would help the readers to understand the important aspect of the derivation, without not needed and confusing complicated formulations;
(3) To compare direct simulations of the network with neural mass results in sub-section "Bifurcation analysis: emergent network states and multistability" to show bistability, as I asked.
As a matter of fact the performed modifications do not solve my previous doubts on the validity of the results reported in the manuscript.
Therefore, my previous assessments remain valid.
Author response:
The following is the authors’ response to the current reviews.
Reviewer #1 (Public review)
Summary:
In this manuscript the authors derive a mean-field model for a network of Hodgkin-Huxley neurons retaining the equations for ion exchange between the intracellular and extracellular space.
The mean-field model derived in this work relies on approximations and heuristic arguments that, on the one hand, allow a closed-form derivation of the mean-field equations, and on the other hand restrict its validity to a limited regime of activity corresponding to quasi-synchronous neuronal populations. Therefore, rather than an exact mean-field representation, the model provides a description of a mesoscopic population of connected neurons driven by ion exchange dynamics.
Strengths:
The idea of deriving a mean-field model which relates the slow-timescale biophysical mechanism of ion exchange and transportation in the brain to the fast-timescale electrical activities of large neuronal ensembles.
Weaknesses:
The idea underlying this work is not completely implemented in practice.
The derived mean field model do not show a one-to-one correspondence with the neural network simulations, except in strongly synchronous regimes. The agreement with the in vitro experiment is hardly evident, both for the mean-field model and for the network model. The assumptions made to derive the closed-form equations of the mean field model have not been justified by any biological reason, they just allow for the mathematical derivation. The final form of the mean-field equations do not clarify whether or not microscopic variables are used together with macroscopic variables in an inconsistent mixture.
Comments on revisions:
The main weaknesses I listed in the first report are still present, since the authors did not answer my questions on a solid basis. I report the list for completeness:
(1) It seems that the reduction methodology that is employed is not the most suitable one for the single-neuron model they are considering.
(2) The formulation of the mean-field derivation is unnecessarily complicated. It could be heavily simplified by following previously published approaches to derive biologically realistic neural masses.
(3) The model seems to work only for highly synchronized situations and not for the standard asynchronous evolution usually observed in neural circuits.
Therefore, my statement remains unchanged.
Reviewer #2 (Public review)
Summary:
The authors aiming in developing a neural mass model characterized by few collective variables mimicking the dynamics of a network of Hodgkin - Huxley neurons encompassing ion-exchange mechanisms. They describe in details the derivation of the mean-field model , then they compare experimental results obtained for the hippocampus of a mice with the neural network simulations and the mean-field results. Furthermore, they report a bifurcation analysis of the developed model and simulation of a small network containing various coupled neural masses, somehow moving towards the simulation of an entire connectome.
Strengths:
The author attempts to develop a mean-field model for a globally coupled network of heterogeneous Hodgkin-Huxley neurons with explicit ion exchange mechanism between the cell interior and exterior.
Weaknesses:
(1) They do not employ the reduction methodology more suited for the single neuron model they consider.
(2) Their derivation of the neural mass model is based on several assumptions, and not all well justified.
(3) Their formulation of the mean-field derivation is unnecessary complicated, it can be strongly simplified by following previously published approaches to derive biologically realistic neural masses.
(4) Their model seems to work only for highly synchronized situations and not for the standard asynchronous evolution usually observed in neural circuits.
General Statements:
The authors honestly declared the many limitations of their approach, once assumed this the results of the mean-field are somehow inconsistent with the neural network simulations as expected.
The authors suggest to employ this model for the simulations on the whole connectome to follow seizure propagation, however I believe that a simpler model, as the Epileptor, remains superior in this respect to this model. That indeed includes biophysical parameters but their correspondence with the ones employed in the network dynamics remain elusive, due to the many assumptions required to derive this mean field model. Furthermore it is more complicated than the Epileptor, I do not think that the present model will be largely employed by the community.
Comments on revisions:
The authors have corrected mistakes present in the manuscript and put a correct list of references.
However, they refuse
(1) To simplify the formulation of the model, the model contains unnecessary complications, as I have clearly written in my report, the authors agree, but they do not want to change the formulation;
(2) To derive the mean field model in a simpler way, as possible, and as I asked many times in my Referee report, this would help the readers to understand the important aspect of the derivation, without not needed and confusing complicated formulations;
(3) To compare direct simulations of the network with neural mass results in sub-section "Bifurcation analysis: emergent network states and multistability" to show bistability, as I asked.
As a matter of fact the performed modifications do not solve my previous doubts on the validity of the results reported in the manuscript.
Therefore, my previous assessments remain valid.
We thank the editors and the two reviewers for their continued engagement with our manuscript. The three weaknesses retained from the first round are essentially identical between the two public reviews:
(i) The reduction methodology is not the most suitable for the single-neuron model we consider;
(ii) The mean-field derivation is unnecessarily complicated;
(iii) The model works only in highly synchronous regimes and does not reproduce the asynchronous evolution typical of neural circuits.
Both reviewers explicitly note that their assessments remain unchanged and we have decided not to alter the formulation of the model. We use this response to state—on the public record—exactly where we agree with the reviewers, where we disagree, and why.
On point (i): the reduction methodology.
We fully agree with the reviewers' technical observation: the Ott–Antonsen / Lorentzian-ansatz reduction in the form introduced by Montbrió, Pazó and Roxin (2015) is exact for canonical Type I neurons (QIF), whose membrane-potential equation is quadratic, and is not directly applicable to a Type II / Hodgkin–Huxley-type neuron whose voltage dynamics is cubic-like. On this point there is no disagreement.
Where we differ is in the conclusion the reviewers draw from this observation. The reviewers read our work as applying an inappropriate reduction methodology to an inappropriate neuron model. We instead positioned our work, from the outset, as an extension of that methodology: we keep the biophysically detailed Hodgkin–Huxley substrate (because it is the only level at which extracellular ion concentrations, depolarization block, bursting and seizure-like events are biophysically grounded), and we adapt the reduction by approximating the cubic voltage nullcline as a piece-wise quadratic with two parabolas of opposite curvature. This is explicitly an approximate, not exact, mean-field. The Lorentzian ansatz is then applied on each branch of the piece-wise quadratic, with the limitations of this construction analyzed in the manuscript.
The reviewers' alternative—starting from a Type I canonical model and grafting on biophysical features—would indeed yield an exact mean-field, but it would forfeit precisely what motivates our work: a tractable mesoscopic description in which the slow variables are physiologically interpretable ion concentrations rather than phenomenological parameters. The trade-off is that we give up exact rigour in order to construct a bridge between the Montbrió-style next-generation neural mass models on one side and the Epileptor on the other, with the additional benefit that the parameters of the resulting neural mass retain a biophysical correspondence (e.g., [K<sup>+</sup>]_bath, Δ[K<sup>+</sup>]_int, [K<sup>+</sup>]_g, the gating variable n) that the Epileptor does not afford.
We therefore respectfully maintain our position: the methodology is not "the wrong reduction for a Type II neuron"; it is an extended reduction designed to be applicable beyond the Type I case, with explicitly characterized validity.
On point (ii): the formulation is unnecessarily complicated.
We agree with the reviewers that, given the assumptions we ultimately adopt, namely that the gating variable n and the potassium concentrations Δ[K<sup>+</sup>]_int and [K<sup>+</sup>]_g are treated as collective (mesoscopic) variables shared by the population, with n a function of the average membrane potential, the closed neural mass equations could be reached by the more direct path used by Guerreiro et al. (2022) and the related literature (R1–R7). In the revised manuscript we now state this explicitly, and we note that the same five-dimensional system arises under either derivation.
Our choice to follow Chen and Campbell (2022) is motivated by the fact that it makes each approximation visible at the point where it is invoked. In particular, it exposes the moment-closure step (Eq. 19), the vanishing-flux boundary condition (Eq. 28), and the locations where microscopic and mesoscopic variables enter the description. We believe that for a reader trying to extend our framework, for instance to a setting with partial heterogeneity in the slow variables, or with stochastic gating, this is the more useful presentation. We have added a remark stating that the simpler Guerreiro-type derivation reaches the same equations under our assumptions, so that readers can take whichever route they find clearer.
On point (iii): the model only works in highly synchronous regimes.
Here we partially agree and partially disagree, and we would like the partial disagreement to appear on the public record.
We agree that the Lorentzian ansatz is, strictly, valid in regimes where the population's membrane potential distribution is unimodal, that is, when essentially all neurons sit on the same side of the threshold V*. Where we disagree is with the implication that the mean-field model fails outside the strongly synchronous regime. The supplementary analysis in Fig. S2, added in the previous round, quantifies the error introduced by the first-moment approximation of n as a collective variable across the full range of [K<sup>+</sup>]_bath values, spanning quiescent, bursting, seizure-like, sustained ictal and depolarization-block dynamics. The fraction of neurons whose gating variable deviates from the population mean is below 2% for the parameters used throughout the manuscript, and the error becomes appreciable only during the brief transitions between sub- and supra-threshold states. These are precisely the moments at which the population is genuinely bimodal and the single-Lorentzian assumption is theoretically expected to leak. In other words, the error peaks coincide with the moments where our derivation tells us in advance that the assumption is locally invalid; the model "knows where it fails." Away from these transitions, the mean-field tracks the population average across all dynamical regimes shown in Fig. 3, not only in the most strongly synchronized ones.
This is, in our view, the strongest argument we can make: we are not claiming exactness, and we are not unaware of the limitations. We have characterized them analytically (the construction of the piece-wise Lorentzian, and the theoretical reason a closed solution exists only when the two branches collapse onto one), and we have characterized them numerically (Fig. S2). The deviations are bounded, their location in parameter space is well identified, and they coincide with transitions where the underlying assumption is locally violated. We believe this constitutes a controlled approximation rather than an uncontrolled one, and we would like this distinction to be visible to readers of the Reviewed Preprint.
We note, in this connection, that the reviewers' preferred reference point, the next-generation neural mass model of Montbrió et al. (2015), which is exact and one-to-one with its underlying network, is exact precisely because the underlying network is a network of QIF neurons. The corresponding statement for a network of Hodgkin–Huxley-type neurons with explicit ion exchange does not, to our knowledge, exist in closed form, and may not exist at all. The relevant question is therefore not whether our model matches the exactness of the QIF case, but whether the controlled approximation we provide is useful. Given the qualitative agreement with neural-network simulations across the full range of [K<sup>+</sup>]_bath, the qualitative agreement with the in vitro recordings, and the recovery of the expected bifurcation structure with new emergent regimes, we believe the answer is yes.
Other outstanding points in the review.
Reviewer 2 reiterates the view that the Epileptor remains superior for whole-connectome seizure-propagation simulations because it is simpler and better characterized. We do not dispute that the Epileptor is more thoroughly analyzed and more parsimonious. The complementarity we propose is not a replacement but a parameter-grounding, as the Epileptor's phenomenological parameters (excitability, slow permittivity) acquire, in the present framework, an interpretation in terms of measurable biophysical quantities (extracellular potassium, intracellular potassium variation, glial buffering).
We thank the reviewers and editors once again for their careful reading, and we are grateful that the points of disagreement have been sharpened to a state where readers can judge them transparently.
The following is the authors’ response to the original reviews.
Public Reviews:
Reviewer #1 (Public review):
Summary:
In this manuscript, the authors derive a mean-field model for a network of Hodgkin-Huxley neurons retaining the equations for ion exchange between the intracellular and extracellular space.
The mean-field model derived in this work relies on approximations and heuristic arguments that, on the one hand, allow a closed-form derivation of the mean-field equations, and on the other hand restrict its validity to a limited regime of activity corresponding to quasi-synchronous neuronal populations. Therefore, rather than an exact mean-field representation, the model provides a description of a mesoscopic population of connected neurons driven by ion exchange dynamics.
We agree with the reviewer's characterization. Our manuscript describes the derivation as relying on "approximations and heuristic arguments" and states that "the derivation is not exact"; what we provide is a controlled, approximate mesoscopic description in which the slow variables are physiologically interpretable ion concentrations rather than phenomenological parameters. An exact closed-form thermodynamic limit is, to our knowledge, available only for canonical Type I (QIF) networks (Montbrió, Pazó and Roxin, 2015) and a few of their extensions; it is not currently known for a Hodgkin–Huxley-type network with explicit ion-exchange dynamics. We acknowledge that the original description of the regime of validity may have caused confusion on this point, and in the revised manuscript we have therefore replaced the looser formulation "strongly synchronous regimes" by the more accurate "regimes where the membrane-potential distribution is unimodal and can be reasonably approximated by a Lorentzian" throughout the manuscript.
Strengths:
The idea of deriving a mean-field model that relates the slow-timescale biophysical mechanism of ion exchange and transportation in the brain to the fast-timescale electrical activities of large neuronal ensembles.
We thank the reviewer for recognizing the motivation behind our work. This explicit coupling between slow biophysical ion dynamics and fast electrical activity is precisely the feature we tried to preserve in the reduction, even at the cost of giving up exactness.
Weaknesses:
The idea underlying this work is not completely implemented in practice.
We address this general statement through the four specific sub-points the reviewer raises in the paragraph that follows.
The derived mean field model does not show a one-to-one correspondence with the neural network simulations, except in strongly synchronous regimes.
We partially agree and partially disagree. We agree that the Lorentzian ansatz is strictly valid where the membrane-potential distribution is unimodal, i.e. when essentially all neurons sit on the same side of the threshold V*. We disagree with the implication that the mean-field fails outside this regime. To make this claim quantitative, we added a new supplementary figure (Fig. S2) that quantifies the deviation of individual neurons' gating variables from the population mean across the full range of [K<sup>+</sup>]_bath values—quiescent, bursting, seizure-like, sustained ictal and depolarization-block dynamics. The fraction of deviating neurons is below 2% for the parameters used in the manuscript, with localized peaks only during the brief, genuinely bimodal transitions between sub- and supra-threshold states—precisely the moments at which the theory predicts the assumption to be locally invalid. Away from these transitions, the mean-field tracks the population average across all dynamical regimes shown in Fig. 3, not only in the strongly synchronized ones.
The agreement with the in vitro experiment is hardly evident, both for the mean-field model and for the network model.
We acknowledge that the experimental and simulated traces in the original Fig. 4 did not match quantitatively; this was never our intention. The figure and its caption have been reorganized in the revised manuscript to frame the comparison as qualitative: we aim to demonstrate the shared structure i.e., the slow modulation of fast population activity by extracellular potassium fluctuations, rather than to claim a quantitative fit.
We also added two clarifications that account for the residual differences: (i) the network simulations were intentionally run with rescaled biophysical parameters (membrane capacitance, gating time constants) to keep the computational cost feasible, a standard practice when the goal is to validate dynamical mechanisms rather than absolute timescales; (ii) the in vitro LFP recordings were AC-coupled, so the slow DC components visible in the mean-field traces are filtered out at acquisition.
The assumptions made to derive the closed-form equations of the mean-field model have not been justified by any biological reason, they just allow for the mathematical derivation.
We agree that the modelling assumptions were scattered through the original derivation. In the revised manuscript, the three core assumptions are stated explicitly at the point of derivation: (i) the gating variable n is treated as a collective, population-averaged variable; (ii) the potassium concentrations Δ[K<sup>+</sup>]_int and [K<sup>+</sup>]_g are homogeneous across the population, biophysically justified by the rapid redistribution of ions through diffusion and electrochemical gradients, which enforces near-instantaneous equilibration at the mesoscopic scale; (iii) no heterogeneity is assumed at the level of ion dynamics. The meaning of "locally homogeneous" is now defined explicitly.
On the biophysical motivation of the in vitro perturbation used in the experiment, we have added a new Methods subsection that explains how low extracellular Mg<sup>2+</sup> unblocks NMDARs and abolishes the divalent-cation stabilisation of the resting membrane potential, depolarising hippocampal neurons and increasing the driving force for outward K<sup>+</sup> currents. This provides a biophysical link between the experimental perturbation and the model's main control parameter, the extracellular potassium concentration. We also added a reference to the well-established model of epileptic discharges that underpins the experiment.
The final form of the mean-field equations does not clarify whether or not microscopic variables are used together with macroscopic variables in an inconsistent mixture.
We now explicitly acknowledge that in the spiking-network simulations the gating variable n is microscopic (each neuron has its own n_i), whereas in the mean-field derivation it is treated as mesoscopic and shared by the population. This asymmetry between modalities is discussed both in the Results and in the Limitations sections, and is identified as a likely source of some of the discrepancy between the two modalities.
We have also made the notation in Eqs. (36)–(37) consistent (firing rate r used throughout, full current-based dV/dt̄ restored) and fixed the typos and broken equation/reference labels that contributed to the impression of inconsistency (Eqs. 18, 28, 29; the Fig. 2(c) [K<sup>+</sup>] bath label; the lost reference at line 696).
Reviewer #2 (Public review):
Summary:
The authors aim to develop a neural mass model characterized by a few collective variables mimicking the dynamics of a network of Hodgkin – Huxley neurons encompassing ion-exchange mechanisms. They describe in detail the derivation of the mean-field model, then they compare experimental results obtained for the hippocampus of a mouse with the neural network simulations and the mean-field results. Furthermore, they report a bifurcation analysis of the developed model and simulation of a small network containing various coupled neural masses, somehow moving towards the simulation of an entire connectome.
We thank the reviewer for the accurate summary of the manuscript's structure and aims.
Strengths:
The author attempts to develop a mean-field model for a globally coupled network of heterogeneous Hodgkin-Huxley neurons with an explicit ion exchange mechanism between the cell interior and exterior.
We thank the reviewer for recognizing this objective. The retention of Hodgkin–Huxley dynamics with explicit ion exchange is precisely the feature that distinguishes our framework from QIF-based reductions, and it is what enables the slow variables of the resulting mean-field to retain a direct biophysical interpretation.
Weaknesses:
(1) It seems that the reduction methodology that is employed is not the most suitable one for the single-neuron model they are considering.
We agree, on technical grounds, with the observation: the Ott–Antonsen / Lorentzian-ansatz reduction is exact for canonical Type I neurons (QIF) and is not directly applicable to a Type II Hodgkin–Huxley-type neuron with a cubic-like voltage nullcline. Where we differ is in the conclusion. We did not apply an inappropriate reduction to an inappropriate neuron; we deliberately extended the methodology by approximating the cubic nullcline as a piece-wise quadratic with two parabolas of opposite curvature, and then applying the Lorentzian ansatz on each branch. The result is an explicitly approximate, biophysically grounded mean-field, with its regime of validity stated and quantified (Fig. S2).
To make this positioning explicit, we have added a paragraph to the Introduction that situates our work within the next-generation neural mass literature (Byrne et al. 2020; Montbrió, Pazó & Roxin 2015; Guerreiro et al. 2022; Forrester et al. 2024; Perl et al. 2023; Gerster et al. 2021; and works on short-term plasticity, adaptation, conductance-based reductions,
spike-timing-dependent plasticity, random connectivity and noise) and clarifies that we see our contribution as complementary to these approaches, not as a competitor to the exact QIF reductions.
(2) The authors' derivation of the neural mass model is based on several assumptions, and not all well justified.
We agree that, in the original submission, the modelling assumptions were scattered through the derivation. In the revised manuscript, the three core assumptions are stated explicitly at the point of derivation: (i) the gating variable n is treated as a collective population-averaged variable; (ii) the potassium concentrations Δ[K<sup>+</sup>]_int and [K<sup>+</sup>]_g are homogeneous across the population, biophysically justified by the rapid redistribution of ions through diffusion and electrochemical gradients, which enforces near-instantaneous equilibration at the mesoscopic scale; (iii) no heterogeneity at the level of ion dynamics is assumed. The meaning of "locally homogeneous" is now defined explicitly. In addition, we have added Fig. S2, which quantifies numerically the error introduced by the moment-closure assumption (deviation below 2% for the parameters used in the manuscript).
(3) The formulation of the mean-field derivation is unnecessarily complicated. It could be heavily simplified by following previously published approaches to derive biologically realistic neural masses.
We agree that, under the assumptions ultimately adopted in our model—namely that n, Δ[K<sup>+</sup>]_int and [K<sup>+</sup>]_g are mesoscopic—the final five-dimensional system can be reached by the more direct path used by Guerreiro et al. (2022) and the related literature. We now state this explicitly in the revised manuscript and note that the same system arises under either derivation, so that the reader can take whichever route they find clearer. Our choice to retain the Chen and Campbell (2022) formalism is pedagogical: it exposes the moment-closure step (Eq. 19), the vanishing-flux boundary condition (Eq. 28), and the locations where microscopic versus mesoscopic variables enter the description, which is the more useful presentation for a reader wishing to extend the framework (e.g. to partial heterogeneity in the slow variables or to stochastic gating). We also made the notation in Eqs. (36)–(37) consistent (firing rate r used throughout, full current-based dV/dt̄ restored) and fixed a number of typos and broken equation/reference labels.
(4) The model seems to work only for highly synchronized situations and not for the standard asynchronous evolution usually observed in neural circuits.
We partially agree and partially disagree. We agree that the Lorentzian ansatz is strictly valid where the membrane-potential distribution is unimodal; we have replaced "strongly synchronous regimes" by this more accurate formulation throughout the manuscript. We disagree, however, with the implication that the mean-field is useful only in those regimes. Fig. S2, added in this revision, explicitly quantifies the deviation across all dynamical regimes (quiescent, bursting, seizure-like, sustained ictal and depolarization-block dynamics): it remains below 2% for the parameters used in the manuscript, with localized peaks only during the brief sub-to-supra-threshold transitions where the population is genuinely bimodal. Away from these transitions, the mean-field tracks the population average across all dynamical regimes shown in Fig. 3.
General Statements:
The authors honestly declared the many limitations of their approach. It is assumed that the results of the mean-field are somehow inconsistent with the neural network simulations as expected.
We thank the reviewer for acknowledging that the limitations are honestly declared. As detailed above and quantified in Fig. S2, the deviation from the network simulations is bounded and well characterized; it is not assumed but measured.
The authors suggest employing this model for the simulations on the whole connectome to follow seizure propagation, however, I believe that the Epileptor remains superior in this respect to this model. That indeed includes biophysical parameters but their correspondence with the ones employed in the network dynamics remains elusive, due to the many assumptions required to derive this mean-field model. Furthermore, it is more complicated than the Epileptor, I do not think that the present model will be largely employed by the community.
We do not propose our model as a direct replacement for the Epileptor and we do not dispute that the Epileptor is more thoroughly analyzed and more parsimonious. The complementarity we propose is not a replacement but a parameter-grounding: the Epileptor's phenomenological parameters (excitability, slow permittivity) acquire, in our framework, a concrete interpretation in terms of measurable biophysical variables (extracellular potassium, intracellular potassium variation, glial buffering). Retaining the Hodgkin–Huxley substrate is essential to ground these variables biophysically.
To make this complementarity more visible, the Limitations and Discussion section has been expanded to discuss the choice of a purely excitatory network as a first step (with excitatory–inhibitory generalizations available via the synaptic reversal potential) and to point to additional biological ingredients (calcium and other ions, plastic synapses, random connectivity and noise, adaptation, spike-timing-dependent plasticity) that the framework can accommodate, with reference to the next-generation neural mass literature.
We thank the reviewers and editors for their careful reading. We hope this public response makes our reasoning, the limits of our approach, and the concrete revisions made in this round transparent.
Recommendations for the authors:
Reviewer #1 (Recommendations for the authors):
(1) In general, the writing is scattered. Every time a model is introduced, one starts from the general formulation only to find that a very simplified case is used with respect to that formulation, which is very confusing. Authors need to reduce unnecessary formulations that confuse the reader and make it clear which formulations are actually used.
We thank the reviewer for this comment and understand the concern regarding the balance between general formulations and specific approximations. Our intention in including the more general equations and derivations (e.g., Eq. 7 and others) was pedagogical — to ensure completeness and transparency in the modeling steps, especially for readers less familiar with mean-field reductions of biophysically detailed models. These general forms also serve to clarify the assumptions underlying the simplifications we employ. In the latest version, we improved the clarity of core equations (e.g., Eq. 37), which form the basis of all simulations presented (see details below, in the answer to question 14).
(2) The Introduction would benefit from a wider view of the literature. The literature on exact mean field models (i.e. derived from the Lorentzian Ansatz) has flourished in the last years. In particular, it would be worth considering the following papers, where exact neural mass models are applied to perform whole-brain and large-scale brain simulations:
Forrester, M., Petros, S., Cattell, O., Lai, Y. M., O'Dea, R. D., Sotiropoulos, S., & Coombes, S. (2024). Whole brain functional connectivity: Insights from next generation neural mass modelling incorporating electrical synapses. PLOS Computational Biology, 20(12), e1012647.
Perl, Y. S., Zamora-Lopez, G., Montbrio, E., Monge-Asensio, M., Vohryzek, J., Fittipaldi, S.,
Campo, C. G., Moguilner, S., Ibanez, A., Tagliazucchi, E., Yeo, B. T. T., Kringelbach, M. L., & Deco, G. (2023). The impact of regional heterogeneity in whole-brain dynamics in the presence of oscillations. Network Neuroscience, 7(2), 632-660.
Byrne, Aine, James Ross, Rachel Nicks, and Stephen Coombes. "Mean-field models for EEG/MEG: from oscillations to waves." Brain topography 35, no. 1 (2022): 36-53.
Gerster, M., Taher, H., Skoch, A., Hlinka, J., Guye, M., Bartolomei, F.,... & Olmi, S. (2021). Patient-specific network connectivity combined with a next generation neural mass model to test clinical hypothesis of seizure propagation. Frontiers in Systems Neuroscience, 15, 675272.
Byrne, Aine, Reuben D. O'Dea, Michael Forrester, James Ross, and Stephen Coombes. "Next-generation neural mass and field modeling." Journal of neurophysiology 123, no. 2 (2020): 726-742.
Benitez-Stulz, Sophie, Samy Castro, Gregory Dumont, Boris Gutkin, and Demian Battaglia. "Compensating functional connectivity changes due to structural connectivity damage via modifications of local dynamics." bioRxiv (2024): 2024-05.
We have added the following paragraph:
“Recently, a class of these models, called next-generation neural mass models [42], has been developed based on an analytical approach introduced by [25] that allowed for the exact derivation of mean field parameters for a population of quadratic integrate-and-fire (QIF) neurons. These can be linked to EEG/MEG oscillations [43], including epipeltic seizures [43], and have been used to study various aspects of the whole-brain dynamics such as the low-dimensional manifold of the resting state [45,46], aging [47] and neural signatures of consciousness [48].”
We have also modified the preceding paragraph of the introduction that now reads:
“At the mesoscopic level, the observable properties of a neuronal ensemble are generally explained by statistical physics formalism of mean-field theory [19-22]. Mean-field models demonstrated a predictive value for studying the mesoscopic dynamics of neuronal populations [23], providing statistical descriptions of neuronal networks [2, 19, 24-29], which can be used to address questions related to network-level mechanisms [12, 24, 30].
In general, neural mass models have a low enough number of parameters to be tractable and provide general intuitions regarding mechanisms underlying complex neuronal activity [31-36]. For example, statistical population measures, such as the firing rate, can be used to assess mesoscopic dynamics [1, 7, 31, 36-41].”
(3) Moreover, conductance-based models have been already implemented in neural mass models not only in references [69, 71, 95], but also in:
Guerreiro, I. C., Di Volo, M., & Gutkin, B. (2023). A new generation of reduction methods for networks of neurons with complex dynamic phenotypes.
Capone, C., Di Volo, M., Romagnoni, A., Mattia, M., & Destexhe, A. (2019). State-dependent mean-field formalism to model different activity states in conductance-based networks of spiking neurons. Physical Review E, 100(6), 062413.
We have added the following sentence:
“Moreover, conductance-based couplings between the spiking neurons have been already implemented in neural mass models [58, 59, 91, 93, 121], but without an extracellular exchange mechanism.”
(4) Sec. 1.1 As previously established in the literature, a system of all-to-all coupled neuronal equations can be solved exactly in the thermodynamic limit (i.e., infinite neurons limit) if the single neuron membrane potential equation is a quadratic function and if the instantaneous distribution of membrane potentials of neurons in a population is described by a Lorentzian [Montbrió, E., Pazó, D. & Roxin, A. Physical Review X 5 (2), 021028 (2015)]. This means that the thermodynamic limit can be performed for a Canonical Type I model like the quadratic integrate-and-fire.
What is the biological justification and the reason to approximate a different neuron type (a type II neuron model), whose membrane potential equation resembles a cubic function, with a quadratic function? The fact that it can be solved in the quadratic approximation is not, in my opinion, a sufficient justification. It would be more correct to start from a type I neuron at the microscopic level with a quadratic function and then provide additional biological features.
We thank the reviewer for raising this important point. We respectfully disagree with the notion that starting from a canonical Type I model (such as the quadratic integrate-and-fire neuron) would be a more biologically grounded approach. While the quadratic form is analytically convenient, it does not capture certain key features of neuronal excitability particularly those related to bursting, seizure-like events, and depolarization block which are closely tied to the cubic-like nullcline geometry arising in Hodgkin–Huxley-type models, especially in the presence of slow ion dynamics.
Our work seeks to bridge biophysical realism with analytical tractability. The step-wise quadratic approximation we employ is specifically designed to mimic the cubic membrane potential profile that emerges from the full ion-exchange dynamics. While the Lorentzian Ansatz is not strictly justified in this case from first principles, we show that it yields a workable and biologically interpretable mean-field description, which aligns with single-neuron dynamics, population simulations, and even in vitro observations. To our knowledge, this is a novel contribution that extends mean-field modeling beyond currently available approaches, which are often restricted to simplified or phenomenological neuron models.
In this context, using a quadratic approximation is not merely a mathematical convenience — it is a means to retain key dynamical features of more realistic (non-Type I) neurons within a tractable framework, enabling insights into complex behaviors like multistability and pathological bursting.
(5) Sec. 1.2 As shown in Figure 3, the mean-field equations do not show a one-to-one correspondence with the neural network simulations, except in strongly synchronous regimes. This represents a strong limitation in the model, especially because exact neural mass models (as shown in Reference [23]) perfectly fit the dynamics of the underlying network model both in the asynchronous and in the synchronized regime.
We appreciate the reviewer’s observation and acknowledge that our original description may have caused confusion. The model's validity is not strictly limited to strongly synchronous regimes, but rather to regimes where the distribution of membrane potentials across the neuronal population remains unimodal and can be reasonably approximated by a Lorentzian. This includes but is not restricted to—highly synchronized states.
We agree that this distinction is important and have clarified it in the revised manuscript (e.g., “in strongly synchronous regimes” —> “in regimes where the membrane potentials' distribution is unimodal and can be reasonably approximated by a Lorentzian”).
In contrast to exact mean-field reductions based on quadratic integrate-and-fire neurons (e.g., [23]), our model originates from a biophysically grounded HH-type neuron with ion exchange dynamics, and necessarily involves heuristic approximations to achieve a closed-form mean-field description. While this results in a less exact correspondence with network simulations in more heterogeneous or bimodal states, our goal was to retain biological interpretability and account for phenomena such as ion-driven bursting and seizure-like transitions, which are not captured by standard QIF-based neural masses.
We see our contribution as complementary to existing exact reductions — offering a biophysically grounded alternative that remains tractable and informative in a relevant class of unimodal, mesoscopic dynamical regimes.
(6) Sec. 1.3 In this section the authors show the comparison between in vitro experiments and simulations with both the network model and the neural mass model (Figure 4, panels a,b,c). The qualitative agreement that is supposed to be shown is hardly evident. The shape of the signals is different as is the type of bursting. The only agreement results in the fact that there are repeated spiking events at successive times in a periodic manner. However, the time scale of the simulations is different for neural network simulation and mean-field experiment, making it difficult to compare them. While the period of the bursting event is around 2 min for mean field simulation (in according with experiments), the time scale of the network simulation is 60 times smaller, thus meaning that we are considering completely different mechanisms and phenomena. The justification given by the authors, that "the parameters were modified to simulate shorter fluctuations (in the network of Hodgkin-Huxley neurons) for computational efficiency" is inappropriate.
The poor agreement turns out to be even worse in the comparison between experiments and mean-field simulations shown in panels d and e of Figure 4. While the mean field simulation is characterized by a periodic behaviour both in the mean membrane potential and in the external potassium concentration, the in-vitro traces are not periodic and show an increasing irregular activity of the extracellular LFP in correspondence with increasing external potassium concentration.
How it is possible to justify the implementation of this model if the working hypotheses are not supported by the results? The worst agreement of the network simulations with the experiments reinforces the doubt raised in the previous point: what is the reasoning underlying the choice of Hodgkin-Huxley as a single neuron model?
We thank the reviewer for this detailed critique. We acknowledge that the comparisons in Figure 4 involve limitations and we now provide a clearer rationale and context in the revised manuscript. First, we emphasize that our intention is not to claim a quantitative match between the experimental and simulated traces, but rather to demonstrate that our model grounded in biophysical mechanisms such as ion exchange is capable of qualitatively reproducing a key feature observed experimentally: the slow modulation of neuronal activity by extracellular potassium concentration. For example, both in vitro (Fig. 4a, 4d) and in our simulations (Fig. 4b, 4e), bursts of activity ride on slower oscillations of potassium, and the interplay of fast and slow dynamics is central to both.
Regarding the discrepancy in timescales between the neural network and mean-field simulations: the network simulations were intentionally run with accelerated dynamics by rescaling biophysical parameters (e.g., membrane capacitance and gating time constants) to keep the computational cost feasible. We now clarify in the manuscript that this choice is standard practice in computational modeling when the primary goal is to validate dynamical mechanisms rather than replicate absolute timescales.
On the shape of LFP signals: the experimental recordings were AC-coupled, and the DC components associated with slower shifts in membrane potential such as those modeled in the mean-field simulations are not captured in those recordings. This limits the visibility of key features like the underlying potential jumps. Additionally, no claim is made regarding a specific bursting classification in either data or simulation.
We agree that the experimental trace in Fig. 4d shows more complex, non-periodic dynamics (e.g., slowing burst frequency and irregularity), which are not captured by our current deterministic model. These differences could plausibly arise from additional physiological processes (e.g., stochastic transitions between metastable regimes or variability in ion regulation) that are not modeled here. In future work, such phenomena may be captured by introducing noise or parameter variability (see, e.g., Saggio et al., A taxonomy of seizure dynamotypes , elife 2020), or by allowing the parabola coefficients in the nullcline approximation to vary dynamically.
Finally, regarding the choice of a Hodgkin–Huxley-type neuron: this model allows us to incorporate a biophysical description of ion exchange, which is central to the phenomena we study. While modeling the spiking mechanisms explicitly precludes certain mathematical simplifications available to very simplified neuron models with reset, it enables direct links between mesoscopic dynamics and measurable quantities such as extracellular potassium an essential objective of our work. To summarize, we rearranged Fig4:
Potassium can have periodic behavior with V bursting riding on top (Fig.4 a). The model also shows this behavior at different timescales (Fig. b,c,e).
AC LFP recording is filtered so we might not see the V jump during the bursts (because we do not have DC recordings). No claim about bursting class here.
Potassium can also have more complex behavior (e.g., slowing down of burst frequency Fig.4.d), that the deterministic model do not show, but maybe exploring dynamical parameters (e.g., from parabolas or K_bath) or with added noise allowing to jump between regimes (reference Saggio et al. eLife 2020).
(7) Sec. 1.5 Here six neural masses are coupled via long-range structural connections with random weights. Simulations of the system are shown for two different values of the global coupling parameter (G = 0 and G = 100). How many realisations of the network have been considered?
We thank the reviewer for pointing this out. The presented simulation was intended as a proof-of-concept demonstration to illustrate the model’s capacity to support network-level propagation of pathological activity. For this purpose, we considered a single representative realization of the structural connectivity with random weights. Given the deterministic nature of the model and the qualitative focus of the demonstration, additional realizations do not qualitatively change the observed behavior — namely, the transition from localized to network-wide bursting as coupling strength increases. We have now clarified this in the revised manuscript.
“This simulation serves as a proof of concept to illustrate how local pathological activity can propagate through a network depending on the strength of coupling. We used a single representative realization of randomly weighted structural connectivity. While we did not perform a systematic exploration of different realizations or coupling strengths, we observed that the qualitative behavior namely, the emergence of network-wide bursting beyond a critical coupling threshold remains robust across similar setups. The model is compatible with empirical connectome data and can be readily extended to simulations using realistic brain network architectures.”
In future applications involving data-driven network architectures or variability analyses, we agree that exploring multiple realizations or empirical connectomes will be valuable.
How do the results depend on the different choices of the random weights? What is the dependence of the emergent dynamics on G? What kind of dynamics can be observed varying smoothly the parameter G (e.g. from 0 to 100)?
This section serves as a proof of concept to show that pathological activity in one node can propagate through the network when coupling is strong. We used a single random weight configuration and did not systematically explore variations in G or connectivity. While richer dynamics likely emerge across intermediate values of G, a full parameter sweep is beyond the scope of this study. We clarify this in the revised text (see answer above).
(8) Sec. 2.1 In the description of the experiment it is mentioned that only Mg^{2+} is varied. What is the role played by Mg^{2+} variation in influencing the external potassium concentration variation? How the experiment can be linked to the model? How the hypothesis of introducing an equation for the potassium concentration current in the microscopic model is supported by the experiment and vice-versa?
We thank the reviewer for this question. We have added a new subsection in the Methods explaining the.agnesium removal as a mean to influence the external potassium dynamics:
“The membrane of hippocampal neurons is equipped with N-methyl-D-aspartate type glutamate receptors (NMDARs). These receptors have a very high affinity for glutamate and can, in principle, be activated by ambient glutamate present at low concentrations in the brain extracellular fluid (ECF). Under normal physiological conditions, this activation does not occur because extracellular magnesium ions (Mg<sup>2+</sup>) block the NMDAR channel at membrane potentials more negative than about –50 mV; this voltage-dependent block prevents receptor activation at rest. When extracellular magnesium is removed, the block is relieved, allowing NMDARs to be activated, leading to neuronal depolarization toward the action potential threshold [117].”
“In addition, as a divalent cation, Mg<sup>2+</sup> interacts with the negatively charged neuronal membrane, contributing to the stabilization of the resting membrane potential. Lowering extracellular magnesium concentration disrupts this effect, resulting in membrane depolarization [118].”
“Consequently, magnesium removal not only facilitates NMDAR-dependent depolarization, but also directly depolarizes neurons. This depolarization increases the driving force for outward potassium currents through K<sup>+</sup> channels, meaning that variations in Mg<sup>2+</sup> can indirectly influence external potassium dynamics during neuronal activity.”
(9) Sec. 2.6 The modified version of the continuity equation has been derived following Reference [95], where the authors consider a network of Izhikevich neurons, and each neuron is modelled by a two-dimensional system consisting of a quadratic integrate and fire equation plus an equation that implements spike frequency adaptation. In particular, in [95] the authors achieve a closed set of mean-field equations with the inclusion of the mean-field dynamics of the adaptation variable by using a Lorentzian ansatz combined with the moment closure approach. The moment closure condition is also assumed in the present manuscript (Eq. 19). Under which assumptions is the implementation of the moment closure condition justified?
We are thankful to the reviewer (and also to the R2) for pointing out to the validity of the justification of the assumptions that we have used in our formalism. We hence agree that the moment closure is not a sufficient justification for assuming that V depends on the mean n, which is neccessary for the derivation of Eq. 20, but in addition we need the assumption that n can be treated as a collective variable as it is done in the works mentioned by the reviewer 2. In addition we have performed numerical simulations of the full system to calculate the error term introduced by this approximation, and the results in the new Fig. S2 show that this is below 2% for each of the different dynamical regimes.
We have hence modified the justification for Eq. (19) reading:
“Next we assume a first-order moment closure condition for the variable n [59], justified by the numerical simulations of the full network (see Fig. S2) which show that for most of the neurons (close to 99 \% for the value of ∆ same as in the other simulations) the mean of the population is well capturing the behavior of the single neurons [122]. Finally, putting together these factors and assuming that n can be treated as a collective variable for each neuron (see Limitations of the model} section) we arrive to ” and also
“The validity of the first moment closure, Eqs. (19), as in [59], is supported by the numerical simulations, which show that, both, during the silent regime and when seizure-like events occur, n<sub>i</sub> for most neurons track the network averaged ⟨n | V, η⟩. In particular, it is less than 2% of the neurons that fire while the mean is low, and vice-versa, Fig. S2. In less synchronized scenarios (larger ∆ or smaller J), however, this value would increase, but the mean would always capture the qualitative behaviour of the population.”
This is also now explicitly mentioned in the following paragraph:
“Unlike the mean membrane potential ⟨V⟩ and the firing rate (r), which can be explicitly derived from the continuity equation under the Lorentzian assumption, the expression for ⟨n(t)⟩ in Eq. (26) is formal. In our mean-field model, the gating variable (n) is treated as a global population variable, evolving deterministically as a function of the average membrane potential. Therefore, ⟨n(t)⟩ corresponds to the collective gating variable assumed to be shared by all neurons, and is not computed by averaging distinct microscopic (n<sub>i</sub>) values.”
(10) Considering also the comments reported above, I think that it would make more sense to start from an Izhikevich neuron model as microscopic model and add the equations for the ionic currents as mesoscopic variables (i.e. written as population average variables), instead of starting from the Hodgkin-Huxley single neuron model and trying to make hardly justifiable approximations and simplifications.
We respectfully disagree. While the Izhikevich model is computationally efficient, it lacks the biophysical detail required to capture key ion-driven mechanisms such as depolarization block, slow ion accumulation, and specific burst-initiation dynamics all of which are central to our study. The Hodgkin–Huxley framework, despite requiring approximation, provides the necessary physiological grounding to link microscopic ion exchange with emergent population behavior.
(11) Sec. 2.7 What is the advantage of using six more parameters to fit, like R-,R+,c-,c+,I-,I+?
This is in contradiction with the spirit of deriving a mean-field model, where the number of parameters should be reduced. What is the advantage of this mean-field derivation with respect to other mean-field derivations of Hodgkin-Huxley neurons, like the one in Reference [9]?
The additional parameters (R±, c±, I±) are not arbitrary they compactly parametrize the cubic-like nonlinearity of the membrane potential dynamics in our stepwise-quadratic approximation. This trade-off allows us to preserve essential biophysical features of HH neurons (e.g., bursting regimes, depolarization block) within a tractable analytic framework. Compared to alternative approaches like in ref. [9], which focus on phenomenological reductions and do not yield an ODE system, our model offers more direct interpretability in terms of ion dynamics, providing a closer link between microscopic mechanisms and mesoscopic activity patterns.
(12) Sec. 2.11 The derivation of the mean-field dynamics for the gating variable is rather heavy and difficult to follow. This section could be simplified, whilst also better explaining the underlying approximations and the validity of these approximations, which is currently missing.
We agree that the derivation is technical, but we chose to retain it for transparency, as it follows the Chen and Campbell approach and makes key approximations such as moment closure explicit. We have now added a clarification that n is treated as a collective variable We hope that the current level of detail helps readers understand the assumptions underlying the gating variable dynamics.
(13) Sec. 2.12 The derivation of Eqs. (36) is quite confusing and needs to be re-written in a clearer form. Why are both the variables x and r present in these equations, since they are proportional according to Eq. (25)?
We thank the reviewer for pointing this out. We have adjusted the equations to improve clarity and now consistently express the firing rate in terms of a single variable. This removes the redundancy and simplifies the presentation.
(14) Sec. 2.13 The derivation of Eqs. (37) is quite confusing and needs to be rewritten in a clearer form.
Both the auxiliary variable x and the firing rate r are present in this equation, the same as in Eq. (36). Therefore it is presented as a set of equations for the auxiliary variable x and for the physical variable V. Moreover in the equation for dV/dt, the quadratic term in V has disappeared and it is not clear to me which are the variables corresponding to I- and I+. In particular, in Eqs. (36) there are two different current terms I-,I+ for the two equations related to dy/dt. In Eqs. (37) there is a single term (I_{cl} +I_{Na}+I_K+I_{pump})/C_m which is identical for both equations related to dV/dt. I was expecting two different terms also in Eqs. (37).
We appreciate the reviewer’s close reading. To improve clarity, we now express the dynamics in terms of the firing rate r, replacing \dot{x} with \dot{r} in both Eq. (36) and Eq. (37) to avoid confusion.
As for the current terms: in Eq. (37), we reverse the stepwise quadratic approximation and reintroduce the original ionic currents from Eq. (16). This is why the expressions involving I_{\text{cl}}, I_{\text{Na}}, I_K, and I_{\text{pump}} appear as a single summed term in \dot{V}, rather than the split I_-,I_+ terms used in the stepwise approximation. We now clarify this in the text.
We also write V as \bar{V} to clarify that it refers to the average membrane potential for the neuronal population. Finally, we wrote the final equation in a more compact form to improve clarity (new Eq.38).
(15) Moreover, while the equation for the gating variable n can be considered as a differential equation for a mesoscopic variable since n depends on average values only, it is not clear to me if the remaining variables 𝛥[K+]_{int}, [K+]_g can be considered mesoscopic or not. Since Eqs. (37) represent a mean-field model, I expect every variable to be a mean-field variable. This could be easily achievable for the extracellular potassium concentration, but I do not understand how a site-specific microscopic variable like the intracellular potassium concentration variation can be automatically inserted in a set of mean-field equations without any averaging or intermediate steps. This is a crucial point to be clarified for the validity of the neural mass equations.
We thank the reviewer for raising this important point. In our model, we assume spatial homogeneity at the mesoscopic scale, meaning that ion concentrations — both intra- and extracellular — are uniformly distributed across the population. As a result, variables such as \Delta[K^+]_{\text{int}}, Δ[K+]int and [K+]g are treated as population-level averages, consistent with the mean-field framework.
Moreover, the rate of change of intracellular potassium is tightly coupled to extracellular dynamics via ion exchange mechanisms, justifying its inclusion as a slow, mesoscopic variable. We now clarify this modeling assumption explicitly in the text.
“By locally homogeneous, we mean that all neurons in the population are assumed to share the same extracellular and intracellular ionic environment and are connected with identical coupling rules, allowing us to treat the population as uniform with respect to ion dynamics and connectivity.”
“These slow variables are in addition considered to be mesoscopic, meaning they are identical for every neuron in the population.”
Minor points:
(1) Figure 2, panel d. Please detail the variable on the y-axis, which is not reported in the figure.
Done
(2) Eq. (15) is cited in many parts of the manuscript, while it seems to me it would be more appropriate to reference Eq. (2). Is this a mistake or is there a reason to cite Eq. (15)?
The reviewer is correct, we have had a wrong equation label, which we have now corrected.
(3) Figure 4 Would it be possible to show enlargements of the mean membrane potential traces to directly compare the different bursting types shown by the simulation of the different models?
The panel d already contains enlarged part of the membrane potential traces. For the rest, going back to the Q6, we want to stress again that our intention is not to claim a quantitative match between the experimental and simulated traces.
(4) Figure 5 In the caption the author refers to "the generic model, single neuron model, and epileptor model". Could you please better explain the models referred to and why they are mentioned? Are the generic model and the single neuron model those that are presented in the Materials and Methods section? Or do you refer to completely different models, as for the epileptor?
We have removed the reference to the generic model (we had in mind the canonical model for seizures by Saggio et al. 2017), since it is not mentioned in the paper, and we have clarified that the single neuron model and epileptor model, which were used to simulate seizure like events.
(5) Sec 2.5 As already stated above, the authors need to reduce unnecessary formulations that confuse the reader. Here, for example, Eqs. (6) and (7) are unnecessary, in view of the fact that delta spikes are used (Eq. 8).
We thank the reviewer for the suggestion, but we disagree, and we think it is better to start the derivations from the more general case, as done with Eqs. 6-7.
(6) Sec. 2.6 Could you please better explain why in Eqs. (15) and (16), the variable V0 is introduced, while before and after this, the variable V is used?
We thank the reviewer for the comment. In Eqs. (15) and (16), \dot{V}_0 denotes the free term of the membrane potential equation, i.e., the component driven solely by the intrinsic ionic currents and excluding the synaptic input I_syn. Only this \dot{V}_0 term (a function rather than an independent variable) is approximated by the piece-wise quadratic expression in Eq.(21). In contrast, the variable V represents the membrane–potential variable, which dynamics is obtained by combining \dot{V}_0 with the synaptic current contribution I_syn. In summary, there is no independent variable V_0; only the function \dot{V}_0 is introduced to represent the intrinsic (non-synaptic) component of the membrane–potential dynamics. We have now clarified this in the text.
(7) In the square brackets of the r.h.s. of Eq. (18), for all the intermediate steps, it appears G^n(V,n) ϱ^V, while there should be G^n(V,n) ϱ^n.
We thank the reviewer for catching this typo. We have corrected this in the revised manuscript.
(8) Sec. 2.8 Here the authors affirm that "a double-Lorentzian (or a piece-wise Lorentzian) could be a suitable form for ρ^V (t, V | η). However, it is not clear under which conditions such an assumption would allow a solution to the continuity equation". What are the problems underlying the implementation of the double Lorentzian? It seems to be a more correct form than the single Lorentzian actually implemented.
We thank the reviewer for this thoughtful question. In principle, a double-Lorentzian ansatz for \rho^V can indeed be implemented in several reasonable ways–for example, by enforcing that the combined area of the two Lorentzian components is normalized to one (to preserve the probabilistic interpretation) and by imposing smoothness constraints at their boundaries. However, despite exploring these implementations, we were unable to obtain non-trivial solutions of the continuity equation under this parametrization. The only solvable case we found is the degenerate one in which the two Lorentzians collapse onto each other (i.e., (x_- = x_+) and (y_- = y_+)), which reduces the ansatz to the single-Lorentzian form used in the manuscript. For this reason, although the double-Lorentzian is conceptually appealing, it did not yield practically useful solutions within our framework.
(9) Eq. (28). The symbols used for the flux (especially those used in the second-to-last step once the inner integration is performed) are confusing and it is difficult to understand what they mean.
We thank the reviewer for noting this issue. The problem was due to a LaTeX typo that prevented the vertical lines—indicating that the flux is evaluated at specific points—from rendering correctly. We have now corrected this.
(10) Eq. (29) In the third step there are some misprints that impair comprehension.
We thank the reviewer for noting this. We have corrected these misprints in the revised version.
(11) Line 696. The reference is not displayed.
Fixed.
Reviewer #2 (Recommendations for the authors):
As a really general remark, this manuscript is written in a confusing manner, the authors present their model in a general formulation and their analysis in a complicated way that in the end is not needed, as I will explain in detail in the following.
Another general question is why the authors want to employ the neural mass reduction methodology developed in [23] to obtain exact mean-field evolution for quadratic neurons (like the quadratic integrate and fire (QIF)) for a model that reveals a cubic dependence on the membrane potential, as the FizhHugh-Nagumo neuron (that indeed is a 2d reduction of the Hodkgin-Huxley model), to obtain an approximate neural mass model that somehow works qualitatively only for synchronized dynamics? Why not use another approach more suited to derive the neural mass model for cubic nonlinearity, as the one suggested in [33] and [69] by Di Volo and co-authors? What is the rationale behind the choice of the authors?
We appreciate the reviewer’s critical feedback and the opportunity to clarify our methodological choices. Our decision to base the mean-field model on Hodgkin–Huxley-type neurons stems from the need to retain ion channel dynamics, which are essential to capture the coupling between membrane activity and extracellular ionic concentrations. This biophysical link is central to our study and cannot be achieved using more abstract neuron models such as QIF or FitzHugh-Nagumo alone.
Regarding the mean-field reduction method: while the Ott-Antonsen/Lorentzian framework is indeed exact for QIF neurons, we adopted a stepwise quadratic approximation to apply a similar formalism to the cubic-like dynamics of the HH model. This choice enables us to analytically capture a rich set of behaviors, including bursting, depolarization block, and seizure-like dynamics, in a tractable mean-field system.
We considered the approach of Di Volo and colleagues [33, 69], but their methodology is tailored to asynchronous irregular regimes, whereas our model is specifically designed to capture dynamics in quasi-synchronous or bursting regimes — including epileptiform activity — which are not covered by the assumptions of the Di Volo framework.
We now clarify these modeling choices more explicitly in the revised manuscript.
"Unlike phenomenological or reduced models, the Hodgkin–Huxley framework allows us to retain explicit ion exchange dynamics, which are essential for linking membrane behavior to extracellular potassium fluctuations. This level of biophysical detail is crucial for modeling pathological regimes such as seizure onset and propagation."
Furthermore, the derivation of the neural mass equations is unnecessarily complicated, as a matter of fact, they approximate all the variables (except the membrane potentials of the single neurons) as collective variables (i.e. the gating variable and the potassium concentration) common to all the neurons. The neural network model for which they derive the neural mass model presents microscopic evolutions of the membrane potential cubic-like plus other global variables equal for all neurons, that depend on collective variables such as the mean membrane potential or the mean firing rate. Once clarified, the derivation of the neural mass model is much simpler, and it is not necessary to follow the approach reported in Reference [95] [Chen, L. & Campbell, S. A. Exact mean-field models for spiking neural networks with adaptation. Journal of Computational Neuroscience 50 (4), 445-469 (2022)] which is unnecessarily complicated. The authors can follow a much simpler methodology as explained by Guerriero et al in Reference [R6] (cited below) where the authors consider the same model studied in [95]. Such a methodology has been applied in many cases already, to introduce realistic aspects in the neural mass model [23] (see References [R1-R7] below). I strongly encourage the authors to reformulate their approach in a simpler and clearer manner, by following the approach reported in [R1-R7]. The manuscript will become more readable and it will gain in comprehension.
We thank the reviewer for this helpful suggestion. We agree that, given the assumptions made in our derivation (i.e., shared gating and ion concentration variables across neurons), the mean-field equations could alternatively be obtained using the simpler methodology proposed by Guerriero et al. [R6] and related works [R1–R7]. However, we chose to follow the derivation presented by Chen and Campbell [95] because it makes the approximations (e.g., moment closure, flux boundary assumptions) explicit and generalizable to future extensions. However, we also acknowledge that the assumption of n to be treated as a collective variable is needed, and for clarity, we have now added a remark in the manuscript indicating that the same result could be recovered more directly using the approach of Guerriero et al.
“We note that, under the assumption of globally shared gating and ion concentration variables across the neuronal population, the resulting mean-field equations can also be derived using simpler methods as proposed by Guerriero et al [58]. In this work, we follow the more general formalism of Chen and Campbell [59], which makes the role of key approximations (e.g., moment closure, vanishing flux at boundaries) explicit. This also facilitates potential generalizations to settings with partial heterogeneity or dynamic gating distributions.”
“Finally, putting together these factors and assuming that n can be treated as a collective variable for each neuron”
“Unlike the mean membrane potential ⟨V⟩ and the firing rate (r), which can be explicitly derived from the continuity equation under the Lorentzian assumption, the expression for ⟨n(t)⟩ in Eq. (26) is formal. In our mean-field model, the gating variable (n) is treated as a global population variable, evolving deterministically as a function of the average membrane potential. Therefore, ⟨n(t)⟩ corresponds to the collective gating variable assumed to be shared by all neurons, and is not computed by averaging distinct microscopic (n<sub>i</sub>) values.”
Now I will examine in detail all the manuscript and report comments/remarks/suggestions numbered as (Q#) on how to improve the present manuscript to render it easier to read and more comprehensible, these are not minor remarks, just detailed ones.
Introduction
(Q1) The Introduction section needs a part devoted to the reduction methodology developed in [23] for QIF neurons and a presentation of previous works dealing with the introduction of biologically realistic aspects in the neural mass model derived in [23]. Here is a non exhaustive list of such papers concerning the introduction of the following realistic aspects in the neural mass developed in [23]:
(I) short-term synaptic plasticity :
[R1] Exact neural mass model for synaptic-based working memory H Taher, A Torcini, S Olmi, PLOS Computational Biology 16 (12), e1008533 (2020)
[R2] Bursting in a next generation neural mass model with synaptic dynamics: a slow-fast approach H Taher, D Avitabile, M Desroches, Nonlinear Dynamics 108 (4), 4261-4285 (2022)
[R3] Mean-field approximations of networks of spiking neurons with short-term synaptic plasticity R Gast, K Thomas R, H Schmidt, Physical Review E 104 (4), 044310 (2021)
(II) spike frequency adaptation:
[R4] Gast, Richard, Helmut Schmidt, Thomas R. Knösche. "A mean-field description of bursting dynamics in spiking neural networks with short-term adaptation." Neural computation 32.9 (2020): 1615-1634.
[R5] Population spiking and bursting in next-generation neural masses with spike-frequency adaptation, A Ferrara, D Angulo-Garcia, A Torcini, S Olmi, Physical Review E 107 (2), 024311 (2023).
(III) conductance-based neuron with a slow current (Izekievic model):
[R6] A new generation of reduction methods for networks of neurons with complex dynamic phenotypes,IC Guerreiro, M Di Volo, B Gutkin, preprint arxiv: 2206.10370 (2022)
(IV) spike timing-dependent plasticity:
[R7] Mean-field approximations with adaptive coupling for networks with spike-timing-dependent plasticity, B Duchet, C Bick, Á Byrne, Neural computation 35 (9), 1481-1528 (2023).
(V) random connectivity and noise:
[R8] Mean-field models of populations of quadratic integrate-and-fire neurons with noise on the basis of the circular cumulant approach
DS Goldobin Chaos: An Interdisciplinary Journal of Nonlinear Science 31 (8) (2021)
[R9] A reduction methodology for fluctuation-driven population dynamics DS Goldobin, M Di Volo, A Torcini, Phys. Rev. Lett. 127, 038301 (2021)
[R10] Shot noise in next-generation neural mass models for finite-size networks VV Klinshov, SY Kirillov Physical Review E 106 (6), L062302 (2022)
I think the authors should refer in the introduction to these previous papers, where realistic biological aspects have been already introduced in the neural mass model developed in [23].
We have added a whole pragaraph devoted to the next-generation neural mass models and in particular to the other works introducing biological realism in this class of models:
“Recently, a class of these models, called next-generation neural mass models [42], has been developed based on an analytical approach introduced by [25] that allowed for the exact derivation of mean field parameters for a population of quadratic integrate-and-fire (QIF) neurons. These can be linked to EEG/MEG oscillations [43], including epipeltic seizures [44], and have been used to study various aspects of the whole-brain dynamics such as the low-dimensional manifold of the resting state [45, 46], aging [47] and neural sig natures of consciousness [48]. Number of works dealt with the introduction of biologically realistic aspects in the mostly phenomenological neural mass model derived in [25]. These included short-term synaptic plasticity [49–51], spike frequency adaptation [52, 53], spike timing-dependent plasticity [54], synaptic delay [29], random connectivity and noise [55–57], as well as an extension of the conductance-based neurons with a recovery variable [58–60].”
(Q2) Line 117 - Please specify what you mean by locally homogeneous, here.
Thank you for allowing us the opportunity to clarify this. We now report:
"By locally homogeneous, we mean that all neurons in the population are assumed to share the same extracellular and intracellular ionic environment and are connected with identical coupling rules, allowing us to treat the population as uniform with respect to ion dynamics and connectivity."
(Q3) In this sub-section the authors should clarify all the hypotheses they employ to derive the neural mass models, not only the Lorentzian approximation they did for a cubic model, but also the fact that they assume that the gating variable n is a global variable as well as that the potassium concentration are assumed to be the same for all neurons, that they assume no heterogeneity at this level. This is a fundamental aspect that should be clarified at this stage already.
We thank the reviewer for this important observation. We agree and have revised the text in the derivation section to explicitly state all key assumptions. Specifically, we now clarify that:
(1) The gating variable n is treated as a population-average (global) variable;
(2) The potassium concentrations Δ[K+]int and [K+]g are assumed to be homogeneous across the neuronal population; and (3) No heterogeneity is assumed at the level of the ion dynamics.
This assumption is biophysically motivated: ion concentrations — particularly extracellular potassium — tend to redistribute rapidly due to diffusion and electrochemical forces, leading to an effectively well-mixed environment at the mesoscopic scale. As such, assigning separate compartments to individual neurons is not justified in this modeling context. We now explicitly note this in the manuscript to avoid ambiguity.
“3) We assume that the potassium concentrations, both intracellular(\( \Delta[K^+]_{\text{int}} \)) and extracellular (through the buffering variable \( [K^+]_g \)), are homogeneous across the neuronal population. This is justified physiologically by the rapid redistribution of ions through diffusion and electrochemical gradients, which enforce near-instantaneous equilibration at the mesoscopic scale. As such, assigning separate compartments to each neuron is neither practical nor biologically meaningful in this context. We assume that the potassium concentrations, both intracellular (\( \Delta[K^+]_{\text{int}} \)) and extracellular (through the buffering variable \( [K^+]_g \)), are homogeneous across the neuronal population. This is justified physiologically by the rapid redistribution of ions through diffusion and electrochemical gradients, which enforce near-instantaneous equilibration at the mesoscopic scale. As such, assigning separate compartments to each neuron is neither practical nor biologically meaningful in this context; 4) We assume that the gating variable n, which governs potassium conductance, can be treated as a population-averaged variable. This allows us to describe the neuronal ensemble using a reduced set of collective (mean-field) variables.”
Comparison with neural network simulations
(Q4) The comparison the authors perform between the microscopic model and the neural mass is misleading, From what the authors wrote it seems that you are considering 4 variables for each neuron in the network model (this is unclear from how the model is written in Eq (9)), I guess one for the membrane potential, one for the gating variable and two for the potassium concentration. However, this is not the network model for which the neural mass has been developed, the neural mass has been obtained for a network made of N + 3 variables (N membrane potentials and 3 collective variables for gate, and potassium concentrations) this is a sort of mesoscopic network models, analogously to what done previously in references [R1,R3,R4] above and others. If the authors would compare their neural mass with this mesoscopic model the agreement among the two would be improved.
We agree with reviewer’s observation and we now acknowledge this issue in the Results and in the Limitations. We have already modified the text to explicitly state that for the mean filed derivations n is treated as a collective variable and we have added the following statements:
“Also note that the gating variable n is treated as microscopic in the neural network, while in the derivations for the mean-field it is considered as a mesoscopic and identical for the whole population. This is likely responsible for some of the discrepancies between the two modalities.”
“Moreover, the discrepancy between the two modalities would have likely been smaller if for the neural network we also adopted a gating variable that is mesoscopic and identical across the spiking neurons, as in similar works [49–51]. However, here we demonstrate the validity of the mean-field approximation even for the more natural, microscopic representation of the gating variable in the neural network.”
Comparison with in vitro experiments
(Q5) Experiment -- The experiment is performed in vitro on the intact Hippocampus of mice between postnatal days P5-P7. It is known [R1] that neuronal activity at an early developmental stage is provided in the Hippocampus by a network primarily driven by synchronized GABA_A that provides an excitatory action and generates giant depolarizing potentials (GDPs) [R11]. However, GDPs have frequencies in the range of 1 Hz - 0.1 Hz, not matching the oscillation frequencies reported by the authors. I have several questions here:
(E1) At this stage P5-P7 are the interactions among neurons essentially excitatory? Or not, please explain why, Are the oscillations reported by the authors somehow related to GDPs? The depolarizing action of GABAergic transmission and the presence of GDPs during early rodent brain development, as described by Ben-Ari and some others researchers, are characteristics commonly observed in ex vivo brain preparations, but are not evident under physiological in vivo conditions (see doi: 10.3389/fphar.2012.00065).
In our preparation—intact mouse hippocampus—GABAergic synaptic transmission is not depolarizing. This is evidenced by the fact that inhibition of ionotropic GABA_A receptors with bicuculline triggers interictal-like discharges, which are routinely used as a model of epileptiform activity (see doi: 10.1016/j.nbd.2014.12.013). Therefore, in our experiments at P5–P7, neuronal interactions are not purely excitatory, and the observed low Mg2+ induced oscillations are not related to GDP.
(E2) What is the nature of the oscillations reported by the authors in Figure 4 ? Which is their origin, please explain in the text of the paper clearly.
The model of epileptic discharges presented in our study was first introduced over 20 years ago and has since become a well-established paradigm for screening potential antiepileptic drugs and research on the mechanism of epileptic seizure. A detailed description of this model can be found in doi: 10.1046/j.1460-9568.2002.02143.x, and its pharmacological properties are reviewed in doi: 10.1046/j.1528-1157.2003.19503.x. These references have now been added to the manuscript for clarity.
We have added the following:
“The model of epileptic discharges presented in our study was first introduced over 20 years ago [115] and has since become a well-established paradigm for screening potential antiepileptic drugs and research on the mechanism of epileptic seizure [116].”
(E3) How exactly does the concentration of extracellular potassium ions change, this is not clear even in Methods, please clarify.
[R11] Excitatory actions of GABA during development: the nature of the nurture Y Ben-Ari, Nature Reviews Neuroscience 3 (9), 728-739 (2002).
We have now added a new Subsection in the methods explaining how we use Mg2+ variation to influence the external potasium variation.
“The membrane of hippocampal neurons is equipped with N-methyl-D aspartate type glutamate receptors (NMDARs). These receptors have a very high affinity for glutamate and can, in principle, be activated by ambient glutamate present at low concentrations in the brain extracellular fluid (ECF).Under normal physiological conditions, this activation does not occur because extracellular magnesium ions (Mg<sup>2+</sup>) block the NMDAR channel at membrane potentials more negative than about –50 mV; this voltage-dependent block prevents receptor activation at rest. When extracellular magnesium is removed, the block is relieved, allowing NMDARs to be activated, leading to neuronal depolarization toward the action potential threshold [117]. In addition, as a divalent cation, Mg<sup>2+</sup> interacts with the negatively charged neuronal membrane, contributing to the stabilization of the resting membrane potential. Lowering extracellular magnesium concentration disrupts this effect, resulting in membrane depolarization [118]”
“Consequently, magnesium removal not only facilitates NMDAR-dependent depolarization, but also directly depolarizes neurons. This depolarization increases the driving force for outward potassium currents through K<sup>+</sup> channels, meaning that variations in Mg<sup>2+</sup> can indirectly influence external potassium dynamics during neuronal activity.”
(Q6) Lines 187-191 and Figure 4 -- The authors wrote : "In Figure 4.c we show the membrane potential and external potassium for a simulation of N = 3000 coupled HH-like neurons showing a similar behavior, although the parameters were modified to simulate shorter fluctuations for computational efficiency." This sentence is unclear. What is clear from Figure 4 is that the network simulations gave rise to collective oscillations on a completely different scale seconds with respect to minutes and also the profile of the potassium concentration has a clearly different evolution. From Figure 4 one can conclude that network simulations have nothing to do with the neural mass evolution and the experiment. I think the authors should better clarify and describe the results reported in Figure 4.
We thank the reviewer for the observation. We have revised the relevant section of the manuscript to clarify the interpretation of Figure 4 and avoid any implication of quantitative matching. As stated in our response to Reviewer 1 (comment 6), the comparison is intended to highlight the shared qualitative structure across experimental data, the neural mass model, and the network simulation — specifically, the modulation of fast bursting by slow extracellular potassium fluctuations. The difference in timescale in the network simulation arises from rescaled parameters used for computational efficiency. We now explicitly state this and have updated the figure caption and accompanying text accordingly to reflect these points.
(Q7) Why do the authors consider a purely excitatory network to describe the experimental results? What is the reason for this choice? Why they do not consider as usual balanced excitatory- inhibitory networks? Please clarify this point.
We thank the reviewer for raising this point. We chose to model a purely excitatory network as a first step in isolating the role of extracellular potassium dynamics in generating population-level bursting. This allows us to focus on the ion-driven modulation mechanisms without introducing additional complexity from inhibitory feedback. Similar modeling choices have been made in previous studies of bursting and seizure-like dynamics (e.g., Gutkin et al.,), where inhibition is omitted to emphasize intrinsic or modulatory mechanisms. We acknowledge that incorporating inhibitory populations is an important next step for capturing a broader range of dynamics, but for the current study, the excitatory-only network provides a minimal and interpretable framework aligned with our focus.
(Q8) By comparing Figures 4 (a) and (b) it seems that the bursting activity observed in the experiment and in the mean-field simulations seem quite different, originating from different mechanisms and bifurcations, Can the authors comment on this?
We thank the reviewer for this important observation. We have reorganized the presentation of Figure 4 and revised the accompanying text to better clarify the nature of the comparison (see also our response to Reviewer 1, point 6). Our aim is not to claim that the experimental and simulated bursts arise from identical bifurcation mechanisms, but rather to highlight shared qualitative features — in particular, slow modulation of population activity by extracellular potassium. We now also comment on the potential role of more complex or noise-driven bifurcations (see Saggio et al. 2020) in shaping experimental bursting dynamics, which are not fully captured by the current deterministic model.
Bifurcation analysis: emergent network states and multistability
(Q9) This sub-section will gain interest by reporting simulations of the network and of the neural mass model presenting bistable dynamics.
We agree with the reviewer that this would be an important addition, but we believe that it goes beyond the scope of this work (for the computational reasons among others) and it remains for future work. We have however updated the bifurcation analysis section.
Limitations of the model
(Q10) Lines 276- 280 -- I think that the parameters c+,c_,R+,R_ depend not only on the slow variables, potassium concentrations but also on the actual value of the gate variable n. This should be stressed.
We thank the reviewer for this helpful observation. We agree and have clarified in the revised manuscript. This reflects the mean-field assumption that n is treated as a collective variable, and we now make this dependency explicit in the text.
“Furthermore, the parabola coefficients c_-,c_+, R_-, R_+ were fixed as constants, however, these coefficients could be made functions of the slow variables and the gating variable, which might unveil new dynamical regimes and extend the validity of the thermodynamic limit beyond the regimes described in this work. Also, in the case of constant values, an in-depth exploration of the parameter space is required to fully characterize the model and its bifurcation structure.”
(Q11) The authors wrote: " Other limiting assumptions are the moment closure condition (19) and the assumptions that the functions (3) averaged across the neuronal population can be expressed as functions of the average membrane potential V and gating variable n (which is only true in the cases where the functions (3) can be reasonably approximated as linear functions in a range of V and n." Apart from that a parenthesis is lacking, I think that this last aspect has been already taken into account when performing the fit with 2 parabolas to the sum of the currents, or not? In case, please specify.
We thank the reviewer for catching the missing parenthesis — this has been corrected in the revised manuscript. Regarding the modeling point: the two-parabola fit applies specifically to the membrane potential dynamics and captures the nonlinear dependence of the total current on V (eq.16). In contrast, the moment closure assumption involves approximating averages of nonlinear functions of both V and n, such as those appearing in the gating dynamics (e.g., n∞(V)). This is not directly accounted for by the parabola approximation, but is handled separately via the mean-field approximation of G^n as a function of the average variables (eq.15).
(Q12) A limitation that should be stressed is that the authors in the neural mass model consider the gate variable and the potassium concentrations, as global variable equal for all neurons, and where n depends on the mena membrane potential, to write that the moment closure (19) is a limiting assumption is honestly too clear, please be explicit here.
We have now the following two statements:
“These slow variables are in addition considered to be mesoscopic, meaning they are identical for every neuron in the population.”
“In our mean-field model, the gating variable (n) is treated as a global population variable, evolving deterministically as a function of the average membrane potential. Therefore, ⟨n(t)⟩ corresponds to the collective gating variable assumed to be shared by all neurons, and is not computed by averaging distinct microscopic (n<sub>i</sub>) values.”
Discussion
(Q13) The authors could discuss in this section the further biological ingredients they can introduce in their neural mass based on the previous works [R1-R9] that have already shown how to include plastic synapses, random connectivity, noise, adaptation, spike-timing-dependent plasticity, etc and which of these ingredients they consider more relevant for the whole brain dynamics.
In order not to repeat the same statements from the Introduction, we have now addded the following sentence:
“This approach, taking into account key biophysical details, offers a first step in considering the role of the glia in neural tissue excitability. Following this direction, other ions, such as calcium should be taken into consideration, as well as other effects such as plastic synapses, random connectivity, noise, adaptation, spike-timing-dependent plasticity, as already discussed in the Introduction.”
(Q14) The authors should also discuss why they limited their analysis to purely excitatory networks, and what would change by including excitatory-inhibitory interactions in each single mass and across neural masses, if this makes sense or not.
As stated in our response to Q7, we chose to focus on purely excitatory networks as a first step to isolate and study the core role of extracellular potassium dynamics in driving bursting behavior. This modeling choice allows for a minimal system where the interaction between intrinsic ionic mechanisms and network coupling is most transparent.
We also note that excitatory and inhibitory effects can be modeled within the same formalism by adjusting the synaptic reversal potential — for example, $E_{syn}=0$mV for excitatory, and $E_{syn}=-80$mV for inhibitory interactions. Including inhibitory populations would introduce additional complexity and richer dynamical regimes (e.g., oscillatory instabilities, balance states), which are certainly of interest but beyond the scope of this study.
Materials and Methods
(Q15) Fig.2 - I think a plus is lost in panel (c) where it should be [K+bath];
Thank you. We corrected the figure.
(Q16) Caption of Figure 2- the authors wrote: "In the case where the derivative of the membrane potential is zero for V > V ⋆ (e.g., if the cubic function is shifted up by adding a constant current to the membrane potential derivative), the population is described by the red distribution in the steady state, and the continuity equation is governed by the negative parabola equation." This sentence is unclear, the authors mean in the case where the derivative of the membrane potential crosses zero at V > V*? Please clarify.
We thank the reviewer for pointing this out. Yes, we refer to the case where the membrane potential derivative crosses zero at a point V>V∗. We have clarified this in the revised figure caption.
(Q17) Lines 558-562 -- Eqs (6) and (7) are examples of unnecessary complications of which this manuscript is full of. Since the authors do not consider any synaptic dynamics and homogenous (equal) couplings, these equations are not needed, I strongly recommend removing Eqs (6) and (7) and limiting to the expression reported in Eq (8), which indeed should also be corrected see next remark.
We appreciate the reviewer’s concern regarding clarity. As mentioned in our response to Reviewer 1, the inclusion of Eqs. (6) and (7) was intentional and serves a pedagogical purpose — to present the general structure of the network interactions before introducing simplifying assumptions. While we agree that Eq. (8) suffices for the simulations considered in this manuscript, we believe that showing the more general form helps clarify the model’s extensibility, for instance to cases with heterogeneous coupling or synaptic dynamics.
(Q18) Eq (8) - line 562 - Since the authors assume no synaptic evolution, i.e. instantaneous post-synaptic potentials, they can clarify that Eq (8) represents the population firing rate that later will be one of the fundamental variables of the neural mass model and call it r, as in the following. Furthermore, $s_i$ does not depend on the neuron index $i$ in a fully coupled network with homogenous coupling, as in the present case, this quantity is the same for all neurons. Please drop the index and call it r since it is the population firing rate.
We thank the reviewer for this useful suggestion. We now clarify in the text that under the assumptions of all-to-all homogeneous coupling and no synaptic dynamics, s_i is identical for all neurons and can be interpreted as the population firing rate r. This connection is made explicit in the revised manuscript.
“Under the assumption of instantaneous synaptic transmission and homogeneous all-to-all coupling, the synaptic activation variable (s<sub>i</sub>) is the same for all neurons and corresponds to the population firing rate, which we denote by (r)”
(Q19) Line 564-567 - Here the network model is incomplete, it is not sufficient that the authors report the evolution equation for the membrane potential Eq (9). They should report the evolution equation for the gate variable n and for the potassium concentration as done in Eq (1). This request is fundamental because it is unclear from the present formulation which are the variables that are microscopic (associated with the single neuron evolution) and which are global (common to all the neurons). This is a fundamental aspect and it should be clarified. I guess that n will depend on the neuron index $i$, while the potassium concentration it is unclear how the authors will consider them, global or local. I guess that the internal density should depend on the neuron index $i$ or not ? Anyway, I would like to know exactly which network model has been simulated e.g. to obtain the results reported in Figure 3.
We thank the reviewer for this essential clarification request. In the revised manuscript, we now explicitly state the full network model, including the evolution equations for the gating variable n_i and potassium variables. While in some simulations we consider the full microscopic model involving 4N variables (where each neuron has its own V_i ,n_i ,Δ[K+]int_i ,[K+]g_i), for the mean-field reduction and mesoscopic comparisons we assume that the gating and potassium variables are shared across neurons. This assumption is consistent with prior work (e.g., Chen & Campbell) and is biophysically justified in the case of potassium due to its fast spatial equilibration in extracellular space. We also now mention this explicitly in the Limitations.
(Q20) Continuity equation - Lines 568 - 597 - This part can be largely simplified and rewritten, as a matter of fact, the authors consider the gate variable n, the potassium concentrations as global (collective variables) depending on mean field values of <V> they can directly start from eq 20, by stating that they assume that the other variables (n, $\Delta[K^+]_{int}$, $[K^+]_g$) are collective variables, common to all the neurons, and that depends only on mean field variables as <V> or r. This has been done in many previous cases since the Ott-Antonsen Ansatz can be applied whenever the potential evolution is driven by quadratic terms and in the presence of mean field variables, the first indication of this was reported in 1993 by Watanabe and Strogatz for phase oscillators :
[R12] Watanabe, Shinya, and Steven H. Strogatz. "Integrability of a globally coupled oscillator array." Physical review letters 70.16 (1993): 2391.
Anyway, this approach has been previously employed to derive a neural mass model for networks of QIF neurons in the presence of various further neuronal variables (ranging from slow currents to plastic evolution of the couplings) describing more biologically realistic situations, see references [R1-R7] above. I strongly encourage the authors to reformulate their approach in a simpler and clearer manner, particularly interesting is for them the article [R6] by Guerriero et al, the authors examine exactly the same model as in Ref [95] [Chen, L. & Campbell, S. A. Exact mean-field models for spiking neural networks with adaptation. Journal of Computational Neuroscience 50 (4), 445-469 (2022)]. However, they solve the problem in a much more simple way, I encourage the authors to follow this approach.
We thank the reviewer for the constructive suggestion. We acknowledge that, under the assumption that n, Δ[K+]int , and [K+]g are collective variables shared across the neuronal population, one could directly begin from Eq. (20) and proceed using the simpler approaches found in Guerriero et al. [R6] or related works [R1–R7]. However, we chose to retain the Chen & Campbell formalism, with additional clarification regarding the mesoscopic nature of the gatin variable, as it explicitly highlights the key approximations used in the derivation, which may be beneficial for readers seeking to extend the method. See also general response to reviewer 2 at the beginning.
(Q21) Eq (26) -- I do not think the authors can estimate explicitly <n(t)> from the equation (26), as they do for the mean membrane potential and the firing rate. This is just a formal expression representing a collective variable, I do not think that <n> will coincide with the average of the values of n_i for each neuron. Please discuss this point, and in this case show that <n> indeed coincides with the average of all of the values of the single neuron gate variable n_i.
We thank the reviewer for raising this important point. We agree that Eq. (26) is more formal than operational, as ⟨n(t)⟩ is not directly derived from the continuity equation in the same way as ⟨V⟩ or the firing rate r. Rather, it reflects our mean-field assumption that the gating variable evolves as a collective population-averaged quantity, governed by the dynamics of the average membrane potential. In our formulation, n is treated as a global variable shared across neurons, and thus ⟨n(t)⟩ effectively is the gating variable in the neural mass model — rather than the result of averaging heterogeneous n_i. We have clarified this distinction in the text to avoid suggesting that Eq. (26) provides an explicit estimate of microscopic gating dynamics.
“Unlike the mean membrane potential ⟨V⟩ and the firing rate (r)>, which can be explicitly derived from the continuity equation under the Lorentzian assumption, the expression for ⟨n(t)⟩ in Eq. (26) is formal. In our mean-field model, the gating variable (n) is treated as a global population variable, evolving deterministically as a function of the average membrane potential. Therefore ⟨n(t)⟩ corresponds to the collective gating variable assumed to be shared by all neurons, and is not computed by averaging distinct microscopic (n<sub>i</sub>) values.”
(Q22) Mean-field dynamics for the gating variable - All this sub-section is in my opinion not useful, if the authors assume from the beginning that <n(t)> is a global variable. Indeed in the end they write for <n(t)> the evolution equation Eq (30) which is the same equation as for the single neuron gate variable (1) but for the mean values of n and <V>. I suggest removing this sub-section.
We thank the reviewer for this suggestion. We agree that, under the assumption that n is a global collective variable, the resulting equation for ⟨n(t)⟩\langle n(t) \rangle⟨n(t)⟩ is equivalent in form to the single-neuron gating equation, driven by the average membrane potential. However, we chose to retain this subsection to explicitly demonstrate how the gating dynamics enter into the mean-field formulation, especially for readers less familiar with this type of reduction. This step also mirrors the structure of the derivation used for other state variables in the model and maintains clarity for potential extensions where n may not be strictly global.
(Q23) Line 696 - here an equation reference is lost.
Thank you for pointing this out. We have corrected the text and restored the missing equation reference in the revised manuscript.
(Q24) Eqs (36) -(37) -- Since the variables r and x entered in Eq (36) are essentially the same as Eq (25), apart from a constant R/pi, the use of two different names complicated in a useless manner an already complicated expression, Please decide to use everywhere r or x and then proceed consequently this applies also to Eq (37). This will also allow us to rewrite the equation in x or r in a more compact form.
As noted in our response to Reviewer 1, point 14, we have revised Eq. (37) to ensure consistency in notation by replacing x with r throughout.
(Q25) Eq (37) - This equation is written in a manner that is not careful enough, apart from that the authors are passed now from (x,y) to (pi*r/R,V) , therefore they should substitute everywhere x with r. Furthermore, the equation for the derivative of V is confusing, the authors should use the same approximate expression employed in eq (36) that makes explicit the quadratic dependence on V itself, otherwise, I believe that the equation is incorrect.
In the same response to Reviewer 1, point 14, we also clarified the expression for \dot{V} in Eq. (37), we reintroduced the full current-based formulation (as in Eq. 16), reversing the quadratic approximation used earlier. This is now explicitly stated in the text, and we have improved the equation presentation to avoid confusion.
(Q26) Eq (37) below line 708 - From this expression, it is clear that the gate variable n and the potassium variables are ruled exactly by the same equations as for the single neuron Eq (1) and that the Lorentzian Ansatz enter only in the rewriting of the evolution of the membrane potentials of the neurons in the network. In the end, the authors are doing exactly the same approximation made by many other authors [R1-R7], that these variables are collective, i.e. they are the same for all neurons, and in particular n=n(V) is a function of the mean membrane potential V. The mean field model that the authors derive corresponds to a microscopic model where the single neurons are heterogenous only in the intrinsic currents $\eta_i$, but they are all driven by collective variables, like n(V) and the potassium variables that are identical for all neurons. This should be clarified.
We agree with the conclusion by the reviewer, and as seen through the previous responses, we now explicitly acknowledge the fact that n and the two slow variables are considered as a mesoscopic variables for the mean-field derivation, while for the spiking network, n remains microscopic.
This writing machine would permit you to use a new process of composing text. For instance, trial drafts could rapidly be composed from re-arranged excerpts of old drafts, together with new words or passages which you stop to type in. Your first draft could represent a free outpouring of thoughts in any order, with the inspection of foregoing thoughts continuously stimulating new considerations and ideas to be entered. If the tangle of thoughts represented by the draft became too complex, you would compile a reordered draft quickly. It would be practical for you to accommodate more complexity in the trails of thought you might build in search of the path that suits your needs.
Modern Day LLMs and such seem to fill a higher abstraction of this process as a tool but the question then is at what parts do you want it to handle the complexity vs human cognition handle it.
As in, is there an abstraction limit to the amount of complexity a human can handle in this way? Up until now it seems there is no limit and we have augmented upwards infinitely with new technology.
Artifacts—physical objects designed to provide for human comfort, for the manipulation of things or materials, and for the manipulation of symbols.
The category of artifact may need to expand to include objects both digital and physical, and the increasingly common case where the two overlap.
A spreadsheet manipulates symbols in roughly the way a slide rule did, while sitting on the same screen as a video call. Meta Glasses and similar wearable interfaces add another layer where the artifact is physical, the manipulation surface is digital, and the input modality is the human body.
Voice and gesture have rejoined the list of ways we touch our symbol systems, after several decades where keyboard and mouse dominated.
cultivate a better field of inquiry
good mantra for the IndyWeb
The design of the space shapes the quality of the thought.
design of the space
shapes the quality of the thought
The form may mimic or simulate understanding before inquiry has matured.
simulacrum of understanding before inquiry matured
It becomes a reflective surface, patterning partner, and provocation device inside a human field of judgment.
reflective surface, patterning partner
human field of judgements
but if you have no way of aving the exchange
and in fact anything you find valuable on the Web
so taht you can find it again and connect with relevant context
or should I say relevant associative complexes or comNplexes I sused to write about conPlexes
it should indeed be comNplexes
Generate a first-pass map.Ask what shaped the map.Ask what was omitted.Ask for rival models.Ask for evidence levels.Ask critics to challenge the frame.Convert the result into a human-accountable synthesis.
Gameⁿ as the shift from response to metalogue
response to metalugue
The generative center question does not ask AI to decide.It asks humans to learn.
ask humans to learn
symmathesy indeed
mutual learning
If Playⁿ is the invitation, Gameⁿ is the field.Gameⁿ says: play becomes more generative when it has a form.
Playn invitation gamen is the filed Cards for Insight

temptation to treat AI as an oracle. And it refuses the temptation to treat AI as merely a contamination.
temptation oracle contaminaion
These dilemmas belong in the center of the Playⁿ field.
Anticipatory systems intelligence turned response-ability.
Pr
How do we gain the benefits of AI without confusing fluency with understanding?
confusing fluency with understanding
Platforms reward the most emotionally legible positions.
emotionally legible position
Seth Meyers. Jimmy Kimmel's Halloween Candy Prank: Harmful Parenting? Psychology Today, October 2017. URL: https://www.psychologytoday.com/us/blog/insight-is-2020/201710/jimmy-kimmels-halloween-candy-prank-harmful-parenting (visited on 2023-12-10).
Jimmy Kimmel’s Halloween Candy Prank makes young children upset by telling them their candy was eaten. Experts say kids under 10 may not understand the joke because their brains are still developing. The prank is not considered true trauma, but parents should still be careful with young children’s feelings.
Face (sociological concept). November 2023. Page Version ID: 1184174814. URL: https://en.wikipedia.org/w/index.php?title=Face_(sociological_concept)&oldid=1184174814 (visited on 2023-12-10).
This is an interesting concept that I haven't really heard of. It seems like its more prevalent in other cultures, but nonetheless, I think its interesting to have a bias on someone based on how they treat other and their overall power and actions towards others. I often base people off of how they are treating someone else like my friend for instance, so I think the concept of "face" encapsulates a good telling of what a person could be about and their ultimate motives.
Seth Meyers. Jimmy Kimmel's Halloween Candy Prank: Harmful Parenting? Psychology Today, October 2017. URL: https://www.psychologytoday.com/us/blog/insight-is-2020/201710/jimmy-kimmels-halloween-candy-prank-harmful-parenting (visited on 2023-12-10).
This article highlights that pranks can be harmful for young children by confusing them. This article says about the Halloween candy prank by Jimmy Kimmel, it argues that those pranks are actually harmful for children since they are emotionally and mentally underdeveloped.
Guilt–shame–fear spectrum of cultures. November 2023. Page Version ID: 1184808072. URL: https://en.wikipedia.org/w/index.php?title=Guilt%E2%80%93shame%E2%80%93fear_spectrum_of_cultures&oldid=1184808072 (visited on 2023-12-10).
This article explains that these cultural differences can influence how people behave in society and how they are taught right from wrong. I found it interesting because it shows that emotions like guilt and shame are not always experienced in the same way across different cultures. It helped me better understand how different cultures shape the way people react to mistakes or bad behavior. Some cultures focus more on guilt and personal responsibility, while others rely more on shame or fear of social judgment. I realize why people may respond very differently to public shaming depending on their background.
Zoë Corbyn. Jennifer Jacquet: ‘The power of shame is that it can be used by the weak against the strong’. The Observer, March 2015. URL: https://www.theguardian.com/books/2015/mar/06/is-shame-necessary-review (visited on 2023-12-10).
Zoe Corbyn in his Gurdian article, talks about a book by Jennifer Jacquet that argues that shame is a strong way to create a solution for issues in society such as pollution and global warming. This is different from guilt because guilt mainly only focuses on individuals instead of influencing large groups or governments into creating change. One key detail from the source is where Jacquet gives an example of a successful shaming campaign where the Occupy Wall Street publicly listed major tax frauds that happened recently at that time, which later played a big role in recovering the unpaid taxes.
Merriam-Webster. Definition of SCHADENFREUDE. November 2023. URL: https://www.merriam-webster.com/dictionary/schadenfreude (visited on 2023-12-10).
This is a Merriam-Webster definition of schadenfreude. It describes the word as the enjoyment of others' misfortune or distress. I think it specifically is talking about the feeling that one would get from others' negative experiences. If a really bad professor liked seeing their students fail, this word could be used in the sentence: my professor experienced schadenfreude when he gave my exam back with a poor score and saw my look of disappointment.
Seth Meyers. Jimmy Kimmel's Halloween Candy Prank: Harmful Parenting? Psychology Today, October 2017. URL: https://www.psychologytoday.com/us/blog/insight-is-2020/201710/jimmy-kimmels-halloween-candy-prank-harmful-parenting (visited on 2023-12-10).
In this article, Seth Meyers argues that pranks can be emotionally harmful for young children because they may not fully understand humor or realize it is a joke. He explains that while the prank is usually not traumatic, parents should still be careful about how they treat children’s feelings and trust because young kids process situations differently than adults do.
Trauma and Shame. URL: https://www.oohctoolbox.org.au/trauma-and-shame (visited on 2023-12-10).
This article talks about how shame is vital when depicting the way someone functions and walks about life. Social media has very current and heavy influences on today's society and the shame and guilt they may face.
Seth Meyers. Jimmy Kimmel's Halloween Candy Prank: Harmful Parenting? Psychology Today, October 2017. URL
I agree with the opinion that parents should be kind to their children. It kind of reminds me of the trend that was going around on tiktok where parents would crack eggs on their kids head then post them crying afterwards. There was a lot of backlash for that one too, and I think its agreeable that parents should never be making their kids cry on purpose.
Seth Meyers. Jimmy Kimmel's Halloween Candy Prank: Harmful Parenting? Psychology Today, October 2017. URL: https://www.psychologytoday.com/us/blog/insight-is-2020/201710/jimmy-kimmels-halloween-candy-prank-harmful-parenting (visited on 2023-12-10).
This article talks about a Halloween prank that Jimmy Kimmel shared to parents on his show. Kimmel told parents to film themselves telling their children that the parents ate all of their candy overnight. Next, it talks about how a child and adult will comprehend the situation differently. The article disagrees that it is a psychologically traumatic experience, since the children immediately find out that the candy has not actually been eaten.
Face (sociological concept). November 2023. Page Version ID: 1184174814. URL: https://en.wikipedia.org/w/index.php?title=Face_(sociological_concept)&oldid=1184174814 (visited on 2023-12-10).
"The Wikipedia article about the word 'face,' describes how face negotiation works as a form of shared social capital — when you lose face it is both personal humiliation and a loss of your place in that society. Therefore, we have to completely rethink what we mean by public shaming; In a culture where relationships are mediated through the currency of face (i.e., a person's reputation), you're not correcting their misbehavior when you humiliate them in front of others — you're dismantling the social structure they rely upon. The authors define the guilt/shame model in terms of shame as something to correct internally, psychologically. However, in a culture where people operate in a world where relationships are based on shared communal values — or face — the damage caused by cyber-shaming will likely be greater than if those same behaviors had been committed offline, not less."
Trauma and Shame. URL: https://www.oohctoolbox.org.au/trauma-and-shame (visited on 2023-12-10).
This article talks about how shame is a normal part of child development, but in trauma it becomes overwhelming and unprocessed, eventually forming the core of a child's identity ("I'm bad…Shame is a normal part of child development, but in trauma it becomes overwhelming and unprocessed, eventually forming the core of a child's identity ("I'm bad, I'm worthless"). This leads to defensive behaviors like lying, rage, and blame shifting, and the only way to help these kids change is by addressing the shame directly with empathy.
Face (sociological concept). November 2023. Page Version ID: 1184174814. URL: https://en.wikipedia.org/w/index.php?title=Face_(sociological_concept)&oldid=1184174814 (visited on 2023-12-10).
The idea of “face” was interesting to me because it shows how shame can work differently across cultures. In many cultures, protecting someone’s social reputation and dignity is extremely important, so criticism is not just personal but can also affect family and community relationships. The source also helped explain why public criticism can feel so intense for some people. Losing respect in front of others can create feelings of humiliation and isolation, even when the original mistake may have been small.
Rebecca Jennings. Stop canceling normal people who go viral. Vox, October 2021. URL: https://www.vox.com/the-goods/22716772/west-elm-caleb-couch-guy-tiktok-cancel (visited on 2023-12-10).
The Vox source about “Stop canceling normal people who go viral” stood out to me because it connects public shaming to ordinary people, not just celebrities. I think this is important because normal people usually do not have PR teams, money, or public experience to protect themselves when they suddenly become the target of thousands of strangers online. This makes public shaming feel less like accountability and more like entertainment sometimes.
Shame is the feeling that “I am bad,” and the natural response to shame is for the individual to hide, or the community to ostracize the person. Guilt is the feeling that “This specific action I did was bad.” The natural response to feeling guilt is for the guilty person to want to repair the harm of their action.
I wonder if children's abilities to develop a understanding between the two emotions has been stunted due to online interactions and the feeling of being removed from immediate consequences.
Shame is the feeling that “I am bad,” and the natural response to shame is for the individual to hide, or the community to ostracize the person. Guilt is the feeling that “This specific action I did was bad.” The natural response to feeling guilt is for the guilty person to want to repair the harm of their action.
I think these definitions that show the distinctions of the two words/feelings is really important when reading this chapter. I tend to use these words interchangeably, but having the clear definitions helped me to better understand concepts in the entire chapter.
Shame is the feeling that “I am bad,” and the natural response to shame is for the individual to hide, or the community to ostracize the person. Guilt is the feeling that “This specific action I did was bad.” The natural response to feeling guilt is for the guilty person to want to repair the harm of their action.
This definition is very important for every individual. Both feelings have common thing about making yourself feel bad, but the consequence of feeling them are completely different. Guilt is the feeling that gives you a lesson, whereas shame makes you run away from the problem causing the feeling of it.
In at least some views about shame and childhood[1], shame and guilt hold different roles in childhood development [r1]: Shame is the feeling that “I am bad,” and the natural response to shame is for the individual to hide, or the community to ostracize the person. Guilt is the feeling that “This specific action I did was bad.” The natural response to feeling guilt is for the guilty person to want to repair the harm of their action.
Shame and guilt may sound similar, but they actually describe different feelings. Shame is more about feeling like a bad person because of how others treat or judge us. It often happens in childhood when parents or adults react harshly to mistakes by saying things like "you are useless,” or “you can’t even do something this simple". Instead of focusing on the mistake, shame makes someone feel bad about who they are as a person. Guilt is happens when we know we did something wrong and feel sorry about it. If you get too busy with work and forget your best friend’s birthday, you might feel guilty and send them a late birthday message the next day. So the feeling comes from your own actions and wanting to make things right. When it comes to public shaming, people often focus more on criticizing or humiliating someone for what they did rather than helping them learn from their mistakes.
18.1. Shame vs. Guilt in childhood development# Before we talk about public criticism and shaming and adults, let’s look at the role of shame in childhood. In at least some views about shame and childhood[1], shame and guilt hold different roles in childhood development [r1]: Shame is the feeling that “I am bad,” and the natural response to shame is for the individual to hide, or the community to ostracize the person. Guilt is the feeling that “This specific action I did was bad.” The natural response to feeling guilt is for the guilty person to want to repair the harm of their action. In this view [r1], a good parent might see their child doing something bad or dangerous, and tell them to stop. The child may feel shame (they might not be developmentally able to separate their identity from the momentary rejection). The parent may then comfort the child to let the child know that they are not being rejected as a person, it was just their action that was a problem. The child’s relationship with the parent is repaired, and over time the child will learn to feel guilt instead of shame and seek to repair harm instead of hide. [1] This view of shame/guilt is perhaps more individualistic and perhaps more common in individualistic cultures [r2]. It might work differently in other cultures (e.g., face [r3])
This is a very interesting and important distinction, though they might seem very similar from the same perspective. I have personally experienced both of these throughout my life, and the common way that I would differentiate the two personally is hide vs repair. There have been times that I have felt that I did something bad and decided to hide or remove myself from it, and there have also been times that I have worked to undo or fix it instead.
18.1. Shame vs. Guilt in childhood development# Before we talk about public criticism and shaming and adults, let’s look at the role of shame in childhood. In at least some views about shame and childhood[1], shame and guilt hold different roles in childhood development [r1]: Shame is the feeling that “I am bad,” and the natural response to shame is for the individual to hide, or the community to ostracize the person. Guilt is the feeling that “This specific action I did was bad.” The natural response to feeling guilt is for the guilty person to want to repair the harm of their action. In this view [r1], a good parent might see their child doing something bad or dangerous, and tell them to stop. The child may feel shame (they might not be developmentally able to separate their identity from the momentary rejection). The parent may then comfort the child to let the child know that they are not being rejected as a person, it was just their action that was a problem. The child’s relationship with the parent is repaired, and over time the child will learn to feel guilt instead of shame and seek to repair harm instead of hide. [1] This view of shame/guilt is perhaps more individualistic and perhaps more common in individualistic cultures [r2]. It might work differently in other cultures (e.g., face [r3])
"Relational repair is how shame becomes guilt in the parent/child model (the parent comforts the child after they've been wronged), which does not exist with social media. Therefore, when one is shamed on social media, the crowd that shames does not come back to help or correct that individual; therefore it appears much more like pure ostracism than a correctional relationship."
Shame is the feeling that “I am bad,” and the natural response to shame is for the individual to hide, or the community to ostracize the person. Guilt is the feeling that “This specific action I did was bad.” The natural response to feeling guilt is for the guilty person to want to repair the harm of their action.
The distinction between shame and guilt in this chapter felt really important to me. Shame focuses on making someone feel like they are a bad person, while guilt focuses on the action itself. I feel like this matters a lot in childhood because the way adults respond to mistakes can affect how children see themselves as they grow up. It also connects strongly to social media today. Public shaming online often feels more focused on humiliating people rather than helping them learn or take accountability.
What do you consider to be the most important factors in making an instance of public shaming bad?
The language that was used, the tone it was said in, and the audience to which it was put out. Another thing to consider is the context of the public shaming, whether it was a reply to something or just out of the blue. In making public shaming bad, I think it depends on multiple different factors, as well as how the audience and person being shamed interact with it. It might often get lost if the person it was directed to doesn't engage with it.
While the example from The Onion above focuses on celebrity, in the time since it was written, social media has taken a larger role in society and democratized celebrity. As comedian Bo Burnham puts it:
This quote shows how social media has changed the way people see themselves. I think many people now feel pressure to always present a perfect version of themselves online. It also explains why social media can affect people’s confidence and mental health.
What do you consider to be the most important factors in making an instance of public shaming bad?
I think public shaming becomes bad when it is done purely for entertainment or out of hate. When this happens, public shaming starts with heavy criticism but allows very little room for the criticized person to learn and grow to actually fix their mistakes, or at least apologize for them, leading to an overall net negative effect.
What do you consider to be the most important factors in making an instance of public shaming bad? What do you consider to be the most important factors in making an instance of public shaming good (if you think that is possible)?
I think public shaming is one of those things where it is best judged with the Consequentialist framework, with the outcome being most important. Public shaming doesn't always affect individuals, and in fact, some are looking for it to grow their platform as a form of engagement, which is where I would qualify it as good for all parties involved.
What do you consider to be the most important factors in making an instance of public shaming bad?
I think the most important factors in making an instance of public shaming bad would be the extent to which people shame. A lot of times people get extremely public shamed, like death threats or getting doxxed for doing something small that doesn't warrant that reaction. Public shaming shouldn't ever put someone in danger or at risk.
What do you consider to be the most important factors in making an instance of public shaming bad?
I think an important factor in making an instance of public shaming bad is if people do it for entertainment. Public shaming can be done for different reasons but when done to criticize for entertainment purposes is bad.
One way to approach questions of this kind is to start from limit cases. That is, go to the farthest limit and see what we find there by way of a template, then work our way back toward the everyday. Let’s look at two contrasting limit cases: one where philosophers and cultural leaders declared that repairs were possible even after extreme wrongdoing, and one where the wrongdoers were declared unforgivable.[1]
I think this passage is interesting because it shows that forgiveness and reconciliation are complicated. Some people believe even serious wrongdoing can be repaired, while others think some actions are impossible to forgive. It made me think more deeply about justice and human behavior.
Do you think there are situations where reconciliation is not possible?
I think that there are many times when reconciliation should not be possible. I think that the section of the textbook regarding the Nazi's is a prime example. Any person or group that commits heinous crimes or partake in a genocide should not have reconciliation.
The term “cancel culture” can be used for public shaming and criticism, but is used in a variety of ways, and it doesn’t refer to just one thing.
I find the phrase of cancel culture very interesting and ironic in many ways because society does not seem to have limits to what is chosen to be canceled and what's not. Someone could get cancelled from something that was brought up years ago that at the time was not controversial.
I think social media makes public shaming much more intense because thousands of people can join in so quickly. Even when someone did something wrong, online criticism can sometimes go too far and turn into harassment instead of accountability. The part about dogpiling made me think about how easy it is for people online to forget there is a real person behind the screen
eLife Assessment
This work by Pyne and Pandey et al. addresses DNase X (DNase1L1) activity at the macrophage phagocytic cup, using an innovative imaging approach that couples visualization of cup formation to spatially resolve DNA degradation. The methodology is technically sound, and the central finding that DNA digestion begins prior to phagolysosomal maturation is considered well supported, though some mechanistic claims may benefit from further evidence and more cautious framing. Overall, the study is solid and provides a valuable framework for investigating early events at the phagocytic cup that may shape responses to pathogens and inflammatory disease.
Reviewer #1 (Public review):
Pyne and Pandey et al. report the observation of early DNA degradation at the phagocytic cup during macrophage engulfment. Using an elegant experimental system that combines actin staining to visualise cup formation with direct monitoring of DNA degradation, the authors identify rapid recruitment of the membrane-bound nuclease DNase X (DNase1L1) to nascent phagocytic cups. This recruitment occurs within minutes of cup formation, is independent of DNA presence at the substrate, and appears to originate from intracellular membrane structures rather than from the extracellular environment. The results support the conclusion that DNase X activity is present at the phagocytic cup and that DNA digestion can begin prior to phagolysosomal maturation.
The study is technically strong. The experimental system is clean, specific, and allows precise spatial and temporal detection of DNA degradation. The imaging-based approaches are carefully executed and enable convincing visualisation of DNase X recruitment and activity. The use of an alternative substrate beyond the primary SNS system strengthens the core observation, and the data broadly support the authors' central claim.
However, several limitations temper the physiological interpretation. The system relies largely on short, free DNA substrates, leaving open how efficiently DNase X processes more complex or physiologically relevant DNA structures, such as nucleosome-bound DNA or neutrophil extracellular traps (NETs). It remains unclear whether DNase X deficiency would alter macrophage responses to larger nucleic acid structures, influence engulfment efficiency, or modify downstream inflammatory signalling pathways such as TLR9 or STING activation. Moreover, the experimental setup prevents full phagocytic cup closure, potentially prolonging DNase activity compared with physiological phagocytosis, which typically proceeds rapidly to cargo internalisation. For example, the peak signal observed in Figure 5 occurs approximately 90 minutes after phagocytic cup formation, a time point at which many phagocytic cups would be expected to have already closed under physiological conditions. Additional work using fully engulfed cargo in more physiological contexts would clarify whether early DNase X activity meaningfully contributes to overall DNA clearance kinetics.
Mechanistically, the signal that triggers DNase X recruitment remains unresolved. Although actin rearrangement was excluded as the primary driver, the upstream cues that direct DNase X-containing membrane structures to the forming cup are not yet defined.
In the broader context, early DNase X activity at the phagocytic cup could represent an additional safeguard against inflammatory signalling by limiting extracellular or surface-associated DNA before phagolysosomal degradation by DNase II. This mechanism may be particularly relevant in settings where DNA fragmentation before engulfment is incomplete, such as necroptosis or NET formation. Determining whether DNase X deficiency exacerbates inflammatory responses, alters DNA clearance efficiency in vivo, or contributes to immune pathology will be critical for establishing its physiological and disease relevance.
Overall, this is a compelling study that introduces a novel concept of pre-phagolysosomal DNA digestion. The conclusions are well supported within the in vitro system used, but further investigation using diverse DNA substrates and physiologically relevant models will be required to fully define the impact of this mechanism on immune regulation and disease.
Reviewer #2 (Public review):
Summary:
This manuscript presents an elegant and innovative imaging approach to visualize DNase activity at the interface between macrophages and extracellular substrates. The platform is technically strong and enables the study of localized DNA degradation with high spatial resolution. The work is of clear interest and provides a useful framework to investigate how immune cells process extracellular DNA. However, several aspects of the mechanistic interpretation and conceptual framing would benefit from clarification.
Strengths:
(1) The study introduces a creative and well-designed imaging platform that allows visualization of localized DNase activity at cell-substrate interfaces.
(2) The approach is technically robust and represents a valuable tool that could be broadly useful to the field.
(3) The experiments are thoughtfully designed and address an important question regarding how immune cells interact with extracellular DNA.
(4) The work opens interesting avenues for studying DNA processing in contexts such as infection and inflammation.
Weaknesses:
While the experimental approach is strong, several key conclusions rely on interpretations that would benefit from further clarification:
(1) First, the conclusion that DNaseX is recruited to phagocytic cups from the "cytoplasm" appears conceptually imprecise. Given that DNaseX is a membrane-anchored protein, it is unlikely to exist as a freely soluble cytoplasmic pool. A more plausible interpretation is that DNaseX is supplied from intracellular membrane compartments. This interpretation would also be more consistent with the data showing dependence on a membrane anchor.
(2) Second, the interpretation that actin polymerization is not required for DNaseX recruitment raises concerns. Phagocytic cup formation is known to depend strongly on actin dynamics, and it is therefore unclear whether the structures observed under actin inhibition represent fully formed functional cups or partial cell-substrate contacts. This distinction is important for interpreting recruitment versus activity, particularly since enzymatic activity is reduced under these conditions.
(3) Third, the identification of DNaseX as the main nuclease responsible for the observed activity is not fully resolved. The conclusions rely primarily on gene silencing and staining approaches, but the specificity of these strategies relative to other nucleases is not addressed. It therefore remains possible that additional enzymes contribute to the observed activity.
(4) Finally, the interpretation of the biofilm experiments may be overstated. While the data clearly show localized DNA degradation in contact with macrophages, it is not fully established that this process depends specifically on phagocytic cup structures. An alternative explanation is that membrane-associated DNase activity more generally mediates this effect. In addition, the physiological relevance of this mechanism would benefit from further discussion.
Overall, the study is technically strong and introduces a valuable methodology, but several central conclusions are only partially supported by the current data and would benefit from more cautious interpretation and clearer conceptual framing.
Tuning a typewriter
reply to u/solestal801 at https://reddit.com/r/typewriters/comments/1tp6xh5/tuning_a_typewriter/
Most will call it "adjusting" in the literature (eg. clean, oil, adjust). That's the sort of thing that's hiding deep within a lot of the repair manuals and found by closely watching lots of YouTube repair videos (and taking notes for when you need them). It's the art hiding within the practice and probably takes the longest to acquire.
This will give you a start for some resources: https://boffosocko.com/2024/10/24/learning-typewriter-maintenance-and-repair/
Some examples of the tidbits include:
By the sound of where you're at, I might suggest buying a Royal KMM for $20 and methodically working your way through this:
eLife Assessment
This important study combines single-molecule imaging and CUT&TAG to address the molecular mechanism underlying the differentiation process that initiates the formation of red blood cells in the bone marrow. The authors provide evidence that the transcription factor GATA2 transiently associates with a new set of genomic loci early in the differentiation process before it is replaced by GATA1. Together, the experiments across three biological systems are solid, but they could benefit from additional details and controls to strengthen the conclusions.
Reviewer #1 (Public review):
Summary:
During erythroid differentiation, hematopoietic progenitors relinquish multipotency and activate lineage programs. The switch from GATA2 to GATA1 is particularly important in this process, yet GATA2 chromatin‑binding kinetics remain undefined. The authors investigated GATA2-chromatin interaction dynamics during erythroid differentiation in three different cell systems using single‑molecule live‑cell imaging, and they also used CUT&Tag to profile GATA2 chromatin occupancy.
By single‑molecule imaging, the authors report two interaction modes for GATA2: short‑lived (<1 s) and long‑lived (>5 s) binding. The proportion of long‑lived molecules, the number of binding events, and the duration of long‑lived binding change (or are maintained) during differentiation. Notably, long‑lived chromatin engagement by GATA2 increases during early erythroid differentiation and decreases at the late stage. CUT&Tag identifies regulatory elements selectively occupied by GATA2 during the early transition stage. Together, these results support a model in which transcription factor kinetics form a dynamic chromatin‑engagement profile that characterizes the GATA2‑to‑GATA1 transition.
Strengths:
(1) Characterizing transcription‑factor binding kinetics during the GATA2->GATA1 transition addresses a fundamental mechanism in erythroid differentiation.
(2) Combining single‑molecule live imaging with CUT&Tag provides both dynamic and locus‑specific perspectives.
(3) Single-molecule analysis across three different cell systems strengthens the potential generalizability of the findings and highlights biological variability.
Weaknesses:
I agree that single‑molecule imaging is a powerful approach for investigating GATA2 kinetics, but the single‑molecule data are the most important part of the paper and need improvement. The analyses focus on three measures: (i) duration of long binding, (ii) proportion of short‑ and long‑binding molecules, and (iii) total binding events. However, several methodological and control issues limit confidence in the kinetic interpretations. The authors should address the following major concerns.
(1) Two binding states: justification and controls
The authors propose two states of GATA2 binding. Are there only two states? Studies that separate short‑ and long‑lived binding (e.g., Chen et al., 2014, PMID: 25342811) address two states of transcriptional factors very carefully. Some long‑binding duration distributions here are very long‑tailed (e.g., Figure 2D middle), suggesting a possible third state. The authors must explain how they determined that two states provide the "best fit" to the data and how they classified "short" versus "long" binding.
Controls should be included for long‑lived and short‑lived binding (e.g., histone proteins, HaloTag‑NLS, or a binding‑deficient GATA2 mutant) as in other studies. These controls are essential to exclude alternative explanations (see points below).
(2) Exclude photophysical and focal‑plane artifacts
The authors should exclude contributions from (i) photobleaching, (ii) blinking, and (iii) Z‑axis motion (disappearance from the focal plane). Although photobleaching correction is mentioned in the Methods, no details are provided. Describe and quantify the photobleaching correction and demonstrate that it was applied across all cell types and conditions.
Some spots in the supplementary movies appear to blink or to move substantially between frames. Provide analyses or controls that distinguish true dissociation events from photophysical blinking/bleaching or axial motion.
(3) HILO illumination and nuclear region sampled
HILO is powerful but sensitive to illumination angle: slight changes sample different nuclear regions (e.g., nuclear interior versus periphery). The nuclear periphery is enriched in heterochromatin and may bias binding statistics. Explain how the authors controlled the HILO angle and confirmed that comparable nuclear regions were imaged across cells and conditions.
(4) Quantification of event counts and long‑binding durations
The number of binding events and measured long‑binding durations are strongly affected by imaging conditions (labeling/staining, bleaching, nucleus size, cell cycle state, focal plane, spot detectability, etc.). Imaging clarity appears to differ among cells/conditions in the supplementary movie. Provide more careful analysis describing how these variables were controlled or corrected for, and assess the sensitivity of results to choices in detection and tracking parameters.
(5) Evidence that spots are single molecules
The authors state that spots represent single molecules but do not provide supporting evidence. Spot brightness varies considerably in the movies. Brightness differences may reflect axial position. Provide evidence supporting single‑molecule assignment (e.g., single‑step photobleaching traces, brightness distributions compared to a known single‑molecule control, or photon count analysis).
(6) Description of spot‑analysis pipeline
The manuscript lacks a sufficient description of the spot‑analysis method. I reviewed the STRAP pipeline paper cited (Haque and Coleman 2025 bioRxiv) and the GitHub code, but the Methods in the current manuscript should include a detailed STRAP pipeline. This would enable readers to evaluate and reproduce the analyses.
(7) Differences among cell systems
The three cell systems yield notably different results (e.g., Figure 2C vs 4C and Figure 2D/3D vs 4D). Provide a more detailed explanation for these differences and discuss how biological variability, technical differences, or imaging biases might account for the discrepancies.
Reviewer #2 (Public review):
In this study, the authors address the molecular mechanism underlying the transcriptional changes during erythroid differentiation from hematopoietic progenitor cells. The authors combine single-molecule live cell imaging and CUT&RUN to analyze the chromatin binding properties of the GATA2 transcription factor prior to and after initiation of differentiation into the erythroid cell lineage. Using three distinct cellular systems, the authors demonstrate that the chromatin binding of GATA2 is transiently increased early in the differentiation process, as evidenced by increased chromatin binding residence time and the emergence of new genomic binding sites identified by CUT&RUN. The strength of the study lies in the combination of single-molecule imaging, which reports on binding dynamics but is agnostic of the binding site, with CUT&RUN, which reports on the binding sites but does not provide dynamic information. The authors clearly demonstrate that chromatin binding of GATA2 is altered early in the differentiation process and is later displaced as cells switch to expression of GATA1, which has been previously observed. The use of three distinct cell lines, in particular the GATA2-SNAP mouse model, is a strength in principle; however, the results are not fully consistent between the different cell systems. A key difference is that the G1E-ER4 and HPC7 cell line models express HaloTagged GATA2 in addition to the endogenous GATA2 protein. The authors go through great lengths to control GATA2-HaloTag expression levels, but they use polyclonal cell lines and do not analyze expression levels of the GATA2-HaloTag transgene, which is a key variable in interpreting their experimental results. Finally, a key variable determined in their single-molecule analysis is the number of binding events observed during the distinct differentiation changes. The number of binding events observed is influenced by the expression level of the tagged protein, which in turn is controlled by the Shield-1 ligand, and the fraction of molecules labeled with the HaloTag ligand. Since transgene protein levels and the labeling efficiency were not determined, it is hard to assess how reliable the measurements of the number of binding events are across all cell lines.
To address the weaknesses summarized above the authors could take the following steps:
(1) Determine the expression levels of the GATA2-HaloTag transgene over the course of differentiation under the conditions used for single-molecule imaging. This will not only allow them to determine the expression of the transgene but also the endogenous untagged protein with which the GATA2-HaloTag fusion proteins compete for binding sites.
(2) To determine the fraction of molecules labeled during imaging, the authors could carry out a titration of the HaloTag ligand and compare the amount of labeled protein under single-molecule imaging conditions to that of saturating labeling of the HaloTag. This approach will ensure that the number of labeled molecules per cell is comparable across experimental conditions and allow the authors to draw more solid conclusions regarding the number of binding events.
(3) The analysis of residence times using single-molecule imaging requires robust single-particle tracking without gaps or interruptions of trajectories. The authors should show images of their particle trajectories to demonstrate that their tracking is robust. Or even better, movies superimposing the trajectories onto the imaging data.
Reviewer #3 (Public review):
Hobbs et al. use live-cell single-molecule tracking (SMT) of HaloTag- and SNAP-tagged GATA2 combined with CUT&Tag chromatin profiling to examine how GATA2 chromatin engagement evolves during erythroid differentiation. Across three complementary systems, G1E-ER4 cells, HPC7 cells, and primary bone marrow progenitors from a new Gata2-SNAP knock-in mouse, they report a transient strengthening of long-lived GATA2 chromatin binding at the "Early" (2 h) erythroid stage, manifested either as increased residence time (G1E-ER4) or expansion of the long-lived bound fraction (HPC7, primary cells). CUT&Tag identifies 1,167 Early-restricted GATA2 peaks partitioning into GATA2-only (promoter-proximal, GATA/RUNX motifs) and GATA2+GATA1 co-bound (distal, GATA/E-box motifs) subclasses. The authors propose that this kinetic phase represents a previously unappreciated dimension of the GATA switch.
This is a strong study with a genuinely novel finding-the non-monotonic kinetic behavior of GATA2 during erythroid priming, supported by complementary measurements in three biological systems. The issues below are largely clarifications, additional analyses of existing data, and modest refinements to the discussion. With these addressed, the manuscript will make a valuable contribution. I recommend a minor revision.
Specific points:
(1) Clarify the photobleaching correction and report per-cell bleach lifetimes.
The long-lived residence time claim in G1E-ER4 cells depends on careful accounting for photobleaching, which the Methods indicate was done via a right-censoring model. For reviewer and reader confidence, the authors should report the per-stage (or per-cell distribution of) photobleaching lifetimes and the photobleach-corrected residence time values alongside the apparent values in Figure 2D. If feasible, including a brief supplementary analysis with an H2B-Halo or similar long-lived control under matched conditions would further solidify the quantitative claims. This is an analysis of existing data and should not require new imaging.
(2) Unify or explicitly discuss the mechanistic differences across systems.
The three systems show qualitatively different signatures: residence time change in G1E-ER4, bound fraction expansion in HPC7, and primary cells. The authors currently group these under "enhanced engagement," but these signatures imply different underlying mechanisms (koff decrease vs. increased kon or increased specific-binding-competent pool). The Discussion partially addresses this by noting engineered vs. native differences, but a more explicit framing in both Results and Discussion would help readers. Specifically, reporting an on-rate proxy (for example, binding events per unit time normalized to detectable molecule number) alongside koff would let readers see how the mechanistic pieces fit together. I do not think this changes the central message; it sharpens it.
(3) Per-cell GATA2 concentration would strengthen the "uncoupling" claim.
A central claim of the Figure 6 model is that chromatin engagement is uncoupled from protein abundance. The ectopic Shield-1 stabilization system is a reasonable design choice, but quantifying total nuclear GATA2-Halo signal (for example, from the pre-bleach frame or a brief high-power acquisition) on a per-cell basis across stages would directly support the interpretation. For the primary cells, where the biological claim is strongest, a western blot or quantitative immunofluorescence on the flow-sorted populations would make the uncoupling argument much more defensible. I recognize this may be one additional experiment, but it is a high-value one.
(4) Additional single-cell distribution analysis.
Figure 1E and Figures 2 to 4 show substantial cell-to-cell heterogeneity, and the Early populations in particular look potentially bimodal. Given that the authors cite Wheat et al. and Palii et al. on probabilistic hematopoietic transitions, a brief supplementary analysis using distribution-based statistics (K-S test, or mixture model) rather than, or alongside, mean-based ANOVA would align the analysis with this conceptual framing and may reveal whether the Early state represents a subpopulation transition rather than a uniform shift. This is purely an analysis of existing data.
(5) Quantitative integration of CUT&Tag with SMT.
The manuscript presents SMT and CUT&Tag as complementary but does not attempt to quantitatively connect them. A back-of-the-envelope calculation of whether a 21% increase in residence time (G1E-ER4), or the fraction expansion in other systems, is consistent with the acquisition of the 1,167 Early-restricted sites, given plausible site affinities, would substantially strengthen integration. Even if the calculation is approximate, framing it explicitly would help readers appreciate that the two datasets reinforce each other.
(6) Short-lived kinetic interpretation and tracking parameters.
The 1.5 s gap allowance in tracking is long relative to the 0.55 to 0.73 s short-lived residence times reported in primary cells (Figure Supplement 1F), which could affect the interpretation of the "slowing of target search" claim. A brief sensitivity analysis with tighter gap parameters in the supplement would reassure readers that this effect is robust. Additionally, please clarify how the inferred slowing of search, which should reduce kon, is reconciled with the increased number of binding events per cell at the Early stage.
(7) CUT&Tag peak definition.
The Early-restricted peak set is defined by presence and absence at q less than 0.01, which can be sensitive to near-threshold peaks. Please report either (a) the CUT&Tag signal intensity distribution at the 1,167 sites across all three stages as a quantitative scatter or density plot, beyond the heatmap in Figure 5C, or (b) the result of a differential binding analysis (for example, DESeq2 on read counts in a union peak set) as a supplementary confirmation. Please also state the number of CUT&Tag replicates per stage and the overlap of Early-restricted sets across replicates.
(8) Knock-in mouse validation.
The Gata2-SNAP allele is a valuable new tool, and it would benefit from slightly more quantitative validation in the supplement. A brief characterization of basic hematopoietic parameters in homozygotes (CBC, LSK/HSPC frequencies, or colony assays) would confirm that the tagged allele is truly physiological and would serve the community that will want to use this mouse going forward. If this has been done, please include it; if not, a statement about what was checked would suffice.
Author response:
We are writing to provide our provisional response to the public reviews. We note that the reviewers’ comments focus primarily on strengthening technical rigor and quantitative interpretation. We have designed the planned revisions to directly address the reviewers’ major concerns and to strengthen the study’s evidentiary basis. We plan to submit a revised manuscript for the final Version of Record.
For clarity, we summarize below the major new experiments and analyses that address the reviewers’ primary concerns:
(1)Validation of Tracking Parameters (Reviewers 1 & 3): We will re-analyze our single molecule tracking data with tighter gap-time allowances (0 seconds) to demonstrate the robustness of our interpretations of short- and long-lived kinetics. We will also generate a supplementary movie with binding trajectories superimposed directly on detected molecules to visually confirm tracking robustness.
(2) Photobleaching & Two-State Controls (Reviewers 1 & 3): We will report per-cell photobleaching lifetimes derived from our global fluorescence decay. To strengthen this analysis, we will include supplementary measurements using a H2B-HaloTag control under matched imaging conditions and perform single-molecule tracking of GATA2 zinc-finger deletion mutants (N-terminal, C-terminal, and double) as a binding-deficient functional control.
(3) Protein Expression & Labeling Efficiency (Reviewers 1 & 2): To address concerns about transgene expression and competition with endogenous proteins, we will quantify Halo-GATA2 levels in G1E-ER4 and HPC7 cells and SNAP-GATA2 levels in primary cells using standardized titration methods with established Halo-CTCF and SNAP-RPB1 reference systems.
(4) Integration of SMT and CUT&Tag (Reviewer 3): We have conducted a quantitative foldchange analysis of our existing CUT&Tag dataset to complement our single-molecule kinetics.
However, as detailed in our specific response below (R3 point 5), we emphasize that directly integrating population-level genomic occupancy measurements with single-cell kinetic measurements is not straightforward. We will therefore frame the relationship between these datasets as a conceptual consistency check rather than a strict quantitative integration. This quantitative analysis supports and refines the Early-restricted peak set, identifying a high confidence strict subset consistent with the broader presence/absence-defined set described in Figure 5 of the manuscript (see Author response images 1–3 and our response to R3 point 7).
(5) Characterization of the GATA2-SNAP Mouse (Reviewer 3): We have characterized hematopoietic populations in the homozygous knock-in mouse, including lymphoid (CD3<sup>+</sup>/CD4<sup>+</sup>/CD8<sup>+</sup>/B220<sup>+</sup>/CD19<sup>+</sup>), myeloid (CD11b<sup>+</sup>/Gr1<sup>+</sup>), and erythroid (Ter119<sup>+</sup>) compartments. These data, presented in Author response image 4, indicate that normal mature hematopoietic output is preserved across genotypes. Statistical caveats are described in the corresponding figure legend and in our response to R3 point 8.
Public Reviews:
Reviewer 1 (Public review):
(1) Two binding states: justification and controls
The authors propose two states of GATA2 binding. Are there only two states? Some longbinding duration distributions here are very long-tailed (e.g., Figure 2D middle), suggesting a possible third state. The authors must explain how they determined that two states provide the best fit and how they classified short versus long binding. Controls should be included for long-lived and short-lived binding (e.g., histone proteins, HaloTag-NLS, or a binding-deficient GATA2 mutant).
Agreed in part; we will attempt the requested binding-deficient control using existing GATA2 deletion constructs, complemented by GRID and H2B-HaloTag controls.
We will clarify that the two-state framework is an operational model rather than a claim that GATA2 can occupy only two physical states. This approach is widely used in SMT studies of chromatin-associated transcription factors and transcription machinery (Gebhardt et al., 2013; Liu et al., 2014; Hansen et al., 2017; Kenworthy et al., 2022). In particular, Ling et al. (Science, 2026) recently used two-exponential survival-probability fitting across 58 Halotagged transcription-associated proteins to distinguish transient and stable chromatin-binding populations, while explicitly noting that the simplified two-state model provides a tractable framework even when the underlying physical behavior may be more heterogeneous.
We agree that our current two-state model may under-represent the diversity of GATA2 chromatin-binding populations in single cells. However, even within this simplified framework, the existing analysis already indicates increased upper-tail dispersion of kinetic measurements (e.g., residence time and/or percentage of stable events) at the single-cell level in early erythroid cells. To support the goodness-of-fit metrics from our two-state fitting, as Reviewer 3 recommends, we will provide a supplementary table containing confidence intervals for the rate parameters and an F-test metric describing the differences between one- and two-state fits.
To determine whether additional binding states exist, we will perform GRID (Genuine Rate Identification from Distributions), which does not bias the model toward a particular number of states and, in our experience across multiple proteins, yields fits with 3-5 binding populations. However, we have found that in many cases, GRID requires aggregating binding events from multiple cells to achieve consistently robust fits for the populations of relatively rare, long-lived (>~30 sec) binding events. Therefore, GRID will assess whether additional populations exist, but we will lose the ability to analyze changes in the cell populations at the single-cell level.
We will include the multi-state analysis as a new supplementary figure. We will additionally clarify in the Results and Methods exactly how short- and long-lived binding events are classified (1-second threshold consistent with prior single-molecule frameworks for transcription-factor chromatin interactions; Gebhardt et al., 2013; Liu et al., 2014; Kenworthy et al., 2022) and direct the reviewer to these passages.
For the requested controls, we will include H2B-HaloTag imaging under matched conditions as a long-lived reference for both photobleaching correction and as a positive control for stable chromatin association, addressing R1 point 2 and R3 point 1 simultaneously.
We will also attempt to address the reviewer’s request for a binding-deficient control. We have lentiviral constructs in hand that encode GATA2 with a C-terminal zinc-finger deletion (which removes the primary DNA-binding domain), an N-terminal zinc-finger deletion, and a double deletion. We will perform single-molecule tracking of these mutants in the engineered cell systems and test whether removing GATA2’s specific DNA-binding capacity produces the predicted reduction in long-lived chromatin engagement, providing a functional perturbation control. The interpretation of these experiments will depend on the mutants expressing and localizing appropriately, which we will validate before drawing kinetic conclusions. We note that an analogous binding-deficient mutant cannot be examined in the physiological context of the Gata2SNAP knock-in mouse, and we will frame the cell-line mutant analyses accordingly. Together with GRID and the H2B-HaloTag control, these mutants provide complementary lines of validation for the two-state kinetic framework.
(2) Photophysical and focal-plane artifacts
The authors should exclude contributions from (i) photobleaching, (ii) blinking, and (iii) Z-axis motion. Describe and quantify the photobleaching correction. Provide analyses or controls that distinguish true dissociation events from photophysical blinking/bleaching or axial motion.
Agreed.
We will substantially expand the methodological description and provide three new pieces of supplementary analysis:
- Photobleaching: A per-cell photobleaching-rate distribution will be plotted for each cell type and differentiation stage, and photobleach-corrected residence-time values will be reported alongside apparent values in the relevant figures. We will also perform H2B-HaloTag imaging under matched illumination, exposure, and dye conditions in each cell line as a longlived chromatin-bound reference, establishing per-cell-type bleach lifetimes to which the GATA2 measurements can be referenced. This approach follows recent SMT precedent in which H2B decay was used to correct residence-time measurements for photobleaching, chromatin and nuclear motion, microscope drift, defocalization, and dye photophysics (Ling et al., Science 2026). The right-censoring photobleach-correction model used in our analysis will be described in detail in the revised Methods, including parameter values and per-cell handling.
- Blinking: The STRAP single-particle tracking pipeline already accommodates fluorophore blinking when linking trajectories across successive frames, following the multiple-targettracing framework of Sergé et al. (Nature Methods, 2008). This use of short gap-frame allowances to avoid artificially splitting trajectories due to fluorophore blinking or transient defocalization is consistent with recent live-cell SMT studies of chromatin-associated factors (Ling et al., Science 2026). We will add an explicit statement to the Methods describing how blinking-tolerant linkage parameters are set, and we will reanalyze representative datasets
with stricter maximum off-frame settings to ensure this parameter does not drive our conclusions (also addressing R3 point 6).
- Z-axis motion: Given our 500-ms exposure and the ~500-nm axial detection range of the HiLo configuration, axial loss is expected to be a minor contributor. We will quantify this indirectly by plotting, as a supplementary analysis, the maximum in-plane 2D spatial exploration of each binding trajectory, defined as the long-axis diameter of the 2D trajectory envelope. Although this does not directly measure z-position, it serves as a control for large apparent displacements that could reflect molecules moving out of the HiLo detection volume and demonstrates that observed dissociation events are not dominated by axial drift.
Representative photobleaching traces from individual cells (lowest, highest, and median bleach rates) will be included to support the single-molecule interpretation (also addresses R1 point 5).
(3) HILO illumination and nuclear region sampled
HiLo is sensitive to illumination angle: slight changes sample different nuclear regions. Explain how the HiLo angle was controlled and confirmed comparable across cells and conditions.
Agreed.
We will add a Methods subsection describing our HiLo illumination procedure. In brief, we started at a TIRF-supercritical angle and reduced it toward epifluorescence just enough to achieve high imaging depth while minimizing out-of-focus background signal. Within each biological system (cell line or primary cells), the TIRF angle was held constant across Basal, Early, and Late conditions to ensure direct comparability of kinetic measurements across stages.
(4) Quantification of event counts and long-binding durations
The number of binding events and the duration of long-binding events are influenced by imaging conditions. Provide a more detailed analysis of how these variables were controlled and assess the sensitivity of the results to detection and tracking parameters.
Agreed.
We will (i) normalize per-cell binding-event counts to nuclear cross-sectional area (extracted from the segmented nuclear masks already in the STRAP pipeline) to control for differences in nuclear size; (ii) report the tracking-parameter sensitivity sweep described above; and (iii) confirm in the revised Methods that all imaging conditions (laser power, exposure, dye concentration, sample preparation) were held constant across stages and cell types, consistent with the existing manuscript text. Per the Reviewing Editor’s guidance, the planned labeling-efficiency and absolute-molecule-quantification experiments will further constrain the interpretation of binding-event counts across conditions.
(5) Evidence that spots are single molecules
Provide evidence that spots represent single molecules.
Agreed.
We will include a small number of per-event intensity traces from our STRAP tracking output, selected to illustrate the single-step photobleaching behavior characteristic of single-molecule emission (intensity remains approximately constant during the binding event and then drops to background in a single step). The nuclear-fluorescence measurements from the planned labeling-titration experiment will also allow us to confirm that bound-spot densities are consistent with single-molecule occupancy at the labeled fraction used for tracking.
(6) Description of the spot-analysis pipeline
The Methods should include a detailed STRAP pipeline description.
Partially agreed; the existing STRAP reference is appropriate, but the Methods will be expanded.
STRAP (Haque & Coleman, 2025) is a consolidated, automated implementation of two well-established, previously published frameworks: SLIMfast / multipletarget tracing (Sergé et al., 2008) and evalSPT (Normanno et al., 2015), both of which are cited in the original manuscript. We will expand the Methods to describe the parameter set used in our analysis (detection thresholds, linking radii, gap-frame allowance, photobleaching correction model) so that readers can assess the analysis without referring exclusively to the STRAP manuscript and code repository, while preserving the cited STRAP reference for the full algorithmic description. We respectfully suggest that a complete pipeline description duplicating Haque & Coleman (2025) would not be appropriate in a primary research article.
(7) Differences among cell systems
The three cell systems yield notably different results. Provide a more detailed explanation for these differences.
Agreed.
We will also explicitly describe the caveats of the engineered systems versus the native GATA2-SNAP primary-cell system, in which endogenous GATA2-SNAP remains under physiological regulation. Specifically, we will discuss how variables such as the GATA1null background, ectopic forced nuclear import of GATA1-ERT, and ectopic GATA2-Halo in G1E-ER4 cells, as well as ectopic GATA2-Halo, endogenous GATA1, and cytokine signaling in HPC7 cells, likely contribute to the observed differences in signatures.
Reviewer 2 (Public review):
(1) Expression levels of the GATA2-HaloTag transgene
Determine the expression levels of the GATA2-HaloTag transgene over the course of differentiation under the conditions used for single-molecule imaging.
Agreed.
This is the central concern flagged by the Reviewing Editor. For each cell line (G1E-ER4 and HPC7), we will (i) measure total nuclear GATA2-Halo fluorescence per cell under matched acquisition conditions and (ii) convert this fluorescence intensity to absolute molecules per cell using a Halo-CTCF/U2OS reference standard (Cattoglio et al., 2019; absolute CTCF abundance quantification applied previously by our group). This will provide per-cell GATA2Halo molecule counts at each differentiation stage (Basal, Early, Late). For the primary GATA2SNAP cells, we will perform the analogous comparison against a SNAP-RPB1/U2OS standard.
(2) Fraction of molecules labeled
Carry out a titration of the HaloTag ligand and compare the amount of labeled protein under single-molecule imaging conditions to that of saturating labeling.
Agreed.
We will perform HaloTag-ligand and SNAP-tag-ligand titrations in each cell type, comparing nuclear fluorescence under the limiting-label conditions used for single-molecule tracking with that under saturating labeling. This will yield a per-cell-type labeled fraction and allow us to confirm that comparisons of binding-event counts across conditions are not confounded by differences in labeling efficiency. The labeled-fraction values will be reported in a new supplementary figure and incorporated into our quantification of binding-event rates.
(3) Robust single-particle tracking
Show images of particle trajectories or movies superimposing trajectories on imaging data.
Agreed.
We will generate visualizations of selected long-lived binding events with single-particle trajectories overlaid on the imaging data — using a multi-frame color overlay (e.g., five sequential frames in distinct colors superimposed) so that linkage of the spot across frames is visually unambiguous — and include them as a new supplementary figure or movie. Examples will be drawn from each cell system to demonstrate consistent tracking quality.
Reviewer 3 (Public review):
(1) Photobleaching correction; per-cell bleach lifetimes
Report the per-stage (or per-cell) photobleaching lifetimes and the photobleachcorrected residence time values alongside apparent values, ideally with an H2B-Halo control.
Agreed.
Addressed by the photobleach-rate distribution and H2B-HaloTag control analyses described under R1 point 2. The supplementary figure will explicitly compare per-cell bleach lifetimes across stages, report photobleach-corrected residence-time values alongside apparent values and include H2B-HaloTag controls under matched conditions in each cell line.
(2) Mechanistic differences across systems
The three systems show qualitatively different signatures: residence time change in G1EER4, bound fraction expansion in HPC7 and primary cells. Reporting an on-rate proxy alongside k_off would help.
Agreed.
Addressed by the cross-system kinetic framing described under R1 point 7 and by the GRID state-spectrum analysis described under R1 point 1. We will explicitly frame the three systems in terms of underlying kinetic mechanism in both Results and Discussion, following the conceptual distinction emphasized by Ling et al. (Science 2026) in which residence time reports binding stability once engaged, whereas changes in bound fraction or event frequency can indicate altered association/recruitment efficiency. In this framework, the G1E-ER4 residencetime signature is consistent with reduced dissociation (a longer-lived bound state), while the longlived-fraction expansion in HPC7 and primary cells is consistent with an increased target-search efficiency or specific-binding-competent pool. Alongside the GRID-derived state-spectrum analysis, we will report an apparent engagement-rate proxy calculated as binding events per unit imaging time normalized to detectable molecule number; this proxy is an approximation, not a direct k_on measurement, as accurate determination of k_on from single-molecule tracking requires concentration-dependent on-rate experiments that are outside the scope of the present study. We thank the reviewer for this suggestion, which we agree sharpens rather than alters the central message.
(3) Per-cell GATA2 concentration and the uncoupling claim
Quantify total nuclear GATA2-Halo signal per cell across stages; for primary cells, a western blot or quantitative immunofluorescence on flow-sorted populations would make the uncoupling argument more defensible.
Agreed.
For the cell lines, the per-cell nuclear GATA2-Halo quantification described in our response to R2 point 1 addresses this point.
For primary cells, where the biological claim is strongest, we will exploit the endogenous Gata2SNAP knock-in itself as a quantitative reporter of total GATA2 protein. Specifically, we will label flow-sorted CD71/Ter119 populations from Gata2-SNAP mouse bone marrow with SNAP-Cell 647-SiR at saturating concentration in a parallel acquisition to the limiting-label single-molecule tracking experiment. Total nuclear SNAP-GATA2 fluorescence at saturating labeling provides a measure of endogenous GATA2 abundance per cell at each erythroid stage, in the same chemistry used for our single-molecule measurements, and will be benchmarked against a SNAPRPB1/U2OS reference standard for absolute molecule counting. This approach (i) measures the protein of interest in the labeling chemistry already established in this study; (ii) avoids reliance on quantitative immunofluorescence, which we have not been able to validate under our flowsorted-cell conditions; and (iii) extends the same analytical framework — saturating versus limiting labeling, with U2OS reference standards — across cell lines and primary cells. Quantitative western blotting on flow-sorted populations remains an alternative we will consider if specifically requested by the reviewers.
(4) Single-cell distribution analysis
Distribution-based statistics (K-S test, mixture model) rather than (or alongside) meanbased ANOVA, particularly for the Early populations, which look potentially bimodal.
Agreed.
We will perform Kolmogorov–Smirnov and Gaussian mixture model analyses of the single-cell long-lived fraction and residence-time distributions across stages, reporting these alongside the existing Welch ANOVA results in a new supplementary figure. This analysis is consistent with the conceptual framework cited in the manuscript (Wheat et al., 2020; Palii et al., 2019) for probabilistic hematopoietic transitions and may reveal subpopulation structure underlying the Early-stage signal. The GRID analysis further complements this by formally testing whether multi-state mixture models are statistically preferred at each stage. However, GRID analysis requires aggregating binding events across cells, which limits our ability to monitor changes in population dispersion at the single-cell level.
(5) Quantitative integration of CUT&Tag with SMT
Attempt a back-of-the-envelope calculation of whether the residence-time or fraction changes are quantitatively consistent with the acquisition of the 1,167 Early-restricted sites.
Partially agreed; will attempt an order-of-magnitude framing.
We thank the reviewer for this thoughtful suggestion. We agree that more explicit framing of the quantitative relationship between the two datasets will strengthen the integration. We will add a paragraph to the Discussion presenting an order-of-magnitude calculation linking the observed residence-time and long-lived-fraction changes to the steady-state occupancy increase predicted at competent regulatory sites, with explicit caveats regarding (i) the inherently semi-quantitative nature of CUT&Tag signal and (ii) the assumptions required to translate population-averaged occupancy into the genome-wide site count observed. For the G1EER4 cells, we observe relatively minor shifts in population-mean behavior as single-cell dispersion increases. Therefore, it may be difficult to directly link population-based measurements (e.g. CUT&Tag) with single-cell kinetic measurements (SPT). This distinction between occupancy and dynamics is consistent with recent systematic SMT analysis of the eukaryotic transcription machinery, in which factors appearing persistently associated in ensemble genomic assays were shown to exchange on second-scale timescales in living cells (Ling et al., Science 2026), emphasizing that population genomic occupancy and single-molecule residence time are complementary but not directly interchangeable measurements. Closing this gap rigorously is a major hurdle for the field and will require substantial technology development on quantitative single-cell CUT&Tag occupancy measurements. We will therefore frame our analysis as a consistency check rather than a strict quantitative integration. The reviewer notes that this analysis “does not change the central message; it sharpens it,” and we agree.
(6) Short-lived kinetic interpretation and tracking parameters
The 1.5 s gap allowance is long relative to the short-lived residence times in primary cells. A sensitivity analysis with tighter gap parameters would help. Also clarify how slowing of search reconciles with increased binding events at Early.
Agreed.
Addressed by the tracking-parameter sensitivity analysis described under R1 point 2. We apologize for the lack of clarity in our original description of the gap allowance. Our current maximum off-frame parameter is set to 2 frames, corresponding to a 0.5-s gap allowance. We will rerun the tracking analysis on representative datasets using a maximum off-frame parameter of 1, corresponding to no missed frames, and will report the resulting residence-time distributions alongside the original analysis to demonstrate robustness. We will also clarify in the Results and Discussion how changes in short-lived binding kinetics are reconciled with the increase in detectable binding events at the Early stage, drawing on the apparent engagement-rate proxy interpreted alongside the GRID-derived state-spectrum analysis.
(7) CUT&Tag peak definition and quantitative analysis
Report (a) signal intensity distribution at the 1,167 sites across stages (scatter or density plot beyond the heatmap) or (b) differential binding analysis (e.g., DESeq2). State replicate count and overlap of Early-restricted sets across replicates.
Agreed; normalized fold-change analysis completed, with replicate-aware differential binding analysis planned if additional replicates are generated.
We have performed a normalized count-based fold-change analysis of the union peak set from the existing GATA2 CUT&Tag dataset (14,468 peaks) using the goodpeaks framework previously used in our group, yielding per-peak log2 fold-change values and discrete dynamicstatus calls (Gained / Lost / Unchanged at |log2FC| ≥ 2) for each of the two transitions (Basal → Early at 0 vs 2 h, and Early → Late at 2 vs 24 h). This provides a conservative quantitative complement to the presence/absence peak-calling analysis presented in Figure 5; if additional replicate data are generated, we will perform replicate-aware differential binding analysis (DiffBind/DESeq2; Love et al., 2014; Stark & Brown, 2011) and report replicate overlap. This analysis addresses option (b) of the reviewer’s request and also enables the visualization requested in option (a) as a cross-stage scatter (Author response image 1). We present the quantitative analysis as a supplement to the presence/absence-defined Early-restricted set in Figure 5 of the manuscript, providing two orthogonal lines of evidence for the same biology. We note that the CUT&Tag experiments were initially performed as a validation step to confirm that the tagged GATA2-Halo constructs recapitulate endogenous chromatin-binding behavior, including appropriate genomic localization and expected GATA switch dynamics. This validation supports the conclusion that the observed single-molecule kinetics reflect physiologically relevant GATA2 engagement. Having established this, we subsequently extended the dataset to perform the quantitative analyses presented here.
Quantitative findings.
- 384 peaks were Gained (|log2FC| ≥ 2) at the Basal → Early transition.
- 1,006 peaks were Lost over the same transition.
- 178 peaks were Gained at Basal → Early and subsequently Lost at Early → Late, defining the strict differentially-restricted Early set (Author response image 1, red points). This set represents the higher-confidence subset of the manuscript’s broader presence/absence-defined Earlyrestricted set (n = 1,167; defined as MACS2 peaks at q < 0.01 present at Early but absent at Basal and Late).
- 200 peaks were Gained at Early and retained at Late, indicating stable acquisition.
- 49 peaks were acquired only at the Late stage.
The discrepancy between the broader presence/absence set (1,167) and the strict differential set (178) reflects the analytical choice the reviewer raised: presence/absence calls based on a peaksignificance threshold are sensitive to near-threshold peaks, whereas differential analysis with a fold-change cutoff captures only sites with quantitatively pronounced stage-restricted enrichment. We interpret these as two complementary definitions: the broader set captures all peaks meeting a stage-specific peak-calling criterion, and the strict subset isolates the most quantitatively dynamic core of that population.
Importantly, the three named example loci shown in Figure 5D of the manuscript — Nono (promoter-proximal), Nr3c1 (intron 2), and Gata3 (distal intergenic) — all survive the strict differential criterion (each shows |log<sup>2</sub>FC| ≥ 2 in both transitions, consistent with a clean Gainedthen-Lost signature). The published example panel therefore represents the high-confidence intersection of both definitions, supporting the robustness of the manuscript’s selected illustrative cases.
We will explicitly state the number of CUT&Tag replicates per stage in the revised Methods and figure legends. Where the differential analysis is currently based on a single replicate per stage, we will explicitly note this and treat the strict subset as a conservative confirmatory analysis. An additional replicate is under consideration for the full revision, and if performed, overlap of Earlyrestricted calls across replicates will be reported.
Motif cross-validation against a matched-GC background using HOMER and/or MEME-ChIP is planned for the strict differential subset and will be reported alongside the original SeqPos analysis in the revised Figure 5F or its supplement.
Author response image 1.
Cross-stage log<sub>2</sub> fold-change scatter for GATA2 CUT&Tag peaks. Each point represents a single peak in the union peak set (n = 14,468). The x-axis shows the log2 fold change from Basal (0 h) to Early (2 h); the y-axis shows the log2 fold change from Early (2 h) to Late (24 h). The sign convention follows the field-standard direction (positive log2FC = increased signal at the later time point). Peaks are colored by dynamic-status classification: unchanged/other (gray; n = 9,794); Lost at Early (blue; n = 109); Gained at Early and retained at Late (orange; n = 200); acquired only at Late (teal; n = 49); and Early-restricted, defined as Gained at Early and Lost at Late with |log2FC| ≥ 2 in both transitions (red; n = 178). The Early-restricted population occupies the lower-right quadrant, consistent with a transient kinetic peak of GATA2 binding.
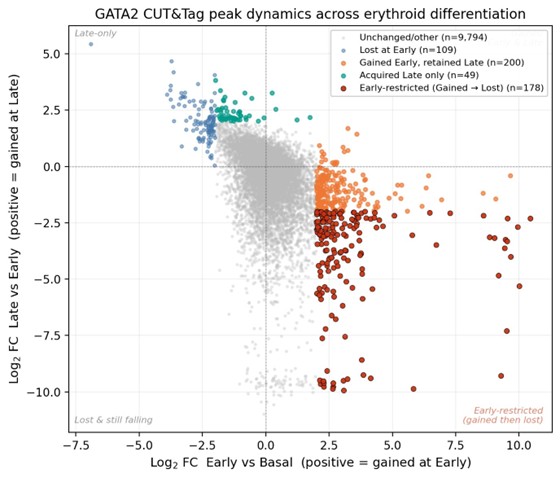
Author response image 2.
Density representation of GATA2 CUT&Tag peak dynamics with Early-restricted peaks highlighted.
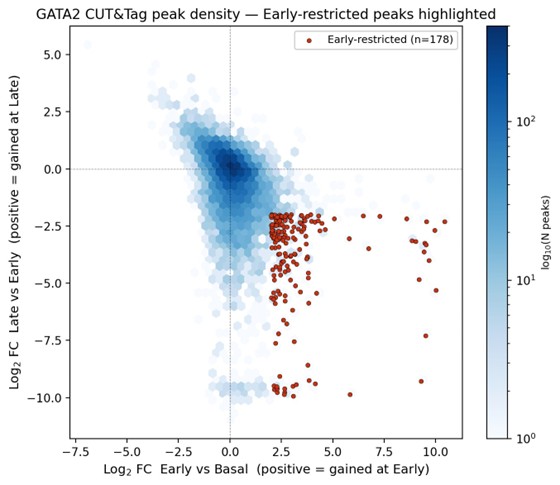
Author response image 2 is shown for illustrative reference and is not annotated with a separate legend; it presents the same data as Author response image 1 in a hexbin density format to emphasize the bulk of unchanged peaks at the origin and the spatial separation of the Early-restricted set.
Author response image 3.
Genomic-annotation comparison of newly acquired GATA2 binding at Early. Stacked-bar comparison of genomic annotations (ChIPseeker classification) for two definitions of the newly acquired GATA2 peaks at the Early erythroid stage: all peaks Gained at Basal → Early (orange; n = 384) and the strict Early-restricted subset (Gained then Lost; red; n = 178). Annotation categories shown: Promoter (≤1 kb of TSS), Intron, Distal Intergenic, and Other (Exon, 5′/3′ UTR, Downstream). Both peak sets contain substantial promoter-proximal and distal/intronic components, consistent with the two-subclass model described in Figure 5E–G of the manuscript (GATA2-only promoter-proximal peaks with GATA/RUNX motifs, and GATA2/GATA1 cobound distal peaks with composite GATA/E-box motifs). The strict subset shows a higher proportion of intronic and distal-intergenic sites and a lower proportion of promoter-proximal sites than the full Gained set; this difference will be discussed transparently in the revised Results. Motif analysis (HOMER/MEME-ChIP, planned for the full revision) will be performed on both peak sets to confirm that the GATA/RUNX and GATA/E-box subclass signatures are preserved.
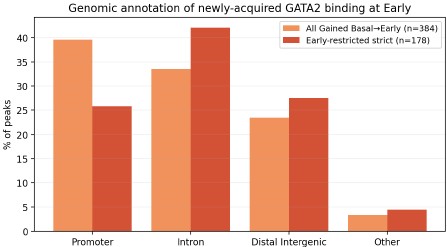
(8) Knock-in mouse hematopoietic validation
A brief characterization of basic hematopoietic parameters in homozygotes (CBC, LSK/HSPC frequencies, or colony assays) would confirm the tagged allele is physiological.
Agreed; data acquired and analyzed.
We have characterized mature trilineage hematopoietic populations in whole bone marrow from wild-type, heterozygous (Gata2Het), and homozygous (Gata2Homo) Gata2-SNAP knock-in mice (n = 5 per genotype). Bone marrow cells were stained for myeloid (CD11b<sup>+</sup> Gr1<sup>+</sup>), lymphoid (CD3<sup>+</sup>/CD4<sup>+</sup>/CD8<sup>+</sup>/B220<sup>+</sup>/CD19<sup>+</sup>), and erythroid (Ter119<sup>+</sup>) markers and analyzed by flow cytometry. Lineage frequencies are shown as percentages of live bone marrow cells in a new Figure Supplement in the revised manuscript.
For myeloid and erythroid populations, omnibus one-way ANOVA detected no significant differences across genotypes (Myeloid: F(2,12) = 2.616, P = 0.1140; Erythroid: F(2,12) = 0.4943, P = 0.6219). Dunnett’s multiple-comparisons test against the WT control did not detect significant pairwise differences for either knock-in genotype (Myeloid: WT vs Het P = 0.1351, WT vs Homo P = 0.9926; Erythroid: WT vs Het P = 0.7017, WT vs Homo P = 0.9602).
For the lymphoid compartment, although the omnibus ANOVA reached significance (F(2,12) = 6.690, P = 0.0112), no pairwise comparison against WT remained significant after multiplecomparisons correction (Dunnett’s adjusted P values: WT vs Het = 0.1217; WT vs Homo = 0.2078). We therefore interpret this result conservatively. Brown-Forsythe and Bartlett’s tests showed no significant differences in variance across genotypes (P = 0.1423 and P = 0.0908), so the result is not attributable to unequal variances. We do not interpret these data as indicating an unambiguous lymphoid phenotype in either heterozygous or homozygous Gata2-SNAP mice; this interpretation is consistent with the broader pattern across all three lineages, in which no pairwise comparison against WT survives multiple-comparisons correction. We will note in the figure legend and in the Results text that more granular HSPC-compartment analysis (LSK, MPP, lineage-restricted progenitor frequencies) and a complete blood count (CBC) remain valuable directions for future characterization of this resource and will be considered for the full revision if specifically requested.
Author response image 4.
Bone marrow trilineage frequencies in Gata2-SNAP knock-in mice. Bone marrow was harvested from the femurs and tibias of wild-type (WT), heterozygous (Gata2Het), and homozygous (Gata2Homo) Gata2-SNAP knock-in mice (n = 5 per genotype; mixed sex; 12–14 weeks). After ACK lysis, cells were stained for myeloid (CD11b<sup>+</sup> Gr1<sup>+</sup>), lymphoid (CD3<sup>+</sup>/CD4<sup>+</sup>/CD8<sup>+</sup>/B220<sup>+</sup>/CD19<sup>+</sup>), and erythroid (Ter119<sup>+</sup>) markers and analyzed by flow cytometry. Each dot represents one mouse, and horizontal bars indicate genotype means. Statistical results: Myeloid: ANOVA F(2,12) = 2.616, P = 0.1140; Dunnett’s adjusted P values WT vs Het = 0.1351, WT vs Homo = 0.9926. Lymphoid: ANOVA F(2,12) = 6.690, P = 0.0112 (omnibus); Dunnett’s adjusted P values WT vs Het = 0.1217, WT vs Homo = 0.2078. Erythroid: ANOVA F(2,12) = 0.4943, P = 0.6219; Dunnett’s adjusted P values WT vs Het = 0.7017, WT vs Homo = 0.9602. Brown-Forsythe and Bartlett’s tests for unequal variance were non-significant in all three lineages. Although the lymphoid omnibus ANOVA reached nominal significance, no pairwise comparison with WT remained significant after multiple-comparison correction; we therefore interpret this result conservatively (see response to R3 point 8).
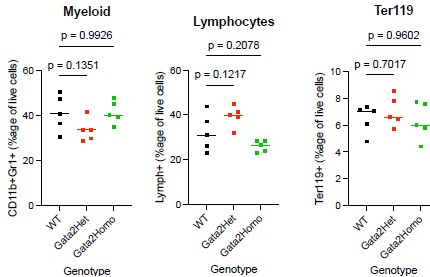
Summary
We thank the editors and the three reviewers for the constructive and detailed assessment. The planned revisions consist of:
- Four new experiments [planned] (HaloTag/SNAP labeling efficiency and absolute molecule counts via U2OS reference standards; H2B-HaloTag photobleaching reference; percell quantification of total endogenous GATA2 in flow-sorted primary Gata2-SNAP populations via saturating SNAP-tag labeling, benchmarked against a SNAP-RPB1/U2OS reference standard; single-molecule tracking of GATA2 N-terminal, C-terminal, and double zinc-finger deletion mutants in the engineered cell systems as a binding-deficient functional control).
- Six analyses of existing data (GRID multi-state fitting [planned]; per-cell bleach-rate distributions and photobleach-corrected residence times [planned]; tracking-parameter sensitivity [planned]; nuclear-area normalization and total-displacement controls [planned]; normalized fold-change CUT&Tag analysis [completed; motif cross-validation planned], presented in Author response images 1–3; distribution-based single-cell statistics [planned]).
- One previously-acquired dataset [completed] (trilineage hematopoietic flow cytometry of homozygous Gata2-SNAP knock-in mice; presented in Author response image 4 with full statistical detail).
- Substantial revisions to text and figures [planned] to address statistical reporting, methodological description, mechanistic framing of cross-system differences, and refinement of the Figure 6 schematic.
With respect to the requested binding-deficient single-molecule control, we will attempt to address this directly using sequence-validated lentiviral constructs in hand encoding GATA2 mutants lacking the C-terminal zinc finger, the N-terminal zinc finger, or both. These mutant analyses will be complemented by GRID multi-state analysis and H2B-HaloTag controls, providing converging lines of validation for the two-state kinetic framework. We note that an analogous mutant cannot be examined in the physiological context of the Gata2-SNAP knock-in mouse, and we will frame the cell-line mutant analyses accordingly.
We believe these revisions directly address the editors’ specific guidance regarding labeling efficiency and methodological clarification. We thank the editors and reviewers for their time and look forward to submitting the revised manuscript.
References cited in this response:
References listed below are cited in this provisional response in support of the planned analyses and methodology.
Cattoglio, C., Pustova, I., Walther, N., Ho, J. J., Hantsche-Grininger, M., Inouye, C. J., Hossain, M. J., Dailey, G. M., Ellenberg, J., Darzacq, X., Tjian, R., & Hansen, A. S. (2019). Determining cellular CTCF and cohesin abundances to constrain 3D genome models. eLife, 8, e40164. https://doi.org/10.7554/eLife.40164
Gebhardt, J. C. M., Suter, D. M., Roy, R., Zhao, Z. W., Chapman, A. R., Basu, S., Maniatis, T., & Xie, X. S. (2013). Single-molecule imaging of transcription factor binding to DNA in live mammalian cells. Nature Methods, 10(5), 421–426. https://doi.org/10.1038/nmeth.2411
Hansen, A. S., Pustova, I., Cattoglio, C., Tjian, R., & Darzacq, X. (2017). CTCF and cohesin regulate chromatin loop stability with distinct dynamics. eLife, 6, e25776. https://doi.org/10.7554/eLife.25776
Haque, N., & Coleman, R. A. (2025). Dynamic transcription pre-initiation complex assembly governs initiation efficiency. bioRxiv. https://doi.org/10.1101/2025.05.07.652662
Heinz, S., Benner, C., Spann, N., Bertolino, E., Lin, Y. C., Laslo, P., Cheng, J. X., Murre, C., Singh, H., & Glass, C. K. (2010). Simple combinations of lineage-determining transcription factors prime cis-regulatory elements required for macrophage and B cell identities. Molecular Cell, 38(4), 576–589. https://doi.org/10.1016/j.molcel.2010.05.004
Kaya-Okur, H. S., Wu, S. J., Codomo, C. A., Pledger, E. S., Bryson, T. D., Henikoff, J. G., Ahmad, K., & Henikoff, S. (2019). CUT&Tag for efficient epigenomic profiling of small samples and single cells. Nature Communications, 10(1), 1930. https://doi.org/10.1038/s41467-019-09982-5
Kenworthy, C. A., Haque, N., Liou, S.-H., Chandris, P., Wong, V., Dziuba, P., Lavis, L. D., Liu, W.-L., Singer, R. H., & Coleman, R. A. (2022). Bromodomains regulate dynamic targeting of the PBAF chromatin-remodeling complex to chromatin hubs. Biophysical Journal, 121(9), 1738–1752. https://doi.org/10.1016/j.bpj.2022.03.027
Ling, Y. H., Liang, C., Wang, S., & Wu, C. (2026). Live-cell single-molecule dynamics of eukaryotic RNA polymerase machineries. Science, 391, eads0960. https://doi.org/10.1126/science.ads0960
Liu, Z., Legant, W. R., Chen, B.-C., Li, L., Grimm, J. B., Lavis, L. D., Betzig, E., & Tjian, R. (2014). 3D imaging of Sox2 enhancer clusters in embryonic stem cells. eLife, 3, e04236. https://doi.org/10.7554/eLife.04236
Loeffler, D., Wang, W., Hopf, A., Hilsenbeck, O., Bourgine, P. E., Rudolf, F., Martin, I., & Schroeder, T. (2018). Mouse and human HSPC immobilization in liquid culture by CD43- or CD44-antibody coating. Blood, 131(13), 1425–1429. https://doi.org/10.1182/blood-2017-07-794131
Love, M. I., Huber, W., & Anders, S. (2014). Moderated estimation of fold change and dispersion for RNAseq data with DESeq2. Genome Biology, 15(12), 550. https://doi.org/10.1186/s13059-014-0550-8
Machanick, P., & Bailey, T. L. (2011). MEME-ChIP: motif analysis of large DNA datasets. Bioinformatics, 27(12), 1696–1697. https://doi.org/10.1093/bioinformatics/btr189
Normanno, D., Boudarène, L., Dugast-Darzacq, C., Chen, J., Richter, C., Proux, F., Bénichou, O., Voituriez, R., Darzacq, X., & Dahan, M. (2015). Probing the target search of DNA-binding proteins in mammalian cells using TetR as model searcher. Nature Communications, 6, 7357. https://doi.org/10.1038/ncomms8357
Palii, C. G., Cheng, Q., Gillespie, M. A., Shannon, P., Mazurczyk, M., Napolitani, G., Price, N. D., Ranish, J. A., Morrissey, E., Higgs, D. R., & Brand, M. (2019). Single-cell proteomics reveal that quantitative changes in co-expressed lineage-specific transcription factors determine cell fate. Cell Stem Cell, 24(5), 812–825.e5. https://doi.org/10.1016/j.stem.2019.02.016
Sergé, A., Bertaux, N., Rigneault, H., & Marguet, D. (2008). Dynamic multiple-target tracing to probe spatiotemporal cartography of cell membranes. Nature Methods, 5(8), 687–694. https://doi.org/10.1038/nmeth.1233
Stark, R., & Brown, G. D. (2011). DiffBind: Differential binding analysis of ChIP-Seq peak data. Bioconductor. http://bioconductor.org/packages/release/bioc/html/DiffBind.html
Taylor, S. J., Stauber, J., Bohorquez, O., Tatsumi, G., Kumari, R., Chakraborty, J., Bartholdy, B. A., Schwenger, E., Sundaravel, S., Farahat, A. A., Dutta, A., Koche, R. P., Steidl, U., & Wheat, J. C. (2024). Pharmacological restriction of genomic binding sites redirects PU.1 pioneer transcription factor activity. Nature Genetics, 56(10), 2213–2227. https://doi.org/10.1038/s41588-024-01911-7
Wheat, J. C., Salsman, J., Reekie, I., Mathhwala, A., Black, K. L., Tiedt, R., Shroff, H., & Steidl, U. (2020). Single-molecule imaging of transcription dynamics in somatic stem cells. Nature, 583(7816), 431– 436. https://doi.org/10.1038/s41586-020-2432-4
eLife Assessment
This manuscript presents a valuable and timely contribution by incorporating desolvation barriers into coarse-grained models of biomolecular condensates. The findings are convincing, supported by a clear physical model and systematic simulations showing effects on phase behavior, packing, and dynamics. Some clarification and broader context would improve the manuscript, but it provides a foundation that will be of use for developing more realistic coarse-grained interaction schemes.
Reviewer #1 (Public review):
This manuscript is very interesting and timely. By introducing the critical effects of desolvation barriers and solvent (water)-separated minima into the implicit-solvent potentials (of mean force, PMFs) for coarse-grained molecular dynamics simulations of biomolecular liquid-liquid phase separation (LLPS), this work fills a gap that should be apparent to researchers of protein folding in the past couple of decades but has so far escaped deserved attention such that these basic features of aqueous solvation have seldom, though not never, been invoked in recent studies of biomolecular condensates. Although the present paper deals almost exclusively with homopolymers, this work can be a foundation for the future development of a new, more physical coarse-grained interaction scheme for simulating amino acid sequence-dependent effects, which I presume is the authors' ongoing or next endeavor. The results presented in this manuscript are highly valuable.
However, there is room for improvement in the authors' description of (i) the broader impact of effects of desolvation barrier and solvent-separated minimum in the thermodynamics of biomolecular condensates, especially with regard to the ramifications on hydrostatic pressure-dependent effects; (ii) the physical implication of using a 20-parameter hydropathy scale rather than a 210-parameter pairwise amino acid interaction scheme; and (iii) temperature-dependent effects, including the authors' discussion of "enthalpic" and "entropic" contributions. In all these aspects, the authors' discussion should be put in a more comprehensive context of the existing literature. At a few other places, the description of the methods and results should be clarified as well. Accordingly, the authors should revise the manuscript to address the following items thoroughly within the revised manuscript (not merely in the response letter) with the additional references mentioned below included in the revised discussion:
(1) In several places, e.g., on line 77 (p.2), the authors appear to suggest that "implicit-solvent representation" is the origin of the deficiency in commonly utilized coarse-grained potentials that this study is aiming to rectify. But desolvation barriers and solvent-separated minima are also features of implicit-solvent representations; they are just features that should be incorporated in more accurate implicit-solvent potentials. This point is stated quite clearly and accurately in the Abstract (p.1) but not consistently in the rest of the text. The authors should check the entire text carefully to ensure that a coherent, accurate perspective is presented.
(2) In the discussion of the importance of desolvation barriers and solvent-separated minima in the Introduction (pp.1-3), connections should be drawn to recent works that utilize these PMF features to rationalize hydrostatic pressure (P)-modulated effects on biomolecular LLPS, including the P-dependent reentrant phase separation of alpha elastin; see Cinar et al. (2019) Chem Eur J 25:13049 (https://chemistry-europe.onlinelibrary.wiley.com/doi/full/10.1002/chem.201902210) and references therein, especially discussions around Figures 10, 11 & 13 in this reference.
(3) In the lower panels of Figures 2D, E (p.5), what do the differently colored small circles in the double-minimum free energy profiles represent? Does the color shading have the same meaning as that in the upper panels? If so, what do the positions of the circles on the free energy profile represent? The authors should clarify this.
(4) The discussion regarding entropy and enthalpy around Figure 2 is quite confusing as it stands. What do the authors mean exactly by the association of entropy or enthalpy with the desolvation barrier of the solvent-separated minimum? Are they referring to conformational entropy?
(5) Do the authors assume that the PMF (effective implicit-solvent potential) is a purely enthalpic term? It appears to be the authors' assumption. If so, the assumption has to be stated clearly in their discussion of "entropy" vs "enthalpy" around Figure 2.
(6) Closely related to points 3-5 above, it should be stated clearly that the "temperature" used in the authors' simulations does not represent experimental temperature if the authors are using purely enthalpic effective potentials because PMFs are in fact temperature-dependent. This clarification is necessary to avoid misunderstanding. In this regard, it should be noted that temperature-dependent effective interactions have been used for modeling biomolecular condensates in analytical theory (Lin, Song, Forman-Kay & Chan, J Mol Liq 2017, already in the citation list) as well as in coarse-grained molecular dynamics simulations [Dignon et al. (2019) ACS Cent Sci 5:821-830 (https://pubs.acs.org/doi/10.1021/acscentsci.9b00102); Chakravarti & Joseph (2025) Protein Sci 34:e70284 (https://onlinelibrary.wiley.com/doi/10.1002/pro.70284)]. The latter two studies, not cited currently, are particularly relevant and thus should be cited because the authors may wish to incorporate temperature-dependent features in their ongoing or future effort in constructing a more comprehensive coarse-grained interaction scheme for biomolecular LLPS simulation.
(7) In tackling "entropy" vs "enthalpy", it should be noted that the temperature dependence of the effective interactions entails an entropic contribution (which is itself temperature dependent) in addition to conformational entropy. As for the effective potential with desolvation barrier and solvent-separated minimum, it should be noted that the decomposition into entropic and enthalpic contributions at the direct contact, desolvation barrier, and solvent-separated minimum can be dramatically different, see, e.g., MaCallum et al. (2007) PNAS 104:6206-6210 (https://www.pnas.org/doi/full/10.1073/pnas.0605859104) and references therein.
(8) P.7, line 340: The proportionality relation follows directly from the standard Flory-Huggins result T_c = T chi(T)/chi_c, thus the proportionality constant is exactly 1/chi_c. Is this the standard relation that the authors are invoking here? The authors should clarify this.
(9) The study on dynamic consequences on pp.8-11 is interesting, but clarifications are necessary:
(i) The vertical schematic in Figure 4A should be explained in detail in its entirety. As it stands, no explanation is provided either in the figure caption or in the text. In particular, what does "elasticity driven" refer to?
(ii) The top snapshot in Figure 4A is labeled t_sim = 0 ns. Does it mean that the snapshot shown is the only chain configuration that the authors used to start the simulation, and that the snapshot does NOT represent the result of any time evolution, no matter how short the duration is? However, if that is the case, why is this snapshot identified with spinodal decomposition if it is not the product of a time evolution from a more homogeneous configuration?
(iii) Related to (ii) - do the rectangular boxes shown represent the entire simulation box or just part of the box containing the polymer chains? One would imagine that if the top snapshot represents spinodal decomposition, the simulation would have been started at a more uniform distribution a short time prior? Why is this not the case?
(iv) What precisely do the small yellow beads and black-colored springs in the zoom-in image of Figure 4E represent?
(10) In discussing dynamic effects, it is useful to draw connections to related works on the effect of chain flexibility on "aging" of condensate [Biswas & Potoyan (2024) PRX 45:9222-9245 (https://journals.aps.org/prxlife/abstract/10.1103/PRXLife.2.023011)] and characterization of viscoelasticity in simulations of biomolecular condensates [Tejedor et al. (2023) J Phys Chem B 127:4441-4459 (https://pubs.acs.org/doi/10.1021/acs.jpcb.3c01292)], as the effects of desolvation can be explored further based on these prior works.
(11) Much of the present study is based on the original HPS formulation of Dignon et al. (2018). In this regard and also in anticipation of future development of improved interaction schemes, several issues should be stated and discussed, even if briefly:
(i) The original HPS model has a basic shortcoming in accounting for the relative interaction strengths of, among others, arginine vs lysine residues [Das et al. (2020) PNAS 117:28795-28805 (https://www.pnas.org/doi/10.1073/pnas.2008122117)].
(ii) Compared to 210-parameter pairwise interaction schemes, such as KH in Dignon et al. (2018) and Joseph et al. (2021), the 20-parameter interaction scheme is likely too restrictive to account for pairwise amino acid residue interactions [Wessén et al. (2022) J Phys Chem B 45:9222-9245 (https://pubs.acs.org/doi/10.1021/acs.jpcb.2c06181)].
(iii) The height of the desolvation barrier may vary significantly for different amino acid residue pairs, see, e.g., Figure 11 of Cinar et al. (2019) mentioned above (and references therein). The authors should discuss these nuances in the revised version. They may also wish to take them into consideration in future investigations.
Reviewer #2 (Public review):
Summary:
This manuscript addresses an important and timely question in the molecular simulation of biomolecular condensates. Most residue-level coarse-grained models used for IDP phase separation employ implicit solvent and represent effective interactions through relatively simple pairwise potentials. While these models have been very useful, they usually do not explicitly distinguish direct contacts from solvent-separated interactions, nor do they include an energetic barrier associated with water removal. This manuscript attempts to address that limitation by introducing desolvation-inspired terms into coarse-grained models and examining their consequences for phase behavior, chain conformations, dense-phase packing, and dynamics.
Strengths:
The central idea is physically well motivated. Using a simple homopolymer model, the authors show that increasing the desolvation barrier suppresses phase separation, whereas stabilizing solvent-separated contacts enhances phase separation. They further show that solvent-separated interactions can reduce dense-phase over-compaction, which is a meaningful result given the known challenges in obtaining both accurate single-chain dimensions and realistic dense-phase properties from the same coarse-grained model. The finding that desolvation-like terms can reshape dense-phase packing without simply rescaling the overall interaction strength is interesting and could be useful for future model development. I also found the attempt to connect conformational changes across dilute and dense phases with thermal distance from the critical point to be intriguing. The dynamic analysis, including the FRAP-like simulations and the discussion of kinetic arrest during coarsening, adds another useful dimension to the work.
Weaknesses:
At the same time, there are several places where the manuscript would benefit from more careful framing. First, the desolvation terms are still effective coarse-grained parameters rather than a direct representation of water molecules. The language sometimes gives the impression that desolvation is being treated explicitly, whereas the model introduces desolvation-inspired effective interactions into an implicit-solvent framework. Second, the conformational analysis is interesting, but the broader context of prior work on dilute-to-dense phase conformational reorganization of IDPs could be more clearly discussed. This would help clarify what is new in the present work, whether it is the conformational change itself, its dependence on desolvation terms, or the proposed scaling with distance from the critical point. Third, the dynamic results are potentially useful, but the manuscript should more clearly articulate what is nontrivial beyond the expected slowing of local rearrangements by an added barrier in the potential.
Overall, I think this is a useful and potentially important contribution.
Author response:
Public Reviews:
Reviewer #1 (Public review):
This manuscript is very interesting and timely. By introducing the critical effects of desolvation barriers and solvent (water)-separated minima into the implicit-solvent potentials (of mean force, PMFs) for coarse-grained molecular dynamics simulations of biomolecular liquid-liquid phase separation (LLPS), this work fills a gap that should be apparent to researchers of protein folding in the past couple of decades but has so far escaped deserved attention such that these basic features of aqueous solvation have seldom, though not never, been invoked in recent studies of biomolecular condensates. Although the present paper deals almost exclusively with homopolymers, this work can be a foundation for the future development of a new, more physical coarse-grained interaction scheme for simulating amino acid sequence-dependent effects, which I presume is the authors' ongoing or next endeavor. The results presented in this manuscript are highly valuable.
We thank the reviewer for all the insightful comments.
However, there is room for improvement in the authors' description of (i) the broader impact of effects of desolvation barrier and solvent-separated minimum in the thermodynamics of biomolecular condensates, especially with regard to the ramifications on hydrostatic pressure-dependent effects; (ii) the physical implication of using a 20-parameter hydropathy scale rather than a 210-parameter pairwise amino acid interaction scheme; and (iii) temperature-dependent effects, including the authors' discussion of "enthalpic" and "entropic" contributions. In all these aspects, the authors' discussion should be put in a more comprehensive context of the existing literature. At a few other places, the description of the methods and results should be clarified as well. Accordingly, the authors should revise the manuscript to address the following items thoroughly within the revised manuscript (not merely in the response letter) with the additional references mentioned below included in the revised discussion:
(1) In several places, e.g., on line 77 (p.2), the authors appear to suggest that "implicit-solvent representation" is the origin of the deficiency in commonly utilized coarse-grained potentials that this study is aiming to rectify. But desolvation barriers and solvent-separated minima are also features of implicit-solvent representations; they are just features that should be incorporated in more accurate implicit-solvent potentials. This point is stated quite clearly and accurately in the Abstract (p.1) but not consistently in the rest of the text. The authors should check the entire text carefully to ensure that a coherent, accurate perspective is presented.
We thank the reviewer for the insightful comment and suggestion. In this work, rather than departing from the implicit‑solvent modeling framework, our intention is to incorporate the desolvation effect within the implicit solvent model framework. In the revised manuscript, we will revise the text to ensure this point is presented clearly and consistently throughout the paper.
(2) In the discussion of the importance of desolvation barriers and solvent-separated minima in the Introduction (pp.1-3), connections should be drawn to recent works that utilize these PMF features to rationalize hydrostatic pressure (P)-modulated effects on biomolecular LLPS, including the P-dependent reentrant phase separation of alpha elastin; see Cinar et al. (2019) Chem Eur J 25:13049 (https://chemistry-europe.onlinelibrary.wiley.com/doi/full/10.1002/chem.201902210) and references therein, especially discussions around Figures 10, 11 & 13 in this reference.
We thank the reviewer for bringing these references to our attention. The hydrostatic pressure modulated effects on LLPS provide important context for understanding the physical significance of desolvation barriers and solvent‑separated minima. In the revised manuscript, we will expand the literature discussion by incorporating previous studies on pressure‑modulated phase separation.
(3) In the lower panels of Figures 2D, E (p.5), what do the differently colored small circles in the double-minimum free energy profiles represent? Does the color shading have the same meaning as that in the upper panels? If so, what do the positions of the circles on the free energy profile represent? The authors should clarify this.
We thank the reviewer for the suggestion to improve the clarity of the figure. In the lower panels of Figures 2D and 2E, the colored dots were intended solely as a qualitative illustration of the populations of residue‑pair configurations along the effective energy surface. Their colors are not related to the color scale used in the phase diagrams shown in the upper panels. We will modify the color scheme to improve clarity.
(4) The discussion regarding entropy and enthalpy around Figure 2 is quite confusing as it stands. What do the authors mean exactly by the association of entropy or enthalpy with the desolvation barrier of the solvent-separated minimum? Are they referring to conformational entropy?
We apologize for the confusion. When the desolvation barrier is high, configurations with inter‑residue distances corresponding to the barrier region become difficult to access, thereby reducing the conformational entropy of the condensed phase. This interpretation is supported by Figure 2—figure supplement 1C, where increasing the desolvation barrier decreases the population in the barrier region of the radial distribution function, indicating that fewer residue‑pair configurations are sampled there. In contrast, increasing the depth of the solvent‑separated minimum makes the condensed phase more energetically favorable. In the revised manuscript, we will incorporate this discussion to improve clarity.
(5) Do the authors assume that the PMF (effective implicit-solvent potential) is a purely enthalpic term? It appears to be the authors' assumption. If so, the assumption has to be stated clearly in their discussion of "entropy" vs "enthalpy" around Figure 2.
We thank the reviewer for highlighting this important point. In this work, the PMF profile is constructed from atomistic simulation results, and thus both entropic and enthalpic contributions shape the overall PMF. In the revised manuscript, we will clarify that the PMF represents a free‑energy profile along the intermolecular distance and therefore incorporates enthalpic and entropic contributions from the solute, solvent, and configurational degrees of freedom.
(6) Closely related to points 3-5 above, it should be stated clearly that the "temperature" used in the authors' simulations does not represent experimental temperature if the authors are using purely enthalpic effective potentials because PMFs are in fact temperature-dependent. This clarification is necessary to avoid misunderstanding. In this regard, it should be noted that temperature-dependent effective interactions have been used for modeling biomolecular condensates in analytical theory (Lin, Song, Forman-Kay & Chan, J Mol Liq 2017, already in the citation list) as well as in coarse-grained molecular dynamics simulations [Dignon et al. (2019) ACS Cent Sci 5:821-830 (https://pubs.acs.org/doi/10.1021/acscentsci.9b00102); Chakravarti & Joseph (2025) Protein Sci 34:e70284 (https://onlinelibrary.wiley.com/doi/10.1002/pro.70284)]. The latter two studies, not cited currently, are particularly relevant and thus should be cited because the authors may wish to incorporate temperature-dependent features in their ongoing or future effort in constructing a more comprehensive coarse-grained interaction scheme for biomolecular LLPS simulation.
We thank the reviewer for raising this important point. We agree that PMFs and the corresponding effective interactions should be temperature dependent, and therefore the simulation temperature in our current temperature-independent CG potential cannot be interpreted as a fully quantitative experimental temperature. In the revised manuscript, we will clarify the above point. We will also expand the discussion to include previous studies that introduced temperature-dependent effective interactions in analytical theories and coarse-grained simulations of biomolecular condensates.
(7) In tackling "entropy" vs "enthalpy", it should be noted that the temperature dependence of the effective interactions entails an entropic contribution (which is itself temperature dependent) in addition to conformational entropy. As for the effective potential with desolvation barrier and solvent-separated minimum, it should be noted that the decomposition into entropic and enthalpic contributions at the direct contact, desolvation barrier, and solvent-separated minimum can be dramatically different, see, e.g., MaCallum et al. (2007) PNAS 104:6206-6210 (https://www.pnas.org/doi/full/10.1073/pnas.0605859104) and references therein.
We agree that a temperature‑dependent PMF includes entropic contributions beyond the configurational entropy discussed around Figure 2. In the present manuscript, our discussion of entropy in that context refers specifically to the reduced accessible configurational space of residue‑pair states in the coarse‑grained ensemble, rather than to a full thermodynamic decomposition of the PMF. In the revised manuscript, we will make this distinction explicit. We will also note that the direct‑contact minimum, desolvation barrier, and solvent‑separated minimum may each have distinct enthalpic and entropic components, and that resolving these components would require additional temperature‑dependent PMF calculations. We will discuss this as a limitation of the current model and as a direction for future parameterization.
(8) P.7, line 340: The proportionality relation follows directly from the standard Flory-Huggins result T_c = T chi(T)/chi_c, thus the proportionality constant is exactly 1/chi_c. Is this the standard relation that the authors are invoking here? The authors should clarify this.
We thank the reviewer for pointing this out. Yes, our argument uses the condition that chi_c is fixed at the critical point for a given chain length. We will revise the text to explicitly state this relation and add the missing intermediate step, so that the proportionality used in the manuscript is clearer.
(9) The study on dynamic consequences on pp.8-11 is interesting, but clarifications are necessary:
(i) The vertical schematic in Figure 4A should be explained in detail in its entirety. As it stands, no explanation is provided either in the figure caption or in the text. In particular, what does "elasticity driven" refer to?
(ii) The top snapshot in Figure 4A is labeled t_sim = 0 ns. Does it mean that the snapshot shown is the only chain configuration that the authors used to start the simulation, and that the snapshot does NOT represent the result of any time evolution, no matter how short the duration is? However, if that is the case, why is this snapshot identified with spinodal decomposition if it is not the product of a time evolution from a more homogeneous configuration?
(iii) Related to (ii) - do the rectangular boxes shown represent the entire simulation box or just part of the box containing the polymer chains? One would imagine that if the top snapshot represents spinodal decomposition, the simulation would have been started at a more uniform distribution a short time prior? Why is this not the case?
(iv) What precisely do the small yellow beads and black-colored springs in the zoom-in image of Figure 4E represent?
We thank the reviewer for pointing out these unclear issues in Figure 4. In the revised manuscript, we will better explain the vertical schematic in Figure 4A, including the progression from the early growth of density fluctuations, to intermediate kinetic arrest, and finally to late-stage coarsening. We will also clarify that “elasticity driven” refers to the resistance to domain deformation caused by transient inter-chain network connectivity. We will clarify that t_sim = 0 denotes the time immediately after the temperature quench from the high-temperature homogeneous state to the low-temperature two-phase region. This snapshot is the post-quench initial configuration, while spinodal decomposition refers to the subsequent amplification of density fluctuations after the quench. The displayed snapshot is one representative trajectory, not the only initial configuration used in the simulations. The quantitative kinetic analysis was averaged over multiple independent trajectories. The rectangular box represents the entire simulation box. Although the system was equilibrated at high temperature before the quench, instantaneous density fluctuations remain, so the initial configuration is not perfectly uniform. In Figure 4E, the yellow beads represent interacting residue pairs. The black springs schematically represent the transient elastic network formed by these interactions, rather than a precise structural model.
(10) In discussing dynamic effects, it is useful to draw connections to related works on the effect of chain flexibility on "aging" of condensate [Biswas & Potoyan (2024) PRX 45:9222-9245 (https://journals.aps.org/prxlife/abstract/10.1103/PRXLife.2.023011)] and characterization of viscoelasticity in simulations of biomolecular condensates [Tejedor et al. (2023) J Phys Chem B 127:4441-4459 (https://pubs.acs.org/doi/10.1021/acs.jpcb.3c01292)], as the effects of desolvation can be explored further based on these prior works.
We thank the reviewer for this helpful suggestion. In the revised Discussion, we will cite and discuss the related studies on condensate aging and viscoelasticity, including the effects of chain flexibility, sticker lifetime, desolvation, and transient network formation on condensate material properties. These works provide an important context for interpreting our dynamic results. We will clarify that desolvation may influence condensate dynamics not only by slowing local rearrangements, but also by modulating transient network connectivity, kinetic arrest, and viscoelastic relaxation.
(11) Much of the present study is based on the original HPS formulation of Dignon et al. (2018). In this regard and also in anticipation of future development of improved interaction schemes, several issues should be stated and discussed, even if briefly:
(i) The original HPS model has a basic shortcoming in accounting for the relative interaction strengths of, among others, arginine vs lysine residues [Das et al. (2020) PNAS 117:28795-28805 (https://www.pnas.org/doi/10.1073/pnas.2008122117)].
(ii) Compared to 210-parameter pairwise interaction schemes, such as KH in Dignon et al. (2018) and Joseph et al. (2021), the 20-parameter interaction scheme is likely too restrictive to account for pairwise amino acid residue interactions [Wessén et al. (2022) J Phys Chem B 45:9222-9245 (https://pubs.acs.org/doi/10.1021/acs.jpcb.2c06181)].
(iii) The height of the desolvation barrier may vary significantly for different amino acid residue pairs, see, e.g., Figure 11 of Cinar et al. (2019) mentioned above (and references therein). The authors should discuss these nuances in the revised version. They may also wish to take them into consideration in future investigations.
We thank the reviewer for highlighting these important limitations of the original HPS-based framework. We agree that a 20‑parameter hydropathy‑scale model has limitation in fully capturing residue‑pair‑specific interactions, including well‑established differences such as those between arginine and lysine. In the revised manuscript, we will explicitly discuss this limitation and cite the suggested studies on residue‑specific and pairwise interaction schemes. We also agree that desolvation barriers and solvent‑separated minima are likely to depend on amino‑acid pair identity. In the present work, we employ a simplified, residue‑independent desolvation parameterization to isolate the general thermodynamic and kinetic consequences of desolvation in coarse‑grained LLPS simulations. In the revised Discussion, we will clarify this scope and emphasize that developing residue‑pair‑specific desolvation parameters, potentially within a 210‑parameter interaction framework, is an important direction for future work.
Reviewer #2 (Public review):
Summary:
This manuscript addresses an important and timely question in the molecular simulation of biomolecular condensates. Most residue-level coarse-grained models used for IDP phase separation employ implicit solvent and represent effective interactions through relatively simple pairwise potentials. While these models have been very useful, they usually do not explicitly distinguish direct contacts from solvent-separated interactions, nor do they include an energetic barrier associated with water removal. This manuscript attempts to address that limitation by introducing desolvation-inspired terms into coarse-grained models and examining their consequences for phase behavior, chain conformations, dense-phase packing, and dynamics.
Strengths:
The central idea is physically well motivated. Using a simple homopolymer model, the authors show that increasing the desolvation barrier suppresses phase separation, whereas stabilizing solvent-separated contacts enhances phase separation. They further show that solvent-separated interactions can reduce dense-phase over-compaction, which is a meaningful result given the known challenges in obtaining both accurate single-chain dimensions and realistic dense-phase properties from the same coarse-grained model. The finding that desolvation-like terms can reshape dense-phase packing without simply rescaling the overall interaction strength is interesting and could be useful for future model development. I also found the attempt to connect conformational changes across dilute and dense phases with thermal distance from the critical point to be intriguing. The dynamic analysis, including the FRAP-like simulations and the discussion of kinetic arrest during coarsening, adds another useful dimension to the work.
We thank the reviewer for all these positive and constructive assessment and comments. We are encouraged that the reviewer found the central idea physically well motivated and recognized the value of introducing desolvation-inspired terms to distinguish direct contacts, solvent-separated interactions, and the energetic barrier associated with water removal in coarse-grained models of biomolecular condensates.
Weaknesses:
At the same time, there are several places where the manuscript would benefit from more careful framing. First, the desolvation terms are still effective coarse-grained parameters rather than a direct representation of water molecules. The language sometimes gives the impression that desolvation is being treated explicitly, whereas the model introduces desolvation-inspired effective interactions into an implicit-solvent framework.
We agree that the current wording should more clearly reflect the nature of our model. The desolvation terms introduced in this work are effective coarse-grained interaction terms rather than an explicit molecular representation of water. In the revised manuscript, we will carefully revise the language throughout the article to describe the model as incorporating desolvation-inspired effective interactions within an implicit-solvent coarse-grained framework.
Second, the conformational analysis is interesting, but the broader context of prior work on dilute-to-dense phase conformational reorganization of IDPs could be more clearly discussed. This would help clarify what is new in the present work, whether it is the conformational change itself, its dependence on desolvation terms, or the proposed scaling with distance from the critical point.
We appreciate this suggestion. In the revised manuscript, we will place the conformational analysis in the context of prior work and discuss the observed conformational changes more explicitly from the perspective of desolvation-inspired interactions. We will also clarify the assumptions behind the scaling relation between conformational change and thermal distance from the critical point.
Third, the dynamic results are potentially useful, but the manuscript should more clearly articulate what is nontrivial beyond the expected slowing of local rearrangements by an added barrier in the potential.
We thank the reviewer for the suggestion. In the revised manuscript, we will clarify which aspects of the observed dynamics can be directly expected from the added desolvation barrier and which trends arise from the combined effects of desolvation on packing density, chain mobility, kinetic arrest, and coarsening.
We again thank the editors and reviewers for their constructive comments and suggestions. We believe that the planned revisions will improve the precision of the model description, clarify the physical interpretation of the desolvation-inspired terms, expand the relevant literature context, and better define the scope and limitations of the current framework.
eLife Assessment
This study presents a valuable framework that uses anticipatory eye movements to track how expectations are formed and revised during implicit probabilistic sequence learning. The evidence supporting a behavioural dissociation between errors arising from environmental noise and errors reflecting an inaccurate internal model is solid, but the oculomotor data describe behaviour rather than explain the underlying computational mechanisms, and the stronger mechanistic claims - that learning is more repetition-based than error-driven - remain incomplete without formal comparison against computational models of error-driven learning. The emerging reaction-time difference between conditions appears driven by slowing to low-probability stimuli rather than facilitation of high-probability ones, an asymmetry that requires decomposition and consideration of alternative explanations. The potential contamination of the anticipatory measure by starting gaze position should be addressed through control analyses, and the "process-pure" framing should be tempered, given that oculomotor behaviour is itself subject to motor learning.
Reviewer #1 (Public review):
Summary:
This manuscript presents an original quantitative approach for tracking the online formation and updating of prior beliefs. In an Alternating Serial Reaction Time task, participants were exposed to probabilistic visual streams, and their pre-stimulus saccadic behavior (i.e., the first eye movement after the previous stimulus disappeared) was monitored via eye-tracking. Since the stimuli followed an alternating probabilistic sequence, upcoming events did not appear with full certainty: some stimuli had a higher, some a lower probability. By comparing anticipatory oculomotor behavior between high and low probability events, the authors dissociated between learning/belief updating and general oculomotor noise. Noise-driven errors were more frequent than learning-dependent errors, which nonetheless triggered more belief updating (i.e., a change in oculomotor behavior in a subsequent encounter of the same event). Interestingly, updating depended more strongly on whether a prior belief was consistent with the task's probabilistic structure than on prediction errors. These findings suggest that incidental, implicit statistical learning may rely on conservative updating with a relatively low learning rate, or on errorless algorithms, rather than prediction errors per se.
Strengths:
By applying a fine-grained analysis of anticipatory oculomotor behavior, this work establishes new continuous metrics to quantify the gradual learning and refinement of prior expectations during statistical learning. These metrics provide convincing evidence of the dynamics of anticipatory oculomotor behavior.
The method is paradigm-independent, offering generalizable metrics for tracking the dynamic formation and refinement of predictive models in any task involving probabilistic stimulus streams. In the future, computational modeling may leverage these continuous metrics to better dissect the mechanisms underlying statistical learning.
Weaknesses:
The authors subscribe to the idea that statistical learning is not a unified concept but rather is implemented via multiple underlying mechanisms. However, it remains unspecified what these different mechanisms could be, and how eye movements could contribute to distinguishing between them.
The authors claim that they developed a novel methodological approach to probe whether anticipatory eye movements directly reflect priors, thereby filling an outstanding gap. However, this claim ignores mounting relevant work on structure learning using eye-tracking in the developmental field.
The authors claim that their framework quantifies trial-by-trial oculomotor dynamics, while in fact the analyses use epochs (i.e. groups of multiple trials) as predictors. Why not use trial number as a predictor to truly investigate trial-by-trial dynamics that directly reflect anticipation, surprisal, and revision?
Reviewer #2 (Public review):
Summary:
Hann and colleagues introduce a gaze-based analytical framework designed to capture, on a trial-by-trial basis, how people form and revise their predictions during implicit probabilistic sequence learning. Using an eye-tracking adaptation of an alternating sequence task, they record the first anticipatory saccade during the response-stimulus interval and classify each such saccade along two dimensions: whether it was directed toward a high- or low-probability upcoming stimulus (the learning-dependent vs. not-learning-dependent distinction), and whether the anticipated location coincided with the stimulus that actually appeared. A complementary iterative-updating metric codes whether a participant's prediction for a given three-element context is repeated or revised on successive encounters of that context.
On the basis of these measures, the authors report that errors congruent with the inferred regularity - which they interpret as reflecting environmental noise - become progressively more frequent than errors reflecting an inaccurate internal model; that participants show a pronounced tendency to repeat their previous prediction rather than revise it; and that updates depend more on whether a prior belief is congruent with the task's statistical structure than on whether the previous prediction was confirmed. They interpret these results as evidence that statistical learning is less error-driven and more repetition-based (Hebbian in character) than is typically assumed.
Strengths:
The methodological ambition of the work is considerable, and the paper makes several contributions that are likely to be useful to the implicit-learning and predictive-processing communities. Using the first anticipatory saccade as a pre-response behavioral readout of prediction is conceptually well-motivated: it provides a trial-by-trial index of predictive orienting at a temporal resolution that manual reaction times cannot deliver, and it does so before the outcome of the trial is known. The explicit distinction between errors arising because the task's outcome is stochastic - that is, predictions congruent with the statistical structure but unconfirmed by the stochastic sample - and errors arising because the internal model is inaccurate is a theoretically meaningful move: predictive-coding and Bayesian accounts have long argued that these two sources of surprise should carry different weight for model revision, and the authors offer a behavioral operationalization of that distinction. The analytical pipeline is not tied to the specific paradigm used here and could be applied to other probabilistic sequence-learning tasks, which gives it broader methodological utility than a single-paradigm report. Finally, the demonstration that learners maintain their prior across successive occurrences of the same context, even when it has been disconfirmed by the most recent outcome, is a robust behavioral observation that speaks directly to an unresolved debate about whether statistical learning is dominantly error-driven.
Weaknesses:
The framework and the core behavioral observations are valuable, but several inferential steps - from the gaze signal to the cognitive constructs the authors invoke - are not fully supported by the present design, and these gaps affect how readers should interpret the stronger theoretical conclusions.
The "process-pure" framing conflates sensitivity with construct purity. The authors repeatedly describe the eye-tracking measure as providing a more process-pure index of statistical learning than manual-response paradigms. Anticipatory saccades are themselves a learned motor behavior - the oculomotor system is among the most plastic motor outputs the primate brain generates, and sequence learning in the saccadic system is well-documented. The present design does not dissociate learning of the statistical structure from learning of the oculomotor sequence that expresses it, so the measure is not, on its face, free from the motor-learning confound that the authors criticize in button-press paradigms. The framing should be read as aspirational rather than as demonstrated by the present data.
The oculomotor reaction-time data do not show the canonical signature of statistical learning. Reaction times for low-probability trials rise across epochs while those for high-probability trials remain approximately flat (Figure 5). The emerging difference between the two trial types, therefore, appears to be driven by a slowing of responses to low-probability stimuli rather than by a facilitation of responses to high-probability ones, and the authors do not rule out the alternative interpretations that this pattern reflects fatigue, a motor floor effect, or inhibition of unexpected locations. Because no fixation constraint is imposed during the response-stimulus interval, pre-stimulus gaze drift toward the anticipated location will artifactually reduce reaction time on precisely those trials the authors wish to treat as learning-driven; the fact that measured reaction times remain well above zero even on trials classified as correct anticipations is itself evidence that this contamination is present. The oculomotor reaction-time data, therefore, do not provide as clean a verification of learning as the manuscript implies.
The correct/error labeling of anticipatory saccades incorporates information that the participant did not have. Because the first saccade occurs during the response-stimulus interval - that is, before the upcoming stimulus is revealed - the participant's internal predictive state is identical whether the trial is subsequently classified as a learning-dependent correct response or a learning-dependent error. Any difference in the epochwise frequency of these two categories must therefore be driven, at least in part, by the external stochastic structure of the task rather than by a difference in the predictive process itself. In particular, the observation that learning-dependent errors are the most frequent saccade type (Figure 7) is predicted by the prior probabilities of the outcomes alone, given a high-probability prediction, without appeal to any difference in predictive state. Readers should recognize that the theoretically meaningful contrast is between learning-dependent and not-learning-dependent anticipations (two categories), and that the four-way split risks confounding predictive state with outcome stochasticity.
The iterative-updating metric does not distinguish prior revision from alternative processes. The binary update / no-update code, computed across non-contiguous occurrences of the same three-element context, does not discriminate between a genuine update of the internal model, simple episodic retrieval of a previously encountered triplet, and oculomotor perseveration. Without a formal generative model to anchor the interpretation, the central theoretical claim - that statistical learning is less error-driven than commonly assumed - is underdetermined by the data. The repetition pattern the authors observe is equally consistent with an error-driven model equipped with a low learning rate in a stable environment, an interpretation the authors themselves acknowledge in the Discussion. Adjudicating between these possibilities requires comparison against explicit computational models, which the present manuscript does not provide.
Data loss and the absence of fixation control. An interpretable saccade is detected on fewer than half of all trials (48.76%; line 889), and the manuscript does not report the distribution of saccade counts per interval, the per-condition trial counts after all exclusions, or the decomposition of the 20% missing-data threshold into its underlying causes. Given that the entire inferential apparatus rests on this subset of trials, the degree of data loss is a relevant context for the reader. Separately, no fixation constraint is imposed between trials: the participant's starting gaze position at the onset of each response-stimulus interval is whatever position was reached at the end of the preceding response, and this starting position carries trial-history information correlated with the upcoming stimulus. This leaves open the possibility that what is classified as predictive orienting partly reflects the mechanical consequences of where the eye happened to be at the end of the previous trial. The authors defend the absence of a fixation cross on the grounds that it would transform the transitional structure of the task, but this is an empirical claim presented without a supporting citation.
Heterogeneity within the high-probability condition is not addressed. The two routes to a high-probability triplet in the design - pattern-random-pattern (50% of trials) and random-pattern-random (12.5%) - differ both in their base rate and in the reliability of the contextual cue they provide. Collapsing across these subtypes is an analytical choice that may conceal heterogeneity in the underlying learning process.
Appraisal: Do the results support the authors' conclusions?
The framework succeeds in providing a trial-by-trial behavioral readout of predictive orienting that is more fine-grained than conventional reaction-time measures, and the behavioral dissociation between errors congruent with the regularity and errors reflecting an inaccurate internal model is a genuine empirical contribution. The conclusions about the mechanistic nature of statistical learning should be read as motivating hypotheses for future modeling work rather than as settled empirical claims.
Impact and utility:
The analytical framework introduced here is likely to be useful to researchers working on implicit learning, predictive processing, and Bayesian models of perception and cognition. The measure of predictive orienting and the iterative-updating code could be adapted to a range of probabilistic learning paradigms, and the behavioral dissociation between noise-driven and model-mismatch errors fills a methodological gap that the field has long acknowledged. The authors share their data and code openly, which will facilitate reuse. The most durable contribution of the paper is methodological; the theoretical claims about the nature of statistical learning will require additional computational modeling before they can be regarded as established.
Author response:
We thank the Reviewers for their time and effort reviewing our manuscript, we are particularly thankful for the literature recommendations of Reviewer 1, and the analysis ideas of Reviewer 2.
We are glad that both Reviewers agree that the method we developed provides value to the field. We furthermore agree that our theoretical claims and conclusions could be supported by further analyses. Thus, we primarily plan to focus on this.
We plan to strengthen our statements by:
- Comparing our metrics to those of alternative learning processes and hypotheses
- Additional analyses, including ones using standardized learning scores, collapsed saccade likelihoods for learning-dependent and not-learning-dependent saccades, angular deviations instead of the binary update variable, and a breakdown of high-probability triplets into ones that end with a pattern element or a random one.
- Adding further information regarding saccades, trials without saccades, and saccade starting points.
Furthermore, we plan to strengthen our Methods section: some of the Reviewers’ points potentially stem from our unclear description of the ASRT task, thus, the Task & Procedure section needs deeper and clearer explanations. Lastly, we will extend the Introduction, citing the literature recommended in the reviews, which indeed could provide further depth.
the nervous system, as well as the propensity for disease and illness.
Growing up involves many different things. When it comes to our bodies, how our brains and nerves grow, and the way they can get hurt along the way, sets the stage for our health and how easily we might get sick later in life.
For example, the physical side of growing up includes how our body changes over time, especially our brain, nerves, senses, and movements. Our brains and nerves do a massive amount of building and shaping during early childhood, but they actually keep growing and maturing well into adulthood. However, if this growth gets disrupted by bad genes, severe stress, or environmental toxins, the brain struggles to keep things balanced. This disruption increases the chances of developing conditions like ADHD or Autism early on, or diseases like Alzheimer's and Parkinson's later in life.
Our health and how we grow are trapped in a lifelong loop where each constantly changes the other. If someone's brain or nervous system is damaged, it can cause slow physical movements or trouble processing senses like sight and sound. On the other hand, things like bad illness or a stressful environment can actually change how the brain develops. Health researchers have proven that our risk for getting sick comes down to this exact mix of the genes we are born with and the world we live in.
Getting sick as an adult isn't just random bad luck; it is actually the final result of how your brain and nerves have been growing since childhood. Our lifelong health is deeply tied to how our bodies, minds, and social lives interact and shape each other as we age. As an autistic adult myself, I can understand this insight. As a child I struggled with socializing, learning, and to understand how important it was to take care of my body (I wouldn't eat and do proper hygiene). But as I aged all of that changed, the way I think, socialize, and how my body reacts to my diagnosis.
Now, my question is: How can early help and brain therapies change someone's growth path for the better and stop them from getting severely sick later in life? I ask this question because, as a child that struggled at home and at school, I've never received early help and support. It was recently, that I've learned about my ADHD and Autism diagnosis. To get diagnosed at this late in my adulthood, it affected my brain and nervous system. I had and still have many questions.
![Basic information about ADHD & Autism and how they overlap] (https://share.google/nRXvAp42o9iSy0Hu7)
eLife Assessment
This valuable study uses large-scale 7T naturalistic fMRI data and nonlinear pRF modeling to map the tonotopic organization of the human auditory cortex, linking spectral tuning to speech selectivity and cortical hierarchy. The evidence is solid, demonstrating that movie-based stimuli can recover robust population-level auditory maps and offering tools for leveraging existing datasets, although there is room for improvement in relating static tonotopy to dynamic speech processing and in presentation clarity. The study will be of interest to a broad audience working on auditory cortex organization and mapping.
Reviewer #1 (Public review):
This paper reports an auditory-directed analysis of the HCP 7T short movie dataset. It has the goal of using the film audio to create tonotopic (pRF) maps and combine these with other HCP-provided data (e.g., T1/T2 ratio) to improve understanding of auditory cortex organization and relative functional segregation, particularly in reference to speech processing.
The paper is ambitious, uses well-founded existing tools for combining data across subjects, and in the Discussion in particular, makes a lot of careful points about interpretation. The paper shows that, at least for a very large dataset on 7T (and for at least a few individual participants) good quality cross-subject-average tonotopic maps can be extracted from fMRI movie datasets via basic spectral modelling of the movie soundtracks. It also suggests ways that these movie-based maps can be combined to come up with potential models of cortical organization. The PCA analysis is a creative way of combining maps (see below for comments)
These are valuable tools for the field in exploiting/exploring existing data, and I look forward to trying them out myself. I want to emphasize that this is not 'damning with faint praise' - a concrete demonstration of this approach with freely available tools/examples is not only the product of a lot of effort (thank you!), but will be an impetus to research going forward.
In terms of the contribution to our understanding of auditory cortex organization, using this large N cohort, they replicate a number of findings in the literature from the last couple of decades, including the overlap of low frequency preference with greater speech stimulus preference (e.g. Moerel, de Martino, & Formisano, 2012, J Neuro), patterns of BF width across cortex (Moerel et al., various; Thomas et al. 2015), use of shorter and longer natural sounds (Moerel et al., 2012, 2014; Dick et al., 2012), the importance/influence of sustained spectral attention for tonotopic mapping (da Costa et al., 2013; Dick et al., 2017; Riecke et al. 2017), the use of tonotopy and 'myelin' mapping to establish areal or regional boundaries (Dick et al., 2012; de Martino et al., 2015; Besle et al., 2018, etc) and the overall shape and consistency of tonotopic maps (e.g., Talavage et al., 2004, Humphries et al., 2010 and many others). To my knowledge/memory, this is the first tonotopy paper that has used the cross-subject cortical-surface-based averaging techniques that are driven by more than curvature/sulcal alignment.
The paper focuses in particular on creating new sets of ROIs based on the various maps derived from the data. Despite being quite familiar with this body of work, I found it difficult to follow how the ROIs were derived, and how and why they were different and/or an improvement over existing parcellation schemes (see for instance Sereno, Sood, & Huang, 2022 for a comprehensive parcellation framework across modalities including auditory, based on combined receptive surface mapping, myelin estimates, and other metrics).
Given the hour of fast(ish) fMRI data on a 7T with pretty big voxels (so high SNR), one aspect of the results that I found surprising - and potentially informative - was the lack of reliable tonotopic 'mappability' in the majority of participants. The authors' analytic approach to computing the pRFs seems completely reasonable (and shows good average maps), and yet individual maps seem unreliable except for the very best examples. I wondered if this might be due to problems in data collection with earbuds becoming slightly uncoupled and therefore delivering a lot less lower-frequency response and also not preventing scanner noise from getting to the ear; this is often a problem with any in-scanner earbud system (including the Sensimetrics). I wondered if the robustness of the 'speech maps' was associated with that of tonotopy; if they are highly associated, that would suggest that either there were huge individual differences in auditory attention, or perhaps that there was some variability in the acoustic signal delivered to each participant.
Reviewer #2 (Public review):
Summary:
In this manuscript, the authors leverage a high-powered 7T fMRI dataset of subjects viewing naturalistic audiovisual movies to elucidate the topographic organization of the human auditory cortex. By applying a nonlinear pRF model, they successfully map tonotopic gradients extending beyond the auditory core into the STG and STS areas. A primary finding is a medial-to-lateral gradient of increasing response compressivity, which the authors claim mirrors the hierarchical cascade architecture of the visual system. Furthermore, the modeling reveals that regions exhibiting high speech selectivity predominantly occupy the low-frequency portions of non-primary tonotopic maps. The authors argue that this architecture reflects an efficient coding mechanism where the cortex magnifies specific spectral features to facilitate the transition from acoustic encoding to flexible speech representation.
Overall, the study presents concise analyses and compelling high-resolution results that advance our understanding of auditory cortical organization. However, the manuscript currently exhibits several significant theoretical and methodological gaps that temper its broader claims. Most notably, the authors' reliance on a spatial, retinotopic-like analogy overlooks the fundamentally temporal nature of audition. Decoding continuous, natural speech relies heavily on dynamic, full-spectrum temporal integration and contextual recurrent computations, which are difficult to reconcile with the purely static, low-frequency spatial tuning observed here.
Strengths:
(1) The utilization of ultra-high-field 7T functional imaging combined with large-scale, naturalistic continuous stimuli provides an excellent signal-to-noise ratio and captures cortical responses under ecologically valid conditions.
(2) The application of a non-linear pRF encoding model provides a robust, quantitative method for parameterizing and mapping tonotopic features across the cortex, moving beyond simple contrast-based parcellations.
(3) The manuscript effectively demonstrates the relationship between category selectivity (e.g., speech) and underlying tonotopy, drawing an elegant and structurally useful analogy to the well-established relationship between category selectivity and retinotopy in the visual cortex.
Weaknesses:
(1) While the PCA mapping of the functional and structural parameter space is visually compelling, the robustness of this representational geometry across varying acoustic contexts remains ambiguous. Because the model relies on the specific statistical regularities of a single naturalistic audiovisual stimulus set, it is unclear if this low-dimensional structure would hold when tested against isolated speech sounds, environmental noise, or spectrally matched non-speech control stimuli.
(2) The methodological descriptions currently lack the computational precision required for replication and deep evaluation. I would suggest that the exact mathematical formulation of the encoding model be fully specified in the Methods section. This should include an explicit definition of the objective function, a clear accounting of all terms and hyperparameters utilized during the fitting process, and the exact dimensionalities of both the input feature space and the resulting parameter space.
(3) There is a critical theoretical disconnect between the observed static, low-frequency tuning in the STG and the known acoustic requirements for continuous speech perception. Speech is a full-spectrum signal; while fundamental frequencies and formants dominate the lower spectrum (which is vital for processing dynamic pitch contours), high-frequency bands (>1 kHz) carry indispensable phonetic information, such as the rapid spectrotemporal dynamics of consonants, especially fricatives. If the speech-responsive cortex is primarily and statically tuned to a low-frequency spectrum, it is unclear how the dynamic, high-frequency spectral information required for semantic decoding is represented. A rich body of electrophysiological literature documents diverse spectrogram coding in the STG. For example, Mesgarani et al. (Science, 2014) demonstrated using spectrotemporal receptive field models that neural populations in the STG are tuned to both low and high-frequency spectrograms well above 1 kHz. The authors must address this discrepancy and attempt to reconcile their static tonotopic findings with the existing literature on dynamic speech encoding.
(4) While drawing parallels between visual and auditory processing hierarchies is conceptually attractive, the modalities face fundamentally different computational challenges. Vision is largely resolved in space, making a retinotopic spatial coding strategy ecologically and computationally sound. Audition, however, evolves continuously in time. Complex temporal structure, continuous temporal integration, and contextual recurrent computations are paramount for auditory processing, particularly for speech comprehension. In this sense, a purely spatial or tonotopic coding framework is insufficient to fully explain the complex temporal processing dynamics required in the higher-order auditory domain.
Reviewer #3 (Public review):
Summary:
The work has the potential to identify the topographical organization of the auditory cortex, which remains controversial with current unnaturalistic sound stimulation, using an elegant approach developed in the visual domain with population receptive field mapping to study the organization of the visual system with naturalistic stimulation conditions.
Strengths:
This work presents an analysis of the topographic study of auditory cortical organization, using a substantial Human Connectome Project 7-Tesla functional imaging dataset in which 174 participants viewed naturalistic movies.
Weaknesses:
The key issue for the paper is that even the authors seem undecided on what the topographical results are and whether these results are consistent with, refute, or expand our notion of human auditory cortical field organization using this massive dataset obtained under movie-watching conditions. Short of this clarity, and much of the discussion of the issues surrounding topographic mapping is buried in the Supplementary materials section, it is not clear what the authors think the advance of the current work is beyond the large datasets.
On the flip side, there is little consideration of the challenges of mapping the auditory cortex using naturalistic stimuli that prevent dissociating visual from auditory stimulation conditions, contributing to this clarity or lack thereof in tonotopic mapping.
As such, the current manuscript struggles to achieve its full potential.
This article has been published in the journal Molecular and Cellular Biochemistry and is available at the following link: https://link.springer.com/article/10.1007/s11010-026-05573-3
I would like to bring to the attention of the authors, which are apparently not aware of it, that a large part of their result is in contradiction to previous literature. This is notably the section related to thyroid hormone receptor alpha (Thra). Specifically, the authors claim that the elimination of this receptor in the GABAergic lineage of Nkx2.1-Thrafl/+ mice results in an increased density in interneurons (PV neurons) in the hippocampus, cortex, and striatum. There are several problems with this claim: 1) If there is no typo, Nkx2.1-Thrafl / + mice keep an intact copy of the Thra gene. So there is no elimination of the receptor in these heterozygous mice. In decades of previous studies, the elimination of a single copy of the Thra gene did not appear to have a clear consequence on the mouse phenotype. Therefore, the phenotype shown in figure 4 is very surprising. 2) Most importantly, previous studies used a knock-in mutation (ThraAMI), which has a much stronger adverse effect on thyroid hormone signaling than a KO mutation. ThraAMI/+ mice were crossed with Gad2Cre or Gad2Cre-ERT2, which are also drivers for Cre/loxP recombination in GABAergic neurons. The result was a DECREASE in PV neurons density (Richard et al. iScience. 2020 Mar 27;23(3):100899. Ren et al. Thyroid. 2025 Dec;35(12):1443-1452). The discrepancy cannot only be due to the choice of driver transgene as Nkx2.1 and Gad2 expression pattern in cortex are similar. 3) Accordingly, all previous models, hypothyroid rat, mice, humans, KO transporters, etc. converge to indicate that a defect in thyroid hormone signaling, at least in the cortex and hippocampus, causes a reduction in PV neurons density, not an increase (review in ref. 30 of the article). This defect appears when signaling defect occurs during early life (Ren et al. iScience 29, Issue 6115970 June 19, 2026).
I believe that it would be the best interest of the authors to address these paradoxes before concluding that the ASXL3 / + mouse phenotype is explained by increased expression of Dio3, causing depletion of thyroid hormone in the brain.
Here are a few suggestions to solve the paradox: To my knowledge, Thrafl/+ mice (Cat# S-CKO-17774 from Cyagen) have not been used in previous studies. It would be interesting to perform germline recombination and compare the phenotype with other Thra KO mice, which have been extensively used in the past. Nkx2.1-Thrafl /+ mice have not been sufficiently characterized. What happens to gene expression in the cortex or striatum? (see citations above for genes sensitive to thyroid hormone deficiency in PV neurons). Additional controls should be helpful. For example Nkx2.1-Thra+/+ or Thrafl/+, all treated with tamoxifen, could also be used as negative controls to ensure that the phenotype is not a side effect of tamoxifen treatment or transgene expression.
Interesting reasearch and nice cristae images. It states 0.09 μm sections in the methods but later mentions 50nm sections. '10 nm for the x- and y-planes and 50 nm for the z165 plane' Which is it? I'd imagine 90nm as that would make 'Stacks of ~50 images of 50-µm block' seem reasonable.
Hello Class. Hypothesis allow us to interact in this youtube video as if it were a mini social network. Respond to this post by leaving your impressions about the content of this video. Leave three major takeaway for you and screenshot your contribution. Everyone should respond to this thread. Let me kow if you have any questions.
Hello Class. Hypothesis allow us to interact in this youtube video as if it were a mini social network. Respond to this post by leaving your impressions about the content of this video. Leave three major takeaway for you and screenshot your contribution. Everyone should respond to this thread. Let me kow if you have any questions.
Hello Class. Hypothesis allow us to interact in this youtube video as if it were a mini social network. Respond to this post by leaving your impressions about the content of this video. Leave three major takeaway for you and screenshot your contribution. Everyone should respond to this thread. Let me kow if you have any questions.
I asked AI what to do about it
Ah, the irony.
eLife Assessment
This important study identifies two pairs of dopaminergic neurons (DA-WED) in Drosophila that coordinate cardiac deceleration and locomotor responses to a mechanical threat. The evidence is convincing, supported by comprehensive optogenetic, physiological, and behavioral experiments showing that these neurons are required for and sufficient to drive threat-associated cardiac slowing. The proposed role of cardiac deceleration as an interoceptive contributor to locomotion is intriguing, but should be presented more cautiously, as the causal relationship between heartbeat changes and locomotor output remains less directly established. The work will be of broad interest to those interested in neural circuits, neuromodulation, and the integration of physiological and behavioral responses.
Reviewer #1 (Public review):
Summary:
This study by Tsuji et al. explores a mechanical threat model in Drosophila using air puffs as a stimulus. The authors first establish the paradigm and show that air puffs induce cardiac deceleration along with increased locomotion. They then identify dopamine as a key regulator of this response and go on to map the underlying circuit. In doing so, they pinpoint two pairs of DA-WED neurons as critical players. They carefully used intersectional strategies to achieve relatively clean labeling of these neurons, which helps ensure that the observed effects can be attributed specifically to DA-WED neurons. They further show that DA-WED neurons are both required and sufficient to drive cardiac deceleration, and that their activity increases in response to air puff stimulation. These neurons also contribute to the locomotor response. Directly inducing cardiac deceleration via optogenetic manipulation of cardiomyocytes also increases locomotion, suggesting a link between cardiac state and behavioral output.
Strengths:
Overall, the experiments are thoughtfully designed, well-controlled, and clearly presented. The figures are easy to follow, and the conclusions are generally well supported by the data. The manuscript is also clearly written, with a discussion that acknowledges potential caveats and outlines future directions. The genetic tools, behavioral paradigm, heart rate measurement approaches, and stimulation methods introduced here will be valuable resources for the community.
Weaknesses:
A few minor points to add to the clarity of the manuscript:
(1) The DA-WED driver (R48A08-AD ∩ VT008692-DBD ∩ TH-FLP) appears quite clean in the brain. However, since the study focuses on cardiac function and locomotion, it would be helpful to check expression in cardiomyocytes and the ventral nerve cord. This would help rule out any off-target expression that might contribute to the phenotypes and further support the idea of a descending pathway from brain dopaminergic neurons.
(2) Since DA-WED>Kir2.1 abolishes the puff-induced locomotor response (Figure 5b), suggesting that DA-WED neurons are directly involved in mediating locomotion. In the model (Figure 5L), it might make more sense for the pathway from mechanical threat to locomotion to pass through DA-WED neurons. The authors could consider adjusting the schematic if they agree.
(3) In line 408, Figure 5K should be 5L as it's a discussion of the model.
(4) In Figure 5j, the x-axis is missing time labels. Even if it matches Figure 5h, adding labels would make it easier to interpret at a glance.
(5) In line 312, it would be helpful to briefly explain why a 28 ms light pulse was used, compared to other pulse durations elsewhere in the paper.
(6) The cardiac deceleration seems to recover quickly after the air puff ends, whereas the locomotor response persists longer (around 10-15 seconds; see Figure 1 and Figure 5). This difference might suggest that DA-WED neurons influence locomotion through an additional or partially independent pathway, beyond their role in cardiac regulation. It could be worth briefly discussing this possibility.
Reviewer #2 (Public review):
Summary:
The authors study cardiac deceleration during threat responses in Drosophila. Particularly, it focuses on identifying the neuronal control of this deceleration. Using behavioral and cardiac tracking and analysis, genetics, and calcium imaging, they identify two pairs of dopaminergic neurons involved in cardiac deceleration during air puff responses
Strengths:
The study is overall well done, and the paper is clearly written. Particularly, the work on identifying the two pairs of dopaminergic neurons involved in cardiac deceleration using a series of drivers and generating new ones is rigorous and extensive. Finally, the authors manipulate the heartbeat to investigate how it influences threat responses
Weaknesses:
There are, however, several points that need to be clarified, as some claims are not entirely supported by evidence.
The authors, for example, claim that dopaminergic neurons are responsible for cardiac deceleration (during the air puff, lines 182-3, page 9). However, based on the work in this study, it seems that other neurons could be involved in this control as well. In addition to dopaminergic neurons, the authors test serotonergic and octopaminergic neurons, which, based on silencing experiments, also show an implication in heart-beat deceleration. Furthermore, because they find that dopaminergic neurons are the only ones that, upon thermogenetic activation, lead to lower heart beat frequency, they conclude that the dopaminergic neurons are responsible for air -puff induced cardiac deceleration.
However, these activation experiments are done in a different context than the air puff experiments (at a higher temperature, which could have an effect on the heartbeat changes upon activation of different neuron groups), and because silencing of other monoaminergic neuron types during the air puff also resulted in less cardiac deceleration, one cannot exclude the implication of octopaminergic or serotonergic neurons in air-puff-induced deceleration.
Activation experiments without high temperatures (using, for example, optogenetics) and/or in the presence of the air puff would be important to determine that the dopaminergic neurons are the main type of monoaminergic neurons involved in air-puff-induced cardiac deceleration. Otherwise, the related claims should be rephrased in a way that clearly doesn't exclude a possible implication of other monoaminergic neurons.
Regarding the interactions between the cardiac deceleration and locomotion, the authors propose, based on the results, that the optogenetic cardiac deceleration is sufficient to induce an increase in locomotion, and that it is the decrease in heartbeat that would be responsible via interoceptive pathways to trigger an increase in locomotion. In the model they propose, the DA-WED neurons would induce a decrease in heartbeat that, in turn, would trigger an increase in locomotion. There is not enough proof that cardiac deceleration is the one that triggers an increase in locomotion during air puff responses. As the authors themselves state, the experiments that would demonstrate this would involve preventing cardiac deceleration while optogenetically activating DA-WED. It can therefore not be excluded that the DA-WED neurons trigger an increase in locomotion that is possibly modulated by the cardiac activity. Both alternatives should be considered (models in Figures 4 and 5).
Reviewer #3 (Public review):
Summary:
In this elegant study, Tsuji et al. identify a relationship in Drosophila between cardiodynamics and threatening stimuli where mild air puffs elicit a brief bradycardia that coincides with locomotion increases. They then take advantage of the arsenal of genetic tools available in the fruit fly to reveal the indispensability of dopamine, through the action of Dop1R2, in this phenomenon. Further, they pinpoint the source of this dopamine to two specific pairs of neurons - DA-WED that are threat-activated. They then test and find a potential role for cardiac interoception from the heart in linking behavior and cardiodynamics.
Strengths:
This is an interesting and timely story that brings together the tools of fruit fly systems neuroscience and links it with physiology. The experiments are well done and tell a very nice story. In particular, the primary message of the paper - that the authors have identified specific dopaminergic neurons that regulate cardiac activity - is sound.
Weaknesses:
There are no important problems with the scientific approach. Rather, there are some interpretive changes I would consider.
(1) The changes in heart rate are small (10% or so), and, as far as I can tell, are evident for a beat or two. So the data may be better interpreted not as a change in rate but as a lengthening of diastole for a beat or two. That may seem a petty difference, but it might point to particular stretch-activated systems or changes in blood flow as the determinant.
Heart rate must be averaged over time, and so might be blurring the effects. It may be useful to produce figures centered on beat count and duration rather than time. Because the effect may even be just on a single beat, we suggest the authors try plotting the average beat duration for each beat that follows the air puff. If it's really just the first beat, using a quantification of the change of this duration relative to the average that precedes the puff may produce more striking figures.
(2) The author's model that cardiac deceleration leads to walking data is only partially supported by their data. In the first figure, the relationship between cardiac deceleration and walking probability seems to be inverted relative to their model (weak stimulus -> strong cardiac effect and weak locomotor effect; strong stimulus-> weak cardiac effect and strong locomotor effect). It is possible that this discrepancy may disappear when the authors look at beat duration rather than heart rate (for instance, if following the strong stimulus, there is a very long beat that is followed by tachycardia, thus weakening their observed HR change). It would also be easier to relate this data in Figure 1 to their interoceptive model if some data were shown that illustrated the relative timing of the cardiac change and the locomotor start.
(3) Also, since the locomotor and cardiac changes are probabilistic, it would be very useful to see how their respective probabilities change when conditioned on the other. According to their interoceptive model, locomotion should preferentially increase on trials where cardiac deceleration occurs. The authors should discuss this incongruity and also potential alternative interpretations of their cardiac manipulation experiments. Perhaps the bradycardia makes them more sensitive to threats - as suggested in the introduction? Control flies show a mild increase in locomotion following green light (Figure 5j), so perhaps by slowing the heart, they are more sensitive and thus respond more strongly to this stimulus?
(4) Looking at the example shapes of the beats in Figure 5g versus Figure 1c, the optogenetically induced diastole has a very different shape from the naturally occurring long beat. Thus, the exact cardiac stimulus may be unnatural. If this is true across trials and animals, it may be worth considering that the funny beat (like an anxiogenic atrial fibrillation in mammals) is the source of the fear and, in turn, locomotor behavior (also interesting!) rather than being a true replication of the cardiac events seen following the puff stimulus.
eLife Assessment
This study proposes that fitness level influences exercise-induced hypoalgesia in women. However, the evidence to support this claim is incomplete: the conclusions rely on a small interaction that emerges only under specific conditions and are incongruent with the title, the findings are inconsistent across pain modalities and stimulus intensities, the analysis approach does not fully exploit the continuous pain ratings collected, and the absence of a baseline condition limits the interpretability of results as reflecting true hypoalgesia. Additionally, the methods by which fitness level was categorized across cohorts can be questioned, and the results and figures do not clearly illustrate how between-group comparisons were conducted. With a proper revision, it could be useful for sports medicine practitioners to consider how they administer exercise protocols to help those experiencing pain.
Reviewer #1 (Public review):
Summary:
The current study is a follow-up to a previously published study by the same research group (Nold et al. 2025). In the previous study, the authors had included a set of exploratory analyses which assessed the effects of fitness level (denominated by a relative FTP), sex, and drug treatment (Naxolone versus placebo). In this previous study, the authors state that "exploratory analysis showed a significant main effect of fitness level on differences in pain ratings in the [saline] condition... suggesting increased hypoalgesia with increasing fitness levels, pooled across all stimulus intensities".
In the current study, the authors have recruited an additional 22 female participants (21 included in analysis) from local cycling clubs to assess if fitness level does indeed impact exercise-induced hypoalgesia responses to experimental thermal and pressure pain models.
Strengths:
The current study has the potential to present a convincing argument about the effect of fitness level and potentially other factors (e.g., sex) on exercise-induced hypoalgesia responses. Combining data across two of their primary studies would be highly fruitful to the research community interested in this area. Specifically, it has the potential to inform sports medicine practitioners and how they administer exercise protocols to help those experiencing pain with a further consideration for the fitness level (and maybe sex) of their patients.
Weaknesses:
However, the current study makes several bold claims about the role of fitness level and sex on exercise-induced hypoalgesia, which I do not believe that this study on its own - or in conjunction with the previously published study by the same authors - can make at present. Namely, the current study does not appear to conduct any specific analyses between the cohorts from either study (current and present). The results mention a difference in the group mean values in "fitness level" between cohorts, but the analysis itself on pain responses/exercise-induced hypoalgesia is limited only to the cohort from the current study. If the authors wanted to provide a convincing argument that fitness level has an effect on exercise-induced hypoalgesia, then the analysis of this study would have to include an analysis between the groups considered to be of "high" and "low" fitness level. I do not think the current study does this. Instead, it makes an assumption from the previous study (Nold et al. 2025) which only states that "exploratory analysis showed a significant main effect of fitness level on differences in pain ratings in the [saline] condition... suggesting increased hypoalgesia with increasing fitness levels, pooled across all stimulus intensities". The analysis of this study would have to include fitness level "high fitness" versus "low fitness" of participants across both studies in its statistical model to properly discern if fitness level has an impact on exercise-induced hypoalgesia.
A similar comment can be made with respect to sex differences, as these have not been assessed in the analysis of this study either.
Another area of weakness in this study is how "fitness level" has been demarcated across participants. One issue is how authors have assumed that the current cohort is 'fit', whereas the previous cohort was 'less fit', meaning that the authors could be coming to false conclusions about fitness level. In detail, figures within the current study show a large overlap between the 'fit' and 'less fit' cohorts, where some participants have a higher relative functional threshold power (FTP) in the 'less fit' cohort than the 'fit' cohort and vice versa. Therefore, I believe the authors should better demarcate between those that are in the 'more fit' and 'less fit' groups according to a validated and well-established criterion from the kinesiology and sport science literature. That being said, I think this may be problematic in some ways as FTP is considered a relatively poor measure to denote fitness levels, a limitation highlighted in the previous study's review.
Altogether, whilst I commend the researchers on their body of work across the two studies, the current methods and analysis provide an incomplete assessment of their primary research question, and therefore, I would urge the authors to reconsider some of their methods/analysis and the framing of their results to better reflect the main research question they have attempted to answer. Likewise, I would recommend that readers ensure they consider the current results with caution until the authors have addressed some areas of concern which currently limit their main conclusions.
Reviewer #2 (Public review):
This study addresses an important question regarding exercise-induced modulation of pain in women, but the conclusions appear to be based on relatively limited and selective evidence. The authors report an interaction between exercise intensity and stimulus intensity, which they interpret as evidence for exercise-induced hypoalgesia and conclude that fitness, but not sex, modulates this effect. However, this main result relies on a relatively small interaction that emerges only under specific conditions, with inconsistent findings across pain modalities and stimulus intensities, and an analysis approach that does not fully exploit the continuous pain ratings collected. The lack of a baseline condition further limits the interpretability of the findings as reflecting hypoalgesia, and overall, the data provide a rather constrained basis for drawing broader conclusions.
Strengths:
(1) The focus on women is important and timely, particularly given the ambiguity in prior findings and the historical bias toward male-dominated samples.
(2) The attempt to revisit previous findings in a new cohort is valuable in principle.
Weaknesses:
(1) The core interpretation may not be fully supported by the data
The central claim-that the results demonstrate exercise-induced hypoalgesia and its dependence on fitness but not sex-does not appear to be fully supported by the evidence presented.
1.1 Lack of baseline condition
The absence of a no-exercise baseline substantially limits interpretation. The study compares high- and low-intensity exercise, but without a baseline, it is not possible to determine whether either condition produces hypoalgesia or hyperalgesia relative to calibration. The observed HI-LI difference, therefore, reflects only a relative contrast between exercise intensities, not an absolute reduction in pain. As a result, attributing the findings to "hypoalgesia" may be difficult to justify fully.
1.2 Lack of internal replication across conditions
The reported effect is highly specific and does not clearly generalise across the experimental design. It emerges significantly only for heat pain at the highest stimulus intensity, with no clear effects for other intensities and for pressure pain. Moreover, the main statistical result is a relatively small interaction effect with a modest p value, which translates into a difference of approximately 6-8 VAS units on a 150 scale. This combination-a small effect size, limited statistical strength, and restriction to a single condition-substantially weakens the evidence for a robust or generalisable effect.
1.3 Deviations from the original study and selective use of data
Although framed as a follow-up to previous work, the current study introduces substantial methodological changes, particularly in the acquisition and scaling of pain ratings (continuous vs post-hoc ratings, modified VAS with sub-threshold range). Despite collecting rich continuous data, the analysis focuses on peak responses to approximate the previous study. While this may aid comparability, it results in a strong emphasis on a single data point (highest intensity), rather than leveraging the full dataset. This limits both interpretability and comparability.
1.4 Over-reliance on null results regarding sex differences
The conclusion that fitness, but not sex, modulates exercise-induced pain may not be directly supported by the data presented. The current study includes only highly fit women, and comparisons with men or less-fit women rely on non-significant differences in a previous cohort. The absence of a significant difference does not provide evidence for equivalence, and no formal statistical support for a null effect is provided. As such, conclusions about the absence of sex differences would unfortunately benefit from more cautious interpretation.
(2) Limited sample and lack of diversity
The dataset is narrow in scope, comprising a small sample (N = 21) of healthy, highly fit women. Key demographic characteristics (e.g. age range, BMI distribution) are not fully presented, explored or discussed. This limits generalisability and makes it difficult to draw broader conclusions about exercise-induced pain modulation in women, as the main focus of the study.
(3) Methodological choices limit the interpretability of the data
Several methodological decisions would benefit from stronger justification:
3.1 The use of a non-standard VAS scale (0-150 with a fixed pain threshold at 50) is unconventional and may influence how participants report pain, while limiting comparability with related literature.
3.2 Participants explicitly reported expecting exercise to reduce pain, introducing a potential confound that is not presently addressed.
3.3 A more comprehensive use of the full time series of pain ratings would provide a stronger and more transparent basis for interpretation of the present findings.
What Students Are Saying About: The American Dream, Mindfulness in Schools and How to Define ‘Family’
Used for project
Strong climate policy Mature district heating systems Industrial decarbonisation agenda Extensive shallow geothermal experience Strong engineering competence Excellent social acceptance of the technology
would it be important show numbers to solidify the case at this stage ?
a
can add use of accessory muscles.
CM Workshop ·
add hyperlinks/headers back to the workshop here
eniority: It is not uncommon for investors in later rounds to demand seniority over investors in earlier rounds, to ensure that they are repaid first.
Higher Seniority means that they get paid out before and also means that they are less risky and that is why lower seniority bonds for example demand a higher yield to cancel our the risk .
eLife Assessment
This study presents important findings on the relationship between nutrient availability and NAD/NADH levels, which in turn regulate biomass production in cancer cells. The authors provide convincing evidence to support their claims, offering insight into why it is difficult to predict which nutrients limit cancer cell growth: both cell type and nutrient availability together determine the oxidative capacity that constrains the synthesis of various metabolic intermediates. The manuscript will be of broad interest to researchers working in cancer and cell metabolism.
Reviewer #1 (Public review):
Summary:
This manuscript investigates how cellular NAD/NADH ratios are controlled in cancer cell lines in vitro. The authors build on previous work, which shows that serine synthesis is sensitive to NAD/NADH ratios and PHGDH expression. Here, the authors demonstrate that serine synthesis is variable across a panel of cell lines, even when controlling for expression of serine synthesis enzymes such as PHGDH. The authors show that cellular NAD/NADH ratios correlate with the ability to synthesize serine and grow in serine-deprived environments when PHGDH levels remain constant. Investigating this variability in NAD/NADH ratios, the authors find that the cells that can positively respond to serine deprivation are able to increase oxygen consumption and cellular NAD/NADH ratios. Cells that do not increase oxygen consumption in response to serine deprivation do not increase NAD/NADH ratios and cannot grow well without serine. The authors go on to show that in cells with the ability to increase oxygen consumption upon serine deprivation, PHGDH expression alone is sufficient to fully restore growth-serine; in cells that cannot increase oxygen consumption, both PHGDH expression and interventions to increase NAD/NADH ratios are required to increase growth. Thus, cells need both PHGDH and NAD/NADH increases to maximize serine synthesis in response to serine deprivation. The authors previously showed that lipid synthesis likewise requires NAD regeneration. Interestingly, one cell line that does not increase oxygen consumption in response to serine limitation tends to increase oxygen consumption in response to lipid deprivation; accordingly, depriving this cell line of lipids increases the synthesis of serine. Together, these findings show that how cells respond to nutrient deprivation is highly variable and that the response to nutrient deprivation (for example, whether or not oxygen consumption is increased) will determine how well cells tolerate depletion of nutrients with related biosynthetic constraints. This work sheds light on the complexity of cancer cell metabolism and helps to explain why it is difficult to predict which nutrients will be limiting to any cancer cell type or environment.
Strengths:
(1) The authors use multiple interventions to manipulate NAD/NADH ratios in cells.
(2) Experiments are well controlled and appropriately interpreted.
Comments on revised version:
The authors thoughtfully and thoroughly responded to all reviewer comments. The revised manuscript addresses the critiques.
Reviewer #2 (Public review):
In the manuscript "Cancer cells differentially modulate mitochondrial respiration to alter redox state and enable biomass synthesis in nutrient-limited environments", Chang et al investigate how cancer cells respond to the limitation of certain environmental nutrients by regulating the cellular NAD+/NADH ratio. They focus on serine and lipid metabolism, pathways known to be controlled by the NAD+/NADH ratio, and propose that changes in mitochondrial respiration in response to deprivation of these nutrients can influence the NAD+/NADH ratio, thereby impacting biomass synthesis.
While the study is descriptive in nature and does not investigate specific molecular mechanisms that explain the crosstalk between nutrient availability and mitochondrial redox changes, the experimental component is robust, and the conclusions are well supported by the results. Some suggestions could further refine the conclusions and enhance the quality of the manuscript.
Comments on revised version:
The authors have provided a very comprehensive response. Their updated paper has improved, and the critiques have been mitigated.
Author response:
The following is the authors’ response to the original reviews.
eLife Assessment
This study presents valuable findings on the relationship between nutrient availability and NAD/NADH levels, which in turn regulate biomass production in cancer cells. The authors provide solid evidence to support their claims, offering insight into why it is difficult to predict which nutrients limit cancer cell growth: both cell type and nutrient availability together determine the oxidative capacity that constrains the synthesis of various metabolic intermediates. The manuscript will be of interest to researchers working in cancer and cell metabolism.
We thank the eLife Editor for evaluating our manuscript and for the positive comments.
Reviewer #1 (Public review):
Summary:
This manuscript investigates how cellular NAD/NADH ratios are controlled in cancer cell lines in vitro. The authors build on previous work, which shows that serine synthesis is sensitive to NAD/NADH ratios and PHGDH expression. Here, the authors demonstrate that serine synthesis is variable across a panel of cell lines, even when controlling for expression of serine synthesis enzymes such as PHGDH. The authors show that cellular NAD/NADH ratios correlate with the ability to synthesize serine and grow in serine-deprived environments when PHGDH levels remain constant. Investigating this variability in NAD/NADH ratios, the authors find that the cells that can positively respond to serine deprivation are able to increase oxygen consumption and cellular NAD/NADH ratios. Cells that do not increase oxygen consumption in response to serine deprivation do not increase NAD/NADH ratios and cannot grow well without serine. The authors go on to show that in cells with the ability to increase oxygen consumption upon serine deprivation, PHGDH expression alone is sufficient to fully restore growth-serine; in cells that cannot increase oxygen consumption, both PHGDH expression and interventions to increase NAD/NADH ratios are required to increase growth. Thus, cells need both PHGDH and NAD/NADH increases to maximize serine synthesis in response to serine deprivation. The authors previously showed that lipid synthesis likewise requires NAD regeneration. Interestingly, one cell line that does not increase oxygen consumption in response to serine limitation tends to increase oxygen consumption in response to lipid deprivation; accordingly, depriving this cell line of lipids increases the synthesis of serine. Together, these findings show that how cells respond to nutrient deprivation is highly variable and that the response to nutrient deprivation (for example, whether or not oxygen consumption is increased) will determine how well cells tolerate depletion of nutrients with related biosynthetic constraints. This work sheds light on the complexity of cancer cell metabolism and helps to explain why it is difficult to predict which nutrients will be limiting to any cancer cell type or environment.
Strengths:
(1) The authors use multiple interventions to manipulate NAD/NADH ratios in cells.
(2) Experiments are well controlled and appropriately interpreted.
Weaknesses:
Overall the data support the conclusions of the manuscript. I have only two minor comments and suggestions:
We thank Reviewer 1 for their insightful comments, which have helped us improve the manuscript.
(1) Figure 2B/C: data are presented as relative to +serine, which shows how some cells respond to -serine, but may also be of interest to see how absolute (not relative) NAD/NADH levels correlate with serine synthesis and serine-independent proliferation. In other words, is it the dynamic increase in the ratio that is most important, or the absolute level of the ratio?
We thank Reviewer 1 for raising this point about whether it is the absolute NAD+/NADH ratio, or the change in NAD+/NADH ratio, that is important for increasing serine synthesis and allowing proliferation under serine depleted conditions. We reported relative ratios for accessibility to a general audience, but agree that this information is informative and should be presented. We assessed the NAD+/NADH ratio using an enzymatic assay, which does not directly measure absolute concentrations of NAD+ or NADH (PMID: 26232225). However, we previously confirmed the assay is in the same linear range for both NAD+ and NADH, and thus is valid for assessing the NAD+/NADH ratio. We now provide the unnormalized NAD+/NADH ratio data in Supplementary Figure 2G of the revised manuscript. This shows that the considered cells exhibit a range of NAD+/NADH ratios, and redox responsive cells do not cluster in having a higher or lower NAD+/NADH ratio.
To more formally answer Reviewer 1’s question about whether the absolute ratio or change in ratio is important for increasing serine synthesis, we measured the correlation coefficient between the unnormalized NAD+/NADH ratios and the proliferation rate of all examined cancer cells cultured with or without serine. These data are presented in Author response image 1. Of note, we find that there is a significant positive correlation between the raw values of the measured NAD+/NADH ratio and proliferation rate in both serine-replete (r = .371) and serine depleted (r = .562) conditions. However, this correlation is not strong, and when examining the cancer cells whose proliferation in serine depleted conditions cannot be fully explained by serine synthesis enzyme expression (Calu6, 8988T, A549, MIA PaCa-2, H1299, and HCT116), there is no significant correlation between the raw NAD+/NADH ratio and proliferation rate in serine depleted conditions. The association between the relative change in the NAD+/NADH ratio and proliferation rate is much stronger upon serine deprivation (r = .571), as presented in Figure 2C of the revised manuscript. This suggests that the dynamic increase in the ratio is more tightly linked to the change in serine synthesis rate and proliferation in serine depleted environments, and we discuss this point in the revised manuscript with the following text:
“Of note, whether the NAD+/NADH ratio of a cell was more or less oxidized in serine-replete conditions was not predictive of response to serine withdrawal (Supplementary Figure 2G).” (Lines 163-165)
Author response image 1.
Correlations between unnormalized NAD+/NADH ratios and cell proliferation rates between (A) all cancer cells examined (Calu6, MCF7, MDA-MB-231, A549, 8988T, MIA PaCa-2, A375, H1299, HCT116, MDA-MB-231 with PHGDH overexpression) in serine-replete conditions, (B) all cancer cells examined in serine depleted conditions, and (C) select cancer cells (labeled in gray) where serine synthesis enzyme protein expression does not fully explain proliferation in serine depleted conditions. Pearson correlation coefficient and P values were calculated by simple linear regression, *p<0.05, **p<0.01. Data shown are means of three biological replicates ± SD.
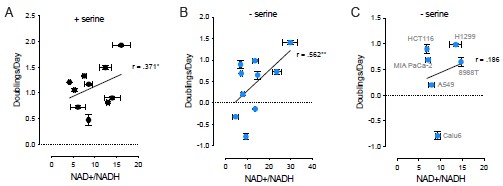
(2) Line 177-178: the authors write, "We hypothesized that the elevated NAD+/NADH ratio represented a cellular response to make the NAD+/NADH ratio more oxidized to enable serine synthesis". I recommend modest edits to avoid anthropomorphizing. It is possible that the ratio responds for reasons yet to be determined and not necessarily because the cell is deliberately trying to enable serine synthesis.
We thank Reviewer 1 for raising this point. We agree that our data do not show whether the ratio is elevated for the deliberate purpose of enabling serine synthesis and have edited the text accordingly with the following edit to that line of the revised manuscript:
“We hypothesized that a more oxidized NAD+/NADH ratio could support greater serine synthesis and thus sought to identify the processes that increase the NAD+/NADH ratio in some but not all cancer cells.” (Lines 190-192)
Reviewer #2 (Public review):
In the manuscript "Cancer cells differentially modulate mitochondrial respiration to alter redox state and enable biomass synthesis in nutrient-limited environments", Chang et al investigate how cancer cells respond to the limitation of certain environmental nutrients by regulating the cellular NAD+/NADH ratio. They focus on serine and lipid metabolism, pathways known to be controlled by the NAD+/NADH ratio, and propose that changes in mitochondrial respiration in response to deprivation of these nutrients can influence the NAD+/NADH ratio, thereby impacting biomass synthesis.
While the study is descriptive in nature and does not investigate specific molecular mechanisms that explain the crosstalk between nutrient availability and mitochondrial redox changes, the experimental component is robust, and the conclusions are well supported by the results. Some suggestions could further refine the conclusions and enhance the quality of the manuscript.
We thank Reviewer 2 for their time and for their suggestions to improve the manuscript.
Main critiques:
(1) Throughout the manuscript, the authors utilise the number of cell doublings per day as an endpoint readout of cell proliferation. It would be advisable to include a quantification of the cell number and to display the proliferation rate over time. This would provide valuable insights into the timeline of cellular responses and avoid potential confounding effects associated with the use of Sulforhodamine B dye, an indirect measure of cell proliferation based on protein content, which may be influenced by some of the interventions. Furthermore, it will help determine whether specific treatments reduce cellular doublings resulting from cell death. This concern is particularly evident in treatments with rotenone, e.g., Fig. 1G, where the increase in doublings could be attributed to cell death.
We thank the reviewer for this suggestion and agree that assessment of cell count provides additional information beyond Sulforhodamine B dye as an indirect measure of proliferation. To address this, we directly measured cell number over time using Incucyte Live-Cell imaging analysis applied to A549 and H1299 cells cultured with or without serine for 72 hours. Consistent with results using sulforhodamine B, A549 cells doubled at a rate of 0.874 per day and H1299 cells doubled at a rate of 1.034 per day in serine-replete conditions. In serine depleted conditions, A549 cells doubled at a rate of 0.205 per day while H1299 cells doubled at a rate of 0.544 per day. We have added the cell number measurements over time as well as the corresponding calculated doublings per day in Supplementary Figure 2D and Supplementary Figure 2E of the revised manuscript.
We also agree with Reviewer 2 that serine deprivation and rotenone treatment could potentially impact cell viability, which might confound phenotypes, including NAD+/NADH ratio measurements. To assess whether serine deprivation and rotenone treatment cause cell death, we measured cell viability using Sytox Green after exposing cells to these conditions for 72 hours. We find that there is indeed more cell death in cells cultured without serine at most concentrations of rotenone. However, cell death did not exceed 4% in any of the conditions tested, suggesting this is not a major contributor to the cell doubling phenotypes. These data are now presented in Supplementary Figure 1C of the revised manuscript. However, in light of Reviewer 2’s comments, along with a comment from Reviewer 3 about whether rotenone induces ROS and cellular stress responses, we have decided to remove the proliferation data involving rotenone that were in Figure 1F and 1G of the original manuscript. The rationale is that the potential confounding impacts of rotenone on viability make interpreting the proliferation data difficult. Instead, we have focused Figure 1 of the revised manuscript on the observation that there is specifically a correlation between the cell NAD+/NADH ratio and serine synthesis.
(2) The authors propose a model in which the deprivation of extracellular nutrients impacts mitochondrial respiration, which in turn increases the NAD+/NADH ratio and ultimately affects metabolic biosynthetic pathways that occur in the cytosol, such as serine biosynthesis. The mechanism by which nutrient availability is sensed and transmitted across different cellular compartments to regulate mitochondrial redox status remains unclear. This concern is particularly relevant for serine metabolism, as its synthesis occurs in the cytosol, but the authors connect it to mitochondrial respiration. Compartment-specific measurements of NAD+/NADH ratio would help to understand to what extent the redox state is affected by nutrients in the mitochondria and in the cytoplasm (see also minor critiques point 2). Moreover, the use of the genetic tool LbNox could be employed to manipulate the NAD+/NADH ratio in a compartmentspecific manner, while also avoiding the toxicity of certain compounds, such as rotenone. This set of experiments would add depth to the investigation, which might otherwise appear too descriptive.
(A) Compartment-specific measurements of NAD+/NADH ratio would help to understand to what extent the redox state is affected by nutrients in the mitochondria and in the cytoplasm
The question of how nutrient availability is sensed and transmitted across cellular compartments to impact mitochondrial respiration is important. However, rigorous assessment of compartment-specific metabolism is quite challenging, as we are not aware of tools to accurately measure redox ratios in a compartment-specific manner. Direct assessment of cofactor levels in subcellular compartments requires long isolation times and are unlikely to be accurate (PMID: 27565352). Rapid immunopurification of mitochondria has been used to estimate metabolite levels and ratios, but accurate measurements are hindered by rapid oxidation of NADH to NAD+. The use of fluorescence lifetime imaging (FLIM) to monitor NADH levels does not allow for accurate monitoring of the NAD+/NADH ratio as NAD+ cannot be visualized and NADH cannot be distinguished from NADPH. Additionally, the resolution of FLIM to interrogate compartment-specific signals is limited (PMID: 38594590). Fluorescent sensors, such as SoNar, have been used to image the NAD+/NADH ratio in compartments, though SoNar is sensitive to pH changes, which vary across compartments, and it has been argued that these sensors are more suitable for qualitative, not quantitative, changes in the NAD+/NADH ratio (PMIDs: 25955212, 29181426). It has also been argued that sensors are not amenable to measurement of mitochondrial ratios, as the predicted ratios are too reduced for the range of the sensors. Given these technical limitations, we opted to attempt a rapid subcellular fractionation (~25 second process to separate cytoplasm and mitochondria) followed by enzyme-based measurements of the NAD+/NADH ratio (PMID: 36883551), acknowledging the limitations of this approach. We find that across both A549 and H1299 cells, the mitochondrial NAD+/NADH ratio is lower than the cytosolic NAD+/NADH ratio, as expected. Using this approach, we find that in A549 cells, serine depletion leads to a decreased cytosolic NAD+/NADH ratio compared to serine-replete conditions while having no impact on the mitochondrial NAD+/NADH ratio. On the other hand, serine depletion leads to an elevated cytosolic NAD+/NADH ratio in H1299 cells while also having no impact on the mitochondrial NAD+/NADH ratio. In parallel, we used extracellular pyruvate exposure as a positive control, which should support cytosolic NAD+ regeneration, and rotenone as a negative control, which should suppress mitochondrial NAD+ regeneration. We show that pyruvate led to an elevated cytosolic NAD+/NADH ratio whereas rotenone treatment led to a decreased cytosolic NAD+/NADH ratio. Despite rotenone inhibiting complex I of the electron transport chain, we did not observe a change in the mitochondrial NAD+/NADH ratio (Author response image 2). This likely indicates that this assay is not sensitive enough to detect changes in mitochondrial NAD+/NADH, and we opted not to include these data in the revised manuscript given the limitations of the approach.
Author response image 2.
Rapid subcellular fractionation to examine compartment-specific NAD+/NADH ratios. (A) Cytosolic and mitochondrial NAD+/NADH ratios of A549 cells grown with or without serine for 24 hours, n=3. (B) Cytosolic and mitochondrial NAD+/NADH ratios of H1299 cells grown with or without serine for 24 hours, n=3. (C) Cytosolic and mitochondrial NAD+/NADH ratios of H1299 cells treated with either 1 mM pyruvate or 50 nM rotenone for 24 hours, n=3. P-values were calculated using a Student’s t-test, *p<0.05, **p<0.01. Data shown are means ± SD.
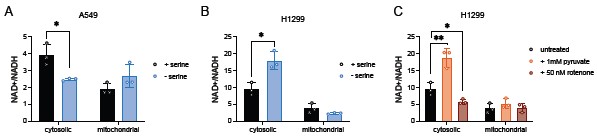
We nevertheless draw the following conclusions from these data:
(1) Changes to mitochondrial NAD+/NADH either do not occur or are not captured with this approach. Even rotenone treatment, which inhibits complex I and might be expected to change mitochondrial redox state, does not change the measured mitochondrial NAD+/NADH ratio.
(2) The whole cell NAD+/NADH ratio most likely reflects changes in the cytosolic NAD+/NADH ratio. While observing no impact on the mitochondrial NAD+/NADH ratio after rotenone treatment, we still find the cytosolic NAD+/NADH ratio is decreased. Moreover, both pyruvate and serine depletion led to an elevated cytosolic NAD+/NADH ratio in H1299 cells, which we observe at the whole cell level.
(3) H1299 cells depleted of serine elevate the cytosolic NAD+/NADH ratio, while rotenone treatment decreased the cytosolic NAD+/NADH ratio despite changes in mitochondrial respiration. This suggests that redox shuttles, such as the malate aspartate shuttle, play a role in communicating changes in mitochondrial redox dynamics to the cytoplasm. We test this hypothesis as described in response to Reviewer 2, point B, below.
(B) The mechanism by which nutrient availability is sensed and transmitted across different cellular compartments to regulate mitochondrial redox status remains unclear
Multiple known shuttles are involved in exchanging redox equivalents between the mitochondria and the cytosol. It is likely that multiple shuttles are involved, or could be involved in the right context, but one major shuttle is the malate aspartate shuttle (MAS), and the MAS has been shown previously to support de novo serine synthesis (PMID: 37647199). Thus, we hypothesized that the MAS is involved in the response involving elevated mitochondrial respiration in H1299 cells to increase the whole cell NAD+/NADH ratio upon serine deprivation. To test this, we used CRISPR/Cas9 to generate H1299 cells lacking MAS components GOT1, MDH1, or GOT2 and measured the cell NAD+/NADH ratio. We did not knock out MDH2 given its integral role in the TCA cycle. We find that when MDH1 and GOT2 are knocked-out, H1299 cells no longer exhibit elevated whole cell NAD+/NADH ratios upon serine deprivation. Consistently, removing MDH1 and GOT2 also blunted the increase in oxygen consumption as well as the increase in serine synthesis upon serine deprivation. This suggests that MDH1 and GOT2 activity though the MAS support the process by which mitochondrial NAD+ regeneration is transmitted to the cytoplasm to support serine synthesis. We have added these data as Supplementary Figure 7 in the revised manuscript.
(C) Moreover, the use of the genetic tool LbNox could be employed to manipulate the NAD+/NADH ratio in a compartment-specific manner
We thank Reviewer 2 for the suggestion to consider whether LbNOX might be used to manipulate the NAD+/NADH ratio in a compartment-specific manner. We expressed LbNOX in both the cytoplasm and the mitochondria of A549 (serine non-responsive) cells. We predicted that if LbNOX expression, either in the cytoplasm or the mitochondria, affected the NAD+/NADH ratio, proliferation in serine depleted conditions might be improved. However, we found that expressing LbNOX in the cytoplasm or the mitochondria of A549 cells had no effect on the NAD+/NADH ratio. Thus, LbNOX expression in either compartment also did not change proliferation in serine depleted conditions. These data are consistent with the known limitations of this genetic tool. While LbNOX can increase NADH oxidation in response to some interventions like rotenone, it does not necessarily change the NAD+/NADH ratio of unperturbed cells. This was reported in the original description of LbNOX (PMID: 27124460). We confirmed that LbNOX was successfully expressed via immunoblotting, and also confirmed that LbNOX functioned by showing either cytoplasmic or mitochondrial LbNOX expression improves cell proliferation following complex I inhibition. Thus, expressing LbNOX in A549 cells is not informative for understanding compartment specific metabolism following serine deprivation. Nevertheless, as this question is likely to come up for other readers, we have included these data as Supplementary Figure 6 in the revised manuscript.
Reviewer #2 (Recommendations for the authors):
Minor critiques:
(1) It seems clear from the authors' data that the response to serine depletion in terms of cell proliferation is not determined exclusively by PHGDH levels. It would be useful to measure the levels of the other two enzymes in the serine synthesis pathway and also to measure serine uptake under normal conditions in the different groups of cells. This information could provide some insight into the different responses of cancer cell lines to serine deprivation.
(A) It would be useful to measure the levels of the other two enzymes in the serine synthesis pathway
Reviewer 2 raises a fair point, and we agree that measuring levels of other enzymes in the serine synthesis pathway is informative. Thus, we measured the expression of phosphoserine aminotransferase 1 (PSAT1) and phosphoserine phosphatase (PSPH) across all cancer cells examined and find that, similar to PHGDH protein expression, PSAT1 and PSPH protein expression is lower in many cancer cells that are more sensitive to serine withdrawal (e.g. MCF7). However, among the cancer cells where PHGDH protein expression did not explain the response to serine withdrawal, the protein expression of PSAT1 and PSPH also did not explain how well the cells proliferate without environmental serine. These data have been included in Supplementary Figure 2B of the revised manuscript.
Of note, we measured serine synthesis enzyme expression for the six cancer cell lines whose proliferation in serine depleted conditions better correlated with a change in the NAD+/NADH ratio than it did with PHGDH expression: Calu6, 8988T, A549, MIA PaCa2, H1299, and HCT116. For these cells, we correlated proliferation upon serine depletion with PHGDH, PSAT1, and PSPH protein expression and found that interestingly, there was a significant negative correlation between PHGDH protein expression and proliferation upon serine deprivation. This was not observed for PSAT1 expression, and a statistically significant positive correlation between proliferation and PSPH protein expression was noted, though the variation in PSPH protein expression was large. We have added these correlation data to the revised manuscript as Supplementary Figure 2F.
(B) It would be useful to measure…serine uptake under normal conditions in the different groups of cells
Per the Reviewer’s request, we performed absolute quantification of serine uptake rates in serine-replete conditions for three serine “non-responder” cancer cells (Calu6, 8988T, A549) and three serine “responder” cancer cells (MIA PaCa-2, H1299, HCT116). We did not observe a notable difference in serine uptake rate and whether cells responded to serine deprivation. Additionally, with the exception of 8988T cells having a higher serine uptake rate than the other cells, there was no statistical difference in serine uptake across the cancer cells tested (Author response image 3).
Author response image 3.
Basal serine uptake rate of exponentially growing cells in serine replete conditions. Serine levels were measured using GC MS before and after 24 hours of serine depletion and normalized by area under the growth curve (PMID: 26954548). P-values were calculated using one-way ANOVA followed by a post-hoc Tukey HSD test, *p<0.05, **p<0.01
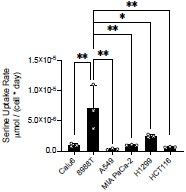
(2) The authors experimentally demonstrated that some cancer cells respond to serine depletion with an increase in mitochondrial respiration, but the molecular mechanism behind this is not addressed. There is some evidence in the literature showing that serine acts as an activator of the glycolytic enzyme PKM, which is coherent with an increased mitochondrial respiration in the absence of serine (PMID: 23064226). The authors could discuss their findings in the context of this paper. Additionally, they could provide some insights about baseline mitochondrial activity in the different cell lines. Indeed, it seems that "redox responsive cells" might have an overall increased basal OCR.
We appreciate the suggestion that pyruvate kinase M (PKM) may mediate the elevation in mitochondrial respiration in response to serine depletion. Given that serine is an allosteric activator of PKM, and PKM suppression can increase mitochondrial OCR, we discuss this possibility in the Discussion section of the revised manuscript using the following text:
“Interestingly, serine is an allosteric activator of the glycolytic enzyme pyruvate kinase, which converts phosphoenolpyruvate to pyruvate and generates ATP (Chaneton, 2012). Thus, decreased environment serine availability in addition to differences in pyruvate kinase activity may yield lower glycolytic ATP, resulting in greater mitochondrial respiration in serine redox responder cancer cells.” (Lines 443-447)
Additionally, we appreciate the reviewer’s observation that redox responsive cells may have an overall increased basal respiration rate. We directly measured mitochondrial dependent oxygen consumption in the same assay to test whether redox responsive cells exhibit higher mitochondrial respiration. We find that while the redox responsive H1299 and MIA-PaCa2 cells have higher mitochondrial respiration than non-responsive cells, HCT116 cells that are also redox responsive to serine deprivation, did not exhibit higher mitochondrial respiration compared to redox non-responsive Calu6, 8988T, and A549 cells (Author response image 4). However, when comparing redox non-responders versus responders as a whole, there was a statistically significant difference in basal OCR. Together, this suggests that basal mitochondrial respiration rate in serine-replete conditions may be related in some cases to whether cancer cells elevate mitochondrial respiration and the NAD+/NADH ratio upon serine deprivation, but this cannot be the full explanation given the HCT116 cell data. We also acknowledge the reviewer’s statement that we do not understand the molecular mechanism by which respiration responds to serine deprivation and explicitly state this in the revised manuscript.
Author response image 4.
Basal Oxygen consumption rate (OCR) of cancer cells in serine-replete conditions. (A) Kinetic OCR measurements of cancer cells before and after rotenone and anti-mycin injection, n=8. Data shown are means ± SD. (B) Quantified mitochondrial OCR (removing residual OCR), n=8. Values are averages obtained over three measurements. P-values were calculated via nested ANOVA, ****p<0.001
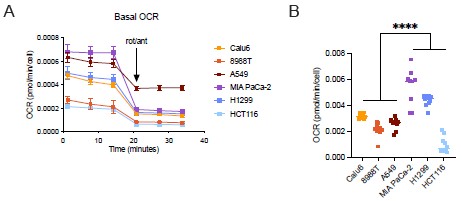
(3) There is a discrepancy between the basal values of the OCR from the same cell lines in different experiments, i.e., Figure 3A and Supp. Figure 3C, or in different experiments, Figure 3A, Figure 5E, and Figure 6A. The authors need to comment on/clarify that. Moreover, authors are encouraged to show ECAR values to support the conclusion that lactate production is not differentially affected by serine depletion, and thus, does not contribute to the increase in the NAD+/NADH ratio.
We recognize the differences in basal OCR values across different experiments. Given experiment-to-experiment variation and the need for different cartridges for each Seahorse experiment, we have found that measured OCR values using Seahorse assays vary across experiments despite the same conditions. Additionally, while we aim to seed the same number of cells per assay, cell seeding and cell quantification after each Seahorse assay can contribute to variation. Given this variability on a per-assay basis, we performed a singular experiment across all examined cancer cell lines considered to minimize variation in oxygen sensor calibration and address the reviewer question about whether absolute differences might contribute to response. These data are shown in Author response image 4.
Regarding the reviewer’s request to present ECAR data, we note that measuring ECAR is dependent on using unbuffered media and for this reason do not routinely measure ECAR. Our concern is that removing serum from the culture conditions can impact OCR measurements, and we instead prioritized maintaining the same media composition across all sets of experiments (i.e., cell proliferation assays, NAD+/NADH assays, kinetic tracing assays, and OCR measurements). Additionally, we point out that ECAR does not directly measure lactate. We refer the Reviewer to data included in the manuscript where GC-MS was used to directly measure lactate secretion over time for cells cultured with or without serine. These data are presented as Supplementary Figure 3B in the revised manuscript.
(4) There seems to be also a discrepancy between the levels of M+2 citrate and the fraction labelled (Figure 5C versus Supplementary Figure 6C) in the H1299 cell line upon serine depletion, whereby the M+2 fraction seems unexpectedly lower in serinedeprived cells. In those conditions, H1299 cells showed an increased mitochondrial respiration, which is consistent with increased total citrate levels. This could be explained by a faster TCA cycle activity and the presence of higher-order isotopologues of citrate upon serine starvation. Is this the case? Showing the abundance of the different citrate isotopologues and their contribution to the total pool would help to interpret the results.
We thank Reviewer 2 for this thoughtful comment regarding the discrepancy between M+2 citrate produced (normalized ion counts per cell) versus fraction of the total intracellular citrate pool that is M+2 labeled in serine depleted H1299 cells. In our kinetic U-<sup>13</sup>C-glucose tracing experiments, where we performed isotope labeling for up to 15 minutes, we only see a greater presence of M+3 citrate from fully labeled glucose without robust changes in M+4, M+5, or M+6 citrate (Author response image 5). An elevated M+3 citrate could represent pyruvate carboxylase activity, where M+3 labeled pyruvate is converted to M+3 oxaloacetate that then reacts with unlabeled acetyl-CoA to generate M+3 citrate.
We also find that the total citrate pool in H1299 cells is elevated upon serine depletion (see Supplementary Figure 6C in the original manuscript). Thus, the fractional contribution of an isotope to the citrate pool may decrease despite an increase in the amount of the particular isotope. In the original manuscript, we included data from kinetic U-<sup>13</sup>C-glutamine tracing in H1299 cells cultured with or without serine (Supplementary Figure 6I,J of the original manuscript). We find that H1299 cells depleted of serine exhibit greater M+4 citrate (via oxidative decarboxylation) and greater M+5 citrate (via reductive carboxylation) compared to serine-replete H1299 cells. Thus, one other potential explanation for why M+2 citrate from kinetic U-<sup>13</sup>C-glucose tracing represents a lower fraction of the total citrate pool in serine depleted H1299 cells is because there is a larger contribution from glutamine to the citrate pool. While there was no difference in the fraction of the citrate pool that consists of M+4 citrate, there was a greater fraction of the citrate pool labeled by M+5 citrate upon kinetic U-<sup>13</sup>C-glutamine tracing in serine depleted H1299 cells (see Author response image 6A, B). There was also a greater fraction of the citrate pool from M+6 citrate upon kinetic U-<sup>3</sup>C-glutamine tracing in serine depleted H1299 cells (Author response image 6C). This would require M+3 pyruvate labeling from glutamine, which may be due to malic enzyme, which converts M+4 malate to M+3 pyruvate. M+3 pyruvate may also be formed by PEPCK, which could convert M+4 oxaloacetate to M+3 phosphoenolpyruvate, leading to M+3 pyruvate. While understanding the source of M+6 citrate from glutamine is out of the scope of this study, it may highlight an interesting metabolic shift in H1299 cells depleted of serine that could elevate the total intracellular citrate pool.
Author response image 5.
Citrate isotopologues (A. M+3; B. M+4; C. M+5; D. M+6) from kinetic U-<sup>13</sup>C-glucose tracing in H1299 cells depleted of serine for 24 hours. For all measurements, citrate values were normalized to internal norvaline standard and cell number for each condition, n=3. Data shown are means ± SD.
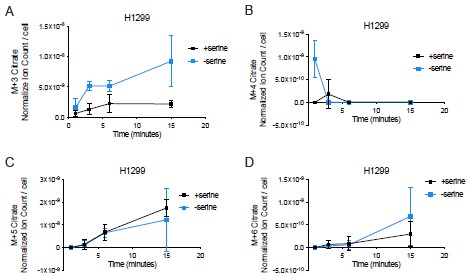
Author response image 6.
Fraction of the citrate pool labeled by U-<sup>13</sup>C-glutamine in H1299 cells depleted of serine for 24 hours. (A) Fraction of the total citrate pool that is M+4 citrate (formed via oxidative decarboxylation), n=3. (B) Fraction of the total citrate pool that is M+5 citrate (formed via reductive carboxylation), n=3. (C) Fraction of the total citrate pool that is M+6 citrate, n=3. Data shown are means ± SD.
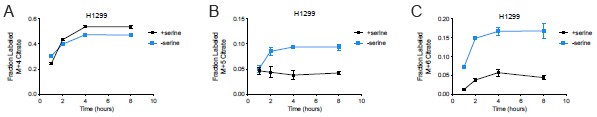
(5) The lipid depletion part of the paper seems to be somewhat tangential. The effect of lipid depletion on the NAD+/NADH ratio in A549 cells is modest, and the effects of dual serine and lipid depletion on OCR and NAD+/NADH ratio are not consistent. Moreover, if the authors want to show that these different nutritional environments affect lipid synthesis, apart from glucose incorporation into citrate, they would need to show actual carbon incorporation into palmitate, probably at longer time points.
We apologize for the lack of clarity for how mitochondrial respiration and the NAD+/NADH ratio play a role in governing glucose oxidation to citrate. To better highlight our logic and rationale for investigating alterations in NAD+/NADH homeostasis and citrate synthesis under lipid depletion, we have added the following text to the revised manuscript:
“Oxidative biosynthetic reactions other than serine synthesis can also be constrained by the NAD+/NADH ratio. For example, cancer cells deprived of environmental lipids increase oxidative citrate production, and we have previously found that citrate synthesis, either through glucose oxidation or glutamine oxidation, is limited by NAD+ availability (Li, 2022) (Figure 5A, Supplementary Figure 8A). Thus, we sought to uncover whether the increase in the cell NAD+/NADH ratio by mitochondrial respiration in response to serine withdrawal specifically supports greater serine synthesis or also leads to greater oxidative citrate production.” (Lines 307-313)
While we have previously shown that alterations to the NAD+/NADH ratio can modify both citrate production and palmitate synthesis under lipid depleted conditions (PMID: 35739397), we agree with Reviewer 2 that no conclusion can be made about lipid synthesis without direct measurements and have revised the manuscript accordingly.
(6) In Figure 6C-6F, showing the results of the controls (+serine +lipids) will help to clarify the extent to which serine and citrate synthesis rates are affected by the different interventions.
We thank the reviewer for the comment. Because we specifically asked how dual serine and lipid starvation impacted either serine or citrate synthesis compared to singular nutrient deprivation alone, we performed the experiments focusing on these conditions. We felt that conducting an experiment that specifically targeted our question would be make the findings more accessible as we had compared the +serine +lipid conditions to either serine or lipid depletion alone earlier in our manuscript (Figure 2D and Figure 5G,H of the revised manuscript).
Reviewer #3 (Public review):
Summary:
The manuscript by Chang and colleagues provides new insights into how cancer cells adapt their metabolism under nutrient-deprived conditions. They find cells respond differentially to serine and lipid deprivation via oxidising the cell redox state, which enables biomass synthesis and cell proliferation. They identified mitochondrial respiration as the major mechanism that dictates the endogenous NAD+/NADH ratio. By incorporating a dual stress paradigm, serine and lipid deprivation, the study further suggests that the NAD+/NADH ratio can serve as a link to orchestrate the complex interplay between multiple nutrient changes in the tumour microenvironment.
Strengths:
A novel aspect of this study is the idea that cancer cells are not uniformly passive victims of nutrient limitation; some can actively invoke endogenous NAD+ regeneration to combat nutrient stress. The conclusion is well-supported by comparing multiple cell lines from different tissues and genetic backgrounds, which improves generalizability. While most of the smaller conclusions align with common reasoning and expectations, the step-by-step deduction that leads to a novel 'big picture' is commendable. Another notable strength is the integration of dual stress (lipid and serine deprivation), which better mimics the complex tumor microenvironment with multiple nutrient fluctuations, raising the translational potential of these findings. The observation that lipid-deprived cells can stimulate serine synthesis and support proliferation in a subset of cancer cell lines offers a novel perspective on metabolic plasticity under starvation conditions.
We thank Reviewer 3 for their time and for their comments to help us improve the manuscript. We also thank them for highlighting the strengths and significance of our findings.
Weaknesses:
(1) Although the authors derive a novel and valuable overarching concept, the presentation of this "big picture" is not clearly articulated, making it less accessible to readers outside the immediate field. It would greatly enhance the manuscript to include a clearer summary of the overarching model and its implications. Additionally, discussing the potential clinical significance and applications of the findings would increase the relevance and broader impact of the work. Finally, the manuscript's clarity and credibility are undermined by inconsistent figure labeling and the lack of statistical analysis, particularly for the Western blot data.
(A) It would greatly enhance the manuscript to include a clearer summary of the overarching model and its implications. Additionally, discussing the potential clinical significance and applications of the findings would increase the relevance and broader impact of the work.
We appreciate Reviewer 3’s suggestion to help clarify the findings of this study. To better articulate our overarching model, we have added the following text to the end of the Results section of the revised manuscript
“Taken together, we propose a model where environmental nutrient availability can impact mitochondrial respiration based on the specific cancer. Because mitochondrial respiration is a major pathway that regenerates NAD<sup>+</sup>, changes to mitochondrial respiration can alter the cell NAD+/NADH ratio, influencing the activity of major NAD<sup>+</sup>-requiring metabolic reactions such as serine synthesis and citrate synthesis that can be important for proliferation. We further propose that changes to the cell NAD+/NADH ratio can impact all oxidative biosynthetic reactions if the enzyme machinery is present, but that specificity for how the cell NAD+/NADH ratio changes is dependent on both cell-intrinsic factors and cellextrinsic factors (Figure 7)." (Lines 396-404)
Additionally, a new model figure was added as Figure 7 in the revised manuscript, which may help with understanding for a general audience.
To better highlight the potential clinical significance of these findings, we have added the following at the end of the Discussion section of the revised manuscript:
“Better understanding the mechanisms cells use to alter respiration and adjust the NAD+/NADH ratio in response to available nutrients could inform the complex interplay between cell-intrinsic and cell-extrinsic factors that determine cancer metabolic dependencies. This is particularly important to consider when targeting metabolism for cancer treatment. Many newer therapies targeting metabolism have not been successful in part because of metabolic plasticity to nutrient shifts (Amoedo, 2017; Fendt, 2020; Xiao, 2023). Co-targeting mitochondrial function limits metabolic adaptations and may also help predict the tissue nutrient conditions that result in pathway dependencies for specific cancers. Thus, better understanding how the cell NAD+/NADH ratio responds to nutrient levels in different cancers could improve selection of patients for cancer therapies that impact metabolism.” (Lines 483-492)
(B) “…the manuscript's clarity and credibility are undermined by inconsistent figure labeling and the lack of statistical analysis, particularly for the Western blot data.”
We apologize to the reviewer for any inconsistency in data presentation. To address the comment related to inconsistent figure labeling, we ensured all figures in the revised manuscript are labeled to allow readers to recognize what cell lines are used, what conditions are tested, what parameters are measured, and how the data may or may not be normalized. To address the reviewer’s comments about lack of statistical analysis, in the revised manuscript we ensured that statistical analyses are included for data presented in each figure, when appropriate. We also include a section titled “Statistics and Reproducibility” in the Methods section. In our revised manuscript, we have ensured that the p-value threshold is consistent throughout all figures, and have removed “ns” across the manuscript for consistency as suggested by Reviewer 3 in their minor comments. We also removed any explicit p-values included in figures where the p-values were close to reaching the threshold for significance (a=0.05). We have also performed additional statistical analyses where needed, including adding the pvalues for linear regression analyses, and ensured new data added to the revised manuscript also included appropriate statistical analyses.
For western blot data, we show representative immunoblots. However, we measured PHGDH, PSAT1, and PSPH protein expression in three biological replicates across examined cancer cells and quantified the average serine synthesis protein expression from each replicate performed with error bars that denote standard deviation (see Author response image 7). We performed a nested ANOVA to examine whether there was a statistically significant difference in PHGDH, PSAT1, and PSPH protein expression between non-responder and responder cancer cells. Interestingly, as noted in our response to Reviewer 2, we find a significant negative association between PHGDH protein expression and response to serine deprivation among the six cancer cells where PHGDH protein expression did not explain proliferation upon serine depletion.
Author response image 7.
Serine synthesis enzyme protein expression in serine-replete and serine depleted cancer cells. (A) Immunoblots examining the expression of PHGDH, PSAT1, and PSPH in cancer cells as shown. HSP90 was used as a loading control. Data are from two separate biological replicates. (B) Mean levels of PHGDH, PSAT1, and PSPH normalized to loading control HSP90 across cancer cells from three separate biological replicates. Yellow denotes cancer cells that do not elevate mitochondrial respiration in response to serine depletion (non-responders). Blue denotes cancer cells that do elevate mitochondrial respiration in response to serine depletion (responders). P-values were calculated with nested ANOVA comparing non-responders and responders, **p<0.01
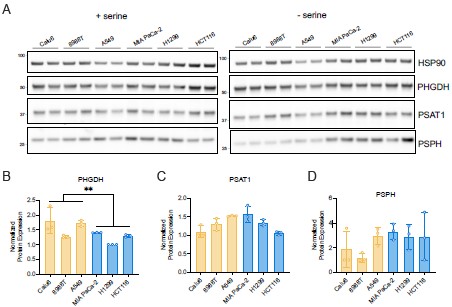
(2) While this study identifies changes in serine synthesis, mitochondrial respiration, PHGDH protein levels, and NAD+/NADH ratio in different cell lines, some of these relationships appear correlative rather than causally established (Figure 2; Figure 5; Figure 6). Some claims are thus overinterpreted. For example, the co-occurrence of increased NAD+/NADH ratio and citrate levels under lipid deprivation in A549 cells does not establish causality (Figure 5). Direct perturbation experiments that manipulate NAD+/NADH and assess downstream effects on citrate synthesis would substantially strengthen the conclusions.
We agree with Reviewer 3 that corresponding changes in proliferation, mitochondrial respiration, and serine synthesis are correlated to the NAD+/NADH ratio. As shown in Figure 4, we perturbed the NAD+/NADH ratio with FCCP and rotenone to measure downstream effects on serine synthesis. We also agree with the reviewer that doing similar experiments in the lipid depletion condition would highlight the relationship between the NAD+/NADH ratio and citrate synthesis. However, we point out that these experiments were already published in a manuscript from our group specifically showing that the NAD+/NADH ratio is limiting for citrate synthesis (PMID: 35739397). In that manuscript, the NAD+/NADH ratio was perturbed using electron transport chain inhibitors, including complex I inhibitors, which decreases the cell NAD+/NADH ratio. Exogenous electron acceptors were used to rescue the NAD+/NADH ratio, and under those conditions, cell proliferation, the NAD+/NADH ratio, and glucose and glutamine oxidation to citrate were measured with and without lipid depletion. We showed that decreasing the NAD+/NADH ratio decreases citrate synthesis through both glucose and glutamine oxidation and also affects palmitate synthesis. We could rescue citrate and palmitate synthesis by supplementing cells with exogenous electron acceptors. We also show that expressing cytosolic or mitochondrial NADH oxidase (LbNOX; PMID: 27124460) in mitochondrial complex I-inhibited cells rescues proliferation in lipid depleted conditions and that LbNOX expression raises oxidative citrate production at baseline. Given the extensive prior work showing the relationship between the NAD+/NADH ratio, oxidative citrate synthesis, and palmitate synthesis, efforts to repeat these same experiments for this manuscript were not warranted. We do show in the current manuscript that treating cells with AKB or FCCP, which raises the NAD+/NADH ratio, also increases glucose oxidation to citrate (Figure 5D of the original and revised manuscripts). We did this to confirm that the elevated M+2 citrate production from glucose in serine starved H1299 cells was related to an increase in the NAD+/NADH ratio as opposed to a specific response to serine depletion.
The study focuses predominantly on mitochondrial respiration as a source of NAD+ regeneration. However, it will also be interesting to check other significant pathways, such as NAD+ salvage, which have been implicated in supporting serine biosynthesis. In addition, the subcellular distribution of NAD+ may distinguish whether some cells are truly redox-unresponsive. Mitochondrial NAD+ regeneration might counteract the cytosolic NAD+ consumption, rendering a relatively stable intracellular NAD+/NADH ratio. The malate-aspartate shuttle can be an interesting aspect.
(A) The role of NAD+ salvage and serine biosynthesis
Per the reviewer’s request, we investigated whether NAD+ salvage might be involved in supporting serine synthesis. Specifically, the reviewer comments highlight an interesting question about whether NAD+ salvage may differentially contribute to serine synthesis between cancer cells that elevate mitochondrial respiration in response to serine depletion and cancer cells that do not change mitochondrial respiration in response to serine depletion. Specifically, we wondered whether cancer cells that do not elevate mitochondrial respiration in response to serine depletion depend more on NAD+ salvage to support proliferation in serine depleted conditions. To test this, we treated A549 and H1299 cells in serine depleted conditions with increasing doses of the nicotinamide phosphoribosyltransferase (NAMPT) inhibitor FK866. However, we found no statistically significant difference in sensitivity to FK866 upon serine depletion in these cells based on ANCOVA analysis (p=0.9332). Interestingly, we observe that A549 cells are more sensitive to FK866 treatment than H1299 cells in serine-replete media conditions (ANCOVA analysis, p=0.0004). This suggests that A549 cells at baseline may have greater dependence on NAD+ salvage compared to H1299 cells, though this is not specific to the response to serine depletion. We then asked whether nicotinamide mononucleotide (NMN), the product of NAMPT and the immediate precursor to NAD+ in the salvage pathway, would rescue the proliferation of A549 cells cultured without serine. We find that adding 100 µM NMN, a concentration that can impact PHGDHdriven serine synthesis (PMID: 30157431), does not change proliferation of A549 cells cultured without serine, unlike supplementing cells with AKB or FCCP, which increase NADH oxidation to NAD+. Together, these data suggest that NAD+ salvage does not play a major role in differentiating the redox response to serine deprivation between responder and non-responder cells. We have added these data as Supplementary Figure 3C,D of the revised manuscript.
(B) The role of the malate-aspartate shuttle and serine biosynthesis
The MAS has been shown to play an important role in serine synthesis (PMID: 37647199) and may facilitate elevation in mitochondrial respiration in response to serine depletion. As stated in response to Reviewer 2, measuring subcellular compartmentspecific NAD+/NADH ratios accurately is not feasible, so we utilized a functional approach to interrogate the role of compartmentalization. Specifically, we tested a role for the malate-aspartate shuttle (MAS). Using CRISPR/Cas9, we generated GOT1, MDH1, and GOT2 deleted H1299 cells. We did not knock out MDH2 given its integral role in the TCA cycle. Using the knockout lines, we measured the whole cell NAD+/NADH ratio and found that MDH1 and GOT2 KO cells no longer exhibited an elevated cell NAD+/NADH ratio upon serine depletion compared to non-targeting controls (NTC). Consistently, MDH1 and GOT2 KO cells did not elevate OCR upon serine deprivation, nor did they exhibit greater serine synthesis rates compared to NTC cells. This suggests that MDH1 and GOT2 activity support the process by which mitochondrial NAD+ regeneration provides cytosolic NAD+ to support serine synthesis. We next asked whether MAS protein expression differed between cells that elevate respiration in response to serine depletion and cells that do not. While enzyme expression is not equivalent to activity, we wondered whether MAS protein expression would be lower in cells that do not increase their mitochondrial respiration upon serine depletion. However, we observed no major difference in GOT1, GOT2, MDH1, or MDH2 protein expression across the cancer cells examined (Author response image 8). Further experimentation is needed to measure MAS activity across lines and may reveal a mechanism by which mitochondrial respiration is governed by nutrient availability, such as levels of environmental serine.
Author response image 8.
Protein expression of the malate aspartate shuttle enzymes GOT1, MDH1, GOT2, and MDH2 in cancer cells cultured without serine for 24 hours. Membranes were first probed for GOT1 or GOT2 then stripped and re-probed for MDH1 or MDH2.
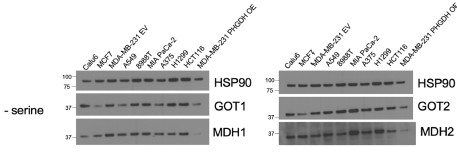
(3) The authors should acknowledge the limitations of short-term isotope tracing in their experimental design. Differences in metabolic rates across cell lines can affect the kinetics of metabolite labeling, limiting the direct comparability of metabolic fluxes between them. As a result, observed changes may reflect transient adaptations rather than stable metabolic reprogramming. It is important to clarify that the study primarily captures short-term responses, and the conclusions may not extrapolate to longer-term adaptations or protein-level changes under sustained nutrient stress.
We thank the reviewer for this comment. We apologize for any confusion around experimental approaches. We agree that in the case of acute changes in nutrient availability at the start of kinetic isotope tracing, the observed changes may reflect transient adaptations. However, cells are exposed to conditions for 24 hours prior to performing kinetic tracing. This approach allows us to examine changes that occurred in response to the nutrient condition, not acute changes. Additionally, we add fresh, prewarmed treatment media at least two hours prior to commencing kinetic isotope tracing. Upon analysis of kinetic isotope tracing, we examine whether cells were at metabolic steady state by monitoring metabolite levels over the course of tracing. For example, in the kinetic glucose tracing experiments in serine depleted cells, total serine levels are relatively stable throughout the experiment, and we find that total serine levels are greater in H1299 cells after 24 hours of serine starvation. Data showing total metabolite pools over the course of tracing are shown in the Supplementary Figures (for example, see Supplementary Figure 8C-H in the revised manuscript). The period of treatment prior to the start of kinetic isotope tracing is described in the figure legends and further detailed in the “Kinetic U-<sup>13</sup>C-Glucose Isotope Tracing Experiments” section of the Methods in the revised manuscript. To improve clarity, we added a kinetic graph showing total serine levels over time in Supplementary Figure 2I of the revised manuscript as this can address whether synthesis rates are captured while cells are at metabolic steady state. We also discuss these considerations better in the revised manuscript with the following text:
“Importantly, we confirmed kinetic U-<sup>13</sup>C-glucose tracing was performed at metabolic steady state by ensuring metabolite levels were stable at each collected time point (Supplementary Figure 2I)” (Lines 178-180).
Reviewer #3 (Recommendations for the authors):
It is important to note that, in many cases, the data show only trends rather than statistically significant differences, or, if significance testing was performed, the results are not clearly labeled. For example, in Figure 1B, no p value was denoted in the figure, and the scale bar is quite high, precluding the conclusion that "AKB and rotenone dosedependently increased and decreased the cell NAD+/NADH ratio". In Figure 2E, no pvalue was shown to support the result that "H1299 cells had higher serine level than A549 cells". Inconsistencies in how significance is denoted across figures (e.g., asterisks vs. numerical values; "ns" vs. no label) make interpretation difficult. Marginal significance (e.g., p = 0.06 in Figure B) can be reported explicitly, but all figures should clearly denote whether comparisons are significant or not. Conclusions drawn from nonsignificant trends should be appropriately stated.
We thank Reviewer 3 for this important comment and for highlighting specific instances where the manuscript could be improved. Please see response to Reviewer 3, Major Comment 1B. We also agree with Reviewer 3 that it is integral to ensure that conclusions made from non-significant trends are appropriately stated. For example, we explicitly mention that there was no statistically significant difference between the serine synthesis rate of A549 cells depleted of serine versus A549 cells depleted of both serine and lipids (Line 375). As another example, we changed the phrase “Moreover lipid depletion led to a greater fraction of total serine derived from glucose in serine depleted A549 cells” to “Moreover, lipid depletion appeared to lead to a greater fraction…” (Line 376).
Western blot data supporting PHGDH expression variability across cell lines (e.g., Supplementary Figure 2B, 3E) appear to rely on single experiments. At least three biological replicates are required to substantiate claims about discordance between PHGDH levels and serine sensitivity. Supplementary Figure 4G presents overexpression validation based on a single Western blot without quantification. Including statistical validation from biological replicates would strengthen this point.
We thank Reviewer 3 for this suggestion. Western blots were repeated 3 times, although data from a representative blot is shown. Please see response to Reviewer 3, Major Comment 1B.
Certain data visualizations (e.g., Figure 2C) lack annotation indicating which data points correspond to which cell lines, limiting interpretability. All figures should include clear labels, consistent statistical notation, and complete legends. The author uses different color labels (redox-responsive (blue) and unresponsive (yellow) cell lines), which provides mechanistic clarity; however, this classification was not consistently used across the manuscript (e.g., Figures 2d and 2e). To further improve reader comprehension, consider adding conceptual schematic diagrams before each main result section to illustrate experimental logic, and a final diagram summarizing the proposed mechanism.
We apologize for any unclear data presentation. In the revised manuscript we have added greater clarity around what cell lines are used in each experiment and have added explicit labeling to specify cancer cell lines in Figure 2C of the revised manuscript. Throughout, we have ensured that any serine redox non-responder cell lines are labeled in yellow while serine redox non-responder cell lines are labeled in blue. We have also ensured that any lipid redox responder cells are labeled in green while lipid redox non-responder cells are labeled in dark purple, a change from the original manuscript. Finally, we have also added a schematic to summarize the proposed model in Figure 7 of the revised manuscript.
Although the authors provide justification for using H1299 and A549 as representative cell lines to study serine depletion, it remains unclear whether these two lines are equally suitable for investigating lipid depletion. Additional rationale or supporting data would help clarify their appropriateness for the lipid-related experiments.
We thank Reviewer 3 for this suggestion. We opted to study H1299 and A549 cells under lipid deprivation to assess their responses in relation to the response to serine deprivation. We specifically wanted to know whether these findings related to serine deprivation applied to other nutrient depleted conditions. We clarify this logic in the revised manuscript by adding the following text:
“Oxidative biosynthetic reactions other than serine synthesis can also be constrained by the NAD+/NADH ratio. For example, cancer cells deprived of environmental lipids increase oxidative citrate production, and we have previously found that citrate synthesis, either through glucose oxidation or glutamine oxidation, is limited by NAD+ availability (Li, 2022) (Figure 5A, Supplementary Figure 8A). Thus, we sought to uncover whether the increase in the cell NAD+/NADH ratio by mitochondrial respiration in response to serine withdrawal specifically supports greater serine synthesis or also leads to greater oxidative citrate production.” (Lines 307-313)
We have also included more detailed justification for focusing our studies on A549 and H1299 to study serine depletion by adding the following statements to the manuscript:
“We performed focused comparisons between A549 and H1299 cells because they exhibit differences in proliferation upon serine deprivation that are not explained by PHGDH protein expression, demonstrate differing responses of the cell NAD+/NADH ratio upon serine deprivation, and have similar basal proliferation rates.” (Lines 171-175)
The concentration of serine in replete media should be explicitly stated and justified. If the intention is to mimic physiological conditions, alignment with human plasma levels would increase translational relevance.
We agree that explicitly stating the concentration of serine in replete media is important. In the revised manuscript, we explicitly state that DMEM contains 400 uM of serine and that we use this concentration for serine-replete conditions (Line 102). While an important application of our manuscript is to better explain metabolic changes that can occur in physiologic conditions, we acknowledge that we did not test levels found in different tissues. Rather, by examining extreme conditions of high and low serine, we hoped to dissect how cells adapt to nutrient conditions, and testing the more subtle responses based on tissue serine levels will require a dedicated study.
Rotenone may elevate ROS levels and trigger cellular stress responses, potentially confounding proliferation assays. The authors should validate that concentrations used do not induce cytotoxicity or excessive oxidative stress, and ideally measure ROS levels to support interpretation.
We thank Reviewer 3 for raising this important point. We explicitly measured cell viability with the doses of rotenone used in this manuscript in cells cultured with or without serine. We find that rotenone dose-dependently increases cytotoxicity in A549 cells grown in serine-replete conditions in a statistically significant manner as calculated by simple linear regression. However, the cytotoxicity from rotenone is low (at most 4% in serine depleted conditions) and does not explain differences to rotenone sensitivity with respect to serine synthesis. These data have been added to Supplementary Figure 1C of the revised manuscript.
Evidence for lipid depletion can enhance serine synthesis in A549 cells is inadequate, for the marginal difference in NAD+/NADH ratio and slight increase of M+3 serine levels. The statement "any perturbation that increases the NAD+/NADH ratio led to both elevated serine and citrate production, regardless of what nutrient was depleted from the environment" (introduction section) should be reworded.
We thank Reviewer 3 for this suggestion. We have changed the above statement to the following:
“Lastly, we find that any perturbation that increases the NAD+/NADH ratio, including lipid deprivation, could paradoxically improve the proliferation of cells in serine depleted conditions.” (Lines 90-92).
Hero
This is for reference only and won't be on the live site
eLife Assessment
This study addresses an important gap in drug discovery by delivering a rigorous, large-scale evaluation of widely used co-folding methods for predicting ligand-bound protein complexes and virtual screening. A key strength is the comprehensive benchmarking framework, which leverages structures and chemical compounds that were absent from the AI models training set, thereby providing particularly compelling and unbiased evidence of co-folding performance. The findings clearly delineate the complementary roles of deep learning-based co-folding and physics-based docking, offering practical guidance for their rational integration into drug discovery workflows. Overall, the conclusions are well supported by thorough analyses across a representative set of cases and are highly convincing.
Reviewer #1 (Public review):
The authors conducted a comprehensive benchmarking and evaluation of co-folding platforms, including AlphaFold3, Boltz-2, Chai-1, and the docking algorithm Dock3.7, which employs a physics-based scoring function that incorporates van der Waals interactions, electrostatics, and ligand desolvation energies. The system of interest was the SARS-CoV-2 NSP3 macrodomain (Mac1), an increasingly popular antiviral target, and the ligand sets comprised 557 unseen ligand poses (keeping the training for these co-folding platforms in mind). Additionally, the authors investigated whether the co-folding models could distinguish true ligands from non-binding small molecules. The study is thorough, with extensive statistical support and consensus across multiple metrics (chemoinformatics for quantifying ligand similarity and efficacy). The questions that the authors aim to address are whether the co-folding models struggle with memorization, whether they can distinguish between a true and a false binder, whether they replicate experimental binding affinities and efficacy, and how they compare to the physics-based docking algorithm (Dock3.7).
Strengths:
Overall, this is a scientifically solid paper.
The work is highly detailed and well executed, featuring thorough data analysis and statistical assessment.
Comments on revised version:
The authors have adequately addressed my concerns.
Reviewer #3 (Public review):
Summary:
Core conclusions are well-supported by data: co-folding outperforms docking in known ligand pose/affinity prediction (validated by RMSD and IC₅₀ correlation), struggles with false positive discrimination in virtual screens (lower AUC values), and is complementary to docking (non-correlated errors, distinct strengths in drug discovery stages).
Strengths:
Unprecedented prospective design with 557 novel Mac1-ligand complexes ensures rigorous, independent evaluation of co-folding methods, provides an unbiased and rigorous benchmark dataset, which contains structures and compounds absent from the co-folding models training sets. Comprehensive comparison of 3 co-folding tools (AlphaFold3, Chai-1, Boltz-2) with DOCK3.7 across diverse targets and metrics enables nuanced performance assessment. The revised results clarify an intriguing finding: co-folding can predict correct ligand poses even when protein formations are mispredicted. The study clearly demonstrates complementary roles of co-folding (superior pose/affinity prediction for known ligands) and docking (better hit prioritization), and addresses deep learning memorization concerns via ligand similarity analysis.
Weaknesses:
The study identifies a major limitation of co-folding-failure to capture rare protein conformational changes, which deserve future investigation. The authors include uncalibrated Boltz-2 affinity data (addressing a prior comment) but note that large-scale free energy perturbation (FEP) comparisons are beyond their capabilities.
Appraisal of Aims Achieved:
The authors successfully achieved their primary aims and the results provide strong, well-supported evidence for their core conclusions. Key conclusions are grounded in the study's unbiased, training-set independent data, ensures the conclusions are not confounded by model memorization and are broadly applicable to the field's use of these co-folding models.
Field Impact:
This study provides a critical reality check for the field: co-folding models are powerful tools for pose prediction but are not yet standalone solutions for virtual screening, a key distinction that will prevent over-reliance on these models and guide more rational tool selection.
Author response:
The following is the authors’ response to the original reviews.
Public Reviews:
Reviewer #1 (Public review):
The authors conducted a comprehensive benchmarking and evaluation of co-folding platforms, including AlphaFold3, Boltz-2, Chai-1, and the docking algorithm Dock3.7, which employs a physics-based scoring function that incorporates van der Waals interactions, electrostatics, and ligand desolvation energies. The system of interest was the SARS-CoV-2 NSP3 macrodomain (Mac1), an increasingly popular antiviral target, and the ligand sets comprised 557 unseen ligand poses (keeping the training for these co-folding platforms in mind). Additionally, the authors investigated whether the co-folding models could distinguish true ligands from non-binding small molecules. The study is thorough, with extensive statistical support and consensus across multiple metrics (chemoinformatics for quantifying ligand similarity and efficacy). The questions that the authors aim to address are whether the co-folding models struggle with memorization, whether they can distinguish between a true and a false binder, whether they replicate experimental binding affinities and efficacy, and how they compare to the physics-based docking algorithm (Dock3.7).
We thank Reviewer 1 for this thoughtful summary of our work.
Strengths:
Overall, this is a scientifically solid paper. The work is highly detailed and well executed, featuring thorough data analysis and statistical assessment.
Weaknesses:
My main concern is that the study's aim is a bit unclear. Modern benchmarking studies comparing physics-based docking with deep learning-based co-folding approaches (e.g., AF3, Boltz-2, Chai-1, and others) are increasingly expected to go beyond aggregate performance metrics.
Indeed, we have gone into several examples of failures and successes for each of these methods. As we are not developing these methods ourselves, we also think this dataset will be a valuable contribution for improving them further.
In addition to rigorous dataset construction, transparent methodology, and appropriate statistical evaluation, high-impact benchmarks typically provide actionable guidance on when each method class is most appropriate, reflecting their distinct inductive biases and practical constraints. Failure-mode analyses that link performance differences to protein flexibility, ligand chemistry, or binding-site characteristics are particularly valuable, as they move comparisons beyond "scoreboard" assessments toward mechanistic understanding.
Right now, we do not observe meaningful trends that separate the failure modes for any individual method. This is covered in Supplementary Figures 6 and 7.
While full biological validation is not expected, qualitative interpretation grounded in physical and biological principles strengthens conclusions. Providing reproducible workflows or reference pipelines is not mandatory, but it is increasingly viewed as a best practice because it facilitates adoption and helps contextualize results for practitioners.
We note that our code is available (https://github.com/jongbin99/Cofolding/) and all structural data will be publicly accessible in the PDB alongside publication (we only held it back only for “blinding” during peer review to avoid contamination with any new deep learning methods).
Reviewer #2 (Public review):
Summary:
The manuscript by Kim et al. evaluates the performance of three modern AI-based methods in predicting complex structures and binding affinities between proteins and chemical compounds. An honest 'prospective' evaluation is achieved by studying benchmark structures and chemical compounds that did not exist in the PDB at the time the AI structure prediction models (AlphaFold3, Chai-1, Boltz-2) were trained.
Strengths:
(1) The study addresses an important question in modern computational biology and drug discovery, and establishes the strengths and limitations of the three tools in solving various computational chemistry tasks, including compound pose prediction, active-inactive discrimination, and potency ranking.
(2) The conclusions are based on examination of four separate targets and respective compound datasets, where for one of the targets, the authors also obtained numerous X-ray structures to serve as experimental answers for the binding pose prediction task.
(3) The study reports relationships between structure prediction confidence, predicted energies (DOCK3.7), and affinity predictions (Boltz-2) with the geometric accuracy of compound pose prediction as well as the experimentally measured potency.
(4) One of the key findings is the limited ability of co-folding methods to predict conformational rearrangements, which does not correlate with their ability to predict binding poses of the compounds inducing these rearrangements.
(5) The findings could serve as useful guidelines for computational chemists in selecting appropriate software and scoring schemes for each task.
We appreciate Reviewer 2’s summary of the novelty of the dataset and analysis.
Weaknesses:
While I consider this a solid study, several aspects would need to be addressed to make it really strong:
(1) DOCK3.7 docking and scoring experiments were performed using one experimental structure of Mac1, selected from dozens of structures based on a criterion that is not sufficiently well justified. For sigma2 receptor, dopamine D4 receptor, and AmpC β-lactamase, it is not clear which structures or models were selected for docking at all. It is well known that geometry predictions, scoring, and active-inactive ROC AUCs are all strongly influenced by the selected structure. It would be important to attempt Mac1 docking using all available experimental Mac1 structures, or at least against representative structures in various conformations; it would also be quite insightful to compare results to docking of the same compound sets to AF3, Boltz-2 and Chai-1 predicted structures of Mac1. Same goes for the docking studies of sigma2, D4, and AmpC β-lactamase.
In any program, a decision has to be made as to which template will be used for docking, we justified the choice in the methods:
“We used this structure because the inhibitor (Z5014193706) was the most potent molecule with a structure determined around the same time as the ligands in this dataset were tested.”
We stand by this as a reasonable assumption. Similarly, for sigma2, D4, and AmpC β-lactamase, the template was chosen in the respective papers:
a) The σ2 receptor bound to cholesterol (PDB ID: 7MFI) was used in the docking calculations.
- This structure was determined in the paper, the first structure of sigma2 and therefore a worthy template
b) The D4 receptor campaign used PDB 5WIU
- This was one of two D4 structures available and chosen because it was not bound to sodium
c) For AmpC, the campaign used the structure in the Protein Data Bank (PDB) 1L2S
- This maximizes comparisons to other docking studies that used the same receptor template.
The major goal of this study is to compare different methods under reasonable (but perhaps as the reviewer points out, not optimal) conditions, not to optimize docking score.
(2) For binding affinity predictions, as a control, authors should consider compound co-folding with an unrelated protein, or even with a pseudo-peptide that consists of a few random single amino acids - this would provide an honest baseline for such predictions.
This suggestion would be valuable for understanding the performance for these methods from the perspective of ligand specificity (a valuable, but separate, goal). Surely this will generate some number or some prediction - but what would this baseline mean and how would it be relevant for drug discovery? Therefore, we do not think this suggestion is relevant for the issues being investigated in this manuscript.
(3) ROC curves Figure 3 and elsewhere should be shown, and AUCs quantified/reported on a log or square-root scaled x-axis, to emphasize early enrichment, which is the area of practical significance for these predictions. For example, Figure 3A currently suggests that the pose prediction performance of AF3 exceeds that of Boltz-2 whereas the early enrichment is clearly better for Boltz-2.
We agree with this, and added a semi-logAUC plot for Figure 3A. For Figure 5, we also generated a semi-logAUC plot to see early ligand enrichment clearly, added as Supplementary Figure 11. We added the text:
“Considering its early enrichment performance, Boltz-2 Ligand ipTM was the strongest predictor of pose accuracy based on normalized logAUC (20.5% above random, Fig. 3a). In contrast, although Boltz-2 pIC50 showed poor overall discrimination, it overestimated its ability to enrich true positive poses at low false positive rates, despite having a weak early enrichment behavior”
(4) 'Trained set' in figures and text should probably be 'training set'? Or otherwise explain this new term the first time it is introduced.
Thank you for pointing out this for clarification. ‘Training set’ is the correct word, and we made changes appropriately across all figures and texts.
(5) Figure 1 illustrates a projection onto the first two principal components of a space that apparently had only one (scalar) metric for each compound pair (% maximum common substructure or Tanimoto coefficient); the authors need to better explain the principle behind this analysis and visualization.
This suggestion is valuable, since we often use PCA to reduce dimensionality for more complex features. For clarification, we actually have a full pairwise similarity matrix for all tested Mac1 compounds based on each of Tc and MCS%. PCA for each MCS% and Tc is a representation of each pairwise similarity matrix. We also made a change in Figure 1 caption to make this point clearer:
“projection of compounds represented by their full pairwise similarity vectors (by ECFP-4 Tc and MCS%)”
Reviewer #3 (Public review):
Summary:
This study's core conclusions are well-supported by data. It is shown that co-folding outperforms docking in known ligand pose/affinity prediction (validated by RMSD and IC₅₀ correlation), struggles with false-positive discrimination in virtual screens (lower AUC values), and is complementary to docking (non-correlated errors, distinct strengths in drug discovery stages).
Strengths:
(1) Unprecedented prospective design with 557 novel Mac1-ligand complexes ensures rigorous, independent evaluation of co-folding methods.
(2) Comprehensive comparison of 3 co-folding tools (AlphaFold3, Chai-1, Boltz-2) with DOCK3.7 across diverse targets and metrics enables nuanced performance assessment.
(3) The study clearly demonstrates complementary roles of co-folding (superior pose/affinity prediction for known ligands) and docking (better hit prioritization), and addresses deep learning memorization concerns via ligand similarity analysis.
We thank Reviewer 3 for pointing out the unprecedented and comprehensive nature of our study
Weaknesses:
(1) Limited generalization to diverse protein families (e.g., no ion channels/transporters).
We agree - we have not explored the entire proteome and these are important target classes that will surely be investigated by future studies. We focused on targets here where we had large number of X-ray crystal structures (Mac1) and affinity/inhibition measurements from docking (the other three targets).
(2) Ambiguity in the mechanism underlying co-folding's failure to predict rare conformational changes.
Again, we agree. We are not the developers of these methods. We observe that these methods do not predict conformational changes with high fidelity and this weakness is an area that co-folding methods will surely prioritize in the future.
(3) Virtual screen comparison is unbalanced (docking-prioritized hit lists bias results).
We acknowledge this in the results: “An important caveat is that the hit-lists were composed of molecules prioritized by docking in the first place, giving it an advantage on these particular sets.” and discussion: “Finally, comparing co-folding to docking based on hit-lists themselves selected by docking is arguably unfair to co-folding. Counter-balancing this is the inclusion, in each of the three hit lists, of molecules that had mediocre and poor docking scores intentionally selected to test the correlation between docking score and hit-rate. Here too, the correlation between co-folding score and likelihood to bind, what we sometimes call a “dock-response-curve” was no better than docking’s, often worse (SFig.11).”
Recommendations for the authors:
Reviewer #1 (Recommendations for the authors):
Here are suggestions for revisions:
(1) The writing is at times obtuse and hard to follow.
This happens sometimes when multiple authors are writing together. We apologize and are happy to respond to specific areas that can be streamlined to be easier to follow.
(2) In the Results section, "A set of 557 previously unreported Mac1 ligand complexes", the authors have compared the ligand poses across different metrics such as Tc - a standard, highly effective method in chemo-informatics and MCS (maximum common substructures); these are standard metrics for quantifying the structural similarity between pairs of small molecules. This part of the analysis checks whether this is memorization; it is critical to compare the two metrics, but it is not sufficient to draw a conclusion.
Thank you for pointing out about the structural similarity of molecules co-folded to those present in the training set (resolved as Mac1 complexes and deposited in PDB before training dates). We have conducted an analysis where we do a pairwise similarity comparison for all ligands present in the PDB (regardless of the target), by both Tc and MCS, and overlay the cluster of ligands we tested (Mac1, AmpC, sigma2, D4). This should show where our tested benchmark datasets lie in the chemical space covered in the entire PDB. Each cluster (around 500 to 1300 compounds per target system) is overlaid on the cluster of all ligands deposited in PDB (over 50,000 compounds), and each cluster was relatively diverse by both Tc and MCS.
(3) In the "Co folding can accurately reproduce poses of ligands dissimilar to those trained." Subsection under Results, the authors' conclusions are hard to follow; they state that the co-folding models often mispredict or miss the alternative conformation, but they also predict poses that are distinct from the training set. What does that imply?
Our interpretation is actually a somewhat unsettling one: co-folding gets the ligand pose right even when it gets the protein wrong, and even when the ligand is novel. This suggests the models may be anchoring on conserved pharmacophoric interactions (like the adenosine-mimicking purine scaffold) rather than truly modeling the physics of the full complex. We added to the results section:
This result suggests that co-folding reliably recapitulates dominant ligand-binding interactions even in the absence of accurate protein conformational modeling, providing further support to the idea that they are learning specific interaction patterns rather than a deeper physics-based representation (Masters et al. 2025).
(4) The Discussion section connects the results and conclusions, but it can be challenging to grasp the study's overall message.
We think the final paragraph hits on three major points:
- Co-folding accurately predicts ligand poses for known binders, but fails to capture conformational changes
- Co-folding does not reliably distinguish true binders from false positives in virtual screening hit lists
- Docking and co-folding are complementary rather than competing tools
(5) The work is highly detailed and well executed, featuring thorough data analysis and statistical assessment. The value of the paper would be further enhanced by explaining how it differs from seemingly similar results reported in other studies, including the one cited in this manuscript (see https://www.biorxiv.org/content/10.64898/2025.12.04.692352v1).
The Mac1 results are completely unique. However, the docking datasets are exactly the same as those analyzed in the Menon et al manuscript. We don’t think our results differs from conclusions of the Menon et al manuscript as we wrote: These observations are supported by a fascinating study on some of the same ligand sets as investigated here, using AlphaFold3, reaching similar conclusions (Menon et al. 2025).
Reviewer #3 (Recommendations for the authors):
(1) Expand target diversity to include ion channels, transporters, etc., beyond enzymes and GPCRs.
(2) Investigate the cause of co-folding's failure in predicting rare conformational changes (e.g., adjust sampling, MSA inputs, or add experimental constraints).
(3) Mitigate docking bias in virtual screens (e.g., re-analyze unbiased compound libraries).
We addressed these three points in the public review above
(4) Test Boltz-2's affinity predictions without linear calibration and compare with FEP.
The data without linear calibration are included in the manuscript. Comparing such a large number of compounds with FEP is currently beyond our capabilities.
(5) Conduct proof-of-concept to test co-folding-docking integration for better hit rates.
We think this is well beyond the scope of this manuscript - but look forward to testing this idea in the future.
We also got one community review that we respond to below:
Summary
This manuscript evaluates the performance of co-folding models when tasked with 1) the recapitulation of a large number of experimentally determined co-crystal structures of Mac1 with a series of Mac1 ligands and 2) the rescoring of hits to identify false positives originally derived from a set of large docking-based virtual screens. The evaluation leverages a dataset of crystal structures and affinity data from high-throughput crystallographic and biophysical screens, respectively. These data uniquely enable this report to focus on the ability of co-folding models to handle ligands, resulting in an analysis that is particularly timely given the wide adoption of co-folding models and the relative scarcity of such ligand-focused benchmarks among existing evaluations, which have primarily focused on protein structure prediction or binder design.
Thank you for this thoughtful summary of our work
Feedback
The experiments and analyses in the manuscript are well thought-out and do not have any significant issues. There are a few high-level points that may improve the clarity and completeness of the results. Importantly, none of the suggested additional experiments will affect the conclusions of the paper, but rather help provide additional context for the results:
The first section presents an exciting opportunity to frame the Mac1 ligands against ligands in the PDB more broadly. It would be informative to assess whether chemotypes that are easier or harder to predict accurately and confidently are over- or under-represented in the PDB as a whole. Note that this is not a recommendation that new scaffold similarity metrics be incorporated into the analysis, but rather that analyses similar to those already performed in the manuscript are performed using all ligands in the PDB. For example, PCA-based analyses similar to those in Fig. 1c could be used to examine Mac1 ligands in the context of all PDB ligands enabling questions such as whether similarity to a nearest PDB neighbor, cluster size in a Tc/MCS PCA space, or other frequency-based measures show any relationship with prediction vs. crystal structure RMSD. Such analyses could provide additional insight into how effectively models leverage ligand information present in the PDB overall, as opposed to biases arising specifically from scaffolds represented in Mac1 structures in the PDB, which are already well covered in the manuscript. The conclusion that Tc/MCS do not correlate with the ligand RMSDs for the ligands already associated with the Mac1 is well supported, and presumably suggests that a correlation would not exist against the backdrop of the PDB, but it would be interesting to see the data using analyses similar to those already done in the manuscript nonetheless.
We are adding new figures in SFig.1 that consider how different clusters of ligands tested for our co-folding analysis are distributed across the chemical space in PDB. This is done by making a similarity comparison between every ligand in PDB and those tested in our analysis by Tc and MCS%, then plotting in PCA space for each metric. We are excited to see that each dataset covers a wide scope in PCA space, but at the same time, there are unexplored areas in the chemical space of PDB by co-folding.
Similarly, even though the four proteins used in this manuscript are not themselves the primary focus of the analysis, it would be valuable to perform a high-level assessment of the precedent for each protein in the PDB (beyond the count of liganded structures in Table S6), either in protein sequence space (e.g., MSAs) or structural space (e.g., FoldSeek). An analysis like this would provide important context about whether any of the proteins in the study have close homologs with liganded structures in the PDB, or are generally overrepresented in the PDB. The fact that the AUC for L-pLDDT for AmpC is higher than σ2 and D4, for example, is notable given the relative abundance of liganded AmpC structures in the PDB (this raises potentially interesting questions related to where DOCK3.7 and AF3 actually place the ligands, given the orthosteric β-lactam binding pocket in AmpC, although this is outside of the scope of this manuscript).
High-level assessment of the precedent for each protein in the PDB will definitely help to understand if proteins we used have close homologs with liganded structures in the PDB. Our Supplementary Table 6 covers the extent to which these liganded structures were available by cutoff dates for AF3, Chai-1 and Boltz-2. AmpC had more homologs than sigma2 and D4, and this may explain a better AUC for AF3 L-pLDDT specifically for this target.
A discussion of the affinity probability results (`affinity_probability_binary`) from Boltz-2 is likely warranted in the second section in addition to the pIC50s that are already reported (`affinity_pred_value`). The former seems like it would be more applicable for section 2 of the manuscript, but both warrant inclusion—they should both be calculated by default when the affinity pipeline in Boltz-2 is turned on, so it wouldn't involve any more inference.
As boltz-2 affinity module outputs both affinity probability binary output and affinity predicted value, we kept track of both metrics. So we tried re-ranking hit lists using both metrics. Where boltz-2 performed better (Sigma2, D4), binary probability values were more representative as a metric to differentiate true actives from non-binders. This was more clear in semi-logarithmic ROC plots. However, in AmpC, both Boltz-2 scoring metrics performed similarly. Such inconsistency in trend made it difficult to draw conclusions.
Minor points
A more detailed description of the experimental methods used to generate the ground-truth data in the introduction (even though these have been explained in prior works) would help orient the reader early on, and ground the benchmarking aspect of the story. In general, the abstract and introduction would benefit from a more cohesive through-line to tie the two complementary but orthogonal sections of the paper together.
We will include a more thorough description alongside the PDB depositions. As for the two sections, we have tried to tie them together from the perspective of drug discovery workflows…
The cutoffs in the "Co-folding can accurately reproduce..." section shift between 2.5 Å (from the ligand center of mass) and 2.0 Å. Is there a reason for this? Along similar lines, mentioning cutoffs for true positives/negatives when introducing the ROC analyses later on in the Mac1 section seems unnecessary since no cutoff should be necessary here.
We used 2.5A distance to COM to just get at “broadly the correct binding site” for fast filtering and 2.0A RMSD because that is the broadly accepted standard in the field for “relatively correct binding pose”.
see Interrelationships3yrAvg
Excel sheet has been attached
Urban sprawl
Glossary Terms (the word popups with explanation) not working in Source link: https://pressbooks.pub/worldgeo/chapter/north-america/#term_58_172
Note: This response was posted by the corresponding author to Review Commons. The content has not been altered except for formatting.
Learn more at Review Commons
Manuscript number: RC-2026-03407
Corresponding author(s): Laura Cantini, Julio Saez-Rodriguez
[The "revision plan" should delineate the revisions that authors intend to carry out in response to the points raised by the referees. It also provides the authors with the opportunity to explain their view of the paper and of the referee reports.
The document is important for the editors of affiliate journals when they make a first decision on the transferred manuscript. It will also be useful to readers of the reprint and help them to obtain a balanced view of the paper.
If you wish to submit a full revision, please use our "Full Revision" template. It is important to use the appropriate template to clearly inform the editors of your intentions.]
This section is optional. Insert here any general statements you wish to make about the goal of the study or about the reviews.
We thank both reviewers for their thorough and constructive evaluation of our manuscript.
Reviewer 1 highlighted that the manuscript would benefit from 1) a stronger positioning of ReCoN within the existing literature on multicellular modelling and network exploration, 2) a justification of our methodological choices, including the use of Random Walk with Restart (RWR), 3) the choice of input datasets for GRN inference and an assessment of the robustness of ReCoN's predictions to noise in these networks, 4) a more systematic exploration of ReCoN's parameter space (restart probability, layer transition probabilities, filtering thresholds).
Reviewer 2 raised concerns about 1) the generalisability of the α parameter value (by default, 0.8) across independent datasets, 2) the expected contribution of the indirect effect in prediction performances, 3) the robustness of GRN across datasets and systems, and 4) the need for more quantitative validation in the spatial/microenvironment showcase. They also pointed out an unsupported claim regarding gene knockout prediction in the abstract.
Several clarifications on figures, methods, and writing were also requested by both reviewers.
As the main addition to the manuscript, we propose a new showcase based on the recently published Human Cytokine Dictionary (Oesinghaus et al., 2025). This showcase will simultaneously address several reviewer concerns by allowing us to 1) test the robustness and performance of α = 0.8 in an independent dataset, 2) evaluate the impact of different GRN inference methods (HuMMuS, SCENIC+, CellOracle, GRNBoost2) and noise on ReCoN's predictions..
We will conduct a systematic parameter exploration on the Heart Atlas showcase, covering restart probability and inter-layer transition probabilities. We will additionally strengthen the validation of the microenvironment showcase by providing additional comparison to matched single-cell fibroblast data.
Regarding the manuscript, we will substantially expand the discussion to better contextualise ReCoN within existing multicellular modelling approaches and the methods to justify our methodological choices (RWR/MultiXrank, dataset selection). We will remove the unsupported gene knockout claim from the abstract and reframe it as a future direction. In addition, we will clarify the distinction between ReCoN variants and rename them for clarity in the results section 1.2., improve figure legends. Finally, we will also work on the tool's documentation, including new tutorials on using spatial data and on running ReCoN with scRNA-seq-only GRN inference.
We believe these revisions will substantially strengthen the manuscript and address the reviewers' concerns regarding method's robustness, generalisation, and contextualisation.
Reviewers' comments are in blue
Authors' answers are in black
Proposed text modifications are in green
Reviewer #1
R1.1. This is a very well-written paper; the methods used are adequate, and the use cases are relevant and broad, exploiting state-of-the-art datasets and tools.
The author's claims are mostly justified. The authors could make an effort to more explicitly cite other efforts in similar directions. The claim 'We envision ReCoN as an extension to prior multicellular modelling, offering an interesting compromise between prediction of cell type responses and understanding of their molecular coordination.' is very general and could be better substantiated. In fact, the authors do not really give examples of alternative approaches to study systems of interacting cells, other than mechanistic agent-based models, which are clearly very different.
Response:
We thank the reviewer for pointing out the lack of contextualisation for ReCoN in this closing discussion.
We wanted to remind that ReCoN builds notably on multicellular factor decomposition methods. We also want to emphasise the interest in completing cell communication methods that describe the big picture in multicellular interactions.
We proposed to *explicitly state these two points with such rephrasing: *
Network-based representations of multicellular systems have been an active field for many years, from early conceptual cytokine networks (Frankenstein, Alon, and Cohen 2006) to curated ligand-receptor cascades of hematopoietic tissue (Kirouac et al. 2010, Qiao et al. 2014). In parallel, and from bulk RNA-seq, the consideration of tissue specificities in GRN inference has been another way to consider the importance of the context in molecular mechanisms reconstruction (Sonawane et al. 2017). Single-cell analysis allowed decomposing tissue composition and quantifying gene expression, opening the possibility of scaling the inference of these networks and the inference of multicellular mechanisms in general, to large sets of molecules. Several methods have been developed to recover multicellularity. A first direction extends ligand-receptor interaction inference into the receiver cell response through curated signalling cascades, yielding ligand to target cascades (Browaeys, Saelens, and Saeys 2020, Jin et al. 2021, Zhang et al. 2021, Yan et al. 2025). A second direction leverages spatial context through explainable multi-view models that decompose marker variation in both intra- and intercellular contributions (Arnol et al. 2019, Tanevski et al. 2022), without considering the mediating cascades. Finally, the more recent family of multicellular factor decomposition methods focuses on the coordinated aspect of cellular programs rather than on the mechanisms. ReCoN's methodology proposes a network-based approach based on single-cell data and the philosophy of this last group of methods. Indeed, ReCoN aims to retrieve links between molecular drivers and such coordinated multicellular programs by bridging and exploring CCC inference and GRN modelling (Badia-i-Mompel et al. 2023) within large and coherent heterogeneous multilayer network.
Arnol D, Schapiro D, Bodenmiller B et al. Modeling Cell-Cell Interactions from Spatial Molecular Data with Spatial Variance Component Analysis. Cell Rep 2019;29(1):202-211.e6. https://doi.org/10.1016/j.celrep.2019.08.077.
Badia-i-Mompel P, Casals-Franch R, Wessels L et al. Comparison and evaluation of methods to infer gene regulatory networks from multimodal single-cell data. Preprint, bioRxiv, 21 Dec. 2024, 2024.12.20.629764. https://doi.org/10.1101/2024.12.20.629764.
Badia-i-Mompel P, Wessels L, Müller-Dott S et al. Gene regulatory network inference in the era of single-cell multi-omics. Nat Rev Genet 2023;24(11):739-54. https://doi.org/10.1038/s41576-023-00618-5.
Browaeys R, Saelens W, Saeys Y. NicheNet: modeling intercellular communication by linking ligands to target genes. Nat Methods 2020;17(2):159-62. https://doi.org/10.1038/s41592-019-0667-5.
Frankenstein Z, Alon U, Cohen IR. The immune-body cytokine network defines a social architecture of cell interactions. Biol Direct 2006;1(1):32. https://doi.org/10.1186/1745-6150-1-32.
Jin S, Guerrero-Juarez CF, Zhang L et al. Inference and analysis of cell-cell communication using CellChat. Nat Commun 2021;12(1):1088. https://doi.org/10.1038/s41467-021-21246-9.
Kirouac DC, Ito C, Csaszar E et al. Dynamic interaction networks in a hierarchically organized tissue. Mol Syst Biol 2010;6(1):MSB201071. https://doi.org/10.1038/msb.2010.71.
Oesinghaus L, Becker S, Vornholz L et al. A single-cell cytokine dictionary of human peripheral blood. Preprint, bioRxiv, 15 Dec. 2025, 2025.12.12.693897. https://doi.org/10.64898/2025.12.12.693897.
Qiao W, Wang W, Laurenti E et al. Intercellular network structure and regulatory motifs in the human hematopoietic system. Mol Syst Biol 2014;10(7):MSB145141. https://doi.org/10.15252/msb.20145141.
Radig J, Droit R, Doncevic D et al. Tracking biological hallucinations in single-cell perturbation predictions using scArchon, a comprehensive benchmarking platform. Preprint, bioRxiv, 27 June 2025, 2025.06.23.661046. https://doi.org/10.1101/2025.06.23.661046.
Sonawane AR, Platig J, Fagny M et al. Understanding Tissue-Specific Gene Regulation. Cell Rep 2017;21(4):1077-88. https://doi.org/10.1016/j.celrep.2017.10.001.
Tanevski J, Flores ROR, Gabor A et al. Explainable multiview framework for dissecting spatial relationships from highly multiplexed data. Genome Biol 2022;23(1):97. https://doi.org/10.1186/s13059-022-02663-5.
Yan L, Cheng J, Nie Q et al. Dissecting multilayer cell-cell communications with signaling feedback loops from spatial transcriptomics data. Genome Res published online 12 May 2025. https://doi.org/10.1101/gr.279857.124.
Zhang Y, Liu T, Hu X et al. CellCall: integrating paired ligand-receptor and transcription factor activities for cell-cell communication. Nucleic Acids Res 2021;49(15):8520-34. https://doi.org/10.1093/nar/gkab638.
R1.2. Moreover, the exploration of the multilayer networks with RWR is a very reasonable choice but could there be other approaches? I think the authors could discuss this issue to briefly support their choice of this method.
Response:
It is a very relevant comment, as this choice has not been discussed in the paper; we propose extending the method section about ReCoN's networks exploration with a justification about this choice.
There is currently a limited set of network exploration methods that have been implemented for multilayer networks. It includes notably pymnet (Nurmi et al., 2024), natively adapted to heterogenous multilayer networks, and multinet (Bagavathi et al., 2019) and muxviz (De Domenico et al., 2015), initially developed for multiplexed networks (e.g. social network where the same set of nodes is present in each layer) but adaptable to more complex multilayer networks. However, to our knowledge, only MultiXrank proposes a robust measurement of proximity between each pair of nodes.
Indeed, pymnet does not propose implementation for pairwise distance, similarly for muxViz, which focuses on community and motif detection. Multi-net does propose pairwise distance based on shortest paths, but implements it only for nodes of the same multiplex (e.g. in our network, it would only be two genes, or two receptors, respectively). https://www.rdocumentation.org/packages/multinet/versions/4.3.2/topics/multinet.distance
We provide the additional justification for choosing RWR and MultiXrank over a reimplementation of another method or an extension of another method.
*
The total complexity of the RWR is O(δm) - when the number of nodes is negligible compared to the number of edges, with m the number of edges and δ the number of iterations in the walk (Baptista et al., 2022 - Supp Notes 2.A; Jin W. et al, 2019). This linear increase with the number of edges is particularly interesting for large networks, such as ReCoN ones that can contain several million* edges. The number of iteration δ and the computational time increases inversely to the restart probability, which is an important factor to keep this probability high. *
*
*MultiXrank is particularly interesting for its flexibility as it allows to easily attribute different weights to the different layers and to precise the direction of the exploration easily. *
*
It also produces deterministic results by prolonging exploration until convergence.
*
Additionally, in the context of ReCoN, the indirect effect of each cell is run independently. We previously extended the implementation of multiXrank for running RWR in parallel in a previous work (Trimbour et al., 2024), making it already adapted for optimising ReCoN's explorations.
For all these reasons MultiXRank implementation seemed to be the best choice for robust and efficient exploration of ReCoN's HMLN.
Bagavathi, A., Krishnan, S. (2019). Multi-Net: A Scalable Multiplex Network Embedding Framework. In: Aiello, L., Cherifi, C., Cherifi, H., Lambiotte, R., Lió, P., Rocha, L. (eds) Complex Networks and Their Applications VII. COMPLEX NETWORKS 2018. Studies in Computational Intelligence, vol 813. Springer, Cham. https://doi.org/10.1007/978-3-030-05414-4_10
Manlio De Domenico, Mason A. Porter, Alex Arenas, MuxViz: a tool for multilayer analysis and visualization of networks, Journal of Complex Networks, Volume 3, Issue 2, June 2015, Pages 159-176, https://doi.org/10.1093/comnet/cnu038
Nurmi et al., (2024). pymnet: A Python Library for Multilayer Networks. Journal of Open Source Software, 9(99), 6930, https://doi.org/10.21105/joss.06930
Jin, Woojeong, Jinhong Jung, and U. Kang. "Supervised and extended restart in random walks for ranking and link prediction in networks." PloS one 14.3 (2019): e0213857
R1.3. Generally the discussion should provide the reader the context in the existing literature in which the work can be set, detailing its impact. I think this could be improved.
Response:
We hope that the correction on the context proposed for comment R1.1 offers a first clarification on the context in the literature.
We also propose to extend the description of ReCoN's impact with the following sentences in the discussion: "Unlike purely data-driven approaches, ReCoN contextualizes prior knowledge balancing both robustness through literature data, and specificity through new measurements. This mechanistic approach opens new possibilities for understanding how cellular coordination shapes tissue-level responses and for designing targeted molecular interventions."
R1.4. Regarding the choice of datasets, it is clear that the method is quite demanding, requiring single cell and different omics to build the model, in addition to the expression dataset that is used as a use case. This inevitably leads to using a mix of datasets.
For example in the mouse experiments the gene regulatory network was inferred from both a lymph node scRNA-seq dataset and a splenic scATAC-seq dataset, presumably due to the lack of multiome data in this setting. However the cell-cell communication network was inferred from the control case of the Immune Dictionary. Why can't the authors use the control data also for inferring GRNs?
Is atac-seq really necessary in the inference of the GRN? What is the impact of the fact that lymph node and spleen samples might be different?
:
Is it a very *interesting comment, and we propose to add both 1) an explanation about our dataset choice to generate the GRN as a Supplementary text, and 2) a new experiment about the effect of GRNs built from multi-omics and scRNA-seq alone. *
*
Dataset choice
We decided to infer a GRN using multiomics data, as these methods seem to perform better and are becoming the state of the art (Badia-i-Mompel et al. 2023, Trimbour, Deutschmann, and Cantini 2024, Yuan and Duren 2025).
As scATAC-seq data was not produced for the Mouse Immune dictionary, we tried to find an external dataset, used HuMMuS, the method we previously developed, as it is also based on RWR and performs well on unpaired data.
scATAC-seq
Our first criteria was to match the mouse model used in the immune dictionary dataset, which reduced importantly the number of multicellular immune cell datasets available. We extended our research to a splenic dataset, as spleen is itself classified as a high specialised lymphatic structure, (check) and contains notably the same cell types than classical lymph nodes.
scRNA-seq
While we could technically use the control mice of the Immune Dictionary single-cel RNA-seq data with the spleen scATAC-seq data, the Immune Dictionary only provides 100 or less cells for each cell types per stimulation, which would results in a low number of cells. As GRN quality seems to depend a lot on the number of cell used, we favoured choosing a larger dataset.
Our choice to use single-cell multiomics methods was driven by the novelty of these methods over scRNA-seq based ones, the performance improvement that they seemed to offer in several benchmarkings, and the will of developing a pipeline integrating the most complete data available for contextualization (Badia-i-Mompel et al. 2024).
*
GRN impact over the Human Immune Dictionary
While it does not relate directly to this showcase, we will also add a new dataset analysis, detailed in the the comment R1.12. In the Human Cytokine Dictionary showcase,, we propose exploring the effect of choosing different GRNs, built from external multi-omics data or from the control scRNA-seq data of the dataset itself. We hope it can partially help users to decide in general wether to use external datasets of higher quality or sample-specific datasets.
Finally, we propose to add in the documentation of the tool, a section showing how to use ReCoN with only scRNA-seq for the GRN inference, and the performance of different GRNs for the Human Cytokine Dictionary dataset directly in the paper.
R1.5. The code is very clear, we were able to install and run it and it is quite well-documented. However, a few more details should be given in the text regarding how the evaluation of the performance is carried out.
For example: If I understand correctly, when predicting the impact of cytokine perturbations the ReCoN predictions of genes impacted are compared to differentially expressed genes identified through traditional DEG analysis. What is compared is the ranking of these genes from ReCoN with the ranking provided by DEseq2. There is no description of how this comparison of ranking gives rise to AUROC values. Also, is it just the ranking that is predicted or can they also estimate how well they can predict the effect size?
Response:
We are thankful for pointing out the unclear technical details. DEG results were binarised, to obtain the list of differentially genes using the thresholds indicated in the section 4.4.4. We considered a gene as perturbed in each cytokine treatment if the comparison of control and treated cells had a t-test p-value below 0.1 and if the log-fold change was above 1.
The second, and more general point of the reviewers, ReCoN scores should be considered to provide ranking on the possible regulations, but cannot be considered proportional to the effect size. As they are represent a likelihood more than a score, the binarisation should be the most appropriate transformation for the validation
*Moreover, as the scores can be seen as the probability to end up the exploration on each node, they are always summing to one. This also prevents interpreting the scores as the amplitude of change. As an illustration example: if a receptor regulates three genes identically, they would (hopefully) all be having a score of (1 - R)/3, R being the restart probability in ReCoN, whether their expression doubles or is multiplied by 10. *
While it can legitimately be seen as a downside, we believe it is similar in practice to most methods inferring GRN methods in practice, where trying to predict the true amplitude of gene perturbations usually results in very low performances (Badia-i-Mompel et al. 2024).
We propose changes related to this comment.
*
We would modify the section 4.4.4. of the method with the following paragraph to explicit that it consists in a binary selection: "For each cytokine-cell type pair, differentially expressed genes were binarised: genes passing the significance thresholds (FDR P-val 1) were labelled as positives, and all remaining genes as negatives. ReCoN scores were then used to rank all genes, and AUROC values were computed from this ranking against the binary labels."
*
We will also include a section "ReCoN scores interpretation" on the documentation website, as score interpretation precisions will be particularly useful for users.
R1.6. When describing the use cases, I think a bit more detail would help.
For example 'To identify the cell-type-specific genes associated with HF, we used the MOFAcell scores of the multicellular factor 1 (MCP1) reported in ReHeat236' I supposed the explanation is on the dataset but for the sake of clarity it would be good to expand this sentence to give at least an idea of the approach.
Response:
We completely agree that more explanations should be provided, to avoid for the reader having to switching between articles to understand the concepts behind this showcase. As suggested by the reviewer, we propose a general description of the approach with the short paragraph, and to remove the term "loading":
"In the ReHeat2 study, the first multicellular factor (MCP1) was associated with heart failure. We used the gene loadings of MCP1 as a proxy for the cell-type-specific transcriptomic changes associated with heart failure, ranking genes by their absolute loading values."
We also propose to complete the method section: "MOFAcell is a multicellular factor analysis method that decomposes multi-sample single-cell data into latent factors representing coordinated gene expression patterns across cell types. Each factor is characterised by cell-type-specific gene scores, reflecting their individual contribution to the coordinated program. In this showcase, we use the first multicellular program (MCP1), as it was associated with heart failure"
R1.7. Regarding the calculation of the R matrix from the NichNet matrices L and G, I gather that the R matrix is calculated once and is thus fully data-independent and available just like the L and G matrices from NichNet. This was not very clear in the tutorials.
Response:
We are very thankful for the reviewers' involvement in testing the tools itself and its documentation. First, we propose a new website page explaining the pre-computed resources available for receptor - gene links, and added a descriptive paragraph in the tutorial themselves.
*Second, we notice a typo in the equation, where it should actually be L = R * G with the current definition. We corrected it in the next version, and precised that R is fully data independent and solely inferred from prior knowledge. *
R1.8. Also, this might just be a typo in the tutorial: 'The default α = 0.8 gives more weight to direct effects, which has been empirically validated. You can adjust this based on your biological question." I believe the manuscript says alpha>0.5 refers to indirect effects dominating.
Response:
We corrected the saying in the tutorials. Indeed, a high alpha represents a stronger indirect effect. Additionally, a similar typo was in the first equation of the paper, we are correcting it too.
R1.9. Same for the pre-processing of the spatial data for the third use case, a little more details on how this was done would help the users and readers.
Response:
We propose adding a specific section about the spatial pre-processing and analysis in the methods.
We are also adding a tutorial on spatial data. Since spatial data processing is computationally intensive without GPUs, we will also provide the data already processed, in order to allow anyone to test this tutorial too.
R1.10. I don't see issues with the statistical power of the analysis.
Rather, I think the authors should provide some examination of the parameter space for their model. Whereas ana analysis of the impact of the Alpha parameter is provided, I believe there are several more parameters that have a crucial impact and choices for their values should be discussed.
For example 'In the GRN reconstruction only the links with a score above 1.5e-7 were retained in ReCoN's gene regulatory layer. How was this chosen?
We have identified the following parameters that are somehow justified but could be explored to have a better feel for how they impact the results
Restart probability: How often the walker goes back to the starting seed/molecule
Layer transition probability: How often the walker stays in the same layer - different cell? - different layers? Gamma
Node transition within a layer: How often one jumps to a different layer
Response:
This is a very valid point raised by the reviewer about parameters explorations.
We focused on exploring the alpha (direct/indirect effect) parameter, as its value was the incertitude when designing the model.
We would like to address this comment by adding new explorations for the restart probability and the transition probability between layers. The probability to transition between specific nodes inside a layer directly depends itself on 1) the restart probability, 2) the transition probabilities, and 3) the weights of the edges, that are determined before and independently to ReCoN's exploration.
The Heart Atlas showcase allows to evaluate each set of parameters in around 10 min instead of 10h for the Immune Dictionary. We thus propose to evaluate restart probability and layer transition probabilities on the data of this showcase.
*
We would explore the restart probability of 0.1 * N, with N between 1 and 9.
*
For transitions probabilities we propose varying GRN, receptor, and cell communication importance with the following configurations: - Staying in CCC probabilities (- not jumping to receptor layer) among (0.1, 0.3, 0.5, 0.7, 0.9), staying in receptor layer (- not jumping to GRN) of (0.25, 0.5, 0.75), staying in GRN layer (- not jumping to CCC) of (0.25, 0.5, 0.75). It would result in 9 intracellular variations combined with 5 intercellular variations.
We envision an evaluation by measuring the correlation between the results of the different configurations, and the time before convergence of the results, as it could potentially increase drastically when decreasing the restart probability. If correlations below 0.9 are observed between some results, we will compare their absolute performances.
We would include the figures related to these explorations in the supplementary data. We would highlight the main findings in the method section dedicated to the random walk with restart. Finally, we would briefly describe the parameter exploration design in the first section of the results, for curious readers who would like to verify parameter choice before reading the showcases.
R1.11. Weighting parameters: How much weight for direct or indirect effect to account for the combined effect - alpha - this is the only one that is explicitly explored.
Response:
We are very thankful for this comment, and we decided to modify our tutorial guidelines to make this choice more intuitive and general.
Indeed, 1.5e-7 would hardly make sense for most methods, which would not produce such low scores. We now propose to select the first 2 million connections of GRNs, in order to keep a complete or a large portion of the network if other methods than HuMMuS are applied.
In our case, 1.5e-7 was empirically determined from the distribution of HuMMuS scores, to keep the 2 million top connections as HuMMuS networks are generally almost fully connected, which is a particularity for classical GRN inference methods, and keeping it entirely would make exploration time much longer.
R1.12. Finally, this might be considered OPTIONAL but would greatly improve the work in our opinion:
The method crucially depends on the networks that are used in the different layers and to connect layers and cell types. As we know, biological data is noisy and incomplete (FP and FN) at each level and in each datatype. It would be really useful to estimate what is the robustness of the results to this noise. Particularly, from personal experience, we think the GRNs reconstructed from data are often almost fully connected and it is exceedingly difficult to validate them in specific contexts. This means that some 'errors' are likely to be present.
Since several methods exist for inferring GRNs one could simply compare the results using different methods for this part of the network.
A related point involves the characteristics of the RWR algorithm, that will be quite impacted by the presence of hubs in these networks (either in single layers or across several) that is likely to impact the exploration. If proteins that are hub are effectively important, that is not a problem, but in some layers, for example, the receptor-receptor layer that presumably will contain PPIs, there might be biases in hubs being just better studied proteins, and these hubs might have an 'unjustified' weight in the walks.
One potential approach to assess the robustness of the method to these issues could be an empirical one that just randomly perturbs the networks in ReCoN to see to what extent similar predictions are achieved.
*Response: *
We are thankful for this relevant comment on GRN and prediction stability, and would like to take it as an opportunity to support the hypothesis that different GRN methods can be used in ReCoN.
When developing our previous HMLN-based tool, HuMMuS (Trimbour et al. 2024 - Supp Figure 6), we observed that its multilayer structure provided more robust results than individual layers. We would like to reproduce such an analysis, verifying that ReCoN results have less variability than the GRN layers individually.
We propose to integrate a new showcase on the Human Cytokine Dictionary (Oesinghaus et al. 2025), trying to predict cytokine downstream effects similarly to the Mouse Immune Dictionary showcase.
This showcase would be useful to confirm the contribution of the indirect effect and test the impact of different GRN on the results.
We would generate different GRN with several other GRNs methods: SCENIC+, CellOracle, and GRNBoost2 - the latest using only the scRNA-seq of the control samples in the Human Cytokine Dictionary.
The GRN methods produce generally output with very low overlap (Badia-i-Mompel et al. 2024)*. *
*If we observe high correlations between the ReCoN predictions associated with the different GRNS, it would provide already a validation of ReCoN's robustness to GRN noise. *
If lower correlations between ReCoN's predictions are obtained, we will add a specific permutation experience over the HuMMuS GRN, creating different level of artificial noise and assessing more precisely the robustness of ReCoN to GRN stochasticity.
Regarding PPI hub justification, our *applications did not use receptor PPI and are not affected by bias at this level in the showcases. This bias could specifically be present in the receptor-gene links, as we derive it from the ligand-gene connections of Nichenet which was itself partially based on prior knowledge. It is thus possible that some receptor are reached more often due to this bias and not a stronger effect. It seems however, hard to control in this context, as ReCoN currently relies on this prior knowledge. Currently, we hope that the combination of personalised, literature-agnostic GRN with literature-based receptor - gene can provide an interesting trade-off. In future development, we could imagine a receptor-gene network based solely on perturbations, but it would require controlling also the bias of ligand - receptor binding couples, which limits even the use of ligand-based experience. *
We propose adding a short point in the discussion about hub effects from RWR-based methods.
R1.13. Please add page numbers.
*Response: *
We will add the page numbers.
R1.14. Figures are nice and clear.
Some specific minor points are listed here below.
Define hMLN on first appearance fig1 caption (no page numbers..
2nd appearance heterogeneous multilayer structure (HMLN) ...
Response:
We updated the legend of the figure to include the definition of the acronym, as it arrives before first text occurrence. (Or define at both positions ?)
R1.15. Bi_j not so clear to what it refers when first mentioned
Response:
*Bi_j represents a weight that can be attributed to favour some cell-to-cell transitions. It is usually not necessary to use them.
*
*It is of interest notably to model 1) known spatial patterns in situ and hypothesis/design where cell types favour some connections. *
E.g.: for modelling the skin, a user might notably want to increase connections between epidermic and dermic cells, and between dermic and hypodermic cells.
We propose a new explanation of Bi_j to both explain it's meaning in the modelling, and illustrates situations for using it: "The coefficient B_{i,j} modulates the influence of cell type i on cell type j in the indirect effect computation. By default, all B_{i,j} are set to one, weighting each cell type's contribution equally per cell. However, it can be adjusted to encode additional biological knowledge, such as spatial proximity between cell types or known cooperation patterns. For instance, when modelling the skin, a user might increase B_{i,j} between epidermal and dermal cells, and between dermal and hypodermal cells, to reflect their spatial organisation."
R1.16. personalized interaction specificity. - maybe better word than personalised (contextualised?)
Response:
We agree that contextualised explicits better the meaning behind this model. Personalised might notably lead to expect patient-specific data, which is not the case here.
We propose to rephrase all the model names to : Receptor-matrix, ReCoN-no-CCC, ReCoN-no-context, ReCoN-complete.
R1.17. ReCoN-genetic and ReCoN, ( generic?)
Response:
We will correct this typo.
R1.18. responses. It is expected to observe common behaviors in-between cell-type, that the GRN
and the generic CCC network already contribute captures.
- not very clear
Response:
We aimed here to provide an explanation to the already good performance of the "ReCoN-no-context" (or its name updated according to comment R1.16), which could be surprising as no cell-type specific information is used. The explanation proposed is the good prediction of several properties shared by all immune cell types, such as similar metabolic pathways, despite their specific roles. If we adopt a quantitative view on their transcriptome like in this showcase, it can be expected that the cell type responses are relatively well predicted through the common properties only.
As this is a very relevant comment, and that several comments pre-submission we received were also related to this result, we would like to keep an explanatory sentence.
R1.19. Figure 2b the icon of cells with double arrows might suggest phenotype shift when instead this is just communication
Response:
(left side) We are very thankful for paying attention to the details of the paper and fully agree with this analysis. We propose to represent ligand emission instead of arrows, reusing the convention of the Figure 1.
R1.20. eTACs explain acronym and what they are
Response:
We update the first occurrence of eTACS to extrathymic Aire-expressing cells (eTACS).
R1.21. Due to very few genes being differentially
expressed, only cDC1 was conserved and evaluated for IL22,
Not so clear
Response:
As we are commenting on IL22 stimulation results, we reorganised the sentence to make it less convoluted: "For IL22 stimulation, only cDC1 presented enough genes being differentially expressed."
R1.22. In this showcase (not very clear, use case?)
Response:
We perceive "use case" as describing a type of use for the method, while a show case is a specific example of a use case. We thus find showcase more appropriate here. We will however go over all use of the word, to be sure it is only used for the precise examples we provided, and not to describe "use cases".
R1.23. different fibroblast specializations - maybe phenotypes?
Response:
*
R1.24. Figure 4b
- b) Schematic view of the deconvolution process and cell type-specific count inference from the spatial niches.
Not so clear what the heatmap shows, rows and columns
Spots heatmap : label niche on rectangles in cols
And each col is a spot
Rows are cell types or cells?
In the cell types x spot
Response:
This figure can indeed benefit strongly from legend modifications. On both matrix, lines represent the genes, while columns represent the spot / individual cells deconvoluted per spots
*
We would annotate the niche legend (here the colour surroundings) by a symbolic drawing instead of writing it on the matrix
Legend "genes" on the first matrix
Write deconvolution ON the figure directly
R1.25. Cell2location. Add reference, maybe explain basic functionality?
Response:
Cell2location was not referenced in the results section, and was only referenced in the section 4.6.2 of the methods, as the 72th citation. We corrected this oversight, and propose 1) a brief explanation of deconvolution right before, 2) a brief explanation of Cell2location particularity in inferring individual cell profiles - which is not common in spatial deconvolution.
R1.26. reconstructing different patients, tissues, and microenvironments to predict
context-specific molecular treatments.
Unclear
fibrosis in different - at
molecular levels
Response:
We will modify this section title according to the reviewer's citation and the different reformulation.
R1.27. Figure 5d myeloid and endothelial colour code inversed from 5 BC
Response:
The legends are individually correct, but there is no reason to not make them coherent across panels. We will update the legend of the panel 5.d..
- *
R1.28. 5d indicate important pathways in organe should not change the colour of the nodes (purple=common, blue or green specific). Use border colour maybe?
Response:
We had forgotten to precise the colour code of this panel, where the choice of orange highlighted here the gene set related to molecular pathways instead of functional annotations. As the name already explicits pathway, we now think that the orange background is redundant informations and may create some confusion. We thus would like to update Wnt and TNFA pathways backgrounds to ___ (more enriched in cell type), and purple (significantly enriched in all cell types).
R1.29. 5e is not a venn diagram
- e) Venn diagram showing the overlap between transcription factors (TFs) predicted by ReCoN (green) and those previously
implicated in fibrosis (orange) or cardiac diseases (violet). Only the top 10 TFs were annotated from literature
sources; full sizes of fibrosis- and cardiac disease-related receptor sets can therefore not be represented.
- f) also not a venn diagram e/f now in supp
the "NABA ECM collagens" gene set. Nodes are
grouped by molecular type (e.g., transcription factors, receptors, ligands), and links represent the weighted,
direct regulatory interactions present in the ReCoN-constructed
Response:
As the diagrams do not indicate the total number of receptor/TF that are in the literature, it cannot be Venn diagrams. We updated the legend to :Venn diagram showing the Overlapp between [...]
As we reorganised the paper, these plots are now only in supplementary; we removed the duplicate occurrence in the figure 5 legend.
R1.30. Why Sankey plot? Normally sankey plot represents flow (of regions changing from 1 state to another) but here this is just a weighted network?
No communication from firbos back to other cell types? No communication between ventricular/myeloid/lymphoid?
Response:
We are thankful for this useful feedback which helped us realising interesting details were missing from the paragraph.
*This is only intended for visualising regulatory cascade, so users have to decide on one receiving cell, a set of target genes, and sending cells. It includes a specific subset of regulatory cells, and only their interactions with the target cells. Here, we illustrated the regulation of some ECM genes produced by fibroblast. *
Sankey Diagram might indeed not be the clearest representation, as we are not modelling the all diffusion, and not a flow per se. We propose to replace by another representation that we hope will be more intuitive for biologists (and more aesthetic), such as illustrated below:
R1.31. as a extension to - an
underrepresented in the current. - current framework?
Response:
framework works perfectly to fill the missing word in the sentence
R1.32. However, it can't represent more - cannot
Borrowing representation from hypergraphs, which introduces
The network exploration implementation of ReCoN also present some limitations.
limitations. While random walks
with restarts offer a stable and fast exploration workflow for multilayer networks, it
currently only considers positive weights to predict regulation strengths. It involves that the
nature of the regulation, as activation or inhibition, has to be identified a posteriori.
- check concordance/grammar
Response:
We will update the raised grammatical errors
R1.33. Only the nodes that are included in one of the layers are present in the
final results, ignoring the ones present only in bipartites.
Unclear
Response:
Layers and bipartites are treated differently by the algorithm, and layer presence is necessary to appear in the results.
In practice, it just means that receptors/ligands not paired in the CCC, or genes not regulated by any TF in the GRN, won't appear.
We propose clarifying with this second explanation
"In practice, a node must have at least one connection in its layer to appear in the final results. It thus means that receptors or ligands absent from the CCC network and genes not targeted by any transcription factor in the GRN will not receive a score from the random walk exploration."
R1.34. a scATAC - an
- *
Barsi et al is published https://journals.plos.org/ploscompbiol/article?id=10.1371/journal.pcbi.1013188
Response:
We updated the reference with the published article.
R1.35. effects, allowing for modulating in a second
time their contribution. - word order
Response:
We propose to formulate "allowing in a second time to modulate their contribution"
R1.36. others. However, it is possible to adjust the Beta coefficient to
represent it based on the available information for each dataset.
Represent- adjust?
Response:
We agree with the reviewer's suggestion to use adjust.
R1.37. We use the latter to compare the different models. - what is the latter?
Response:
The latter referred to the 25 cytokines of the Immune Dictionary which had at least one connection in the inferred cell communication network with CellPhoneDB. We propose clarifying this formulation to "..."
R1.38. It resulted in the scRNA-seq in 1,789 cells with 13,167
genes, and for the scATAC-seq in 3,759 cells with 254,545 regions.
Check english
Response:
We propose replacing this sentence by the following: "It resulted in a scRNAseq dataset of 1,789 cells with 13,167 genes, and a scATACseq dataset of 3,759 cells with 254,545 regions."
R1.39. GRETA pipeline.- reference
Response:
We added the citation to the paper of the GRETA pipeline in the section 4.5 of the methods: "Badia-i-Mompel et al., 2026"
R1.40. We kept all the cells whose annotations through unsupervised clustering,
followed by marker gene annotations, through scANVI were coherent.
Word order
Response:
We propose the following reformulation to correct the sentence: "We kept all cells whose annotations were coherent between unsupervised clustering with marker-gene labelling and scANVI-based label transfer"
R1.41. In parallel, pairs of ligands and receptors with both associated with scores above
an absolute gene loading of 0.1 were considered potential driver interactions in HF.
Unclear
Response:
In the MOFAcell results, factors correspond to linear combination of genes that explain a large part of the data variance; the contribution of each gene is called loading. We chose the factor that classified the best patient with and without fibrosis, and kept all the top genes, all of those with a score above 0.1.
We propose reformulating this sentence as the word "loading" could overcomplicate here for most readers: "To identify the ligand and receptors driving heart failure, we considered all of those with an absolute contribution to the multicellular factor of 0.1."
R1.42. gseapy Python - reference?
Response:
The gseapy package was indeed not cited, we now include the citation : "Zhuoqing Fang, Xinyuan Liu, Gary Peltz, GSEApy: a comprehensive package for performing gene set enrichment analysis in Python, Bioinformatics, 2022;, btac757, https://doi.org/10.1093/bioinformatics/btac757"
R1.43. and to calculate average for each spatial context the average cell type expression.
Unclear
Response:
we propose to reformulate the sentence to: "These cell-type-spot profiles were used later for each spatial context to create a specific cell-cell communication networks and to calculate cell type average expressions."
R1.44. We only used the loadings of all cell
types but the fibroblasts to consider the effect of the sole environment.
Unclear
Response:
we propose to use "APART from the fibroblast" to clarify the sentence and "to ONLY consider the environment effect".
R1.45. We realised a downstream - performed
Response:
We fully agree with the reviewer's suggestion.
R1.46. The profiles inferred by ReCoN were first very correlated in all three contexts. - unclear
Response:
The sentence was missing clarity and deserved being rephrased. We propose: "When looking at the absolute scores of ReCoN in all three contexts, results were initially highly correlated. To focus on context-specific differences, enrichments were performed using the log-ratio of each context profile over the mean of the other profiles."
R1.47. Potentially the closest results are models that can predict the effect of perturbations on cell line cultures. Several approaches in the literature employ either transformers or optimal transport to predict the effect of perturbations in single cell datasets. One of the main issues is an underlying necessary assumption that the perturbation effect will be larger than the heterogeneity (in cell lines for example), which becomes increasingly difficult when considering in-vivo experiments. ReCoN obviously goes beyond this by considering explicitly the presence of different cell types but distinctions of cell types are sometimes quite arbitrary and potentially application of ReCoN to some of the in-vitro culture datasets, even on cell lines, could be a way to test its performance and benchmark it against other methods.
The main bottleneck in the application of this framework to 'personalisation' of therapies, mentioned even in the abstract as a potential future goal for such an approach, will be the lack of data. This approach requires single cell level descriptions of the system at hand, plus additional datasets to build the model structure. To a certain extent, public data of related tissues/contexts can be used, but it will be necessary to test the dependence of performance on coherence of the input data to develop sufficient trust to use it for new predictions, especially in a medical field.
We thank the reviewer for these reflections, which raise several distinct points that we would like to add in the discussion.
Cell line perturbation is indeed a close and active field of research, with notably numerous models based on optimal transport and VAE and relevant benchmarks(Radig et al. 2025)*. In our view, ReCoN tries to take a complementary angle, by both focusing on the environment effect and using a network-driven approach providing explainability. *
These perturbation methods are typically benchmarked on single cell line screenings, where cell-cell communication is highly limited or absent by design, while ReCoN is specifically designed to exploit multiple cell types interactions. Furthermore, ReCoN relies on a network that aims to provide only explainable hypotheses and molecular cascades. They also typically learn from different data, as ReCoN only uses single-cell data and best perturbation prediction methods learn from a subset of perturbation experiments.
Exploring the performance of ReCoN in perturbation predictions would require designing extensive comparisons with the state-of-the-art taking into account all these nuances which we believe goes outside of the scope of the present study. It however still raises a fundamental question for the development of the next methods and the need to assess whether the perturbation effect is actually larger than the heterogeneity, and we propose to extend the discussion to cover these aspects.
Secondly, this comment raised a point about cell type definition, which can be a hard task and sometimes a wrong description of cells heterogeneity. We note that even if ReCoN relies on grouping cells in some way, it does not impose any particular cell type ontology: users can define their own cell types or cell states, since the CCC layer is typically inferred from single-cell RNA-seq alone and does not require canonical cell-type annotations. This flexibility allows ReCoN to accommodate finer or coarser groupings depending on the biological question. We do not propose a framework to take into account diversity in other ways than homogeneous clusters of cells, but we think that it constitutes an interesting future development of ReCoN or new multicellular modelling methods.
Lastly, we fully agree that an important limitation for ReCoN's use is data availability and generation, which was also a limitation when identifying datasets for the manuscript's applications. We hope that the development of open source atlases will make it easier to leverage tissue-specific prior knowledge and increase potential application, prediction performances, and trust in ReCoN results.
In conclusion, we propose to state in the discussion two new points:
*1) extending multicellular perturbations (including gene knock-out) to conditions where cell types cannot be defined prior to the analysis, or are more to consider across a spectrum, will be an interesting future direction. *
2) there is new a need for broad benchmarks covering both multicellular and single-cell line tasks to evaluate the trade-off between accounting for cell heterogeneity and overall prediction accuracy.
Radig, J., Droit, R., Doncevic, D. et al. scArchon: a scalable benchmarking framework for assessing single-cell perturbation models. Genome Biol 27, 162 (2026). https://doi.org/10.1186/s13059-026-04104-z
R1.48. The authors could comment on how their method compares to others that do not require single cell level information. Despite clear differences, it might be important to show the advantage of using this more complex approach that requires data that is less available. Given the ease with which bulk profiles can be constructed from single cell data, it might be possible to compare the approaches directly. For example, see
- Wang, S. Patkar, J.S. Lee, E.M. Gertz, W. Robinson, F. Schischlik, D.R. Crawford, A.A. Schäffer, E. Ruppin Deconvolving Clinically Relevant Cellular Immune Cross-talk from Bulk Gene Expression Using CODEFACS and LIRICS Stratifies Patients with Melanoma to Anti-PD-1 Therapy
Mike van Santvoort, Óscar Lapuente-Santana, Maria Zopoglou, Constantin Zackl, Francesca Finotello, Pim van der Hoorn, Federica Eduati,
Mathematically mapping the network of cells in the tumor microenvironment,
Cell Reports Methods 2025
We propose to extend the discussion with additional methods, notably from before single-cell technology developments. We did not plan to include this two specific methods, as to our knowledge, they don't provide output directly comparable to ReCoN's purpose.
*
*
Reviewer #2
R2.1. It is not clear how well it performs in independent validations. Authors showed that it can predict the effect of cytokine perturbations in the immune dictionary by selecting an optimal alpha. Authors should validate that using the same alpha value of 0.8, it is possible to accurately predict the effect of cytokine perturbations in independent datasets. This is particularly concerning for cytokine-cell type pairs where the optimal alpha is not known. Therefore, the potential utility of Recon to estimate the effect of multicellular perturbations is not well established.
Response:
*The reviewers raised a very relevant point by pointing out that the alpha coefficient might vary between datasets. *
The value of 0.8 was chosen because it produced the best results in two independent datasets, the immune dictionary and the heart failure showcases. We could here observe some cross-dictionary reproducibility. To complete these findings, we will also verify that 0.8 provides the best performance in a new showcase: the Human Cytokine Dictionary (Oesinghaus et al. 2025)
We tried to contrast this choice by opening on the need to confirm the importance of the indirect effect. We propose to add a sentence explicitly commenting on the impact of these new findings on the alpha coefficient and its robustness value.
It is also accurate to say that ReCoN cannot currently estimate the alpha parameter autonomously. We proposed this default value as it worked on both datasets, but it is possible that no default value could fit them all. The value of alpha is currently a default value, but users are completely free in the current implementation of ReCoN to modify its value depending on their needs
If it was not the case, one option could be to fit its value using similar prior perturbations, when such data is available. For example, perturbing one or a few cytokines, a user could choose the value that explained the best the gene expression responses.
R2.2. Authors claimed that optimal alpha value of 0.8 implies the dominance of indirect effect. But in contrast to this claim, the performance across cytokine-celltype pair only increased from 0.72 to 0.76, which seem to imply that indirect effects do not add much.
*Response: *
The range of performance improvement is an interesting point to discuss for us, as it roughly doubles the computational time and consequently a trade-off between resource usage and this improvement.
While the average improvement from combining the direct and indirect effects observed on the first showcase was around 5%, it reached more than 10% in some cell types. We consider that it still corresponds to an interesting improvement for the current task. Indeed, it here "only" incorporates the coordination of immune cells to a cytokine stimulation, which should not necessarily change their profile drastically compared to isolated exposition.
R2.3. How does the cell-type specific effects prediction perform by just considering the intracellular layers? The authors constructed multiple variants of ReCoN to estimate unicellular and multicellular effects. How is the variant ReCoN-grn different from full ReCoN where gamma is set to zero.
*Response: *
We are thankful for this comment, which will help to restructure the section 2.2.
As the ReCoN-GRN differs from the full ReCoN model, even with a gamma value of 0, as the latest include ligand-to-receptor weights. However, the ReCoN-GRN would correspond to the ReCoN-generic with an alpha of 0, which does not weight ligand-to-receptor links.
We propose to clarify this detail in the section 2.2.2 by adding after the introduction of the ReCoN-generic model the sentence: "Note that ReCoN-grn corresponds to the ReCoN-generic model with alpha set to zero, where no indirect effects are considered. It differs from the full ReCoN model with alpha set to zero, which still includes ligand-to-receptor weights through the receptor-gene bipartite network."
R2.4. In section 2.2, authors assert that if matching datasets are not available, GRN layer can be extracted from other datasets. How well does the GRN layer from one system generalizes to the other system in terms of perturbation prediction?
*Response: *
It is, of course, a complex question, as it probably strongly depends on the studied system. However, we believe while it is important to consider similar systems, using the same samples for the cell-communication and the GRN layer is not necessary.
The first showcase that we propose explores exactly this case. We built the GRN from two unpaired datasets, and the cell communication from a third one. It provided convincing performances, justifying our earlier claim. It is additionally something done in most methods contextualising prior knowledge, which usually comes from other samples and sometimes even other organs (Browaeys, Saelens, and Saeys 2020, Jin et al. 2021, Badia-i-Mompel et al. 2023).
To provide additional insights, we will run the new Human Cytokine Dictionary showcase using both 1) multiomics methods on external PBMC datasets, and 2) a single-cell RNA-seq only method on the Human Dictionary directly. We will then be able to show performances using both data and corresponding methods.
To justify more clearly our claim according to reviewer's comment, we propose highlighting in the showcase itself this justification: ".... this showcase highlights the possibility to combine networks obtained from distinct datasets...".
Related to combining datasets, we propose to clarify the reasons behind our choices for the Immune Dictionary showcase with the additional supplementary text proposed in response to the comment R1.4.
Badia-i-Mompel P, Wessels L, Müller-Dott S et al. Gene regulatory network inference in the era of single-cell multi-omics. Nat Rev Genet 2023;24(11):739-54. https://doi.org/10.1038/s41576-023-00618-5.
Browaeys R, Saelens W, Saeys Y. NicheNet: modeling intercellular communication by linking ligands to target genes. Nat Methods 2020;17(2):159-62. https://doi.org/10.1038/s41592-019-0667-5.
Jin S, Guerrero-Juarez CF, Zhang L et al. Inference and analysis of cell-cell communication using CellChat. Nat Commun 2021;12(1):1088. https://doi.org/10.1038/s41467-021-21246-9.
R2.5. In the abstract, authors claimed that ReCoN can predict the effect of gene knockouts. But authors did not show any application or validation to support this claim.
Response:
We indeed had no showcase that could explicitly measure the performance of ReCoN directly for gene knockout, while the possible application was introduced in the abstract.
* We believe that ReCoN could be used in the future to infer such perturbations, but we fully agree that this claim cannot be presented without justification.
We propose to remove the introduction of gene-knockout there, and to introduce it in the discussion opening instead, specifying that it will require specific experience and constitutes a possible future extension of the work.*
R2.6. The communication between cells might be dependent on their spatial proximity. Is it possible to construct the CCC layer by incorporating the context-matched spatial data? How would that affect the performance of multicellular response prediction?
Response:
*This is a very interesting comment as numerous methods using spatial transcriptomic data have been published recently. *
In the current formulation, the beta coefficient Bi_j modulates the impact of the cell type i on the cell type j. If the spatial transcriptomic data can inform on the proximity between cell types, and its overall impact on their communication, users could enforce more communication between some.
However, as ReCoN is a cell-type centric model, adding spatial information can only be done at a general scale, or by modelling independently spatial regions such as presented in the Microenvironments heart infarction showcase. It means that ReCoN cannot beneficiate from the potential of spatial transcriptomic as much as models representing the tissue structure.
R2.7. In the fibroblast application in Fig 4d, based on the cardiac cell types expression in region type, they are predicting fibroblast gene expression. Wouldn't the most direct benchmarking be comparison with observed fibroblast expression from the ST (after deconvolution perhaps)?
Response:
This was a helpful comment to guide the restructuration of the microenvironment heart infarction showcase, as we believe the whole showcase objective was not formulated clearly enough.
We aim at modelling the impact of the environment on the transcriptome. As the complete transcriptome of a cell results from numerous interacting variables, we believe that comparing the correlation between ReCoN's scores and the transcriptome would not evaluate the prediction of the environment impact.
For this reason, we wanted to compare the results to the specific differences from the microenvironment. We focused on gene set enrichment that seemed less noisy for such a comparative experiment, in particular from Visium10X data that has a particularly high dropout rate.
We propose to strengthen the validation by providing molecular insights into the three groups of cells studied.
The spatial data themselves are bulk, adding a layer of noise over the small number of genes captured by Visium. Instead of a correlation with the deconvoluted spots, we have equivalent single-cell RNA-seq fibroblast data annotated in the same study, which matches the three modelled niches. We propose to conduct a differential expression here and try to compute a correlation between these groups and ReCoN scores, providing a quantitative analysis.
If the correlation was low because of the noise in the data (notably leading to the permutation of individual gene orders even if overall biological signals and gene set orders are conserved), we will additionally do a pathway enrichment over this data, enriching also the qualitative validation.
R2.8. Section 2.6 Besides the cytokine section, it is difficult to assess the added value of this approach. Likely there is a lot of valuable findings here but difficult to say because the assessment is very qualitative.
Response:
One of the challenges around this work was to find relevant dataset to evaluate ReCoN. We tried to complete the direct quantitative evaluation from the Immune Dictionary with another quantitive evaluation from the heart atlas multicellular programs, despite a much less direct validation.
We hope that the production of new perturbation experiments over multicellular datasets, especially cell-type targeted perturbations, will provide more opportunities to validate the different findings and claim from our current manuscript.
On a similar note, no method seemed proposing similar predictions to be compared to. It led to the use of Nichenet score and the current decomposition of the ReCoN model in the section 2.2.1 to evaluate the contribution of the model.
R2.9. The article is dense and writing should be reorganized for better readability.
Minor issues -
No p-values in figures.
*Response: *
We agree that integrating values directly in the panels would make the reading of the figure easier. We would like to introduce the p-values in the panels 2d, 2e, 2f, 2g. We had forgot to indicate in the legend of the panel 4.d that all bold scores were associated with a p-value *
R2.10. Typo - ReCoN-genetic should be - ReCoN-generic.
Response:
We are thankful for noticing the typo and corrected it in the new version.
R2.11. Authors may consider adding figures to describe their results on balance between direct and indirect effects in section 2.2.2.
Response:
Depending on the new findings on the indirect effect iterations, we propose adding an additional panel on their combination or a supplementary figure.
R2.12. Redundancy in the following two lines -
o While these approaches effectively describe what tissue-wide programs are coordinated, they generally offer limited insight into the molecular mechanisms that establish or regulate these programs.
o Despite their ability to identify coordinated tissue-wide programs, multicellular program analyses typically offer limited insight into the underlying molecular mechanisms that orchestrate these programs.
Response:
We propose in the version of the manuscript to remove the first sentence. In our opinion, starting the next paragraph by this clarification seems more helpful to guide the reader than having it at the end of the previous one.
Please insert a point-by-point reply describing the revisions that were already carried out and included in the transferred manuscript. If no revisions have been carried out yet, please leave this section empty.
Please include a point-by-point response explaining why some of the requested data or additional analyses might not be necessary or cannot be provided within the scope of a revision. This can be due to time or resource limitations or in case of disagreement about the necessity of such additional data given the scope of the study. Please leave empty if not applicable.
R2.13. The direct and indirect effects are treated in two separate steps. In reality of course these effects are operating simultaneously. I wonder if this could be better modelled by iterating through the two steps. It might be worthwhile
trying to see if that improves the performance.
We thank the reviewer for this interesting idea, and propose to add a supplementary text to present the result of this discussion to the readers.
The direct effect is supposed to be measurable from the first iteration only, as we try to represent the effect of direct receptor binding. Regarding the indirect effect, iterations could be done to model the indirect effect, which could represent more distant effect in time.
On an algorithmic note, the indirect effect already allow several "iterations" of this effect, as each random walk can loop between all cell types until restart. However, it does not allow to control the weight of the different successive transition. In practice, with a high restart probability, an extreme weight is given to the first "iteration" over the second, as there is three layers to cross to explore the next cell.
First, we propose clarifying this section of the manuscript, to explain the depth of the indirect effect explorations.
Biologically, it is highly possible that these iterations have an important role to explain the complete reaction of the cells. However, we believe that it hits a major limitation of our modelling, and RWR based exploration in general, as it goes against the enforcement of restarts.
We aim to represent pairwise measurements, representing the impact of one node on another. But random walks without restart are not naturally well fitted to this problem, as they naturally converge to a stationary distribution ((László, Lov, and Erdos 1996)). In the case of ReCoN, it means that each gene and receptor, if we pushed the exploration indefinitely, would have the same probability to end up on each node of the system.
The restart mitigates this impact and enforces the impacts of the seeds by ensuring that the walkers stay close to the seed. (Tong, Faloutsos, and Pan 2006). By iterating successively from the new distribution obtained from the RWR, we would go against this important probability and progressively converge toward the stationary distribution from classical random walks.
So we completely share the opinion of the reviewer that the iterative nature of the indirect effect should be explored too, but we don't believe that ReCoN can model them accurately. We hope that new exploration methods will be able to decipher the importance of these iterations, once additional arguments have been gathered to justify the global interest of considering the indirect effect.
Bibliography:
László L, Lov L, Erdos O. Random Walks on Graphs: A Survey. 1 Jan. 1996:1-46.
Tong H, Faloutsos C, Pan J yu. Fast Random Walk with Restart and Its Applications. Sixth Int Conf Data Min ICDM06 Dec. 2006:613-22. https://doi.org/10.1109/ICDM.2006.70.
Note: This preprint has been reviewed by subject experts for Review Commons. Content has not been altered except for formatting.
Learn more at Review Commons
Summary - This is an interesting paper where the authors predict the multicellular response to the molecular perturbations. The idea is somewhat novel and offers a conceptual enhancement by modelling the multicellular response as collective outcome of cell intrinsic gene regulatory changes coupled with cell-cell communication by using a simple network diffusion-based approach. We have a few comments to help strengthen the work.
Minor issues
This is an interesting paper where the authors predict the multicellular response to the molecular perturbations. The idea is somewhat novel and offers a conceptual enhancement by modelling the multicellular response as collective outcome of cell intrinsic gene regulatory changes coupled with cell-cell communication by using a simple network diffusion-based approach.
Note: This preprint has been reviewed by subject experts for Review Commons. Content has not been altered except for formatting.
Learn more at Review Commons
The authors propose an approach to model complex regulatory processes in tissue or cell collections in specific environments taking into account intra- cellular regulatory processes at multiple levels and inter-cellular communication, importantly offering a chance to estimate the importance of indirect effects of perturbations on one cell type via processes in other cell types. Increasingly more complete models allow testing the impact of each component and of integrating data as context-specific information versus general prior knowledge. 3 main use cases are provided exploiting public datases: prediction of the effect of specific in-vivo cytokine perturbations on mouse lymph node tissues Healthy and disease myocardium in a heart failure multiome dataset Myocardial infarction spatial transcriptomics to identify how different cellular neighbourhoods are related to fibroblast phenotype and fibrosis The main framework is an extension of their previous HuMMus framework to investigate multilayer networks of regulation within a single cell type to also consider inter-cellular interactions, thus including i) tf-target GRN, ii) receptor a receptor layer based on PPI, and cell-cell communication based on LR interactions. These complex networks are then explored within the framework of Random Walk with Restart, which allows to establish 'interaction weights' between different nodes in the network, based on repeated simulations of spreading on the network that thus produce scores of proximity between network nodes, across possible paths. In this study first RWR that only allow intra-cell type walks are performed to calculate direct interaction of perturbation on node states, then RWRs across layers are also enabled, to calculate the importance of inter-cell interactions (via coeff gamma). The importance of each cell type is given by another coeff B that can either correspond to cell type proportions or spatial proximity of cell pairs and finally the scores of within and inter-cell interactions are weighted with a coefficient alpha.
The central contribution that allows coupling of intra with inter-cellular interactions is the establishment of receptor-gene links. Instead of inferring it from data, they propose to express the receptor-gene matrix as: R = L ⋅ G taking ligand-receptor (L) and ligand-gene (G) adjacency matrices from NicheNet and using NNLS to compute R.
Generally, for all these cases, comparison between performance in inferring the effect of perturbation or the upstream regulators or downstream targets are provided with assessment of AUROC/AUPRC values.
This is a very well-written paper, the methods used are adequate and the use cases are relevant and broad, exploiting state of the art datasets and tools.
The author's claims are mostly justified. The authors could make an effort to more explicitly cite other efforts in similar directions. The claim 'We envision ReCoN as a extension to prior multicellular modelling, offering an interesting compromise between prediction of cell type responses and understanding of their molecular coordination.' is very general and could be better substantiated. In fact, the authors do not really give examples of alternative approaches to study systems of interacting cells, other than mechanistic agent based models, that clearly are very different. Moreover, the exploration of the multilayer networks with RWR is a very reasonable choice but could there be other approaches? I think the authors could discuss this issue to briefly support their choice of this method.
Generally the discussion should provide the reader the context in the existing literature in which the work can be set, detailing its impact. I think this could be improved.
Regarding the choice of datasets, it is clear that the method is quite demanding, requiring single cell and different omics to build the model, in addition to the expression dataset that is used as a use case. This inevitably leads to using a mix of datasets. For example in the mouse experiments the gene regulatory network was inferred from both a lymph node scRNA-seq dataset and a splenic scATAC-seq dataset, presumably due to the lack of multiome data in this setting. However the cell-cell communication network was inferred from the control case of the Immune Dictionary. Why can't the authors use the control data also for inferring GRNs? Is atac-seq really necessary in the inference of the GRN? What is the impact of the fact that lymph node and spleen samples might be different?
'
Please request additional experiments only if they are essential for the conclusions. Alternatively, ask the authors to qualify their claims as preliminary or speculative, or to remove them altogether.
If you have constructive further reaching suggestions that could significantly improve the study but would open new lines of investigations, please label them as "OPTIONAL".
Are the suggested experiments realistic in terms of time and resources? It would help if you could add an estimated time investment for substantial experiments.
Are the data and the methods presented in such a way that they can be reproduced? The code is very clear, we were able to install and run it and it is quite well-documented. However, a few more details should be given in the text regarding how the evaluation of the performance is carried out. For example: If I understand correctly, when predicting the impact of cytokine perturbations the ReCoN predictions of genes impacted are compared to differentially expressed genes identified through traditional DEG analysis. What is compared is the ranking of these genes from ReCoN with the ranking provided by DEseq2. There is no description of how this comparison of ranking gives rise to AUROC values. Also, is it just the ranking that is predicted or can they also estimate how well they can predict the effect size?
When describing the use cases, I think a bit more detail would help. For example 'To identify the cell-type-specific genes associated with HF, we used the MOFAcell scores of the multicellular factor 1 (MCP1) reported in ReHeat236' I supposed the explanation is on the dataset but for the sake of clarity it would be good to expand this sentence to give at least an idea of the approach.
Regarding the calculation of the R matrix from the NichNet matrices L and G, I gather that the R matrix is calculated once and is thus fully data-independent and available just like the L and G matrices from NichNet. This was not very clear in the tutorials.
Also, this might just be a typo in the tutorial: 'The default α = 0.8 gives more weight to direct effects, which has been empirically validated. You can adjust this based on your biological question." I believe the manuscript says alpha>0.5 refers to indirect effects dominating.
Same for the pre-processing of the spatial data for the third use case, a little more details on how this was done would help the users and readers.
For example 'In the GRN reconstruction only the links with a score above 1.5e-7 were retained in ReCoN's gene regulatory layer. How was this chosen?
We have identified the following parameters that are somehow justified but could be explored to have a better feel for how they impact the results
Restart probability: How often the walker goes back to the starting seed/molecule Layer transition probability: How often the walker stays in the same layer - different cell? - different layers? Gamma Node transition within a layer: How often one jumps to a different layer Weighting parameters: How much weight for direct or indirect effect to account for the combined effect - alpha - this is the only one that is explicitly explored.
Finally, this might be considered OPTIONAL but would greatly improve the work in our opinion: The method crucially depends on the networks that are used in the different layers and to connect layers and cell types. As we know, biological data is noisy and incomplete (FP and FN) at each level and in each datatype. It would be really useful to estimate what is the robustness of the results to this noise. Particularly, from personal experience, we think the GRNs reconstructed from data are often almost fully connected and it is exceedingly difficult to validate them in specific contexts. This means that some 'errors' are likely to be present. Since several methods exist for inferring GRNs one could simply compare the results using different methods for this part of the network. A related point involves the characteristics of the RWR algorithm, that will be quite impacted by the presence of hubs in these networks (either in single layers or across several) that is likely to impact the exploration. If proteins that are hub are effectively important, that is not a problem, but in some layers, for example, the receptor-receptor layer that presumably will contain PPIs, there might be biases in hubs being just better studied proteins, and these hubs might have an 'unjustified' weight in the walks. One potential approach to assess the robustness of the method to these issues could be an empirical one that just randomly perturbs the networks in ReCoN to see to what extent similar predictions are achieved.
Minor comments:
Please add page numbers. Figures are nice and clear. Some specific minor points are listed here below.
Define hMLN on first appearance fig1 caption (no page numbers..;) 2nd appearance heterogeneous multilayer structure (HMLN) ... Bi_j not so clear to what it refers when first mentioned personalized interaction specificity. - maybe better word than personalised (contextualised?) ReCoN-genetic and ReCoN, ( generic?) responses. It is expected to observe common behaviors in-between cell-type, that the GRN and the generic CCC network already contribute captures. - not very clear
Figure 2b the icon of cells with double arrows might suggest phenotype shift when instead this is just communication eTACs explain acronym and what they are Due to very few genes being differentially expressed, only cDC1 was conserved and evaluated for IL22, Not so clear In this showcase (not very clear, use case?) different fibroblast specializations - maybe phenotypes?
Figure 4b b) Schematic view of the deconvolution process and cell type-specific count inference from the spatial niches. Not so clear what the heatmap shows, rows and columns Spots heatmap : label niche on rectangles in cols And each col is a spot Rows are cell types or cells? In the cell types x spot
Cell2location. Add reference, maybe explain basic functionality?
reconstructing different patients, tissues, and microenvironments to predict context-specific molecular treatments. Unclear fibrosis in different - at molecular levels
Figure 5d myeloid and endothelial colour code inversed from 5 BC 5d indicate important pathways in organe should not change the colour of the nodes (purple=common, blue or green specific). Use border colour maybe? 5e is not a venn diagram e) Venn diagram showing the overlap between transcription factors (TFs) predicted by ReCoN (green) and those previously implicated in fibrosis (orange) or cardiac diseases (violet). Only the top 10 TFs were annotated from literature sources; full sizes of fibrosis- and cardiac disease-related receptor sets can therefore not be represented. f) also not a venn diagram e/f now in supp the "NABA ECM collagens" gene set. Nodes are grouped by molecular type (e.g., transcription factors, receptors, ligands), and links represent the weighted, direct regulatory interactions present in the ReCoN-constructed
Why Sankey plot? Normally sankey plot represents flow (of regions changing from 1 state to another) but here this is just a weighted network? No communication from firbos back to other cell types? No communication between ventricular/myeloid/lymphoid?
as a extension to - an underrepresented in the current. - current framework? However, it can't represent more - cannot Borrowing representation from hypergraphs, which introduces The network exploration implementation of ReCoN also present some limitations. limitations. While random walks with restarts offer a stable and fast exploration workflow for multilayer networks, it currently only considers positive weights to predict regulation strengths. It involves that the nature of the regulation, as activation or inhibition, has to be identified a posteriori.
Only the nodes that are included in one of the layers are present in the final results, ignoring the ones present only in bipartites. Unclear a scATAC - an Barsi et al is published https://journals.plos.org/ploscompbiol/article?id=10.1371/journal.pcbi.1013188 effects, allowing for modulating in a second time their contribution. - word order
others. However, it is possible to adjust the Beta coefficient to represent it based on the available information for each dataset. Represent- adjust?
We use the latter to compare the different models. - what is the latter?
It resulted in the scRNA-seq in 1,789 cells with 13,167 genes, and for the scATAC-seq in 3,759 cells with 254,545 regions. Check english GRETA pipeline.- reference
We kept all the cells whose annotations through unsupervised clustering, followed by marker gene annotations, through scANVI were coherent. Word order In parallel, pairs of ligands and receptors with both associated with scores above an absolute gene loading of 0.1 were considered potential driver interactions in HF. Unclear gseapy Python - reference?
and to calculate average for each spatial context the average cell type expression. Unclear
We only used the loadings of all cell types but the fibroblasts to consider the effect of the sole environment. Unclear We realised a downstream - performed
The profiles inferred by ReCoN were first very correlated in all three contexts. - unclear
Provide contextual information to readers (editors and researchers) about the novelty of the study, its value for the field and the communities that might be interested.
This is a very timely paper, dealing with an important gap in the literature. It is not an entirely new framework, but it integrates different existing approaches to solve a complex issue in a creative way. To my knowledge, it is the first attempt to consider and formalise regulation processes involving both intra- and inter-cellular interactions. The results support the importance of distinguishing the different paths that can relate the impact of a perturbation to specific genes/functions in different cells and their overall ecosystem.
General assessment: provide a summary of the strengths and limitations of the study. What are the strongest and most important aspects? What aspects of the study should be improved or could be developed?
The tool offers a combination of approaches, providing a coherent framework. The code is well documented and functional. The use cases are quite compelling. Sadly, the only type of validation possible involves confirmation of known facts from the literature, which makes it hard to evaluate the full impact of some of the predictions. I think the details of how the method works and especially how the performance was evaluated could be expanded and an assessment of how different parameters and choices impact the results would also be very helpful. An effort to compare the presented variations of the method to some other approach would be very welcome, but I am finding it hard to identify what an alternative approach could be comparable.
Advance: compare the study to the closest related results in the literature or highlight results reported for the first time to your knowledge; does the study extend the knowledge in the field and in which way? Describe the nature of the advance and the resulting insights (for example: conceptual, technical, clinical, mechanistic, functional,...).
Potentially the closest results are models that can predict the effect of perturbations on cell line cultures. Several approaches in the literature employ either transformers or optimal transport to predict the effect of perturbations in single cell datasets. One of the main issues is an underlying necessary assumption that the perturbation effect will be larger than the heterogeneity (in cell lines for example), which becomes increasingly difficult when considering in-vivo experiments. ReCoN obviously goes beyond this by considering explicitly the presence of different cell types but distinctions of cell types are sometimes quite arbitrary and potentially application of ReCoN to some of the in-vitro culture datasets, even on cell lines, could be a way to test its performance and benchmark it against other methods. The main bottleneck in the application of this framework to 'personalisation' of therapies, mentioned even in the abstract as a potential future goal for such an approach, will be the lack of data. This approach requires single cell level descriptions of the system at hand, plus additional datasets to build the model structure. To a certain extent, public data of related tissues/contexts can be used, but it will be necessary to test the dependence of performance on coherence of the input data to develop sufficient trust to use it for new predictions, especially in a medical field.
The authors could comment on how their method compares to others that do not require single cell level information. Despite clear differences, it might be important to show the advantage of using this more complex approach that requires data that is less available. Given the ease with which bulk profiles can be constructed from single cell data, it might be possible to compare the approaches directly. For example, see K. Wang, S. Patkar, J.S. Lee, E.M. Gertz, W. Robinson, F. Schischlik, D.R. Crawford, A.A. Schäffer, E. Ruppin Deconvolving Clinically Relevant Cellular Immune Cross-talk from Bulk Gene Expression Using CODEFACS and LIRICS Stratifies Patients with Melanoma to Anti-PD-1 Therapy
Mike van Santvoort, Óscar Lapuente-Santana, Maria Zopoglou, Constantin Zackl, Francesca Finotello, Pim van der Hoorn, Federica Eduati, Mathematically mapping the network of cells in the tumor microenvironment, Cell Reports Methods 2025
Audience: describe the type of audience ("specialized", "broad", "basic research", "translational/clinical", etc...) that will be interested or influenced by this research; how will this research be used by others; will it be of interest beyond the specific field?
Broad interest to biomedical researchers and also biologists in other fields. While the method allows advances in basic research on biological process regulation, a clear clinical application can be envisaged in immuno-oncology for example/ immunology and even general molecular medicine.
Please define your field of expertise with a few keywords to help the authors contextualize your point of view. Indicate if there are any parts of the paper that you do not have sufficient expertise to evaluate.
I am a computational biologist with expertise in network models, regulatory networks, agent-based models and especially familiar with the tumour microenvironment and processes therein. I can more or less appreciate the meaningfulness of the biological findings related to the mouse lymphnode example. I am much less of an expert on heart tissue modeling, heart failure, fibrosis etc, required to fully comprehend the impact of the second and third use cases.
reate an account using the sidebar on the
interesting idea here
The Jackson Laboratory (stock #: 007909)
DOI: 10.1038/s41467-026-70971-6
Resource: RRID:IMSR_JAX:007909
Curator: @evieth
SciCrunch record: RRID:IMSR_JAX:007909
The Jackson LaboratoryStrain #:000651
DOI: 10.1016/j.xcrm.2026.102833
Resource: (IMSR Cat# JAX_000651,RRID:IMSR_JAX:000651)
Curator: @nmaralla
SciCrunch record: RRID:IMSR_JAX:000651
The Jackson LaboratoryStrain # 003831
DOI: 10.1016/j.xcrm.2026.102833
Resource: (IMSR Cat# JAX_003831,RRID:IMSR_JAX:003831)
Curator: @nmaralla
SciCrunch record: RRID:IMSR_JAX:003831
The Jackson LaboratoryStrain #:000664
DOI: 10.1016/j.xcrm.2026.102833
Resource: RRID:IMSR_JAX:000664
Curator: @nmaralla
SciCrunch record: RRID:IMSR_JAX:000664
THE CHINESE COMMUNIST PARTY DURING THE ERA OF THECOMINTERN (1919-1943)
Used as Research material
Firms that can show this level of granularity will be in a much stronger position to reduce emissions exposure under CBAM and stay competitive in the EU market
This essentially means the EU can tariff steel with high embodied carbon, and if I am importing steel, I either pay for chinese steel + the tariff, or local green steel
please research the best open source video editing software for beginners
Religion in the Law
Link provided is not working
Visit page 54 of the PDF to read Ruby Payne’s Hidden Rules of Class
PDF has been attached
Certain transmissions, including of paper, via facsimile, and of voice, via telephone, are not considered to be transmissions via electronic media if the information being exchanged did not exist in electronic form immediately before the transmission.
The current definition of "electronic media" excludes Fax for anything that was not digital immediately before transmission.
Attributions:
Can we move this attributions to the License and Attributions accordion at the end of the chapter?
He also attacked the ending of the two child limit, saying it was clear that welfare was in need of major reform.
Does this relate to universal credit? And what was his criticism?
policy debate
These are policy debates though. The positions of these leaders has to be assessed to know if they align with the collective position of the party.