35 Matching Annotations
- Aug 2023
- Apr 2022
-
media.defense.gov media.defense.gov
-
Implement a network monitoring solution to log and track inbound and outbound traffic, such as a network intrusion detection system (NIDS), a traffic inspector, or a full-packet capture device.
-
Place publicly accessible systems and outbound proxies in between the firewall layers in one or more demilitarized zone (DMZ) subnets, where access can be appropriately controlled between external devices, DMZ devices, and internal systems.
-
Implement multiple layers of next-generation firewalls throughout the network to restrict inbound traffic, restrict outbound traffic, and examine all internal activity between disparate network regions. Each layer should utilize different vendors to protect against an adversary exploiting the same unpatched vulnerability in an attempt to access the internal network.
D3-ITF D3-OTF
-
Install a border router to facilitate a connection to the external network, such as an Internet service provider (ISP).
D3-BDI
-
- Sep 2021
-
medium.com medium.com
-
medium.com medium.com
-
animation in data visualization, while impressive and eye-catching, is a much lower priority than understanding how different chart types present data, how to properly design charts, understanding form in data visualization, and other aspects of data visualization practice.
-
-
- Mar 2021
-
www.fabiofranchino.com www.fabiofranchino.com
-
github.com github.comd3/d33
-
D3 4.0 is modular. Instead of one library, D3 is now many small libraries that are designed to work together. You can pick and choose which parts to use as you see fit.
-
To the consternation of some users, 3.x employed Unicode variable names such as λ, φ, τ and π for a concise representation of mathematical operations. A downside of this approach was that a SyntaxError would occur if you loaded the non-minified D3 using ISO-8859-1 instead of UTF-8. 3.x also used Unicode string literals, such as the SI-prefix µ for 1e-6. 4.0 uses only ASCII variable names and ASCII string literals (see rollup-plugin-ascii), avoiding encoding problems.
-
Microlibraries are easier to understand, develop and test. They make it easier for new people to get involved and contribute. They reduce the distinction between a “core module” and a “plugin”, and increase the pace of development in D3 features.
Tags
- constant evolution/improvement of software/practices/solutions
- microlibraries
- change of behavior (software)
- programming: use of special/mathematical symbols
- breaking change
- contributing: low barrier to entry
- d3.js
- modularity
- sad/unfortunate conclusion
- simpler code is easier to understand and verify that it is correct
- limitations leading to workarounds
- funny
- changes (software)
Annotators
URL
-
- Feb 2021
-
observablehq.com observablehq.com
Tags
Annotators
URL
-
-
talk.observablehq.com talk.observablehq.com
-
本页已经总结,见页面底部说明。 D3有很多资料,有些导到Observable,要重新设计主页。 D3肯定要用Observable作为它他的示例所在地。 有几个办法可以将D3从Observalble中拿出来。
-
Copy-pasting code can mean very different things in different situations. I believe the source of frustration for many here is the desire to bring unfamiliar code into a familiar environment and tinker with it there. To that end, several community members have provided tutorials and examples for doing just that: Convert observable code to normal Javascript / David B. / Observable 3 Observable vs Regular Flavor Javascript / Carlos Sandoval Olascoaga / Observable 3 Learning from D3 in Action - in Observable / Tom MacWright / Observable
想要将代码弄出来有这些参考方案。
-
I can wholeheartedly say that Observable is a better way to do it. We will absolutely not stop anyone from translating or making examples elsewhere, however we want to make it clear that bl.ocks.org 1 will continue in maintenance mode but will not be updated.
澄清D3示例: 确定Observable是更好的办法,bl.ocks.or将不再更新。
-
- Oct 2020
-
medium.com medium.com
-
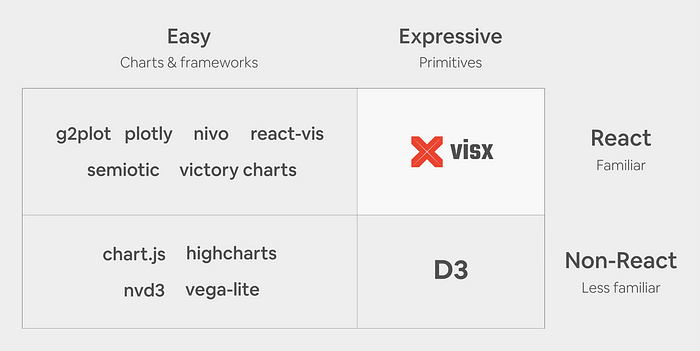
suite of over 30 separate packages of React visualization primitives that fall into several categories (Figure 2). It is un-opinionated on state management, animation, and styling so it can integrate with any React codebase, and its emphasis on modularity (similar to D3) lets you keep your bundle sizes down by only using the packages you need to create your reusable chart library or a custom one-off chart.
Short definition of visx
-
In our research (Figure 1), we found that existing React visualization libraries are often high-level abstractions and optimized for ease of use (i.e., fewer lines of code) at the expense of expressivity. None offer the expressivity of D3 primitives and many don’t allow for the optimization we want in production because computation, animations, state management, styles, and rendering are all encapsulated.
Comparison of data visualisation libraries:
-
because D3 and React both want to own DOM manipulation, we’ve found that it’s best to only use D3 for the math and React for the DOM because two mental models for updating the DOM opens the door for bugs to sneak in. However, using D3 solely for math means a significant amount of its (DOM-based) functionality is not available for use: selection.join, zoom, drag, brush, and transitions. Additionally, as mentioned above, D3 has its own learning curve and we would like developers to feel like they are writing native React code with standard APIs and familiar patterns.
You can use D3 inside a React app, but...
-
-
github.com github.com
Tags
Annotators
URL
-
- Jul 2020
-
github.com github.com
-
d3-flame-graph
Tags
Annotators
URL
-
- Apr 2020
-
hswolff.com hswolff.com
- Mar 2020
-
Tags
Annotators
URL
-
- Feb 2018
-
d3indepth.com d3indepth.com
-
- Jan 2018
-
bl.ocks.org bl.ocks.org
-
bl.ocks.org bl.ocks.org
- Dec 2017
-
www.jasondavies.com www.jasondavies.com
Tags
Annotators
URL
-
- Nov 2017
- Apr 2017
-
alpha.editor.p5js.org alpha.editor.p5js.org
Tags
Annotators
URL
-
-
vis.stanford.edu vis.stanford.edu
-
Original d3 paper
-
-
bost.ocks.org bost.ocks.org
-
var myChart = chart().width(720).height(80); Modifying an existing chart is similarly easy: myChart.height(500); As is inspecting it: myChart.height(); // 500 Internally, the chart implementation becomes slightly more complex to support getter-setter methods, but convenience for the user merits additional developer effort! (And besides, this pattern becomes natural after you’ve used it for a while.) function chart() { var width = 720, // default width height = 80; // default height function my() { // generate chart here, using `width` and `height` } my.width = function(value) { if (!arguments.length) return width; width = value; return my; }; my.height = function(value) { if (!arguments.length) return height; height = value; return my; }; return my; } To sum up: implement charts as closures with getter-setter methods.
-
-
www.recursion.org www.recursion.org
-
D3 for Mere Mortals
old tutorial (2011) on d3
-
-
javascript.tutorialhorizon.com javascript.tutorialhorizon.com
-
A visual explanation of the Enter, Update and Exit Selections in D3js
-
-
d3-annotation.susielu.com d3-annotation.susielu.com
-
Use d3-annotation with built-in annotation types, or extend it to make custom annotations. It is made for d3-v4 in SVG.
data annotation from Susie Lu at Netflix
Tags
Annotators
URL
-