165 Matching Annotations
  1. Mar 2024
  2. Feb 2024
    1. https://kumu.io/

      Make sense of your messy world. Kumu makes it easy to organize complex data into relationship maps that are beautiful to look at and a pleasure to use.

      tagline:

      The art of mapping is to create a context in which others can think.


      Tool mentioned on [[2022-06-02]] by Jerry Michalski during [[Friends of the Link]] meeting.

  3. Jan 2024
      • for: COP28 talk - later is too late, Global tipping points report, question - are there maps of feedbacks of positive tipping points?, My Climate Risk, ICICLE, positive tipping points, social tipping points

      • NOTE

        • This video is not yet available on YouTube so couldn't not be docdropped for annotation. So all annotations are done here referred to timestamp
      • SUMMARY

        • This video has not been uploaded on youtube yet so there is no transcription and I am manually annotating on this page.

        • Positive tipping points

          • not as well studied as negative tipping points
          • cost parity is the most obvious but there are other factors relating to
            • politics
            • psychology
          • We are in a path dependency so we need disruptive change
      • SPEAKER PANEL

        • Pierre Fredlingstein, Uni of Exeter - Global carbon budget report
        • Rosalyn Conforth, Uni of Reading - Adaptation Gap report
        • Tim Lenton, Uni of Exeter - Global Tipping Report
      • Global Carbon Budget report summary

      • 0:19:47: Graph of largest emitters

        • graph
        • comment
          • wow! We are all essentially dependent on China! How do citizens around the world influence China? I suppose if ANY of these major emitters don't radically reduce, we won't stay under 1.5 Deg C, but China is the biggest one.
      • 00:20:51: Land Use Emissions

      • three countries represent 55% of all land use emissions - Brazil - DRC - Indonesia

      • 00:21:55: CDR

        • forests: 1.9 Gt / 5% of annual Fossil Fuel CO2 emissions
        • technological CDR: 0.000025% of annual Fossil Fuel CO2 emissions
      • 00:23:00: Remaining Carbon Budget

        • 1.5 Deg C: 275 Gt CO2
        • 1.7 Deg C. 625 Gt CO2
        • 2.0 Deg C. 1150 Gt CO2
      • Advancing an Inclusive Process for Adaptation Planning and Action

      • adaptation is underfinanced. The gap is:

        • 194 billion / year
        • 366 billion / year by 2030
      • climate change increases transboundary issues
        • need transboundary agreements but these are absent
        • conflicts and migration are a result of such transboundary climate impacts
        • people are increasing climate impacts to try to survive due to existing climate impacts

      -00:29:46: My Climate Risk Regional Hubs - Looking at climate risks from a local perspective. - @Nate, @SoNeC - 00:30:33 ""ICICLE** storyllines - need bottom-up approach (ICICLE - Integrated Climate Livelihood and and Environment storylines)

      • 00:32:58: Global Tipping Points

      • 00:33:46: Five of planetary systems can tip at the current 1.2 Deg C

        • Greenland Ice Sheet
        • West Antarctic
        • Permafrost
        • Coral Reefs - 500 million people
        • Subpolar Gyre of North Atlantic - ice age in Europe
          • goes in a decade - like British Columbia climate
      • 00:35:39

        • risks go up disproportionately with every 0.1 deg C of warming. There is no longer a business-as-usual option now. We CANNOT ACT INCREMENTALLY NOW.
      • 00:36:00

        • we calculate a need of a speed up of a factor of 7 to shut down greenhouse gas emissions and that is done through positive tipping points.

      -00:37:00 - We have accelerating positive feedbacks and if we coordinate policy changes with consumer behavior change and business behavior change to reinforce these positive feedbacks, we can help accelerate change in the other sectors of the global economy responsible for all the other emissions

      • 00:37:30

        • in the report we walk you through the other sectors, where their tipping points are and how we have to act to trigger them. This is the only viable path out of our situation.
      • 00:38:10

        • Positive tipping points can also reinforce each other
        • Question: Are there maps of the feedbacks of positive tipping points?
        • Tim only discusses economic and technological positive tipping points and does not talk about social or societal
  4. Nov 2023
  5. Oct 2023
  6. Sep 2023
    1. It' is pretty good to see the mapping innovation taking several shapes, from the starting narrative to this one.

      Regarding feedback from this one I would make a call out that make more visible where the data and code behind the map is hosted and how to reproduce the results.

      On a more general sense, I think is important to see how the different narratives are better connected and which values they embody and make explicit. I would propose this values:

      1. Utility:

        • internal: helping us to make short or long lasting peer to peer connections like the one between Copincha (Habana, Cuba) and HackBo/Grafoscopio (Bogotá, Colombia) communities resulting from DOTS 202.
        • external to showcase which innovation, people and communities are doing and how they are connected now or can be in the future.
      2. Reproducibility: The data narratives should be able to be reproducible.

      3. Portability: Functionality bundles, including data, code, software should be packages to they can be used in local contexts, particularly those with low/intermittent internet connectivity.

      4. Recontextualization: Our data narratives should be empowering its reuse, adaptation, and extension by other communities and in other context.

      5. Commons/Community oriented: licenses on data/code should be explicit to allow the previous qualities. Some times that would require a copyfarleft license that protect third parties extract value from the data narratives and its bundles against the community interest (cfg current discussion on data collection from IA projects against community of creators).
  7. Jun 2023
  8. May 2023
    1. Map of Content Vizualized (VMOC)

      a start of thinking on the space of converging written and visual thinking, but not as advanced as even Raymond Llull or indigenous ways of knowing which more naturally merge these modes of thinking.

      Western though is just missing so much... sigh

  9. Apr 2023
    1. It is difficult to see interdependencies This is especially true in the context of learning something complex, say economics. We can’t read about economics in a silo without understanding psychology, sociology and politics, at the very least. But we treat each subject as though they are independent of each other.

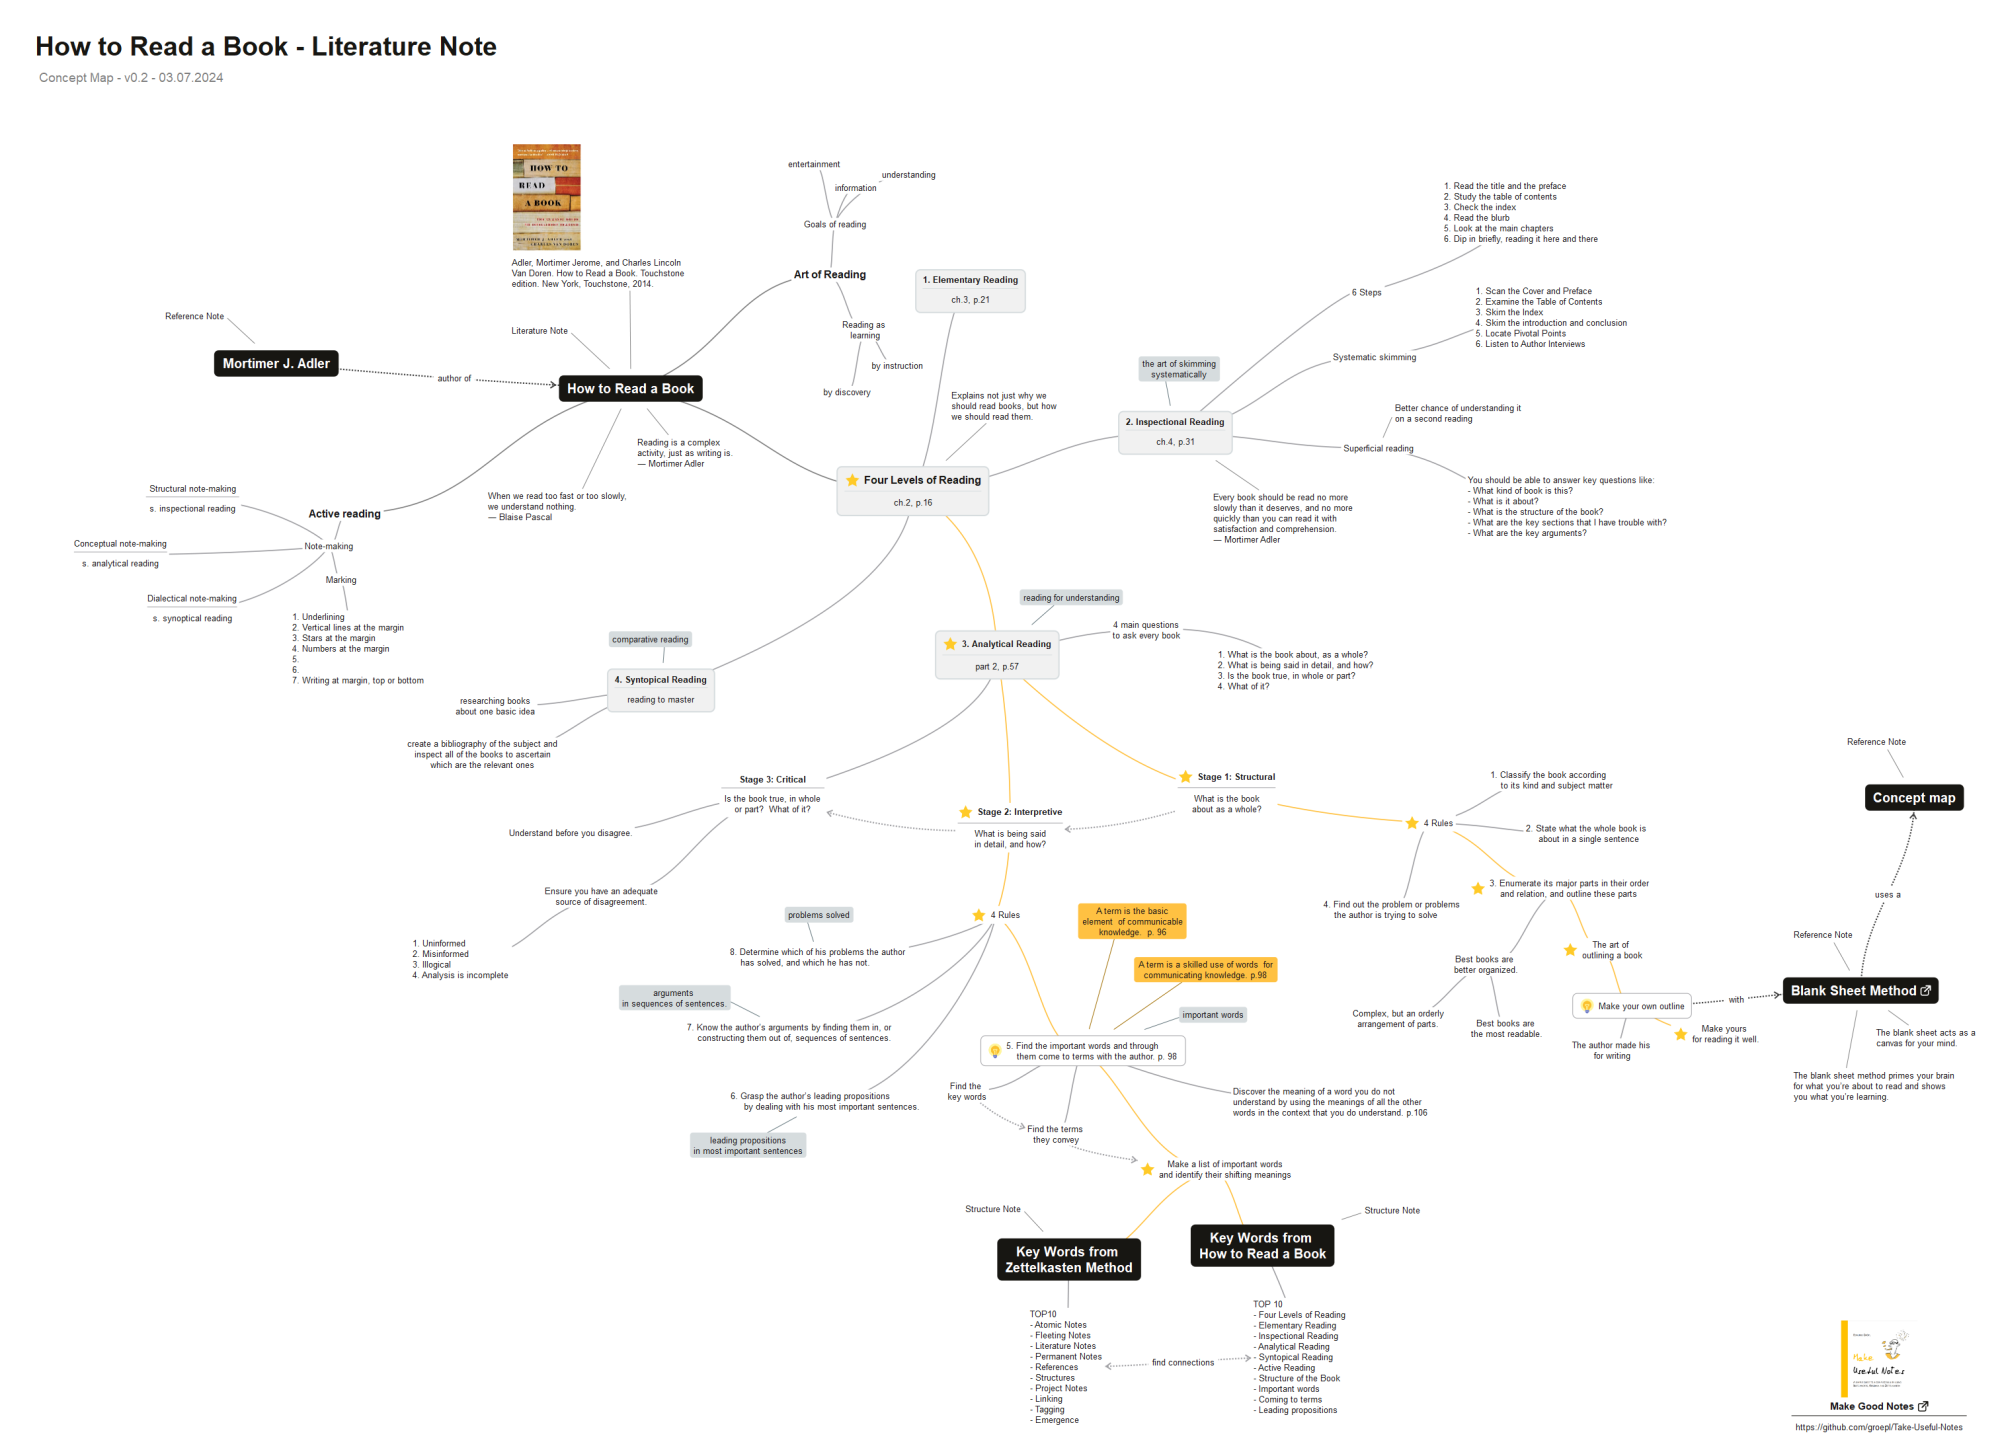
      Where are the tools for graphing inter-dependencies of areas of study? When entering a new area it would be interesting to have visual mappings of ideas and thoughts.

      If ideas in an area were chunked into atomic ideas, then perhaps either a Markov monkey or a similar actor could find the shortest learning path from a basic idea to more complex ideas.

      Example: what is the shortest distance from an understanding of linear algebra to learn and master Lie algebras?

      Link to Garden of Forking Paths

      Link to tools like Research Rabbit, Open Knowledge Maps and Connected Papers, but for ideas instead of papers, authors, and subject headings.


      It has long been useful for us to simplify our thought models for topics like economics to get rid of extraneous ideas to come to basic understandings within such a space. But over time, we need to branch out into related and even distant subjects like mathematics, psychology, engineering, sociology, anthropology, politics, physics, computer science, etc. to be able to delve deeper and come up with more complex and realistic models of thought.Our early ideas like the rational actor within economics are fine and lovely, but we now know from the overlap of psychology and sociology which have given birth to behavioral economics that those mythical rational actors are quaint and never truly existed. To some extent, to move forward as a culture and a society we need to rid ourselves of these quaint ideas to move on to more complex and sophisticated ones.

  10. Mar 2023
    1. a Structure Note can make use of a TOC form, a normal table, a mind map, a flow diagram, a straight list, or even a picture.

      Structure notes can take a variety of forms including lists, diagrams, mind maps, tables, and tables of contents.

  11. Feb 2023
    1. Chris, Chris... concepts and propositions are not nebulous dictionary definitions unless you're joining the Frankfurt School :) :).Click here to get some clarity about these basic terms as applied to learning: https://cmap.ihmc.us/docs/concept.phpAbout systems and emergence, I prefer Mario Bunge's book: https://www.amazon.com/Emergence-Convergence-Qualitative-Knowledge-Philosophy/dp/1442628219Irony? No way. You are always bringing new information about the historical roots of Zettelkasten. Keep doing that, please! Thanks!

      reply to u/New-Investigator-623 at https://www.reddit.com/r/antinet/comments/10r6uwp/comment/j784srg/?utm_source=reddit&utm_medium=web2x&context=3

      I meant nebulous for my initial purposes. They obviously have very concrete meanings in more specific contexts, though even there they can vary. I saw your other post on concept maps where I imagine they matter more; some of that reminds me about some of my initial explorations into category theory (math) a few years back. I'm curious what the overlap of those two looks like...

      On systems, complexity, and emergence, I'm probably closer to the school of thought and applications coming out of the Santa Fe Institute. I'll have to look at Bunge's work there, I've only glanced at some of his math/physics work but never delved into his philosophical material.

    1. Prof. Joseph Novak (Cornell) developed conceptual maps based on David Ausubel's subsumption (aka meaningful learning) theory and Piaget's concept of conceptual schemes. Conceptual maps have been proven successful across all levels of education worldwide (check Google Scholar).
    2. Zettelkasten can be described as a collection of conceptual maps in a written format.

      What are the connections between zettelkasten and conceptual maps?

      How are they different/similar to Tony Buzan's mind maps?

  12. Dec 2022
  13. Nov 2022
    1. Mark: Cathy Marshall at Xerox PARC originally started speaking about information gardening. She developed an early tool that’s the inspiration for the Tinderbox map view, in which you would have boxes but no lines. It was a spatial hypertext system, a system for connecting things by placing them near each other rather than drawing a line between them. Very interesting abstract representational problem, but also it turned out to be tremendously useful.

      Cathy Marshall was an early digital gardener!

  14. Oct 2022
    1. Not mentioned in any other sources I've consulted (yet), Goutor recommends adding notes about the physical location of bibliographic sources to bibliographic notes. This should include details about not only the library and even call numbers, to minimize needing to look them up again in the future, but to have notes about arrangements and contacts which may needed to revisit harder to access resources. (p14) This can also be useful for sources like maps which may be needed for higher quality reproduction in the final text. (p15)

  15. Sep 2022
  16. Aug 2022
    1. First of all, the map does a much better job at preserving the relative size and area of land and water masses, while reducing shape distortion. It is also designed to avoid dead ends, allowing the spherical nature of the world to be visualised by simply expanding the map in any direction.

      Authagraph map - granted, this map is still not perfect (it's still not a globe) but remains one of the best attempts yet at representing the world in flat, two dimensions.

    1. https://www.youtube.com/watch?v=o49C8jQIsvs

      Video about the Double-Bubble Map: https://youtu.be/Hm4En13TDjs

      The double-bubble map is a tool for thought for comparing and contrasting ideas. Albert Rosenberg indicates that construction of opposites is one of the most reliable ways for generating ideas. (35:50)

      Bluma Zeigarnik - open tasks tend to occupy short-term memory.

      I love his compounding interest graphic with the steps moving up to the right with the quote: "Even groundbreaking paradigm shifts are most often the consequence of many small moves in the right direction instead of one big idea." This could be an awesome t-shirt or motivational poster.

      Watched this up to about 36 minutes on 2022-08-10 and finished on 2022-08-22.

  17. Jul 2022
    1. Computer science is the subject that studies what computers can do and investigates the best ways you can solve the problems of the world with them. It is a huge field overlapping pure mathematics, engineering and many other scientific disciplines. In this video I summarise as much of the subject as I can and show how the areas are related to each other. #computer #science #DomainOfScience
    1. https://todomap.xyz/

      An interesting project from grant.codes that is a bookmarking and mapping tool similar to pieces of Google maps functionality.

  18. Jun 2022
    1. "The implicit feel of where you are in a physical book turns out to be more important than we realized," says Abigail Sellen of Microsoft Research Cambridge in England and co-author of The Myth of the Paperless Office. "Only when you get an e-book do you start to miss it. I don't think e-book manufacturers have thought enough about how you might visualize where you are in a book."

      How might we design better digital reading interfaces that take advantage of a wider range of modes of thinking and reading?

      Certainly adding audio to the text helps to bring in benefits of orality, but what other axes are there besides the obvious spatial benefits?

    2. Instead of hiking the trail yourself, the trees, rocks and moss move past you in flashes with no trace of what came before and no way to see what lies ahead.

      Just as there are deficits like dyslexia in the literate world, are there those who have similar deficits relating to location in the oral world? What do these look like? What are they called specifically?

      There are definitely memory deficits withing cognitive neuropsychology. Is there a comprehensive list one could look at?

      Some people aren't as good at spatial orientation as others. Women are stereotyped as being less good at direction and direction finding.

    1. *The compass*

      I too have seen this before, though the directions may have been different.

      When thinking about an idea, map it discretely. North on the compass rose is where the idea comes from, South is where it leads to, West leads to things similar to the idea while East are ideas that are the opposite of it.

      This is useful in situating information, particularly with respect to the similarities and opposites. One must generally train themselves to think about the opposites.

      Many of the directions are directly related to putting information into a zettelkasten, in particular where X comes from (source), where it leads (commentary or links to other ides), what's similar to x are links to either closely related ideas or to an index. The opposite of X is the one which is left out in this system too.

      *The compass*: <br>Saw that one before. Ugh, didn't like it.<br><br>Thinking about it though, it's a fitting metaphor to look at a note from different directions. I'm going to add this to my notes template(Just to try). All my notes have North & could use some other perspectives 🎉<br><br>🧶4/4 pic.twitter.com/CJctmC5Y39

      — Alex Qwxlea (@QwxleaA) June 14, 2022
      <script async src="https://platform.twitter.com/widgets.js" charset="utf-8"></script>

      Link to - Indigenous map conceptualizations - direction finding - method of loci

    1. https://app.thebrain.com/brains/3d80058c-14d8-5361-0b61-a061f89baf87/thoughts/32f9fc36-6963-9ee0-9b44-a89112919e29/attachments/6492d41a-73b2-20d8-b145-3283598c612b

      A fantastic example of an extensive mind map from Jerry Michalski using The Brain.

      There are lots of interesting links and resources, but on the whole

      How many of the nodes actually have specific notes, explicit ideas, annotations, or excerpts within them?

      Without these, it's an interesting map and provides some broad context, but removes local specific context of who Jerry is and how he explicitly thinks. One can review the overarching parts to extract what his biases may be based on availability heuristics, but in areas of conflicting ideas which have relatively equal numbers of links within a particular area, one may not be able to discern arguments from each other.

      Still a fascinating start and something not commonly seen in the broader literature.

      I'll also note that even in a small sample of one video call with Jerry sharing his screen while we talked about a broad sub-topic it's interesting to see his prior contexts as we conversed. I've only ever had similar experiences with Bill Seitz who regularly drops links to his wiki pages in this sort of way or Kevin Marks (usually in text chat contexts and less frequently in video calls/conversations) who drops links to his extensive blogging history which also serves to add his prior thoughts and contextualizations.

    1. https://www.youtube.com/watch?v=j9dK76BqKJ4

      Jerry has been using The Brain for 24 years as of ~November 2021.

      In October 2021 he had approximately 484,000 thoughts in his graph.

      Ideas to explore: Lessons from My Brain

      We Are an Amnesic Society

      Loose guide:

      favicons indicate links to external sources

      Colors indicate

      • yellow - collections of things
      • purple - opinions
  19. May 2022
    1. https://www.macquariedictionary.com.au/blog/article/865/

      Re: Junior Atlas of Indigenous Australia

    2. The decision not to refer primary school children to online language resources such as AustLang and the Gambay map was appropriate as it would create difficulties for both those readers and their teachers. Those resources are usually used by Indigenous language speakers and experts with a sound training in linguistics.
  20. Apr 2022
    1. doi: https://doi.org/10.1038/d41586-021-02346-4

      https://www.nature.com/articles/d41586-021-02346-4

      Oddly this article doesn't cover academia.edu but includes ResearchGate which has a content-sharing partnership with the publisher SpringerNature.

      Matthews, D. (2021). Drowning in the literature? These smart software tools can help. Nature, 597(7874), 141–142. https://doi.org/10.1038/d41586-021-02346-4

    2. Open Knowledge Maps, meanwhile, is built on top of the open-source Bielefeld Academic Search Engine, which boasts more than 270 million documents, including preprints, and is curated to remove spam.

      Open Knowledge Maps uses the open-source Bielefeld Academic Search Engine and in 2021 indicated that it covers 270 million documents including preprints. Open Knowledge Maps also curates its index to remove spam.


      How much spam is included in the journal article space? I've heard of incredibly low quality and poorly edited journals, so filtering those out may be fairly easy to do, but are there smaller levels of individual spam below that?

    3. Amie Fairs, who studies language at Aix-Marseille University in France, is a self-proclaimed Open Knowledge Maps enthusiast. “One particularly nice thing about Open Knowledge Maps is that you can search very broad topics, like ‘language production’, and it can group papers into themes you may not have considered,” Fairs says. For example, when she searched for ‘phonological brain regions’ — the areas of the brain that process sound and meaning — Open Knowledge Maps suggested a subfield of research about age-related differences in processing. “I hadn’t considered looking in the ageing literature for information about this before, but now I will,” she says.
    4. Another visual-mapping tool is Open Knowledge Maps, a service offered by a Vienna-based not-for-profit organization of the same name. It was founded in 2015 by Peter Kraker, a former scholarly-communication researcher at Graz University of Technology in Austria.

      https://openknowledgemaps.org/

      Open Knowledge maps is a visual literature search tool that is based on keywords rather than on a paper's title, author, or DOI. The service was founded in 2015 by Peter Kraker, a former scholarly communication researcher at Graz University of Technology.

    1. My "map of content" for Java Collection Framework. Obsidian & Excalidraw make learning programming language full of joy! Great thanks to @obsdmd @zsviczian

      My "map of content" for Java Collection Framework. Obsidian & Excalidraw make learning programming language full of joy!<br><br>Great thanks to @obsdmd @zsviczian pic.twitter.com/FWBxfj2yLS

      — YM (@Peng1M) April 22, 2022
      <script async src="https://platform.twitter.com/widgets.js" charset="utf-8"></script>

      Note the use of scare quotes around "map of content". Is it because YM doesn't take the idea seriously or because of the pseudo map nature of the diagram included?

      Link to the idea that map of content is just a marketing term for something which already exists, namely a table of contents.

      It's also similar to the projects idea and outlines espoused by Sönke Ahrens.

    1. The final piece that's pushing the two first crucial changes over the paradigm hill is import maps. They allow the use of logical references for modules in ES6 (also known as ESM), rather than explicit file references.
    1. Today, many web developers are even using JavaScript's native module syntax, but combining it with bare import specifiers, thus making their code unable to run on the web without per-application, ahead-of-time modification. We'd like to solve that, and bring these benefits to the web.
  21. Mar 2022
    1. There are some additional interesting questions here, like: how do you get to the edge quickly? How do you do that across multiple fields? What do you do if the field seems misdirected, like much of psychology?
      1. How do you get to the edge quickly?

      I think this is where literature mapping tools come in handy. With such a tool, you can see how the literature is connected and which papers are closer to the edge of understanding. Some tools on this point include Connected Papers, Inciteful, Scite, Litmaps, and Open Knowledge Maps.

      1. How do you do that across multiple fields?

      I think this requires taking an X-disciplinary approach that teeters on multiple disciplines.

      1. What do you do if the field seems misdirected, like much of psychology?

      Good question. It is hard to re-orient a field unless you can find a good reason (e.g., a crisis) for a paradigm shift. I think Kuhn's writing on [The Structure of Scientific Revolutions(https://www.uky.edu/~eushe2/Pajares/Kuhn.html) may be relevant here.

  22. Feb 2022
    1. X : You seem concerned. Me : The competition talks maps but shows graphs. That's a problem. X : Why? Me : In maps, space has meaning which is why they are good for mapping spaces whether geographic, economic, social or political. X : Isn't that true with graphs? Me : No.

      https://twitter.com/swardley/status/1490344071126294528

      maps != graphs

      what are the building blocks at operation with respect to these?

      what pieces of context are built up and how do they add information to become more complex?

  23. Jan 2022
    1. A Mental Squeeze Point is when your unsorted knowledge becomes so messy it overwhelms and discourages you. Either you are equipped with frameworks to overcome the squeeze point, or you are discouraged and possibly abandon your project.

      Cross reference: https://hypothes.is/a/BuMcAnr4EeyxO-PwNBfPrg (Dan Allosso's analogy about the Kuiper Belt)

    1. Three types of linking can be distinguished:a) References in the context of a larger structural outline: When beginning a major line of thoughtLuhmann sometimes noted on the first card several of the aspects to be addressed and marked themby a capital letter that referred to a card (or set of consecutive cards) that was numbered accordinglyand placed at least in relative proximity to the card containing the outline. This structure comesclosest to resembling the outline of an article or the table of contents of a book and therefore doesn’treally use the potentials of the collection as a web of notes.b) Collective references: At the beginning of a section devoted to a specific subject area, one can oftenfind a card that refers to a number of other cards in the collection that have some connection withthe subject or concept addressed in that section. A card of this kind can list up to 25 references andwill typically specify the respective subject or concept in addition to the number. These referencescan indicate cards that are related by subject matter and in close proximity or to cards that are farapart in other sections of the collection, the latter being the normal case.c) Single references: At a particular place in a normal note Luhmann often made a reference to anothercard in the collection that was also relevant to the special argument in question; in most cases the re

      ferred card is located at an entirely different place in the file, frequently in the context of a completely different discussion or subject.

      Niklas Luhmann's index card system had three different types of links. Direct links to individual notes, outlines with links to cards (similar to tables of contents or maps of content), and what Schmidt (2018) refers to as "collective references". These collective references sound a lot like search queries for related topics that have links to a variety of resources/cards related to a particular topic and sound like a table of contents, but without a specific hierarchy.

    1. <small><cite class='h-cite via'> <span class='p-author h-card'>John Philpin</span> in // John Philpin (<time class='dt-published'>01/05/2022 22:55:00</time>)</cite></small>

  24. Dec 2021
    1. First, I go to existing structure notes. They are notes about notes, and therefore they map structures in my archive.

      Structure notes are notes about notes. Sounds similar to Maps of Content (MoC) or Tables of Contents in some sense. No one seems to have a strong or consistent name for this practice.

  25. Nov 2021
  26. Sep 2021
    1. seeing spaces of opportunity

      I'm seeing a space of opportunity in the way we map and plan at the intersection of knowledge practices — like teaching and learning, research, publication, archiving — and tools. I'm thinking about ways we can use practices like Jennifer Hardwick outlines here to map and plan in new ways that emphasize human activity and connections rather than technologies.

      What spaces of opportunity are you seeing?

    1. First, the Backstory:  A Brief History of the Chilbo Community

      What began as a simple Welcome Center with helpful information and freebies for travelers eventually blossomed into a community of fellow learners and explorers.

    1. Maps and atlases are not only visual tools, they are epistemologies. They can help us pay attention to the world using all our senses in order reorientate, navigate and take action as political bodies in an ecological crisis.
  27. Aug 2021
    1. {:name identity :glitter-index str->int}

      The data is organized in maps. Each map has a set of keywords. The original data has a map of keys to string values. The conversions variable has a list of keys that match the keys of the original map's. The value of the conversions is what to do with the data at that key before finalizing.

  28. Jul 2021
  29. Jun 2021
  30. May 2021
  31. Mar 2021
    1. Sentry supports un-minifying JavaScript via Source Maps. This lets you view source code context obtained from stack traces in their original untransformed form, which is particularly useful for debugging minified code (e.g. UglifyJS), or transpiled code from a higher-level language (e.g. TypeScript, ES6).
    1. Any updates on this one? It makes debugging JS and CSS in the web inspector next to impossible when you can't get any help finding the offending code in your own source files.
  32. Feb 2021
    1. Source maps eliminate the need to serve these separate files. Instead, a special source map file can be read by the browser to help it understand how to unpack your assets. It "maps" the current, modified asset to its "source" so you can view the source when debugging. This way you can serve assets in development in the exact same way as in production.
    2. Source maps are a major new feature.
  33. Nov 2020
  34. Oct 2020
    1. emphasized the disutility of 1:1 maps and other overly detailed models: "A model which took account of all the variation of reality would be of no more use than a map at the scale of one to one."
    1. Description: Students in four different college level science classes were asked to complete concept maps then reflect on their helpfulness. A majority of the students in endocrinology found concept maps useful while students in neurobiology disagreed. Students were also allowed to state why they felt positively or negatively towards the activity. Through the survey, they found students wanted an answer key, more discussion with peers, and less terms to place on their concept maps. In the conclusion, the authors state concept maps must be appropriately designed for the end goal of the class, there must be adequate feedback from the professor, and students should see the relevance of the topic for the concept map.

      Rating: 7/10

      Reasoning for the rating: The article clearly explains the study and the results. Additionally, the article includes charts and graphs to help readers visiualize the information. This study only uses the data from the surveys and does not delve into the actual usefulness of concept maps as a study guide.

  35. Sep 2020
    1. (I promise you, this is the single biggest productivity boost to your CSS workflow. If you're writing styles without sourcemaps, you are almost certainly wasting a lot of time. I know I was.)
    1. But source maps have long been seen merely as a local development tool. Not something you ship to production, although people have also been doing that, such that live debugging would be easier. That in itself is a great reason to ship source maps.
    2. source maps are special files that connect that final output file the browser is actually using with the authored files that you actually work with and write code in on your file system.
    3. But because that final CSS file is probably minified (all whitespace removed), DevTools is likely to tell us that we’ll find the declaration we’re looking for on line 1! Unfortunate, and not helpful for development.
  36. Mar 2020
    1. This tool will allow you to create a customised cookieless Google Map that does not use privacy-invasive cookies.
  37. Feb 2020
    1. 99 second hand smartphones are transported in a handcart to generate virtual traffic jam in Google Maps.Through this activity, it is possible to turn a green street red which has an impact in the physical world by navigating cars on another route to avoid being stuck in traffic.
  38. Dec 2019
  39. Nov 2019
  40. Oct 2019
  41. Sep 2019
  42. Aug 2019
  43. May 2019
    1. fantasy maps

      This looks interesting

    Tags

    Annotators

    URL

  44. Mar 2019
  45. Jan 2019
    1. Value-free language and the possibility of a self-contained discipline make possible both modern sci-ence and that mapping of humanistic inquiry onto a scientific model which has created modern social science as well.

      And yet, any mapping of humanistic inquiry onto a scientific model would lead to the creation of incomplete maps, of certain lies. One of those lies? If you can't use the scientific method to come to know something, then that something isn't knowledge/true/truth/fact.

    1. You can display Geocoding API results on a Google Map, or without a map. If you want to display Geocoding API results on a map, then these results must be displayed on a Google Map. It is prohibited to use Geocoding API data on a map that is not a Google map.

      L'output impone una scelta tecnologica, quindi non sono opendata

  46. Aug 2018
    1. En este sentido, esperaba contribuir a la realización de un ideal de trabajo pluridisciplinario en el cual, retomando los términos de Braudel, el mapa, «instrumento de investigación, indispensable a toda ciencia humana», constituye «la ocasión de una convergencia, de una colaboración entre especialistas» (Braudel, 1958). P.351

  47. Jun 2018
    1. This is an interesting demo of several kind of maps available with openstreetmap and LefatLet library

  48. Jun 2017
  49. May 2016
    1. Pictured above: The same area and zoom in 2010 and 2016. Notice how many fewer labels are on the 2016 map.

      A similar thing happens with streets and roads within London: often main streets don't display their name until you've zoomed in way past it's useful.

  50. Apr 2016
  51. Mar 2016
  52. Feb 2016
    1. "How many film versions of Treasure Island have been made?"

      My screencst version of Treasure Island: "The Maps of Treasure Island"

      http://youtu.be/lG6Riht0a84?hd=1

  53. Jan 2016
    1. an open-source JavaScript library for mobile-friendly interactive maps

      Mapy do mojej historyApp

  54. Oct 2015
    1. Useful introduction to how source maps work. The code for Mozilla's source map library is very readable and an easy way to test this in practice.

  55. Jul 2015
  56. Feb 2014