The Observatory of Economic Complexity (OEC)<br /> https://oec.world/en
62 Matching Annotations
- Feb 2026
-
oec.world oec.world
- Jul 2025
- Apr 2025
-
esbuild.github.io esbuild.github.io
-
Above: the time to do a production bundle
Nice way to demonstrate and let people feel how slow the competition is!
-
- Mar 2025
-
www.youtube.com www.youtube.com
-
How a Mechanical Typewriter Works by [[Animagraffs]]
-
- Jan 2024
-
forum.zettelkasten.de forum.zettelkasten.de
-
Software and applications for creating visualizations of zettelkasten contents: - Tinderbox (Mac) - Apple's Freeform (app) - Obsidian Canvas - Excalidraw (plugin for Obsidian) - Scrintal - Heptabase - Card Buddy (Mac) - AFFiNE (https://github.com/toeverything/AFFiNE)
-
- Dec 2023
-
picturing.climatecentral.org picturing.climatecentral.org
-
-
for: visualizations - sea level rise at 3 Deg C
-
comment
- Look to canal cities like Venice or Amsterdam for inspiration because if it cities are salvagable, parts of them will become canal cities.
-
-
- Jul 2023
-
erinflotodesigns.com erinflotodesigns.com
-
Erin Floto has a metal stencil for a chronodex circular design for use in bullet journals. It's a form of circular calendar with the inner circle containing space for daily, bi-weekly, weekly, monthly and longer time horizons with succeeding rings of the circle containing space for data related to the inner categories. Some of the exterior rings also include numbered squares representing days of the month or week on which a task should be done or for which a habit on an interior part of the circle might be tracked.
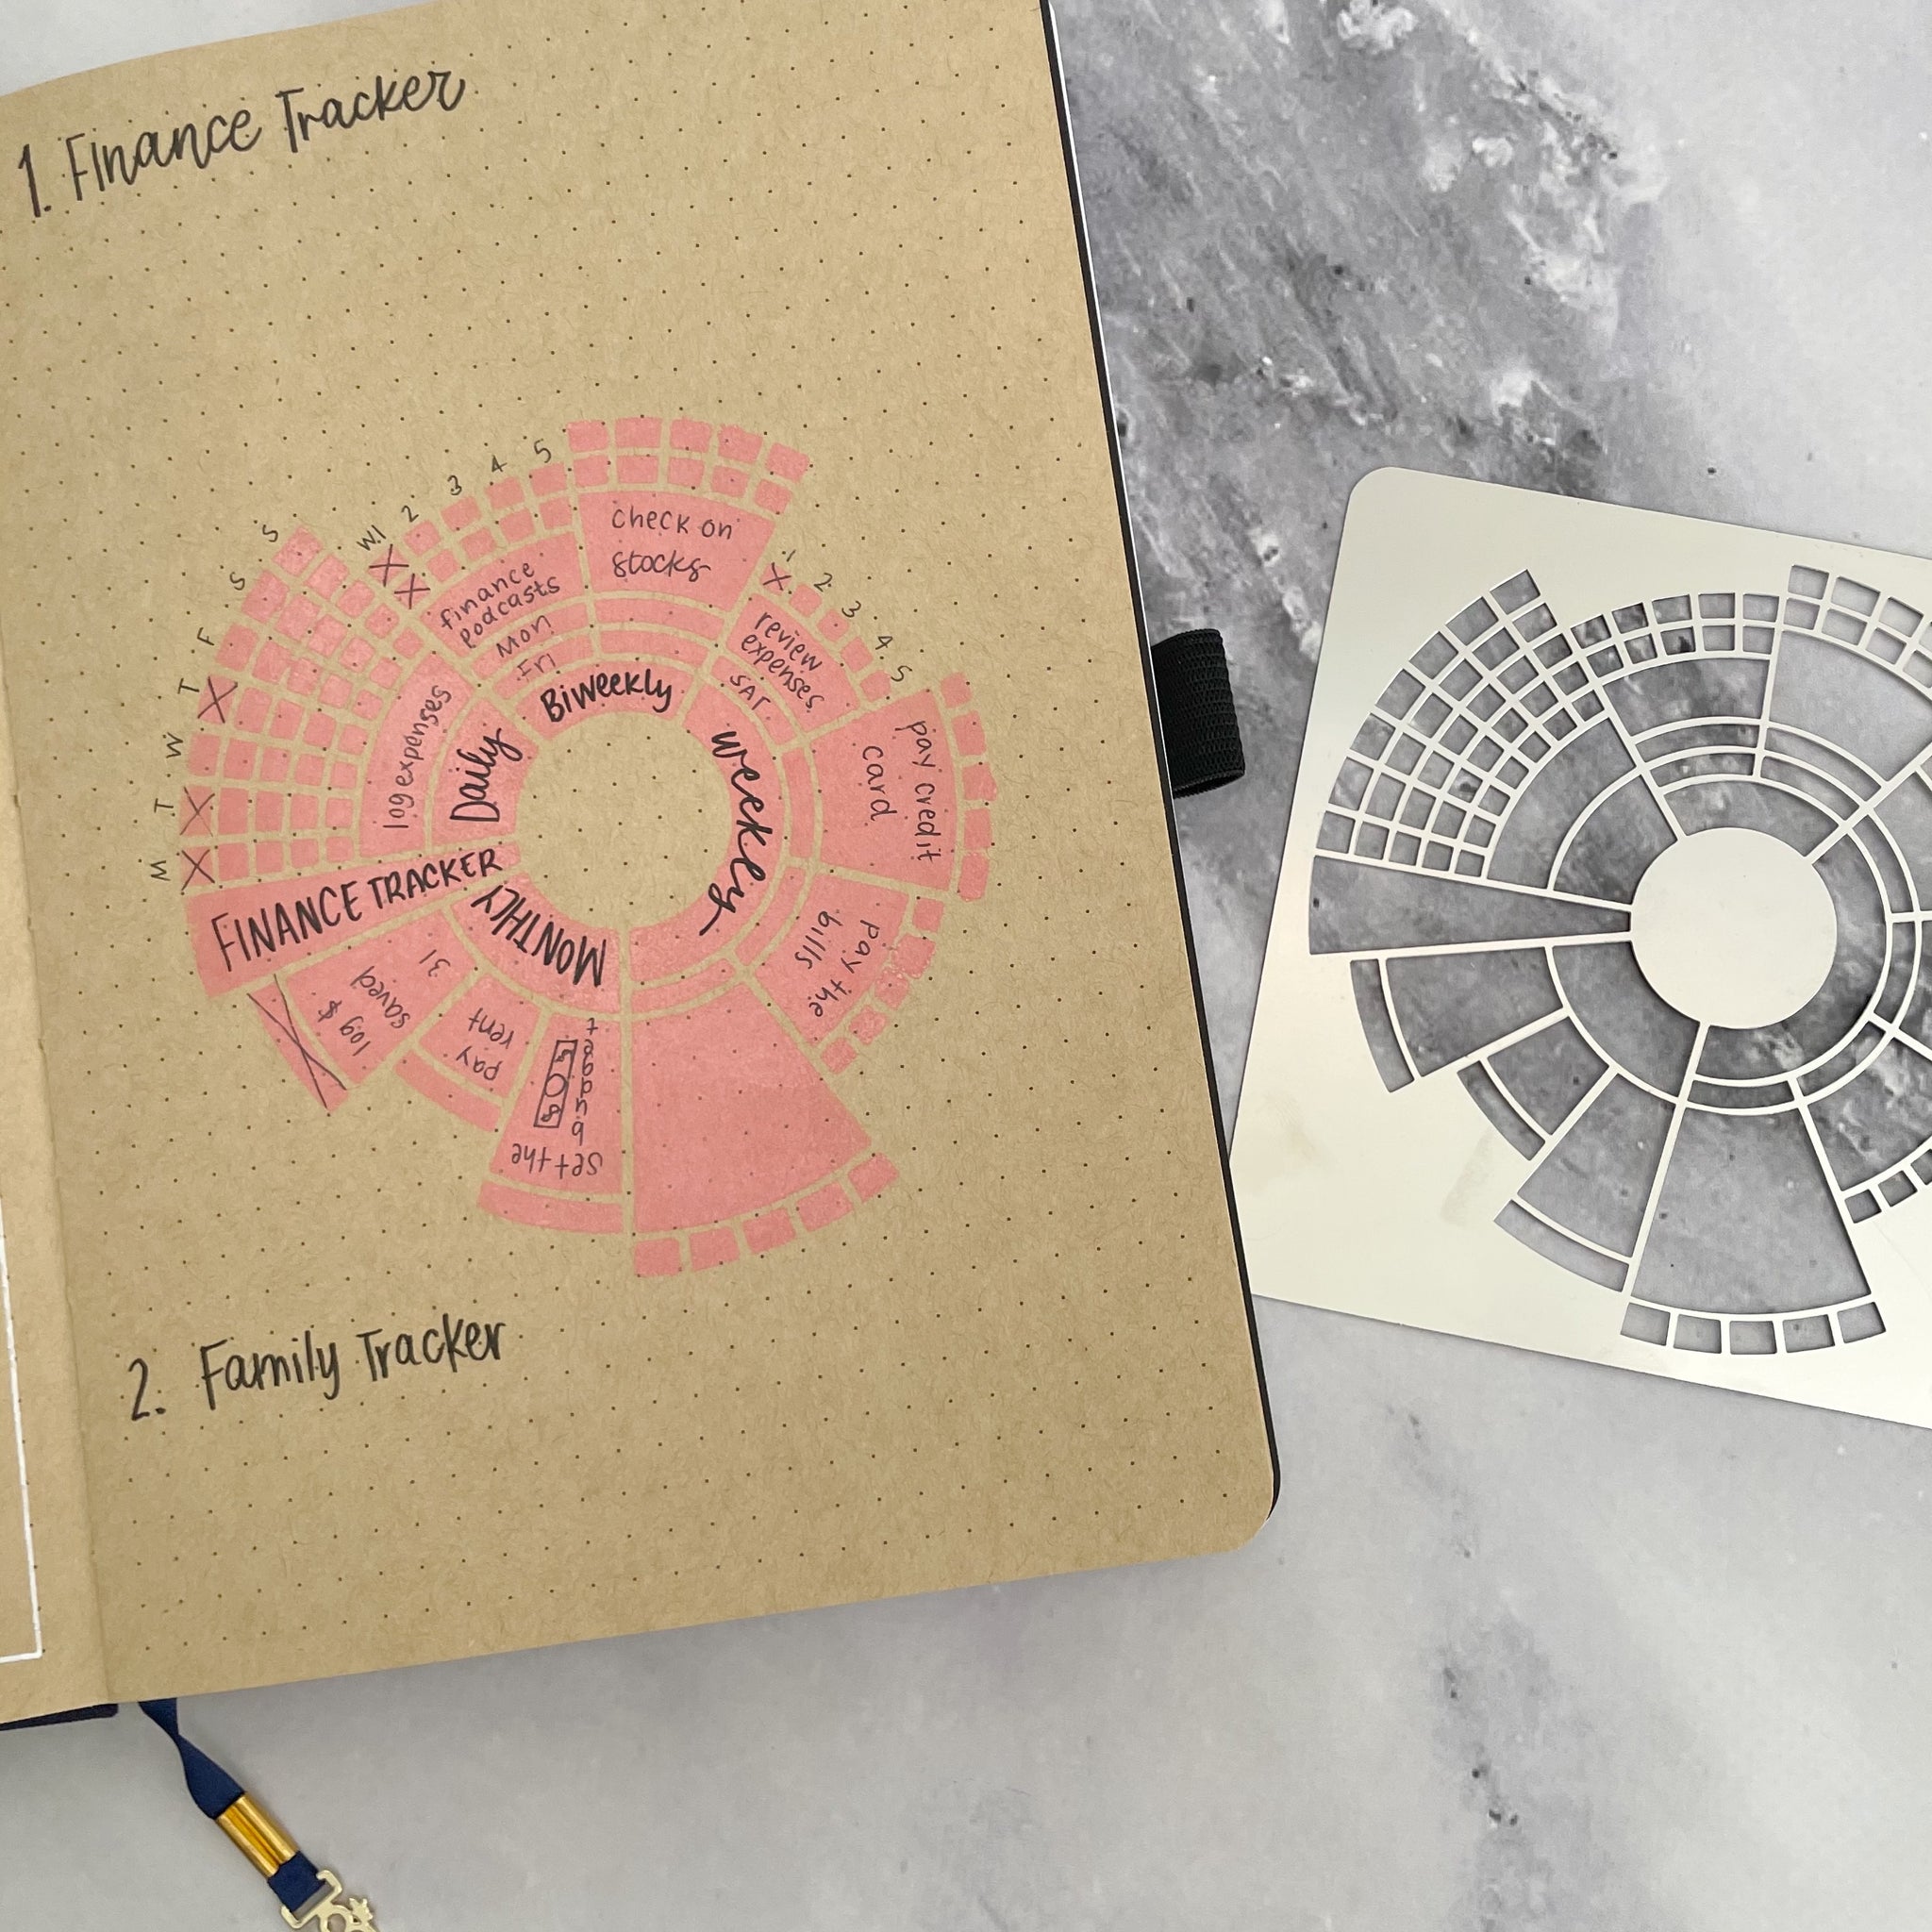
The chronodex, a portmanteau of chrono (time) and index, idea is fairly simple, but can be quite complex. For actual use, one may need to be able to spin the visualization around to read and understand it.
Other stencils with habit trackers, etc: https://erinflotodesigns.com/collections/metal-stencils
-
- Jan 2023
-
Local file Local file
-
If you have experienced trouble in rememberingdates try the following system which has proved beneficial to at least onestudent.
Maxfield suggest drawing out a timeline as a possible visual cue for helping to remember dates. He seemingly misses any mention of ars memoria techniques here.
-
-
www.cambridge.org www.cambridge.org
-
We believe that the numeric notational marks associated with the animals constituted a calendar, and given that it references natural behaviour in terms of seasons relative to a fixed point in time, we may refer to it as a phenological calendar, with a meteorological basis.
-
We have proposed the existence of a notational system associated with an unambiguous animal subject, relating to biologically significant events informed by the ethological record, which allows us for the first time to understand a Palaeolithic notational system in its entirety. This utilized/allowed the function of ordinality (and, later, place value), which were revolutionary steps forward in information recording.
-
-
treeverse.app treeverse.app
-
https://treeverse.app/
Treeverse is a tool for visualizing and navigating Twitter conversation threads.<br /> It is available as a browser extension for Chrome and Firefox.
-
- Dec 2022
-
zephoria.medium.com zephoria.medium.com
-
One interesting concept in organizational sociology is “normal accidents theory.” Studying Three Mile Island, Charles Perrow created a 2x2 grid
https://zephoria.medium.com/what-if-failure-is-the-plan-2f219ea1cd62
-
- Nov 2022
-
-
Intrigue lets you quickly organize the papers you read alongside your thoughts in a visual & clean manner.
-
-
lucahammer.com lucahammer.com
-
medium.com medium.com
-
https://medium.com/@ben_fry/tracing-the-origin-65011dc20877
Could be interesting to apply this sort of process to a variety of texts over time. A draft of Mary Shelley's Frankenstein comes to mind.
How to view this through the lens of Thomas Kuhn's The Structure of Scientific Revolutions? particularly as this was the evolution of an idea by the same author over time...
-
-
benfry.com benfry.com
-
What a spectacular visualization of Darwin's On the Origin of Species.
Richard Carter will love this if he's not seen it.
-
- Oct 2022
-
joelchan.me joelchan.meTest JOB1
-
about a thirdof the users reported problems with the specificity of the material (eithertoo high or too low) and the level of the explanation provided by the expert(either too high or too low)
OK, but start visualizing descriptives from the beginning of the Results. This is getting tedious.
-
-
natto.dev natto.dev
-
Natto https://natto.dev<br /> built by Paul Shen https://twitter.com/_paulshen
-
- Sep 2022
-
projects.fivethirtyeight.com projects.fivethirtyeight.com
- Aug 2022
-
www.youtube.com www.youtube.com
-
https://www.youtube.com/watch?v=o49C8jQIsvs
Video about the Double-Bubble Map: https://youtu.be/Hm4En13TDjs
The double-bubble map is a tool for thought for comparing and contrasting ideas. Albert Rosenberg indicates that construction of opposites is one of the most reliable ways for generating ideas. (35:50)
Bluma Zeigarnik - open tasks tend to occupy short-term memory.
I love his compounding interest graphic with the steps moving up to the right with the quote: "Even groundbreaking paradigm shifts are most often the consequence of many small moves in the right direction instead of one big idea." This could be an awesome t-shirt or motivational poster.
Watched this up to about 36 minutes on 2022-08-10 and finished on 2022-08-22.
-
-
forum.artofmemory.com forum.artofmemory.com
-
Continuing on the bouba/kiki effect thread, I thought some might appreciate this visualization, though I'm unsure of a more concrete method for tying it into my own practice (yet).
https://pbs.twimg.com/media/FYCX1WpXEAcYphG?format=jpg&name=small
via
— Alex Tomlinson 🪶 (@hootalex) July 19, 2022
-
-
en.wikipedia.org en.wikipedia.org
-
The forerunner of contemporary Infographics, he initially called this the Vienna Method of Pictorial Statistics.
-
-
cluster.cis.drexel.edu cluster.cis.drexel.edu
-
http://cluster.cis.drexel.edu/~cchen/talks/2011/ICSTI_Chen.pdf
The Nature of Creativity: Mechanism, Measurement, and Analysis<br /> Chaomei Chen, Ph.D.<br /> Editor in Chief, Information Visualization<br /> College of Information Science and Technology, Drexel University<br /> June 7‐8, 2011
Randomly ran across while attempting to source Randall Collins quote from https://hypothes.is/a/8e9hThZ4Ee2hWAcV1j5B9w
-
- Jul 2022
-
www.youtube.com www.youtube.comYouTube1
-
Local file Local file
-
Lima, Manuel. The Book of Trees: Visualizing Branches of Knowledge, 2014. https://papress.com/products/the-book-of-trees-visualizing-branches-of-knowledge.

-
- Jun 2022
-
Local file Local file
-
If we overlay the four steps of CODE onto the model ofdivergence and convergence, we arrive at a powerful template forthe creative process in our time.
The way that Tiago Forte overlaps the idea of C.O.D.E. (capture/collect, organize, distill, express) with the divergence/convergence model points out some primary differences of his system and that of some of the more refined methods of maintaining a zettelkasten.
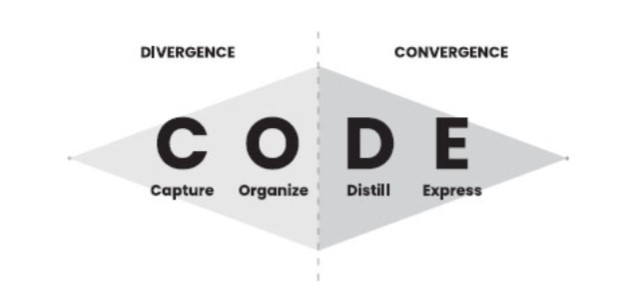 <small>Overlapping ideas of C.O.D.E. and divergence/convergence from Tiago Forte's book Building a Second Brain (Atria Books, 2022) </small>
Forte's focus on organizing is dedicated solely on to putting things into folders, which is a light touch way of indexing them. However it only indexes them on one axis—that of the folder into which they're being placed. This precludes them from being indexed on a variety of other axes from the start to other places where they might also be used in the future. His method requires more additional work and effort to revisit and re-arrange (move them into other folders) or index them later.
Most historical commonplacing and zettelkasten techniques place a heavier emphasis on indexing pieces as they're collected.
Commonplacing creates more work on the user between organizing and distilling because they're more dependent on their memory of the user or depending on the regular re-reading and revisiting of pieces one may have a memory of existence. Most commonplacing methods (particularly the older historic forms of collecting and excerpting sententiae) also doesn't focus or rely on one writing out their own ideas in larger form as one goes along, so generally here there is a larger amount of work at the expression stage.
Zettelkasten techniques as imagined by Luhmann and Ahrens smooth the process between organization and distillation by creating tacit links between ideas. This additional piece of the process makes distillation far easier because the linking work has been done along the way, so one only need edit out ideas that don't add to the overall argument or piece. All that remains is light editing.
Ahrens' instantiation of the method also focuses on writing out and summarizing other's ideas in one's own words for later convenient reuse. This idea is also seen in Bruce Ballenger's The Curious Researcher as a means of both sensemaking and reuse, though none of the organizational indexing or idea linking seem to be found there.
This also fits into the diamond shape that Forte provides as the height along the vertical can stand in as a proxy for the equivalent amount of work that is required during the overall process.
This shape could be reframed for a refined zettelkasten method as an indication of work
Forte's diamond shape provided gives a visual representation of the overall process of the divergence and convergence.
But what if we change that shape to indicate the amount of work that is required along the steps of the process?!
Here, we might expect the diamond to relatively accurately reflect the amounts of work along the path.
If this is the case, then what might the relative workload look like for a refined zettelkasten? First we'll need to move the express portion between capture and organize where it more naturally sits, at least in Ahren's instantiation of the method. While this does take a discrete small amount of work and time for the note taker, it pays off in the long run as one intends from the start to reuse this work. It also pays further dividends as it dramatically increases one's understanding of the material that is being collected, particularly when conjoined to the organization portion which actively links this knowledge into one's broader world view based on their notes. For the moment, we'll neglect the benefits of comparison of conjoined ideas which may reveal flaws in our thinking and reasoning or the benefits of new questions and ideas which may arise from this juxtaposition.
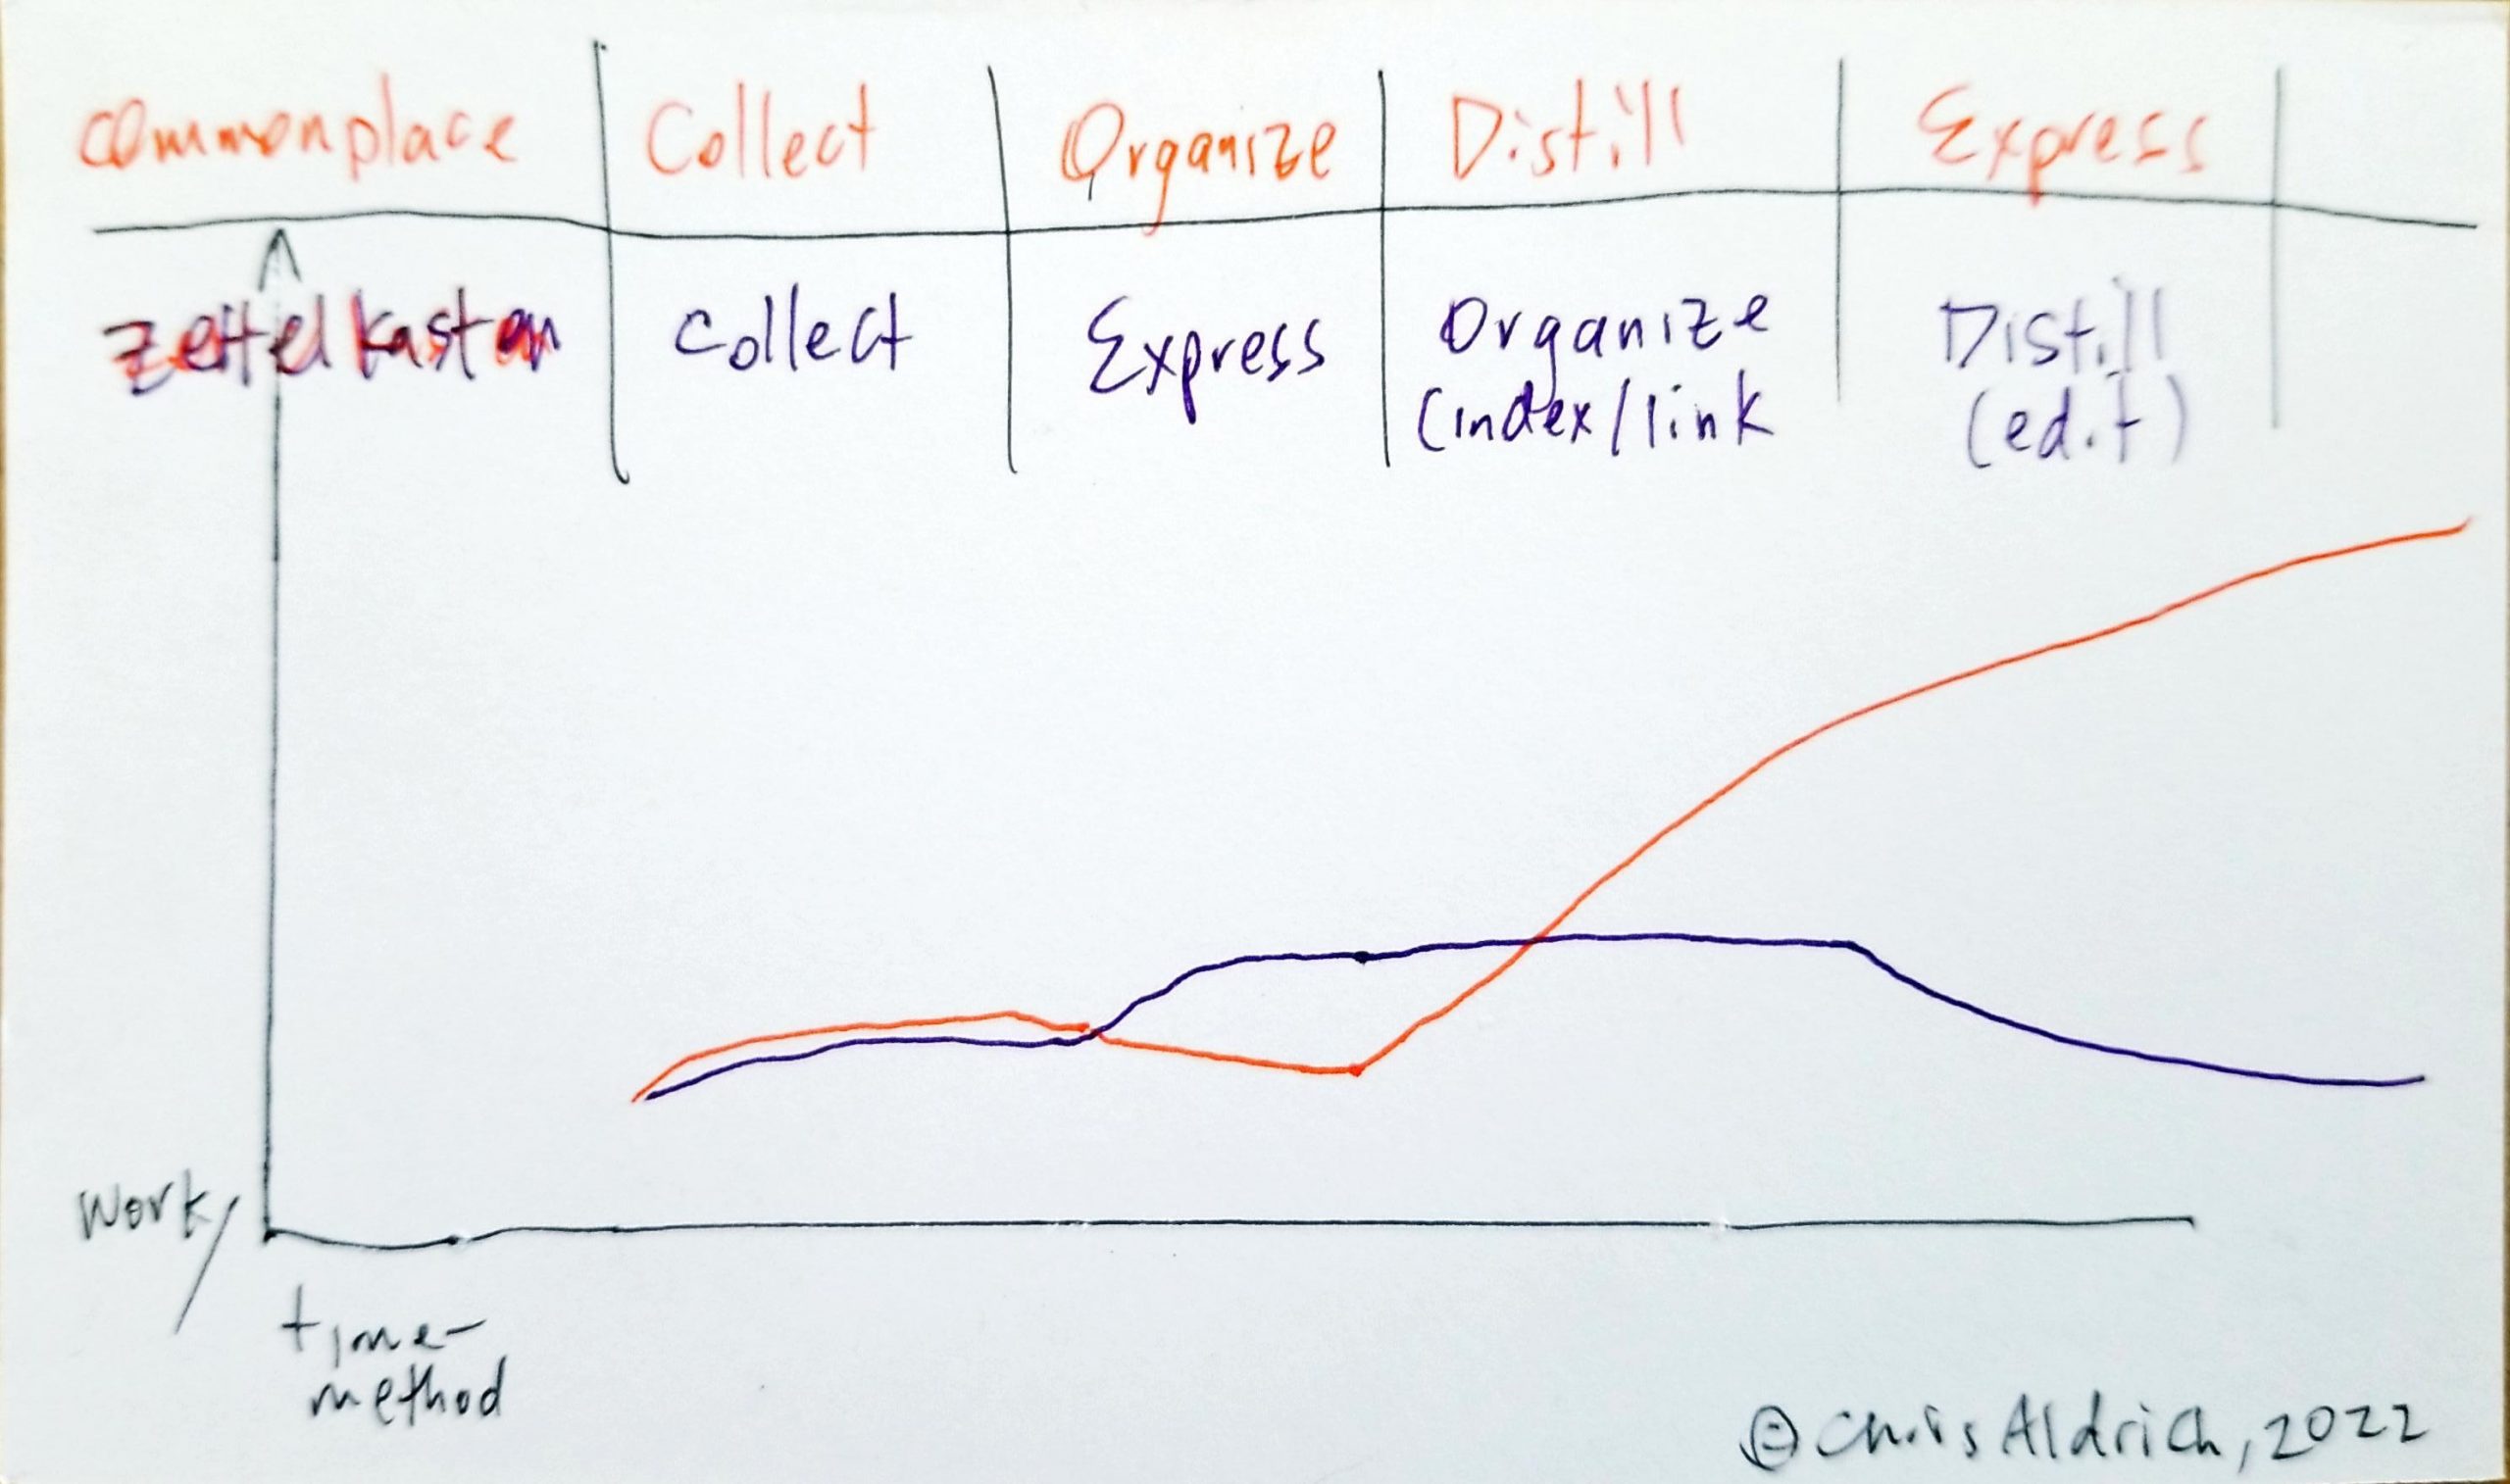
This sketch could be refined a bit, but overall it shows that frontloading the work has the effect of dramatically increasing the efficiency and productivity for a particular piece of work.
Note that when compounded over a lifetime's work, this diagram also neglects the productivity increase over being able to revisit old work and re-using it for multiple different types of work or projects where there is potential overlap, not to mention the combinatorial possibilities.
--
It could be useful to better and more carefully plot out the amounts of time, work/effort for these methods (based on practical experience) and then regraph the resulting power inputs against each other to come up with a better picture of the efficiency gains.
Is some of the reason that people are against zettelkasten methods that they don't see the immediate gains in return for the upfront work, and thus abandon the process? Is this a form of misinterpreted-effort hypothesis at work? It can also be compounded at not being able to see the compounding effects of the upfront work.
What does research indicate about how people are able to predict compounding effects over time in areas like money/finance? What might this indicate here? Humans definitely have issues seeing and reacting to probabilities in this same manner, so one might expect the same intellectual blindness based on system 1 vs. system 2.
Given that indexing things, especially digitally, requires so little work and effort upfront, it should be done at the time of collection.
I'll admit that it only took a moment to read this highlighted sentence and look at the related diagram, but the amount of material I was able to draw out of it by reframing it, thinking about it, having my own thoughts and ideas against it, and then innovating based upon it was incredibly fruitful in terms of better differentiating amongst a variety of note taking and sense making frameworks.
For me, this is a great example of what reading with a pen in hand, rephrasing, extending, and linking to other ideas can accomplish.
-
Some digital notes apps allow you to displayonly the images saved in your notes, which is a powerful way ofactivating the more intuitive, visual parts of your brain.
Visual cues one can make in their notes and user interfaces that help to focus or center on these can be useful reminders for what appears in particular notes, especially if visual search is a possibility.
Is this the reason that Gyuri Lajos very frequently cuts and pastes images into his Hypothes.is notes?
Which note taking applications leverage this sort of visual mnemonic device? Evernote did certainly, but other text heavy tools like Obsidian, Logseq, and Roam Research don't. Most feed readers do this well leveraging either featured photos, photos in posts, or photos in OGP.
Tags
- divergence/convergence
- misinterpreted-effort hypothesis
- imitation for innovation
- commonplace books vs. zettelkasten
- innovation
- cognitive bias
- Tiago Forte
- zettelkasten
- behavioral economics
- open graph protocol
- Gyuri Lajos
- C.O.D.E.
- note taking affordances
- work
- visualizations
- writing
- efficiency
- visual memory
- note taking
- visual cues
- compounding value
- Evernote
- time
- knowledge work
- Hypothes.is
- writing for understanding
- putting in the work
- productivity
- commonplace books
Annotators
-
-
thebrain.com thebrain.com
-
Initially came across this via Jerry Michalski who has an extensive personal mind map of over 24 years (as of fall 2021).
-
-
app.thebrain.com app.thebrain.comTheBrain1
-
A fantastic example of an extensive mind map from Jerry Michalski using The Brain.
There are lots of interesting links and resources, but on the whole
How many of the nodes actually have specific notes, explicit ideas, annotations, or excerpts within them?
Without these, it's an interesting map and provides some broad context, but removes local specific context of who Jerry is and how he explicitly thinks. One can review the overarching parts to extract what his biases may be based on availability heuristics, but in areas of conflicting ideas which have relatively equal numbers of links within a particular area, one may not be able to discern arguments from each other.
Still a fascinating start and something not commonly seen in the broader literature.
I'll also note that even in a small sample of one video call with Jerry sharing his screen while we talked about a broad sub-topic it's interesting to see his prior contexts as we conversed. I've only ever had similar experiences with Bill Seitz who regularly drops links to his wiki pages in this sort of way or Kevin Marks (usually in text chat contexts and less frequently in video calls/conversations) who drops links to his extensive blogging history which also serves to add his prior thoughts and contextualizations.
-
-
www.nytimes.com www.nytimes.com
-
The Algebra Project was born.At its core, the project is a five-step philosophy of teaching that can be applied to any concept: Physical experience. Pictorial representation. People talk (explain it in your own words). Feature talk (put it into proper English). Symbolic representation.
The five step philosophy of the Algebra Project: - physical experience - pictorial representation - people talk (explain it in your own words) - feature talk (put it into proper English) - symbolic representation
"people talk" within the Algebra project is an example of the Feynman technique at work
Link this to Sonke Ahrens' method for improving understanding. Are there research links to this within their work?
-
- May 2022
-
www.uni-bielefeld.de www.uni-bielefeld.de
-
The pixel portrait of Niklas Luhmann was created by Sebastian Zimmer (CCeH) using the software AndreaMosaic from the image of 1271 slips of paper from the 'Zettelkasten'.
 © Alexander Kluge/ Universität Bielefeld*
-
-
Local file Local file
-
Tables and Illustrations for A Brief History of Equality available here: https://www.hup.harvard.edu/supplementary/a-brief-history-of-equality/
This PDF of tables and illustrations is being made available as a supplement to the audio book format of Thomas Piketty’s A Brief History of Equality as published by Harvard University Press, 2022.
-
-
www.youtube.com www.youtube.com
-
https://www.youtube.com/watch?v=F-icwOk8YFk
It's interesting to see the differences between the bookclubs in this visualization of their related notes.
-
-
addons.mozilla.org addons.mozilla.org
-
anvaka.github.io anvaka.github.io
-
https://anvaka.github.io/map-of-reddit/
<small><cite class='h-cite via'>ᔥ <span class='p-author h-card'>https://indieweb.social/@elgg/</span> in Platform for Social Apps: "Map of #Reddit https://anvaka.github.io/map-of-r…" - Indieweb.Social (<time class='dt-published'>05/13/2022 13:29:09</time>)</cite></small>
-
- Mar 2022
-
-
“penetrative thinking.” This is the capacity to visualize and reason about theinterior of a three-dimensional object from what can be seen on its surface—acritical skill in geology, and one with which many students struggle.
Penetrative thinking is the ability to abstractly consider and internally visualize or theorize about the inside of a three dimensional object based on what can be seen on its surface.
Penetrative thinking can be useful in areas like geology and anatomy.
Improvements in penetrative thinking can be exercised, encouraged, and improved by using gestures.
-
-
twitter.com twitter.com
-
Working on a new data visceralization. I’m particularly interested in the tactile quality of this one. Covid deaths from 3/2020-6/2021
<script async src="https://platform.twitter.com/widgets.js" charset="utf-8"></script>Working on a new data visceralization. I’m particularly interested in the tactile quality of this one. Covid deaths from 3/2020-6/2021 pic.twitter.com/MjFZCqDP4x
— Jacqueline Wernimont (@profwernimont) March 1, 2022
-
- Feb 2022
-
thinkzone.wlonk.com thinkzone.wlonk.com
-
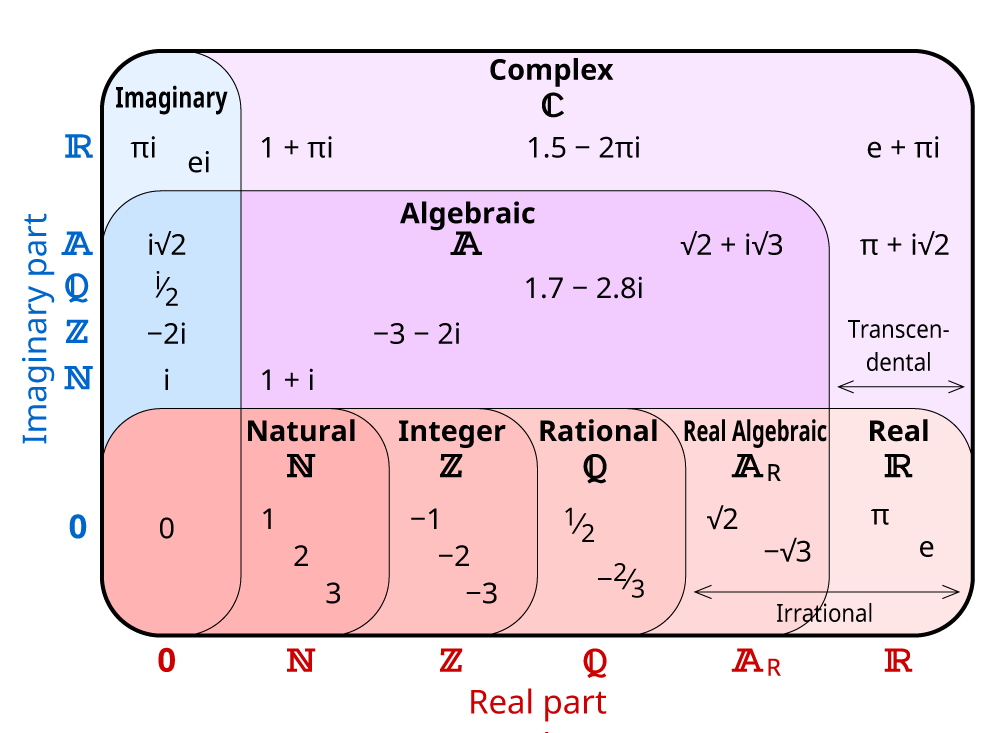
https://thinkzone.wlonk.com/Numbers/NumberSets.htm
A relatively clear explanation of the types of numbers and their properties.
I particularly like this diagram:
-
- Sep 2021
-
tailwindcss.com tailwindcss.com
-
Tailwind automatically removes all unused CSS when building for production
-
- Aug 2021
-
papress.com papress.com
-
from its roots
Ha!
-
- May 2021
-
www.connectedpapers.com www.connectedpapers.com
- Apr 2021
-
frankensteinvariorum.github.io frankensteinvariorum.github.io
-
Interesting to see this actually hosted by GitHub pages.
-
- Mar 2021
-
tatianamac.com tatianamac.com
-
Visualise written content into a more dynamic way. Many people, some neurodivergent folks especially, benefit from information being distilled into diagrams, comics, or less word-dense formats. Visuals can also benefit people who might not read/understand the language you wrote it in. They can also be an effective lead-in to your long-form from visually-driven avenues like Pinterest or Instagram.
This is also a great exercise for readers and learners. If the book doesn't do this for you already, spend some time to annotate it or do it yourself.
-
-
puntofisso.net puntofisso.net
Tags
Annotators
URL
-
- Feb 2021
-
cytoscape.org cytoscape.org
-
Cytoscape is an open source software platform for visualizing complex networks and integrating these with any type of attribute data. A lot of Apps are available for various kinds of problem domains, including bioinformatics, social network analysis, and semantic web.
Tags
Annotators
URL
-
- Nov 2020
-
svelte.dev svelte.dev
-
You can explore the various eases using the ease visualiser in the examples section.
Tags
Annotators
URL
-
- Oct 2020
-
-
The most dangerous kind of assumption is the one we don’t know we have. In Rumsfeldian, that’s an “Unknown unknown.”
-
- Apr 2020
-
experience.arcgis.com experience.arcgis.com
- Feb 2020
-
observablehq.com observablehq.com
-
Source code of this (or predecessor to this): https://gist.github.com/kerryrodden/7090426
-
- Jan 2020
-
www.census.gov www.census.gov
- Nov 2019
- Aug 2019
-
material-ui.com material-ui.com
-
Linear Buffer
-
- Nov 2018
-
www.denizcemonduygu.com www.denizcemonduygu.com
-
Inventive interactive history of philosophy linking quotes/ideas from various thinkers. No Deleuze!?
-
- Aug 2018
-
link.springer.com link.springer.com
-
visualizations are more than just ‘‘prettypictures’’: rather, precisely in virtue of their bringinginto play oursharedcognitive and aesthetic frame-works as human beings, they thereby catalyze theepistemological – but also aesthetic and therebysocial, if not also political – processes that create ashared intersubjective framework in the first place,one that then makes possible trust-building and asharedsensus communiswithin which the enterpriseof collaborative science may take place
-
a view towards examining how visualizationscontribute to building frameworks of trust.
-