rectificatie
hoort rectificatie niet bij schadevergoeding in andere vorm?
rectificatie
hoort rectificatie niet bij schadevergoeding in andere vorm?
Click
StudentRow에서 Jane 클릭
onSelect({selectedId}) 호출
App.setState({{selectedId}}) 요청
React가 App.render() 재실행
Roster와 StudentRow 렌더링
selected 결과에 따라 > 표시 변경
<section>
<section>은 <h2>와 <ul>을 하나의 Root Element로 묶기 위해 사용한 거야.
반드시 <section>일 필요는 없으며 <div>나 Fragment로 대체할 수도 있어.
const { title, students, selectedId, onSelect } = this.props;
destructing -> 굳이 this.props.속성 이렇게 사용 안 해도 됨
const title = this.props.title;
const students = this.props.students;
const selectedId = this.props.selectedId;
const onSelect = this.props.onSelect;
destructure
function Greeting({ name })은 function Greeting(props)에서 props.name을 일일이 쓰지 않도록 name을 바로 꺼내는 축약 문법이야
State
state = { ... } State 객체 생성
{ id: 1, name: 'Joe' } 학생 객체 생성
(id) => { ... } 함수 본문
this.setState({ selectedId: id }) 변경할 state 속성을 객체로 전달
students={this.state.students} JSX에서 JavaScript 값 사용
onSelect={this.handleSelectStudent} JSX에서 함수 객체 전달
onSelect={this.handleSelectStudent}
함수 자체를 전달하는 거야
students={this.state.students}
는 JavaScript 변수/속성의 값을 읽어 전달하니까 {}가 필요해.
{
여기서 {}는 JavaScript 객체를 만드는 중괄호야.
The effect of judges’ institutional interests on a free press
Test
il faut créditer le président Warsh d’avoir pris l’initiative d’une remise en cause audacieuse, assez peu courante dans le monde feutré des banques centrales, du consensus assez paresseux sur la politique monétaire, dont les fondements remontent aux années 1980, tenant lieu de doctrine et laissant les banques centrales assez mal préparées aux chocs économiques contemporains comme le montre par exemple la crise de 2008.
Il me semble qu'il y a une contradiction entre ce paragraphe et le précédent. - le précédent nous dit que Warsh veut retourner aux "fondamentaux" de la politique monétaire qui prévalaient entre les années 80 et 2008, effectivement très discrétionnaire (et refermer la parenthèse ouverte par Bernanke) ; - celui-ci nous dit que il remet en cause une politique monétaire dont les fondements remontent aux années 80 et qui avaient mal préparé les BC aux périodes de crise auxquelles elles ont été confrontées depuis 2008.
Personnellement, j'ai le sentiment que les initiatives de Warsh visent davantage l'héritage de l'ère Bernanke (la politique de communication, que Bernanke a fait évoluer dès son arrivée en 2006, et l'instrumentalisation du bilan par la suite) que l'héritage Volker+Greenspan même s'il veut actualiser ce dernier.
A VPN is an Internet security service that allows users to access the Internet as though they were connected to a private network. VPNs encrypt Internet communications as well as providing a strong degree of anonymity. VPNs are often used to allow remote employees to securely access corporate data. Meanwhile, individual users may choose to use VPNs in order to protect their privacy.
Definition of VPNs, and how they work-Use for assignment. Eddleman
A schematic is a graphical representation of a circuit and is very useful in visualizing the main features of a circuit. Schematics use standardized symbols to represent the components in a circuits and solid lines to represent the wires connecting the components.
Nice blurb for the vocabulary term "schematic." Cf., also, * From GIS professionals, What are schematics? * From scientific visualization professionals, Difference between pictorial and schematic diagrams
Note: This response was posted by the corresponding author to Review Commons. The content has not been altered except for formatting.
Learn more at Review Commons
Point 1. Cas-Tuner of Xist also represses Tsix (Supp Fig 3b). This was mentioned, but was not elaborated on in great detail. Was expression of the first exons of Tsix tested to see if this was simply transcriptional interference? If not, would this imply some more complex feedback?
*A central experiment in the manuscript is the observation that Xist knock-down leads to a reduction of H3K9me3 at the Xist locus, suggesting a functional role of Xist transcription in heterochromatin formation. As pointed out by the reviewer the knock-down strategy used resulted also in a reduction of Tsix, the antisense transcript of Xist. This is unlikely to reflect transcriptional interference between Xist and Tsix, because then a Xist knock-down should result in increased Tsix level, while we observe the opposite. It is more likely a direct effect of the CRISPRi system used for the knock-down, which recruits a repressor complex to the last exon of Tsix and might therefore interfere with proper termination or processing. *
Point 2. It was surprising that targeting an HDAC with Cas-Tuner leads to reduced K9me3, and transiently inducing Xist expression actually leads to increased silencing of that allele (Fig 3h). These were very exciting results. However, this seems inconsistent with the X-linked gene expression (supp 3d), where you would expect inverted expression patterns, but it's at 50%. What explains this? I know the authors mentioned the discrepancy between 1day vs 2 days of Dox induction, but nevertheless, I would have expected a stronger effect.
*In Fig. 3f-k and Suppl. Fig. 3d we show that transient Xist induction from one allele (B6) primes this allele to become the Xist-silent allele later on (Day 4). While we observed a clear skewing for Xist expression towards the Cast allele at day 4 (Fig. 3h), the effect on X-linked gene expression is much smaller and only observed for the 1 day Dox treatment (Suppl. Fig. 3d). We believe that two effects contribute to this difference: (1) Also Xist-negative cells, which are a considerable subpopulation (Fig. 3k), express the tested X-linked genes (50% Cast, 50% B6) and thus contribute to the pool of total RNA measured by pyrosequencing, while Xist is not expressed in these cells, resulting in a stronger skewing observed for Xist RNA levels. (2) X-linked gene silencing (and reactivation) occurs with a delay relative to changes in the Xist expression pattern, such that gene reactivation from the B6 allele might not yet be complete at day 4, in particular, in the 2-day Dox treated population, and silencing at the Cast allele might not yet be complete, resulting in a mixed / weak effect on X-linked gene expression. *
Point 3. Is it possible the ZFP proteins (281 and 36L1) are partially redundant? Moreover, could these be the mysterious targets of RNF12? I presume these are ideas that have occurred to the authors, and potentially want to save them for future studies?
We have performed a comparative analysis of how ZFP281, ZFP36L1 and RNF12 affect the genome-wide H3K9me3 distribution. This analysis revealed only a minor overlap of the affected regions beyond Xist, and thus suggested that the RNF12 does not function by targeting the ZFP proteins. This analysis also does not support the idea that the ZFP proteins exhibit redundant functions.
__Point 4. __The model in Figure 6 seems to hinge on transient silencing of RNF12. Could this be tested by inducible RNF12 expression?
In principle, this is an intriguing suggestion, which would address the question of how the Xist-transcription dependent H3K9me3 deposition and the RNF12 dependent reduction of the mark interact. However, manipulating RNF12 expression will also alter Xist transcription through the REX1 pathway, which is independent of the H3K9me3-effect, making it again difficult to disentangle the contributions of these two pathways.
Point 5. I enjoyed the discussion of possible mechanisms by which Tsix contributes to robust Xist silencing. I found both of them compelling, and I hope future work will test them!
We thank the reviewer for these encouraging words.
Minor Points
Point 6. Odd to introduce RITS concept from Pombe (page 11), where I believe has never been demonstrated in mice, with perhaps an exception being piRNAs in the male germline. In other words, this would be a huge paradigm shift. There is a study showing that dsRNAs from hypomethylated ESCs can form "endosiRNAs", but these are proposed to act post-transcriptionally. That's a long way of saying, it's probably best to remove it.
We will remove this notion from the revised version of the manuscript.
Point 7. Supp 5h: there does appear to be a subtle effect on exit of naive pluripotency in Zic3KD, even if at the edge of statistical significance. Text should be reworded. Also, Supp 5 appears cited in the following order: a, b, c, f, h, d, e (realizing they cite the whole figure in the beginning of the section, but this is not really standard practice).
*We agree with the suggested changes and will implement them in a revised version of the manuscript. *
Point 1. In Figure 3, is it possible that CasTuner-mediated recruitment of HDAC4 could change the spectrum of epigenetic modifications naturally found at RE57 -- is that a reason why H3K9me3 levels would change?
With the current data set we indeed cannot fully exclude that the CasTuner-mediated Xist knock-down might not affect H3K9me3 independently of Xist transcription. However, the fact that Xist overexpression can recruit H3K9me3 (Fig. 4e), makes it likely that the knock-down effect is also mediated by Xist-dependent H3K9me3 recruitment.
Point 2. Relatedly, in the experiment outlined in Figure 3F, can the authors explain how/why in the absence of doxcycline, the system results in a 50:50 ratio of Xist selection over the four day timecourse? I might have thought that Xist expression from the TetO-containing B6 allele would require dox to be expressed, and that in the absence of dox, expression from the Cast allele would dominate at Day 4. The results are striking but my concern is that they are being influenced by an unusual property of the TetO that is not related to natural regulation of Xist.
*In the TX1072 cell line used in this study, insertion of the Dox-inducible promoter does not prevent Xist upregulation in the absence of Doxycycline. In our Dox-inducible allele, which was originally generated by Anton Wutz in the Jaenisch lab (Wutz et al, Nat Gen, 2002), a TetO array is inserted directly upstream of the Xist TSS, leaving the core promoter and endogenous regulation largely intact. We have characterized the dynamics of random XCI (in the absence of Dox) in this line extensively in a previous publication (Pacini et al, Nat Comm, 2021). *
Point 3. Do the authors have access to a wild-type female B6/Cast ESC line? If so, the prediction based on the authors model would be that the B6 version of Xist is expressed more highly prior to differentiation, because in these hybrids, B6 is the allele that is typically inactivated after differentiation. Alternatively, if the Xist promoter has been substantially modified on the B6 allele in TX1072, can the authors perform a reciprocal Xist upregulation, by targeting a dCas9-activator to the wild-type Cast allele (which would presumably not upregulate Xist on the TetO-driven B6 allele)?
*The notion that differential timing of Xist upregulation might differ between mouse strains, which could then contribute to the often observed skewing in hybrid mice (e.g. in a B6xCast cross), is very interesting and would be worth following up in future studies. *
Reviewer 2, Point 4. Lastly, the authors show that Rnf12 deletion increases H3K9me3, but abolishes Xist expression. Am I correct to interpret that this result is the opposite of what would be predicted by the TetO and CasTuner experiments: the less Xist that is expressed, the lower the H3K9me3?
With the available data we cannot distinguish whether the RNF12- and the Xist-pathway are independent or in some way dependent on each other. This is technically difficult to disentangle because Rnf12 and Xist modulate each other.
Minor Points
Point 5. Am I correct in interpreting that TX1072 ESCs have a dox-inducible promoter driving Xist on the B6 allele? If so, for accuracy and ease of interpretation, the TetO should somehow be denoted in where X-B6 or Xist-B6 is shown in Figure 2, and this piece of information should be delivered when the TX1072 ESC line is first introduced in the manuscript.
The TX1072 ESCs indeed have a Dox-inducible promoter inserted upstream of the Xist TSS, which however does not affect the random choice of the active allele in the absence of Doxycycline.
Point 6. The clarity of the section describing the data in Figure 4 could be increased (modestly) if the title of the section and the figure were edited to distinguish the effects in undifferentiated cells from differentiated ones. The authors nicely show that Tsix transcription is not required for Xist-dependent H3K9me3 deposition at RE57 in undifferentiated cells, but is required for its maintenance in differentiated cells.
We will clarify this point in future versions of the manuscript.
Point 7. The data in Figure 5 are described in separate sections in the manuscript, entitled "Xist activator RNF12 counteracts heterochromatin formation at Xist" and "RNF12 regulates heterochromatin independently of REX1". This is within the authors discretion, but it may make sense from an organizational standpoint to split Figure 5 into two figures, to match with the way that the data are described in the manuscript. A split into two would also enable the supplemental data associated with Figure 5 to be shown in the main figure as well. As a final small suggestion for the authors, I might consider renaming the title of the final section to one that is more specific, such as "RNF12 counteracts heterochromatin at Xist and sites across the genome independently of REX1" etc. The term "regulates" does not indicate in what direction the primary regulation occurs.
*We will consider this suggestion for future versions of the manuscript. *
Point 1. The H3K9me3 CUT&Tag profiles presented in this manuscript appear substantially different from those reported by Almeida et al. (2026; PMID: 41957023). This difference may in part reflect the use of different H3K9me3 antibodies, however, this raises some concern regarding the specificity of the H3K9me3 profiling performed here. The authors should provide validation of the H3K9me3 antibody used in this study, e.g. by including the KMetStat panel in a suitable control line during CUT&Tag. Validation of the specificity of the H3K9me3 antibody used here would help facilitate the interpretation of the differences in H3K9me3 profiles reported in the two studies.
The H3K9me3 profiles along the Xist gene are indeed somewhat different between the two studies. In particular Almeida et al do not observe the H3K9me3 accumulation that we see at RE57 at the Xist promoter-proximal region, but instead a much broader domain that extends over the Xist gene body. This RE57-centric pattern is however also observed in ChIP-seq data from a different study (Bleckwehl et al, 2021, PMID: 34599190), which we had re-analyzed previously (Gjaltema et al, 2022). Nevertheless, we welcome the suggestion to verify antibody specificity.
Point 2. A limitation of Figures 3-5 is that the Xist, Tsix, and Rnf12 perturbation experiments appear to have been performed in bulk populations of hybrid XX cells undergoing random X-inactivation rather than the TX-Maged1-2tag fluorescent reporter system employed in Figure 2, which permits separation of cells according to which X chromosome is inactive. The experiments in Figures 3-5 use the CasTuner cell line, which is described as hybrid, but not indicated to be XX∆XIC-B6 (i.e. not undergoing biased X-inactivation) in the text or methods of the paper. Perturbations of Xist, Tsix, and Rnf12 could affect the active- and inactive-X chromosomes differently, whereas the bulk H3K9me3 CUT&Tag measurements in Figures 3-5 represent aggregate signal from both X chromosomes in a mixed population of cells that are undergoing random X-inactivation. Thus, a change in bulk H3K9me3 does not establish whether the change occurs specifically on the Xist-silent allele, the Xist-expressing allele, or both. Understanding the dynamics of H3K9me3 on both X chromosomes would help clarify the authors' proposed model, in which it is still unclear how H3K9me3 ultimately preferentially accumulates on the Xist-silent allele. Ideally, key perturbation experiments should be repeated in the TX-Maged1-2tag system to enable allele-specific quantification of changes to Xist expression and H3K9me3 accumulation on the active- vs. inactive-X chromosomes.
For example, in Figure 4H, Xist RNA expression is increased following Tsix knockdown during differentiation. Tsix is required for maintenance of Xist repression on the active-X chromosome (PMID: 25981039), therefore, the upregulation of Xist RNA could reflect a de-repression of Xist on the active-X. Ideally, the authors would quantify Xist expression from the active- vs. inactive-X chromosomes using allele-specific RNA-seq. As an alternative to allele-specific RNA-seq, the authors could determine whether Xist RNA upregulation following Tsix knockdown reflects increased expression of Xist from the active-X, inactive-X, or both, using allele-specific fluorescent in situ hybridization (FISH). However, discerning whether H3K9me3 changes on the active- vs. inactive-X upon Tsix knockdown is arguably more critical to the model, and would require use of the CasTuner system in the TX-Maged1-2tag fluorescent reporter line.
*While indeed the majority of experiments use bulk cell populations, we contend that it is still possible to draw conclusions about which allele is affected by a perturbation. In particular in those experiments where we observe a reduction of H3K9me3 (Xist-KD, Tsix-KD), we can attribute this to the Xist-silent allele, because we show in Fig. 2 that the mark is nearly exclusively present at that allele. *
Point 3. We suggest that the authors soften their description of H3K9me3 as having a role in the "initiation of X-inactivation". Conventionally, initiation of X-inactivation refers to the initiation and upregulation of Xist RNA expression, whereas the authors' data suggest that Xist transcription precedes and promotes H3K9me3 deposition at the Xist locus. The authors' findings therefore appear more directly relevant to the establishment of Xist allele-specific repression on the active-X, and perhaps more accurately the "establishment" of X-inactivation, rather than initiation of X-inactivation itself.
We will consider this suggestion in future versions of the manuscript.
Point 4. Figure 3K shows a strikingly low frequency of Xist-expressing cells at day 4 of differentiation in both the "no dox" and "dox" conditions. Approximately 50% of no dox cells and 25% of dox-treated cells show Xist RNA coating at day 4 of differentiation. These data, particularly the no dox condition, contrast with Figure 2, in which nearly 100% of WT XX cells exhibit Xist RNA coating at day 4 of differentiation. Can the authors clarify the reason for the notable difference in Xist induction efficiency between the control cells (WT XX and no-dox) shown in Figures 2 and 3? Presumably, the reduced number of Xist-expressing cells in the dox-treated condition reflect a higher proportion of cells in which both Xist loci were silenced by H3K9me3 accumulation through Xist overexpression. The authors can directly test this experimentally.
*In Fig. 2c the cells were sorted according to their Xist expression pattern, generating pure populations of Xist-positive cells. Therefore the Xist-positive fraction is much higher than in unsorted cells shown in Fig. 3k. The two experiments are actually very comparable when analyzing the unsorted cells (Supplementary Fig. 2f vs Fig. 3k). *
Note: This preprint has been reviewed by subject experts for Review Commons. Content has not been altered except for formatting.
Learn more at Review Commons
Summary Here, the authors investigate the role of tri-methylation at histone H3 lysine 9 (H3K9me3) in the regulation of Xist during the initiation and establishment of random X chromosome inactivation. Previous work from the authors (PMID: 34932975) identified a regulatory element within the first exon of Xist, termed RE57, that exhibits differential H3K9me3 levels in female cells harboring a single X chromosome (XO) relative to XX female cells during early differentiation. In addition, a CRISPR screen by the authors (PMID: 41053217) identified the H3K9 methyltransferase SETDB1 as a potential repressor of Xist RNA expression. Recent work (PMID: 41957023) further implicates SETDB1 in the accumulation of H3K9me3 across the Xist gene body during differentiation of XX female embryonic stem cells (ESCs) to neural progenitor cells (NPCs), potentially through an interaction between SETDB1, the HUSH complex, and the Xist RNA. Building on these observations, here, the authors examine the establishment and maintenance of H3K9me3 at the Xist promoter-proximal region and its relationship to Xist transcription and known regulators of X-inactivation.
Using hybrid XX ESCs to enable allele specific analyses, the authors showed that H3K9me3 preferentially accumulates in the RE57 region of the Xist allele of the active X chromosome (the "Xist-silent" allele) during the onset of random X-inactivation.  Knockdown of Xist using the CasTuner dCas9-HDAC4 fusion system in undifferentiated and differentiating XX and XO ESCs unexpectedly revealed that Xist transcription contributes to the accumulation of H3K9me3 at the RE57 region.  The authors further show that Xist-dependent H3K9me3 deposition at the RE57 region is independent of Tsix, although Tsix somewhat contributes to the maintenance of H3K9me3 during cellular differentiation.  Finally, the authors investigate the role of X-linked Xist activator RNF12 and show that loss of RNF12 promotes the accumulation of H3K9me3 at the RE57 region through a mechanism that they propose is independent of REX1 targeting.  From these findings, the authors propose a model in which transient Xist transcription promotes initial H3K9me3 deposition at the RE57 region of the future active-X, which is maintained in part by Tsix on the active-X and counteracted by RNF12 on the future inactive-X through an undefined mechanism.

These data are intriguing and provide evidence for a relationship between Xist transcription and H3K9me3 deposition at the RE57 region.  However, the mechanistic interpretation of these findings is limited by the use of bulk populations of cells undergoing random X-inactivation in many of the perturbation experiments, which makes it difficult to determine the consequences of altered Xist, Tsix, or Rnf12 expression on the active- vs. inactive-X chromosomes.  In addition, several aspects of the proposed temporal relationship between Xist transcription, H3K9me3 deposition, and subsequent Xist silencing remain unresolved - particularly how the Xist-expressing inactive-X avoids accumulation of and silencing by H3K9me3.
Major Points
The H3K9me3 CUT&Tag profiles presented in this manuscript appear substantially different from those reported by Almeida et al. (2026; PMID: 41957023). This difference may in part reflect the use of different H3K9me3 antibodies, however, this raises some concern regarding the specificity of the H3K9me3 profiling performed here. The authors should provide validation of the H3K9me3 antibody used in this study, e.g. by including the KMetStat panel in a suitable control line during CUT&Tag. Validation of the specificity of the H3K9me3 antibody used here would help facilitate the interpretation of the differences in H3K9me3 profiles reported in the two studies.
A limitation of Figures 3-5 is that the Xist, Tsix, and Rnf12 perturbation experiments appear to have been performed in bulk populations of hybrid XX cells undergoing random X-inactivation rather than the TX-Maged1-2tag fluorescent reporter system employed in Figure 2, which permits separation of cells according to which X chromosome is inactive. The experiments in Figures 3-5 use the CasTuner cell line, which is described as hybrid, but not indicated to be XX∆XIC-B6 (i.e. not undergoing biased X-inactivation) in the text or methods of the paper. Perturbations of Xist, Tsix, and Rnf12 could affect the active- and inactive-X chromosomes differently, whereas the bulk H3K9me3 CUT&Tag measurements in Figures 3-5 represent aggregate signal from both X chromosomes in a mixed population of cells that are undergoing random X-inactivation. Thus, a change in bulk H3K9me3 does not establish whether the change occurs specifically on the Xist-silent allele, the Xist-expressing allele, or both. Understanding the dynamics of H3K9me3 on both X chromosomes would help clarify the authors' proposed model, in which it is still unclear how H3K9me3 ultimately preferentially accumulates on the Xist-silent allele. Ideally, key perturbation experiments should be repeated in the TX-Maged1-2tag system to enable allele-specific quantification of changes to Xist expression and H3K9me3 accumulation on the active- vs. inactive-X chromosomes.
For example, in Figure 4H, Xist RNA expression is increased following Tsix knockdown during differentiation. Tsix is required for maintenance of Xist repression on the active-X chromosome (PMID: 25981039), therefore, the upregulation of Xist RNA could reflect a de-repression of Xist on the active-X. Ideally, the authors would quantify Xist expression from the active- vs. inactive-X chromosomes using allele-specific RNA-seq. As an alternative to allele-specific RNA-seq, the authors could determine whether Xist RNA upregulation following Tsix knockdown reflects increased expression of Xist from the active-X, inactive-X, or both, using allele-specific fluorescent in situ hybridization (FISH). However, discerning whether H3K9me3 changes on the active- vs. inactive-X upon Tsix knockdown is arguably more critical to the model, and would require use of the CasTuner system in the TX-Maged1-2tag fluorescent reporter line.
Minor Points
We suggest that the authors soften their description of H3K9me3 as having a role in the "initiation of X-inactivation". Conventionally, initiation of X-inactivation refers to the initiation and upregulation of Xist RNA expression, whereas the authors' data suggest that Xist transcription precedes and promotes H3K9me3 deposition at the Xist locus. The authors' findings therefore appear more directly relevant to the establishment of Xist allele-specific repression on the active-X, and perhaps more accurately the "establishment" of X-inactivation, rather than initiation of X-inactivation itself.
Figure 3K shows a strikingly low frequency of Xist-expressing cells at day 4 of differentiation in both the "no dox" and "dox" conditions. Approximately 50% of no dox cells and 25% of dox-treated cells show Xist RNA coating at day 4 of differentiation. These data, particularly the no dox condition, contrast with Figure 2, in which nearly 100% of WT XX cells exhibit Xist RNA coating at day 4 of differentiation. Can the authors clarify the reason for the notable difference in Xist induction efficiency between the control cells (WT XX and no-dox) shown in Figures 2 and 3? Presumably, the reduced number of Xist-expressing cells in the dox-treated condition reflect a higher proportion of cells in which both Xist loci were silenced by H3K9me3 accumulation through Xist overexpression. The authors can directly test this experimentally.
The manuscript seeks to address how one of the two X chromosomes in cells of eutherian females does NOT undergo X-inactivation. This is an important question to address, since it gets at the heart of how the two Xs become transcriptionally divergent despite sharing the same or similar sequences. The question, however, isn't adequately addressed via experimentation, as detailed above.
Note: This preprint has been reviewed by subject experts for Review Commons. Content has not been altered except for formatting.
Learn more at Review Commons
Summary
Kanata and collegues present an interesting follow-up of a study published by the Schulz lab in 2022, which discovered a domain of H3K9me3 and DNA methylation deposited on the Xist promoter during differentiation of mouse embryonic stem cells. Kanata et al. demonstrate in this manuscript that the H3K9me3 and DNA methylation modifications are deposited on the Xist allele that is ultimately silenced during differentiation. Intriguingly, they present results that suggest Xist overexpression from one allele increases H3K9me3 and DNA methylation and primes that allele to be selected for ultimate silencing. They further show in the final figures of the manuscript that Tsix modulates the levels of H3K9me3 in differentiated cells, and that Rnf12 has a REX1-independent role in reducing the accumulation of H3K9me3 surrounding the RE57 element.
Overall the study was well controlled, well written, and the conclusions were supported by the data. From a visual presentation standpoint, the Figures were exceptionally clear. I enjoyed reading the manuscript.
Major questions:
My main questions revolve around the somewhat non-intuitive observation that higher Xist expression prior to differentiation results in preferential silencing of the more highly expressed allele after differentiation. I am wondering if the authors can rule out that the relationship that they observe between higher Xist expression and higher H3K9me3 levels is a natural phenomenon and not due to genetic manipulation of the Xist locus? Asking because the key data suggesting the relationship were acquired using genetic modifications of the Xist locus (in Figure 4), whereas the data in Figure 5 (by my interpretation) suggest the opposite result, that the lower the levels of Xist, the higher the levels of H3K9me3.
1) In Figure 3, is it possible that CasTuner-mediated recruitment of HDAC4 could change the spectrum of epigentic modifications naturally found at RE57 -- is that a reason why H3K9me3 levels would change?
2) Relatedly, in the experiment outlined in Figure 3F, can the authors explain how/why in the absence of doxcycline, the system results in a 50:50 ratio of Xist selection over the four day timecourse? I might have thought that Xist expression from the TetO-containing B6 allele would require dox to be expressed, and that in the absence of dox, expression from the Cast allele would dominate at Day 4. The results are striking but my concern is that they are being influenced by an unusual property of the TetO that is not related to natural regulation of Xist.
3) Do the authors have access to a wild-type female B6/Cast ESC line? If so, the prediction based on the authors model would be that the B6 version of Xist is expressed more highly prior to differentiation, because in these hybrids, B6 is the allele that is typically inactivated after differnetiation. Alternatively, if the Xist promoter has been substantially modified on the B6 allele in TX1072, can the authors perform a reciprocal Xist upregulation, by targeting a dCas9-activator to the wild-type Cast allele (which would presumably not upregulate Xist on the TetO-driven B6 allele)?
4) Lastly, the authors show that Rnf12 deletion increases H3K9me3, but abolishes Xist expression. Am I correct to interpret that this result is the opposite of what would be predicted by the TetO and CasTuner experiments: the less Xist that is expressed, the lower the H3K9me3?
Minor comments:
5) Am I correct in interpeting that TX1072 ESCs have a dox-inducible promoter driving Xist on the B6 allele? If so, for accuracy and ease of interpretation, the TetO should somehow be denoted in where X-B6 or Xist-B6 is shown in Figure 2, and this peice of information should be delivered when the TX1072 ESC line is first introduced in the manuscript.
6) The clarity of the section describing the data in Figure 4 could be increased (modestly) if the title of the section and the figure were edited to distinguish the effects in undifferentiated cells from differentiated ones. The authors nicely show that Tsix transcription is not required for Xist-dependent H3K9me3 deposition at RE57 in undifferentiated cells, but is required for its maintenance in differentiated cells.
7) The data in Figure 5 are described in separate sections in the manuscript, entitled "Xist activator RNF12 counteracts heterochromatin formation at Xist" and "RNF12 regulates heterochromatin independently of REX1". This is within the authors discretion, but it may make sense from an organizational standpoint to split Figure 5 into two figures, to match with the way that the data are described in the manuscript. A split into two would also enable the supplemental data associated with Figure 5 to be shown in the main figure as well. As a final small suggestion for the authors, I might consider renaming the title of the final section to one that is more specific, such as "RNF12 counteracts heterochromatin at Xist and sites across the gennome independently of REX1" etc. The term "regulates" does not indicate in what direction the primary regulation occurs.
Significance
The significance of this work, in my opinion, is its investigation into the dynamics of H3K9me3 deposition surrounding Xist promoter following differentiation and the data showing that Rnf12 has an REX1-independent function in counteracting the deposition of H3K9me3 at Xist and at other sites across the genome. The putative link between Xist expression and H3K9me3 is intriguing, but as described above, I do not quite see how it is consisent between the data described in Figure 3 and the data described in Figure 5.
If clarity about the relationship between Xist expression and H3K9me3 deposition were obtained during revision, I would describe the study as providing a mechanistic advance that is important from a basic research standpoint.
Note: This preprint has been reviewed by subject experts for Review Commons. Content has not been altered except for formatting.
Learn more at Review Commons
In early mammalian development, the cells in female embryos silence one of their two X chromosomes in a random manner. After this initial choice, there is robust epigenetic memory, such that the silent X chromosome remains silent throughout life. There has been a decades-long intense effort to investigate this phenomenon, and a great deal is known about dynamics, mechanism and implications in development and disease. Nevertheless, one of the most interesting facets of this process-how this random choice is made to begin with-remains nebulous. In this study from Kanata and colleagues, they do not resolve this quandary, but they do make important insights. Briefly, X chromosome silencing requires the cis action of the non-coding RNA Xist. This RNA contains a regulatory region called RE57 (previously characterized by the lab) that becomes enriched for the heterochromatic mark H3K9me3, associated with the silent form of Xist. In other words, the H3K9me3 at RE57 is associated with the active X chromosome. Here, in a set of elegant genetic assays performed in mouse ESCs, the authors show that transient expression of Xist is counterintuitively required for deposition of H3K9me3. The well-characterized antagonist ncRNA of Xist, Tsix, is not required for this initial deposition, but instead helps maintain and reinforce the RE57 heterochromatin, which involves accumulation of DNA methylation. The authors then went on to investigate candidate trans regulators of Xist silencing. They made the novel finding that RNF12 counteracts H3K9me3 through an REX1-independent function, adding a new dimension to Xist regulation. While they did not show the mechanism, per se, this should be fodder for future studies.
Below are some questions and comments.
Cas-Tuner of Xist also represses Tsix (Supp Fig 3b). This was mentioned, but was not elaborated on in great detail. Was expression of the first exons of Tsix tested to see if this was simply transcriptional interference? If not, would this imply some more complex feedback?
It was surprising that targeting an HDAC with Cas-Tuner leads to reduced K9me3, and transiently inducing Xist expression actually leads to increased silencing of that allele (Fig 3h). These were very exciting results. However, this seems inconsistent with the X-linked gene expression (supp 3d), where you would expect inverted expression patterns, but it's at 50%. What explains this? I know the authors mentioned the discrepancy between 1day vs 2 days of Dox induction, but nevertheless, I would have expected a stronger effect.
Is it possible the ZFP proteins (281 and 36L1) are partially redundant? Moreover, could these be the mysterious targets of RNF12? I presume these are ideas that have occurred to the authors, and potentially want to save them for future studies?
-The model in Figure 6 seems to hinge on transient silencing of RNF12. Could this be tested by inducible RNF12 expression?
Minor
Odd to introduce RITS concept from Pombe (page 11), where I believe has never been demonstrated in mice, with perhaps an exception being piRNAs in the male germline. In other words, this would be a huge paradigm shift. There is a study showing that dsRNAs from hypomethylated ESCs can form "endosiRNAs", but these are proposed to act post-transcriptionally. That's a long way of saying, it's probably best to remove it.
Supp 5h: there does appear to be a subtle effect on exit of naive pluripotency in Zic3KD, even if at the edge of statstical significance. Text should be reworded. Also, Supp 5 appears cited in the following order: a, b, c, f, h, d, e (realizing they cite the whole figure in he beginning of the section, but this is not really standard practice).
All told, I found this to be a fantastically executed study. The authors made great use of a bevy of X-chromosome-specific genetic tools, as well as implementation of their Cas-Tuner system developed by the group. While the gene networks at play can be complex-as well as having to keep track of simultaneous, asymmetric regulation occurring on the two X homologs-the authors assist the reader with clear descriptions and helpful models throughout. I also appreciated the thoughtful discussion, drawing links with the biallelic Xist expression in mice with what is known in other mammals (humans and rabbits). Of course, the study begs the question: if Xist expression leads to K9me3 enrichment, how does the cell choose which allele to activate? But it was not trivial to reach this question, and I am excited for future work to unravel this conundrum.
2010 až 2015
2025
Náklady
Výdaje
13 %
14
snížil 19 %
snížil z
2023
dal bych 2025 a hodnotu 31 %
nákladů
výdajů
náklady
výdaje
přetíženo
nadměrně zatíženo
26 %
22?
Veřejné výdaje na bydlení se v letech 2010 až 2015 pohybovaly okolo 19 mld. Kč ročně, což činilo přibližně 0,35 % hrubého domácího produktu.
Nedávat kursivu...?
Rok 2025 s 30,4 tisíci dokončených bytů tak byl mírně pod tímto průměrem.
Rok 2025 s 33,4 tisíci dokončených bytů tak byl mírně nad tímto průměrem.
17 % domácností
Myslí se asi celkově (a ne jen ze seniorů), tak bych to upřesnil.
zhruba
téměř
podíl
v populaci
už druhým rokem roste
se v posledních třech letech zvýšil
Byldení
Opravit BYDLENÍ.
nájemnků
nájemníků
obydlených
"Počet obydlených bytů"
rostel
Roste nebo rostl.
Zaměřit se lze také na fyzickou dostupnost bytů. Tento indikátor sleduje počet bytů na 1000 obyvatel, případně i se zaměřením na obydlené byty. Zmínit lze také výstavbu. V jejím rámci sledujeme dokončené a zahájené byty v jednotlivých letech.
Když na to koukám, tak mi vlastně přijde kvalita bydlení něco dost jiného než fyzická dostupnost (i když vím, že to máme v jedné kapitole. Ale raději bych to tady více oddělil a nazval i tohle kapitolu "Kvalita bydlení a fyz, dostupnost".
Více než
Nechal bych jenom Desetina
téměr 40 %
36 %, I guess téměř 40, ale potom je tam přesné číslo
93 %
94 %
samoživitelů a samoživitelek
V předchozí větě se uvádí pouze "samoživotelů", a tady samoživitelé a samoživitelky. Možná ty věty propojit: "u této kategorie však došlo..."
mírně
"o něco hůře"
rychlejší
raději "znatelné" zlepšení?
avšak pouze 16 %
tohle může působit nepřesně, je to 16 % domácností celkem, ale asi 22 % domácností ve vlastním
tak
smazat
splátky
"případné"
bydlící
bydlících
bydlící
bydlících
senirských
seniorských
výrazně
Použil bych např. "významně". Slovo výrazně je totiž použito i v další větě.
družstvy
za družstvy čárku. Nejvíce domů, které jsou dnes vlastněné družstvy, pochází z 80. a 90. let 20. století,...
za posledních
smazat
bydlící
opravit na "bydlících"
bydlení
Na konci slova chybí m, opravit na "bydlením".
byddlením
Jsou tam dvě dd. Opravit na "bydlením".
V p
Doporučil bych dát 1 řádek pod grafem mezeru. I pak pod dalšími grafy níže.
snížil
Nahradit "vývoj .... se snížil".
Lépe asi: "... nebo se dostupnost zlepšila (Polsko)".
o 6,5 %
je to 6,5 p.b., ale 6 %, nahoře už je to v procentech, tak bych tady nedaval jine cislo, mozna ty posledni roky bych tady vlastne uz nekomentoval podruhe
Ukazuje
Ukazuje,
(Německo) nebo
vylučovací nebo, takže čárka?
A negation is the denial of a statement, which we indicate with the word not or a term that means the same thing.
What a negation is
Two simple statements joined by a connective to form a compound statement are known as a conjunction.
What a conjunction is
Remember that a statement (or claim) is an assertion that something is or is not the case. In other words, it is the kind of thing that can be either true or false. A simple statement is one that doesn’t contain any other statements as constituents. A compound statement is composed of at least two simple statements.
What a statement, a simple statement and a compound statement are
Here, we take up an exploration of propositional logic (or truth-functional logic)—the branch of deductive reasoning that deals with the logical relationships among statements.
What propositional logic is
eLife Assessment
This important study used several genome-wide approaches to compare dormancy in S. pombe spores and killifish diapause embryos. The findings include a trade-off between longevity and heat resistance in yeast spores and, in both these systems, a relatively higher expression of ribosomal-protein mRNAs but not proteins. While the evidence for the findings is overall solid, some interpretations should still be tempered. The large-scale datasets provide an excellent resource for future research in the dormancy field.
[Editors' note: this paper was reviewed by Review Commons.]
Reviewer #1 (Public review):
Summary:
In the manuscript entitled "Gene function and expression profiling in yeast spores, killifish diapause embryos, and their post-dormant offspring cells" the authors analyze dormancy at three levels: functional, transcriptomic and proteomic, using Schizosaccharomyces pombe spores, diapausing killifish embryos and human dormant cancer cells as models. The authors performed a genome-wide Bar-seq screen for gene deletions in fission yeast spores and then compared changes in mRNA and protein expression in young and old and heat-stressed cells in yeast and killifish. The main conclusions of the work include that dormancy is a dynamic not static state. The authors conclude that specific biological processes, rather than particular genes, are conserved across organisms during the dormancy, and that there is a clear disconnect between the mRNA and protein kinetics and behavior, particularly for ribosomal proteins and processes related to autophagy and mitochondrial metabolism.
In general, the manuscript is well structured and written, with carefully designed figures. The authors are also generally aware of the limitations of the work. The manuscript is interesting and valuable, but some interpretations should be moderated.
Major comments:
(1) The data presented provide in general good support for majority of conclusions presented in the manuscript. However, less support is provided for the theories that: there is a universal "core expression signature" of dormancy; the mRNA/ribosome protein uncoupling reflects a specific mechanism of preparation for exiting dormancy; and the observed changes provide evidence for an epigenetic "memory" of dormancy. These elements are currently more interpretive than evidentiary. I would recommend softening the language in these places and clearly labeling them as hypothetical.
(2) The authors propose that spores and post-dormancy cells retain a memory of time spent in dormancy or stress exposure. However, sporulation is also generally expected to reset or remove accumulated damage. Please clarify whether the observed long-term effects reflect classical "memory" of the cell, persistent regulatory state, or selection of cells with different fitness (carry-over effects). I would be careful in interpreting the effects as a form of memory associated mostly with epigenetic control - the statement seems stronger than what the data directly demonstrate.
(3) Validation of a small set of top hits by independent assays would substantially strengthen the conclusions. For example, targeted qPCR and/or biochemical assays for key genes (like ribosomal and autophagy) or pathways would help confirm the most important transcriptomic and proteomic trends. Without this, the suggestion of, for example, translational regulation remains possible but unproven.
(4) Overall, the study appears reproducible, with detailed methods, biological replicates, and appropriate statistical analyses. However, reproducibility could be improved by more clearly describing the limitations of the comparisons (especially with the published datasets) and the data-processing parameters, particularly for correlation and functional enrichment analyses. Some comparative conclusions are based on data from different studies, under different conditions and often with different depths of coverage. It is not always clear to what extent interspecies comparisons are fully methodologically similar.
Significance:
This is an ambitious work that combines a genetic screen with multi-omics analyses and cross-species comparisons. The novelty is less in known roles of autophagy, mitochondria and translation, but rather in integrating them into a comparative framework across S. pombe spores, killifish diapause embryos, and dormant human cancer cells, combined with Bar-seq screening and multi-omics. Its greatest strength is its coherent, broad concept: dormant cells are not passive, and the regulated processes and functions during dormancy are evolutionarily conserved rather than the individual set of genes. The contribution of this work lies more in demonstrating process-level conservation than in identifying a single universal gene. This significantly expands the literature on dormancy, but rather in terms of a framework of biological organization rather than a single mechanism.
The weakness of the manuscript is the tendency to draw broad, sometimes overly strong mechanistic conclusions based primarily on correlational data (sometimes with poor statistical significance) and on relative, rather than absolute, expression. The lack of biochemical validation, in my opinion, lowers the impact of the paper.
Audience: This work will be of interest especially to aging and dormancy specialists and comparative biologists. It is important to note that this is not a purely technical or model-specific work, but it has the potential to impact researchers interested in homeostasis, translation and adaptation to stress.
My expertise: My expertise is mostly in aging, sporulation, cell cycle control and ribosome biogenesis.
Reviewer #2 (Public review):
Summary:
In this manuscript, Hassan et al. examine dormancy in fission yeast spores and killifish embryos in diapause. The authors first performed a genetic screen in yeast spores to identify genetic modulators of spore longevity and resilience to heat stress, finding that there is a trade-off between stress resilience and longevity. Next, the authors performed transcriptomic and proteomic profiling of yeast spores and killifish diapause embryos, comparing active and dormant states, early and late dormancy, and with and without heat stress in each model. Comparison between the two models identified a shared set of gene expression changes in dormancy. Lastly, the authors tested whether stress in dormancy is able to reshape the transcriptome or proteome following exit from dormancy, finding that heat stress altered gene expression post-dormancy in both yeast spores and killifish diapause embryos.
This study is interesting because it provides valuable transcriptomic and proteomic datasets across a large number of conditions in both yeast spores and killifish embryos. Furthermore, these datasets reveal several interesting insights about dormancy, including shared gene expression changes in dormancy across diverse organisms, a trade-off between stress resilience and longevity in yeast spores, and memory of heat stress following exit from dormancy.
This interesting manuscript would be strengthened by additional characterization of the functional consequences of these gene expression changes.
Major comments:
(1) The finding that a set of gene expression changes in dormancy is shared between yeast spores and killifish diapause embryos is very interesting and raises the question of whether the genetic determinants of stress resilience or longevity in dormant states are also shared. For instance, do any genes identified in the genetic screen as critical for resilience to heat stress in yeast spores also show a similar phenotype in killifish diapause embryos?
(2) The authors show that gene expression changes in dormancy (old vs. young spores and late vs. early diapause) are poorly correlated with aging in stationary-phase yeast cells (Figure 4E) and killifish brain (Figure 5E). The authors suggest that this poor correlation might reflect a lack of aging during dormancy. Interestingly, the authors also show that in both yeast and killifish models, both time and stress in dormancy result in gene expression changes following exit from dormancy. Are these post-dormancy differences correlated with aging in stationary-phase yeast cells and adult killifish? Additionally, could the authors compare these changes with age-related changes in different adult killifish organs?
(3) In Figures 1C, 4F, and 5F, the authors find significant correlations between two comparisons with a shared condition (e.g. 2-week unstressed spores in Figure 4F). Using the same samples in both comparisons can inflate the correlation between the two sets of fold-changes because the two comparisons are not made independently. The authors should ensure that the correlations found in these figures remain significant even when different samples are used for the shared condition in the two comparisons.
Significance:
This study is interesting because it provides a comparison between different states of dormancy and identify shared pathways. This paper should appeal to a broad audience, including aging, stress pathways, and quiescence/dormancy.
Reviewer #3 (Public review):
Summary:
In this study, the authors use several genome-wide approaches to find commonalities and differences between distinct dormancy models, including S. pombe spores, killifish diapause embryos, and human dormant cancer cells. As G0 states are ubiquitous in nature, yet still understudied, this study provides not only a clear demonstration of an evolutionarily-conserved component in G0 regulation, but also a rich resource of genomics datasets, that will be especially of interest to S. pombe and killifish researchers.
The main conclusions of the study are that: (1) there are commonalities in dormancy programs across eukaryotic evolution; (2) the uncoupling between transcriptome and translatome is more pronounced in non-dividing cells, particularly at ribosomal protein coding genes; and (3) dormant cells retain dynamic responses to stress, changing their cellular state and maintaining this difference.
Overall, the study is clearly written, provides large data resources for future research in the dormancy field, and the conclusions are supported by the presented evidence (although point 3 would require further experimental clarification, see below).
Major comments:
A key consideration when comparing transcriptomes of cycling and dormant cells is the overall RNA quantity in the cells; however, it is not made clear in the manuscript whether this overall level was compared and/or if RNA-seq used spike-in quantification. However, this will directly affect some conclusions; for example, there is a conceptual difference between a transcript upregulated in spores and a transcript that appears upregulated in spores but is in fact 'less repressed than average' (resulting in higher FC). While the overall transcript diversity as described will be not affected, this analysis can provide important context. For the highlighted example of ribosomal protein mRNAs, this scenario could be what resulted in an apparent mRNA increase but protein decrease (which would be interpreted as both mRNA stabilization and translation inhibition); if the total mRNA is much lower, then the mRNA levels may be similar (which would then be interpreted as no change in transcription nor mRNA stability, but highlight the importance of translation inhibition).
This point was more clearly described in a previous seminal study by the authors (Marguerat et al 2012), and so should be made clearer here as well. What is the overall RNA level in cycling cells compared to quiescent cells, and compared to spores? Likewise, what is the overall reduction in total protein levels? Was the overall reduction comparable to the previous study? These overall levels should at least be quantified, which is a straight-forward experiment. The current mention of this limitation (two sentences in the last paragraph of the conclusion) is not enough.
Accordingly, the term "induced" (in Fig 2 for example) may be misleading, and could be separated into truly "induced" genes and "relatively induced" genes, when normalized to absolute levels. Likewise, Fig S2A and S2I are misleading due to this effect (normalization will tend to show a similar number of up-regulated and down-regulated genes). These panels should be clarified by plotting next to the relative quantification (current panels) a comparison taking overall RNA level into account. This will very likely strongly increase the number of downregulated genes and decrease the number of upregulated genes, and the new lists can also be subjected to GO analysis.
The same issue would be important to discuss for the killifish experiment as well.
For spore offspring stress experiments, the estimated number of cell divisions after spore germination should be indicated. It appears over 20, which would confirm the authors' conclusion that an epigenetic state is induced and persists over multiple rounds of replication and underlie improved heat resistance, indeed hinting at transcriptional memory through chromatin modification. As the phenotype is tested at a population-level, it is unclear whether every spore is equally able to impart this phenotype, and for how long the stress resistance response persists. Moreover, it may be clearer to test heat resistance in log-phase cells, as in the current experimental setup cells are grown to stationary-phase before plating; however, stationary-phase cultures are more heterogenous and more heat-resistant.
Note also that using 3-fold serial dilutions (instead of more commonly used 10-fold) means that the differences shown in Fig 3M are mild. Plating duplicates (at log-phase) and imaging at several times of growth would be necessary to have a clearer view of the result.
Significance:
Overall, the study provides a proof-of-concept that dormancy programs across vastly different eukaryotes display commonalities. This is not an entirely new concept, but this is the first demonstration of it using S. pombe and turquoise killifish and will therefore be of interest to a wide audience of researchers interested in quiescence and dormancy in general. A key finding (albeit also not entirely new) is the transcriptome/proteome difference, which appears increased in dormant cells; this hints at the existence of key post-transcriptional regulatory mechanisms in dormant and G0 cells.
A current key limitation is that only relative quantifications are discussed, which can currently give a misleading idea of overall transcriptional activity in dormant cells. Another limitation is that differentially-regulated genes, proteins and GO processes are mentioned, but with relatively limited biological interpretation, making some sections of the manuscript lengthy and descriptive.
Advance: The authors provide a vast amount of datasets for fission yeast spores (transcriptome, proteome, differential viability of a mutant collection) and killifish, which will be a very useful resource for researchers in the field. The authors identified several genes and processes that are commonly differentially regulated in dormant cells across several systems, including autophagy and ribosomal protein genes, which were previously known to be required for G0.
Reviewer #4 (Public review):
Summary:
This manuscript from Hassan et al presents a comparative study of the hallmarks of dormant cells in different systems. The authors first use a bar-coded knockout set to identify genes important for persistence of fission yeast spores in the dormant state (up to 6 months) and then use RNA seq and Mass spec to examine changes in transcript and protein abundance as fission yeast spores enter and exit dormancy. They then perform a similar transcriptomic and proteomic profile of Killifish embryos in diapause. The authors note certain functional classes of genes (e.g. autophagy-related genes or ribosomal proteins) that are similarly upregulated during dormancy in both systems and show that this applies in human dormant cancer cells as well. Importantly, this pattern applies to genes broadly in these functional classes, but not necessarily to any particular gene within the class. Finally, the authors examine the effects of stress (heat shock) on the transcriptomes and proteomes of young and aged spores as well as mitotic populations germinated from those spores.
Dormancy is relatively understudied at the cellular level and this study provides a number of potentially interesting observations, in particular the authors identify common features of dormancy-related expression changes in the different systems that may be a general hallmark of dormancy. Included in this is a fascinating disconnect between transcript and protein levels of ribosomal genes. That said, the work seems to be almost three different stories, none of which is entirely complete, and which only loosely fit together: (1) the identification of dormancy mutants in fission yeast; (2) comparative 'omics of dormancy in different systems; and (3) changes induced by stress in dormant cells.
Specific comments:
There is a dissonance between the apparent upregulation of autophagy genes during dormancy in both systems and the observation that loss of autophagy genes enhance dormancy. While the authors brush this off by noting "that genes regulated in a given cellular state often do not overlap with those functionally required for that state" (an argument that undermines their whole analysis), it raises the possibility that the process signatures they report are not, in fact, functionally linked to dormancy and could be coincidental. What would make the expression analysis more convincing would-be functional data showing that at least one of the upregulated genes in one of the systems is important for dormancy.
It is not clear how the bar-coding experiment was controlled for mutants that make defective spores (e.g. poor spore walls) rather than being required for dormancy per se. As the authors note, several of the mutants with the strongest effects (shortening lifespan of the spores) have been previously identified in screens for sporulation or spore wall defects, consistent with those genes playing a specific role in proper spore assembly rather than a general function in dormancy.
It would be helpful to make the data - or at least the lists of genes identified in the screen and the up and downregulated transcripts/proteins available as supplemental information.
There are at least two different points of diapause in Killifish. It was not entirely clear which diapause was analyzed here. This should be clarified.
The data that offspring from older or heat-shocked spores are more stress resistant (Figure 4M) is not convincing. Serial dilution assays as shown are more qualitative than quantitative and an actual quantitative measure (e.g. c.f.u.'s per cell plated) would be better and would allow statistical confidence to be calculated.
Significance:
This work provides a useful overview and comparison of gene expression changes occurring during dormancy in different systems. As this is a relatively understudied area the results are likely to be of great interest to researchers in this area. The primary weakness, as is often the case for systems studies, is that it provides a 'high level' view of changes, but it is unclear whether any of the specific changes documented are functionally relevant to dormancy.
I am a cell biologist and not qualified to critically assess the quality/appropriateness of the different statistical measures used to analyze their expression data.
Author response:
General Statements
We thank the four reviewers for their careful reading of the manuscript and for their constructive and insightful comments. Below, we outline the revisions we have already started or plan to make shortly in response to the reviewers' specific comments.
Description of the planned revisions
Reviewer #1:
In general, the manuscript is well structured and written, with carefully designed figures. The authors are also generally aware of the limitations of the work. The manuscript is interesting and valuable, but some interpretations should be moderated.
Major Comments:
(1) The data presented provide in general good support for majority of conclusions presented in the manuscript. However, less support is provided for the theories that: there is a universal "core expression signature" of dormancy; the mRNA/ribosome protein uncoupling reflects a specific mechanism of preparation for exiting dormancy; and the observed changes provide evidence for an epigenetic "memory" of dormancy. These elements are currently more interpretive than evidentiary. I would recommend softening the language in these places and clearly labeling them as hypothetical.
We agree, of course, that the core expression signatures determined for yeast, killifish and human may not extend to all other dormant states (and we do not call it universal in the manuscript). Also, the mechanistic nature of the ‘memory’ of dormancy is not known, and we have merely speculated on the possibility of an epigenetic memory for discussion, based on the known causes of similar phenomena. Similarly, we discussed plausible processes underlying the mRNA/ribosome protein uncoupling. We will make it clearer in the revised manuscript that these are only hypotheses at this point.
(2) The authors propose that spores and post-dormancy cells retain a memory of time spent in dormancy or stress exposure. However, sporulation is also generally expected to reset or remove accumulated damage. Please clarify whether the observed long-term effects reflect classical "memory" of the cell, persistent regulatory state, or selection of cells with different fitness (carry-over effects). I would be careful in interpreting the effects as a form of memory associated mostly with epigenetic control - the statement seems stronger than what the data directly demonstrate
Our experiments focus on spores (post-sporulation) and their offspring cells, so these findings have no bearing on any reset that may occur during earlier sporulation. It is extremely unlikely that the observed ‘memory’ effects reflect the selection of cells with different fitness, because we started with genetically identical cells, findings were repeated independent biological replicates, and our conditions (stress and prolonged time) maintained the viability of most cells. However, we certainly agree that our results do not establish a mechanism for the observed post-dormancy ‘memory’ effects. Again, we merely discussed the plausible possibility of an epigenetic memory and will provide more nuanced interpretations in the revised manuscript.
(3) Validation of a small set of top hits by independent assays would substantially strengthen the conclusions. For example, targeted qPCR and/or biochemical assays for key genes (like ribosomal and autophagy) or pathways would help confirm the most important transcriptomic and proteomic trends. Without this, the suggestion of, for example, translational regulation remains possible but unproven
For transcriptome and proteome studies using current, reliable methods, transcripts or proteins from specific genes are not typically validated, especially when studies focus on global patterns and functional enrichments rather than on any specific genes. General induction of autophagy-related genes at both the RNA and protein levels is unlikely to occur by chance, and autophagy genes have previously been shown to be induced under similar conditions, including in the transcriptomes of killifish diapause embryos (see Fig. S2H). However, we agree that validation of the unexpected regulation of ribosomal genes in diapause embryos would strengthen this conclusion. In spores, the effect is weaker and depends on the control sample used. We have begun qPCR and Western validation of ribosomal protein gene expression in killifish embryos to independently confirm the antagonistic changes in relative expression at the RNA and protein levels. We will incorporate these results in the revised manuscript.
(4) Overall, the study appears reproducible, with detailed methods, biological replicates, and appropriate statistical analyses. However, reproducibility could be improved by more clearly describing the limitations of the comparisons (especially with the published datasets) and the data-processing parameters, particularly for correlation and functional enrichment analyses. Some comparative conclusions are based on data from different studies, under different conditions and often with different depths of coverage. It is not always clear to what extent interspecies comparisons are fully methodologically similar
We used two strategies to minimise the limitations of comparing our RNA-seq data with a published RNA-seq dataset (human dormant cancer cells): first, we considered only genes that were detected in all datasets being compared, so that any differences in sequencing depth would not bias the comparison; second, we used relative expression values normalized to their respective controls instead of raw values, using identical cutoffs for all studies (fold-change >1.5x; FDR <0.05), to make the cross-study comparisons more consistent. We will further clarify this and its limitations in the Methods and Results. Notably, we observed significant functional enrichments shared across all three model systems, something one would not expect if the comparison were strongly affected by differences in the analyses. A strength of our study is that the RNA-seq datasets used to compare killifish and yeast were both generated in our laboratory under standardised conditions and processed through the same bioinformatics pipeline, thus enhancing comparability.
Minor Comments:
(1) Because the Bar-seq assay measures barcode abundance only after germination and regrowth, the phenotype may reflect not only spore survival but also germination efficiency and subsequent growth. Please discuss how the authors controlled for selection during regrowth and whether new mutations, clonal selection, or differences in ploidy could contribute to the observed effects.
We highlight in the manuscript that “Bar-seq quantification of deletion mutants was carried out after spore germination and regrowth. Therefore, the abundance of each barcode is a product of the combined influence of spore survival, germination efficiency and growth, which may affect stress- or lifespan-associated phenotypes for some mutants, a compromise necessary to prevent barcodes of dead spores from being sequenced.” To partially correct for this effect, we used conservative cutoffs and normalised all barcode abundances to the 2-week reference timepoint, so mutants that were already depleted early on due to poor germination or growth should not confound the longevity analysis. Similarly, the heat-shocked samples were compared to unstressed control samples, and any differences between the two samples should therefore reflect the effect of heat stress. All timepoints and pools were grown under consistent, uniform outgrowth conditions. We used two independent biological replicates and pooled samples, so any effects arising from extremely rare events, such as new mutations or diploidization, should be negligible. Moreover, our genome-wide screens focus on global functional enrichments rather than any specific mutants. We will describe this strategy in more detail in the Methods section.
(2) Please clarify whether spores were analyzed as pooled spores or after tetrad dissection, and how the authors ensured that colonies originated from single haploid spores rather than mixed events. Since ploidy can affect growth and lifespan, please indicate whether ploidy was checked in the recovered colonies or whether the experimental design excludes diploid formation during germination/regrowth.
As indicated in the scheme in Fig. 1A, meiosis was triggered by crossing a haploid h+ with a haploid h- colony to generate diploid cells that immediately sporulate, using a colonypicking robot. All cells that do not form haploid spores after this step are then killed by heat. This is the same principle as applied for genetic interaction screens using synthetic genetic arrays (SGA). Thus, the haploid spores in each colony resulted from a cross between cells of different mating types carrying an identical deletion mutant. For both the Bar-seq screen and expressionbased spore analyses, spores were analysed as pooled populations without tetrad dissection. Our results refer to the population rather than the single-cell level. Unlike budding yeast, fission yeast cells do not normally grow as diploids and will not mate in the medium used for germination and regrowth. Naturally occurring, vegetatively growing diploid cells in fission yeast are rare and unstable; they would be at an equal growth disadvantage during regrowth from all conditions tested, thus minimising the possibility of a systematic bias caused by diploidy. Accordingly, we did not directly check for ploidy. We will describe this experimental design in greater detail in the Methods.
(3) The cross-species GO enrichment analyses may be affected by differences in annotation quality and gene coverage, especially between yeast and killifish. Please clarify how gene duplication, paralogs and annotation redundancy were handled and whether the conclusions remain robust after accounting for GO term similarity or annotation bias.
Response: The handling of orthology, paralogs, and annotation differences between species is described in the Methods. Importantly, yeast and killifish genes, and their GO terms, were not directly compared but via their corresponding human orthologs and GO associations, as these mappings are most reliable and comprehensive. Orthology relationships between fission yeast and humans were obtained from a manually curated list in PomBase (Wood et al. 2019), compiled from various sources. In some cases, the consensus ortholog from the major ortholog predictors (Compara, Inparanoid, OrthoMCL) is used. Distant orthologs have also been identified by PSI-BLAST matches. Other ortholog predictions come from experimental data demonstrating functional correspondence or involving membership of corresponding complexes. These predictions are aligned and submitted to Pfam before inclusion. PomBase’s approach ensures that the breadth of coverage exceeds that of any individual prediction method and includes many ortholog calls that are not detected by any automated method. Killifish-to-human orthology was inferred from BLASTp-based mapping to the human UniProt reference proteome, with additional hidden orthologs identified using the spotted gar proteome (Kelmer Sacramento et al. 2020). Spotted gar is a fish whose lineage diverged from teleosts before their genome duplication, and it was therefore used as a bridge to identify hidden orthologs between teleosts and mammals. All paralogs were included to ensure comprehensive coverage, although some may have specialised roles.
Thus, all genes were mapped to their human orthologs and their GO associations, and genes commonly regulated were identified by filtering for significantly induced or repressed genes across all models, as indicated. This procedure circumvents the bias in GO term annotation between yeast and killifish. Naturally, given the relatively poor annotation of the killifish genome, such comparative analyses may miss some orthologs. Nevertheless, we observed significant functional enrichments shared across all three model systems, something one would not expect if the comparison were strongly affected by differences in annotation quality or gene coverage. We will highlight this information more clearly in the revised manuscript.
(4) Please discuss whether the age of the mother cells could influence spore quality, lifespan, or stress resilience. Did the authors control for mother-cell age? I would like to know about a possible impact on spore quality and subsequent lifespan.
Spores were always produced from freshly grown cells derived from frozen stocks, thereby controlling for any effects of cell age on spore quality and lifespan. Moreover, unlike budding yeast, fission yeast cells grow by symmetrical division, producing two daughter cells of equal size, so the concepts of mother cells and replicative ageing do not apply.
(5) It may be useful to briefly note how dormancy in plants differs from the fungal and animal systems studied here or to clarify that the present conclusions are limited to the models analyzed in this manuscript.
We agree that this is an interesting topic, e.g. plant seeds. However, given that dormancy is an understudied cell state, there is not enough solid information to make meaningful comparisons at this point. Moreover, any comparative review of what is known in plants is beyond the scope of our study. In the revised manuscript, we will clarify that our findings are naturally limited to the fungal and animal cells analysed in our study.
(6) Please briefly justify the choice of heat shock as the acute stress condition. It would also be helpful to comment on whether oxidative stress (for example, by incubation with H2O2) might reveal similar or distinct aspects of dormant-cell resilience.
Heat shock is a well-established stressor for yeast that elicits a conserved stress response and, most critically, avoids the spore wall permeability problem that complicates the interpretation of trials with chemical stressors. We have actually tried to stress spores with H2O2 at different doses, treatment times, and cell densities; under all tested conditions, spores maintained high viability similar to untreated spores, possibly due to their strong catalase activity (spore suspensions foamed after adding H2O2). Therefore, oxidative stress is not a suitable stressor for the resilient spores. In the revised manuscript, we will show these data in a supplement to justify the use of heat shock as an acute stress condition.
Reviewer #2:
This study is interesting because it provides valuable transcriptomic and proteomic datasets across a large number of conditions in both yeast spores and killifish embryos. Furthermore, these datasets reveal several interesting insights about dormancy, including shared gene expression changes in dormancy across diverse organisms, a trade-off between stress resilience and longevity in yeast spores, and memory of heat stress following exit from dormancy. This interesting manuscript would be strengthened by additional characterization of the functional consequences of these gene expression changes.
Major Comments:
(1) The finding that a set of gene expression changes in dormancy is shared between yeast spores and killifish diapause embryos is very interesting and raises the question of whether the genetic determinants of stress resilience or longevity in dormant states are also shared. For instance, do any genes identified in the genetic screen as critical for resilience to heat stress in yeast spores also show a similar phenotype in killifish diapause embryos?
We used the genome-wide deletion library in fission yeast to systematically screen for genes required for spore resilience and longevity. A comparably large-scale functional interrogation is not possible for killifish diapause embryos. Generating deletion-mutant lines for even a single gene in killifish is quite a lengthy and costly effort and would not be realistic within the scope of this work. However, we agree that an exciting direction for future studies is to assess what conserved genes contribute to dormancy function across species.
(2) The authors show that gene expression changes in dormancy (old vs. young spores and late vs. early diapause) are poorly correlated with aging in stationary-phase yeast cells (Figure 4E) and killifish brain (Figure 5E). The authors suggest that this poor correlation might reflect a lack of aging during dormancy. Interestingly, the authors also show that in both yeast and killifish models, both time and stress in dormancy result in gene expression changes following exit from dormancy. Are these post-dormancy differences correlated with aging in stationary-phase yeast cells and adult killifish? Additionally, could the authors compare these changes with age-related changes in different adult killifish organs?
We conducted these analyses and did not observe any positive correlation between post-dormancy gene expression changes in yeast offspring from old spores and gene expression changes in stationary-phase ageing cells; if anything, the gene expression signatures showed a slight inverse correlation (R = -0.05; p = 9e-04). For killifish, postdormancy expression changes in embryos from late diapause showed no significant correlations with age-related expression changes in adult brain (R = −0.04, p = 0.84), liver (R = −0.03, p = 0.39), or skin (R = −0.06, p = 0.19). Changes in expression in killifish late diapause compared to early diapause showed no significant correlation with age-related changes in expression in adult killifish liver (R = −0.008, p = 0.53), but did show a weak correlation with old skin (R = 0.18 , p <2e−16), specifically repression of collagen and extracellular matrix genes. We will include the latter analyses in the revised manuscript as supplemental panels.
(3) In Figures 1C, 4F, and 5F, the authors find significant correlations between two comparisons with a shared condition (e.g. 2-week unstressed spores in Figure 4F). Using the same samples in both comparisons can inflate the correlation between the two sets of fold-changes because the two comparisons are not made independently. The authors should ensure that the correlations found in these figures remain significant even when different samples are used for the shared condition in the two comparisons.
To address this issue, we re-ran the correlation analyses shown in Figs 1C, 4F and 5F using independent replicates for the shared condition (split-replicate analyses). For example, in Fig 4F, replicate A of the 2-week unstressed spores was used for the old-versus-young comparison, while replicate B was used for the heat-shock-versus-control comparison. For Fig 1C, using independent batches, the correlations remained significant (Batch A vs B: R = −0.16, p = 4.e−16; Batch B vs A: R = −0.27, p <2e−16). For Fig 4F, using independent replicates of the unstressed spores, the correlations remained significant across all replicate pairs (Rep 1 vs Rep 2: R = 0.18, p <2e−16; Rep 2 vs Rep 3: R = 0.14, p = 3e−12; Rep 2 vs Rep 1: R = 0.23, p <2e−16). For Fig 5F, the correlations were also robust across independent pairs (Pair 1: R = 0.15, p = 4e−10; Pair 2: R = 0.13, p = 3e−08; Pair 3: R = 0.16, p = 2e−11). These results show that the correlations are not an artefact of shared samples.
Minor Comments:
(4) In Figure 1, it could be informative to present data from intermediate timepoints (i.e., 1, 2, and 5 months). Do mutants that affect spore longevity show a progressive enrichment or depletion over time in dormancy, as depicted in the schematic in Figure 1A? Are there differences in kinetics across the different mutants?
We thank the reviewer for this suggestion. We will add line plots of the logCPM abundance of short-lived and long-lived mutants (relative to 2-week spore mutants) for all timepoints (2 weeks, 1, 2, 5 and 6 months) to Figure 1. The plots show that most short-lived mutants exhibit progressive depletion over time, while most long-lived mutants exhibit progressive enrichment.
(5) The authors focus on shared gene expression changes in dormancy between yeast spores, killifish diapause embryos, and dormant cancer cells. Are any pathways enriched among yeast-, killifish-, or human-specific changes?
We focused on pathways shared across species, but we have now also examined pathways enriched among genes that change specifically in each organism. Among the species-specific gene sets, only genes repressed in yeast spores were significantly enriched, with cytoplasmic translation being the most enriched process (p = 4e-11). The killifish- and human-specific gene sets were not significantly enriched for any functional terms. These results will be included as a supplementary figure.
Reviewer #3:
In this study, the authors use several genome-wide approaches to find commonalities and differences between distinct dormancy models, including S. pombe spores, killifish diapause embryos, and human dormant cancer cells. As G0 states are ubiquitous in nature, yet still understudied, this study provides not only a clear demonstration of an evolutionarily-conserved component in G0 regulation, but also a rich resource of genomics datasets, that will be especially of interest to S. pombe and killifish researchers.
The main conclusions of the study are that: (1) there are commonalities in dormancy programs across eukaryotic evolution; (2) the uncoupling between transcriptome and translatome is more pronounced in non-dividing cells, particularly at ribosomal protein coding genes; and (3) dormant cells retain dynamic responses to stress, changing their cellular state and maintaining this difference.
Overall, the study is clearly written, provides large data resources for future research in the dormancy field, and the conclusions are supported by the presented evidence (although point 3 would require further experimental clarification, see below).
Major Comments:
A key consideration when comparing transcriptomes of cycling and dormant cells is the overall RNA quantity in the cells; however, it is not made clear in the manuscript whether this overall level was compared and/or if RNA-seq used spike-in quantification. However, this will directly affect some conclusions; for example there is a conceptual difference between a transcript upregulated in spores and a transcript that appears upregulated in spores but is in fact 'less repressed than average' (resulting in higher FC). While the overall transcript diversity as described will be not affected, this analysis can provide important context. For the highlighted example of ribosomal protein mRNAs, this scenario could be what resulted in an apparent mRNA increase but protein decrease (which would be interpreted as both mRNA stabilization and translation inhibition); if the total mRNA is much lower, then the mRNA levels may be similar (which would then be interpreted as no change in transcription nor mRNA stability, but highlight the importance of translation inhibition). This point was more clearly described in a previous seminal study by the authors
(Marguerat et al 2012), and so should be made clearer here as well. What is the overall RNA level in cycling cells compared to quiescent cells, and compared to spores? Likewise, what is the overall reduction in total protein levels? Was the overall reduction comparable to the previous study? These overall levels should at least be quantified, which is a straightforward experiment. The current mention of this limitation (two sentences in the last paragraph of the conclusion) is not enough.
Accordingly, the term "induced" (in Fig 2 for example) may be misleading, and could be separated into truly "induced" genes and "relatively induced" genes, when normalized to absolute levels. Likewise, Fig S2A and S2I are misleading due to this effect (normalization will tend to show a similar number of up-regulated and down-regulated genes). These panels should be clarified by plotting next to the relative quantification (current panels) a comparison taking overall RNA level into account. This will very likely strongly increase the number of downregulated genes and decrease the number of upregulated genes, and the new lists can also be subjected to GO analysis.
The same issue would be important to discuss for the killifish experiment as well.
We acknowledge that the overall quantities of transcripts and proteins in proliferating cells versus those in different dormant cells are important considerations. As described in the Results and Methods, our study presents relative expression changes between dormant and proliferating cells. We highlight this limitation in the Conclusions: “As is the case for most expression studies, our transcriptome and proteome data reflect relative expression levels between two conditions. It is likely that the absolute cellular numbers of most transcripts and proteins are reduced in dormant cells, as they are in quiescent S. pombe cells (Marguerat et al. 2012). Thus, genes induced in dormant cells relative to active cells might be repressed in absolute levels, but to a lesser extent than most other genes.” We also make it clear in the concluding sentences for different sections that our data refer to relative changes (e.g., “Accordingly, several transcripts and proteins were differentially expressed in offspring from 5month-old spores relative to offspring from 2-week-old spores, including 199 mRNAs, 223 proteins, and 33 long non-coding RNAs”). We will carefully review the manuscript, including the Abstract and figures, to further clarify this point, e.g., by using "relatively induced" or “higher relative abundance”.
We would like to note, however, that relative quantification, normalised to average expression, focusing on genes that become more or less enriched relative to average genes in the condition of interest compared to a control condition, is a widely accepted and biologically meaningful approach for identifying expression signatures that specify the condition of interest. This is also the principle for qPCR and western analyses, where housekeeping gene normalisation is common. If the absolute expression of all or most genes decreases in dormant cells (which is likely), it would not be meaningful to determine functional enrichments among these genes. Relative expression data help distinguish groups of genes that increase or decrease more than most other genes, reflecting cellular regulation and functional signatures.
However, we fully agree that the overall quantities of transcripts and proteins in proliferating cells versus those in different dormant cells offer a complementary perspective. Therefore, we are quantifying the overall RNA and protein levels in yeast spores compared to proliferating cells as well as in killifish diapause embryos compared to actively developing embryos. If successful, these results will provide useful context for the relative expression data and will be included in the revised manuscript.
For spore offspring stress experiments, the estimated number of cell divisions after spore germination should be indicated. It appears over 20, which would confirm the authors' conclusion that an epigenetic state is induced and persists over multiple rounds of replication and underlie improved heat resistance, indeed hinting at transcriptional memory through chromatin modification. As the phenotype is tested at a population-level, it is unclear whether every spore is equally able to impart this phenotype, and for how long the stress resistance response persists. Moreover, it may be clearer to test heat resistance in log-phase cells, as in the current experimental setup cells are grown to stationary-phase before plating; however, stationary-phase cultures are more heterogenous and more heatresistant.
We agree, and several of these issues are already addressed in the manuscript. First, regarding the number of cell divisions, the offspring cells were obtained by germinating spores in rich medium and allowing them to grow to mid-exponential phase for approximately 6 generations, as described in the Results (p. 24). Second, for the log-phase testing, we state in the Methods (p. 43) that cultures were adjusted to OD600 = 0.2 and grown to OD600 = 0.6 before stress treatment and plating. Thus, all assays were in fact already performed on log-phase cells.
We will further emphasise these points in the revised manuscript.
Yes, our experiments were conducted at the cell population level, and we therefore cannot distinguish whether there is uniform transmission of the transcriptional and phenotypic legacy of dormancy across all germinating spores or whether single cells show heterogeneity within the population in this respect. While this is an interesting question, it would be too technically challenging and time-consuming to pursue this project within the framework of the current study.
Note also that using 3-fold serial dilutions (instead of more commonly used 10-fold) means that the differences shown in Fig 4M are mild. Plating duplicates (at log-phase) and imaging at several times of growth would be necessary to have a clearer view of the result.
We fully agree that the serial dilution assay for stress resistance should be improved given the subtle differences. We are repeating the spot assay with 10-fold serial dilutions as suggested, imaging plates at multiple time points, and including sufficient repeats to strengthen the confidence in this result.
Minor Comments:
One point for clarification in the introduction is that there is a scale difference between cellular dormancy (at the level of a cell) and organismal dormancy such as diapause (in which the dormancy qualifies the whole organism; typically this will involve slower metabolism, but not necessarily the arrest of the cell cycle for every cell in the organism). As diapause can take different forms depending on organism, detailing this process for the turquoise killifish model may clarify the phenotypic commonalities between these models. Indeed, as pointed out by the authors, several mutants show opposite effects for stationary phase viability and for dormant spore viability, highlighting the diversity of G0 states.
We agree that there may be a difference between cellular dormancy, in which individual cells arrest their cell cycle, and organismal dormancy, such as diapause, in which individual cells may differ in cell-cycle arrest. However, it has been shown in killifish that all cells throughout the diapause embryo exit the cell cycle and become quiescent (Dolfi et al. 2019), as may be expected given that these embryos can remain dormant for up to two years. We will highlight this aspect more clearly in the Introduction.
The title of the manuscript may gain from also mentioning some of the insights (instead of "Gene function and expression of X and Y", "Gene function and expression in X and Y shows Z").
We agree and will change the title to “Gene function and expression profiling in yeast spores, killifish diapause embryos, and their offspring cells reveal common regulatory features of dormancy
The Venn diagram in Fig 1D may not be the best way to represent the data; by definition, multiple overlaps here will be zero (between "long-lived spores" and "short-lived spores" and between "long-lived cells" and "short-lived cells"). A table or an upset plot may be useful there. Note that the gained space in Fig 1 may be used to provide examples of mutants in each GO category.
We agree and will replace the Venn diagram in Figure 1D with an UpSet plot, which better represents the overlapping and non-overlapping categories.
Reviewer #4:
Specific Comments:
There is a dissonance between the apparent upregulation of autophagy genes during dormancy in both systems and the observation that loss of autophagy genes enhance dormancy. While the authors brush this off by noting "that genes regulated in a given cellular state often do not overlap with those functionally required for that state" (an argument that undermines their whole analysis), it raises the possibility that the process signatures they report are not, in fact, functionally-linked to dormancy and could be coincidental. What would make the expression analysis more convincing would be functional data showing that at least one of the upregulated genes in one of the systems is important for dormancy.
We respectfully disagree with this assessment. Please note that this apparent paradox between autophagy gene regulation and spore phenotype is highlighted and discussed in the manuscript, and our data actually confirm the importance of autophagy in dormant spores when considered carefully. It is not correct to say that ‘loss of autophagy genes enhance dormancy’. Although autophagy mutants show increased lifespan, they also show decreased stress resiliency. Stress resilience is a key feature and purpose of dormancy, so the loss of autophagy function would clearly be a problem for dormant cells, consistent with the induction of autophagy genes in spores. The surprising trade-off between processes (including autophagy) that support spore longevity and those that support stress resilience is a key finding of our study.
Regarding the request for functional data linking at least one upregulated gene to dormancy, we note that we have already provided this at a scale far beyond a single gene. In fact, we identified as many as 600 genes that are differentially expressed in spores and, when deleted, cause spore phenotypes (altered stress resilience and/or lifespan). Moreover, the processes significantly enriched among these 600 genes, including protein translation, ribosomes, TCA cycle, and autophagy, are the same processes most enriched among the differentially expressed genes. This significant process-level convergence between functional and expression data provides compelling evidence that our expression signatures are not coincidental but largely reflect roles in dormancy.
It is not clear how the bar-coding experiment was controlled for mutants that make defective spores (eg poor spore walls) rather than being required for dormancy per se. As the authors note, several of the mutants with the strongest effects (shortening lifespan of the spores) have been previously identified in screens for sporulation or spore wall defects, consistent with those genes playing a specific role in proper spore assembly rather than a general function in dormancy.
The experimental design was carefully set up to avoid the contribution of mutants that do not sporulate or fail to produce mature spores. After sporulation, samples were heatshocked at 43°C for 3 days and stored in water for at least 2 weeks prior to starting the longevity assay. These conditions will kill any remaining vegetative cells; hence, only spores that can withstand these treatments will be included in the barcode measurements. All abundance values were also normalised to the abundance of each mutant that regrew after two weeks of spore ageing, so any differences in abundance should be caused by our conditions of interest. Thus, mutants with sporulation defects or that fail to form viable spores would be substantially depleted before this normalisation point and would therefore not be included in the subsequent analysis; if they were included, they should not show different abundances across our postsporulation conditions. Nevertheless, we cannot rule out that some of the short-lived mutants reflect problems during sporulation rather than spore traits, as suggested by overlaps with the published sporulation screen. However, this overlap is limited to a very few genes (among 416 short-lived spore mutants), as described in the Results.
In this context, we also comment on a broader issue known in the ageing field. Short-lived mutants are less likely to function in ageing-related processes than long-lived mutants, as any perturbation that compromises cell integrity or general fitness – including poor spore wall assembly – will compromise survival regardless of its specific relevance to dormancy regulation. Thus, the long-lived mutants in our screen are more revealing of ageing-related processes. We will clarify and better describe these perspectives in the revised manuscript.
It would be helpful to make the data - or at least the lists of genes identified in the screen and the up and downregulated transcripts/proteins available as supplemental information.
Please note that we provide extensive Supplemental Datasets S1 to S6 that include this very information in table form (genes identified in the Bar-seq screens, differentially expressed RNAs and proteins across the different conditions), along with additional useful data from our large-scale assays.
There are at least two different points of diapause in Killifish. It was not entirely clear which diapause was analyzed here. This should be clarified.
We described the Diapause II stage in the Introduction as the most prominent dormant state and commonly studied state in N. furzeri. In the Results (p. 12), we stated, “To uncover conserved aspects of dormant states between yeast and vertebrates, we analyzed the transcript and protein signatures of N. furzeri diapause II embryos, henceforth called diapause embryos,….”. We also mentioned Diapause II in the Methods.
The data that offspring from older or heat-shocked spores are more stress resistant (Figure 4M) is not convincing. Serial dilution assays as shown are more qualitative than quantitative and an actual quantitative measure (eg. c.f.u.'s per cell plated) would be better and would allow statistical confidence to be calculated.
Serial dilution assays are widely used and accepted to assess differences in stress resistance. The problem with CFUs is that they only determine the proportion of viable cells, while stress resistance also incorporates growth (e.g., stress-sensitive cells may survive the stress but grow more slowly in its presence). However, we agree that the current data in Fig. 4M are not convincing. We are repeating the spot assay with 10-fold serial dilutions, imaging plates at multiple time points, and including sufficient repeats to strengthen the confidence in this result. This is in response to a similar concern raised by Reviewer 3. We will also determine CFU counts, which would provide a more quantitative measure for statistical confidence, should the stress resistance be primarily reflected in cell viability. If necessary, for a more quantitative growth assay allowing statistical analysis, we may also analyse control and stressed cells growing in liquid cultures.
Description of the revisions that have already been incorporated in the transferred manuscript
We have started conducting additional experiments and making text changes to the manuscript, as described in the specific points above. At this stage, we do not provide a partially revised manuscript, but we will provide a fully revised one when everything is ready.
Description of analyses that authors prefer not to carry out
Reviewer 2:
Comment 1: The finding that a set of gene expression changes in dormancy is shared between yeast spores and killifish diapause embryos is very interesting and raises the question of whether the genetic determinants of stress resilience or longevity in dormant states are also shared. For instance, do any genes identified in the genetic screen as critical for resilience to heat stress in yeast spores also show a similar phenotype in killifish diapause embryos?
We used the genome-wide deletion library in fission yeast to systematically screen for genes required for spore resilience and longevity. A comparably large-scale functional interrogation is not possible for killifish diapause embryos. Generating deletion-mutant lines for even a single gene in killifish is quite a lengthy and costly effort and would not be realistic within the scope of a revision. However, we agree that an exciting direction for future studies is to assess what conserved genes contribute to dormancy function across species.
eLife Assessment
The results of this study are important and the approach to dissect the developmental contribution of RIF1 function is convincing. The results that suggest a possibly separate control of replication timing and gene expression are intriguing and represent a strong foundation for future research. The work will be of interest for researchers both in the transcription and the replication field, especially for scientists investigating the interplay between the two processes.
Reviewer #1 (Public review):
[Editors' note: this version has been assessed by the Reviewing Editor without further input from the original reviewers. The authors have addressed the comments raised in the previous round of review.]
The authors sought to determine how Rif1 contributes to DNA replication timing (RT), transcriptional regulation, and embryonic development using zebrafish. They generated a maternal-zygotic rif1 knockout line and examined developmental phenotypes, genome-wide replication timing profiles, RNA-seq, and nascent transcription (SLAM-seq) during early embryogenesis.
Their major findings in this manuscript are.
(1) Rif1 is not essential for zebrafish viability, unlike its partially essential role in mice.
(2) Rif1 deficiency causes defects in female sex determination, delayed epiboly, and reduced primitive erythropoiesis.
(3) Genome-wide RT is altered by Rif1, but developmental stage has a much larger influence than Rif1 itself.
(4) Rif1 is required for the proper maturation ("sharpening") of the RT program during development rather than for specific developmental RT switches.
(5) Rif1 has a much stronger effect on transcription during zygotic genome activation (ZGA) than on replication timing at these early stages.
(6) Loss of Rif1 leads to increased expression of early zygotic genes, indicating that Rif1 normally suppresses widespread transcription during ZGA.
Overall, the work proposes that Rif1 independently regulates replication timing and transcription, with these two functions becoming most prominent at different developmental stages.
The major strengths of the manuscript are as follows.
(1) the study combines multiple genome-wide approaches including whole-genome RT profiling, RNA-seq, SLAM-seq in combination with gene KO and developmental analyses.
(2) One of the strongest points is that the authors conducted the analyses at multiple developmental stages rather than a single point.
(3) The most important conclusion is that the Rif1 regulates transcription during development in a manner largely independent of its RT function, which was further strengthened by the additional data provided in the revised manuscript.
Comments on revised version:
The authors responded to my comments in a largely satisfactory manner. They have conducted additional analyses and concluded that Rif1 regulates transcription during ZGA largely independently of its classical RT function, which is an important finding.
Although authors did not examine origin firing and replication fork rate in rif1 KO cells, which I suggested in my original review, this can be saved for their future studies.
I think the revised manuscript has been improved and provides important basic information on the functions of the conserved Rif1 protein in RT and transcriptional regulation.
I have no further recommendation for additional experiments or data analyses.
Reviewer #2 (Public review):
This study by Masser et al. analyzes global replication timing and gene expression in rif-1 null zebrafish. This work is an extension of their previous report of the normal replication timing pattern during wild-type zebrafish development. The major valuable finding here is that Rif1 is not essential for viability in zebrafish, and - counter to expectation from studies in cultured cells and other species - late replication does not strongly depend on Rif1. Instead, the data suggest that Rif1 subtly sharpens replication timing pattern during normal development rather than function generally to delay replication timing. In the absence of Rif1, the normal pattern establishment is somewhat delayed. The authors also document some changes in expression during development with more genes being repressed by Rif1 than activated at some early stages.
The study and analysis are generally rigorous, and the conclusions are supported by convincing data. Given the strong link between replication timing and cell type/development, studying timing in a whole developing organism is important. The experimental approach is technically challenging, particularly the bioinformatic analysis. The scientific advance here is largely confined to documenting the timing of Rif1-affected transcription, the unanticipated effect of the rif1 deletion on replication timing and on sex determination, though the latter is not explored. The difference in timing of the transcription phenotypes and replication phenotypes suggests they may be very distinct Rif1 roles. The overall study a useful set of findings and detailed data for future work.
Loss of Rif1 did not affect viability, but it did strongly influence sex determination, resulting in a lower population of females. This effect is the strongest organismal phenotype, but the study provides no mechanistic explanation for the loss of females from the data gathered here.
Comments on revised version:
We are generally satisfied with the revised version of this manuscript.
Author response:
The following is the authors’ response to the previous reviews.
Public Reviews:
Reviewer #1 (Public review):
The authors sought to determine how Rif1 contributes to DNA replication timing (RT), transcriptional regulation, and embryonic development using zebrafish. They generated a maternal-zygotic rif1 knockout line and examined developmental phenotypes, genome-wide replication timing profiles, RNA-seq, and nascent transcription (SLAM-seq) during early embryogenesis.
Their major findings in this manuscript are
(1) Rif1 is not essential for zebrafish viability, unlike its partially essential role in mice.
(2) Rif1 deficiency causes defects in female sex determination, delayed epiboly, and reduced primitive erythropoiesis.
(3) Genome-wide RT is altered by Rif1, but developmental stage has a much larger influence than Rif1 itself.
(4) Rif1 is required for the proper maturation ("sharpening") of the RT program during development rather than for specific developmental RT switches.
(5) Rif1 has a much stronger effect on transcription during zygotic genome activation (ZGA) than on replication timing at these early stages.
(6) Loss of Rif1 leads to increased expression of early zygotic genes, indicating that Rif1 normally suppresses widespread transcription during ZGA.
Overall, the work proposes that Rif1 independently regulates replication timing and transcription, with these two functions becoming most prominent at different developmental stages.
The major strengths of the manuscript are as follows.
(1) the study combines multiple genome-wide approaches including whole-genome RT profiling, RNA-seq, SLAM-seq in combination with gene KO and developmental analyses.
(2) One of the strongest points is that the authors conducted the analyses at multiple developmental stages rather than a single point.
(3) The most important conclusion is that the Rif1 regulates transcription during development in a manner largely independent of its RT function, which was further strengthened by the additional data provided in the revised manuscript.
On the other hand, the weakness of the manuscript includes the followings.
(1) Limited mechanistic insight. The questions such as where Rif1 binds on the chromatin (in relation to the transcriptional promoters/ enhancers and replication origins).
(2) Which functional domains of RIf1 are involved in regulation of transcription and replication (Is PP1 recruitment required for transcription regulation?) are not addressed.
(3) Since Rif1 is known to be involved in chromatin organization/ nuclear architecture regulation, the studies addressing this (Hi-C, compartment analyses, ATAC seq etc) would provide important mechanistic information.
(4) Female sex determination phenotype is intriguing, but it remains largely descriptive, and its mechanisms are elusive at the moment.
Overall, the results support the authors' conclusions and they have successfully provided answers to the authors' original questions on developmental roles of Rif1 in RT and transcription in vertebrate.
Comments on revised version:
The authors responded to my comments in a largely satisfactory manner. They have conducted additional analyses and concluded that Rif1 regulates transcription during ZGA largely independently of its classical RT function, which is an important finding.
Although authors did not examine origin firing and replication fork rate in rif1 KO cells, which I suggested in my original review, this can be saved for their future studies.
I think the revised manuscript has been improved and provides important basic information on the functions of the conserved Rif1 protein in RT and transcriptional regulation.
I have no further recommendation for additional experiments or data analyses.
We thank the reviewers for their public evaluations of the manuscript.
Reviewer #2 (Public review):
This study by Masser et al. analyzes global replication timing and gene expression in rif-1 null zebrafish. This work is an extension of their previous report of the normal replication timing pattern during wild-type zebrafish development. The major valuable finding here is that Rif1 is not essential for viability in zebrafish, and - counter to expectation from studies in cultured cells and other species - late replication does not strongly depend on Rif1. Instead, the data suggest that Rif1 subtly sharpens replication timing pattern during normal development rather than function generally to delay replication timing. In the absence of Rif1, the normal pattern establishment is somewhat delayed. The authors also document some changes in expression during development with more genes being repressed by Rif1 than activated at some early stages.
The study and analysis are generally rigorous, and the conclusions are supported by convincing data. Given the strong link between replication timing and cell type/development, studying timing in a whole developing organism is important. The experimental approach is technically challenging, particularly the bioinformatic analysis. The scientific advance here is largely confined to documenting the timing of Rif1-affected transcription, the unanticipated effect of the rif1 deletion on replication timing and on sex determination, though the latter is not explored. The difference in timing of the transcription phenotypes and replication phenotypes suggests they may be very distinct Rif1 roles. The overall study a useful set of findings and detailed data for future work.
Loss of Rif1 did not affect viability, but it did strongly influence sex determination, resulting in a lower population of females. This effect is the strongest organismal phenotype, but the study provides no mechanistic explanation for the loss of females from the data gathered here.
Comments on revised version:
We are generally satisfied with the revised version of this manuscript.
We thank the reviewers for their public evaluations of the manuscript.
test
Denial of the Metaxy (The In-Between)
metaxy—a participatory, tensional middle ground between finite humanity and the transcendent divine. Hegel's system collapses this gap, pretending that human reason can fully comprehend and absorb the divine
https://www.google.com/search?q=what+did+Eric+Voegelin+objected+to+in+Hegel%27s+Philosophy
q8_ter
cacher
pas deux
manque "aux"
eLife Assessment
This important study explores the function of SIRT2 in inhibiting Japanese encephalitis virus infection and disease progression in rodent models. The findings presented are novel as sirtuins are known for their roles in aging, metabolism, and cell survival, but have not been studied in the context of viral infections until recently. The evidence supporting the claims is solid and reveals a mechanism for SIRT2 in modulating acetylated NF-kB transcription factor levels and additional inflammatory response mediators. The work will be of interest to biologists studying viruses, sirtuins, and inflammation.
Reviewer #1 (Public review):
Summary:
Desingu et al. show that JEV infection reduces SIRT2 expression. Upon JEV infection, 10-day old SIRT2 KO mice showed increased viral titer, more severe clinical outcomes, and reduced survival. Conversely SIRT2 overexpression reduced viral titer, clinical outcomes and improved survival. Transcriptional profiling show dysregulation of NF-KB and expression of inflammatory cytokines. Pharmacological NF-KB inhibition reduced viral titer. The authors conclude that SIRT2 is a regulator of JEV infection.
Strengths:
This paper is novel because sirtuins have been primarily studied for aging, metabolism, stem cells/regeneration. Their role in infection has not been explored until recently. Indeed, Barthez et al. showed that SIRT2 protects aged mice from SARS-CoV-2 infection (Barthez, Cell Reports 2025). Therefore, this is a timely and novel research topic. Mechanistically, the authors showed that SIRT2 suppresses the NF-KB pathway. Interesting, SIRT2 has also been shown recently to suppress other major inflammatory pathways, such as cGAS-STING (Barthez, Cell Reports 2025) and the NLRP3 inflammasome (He, Cell Metabolism 2020; Luo, Cell Reports 2019). Together, these findings support the emerging concept that SIRT2 is a master regulator of inflammation.
Comments on revised version.
The authors have addressed my comments.
Reviewer #2 (Public review):
The manuscript by Desingu et al., explores the role of SIRT2 in regulating Japanese Encephalitis Virus (JEV) replication and disease progression in rodent models. Using both an in vitro and an in vivo approach, the authors demonstrate that JEV infection leads to decreased SIRT2 expression, which they hypothesize is exploited by JEV for viral replication. To test this hypothesis, the authors utilize SIRT2 inhibition (via AGK2 or genetic knockout) and demonstrate that it leads to increased viral load and worsens clinical outcomes in JEV-infected mice. Conversely, SIRT2 overexpression via an AAV delivery system reduces viral replication and improves survival among infected mice. The study proposes a mechanism in which SIRT2 suppresses JEV-induced autophagy and inflammation by deacetylating NF-κB, thereby reducing Beclin-1 expression (an NF-κB-dependent gene) and autophagy, which the authors consider a pathway that JEV exploits for replication. Transcriptomic analysis further supports that SIRT2 deficiency leads to NF-κB-driven cytokine hyperactivation. Additionally, pharmacological inhibition of NF-κB using Bay 11 (an IKK inhibitor) results in reduced viral load and improved clinical pathology in WT and SIRT2 KO mice. Overall, the findings from Desingu et al. are generally supported by the data and suggest that targeting SIRT2 may serve as a promising therapeutic approach for JEV infection and potentially other RNA viruses that SIRT2 helps control.
Comments on revised version.
We believe the authors of Desingu et al. have adequately addressed the major concerns of each reviewer. Thus, we believe the current version of the manuscript is significantly improved, and the data more strongly support the authors' conclusions.
We would like to point out that the statistics in Figure 8 are difficult to interpret and should be improved to make them useful to the reader and strengthen the paper. Also, line 70 has an extra period that should be removed.
Author response:
The following is the authors’ response to the original reviews.
Public Reviews:
Reviewer #1 (Public review):
Summary:
Desingu et al. show that JEV infection reduces SIRT2 expression. Upon JEV infection, 10-day-old SIRT2 KO mice showed increased viral titer, more severe clinical outcomes, and reduced survival. Conversely, SIRT2 overexpression reduced viral titer, clinical outcomes, and improved survival. Transcriptional profiling shows dysregulation of NF-KB and expression of inflammatory cytokines. Pharmacological NF-KB inhibition reduced viral titer. The authors conclude that SIRT2 is a regulator of JEV infection.
This paper is novel because sirtuins have been primarily studied for aging, metabolism, stem cells/regeneration. Their role in infection has not been explored until recently. Indeed, Barthez et al. showed that SIRT2 protects aged mice from SARS-CoV-2 infection (Barthez, Cell Reports 2025). Therefore, this is a timely and novel research topic. Mechanistically, the authors showed that SIRT2 suppresses the NF-KB pathway. Interestingly, SIRT2 has also been shown recently to suppress other major inflammatory pathways, such as cGAS-STING (Barthez, Cell Reports 2025) and the NLRP3 inflammasome (He, Cell Metabolism 2020; Luo, Cell Reports 2019). Together, these findings support the emerging concept that SIRT2 is a master regulator of inflammation.
We thank the reviewer for his/her valuable time, clear summary, and critical comments on the work.
Weaknesses:
(1) Figures 2 and 3. Although SIRT2 KO mice showed increased viral titer, more severe clinical outcomes, and reduced survival upon JEV infection, the difference is modest because even WT mice exhibited very severe disease at this viral dose. The authors should perform the experiment using a sub-lethal viral dose for WT mice, to allow the assessment of increased clinical outcomes and reduced survival in KO mice.
We thank the reviewer for the valuable recommendation. We conducted an experiment using a sub-lethal viral dose of 5 × 10^2 PFU in 14-day-old wild-type (WT) and SIRT2 knockout (KO) mice to evaluate clinical outcomes. Our findings showed a significant reduction in survival rates among the SIRT2-KO mice compared to the wild-type mice (Figure 2O).
(2) Figure 5K-N, the authors examined the expression of inflammatory cytokines in WT and SIRT2 KO cells upon JEV infection, in line with the dysregulation of NF-kB. It has been shown recently that SIRT2 also regulates the cGAS-STING pathway (Barthez, Cell Reports 2025) and the NLRP3 inflammasome (He, Cell Metabolism 2020; Luo, Cell Reports 2019). Do you also observe increased IFNb, IL1b, and IL18 in SIRT2 KO cells upon JEV infection? This may indicate that SIRT2 regulates systemic inflammatory responses and represents a potent protection upon viral infection. This is particularly important because in Figure 7F, the authors showed that SIRT2 overexpression reduced viral load even when NF-KB is inhibited, suggesting that NF-KB is not the only mediator of SIRT2 to suppress viral infection.
We agree with the suggestion made by the reviewers. We have quantified the transcript levels of IFNb, IL1b, and IL18 and found that the expression of these genes was increased in JEV-infected SIRT2-KO mice compared to wild-type mice (Figure S5D-S5F). Additionally, we acknowledge the reviewers' comments regarding the role of SIRT2 in regulating systemic inflammatory responses and its significant protective effect against viral infections. Furthermore, NF-κB is not the only mediator involved in SIRT2's suppression of viral infections; other molecular mechanisms may also contribute to this process.
Reviewer #2 (Public review):
The manuscript by Desingu et al., explores the role of SIRT2 in regulating Japanese Encephalitis Virus (JEV) replication and disease progression in rodent models. Using both an in vitro and an in vivo approach, the authors demonstrate that JEV infection leads to decreased SIRT2 expression, which they hypothesize is exploited by JEV for viral replication. To test this hypothesis, the authors utilize SIRT2 inhibition (via AGK2 or genetic knockout) and demonstrate that it leads to increased viral load and worsens clinical outcomes in JEV-infected mice. Conversely, SIRT2 overexpression via an AAV delivery system reduces viral replication and improves survival among infected mice. The study proposes a mechanism in which SIRT2 suppresses JEV-induced autophagy and inflammation by deacetylating NF-κB, thereby reducing Beclin-1 expression (an NF-κB-dependent gene) and autophagy, which the authors consider a pathway that JEV exploits for replication. Transcriptomic analysis further supports that SIRT2 deficiency leads to NF-κB-driven cytokine hyperactivation. Additionally, pharmacological inhibition of NF-κB using Bay 11 (an IKK inhibitor) results in reduced viral load and improved clinical pathology in WT and SIRT2 KO mice. Overall, the findings from Desingu et al. are generally supported by the data and suggest that targeting SIRT2 may serve as a promising therapeutic approach for JEV infection and potentially other RNA viruses that SIRT2 helps control. However, the paper does fall short in some areas. Please see below for our comments to help improve the paper.
We thank the reviewer's valuable recommendation. We measured NF-kB acetylation in JEV-infected Neuro-2a cells treated with Ad-null or Ad-SIRT2. Our findings show that levels of NF-kB acetylation and JEV-NS5 were reduced in the SIRT2-overexpressing cells (Figure S6).
We conducted an experiment using a sub-lethal viral dose of 5 × 10^2 PFU in 14-day-old wild-type (WT) and SIRT2 knockout (KO) mice to evaluate clinical outcomes. Our findings showed a significant reduction in survival rates among the SIRT2-KO mice compared to the wild-type mice (Figure 2O).
Recommendations for the authors:
Reviewer #1 (Recommendations for the authors):
In Figures 5C-F, the text is very small.
Thanks for raising this point. We have increased the text size in the revised Figures 5C-F
Reviewer #2 (Recommendations for the authors):
Major concerns:
(1) Line 71: The introduction does not adequately cite existing work demonstrating the role of SIRT2 in viral infections, including other RNA viruses. It would be more effective to summarize the current literature (similar to lines 162-165) rather than stating that the role of SIRT2 in RNA virus infection is largely unknown.
We thank the reviewer for the valuable suggestion to improve the manuscript substantially. We have cited existing work demonstrating the role of SIRT2 in viral infections, including other RNA viruses, in the introduction, as suggested.
(2) Figure 1C: The image should be quantified to state that the observation is statistically significant.
Thank you for the valuable suggestion. We have quantified the proteins SIRT2, LC3 I, LC3 II, p62, and Beclin in Mock- and JEV-infected Neuro-2a cells, as well as in mouse brain Western blots. These results, along with representative blots (Figure 6I-6J) and n-number-related blots, are presented graphically along with p-values in supplementary figures 7A-7B. Our analysis indicates that these proteins are expressed at statistically significant levels.
(3) Figure 1I: What tissue is 1I? not stated in the manuscript text or the figure legend.
Thank you for pointing that out. These samples are from mouse brains. We have included this information in both the text and the figure legend of the revised manuscript.
(4) Figure 2A: How does Sirt2 expression in WT-infected cells compare to the levels observed in the KD? Are they at comparable levels?
Thank you for highlighting an important point. We used control siRNA to compare SIRT2 knockdown in SIRT2-siRNA-treated cells in JEV infection. In Figure 2A, “control siRNA” was labelled as “control.” In the revised Figure 2A, we updated this to read “control siRNA.”
(5) Figure 2L-N: Clinical outcome comparing WT and SIRT2KO mice, JEV-infected mice seems modest. Can statistical analysis be performed to determine whether the results are statistically significant?
We agree with the suggestion. Clinical signs (Figure 2L) and paralysis (Figure 2M) onset were earlier in SIRT2-KO mice compared to WT mice, and the survival curve (Figure 2N) shows statistical significance. We conducted an experiment using a sub-lethal viral dose of 5 × 10^2 PFU in 14-day-old wild-type (WT) and SIRT2 knockout (KO) mice to evaluate clinical outcomes. Our findings showed a significant reduction in survival rates among the SIRT2-KO mice compared to the wild-type mice (Figure 2O).
(6) Figure 3: AGK2 can also inhibit other Sirtuins. Thus, to test the contribution of other Sirtuins, the experiment could be repeated using wild-type and Sirt2 KO mice.
We agree with the suggestion. We repeated the experiment using wild-type and SIRT2-KO mice and found that the differences in survival rates were statistically insignificant between JEV-infected wild-type mice treated with AGK2 and JEV-infected SIRT2-KO mice treated with AGK2 (Figure 3K).
(7) Figure 5: A-B: Clearly label diagrams and explain what is being compared. G-I: Please annotate genes in the heat maps and volcano plots.
Thank you for pointing out an important aspect. The figures include several genes that may not be easily visible at readable levels in the main figure. To address this, we have enlarged the figures and labelled them with the gene names in a clearer format, as shown in the supplementary Figures S2-S4. Additionally, we have updated the figure legend for Figure 5 to include this information.
(8) Line 230-232: "Taken together, these findings reveal that JEV infection negatively regulates SIRT2 levels, resulting in a concomitant increase in acetylated NF-κB mediated virus replication". Data does not support this statement. The experiments presented do not demonstrate that acetylated NF-kB mediates viral replication. In fact, it would be good to measure NF-kB acetylation in AdSIRT2 JEV-infected cells compared to WT-infected cells, to verify that the acetylation of NF-kB is truly linked to SIRT2 expression levels.
We thank the reviewer for his/her valuable recommendation. We measured NF-kB acetylation in JEV-infected Neuro-2a cells treated with Ad-null or Ad-SIRT2. Our findings show that levels of NF-kB acetylation and JEV-NS5 were reduced in the SIRT2-overexpressing cells (Figure S6).
(9) Figure 6E: The Graph is hard to interpret. It is also missing a figure legend/key, and also a misplaced A in the image.
Thank you for highlighting an important point. We have highlighted NF-κB and other colour representations in the signalling network graph (Figure 6E). We revised the figure legend for clarity and removed the misplaced "A" from the figure.
(10) Line 260-261: "These results indicate that SIRT2 regulates JEV replication through the NF-κB-beclin-autophagy axis.". Data does not support this statement.
We modified the statement as follows: “These results suggest that SIRT2 regulates JEV replication through the NF-κB-autophagy axis.
(11) Line 270: Do the authors mean decrease? Bay 11 is an NF-κB inhibitor.
We agree with the suggestion. This is a typographical error. We have replaced “increase” with “decrease” in the revised manuscript.
(12) Figure 8: The phenotype seems modest. Have the authors considered that Sirt2 may regulate JEV via other acylation targets?
We agree with the reviewers' suggestion. NF-κB is not the only mediator involved in SIRT2's suppression of viral infections; other molecular mechanisms may also contribute to this process.
eLife Assessment
The characterization of a dissociable Mediator subunit implicated in cellular pathways, particularly lung alveolar function and HIV latency, would be conceptually interesting. The authors have preliminary evidence for a Med16 subcomplex that may regulate specific genes. This work is useful in that it points to interactions between Med16 and UBP1, but the evidence is somewhat preliminary and incomplete.
Reviewer #1 (Public review):
This work reports the finding of a dissociable human Mediator complex subunit, MED16, and its recruitment of transcription factors UBP1 and TFCP2 that form a trimeric complex regulating cellular gene transcription and inhibiting HIV promoter activity, thus promoting MED16-targeting inhibitors as HIV latency-reversing agents for anti-HIV therapy. In this revision, the authors provide new data indicating that MED16 action occurs in the holo-Mediator complex, not as a free form, for its functional association with UBP1 and TFCP2.
Summary:
Characterization of a dissociable Mediator subunit implicated in cellular pathways, particularly lung alveolar function, and HIV latency is conceptually interesting.
Strengths:
The strengths of this study are:
(1) Demonstration of MED16 dissociation from the core Mediator complex and formation of a subcomplex containing MED16, upstream-binding protein 1 (UBP1), and transcription factor cellular promoter 2 (TFCP2) by elegant biochemical fractionation and immunoblotting analysis.
(2) Defining nine N-terminal WD-40 repeats (WDRs) of MED16 as a Mediator-incorporating module and the C-terminal ⍺β-domain (157 amino acids) important for interaction with the UBP1-TFCP2 heterodimeric complex.
(3) Illustration of a weak hydrophobic interaction between MED16 and the Mediator core that could be disrupted by 1,6-hexanediol, but not by its 2,5-hexanediol isomer nor by high salt (500 mM NaCl) disruption.
(4) Classification of UBP1-upregulated cellular genes typically containing binding sites flanking the transcription start site (TSS) in contrast to UBP1-downregulated genes often containing a TSS-overlapping UBP1-binding site;
(5) Presenting evidence for Mediator complex-dissociated free MED16-repressed HIV promoter activity through functional association with UBP1 and showing bromodomain-containing protein 4 (BRD4) inhibitor JQ1 that potentially disrupts BRD4-inhibited HIV-1 transcription elongation could lead to reversal of HIV-1 latency.
Weaknesses:
(1) No clear demonstration that MED16-UBP1-TFCP2 indeed form a trimeric core subcomplex in regulating cellular gene transcription and HIV-1 promoter inhibition.
(2) No validation of transcriptomic datasets and pathways identified.
(3) Use of mostly artificial reporter gene constructs and non-HIV host cells (e.g., human 293T embryotic kidney cells, human HeLa cervical cancer cells, and mouse HT pancreatic cancer cells) for examining MED16/UBP1-regulated HIV transcription.
(4) Inconsistent use of 293T and HeLa cells in the characterization of dissociated MED16 interaction with UBP1 and TFCP2.
(5) In vitro transcription using immobilized DNA templates was not performed to a high standard thus failing to convincingly show MED16/UBP1-inhibited HIV-1 transcription preinitiation complex formation.
In this revision, the authors stipulate that the action of MED16-UBP1-TFCP2 is through the holo-Mediator complex, not as a free trimeric complex, since deletion of the N-terminal Mediator-incorporating module abolishes the functional effect of MED16 even though its interaction with UBP1-TFCP2 persists. The authors also show that a predicted UBP1-binding site is indeed present in the promoter region not overlapping with the TSS in each of the UBP1/MED16-upregulated respiratory gaseous exchange genes, such as surfactant protein A1 (SFTPA1), SFTPA2, SFTPB and SFTPC. To demonstrate UBP1/MED16-inhibited HIV transcription in a more biologically relevant system, the authors employ an HIV-1 latency model derived from CD4+ T cells. Additional experiments are also performed to address other issues raised by the reviewers.
Overall, the revised manuscript has been improved by addressing some of the reviewer's comments. Additional issues that came up while reading this revision are: a) The statement, "UBP1 (as known as LBP-1) and TFCP2 (as known as LSF) belong to a subfamily of the TFCP2/Grainyhead transcription factor family" (lines 63-64), is confusing and needs to be clarified. My understanding is that LBP-1 has four family members encoded by two different genes (see Yoon et al., MCB 14: 1776-1785, 1994): LBP-1a and LBP-1b are probably UBP1, and LBP-1c and LBP-1d are likely TFCP2/LSF. If this is correct, the authors should clearly indicate which specific isoforms are analyzed in their UBP1 and TFCP2 proteins and clarify some of the text descriptions seemingly contradictory to the earlier findings.
The use of mostly artificial reporter templates and transfection assays conducted mostly in 293T and HeLa cells remains concerning. It is also unclear why overexpression of MED16 only, but not MED23 or MED24, inhibits HIV promoter activity (Figure 5) if MED16 action is through the holo-Mediator complex and overexpression of MED16 may titrate out key cellular factors, thus diminishing their action through holo-Mediator. Results based on this squelching type of experiment relying on overexpression of a single component needs to be carefully interpreted.
Reviewer #2 (Public review):
Summary:
The article from Zheng et al. proposes that the Med16 subunit of Mediator can dissociate from the complex, associate with transcription factor UBP1, and contribute to activation or repression of specific sets of genes in human cells. The question is potentially interesting, and the possibility of a distinct role for Med16 in UBP1-dependent transcription could be of interest to the field. However, I have substantial concerns about the experimental design, reproducibility, and interpretation of the data. In particular, several of the central conclusions rely on single experiments, indirect assays, or perturbations that are expected to cause broader changes in Mediator structure and transcription. In my view, the current data therefore do not provide sufficient evidence to support several of the principal mechanistic conclusions of the manuscript.
Strengths:
The authors provide preliminary evidence that Med16 may exist in an altered or partially dissociated Mediator complex and may be associated with specific transcriptional effects. The use of biochemical assays, reporter assays, RNA-seq, and Med16 knockout/rescue experiments provides several potentially useful approaches to investigating this question. In particular, the Med16 knockout/rescue RNA-seq experiment described in the rebuttal is a potentially informative experiment. Making the underlying IP-MS abundance and peptide-count data available is also an improvement over the previous version.
However, important limitations of these experiments need to be addressed before the proposed mechanism can be established.
Comments on the revised version:
In the previous review, I raised concerns that the evidence for a specific UBP1-Med16 interaction and for a mechanistic role of this interaction was limited. The revised manuscript does not resolve these concerns. In particular, whether UBP1 interacts specifically with Med16, whether this interaction is required for activation of UBP1 target genes, and whether UBP1 represses HIV-1 transcription through Med16 remain unresolved.
A stronger case for a specific UBP1-Med16 interaction would require more direct biochemical, structural, or biophysical evidence. The current experiments do not distinguish sufficiently between a specific Med16-dependent mechanism and broader consequences of perturbing Mediator structure or transcription.
The revision also does not include the additional biological replicates needed to assess the reproducibility of several foundational experiments. Consequently, a number of the central conclusions remain based on single experiments, which substantially limits the strength of the conclusions that can be drawn.
Major concerns:
Figure 1:
All of the data in Figure 1 are from single experiments without biological replicates. Because Figure 1 provides an important foundation for the proposed mechanism, this limits confidence in the reproducibility of the observations. Western blot experiments can show substantial experiment-to-experiment variability, and such variability appears relevant to several of the observations presented here.
A key experiment is the western blot analysis of the gel-filtration experiment in Figure 1D. Rather than migrating with Mediator, the majority of the detected Med16 appears to elute at a lower molecular weight. The extract was maintained at super-physiological salt concentrations from preparation through column loading and elution, which could potentially contribute to this result. Other possibilities include experiment-to-experiment variation or detection of a cross-reacting protein by the Med16 antibody. The latter possibility warrants consideration because the bands detected in fractions 28-31 appear to migrate at a different molecular weight from the Med16 bands in fractions 16-19. Additional replicated experiments and appropriate controls would be needed to establish that the lower-molecular-weight signal represents Med16 in a distinct complex.
Figure 2:
The data in Figure 2 are also based on single experiments without biological replicates. The biochemical experiments use protein fragments that do not occur as such in the native protein. Such experiments can be useful for mapping possible protein-protein interaction surfaces, but they can also generate false-positive or false-negative interactions depending on the experimental configuration.
Some of the results raise additional questions about the proposed interaction model. For example, the observations involving TFCP2 in panel B and Med1 and Med23 in panel F appear difficult to reconcile with a simple model in which UBP1 interacts with Mediator through Med16. Panel 2F is particularly relevant because Med1 and Med23 are not detected despite the proposed model involving UBP1 interaction with Mediator. These observations should be addressed when interpreting the specificity and mechanism of the proposed UBP1-Med16 interaction.
Figure 3:
The reporter assays provide potentially useful preliminary evidence for factors that influence transcription. However, the relatively long experimental timeframes (36-48 hours after transfection), use of artificial promoters, and overexpression of proteins introduce important limitations.
The data are consistent with the authors' model, but they are also consistent with a simpler explanation in which Med16 depletion broadly affects Mediator structure and function. Previous work from the Gross, Robert, and Roeder laboratories has shown that loss of Med16 can result in dissociation of Med23, Med24, and Med25 from Mediator. Importantly, the authors' own data in the rebuttal document appear to show similar effects following Med16 loss. These observations are important because Med23, Med24, and Med25 provide major interfaces for DNA-binding transcription factors, and Med16, Med23, Med24, and Med25 together represent a substantial fraction of the molecular mass of Mediator. The functional properties and stability of the resulting Mediator complex therefore need to be considered when interpreting Med16 depletion experiments.
The authors' data also suggest broader transcriptional effects: Med16 knockout causes loss of basal transcription in panel 3E. Conversely, overexpression of Med16 or Med16 fragments can cause broad defects in transcriptional activation, including through squelching. The relatively modest effects observed despite substantial increases in protein abundance are therefore also consistent with non-specific consequences of overexpression. These alternative explanations need to be considered when interpreting the reporter assays.
Figure 4:
RNA-seq is an appropriate approach for investigating possible effects of Med16 on gene expression. However, the experimental design has important limitations because Med16 depletion is expected to affect the composition of Mediator, including loss of Med23, Med24, and Med25. The knockdown also occurs over an extended timeframe (>24 hours), making it difficult to distinguish direct effects of Med16 from secondary effects arising from altered Mediator structure or broader changes in transcription.
The RNA-seq results could therefore reflect Med16-specific functions, but they are also consistent with a model in which loss of Med16 compromises Mediator structure and function and produces downstream gene-expression changes.
The presentation of the RNA-seq data in Figure 4E is also difficult to interpret. The volcano plot shows UBP1 overexpression versus the shCTRL vector, whereas the comparison central to the authors' interpretation concerns the effects of shMed16. Showing the volcano plot for the shMed16 comparison would allow readers to assess the statistical significance and magnitude of the relevant gene-expression changes directly. Instead, the authors superimpose "x" symbols for genes that "failed to be activated by UBP1 in the shMed16 cell line." Because the underlying Med16 comparison is not displayed, the p-values and fold changes for the comparison of interest cannot be evaluated. Moreover, positioning the "x" symbols according to the coordinates of the UBP1-overexpression volcano plot does not appear to represent their corresponding positions in a volcano plot of the Med16 comparison. This makes the figure difficult to interpret and could give a misleading visual impression of the underlying data.
Finally, the RNA-seq data are not spike-in normalized. This is potentially important because Med16 depletion is expected to cause broad effects on transcription and could result in an overall reduction in transcription across the genome. Appropriate normalization is therefore important for distinguishing gene-specific effects from global changes. I also did not identify information in the manuscript indicating where the RNA-seq data have been deposited in a public repository.
Figure 5:
The reporter assays in Figure 5 are subject to similar concerns. The authors' model may explain the observations, but the data are also consistent with broader disruption of Mediator structure and function following Med16 depletion, or with more general transcriptional effects caused by overexpression of Med16 or Med16 fragments.
A separate concern is the proposed mechanism for HIV-1 repression. The authors propose that UBP1 interacts with Med16/Mediator and that overexpression of Med16 enhances Mediator recruitment, although Mediator recruitment is not directly measured. The proposed increase in Mediator recruitment would, in isolation, be expected to promote transcription rather than repression. The authors instead invoke a UBP1-dependent mechanism to explain the repression. However, a simpler explanation is that overexpression of Med16 or selected Med16 fragments perturbs normal transcription through mechanisms including squelching. The authors themselves invoke a Med16 squelching model to explain reduced transcription at the UBP1 reporter in Figure 3G-I. The possibility that the same mechanism contributes to the results in Figure 5 should therefore be addressed.
Finally, a central component of the proposed model is recruitment of Mediator by UBP1 through Med16, but neither UBP1 occupancy nor Mediator occupancy at the relevant promoters is directly measured. These experiments would provide important evidence for the proposed mechanism. There is also no legend for Figure 5G,H, and the legend for Figure 5C,D appears to be incorrect.
Figure 6:
The title of Figure 6 states that "The position of the UBP1 binding site relative to the TSS dictates whether MED16-UBP1 activates or represses transcription." The data presented do not establish this conclusion.
Only one alternative location of the UBP1 binding site is tested, and the analysis in panel D compares only the 50 most up- or down-regulated genes in UBP1-overexpression experiments. The correlations shown are relatively weak, and a rigorous statistical analysis is not presented.
The authors cite Duttke et al. (Nature 2024) in support of the concept that transcription-factor position can influence regulatory activity. That study used genome-wide mapping of native TSSs, MPRA analysis of approximately 2,000 promoter variants, and targeted follow-up experiments. By contrast, Figure 6 relies on an artificial reporter and a single change in UBP1 binding-site position. The current data therefore support the possibility that binding-site position influences the observed reporter activity, but they do not establish the broader conclusion that the position of the UBP1 binding site relative to the TSS dictates whether Med16-UBP1 activates or represses transcription.
Figure 7:
The title of Figure 7 states that Med16 "interferes with HIV-1 PIC assembly," but the data presented do not establish this mechanism.
First, the proposed mechanism is described as acting through interaction with UBP1, but UBP1 is not measured in this experiment.
Second, Med16 knockout or overexpression has relatively modest effects on the estimated levels of bound PIC components, and these changes do not consistently correspond to the transcriptional changes shown in panel C. For example, in the WT versus Med16 KO comparison, there is no apparent difference in the levels of Pol II, Med1, IIB, or IIH based on the western blot data. The reduction in Med16 and Med23 is expected following Med16 knockout and therefore does not by itself establish altered PIC assembly. In the WT versus Med16 overexpression comparison, panel C suggests a meaningful reduction in transcription, whereas the changes in PIC-associated proteins do not follow the direction predicted by the proposed model: Pol II and IIB increase with Med16 overexpression, while Med1, Med23, Med16, and IIH appear similar.
Third, Cdk8 and Med12 are not PIC components. They are subunits of the CDK8 module, which can inhibit PIC formation. Even under a simplified interpretation in which reduced Cdk8 and Med12 levels were relevant to PIC formation, the direction of these changes is opposite to that expected from the "relative mRNA level" plots in panel C. Reduced levels of these proteins in the Med16 overexpression condition would, under this interpretation, be expected to promote rather than reduce transcription.
Finally, this is a single-replicate experiment, and quantitative comparisons are made across immobilized-template pulldowns using different nuclear extracts (WT, Med16 KO, and Med16 OE). Differences in protein concentration between extracts, differences in pulldown efficiency, and experiment-to-experiment variation could all contribute to the observed differences. Replicated experiments with appropriate normalization would therefore be needed to support the proposed PIC mechanism.
Figure 8:
Panel F presents a model that, in my view, goes beyond what is supported by the experimental data. In particular, there is currently insufficient evidence to establish the proposed Med16-UBP1-TFCP2 complex as a distinct functional complex.
The model also depicts the Mediator CDK8 module bound at promoters together with Pol II. The manuscript does not provide evidence supporting this arrangement, and there is substantial prior evidence that the CDK8 module can inhibit or prevent PIC formation. This aspect of the model therefore requires either experimental support or clarification.
Finally, the model depicts a separate Med16-UBP1-TFCP2 complex. This appears inconsistent with the authors' statements in the rebuttal that they did not intend to propose such an unsupported isolated complex. If this is not the intended model, Figure 8 should be revised to avoid conveying that interpretation.
Figure S1: IP-MS analysis:
The IP-MS data raise substantial concerns regarding the specificity of the proposed UBP1-Med16 interaction.
The authors state that they "have now reanalyzed the IP-MS data using a more precise quantification approach." However, the filtering procedure described in the Methods is difficult to evaluate and requires substantially more justification. The procedure includes multiple sequential criteria: detection in at least two of three replicates of the target bait; a minimum unique peptide count; detection in at least one additional Mediator bait; exclusion of Mediator/Pol II subunits, ribosomal proteins, histones, keratins, and common contaminants; and annotation with transcriptional or DNA-binding functions using GO terms. The rationale for this particular combination of filters and its impact on the candidate list should be explained and justified.
The resulting "bait-preferential score" is also difficult to assess. The reported mean_target and mean_other values are frequently negative, with some positive values, and the method appears to derive a positive score from the difference between these values after taking an absolute value. The biological and statistical interpretation of this score is therefore unclear. The reported scores are generally clustered around relatively narrow values, and the analysis does not appear to provide the statistical framework normally used to assess enrichment and reproducibility in IP-MS experiments.
Importantly, the candidate proteins identified by this approach do not appear to overlap with proteins identified in other published Med16 IP-MS analyses in human cell lines, including HCT116, MCF7, HEK293T, and HeLa. I was unable to identify a protein among the 37 Med16 candidates that was consistently observed in the cited resources, including BioPlex (Huttlin et al., Cell 2021) and Malovannaya et al. (Cell 2011). This lack of concordance raises questions about the specificity and physiological relevance of the proposed Med16-associated proteins and, in particular, about the evidence for a specific UBP1-Med16 interaction.
The peptide counts for UBP1 also illustrate the limitation of the current analysis. The total UBP1 peptide counts across the Cdk8, Med1, and Med16 IP-MS experiments are 12, 10, and 14, respectively, yielding bait-preferential scores of 1.07, 0.76, and 1.85. Given these relatively small differences and the absence of statistical significance measures, it is difficult to determine whether these observations provide evidence for a specific biological interaction.
The authors have now made the raw abundance values and peptide counts available as supplementary tables, which is useful. However, standard statistical measures for evaluating MS data, including FDR, p-values, and adjusted p-values, are not provided, nor is sufficient information given about how the reported scores were calculated. These additions would be important for readers to assess the robustness of the conclusions.
Concerns about the rebuttal document:
Several statements in the rebuttal appear inconsistent with the data shown in the revised manuscript or with the interpretation of the authors' own experiments. I highlight specific examples below.
(1) The proposed Med16-UBP1 complex:
I previously raised concerns that the manuscript overstated the evidence for a separate Med16 complex associated with UBP1 and lacked rigorous biochemical characterization of such a complex. The authors responded that the wording of the original manuscript may have created this interpretation and stated that this was not the mechanistic model they intended to convey. However, Figure 8 of the revised manuscript still depicts a separate Med16-UBP1-TFCP2 complex. The figure therefore appears to retain the interpretation that the authors stated they did not intend to convey. This should be clarified.
(2) Replication and experimental rigor:
I previously raised concerns about the absence of replication and the limitations of the experimental approaches used to infer roles for Med16 and UBP1. These concerns remain because no additional replicate experiments were performed for several of the key experiments. As a result, important conclusions continue to depend on single western blots, including foundational experiments in Figures 1, 2, and 7.<br /> Examples include the variable quantification in Figure 1A; the absence of detectable Med23 and Med1 in the UBP1 IP in Figure 2F despite the proposed interaction between UBP1 and Mediator; and the variable association of TFCP2 with Flag-MED16 fragments in Figure 2B, including lanes 7-9. Replication would be important for determining whether these observations are reproducible.
(3) IP-MS analysis:
The revised IP-MS analysis provides additional information compared with the previous version, but important concerns remain regarding the processing and interpretation of the data. The "bait-preferential score" approach is not sufficiently justified, and standard measures such as p-values, adjusted p-values, or FDR are not provided.
The analysis also identifies no proteins among the 37 Med16 candidates that appear to be consistently observed in other published Med16 IP-MS analyses in human cell lines. This is important when assessing the specificity of the proposed interaction.
The peptide counts for UBP1 are similarly low and do not show a clear Med16-specific enrichment: 12 peptides in the Cdk8 IP, 10 in the Med1 IP, and 14 in the Med16 IP, corresponding to scores of 1.07, 0.76, and 1.85, respectively. These observations do not by themselves provide strong evidence for a specific UBP1-Med16 interaction.<br /> In addition, the Med16 IP experiments identify approximately 800 proteins per replicate. This broad set of associated proteins highlights the importance of appropriate controls and statistical analysis when interpreting a co-IP as evidence for a specific protein-protein interaction.
(4) Interpretation of the 1,6-HD experiments:
I previously raised concerns that the IP-western data in Figure 1 did not establish a Med16-specific effect. The rebuttal states that "MED16 exhibits a uniquely pronounced dissociation by 1,6-HD that is consistent across three independent IPs using anti-CDK8, anti-MED1, and anti-MED12 antibodies." However, the quantitative data shown do not clearly support this interpretation.
In the CDK8 IP, CDK8 and MED23 appear to be lost to a similar extent as Med16. In the Med1 IP, Med12 shows a similar loss to Med16, with Med23 also showing a comparable trend. In the Med12 IP, CDK8 and Med23 show changes comparable to Med16. There are also unexplained increases in some Mediator subunits with increasing 1,6-HD concentrations. For example, Med12 and Med1 are variable across the 1,6-HD conditions, and Med1 and Med24 increase at higher concentrations. Similar trends are present in the CDK8 IP.
The Figure 1B data raise related concerns. Several Mediator subunits show substantial increases following the 2,5-HD condition compared with 1,6-HD, in some cases greater than the change observed for Med16. Thus, the available data do not clearly establish that Med16 exhibits a uniquely pronounced dissociation from Mediator.
(5) Evidence for the proposed mechanism:
I previously suggested that more rigorous approaches would be needed to distinguish a specific Med16-dependent mechanism from broader effects of Med16 perturbation. The rebuttal instead emphasizes that the authors' conclusion that the UBP1-TFCP2 heterodimer acts through Med16 is supported by multiple independent lines of evidence.
However, the different experiments do not independently establish the same mechanistic conclusion. Many rely on long experimental timeframes, overexpression, reporter assays, limited controls, or lack of biological replication. These approaches can provide useful preliminary evidence for effects on transcription but do not establish that a specific UBP1-Med16 interaction is required for UBP1 target-gene expression.
Additional approaches that directly test the proposed interaction and its requirement for transcriptional regulation would therefore be needed to establish this mechanism.
(6) Med16 rescue experiment:
The authors performed an RNA-seq comparison of WT, Med16 KO, and Med16 KO cells rescued by re-expression of WT Med16. This is a potentially informative experiment, and I appreciate that it was performed.
However, the heatmap shown in the rebuttal does not appear to demonstrate a clear rescue of UBP1 target-gene expression. The figure contains approximately 60 genes but provides no legend beyond "Gene profiling of MED16 KO and rescue effect." The authors describe the result as showing that re-expression of Med16 can largely restore expression of UBP1 target genes, but this conclusion is not readily apparent from the figure as presented. More information about the analysis, normalization, and comparisons would be needed to evaluate the claimed rescue. It would also be useful to include the relevant analysis in the revised manuscript rather than only in the rebuttal.
(7) Consequences of Med16 depletion:
A continuing concern is that the manuscript does not adequately account for the broader consequences of Med16 depletion or knockout. Loss of Med16 is known to cause dissociation of other Mediator subunits, including Med23, Med24, and Med25. The authors acknowledge this in the rebuttal and state that their new Co-IP and IP-MS experiments confirm partial dissociation of these subunits following Med16 knockout. They also acknowledge that this structural perturbation must be considered when interpreting phenotypes from Med16 depletion and that long-term knockdown or knockout approaches are susceptible to secondary effects and cellular adaptation.<br /> These are important caveats, but they are not adequately incorporated into the interpretation of the revised manuscript, and the new data demonstrating loss of Med23, Med24, and Med25 are not shown in the article.
This issue is particularly important for interpreting the transcriptional experiments. Loss of Med16 is expected to disrupt Mediator more broadly, including loss of Med23, Med24, and Med25, which provide important transcription-factor interaction surfaces. These changes could produce widespread transcriptional effects independently of a specific UBP1-Med16 mechanism. Given that the authors' own experiments now provide evidence for this structural perturbation, the possibility of indirect effects and altered Mediator function should be explicitly incorporated into the experimental interpretation.
Overall assessment:
The manuscript addresses an interesting question and presents several potentially useful observations concerning Med16, Mediator, and UBP1. However, the central mechanistic conclusions are currently not supported by sufficiently rigorous or independent evidence. The principal concerns are the extensive reliance on single-replicate experiments; the use of overexpression, artificial reporters, and long depletion timeframes; the absence of direct measurements of UBP1 and Mediator occupancy; the broad structural consequences of Med16 depletion; and the limited statistical support for the IP-MS analysis.
Taken together, the current data do not distinguish adequately between the proposed specific UBP1-Med16 mechanism and alternative explanations involving broader disruption of Mediator structure or transcription. Addressing this distinction is important because it affects the interpretation of much of the manuscript, including the RNA-seq and reporter-assay results and the proposed HIV-1 mechanism.
The authors have generated several useful datasets, including the Med16 knockout/rescue experiment and additional IP-MS information, but the manuscript would need to incorporate the associated caveats and provide stronger experimental evidence before the proposed mechanistic model can be established.
Author response:
The following is the authors’ response to the original reviews.
Public Reviews:
Reviewer #1 (Public review):
Summary:
Characterization of a dissociable Mediator subunit implicated in cellular pathways, particularly lung alveolar function, and HIV latency is conceptually interesting.
Strengths:
The strengths of this study are:
(1) Demonstration of MED16 dissociation from the core Mediator complex and formation of a subcomplex containing MED16, upstream-binding protein 1 (UBP1), and transcription factor cellular promoter 2 (TFCP2) by elegant biochemical fractionation and immunoblotting analysis.
(2) Defining nine N-terminal WD-40 repeats (WDRs) of MED16 as a Mediator-incorporating module and the C-terminal ⍺β-domain (157 amino acids) important for interaction with the UBP1-TFCP2 heterodimeric complex.
(3) Illustration of a weak hydrophobic interaction between MED16 and the Mediator core that could be disrupted by 1,6-hexanediol, but not by its 2,5-hexanediol isomer nor by high salt (500 mM NaCl) disruption.
(4) Classification of UBP1-upregulated cellular genes typically containing binding sites flanking the transcription start site (TSS) in contrast to UBP1-downregulated genes often containing a TSS-overlapping UBP1-binding site
(5) Presenting evidence for Mediator complex-dissociated free MED16-repressed HIV promoter activity through functional association with UBP1 and showing bromodomain-containing protein 4 (BRD4) inhibitor JQ1 that potentially disrupts BRD4-inhibited HIV-1 transcription elongation could lead to reversal of HIV-1 latency.
Weaknesses:
Nevertheless, foreseeable weaknesses include:
(1) No clear demonstration of MED16-UBP1-TFCP2 indeed forming a trimeric core subcomplex in regulating cellular gene transcription and HIV-1 promoter inhibition
We appreciate this insightful comment from the reviewer. The physical interaction between MED16 and the UBP1–TFCP2 heterodimer was uncovered serendipitously via biochemical fractionation. Specifically, UBP1 and TFCP2 were identified in gel-filtration fractions containing free MED16 that eluted separately from the intact core Mediator complex (Figures 1D–1F). This biochemical observation suggested to us a potential functional linkage between MED16 and these two transcription factors. Subsequently, our functional assays further clarified this regulatory relationship: UBP1 and TFCP2 do interact with MED16 that is required to be fully assembled into Mediator complexes to exert transcriptional control. Truncation of MED16’s N-terminal WD40-repeat (WDR) domain (MED16ΔWDR) eliminates MED16 integration into the Mediator complex. Notably, this MED16ΔWDR mutant still retains an intact C-terminal αβ-domain capable of binding UBP1 yet completely loses the capacity to support UBP1-dependent transcription. Collectively, these data demonstrate that UBP1–TFCP2 engage MED16 as a component of the complete Mediator complex to govern target gene expression in cells.
We have updated the abstract and full manuscript to present this model more clearly and coherently throughout the text.
(2) No validation of transcriptomic datasets and pathways identified.
We thank the reviewer for this comment. Since our RNA-seq analysis identified SFTP family genes (SFTPA1, SFTPA2, SFTPB, SFTPD) as UBP1-MED16 co-regulated targets, and these are lung-specific surfactant protein genes, we have now performed qRT-PCR validation in the A549 human lung adenocarcinoma cell line. The results confirm that knockdown of MED16 largely attenuates the expression of these SFTP genes (see Author response image 1) and other UBP1 target genes identified in our RNA-seq dataset.
Author response image 1.
qRT-PCR validation of SFTP gene family expression (SFTPA1/A2/B/D) in A549 cells
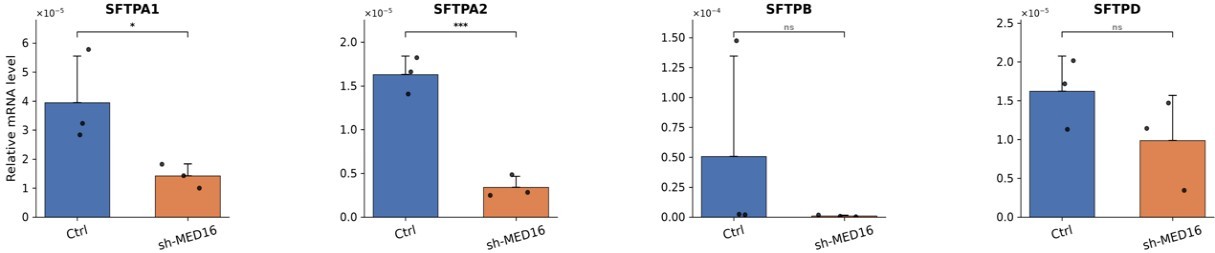
(3) Use of mostly artificial reporter gene constructs and non-HIV host cells (e.g., human 293T embryonic kidney cells, human HeLa cervical cancer cells, and mouse HT pancreatic cancer cells) for examining MED16/UBP1-regulated HIV transcription.
To overcome the limitations of artificial reporter systems, we have managed to utilize multiple complementary approaches beyond reporter assays, including: (i) RNA-seq analysis of endogenous gene regulation, (ii) biochemical co-IP and gel filtration experiments, (iii) immobilized template transcription assays that directly measure PIC assembly and nascent RNA production, and (iv) validation in the J-Lat 10.6 CD4+ T cell line harboring an integrated latent HIV-1 provirus, where MED16 overexpression suppresses HIV-1 reactivation.
Unfortunately, the direct infection experiments with replication-competent HIV-1 were not feasible as our institution does not have the biosafety level 3 (BSL-3) containment facilities.
(4) Inconsistent use of 293T and HeLa cells in the characterization of dissociated MED16 interaction with UBP1 and TFCP2.
For biochemical characterization in this study, HEK293T cells were primarily utilized for overexpression-based co-immunoprecipitation (Co-IP) and domain-mapping assays owing to their superior transfection efficiency. In contrast, HeLa cells were employed for gel-filtration chromatography and endogenous Co-IP, as fractionation of HeLa nuclear extracts represents a well-established workflow for purifying native protein complexes. Critically, the physical interaction between MED16 and the UBP1–TFCP2 heterodimer was consistently detected in both HEK293T whole-cell lysates and HeLa nuclear extracts across all assays.
(5) In vitro transcription using immobilized DNA templates was not performed to a high standard, thus failing to convincingly show MED16/UBP1-inhibited HIV-1 transcription preinitiation complex formation.
We appreciate the reviewer’s careful assessment of the immobilized template assay. While we recognize the technical challenges inherent in this approach, we want to emphasize that the proposed model—that MED16-UBP1 inhibits HIV-1 transcription at the level of PIC assembly—does not rest solely on this single experiment.
Multiple independent lines of evidence converge on this model:
(1) The MED16-UBP1 inhibition depends on the UBP1 binding site overlapping the TSS: a chimeric reporter with the UBP1 binding site placed at the TSS is inhibited by MED16, whereas placing it upstream does not show inhibition, demonstrating the UBP1 binding site-specific repression (Fig 6A-C).
(2) MED16 overexpression inhibits HIV-1 reporter activity in a manner depending on interaction with UBP1. Deletion of the MED16 αβ-domain (MED16Δαβ), which abolishes MED16-UBP1 interaction, completely abrogates the inhibitory effect (Fig 5E-G).
(3) The MED16-UBP1 inhibition of HIV is independent of TAR-mediated elongation (Fig S2B-C) and HDAC-mediated deacetylation (Fig S2A), consistent with an inhibition mechanism operating at the initiation stage rather than at the post-initiation steps.
(4) Upon MED16 overexpression, the immobilized template assay shows reduced CDK8 binding and Pol II pSer5 signals, along with TFIIB retention, providing mechanistic evidence that is consistent with the aforementioned functional observations.
Thus, the model is supported by convergent evidence from reporter assays, domain-mapping experiments, pharmacological inhibition, and in vitro biochemical reconstitution. In the revised manuscript, we have further clarified how these complementary approaches collectively support the PIC inhibition model.
Reviewer #2 (Public review):
Summary:
The article from Zheng et al. proposes an interesting hypothesis that the Med16 subunit of Mediator detaches from the complex, associates with transcription factor UBP1, and this complex activates or represses specific sets of genes in human cells. Despite my excitement upon reading the abstract, I was concerned by the lack of rigor in the experimental design. The only statement in the abstract that has some experimental support is the finding that Med16 dissociates from the Mediator and forms a subcomplex, but the data shown remain incomplete.
We would like to first address a core conceptual point that we believe underpins several of the reviewer’s concerns.
We respectfully disagreed that the reviewer summarized our proposed model as a pathway where “Med16 detaches from the complex, associates with transcription factor UBP1, and this complex activates or represses specific sets of genes.” We acknowledge that phrasing in our original manuscript may have created this misleading interpretation, yet this is not the mechanistic model we intend to convey. We identified the MED16–UBP1–TFCP2 interaction serendipitously during biochemical fractionation: UBP1 and TFCP2 co-eluted with free MED16 in gel-filtration fractions that were fully separated from the intact core Mediator complex. While this biochemical result guided our subsequent functional investigation into MED16–UBP1–TFCP2 crosstalk, we never intend to propose that a standalone MED16–UBP1–TFCP2 subcomplex can drive transcriptional activation or repression independently of the intact Mediator complex.
Most importantly, our functional experiments demonstrate that UBP1 and TFCP2 require MED16 as an integral part of the Mediator complex to regulate transcription as shown by domain mapping experiments. Specifically, MED16 uses its N-terminal WDR domain to integrate into the Mediator and its C-terminal αβ-domain to bind UBP1/TFCP2. Deletion of either WDR or αβ-domain is functionally inert in both cellular and HIV-1 reporter assays. Thus, the MED16-UBP1 interaction is functionally relevant because it links these transcription factors to the Mediator complex, not because it forms an autonomous regulatory complex. In another word, UBP1–TFCP2 target MED16 to recruit the whole Mediator complex for governing gene expression in cells.
We have comprehensively revised the full manuscript to sharply distinguish our initial biochemical observation from the validated functional model. As all experimental approaches carry inherent limitations, we tried our best to validate every major conclusion using multiple orthogonal assays and to draw mechanistic interpretations when results from distinct experimental systems do converge. Our detailed replies to each specific concern from the reviewer are provided below.
Strengths:
The authors have preliminary evidence that a stable Med16 complex may exist and that it may regulate specific sets of genes.
Weaknesses:
The experiments are poorly designed and can only infer possible roles for Med16 or UBP1 at this point. Furthermore, the data are often of poor quality and lack replication and quantitation. In other cases, key data such as MS results aren't even shown. Instead, we are given a curated list of only about 6 proteins (Figure S1), a subset of which the authors chose to pursue with follow-up experiments. This is not the expected level of scientific process.
As clarified in our Summary Response above, we thought this reviewer may have misinterpreted our data and model. Overall, our work demonstrates that MED16 acts as a molecular bridge, linking UBP1/TFCP2 to the Mediator complex, not that three proteins form a free-standing subcomplex, and we have extensively revised the manuscript to clarify this.
Here we also want to address the specific concerns about data completeness and rigor. The full mass spectrometry datasets were not clearly presented in the original submission. We have now reanalyzed the IP-MS data using a more precise quantification approach. Rather than scoring proteins by simple presence or absence, we calculated a bait-preferential score for each protein by comparing its normalized abundance in the MED16 IP to that in the other three Mediator bait IPs (MED1, MED12, CDK8). This score reflects the degree to which a protein is preferentially enriched by MED16 relative to other Mediator subunits. The bait-specific candidates identified by this analysis are presented in Fig S1B, and the complete list of MED16-specific candidates is now included. In addition, the raw abundance values and peptide counts for all identified proteins have been compiled and uploaded as supplementary tables. A detailed description of the normalization and scoring procedure is provided in the Methods section
Furthermore, we have added quantification analysis for key Western blot results throughout the revised figures.
(1) The data supporting the Med16 dissociation and co-association with UBP1 are incomplete and not convincing at this stage. According to the Methods and text, the gel filtration column was run with "un-dialyzed HeLa cell nuclear extract" and eluted in 300mM KCl buffer. The extracts were generated with the Dignam/Roeder method according to the text. Undialyzed, that means the extract would be between 0.4 - 0.5M NaCl. Under these high salt conditions (not physiological), it's possible and even plausible that Mediator subunits could separate over time. This caveat is not mentioned or controlled for by the authors. Because a putative Med16 subcomplex is a foundational point of the article, this is concerning.
The data are incomplete because a potential Med16 complex is not defined biochemically. The current state suggests a smaller Med16-containing complex that may also contain UBP1 and other factors, but its composition is not determined. This is important because if you're going to conclude a new and biologically relevant Med16 complex, which is a point of the article, then readers will expect you to do that.
We appreciate the reviewer’s thorough feedback and address the two core concerns separately below.
(1) Undialyzed nuclear extracts & high-salt conditions
Published work confirms Mediator undergoes massive precipitation (~70% loss) upon dialysis to low-salt 100 mM KCl buffer (1), justifying our use of undialyzed HeLa nuclear extracts for biochemical assays. Prior study also demonstrated intact Mediator remains stable in up to 1 M KCl (1). Therefore, MED16 dissociation seen at 300 mM KCl arises from its unique biochemical property, rather than non-specific high-salt damage.
(2) Biochemical interpretation of MED16-containing fractions
We have revised ambiguous original wording to clarify our model: we do not intend to propose an autonomous MED16–UBP1–TFCP2 subcomplex functions independently in cells. Gel filtration only captures a biochemical state where MED16 co-elutes with UBP1/TFCP2 separate from core Mediator, which merely inspired our functional follow-up. Three lines of evidence prove UBP1/TFCP2 require fully assembled Mediator to function:
(i) MED16’s N-terminal WDR domain mediates Mediator integration, while its C-terminal αβ-domain binds UBP1; both interactions can occur simultaneously (Fig 2B).
(ii) MED16Δαβ incorporates into Mediator but loses UBP1 binding, showing no activity in UBP1-driven and HIV-1 reporter assays (Fig 3G, 5G).
(iii) MED16ΔWDR retains UBP1 binding yet cannot assemble into Mediator, thus fails to repress HIV-1 transcription (Fig 5F).
In vitro MED16 separation only reflects its extractable biochemical behavior, not a functional standalone complex. Collectively, our data establish UBP1/TFCP2 recruit the entire Mediator complex via MED16. All relevant manuscript sections have been rewritten to distinguish this preliminary biochemical observation from our validated functional model.
Equally concerning are the IP-western results shown in Figure 1. In my opinion, these experiments do nothing to support the claims of the authors. The authors use hexanediols at 5% or 10% in an effort to disrupt the Mediator complex. Assuming this was weight/volume, that means ~400 to 800mM hexanediol solution, which is fairly high and can be expected to disrupt protein complexes, but the effects haven't been carefully assessed as far as I'm aware. The 2,5 HD (Figure 1B) experiments appear to simply contain greater protein loading, and this may contribute to the apparent differential results. In fact, in looking at the data, it seems that all MED subunits probed show the same trend as Med16. They are all reduced in the 1,6HD experiment relative to the 2,5 HD experiment. But it's hard to know, because replicates weren't completed and quantitation was not done. There aren't even loading controls. Other concerns about the IP-Western experiments are outlined in point 2.
Treatment with 10% (w/v) 1,6-hexanediol (1,6-HD) is a well-established method to selectively disrupt weak hydrophobic interactions while maintaining stable protein assemblies. A comparable strategy was recently applied to dissect NEAT1-dependent paraspeckle formation driven by liquid–liquid phase separation (2). Notably, we included 2,5-hexanediol (2,5-HD) as a critical specificity control: as a structural isomer with distinct hydroxyl group positioning, 2,5-HD cannot efficiently disrupt weak hydrophobic contacts and failed to trigger MED16 dissociation (Figure 1B). The divergent outcomes observed side-by-side with equal sample input therefore serve as an internal control, validating that MED16 dissociation is a specific consequence of 1,6-HD treatment.
We acknowledge mild signal reductions for several other Mediator subunits following 1,6-HD exposure under certain immunoprecipitation (IP) conditions (Figures 1A, 1B). Nevertheless, MED16 exhibits a uniquely pronounced dissociation by 1,6-HD that is consistent across three independent IPs using anti-CDK8, anti-MED1, and anti-MED12 antibodies, in both HEK293T whole-cell lysates and HeLa nuclear extracts. By contrast, the mild depletion of other Mediator subunits varies substantially depending on the antibody and cell extract used, whereas robust MED16 loss is universally observed in all experimental setups we tested.
(2) At no point do the authors apply rigorous methods to test their hypothesis. Instead, methods are applied that have been largely discredited over time and can only serve as preliminary data for pilot studies, and cannot be used to draw definitive conclusions about protein function.
We greatly appreciate the reviewer’s emphasis on methodological rigor. We fully concur that individual techniques including protein fractionation, IP-WB, transient transfection, shRNA knockdown, immobilized template and luciferase reporter assays each carry intrinsic limitations when deployed alone. To address this, we employed a panel of orthogonal experimental strategies throughout our work and only draw conclusions supported by convergent results across distinct assays. Our core mechanistic conclusion—that MED16 acts as a molecular bridge linking the UBP1–TFCP2 heterodimer to the intact Mediator complex to control transcription—is validated by multiple independent lines of evidence, rather than resting on a single experimental approach, as elaborated in detail below.
(a) IP-westerns are fraught with caveats, especially the way they were performed here, in which the beads were washed at relatively low salt and then eluted by boiling the beads in loading buffer. This will "elute" bound proteins, but also proteins that non-specifically interact with or precipitate on the beads. And because Westerns are so sensitive, it is easy to generate positive results. It's just not a rigorous experiment.
We acknowledge that IP-Western has inherent limitations regarding specificity. To minimize non-specific signals, we included IgG controls in our CDK8 IP experiments (available in raw data) and the boiling elution method has been extensively validated in our hands. More importantly, the interaction between MED16 and UBP1/TFCP2 is not solely supported by IP-Western.
This interaction was initially observed through co-elution of MED16 with UBP1 and TFCP2 in gel filtration fractions (Fig 1D), confirmed by reciprocal co-IP with anti-MED16 and anti-TFCP2 antibodies in both HeLa NE and the resolved fractions (Fig 1E-F), and further corroborated by in vitro GST pull-down assays showing direct binding between MED16 αβ-domain and recombinant UBP1 (Fig 2C). IP-MS analysis with three biological replicates independently identified UBP1 and TFCP2 as MED16-associated proteins. Each of these methods has different sources of potential artifacts, yet they all converge on the same conclusion.
(b) Many conclusions relied on transient transfection experiments, which are problematic because they require long timeframes, during which secondary/indirect effects from expression/overexpression will result. This is especially true if the proteins being artificially expressed/overexpressed are major transcription regulators, which is the case here. It is simply impossible to separate direct from indirect effects with these types of experiments. Another concern is that there was no effort to assess whether the induced protein levels were near physiological levels. Protein overexpression, especially if the protein is a known regulator of pol2 transcription (e.g., UBP1 or Med16), will create many unintended consequences.
The reviewer raises a valid concern about indirect effects from overexpression. To address this, our key conclusions were validated by multiple loss-of-function approaches that do not rely on overexpression alone. Specifically, the conclusion that MED16 is required for UBP1 transcriptional activity is supported by:
(i) shRNA-mediated MED16 knockdown (Fig 3C);
(ii) CRISPR-mediated MED16 knockout in five independent frameshift clones with consistent phenotypes (Fig 3E-F);
(iii) Using a domain-disruption approach, we demonstrated that a UBP1-binding-deficient MED16 mutant (Δαβ) fails to exert the dominant-negative effect on UBP1 activity, as seen with wild-type MED16 (Fig 3G and 6A). All these different methods point to the same conclusion. This makes it unlikely that the effects we see are simply artifacts of overexpression or indirect consequences.
(c) Many conclusions were made based upon shRNA knockdown experiments, which are problematic because they require long timeframes (see above point), which makes it nearly impossible to identify effects that are direct vs. indirect/secondary/tertiary effects. Also, shRNA experiments will have off-target effects, which have been widely reported for well over a decade. An advantage of shRNA knockdowns is that they prevent genetic adaptation (a caveat with KO cell lines). A minimal test would be to show phenotypic rescue of the knockdown by expressing a knockdown-resistant Med16 (for example), but these types of experiments were not done.
We agree that shRNA has potential off-target effects, and that is why we did not rely on shRNA as our sole loss-of-function approach. We have generated five independent CRISPR MED16 knockout clones, each with a distinct frameshift mutation, and all five clones showed consistent reduction in UBP1 reporter activity (Fig 3E-F). Furthermore, we performed RNA-seq on MED16 knockout cells in which wild-type MED16 was re-introduced. As presented in Author response image 2, re-expressing MED16 in KO cells can largely restore the expression of UBP1 target genes. These rescue data provide strong evidence that the transcriptional defects are specifically attributable to MED16 loss rather than off-target effects or clonal adaptation.
Author response image 2.
Gene profiling of MED16 KO and rescue effect
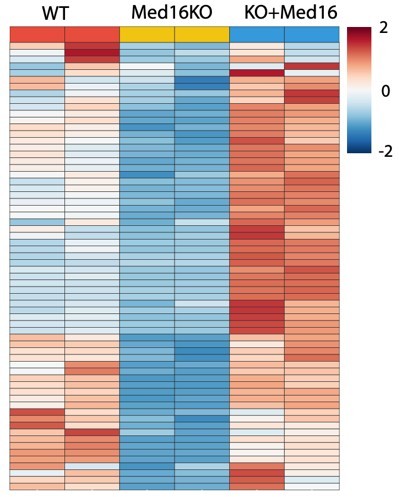
(d) Many experiments used reporter assays, which involved artificial, non-native promoters. Reporters are good for pilot studies, but they aren't a rigorous test of direct regulatory roles for Med16 or other proteins. Reporters don't even measure transcription directly. In fact, no experiment in this study directly measures transcription. An RNA-seq experiment was done with overexpressed or Med16 knockdown cells, but these required long timeframes and RNA-seq measures steady-state mRNA, which doesn't test the potential direct effects of these proteins on nascent transcription.
The two principal reporters used in this study are both based on native promoters. The UBP1 reporter is derived from the mouse α-globin gene promoter, a well-established natural target of UBP1/TFCP2 that contains two endogenous UBP1 binding sites. To enhance sensitivity, we expanded these to six copies, as the α-globin promoter has low basal activity in most cell lines. Critically, this expansion preserved the original promoter architecture, including the CCAAT box, TATA box, and TSS. The HIV-1 reporter is driven by the HIV-1 core promoter (-78 to +60), which contains all elements required for basal transcription and Tat-mediated activation. Thus, both reporters retain the native sequence context of the regulatory elements under study.
These reporter assays served as initial screening and hypothesis-testing tools. The key functional insights from reporters were then validated in more physiological contexts:
(i) The position-dependent effect of UBP1 binding (activation when upstream of TSS, repression when overlapping TSS) observed in chimeric reporters (Fig 6A-C) was independently confirmed by motif enrichment analysis of endogenous genes from RNA-seq data (Fig 6D-E).
(ii) Our immobilized template transcription assays directly measure nascent RNA production from the HIV-1 promoter, showing that MED16 overexpression reduces transcriptional output (Fig 7C). Thus, while reporter assays alone would be insufficient, our conclusion on UBP1-MED16 function are further corroborated by both global genomic analysis and direct in vitro transcription measurements.
(e) The MS experiments show promise, but the data were not shown, so it's hard to judge. The reader cannot compare/contrast the experiments, and we have no indication of the statistical confidence of the proteins identified. How many biological replicate MS experiments were performed?
The IP-MS experiments were performed with three biological replicates for each of the four antibodies against MED1, MED12, CDK8, and MED16 respectively. The complete datasets are now provided in the revised manuscript (Supplementary Table 1).
In addition, we have reanalyzed the data using a more quantitative approach. In the original submission, we classified proteins by a binary cutoff—detected or not detected in MED16 relative to other baits. In the revised analysis, we calculated a bait-preferential score for each protein by comparing its normalized abundance in the MED16 IP to its mean abundance across the other three Mediator baits. This score reflects how strongly a protein is enriched by MED16, rather than simply whether it meets an arbitrary detection threshold. A detailed description of this method is provided in the revised Methods section.
Notably, using this quantitative method, UBP1 and TFCP2 can also be detected at lower levels in some replicates of the other Mediator baits. This is consistent with our functional model: UBP1 and TFCP2 associate with the whole Mediator complex through MED16. The MED16-biased enrichment pattern, now supported by the bait-preferential score, reinforces the conclusion that MED16 serves as the primary anchor for UBP1/TFCP2 to associate with the Mediator complex.
(3) The data are over-interpreted, and alternative (and more plausible) hypotheses are ignored. Many examples of this, some of which are alluded to in the points above. For example, Med16 loss or overexpression will cause compensatory responses in cells. An expected result is that Mediator composition will be disrupted, since Med16 directly interacts with several other subunits. Also in yeast, the Robert, Gross, and Morse labs showed that loss of Med16/Sin4 causes loss of other tail module subunits, and this would be expected to cause major changes in the transcriptome. The authors also mention that yeast Med16/Sin4 "alters chromatin accessibility globally" and this would be expected to cause major changes in the transcriptome, leading to unintended consequences that will make data analysis and identification of direct Med16 effects impossible. The unintended consequences will be magnified with prolonged disruption of MED16 levels in cells (e.g., longer than 4h). These unintended consequences are hard to predict or define, and are likely to be widespread given the pivotal role of Mediator in gene expression. One unintended consequence appears to be loss of pol2 upon Med16 over-expression, as suggested by the western blot in Figure 8B. I point this out as just one example of the caveats/pitfalls associated with long-term knockdowns or over-expression.
We thank the reviewer for raising this important point. Indeed, our new Co-IP and IP-MS data confirm that MED16 knockout leads to partial dissociation of MED23, MED24, and MED25 from the Mediator complex. We agree that this structural perturbation must be carefully considered when interpreting phenotypes from MED16 depletion experiments, and we acknowledge that long-term knockdown or knockout approaches are inherently susceptible to secondary effects and cellular adaptation.
Author response image 3.
MED16 knockout impacts on the Mediator complex
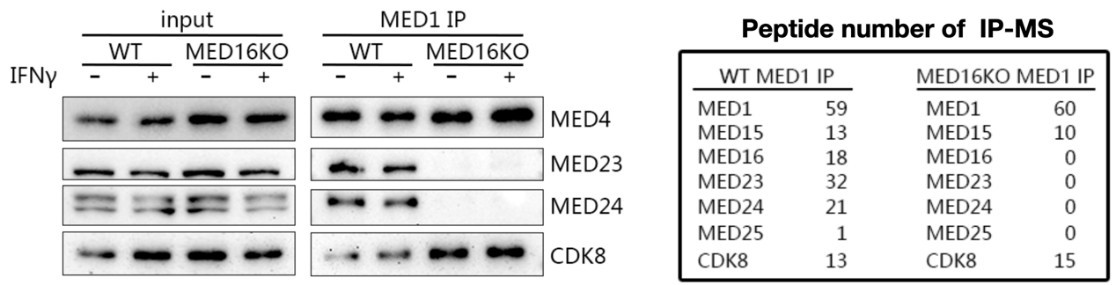
However, our key conclusions are not based solely on long-term depletion experiments. Several lines of evidence, including experiments performed on short timescales without prolonged MED16 loss, converge on the same conclusion:
First, the MED16 mutant lacking its C-terminal αβ-domain cleanly separates the two functions. This mutant retains the intact N-terminal WDR domain of MED16 and can integrate into the Mediator complex, preserving its structural role and preventing tail module dissociation. Yet it completely fails to exert the competitive inhibition (squelching) effect on the UBP1 reporter that is observed with wild-type MED16 overexpression (Fig 3G), and similarly fails to inhibit HIV-1 reporter activity (Fig 5G). The sole molecular defect of this mutant is its inability to bind UBP1 (Fig 2B). Critically, this overexpression experiment is performed in a wild-type background where the endogenous Mediator complex remains structurally intact. The only variable is whether the overexpressed MED16 can interact with UBP1. This provides strong evidence that the transcriptional effects are mediated specifically through the MED16-UBP1 interaction interface, independent of MED16's structural role in maintaining Mediator integrity.
Second, the transcriptional changes we observe are not random but show specific functional coherence. If the transcriptomic changes in MED16 knockdown cells were merely secondary consequences of Mediator tail module disruption, we would expect broad, non-specific dysregulation. Instead, the UBP1-MED16 co-regulated genes are enriched for specific biological processes—angiogenesis—which largely align with the known biological functions of UBP1 (Fig 4D-E). This functional specificity is difficult to reconcile with the global, non-specific transcriptional disruption that would be expected from the total Mediator dysfunction.
Finally, we wish to address the reviewer's observation regarding Pol II levels in Figure 8B. In preparing the revised manuscript, we carefully re-examined our original Western blot data and found that the reduction of Pol II upon MED16 overexpression was not consistently reproducible across independent experiments. We have therefore replaced new Pol II blot in Figure 8B. We note that this revision does not affect any of the conclusions drawn from Figure 8, which focus on the inhibitory effect of MED16 overexpression on HIV-1 latency reversal in J-Lat cells.
We are grateful for the reviewer’s careful assessment, which encouraged us to refine our data presentation and enhance experimental rigor. The manuscript has been significantly improved as a result.
Reviewer #3 (Public review):
Weaknesses:
(1) The decrease in 1,6-hexanediol-treated cells of MED16 is modest, variable, not quantified, and internally inconsistent. For example, in Figure 1A, 1,6-hexanediol treatment should not have an impact on the level of the protein being directly IP. For MED12 (and CDK8 and MED1 to a lesser extent), 1,6-hexanediol treatment alters the level of the target protein in the IP. Along these lines, Figure 1A shows a no 1,6H-D dependent decrease in MED1 or MED12 levels in the CDK8 IP, whereas Figure 1B does show a decrease. Figure 1A shows no 1,6H-D dependent decrease in CDK8 levels in the MED1 IP, whereas Figure 1B shows a dramatic decrease. MED24 levels in the MED12 IP increase upon 1,6H-D in Figure 1A, but decrease in Figure 1B. Internal inconsistencies of this nature persist in the other Figures.
We thank the reviewer for this careful observation, and we here clarify the rationale behind our experimental design to resolve the apparent discrepancies between Figures 1A and 1B.
We first performed co-immunoprecipitation (co-IP) assays using HEK293T whole-cell lysates with three distinct antibodies targeting CDK8, MED1, and MED12, respectively, to pull down intact Mediator complexes. This setup was designed to assess whether 1,6-hexanediol (1,6-HD) impairs Mediator complex integrity and, if so, whether this perturbation affects individual subunits unequally. Across all three independent IP replicates, we observed a uniform trend: most Mediator subunits displayed only mild signal attenuation, whereas MED16 exhibited a striking, dose-dependent reduction upon escalating 1,6-HD concentrations (Fig 1A). Quantitative densitometry of these immunoblot signals has now been incorporated into the revised Figures 1A and 1B to better visualize this difference. Thus, this initial result in Fig 1A indicated that MED16’s interaction with the core Mediator complex is uniquely vulnerable to 1,6-HD disruption, irrespective of which Mediator subunit was used for immunoprecipitation.
To validate the reproducibility of this phenotype, we replicated the assay in an alternative biochemical system using HeLa nuclear extracts (NEs) (Fig 1B), with 2,5-hexanediol (2,5-HD) included as a critical negative control—this structural isomer cannot disrupt weak hydrophobic protein-protein contacts. Notably, the HeLa NE experiments in Fig 1B were carried out under elevated salt conditions (~300 mM NaCl), in contrast to the 150 mM NaCl buffer used for the HEK293T lysate assays in Figure 1A.
We want to emphasize that despite these substantial technical disparities between the two experimental setups, both datasets converge on the identical core conclusion: MED16’s association with the core Mediator complex is selectively disrupted by 1,6-HD. This consistent trend is further strengthened by quantitative analysis of immunoblot band intensities from biological replicates, which we have added to the revised figures.
Minor variability observed for other Mediator subunits between Fig 1A and 1B arises from intrinsic differences in cell type, extraction protocols, and buffer salt concentrations. For this reason, we did not draw mechanistic interpretations regarding the variable signal changes of other subunits across distinct experimental conditions; instead, our analysis focused on the robust, consistent loss of MED16 following 1,6-HD exposure.
(2) Undermining the value of Figure 1E/F, UBP1 and TFCP2 may also associate with the small amount of MED16 in the 2MDa fractions. This is not tested, and therefore, the conclusion that they just associate with the dissociable form of MED16 is not supported.
We thank the reviewer for this insightful observation. Indeed, UBP1 and TFCP2 can associate with MED16 in the context of the intact Mediator complex. Figure 1B directly supports this: under 2,5-HD conditions, where MED16 remains integrated into the Mediator, both UBP1 and TFCP2 are co-immunoprecipitated with the Mediator complex (via anti-MED1). This association is lost under 1,6-hexanediol conditions, where MED16 dissociates—suggesting that UBP1 and TFCP2 are tethered to the Mediator through MED16.
The gel filtration experiment (Fig 1D) further reveals that a portion of MED16 resolves away from the core Mediator complex under these in vitro conditions, and Figure 1E-F shows that UBP1 and TFCP2 co-immunoprecipitated with MED16 in these lower molecular weight fractions. Taken together, these data indicate that UBP1 and TFCP2 can be found in association with MED16 in two biochemically distinguishable states: one integrated into the Mediator complex, and another that has dissociated from it under our experimental conditions. We did not state that UBP1 and TFCP2 associate exclusively with the dissociated form; rather, the dissociated fraction is where we initially identified this interaction, which then led us to investigate its functional significance. The whole manuscript has been extensively rewritten now, and hopefully the confusion has been clarified.
Our functional data further demonstrate that the transcriptional activities of UBP1 and TFCP2 require the intact Mediator complex. MED16 bridges this interaction through its C-terminal αβ-domain, which binds UBP1/TFCP2, and its N-terminal WDR domain, which anchors MED16 into the Mediator. We have revised the manuscript to clearly distinguish the biochemical observation from the functional model, and we now explicitly state that UBP1 and TFCP2 associate with the Mediator complex through MED16.
(3) Domain mapping studies in Figure 2 are overinterpreted. Since the interactions could be indirect, it is not accurate to conclude "Therefore, the N-terminal WDR domain of MED16 is crucial for its integration into the Mediator complex, while the C-terminal αβ-domain is essential for interacting with UBP1-TFCP2."
We fully acknowledge that co-immunoprecipitation (co-IP) assays alone cannot discriminate direct physical binding from indirect protein associations mediated by intermediate partners. Nevertheless, our conclusion that MED16 directly interacts with UBP1 is supported by two orthogonal, independent experimental datasets.
First, GST pull-down assays using purified recombinant proteins expressed in E. coli confirm direct binding (Figure 2C). This cell-free biochemical system removes all potential cellular bridging factors, unambiguously demonstrating a physical contact between the C-terminal αβ-domain of MED16 and UBP1.
Second, our mutational functional analyses further rule out an indirect interaction model. Deletion of the unique 36-residue USP peptide in UBP1 completely abrogates MED16 binding (Figure 2F, comparison between ΔSAM and DBD truncations). Reciprocally, MED16 mutants lacking the C-terminal αβ-domain lose all capacity to associate with UBP1. Importantly, both truncation mutations yield identical functional defects in UBP1-driven and HIV-1 luciferase reporter assays (Figures 3G and 5G). If this complex assembly relied on an uncharacterized bridging protein, it would be statistically improbable for two distinct, structurally unrelated deletions (USP removal on the UBP1 side and αβ-domain truncation on the MED16 side) to independently disrupt the same indirect linkage and generate identical loss-of-function phenotypes.
Collectively, the congruent results from cell-free in vitro biochemistry and targeted mutational functional assays provide robust evidence for a direct, specific physical interaction between MED16 and UBP1.
(4) A close examination of Figure 2C undermines confidence in the association studies. The bait protein in lanes 5-8 should be equal. Also, there is significant binding of GST to UBP1 and TFCP2, in roughly the same patterns as they bind to GST-MED16 αβ. The absence of input samples makes the results even more difficult to interpret.
We acknowledge the technical limitations the reviewer pointed out. Regarding the concern about unequal protein loading across lanes 5-8, we note that lanes 7 and 8 in fact contain more GST-M16αβ bait protein than lanes 5 and 6, yet TFCP2L1 and YY1 still show no appreciable binding above the GST-alone background. This loading asymmetry therefore strengthens the conclusion that these proteins do not directly interact with MED16. For UBP1 and TFCP2, we have now provided quantification of the Western blot signals, which confirms a clear difference in binding to GST-M16αβ versus GST alone. Furthermore, these GST pull-down experiments were performed under stringent conditions—300 mM NaCl and 0.5% Tween-20 in the wash buffer—and the UBP1 and TFCP2 interactions with GST-M16αβ persisted under these conditions (lane 5-8), whereas binding to GST alone was minimal (lane 1-4). These technical details support the specificity of the observed interactions.
(5) The domain deletion mutants are utilized throughout the manuscript as evidence of the importance of the UBP1-MED16 interaction. However, in Figure 2F lanes 7 and 8, the delta-S mutant binds MED16 as well as full-length UBP1. This undermines much of the subsequent data and conclusions about specificity.
We believe the reviewer may have a misunderstanding about the experimental design. The delta-S (ΔSAM) mutant deletes the SAM motif, which is required for UBP1-TFCP2 heterodimerization, but retains the UBP1-specific sequence (USP) that mediates MED16 binding. The observation that ΔSAM still binds MED16 at levels comparable to full-length UBP1 is therefore not a discrepancy—it is the expected result and confirms that USP is the region responsible for MED16 interaction. The DBD mutant, which further removes USP, completely loses MED16 binding. Together, these deletion constructs delineate two separable interaction surfaces on UBP1: USP for MED16 binding and the SAM motif for TFCP2 heterodimerization (see Figure 2 G). The functional analysis of these domains is reflected in Figure 3B: ΔSAM, which retains MED16 binding but loses TFCP2 dimerization, shows approximately half the transcriptional activity of full-length UBP1, suggesting that both interactions contribute to full UBP1 function. To avoid similar confusion, we have renamed ΔS to ΔSAM,UBP1-SP to USP in the revised manuscript.
(6) Even if the delta-S mutant were defective for MED16 binding, the result in Figure 3B does not "confirm that MED16 is required for the transcriptional activity of UBP1,". Removal of that domain may have other effects.
We wish to first clarify a factual point: the delta-S mutant (ΔSAM) is not defective for MED16 binding. ΔSAM deletes the SAM motif that is required for UBP1-TFCP2 heterodimerization, but retains the UBP1-specific sequence (USP) that mediates MED16 binding. As shown in Figure 2F, ΔSAM binds MED16 at levels comparable to full-length UBP1. The mutant that loses MED16 binding is DBD, which further deletes USP.
The functional result in Figure 3B is therefore consistent with this biochemical mapping: ΔSAM retains MED16 binding but loses TFCP2 dimerization, and accordingly shows approximately half the transcriptional activity of full-length UBP1. This suggests that both the MED16 interaction (via USP) and the TFCP2 interaction (via the SAM motif) contribute to full UBP1 function.
More importantly, the conclusion that MED16 is required for UBP1 transcriptional activity does not rest on domain mutant analysis alone. It is supported by independent loss-of-function approaches: shRNA-mediated MED16 knockdown (Fig 3C) and CRISPR-mediated MED16 knockout across five independent frameshift clones (Fig 3E-F), both of which consistently reduce UBP1 reporter activity. The domain deletion mutants complement these approaches by mapping the specific interaction interfaces.
(7) As Mediator is critical for the activation of many genes, it is not accurate to assume that the impact of its deletion in Figure 3E/F demonstrates a direct requirement in UBP1-driven transcription. This could easily be an indirect effect.
MED16 knockout data must be interpreted cautiously due to potential Mediator destabilization artifacts. However, our conclusion does not rely solely on loss-of-function data; transient competitive overexpression and domain-mapping assays bypass chronic MED16 depletion entirely. The MED16Δαβ mutant retains full Mediator integration but loses UBP1 binding. Unlike wild-type MED16, this mutant fails to change UBP1 or HIV-1 reporter activity in 36–48 h transient assays performed in wild-type cells with intact endogenous Mediator. Dose titration further confirms that only UBP1-interacting MED16 competes for UBP1 binding to repress target promoters (Fig 3G). Since these experiments involve no permanent MED16 ablation, the observed transcriptional effects cannot be attributed to indirect global Mediator dysfunction, verifying specific MED16–UBP1 regulation.
(8) Without documenting the relative protein expression levels in Figure 3G/H, conclusions cannot be drawn about the titration experiments, nor the co-expression experiments. These findings are likely the result of squelching or some form of competition that is not directly related to the UBP1-mediated transcription. A great deal of validation would be required in order to support the model that these effects are a result of MED16 overexpression sequestering UBP1 away from holo-Mediator.
We thank the reviewer for this insightful comment. In fact, the squelching interpretation that the reviewer proposes is fully consistent with our functional model and helps reinforce a key conclusion of our study.
The reviewer correctly points out that overexpressed MED16 may compete with the endogenous Mediator complex for UBP1 binding, sequestering UBP1 away from the holo-Mediator and thereby inhibiting UBP1-driven transcription. This interpretation directly implies that UBP1 requires association with the intact Mediator complex—not merely free MED16—to activate transcription. This is precisely the model we advocate, and the squelching phenomenon observed in Figure 3G thus provides independent functional evidence for it.
The specificity of this effect is confirmed by the MED16 Δαβ mutant: the Δαβ mutant integrates into the Mediator complex normally but cannot bind UBP1, and consequently fails to exert any competitive inhibition on the UBP1 reporter (Fig 3G). This demonstrates that the squelching effect is specifically dependent on the MED16-UBP1 interaction interface. We have now documented the relative protein expression levels for these experiments in the revised manuscript.
(9) The lack of any documentation of expression levels for the various ectopic proteins in the majority of Figures, renders mechanistic claims meaningless (Figures 3, 4, 5, 6, 7, S2, S3). This is particularly relevant since the model presented for many of the results invokes concentration-dependent competition.
In the revised manuscript, we have now included Western blot data documenting the expression levels of ectopic proteins for the key experiments. The expression level data confirm that the proteins were expressed at the expected levels across the different conditions.
Recommendations for the authors:
Reviewing Editor Comments:
The individual reviews are included above. Please also note that additional instructions regarding the publication of the preprint are below.
If you choose to publish your preprint with eLife, these reviews will also be published with the article. As noted in the instructions following the reviews, you do have a chance to include a provisional response to the reviewers' comments in the provisional publication of the preprint. You will also have an opportunity to submit a revised version of the manuscript in the future. Finally, you do have the option of formally withdrawing the article from eLife after the Reviewed Preprint has been published and pursuing publication elsewhere.
Reviewer #1 (Recommendations for the authors):
(1) The writing and presentation are generally good, except that some typos and mistakes in conceptual statements (e.g., lines 407-408 "WDR-deleted MED16, which cannot interact with UBP1") often confuse the readers.
We thank the reviewer for the careful reading. We have tried out best to correct the typos and misstatements, including the error in line 407-408 where "WDR-deleted MED16, which cannot interact with UBP1" should refer to the αβ-domain deletion rather than the WDR deletion. The whole manuscript has been extensively rewritten for better clarity and preciseness.
(2) Inconsistency in the citation format between numbering and author names should be avoided.
The citation format has now been unified throughout the manuscript.
(3) Two important scientific concepts based on the published literature should be mentioned:
(a) "The position-dependent function of transcription factors (TFs) relative to the TSS" (lines 427-428) is a well-known fact in the transcription field that partly explains gene activation versus gene repression; and
(b) the statement "JQ1 that is known to reverse HIV-1 latency by antagonizing BRD4's suppression of the Tat-P-TEFb/SEC (Super Elongation Complex) interaction" (lines 384-386) is only partially correct and is a property unique to the BRD4 long (BRD4-L) isoform.
We thank the reviewer for this suggestion. We have now cited the relevant literature on the position-dependent function of transcription factors relative to the TSS, including the recent study by Duttke et al. (3), which systematically demonstrated that the effect of TF binding on transcription initiation is highly position-dependent. Our findings provide a clear example that UBP1 activates transcription when its binding motif is located upstream of the TSS but represses when the motif overlaps the TSS, which exemplifying this concept.
We have corrected the statement to specify that JQ1 antagonizes the BRD4 long isoform (BRD4-L)-mediated suppression of Tat-P-TEFb/SEC, and have noted that the BRD4 short isoform (BRD4-S) may also contribute to HIV-1 promoter repression and JQ1-mediated latency reversal.
(4) Another relevant concept is that BRD4 short (BRD4-S) isoform-inhibited HIV-1 promoter activity could be potentially alleviated by JQ1, leading to latency reversal. Besides the aforementioned points and those comments already provided in the Public Review, the involvement of TFCP2 and YY1 in MED16-UBP1 function has not been clearly established and will require more careful and detailed investigation.
We thank the reviewer for these suggestions. Regarding BRD4-S, we have added a discussion of the BRD4 short isoform's role in HIV-1 promoter regulation and its potential contribution to JQ1-mediated latency reversal.
Regarding the involvement of TFCP2 and YY1, we agree that their precise roles within the MED16-UBP1 regulatory axis have not been fully dissected in the current study. Our data indicate that TFCP2 can dimerize with UBP1 to enhance transcriptional activation (Fig 3H), and YY1 is present in the MED16-containing fractions (Fig 1E), consistent with its previously reported role in HIV-1 silencing. However, the molecular details of how TFCP2 and YY1 contribute to MED16-UBP1 function—and whether they act in the same or parallel pathways—remain to be determined. We have acknowledged this as a limitation and a direction for future investigation in the revised Discussion.
Reviewer #2 (Recommendations for the authors):
(1) The data from Figure 1F are hard to interpret, the blot quality is poor for Med23, 16
We acknowledge that the blot quality for MED23 and MED16 in Figure 1F was suboptimal in the original submission. We have now provided better Western blot, which confirms the specific co-immunoprecipitation of MED16 and MED23 with TFCP2 in both HeLa nuclear extract and the gel filtration fractions. Importantly, the reciprocal co-IP (anti-MED16 IP blotted for TFCP2 and UBP1, Fig 1E) independently validates this interaction.
(2) Figure 2: No MW markers on gels. Also, these types of experiments are ok for pilot studies, but they aren't rigorous. Only a few proteins were tested, and it's easy to get false positives with how the experiments were completed. Finally, the Mediator proteins were tested as single isolated proteins rather than in their native context. As isolated proteins, they likely have large exposed hydrophobic patches (normally bound to other subunits), and this can generate non-specific "sticky" interactions that can lead to false positive results.
We have now included MW markers on the gel images in the revised Figure 2.
The reviewer raises a valid general concern about domain mapping experiments. However, we wish to emphasize that the readout in Figure 2B and 2F is the binding of exogenously expressed truncated proteins to their endogenous interaction partners—MED1, TFCP2, MED16, and MED23—which are natively folded and assembled in their physiological environment. This is not a situation where two isolated proteins are mixed in a test tube. Furthermore, the deletion series themselves contain important internal controls against non-specific "stickiness": In Figure 2B, progressive deletion of the WDR domains leads to a gradual reduction in MED1 binding, consistent with the predicted structural role of the β-propeller (WDR domain). The truncation at the αβ-domain specifically abolishes TFCP2 binding but does not affect its association with Mediator complex as indicated by MED1. If the truncated proteins were non-specifically sticky due to exposed hydrophobic patches, one would expect uniform binding across all truncations or random binding patterns, which is not observed. And in Figure 2F, deletion of the 36-amino-acid USP abolishes its MED16 binding, while deletion of the SAM motif does not. This sequence-specific differential effect is inconsistent with non-specific hydrophobic interactions.
The domain mapping experiments in Figure 2 were not designed as an unbiased screen but as hypothesis-driven tests guided by the IP-MS results identifying UBP1/TFCP2 as MED16 interactors, sequence and structural analysis predicting the roles of the WDR and αβ-domains. The conclusions from these experiments are corroborated by subsequent functional assays: the USP-deleted mutant and the MED16 Δαβ mutant show corresponding functional defects in both UBP1 reporter and HIV-1 reporter assays (Fig 3G, Fig 5G), providing strong support that the mapped interaction interfaces are functionally relevant.
(3) Figure 3: UBP1 reporter is artificial, 6X UBP1 sites upstream of a TATA box.
We appreciate this comment and wish to clarify a misunderstanding. The UBP1 reporter used in Figure 3 is not an artificial construct assembled from random elements. Its backbone is derived from the mouse α-globin gene promoter, a well-established natural target of UBP1/TFCP2, which contains two endogenous UBP1/TFCP2 binding sites. In order to increase the reporter's sensitivity to UBP1/TFCP2, we expanded the original two sites to six. Critically, this expansion did not alter the native architecture of the promoter—the relative positions of the transcription factor binding sites, the CCAAT box, the TATA box, and the TSS remain unchanged from the original α-globin promoter. This reporter therefore retains the physiological spacing and topological organization of a genuine UBP1 target promoter, and its low basal activity and high inducibility by UBP1 make it a well-suited tool for modeling UBP1 transcriptional activity. We have further clarified this description in the revised manuscript.
(4) Figure 3D: Med16 KD not compelling, perhaps 50% knockdown? Hard to tell because no replicates and no quantitation.
We acknowledge that the shRNA-mediated MED16 knockdown in Figure 3D was partial and that the original presentation lacked replicate quantification. We initially tested three independent shRNAs targeting MED16, of which only one achieved appreciable knockdown. Recognizing this limitation, we turned to a more definitive loss-of-function approach: CRISPR-Cas9-mediated MED16 knockout. Five independent frameshift KO clones were generated in mouse HT cells, each verified by sequencing and Western blotting (Fig 3F), and all five clones consistently showed reduced UBP1 reporter activity compared with wild-type cells (Fig 3E). The consistency between the shRNA knockdown and CRISPR KO reinforce the conclusion that MED16 is required for UBP1 transcriptional activity.
(5) Figure 3E: Med16 KO will be a different cell line because of genetic adaptation. That is, an RNA-seq experiment is expected to result in many gene expression changes compared to the parental line. This could contribute to differences, or differences could result from altered Mediator composition to compensate for Med16 loss, but this wasn't addressed by the authors. A rapid degron method would be much more rigorous.
We thank the reviewer for raising this important concern. We agree that prolonged MED16 loss can elicit cellular adaptation and compensatory changes in Mediator composition, as our own new data on tail module dissociation confirm. This makes it challenging to disentangle direct and indirect effects using constitutive KO models alone.
However, two independent lines of evidence support a direct role for MED16 in UBP1-mediated transcription that cannot be explained by adaptive responses:
First, acute shRNA-mediated knockdown produces the same phenotypic trend. shRNA operates on a shorter timescale (days) without prolonged selection for compensatory mutations, yet it also reduces UBP1 reporter activity (Fig 3C). The convergence of acute and chronic loss-of-function approaches suggests the phenotype is driven by MED16 loss itself rather than by the secondary adaptations that accumulate over time in KO cells.
Second, and most critically, the MED16Δαβ mutant experiment completely bypasses the issues of genetic adaptation and Mediator structural disruption (Fig 3G). This experiment is performed in wild-type cells with an intact endogenous Mediator complex, without any MED16 depletion and without any long-term selection. The MED16Δαβ mutant retains full ability to integrate into the Mediator complex (its WDR domain is intact) but cannot bind UBP1. Overexpression of wild-type MED16 competitively inhibits the UBP1 reporter due to the squelching effect, whereas overexpression of MED16Δαβ at comparable levels does not (Fig 3G). The sole molecular difference is that MED16Δαβ doesn`t contain the UBP1-binding interface. Because this experiment involves no MED16 loss and no adaptive period, the result directly demonstrates that MED16-UBP1 interaction is required for UBP1 transcriptional activity, entirely independent of concerns about clonal adaptation.
We appreciate the reviewer's suggestion of a rapid auxin-inducible degron approach. While acute depletion strategies offer clear advantages in minimizing cellular adaptation, they are not without limitations. First, degron-based depletion rarely achieves 100% elimination of the target protein, and residual protein may confound interpretation. Second, and particularly relevant to our system, degron-mediated degradation may preferentially target free, unassembled subunits while sparing proteins already stably integrated into large macromolecular complexes such as the Mediator—potentially creating a lag or even complete resistance to degradation for the pool of MED16 that is assembled into the complex. Given these considerations, we believe our convergent strategy—combining shRNA knockdown, CRISPR-mediated knockout in multiple independent clones, and the Δαβ mutant that bypasses structural perturbation—provides a robust and complementary set of evidence that does not rely on any single depletion method.
(6) The title for Figure 3 is "Med16 is required for UBP1 activation of gene transcription", but that's not conclusively shown by these experiments.
We agree that the original title of Figure 3 may overstate. We have revised the title to " MED16 acts through the Mediator complex to support UBP1-mediated transcriptional activation ", which may better reflect the data. As discussed in our responses above, this conclusion is supported by converging evidence from shRNA knockdown (Fig 3C), CRISPR-mediated KO across multiple clones (Fig 3E-F), and the specific loss of function observed with the MED16Δαβ mutant (Fig 3G).
(7) Figure 5: Med16 protein levels were never measured, nor were other transfected proteins. Reporter assay data are correlative only; no evidence for direct effects, and only 2 other MED subunits are probed. Again, this is a starting point, but nothing to use for concrete conclusions about Med16.
We have now provided Western blot data documenting MED16 and other transfected protein levels for the experiments in Figure 5, confirming that the proteins were expressed at the expected levels. We agree that plasmid-based reporter assays alone cannot establish direct transcriptional mechanisms. The HIV-1 reporter experiments in Figure 5 serve as an initial functional readout, and their conclusions are corroborated by more direct approaches: (i) the position-dependent specificity demonstrated by chimeric reporter assays (Fig 6A-C); (ii) the independence of the effect from TAR-mediated elongation and HDAC activity (Fig S2), ruling out alternative mechanisms; and (iii) the immobilized template transcription assays, which directly measure nascent RNA production and PIC assembly on the HIV-1 promoter (Fig 7). The reporter data should be viewed as one component of a larger body of convergent evidence rather than as standalone proof.
MED23 and MED24 were chosen as the most relevant controls because they, along with MED16, form the core of the tail module submodule that creates the transcription factor interaction platform. They are structurally adjacent to MED16 within the same submodule. The fact that neither MED23 nor MED24 overexpression affects HIV-1 reporter activity (Fig 5C), whereas MED16 overexpression does so in a UBP1-binding-dependent manner (Fig 5C, 5E), demonstrates that the inhibitory effect is specific to MED16 and not a generic consequence of overexpressing a Mediator tail subunit.
(8) Figure 6: similar concerns to Figure 5. The promoters are artificial, derived from a chicken beta-actin promoter with artificially inserted UBP1 binding sequences.
We acknowledge that the chimeric promoters in Figure 6 are indeed deliberately designed. To address this specific question: Does the binding position of the UBP1 relative to the TSS dictate whether UBP1-MED16 activates or represses transcription?
To isolate position as the sole variable, we needed a backbone promoter that (i) is stably and robustly active in the cell lines used, (ii) does not itself contain endogenous UBP1 binding sites that would confound the interpretation, and (iii) allows precise placement of the UBP1 binding motif either upstream of or overlapping the TSS. The chicken β-actin promoter meets all three criteria and is a widely used tool in molecular biology for such controlled promoter engineering experiments. Notably, its high GC content around the promoter region is also a feature shared with the HIV-1 core promoter, making it a particularly relevant backbone for the HIV-1 TSS chimeric constructs.
The key controls for this experiment are internal: in the same backbone, placing the UBP1 binding site at the TSS results in MED16-UBP1-dependent repression, whereas placing it upstream does not (Fig 6A vs 6B). Furthermore, this position-dependent effect requires the MED16-UBP1 interaction interface, as the MED16 Δαβ mutant and the UBP1 DBD mutant both fail to produce the inhibitory effect (Fig 6A). The differential outcome between the two constructs—which differ only in the placement of the UBP1 binding site—cannot be attributed to the artificial nature of the backbone, because the backbone is identical in both cases.
(9) Figure 6D: Not rigorous, no statistical analysis, cannot determine whether the modest changes are biologically relevant/meaningful. Also, data were obtained through indirect measurements and long timeframes, so any direct effects from possible UBP1 binding are probably lost.
The differentially expressed genes in Figure 6D were selected using DESeq2 with a significance threshold of p < 0.05. The top 50 upregulated and top 50 downregulated transcripts were then used for UBP1 motif enrichment analysis around their promoters. We have clarified these selection criteria in the revised figure legend.
Regarding the concern that indirect measurements over long timeframes, we now have additional evidence that UBP1 binding effects are preserved in our RNA-seq data. Motif analysis of UBP1-upregulated genes using HOMER identified the CP2 family binding motif (CNRG-N6-CNRG) as the most significantly enriched motif. This indicates that UBP1-binding-dependent transcriptional effects are not lost in our dataset.
Author response image 4.
Motif enrichment result of the UBP1 up-regulated genes
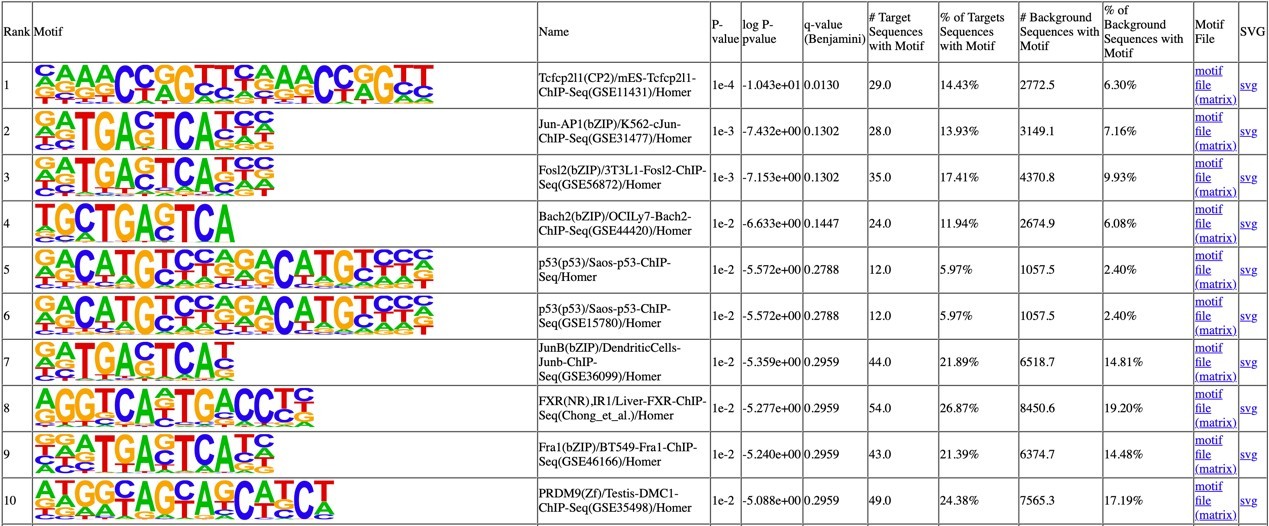
Furthermore, when these UBP1-upregulated and UBP1-downregulated genes are analyzed separately for motif position relative to the TSS, a clear pattern emerges: UBP1-upregulated genes show motif enrichment flanking the TSS, whereas UBP1-downregulated genes show enrichment overlapping the TSS (Fig 6D). If the transcriptional changes were non-specific secondary consequences of prolonged UBP1 overexpression, one would not expect this position-specific distribution. Finally, this positional specificity is corroborated by the chimeric reporter experiments (Fig 6A-C), where moving the UBP1 binding site across the TSS in an otherwise identical promoter directly switches the regulatory outcome. The concordance among the de novo motif discovery, the genome-wide positional analysis, and the functional reporter assays supports the biological relevance of the motif enrichment pattern.
(10) The title for Figure 6 is "UBP1 binding site determines the UBP1-Med16 inhibition in HIV-1 transcription" but the data do not convincingly show this.
We appreciate this suggestion. We have revised the title to "The position of the UBP1 binding site relative to the TSS dictates whether MED16-UBP1 activates or represses transcription.". For clarification, Figure 6 not only demonstrates that the UBP1 binding position dictates MED16-UBP1-mediated inhibition in the HIV-1 context, but also revealed that this positional effect could be generalized to endogenous genes: UBP1 motifs flanking the TSS are associated with activation, while motifs overlapping with the TSS are associated with repression.
(11) Figure 7: The data and the experiment do not support the claim in the title that "MED16-UBP1 complex prohibited PIC formation of HIV-1 transcription". I cannot convince myself that there are meaningful differences between the results shown in 7B, but it's hard to judge because there are no replicates and no quantitation.
We have revised the title from "MED16-UBP1 complex prohibited PIC formation of HIV-1 transcription" to "MED16 interferes with HIV-1 PIC assembly at the TSS via its interaction with UBP1." We have also provided quantification of the Western blot signals from replicate experiments in Figure 7B, which confirms statistically significant differences in CDK8 binding, Pol II pSer5 signals, and TFIIB retention between conditions. We note that the key observations in Figure 7B were consistently observed across multiple pilot experiments prior to the final dataset presented in the manuscript. Thus, the reported differences are reproducible and not based on a single experiment.
(12) The immobilized template experiments had only -78 upstream and +60 downstream of the TSS. By my understanding, much more upstream DNA is needed to allow a PIC to assemble, because the 5'-end bead attachment will block. I think this was outlined in an article by the Carey lab, but I'm not sure. A point here is that it would be reassuring for the authors to show that PIC assembly was occurring and that transcription was responsive to a transcription factor, similar to what the Carey lab has done with immobilized templates. See, for example, Figure 1 in Lin & Carey Curr Protocol Mol Biol 2012 Ch12 unit 12.14.
We thank the reviewer for raising this technical consideration. We respectfully offer a different perspective based on current structural data on the human PIC.
A recent cryo-EM study of the human Mediator-bound preinitiation complex (4) demonstrated that the PIC spans approximately 50 bp upstream and downstream of the TSS. The DNA templates used for structural determination in that study were generally within 105 bp upstream and 63 bp downstream of the TSS. Our HIV-1 template (-78 to +60, i.e., 78 bp upstream and 60 bp downstream of the TSS) falls within this well-characterized range and provides sufficient space for PIC assembly.
Regarding the choice of the -78 boundary: the HIV-1 core promoter is defined as -78 to +60, and the region from -78 to -105 encompasses the HIV-1 enhancer, which contains additional regulatory elements including NF-κB and NFAT binding sites. We deliberately excluded these enhancer elements to avoid confounding regulatory inputs and to focus specifically on the UBP1 binding site at the TSS, which is the central focus of our model. The robust luciferase mRNA production observed in wild-type nuclear extract (Fig 7C) provides direct functional evidence that PIC assembly and transcription initiation proceed efficiently on this template under our conditions.
Author response image 5.
Promoter templates used for human PIC assembly (Chen et al., Science 372, eaba8490, 2021): templates within −105 to +65 bp of the TSS support PIC formation
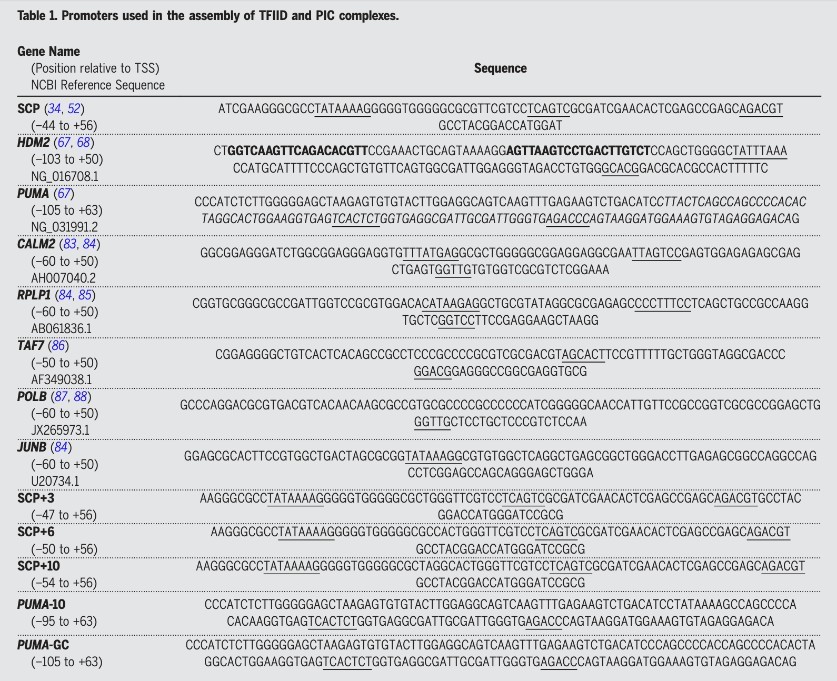
(13) Related to the above concern, the qPCR analysis from the extract experiments may be misleading because of contaminating nucleic acids in the extract. More control experiments are needed, such as no NTP controls.
We thought this concern has been addressed by our experimental design.
First, the PIC step in our experimental design (Fig 7B, "PIC") is the no-NTP control: nuclear extract is incubated with the immobilized template without NTPs. After washing, the proteins bound at this step are analyzed by Western blot, and importantly, there is no transcription occurred at this step. Transcription is then initiated by adding NTPs (Fig 7B, "Trx."), and the supernatant from this step is collected for qPCR analysis of transcription.
Second, it is unlikely that the contaminating nucleic acids from the nuclear extract could confound our qPCR results, because the qPCR analysis specifically detects Luciferase mRNA transcribed from the immobilized HIV-1-Luciferase template, which is absent from eukaryotic genomes; and the endogenous genomic DNA or RNA cannot generate a false-positive signal.
Lastly, after transcription, the immobilized templates are retained on the streptavidin beads and removed, while only the supernatant containing newly synthesized RNA is collected for qPCR. Any residual template DNA or extract-derived nucleic acids bound to the beads are therefore excluded from the qPCR sample.
(14) Some references are made with the format of (author name, year), but others use numbers.
The citation format has been unified throughout the manuscript.
(15) On line 111-115, it is stated that 2,5 HD somehow "does not interfere with weak hydrophobic interaction due to different positions of hydroxyls" with no reference. Both 1,6 HD and 2,5 HD are hydrophobic molecules, and they will disrupt protein structure. The authors make a point about the differential results with 1,6 HD vs. 2,5 HD, but it's not compelling and not justified.
We have now provided the reference to support this statement. The specificity of the 1,6-HD effect is further clarified as follows.
1,6-HD and 2,5-HD are structural isomers sharing the same chemical formula and molecular weight. The key difference lies in the positions of their hydroxyl groups (See Author response image 6). The position of the two hydroxyl groups changes both the molecule’s shape and how it interacts with water and hydrophobic surfaces.
In 1,6-HD, the two -OH groups sit at the ends of the chain, giving a more symmetric, flexible molecule, while in 2,5-hexanediol the -OH groups are closer to the middle, which changes polarity distribution and local geometry (5, 6). The distinctive structures matter because hydroxyl groups strongly hydrogen-bond with water. When they are terminal and well separated in 1,6-HD, the molecule can present a more balanced hydrophilic “cap” at both ends while keeping a relatively long hydrophobic center, which helps 1,6-HD partition into and disturb weakly interacting hydrophobic regions in condensates or hydrophobic interfaces (Author response image 6). By contrast, moving the hydroxyls inward in 2,5-HD does not help with disrupting the hydrophobic interfaces (Author response image 6). That is why 2,5-HD is often used as a comparison compound: it has the similar chemical formula, but the different hydroxyl pattern usually makes it a weaker or at least differently acting perturbant.
Author response image 6.
Differential disruption of hydrophobic interfaces by 1,6-HD vs 2,5-HD
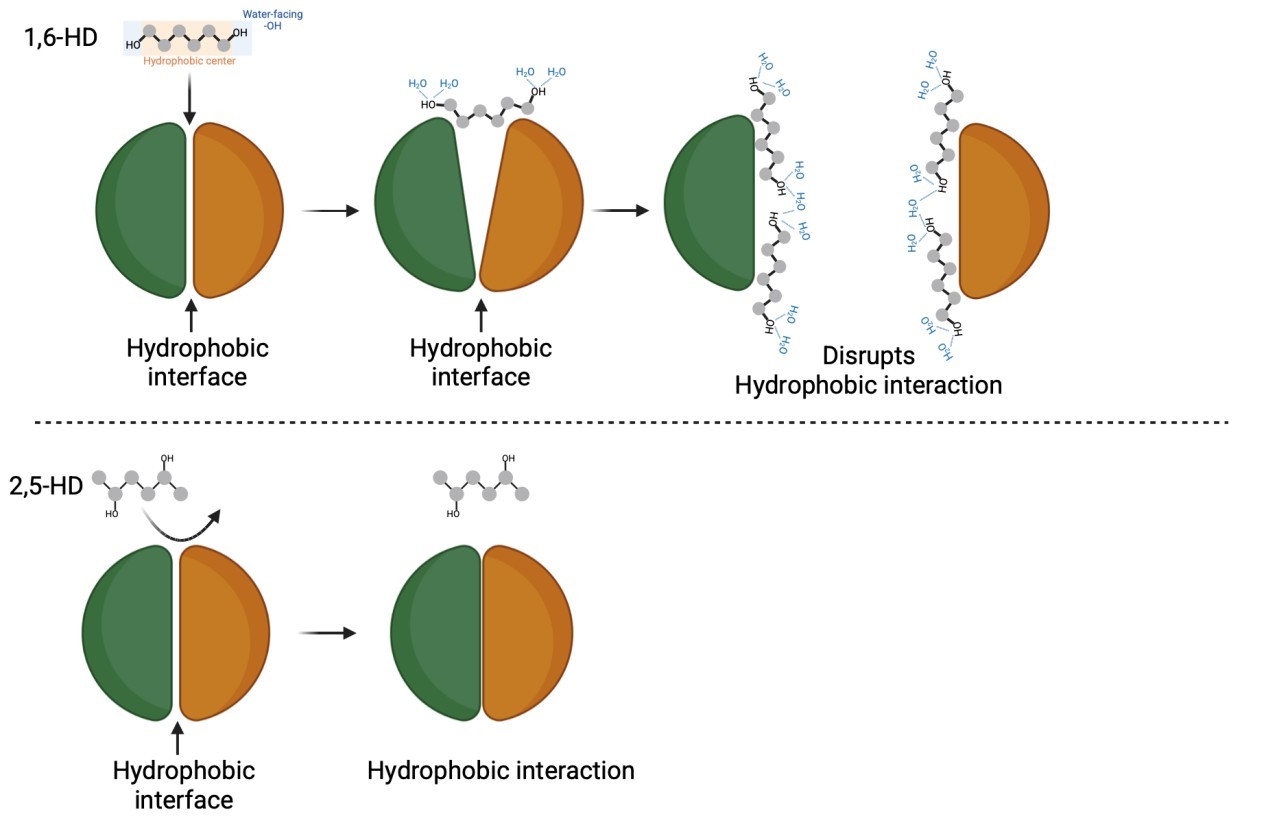
(16) On lines 117-120, the authors claim that Med16 is "integrated into the Mediator complex through weak hydrophobic interaction but not ionic interaction" based upon a few IP results. They then state (lines 130-131) that "the interaction between Mediator and Med16 is an unstable hydrophobic interaction." These statements make no sense based on any data shown, and they ignore the fact that Med16 purifies with Mediator from many different purification protocols. It's safe to say that its interaction with Mediator results from strong, extensive hydrophobic interfaces, which is further supported by actual structural data. The authors should check their reasoning here because they are over-interpreting their results, and this will be misleading to readers.
We thank the reviewer for this important suggestion. The reviewer is right that our original phrasing—particularly "unstable hydrophobic interaction"—was imprecise and inconsistent with the established structural data. As the reviewer notes, MED16 co-purifies with the Mediator complex through multiple purification protocols, and recent cryo-EM structures (4) reveal that MED16 engages in extensive hydrophobic interfaces with neighboring tail module subunits, particularly MED24 and MED25. We fully agree that this is a strong, hydrophobic interaction in the physiological context.
Our 1,6-hexanediol experiments demonstrated that the MED16-Mediator interface does have a hydrophobic character, which renders the sensitivity to 1,6-HD disruption. This does not mean the interaction is weak. We have now carefully described the relevant statements in the revised manuscript.
Reviewer #3 (Recommendations for the authors):
(1) It is not accurate to claim that "198 (genes) were repressed by shMED16 knockdown (Fig 4B and 4C)". These genes were simply not activated by UBP1 in the knockdown cells.
We thank the reviewer for this careful distinction. We have revised the text to state that the UBP1-activated genes were “profoundly downregulated upon MED16 depletion” rather than “repressed by shMED16 knockdown”. The biological point remains unchanged: MED16 is required for UBP1 to activate this set of target genes.
(2) Like the majority of experiments presented, the RNA-seq presented in Figure 4 may reflect indirect effects of MED16 loss. As such, the results do not support the claim that "This result demonstrated that UBP1 and MED16 collaborate to regulate transcription".
We acknowledge that RNA-seq data from MED16 knockdown cells alone cannot distinguish direct from indirect effects. However, we did not rely on the RNA-seq data alone to support a collaborative role for UBP1 and MED16.
The key evidence comes from experiments comparing wild-type MED16 with the MED16Δαβ mutant. MED16Δαβ integrates into the Mediator complex normally but cannot bind UBP1 (Fig 2B). When overexpressed in wild-type cells, wild-type MED16 inhibits the UBP1-driven reporter activity through a squelching effect. In contrast, MED16Δαβ has no effect on the UBP1 reporter assay (Fig 3G), and the same is true for the HIV-1 reporter assays (Fig 5G). Thus, MED16 must both integrate into the Mediator complex and directly bind UBP1 to support UBP1-mediated transcription.
In addition, the genes identified as UBP1-MED16 co-regulated by RNA-seq are enriched for specific biological processes—angiogenesis (Fig 4D-E)—that align with the known physiological functions of UBP1. Such functional coherence would be unexpected if the transcriptional changes were merely non-specific secondary consequences of Mediator disruption.
Thus, while we agree that RNA-seq alone has limitations, the convergent evidence from the MED16Δαβ mutant and the functional specificity of the co-regulated gene set supports a collaborative role for UBP1 and MED16 in transcriptional regulation.
(3) The data in Figure 4 are not presented with controls documenting the relative expression levels of MED16 and UBP1. For example, it would be important to understand the level of UBP1 overexpression achieved, relative to endogenous UBP1 levels in HeLa cells.
We agree with the reviewer that documenting expression levels is important. Author response image 7 are the CPM values for UBP1 from our RNA-seq data, confirming robust overexpression in the UBP1-overexpression condition compared with the control. The MED16 protein levels in the knockdown cells can be found in Fig 3D, as the same MED16-knockdown HeLa cell line was used for the RNA-seq experiment.
Author response image 7.
UBP1 expression level derived from RNA-seq
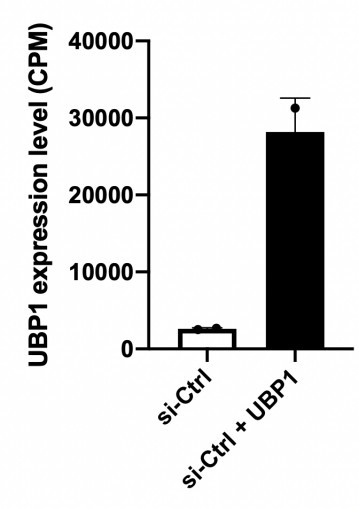
Regarding the physiological relevance of UBP1 overexpression, several observations support that the transcriptional effects we observe are specific rather than artifacts of overexpression: (i) the UBP1-activated genes are enriched for pathways known to be regulated by UBP1—angiogenesis (Fig 4D-E)—rather than showing random, non-specific activation; (ii) the activation of these genes is attenuated upon MED16 knockdown, demonstrating dependence on the MED16-UBP1 interaction; and (iii) in reporter assays, the MED16 mutant lacking its C-terminal αβ-domain fails to competitively inhibit UBP1 driven reporter transcription even when UBP1 is similarly overexpressed (Fig 3G), indicating that the competitive inhibition of the UBP1 reporter depends specifically on the MED16-UBP1 interaction interface, rather than on the amount of UBP1 protein overexpressed.
(4) The enhancer-promoter architecture of the luciferase construct used in Figure 3 is not sufficiently described. Are the elements far enough apart that Mediator-dependent looping is required for transcription, for example?
We appreciate the reviewer's question. The UBP1 reporter construct used in Figure 3 is derived from the mouse α-globin gene promoter, a well-established natural target of UBP1/TFCP2(7, 8). The native α-globin promoter contains two endogenous UBP1/TFCP2 binding sites; to increase the reporter's sensitivity to UBP1, we expanded these to six tandem copies. Critically, this expansion preserved the native architecture of the promoter—the relative positions of the UBP1 binding sites, the CCAAT box, the TATA box, and the TSS were not altered. The entire reporter construct spans only 198 bp in total length. At this scale, all regulatory elements reside within a compact proximal promoter region, with no element separated by a distance that would require DNA looping for functional communication. The reporter therefore measures UBP1-dependent transcriptional activation from the proximal promoter, consistent with the canonical role of Mediator in facilitating PIC assembly rather than mediating long-range enhancer-promoter interactions. We have added a detailed description of the construct architecture to the Methods section.
(5) The identification of matches to the UBP1 consensus sequence in a promoter does not prove that this is how UBP1 overexpression is impacting their transcription. "highly matched UBP1 motifs were identified in their promoters (Fig. 4F), leading to their activation when UBP1 was overexpressed."
We agree with the reviewer that the presence of a UBP1 consensus motif in a promoter does not by itself prove direct regulation. We have revised the original statement: the activation of these genes by UBP1 overexpression is now described as "associated with" the presence of UBP1 motifs in their promoters.
We acknowledge that the ideal experiment to demonstrate direct UBP1 occupancy would be ChIP-seq. However, ChIP-grade antibodies against UBP1 are not commercially available, and no UBP1 ChIP-seq datasets exist in public databases. We attempted to carry out the ChIP-seq ourselves but were unable to obtain sufficiently good-quality data.
In the absence of ChIP data, three lines of evidence indicate that the identified UBP1 motifs are functionally relevant. First, motif analysis of UBP1-upregulated genes using HOMER identified the CP2 family binding motif (CNRG-N6-CNRG) as the most significantly enriched motif. This demonstrates that UBP1-binding-dependent transcriptional could be preserved in our RNA-seq data. Second, when we examine the positional distribution of these motifs, a clear pattern emerges: UBP1 motifs flank the TSS in activated genes, but overlap the TSS in repressed genes (Fig 6D). Indirect effects would not produce this position-specific pattern. Third, our chimeric reporter experiments (Fig 6A-C) directly test this position effect: moving the UBP1 binding site upstream of the TSS leads to activation, while moving it to overlap the TSS leads to repression. Together, these three independent approaches support the conclusion that UBP1 regulates these genes through the motifs we identified. See Author response image 4.
(6) Lines 266 and 277 are redundant.
We have carefully reviewed lines 266 and 277. Line 266 is the topic sentence (caption) of the section ("MED16 collaborates with UBP1 to inhibit HIV-1 transcription"), which introduces the overall conclusion, while line 277 describes the specific experimental result ("MED16 inhibited HIV-luciferase activity in a dose-dependent manner"). These serve distinct rhetorical functions. We have ensured that no other redundant phrasing exists elsewhere in the section.
(7) The mere correlation of binding site position with activation status does not prove "that UBP1 may act as either a transcriptional activator or repressor, depending on distance of its binding site to TSS."
We appreciate the reviewer's concern regarding the distinction between correlation and causation. The genome-wide analysis (Fig 6D) reveals an association between UBP1 motif position and transcriptional outcome, which prompts us to postulate that the UBP1 binding position could dictate the transcriptional activity level. The causal evidence comes from the chimeric reporter experiments (Fig 6A-C), in which we directly manipulated the position of the UBP1 binding site relative to the TSS in an otherwise identical promoter background. Placing the UBP1 binding site at the TSS resulted in MED16-UBP1-dependent repression, whereas placing it upstream of the TSS did not. This controlled experiment demonstrates that changing only the position of the UBP1 binding site is sufficient to switch the regulatory outcome, thereby establishing a causal relationship between binding site position and transcriptional effect. We have revised the text to clearly distinguish the correlational genome-wide analysis from the causal reporter experiments.
(8) In Figure 7, MED16 overexpression results in less CDK8 binding. This undermines the claim that MED16 overexpression lowers transcription by binding to UBP1, and suggests an indirect effect.
We appreciate the reviewer's careful observation. The reduction in CDK8 binding upon MED16 overexpression is consistent with our model: MED16, through UBP1 occupying the TSS, interferes with PIC assembly, of which CDK8 is a component. Importantly, the input levels of CDK8 and other Mediator subunits remained unchanged across the three conditions (Fig 7B), indicating that the reduced CDK8 signal in the PIC is not due to altered protein expression.
In support of the specificity of the transcriptional effect, MED16Δαβ—which integrates into the Mediator complex but cannot bind UBP1 (Fig 2B)—fails to competitively inhibit either the UBP1 reporter (Fig 3G) or the HIV-1 reporter (Fig 5G), confirming that the transcriptional outcome depends on the MED16-UBP1 interaction.
(9) Figure 8F is not referenced in the text or legend.
Figure 8F has now been referenced in the Results and Discussion section.
Reference:
(1) Wang G, Cantin GT, Stevens JL, Berk AJ. Characterization of mediator complexes from HeLa cell nuclear extract. Mol Cell Biol. 2001;21(14):4604-13.
(2) Yamazaki T, Souquere S, Chujo T, Kobelke S, Chong YS, Fox AH, et al. Functional Domains of NEAT1 Architectural lncRNA Induce Paraspeckle Assembly through Phase Separation. Molecular Cell. 2018;70(6):1038-+.
(3) Duttke SH, Guzman C, Chang M, Delos Santos NP, McDonald BR, Xie J, et al. Position-dependent function of human sequence-specific transcription factors. Nature. 2024;631(8022):891-8.
(4) Chen X, Yin X, Li J, Wu Z, Qi Y, Wang X, et al. Structures of the human Mediator and Mediator-bound preinitiation complex. Science. 2021;372(6546).
(5) Zheng T, Wake N, Weng SL, Perdikari TM, Murthy AC, Mittal J, et al. Molecular insights into the effect of 1,6-hexanediol on FUS phase separation. EMBO J. 2025;44(10):2725-40.
(6) Romero CM, Páez MS, Miranda JA, Hernández DJ, Oviedo LE. Effect of temperature on the surface tension of diluted aqueous solutions of 1,2-hexanediol, 1,5-hexanediol, 1,6-hexanediol and 2,5-hexanediol. Fluid Phase Equilibr. 2007;258(1):67-72.
(7) Lim LC, Swendeman SL, Sheffery M. Molecular cloning of the alpha-globin transcription factor CP2. Mol Cell Biol. 1992;12(2):828-35.
(8) Chae JH, Kim CG. CP2 binding to the promoter is essential for the enhanced transcription of globin genes in erythroid cells. Mol Cells. 2003;15(1):40-7.
eLife Assessment
This is a useful study that seeks to elucidate the molecular mechanisms underlying spinal circuit assembly. The authors demonstrate that loss of Onecut transcription factors in spinal motor neurons affects the size and spatial distribution of pre-motor interneurons. The main conclusion that Onecut acts through Neurotrophin-3 to regulate interneuron development in a non-cell autonomous manner is partially supported by the data, rendering the study incomplete. The work will be of broad interest to cell and developmental biologists.
Reviewer #1 (Public review):
Summary:
This is a useful study by Angla et al that investigates the basis of observations made from previous studies where loss of Onecut (OC) transcription factors lead to changes in spinal interneuron populations that do not themselves normally express OC. The authors hypothesize that OC expression in spinal motor neurons has non-cell-autonomous effects on pre-motor interneuron (V1, V2a/b/c) population size and distribution. By knocking out OC in the motor neuron lineage (i.e., downstream of Olig2, a motor neuron progenitor marker gene), they indeed show that motor neuron-specific loss of OC expression decreases V2c interneuron number and alters the spatial distribution of V1, V2a, V2b, V2c populations. Using bulk RNA-sequencing of WT and OC conditional knockout (cKO) motor neurons, the authors identify that neurotrophic factor Ntf3 as another factor that is responsible for the non-cell-autonomous effects on the interneuron population; upon knock out of Ntf3 downstream of Olig2 they show that this leads to increased interneuron numbers and alters their spatial distribution, ultimately leading to dysregulation of spinal motor circuits and motor activity.
Strengths:
The authors use sophisticated genetic tools to precisely remove OC and Ntf3 expression in a lineage-specific manner and comprehensively assess the downstream effects across brachial, thoracic, lumbar levels of the spinal cord, as well as at two developmental timepoints, E12.5 and E14.5.
Weaknesses:
The evidence supporting their claims is incomplete. In figure 2 and 4, the control distributions (despite reporting the same populations in the same regions) look different, suggesting large sample-to-sample variance in distribution. The authors explain that this is due to several technical limitations in their study.
Furthermore, the way the Ntf3 results are framed can be misleading; it reads as though one of the main claims of this study is that OC acts through Ntf3.
Reviewer #2 (Public review):
The study by Angla et al. proposes a model in which NT-3 produced by motor neurons regulates interneuron numbers and distribution in a non-cell autonomous manner. The authors demonstrate that ablation of motor neurons (MNs) and global and conditional deletion of OC transcription factors lead to changes in interneuron distribution. They identify that NT3 is upregulated after MN-specific OC deletion in RNA-seq experiments and show that olig2-cre mediated NT3 deletion leads to increased ventral interneuron numbers, altered distribution and defects in locomotor behavior. The authors conclude that MN-derived NT3, under OC control, regulates interneuron development. While this is an intriguing hypothesis, the study does not consolidate the results from the different experimental models in a cohesive model to provide any mechanistic insights into how NT3 may accomplish this function.
(1) The authors utilize different experimental models (OC transcription factor global and conditional knockouts, DTA ablation and NT3 deletion) to show that MNs may influence interneuron numbers and positioning, but there doesn't seem to be a direct link into how each manipulation relates to the others in an informative way. For example, the relationship between OC and NT3 deletion data is not entirely clear, even though NT3 is downstream of OC transcription factors. Both deletions lead to changes in interneuron distribution but there doesn't seem to be any correlation between the two that relates to relative changes in NT3 levels. Although it is understandable that transcription factor manipulations may have additional effects, it is hard to derive any mechanistic insights into how exactly MNs influence interneuron differentiation or migration from the data presented here. Similarly, while the rationale for following up on NT3 seems to be the chick electroporation experiments, only a very minor decrease in Chx10 interneurons is shown in those experiments. Shouldn't NT3 overexpression lead to substantial decreases in IN numbers according to the authors' model?
(2) The study primarily quantifies interneuron numbers and distribution at different levels of the spinal cord and under different genetic manipulations. In different figures, the values and distributions shown for controls vary quite a lot. For example, in figure 2B vs figure 4B, the number of FoxP2+ V1 neurons at brachial levels is ~350 vs 125. Similarly, the control distributions in 2I and 4I are quite different. While this can be partially explained by technical issues, it remains challenging to determine whether the conclusions regarding the impact of each genetic manipulation on interneuron numbers and distribution are valid.
(3) It is not clear that the behavioral phenotypes seen in the olig2-cre mediated deletion of NT3 can be attributed to specific changes in interneuron development, connectivity or function. While the behavioral phenotype is in theory consistent with defects in motor circuits, there is a big gap between the embryonic changes shown here and behavior, with no in between circuit level changes in locomotor circuits shown. Thus, the behavioral experiments are not very informative as to how exactly components of motor circuits might be altered with the NT3 deletion.
Reviewer #3 (Public review):
This manuscript aims to investigate cell extrinsic mechanisms that regulate differentiation and distribution of interneuron types in the spinal cord. The authors demonstrate that the loss of motor neurons leads to changes in number and distribution of different interneuron types, specifically V0v, V1, and V2b (but not V2a). The authors then hypothesize that this phenotype may be controlled by the action of Onecut (OC) transcription factors in motor neurons. Conditional knockout of OC1 + OC2 in motor neurons using Olig2-Cre, however, does not lead to significant changes in numbers of V1, V2a, V2b interneurons, although there is a change in their spatial distribution. While the authors do not check V0v neurons in OC mutants, they do check V2c, which show a reduction in number and change in distribution. Why the same neurons are not checked across experiments is unclear. The authors then analyze existing RNA-seq data to identify factors that could be mediating effects of the OC factors in motor neurons. They identify Ntf3 as a candidate and confirm that it is upregulated in OC mutants. Conditional loss of function of Ntf3 (Olig2-Cre) leads to increases in V1, V2a, and V2b (but not V2c) interneurons and changes in distribution of all four interneuron types. However, the Ntf3 phenotypes do not necessarily suggest that it works in the same pathway as OC to control interneuron development. Finally, the authors demonstrate that these Ntf3 conditional mutants have major defects in motor function.
The main conclusions of the manuscript are that i) motor neurons non-cell autonomously control interneuron development, ii) that OC activity in Olig2 lineage cells non-cell autonomously controls aspects of interneuron development, and iii) that Ntf3 in motor neurons non-cell autonomously controls aspects of interneuron development. The mechanistic link between OC and Ntf3 activity is not clear. And the interneuron phenotype seen when motor neurons are depleted it not phenocopied by either loss of OC or Ntf3 from motor neurons. While the authors addressed some of my initial comments, the impact of this work on the field remains difficult to assess for the following reasons:
(1) The manuscript relies heavily on quantifying numbers and spatial distribution of interneuron populations. However, these do not seem to be consistent in control animals across experiments, making it difficult to interpret any changes observed in genetic manipulations. Specifically, in Fig. 2 and 4, the same markers are being used to quantify V1, V2a, V2b, and V2c interneurons in controls vs. OC (Fig. 2) or Ntf3 (Fig. 4) conditional knockouts, but the numbers of neurons and their distribution in control animals are variable between these two figures. For example, there seem to be a mean of >300 V1 neurons in E12.5 brachial sections of Fig. 2 controls, but this number is <150 in Fig. 4 controls. The cell distribution scoring is similarly variable between these controls without any explanation. The same is true for E14.5 controls used in Fig. S2 vs. Fig. S6.<br /> The authors explain in response to the 1st review that technical variability including different antibodies, different researchers performing experiments, and different mouse backgrounds may contribute to this variation, but do not include this explanation clearly in the manuscript where it would be useful for readers. It would have also helped, for example, if authors had labeled datapoints on bar plots based on the animal that they came from to understand inter-animal variability within experiments. Overall, the biological significance of the results remain difficult to interpret due to high technical variability.
(2) In the initial review, it was noted that there is no data to support the claim that OC1/2 mutants have altered interneuron development because of higher Ntf3 expression. In response to this, the authors note that the manuscript does not claim that OC exerts its non-cell autonomous effects through Ntf3 and add a new paragraph in the discussion which now addresses the fact that it is difficult to compare the phenotypes observed the different genetic manipulations presented in the work. While this paragraph addresses the incomplete mechanistic link between OC and Ntf3, it also decreases the mechanistic impact of the work.
(3) In Figure 3E-3G, the authors show that some V1, V2a, V2b interneurons express the Ntf3 receptor TrkC. It is not stated (apologies if I missed it) what age this expression is, and from the images, it looks like in addition to medially located newborn neurons being negative, laterally located Gata3 interneurons are also broadly negative for TrkC, and many Foxd3 and Chx10 interneurons are also negative. Separate images of each channel and/or scoring would help clarify this. If many relevant interneurons are indeed TrkC negative, how this affects the conclusions should be addressed in the manuscript.
(4) Behavioral phenotypes are not necessarily caused by Ntf3's role in premotor interneuron development.
Author response:
The following is the authors’ response to the original reviews.
Public Reviews:
Reviewer #1 (Public review):
Summary:
In this study, Angla et al investigate the basis of observations made from previous studies where loss of Onecut (OC) transcription factors leads to changes in spinal interneuron populations that do not themselves normally express OC. The authors hypothesize that OC expression in spinal motor neurons has non-cell-autonomous effects on pre-motor interneuron (V1, V2a/b/c) population size and distribution. By knocking out OC in the motor neuron lineage (i.e., downstream of Olig2, a motor neuron progenitor marker gene), they indeed show that motor neuron-specific loss of OC expression decreases V2c interneuron number and alters the spatial distribution of V1, V2a, V2b, and V2c populations. Using bulk RNA-sequencing of WT and OC conditional knockout (cKO) motor neurons, the authors identify that the neurotrophic factor Ntf3 is downregulated by OC expression. They subsequently hypothesize that the non-cell-autonomous effects observed by loss of OC expression in motor neurons can be explained by de-repression of Ntf3. To test this, the authors conditionally knock out Ntf3 downstream of Olig2 and show that this leads to increased interneuron numbers and alters their spatial distribution, ultimately leading to dysregulation of spinal motor circuits and motor activity.
Strengths:
The authors use sophisticated genetic tools to precisely remove OC and Ntf3 expression in a lineage-specific manner and comprehensively assess the downstream effects across brachial, thoracic, lumbar levels of the spinal cord, as well as at two developmental timepoints, E12.5 and E14.5.
Weaknesses:
There are two main concerns that are not fully addressed:
(1) Based on the effects observed with OC vs. Ntf3 cKO, it is unclear whether OC is indeed exerting its non-cell-autonomous effects via Ntf3. Knocking out both Ntf3 and OC and comparing the effects to those seen with just OC cKO alone could provide more insight on this point.
In this study, we did not intend to demonstrate that Onecut transcription factors exert their non-cell autonomous action on spinal interneuron development by regulating Ntf3 expression, and we do not state in the manuscript that this is the case. We only show that Onecut factors and Ntf3, the expression of which they regulate, contribute to the non-cell autonomous regulation of spinal interneuron development by the motor neurons. We are convinced that Onecut factors could regulate multiple independent factors and pathways involved in extrinsic regulation of interneuron development. This possibly also includes, as demonstrated in cell culture for multiple homeoproteins including human Onecut factors, the intercellular transfer of the Onecut homeoproteins during spinal cord development, a process that we are currently investigating. Knocking out both OC and Ntf3 in the motor neurons, beyond being technically extremely challenging (1/64 probability to obtain double-mutant embryos), would not enable to address this question, as it will simply results in the addition of two different defects.
Also, a quantitative summary of the effects of Ntf3 overexpression in motor neurons in the chick is lacking.
A quantitative summary of the effects of Ntf3 overexpression in the chicken embryonic spinal cord is provided in Figure S2.
(2) How the authors assess changes in the spatial distribution of interneurons is unclear. In Figures 2 and 4, the control distributions (despite reporting the same populations in the same regions) look different, suggesting large sample-to-sample variance in distribution. Although the authors report that several sections in each level were taken from at least three animals for each condition, it's unclear how variance within WT or cKO sections was accounted for in the final statistical evaluation. It seems at a glance that a comparison between control samples in Figure 2 and Figure 4 could report statistically significant differences, which would be problematic. A more rigorous report of sample-to-sample variance and a more in-depth explanation of the statistical methods are needed.
The experimental procedure to analyze the spatial distribution of spinal interneurons at different stages of development is described in details in the “Statistical analyses” paragraph of the Materials and Methods section of the manuscript, and has been repeatedly used by ourselves [1,2] and by others (see for example [3-5]) to conduct similar analyses.
We also noticed that the distribution of the different analyzed interneuron populations in the control embryos showed some differences between the cOc1Oc2<sup>-/-</sup> and in the cNtf3<sup>-/-</sup> lines. Several parameters can account for this observation. First, this study has been conducted over a period of 15 years, different investigators each contributing to different steps of the analysis. Second, the genetic background of these two lines is not identical, impacting both the duration of the gestation (hence, the embryonic stage of the performed analyses, even if the embryos were collected on the same gestation day) and possibly the distribution of some interneuron populations. Third, because of evolutions in the availability of the primary antibodies used to label the interneuron populations of interest, the same antibodies were not used throughout the study, as stated for in the Materials and Methods section for Chx10, Gata3 and Sox1, although the same antibody was used by the same investigator to label the same interneuron population in each mouse line at each developmental stage.
A detailed description of the number of sections and embryos included in each analysis as well as the whole statistical workflow that was used for the distribution analyses, which takes into account variance within control or mutant samples, is now provided in the revised version of the manuscript.
Reviewer #2 (Public review):
The study by Angla et al. proposes a model in which NT-3 produced by motor neurons regulates interneuron numbers and distribution in a non-cell autonomous manner. The authors demonstrate that ablation of motor neurons (MNs) and global and conditional deletion of OC transcription factors lead to changes in interneuron distribution. They identify that NT3 is upregulated after MN-specific OC deletion in RNA-seq experiments and show that olig2-cre mediated NT3 deletion leads to increased ventral interneuron numbers, altered distribution, and defects in locomotor behavior. The authors conclude that MN-derived NT3, under OC control, regulates interneuron development. While this is an intriguing hypothesis, additional experiments are needed to support it and strengthen the link between the different experiments described here.
(1) The study primarily quantifies interneuron numbers and distribution at different levels of the spinal cord and under different genetic manipulations. Experimental details are lacking, defining how many sections were analyzed (several are noted in the methods) and how the rostrocaudal levels of the spinal cord were precisely aligned.
A detailed description of the number of sections and embryos included in each analysis as well as the whole statistical workflow that was used for the distribution analyses is now provided in the revised version of the manuscript. The rostrocaudal levels of the spinal cord were precisely aligned using the distribution of Foxp1 in the Lateral Motor Columns (LMCs) at brachial or lumbar levels of the spinal cord, which is also indicated in the revised version.
In different figures, the values and distributions shown for controls vary quite a lot. For example, in Figure 2B vs Figure 4B, the number of FoxP2+ V1 neurons at brachial levels is ~350 vs 125. Similarly, the control distributions in 2I and 4I are quite different. This makes it challenging to determine whether the conclusions regarding the impact of each genetic manipulation on interneuron numbers and distribution are valid.
Several parameters can account for these observations. First, this study has been conducted over a period of 15 years, different investigators each contributing to different steps of the analysis. Second, the genetic background of these two lines is not identical, impacting both the duration of the gestation (hence, the embryonic stage of the performed analyses, even if the embryos were collected on the same gestation day) and possibly the distribution of some interneuron populations. Third, because of evolutions in the availability of the primary antibodies used to label the interneuron populations of interest, the same antibodies were not used throughout the study, as stated for in the Materials and Methods section for Chx10, Gata3 and Sox1, although the same antibody was used by the same investigator to label the same interneuron population in each mouse line at each developmental stage.
(2) The relationship between OC and NT3 deletion data is not entirely clear. Both deletions presumably lead to changes in interneuron distribution, but is there any reverse relationship between the two that relates to relative changes in NT3 levels? The authors do not directly compare NT3 and OC KO IN distributions. Similarly, one might expect a decrease in interneuron numbers in OC mutants, which is only reported for V2c neurons. However, the image presented in Figure 2G shows an equal number of V2c INs in control and mutant.
In this study, we did not intend to demonstrate that Onecut transcription factors exert their non-cell autonomous action on spinal interneuron development by regulating Ntf3 expression, and we do not state in the manuscript that this is the case. We only show that Onecut factors and Ntf3, the expression of which they regulate, contribute to the non-cell autonomous regulation of spinal interneuron development by the motor neurons. We are convinced that Onecut factors could regulate multiple independent factors and pathways involved in extrinsic regulation of interneuron development. For example, as mentioned above, we observed intercellular transfer of the Onecut homeoproteins during spinal cord development, suggesting different strategies for non-cell autonomous regulation of interneuron development. The two mouse lines studied here consist on the one side in a combination of OC inactivation and Ntf3 increased expression, and on the other side in Ntf3 inactivation. Therefore, a reverse relationship between the changes in interneuron distribution is not expected. Furthermore, gain-of-function and loss-of-function experiments in mouse models frequently generate phenotypes that are not inverse to each other.
(3) It is not clear that the behavioral phenotypes seen in the olig2-cre mediated deletion of NT3 can be attributed to changes in interneuron development. How about a role of NT3 in oligodendrocytes? There is a big gap between the embryonic changes shown here and behavior, with no in-between circuit-level changes in locomotor circuits shown.
We agree, the motor behavior changes that we recorded in Ntf3 conditional mutant mice are, as stated, “consistent with the hypothesis that Ntf3 produced by MNs is required to generate locomotor circuits with properly coordinated activity” but do not demonstrate a direct causal relationship. However, investigating the intrinsic activity of the spinal locomotor circuits, independently from, for example, oligodendrocyte contribution may prove to be extremely challenging and was beyond the scope of this study. In addition, to our best knowledge, Ntf3 has not been shown to be expressed in healthy oligodendrocytes in vivo, and TrkC has not been reported to be displayed by these cells in the same conditions.
A more restricted manipulation would be deleting TrkC from specific interneuron populations. Related to this, although TrkC is shown to be broadly expressed in ventral interneurons, it is not shown specifically to colocalize with any of the interneuron markers. The authors should validate that the receptor is expressed in the subsets that they are investigating.
We agree, investigating the consequences of inactivating the TrkC receptor in specific interneuron populations would be extremely informative. However, this experiment is also very challenging to perform, as most of the driver lines available to target spinal interneuron populations additionally target multiple neuronal populations outside of the spinal cord that are also involved in the control of movements and could therefore induce confounding effects on motor behavior analyses.
We thank the reviewer for suggesting to investigate in more details the interneuron populations that display TrkC receptors, which is now included in the revised version of the manuscript (Figure 3E-G).
(4) The rationale for following up on NT3 seems to be the chick electroporation experiments; however, no changes in distribution are shown in those experiments, and only a very minor decrease in Chx10 interneurons. Shouldn't NT3 overexpression lead to substantial decreases in IN numbers according to the authors' model? The "data not shown", which presumably refers to distribution, would be important to show here, to further support this rationale.
Chicken spinal cord electroporation only enables to study spinal cord development for a few days, given the high mortality rate observed after longer incubation. At the stage we collected the electroporated embryos for analyses, interneuron migration has barely been initiated, and distribution cannot be studied yet. Consistently, we are not aware of any report of interneuron distribution analysis in electroporated chicken embryonic spinal cord, as compared to mouse embryos [1-5].
(5) The idea that NT3 downregulation causes an increase in IN numbers is not intuitive. Also, considering the DTA experiments in Figure 1, showing that MN ablation leads to a decrease in several IN subtypes and no changes in V2a neurons. It would be helpful for the reader if the authors could synthesize their results in the discussion and reconcile their experimental findings.
We agree, this has now been included in the Discussion section of the revised manuscript.
Reviewer #3 (Public review):
This manuscript aims to investigate cell extrinsic mechanisms that regulate the differentiation and distribution of interneuron types in the spinal cord. The authors demonstrate that the loss of motor neurons leads to changes in the number and distribution of different interneuron types, specifically V0v, V1, and V2b (but not V2a). The authors then hypothesize that this phenotype may be controlled by the action of Onecut (OC) transcription factors in motor neurons. Conditional knockout of OC1 + OC2 in motor neurons using Olig2-Cre, however, does not lead to significant changes in the numbers of V1, V2a, and V2b interneurons, although there is a change in their spatial distribution. While the authors do not check V0v neurons in OC mutants, they do check V2c, which show a reduction in number and change in distribution. Why the same neurons are not checked across experiments is unclear. The authors then analyze existing RNA-seq data to identify factors that could be mediating the effects of the OC factors in motor neurons. They identify Ntf3 as a candidate and confirm that it is upregulated in OC mutants. Conditional loss of function of Ntf3 (Olig2-Cre) leads to increases in V1, V2a, and V2b (but not V2c) interneurons and changes in the distribution of all four interneuron types. Finally, the authors demonstrate that these Ntf3 conditional mutants have major defects in motor function.
The conclusions of this manuscript are not well supported by the data for the reasons listed below, making it difficult to assess the impact of this work on the field.
(1) The manuscript relies heavily on quantifying numbers and the spatial distribution of interneuron populations. However, these do not seem to be consistent in control animals across experiments, making it difficult to interpret any changes observed in genetic manipulations. Specifically, in Figures 2 and 4, the same markers are being used to quantify V1, V2a, V2b, and V2c interneurons in controls vs. OC (Figure 2) or Ntf3 (Figure 4) conditional knockouts, but the numbers of neurons and their distribution in control animals are variable between these two figures. For example, there seems to be a mean of >300 V1 neurons in E12.5 brachial sections of Fig. 2 controls, but this number is <150 in Fig. 4 controls. The cell distribution scoring is similarly variable between these controls without any explanation. The same is true for E14.5 controls used in Figure S1 vs. Figure S3.
We also noticed that quantifications and distributions of the different analyzed interneuron populations in the control embryos showed some differences between the cOc1Oc2<sup>-/-</sup> and in the cNtf3<sup>-/-</sup> lines. Several parameters can account for this observation. First, this study has been conducted over a period of 15 years, different investigators each contributing to different steps of the analysis. Therefore, the interneuron distribution analyses in these two mouse lines were not conducted by the same researchers. Second, the genetic background of these two lines is not identical, impacting both the duration of the gestation (hence, the embryonic stage of the performed analyses, even if the embryos were collected on the same gestation day) and possibly the distribution of some interneuron populations. Third, because of evolutions in the availability of the primary antibodies used to label the interneuron populations of interest, the same antibodies were not used throughout the study, as stated in the Materials and Methods section for Chx10, Gata3 and Sox1, although the same antibody was used by the same investigator to label the same interneuron population in each mouse line at each developmental stage.
(2) Neurotrophic factors generally promote neuronal survival. However, in this study, the loss of Ntf3 leads to increased numbers of interneurons. This finding is in disagreement with previous observations in slice cultures of spinal cords, as stated in the discussion. This discrepancy makes it even more important that the cell counts reported in the figures discussed above are robust.
Considering that neurotrophic factors only support neuronal survival would strongly neglect their important function in neuronal differentiation, which has been broadly demonstrated. Severe immunotoxic ablation of motor neurons or anti-serum blockade of Ntf3 activity severely depleted inhibitory, but not excitatory, interneurons in a highly apoptotic-prone organotypic culture model of embryonic rat spinal cord slices, which was rescued by Ntf3 in the first model [6]. Opposite results were obtained in vivo by other researchers using mouse models lacking almost all MNs due to the elimination of skeletal muscles, where the number of spinal INs remained unaffected [7,8]. Combined to our results, these in vivo observations suggest that Ntf-3 is involved in interneuron differentiation rather in their survival. Consistently, Ntf3 has been shown to promote neuronal differentiation [9].
(3) The claim that phenotypes are non-cell autonomously driven by motor neurons is not well supported. In Olig2-Cre conditional knockouts of Onecut and Ntf3, there is no confirmation that the loss of these factors is specific to motor neurons. Therefore, it cannot be ruled out that other cell populations may be mediating the phenotypes.
Combined conditional inactivation of Oc1 and Oc2 has been reported in [10]. Conditional inactivation of Ntf3 only impacts motor neurons as it is the only cell population in the ventral spinal cord wherein this factor is produced (this study and [11-13]). Furthermore, Olig2-Cre has been shown to be active in motor neurons and in V3 interneurons (see for example [14], which, for this reason, have not been studied in the frame of this project as stated in the manuscript.
(4) The claim that interneuron development is regulated by OC control of Ntf3 expression in motor neurons is not well supported. The authors show that loss of OC1/2 leads to an increase in Ntf3 expression in motor neurons. If this pathway were controlling interneurons, loss of OC function and overexpression of Ntf3 would have the same phenotype, which is not the case. Additionally, it would also be expected that loss of OC function and loss of Ntf3 function would have inverse phenotypes, which is also not the case. The phenotypes from OC loss of function and Ntf3 loss of function seem distinct from one another. The authors state that too little and too much Ntf3 are both bad for interneuron development, but there is no data to support their claim that OC1/2 mutants have altered interneuron development because of higher Ntf3 expression.
In this study, we did not intend to demonstrate that Onecut transcription factors exert their non-cell autonomous action on spinal interneuron development by regulating Ntf3 expression, and we do not state in the manuscript that this is the case. We only show that Onecut factors and Ntf3, the expression of which they regulate, contribute to the non-cell autonomous regulation of spinal interneuron development by the motor neurons. We are convinced that Onecut factors could regulate multiple independent factors and pathways involved in extrinsic regulation of interneuron development. This possibly also includes, as demonstrated in cell culture for multiple homeoproteins including human Onecut factors, the intercellular transfer of the Onecut homeoproteins during spinal cord development, a process that we are currently investigating.
(5) It is not clear that interneurons being studied express the Ntf3 receptor TrkC, which makes it difficult to assess whether changes in Ntf3 signaling are directly responsible for the phenotype.
We thank the reviewer for suggesting to investigate in more details the interneuron populations that display TrkC receptors, which is now included in the revised version of the manuscript (Figure 3E-G).
(6) While the behavioral phenotypes are consistent with Ntf3 playing a role in motor circuits, there is no evidence to suggest that Ntf3's influence on premotor interneurons being studied is driving or contributing to this phenotype, as discussed by the authors.
We agree, the motor behavior changes that we recorded in Ntf3 conditional mutant mice are, as stated, “consistent with the hypothesis that Ntf3 produced by MNs is required to generate locomotor circuits with properly coordinated activity” but do not demonstrate a direct causal relationship. However, investigating the intrinsic activity of the spinal locomotor circuits was beyond the scope of this study.
Recommendations for the authors:
Reviewer #1 (Recommendations for the authors):
(1) Figure 3: A more comprehensive overview of the RNA-seq results would be helpful to see how much gene expression is shifted as a result of OC loss (e.g., volcano plot, pathway enrichment analysis).
We agree, this has now been added in Figures 3B and S3 of the revised manuscript.
(2) Figure 2, 4: How does the spatial distribution of motor neurons change?
Describing the distribution of motor neurons is highly challenging given that the expression of markers that are collectively required to label all the motor neuron subset, including Foxp1, Hb9 and most significantly Isl1, is altered when Onecut expression is modified. Furthermore, changes in motor neuron distribution could constitute consequences of alterations in pre-motor interneuron numbers or distributions. However, as far as we can observe, motor neuron distribution was not obviously modified in the studied mutants.
(3) Figure S2: Why is Ntf3 expression so limited compared to Isl1-expressing motor neurons? An explanation would be helpful.
As stated in the Material and Methods section and in the legend of Figure S4 of the revised manuscript, expression after chicken embryonic spinal cord electroporation is transient and maximal reporter gene expression, including GFP, can usually only be visualized 24h after electroporation, but not at later stages. Forty-height hours after electroporation, only residual expression can still be detected in a few targeted cells.
Reviewer #3 (Recommendations for the authors):
(1) Changes in interneuron numbers are attributed to defects in differentiation. However, the possibility that these could be caused by changes in cell death has not been ruled out.
Absence of increased cell death had been demonstrated previously for Onecut mutant embryos [15] and has been verified now in conditional Ntf3 mutant embryos (Figure S5). Both information have been included in the text.
(2) In Figures 2 and 4, it is unclear if the images of the spinal cords are from brachial, thoracic, or lumbar levels. As the three levels frequently show different phenotypes, it is difficult to match the immunostaining with the reported quantification.
All the pictures show thoracic regions of the spinal cord, as now stated in the figure legends of the revised version of the manuscript.
(3) Statistics are missing in the cell distribution plots in Figure S1.
This is not the case in our version of the pdf file.
(4) In experiments where motor neurons are eliminated with Olig2-Cre/DTA, the authors write that progenitors are not affected without showing data. These data should be included because i) Olig2 is expressed in progenitors, so it would be expected that motor neuron progenitors are lost or reduced in this mouse, and ii) showing no changes in progenitors is crucial to the claim that postmitotic motor neurons are affected interneuron populations.
We agree, these data are now included as Figure S1 of the revised version of the manuscript.
(1) Harris, A. et al. Onecut factors and Pou2f2 regulate the distribution of V2 interneurons in the mouse developing spinal cord. Front Cell Neurosci 13 (2019). https://doi.org/10.3389/fncel.2019.00184
(2) Kabayiza, K. U. et al. The Onecut Transcription Factors Regulate Differentiation and Distribution of Dorsal Interneurons during Spinal Cord Development. Front Mol Neurosci 10, 157 (2017). https://doi.org/10.3389/fnmol.2017.00157
(3) Deska-Gauthier, D. et al. Embryonic temporal-spatial delineation of excitatory spinal V3 interneuron diversity. Cell Rep 43, 113635 (2024). https://doi.org/10.1016/j.celrep.2023.113635
(4) Bikoff, J. B. et al. Spinal Inhibitory Interneuron Diversity Delineates Variant Motor Microcircuits. Cell 165, 207–219 (2016). https://doi.org/10.1016/j.cell.2016.01.027
(5) Hayashi, M. et al. Graded Arrays of Spinal and Supraspinal V2a Interneuron Subtypes Underlie Forelimb and Hindlimb Motor Control. Neuron 97, 869–884 e865 (2018). https://doi.org/10.1016/j.neuron.2018.01.023
(6) Bechade, C., Mallecourt, C., Sedel, F., Vyas, S. & Triller, A. in J Neurosci Vol. 22 8779–8784 (2002).
(7) Grieshammer, U., Lewandoski, M., Prevette, D., Oppenheim, R. W. & Martin, G. R. Muscle-specific cell ablation conditional upon Cre-mediated DNA recombination in transgenic mice leads to massive spinal and cranial motoneuron loss. Dev Biol 197, 234–247 (1998). https://doi.org/10.1006/dbio.1997.8859
(8) Kablar, B. & Rudnicki, M. A. Development in the absence of skeletal muscle results in the sequential ablation of motor neurons from the spinal cord to the brain. Dev Biol 208, 93–109 (1999). https://doi.org/10.1006/dbio.1998.9184
(9) Dutton, R., Yamada, T., Turnley, A., Bartlett, P. F. & Murphy, M. Regulation of spinal motoneuron differentiation by the combined action of Sonic hedgehog and neurotrophin 3. Clin Exp Pharmacol Physiol 26, 746–748 (1999). https://doi.org/10.1046/j.1440-1681.1999.03108.x
(10) Toch, M. et al. Onecut-dependent Nkx6.2 transcription factor expression is required for proper formation and activity of spinal locomotor circuits. Sci Rep 10, 996 (2020). https://doi.org/10.1038/s41598-020-57945-4
(11) Buck, C. R., Seburn, K. L. & Cope, T. C. Neurotrophin expression by spinal motoneurons in adult and developing rats. J Comp Neurol 416, 309–318 (2000). https://doi.org/10.1002/(sici)1096-9861(20000117)416:3<309::aid-cne3>3.0.co;2-u
(12) Henderson, C. E. et al. Neurotrophins promote motor neuron survival and are present in embryonic limb bud. Nature 363, 266–270 (1993). https://doi.org/10.1038/363266a0
(13) Usui, N. et al. Role of motoneuron-derived neurotrophin 3 in survival and axonal projection of sensory neurons during neural circuit formation. Development 139, 1125–1132 (2012). https://doi.org/10.1242/dev.069997
(14) Debrulle, S. et al. Vsx1 and Chx10 paralogs sequentially secure V2 interneuron identity during spinal cord development. Cell Mol Life Sci 77, 4117–4131 (2020). https://doi.org/10.1007/s00018-019-03408-7
(15) Roy, A. et al. Onecut transcription factors act upstream of Isl1 to regulate spinal motoneuron diversification. Development 139, 3109–3119 (2012). https://doi.org/10.1242/dev.078501
eLife Assessment
This valuable study is a rigorous and comprehensive anatomical description of populations of spinal-projecting neurons in the brain of the larval zebrafish. The compelling data reveal a far more complete and robust visualization of these populations than past work. The scholarship is also notable, featuring thoughtful contextualization of the findings with respect to both non-mammalian and mammalian literature.
Reviewer #2 (Public review):
Summary:
Vertebrate spinal cord receives inputs from many supraspinal regions. The authors used optical backfilling to trace neurons in the zebrafish larval brain sending axons to the spinal cord . With two-photon microscopy, they managed to render a comprehensive 3D map of these neurons and drew homologs with mammalian brain structures.
Strengths:
The main strength lies in the precise 3D mapping. The fact that most of previously reported neuron groups have been confirmed by their approach is a solid endorsement of their methodology.
This study provides a comprehensive alternative anatomical reference framework for studying individual groups of supraspinal neurons with projections to the zebrafish spinal cord.
Weaknesses:
The backfilling approach does not reveal the full trajectories of axons, which is available to some degree by ZExplorer Atlas.
Author response:
The following is the authors’ response to the original reviews.
Reviewer #1 (Public review):
Summary:
The authors have achieved an excellent, thorough anatomical characterization of all spinal projecting neurons in the larval zebrafish. The comprehensive nature of their labeling approach and their quantification will make this work an instant reference benchmark for a wide number of zebrafish researchers. In addition, the scholarly approach in comparisons with other work in and outside of fish makes the manuscript valuable to researchers outside the field who would like to know how to translate between zebrafish and mouse terminologies.
Strengths:
The figures are clear and easy to follow. The literature review is impressive. The authors are careful to note the few limitations of their approach (eg the absence of Mauthner cell labeling and associated large neuron weak label). The manuscript does the whole field a major service.
Weaknesses:
No weaknesses were identified by this reviewer.
We deeply thank reviewer #1 for recognizing the importance of our work.
Reviewer #2 (Public review):
Summary:
The vertebrate spinal cord receives inputs from many supraspinal regions. The authors used optical backfilling to trace neurons in the zebrafish larval brain sending axons to the spinal cord. With two-photon microscopy, they managed to render a comprehensive 3D map of these neurons and drew homologs with mammalian brain structures.
Strengths:
The main strength lies in the precise 3D mapping. The fact that most of the previously reported neuron groups have been confirmed by their approach is a solid endorsement of their methodology. This study provides a comprehensive alternative anatomical reference framework for studying individual groups of supraspinal neurons with projections to the zebrafish spinal cord.
Weaknesses:
The whole approach could be enhanced by counter-staining their preparation to profile brain structures, including many nuclei more precisely.
Also, the backfilling approach does not reveal the full trajectories of axons, which is already available to some degree by ZExplorer Atlas.
We thank Reviewer #2 for the attention given to important details. As you will read below, our approach needed to be implemented on live larval zebrafish for the PA GFP to fluoresce only when photactivated. Although counterstains on fixed samples could have been done, it would have been difficult to trace it back in a fixed (and deformed) sample where all neurons appear GFP-positive. We wrote this publication so it can serve the field best before the release of full brain connectome in 2027. Further molecular and histological characterization will be the topic of a subsequent study. Below we will individually address the issues stated by the reviewer.
Reviewer #2 (Recommendations for the authors):
(1) The power of 800 nm laser: 1 mW in Figure 1a, 10 mW stated in the method text.
Thanks for catching this, this is now corrected to 1 mW in the revised manuscript.
(2) Figure 2c: laterality density (e.g., 90:40 by neuron numbers) is already quite clear. The laterality index is less informative if not causing confusion. Take POA as an example; shouldn't the value be close to 1, rather than -0.8 based on your formula?
The laterality density plot shows the anatomical spatial distribution of spinal descending neurons relative to the midline, whereas the laterality index is a scalar summary of the relative neuron counts on each side, independent of spatial position. For POA, we observed after pooling across animals 26 ipsilateral versus 1 contralateral neurons, which gives an LI close to -0.8 (after bootstrapping), indicating strong ipsilateral dominance. The density plot additionally shows that these neurons cluster close to the midline. We view the two measures as complementary: one quantifies laterality, the other reflects its spatial organization.
(3) Line 286, check grammar.
Corrected to "Using the ZExplorer atlas (Du et al., 2025), which contains thousands of single-neuron tracings in the larval zebrafish brain, we searched for telencephalic neurons projecting to the spinal cord."
(4) Add discussion on comparison between your approach, conventional backfill tracing method, singlecell tracing by dye or GFP, and, more importantly, ZExplorer Atlas.
We believe this comparison is sufficiently addressed in the Introduction and Discussion.
(5) Line 346, add "in bi" after "scale bar".
Corrected, thank you for spotting this.
(6) Figure 4, change label ICN to INC in c and d.
We apologize for this confusion, all of them are now corrected in the revised manuscript.
(7) Line 389, change to "ventral (top) to dorsal (bottom)". Try to use the same order for all figures, i.e., dorsal images on top and ventral ones at the bottom.
Corrected for the specific line and now all figures follow the same convention.
(8) Figure 7b, add stack location diagrams.
Added. Thank you very much for suggesting an improvement to the figure readability.
(9) Figure 7c and other figure panels, suggest changing the word "medial" to "middle" since medial/lateral is usually used to describe sagittal locations.
Good point: now corrected as suggested.
(10) Why was DAPI counter-staining not carried out? This would help the authors to better draw outlines for different nuclei. It also provides important data on the proportion of SPNs within each nucleus.
We agree with the reviewer that determining the proportion of SPNs within each nucleus is an important question; however, properly addressing this requires an independent, cytoarchitecture-based definition of nucleus boundaries, a substantial project that we consider outside the scope of the present study.
DAPI labels cell nuclei generally but carries limited information relevant to classical neuroanatomical delineation of nuclei. Methods such as Nissl staining are better suited to this purpose, as they reveal the cytoarchitectonic characteristics of neurons. As mentioned in the Introduction and Discussion, we instead based our nuclei definitions on the strong evolutionary conservation of spinal-projecting neuron distributions, which we used as a proxy for delineating the different nuclei.
(11) The photoactivation is restricted to the rostral spinal cord. Therefore, how far the axons project throughout the spinal cord cannot be assessed with the current photo-activation method.
We agree with the reviewer: because photoactivation was restricted to the rostral spinal cord, our current data cannot resolve how far individual axons project caudally. However, all evolutionary comparisons in this study were performed across vertebrates using similarly rostrally-labeled SPNs, ensuring consistency in our cross-species analysis. We therefore do not believe that this limitation undermines our initial characterization of the SPN populations.
We agree, however, that extending photoactivation to multiple spinal levels will be valuable for future work characterizing and refining the nuclei proposed in this work. Some of this effort is carried for vsx2+ neurons only by Jia et al., under revision in Nature Communications.
(12) Line 544, if it is the spinal trigeminal tract, why does there appear to be some feint soma staining?
We apologize for the confusion. We always meant to say trigeminal nucleus and not its tract. Text and figure legend are now corrected.
Reviewer #3 (Public review):
In this study, the authors aim to provide the most comprehensive and detailed topographic map to date of spinal projection neurons in the larval zebrafish brain. They achieve this by retrogradely photoactivating, in the rostral spinal cord, a photoconvertible GFP expressed pan-neuronally, and by constructing a template larval zebrafish brain atlas to regionalize the location of all labeled somata across the brain. The labeling strategy, together with the chosen animal model, provides strong support for the completeness of the dataset. The generation of a standardized anatomical atlas establishes a rigorous framework for analysis. Molecular and anatomical evidence suggesting evolutionary conservation of selected regions of interest appears solid.
Overall, the authors successfully achieve their aim. By generating this atlas of spinal projection neurons, they provide not only an anatomical framework of the regions involved, but also an important reference for improving the orientation and regionalization of the zebrafish brain, which has historically been difficult to define. This work may serve as a valuable resource for future evolutionary, developmental, and comparative studies of spinally projecting neuronal populations implicated in diverse functions.
We deeply thank Reviewer #3 for recognizing the impact of our work and benefit for the community at large, which has always been our intention.
eLife Assessment
This is an important study with implications for signal transduction, breast cancer, and metastasis research. The study uses cell lines from the innovative HER2BOW model mouse to compare and contrast properties of mouse mammary tumors induced by wt-HER2, dex16-HER2, and p95-HER2. The study involves mechanistic approaches that are convincing for distinguishing signaling from dex16-HER2 and p95-HER2; this will be of interest to the cancer field.
Reviewer #1 (Public review):
Summary:
The study by Fernandes et al used multiple types of experiments to study the increased metastatic activity conferred by p95-HER2 and presented evidence that biased downstream signaling was engaged by p95-HER2. Further studies demonstrated crucial phosphorylation sites and downstream transcription targets. Overall, this study will contribute to increased understanding of HER2 biology and breast cancer metastasis.
Strengths:
Multiple types of experiments to assess the increased invasion property by p95-HER2. Solid evidence was provided that p95-HER2 elicits a different transcription program, enhancing EMT. Convincing results were achieved in knockdown studies on crucial genes such as MRTFA and TGFB1I1.
Weaknesses:
To enhance the quality of this study, several points need to be addressed.
(1) First, as the background to this study, the authors stated in the introduction that different isoforms of HER2 lead to different invasive properties. Is this conclusion based on clinical observation or animal models? This needs to be specified to help readers grasp the importance of the paper.
(2) Second, this study is mostly performed on three cell lines generated from three tumor models, WT, d16, and p95. Were multiple cell lines generated from the same tumor model (e.g., p95), and how similar are these cell lines if they are from the same tumor model?
(3) Third, Figure 2 presented data from a very interesting experiment. However, the overall conclusion of this experiment is hard to grasp from the text.
Reviewer #2 (Public review):
Summary:
This is a significant study with implications for signal transduction, breast cancer, and metastasis research. The study uses cell lines from the innovative HER2BOW model mouse to compare and contrast properties of mouse mammary tumors induced by wt HER2, dex16 HER2, and p95 HER2. The linkage between p95 Y1139 and TGFB1I1, as well as MRTFA, is very interesting. The study involves mechanistic approaches to distinguish signaling from dex16 HER2 and p95 HER2 that will be well received by the field.
Strengths:
The study describes the development of novel cell lines for mouse mammary tumors induced by different forms of HER2. In vitro analysis includes a wide variety of assays, including high-resolution fluorescent imaging and tracing of cell movement/ECM degradation, and single-cell RNA-seq analysis. Several approaches are used to confirm p95 HER2 pY1139-induced signaling through nuclear MRTFA and TGFB1I1. shRNA and CRISPR/Cas9 were used to confirm signaling through this pathway.
Weaknesses:
The authors have only described one cell line for each HER2 form, a weakness which they acknowledge. The fact that these lines mimic characteristics that were described in their previous work on tumors induced by wt HER2 vs. dex16 HER2 vs. p95 HER2 is, however, supportive of their conclusions. In addition, the specific connection between p95 and nuclear MRTFA is confirmed in HEK cells. The manuscript could be improved with some discussion on how p95 p-Y1139 is likely to signal (what binds to this site?)
Reviewer #3 (Public review):
Summary:
The study aims to explain why different HER2 isoforms produce distinct cancer-cell phenotypes, with a particular focus on the poorly understood mechanisms by which p95-HER2 promotes the invasive and metastatic behaviors of HER2-positive breast cancer. The authors propose that functional selectivity at the HER2 receptor level, particularly signaling through Y1139, preferentially engages an MRTFA-TGFB1I1 transcriptional/cytoskeletal program, thereby shifting p95-HER2-expressing cells toward individual motility, matrix degradation, invasion, and metastasis rather than simply proliferation.
Strengths:
A major strength is the multi-level experimental strategy. Rather than relying on a single invasion assay, the authors integrate phenotypic profiling, single-cell RNA-seq, imaging of MRTFA nuclear localization, protein validation, cytoskeletal analysis, matrix-degradation assays, transwell invasion, 3D spheroid/organoid assays, and orthotopic transplantation. This provides relatively coherent evidence that p95-HER2 cells occupy a distinct biological state characterized by individual motility and invasion, accompanied by a myogenic/contractile transcriptional program and increased MRTFA nuclear localization. Another strong aspect is the attempt to connect the downstream phenotype to a specific HER2 phosphorylation site. The authors identify Y1139 as a candidate determinant of the "go" phenotype and show that mutation of Y1139 to phenylalanine eliminates MRTFA translocation as well as the associated motility and invasion phenotypes
Weaknesses:
The main limitation is that the evidence for the proposed signaling mechanism is stronger for functional dependence than for direct molecular mechanism. The data establish that Y1139, MRTFA, and TGFB1I1 are required for the p95-HER2 invasive phenotype, but they do not appear to fully establish how phosphorylation at Y1139 mechanistically couples p95-HER2 to MRTFA activation. In particular, a direct biochemical link between Y1139 and the machinery controlling actin polymerization/MRTFA nuclear translocation would make the proposed pathway substantially more convincing.
A second limitation is the model system used in the study. Much of the mechanistic work relies on three particular engineered HER2 isoform-expressing cell lines, while the in vivo experiments use NOD/SCID mice. This is useful for testing tumor-cell intrinsic invasion and metastasis, but it limits conclusions about the generality of the functional regulation across different cell contexts, and also limits the understanding of how the pathway operates in the intact immune microenvironment. This is especially relevant because the manuscript itself places p95-HER2 in the broader context of immune evasion and notes that MRTFA can regulate PD-L1; however, the current models cannot adequately establish whether the proposed pathway contributes to immune-mediated metastatic progression in vivo.
Finally, the distinction between "go" and "grow" signaling is conceptually attractive, but the extent to which it represents a general property of HER2-positive human breast cancers remains less certain. The study provides strong experimental evidence for functional selectivity in the models examined, but additional validation in independent patient-derived models and clinically relevant tumors would be needed before generalizing this mechanism across HER2-positive disease.
Author response:
Reviewer #1 (Public review):
Summary:
The study by Fernandes et al used multiple types of experiments to study the increased metastatic activity conferred by p95-HER2 and presented evidence that biased downstream signaling was engaged by p95-HER2. Further studies demonstrated crucial phosphorylation sites and downstream transcription targets. Overall, this study will contribute to increased understanding of HER2 biology and breast cancer metastasis.
Strengths:
Multiple types of experiments to assess the increased invasion property by p95-HER2. Solid evidence was provided that p95-HER2 elicits a different transcription program, enhancing EMT. Convincing results were achieved in knockdown studies on crucial genes such as MRTFA and TGFB1I1.
We thank the reviewer for this positive feedback on our manuscript.
Weaknesses:
To enhance the quality of this study, several points need to be addressed.
(1) First, as the background to this study, the authors stated in the introduction that different isoforms of HER2 lead to different invasive properties. Is this conclusion based on clinical observation or animal models? This needs to be specified to help readers grasp the importance of the paper.
We thank the reviewer for bringing this to our attention; we will add additional language to emphasize and explain prior findings referenced in the introduction establishing HER2 isoforms’ different invasive properties. The increased invasiveness of both d16 and p95 isoforms of HER2 has been established both in animal models and in clinical studies (1-6). We summarize these studies below:
(1) Expression of the delta16 splice variant isoform has been shown in human cell lines to be more oncogenic than the WT HER2 isoform (7), and associated with different transcriptional profile including increased expression of cancer metastasis and cancer stem cell-related genes (4). Clinically, patients with d16HER2-positive breast cancer have higher rates of lymph node metastases than those with d16HER2-negative breast cancer (8). Castagnoli et al (9) provides an overview of preclinical and clinical data on d16 in HER2+ cancers.
(2) The p95 isoform of HER2 is associated with increased metastasis (2) and worse outcomes (1, 10) in HER2+ breast cancer patients. Preclinical models show that p95-HER2 (also known as 611-CTF) activates a transcriptional program that promotes invasion and metastasis (3), part of the basis for our interest in HER2 isoform biology.
Moreover, our group has previously detailed different tumor growth and dissemination characteristics of WT, d16, and p95 HER2 isoforms in our HER2 Crainbow mouse model which expresses all 3 of these isoforms in the mammary epithelium (5).
Both d16 and p95 tumors in Her2Crainbow mice have the ability to progress to overt metastasis, unlike WT HER2 in this model (6). During early stages of malignant transformation prior to palpable tumor formation, p95 cells disseminated to the lung were 5x more numerous than d16 cells in the lung (despite more proliferation of d16 cells in the mammary gland at that timepoint). This is the foundation on which we built this current work, to study what could promote these different proliferation, dissemination, and metastasis behaviors in different HER2 isoforms.
(2) Second, this study is mostly performed on three cell lines generated from three tumor models, WT, d16, and p95. Were multiple cell lines generated from the same tumor model (e.g., p95), and how similar are these cell lines if they are from the same tumor model?
Our lab has generated a number of tumor cell lines derived from individual tumors developed in different HER2 Crainbow mice. We hypothesize, based on preliminary data in these cell lines as well as our previously reported data examining phenotypes of WT, d16, and p95 tumors (5, 6), that different clones will share core features such as invasive properties. In order to strengthen the generalizability of our conclusions, we intend to perform transwell assays, matrix degradation assays, and western blots to examine expression of Mrtfa and Tgfb1i1 in additional HER2 Crainbow-derived cell lines to validate if our findings hold true across cell lines derived from different tumors.
(3) Third, Figure 2 presented data from a very interesting experiment. However, the overall conclusion of this experiment is hard to grasp from the text.
We thank the reviewer for this comment. We will revise the text accompanying Figure 2 to provide further detail on the interpretation of the PCA plots and clarify the overall conclusions by adding the following text:
Vectors indicate variable loadings, where vector direction corresponds to increasing values of the variable and vector length reflects the magnitude of the variable’s contribution to the displayed principal components. For example, HCR-WT populations cluster toward lower values of PC1 and higher values PC2, notably in the direction of higher self-correlation indicating an association with greater spatial clustering. HCR-16 and HCR-95 cells cluster similarly and are driven by their similarity in speed, MSD, persistence, and individual behavior (low self-correlation and high proportions of cells with zero neighbors), whereas HCR-WT is distinct for its collective cell behavior (high self-correlation) (Figure 2E). This separation indicates potentially distinct kinematic and spatial organization compared to HCR-16 and HCR-95 cells.
Reviewer #2 (Public review):
Summary:
This is a significant study with implications for signal transduction, breast cancer, and metastasis research. The study uses cell lines from the innovative HER2BOW model mouse to compare and contrast properties of mouse mammary tumors induced by wt HER2, dex16 HER2, and p95 HER2. The linkage between p95 Y1139 and TGFB1I1, as well as MRTFA, is very interesting. The study involves mechanistic approaches to distinguish signaling from dex16 HER2 and p95 HER2 that will be well received by the field.
Strengths:
The study describes the development of novel cell lines for mouse mammary tumors induced by different forms of HER2. In vitro analysis includes a wide variety of assays, including high-resolution fluorescent imaging and tracing of cell movement/ECM degradation, and single-cell RNA-seq analysis. Several approaches are used to confirm p95 HER2 pY1139-induced signaling through nuclear MRTFA and TGFB1I1. shRNA and CRISPR/Cas9 were used to confirm signaling through this pathway.
We thank the reviewer for these positive comments.
Weaknesses:
The authors have only described one cell line for each HER2 form, a weakness which they acknowledge. The fact that these lines mimic characteristics that were described in their previous work on tumors induced by wt HER2 vs. dex16 HER2 vs. p95 HER2 is, however, supportive of their conclusions. In addition, the specific connection between p95 and nuclear MRTFA is confirmed in HEK cells. The manuscript could be improved with some discussion on how p95 p-Y1139 is likely to signal (what binds to this site?)
We thank the reviewer for this assessment, and we agree that adding additional cell lines derived from different HER2 Crainbow mouse tumors would strengthen the conclusions drawn in this manuscript. As mentioned in response to Reviewer #1, we intend to perform transwell assays, matrix degradation assays, and western blots to examine expression of Mrtfa and Tgfb1i1 in additional HER2 Crainbow-derived cell lines to validate if our findings hold true across cell lines derived from different tumors.
With regards to p95 p-Y1139 signaling, previous work by Dankort et al. (11, 12) established that tyrosine autophosphorylation site Y1144 on rat neu (equivalent to Y1139 in human HER2) promoted lung metastasis in animal models, and that this site was necessary and sufficient for direct binding of Grb2.
We intend to clarify and discuss links between Y1139 on p95 HER2 and the nuclear translocation of MRTFA.
Reviewer #3 (Public review):
Summary:
The study aims to explain why different HER2 isoforms produce distinct cancer-cell phenotypes, with a particular focus on the poorly understood mechanisms by which p95-HER2 promotes the invasive and metastatic behaviors of HER2-positive breast cancer. The authors propose that functional selectivity at the HER2 receptor level, particularly signaling through Y1139, preferentially engages an MRTFA-TGFB1I1 transcriptional/cytoskeletal program, thereby shifting p95-HER2-expressing cells toward individual motility, matrix degradation, invasion, and metastasis rather than simply proliferation.
Strengths:
A major strength is the multi-level experimental strategy. Rather than relying on a single invasion assay, the authors integrate phenotypic profiling, single-cell RNA-seq, imaging of MRTFA nuclear localization, protein validation, cytoskeletal analysis, matrix-degradation assays, transwell invasion, 3D spheroid/organoid assays, and orthotopic transplantation. This provides relatively coherent evidence that p95-HER2 cells occupy a distinct biological state characterized by individual motility and invasion, accompanied by a myogenic/contractile transcriptional program and increased MRTFA nuclear localization. Another strong aspect is the attempt to connect the downstream phenotype to a specific HER2 phosphorylation site. The authors identify Y1139 as a candidate determinant of the "go" phenotype and show that mutation of Y1139 to phenylalanine eliminates MRTFA translocation as well as the associated motility and invasion phenotypes
We thank the reviewer for these positive comments on our manuscript.
Weaknesses:
The main limitation is that the evidence for the proposed signaling mechanism is stronger for functional dependence than for direct molecular mechanism. The data establish that Y1139, MRTFA, and TGFB1I1 are required for the p95-HER2 invasive phenotype, but they do not appear to fully establish how phosphorylation at Y1139 mechanistically couples p95-HER2 to MRTFA activation. In particular, a direct biochemical link between Y1139 and the machinery controlling actin polymerization/MRTFA nuclear translocation would make the proposed pathway substantially more convincing.
We thank the reviewer for these insightful comments. We agree that establishing a mechanistic link between p95 Y1139 and MRTFA nuclear translocation would strengthen the conclusions in this study. As such, we intend to perform Rho activation assays and western blotting for proteins in HER2 signaling cascades to explore the signaling link between p95 Y1139 and MRTFA. Additionally, we plan to treat cells with RhoA/ROCK inhibitors to explore our hypothesis that Y1139 acts through RhoA activation to ultimately alter MRTFA translocation.
A second limitation is the model system used in the study. Much of the mechanistic work relies on three particular engineered HER2 isoform-expressing cell lines, while the in vivo experiments use NOD/SCID mice. This is useful for testing tumor-cell intrinsic invasion and metastasis, but it limits conclusions about the generality of the functional regulation across different cell contexts, and also limits the understanding of how the pathway operates in the intact immune microenvironment. This is especially relevant because the manuscript itself places p95-HER2 in the broader context of immune evasion and notes that MRTFA can regulate PD-L1; however, the current models cannot adequately establish whether the proposed pathway contributes to immune-mediated metastatic progression in vivo.
We also acknowledge the limitations of relying on mostly in vitro assays and in vivo experiments in an immunodeficient environment, and will more explicitly address this in our discussion. The interplay between p95-HER2 and the immune system is being explored in a parallel project that will be published separately in the future; the focus of the current manuscript is the cell-intrinsic signaling mechanisms that contribute to p95 invasiveness. Points about immune evasion that were brought up in the introduction will be moved to the discussion section, to make it clear that the current study does not address the immunocompetent environment but that we wish to further investigate the results we report in this manuscript in that context as well.
Finally, the distinction between "go" and "grow" signaling is conceptually attractive, but the extent to which it represents a general property of HER2-positive human breast cancers remains less certain. The study provides strong experimental evidence for functional selectivity in the models examined, but additional validation in independent patient-derived models and clinically relevant tumors would be needed before generalizing this mechanism across HER2-positive disease.
With respect to validating findings in human samples, we intend to utilize human HER2+ breast cancer cell lines and/or patient-derived xenografts to investigate the extent to which our described mechanism is relevant in human HER2+ breast cancer.
References:
(1) Sáez R, Molina MA, Ramsey EE, Rojo F, Keenan EJ, Albanell J, et al. p95HER-2 Predicts Worse Outcome in Patients with HER-2-Positive Breast Cancer. Clinical Cancer Research. 2006;12:424–31.
(2) Molina MA, Saez R, Ramsey EE, Garcia-Barchino MJ, Rojo F, Evans AJ, et al. NH(2)-terminal truncated HER-2 protein but not full-length receptor is associated with nodal metastasis in human breast cancer. Clin Cancer Res. 2002;8:347–53.
(3) Pedersen K, Angelini PD, Laos S, Bach-Faig A, Cunningham MP, Ferrer-Ramon C, et al. A naturally occurring HER2 carboxy-terminal fragment promotes mammary tumor growth and metastasis. Mol Cell Biol. 2009;29:3319–31.
(4) Turpin J, Ling C, Crosby EJ, Hartman ZC, Simond AM, Chodosh LA, et al. The ErbB2DeltaEx16 splice variant is a major oncogenic driver in breast cancer that promotes a pro-metastatic tumor microenvironment. Oncogene. 2016;35:6053–64.
(5) Ginzel JD, Acharya CR, Lubkov V, Mori H, Boone PG, Rochelle LK, et al. HER2 Isoforms Uniquely Program Intratumor Heterogeneity and Predetermine Breast Cancer Trajectories During the Occult Tumorigenic Phase. Mol Cancer Res. 2021; 19(10):1699–1711.
(6) Ginzel JD, Chapman H, Sills JE, Allen EJ, Barak LS, Cardiff RD, et al. Nonlinear progression during the occult transition establishes cancer lethality. Dis Model Mech. 2025;18:dmm052113.
(7) Kwong KY, Hung M-C. A novel splice variant of HER2 with increased transformation activity. Molecular Carcinogenesis. 1998;23:62–8.
(8) Mitra D, Brumlik M, Okamgba S, Zhu Y, Duplessis T, Parvani J, et al. An oncogenic isoform of HER2 associated with locally disseminated breast cancer and trastuzumab resistance. Mol Cancer Ther. 2009;8(8):2152-62.
(9) Castagnoli L, Ladomery M, Tagliabue E, Pupa SM. The d16HER2 Splice Variant: A Friend or Foe of HER2-Positive Cancers? Cancers (Basel). 2019;11.
(10) Sperinde J, Jin X, Banerjee J, Penuel E, Saha A, Diedrich G, et al. Quantitation of p95HER2 in paraffin sections by using a p95-specific antibody and correlation with outcome in a cohort of trastuzumab-treated breast cancer patients. Clin Cancer Res. 2010;16:4226–35.
(11) Dankort DL, Wang Z, Blackmore V, Moran MF, Muller WJ. Distinct tyrosine autophosphorylation sites negatively and positively modulate neu-mediated transformation. Mol Cell Biol. 1997;17:5410–25.
(12) Dankort D, Maslikowski B, Warner N, Kanno N, Kim H, Wang Z, et al. Grb2 and Shc adapter proteins play distinct roles in Neu (ErbB-2)-induced mammary tumorigenesis: implications for human breast cancer. Mol Cell Biol. 2001;21:1540–51.
eLife Assessment
This is a valuable study that aims to resolve the mechanistic details of the final steps of bacterial lipoprotein trafficking. The evidence supporting the conclusions is mostly solid but support for other claims is incomplete. This work will be of interest to biochemists and microbiologists studying the bacterial cell envelope and those aiming to develop novel antibacterial molecules.
Reviewer #1 (Public review):
Summary:
The manuscript aims to mechanistically characterize the final step of the Lol lipoprotein trafficking pathway in Gram-negative bacteria, where triacylated lipoproteins are transferred from the periplasmic chaperone protein LolA to the outer membrane receptor LolB for subsequent insertion into the inner leaflet of the outer membrane. The crystal structures of LolA R43L-LolB, LolB L114G-lipoprotein, LolB Q44A (open), and LolB Q44A (closed) are reported. A combination of structural analysis, growth assays, pull-downs, and fluorescence spectroscopy was employed to characterize the behaviour of wild-type and mutant forms of Lol proteins. The authors then used previously published molecular dynamics simulations to propose a six-step model for the transfer and insertion of lipoproteins from LolA to LolB, and finally into the membrane.
The structural work is mostly solid, but the mechanistic conclusions drawn from it rely too much on interpolation between static states and on functional assays with limited dynamic range.
Strengths:
(1) The structure-guided mutagenesis was thorough and well designed. Mutants were tested both in isolation and in combination with one another, utilizing both alanine and charge reversal mutants, to fully tease apart which residues were most important for the interaction.
(2) The dissection of the Hook interactions allowed the authors to identify the importance of the identity of the hook apex residue, as well as the critical hydrogen bond that maintained the Hook geometry.
(3) The structure of the lipoprotein-bound LolB is a valuable addition to the body of knowledge around this pathway, and the way that the complex was produced was very clever.
Weaknesses:
(1) There is no raw data shown for any of the interactions or lipoprotein transfer experiments. All of the quantitative claims about LolA association and lipoprotein transfer rely on SDS-PAGE densitometry, and not a single gel image from those experiments is provided in the main text or supplemental.
(2) Pull-down assays are a fairly poor assay to use for protein interactions when there are so many quantitative alternatives that would be amenable to this experimental system, especially when the association and transfer of lipoprotein are the central claims of the manuscript.
(3) The crystal structures are under-refined for their resolution, with large R-factor gaps and somewhat concerning statistics contained in the wwPDB reports (e.g. >20% RSRZ outliers in 2/4 structures). The data also seem to be cut at strangely high I/sigI for the two Q44A structures with no explanation.
(4) In the LolB L114G structure, the Hook residue L68 is the most poorly fit in the whole structure. The validation report indicates the entire hook is poorly resolved, but without access to the maps and models, we are unable to assess this independently.
(5) There is no rubric for what constitutes a significant result for the DAUDA fluorescence spectroscopy. What level of increase vs wild-type is considered significant? I188G is incredibly close to L144G, but one is treated as a non-result and the other as something that should be further investigated.
(6) The conformational trajectory of the proposed model is on static endpoints.
Reviewer #2 (Public review):
Summary:
The manuscript by Jepson and colleagues presents the structural and biochemical study of the outer membrane LolB in complex with LolA in its apo and lipoprotein-bound states. The Lol system (LolABCDE) is essential in the translocation of lipoproteins to the outer membrane. Several studies have looked at the inner membrane complex. This study captured the last step of the process, the translocation of lipoproteins to the outer membrane via the LolB and LolA proteins. The crystal structures of LolB in complex with LolA revealed key interactions via the hook and charged belt motifs. Mutagenesis was not able to fully dissociate the complex or prevent the transfer of lipoprotein. The complex of LolB with LolA and lipoprotein revealed the 'final' step of engaging the complex for lipoprotein insertion into the outer membrane.
Overall, this is an excellent and exciting study for the Lol field as it captures the events happening at the outer membrane.
Strengths:
The authors have determined several high-resolution structures and validated them with excellent mutagenesis experiments. The key structure is that of LolB with LolA and the lipoprotein (even partially resolved).
Weaknesses:
The only 'weakness' is that the authors have used mutants of either LolB or LolA to capture the stable states, and the discussion section would benefit from commenting if these states could be dead-end states, as validation of the mutants has been done with a WT background. In addition, can they discuss whether a2 is likely to undergo further conformational changes to open a lateral gate to the OM for the acyl chains of the lipoprotein to insert?
Вода180
что еще воду добавлять надо?
328
а не много по сравнению с фаршем?
eLife Assessment
This valuable study carefully assesses the anatomical organization of the adult zebrafish olfactory bulb using a densely reconstructed electron microscopy dataset. The data were generated using a previously acquired state-of-the-art serial block-face scanning electron microscopy dataset, followed by manual classification of cells into distinct anatomical groups. The analysis is a convincing application of careful expert neuroanatomical understanding that reveals key details of the cell class and connectivity in the olfactory bulb, with helpful detailed descriptions of why each cell class was distinguished.
Reviewer #1 (Public review):
Summary
The authors set out to address a critical gap in olfactory bulb research: the lack of a comprehensive annotation of neuron types and their connectivity in the adult zebrafish. Using a large serial block-face scanning electron microscopy volume, they reconstructed 459 neurons and performed a detailed morphological and ultrastructural classification. They identified 13 major neuron subclasses, including two projection neuron types (mitral cells and ruffed cells) and 11 interneuron types. A key finding is that despite the diffuse appearance of the lateral olfactory bulb neuropil, it is organized into discrete, segregated glomeruli. The authors also performed targeted synapse annotation, revealing systematic and selective connectivity patterns between projection neurons and specific interneuron subnetworks, and discovered distinct microcircuit motifs involving reciprocal and unidirectional connectivity. This work provides a crucial anatomical framework for understanding the circuit basis of olfactory computations.
Strengths
(1) The volumetric EM reconstructions capture fine ultrastructural features (e.g., spine shapes, neurite caliber variations, and varicosity morphology) at nanometer resolution across hundreds of neurons. The descriptive detail and 3D rendering provided for each subclass are remarkably thorough.
(2) The study goes beyond simple morphological descriptions by integrating ultrastructural features, such as spine shape, neurite diameter, and synaptic arrangements, to define neuron classes. This provides a more functionally relevant taxonomy. The classification was also cross-validated by independent neuroscientists.
(3) The targeted synapse annotation translates anatomy into testable circuit hypotheses, revealing distinct connectivity motifs (reciprocal vs. unidirectional, MC-selective vs. RC-selective) that provide structural substrates for computational functions such as normalization.
Weaknesses
(1) It is important to provide an estimate of the total neuronal population of the adult zebrafish OB and justify that their sample size is sufficient to claim a "comprehensive" neuron type classification.
(2) The classification was based on morphology and ultrastructure. If feasible, we recommend an unsupervised clustering analysis using only the synaptic connectivity matrix for fully reconstructed neurons to test whether connectivity patterns recapitulate the 13 morphological subclasses. Besides, cross-validation by independent annotators is great. However, when the annotators disagreed on a neuron's subclass, how was it resolved?
(3) A summarized reference table that includes features for each subclass is highly recommended (the main text cited several tables; however, I did not find them). This would facilitate community adoption of the classification.
(4) The schematic in Figure 20 could be optimized to reflect synaptic connections among 13 subclasses with connection strength annotated.
Reviewer #2 (Public review):
Summary:
The authors have used a previously published SBEM dataset of the adult zebrafish olfactory bulb and carefully reconstructed the fine structure of a large number (459) of neurons. Through manual classification of cells into 13 different anatomical classes, they provide a carefully annotated library of cells. Classifications have been validated by comparing the labeling of 5 human annotators, which revealed a large degree of reproducibility. Synaptic identification enables assignment of connectivity, revealing a major contribution of reciprocal connections (two-way synapses) that may support key computational features during olfactory processing. In general, the work provides a clean descriptive account of the organization of the zebrafish olfactory bulb, which should help to better understand principles of olfactory processing in vertebrates.
Strengths:
The authors provide a library of neurons in the olfactory bulb of adult zebrafish that will be highly useful to the broader circuit neuroscience community. Figures of classified cell types have been convincingly arranged to appreciate the high quality of the EM volume and reconstructions. Cells are easily accessible through a web interface to facilitate the assessment of classifications. An important result is that anatomical structures in zebrafish clearly follow the glomerular arrangement known in mammals, which argues against a microglomerulus model previously proposed for the zebrafish olfactory bulb.
Weaknesses:
The paper uses Wanner et al. 2016 as a main base dataset to generate a descriptive library of cells, in a limited volume (18%) of the zebrafish olfactory bulb. Annotations of cell types and synapses are largely human-based. Using a multi-human validation strategy helps to assess labeling, but it would benefit from more rigorous statistics, in particular for the synapse annotations. In general, the paper would be easier to read with a glossary of cell types. Some features are quite intriguing, like the cilia structures in some of the somata or the ruffs, but discussion of the potential computational roles of these fine structures is missing.
Reviewer #3 (Public review):
Summary:
The authors aimed to build a comprehensive understanding of the cell classes that make up the adult zebrafish olfactory bulb (OB) and their connectivity. Using an EM volume covering the three OB layers and several glomeruli, they aim to reconstruct a sufficient sample of all cell classes in the OB. Based on 459 proofread reconstructions, they identify 13 cell classes and a small number of subclasses and offer detailed expert neuroanatomical arguments, largely qualitative, for why these classes are distinct. While they do not have a synapse classification, they further build a manual wiring diagram of connectivity based on these reconstructions, which together offer a strong baseline understanding of the organization of the OB and useful properties to build into a future quantitative assessment of fish neuroanatomy in general.
Strengths:
The paper offers a powerful example of why expert assessment remains a vital tool in neuroanatomy. While quantification is deeply important to scale data, the kind of careful multimodal human investigation of neuronal shape, connectivity, and ultrastructure forms a key basis for discovering and differentiating neuronal cell types. The authors use multi-expert classification to validate qualitative assessments as well, which is a good way to handle cross-individual uncertainty. The descriptions of each type and their relationships are generally quite thorough, and there are enough cells to offer a satisfying baseline categorization. Anyone studying zebrafish OB is likely to get a lot out of this paper.
Weaknesses:
While I am a strong believer in expert neuroanatomical intuition alongside quantitative neuroanatomical approaches to cell typing (especially given the manageable number of cells and cell types), I would have liked a section explaining why this approach was taken as opposed to a more quantitative one from the beginning. I think that this is a case study in where the expert qualitative approaches are useful, especially with fascinating details like the unusual hand-shaped spines. A lot of the strength of the paper comes from this philosophy, in my view, and it would be nice to hear it elucidated by the authors. I would also be curious if the authors came to any conclusions about what might have been possible with a more data-driven approach, although this may be beyond the scope of the work or not terribly interesting.
There were some aspects of the cell typing that I didn't totally understand. Two of the most common issues with cell typing are that (1) it is unclear if cell types are discrete and (2) unusual cells appear that don't have enough peers to classify into an unambiguous type. Did those happen here? For example, it was not obvious to me how it was decided that mitral cells fell into three subclasses: small, medium, and large, and not a continuum from small to large. Similarly, some interneuron classes had subclasses. What anatomical qualities suggested that a split was a subclass-level split vs a class-level split? Were there any cells that were impossible to classify into a group, or was everything actually tidy? How confident are the authors that they have captured the complete diversity of the OB from this sampling?
I generally appreciated the numerous detailed figures and found them generally clear and informative. However, as someone who is not deeply familiar with zebrafish olfactory bulb organization, I would have liked to have at least some global context for each cell class in terms of how typical cells relate to the layers and glomeruli. Figure 18B does a nice job of this with many cells, but it would be clearer to see this along the way with the individual classes (and subclasses) as well.
For the connectivity analysis, I commend the authors for doing as much manual synapse annotation as they did, but the lack of completeness makes it less clear how to interpret the connectivity findings. In particular, how complete is the current assessment? For example, when describing connectivity between pairs of cells, how were the pairs selected? Did they necessarily have contact between the meshes, or innervate the same glomerulus, or were they just two cells of the same type in any location? This is useful to understand how to interpret the connectivity fractions measured.
Author response:
We thank the reviewers for their constructive feedback.
Reviewer 1:
(1) We will provide an estimate of total neuron numbers.
(2) We will explore the possibility to extend cell type classification by unsupervised clustering of connectivity but it may not be possible to obtained a meaningful clustering based on the available connectivity data. The main issue is that connectivity information is available only for subsets of neurons. The underlying reason is that synapses were annotated manually and a complete manual annotation of the entire dataset would be an excessive task. In principle, this problem could be solved by automation but networks for automated annotation of synapses in other brain areas do not produce reliable results in the olfactory bulb, most likely because many neurites are both pre-and postsynaptic (further remarks below).
(3) We are happy to supply the missing tables and to provide a glossary/table summarizing the features of the different neuron types.
(4) Thank you; we will consider the suggestion to optimize Fig. 20.
Reviewer 2:
We agree that more a more comprehensive analysis of synaptic connectivity would be desired. The underlying problem, however, is that scaling synapse annotation requires automation but networks used for synapse annotation in other brain areas failed to produce reliable results in the olfactory bulb. The underlying reason is most likely that neurites of many olfactory bulb neurons are both pre- and postsynaptic; their ultrastructure is therefore different from classical axons or dendrites, e.g., vesicles are frequently found in close proximity on both sides. We therefore annotated synapses manually, which is the reason why synapse annotation was restricted to subsets of neurons. We will explain this situation in the revisions. Moreover, we will explore further approaches for automated cell type classification using both morphological and synaptic features.
We shall be happy to include a glossary of cell types.
We are also happy to expand the discussion of ultrastructural observations. Concerning primary cilia, we do not have a strong hypothesis concerning their function, neither based on our observations nor based on the literature.
Reviewer 3:
Following the reviewer’s suggestion we will be happy to include a more in-depth discussion of why our analysis is based primarily on human annotations and observations rather than more automated classification.
As suggested by the reviewer we are planning to include additional figures and/or tables to show the relations between neuron types and layers, and to provide more summary information about cell types.
We will also explain in more detail how neurons were chosen for connectivity analysis, with a specific focus on the assessment of connectivity fractions.
eLife Assessment
This fundamental study delivers a population reference panel for long-read sequencing-based structural variants and demonstrates its utility for disease association analyses in the UK Biobank, expanding genetic discovery beyond conventional SNV-based approaches. The authors provide convincing evidence through extensive benchmarking and systematic analyses that the panel improves structural variant detection and can support fine-mapping of trait associations.
Reviewer #1 (Public review):
Summary:
The authors sequenced 888 individuals from the 1000 Genomes Project using the Oxford Nanopore long-read sequencing method to achieve highly sensitive, genome-wide detection of structural variants (SVs) at the population level. They conducted solid benchmarking of SV calling and systematically characterized the identified SVs. While short-read sequencing methods, including those used in the 1000 Genomes Project, have been widely applied, they exhibit high accuracy in detecting single nucleotide variants (SNVs) and small insertions and deletions but have limited sensitivity for SV detection. This study significantly enhances SV detection capabilities, establishing it as a valuable resource for human genetic research. Furthermore, the authors constructed an SV imputation panel using the generated data and imputed SVs in 488,130 individuals from the UK Biobank. They then conducted a proof-of-principle genome-wide association study (GWAS) analysis based on the imputed SVs and selected traits within the UK Biobank. Their findings demonstrate that incorporating SV-GWAS analysis provides additional insights beyond conventional GWAS frameworks focusing on SNVs, particularly in improving fine-mapping.
Strengths:
The authors constructed a high-sensitivity reference panel of genome-wide SVs at the population level, addressing a critical gap in the field of human genetics. This resource is expected to significantly advance research in human genetics. They demonstrated the imputation of SVs in individuals from the UK Biobank using this panel and conducted a proof-of-concept SV-based GWAS. Their findings highlight a novel and effective strategy for integrating SVs into GWAS, which will facilitate the analysis of human genetic data from the UK Biobank and other datasets. Their conclusions are supported by comprehensive analyses.
Weaknesses:
The authors have addressed many of my previous comments, and I appreciate their efforts. However, I still have two related concerns.
(1) Shortly after reviewing this manuscript last year, my laboratory obtained access to the UK Biobank (UKB) Tier 3 dataset for an unrelated project. In August 2025, I searched the UKB Research Analysis Platform (UKB-RAP) for the imputed structural variant (SV) dataset described in this manuscript but was unable to locate it. After contacting UKB, I was informed that they were developing the system for releasing the data. To the best of my knowledge, the dataset remains unavailable. A major contribution of this work is the generation of an imputed SV resource for approximately 500,000 UKB participants with extensive phenotypic information. If this resource is not accessible to the research community, even to authorized UKB users, the practical impact and utility of the study are substantially diminished.
(2) Given that the imputed SV dataset is currently unavailable, it becomes even more important for the authors to provide a detailed, ready-to-run SV imputation pipeline for UKB-RAP, even if the "data processing simply consisted of running standard bioinformatics tools with the parameters exactly as described in the manuscript". In particular, the pipeline should include practical information such as computational requirements (e.g., memory and storage), expected running time, and estimated cost. Anyone with experience using UKB-RAP will agree that reproducing large-scale analyses on the platform can be both technically complex and financially expensive. Such pipeline would greatly improve the reproducibility and accessibility of this work.
Because my initial assessment of the manuscript was generally positive, I do not wish to change my overall evaluation, summary, or assessment of its strengths. However, I would view the work even more favorably if either (i) the imputed SV dataset became publicly available to authorized UKB users, or (ii) the authors extended their SV-GWAS analyses to the full range of UKB phenotypes and released the resulting summary statistics, analogous to the Pan UKBB ("https://pan.ukbb.broadinstitute.org/") resource. Although this would require considerable additional effort and computational resources, it would substantially enhance the long-term value and impact of the study.
Finally, I would like to emphasize that these comments are not intended to create unnecessary difficulties for the authors or the editors. Rather, I believe this highlights a broader issue in the use of this kind of large public datasets: reviewers cannot independently verify key results, and readers cannot readily build upon the work if the underlying resources are inaccessible, even after obtaining authorized access to the original dataset. I hope the authors, together with the eLife editors and UK Biobank where appropriate, can help facilitate the timely release of this valuable resource.
Author response:
The following is the authors’ response to the original reviews.
Our revision includes:
(1) The generated data from long-read whole-genome sequencing of 1000 Genomes Project samples, including FASTQ files, SV calls, and the imputation panel, are now openly available via ENA and OpnMe. The imputed structural variant data have been submitted to UK Biobank for release through the UK Biobank Research Analysis Platform, subject to UK Biobank release procedures. SV-WAS summary statistics have been made available via OpnMe.
(2) Clarification of analyses and methods, addition of two new Supplementary Figures, and correction of minor issues throughout the manuscript.
(3) A significantly expanded Discussion to address the reviewers’ comments and better contextualise our methods and results.
eLife Assessment
This fundamental work significantly enhances our understanding of how structural variants influence human phenotypes. The conclusion is convincingly supported by rigorous analyses of long-read sequencing data. If the raw data are made publicly available, these high-quality datasets and findings will further advance our knowledge of genetic variation in the human population.
We thank the editors for this positive assessment of our work. The raw long-read sequencing data (FASTQ files) can now be accessed through the European Nucleotide Archive (ENA) under accession number PRJEB89727, as part of a larger collection of 1019 sequenced probands from the 1000 Genomes Project (https://www.ebi.ac.uk/ena/browser/view/PRJEB89727). The generated imputation panel and the structural variant calls, based on the 888 probands used in the present manuscript, remain freely available for download at https://opnme.com/genomiclens. We have now added the summary statistics of 32 SV-wide association studies to the same resource. In addition, we have submitted the imputed SV genotypes for UK Biobank participants to the UK Biobank; once processed by UK Biobank, these genotypes will be released via the UK Biobank Research Analysis Platform (RAP).
Public Reviews:
Reviewer #1 (Public review):
Summary:
The authors sequenced 888 individuals from the 1000 Genomes Project using the Oxford Nanopore long-read sequencing method to achieve highly sensitive, genome-wide detection of structural variants (SVs) at the population level. They conducted solid benchmarking of SV calling and systematically characterized the identified SVs. While short-read sequencing methods, including those used in the 1000 Genomes Project, have been widely applied, they exhibit high accuracy in detecting single nucleotide variants (SNVs) and small insertions and deletions but have limited sensitivity for SV detection. This study significantly enhances SV detection capabilities, establishing it as a valuable resource for human genetic research. Furthermore, the authors constructed an SV imputation panel using the generated data and imputed SVs in 488,130 individuals from the UK Biobank. They then conducted a proof-of-principle genome-wide association study (GWAS) analysis based on the imputed SVs and selected traits within the UK Biobank. Their findings demonstrate that incorporating SV-GWAS analysis provides additional insights beyond conventional GWAS frameworks focusing on SNVs, particularly in improving fine mapping.
The authors constructed a high-sensitivity reference panel of genome-wide SVs at the population level, addressing a critical gap in the field of human genetics. This resource is expected to significantly advance research in human genetics. They demonstrated the imputation of SVs in individuals from the UK Biobank using this panel and conducted a proof-of-concept SV-based GWAS. Their findings highlight a novel and effective strategy for integrating SVs into GWAS, which will facilitate the analysis of human genetic data from the UK Biobank and other datasets. Their conclusions are supported by comprehensive analyses.
We thank the reviewer for highlighting the value of our SV imputation reference panel.
Weaknesses:
(1) Although the authors employ state-of-the-art analytical approaches for the identification of SVs, the overall accuracy remains suboptimal, as indicated by an F1 score of 74.0%, particularly in tandem repeat regions. To enhance accuracy, it would be beneficial to explore alternative SV detection methods or develop novel approaches. Given the value of the reference panel and the fact that improved SV accuracy would lead to more precise SV imputation and GWAS results, investing effort in methodological refinement is highly encouraged.
Accurate SV calling remains an active area of research and is beyond the scope of the present study. Tandem repeat regions are particularly challenging for standardised SV detection. We believe that achieving a benchmark for NA12878 of F1 = 74% on a genome-wide level and, notably, F1 = 91% when excluding longer tandem repeats, represents strong performance. This result is especially convincing when considering that our benchmarking compared the SV calls to data generated using a different sequencing technology and processed using different bioinformatics pipelines.
(2) From the Methods section, it appears that the authors employed Beagle for both imputation and the UK Biobank imputation.
(a) It would be better to explicitly clarify this in the Results section and provide a detailed description of the corresponding procedures and parameters in the Methods section for both analyses, as this represents a key aspect of the study.
We thank the reviewer for these suggestions. Accordingly, we added the clarification to the Methods section that the leave-one-out imputation used exactly the same pipeline and settings as the UK Biobank imputation (page 14, section “Leave-one-out imputation performance”):
“We excluded one individual from the panel and imputed SVs for this individual using the panel of the remaining 887 samples, applying exactly the same pipeline and settings as those later used for SV imputation into UK Biobank (see below).”
(b) Additionally, Beagle is not specifically designed for SV imputation, the imputation quality of SVs is generally lower than that of SNVs. Exploring strategies to improve SV imputation, such as developing a novel method with reference panel data, may enhance performance.
As stated in our manuscript (page 4), we believe that, in our study, the imputation quality of SVs is lower than of that of SNVs primarily because of a) the greater difficulty of SV calling compared to SNV genotype calling and b) the heterogeneity in SV representation across samples. Once SVs are encoded as bi-allelic markers in the reference panel, they can be imputed using the same LD/haplotype-based framework as any other variants. Accordingly, improving SV imputation is likely to benefit most from more accurate upstream SV calling and genotyping (e.g., through more robust multi-sample calling and harmonised variant representations) and not so much from improved or SV-specific imputation methods. While improved imputation is an important research direction, it is beyond the scope of the present manuscript.
(c) It is also important to assess how this reduced imputation quality may influence GWAS results. For instance, it would be useful to examine whether associated SVs exhibit higher imputation quality and whether SVs with lower quality are less likely to achieve significant association signals. In addition, the lower imputation quality observed for INV, DUP, and BND variants (Figure 3) may be due to their greater lengths (Figure 2). It is better to investigate the relationship between SV length and imputation quality.
We agree that imputation quality can influence GWAS results. For example, for the FEV1/FVC phenotype, SVs with INFO > 0.9 are almost twice as likely to reach genome-wide significance (p < 5e-8) compared with SVs with 0.7 < INFO < 0.9 (odds ratio 1.95; Fisher’s exact test p-value 2.5e-5). This is consistent with the intuitive notion (applicable to any variants, not only to SVs) that greater uncertainty in the imputed genotypes dilutes association signals and therefore reduces power. For a detailed discussion of the relationship between allele frequency, imputation accuracy, and GWAS association results, see Zhang et al., Human Molecular Genetics 31(1):146–155 (2022), https://doi.org/10.1093/hmg/ddab203
We have now investigated the relationship between SV length and imputation quality (the new Supplementary Figure 6). The results suggest that the observed association between imputation quality and SV size is primarily driven by the SV-size–dependent minor allele frequency in the imputation panel.
(3) All examples presented in the manuscript focus on SVs that overlap with genes. It may also be valuable to investigate SVs that do not overlap with genes but intersect with enhancer regions. SVs can contribute to disease by altering regulatory elements, such as enhancers, which play a crucial role in gene expression. Including such analyses would further demonstrate the utility of SV-GWAS and provide deeper insights into the functional impact of SVs.
We agree with the reviewer that examining SVs intersecting with enhancer regions could be an interesting direction for future studies, as it would provide additional insights into regulatory mechanisms and disease associations. However, in the present proof-of-principle study, we prefer focusing on SVs overlapping with genes and have now highlighted this in additional detail in the revised manuscript (Discussion, page 7):
“In the present proof-of-principle study, we focused on SVs overlapping with the coding sequence of genes. In future applications of our SV imputation panel, more refined gene mapping approaches could be employed, e.g., including SVs overlapping enhancer regions or epigenetic marks. Such an enhanced mapping would increase the number of identified associated genes and thus provide additional insights into regulatory mechanisms and disease biology.”
(4) The data availability link currently provides only a VCF file ("sniffles2_joint_sv_calls.vcf.gz") containing the identified SVs.
(a) It would be beneficial for the authors to make all raw sequencing data (FASTQ files) and key processed datasets (such as alignment results and merged SV and SNV files) available. Providing these resources would enable other researchers to develop improved SV detection and imputation methods or conduct further genetic analyses.
Thank you for emphasising the importance of data sharing, which we agree with.
The Data Availability section of the manuscript already includes a link to https://opnme.com/genomiclens, where we made both the SV calls and the full and reduced SV imputation panel files freely available. We have now added SV summary statistics from 32 SVwide association studies to the same resource. Based on the reviewer’s request, we now also reference the ENA repository project PRJEB89727 (https://www.ebi.ac.uk/ena/browser/view/PRJEB89727), where the raw FASTQ files are available for download, in the manuscript.
We have appended the Data Availability statement on page 22 of the revised manuscript as follows:
“Raw SV calls, the long-read sequencing-based SV imputation panel, and the SV summary statistics from 32 SV-wide association studies are available through the OpnMe initiative of Boehringer Ingelheim GmbH (https://opnme.com/genomiclens). The raw long-read sequencing data (FASTQ files) for the 1000 Genomes Project samples included in this study are accessible via the European Nucleotide Archive under accession number PRJEB89727 (https://www.ebi.ac.uk/ena/browser/view/PRJEB89727). The dataset analysed here constitutes a subset of this broader collection.”
(b) Furthermore, establishing a dedicated website for data access, along with a genome browser for SV visualization, could significantly enhance the impact and accessibility of the study. Additionally, all code, particularly the SV imputation pipeline accompanied by a detailed tutorial, should be deposited in a public repository such as GitHub. This would support researchers in imputing SVs and conducting SV-GWAS on their own datasets.
The Methods section provides a full and detailed description of the imputation pipeline and parameters in the section “Preprocessing and imputation of SVs into UK Biobank” on page 14 of the revised manuscript. Our data processing simply consisted of running standard bioinformatics tools with the parameters exactly as described in the manuscript.
Reviewer #1 (Recommendations for the authors):
(1) In the Results section, Figure 3b is mentioned before 3a, and it is better to switch them in the Figure.
Thank you for highlighting this fact. We acknowledge that typically the sequence of sections matches exactly between text and figures. However, in this specific case, we would prefer to deviate from the norm: In our opinion, Figure 3 is easier to interpret in its current sequence. At the same time, the text flows more logically in its current sequence, describing 3b before 3a. We would therefore prefer to stick to the current order, even if it means that Fig. 3b is described before 3a in the text.
(2) Page 10, "Figure 1e" -> "Figure 2e".
Thank you, we corrected this issue.
(3) Page 14, "Leave-one out" -> "Leave-one-out".
Thank you, we corrected this mistake.
(4) It is better not to use abbreviations in the subheadings, especially "UKB" (page 3).
Thank you, we changed the acronym ‘UKB’ to ‘UK Biobank’ in all subheadings.
Reviewer #2 (Public review):
Summary:
The authors aimed to develop a novel and efficient method for SV detection, utilizing data from the 1000 Genomes Project (1KGP) for modeling and calibration. This method was subsequently validated using UK population data and applied to identify structural variants associated with specific disease phenotypes.
Strengths:
Third-generation single-molecule sequencing data offers several advantages over traditional high-throughput sequencing methods, particularly due to its long-read lengths, which provide valuable insights into significant forms of genomic variation. The authors have developed an efficient method for detecting structural variations and optimizing the utilization of genomic data. We hope that this method will continue to be refined, enabling researchers to more effectively leverage long-read data, high-throughput data, or even a synergistic combination of both.
Weaknesses:
Although this research contributes to our ability to more effectively utilize long-length and high-throughput data, there are some key issues that need to be addressed in terms of analyzing the specific results as well as writing the article.
Reviewer #2 (Recommendations for the authors):
(1) How to discuss the lower detection rate of structural variations (SVs) in East Asian populations, it is worth considering whether the authors' training dataset, which may have been based on raw data with insufficient representation of East Asian individuals, could have introduced a bias favoring other populations. This potential bias might arise from the relatively limited data available for Asian ancestry. Alternatively, the observed differences could also be influenced by the role of natural selection, which may have shaped the genomic landscape of East Asian populations in distinct ways. Further investigation is needed to clarify these possibilities.
Thank you for raising this important point. Although an interesting research direction, a detailed investigation of the factors affecting SV detection rates is beyond the scope of the present study. However, we do not think that the lower detection rate in East Asians is due to an underrepresentation of Asian ancestry in our dataset. To explain this to all readers, we have added the following explanation to page 7 of the Discussion:
“In this context, we observed that the number of SVs detected per individual differed between superpopulations. We identified the highest average number of SVs in individuals of African descent and a slightly lower average in East Asians, compared to the other superpopulations. While we included a higher number of African ancestry individuals, the number of East Asian individuals included in our reference panel was comparable to the number of individuals from other, non-African ancestries. In fact, it was even larger than the number of European ancestry individuals (AFR n=241, SAS n=171; EAS n=168; EUR n=164; AMR n=144). Therefore, we do not expect a major bias from underrepresentation of any superpopulation in the training dataset. It is well established that African ancestry is more diverse than is the case for other superpopulations [32, 33] and previous studies indicate that East Asian populations tend to exhibit slightly lower genetic diversity compared to European populations [34], which is consistent with the lower observed SV counts per genome.”
(2) The authors did not present the results of the detection of CNV.
Copy number variations (CNVs) are considered a subclass of structural variants. In our analysis, we detected deletions and duplications, which represent the most common forms of CNVs. However, we did not specifically investigate high copy-number SVs, as these are often larger than what can be reliably detected using long-read sequencing. Large-scale CNVs are typically identified in biobank studies through analysis of intensity data from genotyping microarrays using tools like PennCNV, and there is extensive literature supporting the use of this microarray approach in UK Biobank and other genotyped cohorts, see for example Aguirre et al.: Phenomewide Burden of Copy-Number Variation in the UK Biobank. Am J Hum Genet. 2019, Aug 1;105(2):373-383. doi:10.1016/j.ajhg.2019.07.001.
(3) Multiple testing correction is essential for ensuring the validity of large-scale structural variation (SV) association analyses. It is strongly recommended that the statistical methods and correction strategies employed, such as Bonferroni correction or false discovery rate (FDR) control, be explicitly detailed to enhance the transparency and reliability of the findings.
For genome-wide SV association analyses, we applied the commonly used genome-wide significance threshold of 5e-8, which is standard in genome-wide studies. Given that these were exploratory proof-of-principle analyses illustrating use cases for SV analyses, we decided not to correct on top of that for multiple testing for the number of traits (32) tested. For the pQTL analyses, we further adjusted this threshold using a Bonferroni-type correction based on the number of proteins tested (1,463), to account for the increased number of multiple comparisons.
We have now added a more detailed description of this multiple testing procedure to the Methods subsection “SV-wide association studies in UK Biobank” on page 16 of the revised manuscript:
“In the exploratory SV-WAS, we used the standard threshold for genome-wide significance of p < 5×10<sup>-8</sup>. For the pQTL analyses, we applied Bonferroni correction for multiple testing on top of that genome-wide threshold, correcting for the number of tested protein levels (n=1463): p < 5×10<sup>-8</sup>/ 1463 = 3.4×10<sup>-11</sup>.”
(4) The study primarily relied on data from the 1000 Genomes Project (1KGP) and the UK Biobank; however, the UK Biobank cohort is predominantly composed of individuals of European ancestry, which may restrict the generalizability of the research findings to other populations.
Our reference panel was constructed to cover multiple ancestries, enabling imputation for diverse populations. Thus, our imputation panel can be applied to biobanks around the world and is freely available for this purpose. As a proof of principle, we have demonstrated the feasibility and performance of SV imputation in UK Biobank as an example of a broadly accessible cohort. We are looking forward to biobanks from diverse ancestries downloading our imputation panel and applying it to their populations.
(5) Although the study employed long-read sequencing technology, the validation of structural variation (SV) detection accuracy predominantly relied on internal data, such as 'leave-one-out' validation. To further strengthen the reliability of the SV detection methods, it is recommended to incorporate additional external independent datasets for validation.
The leave-one-out procedure in our study was used to validate the imputation performance, not the accuracy of SV detection. To assess SV calling accuracy, we performed extensive benchmarking against external SV call datasets derived from PacBio long-read sequencing and Illumina short-read sequencing. These details are provided under the subheading ‘Structural variant calling and benchmarking’ in the Results section on page 2 of the manuscript.
(6) Some of the SVs mentioned in the study overlap with disease association loci in the GWAS Catalog, but functional annotation and exploration of the biological mechanisms of these SVs are more limited. It is suggested that LD can be added to analyse whether there are SNP that are highly linked to them to further explore their functions.
We thank the reviewer for this suggestion. We have actually conducted an analysis addressing exactly this question: We performed conditional association analyses of the SV signals with nearby short variants (SNPs and InDels) at the SV locus. Such a conditional analysis addresses whether the observed SV association is influenced by LD-correlated SNPs or not. The results of this analysis are reported in Supplementary Tables 16 and 17. These tables include both the conditional analysis results and the LD between each SV and the variant at the locus with the second-highest evidence for an association.
Researchers interested in exploring the biological significance of the SV-WAS results in more detail can now download the full SV-WAS summary statistics from https://opnme.com/genomiclens.
(7) The discussion section could be further expanded to explore the role of SV in complex diseases and its potential application in precision medicine. For example, it could discuss how SV information can be integrated into existing GWAS frameworks to enhance the accuracy of disease risk prediction.
Thank you for the suggestion, we have now added the following sentences to the discussion (page 7/8):
“Structural variants can influence complex disease biology through either the disruption of coding sequence or an altered regulation of gene expression. Such effects may not be well captured by short variants alone. Incorporating SVs into GWAS and follow-up analyses would thus provide more accurate disease risk prediction, uncover underlying pathomechanisms by highlighting actionable pathways and targets, and support precision medicine by providing biomarkers for patient stratification.”
(8) The geographic labeling of certain samples in Figure 2 appears to contain inaccuracies. For instance, the CDX sample, which represents the Dai population from Xishuangbanna in China's Yunnan Province, is currently mislabeled as originating from China's Inner Mongolia. This discrepancy should be corrected to ensure the accuracy of the data representation.
We apologise for the misunderstanding. The geographic map in Figure 2a serves as an illustrative mapping of the samples to countries. It is intended to provide readers with an overview of population coverage, rather than to indicate the precise geographic origins of individual populations. The populations CDX, CHB, and CHS are displayed within the outline of China in alphabetical order, without any intention to indicate their exact geographic origin. We changed the respective figure caption to make this clear (page 19 of the revised manuscript):
“Map of the 888 samples from the 1000 Genomes project, mapping the samples to countries and not indicating detailed geographical origins of populations.”
Reviewer #3 (Public review):
This study successfully identified genetic loci associated with various traits by generating large-scale long-read sequencing data from a diverse set of samples. This study is significant because it not only produces large-scale long-read genome sequencing data but also demonstrates its application in actual genetics research. Given its potential utility in various fields, this study is expected to make a valuable contribution to the academic community and to this journal. However, there are several critical aspects that could be improved. Below are specific comments for consideration.
Strengths:
Producing high-quality, large-scale variant datasets and imputation datasets
Weaknesses:
(1) Data availability
Currently, it appears that only the Genomic Lens SV Panel is available on the webpage described in the Data Availability section. It is unclear whether the authors intend to release the raw sequencing data. Since the study utilized samples from the 1000 Genomes Project, there should be no restriction on making the data publicly accessible. Given this, would the authors consider making the raw sequencing reads publicly available? If so, NCBI SRA or EBI ENA would be the most appropriate repositories for data deposition. I strongly encourage the authors to consider public data release. Additionally, accessing the Genomic Lens SV Panel data does not seem straightforward. The manuscript should provide a more detailed description of how researchers can access and utilize these data. In my opinion, the best approach would be to upload the variant data (VCF files) to a public database such as the European Variation Archive (EVA) hosted by EBI.
I strongly request that the authors publicly deposit the variant data. At a minimum:
(a) The joint genotype data for all 888 samples from the 1000 Genomes Project must be publicly available.
Thank you for emphasising the importance of data sharing, which we agree with.
The Data Availability section of the manuscript already includes a link to https://opnme.com/genomiclens, where we make both the SV calls and the full and reduced SV imputation panels (provided as multi-sample VCF files) freely available. Based on the reviewer’s request, we now also reference the ENA repository project PRJEB89727 (https://www.ebi.ac.uk/ena/browser/view/PRJEB89727), where the raw FASTQ files are available for download.
We have appended the Data Availability statement on page 22 of the revised manuscript as follows:
“Raw SV calls, the long-read sequencing-based SV imputation panel, and the SV summary statistics from 32 SV-wide association studies are available through the OpnMe initiative of Boehringer Ingelheim GmbH (https://opnme.com/genomiclens). The raw long-read sequencing data (FASTQ files) for the 1000 Genomes Project samples included in this study are accessible via the European Nucleotide Archive under accession number PRJEB89727 (https://www.ebi.ac.uk/ena/browser/view/PRJEB89727). The dataset analysed here constitutes a subset of this broader collection.”
(b) For the UK Biobank samples, at least allele frequency data should be disclosed.
Supplementary Table 5 includes the allele frequencies of the SVs imputed into UK Biobank.
(c) Since eLife has a well-established data-sharing policy, compliance with these guidelines is essential for publication in this journal.
By sharing the FASTQ files, the SV calls, the SV imputation panels, the SV summary statistics, and (once processed by UK Biobank) the genotypes of SVs imputed into UK Biobank, we are providing all SV data generated in our study.
(2) Long-read sequencing data quality
While the manuscript presents N50 read length and mean or median read base quality for each sample in a table, it would be highly beneficial to visualize these data in figures as well. A violin plot or similar visualization summarizing these distributions would significantly improve data presentation.
Notably, the base quality of ONT long-read sequencing data appears lower than expected. This may be attributed to the use of pore version 9.4.1, but the unexpectedly low base quality still warrants attention. It would be helpful to include a small figure within Figure 2 to illustrate this point. A visual representation of read length distribution and base quality distribution would strengthen the manuscript.
We thank the reviewer for this suggestion. We have now included two violin plots (the new Supplementary Figure 1) to the revised manuscript, summarising a) the N50 read length per sequencing run and b) the median read quality per sequencing run. These plots provide a clearer visualisation of the underlying distributions. We do not consider the ONT base quality to be low. Importantly, structural variant detection is generally robust to modest variations of per-base quality. Therefore, we do not expect the observed base quality levels to significantly affect SV calling in this study.
(3) Variant detection precision, recall, and F1 score
This study focuses on insertions and deletions (indels) {greater than or equal to}50 bp, but it remains unclear how well variants <50 bp are detected. I am particularly interested in the precision, recall, and F1 score for variants between 5-49 bp.
While ONT base quality is relatively low, single-base variants are challenging to analyze, but variants {greater than or equal to}5 bp should still be detectable as their read accuracy is still approximately 90%, making analysis feasible. Given that Sniffles supports the detection of variants as small as 1 bp, I strongly encourage the authors to conduct an additional analysis.
A simple two-category classification (e.g., 5-49 bp and {greater than or equal to}50 bp) should suffice. Additionally, a comparative analysis with HiFi and short-read sequencing data would be highly valuable. If possible, I strongly recommend that all detected variants {greater than or equal to}5 bp be made publicly available as VCF files.
Because short InDels are available from high-coverage Illumina sequencing data generated for the same individuals (i.e., the data referred to as the NYGC dataset in our manuscript), we decided against calling such short variants from our lower coverage Oxford Nanopore data and thus concentrated our efforts on reliably calling longer variants covering at least 50 bp, consistent with the conventional definition of structural variants.
(4) Assembly-based methods
Given the low read accuracy and low sequencing depth in this dataset, it is understandable that genome assembly is challenging. However, the latest high-quality human genome datasets-such as those produced by the Human Pangenome Reference Consortium (HPRC)demonstrate that assembly-based approaches provide significant advantages, particularly for resolving complex and long structural variants.
Since HPRC data also utilize 1000 Genomes Project samples, it would be highly informative to compare the accuracy of ONT sequencing in this study with HPRC's assembly-based genome data. The recent publication on 47 HPRC samples provides a valuable reference for such a comparison. Given its relevance, the authors should consider providing a comparative analysis with HPRC data.
The aim of the present study was to generate an SV reference panel that enables SV imputation for large biobanks. Detailed assessments of ONT sequencing quality in general and comparisons to other sequencing efforts and technologies are out of scope for the present manuscript. We invite the scientific community to use the FASTQ files provided at ENA for conducting such detailed assessments in follow-up studies.
eLife Assessment
This study provides valuable new insights into the functional differentiation of human amygdala subnuclei during the observation of negative images and emotional reappraisal. The evidence is convincing, particularly regarding differences in the time course of evoked responses and their partial correspondence with broad anatomical subdivisions. The work will be of interest to researchers studying the amygdala, emotional processing, and emotion regulation.
Reviewer #1 (Public review):
Summary:
The authors aimed to re-analyse two fMRI datasets of studies investigating the effect of cognitive emotional regulation on amygdala response during the viewing of negative images, in order to assess whether such effects might have been missed in previous reports of the results of these studies. In order to accommodate potential non-typical response profiles in the amygdala, they used a modelling approach that is agnostic about the shape of the BOLD response (finite impulse response modelling). Furthermore, the authors sought to differentiate between amygdala subregions using i) two previously published probabilistic atlases of amygdala subnuclei; and ii) a data-driven analysis focusing on temporal response profiles, which identified four clusters that mostly overlapped with anatomical parcellations. The analyses confirmed their previous results insofar as they did not find any impact of emotional regulation on the amygdala response in any subregion. However, their approach revealed differences in temporal response profiles between amygdala subregions: the centromedial amygdala showed sustained activation extending into the post-stimulus rating period, whereas laterobasal and superficial subregions peaked earlier during stimulus presentation. Overall, this study helps to clarify whether cognitive emotional regulation during negative image viewing alters amygdala response, and demonstrates the value of flexible response modelling to differentiate between functional subregions of an important brain structure.
Strengths:
The strengths of this study lie in the amount of data used (a combined N of 358 participants is rather high), the flexibility of the modelling approach (FIR), the exploratory nature of the data-driven clustering based on temporal response profiles, and clarity of the text and of the findings. One weakness would be the fact that no fMRI data acquired at higher field strengths were used for the aim of differentiating responses of amygdala subunits.
In my opinion, the authors achieved their aims of re-analysing these datasets with complementary methods, and helped to discover new aspects of the BOLD response in the amygdala during emotional regulation. The results support their conclusions.
This work is likely to stimulate discussion of the response of amygdala subnuclei during emotional regulation, and might encourage researchers to resort to more flexible analysis methods by demonstrating the information gain achieved with the FIR approach.
Weaknesses:
There are 7T studies of the amygdala response that have looked at differences in BOLD response across subnuclei. While I don't know of any that have investigated emotional regulation, I think these studies should nevertheless be mentioned and discussed in the Discussion, at least to compare the differences observed across subnuclei.
Reviewer #2 (Public review):
Summary:
In this paper, Bo et al. study the spatiotemporal organization of BOLD responses in the amygdala. They apply FIR modelling to a large sample (two cohorts tested at the same site and scanner, totalling >350 individuals) who completed a negative/neutral picture viewing and cognitive reappraisal task. Averaging voxelwise BOLD responses across two distinct probabilistic atlases of the amygdala, the authors found that a corresponding centromedial region showed sustained activation to negative stimuli beyond the stimulus period. Laterobasal and superficial subregions peaked earlier, within the stimulus presentation period. In all cases, reappraisal did not change these profiles. Lateralization effects (left-side dominance) were found in the CM region at later time points, and to a lesser extent in the superficial nucleus area at earlier time points. Data-driven clustering of voxelwise time courses could partly recover findings from probabilistic atlases, but nonetheless showed partial decoupling of anatomical and functional boundaries in the amygdala.
Strengths:
This is a well-written paper with a clear objective addressed by sound methods. The authors set out to address two main questions: (1) "do amygdala subregions exhibit distinct temporal dynamics in response to negative emotional stimuli?" and (2) "does cognitive reappraisal differentially modulate these temporal profiles across subregions?" Regarding question 1, FIR modelling results indicate strong differentiation of the centromedial region of the amygdala from other subdivisions, with strong and late responses to presented negative stimuli. On question 2, cognitive reappraisal does not seem to play a major role here, although I raise a question on this in the next section. Overall, all presented conclusions are supported by study findings. I would add that lateralization effects are not mentioned in the main objectives/questions of the paper, but this analysis represents a large section of the results that may warrant mention in the introduction as well.
Weaknesses:
(1) An important concern when looking at mesiotemporal regions such as the amygdala is signal-to-noise. Yet, this challenge in analyzing data from the amygdala was not addressed here but represents a potential confound if SNR varies within the amygdala along its major subdivisions.
(2) The authors analyze BOLD evoked response time courses, but I did not find a GLM analysis showing that the task reliably engaged the amygdala, either when analyzed with a canonical HRF or with the FIR model used here. We can see from Figure 2 that the task may not engage the entire amygdala (e.g. LB/LA subregions seem to show lower amplitude evoked-responses), yet the authors focus equally on time courses of subregions engaged and not engaged in the task. As such, differences observed between subregions may reflect different underlying processes (e.g. different processes of engagement in the task, or high/low engagement).
(3) The study uses two different probabilistic atlases to parse BOLD response time courses in the amygdala. However, methodological details on the processing of the atlas data are missing from the text. For example, it is unclear if the subregions were thresholded or overlap in any way, which would affect the strength of detected effects if there is substantial overlap between areas.
(4) The authors found no effect of reappraisal on BOLD response time courses. However, if I understand correctly, not all participants showed successful reappraisal according to their behavioural ratings (lines 125-126: "Eighty-one percent of participants showed a regulation effect in the same direction as the group-level effect"). Were these participants excluded from the reappraisal analysis on evoked response time courses? This is currently unclear, but holds significance in reliably answering question 2.
Add a contact
By sharing your profile:
using contacts
On CryptPad, using contacts makes collaboration more secure and simple.
list of contacts.
If the user is in your list of contacts.
User menu (avatar at the top-right) - > Contacts > Double click on their name in the list.
105530
DOI: 10.64898/2026.06.03.729793
Resource: RRID:Addgene_105530
Curator: @Apiekniewska
SciCrunch record: RRID:Addgene_105530
pET-His6-MBP-TEV-Lic
DOI: 10.64898/2026.06.03.724713
Resource: Addgene (RRID:SCR_002037)
Curator: @Apiekniewska
SciCrunch record: RRID:SCR_002037
78110
DOI: 10.64898/2026.06.01.729450
Resource: RRID:Addgene_78110
Curator: @Apiekniewska
SciCrunch record: RRID:Addgene_78110
51631
DOI: 10.64898/2026.06.01.728939
Resource: RRID:Addgene_51631
Curator: @Apiekniewska
SciCrunch record: RRID:Addgene_51631
12259
DOI: 10.64898/2026.06.01.728939
Resource: RRID:Addgene_12259
Curator: @Apiekniewska
SciCrunch record: RRID:Addgene_12259
28170
DOI: 10.64898/2026.06.01.728939
Resource: RRID:Addgene_28170
Curator: @Apiekniewska
SciCrunch record: RRID:Addgene_28170
12260
DOI: 10.64898/2026.06.01.728939
Resource: RRID:Addgene_12260
Curator: @Apiekniewska
SciCrunch record: RRID:Addgene_12260
26655
DOI: 10.64898/2026.06.01.728939
Resource: RRID:Addgene_26655
Curator: @Apiekniewska
SciCrunch record: RRID:Addgene_26655
8453
DOI: 10.64898/2026.06.01.728939
Resource: RRID:Addgene_8453
Curator: @Apiekniewska
SciCrunch record: RRID:Addgene_8453
255617
DOI: 10.64898/2026.05.31.729073
Resource: Addgene (RRID:SCR_002037)
Curator: @Apiekniewska
SciCrunch record: RRID:SCR_002037
255626
DOI: 10.64898/2026.05.31.729073
Resource: Addgene (RRID:SCR_002037)
Curator: @Apiekniewska
SciCrunch record: RRID:SCR_002037
255627
DOI: 10.64898/2026.05.31.729073
Resource: Addgene (RRID:SCR_002037)
Curator: @Apiekniewska
SciCrunch record: RRID:SCR_002037
255616
DOI: 10.64898/2026.05.31.729073
Resource: Addgene (RRID:SCR_002037)
Curator: @Apiekniewska
SciCrunch record: RRID:SCR_002037
255625
DOI: 10.64898/2026.05.31.729073
Resource: Addgene (RRID:SCR_002037)
Curator: @Apiekniewska
SciCrunch record: RRID:SCR_002037
159298
DOI: 10.64898/2026.05.31.729073
Resource: RRID:Addgene_159298
Curator: @Apiekniewska
SciCrunch record: RRID:Addgene_159298
255624
DOI: 10.64898/2026.05.31.729073
Resource: Addgene (RRID:SCR_002037)
Curator: @Apiekniewska
SciCrunch record: RRID:SCR_002037
255615
DOI: 10.64898/2026.05.31.729073
Resource: Addgene (RRID:SCR_002037)
Curator: @Apiekniewska
SciCrunch record: RRID:SCR_002037
62196
DOI: 10.64898/2026.05.31.729073
Resource: RRID:Addgene_62196
Curator: @Apiekniewska
SciCrunch record: RRID:Addgene_62196
255622
DOI: 10.64898/2026.05.31.729073
Resource: Addgene (RRID:SCR_002037)
Curator: @Apiekniewska
SciCrunch record: RRID:SCR_002037
62197
DOI: 10.64898/2026.05.31.729073
Resource: RRID:Addgene_62197
Curator: @Apiekniewska
SciCrunch record: RRID:Addgene_62197
255621
DOI: 10.64898/2026.05.31.729073
Resource: Addgene (RRID:SCR_002037)
Curator: @Apiekniewska
SciCrunch record: RRID:SCR_002037
255614
DOI: 10.64898/2026.05.31.729073
Resource: Addgene (RRID:SCR_002037)
Curator: @Apiekniewska
SciCrunch record: RRID:SCR_002037
255613
DOI: 10.64898/2026.05.31.729073
Resource: Addgene (RRID:SCR_002037)
Curator: @Apiekniewska
SciCrunch record: RRID:SCR_002037
255612
DOI: 10.64898/2026.05.31.729073
Resource: Addgene (RRID:SCR_002037)
Curator: @Apiekniewska
SciCrunch record: RRID:SCR_002037
255631
DOI: 10.64898/2026.05.31.729073
Resource: Addgene (RRID:SCR_002037)
Curator: @Apiekniewska
SciCrunch record: RRID:SCR_002037
255630
DOI: 10.64898/2026.05.31.729073
Resource: Addgene (RRID:SCR_002037)
Curator: @Apiekniewska
SciCrunch record: RRID:SCR_002037
255629
DOI: 10.64898/2026.05.31.729073
Resource: Addgene (RRID:SCR_002037)
Curator: @Apiekniewska
SciCrunch record: RRID:SCR_002037
255628
DOI: 10.64898/2026.05.31.729073
Resource: Addgene (RRID:SCR_002037)
Curator: @Apiekniewska
SciCrunch record: RRID:SCR_002037
159297
DOI: 10.64898/2026.05.31.729073
Resource: RRID:Addgene_159297
Curator: @Apiekniewska
SciCrunch record: RRID:Addgene_159297
255623
DOI: 10.64898/2026.05.31.729073
Resource: Addgene (RRID:SCR_002037)
Curator: @Apiekniewska
SciCrunch record: RRID:SCR_002037
8454
DOI: 10.64898/2026.05.30.728955
Resource: RRID:Addgene_8454
Curator: @Apiekniewska
SciCrunch record: RRID:Addgene_8454
98184
DOI: 10.64898/2026.05.30.728950
Resource: RRID:Addgene_98184
Curator: @Apiekniewska
SciCrunch record: RRID:Addgene_98184
12259
DOI: 10.64898/2026.05.29.728882
Resource: RRID:Addgene_12259
Curator: @Apiekniewska
SciCrunch record: RRID:Addgene_12259
12253
DOI: 10.64898/2026.05.29.728882
Resource: RRID:Addgene_12253
Curator: @Apiekniewska
SciCrunch record: RRID:Addgene_12253
12251
DOI: 10.64898/2026.05.29.728882
Resource: RRID:Addgene_12251
Curator: @Apiekniewska
SciCrunch record: RRID:Addgene_12251
178883
DOI: 10.64898/2026.05.29.728882
Resource: RRID:Addgene_178883
Curator: @Apiekniewska
SciCrunch record: RRID:Addgene_178883
178882
DOI: 10.64898/2026.05.29.728882
Resource: RRID:Addgene_178882
Curator: @Apiekniewska
SciCrunch record: RRID:Addgene_178882
178881
DOI: 10.64898/2026.05.29.728882
Resource: RRID:Addgene_178881
Curator: @Apiekniewska
SciCrunch record: RRID:Addgene_178881
178880
DOI: 10.64898/2026.05.29.728882
Resource: RRID:Addgene_178880
Curator: @Apiekniewska
SciCrunch record: RRID:Addgene_178880
178879
DOI: 10.64898/2026.05.29.728882
Resource: RRID:Addgene_178879
Curator: @Apiekniewska
SciCrunch record: RRID:Addgene_178879
178878
DOI: 10.64898/2026.05.29.728882
Resource: RRID:Addgene_178878
Curator: @Apiekniewska
SciCrunch record: RRID:Addgene_178878
55636
DOI: 10.64898/2026.05.28.728535
Resource: RRID:Addgene_55636
Curator: @Apiekniewska
SciCrunch record: RRID:Addgene_55636
50469
DOI: 10.64898/2026.05.28.728535
Resource: RRID:Addgene_50469
Curator: @Apiekniewska
SciCrunch record: RRID:Addgene_50469
100842
DOI: 10.64898/2026.05.28.728535
Resource: RRID:Addgene_100842
Curator: @Apiekniewska
SciCrunch record: RRID:Addgene_100842
64604
DOI: 10.3390/ijms27115039
Resource: RRID:Addgene_64604
Curator: @Apiekniewska
SciCrunch record: RRID:Addgene_64604
12260
DOI: 10.3390/ijms27114974
Resource: RRID:Addgene_12260
Curator: @Apiekniewska
SciCrunch record: RRID:Addgene_12260
12259
DOI: 10.3390/ijms27114974
Resource: RRID:Addgene_12259
Curator: @Apiekniewska
SciCrunch record: RRID:Addgene_12259
11171
DOI: 10.3390/ijms27114974
Resource: RRID:Addgene_11171
Curator: @Apiekniewska
SciCrunch record: RRID:Addgene_11171
Addgene
DOI: 10.3390/ijms27114873
Resource: Addgene (RRID:SCR_002037)
Curator: @Apiekniewska
SciCrunch record: RRID:SCR_002037
pRK793
DOI: 10.3390/ijms27114823
Resource: Addgene (RRID:SCR_002037)
Curator: @Apiekniewska
SciCrunch record: RRID:SCR_002037
20058
DOI: 10.3390/ijms27114689
Resource: RRID:Addgene_20058
Curator: @Apiekniewska
SciCrunch record: RRID:Addgene_20058
Addgene
DOI: 10.3390/ijms27114685
Resource: Addgene (RRID:SCR_002037)
Curator: @Apiekniewska
SciCrunch record: RRID:SCR_002037
12253
DOI: 10.3390/cells15111028
Resource: RRID:Addgene_12253
Curator: @Apiekniewska
SciCrunch record: RRID:Addgene_12253
26655
DOI: 10.3390/cells15111028
Resource: RRID:Addgene_26655
Curator: @Apiekniewska
SciCrunch record: RRID:Addgene_26655
12259
DOI: 10.3390/cells15111028
Resource: RRID:Addgene_12259
Curator: @Apiekniewska
SciCrunch record: RRID:Addgene_12259
12251
DOI: 10.3390/cells15111028
Resource: RRID:Addgene_12251
Curator: @Apiekniewska
SciCrunch record: RRID:Addgene_12251
8453
DOI: 10.3390/cancers18111712
Resource: RRID:Addgene_8453
Curator: @Apiekniewska
SciCrunch record: RRID:Addgene_8453
12259
DOI: 10.3390/biology15110848
Resource: RRID:Addgene_12259
Curator: @Apiekniewska
SciCrunch record: RRID:Addgene_12259
12253
DOI: 10.3390/biology15110848
Resource: RRID:Addgene_12253
Curator: @Apiekniewska
SciCrunch record: RRID:Addgene_12253
12260
DOI: 10.3390/biology15110848
Resource: RRID:Addgene_12260
Curator: @Apiekniewska
SciCrunch record: RRID:Addgene_12260
51733
DOI: 10.3390/biology15110848
Resource: RRID:Addgene_51733
Curator: @Apiekniewska
SciCrunch record: RRID:Addgene_51733
Syn.GCaMP6f.WPRE.SV40
DOI: 10.3389/fnsyn.2026.1832103
Resource: Addgene (RRID:SCR_002037)
Curator: @Apiekniewska
SciCrunch record: RRID:SCR_002037
lentiCRISPR
DOI: 10.3389/fimmu.2026.1842309
Resource: Addgene (RRID:SCR_002037)
Curator: @Apiekniewska
SciCrunch record: RRID:SCR_002037
TgF344-AD
DOI: 10.21203/rs.3.rs-7072571
Resource: Rat Resource and Research Center (RRID:SCR_002044)
Curator: @Apiekniewska
SciCrunch record: RRID:SCR_002044
TgF344-AD rats
DOI: 10.21203/rs.3.rs-7072571
Resource: RRID:RRRC_00699
Curator: @bandrow
SciCrunch record: RRID:RRRC_00699
RRID:Addgene_76784
DOI: 10.1371/journal.ppat.1012998
Resource: RRID:Addgene_76784
Curator: @Apiekniewska
SciCrunch record: RRID:Addgene_76784
RRID:Addgene_76783
DOI: 10.1371/journal.ppat.1012998
Resource: RRID:Addgene_76783
Curator: @Apiekniewska
SciCrunch record: RRID:Addgene_76783
RRID:Addgene_83423
DOI: 10.1371/journal.ppat.1012998
Resource: RRID:Addgene_83423
Curator: @Apiekniewska
SciCrunch record: RRID:Addgene_83423
RRID:Addgene_83422
DOI: 10.1371/journal.ppat.1012998
Resource: RRID:Addgene_83422
Curator: @Apiekniewska
SciCrunch record: RRID:Addgene_83422
Addgene #8454
DOI: 10.1371/journal.pgen.1012191
Resource: RRID:Addgene_8454
Curator: @Apiekniewska
SciCrunch record: RRID:Addgene_8454
119760
DOI: 10.1261/rna.080638.125
Resource: RRID:Addgene_119760
Curator: @Apiekniewska
SciCrunch record: RRID:Addgene_119760
12260
DOI: 10.1200/PO-26-00091
Resource: RRID:Addgene_12260
Curator: @Apiekniewska
SciCrunch record: RRID:Addgene_12260
52961
DOI: 10.1200/PO-26-00091
Resource: RRID:Addgene_52961
Curator: @Apiekniewska
SciCrunch record: RRID:Addgene_52961
12259
DOI: 10.1200/PO-26-00091
Resource: RRID:Addgene_12259
Curator: @Apiekniewska
SciCrunch record: RRID:Addgene_12259
psPAX2
DOI: 10.1186/s40478-026-02298-8
Resource: Addgene (RRID:SCR_002037)
Curator: @Apiekniewska
SciCrunch record: RRID:SCR_002037
pMD2
DOI: 10.1186/s40478-026-02298-8
Resource: Addgene (RRID:SCR_002037)
Curator: @Apiekniewska
SciCrunch record: RRID:SCR_002037
17448
DOI: 10.1172/JCI199838
Resource: RRID:Addgene_17448
Curator: @Apiekniewska
SciCrunch record: RRID:Addgene_17448