VScode claude code plugin. Can I check how this integrates, and why the same isn't happening when I want to work with local models?
55 Matching Annotations
- Jan 2026
-
code.claude.com code.claude.com
Tags
Annotators
URL
-
-
tenthousandmeters.com tenthousandmeters.com
-
I switched from VSCode to Zed
- Original author switched from VSCode to Zed in December and now uses Zed as the primary editor for Python and Go.
- Main reason for leaving VSCode was increasingly intrusive AI features (Copilot prompts, inline terminal suggestions) and perceived increase in crashes and slowness.
- Author still likes VSCode overall but feels rapid AI integration harmed stability and usability, and hopes it becomes less intrusive in the future.
- JetBrains IDEs were rejected as feeling too heavy, and Vim/Emacs as too time‑intensive to configure; Zed was attractive as a modern, lightweight Rust-based IDE.
- Transition from VSCode was smooth: similar UI, mostly compatible keybindings, and ability (unused by author) to import some VSCode settings.
- Zed felt significantly faster and more responsive than VSCode, with no glitches or crashes over a couple of weeks, restoring a sense of “joy of programming”.
- Initial Zed setup was minimal: adjust fonts, theme, disable inline git blame, and enable autosave; Go worked out of the box.
- Python setup required more work because Zed uses language servers and defaults to Basedpyright instead of Pylance (which is VSCode-only and closed source).
- The author hit unexpected strict type-checking because projects with a
[tool.pyright]section inpyproject.tomleffectively force Basedpyright’srecommendedmode. - Attempting to set
typeCheckingModein Zed’ssettings.jsondid not help; the fix was explicitly settingtypeCheckingMode = "standard"inside each project’s[tool.pyright]config. - Another issue was delayed type diagnostics across files, fixed by setting
"disablePullDiagnostics": truein Zed’s Basedpyright initialization options. - Virtualenv handling and other Python-specific behavior worked smoothly; the author also tried the new
tylanguage server, found it good, but stayed with Basedpyright to match CI’s Pyright. - Zed is now the author’s default IDE: fast, stable, familiar, with enough extensions despite a much smaller ecosystem than VSCode.
- The main missing feature is a powerful side‑by‑side git diff viewer comparable to GitLens.
- Zed’s AI features are present but easy to ignore; paid plans for AI edit predictions seem like a reasonable way to fund development while keeping the core editor free.
- The author views Zed as a serious competitor that pressures VSCode to improve, especially around AI integration and performance.
- The post ends with sharing a minimal
settings.jsonshowcasing autosave, disabled inline blame, VSCode keymap, fonts, light theme, and customized Basedpyright LSP options.
Hacker News Discussion
- A VS Code team member acknowledges that AI-related features sometimes ignore the “disable” settings but states they try to ship fixes quickly and appreciate feedback.
- Several commenters recommend VSCodium as a way to get the open‑source VS Code experience without Microsoft’s telemetry and aggressive AI integration, while clarifying that both VS Code and VSCodium build from the same upstream repo.
- Many users express frustration with VS Code becoming bloated, unreliable, or “enshittified,” particularly around Copilot and complex configuration/remote setups, and are looking at Zed or classic editors as alternatives.
- Emacs and Vim/Neovim advocates argue that investing in these longstanding editors avoids churn and AI/UX regressions, with some describing decades-long Emacs usage and others praising Neovim plus LSPs as a lightweight yet powerful setup.
- Sublime Text is often cited as the spiritual predecessor of Zed in terms of speed and snappiness, with some saying Zed is the closest modern successor focused on performance.
- Zed users highlight positives like fast AI/MCP integration, good Nix/Direnv support, and pleasant design, but note pain points such as font rendering on low‑DPI or non‑GPU setups, Linux packaging gaps, missing REPLs for Lisps, and weaker debugging/extension ecosystems compared to VS Code or JetBrains.
- Some comments mention concrete bugs and annoyances in Zed, including format‑on‑save occasionally deleting the first line of Python classes, unwanted newline insertion at EOF, and missing small quality-of-life features (e.g., indentation autodetection, drag‑and‑drop markdown link insertion).
- A few developers describe hybrid workflows: using JetBrains IDEs on powerful machines, Zed on lower‑power devices, and Vim/Neovim or Sublime for quick one‑off edits, emphasizing that Zed is not yet at JetBrains’ level for deep refactoring and code understanding.
- Several participants discuss Zed’s business model as an AI “reseller”: core editor remains free while Pro users pay for pooled tokens across multiple AI providers, which some see as a relatively benign and sustainable way to monetize.
- There is concern that Zed’s extension ecosystem is still small and that Rust-based extension development may limit growth relative to VS Code; suggestions include better guidance for porting VS Code extensions and addressing collaboration/chat self‑hosting and security concerns.
-
- Dec 2025
-
github.com github.com
-
Configure the Extension Install this extension from the VS Code marketplace Open VS Code Settings (Cmd/Ctrl + ,) Search for "Obsidian MCP"
Obsidian MCP not found in VS Code market.
Tags
Annotators
URL
-
-
modelcontextprotocol.io modelcontextprotocol.io
-
Visual Studio Code acts as an MCP host. When Visual Studio Code establishes a connection to an MCP server, such as the Sentry MCP server, the Visual Studio Code runtime instantiates an MCP client object that maintains the connection to the Sentry MCP server.
VS Code acts as MCP Host (in their AI toolkit extension I think). You could connect it to the Obsidian MCP server plugin then?
Tags
Annotators
URL
-
-
www.xda-developers.com www.xda-developers.com
-
A comparison between VS Code and Obsidian. Doesn't state the obvious: any text editor can do this. The tools are just viewers and do not contain the data, which is part of your filesystem. Vgl [[3 Distributed Eigenschappen 20180703150724]]
-
-
code.visualstudio.com code.visualstudio.com
-
The AI toolkit adds LLM based options to VSCode. Installed it, as it allows me to access different models via ollama locally.
-
-
marketplace.visualstudio.com marketplace.visualstudio.com
-
Claude Code plugin for Visual Studio Code
Tags
Annotators
URL
-
- Mar 2025
-
github.com github.comView1
-
Forward/Direct synctex (source to pdf) can either be activated by selecting 'Navigate, select, and edit' > 'SyncTeX from cursor' in the side bar, or by the shortcut ctrl+alt+j (cmd+option+j on Mac), see also the FAQ for an alternative shortcut. Backward/Reverse synctex (pdf to source) is activated by pointing at the relevant element of the pdf preview. When using the internal viewer, the default keybinding to point at an element in the pdf preview is ctrl+click.
vscode + latex workshop,syntex 跳转:在编辑窗格中,用 ctrl+alt+j;在预览窗格中,用 ctrl+左键
-
- Jun 2024
-
www.codium.ai www.codium.ai
Tags
Annotators
URL
-
-
www.kenmuse.com www.kenmuse.com
-
Sample
.devcontainer/devcontainer.json:json { "name": "Global", "build": { "context": "..", "dockerfile": "Dockerfile" }, "containerEnv": { "PYTHONPATH": "." }, "customizations": { "vscode": { "settings": { "extensions.verifySignature": false }, "extensions": [ "GitHub.copilot", "ms-python.vscode-pylance", "ms-python.python", "eamodio.gitlens" ] } }, "initializeCommand": "/bin/bash -c '[[ -d ${HOME}/.aws ]] || { echo \"Error: ${HOME}/.aws directory not found.\"; exit 1; }; [[ -f ${HOME}/.netrc ]] || { echo \"Error: ${HOME}/.netrc file not found.\"; exit 1; }; [[ -d ${HOME}/.ssh ]] || { echo \"Error: ${HOME}/.ssh directory not found.\"; exit 1; }; echo \"\n> All required mounts found on the host machine.\"'", "onCreateCommand": { "hadolint": "apt-get update && apt-get install wget -y && wget -O /bin/hadolint https://github.com/hadolint/hadolint/releases/download/v2.12.0/hadolint-Linux-x86_64 && chmod u+x /usr/bin/hadolint", "precommit": "pip install pre-commit" }, "updateContentCommand": "/bin/bash -c 'if grep -A 2 \"machine gitlab.com\" ~/.netrc | grep -q \"password\" && GITLAB_TOKEN=$(grep -A 2 \"machine gitlab.com\" ~/.netrc | grep -oP \"(?<=password ).*\" | tr -d \"\\n\") && [ -n \"$GITLAB_TOKEN\" ]; then echo \"\n> Token found in ~/.netrc\"; else read -sp \"\n> Enter your GitLab token: \" GITLAB_TOKEN && echo; fi; echo \"export GITLAB_TOKEN=$GITLAB_TOKEN\" >> ~/.bashrc && . ~/.bashrc && poetry config http-basic.abc __token__ $GITLAB_TOKEN'", "postCreateCommand": ". ~/.bashrc && curl -s --location 'https://gitlab.com/api/v4/projects/12345/repository/files/.pre-commit-config.yaml/raw?ref=main' --header \"PRIVATE-TOKEN: $GITLAB_TOKEN\" -o .pre-commit-config.yaml", "postAttachCommand": "/bin/bash -c '. ~/.bashrc && read -p \"\n> Do you want to update the content of devcontainer.json? (y/n): \" response; if [[ \"$response\" == \"y\" ]]; then curl -s --location \"https://gitlab.com/api/v4/projects/12345/repository/files/devcontainer.json/raw?ref=main\" --header \"PRIVATE-TOKEN: $GITLAB_TOKEN\" -o .devcontainer/devcontainer.json; else echo \"\n> Skipping update of devcontainer.json\"; fi'", "mounts": [ "source=${localEnv:HOME}/.aws/,target=/root/.aws/,type=bind,readonly", "source=${localEnv:HOME}/.netrc,target=/root/.netrc,type=bind,readonly", "source=${localEnv:HOME}/.ssh/,target=/root/.ssh/,type=bind,readonly" ] } -
Some more of my recent learning with
devcontainer.json(its Dev Container metadata):- Interactive commands (those waiting for user input like
read) do not display the input request in (at leastonCreateCommandandpostCreateCommandsections), so it is better to keep them inupdateContentCommandorpostAttachCommand. - If there are 2
readcommands in a single section, likeupdateContentCommand, only the 1st one is displayed to the user, and the 2nd one is ignored. - When I put a
readcommand within a dictionary (with at lest 2 key/values) ofpostAttachCommand, the interactive command wasn't being displayed. - We need to use
/bin/bash -cto be able to useread -s(the-sflag) which allows for securely passing the password so that it does not stay in the VS Code console. Also, I had trouble with interactive commands andifstatements without it. - Using
"GITLAB_TOKEN": "${localEnv:GITLAB_TOKEN}"does not easily work as it is looking forGITLAB_TOKENenv variable set locally on our host computers, and I believe no one does it. - The dictionary seems to be executing its scripts in parallel; therefore, it is not easily possible to break down long lines which have to execute in a chronological sequence.
- JSON does not allow for human-readable line breaks; therefore, indeed, it seems impossible to improve the long one-liners.
- The files/folders mentioned within
mountsneed to exist locally (otherwise, Docker container build fails). They are mounted before any other section. Technically, we can protect ourselves with the following command to find an extra message in VS Code container logs:
json
"initializeCommand": "/bin/bash -c '[[ -d ${HOME}/.aws ]] || { echo \"Error: ${HOME}/.aws directory not found.\"; exit 1; }; [[ -f ${HOME}/.netrc ]] || { echo \"Error: ${HOME}/.netrc file not found.\"; exit 1; }; [[ -d ${HOME}/.ssh ]] || { echo \"Error: ${HOME}/.ssh directory not found.\"; exit 1; }'",
Other option is to get rid of the error completely, but this creates files on the host machine; therefore, it is not an ideal solution:
json "initializeCommand": "mkdir -p ~/.ssh ~/.aws && touch ~/.netrc", - Interactive commands (those waiting for user input like
-
["bash", "-i", "-c", "read -p 'Type a message: ' -t 10 && echo Attach $REPLY"],
I would also simply put the following:
bash /bin/bash -c 'read -p 'Type a message: ' -t 10 && echo Attach $REPLY' -
Consequently, it’s one of the only commands that consistently allows interactions with users.
I also found that
updateContentCommandallows for the user interaction (it displays interactive command in the VS Code console). -
There are six available lifecycle script hooks
Explanation of 6 available
devcontainer.json(Dev Container in VS Code) hooks.
-
- Jan 2024
-
www.highgo.ca www.highgo.ca
- Oct 2023
-
code.visualstudio.com code.visualstudio.com
- Jul 2023
-
vscode.dev vscode.dev
-
- Jun 2023
-
code.visualstudio.com code.visualstudio.com
Tags
Annotators
URL
-
-
bitfieldconsulting.com bitfieldconsulting.com
Tags
Annotators
URL
-
-
www.freecodecamp.org www.freecodecamp.org
-
discourse.julialang.org discourse.julialang.org
-
www.datacamp.com www.datacamp.com
Tags
Annotators
URL
-
-
stackoverflow.com stackoverflow.com
-
towardsdatascience.com towardsdatascience.com
-
fly.io fly.io
- Feb 2023
-
code.visualstudio.com code.visualstudio.com
-
"languageServerExample.trace.server": "verbose"
This is in the contributes part of the package.json
json
    "contributes": {
        "configuration": {
            "type": "object",
            "title": "Example configuration",
            "properties": {
                "languageServerExample.maxNumberOfProblems": {
                    "scope": "resource",
                    "type": "number",
                    "default": 100,
                    "description": "Controls the maximum number of problems produced by the server."
                },
                "languageServerExample.trace.server": {
                    "scope": "window",
                    "type": "string",
                    "enum": [
                        "off",
                        "messages",
                        "verbose"
                    ],
                    "default": "off",
                    "description": "Traces the communication between VS Code and the language server."
                }
            }
        }
    },
-
- Dec 2022
-
www.pythoncheatsheet.org www.pythoncheatsheet.org
- Oct 2022
-
blog.51cto.com blog.51cto.com
-
2.在设置中输入 run code config 找到里面的 run in terminal 打勾即可,往下滑动几秒就看到了
输入 code-runner
Tags
Annotators
URL
-
- Jan 2022
-
code.visualstudio.com code.visualstudio.com
-
A best practice among Python developers is to avoid installing packages into a global interpreter environment. You instead use a project-specific virtual environment that contains a copy of a global interpreter. Once you activate that environment, any packages you then install are isolated from other environments. Such isolation reduces many complications that can arise from conflicting package versions. To create a virtual environment and install the required packages, enter the following commands as appropriate for your operating system:
Tags
Annotators
URL
-
- Dec 2021
-
-
packer has the cond option that you can pass to optionally load a plugin. I found the disable didn't work for dynamic variables. For instance I have use { 'vimwiki/vimwiki', setup = [[require('config.vimwiki')]], cond = function() return not vim.g.vscode end } to only load vimwiki if not in vs code
-
- Sep 2021
-
betterdatascience.com betterdatascience.com
-
You can attach Visual Studio Code to this container by right-clicking on it and choosing the Attach Visual Studio Code option. It will open a new window and ask you which folder to open.
It seems like VS Code offers a better way to manage Docker containers
-
- Mar 2021
-
code.visualstudio.com code.visualstudio.comCommands1
-
Commands may also return a result. The API-like vscode.executeDefinitionProvider command, for example, queries a document for definitions at a given position. It takes a document URI and a position as arguments, and returns a promise with a list of definitions:
定位文档路由和位置
-
- Apr 2020
-
code.visualstudio.com code.visualstudio.com
-
The best way to explain the difference between launch and attach is to think of a launch configuration as a recipe for how to start your app in debug mode before VS Code attaches to it, while an attach configuration is a recipe for how to connect VS Code's debugger to an app or process that's already running.
Simple difference between two core debugging modes: Launch and Attach available in VS Code.
Depending on the request (
attachorlaunch), different attributes are required, and VS Code'slaunch.jsonvalidation and suggestions should help with that. -
Logpoint is a variant of a breakpoint that does not "break" into the debugger but instead logs a message to the console. Logpoints are especially useful for injecting logging while debugging production servers that cannot be paused or stopped. A Logpoint is represented by a "diamond" shaped icon. Log messages are plain text but can include expressions to be evaluated within curly braces ('{}').
Logpoints - log messages to the console when breakpoint is hit.
Can include expressions to be evaluated with
{}, e.g.:fib({num}): {result} -
Here are some optional attributes available to all launch configurations
Optional arguments for
launch.json:presentation("order", "group" or "hidden")preLaunchTaskpostDebugTaskinternalConsoleOptionsdebugServerserverReadyAction
-
The following attributes are mandatory for every launch configuration
In the
launch.jsonfile you've to define at least those 3 variables:type(e.g. "node", "php", "go")request("launch" or "attach")name(name to appear in the Debug launch configuration drop-down)
-
Many debuggers support some of the following attributes
Some of the possibly supported attributes in
launch.json:programargsenvcwdportstopOnEntryconsole(e.g. "internalConsole", "integratedTerminal", "externalTerminal")
Tags
Annotators
URL
-
-
code.visualstudio.com code.visualstudio.com
-
If you'd just like to see refactorings without Quick Fixes, you can use the Refactor command (Ctrl+Shift+R).
To easily see all the refactoring options, use the "Refactor" command
-
-
code.visualstudio.com code.visualstudio.com
-
To customize settings for debugging tests, you can specify "request":"test" in the launch.json file in the .vscode folder from your workspace.
Customising settings for debugging tests while running
Python: Debug All Tests
or
Python: Debug Test Method
-
For example, the test_decrement functions given earlier are failing because the assertion itself is faulty.
Debugging tests themselves
- Set a breakpoint on the first line of the failing function (e.g.
test_decrement) - Click the "Debug Test" option above the function
- Open Debug Console and type:
inc_dec.decrement(3)to see what is the actual output when we use x=3 - Stop the debugger and correct the tests
- Save the test file and run the tests again to look for a positive result
- Set a breakpoint on the first line of the failing function (e.g.
-
With pytest, failed tests also appear in the Problems panel, where you can double-click on an issue to navigate directly to the test
pytest displays failed tests also in PROBLEMS

-
VS Code also shows test results in the Python Test Log output panel (use the View > Output menu command to show the Output panel, then select Python Test Log
Another way to view the test results:
View > Output > Python Test Log
-
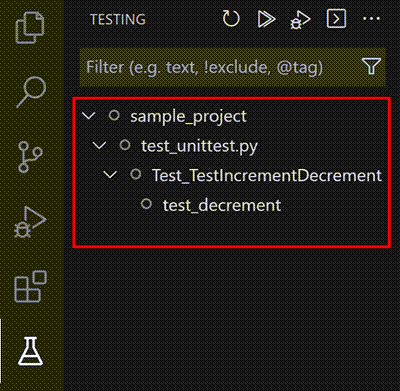
For Python, test discovery also activates the Test Explorer with an icon on the VS Code activity bar. The Test Explorer helps you visualize, navigate, and run tests
Test Explorer is activated after discovering tests in Python:
-
You can trigger test discovery at any time using the Python: Discover Tests command.
After using
python.testing.autoTestDiscoverOnSaveEnabled, it'll be set totrueand discovering tests whenever a test file is saved.If discovery succeeds, the status bar shows Run Tests instead:

-
Testing in Python is disabled by default. To enable testing, use the Python: Configure Tests command on the Command Palette.
Start testing in VS Code by using
Python: Configure Tests(it automatically chooses one testing framework and disables the rest).Otherwise, you can configure tests manually by setting only one of the following to True:
python.testing.unittestEnabledpython.testing.pytestEnabledpython.testing.nosetestsEnabled
-
-
code.visualstudio.com code.visualstudio.com
-
Visual Studio Code supports working with Jupyter Notebooks natively, as well as through Python code files.
To run cells inside a Python script in VSCode, all you need to is to define Jupyter-like code cells within Python code using a
# %%comment:# %% msg = "Hello World" print(msg) # %% msg = "Hello again" print(msg)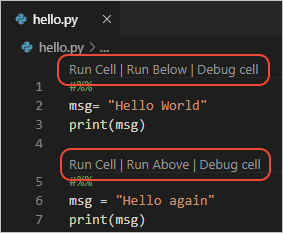
-
-
code.visualstudio.com code.visualstudio.com
-
To help you get started quickly, we created a special Installer of Visual Studio Code for Java developers. Download Visual Studio Code Java Pack Installer Note: The installer is currently only available for Windows. For other OS, please install those components (JDK, VS Code and Java extensions) individually. We're working on the macOS version, please stay tuned. The package can be used as a clean install or an update for an existing development environment to add Java or Visual Studio Code. Once downloaded and opened, it automatically detects if you have the fundamental components in your local development environment, including the JDK, Visual Studio Code, and essential Java extensions.
If you wish to use Java inside VSCode, try downloading the Installer of Visual Studio Code for Java developers
Tags
Annotators
URL
-
-
code.visualstudio.com code.visualstudio.com
-
Note: When you create a new virtual environment, you should be prompted by VS Code to set it as the default for your workspace folder. If selected, the environment will automatically be activated when you open a new terminal.
After creating a new project related environment, it shall be specified as a default for this specific project
-
Tip: Use Logpoints instead of print statements: Developers often litter source code with print statements to quickly inspect variables without necessarily stepping through each line of code in a debugger. In VS Code, you can instead use Logpoints. A Logpoint is like a breakpoint except that it logs a message to the console and doesn't stop the program. For more information, see Logpoints in the main VS Code debugging article.
Try to use logpoints instead of print statements.
More info: https://code.visualstudio.com/docs/editor/debugging#_logpoints
-
- Nov 2019
-
-
the more files you have and the bigger your project, the more resources VS Code will start to consume. The Search Indexing and File Watcher scripts start eating up your memory. Moreover, to work on such a project, you will open each file in a new tab, leading to multiple VS Code instances running simultaneously, and eventually, your CPU usage will start to look like this
VS Code consumes much more memory in comparison to Sublime while working on more significant projects
-
-
code.visualstudio.com code.visualstudio.com
-
Option to run NPM scripts for a folder#
Tags
Annotators
URL
-
- Nov 2018
-
Tags
Annotators
URL
-