10,000 Matching Annotations
  1. May 2026
    1. Learning isn't a passive event but a dynamic action. It requires focused attention, active engagement, and conscious processing by the learner. The hallmark of an independent learner is his ability to direct his_ attention towara his o...w,qJ~ning

      Something we need to remember. Learning is interactive.

    2. It i~t enough to have a classroQ.J;n free of psychological and socia~l 1 thr~ The brain needs to be part ~f a caring social community to • IJll!Ximize its sense of well-being. Marginalized students need to fe affirmed and included as valued members of a learning community.

      We need to connect with students, value and include them. This is the best way in which students will be ready to learn.

    3. Relationships are not just emotional; they have a physical component. Relationships exist at the intersection of mind-body. They are the precursor to learmng.

      Very important for learning. Feeling safe is key.

    4. Conversely, w1:en we don't pm,Gti,ce or use~_.den.cl~ortly af~(-a le~r!1.!!!~. _:P.isode~ brafurunes th~m~bY. star.,yjng them and t~~i reabsorbing them. It assumes that if you didn't revisit the activity that grewtJ:re·clenarHes thannf6rmahon wasn't important to keep. The foot-path ~fi~mntdtsappears, ma mg it hard to find your way back to stored knowledge and skills.

      We need to have this in mind to support our students learning. Making these connections is important for learning.How do we help our students? What is the best way?

    5. here in the neocortex that we have the chance to build our brain power, also called our intellective capacity. The challenge is getting past the lower brain's two emotional gatekeepers: the reticular activating sys-tem (RAS) and the amygdala.

      This is important to have in mind. This is the part of the brain that manages our executive functions. The question is how do we help our students and ourselves to develop thispart of the brain.

    6. The lizard brain allows you to smell smoke or hear a loud suspicious noise when you are asleep. It is what wakes you up. The brain stem is the structure that connects the brain to the spinal cord.

      This is definitely interesting to remember how our brains are always on alert.

    1. that modernization, urbanization, consumeraspirations, and individualistic values may erode traditional filial obligations

      I can absolutely see why this is a concern in modern times. I think this concern would also be projected on the Chinese diaspora, I wonder if they would "disprove" this concern as well.

    2. rather than being eroded, collective familial interests and filial obligation have beenrenegotiated and reinterpreted in a pragmatic response to the development strategiesand social policies supported by the state

      Relates to chapter 1 of the textbook's "As powerful as culture is, humans are not necessarily bound by culture; they have the capacity to conform to it or not and even transform it." The author references observed changes in the familial care culture due to outside forces.

    3. ‘caredebt’, owed by adult children to their parents for the care they received throughouttheir upbringings

      Emphasizes the reasoning behind the "need" for caregivers: adult children feel the need to take care of their parents as an act of reciprocity for their parents taking care of them as children. I grew up with this ideology & it's been heavily practiced in my family between the members in Vietnam and in America.

    4. commodification of intimacy

      Interesting to frame it this way. To me, I think emotions and personal connections can definitely be exploited. I never thought about it this way but other examples of the commodification of intimacy are companies advertising "personal AI robots" to prey on loneliness. I think caregiving can definitely reflect the idea of "commodification of intimacy" as people tend to seek caregivers for their family members that fit into their family. A level of trust and connection typically are sought out when hiring staff for these purposes.

    5. theorize care as ‘simultaneously moral, relational, historically specific, and embeddedwithin forms of governance and global political-economic transformations’

      One of the purposes of this piece is to further "prove" that caregiving can contribute to and shape culture in an anthropological lense.

    6. patriarchal patriliny

      Patriarchal patriliny: a social system combining male authority (patriarchy) with descent and inheritance traced through the male line (patrilineality)

    7. salience

      Salience: the quality by which an item, stimulus, or idea stands out from its surroundings, catches attention, and appears prominent or important

    8. one element of which has been her focus onpossibilities of detachability and the duality of relations

      Notes writing on the complexity and fluidity of relationships.

    9. shifted studies from kinship practice as the expression of a relation, to are-thinking of the way kinship practice can create relations.

      Basically caring for the elderly or family members doesn't necessarily require a blood relation, the care can create familial-like bonds between caregiver and care reciever.

    10. allowing ‘filial heart’ to be detachable and applied to non-kin

      I think this is also in part to the collectivist culture in Asia, we see all elders as "ours." Korea uses the word "uri" as a possessive meaning "we" or "ours" instead of "i" or "my" which reflects this deeply engrained collectivist culture that's shared in many Asian cultures.

    11. filial heart’

      Filial heart: a deep, loving, and obedient heart towards one’s parents. Or, in this case, towards the elders that caregivers are taking care of.

    12. onceived as rootednot only in a family-centred social order

      The reason for these migrant caregivers is because Chinese (and many other Asian cultures) emphasize taking care of your family. You can often find multigenerational households across the Asian diaspora. However, the need for the caregivers is because adult children are often too busy with work to fully take care of their parents as they become elderly.

    13. emic perspective

      "Emic perspectives refer to descriptions of behaviors and beliefs in terms that are meaningful to people who belong to a specific culture," (Chapter 3 of the textbook)

  2. learn-eu-central-1-prod-fleet01-xythos.content.blackboardcdn.com learn-eu-central-1-prod-fleet01-xythos.content.blackboardcdn.com
    1. s rather than their strengths, suggesting that these we aknesses stem from low intelligence, poor moral character, or inadequate social skills. At its core, the culture of poverty theory says that poor people are respo

      This is definitely present in our schools. We are still fighting this in my school. Some teachers make some comments about families and students that are hurtful. Some teachers do not believe that students can learn because of their way of living.

    2. iali­zation. We see it in the way we make staffing decisions in education. Often, underresourced urban schools are staffed by new teachers or te

      I was really surprised to learn about this some years ago. It is sad that we define a student's future by 3rd grade.

    3. mmunity, and cooperative learning. Individualistic societies , emphasize individual achievement and independence,:,__ _ ../ / n erica, tmomin'airt ��re is individual

      This can be evident in the classroom. Also, we need to think about our students' learning styles and personalities.

    4. The realit is that the strug le not because of their race, lcgrnqage, or pov-e�hey :tr��, �e�b�e�c�au�s�e�w�e�.=4-_=;o�n�•t�o�f;;;fe=r t�sufficient �0?orf¥rµties.in the classroom to develop the cogl?Jtiv� s . �ts of lll[ld that would pre-'--' _____ ,..._...._ � pare them to take_on more advanced academic task

      I think we need to change our mindset in order to support our students better.

    5. Estcl,blish an authentic connection with students that builds mutual trust and respect • Leverage the trust bond to help students rise to higher expectations • Give feedback in emotionally intelligent ways so students are able to take it in and act on it • Hold students to high standards while offering them new intellectual challenges

      Pert of creating a safe environment is to hold students accountable to high expectations.

    6. Every culturally responsive teacher develops a socio­politi�al consciousness, an understanding that we live in a racialized society that gives unearned privilege to some while others experience unearned disadvantage because of race, gender, class, or language.

      This is part of getting to know our students but also to be aware of our own biases and the position we take in this world.

    7. An educator's ability to recognize students' cultural displays of learning and meaning making and respond positively and con­structively with teaching moves that use cultural knowledge as a scaffold to connect what the student knows to new concepts and content in order to promote effective information processing. All the while, the educator understands the impor tance of being in a / relationship and having a social-emotional connection to the stu-// \dentin order to create a safe space for learning.

      We all need to connect with our students in order to get to know them. This way, we can support them better while taking advantage of the knowledge they bring.

    1. There were many approaches to the re-voicings – some actors over-acted in an attempt to get political points across; others attempted to be neutral; some journalists asked the actors to deliberately speak out of sync, to highlight the absurdity of the restriction.

      Im kind of obsessed with this idea of re-voicing... there is something here for a project.

    1. The Effects of Mental Fatigue on Physical Performance: A Systematic Review
      • Minimal Caloric Increase: Intense mental effort only increases energy expenditure by about 5% above baseline (approx. 100–200 kcal per day).
      • Maintenance vs. Thought: Most of the brain's energy is consumed by basic biological maintenance rather than the active thinking process itself.
      • Cognitive Fatigue & Performance: Mental exhaustion can reduce physical performance by roughly 15%.
      • Perceived Exertion: This performance drop is caused by an increased subjective feeling of effort, linked to adenosine accumulation in the brain.
      • Impact on Training: After heavy mental work, physical exercise feels harder, leading to earlier fatigue and lower intensity, which can hinder physical adaptation and results.
    1. Growth factors: the most uncertain cost driver

      "most uncertain" is stated a little bit too strongly here. .. Perhaps "Arguably the most uncertain "

    2. Cultivated meat — also called cell-based or cultured meat — is produced by growing animal cells in a controlled environment rather than raising and slaughtering animals. The basic idea is simple: take a small sample of cells from an animal, give them the right conditions to grow, and you end up with genuine animal muscle tissue, produced without the animal. That’s the concept. The reality involves some sophisticated biology and engineering, and understanding it is essential for anyone thinking seriously about whether this technology can become commercially viable. This overview walks through the main steps of the production process and flags where costs enter the picture at each stage.

      This is likely very oversimplified and presents concepts that are already well known to most workshop participants, but some may be less familiar with the full process.

    1. Talking to 35 Strangers at the Gym
      • The Experiment: The author, struggling with loneliness after college, challenged themselves to talk to one stranger every day for a month at the gym to overcome social anxiety.
      • The Approach:
        • Waited for people to finish their sets to avoid being intrusive.
        • Used a standard opener: "Hey, I see you here all the time. You’re pretty strong. What’s your split?"
        • Transitioned to more personalized openers (e.g., asking about a sports hat or specific equipment) as they grew more comfortable.
      • Key Results:
        • 35 Strangers: Talked to a wide variety of people, including medical students, engineers, and retirees.
        • Social Connections: Most interactions were positive. Several led to fist bumps and "gym-nod" friendships, while two resulted in off-site dinners and deeper friendships.
        • Anxiety Reduction: The author realized that the "terrifying" social barrier was largely internal; most people were happy to chat or at least polite.
      • Major Takeaway: Consistency is key. By treating social interaction like a gym workout—showing up and doing the "reps"—the author significantly improved their social life and mental well-being.

      Hacker News Discussion

      • Genuine Appreciation: Many commenters praised the author for giving sincere compliments without a hidden agenda. They referenced Dale Carnegie’s How to Win Friends and Influence People, emphasizing that "radiating happiness" creates a "feeling that glows" even if the interaction is brief.
      • The "Cringe" Barrier: A popular sentiment in the thread was that "the only path to cool is through cringe." Users discussed the necessity of enduring awkward first attempts to develop social skills.
      • "Genuinely Caring" vs. Small Talk: There was a deep debate on whether small talk is "fake." Some argued that showing curiosity about a stranger is a form of "genuine care" for their well-being, while others found the American style of polite inquiry to be performative.
      • Gym Etiquette: The discussion touched on the unwritten rules of the gym. While some Redditors (as noted in the article) want to be left alone, HN users generally agreed that waiting for the end of a set and keeping it brief makes social interaction acceptable.
      • Friendship After College: Users identified with the author's struggle, noting that modern life lacks "third places" and that active effort—like the author's experiment—is now required to build a community.
    1. my point is the average teacher makes 1,500 educational decisions every school day. In an average six-hour day in front of students, teachers make more than four educational decisions per minute (Busy Teacher.org, n.d.), and that is exhausting.

      no wonder we're all running on Red Bull and love ;) This is just another reminder of why taking good care of ourselves mentally and physcally is so important if we want to be effective and regulated educators!

    1. That counterintuitive finding — that asking students to explain their reasoning during worked examples can actually reduce their effectiveness — likely reflects the additional cognitive load that self-explanation imposes on novice learners still building basic schemas.

      I remember all of those "explain your thinking" questions where I had to pay attention to penmanship and grammar, not math.

    1. Differentiating between an Underwood SS and the Underwood Rhythm Touch:

      comment to James Grooms at https://typewriterdatabase.com/show.23202.typewriter

      James, perhaps it's hiding somewhere else in the comments on the database, but I'm curious if you've come across definitive differences between the Underwood SS and the Underwood Rhythm Touch models which have separate pages within the database:<br /> - SS https://typewriterdatabase.com/Underwood.SS.4.bmys - Rhythm Touch https://typewriterdatabase.com/Underwood.Rhythm+Touch.4.bmys

      Most of my Google searches don't return anything definitive or with actual sourcing of any sort.

      The main page has the SS starting in May 1946 and the Rhythm Touch beginning in July of that year, but doesn't seem to specify between the two in any substantive way. Neither of the two models seems to have had a name printed on it.

      Your description here uses both designators, but knowing your penchant for newspaper and magazine advertisements, I would suspect you may have seen specific differentiators.

      This Facebook post has some handwaving differentiators: https://www.facebook.com/groups/TypewriterCollectors/posts/10161712887224678/ but none seem definitive or sourced. It also uses the phrase carriage shift, though presumably with these models Underwood had moved to a segment/basket shift on their standards.

      Other than the chrome side detailing moving from 3 strips to 5 as you've noted, one of the few differentiators I can see in this era is the shift from the shorter carriage return lever to the longer armed version around 1948 which Robert Messenger notes in https://oztypewriter.blogspot.com/2012/11/on-this-day-in-typewriter-history_25.html. However that same page also has an advertisement on it with the words Rhythm Touch featuring a short armed (older style) carriage return.

      Is there really a difference between the SS and the Rhythm Touch or are they the same model with the phrase "Rhythm Touch" used as a marketing tag to compete potentially with Smith-Corona's "Floating Shift"?

      Thanks!

    1. ncrease your revenue and average order value

      The end goal is a high converting funnel that sells your diversified product offerings in one place, increasing revenue through showing the advantages of upsells and increasing the average order value through bump ups etc.

    2. customers access once they purchase

      ThriveCart learn started as as way for us to teach our own clients how to leverage the power of the tool but has since grown to be utility for our clients. Meaning? Just like an NFT once you purchase something from the client you can get access to client built training courses.

  3. pressbooks.library.torontomu.ca pressbooks.library.torontomu.ca
    1. Being able to whip her reassured him in possession.

      Tea Cake hit Janie because he wanted to prove to Mrs. Turner that he is in control over her and has more power even though he is darker skinned.

    2. See dat! Mah woman would spread her lungs all over Palm Beach County, let alone knock out mah jaw teeth. You don’t know dat woman uh mine. She got ninety-nine rows uh jaw teeth and git her good and mad, she’ll wade through solid rock up to her hip pockets.”

      This text shows a boastful description of a women’s extreme strength and ferocity

    3. She’s color-struck. She ain’t got de kind of uh mind you meet every day.

      Tea cake tells Janie how Mrs. Turner isn’t a normal person but thinks bad about her own people

    4. Tea Cake is jealous of Mrs. Turners brother and beats Janie for possession and control. They destroy Mrs. Turners restaurant on Saturday night. She returns back to Miami.

    5. We’se goin’ back tuh Miami where folks is civilised.”

      There deciding to move back to Miami as they think they might have a better life over there.

    6. Chapter 17 Tea Cake hits Janie to show control after getting jealous. Mrs. Turner tries to separate them because of colorism and causes tension. A big drunken fight breaks out in her restaurant, causing chaos and injuries. Afterward, Mrs. Turner decides to leave.

    7. “Ah yeah, she’s too smart tuh stay round heah. She figgers we’se jus’ uh bunch uh dumb niggers so she think she’ll grow horns. But dat’s uh lie. She’ll die butt-headed.”

      They are trying to get rid of her, because she is using black folks for her business while looking down at them.

    8. It’s striking how in Chapter 17. the muck’s sense of community starts to curdle. Jody’s control is gone, but now Tea Cake’s possessiveness and the violent fight over Mrs. Turner show that Janie still isn’t fully free, she’s just exchanged one kind of constraint for another. The party turns into a brawl, and you realize the Everglades can be just as trapping as Eatonville.

    9. How kin you set and see yo’ wife all trompled on? You ain’t no kinda man at all. You seen dat Tea Cake shove me down! Yes you did! You ain’t raised yo’ hand tuh do nothin’ about it.”

      They’re shaming turner because he is letting everyone trample over his wife and they are saying he isn’t a real man.

    10. Before the week was over he had whipped Janie. Not because her behavior justified his jealousy, but it relieved that awful fear inside him.

      It seems like Tea Cake is acting like Janie’s past husbands. His insecurities are leading to him hitting Janie.

    11. Uh person can see every place you hit her. Ah bet she never raised her hand tuh hit yuh back, neither.

      Tea Cake resorts to violence against Janie because of his insecurity and jealousy. No one bats an eye at the abuse and they even support it.

    12. He just slapped her around a bit to show he was boss

      It seems that if tea cake doesn’t get his way, or gets jealous he instantly think of abuse or hitting women

    13. Before the week was over he had whipped Janie. Not because her behavior justified his jealousy, but it relieved that awful fear inside him. Being able to whip her reassured him in possession. No brutal beating at all. He just slapped her around a bit to show he was boss.

      He was jealous and chose violence towards her instead of talking to her about things.

  4. pressbooks.library.torontomu.ca pressbooks.library.torontomu.ca
    1. Janie’s coffee-and-cream complexion and her luxurious hair made Mrs. Turner forgive her for wearing overalls like the other women who worked in the fields. She didn’t forgive her for marrying a man as dark as Tea Cake, but she felt that she could remedy that.

      Mrs. Turner liked Janie because she had lighter skin, which made her overlook everything “bad” about her. She didn’t like Tea Cake because he was darker skinned so she wanted to make Janie get with her brother instead.

    1. A long-term perspective is a more balanced view of profit maximization that recognizes that the impacts of a business decision may not manifest for a longer time.

      Feel's like it is hard for a Wall Street employee for example to have a long-term perspective when their performance is graded on a short-term scale

    1. Stage 3: Interesting findings extraction. To build the culture layer, a separate week-147batched pass uses elevated temperature to identify 3–10 qualitatively interesting moments148per week—humor, prescience, fun facts, cultural artifacts—each with a catchy title, de-149scription, category, excitement rating (1–10), and source email references. Findings below150excitement level 6 are discarded, yielding 382 curated findings across 119 weeks.1514

      .............

    2. 3)Temporal density—email provides daily or even hourly granularity over121months or years;

      Yes, but do you establish how frequently? I want to see this data. Taking the corpus size of 345k for 150 employees over 4 years works out as ~1.6 emails/employee-day. Is the claim here genuinely that people's work is summarized by two emails a day?

    1. The Pacificus–Helvidius Debates of 1793–1794 matched Hamilton and Madison in the first chapter of an enduring discussion about the proper roles of the executive

      very important

    1. The third normative approach, typically called virtue theory, focuses on the character of the decision-maker—a character that reflects the training we receive growing up.

      Feels like this can create conflict when two people of contradicting training growing up meet and disagree, while both having good character in their own ways.

    2. Behaving ethically requires that we meet the mandatory standards of the law, but that is not enough.

      I would argue that there are situations where you can be behaving ethically but not meeting the standards of the law.

    1. App Platform retrieves your app’s code from your linked repository or container registry, detects the type of language the app is written in, and deploys the app into an appropriate container environment.

      comment comment comment

    1. A 33-question survey was designed by our data scientists and administered to 2,072 B2C marketers via Panoplai across 8 countries

      Can you "unbold" the # of respondents and make sure this is all appearing as one continuous sentence? Right now it is "wrapping" around for me at odd places.

    2. US (n=404), UK (n=435), France (n=213), Germany (n=207), Spain (n=205), Italy (n=200), Australia

      This is running too long - can you make the space inbetween the two columns LARGER so this will wrap earlier?

    1. The rationale for CCPT is derived from Carl Rogers (1951), whodeveloped a philosophy of personality development including the originof psychopathology, and a system of nondirective or client-centeredtherapy completely consistent with the philosophy—the latter of whichhe developed and researched primarily on adolescents and adults. As astudent of Rogers and a professional trained in child development,Virginia Axline (1947, 1969) extended client-centered therapy forapplication to children. She believed that the Rogerian approach wasvalid with children as well as adults and saw the phenomena on whichRogers based his theory as present in infants and children, as Rogershimself recognized. Since the underlying principles are Rogerian, itwould seem to make sense to take a little space to lay those out beforemoving onto Axline's child-centered application.

      Summarization of what is going on in this chapter

    Annotators

  5. social-media-ethics-automation.github.io social-media-ethics-automation.github.io
    1. Rowland Manthorpe. It's the attention economy, stupid: why Trump represents the future whether we like it or not. Wired UK, 2016. URL: https://www.wired.co.uk/article/us-president-donald-trump-attention-economy (visited on 2023-12-08).

      Rowland Manthrope, in this article, explains an incident where President Donald Trump's retweet of a quote from Benito Mussolini was gaining attention and going viral on social media. He connects this to a broader picture where he explains that gaining people's attention and going viral on the internet is important to be successful in public life in this modern attention-driven digital world. One piece of detail that Manthrope shared that most stood out to me was that it was actually a bot that caused that incident of making that post.

    2. Meme. December 2023. Page Version ID: 1187840093. URL: https://en.wikipedia.org/w/index.php?title=Meme&oldid=1187840093#Etymology (visited on 2023-12-08).

      The Wikipedia article on “meme” explains that the term was first introduced by Richard Dawkins to describe how ideas and cultural behaviors spread through imitation, kind of like how genes evolve over time. It also goes into the word’s origins from the Greek “mimema,” meaning “something imitated,” and shows how the concept has expanded today to include internet memes as a major way culture spreads online.

    3. Tanya Chen. A 27-Year-Old Composer Has Inspired One Of The Most Epic And Delightful Duet Chains On TikTok. BuzzFeed News, October 2020. URL: https://www.buzzfeednews.com/article/tanyachen/epic-tiktok-chain-musical-fighting-in-a-grocery-store (visited on 2023-12-08).

      This article discusses how a 27 year old composer made a viral trend on TikTok. It highlights how individual contributions turned a simple video into a crowd-created performance, which suggest potential for TikTok's potential for creative collaboration.

    4. Chain letter. December 2023. Page Version ID: 1188532303. URL: https://en.wikipedia.org/w/index.php?title=Chain_letter&oldid=1188532303 (visited on 2023-12-08).

      The source on chain letters explains how chain messages have existed for a long time, even before the internet, often spreading through physical mail and later through email and social media. Many chain letters relied on emotional pressure by promising rewards for forwarding the message or threatening bad luck if the chain was broken. Reading about this made me realize how similar modern internet culture still is. Even though chain letters sound outdated, social media trends today often use the same idea of encouraging participation and rapid sharing. One detail I found memorable was how chain letters became especially widespread through email in the early internet era because forwarding messages suddenly became instant and effortless.

    5. Pyramid scheme. December 2023. Page Version ID: 1188350070. URL: https://en.wikipedia.org/w/index.php?title=Pyramid_scheme&oldid=1188350070 (visited on 2023-12-08).

      This source talks about the pyramid scheme being a business model where you enroll others to enroll more people, giving it a snowballing effect. It also goes into depth on different models of the scheme because apparently there are more than one. The source also covers notable cases of pyramid schemes being deployed.

    6. Star Wars Kid. December 2008. URL: https://knowyourmeme.com/memes/star-wars-kid (visited on 2023-12-08).

      This meme is interesting because this kid reached fame unknowingly and many different versions were made. It seemed to have negative effects on the boy and lawsuits were made to the families of the boys how made the video originally.

    7. Star Wars Kid. December 2008. URL: https://knowyourmeme.com/memes/star-wars-kid (visited on 2023-12-08).

      This source details the story of the "Star Wars Kid" meme, including its creation and the aftermath. The video came from a boy in his high school who was playing with a golf ball retriever; unknowingly to him, there was a camera in the room recording him. Some of his classmates found the recording and published it. The meme took off from there, and people edited the original video to include a realistic lightsaber and sound effects. After the meme became viral, it is reported that the boy from the video finished his schooling in a psychiatric ward, and his parents filed a lawsuit against the families of the boys who originally posted the video.

    8. Monica Lewinsky. December 2023. Page Version ID: 1187944516. URL: https://en.wikipedia.org/w/index.php?title=Monica_Lewinsky&oldid=1187944516 (visited on 2023-12-08). [l14] Monica Lewinsky (she/her) [@MonicaLewinsky]. 👀. May 2021. URL: https://twitter.com/MonicaLewinsky/status/1395734868407984136 (visited on 2023-12-08). [l15] Clinton–Lewinsky scandal. November 2023. Page Version ID: 1187645037. URL: https://en.wikipedia.org/w/index.php?title=Clinton%E2%80%93Lewinsky_scandal&oldid=1187645037 (visited on 2023-12-08). [l16] Matt Stopera. Monica Lewinsky Has Been Making Jokes About The Clinton Impeachment For Years, And It Really Is Funny Every Single Time. BuzzFeed, September 2021. URL:

      Monica is a shocking example of virality; overnight, her life changed forever. I think it's because the affair was so public. But just like internet memes, they have consequences as well, but these things come in cycles. There is always going to be new drama, a new meme, or something freshly viral. That is just the nature of the internet.

    9. Nobu Tamura. Spinops. 2023. URL: http://spinops.blogspot.com/ (visited on 2023-12-13).

      The blog Spinops by Nobu Tamura mainly shares his artwork about dinosaurs and other prehistoric animals. What stands out is how he doesn’t just draw for fun but his illustrations are based on scientific research, so they feel both creative and educational at the same time. It helps us imagine what these extinct creatures might have actually looked like in real life. This feels like a mix of art and science. It shows how one person can use the internet to share their passion and knowledge with others in a simple but effective way.

    10. I think the part about going viral is interesting because it shows that fame online is not always positive. Many people want attention, but sudden attention can feel stressful or scary. It also connects to recommendation algorithms because platforms reward posts that get strong reactions. I wonder if social media should give users more control when their posts suddenly go viral.

    11. The source about “a lie traveling faster than truth” connects strongly to social media virality. I think it is interesting that this idea existed long before the internet, but platforms now make it happen much faster. It makes me wonder whether viral sharing rewards speed more than accuracy, which can make misinformation harder to stop.

    12. The Selfish Gene. December 2023. Page Version ID: 1188207750. URL: https://en.wikipedia.org/w/index.php?title=The_Selfish_Gene&oldid=1188207750 (visited on 2023-12-08).

      The chapter on memes & inheritance with modification, the chapter’s use of “meme” to describe viral inheritance traces directly back to dawkin’s book The Selfish Gene (1976) where he coined the term meme to explain cultural units which spread mutate and compete for attention, essentially applying evolutionary logic to ideas. Worth noting is how far the word has drifted from its original meaning. Dawkins meant meme as a serious theoretical concept parallel to the gene, an explanation of why some ideas persist across generations while others die out. The internet reduced it to image macro format. That drift demonstrates perfectly the idea of inheritance with modification the chapter describes, the word meme got replicated; got mutated; mutation won out over original meaning.

    13. Pyramid scheme. December 2023. Page Version ID: 1188350070. URL: https://en.wikipedia.org/w/index.php?title=Pyramid_scheme&oldid=1188350070 (visited on 2023-12-08).

      A detail from this source that I found interesting was the inclusion of multi-level marketing (MLM). I had always thought that MLM was a different term for pyramid schemes. I did not know that the FTC acknowledged legal MLM's, and I think this is quite strange. The definition the FTC gives that distinguishes legal MLM's from pyramid schemes seems extremely vague and predatory. However, after learning this I am not surprised at all that this is the product of a lobbying group.

    14. Evolution of cetaceans. November 2023. Page Version ID: 1186568602. URL: https://en.wikipedia.org/w/index.php?title=Evolution_of_cetaceans&oldid=1186568602 (visited on 2023-12-08).

      This article talks about the evolution of cetaceans. They were originally land animals and eventually became water animals, during their evolution they could be compared to a hippopotamus. Eventually they grew sea animal limbs for sea life such as flippers, tail flukes, blowholes, etc. They then split into 2-3 groups.

    15. kcggggg. The Comics Of KC Green. January 2023. URL: https://kcggggg.tumblr.com/post/706263607432921088/we-passed-it-a-couple-of-days-ago-but-it-has-been (visited on 2023-12-08).

      I looked at KC Green’s post about the “This is Fine” meme. In this post, he explains that the comic became much bigger than he expected. He says the meme is still relatable to many people, but it also feels strange because one old comic became more famous than much of his other work. He also talks about how hard it is for artists to control their work after it becomes popular online. I think this source is useful because it shows the human side of internet memes. People often share memes without thinking about the artist behind them. This post reminds me that memes are not just random pictures online. They are also someone’s creative work. Once a meme spreads widely, it can belong to internet culture, but the original creator may lose control over how people use it.

    1. How do you think attribution should work when copying and reusing content on social media (like if you post a meme or gif on social media)?

      I think people should generally give credit when reposting or reusing someone else’s work, especially if it’s art, photography, writing, or originally created videos. For memes and gifs, I can see how attribution is harder because they spread so quickly, but if the original creator is known, tagging or linking them would be the respectful thing to do.

    2. And this is something really quite profound that’s happening. Where we can remix this culture that’s being thrown at us, where we can take it, re-appropriate it and throw it back. […] Most of what we do is actually illegal, any remixing is basically illegal. And I could talk more about the- the parameters of that, we have fair use laws that should protect it but the simple fact of ripping a DVD is actually illegal which makes virtually everything we do illegal.

      I think Wesch makes a really interesting point here about how internet culture is built around remixing and reinterpreting media, and the critical vulnerability being that most copyright laws haven’t caught up to that reality. It’s kind of strange that so much normal online creativity can technically exist in a legal gray area, with most people not even realizing it.

    3. How do you think attribution should work when copying and reusing content on social media (like if you post a meme or gif on social media)?

      For me personally, I think this depends on the kind of content being copied. For example, if this meme is massively widespread and well known, it feels more unstable. However, if this is a meticulous dedicated work that displays artistry, another creator is trying to use it to amass money or attention, or it is less well known yet blatantly copied, I believe the original post should be credited.

    4. How do you think attribution should work when copying and reusing content on social media (like if you post a meme or gif on social media)?

      I believe this is a difficult question to answer, simply because with the use of social media, memes and certain phrases and thrown and passed around so easily it seems almost impossible to cite them. As of late, memes and key phrases are mostly found in comment sections or throughout certain video ideas.

    5. When is it ok to not cite sources for content?

      I believe that you do not need to cite your sources for content when something is not exactly the same. While I think it is a good practice to give credit to inspiration, I do not believe that it is mandatory. However, I believe that any exact copy included should be cited, whether or not you gain a monetary benefit. Even if you do not personally gain value from taking someone else's work, you can limit the revenue/attention they get. This is solved by citing, which could potentially even give the original poster a larger reach.

    1. 12.1.2. Memes# In the 1976 book The Selfish Gene [l3], evolutionary biologist Richard Dawkins[1] said rather than looking at the evolution of organisms, it made even more sense to look at the evolution of the genes of those organisms (sections of DNA that perform some functions and are inherited). For example, if a bee protects its nest by stinging an attacking animal and dying, then it can’t reproduce and it might look like a failure of evolution. But if the gene that told the bee to die protecting the nest was shared by the other bees in the nest, then that one bee dying allows the gene to keep being replicated, so the gene is successful evolutionarily. Since genes contained information about how organisms would grow and live, then biological evolution could be considered to be evolving information. Dawkins then took this idea of the evolution of information and applied it to culture, coining the term “meme” (intended to sound like “gene” [l4]). A meme is a piece of culture that might reproduce in an evolutionary fashion, like a hummable tune that someone hears and starts humming to themselves, perhaps changing it, and then others overhearing next. In this view, any piece of human culture can be considered a meme that is spreading (or failing to spread) according to evolutionary forces. So we can use an evolutionary perspective to consider the spread of: Technology (languages, weapons, medicine, writing, math, computers, etc.), religions philosophies political ideas (democracy, authoritarianism, etc.) art organizations etc.

      This history and background of the origins of memes is both really interesting and surprising to me. I never thought something as widely used today, could trace its roots back to a biological process of DNA and genes. I completely understand how the behavior of an interesting meme is so similar to that of genes in the way it spreads information. For example, the recent 6 7 meme is what started as a normal, interesting gesture caught on camera, and soon started getting reproduced just like a gene to a point where it became viral.

    2. A meme is a piece of culture that might reproduce in an evolutionary fashion, like a hummable tune that someone hears and starts humming to themselves, perhaps changing it, and then others overhearing next. In this view, any piece of human culture can be considered a meme that is spreading (or failing to spread) according to evolutionary forces. So we can use an evolutionary perspective to consider the spread of:

      This part was interesting since it suggested definition of the meme. As a social media user who watches meme every day, I thought meme was a popular image or video that goes viral. This part broaden my aspect of dealing with memes.

    3. Since genes contained information about how organisms would grow and live, then biological evolution could be considered to be evolving information. Dawkins then took this idea of the evolution of information and applied it to culture, coining the term “meme” (intended to sound like “gene” [l4]).

      This passage is interesting because it connects biological evolution with cultural evolution in a simple and understandable way. The explanation of how genes survive through shared traits in a bee colony makes the idea of evolution feel more practical and less abstract. I also like how it introduces Dawkins’ idea of the “meme” as cultural information that spreads between people, similar to how genes spread biologically. Overall, the paragraph effectively combines science and culture while encouraging readers to think about how ideas, beliefs, and behaviors evolve in society.

    1. Correction requested: Table 2 compares the paper's miniscope to other commercial options. the nVue from Inscopix has 2 LEDs, and default 60FPS, with up to 100FPS in fast frame mode.

    1. We’ll include several examples on this page from the TikTok Duet feature, which allows people to build off the original video by recording a video of themselves to play at the same time next to the original. So for example, This tweet thread of TikTok videos (cross-posted to Twitter) starts with one Tiktok user singing a short parody musical [l19] of an argument in a grocery store. The subsequent tweets in the thread build on the prior versions, first where someone adds themselves singing the other half of the argument, then where someone adds themselves singing the part of their child, then where someone adds themselves singing the part of an employee working at the store[1]:

      I realized how social media has slowly changed creativity from being individual into something almost communal. A lot of the funniest or most memorable content online now is not made by one person alone, but by dozens of strangers building on top of each other’s ideas. The grocery store musical example reminded me of how internet culture can feel chaotic, but also strangely collaborative at the same time. Someone makes a random joke, another person adds onto it, and suddenly people across the world are participating in the same “inside joke” without ever meeting each other. I also think this changes the way people seek attention online. Instead of always trying to create something completely original, many users now try to become part of an existing trend because that gives them a higher chance of being seen by the algorithm. In a way, creativity online has become less about ownership and more about timing, participation, and adaptation. Sometimes the person who improves or remixes the original idea even becomes more popular than the person who started it. I honestly think that says a lot about internet culture today. People value interaction and relatability more than polished originality.

    1. Youtube is kinda strange man.. The user becomes both observer and observed, locked in a recursive loop of feedback between desire and recommendation.

    1. When content is replicated on social media, it may be modified. The Social media system might have built-in ways to do this, like a quote tweet or reply adding some sort of comment to the original post, effectively making a new version of the post that can spread around.

      Yes, I've talked about this before in comments, but I think this is why the magnitude of virality is so much higher. It's because of how many people clip and make memes of the original post. This all adds up and becomes something like a cultural phenomenon.

    2. For social media content, replication means that the content (or a copy or modified version) gets seen by more people. Additionally, when a modified version gets distributed, future replications of that version will include the modification (a.k.a., inheritance). There are ways of duplicating that are built into social media platforms: Actions such as: liking, reposting, replying, and paid promotion get the original posting to show up for users more Actions like quote tweeting, or the TikTok Duet feature let people see the original content, but modified with new context. Social media sites also provide ways of embedding posts in other places, like in news articles There are also ways of replicating social media content that aren’t directly built into the social media platform, such as: copying images or text and reposting them yourself taking screenshots, and cross-posting to different sites

      I think the idea of replication on social media is really fascinating, because how these content can spread in so many ways beyond just reposting. I realized some people interacts with posts like replying, screenshotting, add some emotinal into those comment, they can helping it changing its meaning or going so far. When people add their own captions or context to a post, it can completely shift how others interpret the original message. Before reading about this, I didn’t really think about how these small changes could “carry forward” future versions.

    3. 12.3.1. Replication (With Inheritance)# For social media content, replication means that the content (or a copy or modified version) gets seen by more people. Additionally, when a modified version gets distributed, future replications of that version will include the modification (a.k.a., inheritance). There are ways of duplicating that are built into social media platforms: Actions such as: liking, reposting, replying, and paid promotion get the original posting to show up for users more Actions like quote tweeting, or the TikTok Duet feature let people see the original content, but modified with new context. Social media sites also provide ways of embedding posts in other places, like in news articles There are also ways of replicating social media content that aren’t directly built into the social media platform, such as: copying images or text and reposting them yourself taking screenshots, and cross-posting to different sites

      What the author calls an inheritance with regard to content replication and viral potential is also interesting since it uses a biological analogy (mutation) but the way the author applies this creates an interesting duality. Since mutations that can replicate do not have to be good as well as being able to reproduce faster than others; a screenshot stripped of the context from which it was taken, or a quote tweet using someones words, take on the viral ability of the original piece and lose what ever accuracy there was in them. Thus, the modification(s), that will allow content to go viral and be copied are typically those that remove all nuance from the content.

    4. [1] It isn’t clear what should be considered as “natural” selection in a social media environment (human nature? cultural biases, like racism? the nature of the design of the social media platform? are bots unnatural?), so we’ll just instead talk about selection.

      I think that what should be considered as "natural" selection in social media isn't clear because of the different content of social media. Since different content is interesting and catered to many different types of people.

    1. What these numbers represent: Simulated manufacturing cost per kg of cultured chicken cell biomass (wet weight, at harvest ⓘ) in 2036, based on 30,000 Monte Carlo simulations. Wet-weight hydration assumed ~80% (range ~75

      some of the tooltips are not coming up -- like here!!

    2. --- ## Interactive Model ```{ojs} //| echo: false // ============================================================ // SEEDED RANDOM NUMBER GENERATOR // ============================================================ // Simple mulberry32 PRNG (fast, good quality for Monte Carlo) function mulberry32(seed) { return function() { let t = seed += 0x6D2B79F5; t = Math.imul(t ^ t >>> 15, t | 1); t ^= t + Math.imul(t ^ t >>> 7, t | 61); return ((t ^ t >>> 14) >>> 0) / 4294967296; }

      Note, it's doing the sampling in straight javascript

    1. Sassoon and Graves and Owen were obviously far better poets, but it is important to remember that they were not the only, or even the dominant, voices in the air. Disillusion and horror were counterbalanced by pride in what, it continued to be argued, was a necessary sacrifice. In this connection, it is worth mentioning Hugh Cecil’s Flower of Battle (1996), which covers a dozen novelists of the time, many of them bestselling, who tried to make sense of the war with more sorrow than bitterness.

      Could look up.

    1. Autoantibodies (AABs) have been identified in advanced Covid, laboratory models of Covid-19 utilizing S-protein fragments. The concept that addressing the AABs is a therapeutic target is reasonable, but falls short of addressing the host-targets, the ubiquitous and critical neuroreceptors that have been rendered dysfunctional by these AABs. The a7 nicotinic acetylcholine receptors (a7Rs) rendered dysfunctional are no longer capable of stabilizing the cholinergic anti-inflammatory pathway. In our clinical experience, supported with laboratory collaborations, re-establishing a7R function plays a significant role in both acute COVID-19 as well as Post-Acute Sequelae of Covid. Focusing on therapeutics for Abs 1 or Abs2 appears to be just as short-sighted for PASC as it was for using Monoclonal Abs, IL-6 inhibitors, antivirals for acute COVID-19. The focus should be entirely on the host - targets, the a7Rs and enabling the host's CAP. Ref: doi: 10.1016/biocel.2024.106519

  6. pressbooks.library.torontomu.ca pressbooks.library.torontomu.ca
    1. Chapter 18: Animals begin moving east, warning of a coming hurricane, but most people ignore it. The storm hits hard, flooding the Everglades and causing chaos and destruction. Janie, Tea Cake, and others struggle to survive as they try to escape the rising water and dangerous conditions.

  7. pressbooks.library.torontomu.ca pressbooks.library.torontomu.ca
    1. Chapter 19 After the hurricane, Tea Cake gets rabies from a dog bite and becomes violent. Janie is forced to shoot him to save her own life. She is put on trial but found not guilty. In the end, she buries Tea Cake and mourns him deeply.

    1. Note: This response was posted by the corresponding author to Review Commons. The content has not been altered except for formatting.

      Learn more at Review Commons


      Reply to the reviewers

      Reviewer #1

      Evidence, reproducibility and clarity

      1) Summary

      This study investigates the mechanochemistry of Arp2/3-mediated branched actin networks at the level of individual branch junctions under load. Using microfluidic single-filament/branch force assays (including constant-force flow and open-chamber imaging) the authors quantify debranching, re‑nucleation, and mother- vs daughter‑interface stability across nucleotide states of Arp2/3 (ADP-Pi, ADP, and an ADP-BeFx proxy for ADP-Pi). They further test effects by two branch regulators (GMF and cortactin). Key findings include: (i) ADP-Pi and ADP complexes share similar force dependence but differ markedly (~20×) in intrinsic dissociation rate; (ii) phosphate turnover on the Arp2/3 complex is rapid ii) affinity for Pi drops when Arp2/3 loses its daughter filament; (iii) quantification from model fits uncovers large stability differences between daughter and mother interfaces of the Arp2/3 complex; (iv) extraordinary high stability of ADP-Pi-like Arp2/3 on the mother filament; and (v) distinct effects of GMF and cortactin on force‑dependent stability. Overall, the work combines technically demanding measurements with mechanistic modeling to probe how nucleotide state and regulatory factors tune branch mechanics.

      2) Major comments:

      1. Low force kinetics and completeness of survival curves (Figure 1). "For all forces, the surviving curves exhibited a clear single exponential behavior...." While the data can be fitted to monoexponential decay curves, data at low forces is clearly incomplete. >90% of branches have not dissociated by the end of the experiment. For the particular data shown in 1C (F00nN, n=60 total branches) it means that the time information is coming from

      Essential; experiment might already be performed. Otherwise straightforward to do (weeks time).

      In figure 1B, we indeed show a Survival curve for ADP-Arp2/3 complex branch dissociation at 0 pN up to 900 seconds. As now shown in updated supp figure S2, the data was in fact acquired for at least 5000 seconds for ADP-Arp2/3 and ADP-Pi states (N=2 repeats for each condition, with n = 60 and 90 branches for ADP-Arp2/3 branches, and 90 and 132 branches for ADP-Pi-Arp2/3 branches). The debranching rates reported in the initial submission were already obtained by fitting the surviving curves over the whole duration of the experiments.

      1. Stability Analysis (Figure 4). I can follow much of the arguments presented in the stability analysis of the daughter vs mother interfaces, which is in principle extremely interesting! However, there are some concerns here:

      i) The authors emphasize the zero force ratio derived from fits (which is linked to the stability difference of the two interfaces in the absence of force) despite this being only weakly constrained by data. Intuitively in the model, the stability difference should grow to very large values as the re-nucleation ratio approaches 1 at low force. This combined with the noise in the data poses an issue in my opinion. Looking at the data and the error margin, I think that the authors cannot state with high confidence that there is a real difference between the relative stability of the daughter and mother interfaces between the two nucleotide states of the complex.

      Essential; analysis and textual revision only

      We thank the reviewer for this comment. The difference in stability between the two interfaces is strongly constrained by the shape of the branch renucleation ratio versus force curve, and its value at 0 pN. This is illustrated in the figure shown below (new Supp Fig. S8), showing the dissociation rates of the two interfaces (in 'dashed' and 'point-dashed' style) that contribute to the overall debranching rate in each nucleotide condition. Despite the limited force range at which we probed the debranching rate, the branch renucleation ratio curve informs us on which interface is the weakest, and how this evolves with force.

      We have assessed the confidence intervals of the parameters obtained from the fits, taking into account the error bars on our experimental datapoints. It seems to indicate that the simultaneous fits of the debranching rate and the branch renucleation ratio curves indeed constrain the parameters quite strongly. These confidence intervals are now reported in the main text and in the summarizing table.

      We have repeated branch renucleation experiments for ADP-BeFx- and ADP-Pi-Arp2/3 complex branches (see new figure 4C&D, and our response to the next point). We believe these new measurements allow a better assessment of the relative stability between the two interfaces for Arp2/3 complex branch junctions in the ADP-BeFx state.

      Still, we agree with the reviewer that the dispersion of the experimental data does not allow us to have a strong confidence on the crossover force and relative stability difference of the interfaces. Therefore, we have slightly toned down the way we present and discuss the differences in stability when comparing the two nucleotide states.

      ii) For ADP-Pi, the renucleation ratio essentially remains flat over the measured force range. Hence, the data can only provide little leverage to estimate both the zero force ratio and, more importantly, the differential distance to the transition state in the slip-bond model in my opinion, which will show in the crossover force. Consequently, the quoted ">100×" stability difference at F=0 and the crossover force >20pN are driven largely by extrapolation rather than direct constraint by data. Given the high number of free parameters in the model, I would anticipate that several crossover forces and differential distances might explain the data nearly equally well. Instead of loosely reporting exact number from fits, I would have hoped for some sort of sensitivity analysis, for instance relying on profile likelihoods. Also parameter values could be reported as bounds (e.g crossover force≫measured range) rather than precise point estimates. This issue re-occurs (albeit not as drastically) for the cortactin experiments (Figure 6).

      Essential; analysis and textual revision only

      As mentioned in our response to the previous point, we have repeated renucleation experiments for ADP-BeFx- (and also for Arp2/3 complex branches in the presence of 50 mM Pi) (see new figure 4C&D) to better characterize the differential distance between to the transition force. The crossover force for the ADP-BeFx state is now 13.5 pN and the ratio of the stability between the two interfaces is roughly 100 times.

      We agree with the reviewer that the dispersion of the experimental data does not allow us to have a strong confidence on the crossover force and relative stability difference of the interfaces. We have thus toned down the way we report these values. We do believe though that the difference we report between the ADP and ADP-BeFx state appears to be significant and needs to be acknowledged.

      As a side note, it has proven to be challenging to pull on branches at forces higher than 7 pN. To apply a large force on the branch junction, we need to have a high flow rate. In this case, it appeared that the height of the filaments (both mother and daughter filaments) above the surface seem to deviate from what we have established in our previous studies (Jegou et al, Nat. Comm. 2013 & Wioland et al, PNAS 2019). This may originate from the fact branched filaments have a more complex shape than an individual filament. Characterizing accurately the evolution of the branch height as a function of the flow rate and applied force would require quite extensive additional characterization, which, we believe, is beyond the current focus of this study on the stability of Arp2/3 complexes.

      iii) One important expectation from the "two slip bond" model is that branch dissociation rates should not necessarily scale mono-exponentially as they mostly do over the accessible force range of the paper. However, once the "minor" pathway of dissociation from the mother starts to dominate at high forces, rates become more force sensitive. This is nicely recaptured by the model fits in Figure S6 but deserves some explanation in the text. Otherwise, people will simply remember the "ADP-Pi is 20-fold more stable than ADP at all forces" message.

      Essential; textual revision only

      We now have rephrased the key sentences (in the Abstract and Results sections) to more clearly state that the debranching rate is not increasing mono-exponentially with force.

      In the Abstract: "Remarkably, we find that branch junctions are over 30-fold more stable when the Arp2/3 complex is in the ADP-Pi rather than ADP state, and that force accelerates debranching with similar exponential factors in both states."

      In the Results section: "The debranching rate seems to increase exponentially with the applied pulling force, in the range of 0 to 6 pN (Fig. 1F; see more refined analysis below). This behaviour is predicted by the Bell-Evans model for a slip bond."

      iv) One important prerequisite for the model is that isolated Arp2/3 complexes (without a daughter filament) should dissociate with equal rates from mother filaments at all flow rates. Since the Arp2/3 complex prefers mother filament curvature, forces experienced by the mother might change its off-rate. It would be good to refer to this assumption in the text and experimentally verify it. I could not find it in the paper nor in Ghasemi et al 2024.

      Essential; simple experiment (a weeks time).

      We thank the reviewer for this important comment.

      First, we investigated whether the viscous drag force, applied on the ADP-Arp2/3 complexes which remain bound to mother filaments could affect their stability. We have performed branch renucleation experiments at different flow rates but with the same pulling force on branch junctions (average force 3.9 pN) by adapting the length of the daughter filament. As shown in new supp. figure S11 (shown below), we did not observe any significant differences between 'low' and 'high' flow rates. If the off-rate of the surviving Arp2/3 was significantly affected by the flow, this would have led to a variation of the renucleation ratio with the flow rate.

      Second, we have investigated the impact of the tension experienced by the mother filament at the location of the branch junction for ADP-Arp2/3 complex branches, with the same pulling force on the branches (average 4.1 pN pulling force on branches). We have quantified the debranching rate from three groups of branches depending on their position along mother filaments. As shown in new supp. figure S12 (shown below), we can observe a small trend, where the debranching rate decreases with the tension on the mother filament at the branching point.

      Doubling the tension on the mother filament from 15 to 30 pN decreases the debranching rate by a third. Though, pairwise logrank tests performed between the survival fractions of the three binned groups do not report any statistical significant difference (all p values > 0.05). One possible explanation for this is the height of the mother filament in the microfluidics flow that increases linearly from the anchoring point to the free barbed end. As a consequence the pulling force on the branches will be higher, as branches experience faster flows.

      For these same groups, upon branch dissociation, all remaining-bound Arp2/3 complexes are exposed to the same flow rate; the branch renucleation ratios were similar. Thus branch renucleation ratio seems to not significantly depend on the tension experienced by the mother filament at the branching point.

      Similarly, Pandit et al PNAS 2020, Extended figure S1, also reported no detectable impact of the mother filament tension on the debranching rate in their assay.

      v) The force dependence of the branch re-nucleation rate (Fig 3D) has been measured previously by the same group (Ghasemi et al). While the data in the older paper has not been fitted by a model, the trend of the data in the previous paper looks conspicuously different. Are there any explanations for this? I speculate that it might be related to actin and ATP not being saturated (low-force re-nucleation rate rarely exceeds 80%) in Ghasemi et al., but it would be good to know what the authors think about this. Essential; textual revision only

      This is a good point. We have plotted the data of the renucleation ratio from ADP-Arp2/3 complex from figure 1F of Ghasemi et al, Sc. Adv. 2024 (performed at 0.3 and 1 µM actin), together with the data of the current study from figure 4D (performed at 1.5 µM actin). We feel this comparison could be of interest to the readers, and have thus integrated it in the manuscript as new supp. figure S13 (shown below).

      As expected, the branch renucleation ratio is lower with lower concentrations of actin. The experimental data points from Ghasemi et al are similarly well fitted by the branch renucleation function obtained for 1.5 µM multiplied by a scaling parameter, which reflects the fact that the branch renucleation ratio is actin concentration dependent (Fig. 6A in Ghasemi et al). This scaling parameter was the only free parameter of those fits.

      Since the branch renucleation ratio depends on the actin concentration as follows, 0.97.kon.([actin] - Cc)kon.([actin] - Cc)+koffATP-Arp2/3 , with kon = 3.4 µM-1.s-1 and koff ATP-Arp2/3 = 0.66 s-1 from (Ghasemi et al. 2024), the scaling parameter obtained by the fits give estimates of the actin concentration in these experiments, of 0.6({plus minus}0.05) and 0.9({plus minus}0.2) µM for the experiments performed at 0.3 and 1 µM respectively in (Ghasemi et al. 2024).

      1. Stability of the authentic ADP-Pi-Arp2/3 complex on the mother filament. The extraordinary stability of the isolated ADP-BeFx-Arp2/3 complex on mother filaments is surprising, especially considering that both ATP and ADP states are much more labile (Ghasemi et al 2024). I would recommend repeating this experiment in the authentic ADP-Pi state with labelled Arp2/3 complexes as a more direct readout, even if this would require working with very high phosphate concentrations.

      Essential; simple experiment (a weeks time).

      We have followed the recommendation of the reviewer and have performed new experiments using fluorescent Arp2/3 complexes for ADP, ADP-BeFx and ADP-Pi states, now displayed in new figure 5C (also shown below).

      For fluorescent Arp2/3 complexes remaining bound to the mother filament, the Arp2/3 complex - mother filament interface is ~ 100 times more stable in the ADP-BeFx state (0.0046 s-1) compared to the ADP state (0.56 s-1). We also assessed the dissociation of surviving ADP-BeFx-Arp2/3 complexes using unlabelled Arp2/3 complexes (previously in figure 4B, repeated experiment shown in new supp. figure S10), which also indicates a remarkable stability.

      The dissociation curve of surviving Arp2/3 complexes in the presence of 50 mM Pi and 200 µM ATP in solution reflects the mixture of Arp2/3 dissociating in the ADP/ATP state and ADP-Pi-Arp2/3 that can either dissociate in the ADP-Pi state or lose their Pi and dissociate in the ATP state. Despite the presence of 50 mM Pi, the rate at which ADP dissociates and ATP reloads rate is much faster than Pi binding. Fitting this survival curve with a function that accounts for the initial double populations and the evolution of the ADP-Pi population (see Methods) gives a good estimate of the Pi release rate.

      OPTIONAL: Further, but beyond the scope of the present paper, would be titrating phosphate in these experiments, which would even allow the authors to independently verify the reduced Pi affinity for Arp2/3 in the mother filament. Of note, this affinity difference is needed to satisfy detailed balance in the reaction scheme (Fig 4 D)!

      We thank the reviewer for this suggestion. High concentrations of phosphate in the buffer renders glass surfaces quite sticky in our assays. We've tried several different passivation strategies (BSA, PLL-PEG, K-casein, ...) but none gave satisfactory results. So titrating phosphate, by going beyond 50 mM phosphate, proved to be quite challenging.

      Detailed balance, considering the two possible routes connecting the ADP-Pi-Arp2/3 complex branch junction state and the surviving ADP-Arp2/3 complex state, can be written as KPi rel.branch junction . Kdebranching ADP-Arp2/3 = KdebranchingADP-Pi-Arp2/3 . KPi rel.surviving Arp2/3.. Some of these affinity constants are not known, because of the inability to determine reverse reactions rates such as the rebinding of a daughter filament to a surviving Arp2/3. It is thus hard to determine how the affinity of Pi for Arp2/3 complex changes between Arp2/3 complexes at branch junctions and surviving Arp2/3 complexes on mother filaments.

      While we cannot determine the affinity constant of Pi for a surviving Arp2.3 complex, our data indicates that the dissociation rate of Pi is higher from Arp2/3 complexes at branch junction (koff = 0.21 s-1) than from surviving Arp2/3 complexes (koff = 0.05 s-1). This unexpected finding indicates that surviving Arp2/3 complexes adopt a conformation where the nucleotides are readily exchanged, but where the 'back door' for Pi release is less open. We now discuss this point in our revised manuscript.

      1. Importance of "surviving" ADP-Pi-Arp2/3 complexes. The authors show a) rapid turnover of Pi on the ADP-Arp2/3 complex in both branch- or mother filament-bound state and b) the lowered Pi affinity of the latter. Nonetheless, they emphasize the importance of long-lived "surviving" ADP-Pi bound complexes on the mother (even stated in the abstract). I understand that this fraction shows under some experimental conditions (BeFx), but unless I am missing something, most complexes should rapidly lose their phosphate and either exchange nucleotide or dissociate from the mother under physiological conditions. Please clarify or tone done.

      Essential; textual revision only

      We thank the reviewer for their remark. We have tried to clarify this aspect in the manuscript.

      As shown now with the departure rate of fluorescent surviving Arp2/3 complexes together with branch renucleation data, we show that surviving ADP-Pi-Arp2/3 complexes are quite stable on mother filaments, because they detach and release their Pi slowly, such that branch regrowth will occur provided there is actin in solution. In the absence of actin monomers, as the reviewer correctly points out, the surviving ADP-Pi-Arp2/3 will predominantly release its Pi and thus become a surviving ADP-Arp2/3 complex. We have modified the text to avoid any confusion.

      1. GMF mechanism. The authors claim that GMF "...accelerates the departure of the surviving Arp2/3 complex from the mother...". I assume that they infer this from decrease in the re-nucleation ratio. However, alternatively GMF could simply dwell on the complex, inhibiting re-nucleation without promoting dissociation from the mother. The authors should either monitor Arp2/3 dwell times directly to discriminate between these possibilities or be more cautious in their conclusions.

      Essential; simple experiment (a weeks time) or textual revision.

      In Ghasemi et al. Sci. Adv. 2024, we examined the departure of Arp2/3 from the mother filament after GMF-induced debranching using fluorescent Arp2/3. Most of the fluorescent Arp2/3 dissociated from mother filaments within the same frame as the branch, i.e. within 0.5 seconds after the debranching event, and none were visible after another second . This could be due to Arp2/3 departing with the branch or an accelerated departure after branch dissociation. In any case, this rules out the possibility that GMF would dwell on the surviving complex for a substantial amount of time without promoting dissociation from the mother.

      In the present manuscript, we now show that increasing the ATP concentration 10-fold (from 0.2 to 2 mM) is sufficient to restore the branch renucleation ratio to its level without GMF. This shows that GMF does not cause Arp2/3 to leave with the branch, but rather that it (also) acts on the surviving Arp2/3 complex, in a way that is countered by high concentrations of ATP. More specifically, it suggests that GMF accelerates the departure of the surviving ADP-Arp2/3 complex, either directly and by hindering the reloading of ATP, and that GMF does not affect the surviving Arp2/3 complex once it has reloaded ATP.

      We now discuss these two non-mutually exclusive possibilities for the accelerated dissociation of the surviving ADP-Arp2/3 complex in the manuscript.

      6.Cortactin mechanism and the "leash model". I must say that the cortactin data are the most puzzling part of the paper and hard to reconcile with what we know from structure. I was hoping to find some of this resolved in the discussion. However, I do not understand the "leash model" in the discussion section for cortactin-mediated branch stabilization: "This would explain the observed increase in branch survival compared to the absence of cortactin. As the pulling force is increased, this rebinding mechanism becomes less efficient." According to my understanding of the data, this is opposite to what happens. Cortactin only stabilizes the labile interface at elevated forces! Some re-writing might help here.

      Essential; textual revision.

      We thank the reviewer for having us think more thoroughly about the model we initially proposed. We now believe that our 'leash' mechanism is not able to fully recapitulate our observations in a simple and satisfactory manner.

      We now propose a much simpler model, where the binding of cortactin to the Arp2/3 complex at the branch junction simply changes the energy landscape of the Arp2/3-daughter interface without the need to invoke a rebinding of the daughter filament upon branch departure. We have updated our interpretation of the data in the Discussion section accordingly.

      Overall, our results on the impact of cortactin on branch renucleation highlights a surprising behaviour that would require further investigation to fully decipher the underlying molecular mechanism.

      3) Minor comments

      Organization: - I do not want to impose on how to best tell the story, but I felt that Fig1 A-D and Fig 2 A-B belong to one logical unit (nucleotide dependence), whereas Fig 1 E-F and Fig 2 C belong to the other (Pi binding and exchange). Perhaps consider re-organizing to streamline presentation?

      We thank the reviewer for their suggestion. We agree that it flows more naturally as suggested, and have made the changes! Thank you.

      Semantics/Typos: - Abstract: „... ADP-Pi and ADP-Arp2/3 detach with the same exponential increase as a function of force...". Increase should refer to the dissociation rate, which should be added to the sentence.

      We have corrected this.

      Results page 8: "...and the majority of Arp2/3 complexes detach from the mother filament while remaining bound to the branch at the debranching time." "Branch" should likely be daughter here, as there is no branch after dissociation of either interface.

      We have corrected this, thank you.

      Results page 13: "Exposing ADP-BeFx-Arp2/3 complex branch junctions to a saturating amount of GMF...". It is strange to imply saturation, because GMF likely simply does not bind to the complex in this nucleotide state with appreciable affinity. Suggest to change to "high".

      We have made the changes accordingly.

      Discussion page 18: "Moreover, in mammalian Arp2/3, His80 in Arp3 (corresponding to His73 in mammalian actin) is not methylated, and corresponds to residue N77 in Arp3, which is also not modified." N77 likely belongs to Arp2?

      We have made the changes accordingly.

      Discussion page 19: "We showed that Pi affinity for Arp2/3 complexes at branch junctions is around 3.7 mM (Fig. 1), a value which lies within the reported 1-10 mM Pi concentration measured in the cytosol in different mammalian cell types". Notably, this is not too different from F-actin, which should be mentioned. By this measure alone, free inorganic phosphate could also directly regulate actin filament stability!

      We now mention this and discuss that intracellular Pi can also impact actin filament nucleotide state.

      Future interest (non essential): - It would be utterly exciting (but beyond current scope) to quantify how instantaneous debranching rates evolve for naturally aging branches starting from ATP-Arp2/3 complexes!

      We thank the reviewer for this remark. It is indeed quite beyond the scope of the current study, as this would require a way to probe ATP-Arp2/3 complex branches while daughter filaments are still quite short (so pulling on them is difficult). An interesting alternative could be to use ATP analogs, such as App-NHp (aka AMP-PNP), to stabilize this state. However, some studies have mentioned that App-NHp is not very stable.

      Significance

      General assessment:

      This is a compelling and carefully executed study that delivers a clear mechanistic framework for how Arp2/3 branch junctions fail and re‑form under load. The central strength is the tight integration of state‑of‑the‑art reconstitutions with careful and original kinetic analysis. The experimental design is elegant and experiments have been carried out to a masterful standard. The figures are clear, the statistics are appropriate with some exceptions as detailed above. There are very few labs in the world that could have achieved this feat!

      A few aspects could be further strengthened, most notably the explanation and application of the "two slip bond" model as well as slightly more restraint in speculating around specific regulatory mechanisms. However, these are minor refinements that do not detract from the important contributions of the paper.

      Overall, the clearly work merits publication with high priority after revision; most requested changes are textual/analytical with very few targeted experiments, which would substantially strengthen core claims.

      We thank the reviewer for their positive evaluation of our manuscript. We hope that our responses to the detailed points above, along with the corresponding revisions of the manuscript, will alleviate their concerns.

      Advance relative to prior literature: The major novel findings of the paper are already summarized above. There is some recent work done on the subject of branch mechanics by the authors (Ghasemi et al 2024, PMID: 38277459) and others (Pandit et al 2020 PMID: 32461373), but the focus of the present work is clearly unique and the there is plenty of novel insight.

      Audience and impact: Primary audience: specialists in cytoskeleton dynamics, in vitro reconstitution single molecule biophysics, and mechanobiochemistry. Secondary: researchers in cell motility, morphogenesis and mechanobiology, physicists working on active matter and modelers studying force producing and load-bearing biopolymer networks. The results and analysis framework should inform quantitative models of branched network turnover under load and the interpretation of regulatory factor action in vivo and in cells.

      Reviewer expertise: Actin dynamics; biochemical reconstitution; single molecule approaches; biophysics.

      Reviewer #2 (Evidence, reproducibility and clarity (Required)):

      Xiao et al examine the molecular events occurring when Arp2/3 complex-mediated actin filament branches are removed from mother actin filaments. They do this using microfluidics assay with purified proteins combined with single filament TIRF imaging of branched actin filaments with distinct fluorescent labels. The contribution of different nucleotide states of Arp2/3 complex are tested in conjunction with the relationship force exerted on the branches and regulatory protein involvement from GMF and cortactin. The data seem comprehensive and highly quantified in response to concentration, force, fraction of branches and survival times and branching rates. They find that ADP-BeFx and high phosphate concentrations (leading to the ADP-Pi state) leads to a slower debranching rate at a given level of force applied. The ability to rapidly switch the buffer gives powerful information about response times of debranching compared with other actin remodelling events. They use renucleation experiments to determine that the previous debranching event most often occurs at the Arp2/3 complex/daughter interface, showing that filaments will be ready to re-branch in the stable ADP-Pi bound state. GMF addition allows debranching of the ADP state to occur at a lower force. Cortactin acts similarly to the ADP-Pi state to increase branch stability.

      Specific comments

      The pulling force on the branches seems to arise from different flow rates in the microfluidics. Viscous drag is mentioned and I can see there is methylcellulose in the buffer. It would be helpful to have the explanation of the conversion between flow and force, even if it has been standard in previous work.

      We apologize if this was unclear: in microfluidics experiments, the buffer does not contain methylcellulose. Methylcellulose is only used for 'open chamber' experiments, where no force is applied to Arp2/3 branches, to maintain them in the TIRF field of excitation (Figure S2).

      To better clarify the conversion between flow and force, we have rephrased and extended the Methods section to explain how the force on the branch junction is computed based on the local flow velocity and the length of the daughter filament.

      Pg 5 - what was the motivation to titrate phosphate? It seems a stretch that intracellular Pi levels are tuning branching inside cells more than protein-mediated control (GMF or cortactin) - can the authors evidence this at all?

      We are not claiming that the level of Pi plays a stronger regulatory role than proteins. We show that inorganic phosphate tunes the state of the Arp2/3 complex, which in turn modulates the action of regulatory proteins, such as GMF and cortactin.

      Nonetheless, we do show that the contribution of inorganic phosphate is quite central as it can (1) strongly stabilize branch junctions (~30-fold decrease in the dissociation rate), and (2) tune the activity of GMF and cortactin on Arp2/3 complexes at branch junctions as well as on the 'surviving' Arp2/3 complexes that remain bound to mother filaments.

      We thus titrated phosphate and found that its impact on Arp2/3 complex stability is significant in the range of Pi concentration that is explored in cells. For the sake of completeness, and following a comment from reviewer #1, we now also mention the affinity of Pi for actin subunits in filaments in the Discussion, and discuss the impact of intracellular Pi on actin itself.

      Minor comments

      • In the introduction, while the structural and mutagenesis evidence is clearly stated, in other cases a bit more detail would be helpful e.g. 'biochemical studies', which referred measurement of hydrolysis rates using radiolabelling

      We have made changes to more precisely define which biochemical assays were used in previous studies.

      • Page 3 Figures shouldn't be referenced in the introduction

      We have removed the references to the figures from the introduction.

      • Page 3 slip bond behaviour needs explanation

      We now explain the concept when first using this concept in the manuscript, as follows: "The debranching rate seems to increase exponentially with the applied pulling force, in the range of 0 to 6 pN (Fig. 1F; see more refined analysis below). This behaviour of accelerated debranching with the increase of the applied force is similar to the 'slip bond' concept, as predicted by the Bell-Evans model of the force-dependent lifetime of the interaction between two proteins".

      • Figure 1B seems to be a theoretical schematic which is superfluous

      We suppose that the reviewer is actually referring to figure 3B of the initial manuscript, describing the energy potential of a molecular interaction as a function of the reaction coordinate. We agree with the reviewer that it is not absolutely required and we have removed it.

      • Figure 4D is helpful, different weight lines might help even more to explain the dominant pathways

      We have made modifications to the biochemical reaction scheme in this figure (now figure 5F in the revised version). We hope we succeeded in improving its readability. Since the different paths depend on mechano-chemical parameters, there is no real dominant pathway per se.

      **Referee cross-commenting**

      Rev1 sounds like the specialist here. I can't comment on their requests. Some similar points arise between the reviewers which need addressing.

      Reviewer #2 (Significance (Required)):

      Significance

      Taking a look at references 16 and 19, I do not find it clear what is achieved differently in the current work compared to these papers and what agrees and what disagrees. If it's a species difference I might expect the two species would be analysed side-by-side in this paper.

      We thank the reviewer for this important comment. The goal of our study was not to compare the behaviour of mammalian and yeast Arp2/3 complexes.

      We now try to better explain that the motivation of the present work is to address how the nucleotide state of the Arp2/3 complex tunes actin branch mechanosensitive stability, and regulates interactions with well known Arp2/3 complex binding proteins. Most of the reactions are quantified here for the first time. Moreover, the experiments with branch junctions in different nucleotide states are done under controlled mechanical conditions, providing the first direct measurements of the force-dependence of the debranching reactions. Our detailed kinetic analysis of the full reaction scheme allows us to model the different binding interfaces of the Arp2/3 complex.

      In addition, it is worth noting that:

      1. Species matter and this is why ref 16 and 19 can give the impression to disagree on the ability to renucleate branches thanks to the stability of surviving Arp2/3 complexes on mother filaments.
      2. In ref 16 (Pandit et al, PNAS 2020) species are mixed (yeast Arp2/3 and mammalian alpha actin from skeletal muscle), likely leading to a different behaviour compared to the only mammalian protein situation we examine in our current work. In particular, with mixed species one misses the ability to renucleate, as shown in our previous study Ghasemi et al (ref 19). However, since mixing species does not correspond to anything physiological, we do not think it is worth repeating these conditions alongside our experiments.
      3. Further, the analysis carried out in ref 16 suffers from important limitations: the force was unknown (not calibrated) and the data was fitted by a model that compounded several reactions, providing only an indirect estimation of the rates, in particular at zero force. In contrast, we have worked with calibrated forces (including dedicated experiments at zero force) and we have carried out specific experiments to directly measure several rates.
      4. In ref 19 (our earlier work) we did not investigate the impact of the nucleotide state of the branch junction at all, and we did not systematically measure the dissociation rates as a function of force. Contrary to Pandit et al, we directly measure the difference in branch stability at zero force between ADP and ADP-Pi states and show that the ~ 30 fold difference holds true at all probed forces. Last, the force dependence of the branch renucleation success rate gives us crucial information on which of the two Arp2/3 complex interfaces ruptures first.

      I'm not understanding how the authors can distinguish effects of adding phosphate and BeFx on Arp 2 and 3 compared to effects on actin. Importantly, are possible accompanying changes in the actin filament a confounding factor?

      We have checked that the nucleotide state (ADP-BeFx and ADP-Pi versus ADP) of the mother and daughter filaments have no impact on branch stability:

      • In the experiments shown in figure 2F, where the buffer condition to which branches are exposed is quickly changed from phosphate buffer to buffer without phosphate, we observe a rapid change of branch stability. Actin subunits at the branch junction are in F-actin conformation according to recent cyroEM observations (ref. Chavani et al, Nat Comm. 2024; Liu et al, NSMB 2024). These actin subunits, initially in the ADP-Pi state, are expected to age and become ADP with a rate of ~ 0.007 s-1 (ie half-time of 100 s; ref. Jegou et al, PLoS Biology 2011, Ooosterhert et al, NSMB 2023), a much lower rate than the observed change of the debranching rate (0.21 s-1). This means that the debranching rate is independent of the nucleotide state of daughter and mother filaments.

      • In new supp. Figure S4, we show that the debranching rate is similar for ADP-Arp2/3 complex branch junctions initiated from ADP- or ADP-BeFx-actin mother filaments.

      • In new supp. Figure S9, we initially exposed branch junctions to a BeFx solution then monitored debranching and branch renucleation in our standard buffer (ie without BeFX or Pi). We observed multiple rounds of branch renucleation, the first with ADP-BeFx-actin daughter filaments, and the following with daughter filaments never exposed to BeFx. They all had the same debranching rates and renucleation success rates.

      The paper is quite specialist to read and the advance appears to be incremental. My expertise is in molecular pathways to actin regulation outside the main area of the paper.

      The results we present in this study are often unexpected, and some go counter long-standing assumptions. The regulation of Arp2/3-nucleated branches is of importance for the stability and the force-generating capabilities of many actin networks in cells. Last, most of the measurements that we present had never been done, mainly because experiments are difficult to achieve, and require specific tools to monitor several events while controlling the applied force.

      We believe our results are of broad interest as they go counter long-standing assumptions. We have rewritten the text in several instances to convey our message more clearly.

      Reviewer #3 (Evidence, reproducibility and clarity (Required)):

      Please find enclosed the review of the manuscript "Inorganic phosphate in Arp2/3 complex acts as a rapid switch for the stability of actin filament branches" by Xiao et al.

      The authors provide a detailed investigation of how the nucleotide bound to the Arp2/3 complex affects branch stability under flow force. From a kinetic perspective, this is an elegant study with generally high-quality data, although some conclusions rest on assumptions rather than direct experimental evidence.

      We thank the reviewer for their positive feedback. We have improved our manuscript and performed important additional experiments to provide more direct experimental evidence of our conclusions.

      A key question concerns the physiological relevance of these findings. For instance, the concept of branch regrowth may not be applicable in cellular contexts, since forces by actin polymerization would displace existing branches away from sites where they generate this active forces. The authors should clarify the relevance of regrowth during active force generation by branched networks.

      We thank the reviewer for this comment. Our in vitro results indeed point to a previously unreported property of branched actin networks, i.e. the ability of Arp2/3 complexes to readily renucleate branches in the ADP-Pi state and that it does require reloading ATP within Arp2/3.

      Branched actin networks, especially the lamellipodia or endocytotic patches, do exert active force thanks to actin polymerization of the individual branches at the forefront. Though, the whole actin network is exposed to stress, and the architecture of the network (inter-branch distance, crosslink between branches, ...) presumably strongly impact its mechanical properties.

      In the case of other types of branched actin networks, such as the actin cortex, myosin motor put the whole network under tension. Such pulling forces on actin branches, depending on the amplitude of the pulling force, can lead to branch regrowth, and network self-repair.

      We have modified the text to make the physiological relevance clearer.

      Additionally, all experiments employ flow conditions that branches would probably not experience in cells-notably, the flow direction in the cellular context would be reversed. Altering the flow direction relative to the branches could affect not only the relationship between flow rate and branch stability, but potentially other system properties as well.

      We agree with the reviewer that in cells branches will not experience flow conditions similar to the ones we use in our in vitro assay. Nonetheless, in cells we expect mechanical stress on the branch junction to be applied in all directions. In lamellipodia, the compressive force applied at the leading edge is expected to result in diverse local orientations of the force on individual branch junctions within the network (as explained in Lappalainen et al. Nat Rev MBC 2022). Also, branch junctions are found in the cell cortex, where they are exposed to pulling forces resulting from the action of myosin motors and crosslinkers on mother and daughter filaments.

      This impact of the direction of the flow was addressed in our previous publication (Ghasemi et al, Sc. Adv. 2024, figure 2) and, to a lesser extent, by the lab of Enrique de la Cruz in Pandit et al, PNAS 2020 (ref. 16). We reported that flow direction has a minimal effect, if any, on branch dissociation rate and renucleation ratio.

      Reviewer #3 (Significance (Required)):

      Furthermore, the study appears not to account for the mother filament (particularly its nucleotide state) or the actin subunit bound to the Arp2/3 complex. The authors should discuss why their interpretation focuses exclusively on the Arp2/3 complex rather than on the actin filaments or Arp2/3-bound actin subunit.

      We have checked that the nucleotide state (ADP-BeFx and ADP-Pi versus ADP) of the mother and daughter filaments has no impact on branch stability :

      • In the experiments shown in figure 2F, where the buffer condition to which branches are exposed is quickly changed from phosphate buffer to buffer without phosphate, we observe a rapid change of branch stability. Actin subunits at the branch junction are in F-actin conformation according to recent cyroEM observations (ref. Chavani et al, Nat Comm. 2024; Liu et al, NSMB 2024). These actin subunits, initially in the ADP-Pi state, are expected to age and become ADP with a rate of ~ 0.007 s-1 (ie half-time of 100 s; ref. Jegou et al, PLoS Biology 2011, Ooosterhert et al, NSMB 2023), a rate much lower than the observed change of the debranching rate (0.21 s-1). This means that the debranching rate is independent of the nucleotide state of daughter and mother filaments.

      • In new supp. Figure S4, we show that the debranching rate is similar for ADP-Arp2/3 complex branch junctions initiated from ADP- or ADP-BeFx-actin mother filaments.

      • In new supp. Figure S9, we initially exposed branch junctions to a BeFx solution then monitored debranching and branch renucleation in a regular buffer. We observed multiple rounds of branch renucleation, the first with ADP-BeFx-actin daughter filaments, and the following with daughter filaments never exposed to BeFx. They all had the same debranching rates and renucleation success rates.

      An important concern involves the use of KPi (inorganic phosphate). Based our experience, KPi appears to have effects beyond simply impacting nucleotide state-actin filaments seem to assemble differently in the presence of KPi. The authors should exercise caution in their interpretation of KPi-based experiments.

      Concentration of KPi (up to 50 mM Pi) did not slow down barbed end elongation rate in our experiments.

      Overall, while the technical quality and kinetic analyses are state-of-the-art, relating this work to physiological contexts remains challenging, and some conclusions appear overstated.

      We have made changes in the discussion to try to more clearly relate our in vitro observations and conclusions with the cellular context where branch renucleation could have a strong impact on the architecture and mechanics of actin networks.

    2. Note: This preprint has been reviewed by subject experts for Review Commons. Content has not been altered except for formatting.

      Learn more at Review Commons


      Referee #3

      Evidence, reproducibility and clarity

      Please find enclosed the review of the manuscript "Inorganic phosphate in Arp2/3 complex acts as a rapid switch for the stability of actin filament branches" by Xiao et al.

      The authors provide a detailed investigation of how the nucleotide bound to the Arp2/3 complex affects branch stability under flow force. From a kinetic perspective, this is an elegant study with generally high-quality data, although some conclusions rest on assumptions rather than direct experimental evidence.

      A key question concerns the physiological relevance of these findings. For instance, the concept of branch regrowth may not be applicable in cellular contexts, since forces by actin polymerization would displace existing branches away from sites where they generate this active forces. The authors should clarify the relevance of regrowth during active force generation by branched networks.

      Additionally, all experiments employ flow conditions that branches would probably not experience in cells-notably, the flow direction in the cellular context would be reversed. Altering the flow direction relative to the branches could affect not only the relationship between flow rate and branch stability, but potentially other system properties as well.

      Significance

      Furthermore, the study appears not to account for the mother filament (particularly its nucleotide state) or the actin subunit bound to the Arp2/3 complex. The authors should discuss why their interpretation focuses exclusively on the Arp2/3 complex rather than on the actin filaments or Arp2/3-bound actin subunit.

      An important concern involves the use of KPi (inorganic phosphate). Based our experience, KPi appears to have effects beyond simply impacting nucleotide state-actin filaments seem to assemble differently in the presence of KPi. The authors should exercise caution in their interpretation of KPi-based experiments.

      Overall, while the technical quality and kinetic analyses are state-of-the-art, relating this work to physiological contexts remains challenging, and some conclusions appear overstated.

    3. Note: This preprint has been reviewed by subject experts for Review Commons. Content has not been altered except for formatting.

      Learn more at Review Commons


      Referee #2

      Evidence, reproducibility and clarity

      Xiao et al examine the molecular events occurring when Arp2/3 complex-mediated actin filament branches are removed from mother actin filaments. They do this using microfluidics assay with purified proteins combined with single filament TIRF imaging of branched actin filaments with distinct fluorescent labels. The contribution of different nucleotide states of Arp2/3 complex are tested in conjunction with the relationship force exerted on the branches and regulatory protein involvement from GMF and cortactin. The data seem comprehensive and highly quantified in response to concentration, force, fraction of branches and survival times and branching rates. They find that ADP-BeFx and high phosphate concentrations (leading to the ADP-Pi state) leads to a slower debranching rate at a given level of force applied. The ability to rapidly switch the buffer gives powerful information about response times of debranching compared with other actin remodelling events. They use renucleation experiments to determine that the previous debranching event most often occurs at the Arp2/3 complex/daughter interface, showing that filaments will be ready to re-branch in the stable ADP-Pi bound state. GMF addition allows debranching of the ADP state to occur at a lower force. Cortactin acts similarly to the ADP-Pi state to increase branch stability.

      Specific comments

      The pulling force on the branches seems to arise from different flow rates in the microfluidics. Viscous drag is mentioned and I can see there is methylcellulose in the buffer. It would be helpful to have the explanation of the conversion between flow and force, even if it has been standard in previous work.

      Pg 5 - what was the motivation to titrate phosphate? It seems a stretch that intracellular Pi levels are tuning branching inside cells more than protein-mediated control (GMF or cortactin) - can the authors evidence this at all?

      Minor comments

      • In the introduction, while the structural and mutagenesis evidence is clearly stated, in other cases a bit more detail would be helpful e.g. 'biochemical studies', which referred measurement of hydrolysis rates using radiolabelling
      • Page 3 Figures shouldn't be referenced in the introduction
      • Page 3 slip bond behaviour needs explanation
      • Figure 1B seems to be a theoretical schematic which is superfluous
      • Figure 4D is helpful, different weight lines might help even more to explain the dominant pathways

      Referee cross-commenting

      Rev1 sounds like the specialist here. I can't comment on their requests. Some similar points arise between the reviewers which need addressing.

      Significance

      Taking a look at references 16 and 19, I do not find it clear what is achieved differently in the current work compared to these papers and what agrees and what disagrees. If it's a species difference I might expect the two species would be analysed side-by-side in this paper.

      I'm not understanding how the authors can distinguish effects of adding phosphate and BeFx on Arp 2 and 3 compared to effects on actin. Importantly, are possible accompanying changes in the actin filament a confounding factor?

      The paper is quite specialist to read and the advance appears to be incremental. My expertise is in molecular pathways to actin regulation outside the main area of the paper.

    4. Note: This preprint has been reviewed by subject experts for Review Commons. Content has not been altered except for formatting.

      Learn more at Review Commons


      Referee #1

      Evidence, reproducibility and clarity

      Summary

      This study investigates the mechanochemistry of Arp2/3-mediated branched actin networks at the level of individual branch junctions under load. Using microfluidic single-filament/branch force assays (including constant-force flow and open-chamber imaging) the authors quantify debranching, re‑nucleation, and mother- vs daughter‑interface stability across nucleotide states of Arp2/3 (ADP-Pi, ADP, and an ADP-BeFx proxy for ADP-Pi). They further test effects by two branch regulators (GMF and cortactin). Key findings include: (i) ADP-Pi and ADP complexes share similar force dependence but differ markedly (~20×) in intrinsic dissociation rate; (ii) phosphate turnover on the Arp2/3 complex is rapid ii) affinity for Pi drops when Arp2/3 loses its daughter filament; (iii) quantification from model fits uncovers large stability differences between daughter and mother interfaces of the Arp2/3 complex; (iv) extraordinary high stability of ADP-Pi-like Arp2/3 on the mother filament; and (v) distinct effects of GMF and cortactin on force‑dependent stability. Overall, the work combines technically demanding measurements with mechanistic modeling to probe how nucleotide state and regulatory factors tune branch mechanics.

      Major comments:

      1. Low force kinetics and completeness of survival curves (Figure 1). "For all forces, the surviving curves exhibited a clear single exponential behavior...." While the data can be fitted to monoexponential decay curves, data at low forces is clearly incomplete. >90% of branches have not dissociated by the end of the experiment. For the particular data shown in 1C (F00nN, n=60 total branches) it means that the time information is coming from <6 observations, which is rather low for the single molecule field. I am slightly worried by this point, since the debranching rates under ADP-Pi conditions at zero force, are even by one magnitude slower. Yet, no raw data is shown. Given that the dissociation rate at low forces is a contentious point, the authors should show the raw data and the corresponding fits. At present, they only show an experimental scheme and images for these "open chamber" assay (Fig S2). Ideally, they would image for much longer than 900s with lower sampling time in those assays, to firmly establish that 20-fold difference also holds at 0 force.

      Essential; experiment might already be performed. Otherwise straightforward to do (weeks time).

      1. Stability Analysis (Figure 4). I can follow much of the arguments presented in the stability analysis of the daughter vs mother interfaces, which is in principle extremely interesting! However, there are some concerns here:

      i) The authors emphasize the zero force ratio derived from fits (which is linked to the stability difference of the two interfaces in the absence of force) despite this being only weakly constrained by data. Intuitively in the model, the stability difference should grow to very large values as the re-nucleation ratio approaches 1 at low force. This combined with the noise in the data poses an issue in my opinion. Looking at the data and the error margin, I think that the authors cannot state with high confidence that there is a real difference between the relative stability of the daughter and mother interfaces between the two nucleotide states of the complex.

      Essential; analysis and textual revision only

      ii) For ADP-Pi, the renucleation ratio essentially remains flat over the measured force range. Hence, the data can only provide little leverage to estimate both the zero force ratio and, more importantly, the differential distance to the transition state in the slip-bond model in my opinion, which will show in the crossover force. Consequently, the quoted ">100×" stability difference at F=0 and the crossover force >20pN are driven largely by extrapolation rather than direct constraint by data. Given the high number of free parameters in the model, I would anticipate that several crossover forces and differential distances might explain the data nearly equally well. Instead of loosely reporting exact number from fits, I would have hoped for some sort of sensitivity analysis, for instance relying on profile likelihoods. Also parameter values could be reported as bounds (e.g crossover force≫measured range) rather than precise point estimates. This issue re-occurs (albeit not as drastically) for the cortactin experiments (Figure 6).

      Essential; analysis and textual revision only

      iii) One important expectation from the "two slip bond" model is that branch dissociation rates should not necessarily scale mono-exponentially as they mostly do over the accessible force range of the paper. However, once the "minor" pathway of dissociation from the mother starts to dominate at high forces, rates become more force sensitive. This is nicely recaptured by the model fits in Figure S6 but deserves some explanation in the text. Otherwise, people will simply remember the "ADP-Pi is 20-fold more stable than ADP at all forces" message.

      Essential; textual revision only

      iv) One important prerequisite for the model is that isolated Arp2/3 complexes (without a daughter filament) should dissociate with equal rates from mother filaments at all flow rates. Since the Arp2/3 complex prefers mother filament curvature, forces experienced by the mother might change its off-rate. It would be good to refer to this assumption in the text and experimentally verify it. I could not find it in the paper nor in Ghasemi et al 2024.

      Essential; simple experiment (a weeks time).

      v) The force dependence of the branch re-nucleation rate (Fig 3D) has been measured previously by the same group (Ghasemi et al). While the data in the older paper has not been fitted by a model, the trend of the data in the previous paper looks conspicuously different. Are there any explanations for this? I speculate that it might be related to actin and ATP not being saturated (low-force re-nucleation rate rarely exceeds 80%) in Ghasemi et al., but it would be good to know what the authors think about this.

      Essential; textual revision only 3. Stability of the authentic ADP-Pi-Arp2/3 complex on the mother filament. The extraordinary stability of the isolated ADP-BeFx-Arp2/3 complex on mother filaments is surprising, especially considering that both ATP and ADP states are much more labile (Ghasemi et al 2024). I would recommend repeating this experiment in the authentic ADP-Pi state with labelled Arp2/3 complexes as a more direct readout, even if this would require working with very high phosphate concentrations.

      Essential; simple experiment (a weeks time).

      OPTIONAL: Further, but beyond the scope of the present paper, would be titrating phosphate in these experiments, which would even allow the authors to independently verify the reduced Pi affinity for Arp2/3 in the mother filament. Of note, this affinity difference is needed to satisfy detailed balance in the reaction scheme (Fig 4 D)! 4. Importance of "surviving" ADP-Pi-Arp2/3 complexes. The authors show a) rapid turnover of Pi on the ADP-Arp2/3 complex in both branch- or mother filament-bound state and b) the lowered Pi affinity of the latter. Nonetheless, they emphasize the importance of long-lived "surviving" ADP-Pi bound complexes on the mother (even stated in the abstract). I understand that this fraction shows under some experimental conditions (BeFx), but unless I am missing something, most complexes should rapidly lose their phosphate and either exchange nucleotide or dissociate from the mother under physiological conditions. Please clarify or tone done.

      Essential; textual revision only 5. GMF mechanism. The authors claim that GMF "...accelerates the departure of the surviving Arp2/3 complex from the mother...". I assume that they infer this from decrease in the re-nucleation ratio. However, alternatively GMF could simply dwell on the complex, inhibiting re-nucleation without promoting dissociation from the mother. The authors should either monitor Arp2/3 dwell times directly to discriminate between these possibilities or be more cautious in their conclusions.

      Essential; simple experiment (a weeks time) or textual revision. 6. Cortactin mechanism and the "leash model". I must say that the cortactin data are the most puzzling part of the paper and had to reconcile with what we know from structure. I was hoping to find some of this resolved in the discussion. However, I do not understand the "leash model" in the discussion section for cortactin-mediated branch stabilization: "This would explain the observed increase in branch survival compared to the absence of cortactin. As the pulling force is increased, this rebinding mechanism becomes less efficient." According to my understanding of the data, this is opposite to what happens. Cortactin only stabilizes the labile interface at elevated forces! Some re-writing might help here.

      Essential; textual revision.

      Minor comments

      Organization:

      • I do not want to impose on how to best tell the story, but I felt that Fig1 A-D and Fig 2 A-B belong to one logical unit (nucleotide dependence), whereas Fig 1 E-F and Fig 2 C belong to the other (Pi binding and exchange). Perhaps consider re-organizing to streamline presentation?

      Semantics/Typos:

      • Abstract: „... ADP-Pi and ADP-Arp2/3 detach with the same exponential increase as a function of force...". Increase should refer to the dissociation rate, which should be added to the sentence.
      • Results page 8: "...and the majority of Arp2/3 complexes detach from the mother filament while remaining bound to the branch at the debranching time." "Branch" should likely be daughter here, as there is no branch after dissociation of either interface.
      • Results page 13: "Exposing ADP-BeFx-Arp2/3 complex branch junctions to a saturating amount of GMF...". It is strange to imply saturation, because GMF likely simply does not bind to the complex in this nucleotide state with appreciable affinity. Suggest to change to "high".
      • Discussion page 18: "Moreover, in mammalian Arp2/3, His80 in Arp3 (corresponding to His73 in mammalian actin) is not methylated, and corresponds to residue N77 in Arp3, which is also not modified." N77 likely belongs to Arp2?
      • Discussion page 19: "We showed that Pi affinity for Arp2/3 complexes at branch junctions is around 3.7 mM (Fig. 1), a value which lies within the reported 1-10 mM Pi concentration measured in the cytosol in different mammalian cell types". Notably, this is not too different from F-actin, which should be mentioned. By this measure alone, free inorganic phosphate could also directly regulate actin filament stability!

      Future interest (non essential):

      • It would be utterly exciting (but beyond current scope) to quantify how instantaneous debranching rates evolve for naturally aging branches starting from ATP-Arp2/3 complexes!

      Significance

      General assessment:

      This is a compelling and carefully executed study that delivers a clear mechanistic framework for how Arp2/3 branch junctions fail and re‑form under load. The central strength is the tight integration of state‑of‑the‑art reconstitutions with careful and original kinetic analysis. The experimental design is elegant and experiments have been carried out to a masterful standard. The figures are clear, the statistics are appropriate with some exceptions as detailed above. There are very few labs in the world that could have achieved this feat!

      A few aspects could be further strengthened, most notably the explanation and application of the "two slip bond" model as well as slightly more restraint in speculating around specific regulatory mechanisms. However, these are minor refinements that do not detract from the important contributions of the paper.

      Overall, the clearly work merits publication with high priority after revision; most requested changes are textual/analytical with very few targeted experiments, which would substantially strengthen core claims.

      Advance relative to prior literature:

      The major novel findings of the paper are already summarized above. There is some recent work done on the subject of branch mechanics by the authors (Ghasemi et al 2024, PMID: 38277459) and others (Pandit et al 2020 PMID: 32461373), but the focus of the present work is clearly unique and the there is plenty of novel insight.

      Audience and impact:

      Primary audience: specialists in cytoskeleton dynamics, in vitro reconstitution single molecule biophysics, and mechanobiochemistry. Secondary: researchers in cell motility, morphogenesis and mechanobiology, physicists working on active matter and modelers studying force producing and load-bearing biopolymer networks. The results and analysis framework should inform quantitative models of branched network turnover under load and the interpretation of regulatory factor action in vivo and in cells.

      Reviewer expertise:

      Actin dynamics; biochemical reconstitution; single molecule approaches; biophysics.

    1. The microorganisms in the starter will continue multiplying if you let them, and you can add flour and water to make it larger, then split it into multiple starters. You can repeat this process again and again, occasionally using some starters to bake bread, but you can share the starters with others.

      This passage uses sourdough starter as a creative example to explain how microorganisms can continue growing and spreading over time. I think the comparison is effective because it makes the concept of evolution easier to understand through something familiar and practical. The idea that people can keep feeding, dividing, and sharing the starter also connects well to how culture and information spread between humans. Overall, the paragraph is simple but engaging, and it helps readers see how biological and cultural evolution can work in similar ways.

    1. eLife Assessment

      This important study investigates the impact of BRCA1/2 mutations on immunotherapy in lung adenocarcinoma using multi-omics approaches. The detailed genetic analysis of two cancer genes (BRCA1 and BRCA2) demonstrated their new roles in causing the tumor microenvironment in lung cancer. The solid findings of this study provide an essential foundation for further developing drugs targeting BRCA1/2 in lung cancer therapy.

    2. Reviewer #1 (Public review):

      Summary:

      Liao et al. performed a large-scale integrative analysis to explore the function of two cancer genes (BRCA1 and BRCA2) in lung cancer, which is one of the cancers with an extremely high mortality rate. The detailed genetic analysis demonstrated new roles of BRCA1/2 in causing the tumor microenvironment in lung cancer. In particular, the discovery of different mechanisms of BRCA1 and BRCA2 provides an essential foundation for developing drugs that target BRCA1 or BRCA2 in lung cancer therapy.

      Strengths:

      (1) This study leveraged large-scale genomic and transcriptomic datasets to investigate the prognostic implications of BRCA1/2 mutations in LUAD patients (~2,000 samples). The datasets range from genomics to single-cell RNA-seq to scTCR-seq.

      (2) In particular, the scTCR-seq offers a powerful approach for understanding T cell diversity, clonal expansion, and antigen-specific immune responses. Leveraging these data, this study found that BRCA1 mutations were associated with CD8+ Trm expansion, whereas BRCA2 mutations were linked to tumor CD4+ Trm expansion and peripheral T/NK cell cytotoxicity.

      (3) This study also performed a comprehensive analysis of genomic variation, gene expression, and clinical data from the TCGA program, which provides an independent validation of the findings from LUAD patients newly collected in this study.

      (4) This study provides an exemplary integration analysis using both computational biology and wet bench experiments. The experimental testing in the A549 cell line further supports the robustness of the computational analysis.

      (5) The findings of this study offer a comprehensive view of the molecular mechanisms underlying BRCA1 and BRCA2 mutations in LUAD. BRCA1 and BRCA2 are two well-known cancer-related genes in multiple cancers. However, their role in shaping the tumor microenvironment, particularly in lung cancer, is largely unknown.

      (6) By focusing on PD-L1-negative LUAD patients, this study demonstrated the molecular mechanisms underlying resistance to immune therapy. These new insights highlight new opportunities for personalized therapeutic strategies to BRCA-driven tumors. For example, they found histone deacetylase (HDAC) inhibitors consistently downregulated 4-R genes in A549 cells.

      (7) The deposition of raw single-cell sequencing (including scRNA-seq and scTCR-seq) data will provide an essential data resource for further discovery in this field.

      Comments on revisions:

      The author has revised accordingly. I have no further comments.

    3. Reviewer #2 (Public review):

      Summary:

      This study investigates the impact of BRCA1/2 mutations on immunotherapy in lung adenocarcinoma using multi-omics approaches. The work highlights distinct roles of BRCA1 and BRCA2 mutations in shaping immune-related processes, and is logically structured with clearly presented analyses. However, the conclusions rely primarily on descriptive computational analyses and would benefit from additional immunological validation.

      Strengths:

      By integrating public datasets with in-house data, this study examines the impact of BRCA1/2 mutations on immunotherapy in lung adenocarcinoma from multiple perspectives using multi-omics approaches. The analyses are diverse in scope, with a clear overall logic and a well-organized structure.

      Weaknesses:

      The study is largely descriptive and would benefit from additional immunological experiments or validation using in vivo models. The fact that the BRCA1 and BRCA2 samples were each derived from a single patient also limits the robustness of the conclusions.

      Comments on revisions:

      The authors have addressed my concerns satisfactorily

    4. Author response:

      The following is the authors’ response to the original reviews.

      eLife Assessment

      This important study investigates the impact of BRCA1/2 mutations on immunotherapy in lung adenocarcinoma using multi-omics approaches. The detailed genetic analysis of two cancer genes (BRCA1 and BRCA2) demonstrated new roles for these genes in causing the tumor microenvironment in lung cancer. Further experimental explorations of the immune-related changes may still be required. The solid findings of this study provide a foundation for further developing drugs targeting BRCA1/2 in lung cancer therapy.

      We would like to express our sincere gratitude for your thoughtful and constructive comments on our manuscript. We carefully considered each comment from these two reviewers and revised the manuscript accordingly. Below, we provided a point-by-point response to each comment.

      Reviewer #1 (Public review):

      Summary:

      Liao et al. performed a large-scale integrative analysis to explore the function of two cancer genes (BRCA1 and BRCA2) in lung cancer, which is one of the cancers with an extremely high mortality rate. The detailed genetic analysis demonstrated new roles of BRCA1/2 in causing the tumor microenvironment in lung cancer. In particular, the discovery of different mechanisms of BRCA1 and BRCA2 provides an essential foundation for developing drugs that target BRCA1 or BRCA2 in lung cancer therapy.

      Strengths:

      (1) This study leveraged large-scale genomic and transcriptomic datasets to investigate the prognostic implications of BRCA1/2 mutations in LUAD patients (~2,000 samples). The datasets range from genomics to single-cell RNA-seq to scTCR-seq.

      (2) In particular, the scTCR-seq offers a powerful approach for understanding T cell diversity, clonal expansion, and antigen-specific immune responses. Leveraging these data, this study found that BRCA1 mutations were associated with CD8+ Trm expansion, whereas BRCA2 mutations were linked to tumor CD4+ Trm expansion and peripheral T/NK cell cytotoxicity.

      (3) This study also performed a comprehensive analysis of genomic variation, gene expression, and clinical data from the TCGA program, which provides an independent validation of the findings from LUAD patients newly collected in this study.

      (4) This study provides an exemplary integration analysis using both computational biology and wet bench experiments. The experimental testing in the A549 cell line further supports the robustness of the computational analysis.

      (5) The findings of this study offer a comprehensive view of the molecular mechanisms underlying BRCA1 and BRCA2 mutations in LUAD. BRCA1 and BRCA2 are two well-known cancer-related genes in multiple cancers. However, their role in shaping the tumor microenvironment, particularly in lung cancer, is largely unknown.

      (6) By focusing on PD-L1-negative LUAD patients, this study demonstrated the molecular mechanisms underlying resistance to immune therapy. These new insights highlight new opportunities for personalized therapeutic strategies to BRCA-driven tumors. For example, they found histone deacetylase (HDAC) inhibitors consistently downregulated 4-R genes in A549 cells.

      (7) The deposition of raw single-cell sequencing (including scRNA-seq and scTCR-seq) data will provide an essential data resource for further discovery in this field.

      Weaknesses:

      (1) The finding of histone deacetylase (HDAC) inhibitors suggests the potential roles of epigenetic regulation in lung cancer. It would be interesting to explore epigenetic changes in LUAD patients in the future.

      Thank you for your insightful comment. We fully agree that the specific situation of epigenetic dysregulation in LUAD needs to be explored. We believe that future investigations utilizing clinical specimens and animal models to map histone acetylation patterns and DNA methylation profiles were crucial for identifying novel biomarkers and therapeutic targets unique to LUAD.

      (2) For some methods, more detailed information is needed.

      This is a valid point. We agree that additional details regarding are necessary for clarity and reproducibility. We have expanded these method details in the revised manuscript.

      (3) There are grammar issues in the text that need to be fixed.

      We apologize for our irregular use of grammar. In the revised manuscript, we carefully checked the grammar and make corrections.

      (4) Some text in the figures is not labeled well.

      We appreciate the reviewers' comments. We have added labels to the revised version of the figures.

      Reviewer #2 (Public review):

      Summary:

      This study investigates the impact of BRCA1/2 mutations on immunotherapy in lung adenocarcinoma using multi-omics approaches. The work highlights distinct roles of BRCA1 and BRCA2 mutations in shaping immune-related processes, and is logically structured with clearly presented analyses. However, the conclusions rely primarily on descriptive computational analyses and would benefit from additional immunological validation.

      Strengths:

      By integrating public datasets with in-house data, this study examines the impact of BRCA1/2 mutations on immunotherapy in lung adenocarcinoma from multiple perspectives using multi-omics approaches. The analyses are diverse in scope, with a clear overall logic and a well-organized structure.

      Weaknesses:

      The study is largely descriptive and would benefit from additional immunological experiments or validation using in vivo models. The fact that the BRCA1 and BRCA2 samples were each derived from a single patient also limits the robustness of the conclusions.

      Thank you for this excellent suggestion. In the revised manuscript, we supplemented the additional immunological experiments and validation based on pathological tissue sections of lung adenocarcinoma patients. In addition, we elaborated on the limitations of our study in the Discussion section and provided reasonable explanations.

      Recommendations for the authors:

      Reviewer #1 (Recommendations for the authors):

      (1) The abstract includes a lot of abbreviations, which makes it difficult to follow. For example, "IFN" is not defined. And "HRR" is defined but used only once in the abstract. This issue also appears in other parts, such as "OAK" on page 5, line 114; "DFS" on page 15, line 398; and "DSBs" on page 20, line 558. Please try to avoid unnecessary abbreviations.

      Thank you for highlighting this. We have revised the manuscript to minimize the use of abbreviations. Specifically, we have now defined all necessary abbreviations upon first mention (including 'IFN') and have removed or spelled out those used infrequently to ensure the text flows more smoothly for the reader.

      (2) Page 5, line 129, what data type is used in this part analysis?

      We apologize for our negligence. The whole exome sequencing data used here has been added in the revised manuscript.

      Materials and methods, page 6, lines 131-132: “The raw reads (fastq) of whole exome sequencing were pre-processed and trimmed with fastp (Version: 0.23.4) based on default parameters.”

      (3) Page 6, line 138, Add citation for ANNOVAR.

      Thank you for your suggestion. We have added a citation for ANNOVAR in the revised manuscript.

      (4) Page 8, line 211, what cutoff is used to define the significant makers?

      Thank you for your insightful comment. We provided the cutoff used to define significant markers.

      Materials and methods, page 8, lines 213-215: “Differential expression genes for specific clusters were identified using the “FindMarkers” function, with a threshold of |avg_log2FC| ≥ 0.5 and adjusted P-value ≤ 0.01.”

      (5) Page 11, line 276, HEK293T is not a lung cancer cell line. It would be better to label the details of this cell line.

      Thank you for your correction. We have now clarified HEK293T in the text by stating: 'human embryonic kidney cell line HEK293T'.

      Materials and methods, page 11, lines 277-278: “The human lung cancer cell line A549 (#SCSP-503) and the human embryonic kidney cell line HEK293T (#SCSP-502) were purchased from the Type Culture Collection of the Chinese Academy of Sciences, China.”

      (6) Page 16, line 415, what samples and how many individuals were used for the exome sequencing?

      We agree that specifying the sample set is crucial. The exome sequencing was conducted on 2 individuals (four samples). The samples used were tumor tissues (2 samples) and matched blood (2 samples). This information has been clarified in the revised manuscript.

      Results section, page 16, lines 415-416: “Exome sequencing was performed on four samples from two individuals: two tumor tissues and two matched blood samples.”

      (7) Page 17, line 468, Replace "Differently" with "In contrast" (more appropriate for scientific writing).

      Thank you for pointing this out. We agree that "In contrast" is more appropriate for scientific writing. Accordingly, we have replaced "Differently" with "In contrast" in this sentence (Results section, page 18, line 483).

      (8) Page 18, line 489, what is HMG?

      Thank you for pointing this out. HMG stands for High Mobility Group. We have clarified this by writing out the full term upon first mention in the manuscript (Results section, page 19, line 503).

      (9) Page 19, line 527, check the grammar for this sentence.

      We appreciate your careful reading. We have carefully rephrased this sentence to ensure clarity and grammatical accuracy.

      Results section, page 20, line 540: “Based on pseudotime order, we divided trajectories into 10 bins and analyze the activity changes of related features.”

      (10) Page 20, line 541-546. It would be better to split this long sentence into smaller ones.

      Thank you for your insightful comment. We have revised the text, splitting the long sentence into smaller ones for better clarity.

      Results section, page 20, lines 554-559: “MHC class I and II molecules showed increased activity in late pseudotime in BRCA1- and BRCA2-mutant cells, respectively (Fig. 4G-I). This pattern was also reflected in the cell density analysis (Fig. 4J). Furthermore, CD8<sup>+</sup> Tcm and Th1 signatures exhibited higher activity in late pseudotime in BRCA1- and BRCA2-mutant cells, respectively (Fig. S5F-G). These findings suggest a differential association with CD8<sup>+</sup> versus CD4<sup>+</sup> T cell engagement.”

      (11) Page 20, line 550, remove "." after "of".

      Thank you for catching this. We have removed it (Results section, Page 21, line 563).

      (12) Page 22, line 592, what is "LME"?

      Thank you for pointing this out. "LME" was indeed redundant in the original manuscript, so we have removed it in the revised version (Results section, Page 22, lines 607-609).

      (13) Page 24, line 674, Replace "suggest" with "suggested"?

      We apologize for our negligence. In the revised manuscript, we have replaced "suggest" with "suggested" (Results section, Page 25, lines 691-693).

      (14) Page 35, Figure 1I, Use "B cells" instead of "B".

      Thank you for your detailed review. We have changed to the appropriate label in Figure 1I.

      (15) Page 36, Figure 2H, the statistics and p-value are needed to show.

      Thank you for your suggestion. We have added the statistical analysis for Figure 2H, and the p-values were indicated in the revised Figure.

      Special thanks to you for your kind comments.

      Reviewer #2 (Recommendations for the authors):

      Major:

      (1) Line 44. In the Introduction section, a brief description of the prevalence of HRD or BRCA1/2 mutations in lung cancer patients should be included to highlight the significance of the study.

      This is an excellent suggestion. We revised the Introduction section (page 3, lines 61-64) to include a brief overview of the prevalence of BRCA1/2 mutations specifically in lung cancer patients. We believe this addition will strengthen the background for readers.

      Introduction section, page 3, lines 61-64: “Among the key genetic mutations that drive LUAD, BRCA1 and BRCA2 mutations (with prevalence rates of approximately 4% and 5%, respectively) have been increasingly implicated in the pathogenesis and progression of lung cancer [9, 13].”

      (2) Line 302-355. There are relatively serious grammatical issues, and substantial revision of the text is recommended.

      We acknowledge the grammatical issues in the original text. We have now carefully revised the Materials and methods section of the manuscript (pages 11-14, lines 277-358) to correct these issues and improve the overall readability. We believe the revised version is significantly improved.

      (3) Line 375. The Results section lacks detailed information on the specific BRCA1/BRCA2 mutations and data explaining how these mutations lead to functional alterations of BRCA1/2.

      Thank you for your insightful comment. In the revised manuscript, we added the amino acid changes caused by the specific BRCA1/BRCA2 mutation sites and expand the text to discuss the predicted and known pathogenic mechanisms of these variants (Results section, page 16, lines 420-433).

      Results section, page 16, lines 420-433: “Exome sequencing data show that these two types of tumor tissues harbor somatic nonsynonymous single nucleotide variants (SNV) in BRCA2 (p.N372H) and BRCA1 (p.E991G, p.S1566G, p.K1136R, p.P824L, and p.Y809H), respectively (Table S1). The BRCA2 p.N372H variant lies within the BRC3 or BRC4 motifs critical for RAD51 binding. It may alter binding affinity, impair high-fidelity homologous recombination repair, and promote genomic instability [39-41]. In BRCA1, mutations are distributed across two key functional domains: the Coiled-Coil domain (e.g., p.E991G, p.Y809H, p.P824L) and the BRCT domain (e.g., p.K1136R, p.S1566G). Coiled-Coil mutations disrupt BRCA1-PALB2-BRCA2 complex assembly, impairing localization to DNA damage sites and subsequent RAD51 recruitment; BRCT domain mutations compromise phospho-protein recognition and G2/M checkpoint control, leading to defective DNA damage response and unchecked proliferation of damaged cells [42-44]. Together, these defects promote the accumulation of genomic scars and chromosomal instability.”

      (4) Line 492-498. Changes in genes associated with BRCA1 and BRCA2 mutations should be validated by immunofluorescence.

      Thank you for your insightful comment. Immunofluorescence would provide valuable orthogonal validation of the protein-level consequences of these mutations. To address this, we obtained pathological tissue sections from patients carrying BRCA1/2 mutations and performed immunofluorescence staining for S100A10, a risk gene associated with BRCA1 mutations. We found that S100A10 was upregulated in BRCA1-mutated tumor tissue compared to adjacent non-cancerous tissue.

      Results section, page 24, lines 673-675: “Immunofluorescence experiments on patient tissue sections revealed that S100A10 was upregulated in BRCA1-mutated tumor tissue relative to adjacent non-cancerous tissue (Fig. S11D-E).”

      (5) Line 538. Although both BRCA1 and BRCA2 deficiencies impair DNA damage repair, BRCA1, but not BRCA2, activates the cGAS-STING pathway. This is a particularly interesting observation and should be validated by immunofluorescence experiments.

      Thank you for highlighting this observation. To address this, we conducted immunofluorescence experiments to quantify STING, the key protein of cGAS-STING pathway, in BRCA1- and BRCA2-deficient tissues to confirm this phenotype. We have included these results in the revised manuscript.

      Results section, page 21, lines 578-584: “Furthermore, our results revealed that BRCA1-mutant tumors showed higher activity of cGAS-STING signaling and STING mediated induction of host immune responses compared to BRCA2-mutant tumors (Fig. 5G and Fig. S6F). Also, cGAS-STING signaling gens, including cGAS, STING1, and downstream factors STAT1 and CCL5, were upregulated in BRCA1-mutant tumor cells (Fig. 5H). This observation was validated through immunofluorescence staining experiments on patient tumor tissue sections (Fig. 5I-J).”

      (6) Line 599. "CD8+ Trm cells were more abundant in BRCA1-mutant sample, whereas CD4+ Trm cells were higher in BRCA2-mutant sample". This part is also recommended to be validated using immunofluorescence or more rigorous flow cytometry analyses.

      We sincerely appreciate this insightful suggestion. To address this, we performed immunofluorescence staining to quantify the abundance of CD8<sup>+</sup> and CD4<sup>+</sup> Trm cells in BRCA1- and BRCA2-mutant tissues. We have included these results in the revised manuscript.

      Results section, page 22, lines 614-617: We identified two tissue-resident memory T cell (Trm) subsets, CD8<sup>+</sup> Trm and CD4<sup>+</sup> Trm, both predominantly derived from tumor tissues (Fig. 6B). “Interestingly, our analysis revealed that CD8<sup>+</sup> Trm cells were more abundant in BRCA1-mutant tumor, whereas CD4<sup>+</sup> Trm cells were more abundant in BRCA2-mutant tumor (Fig. 6B-D, Fig. S7D, and Fig. S8A-B).”

      (7) Line 643-676. The authors identified four risk genes associated with BRCA1 mutations-S100A10, LDHA, MYL12A, and GAPDH; however, MYL12A was not validated in the subsequent in vitro experiments. The authors state that "S100A10 can promote cancer metastasis by recruiting MDSC cells, and increased LDHA activity contributes to tumor immune escape." However, because immune cells were not included in the in vitro assays, these results instead suggest that these genes may directly suppress tumor cell proliferation.

      We thank the reviewer for this insightful observation. Our intention was not to suggest that the reduction in proliferation observed in our in vitro assays was caused by the disruption of immune cell recruitment or immune escape pathways. As the reviewer correctly points out, those mechanisms are irrelevant in a system lacking immune cells. Our results showing that "Knockdown of S100A10, LDHA, and GAPDH reduced LUAD cell proliferation in vitro (Fig. 7D-E)" strongly suggest a direct, cell-autonomous role for these genes in regulating LUAD cell growth. For the MYL12A gene, the existing study have shown that BRCA1 transcriptionally regulates this gene involved in breast tumorigenesis (PMID: 12032322). In view of the characteristics of MYL12A in lung cancer, we will conduct in-depth in vitro and in vivo validation experiments in future studies.

      (8) Line 677. The authors should emphasize the limitations arising from the small sample size and the lack of in vivo validation models in the Discussion section.

      Thank you for highlighting these important limitations. We agree that the small sample size and the lack of in vivo validation are significant limitations of the current study. We have explicitly addressed these points in the Discussion section (page 27, lines 740-750) to ensure the interpretation of our data is appropriately qualified and to provide transparency regarding the scope of our conclusions.

      Discussion section, page 27, lines 740-750: “Although we included both tumor tissues and matched paracancerous and blood samples, the sample size remains modest, which may limit the statistical power and generalizability of our findings. Therefore, our results should be interpreted as preliminary, and further studies with larger, independent cohorts are required to validate these observations. Single-cell RNA-seq and TCR-seq analyses in this study provide high-resolution insights into the cellular and clonal dynamics of the TME, the functional validation of key mechanisms remains largely correlative. While our in vitro experiments provide valuable mechanistic insight, the lack of in vivo validation, which cannot fully recapitulate the complex TME. Future studies utilizing murine models or patient-derived organoids are essential to establish causal relationships and elucidate the underlying molecular pathways.”

      Minor:

      (1) Line 163: cell/μl should be corrected to cells/μL.

      Thank you for catching this. We have corrected it in the revised manuscript (Methods section, page 7, line 165).

      (2) Line 388: Please clarify how the HRD score, tumor mutation burden, and neoantigen load were calculated.

      We thank the reviewer for this request for clarification. In the revised manuscript, we have expanded the Methods section (page 5, lines 117-121) to provide a detailed description of how these metrics were calculated. HRD score was calculated as the unweighted sum of loss of heterozygosity (LOH), telomeric allelic imbalance (TAI), and large-scale state transitions (LST). Tumor mutation burden (TMB) was defined as the total number of somatic nonsynonymous mutations per megabase of the exome captured by the sequencing panel. Neoantigen load was predicted by NetMHCpan using the patient's HLA typing and the identified somatic mutations. The data for these three indicators all obtained from a previous study (PMID: 29628290). We believe these additions provide the necessary transparency and reproducibility for our study.

      Methods section, page 5, lines 117-121: The HRD score was determined by summing specific genomic alterations, including loss of heterozygosity (LOH), large-scale state transitions (LST), and telomeric allelic imbalances (TAI). “Tumor mutation burden (TMB) was defined as the total number of somatic nonsynonymous mutations per megabase of the exome captured by the sequencing panel. Neoantigen load was predicted by NetMHCpan using the patient's HLA typing and the identified somatic mutations.”

      (3) Line 421: BRCA12 should be corrected to BRCA2.

      Thank you for your detailed review. We have revised it.

      (4) The order of Figures 7D and 7E should be reversed.

      Thank you for your insightful comment. According to your suggestion, we reversed the order of Figures 7D and 7E in the revised manuscript.

      Special thanks to you for your kind comments.

    1. eLife Assessment

      This study examines the role of the fungal pathogen Candida albicans in the progression of colorectal cancer, a relevant and urgent topic given the global incidence of colon cancer. While the findings are useful and provide solid experimental work and insight into how Candida may contribute to tumor progression, the small patient sample size, reliance on in vitro models, and absence of in vivo validation may limit its impact. This work will interest scientists studying cancer progression and the role played by pathogens.

    2. Reviewer #1 (Public review):

      [Editors' note: this version has been assessed by the Reviewing Editor without further input from the original reviewers. The authors have addressed most of the comments raised in the previous round of review.]

      Summary:

      This study addresses the emerging role of fungal pathogens in colorectal cancer and provides mechanistic insights into how Candida albicans may influence tumor-promoting pathways. While the work is potentially impactful and the experiments are carefully executed, the strength of evidence is limited by reliance on in vitro models, small patient sample size, and the absence of in vivo validation, which reduces the translational significance of the findings.

      Strengths:

      (1) Comprehensive mechanistic dissection of intracellular signaling pathways.

      (2) Broad use of pharmacological inhibitors and cell line models.

      (3) Inclusion of patient-derived organoids, which increases relevance to human disease.

      (4) Focus on an emerging and underexplored aspect of the tumor microenvironment, namely fungal pathogens.

    3. Reviewer #2 (Public review):

      The authors in this manuscript studied the role of Candida albicans in Colorectal cancer progression. The authors have undertaken a thorough investigation and used several methods to investigate the role of Candida albicans in Colorectal cancer progression. The topic is highly relevant, given the increasing burden of colon cancer globally and the urgent need for innovative treatment options.

      Strengths:

      Authors have undertaken a thorough investigation and used several methods to investigate the role of Candida albicans in Colorectal cancer progression.

    4. Author response:

      The following is the authors’ response to the original reviews.

      Public Reviews:

      Reviewer #1 (Public review):

      Summary:

      This study addresses the emerging role of fungal pathogens in colorectal cancer and provides mechanistic insights into how Candida albicans may influence tumor-promoting pathways. While the work is potentially impactful and the experiments are carefully executed, the strength of evidence is limited by reliance on in vitro models, small patient sample size, and the absence of in vivo validation, which reduces the translational significance of the findings.

      Strengths:

      (1) Comprehensive mechanistic dissection of intracellular signaling pathways.

      (2) Broad use of pharmacological inhibitors and cell line models.

      (3) Inclusion of patient-derived organoids, which increases relevance to human disease.

      (4) Focus on an emerging and underexplored aspect of the tumor microenvironment, namely fungal pathogens.

      Weaknesses:

      (1) Clinical association data are inconsistent and based on very small sample numbers.

      We thank the reviewer for this important comment. We have investigated 4 colorectal tumors (2 in early stage and 2 in late stage), and we observed Candida albicans in the 2 late-stage samples while not in the early-stage ones. This result is consistent with TCGA data (which is large-scale) that Candida albicans mainly detectable in the late-stage colorectal tumors (Fig. 1c) and suggests that Candida albicans contributed to colorectal cancer progression, which is the main research direction of this study.

      (2) No in vivo validation, which limits the translational significance.

      We appreciate the reviewer’s concern regarding the lack of in vivo validation. While we recognize the value of in vivo models, our current institutional biosafety protocols and animal facility designations do not support the handling of pathogenic microorganisms like Candida albicans in live infection models. Consequently, these experiments were beyond the immediate technical scope of this study. To validate the findings using cell lines, we have performed Candida albicans infection experiments using organoids collected from colorectal cancer patients instead (Fig. 7). We have revised the Discussion section to acknowledge this limitation and clarify that the current work serves as a mechanistic study based on in vitro and ex vivo systems. We have also incorporated references to recent studies demonstrating the in vivo effects of C. albicans in tumor models, which support the biological relevance of our findings.

      (3) Species- and cell type-specificity claims are not well supported by the presented controls.

      We thank the reviewer for this insightful comment. We agree that our current dataset does not warrant definitive conclusions regarding species- or cell type-specificity. Accordingly, we have tempered our claims throughout the manuscript, describing the observed effects as context-dependent across different epithelial models. Specifically, we observed differential responses among the cell lines and epithelial systems evaluated, suggesting variability rather than strict specificity. Furthermore, the Discussion has been expanded to address potential underlying factors, such as variations in EGFR expression levels and other signaling determinants. We have also added a dedicated section to acknowledge this limitation and emphasize the need for future systematic investigations using a more diverse array of fungal species and cell models.

      (4) Reliance on colorectal cancer cell lines alone makes it difficult to judge whether findings are specific or general epithelial responses.

      We appreciate the reviewer’s thoughtful concern. Although most of our mechanistic experiments were performed in colorectal cancer cell lines, we also evaluated our finding across a broader range of epithelial models, including normal human colon-derived organoids and the breast epithelial cancer line MCF7 (Fig. 8). Neither model exhibited HIF-1α activation upon C. albicans exposure, supporting that the hypoxia response we observed might not be universal. Interestingly, the observed response in non-colorectal epithelial cancer lines (e.g., HCC1937, NUGC-3) suggests that this mechanism is not strictly confined to CRC. Based on these observations, we propose that the specificity is likely related to EGFR levels but may involve additional epithelial determinants, which we aim to investigate in future work.

      Reviewer #2 (Public review):

      The authors in this manuscript studied the role of Candida albicans in Colorectal cancer progression. The authors have undertaken a thorough investigation and used several methods to investigate the role of Candida albicans in Colorectal cancer progression. The topic is highly relevant, given the increasing burden of colon cancer globally and the urgent need for innovative treatment options. However, there are some inconsistencies in the figures and some missing details in the figures, including:

      (1) The authors should clearly explain in the results section which patient samples are shown in Figure 1B.

      We thank the reviewer for pointing out this omission. We apologize for the lack of clarity in the initial submission. The patient samples shown in Figure 1B are from the CRC patients with Stage III. We have revised the manuscript to explicitly state this information in the legend for Figure 1B to ensure better clarity for the reader.

      (2) What do a, ab, b, b written above the bars in Figure 1F represent? Maybe authors should consider removing them, because they create confusion. Also, there is no explanation for those letters in the figure legend.

      We thank the reviewer for this helpful comment. The letters above the bars represent statistical groupings from post-hoc multiple-comparison tests (a standard convention used after ANOVA or similar analyses): bars sharing the same letter are not significantly different, whereas different letters indicate statistically distinct groups. We chose this letter-based system over asterisks to avoid the visual clutter and potential confusion that often arise from numerous pairwise comparisons; therefore, we will retain the letter-based grouping. In the revised manuscript, we have explicitly defined this notation in the figure legend to be ease of interpretation for the reader.

      (3) The authors should submit all the raw images of Western blot with appropriate labels to indicate the bands of protein of interest along with molecular weight markers.

      We appreciate the reviewer’s request for raw data. We have now included the raw images of the Western blots in the supplementary materials, with clear annotations of the bands corresponding to the proteins of interest as well as molecular weight markers.

      (4) The authors should do the quantification of data in Figure 2d and include it in the figure.

      We thank the reviewer for this valuable suggestion. In the revised manuscript, we have quantified the subcellular localization of HIF-1α in PBS-treated versus C. albicans–infected cells shown in Figure 2d. The quantification results are shown in the following figure and provided in Supplementary Figure 3c.

      (5) In Figure 2h, the authors should indicate if the quantification represents VEGF expression after 6h or 12h of C. albicans co-culture with cells.

      We thank the reviewer for pointing this out. We have updated Figure 2h to specify that the quantification represents VEGF expression after 12 hours of co-culture with Candida albicans.

      (6) In Figure 2i, quantification of VEGF should be done and data from three independent experiments should be submitted. The authors should also mention the time point.

      We thank the reviewer for this helpful comment. In the revised manuscript, we have quantified VEGFA fluorescence intensity based on three independent experiments (the other 2 replicates were shown in Author response image 1). The corresponding time point (12 hours of co-culture) has been clearly indicated in the figure legend.

      Author response image 1.

      Recommendations for the authors:

      Reviewing Editor Comments:

      (1) Some of the statements regarding Candida albicans and CRC progression in Figure 1 may be overstated (since the association with stage/survival may be cross-confounded). That is, analyses of survival ought to be stage-adjusted.

      We thank the editor for this important comment. We agree that the association between C. albicans and patient survival may be influenced by tumor stage as a confounding factor. In the revised manuscript, we have moderated our statements regarding the clinical associations and clarified the limitations of these analyses, now presenting these findings as correlative observations rather than causal relationships. We have also noted in the Discussion that stage-adjusted analyses would be required to more rigorously assess the independent contribution of C. albicans to patient outcomes.

      (2) Fan et al. (citation 26) is incorrectly referenced. The paper states that Bacteroides fragilis does not affect Candida albicans colonization. Instead, Bacteroides thetaiotamicron was shown to reduce C. albicans colonization, but B. fragilis was used in the current study as a control.

      We thank the editor for pointing out this error, and we have corrected the citation accordingly. As noted, the referenced study indicates that Bacteroides thetaiotaomicron, rather than Bacteroides fragilis, reduces C. albicans colonization. We selected B. fragilis as a control in this study because it is a prevalent gut commensal and has been previously implicated in colorectal cancer progression. Although prior reports suggest that B. fragilis does not significantly affect C. albicans growth, we observed that co-culture with B. fragilis led to a noticeable inhibition of C. albicans growth under our experimental conditions. This discrepancy may reflect differences in experimental settings. We believe these findings provide additional context for the complex interactions between gut microbiota and fungal pathogens.

      (3) The link between hypoxia signaling is interesting, but for the most part, these experiments were largely done in normoxic conditions, while the colon is generally hypoxic. So I would have encouraged the authors to consider testing the effect of C. albicans presence/absence under low-oxygen conditions, which may be more physiologically relevant.

      We thank the editor for this insightful suggestion. We fully agree that evaluating the effects of C. albicans under hypoxic or anaerobic conditions would be highly relevant to the physiological tumor microenvironment. Although we have attempted to assess the impact of C. albicans on cell migration under hypoxic conditions, we observed that tumor cells exhibited markedly accelerated migration and proliferation, resulting in near-complete wound closure within 24 hours in control groups. This limited our ability to reliably detect differences between conditions using standard migration assays. We agree that in vivo models may provide a more physiologically relevant context to address this question, and we will pursue this direction in future studies when appropriate experimental conditions become available.

      Reviewer #1 (Recommendations for the authors):

      (1) Figure 1 inconsistencies: In Figure 1C, there is no significant difference in C. albicans detection between stage II and stage III CRC patients. In fact, more patients in stage II appear positive, which is inconsistent with Figures 1A and 1B. For Figures 1A and 1B, the sample size (n=2) is too low to support meaningful conclusions. Please also clarify which stage is represented in Figure 1B.

      We thank the reviewer for this important comment. In the revised manuscript, we have clarified the sample information and explicitly stated that the samples shown in Figure 1b are derived from stage III CRC patients. We have also moderated our conclusions and described these findings as exploratory observations. Regarding the apparent inconsistency between Figure 1C and Figures 1a-b, we consider that this discrepancy may be partly due to the small number of clinical samples analyzed in our study. In addition, the TCGA-based analysis relies on transcriptomic data, whereas our analysis is based on immunohistochemistry (IHC). These methodological differences may also contribute to the observed variation.

      (2) Weak link between clinical and in vitro data: The transition from clinical samples to CRC cell line models feels tenuous. While C. albicans may induce hypoxia signaling, it is unclear whether this is specific to CRC cells or could occur in other epithelial cell types. Some broader testing would help strengthen this link.

      We thank the reviewer for this insightful comment. We agree that reinforcing the bridge between clinical observations and in vitro mechanistic findings, as well as clarifying cell type specificity, is important for a comprehensive study. In the revised manuscript, we have clarified that the clinical data provide correlative evidence, while the mechanistic insights are derived from controlled in vitro systems. To address the issue of cell type specificity, we have included additional analyses across multiple epithelial cell models (Figure 8). These results indicate that the response to C. albicans is not restricted to colorectal cancer cells but varies across different epithelial contexts.

      (3) Lack of in vivo validation: The mechanistic findings would be substantially strengthened by in vivo data, e.g., murine CRC models. Without this, the translational impact is limited.

      We appreciate the reviewer’s concern regarding the lack of in vivo validation. While we recognize the value of animal models, our current institutional biosafety protocols and facility designations do not support the handling of pathogenic microorganisms like Candida albicans in live infection models. Consequently, these experiments were beyond the immediate technical scope of this study, and better be performed in future studies to validate the mechanisms.

      (4) Figure 8B interpretation: The authors conclude that C. albicans shows the strongest effect on c-Myc and c-Jun activation. However, from the presented blots, the differences compared to other fungi are not obvious. The claim should be toned down or quantified more rigorously.

      We thank the reviewer for this important comment. We agree that the differences in c-Myc and c-Jun activation among fungal species are not sufficiently pronounced to support a strong comparative claim. In the revised manuscript, we have moderated the corresponding statements to avoid overinterpretation.

      (5) Cell type specificity: Since the title emphasizes CRC specificity, the cell line comparison shown in Figure 8 should be moved earlier in the results. This would clarify from the start whether the described mechanisms are CRC-specific or more generalizable.

      We thank the reviewer for this insightful suggestion. We agree that earlier presentation of cell type comparisons would help clarify the scope of the observed effects. We have revised the Results section accordingly: “To evaluate the cell type specificity of this response, we further analyzed additional epithelial cell models, as shown in Figure 8”.

      In this study, we initially identified the effects of C. albicans in colorectal cancer (CRC) cells and therefore focused on establishing the underlying mechanisms in this context. Subsequently, we extended our analysis to additional epithelial cell types to evaluate whether these effects are shared or context-dependent. We believe that this stepwise organization, from detailed mechanistic investigation in CRC cells to broader comparison across cell types, provides a logical and coherent flow for the reader. In the revised manuscript, we have further clarified this rationale in the text to improve readability and interpretation.

      (6) It would be good to use a negative fungi control instead of a PBS control for most of the experiment.

      We thank the reviewer for this valuable suggestion. We agree that a negative fungal control would further strengthen the conclusions. Unfortunately, we were unable to incorporate additional controls during the revision, while we believe that our comparative analysis across multiple fungal species (Figure 8) partially addresses this issue by demonstrating differential signaling responses. Future studies will incorporate appropriate negative fungal controls to further validate the specificity of these effects.

      (7) It is surprising that the Dectin-1 inhibitor shows a smaller effect compared with the TLR2 inhibitor. This result warrants further explanation, as Dectin-1 is a well-known receptor for C. albicans β-glucans. The authors should clarify whether this difference reflects cell type-specific expression (e.g., low Dectin-1 in CRC cells), ligand accessibility, or pathway redundancy, and discuss how it aligns with existing literature.

      We thank the reviewer for this insightful comment. We agree that the relatively modest effect of Dectin-1 inhibition compared to TLR2 inhibition warrants further consideration. In the revised manuscript, we have expanded the Discussion to address this observation. We propose several possible explanations: Firstly, the expression level of Dectin-1 is relatively low in these epithelial cancer cells, thereby limiting its functional contribution. Secondly, differences in ligand accessibility, particularly in the context of fungal cell wall architecture, may influence receptor engagement. Finally, redundancy and cross-talk among pattern recognition receptor pathways compensate for Dectin-1 inhibition. These observations highlight the context-dependent nature of host–fungal interactions.

      Reviewer #2 (Recommendations for the authors):

      All my comments that need to be addressed are given above and below:

      (1) What do a and b represent in Figure 2f? They should be removed or clearly explained in the figure legend, as they are creating confusion for the audience.

      We thank the reviewer for this comment. The letters indicate statistical groupings from post hoc multiple comparison tests. In the revised manuscript, we have added a clear explanation of this notation to the corresponding figure legends to be ease of interpretation for the reader.

      (2) In the figure legend of S3a, the authors mentioned only the Caco2 cell line, whereas in the figure, there are two more cell lines, HCT116 and SW48. The authors should revise the figure legend.

      We thank the reviewer for this comment. We have addressed this point and made the necessary corrections in the revised manuscript.

      (3) The scale bar information is missing for Figure S3b. It should be included.

      We thank the reviewer for this comment. The same scale bar was applied across all images in this panel. We have clarified this in the figure legend.

      (4) In Figure 2e, the HIF-1α level in the Caco2 cells at 24 hr time point is a lot higher compared to the level at the 12-hour time point after C. albicans infection. But in the WB quantification in Figure 2f, the level of HIF-1α is not higher when compared to 12hr. Although it is relative data based on control, authors should check this calculation again for any errors.

      We thank the reviewer for carefully examining the data. We have re-verified the quantification and confirmed that the values represent relative protein levels normalized to the corresponding controls at each time point.

      Because samples from different time points were processed and analyzed separately, direct comparison of absolute protein levels across time points is not appropriate. Therefore, relative quantification within each time point provides a more accurate and representative assessment of HIF-1α changes.

      (5) Line 125-127: This sentence should be rephrased.

      We thank the reviewer for this comment. We have revised the corresponding section to improve clarity.

      (6) PHD-mediated ubiquitination is the primary mechanism regulating HIF-1α protein stabilization. The authors should add an appropriate reference here.

      We thank the reviewer for this suggestion. An appropriate reference has been added in the revised manuscript to support this statement.

      (7) The authors claim that they observed that although the total level of HIF-1α increased, the ratio of its ubiquitinated form to total HIF-1α decreased. The authors should clearly indicate in the figure which protein band from the WB image was used for quantification from Figure S3c, which resulted in the graph presented in Figure S3d.

      We thank the reviewer for this suggestion. We have revised the figure legend to improve clarity.

      (8) In Figure 3a, there are some faint grey color lines. These graphs should be reformatted.

      We thank the reviewer for this comment. We did not observe obvious faint grey lines in the original figure; however, these artifacts may have arisen during image conversion or file transfer. To ensure optimal image quality, we have provided high-resolution vector files to improve clarity.

      (9) What do a and b in the bar graphs shown in Figure 3d,e; S4d,e,f represent?

      We thank the reviewer for this comment. The letters indicate statistical groupings from multiple comparison tests. In the revised manuscript, we have added a clear explanation in the figure legend of this notation to the corresponding figure legends.

      (10) What do a,b,c in the bar graphs shown in Figure 4c,d,h represent?

      We thank the reviewer for this comment. The letters indicate statistical groupings from multiple comparison tests. In the revised manuscript, we have added a clear explanation in the figure legend of this notation to the corresponding figure legends.

      (11) There are some faint grey lines in the bar graphs shown in Figure 4g. These lines should be removed.

      We thank the reviewer for this comment. We did not observe obvious faint grey lines in the original figure; however, these artifacts may have arisen during image conversion or file transfer. To ensure optimal image quality, we have provided high-resolution vector files to improve clarity.

      (12) Grey line below HIF-1α in the graph shown in Figure h should be removed.

      We thank the reviewer for this comment. We did not observe obvious faint grey lines in the original figure; however, these artifacts may have arisen during image conversion or file transfer. To ensure optimal image quality, we have provided high-resolution vector files to improve clarity.

      (13) The authors wrote - notably, despite treatment with AG1478, the levels of HIF-1α and c-MYC in C.albicans-infected cells remained significantly elevated compared to the uninfected control group (Figure 4b). There is no quantification for c-MYC. Statistics for HIF-1α quantification are missing. These should be added.

      We thank the reviewer for this comment. We have quantified HIF-1α levels, and the results are presented in Figure 4d, including statistical analysis.

      (14) There is no data for knockdown of MYD88, Dectin-1, and SYK as mentioned in the text lines 222-224. The authors should explain this discrepancy.

      We thank the reviewer for this important comment. MYD88, Dectin-1, and SYK are expressed at relatively low levels in HCT116 cells, and our preliminary qPCR analyses indicated that it would be technically challenging to achieve reliable and quantifiable knockdown of these targets. Nevertheless, previous studies have reported that Dectin-1 can be present on the surface of epithelial cells, suggesting that it may still contribute to fungal recognition even at low expression levels. Therefore, given the technical constraints of gene knockdown in this specific context, we reasoned that pharmacological inhibition would provide a more robust approach to suppress this pathway.

      (15) In line 227 in the results section it should be Figure S5c-e instead of Figure S5b-e. Figure S5b results do not match the results that are being explained here.

      We thank the reviewer for this comment. We have corrected the typos in the revised manuscript.

      (16) What do a,b,c in the bar graphs shown in Figure 5 a,b,i represent?

      We thank the reviewer for this comment. The letters indicate statistical groupings from multiple comparison tests. In the revised manuscript, we have added a clear explanation in the figure legend of this notation to the corresponding figure legends.

      (17) Was the experiment in Figure 5e done in triplicate? If not, it should be done in triplicate and quantified. The scale bar information is missing for IF images shown in Figure 5e. It should be added.

      We thank the reviewer for this comment. The experiments were independently repeated for three times, and the quantification shown in Figure 5g represents the combined results from these biological replicates. The same scale bar was applied across all images in this panel. We have clarified this in the figure legend.

      (18) Lines 273-274 in the results section: Als3 and Hwp1 are known to be involved in the adhesion of C. albicans to epithelial cells, while Ece1 encodes the virulence factor candidalysin. References should be added.

      We thank the reviewer for this suggestion. We have added a reference in the revised manuscript to support this statement.

      (19) What do a and b in the bar graphs shown in Figures 6 f,h,r represent? Since these letters are confusing and are present in several figures, they should be either deleted or clearly explained in the figure legends or text.

      We thank the reviewer for this comment. The letters indicate statistical groupings from multiple comparison tests. In the revised manuscript, we have added a clear explanation in the figure legend of this notation to the corresponding figure legends to be ease of interpretation for the reader.

      (20) What do a,b, and c in the bar graphs shown in Figure S8 b represent?

      We thank the reviewer for this comment. The letters indicate statistical groupings from multiple comparison tests. In the revised manuscript, we have added a clear explanation in the figure legend to of this notation to the corresponding figure legends to be ease of interpretation for the reader.

      (21) Scale bar should be added in Figure S9.

      We thank the reviewer for these helpful comments. We have addressed this point and made the necessary corrections in the revised manuscript.

      (22) What do a and b, in the bar graphs shown in Figure S11 represent?

      We thank the reviewer for this comment. The letters indicate statistical groupings from post hoc multiple comparison tests. In the revised manuscript, we have added a clear explanation in the figure legend of this notation to the corresponding figure legends to be ease of interpretation for the reader.

      (23) Were the organoids used in this paper characterized? If yes, how? Also, it should be mentioned in the appropriate section in the manuscript.

      The organoids are not characterized; they are cultured using patients’ samples according to our previous protocols (He et al. Cell Stem Cell 2022).

    1. eLife Assessment

      This paper presents a collection of analyses relating structure and function in the whole-brain Drosophila EM connectome and whole-brain calcium imaging data. The linkage of detailed anatomical structure with population activity is of broad interest in circuit neuroscience in light of increasingly detailed brain maps, but the methods used made the evidence inadequate due to a lack of consideration of neurotransmitter identity and technical issues with the network analysis. The conclusions are useful for specific network observations, but a more thorough analysis of the anatomical and functional data is needed to support the overall claims.

    2. Reviewer #1 (Public review):

      In this revision the authors address some of the points, but they also make some technical errors. My overall view of the manuscript hasn't changed since the original evaluation.

      Previously I noted that SC sparsity presents an issue when comparing to full FC matrices. They authors misinterpreted the Honey et al paper. They resampled ALL entries of the SC matrix (including zeros) from a Gaussian distribution. In effect, this assigns zeros small (but uniform) weights. In Honey et al, the authors resampled only existing edge weights from a gaussian distribution (the rationale at the time was that there might be pushback against the extremely heavy-tailed edge weight distribution). In other words, the zeros are still zeros following this resampling procedure.

      That said, I agree that the log transform is likely useful or necessary given edge weight distributions.

      In short, I still think that the approach is interesting and meritorious, I just don't think the execution is correct.

    3. Reviewer #3 (Public review):

      Summary:

      In this manuscript, Okuno et al. re-analyze whole-brain imaging data collected in another paper (Brezovec et al., 2024) in the context of the two currently available Drosophila connectome datasets: the partial "FlyEM" (hemibrain) dataset (Scheffer et al., 2020) and the whole-brain "FlyWire" dataset (Dorkenwald et al., 2024). They apply existing fMRI signal processing algorithms to the fly imaging data and compute function-structure correlations across a variety of post-processing parameters (noise reduction methods, ROI size), demonstrating an inverse relationship between ROI size and FC-SC correlation. The authors go on to look at structural connectivity amongst more polarized or less polarized neurons, and suggest that stronger FC-SC correlations are driven by more polarized neurons.

      Strengths:

      (1) The result that larger mesoscale ROIs have higher correlation with structural data is interesting. This has been previously discussed in Drosophila in Turner et al., 2021, but here it is quantified more extensively.

      (2) The quantification of neuron polarization (PPSSI) as applied to these structural data is a promising approach for quantifying differences in spatial synapse distribution. The revision now uses morphological cable length for some analyses rather than straight-line distance, which improves the realism and interpretability of these results.

      Weaknesses:

      One should not score noise/nuisance removal methods solely by their impact on FC-SC correlation values, because we do not know a priori that direct structural connections correspond with strong functional correlations. In fact, work in C. elegans, where we have access to both a connectome and neuron-resolution functional data, suggests that this relationship is weak (Yemini et al., 2021; Randi et al., 2023). Similarly, I don't think it's appropriate to tune the confidence scores on the EM datasets using FC-SC correlations as an output metric. While it is likely that some FC-SC relationship does exist at large scales, it does not in my view justify use of this metric for evaluating noise removal methods, since such methods may inadvertently remove real neural correlates. This concern remains unaddressed in the revision.

      Any discussion of FC-SC comparisons should include an analysis of excitatory/inhibitory neurotransmitters, which are available in the fly connectome dataset. The authors examine the ratios of input and output neurotransmitters in different defined regions. However, I think it would be more useful to integrate the neurotransmitter information more fully into the assessment of SC, for instance: examining the signed weight (excitatory - inhibitory), or by examining the excitatory and inhibitory networks separately.

      Comparisons between fly and human MRI data are also premature here. Firstly, the fly connectomes, which are derived from neuron-scale EM reconstructions, are a qualitatively different kind of data from human connectomes, which are derived from DSI imaging of large-scale tracts. Likewise, calcium data and fMRI data are very different functional data acquisition methods-the fact that similar processing steps can be used on time-series data does not make them surprisingly similar, and does not in my view constitute evidence of "similar design concepts."

      The comparison of FlyEM/FlyWire connectomes concludes that differences are more likely a result of data processing than of inter-individual variability. If this is the case, the title should not claim that the manuscript covers individual variability.<br /> The analysis of the wedge-AVLP neuron strikes me as highly speculative, given that the alignment precision between the connectome and the functional data is around 5 microns (Brezovec* et al, PNAS 2024).

    4. Author response:

      The following is the authors’ response to the original reviews.

      Public Reviews:

      Reviewer #1 (Public review):

      Summary:

      In this paper, the authors analyze connectome data from Drosophila and compare the physical wiring with functional connectivity estimated from calcium imaging data. They quantify structure-function relationships as a correlation of the two connectivity modalities. They report correlations roughly comparable to what has been described in the literature on sc/fc relationships in mammalian connectome data at the meso-scale. They then repeat their analysis, focusing on segregated versus unsegregated synapses. They derive separate connectomes using one or the other class of synapse. They show differential contributions to the sc/fc relationships by segregated versus unsegregated synapses.

      Strengths:

      There is nice synthesis of multimodal imaging data (Ca and EM data from flies and meso-scale data from human and marmoset).

      Thank you very much for your comments.

      Weaknesses:

      (1) The paper is written in an unusual way. The introduction intermingles results with background, making it hard to figure out what precisely is being tested.

      Thank you for pointing this out. We have revised the introduction to make it more concise.

      (2) There are also major methodological gaps. Though the mammalian connectomes are used as a point of reference, no descriptions of their origins or processing are included.

      The reanalysis of marmoset data is presented in Ext. Data Figure. However, as pointed out by other reviewers, the data was obtained in [10], and the processing is also described in [10]. Therefore, we have revised the caption and removed the Ethics Declaration.

      (3) A major weakness stems from the actual calculation of the sc/fc correlation. In general, SC is sparse. In the case of the EM connectomes, it is *exceptionally* sparse (most neural elements are not connected to one another). The authors calculated sc/fc coupling by correlating the off-diagonal elements of sc (the logarithm of its edge weights) and fc matrices with one another. The logarithmic transformation yields a value of infinity for all zero entries. The authors simply impute these elements with 0. This makes no sense and, depending on whether these zero elements are distributed systematically versus uniformly random, could either inflate or deflate the sc/fc correlations. Care must be taken here.

      Thank you for pointing this out. As you mentioned, the SC matrix becomes increasingly sparse as the number of ROIs increases (Ext. Data Fig.2-2b). In contrast, the FC matrix may contain values even when there are no direct connections between ROIs (indirect connections). We conducted an investigation into this issue. To deal with this issue, Honey et al. (2009) [6] resampled the elements of the SC matrix in rank order using a Gaussian distribution and calculated the FC-SC correlation between this resampled SC and FC.

      Ext. Data Fig.2-2a shows a comparison between resampled SC (Honey et al.’s method) and log-scaled SC (our method). Up to 200 ROIs, the proportion of SC matrix elements that are zero is less than 10% (Ext. Data Fig.2-2b), and there is little zero replacement of logarithmic elements. In this situation, replacing with Gaussian arithmetic tends to increase the correlation coefficient (Ext. Data Fig.2-2a). On the other hand, with 10,000 ROIs, where sparsity is extremely high, the proportion of SC matrix elements that are zero exceeds 70%. In this situation, 70-80% of the zeros are randomly assigned from the smaller end of the Gaussian distribution, which causes a lowering of the correlation coefficient (Ext. Data Fig.2-2a, c, d). For these reasons, we believe that log-scaled SC has less bias than resampling with a Gaussian distribution, and conclude that using log-scaled SC as is in this paper is reasonable. Log-scaled SC has also been used in previous studies [9, 68] and is considered a simple method for showing the relationship (correlation) between FC and SC. To show that we have considered this issue, Ext. Data Fig.2-2 has been added to the manuscript.

      (4) Further, in constructing the segregated versus unsegregated connectomes, they use absolute thresholds for collecting synapses. It is unclear, however, whether similar numbers of synapses were included in both matrices. If the number is different, that might explain the differential relationship with fc; one matrix has more non-zero entries (and as noted earlier, those zero entries are problematic).

      Author response image 1.

      a, Sparsity rate histogram of SC matrix with cPPSSI (0-0.1) and subsampled null SC matrices corresponding Fig.4e. Red line indicates sparsity rate of SC matrix with cPPSSI (0-0.1). b, Sparsity rate histogram of SC matrix with cPPSSI (0.9-1) and subsampled null SC matrices corresponding Fig.4f. c, Sparsity rate histogram of SC matrix with reciprocal synapse (≤2𝜇𝑚) and subsampled null SC matrices corresponding Fig.4i.
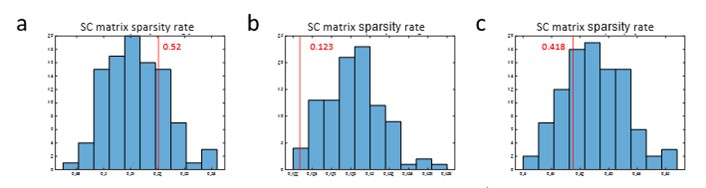
      Thank you for pointing this out. The number of synaptic connections in the SC matrix shows a large difference between those extracted from cPPSSI (0-0.1) and cPPSSI (0.9-1) (Fig. 4e, f). However, when null SC matrices (99) were generated for each and compared with the cPPSSI-extracted matrices, the FC-SC correlation was significantly higher or lower. At this point, since the sparsity rates of the null SC matrices differed a lot from that of the SC matrices extracted by cPPSSI, we regenerated the null SC matrices in Fig. 4e and 4i. As shown in Author response image 1, we ensured that the extracted SCs (red lines) fit within the null-generated matrices. This figure was added to Ext. Data Fig.4-5, and the main text was also revised. The sparsity rates are 0.52 for cPPSSI (0-0.1) and 0.123 for cPPSSI (0.9-1). Since both cases involve comparisons with null SC matrices that have closely similar sparsity rates, we believe comparison using log-scaled SC is appropriate.

      (5) There was also considerable text (in the results) describing the processing of the Ca data. In this section, the authors frequently refer to some pipelines as "better" or "worse" (more or less effective). But it is not clear what measures they adopted to assess the effectiveness of a pipeline.

      Detailed registration flow of Ca data is described in “Preprocessing of D. melanogaster calcium imaging data” in Materials and Methods section (Ext. Data Fig. 1-1a). Then, optimal nuisance factor removal methods and smoothing size were investigated. We used both correlation analysis (FC-SC correlation) and ROC curve analysis (FC-SC detection). Since signals are assumed to be transmitted between regions based on SC, when SC is treated as the ground truth, we considered a pipeline with a FC-SC higher similarity and higher detection to be better. We updated the Results section to include this point.

      Reviewer #2 (Public review):

      Summary:

      Okuno et al. investigate the structure-function relationship in the fruit fly Drosophila melanogaster. To do so, they combine published data from two recent synapse-level connectomes ("hemibrain" and "FlyWire") with a dataset comprising functional whole-brain calcium imaging and behavioural data. First, they investigate the applicability of fMRI pre-processing techniques on data from calcium imaging. They then cross-correlate this pre-processed functional data with structural data extracted from the connectomes, including a comparison to humans. The authors proceed to compare the two connectomes and find significant differences, which they attribute to differences in the accuracy of the synapse detections. Next, they present a novel algorithm to quantify whether neurons are segregated (pre- and postsynapses are spatially separate) or unsegregated (pre- and postsynapses are mixed). Using this approach, they find that unsegregated neurons may contribute more to function than segregated neurons. Applying a general linear model to the functional dataset suggests that activity in two brain areas (Wedge and AVLP) is suppressed during walking. The authors identify a GABAergic neuron in the connectome that could be responsible for this effect and suggest it may provide feedback to the fly's "compass" in the central complex.

      Strengths:

      The study tackles a relevant question in connectomics by exploring the relationship between structural and functional connectivity in the Drosophila brain. The authors apply a range of established and adapted analytical methods, including fMRI-style preprocessing and a novel synaptic segregation index. The effort to integrate multiple datasets and to compare across species reflects a broad and methodical approach.

      Thank you very much for your comments.

      Weaknesses:

      The manuscript would benefit from a clearer overarching narrative to unify the various analyses, which currently appear somewhat disjointed. While the technical methods are extensive, the writing is often convoluted and lacks crucial details, making it difficult to follow the logic and interpret key findings. Additionally, the conclusions are relatively incremental and lack a compelling conceptual advance, limiting the overall impact of the work.

      (1) The introduction currently contains a number of findings and conclusions that would be better placed in the results and discussion to clearly delineate past findings from new results and speculations.

      Thank you for pointing this out. We have revised the introduction to make it more concise.

      (2) The narrative would benefit greatly from some clear statements along the lines of "we wanted to find out X, therefore we did Y".

      Thank you for pointing this out. In many biology papers, the problem is clear, but as you say, this paper starts by comparing the very fine SC and FC of flies, which makes the problem unclear and the results sporadic. We have revised the structure of the introduction.

      (3) More concise terminology would be helpful. For example, the connectomes are currently referred to as either "hemibrain", "FlyEM", "whole-brain", or "FlyWire".

      Thank you for pointing this out. We revised the manuscript to separate "hemibrain" and "whole-brain" from "connectome." "hemibrain" and "whole-brain" retain their original meanings.

      (4) The abstract claims "a new, more robust method to quantify the degree of pre- and post-synaptic segregation". However, the study fails to provide evidence that this method is indeed more robust than existing methods.

      We apologize, but this information was not included in the main figures or the Results section. It is presented in the Methods section and Ext. Data Fig. 4-1i, j. We moved related texts from the Methods to the Results section.

      (5) The authors define unsegregated neurons as having mixed pre- and postsynapses in the same space. However, this ignores the neurons' topology: a neuron can exhibit a clearly defined dendrite with (mostly) postsynapses and a clearly defined axon with (mostly) presynapses, which then occupy the same space. This is different from genuinely unsegregated neurons with no distinct dendritic and axonal compartments, such as CT1.

      Thank you for pointing this out. Regarding this point, we think it is difficult to discuss the neuron’s topology in this paper. We defined PPSSI and demonstrated only that unsegregated neurons with mixed pre- and post-synapses are scattered throughout the brain (Ext. Data Fig. 4-2e). Further research is needed to determine the relationship with morphology in individual neurons.

      One possibility is that inhibitory, non-spiking unsegregated neurons, such as CT1 amacrine cell [24, 27, 28] or interneurons in Antennal Lobe [29], may be widely used throughout the brain (WAGN is also a candidate for this). Grimes et al. [34] mentioned “The retina is a beautiful example of a neural network that optimizes signal processing capacity while minimizing cellular cost.” To maintain the signal dynamic range, A17 amacrine cells must optimize the processing units and wiring costs. If one unit equaled one cell, an enormous number of cell bodies would be required, reducing the number of processing units per volume and increasing the energy cost during development. To optimize this, they proposed arranging units capable of parallel processing within a single cell, thereby maximizing the processing units and wiring costs per volume.

      Signal bursts might also occur in the central nervous system (CNS), in which case CNS neurons also require dynamic range adjustment. The concept of optimizing processing units per volume is highly compelling and is thought to apply not only to the retina but throughout the entire brain.

      (6) It is not entirely clear where the marmoset dataset originates from. Was it generated for this study? If not, why is there a note in the Ethics Declaration?

      Marmoset data were reported in [10] and it was not generated for this study. We therefore removed the Ethics Declaration.

      (7) On the differences between hemibrain and FlyWire: What is the "18.8 million post-synapses" for FlyWire referring to? The (thresholded) FlyWire synapse table has 130M connections (=postsynapses). Subsetting that synapse cloud to the hemibrain volume still gives ~47M synapses. Further subsetting to only connections between proofread neurons inside the hemibrain volume gives 19.4M - perhaps the authors did something like that? Similarly, the hemibrain synapse table contains 64M postsynapses. Do the 21M "FlyEM" post-synapses refer to proofread neurons only? If the authors indeed used only (post-)synapses from proofread neurons, they need to make that explicit in results and methods, and account for differences in reconstruction status when making any comparisons. For example, the mushroom body in the hemibrain got a lot more attention than in FlyWire, which would explain the differences reported here. For that reason, connection weights are often expressed as, e.g., a fraction of the target's inputs instead of the total number of synapses when comparing connectivity across connectomic datasets. Furthermore, in Figure 3b, it looks like the FlyWire synapse cloud was not trimmed to the exact hemibrain boundaries: for example, the trimmed FlyWire synapse cloud seems to extend further into the optic lobes than the hemibrain volume does.

      Thank you for pointing this out. FlyEM connectome data version 1.2 was downloaded and used as described in Data Availability. This data is provided in the format defined by https://neuprint.janelia.org/public/neuprintuserguide.pdf, and we extracted neurons and synapses from it.

      The entire segmentation body is 28M segmentations, and there were 99,644 Traced proofread neurons. In addition, there were 73M (pre- or post- alone) synapses, 87M records in synapseSets and 128M records in synapseSet-to-synapse. When we extracted post-synapses between Traced neurons, the total number was 21.4M (i.e., connections from Traced neurons to other body fragments like Orphans were excluded).

      The FlyWire dataset (v783) was downloaded from the flywire codex and Zenodo. This dataset contained 139,255 proofread neurons and 54.5M (pair of pre- and post-) synapses, as described in Dorkenwald et al. [13], with 18.8M post-synapses in the regions corresponding to the hemibrain primary ROIs. We have updated the Results and Methods sections by taking into account your comment.

      In Fig. 3b, these images were created using a mask that extended the boundaries of the hemibrain primary ROIs, making the boundaries unclear. Therefore, we corrected the images in Fig. 3b by adjusting the mask so that the boundaries were properly aligned.

      Reviewer #3 (Public review):

      Summary:

      In this manuscript, Okuno et al. re-analyze whole-brain imaging data collected in another paper (Brezovec et al., 2024) in the context of the two currently available Drosophila connectome datasets: the partial "FlyEM" (hemibrain) dataset (Scheffer et al., 2020) and the whole-brain "FlyWire" dataset (Dorkenwald et al., 2024). They apply existing fMRI signal processing algorithms to the fly imaging data and compute function-structure correlations across a variety of post-processing parameters (noise reduction methods, ROI size), demonstrating an inverse relationship between ROI size and FC-SC correlation. The authors go on to look at structural connectivity amongst more polarized or less polarized neurons, and suggest that stronger FC-SC correlations are driven by more polarized neurons.

      Strengths:

      (1) The result that larger mesoscale ROIs have a higher correlation with structural data is interesting. This has been previously discussed in Drosophila in Turner et al., 2021, but here it is quantified more extensively.

      (2) The quantification of neuron polarization (PPSSI) as applied to these structural data is a promising approach for quantifying differences in spatial synapse distribution.

      Thank you very much for your comments.

      Weaknesses:

      One should not score noise/nuisance removal methods solely by their impact on FC-SC correlation values, because we do not know a priori that direct structural connections correspond with strong functional correlations. In fact, work in C. elegans, where we have access to both a connectome and neuron-resolution functional data, suggests that this relationship is weak (Yemini et al., 2021; Randi et al., 2023). Similarly, I don't think it's appropriate to tune the confidence scores on the EM datasets using FC-SC correlations as an output metric.

      Thank you for pointing this out. We believe that the FC in C. elegans uses cell body dynamics, which is different from the synaptic population dynamics in a region of fly calcium imaging or fMRI data (BOLD [Blood Oxygenation Level Dependent] signal). The BOLD signal in a region is thought to correspond to the neurovascular coupling of synaptic population dynamics. Furthermore, compartmentalization of a neuron has been observed in C. elegans (Hendricks et al., 2012)*, showing different dynamics across neuron compartments. Thus, the dynamics of the cell body and the dynamics of the synaptic population in other regions are different in C. elegans. We speculate that there is some relationship between FC-SC between regions, because the FC-SC correlation in the fly brain reached r=0.87 with 20 ROIs (Fig. 2d). We believe that this result is different from the cell body dynamics in C. elegans.

      *Hendricks et al., “Compartmentalized calcium dynamics in a C. elegans interneuron encode head movement,” Nature 487, 99-103 (2012)

      Any discussion of FC-SC comparisons should include an analysis of excitatory/inhibitory neurotransmitters, which are available in the fly connectome dataset. However, here the authors do not perform any analyses with neurotransmitter information.

      A comparison between FC-SC and neurotransmitter has been written in the Results section. We investigated the ratios of neurotransmitter input (ExtFig.3-2a) and output (Fig. 3f) in each region, and investigated the relationship between this ratio and FC-SC correlation in each neurotransmitter. This revealed significant correlations for acetylcholine (r=0.39, p=0.0013) and GABA (r=-0.25, p=0.046) (Fig. 3g). That is, the higher the percentage of excitatory connections, the higher the FC-SC correlation; conversely, the higher the percentage of inhibitory connections, the lower the FC-SC correlation.

      Comparisons between fly and human MRI data are also premature here. Firstly, the fly connectomes, which are derived from neuron-scale EM reconstructions, are a qualitatively different kind of data from human connectomes, which are derived from DSI imaging of large-scale tracts. Likewise, calcium data and fMRI data are very different functional data acquisition methods-the fact that similar processing steps can be used on time-series data does not make them surprisingly similar, and does not in my view, constitute evidence of "similar design concepts."

      Thank you for pointing this out. As you say, fiber bundles of DTI and EM connectome are completely different. Nevertheless, the fact remains that the FC-SC correlation is high in both the fly and human brains. As mentioned above, both regional signal from calcium imaging and BOLD signal from fMRI are based on synaptic population dynamics. It was estimated that 43% of the energy consumption in the gray matter is due to synaptic activity of neurons (Harris et al., 2012), and the BOLD signal fluctuates greatly due to this activity. Furthermore, synaptic activity is thought to be much faster than the activity of microglia and astrocytes, so the FC of fMRI is thought to mainly capture the regional correlation of synaptic activity. In other words, in both flies and humans, although the size is different, the pre-synaptic activity in one region and the pre-synaptic activity in another region via neural fibers are being compared in a common manner in the form of FC-SC.

      In addition, non-spiking unsegregated neuron exists in mammals as well, such as the amacrine cell of the retina [34], and even pyramidal cells in the neocortex show local mixtures of pre- and post-synapses (Ext. Data Fig.1-2). If a functional unit is realized by local compartment in a neuron as mentioned in [34], the fly will be a powerful model organism for investigating them, and its functional “design concept” may also be useful for mammals.

      Harris et al., “The Energetics of CNS White Matter,” J. Neurosci., 2012, 32 (1) 356-371

      The comparison of FlyEM/FlyWire connectomes concludes that differences are more likely a result of data processing than of inter-individual variability. If this is the case, the title should not claim that the manuscript covers individual variability.

      Thank you for pointing this out. Inter-individual variability is relevant to both SC and FC. Regarding SC, we think the difference in the number of synapses between the two individuals is due to the difference in detection power caused by differences in the resolution of the electron microscope. Regarding FC, as stated in the Results section, “Spatial smoothing is useful for absorbing inter-individual variability and conducting second-level group analysis.” Increasing the smoothing size improves the correlation and AUC between group-averaged FC and SC, indicating the presence of inter-individual variability in FC (Fig. 2b, Ext. Data Fig. 2-1b, especially when the number of ROIs is high). We added this text in the Introduction and Results sections to address your comment.

      The analysis of the wedge-AVLP neuron strikes me as highly speculative, given that the alignment precision between the connectome and the functional data is around 5 microns (Brezovec* et al, PNAS 2024).

      As you mentioned, functional analysis has limitations in spatial resolution. In particular, the resolution in the Z axis is 4 μm, which is 1,000 times lower than the resolution of electron microscopy data. This makes it difficult to perfectly match synaptic activity to a synapse in the structural data. Furthermore, spatial smoothing is applied to functional images to absorb inter-individual variability, which can only provide blurred results for group analyses. These are considered limitations of the methods used in fMRI analysis. Despite these limitations, we applied GLM analysis to walking behavior and observed clear inactivity region. This region roughly corresponds to the synaptic cloud of a neuron named WAGN (Fig.5b and c). This neuron also connects to WPNb and ANs in the connectome data, suggesting a possibility that it is related to walking behavior. This is merely a screening reference; therefore, further biological experimentation is needed to pursue this topic.

      Recommendations for the authors:

      Reviewing Editor Comments:

      We should emphasize that the reviewers encouraged revision and resubmission. If the reviewers' comments were to be addressed in full in a revision to strengthen the evidence, this would significantly increase the impact of the findings and the relevance of the work to the fly neuroscience community and to the connectomics field more broadly.

      Thank you very much for your comments.

      Major Issues:

      (1) Structural correlation and functional correlation measure very different aspects of network data, yet a simple correlation between the off-diagonal elements of the two is used. It would be expected that this would not be directly proportional, and it's not clear why this would be a sensible measure. The authors need a better solution for dealing with the zero entries in the SC matrix. Replacing the infinities with zeros and then running the linear regression to get an SC/FC relationship is not appropriate. Even with a better metric, given that both intuition and other studies have shown a weak correlation between FC and SC, using FC-SC correlation as a quality descriptor for other properties is not proper. Furthermore, the authors don't account for neurotransmitter identity in the structural data, which would have strong implications for the relationships between FC and SC.

      Thank you for pointing this out. To investigate this issue we compared the FC-SC correlation between the Gaussian resampled SC approach used in Honey et al. (2009) [6] and the log-scaled SC used in this study (Ext. Data Fig.2-2a). With a small number of ROIs, the sparsity rate is low (Ext. Data Fig.2-2b), resulting in less zero replacement. Therefore, log-scaled SC is likely to more accurately represent the FC-SC relationship. Furthermore, with a large number of ROIs, the sparsity rate exceeds 70%, and Gaussian resampled SC randomly assigns a large number of zero elements from the smaller end of the distribution. This tends to lower the correlation (Ext. Data Fig.2-2c, d), suggesting that log-scaled SC provides fairer results. Log-scaled SC has been used in previous studies [9, 68] and is considered a simple method for showing the relationship (correlation) between FC and SC. When zero replacement is undesirable, using connection weights (the proportion of connections originating from the target region among all connections) can yield results similar to log-scaled SC (data not shown). It may be possible to compare various methods, but this is outside the scope of this study and requires further research.

      The C. elegans studies presented by Reviewer #3 showed a weak correlation between FC and SC. However, C. elegans neurons do not fire and exhibited different calcium fluctuations depending on the region (Hendricks et al., 2012). This suggested that the cell body and various synaptic terminal regions have different FCs, which is consistent with the objective of our study (neuronal compartmentalization). If a functional unit is locally composed of multiple neurons and synapses, it is expected that SC and FC from that region will show a strong relationship. Larger regions would include multiple functional units, and a relationship between SC and FC would also be found, which is consistent with the results of our study. The C. elegans study compared FC of the cell body (a region) with SC of whole cell (not a same region), which would be inconsistent.

      (2) Synaptic segregation on neurons can be topologically present even if pre- and post-synaptic synapses are present in similar regions of space, as an axon branch and dendrite branch can overlap in space but remain distinct along the arbor. The authors emphasize a region-based definition that does not reflect cellular anatomy. Moreover, the authors do not make an argument for their claim of better robustness of their new synaptic segregation measures.

      Author response image 2.

      Distance calculation for DBSCAN. a, Example synapse pair (black dot) of distance calculation. Red line shows the straight-line distance, and green line shows the morphology-based distance. DBSCAN will places two synapses in the same cluster based on straight-line distance, but they will be in different clusters based on the morphology-based distance.
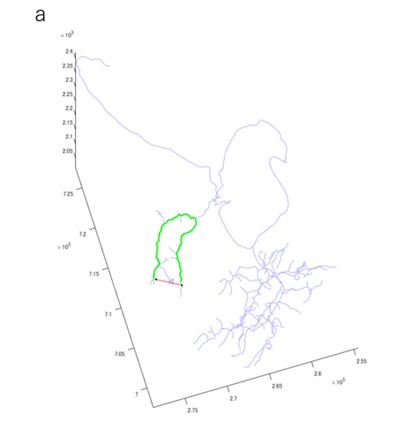
      Thank you for pointing this out. We changed from using DBSCAN based on the straight-line distance between synapses to DBSCAN based on the morphology-based distance via the branch nearest to the synapse (Author response image 2a). This resulted in a synaptic segregation measure that incorporates cellular anatomy. We updated all related figures, such as Figure.4, Ext. Data Figure.4-1, 4-2, 4-3, 4-4, Figure.5h. Also, we updated related text in the Results and Methods sections.

      (3) Reviewers found the overall structure of the paper is difficult to follow, with sections appearing disjoint and the aims of different sections not well described. This extended to the paper organization as well, with the introduction not clearly setting up the questions and being distinct from the results. The manuscript would benefit from a clearer overarching narrative to unify the various analyses.

      Thank you for pointing this out. We have revised the introduction to make it more concise.

      (4) Similarly, there are several descriptions of data and analysis that are unclear or lacking, including the source of the marmoset data and how the FlyWire synapse was subsampled.

      As pointed out by other reviewers, the marmoset data was obtained in [10], and the processing is also described in [10]. Therefore, we have revised the caption and removed the Ethics Declaration.

      We have updated the Results and Methods sections regarding the extraction of "traced" neurons and synapses in FlyEM connectome data, and the extraction of post-synapses in hemibrain primary ROIs in FlyWire connectome data.

      (5) Comparisons between FlyWire and Hemibrain have shown many similarities and some clear examples of inter-individual variability. There was concern that technical decisions with handling FlyWire synapse sampling were responsible for some of the differences observed between the datasets.

      In response to Reviewer #2's question, we answered that both FlyEM and FlyWire use proofread neurons and their connecting synapses. We also updated Fig. 3b and the Results and Methods sections.

      Reviewer #1 (Recommendations for the authors):

      The paper is written in an unusual way. It would be helpful if the introduction read more like a standard introduction. Describe the relevant background that the reader needs to understand the results that come later. Frame the experiments in terms of a question or hypothesis. Results should be relegated to the results section (or, if you like, a final paragraph that summarizes the findings). They should not be intermingled throughout the introduction.

      Thank you for pointing this out. We have revised the introduction to make it more concise.

      The authors must be more attentive in terms of how they construct the segregated/unsegregated connectomes. I suggest exploring various thresholds/bins, but also considering proportionality thresholds that match the number of synapses.

      Thank you for pointing this out. As pointed out by other reviewers, we changed from using DBSCAN based on the straight-line distance between synapses to DBSCAN based on the morphology-based distance via the branch nearest to the synapse (Author response image 2a). This resulted in a synaptic segregation measure that incorporates cellular anatomy.

      We also considered about the sparsity rates of the SC matrices. Since the sparsity rates of the null SC matrices differed a lot from that of the SC matrices extracted by cPPSSI, we regenerated the null SC matrices, shown in Fig. 4e and 4i. As shown in Author response image 1, we ensured that the extracted SCs fit within the null-generated matrices. This figure was added to Ext. Data Fig.4-5, and the main text was also revised.

      The authors need a better solution for dealing with the zero entries in the sc matrix. Replacing the infinities with zeros and then running the linear regression to get an sc/fc relationship is not appropriate.

      Thank you for pointing this out. To investigate this issue, as pointed out by other reviewers, we compared the FC-SC correlation between the Gaussian resampled SC approach used in Honey et al. (2009) [6] and the log-scaled SC used in this study (Ext. Data Fig.2-2a). With a small number of ROIs, the sparsity rate was low (Ext. Data Fig.2-2b), resulting in less zero replacement. Therefore, log-scaled SC is likely to more accurately represent the relationship. Furthermore, with a large number of ROIs, the sparsity rate exceeds 70%, and resampled SC randomly assigns a large number of zero elements from the smaller end of the distribution. This tends to lower the correlation (Ext. Data Fig.2-2c, d), suggesting that log-scaled SC provides fairer results. Using connection weights (the proportion of connections originating from the target region among all connections) can yield results similar to log-scaled SC (data not shown), because this matrix can also be very sparse. It may be possible to compare various methods, but this is outside the scope of this study and requires further research.

      It would be useful to include a description of where the human/marmoset datasets came from. It would be useful to describe the processing of those datasets and whether they're comparable to how the fly data was processed.

      As pointed out by other reviewers, the marmoset data was obtained in [10], and the processing is also described in [10]. Therefore, we have revised the caption and removed the Ethics Declaration.

      The pre-processing of fly calcium imaging data is described in the Methods section. Unfortunately, this processing method is not comparable to that used in humans/marmosets as it was highly customized.

      The authors report sc/fc correlations for the human/marmoset datasets based on single papers. However, in the human case, especially, the strength of sc/fc correlations is highly variable. Not just based on number/size of parcels, but based on amount of data, processing pipeline, single-subject versus group averaged (incidentally, single-subject sc/fc is ‘much’* lower than group-averaged, which has big implications for this study, where the fly datasets are, in essence, N=1 studies).

      Yes, there are numerous FC-SC correlation studies. We think Honey et al. (2009) [6] to be a highly representative study. It showed r = 0.39 to 0.48 for individual participants in 998 ROIs, and r = 0.36 for averaged one, but it increased r = 0.53 excluding absent or inconsistent structural connections. So, single-subject may not be much lower than group-averaged. Since the SC for a fly is an N=1 study, the FC-SC correlation for the same individual cannot be calculated. We think further research will be necessary.

      Reviewer #2 (Recommendations for the authors):

      Abstract:

      Please introduce the term "ROI"

      Thank you for pointing this out. We have revised the Abstract.

      Introduction:

      (1) On a general note: the introduction reads like an extended abstract (i.e., a mix of results and discussion).

      Thank you for pointing this out. We have revised the introduction to make it more concise.

      (2) Line 43: Does this mean FC-SC correlation is higher in flies but not significantly so? Please clarify.

      We performed Mann-Whitney U test and it was not significant (p= 0.2667).

      (3) Line 51: The "confidence" score does not indicate the degree of synaptic detection.

      In the NeuPrint user guide, https://neuprint.janelia.org/public/neuprintuserguide.pdf it states “confidence - The certainty that an annotated synapse is correct and valid.” Since “degree of synaptic detection” may be difficult to understand, we changed it to “certainty of an annotated synapse.”

      (4) Line 59-61: This statement needs refining: post-synapses do not "receive" neurotransmitters, action potentials aren't conducted along nerve fibres.

      We changed “receive” to “sense.” About “action potentials,” we changed “conduct an action potential” to “graded potentials”, and removed “along nerve fibers.”

      (5) Line 61: calcium activity as detected via GCaMP correlates with (electric) neuronal activity - please cite relevant GCaMP literature here.

      We added F. Helmchen and J. Waters, "Ca2+ imaging in the mammalian brain in vivo," Eur J Pharmacol., vol. 447, pp. 119-129, 2002.

      (6) Line 76: "interconnected" is rather vague; just say "many Drosophila neurons are reciprocally connected".

      Thank you for pointing this out. Lin et al., (2024) showed motif analysis and there are many reciprocal, three-node and rich-club connections. However, introduction was updated and this sentence was removed.

      (7) Line 77: comparing unsegregated vs reciprocal synapses is overly simplistic; these are separate features of the same object - i.e., a synapse can be reciprocal and at the same time be segregated in the presynaptic neuron but unsegregated in the postsynaptic neuron.

      Thank you for pointing this out. As you say, the relationship is complicated. In this paper, we are concerned with the degree of segregation of pre- and post-synapses, and we are looking at the segregation within a neuron. In this case, nearby reciprocal synapses (<=2 μm) are included in unsegregated synapses. We have made a correction to the sentence.

      (8) Line 79: I don't understand how we get from unsegregated synapses to local activity.

      Retinal amacrine cells have extensive unsegregated synapses, which provide local feedback inhibition of burst inputs [34]. We changed the text around these descriptions.

      (9) Line 80: What does "more essential function" mean?

      We removed this sentence.

      (10) Line 85: "as shown earlier": Is this based on results in this study or prior work? See also the general above note on mixing results/discussion into the introduction.

      Thank you for pointing this out. We have revised the introduction to make it more concise.

      (11) Line 85-87: I don't understand how the applicability of certain fMRI analysis methods in turn means that functional activity is locally compartmentalized. Did you mean to say something along the lines of "we applied common fMRI methods which showed functional activity is locally compartmentalized"?

      These sentences discuss the commonality between fMRI (BOLD signal) and calcium signal, which both represent presynaptic population dynamics within a local region (voxel). Furthermore, unsegregated synapses are widespread throughout the fly brain (Ext. Data Fig.4-2) and can also be observed in human pyramidal cells (Ext. Data Fig.1-2). Unsegregated synapses suggest local compartment activity [33, 34, 39, 40] and contribute more to functional activity (Fig.4b). Therefore, the similar trend in FC-SC correlation (Fig.2d) between humans and flies suggest that both species exhibit localized compartmental activity via unsegregated synapses throughout the entire brain.

      Because these sentences contain many conclusions, they have been moved from the Introduction to the Discussion section.

      (12) Line 87: Please provide a reference for "common among various species".

      Thank you for pointing this out. Because these sentences contain many conclusions, they have been moved from the Introduction to the Discussion section.

      Results:

      (1) Line 91-92:

      (a) Please explain where the calcium data came from, how it was generated, etc.

      We added the data source and a reference (Brezovec et al. [14]).

      (b) Please clarify: what registration method?

      This is not simple. Please see the Methods section and Ext. Data Fig.1-1. This is also indicated in the text.

      (c) "calcium image" → "calcium image data"?

      We changed “calcium image” to “calcium imaging data”.

      (d) What is the "FDA template"?

      This is a brain template created by Brezovec et al. [14]. JRC2018 is a well-known brain template, but it was created by immunostaining postmortem brains and did not fit well with calcium imaging data from living flies. Therefore, we used the FDA template.

      (2) Line 93: Please introduce the term "ROI".

      We added “(Region of Interest)” in Line 38.

      (3) Line 94: Ito et al., Neuron (2014) "A systematic nomenclature for the insect brain" is a better reference for Drosophila neuropils; for the hemibrain, the ROIs were generated to match that original atlas

      Thank you for pointing this out. We added a reference.

      (4) Line 95/96: It is unclear what was used as the basis for the k-means/distance-based clustering

      This was because we wanted to investigate whether nuisance factor removal methods are robust, even for such diverse types of ROI. We added this point to the text.

      (5) Line 120ff: I'm not sure how the total number of ROIs is relevant for comparing flies and humans, given (a) the huge difference in brain size and (b) the difference in resolution of the functional data.

      Indeed, the fly brain and the human neocortex are completely different. We are investigating whether there are commonalities between them using a metric called FC-SC correlation. As described in our answer for (11), both the fMRI (BOLD signal) and calcium signal represent presynaptic population dynamics within a local region (voxel). FC represents the synchronization of synaptic activity between regions, and SC represents the structural connectivity of neurons. Both flies and humans showed high SC-FC correlation and showed similar trends (Fig. 2d), so we believe it would be interesting to investigate this phenomenon.

      (6) Line 123: "by contrast" is misleading here since, as you say, there isn't really a difference.

      We changed “by contrast” to “and.”

      (7) Line 141: I'm somewhat worried that the differences between FlyWire and hemibrain synapse counts are due to the issues mentioned above.

      Thank you for the comment but we are not sure about “the issues mentioned above” is referring to.

      (8) Line 148: There is no evidence that any differences in synapse are due to the resolution or anisotropy (as suggested in the introduction).

      We apologize that we don’t have direct evidence for it. We changed this to the sentence “This may be caused by differences in detection accuracy resulting from the resolution of EM scanning, but not to inter-individual variability.”

      (9) Line 155: References "39,45" have no brackets.

      These are not referencing numbers, but brain regions of Brodmann area 39 and 45.

      (10) Line 155-157: I don't think we can infer the composition of brain areas in humans based on a tenuous correlation in flies; this is highly speculative and really should be in the discussion.

      In humans, there are areas with strong and weak FC-SC correlations [8], which may be due to the E-I (Excitatory-Inhibitory) balance of connections. We investigated this possibility by comparing the correlation between neurotransmitters and FC-SC correlations in the fly brain. We slightly changed this sentence.

      (11) Line 159: I find the first 2-3 sentences in this paragraph confusing. Are you saying that you did all these things in the prior results sections, or that you wanted to look at X and therefore you did Y? Maybe there is an issue with the tense here?

      We changed the sentences around this description.

      (12) Line 161: "whole-brain" = FlyWire?

      We changed “whole-brain” to “FlyWire”.

      (13) Line 163: Please explain the "PPSSI" acronym.

      This is now explained on Line 75.

      (14) Line 165: The description of how the cPPSSI was calculated is hard to follow. For example, what's the "fraction of synapse number".

      We changed our sentences around this description to be clearer. The cPPSSI is the degree of segregation within a cluster and is also assigned to each synapse. The PPSSI is then the average of the cPPSSI values of all synapses in a neuron.

      (15) Line 166: Is there a difference between "cPPSSI" and "PPSSI"?

      Yes, there is. Please see our answer for (14).

      (16) Line 167: "The result showed a histogram resembling a normal distribution" → I suggest running a normality test.

      Thank you for pointing this out. We tested it by Lilliefors test and the result was p=0.001 (significantly not a normal distribution). Since there are numerous values with PPSSI=1, it is not judged to be a normal distribution. We therefore changed this description.

      (17) Line 173: I am somewhat worried about a selection bias in your correlation of segregated vs unsegregated synapses. First, it seems like only a small fraction of neurons are in the 0-0.1 and 0.9-1 PPSSI range. I would suggest running a proper correlation between PPSSI and FC-SC correlation instead of looking at just the two extremes. Second, your examples for segregated neurons (APL + CT1) are large neurons that densely innervate spatially close and functionally very similar neuropils. If the sample of unsegregated neurons consists mainly of these large interneurons, I'm not at all surprised that they contributed strongly to FC-SC correlation.

      Thank you for pointing this out. For this work we investigated synapses (not neurons), extracting those with cPPSSI of 0-0.1 and 0.9-1, and performed a rank text with the FC-SC correlation of random sub-sampled synapses. We aimed to demonstrate that unsegregated synapses in particular, strongly contribute to FC-SC, and we hope to investigate overall trends in a future study.

      (18) Line 185: I don't think the function of reciprocal synapses is "considered to be clear". There are examples of feedback inhibition through reciprocal synapses, in particular in the visual system, but that does not mean that this is true across the board.

      We changed “considered to be clear” to “considered to be clearer than unsegregated synapses.” Of course, the function of reciprocal synapses is unknown for the whole brain, but we think it is more well-studied than unsegregated synapses.

      (19) Line 188 / Figure 4h: that figure panel does not appear to show transmitter pairs.

      Figure 4h (FlyWire) showed transmitter pairs. Ext. Data Fig.4-1g did not, because FlyEM does not have transmitter information.

      (20) Line 192: Please clarify "functionally common".

      We changed our sentences to clarify this.

      (21) Line 199: "ventral nerve code" → "ventral nerve cord".

      We fixed this typo.

      (22) Line 201: I don't think you can use "conversely" here.

      We changed “Conversely” to “Moreover.”

      (23) Line 201: How certain are you that the WAGN neuron is the only candidate? Also, it would be nice to provide the neuron IDs so that people can identify them in the connectome.

      Thank you for pointing this out. We added Root ID: 720575940644632087 in the text. Actually, we found several GABA neuron candidates, such as 720575940637611365, 720575940644632087, 720575940613552947, 720575940640333109 and 720575940612264817. We investigated whether ER1(L) was present in these downstream connections and found that 720575940644632087 had the strongest connection with the largest number of synapses, so we adopted this.

      (24) Line 207: When you say "the left WAGN was strongly connected", are those connections not also present for the right WAGN?

      There is a right WAGN (Root ID: 720575940624377224), but it does not have strong interconnections with WPNb tier 2/3 (left) neurons. For the right WAGN, there are few inputs from WPNb tier 2/3 (left). We added “(left)” in the text.

      (25) Line 212: I don't think you can use "however" here.

      We removed “however.”

      (26) Line 214: "well unsegregated" → "very unsegregated"?

      This sentence was removed, because we recalculated Fig. 5h.

      Ethics Declaration:

      It seems the marmoset data were reported on in [10], so why is there a reference to the generation of the dataset?

      Yes, marmoset data were reported in [10], so we removed the Ethics Declaration.

      Reviewer #3 (Recommendations for the authors):

      (1) In my opinion, the title and framing of this manuscript dramatically overstate the results presented here. Also, the results presented in the different figures in this manuscript seem disjointed and are not very related to each other.

      Thank you for pointing this out. We have rewritten our manuscript slightly to address this. Inter-individual variability is relevant to both SC and FC. Regarding SC, we think the difference in the number of synapses between the two individuals is due to the difference in detection power caused by differences in the resolution of the electron microscope. Regarding FC, as stated in the Results section, “Spatial smoothing is useful for absorbing inter-individual variability and conducting second-level group analysis.” Increasing the smoothing size improves the correlation and AUC between group-averaged FC and SC, indicating the presence of inter-individual variability in FC (Fig. 2b, Ext. Data Fig. 2-1b, especially when the number of ROIs is high). We added this text in the Introduction and Results sections.

      (2) There are multiple ways to compute structural correlation matrices-the methods the authors implemented should be discussed in greater detail in the manuscript.

      Thank you for pointing this out. To investigate this issue, as pointed out by other reviewers, we compared the FC-SC correlation between the Gaussian resampled SC approach, used in Honey et al. (2009) [6] and the log-scaled SC approach, used in this study (Ext. Data Fig.2-2a). With a small number of ROIs, the sparsity rate was low (Ext. Data Fig.2-2b), resulting in fewer zero replacement. Therefore, log-scaled SC is likely to more accurately represent the relationship in our study. Furthermore, with a large number of ROIs, the sparsity rate exceeds 70%, and resampled SC randomly assigns a large number of zero elements from the smaller end of the Gaussian distribution. This tends to lower the correlation (Ext. Data Fig.2-2c, d), suggesting that log-scaled SC provides fairer results. Using connection weights (the proportion of connections originating from the target region among all connections) can yield results similar to log-scaled SC (data not shown), because this matrix can be also very sparse. The log-scaled SC aprroach has been used in previous studies [9, 68] and is considered a simple method for showing the relationship (correlation) between FC and SC. It may be possible to compare various methods in-depth, but this is outside the scope of this study and requires further research.

      (3) The use of the FC-SC detection score defined by the authors should be discussed and justified more extensively in the text.

      Thank you for pointing this out. This has already been discussed in [10]. We defined our own “FC-SC detection score,” but we consider the overall approach to be well established in the literature. For example, Stafford et al. (2014) carried out FC-SC detection for 168 mouse cortical regions, and obtained 78.26% sensitivity and 81.69% specificity for the top 1% of SC. Hori et al. (2020) also investigated FC-SC detection for 55 cortical regions of the marmoset brain left hemisphere, achieving an AUC of 0.72. We think FC-SC detection is an index that evaluates the relationship between FC and SC from a different angle than FC-SC correlation and is worthwhile.

      Hori et al., (2020). Comparison of resting-state functional connectivity in marmosets with tracer-based cellular connectivity. NeuroImage, 204, 116241.

      Stafford et al., (2014). Large-scale topology and the default mode network in the mouse connectome. Proc. Natl. Acad. Sci. U.S.A., 111(52), 18745-18750.

    1. Note: This response was posted by the corresponding author to Review Commons. The content has not been altered except for formatting.

      Learn more at Review Commons


      Reply to the reviewers

      Reviewer #1 (Evidence, reproducibility and clarity (Required)):

      • *

      Background and unknown in the field:

      This study investigates how fibroblast alignment influences the migration of intestinal epithelial cells, contributing to tissue integrity and repair. It is well established that intestinal fibroblasts are important regulators in the tissue through their ability to secrete essential paracrine factors for the epithelium. However, it is less well understood if they also play additional structural, tissue architecture instructing role and how the communication between the fibroblasts and the epithelia is regulated.

      Advance over state of the art:

      Here the authors have set-up an elegant three-component system to investigate this. They have gone beyond the recent advances of culturing intestinal and colonic organoids in 2D (in a manner that preserves- and villus-like organization) and bioengineered epithelial-stromal model comprising organoid-derived intestinal epithelial cells (IECs), primary intestinal fibroblasts, and a basement membrane matrix. Using this model, they have uncovered fibroblasts enhancing the directed and persistent migration of intestinal epithelial cells (IECs). They used scRNAseq to carefully analyse the stromal cell populations present in their co-cultures of primary mouse intestinal subepithelial fibroblasts and organoid-derived intestinal mouse epithelial cells. They observed that this reflected well the stromal cell-type composition as well as the paracrine activity previously reported for these cells in tissue. Using a clever system with Matrigel and an elastomeric barrier, the authors were able to induce non-epithelial gaps in different scenarios (IECs alone or with fibroblasts or with conditioned media) and observe the wound-closure as well as the presence of specific cell types. They observed that the epithelial monolayers showed significant gap closure when in direct contact with fibroblasts compared to controls. Interestingly, the enhanced efficiency of epithelial migration and gap closure, in the presence of fibroblasts, was independent of PGE-EP4 signaling and was not due to differences in cell proliferation. Instead, the imaging revealed that the fibroblasts were in direct contact with the epithelium. The authors observed that in the absence of fibroblasts the migration properties of cells in the villus and the crypt regions were dramatically different and the fibroblast presence was necessary to efficiently synchronize these to support gap closure. In addition, the presence of fibroblasts enhanced the directionality of the epithelial cell migration. Detailed imaging and image analyses revealed that gap closure involved activation of the fibroblasts and co-ordinated coalignment of IECs and fibroblasts. They also explored matrix deposition of the fibroblasts during the process and found that they deposited aligned ECM fibers that guide epithelial migration. Mere cell-derived matrix (devoid of live fibroblasts) was able to partially recapitulate the fibroblast-coordinated epithelial migration that the fibroblast generated matrix and its alignment are key contributors to the phenotype.

      Comments:

      This is overall a very interesting and well-written study. The imaging and the image analysis are state-of-the art and the bioengineered model is an exciting advancement over current methods developed by these researchers and others. This study meets all the criteria for a publication in the since that all the experiments seem to be carefully conducted, with appropriate controls and sufficient quantifications and statistics. The claims made by the authors are supported by the data. This is currently suitable to be published as a method/protocol and as a descriptive study uncovering interesting cross-talk and co-dependencies of epithelial and stromal cells during injury repair. There are of course aspects that could improve the study further like more mechanistic insight into the underpinnings of the direct epithelia-fibroblast interaction and its involvement in the directed IEC migration. However, these may be topics to investigate in a future study.

      • *

      Reviewer #1 (Significance (Required)):

      • *

      The strengths of the study are the highly in vivo relevant model system that is amendable to imaging and detailed image analysis of distinct cell populations. This may be adapted by others in in the field and has the potential to transform the way cell dynamics in the intestinal epithelium are visualized and investigated in vitro

      • *

      We thank the reviewer for their thoughtful and positive assessment of our work, and their recognition of the relevance of the bioengineered epithelial-stromal model and its potential for quantitative imaging and analysis of epithelial and fibroblast dynamics.

      We agree that further mechanistic insight into epithelial-fibroblast crosstalk would strengthen the study. While the current manuscript establishes this tractable system and identifies a role for fibroblast organization and matrix alignment in coordinating epithelial migration, we also aim to deepen the mechanistic understanding in the revision. As outlined in our response to Reviewer 2, we will perform additional experiments to further investigate the epithelial-fibroblast crosstalk and force-dependent interactions underlying this process.

      We believe that these additions will complement the current findings and strengthen the conceptual contribution of the study beyond its methodological advances.

      • *

      Reviewer #2 (Evidence, reproducibility and clarity (Required)):

      • *

      Please find enclosed my review comments on the manuscript entitled "Fibroblast alignment coordinates epithelial migration and maintains intestinal tissue integrity" by Jordi Comelles et al.

      In this manuscript, the authors use a bioengineered epithelial-stromal system composed of organoid-derived intestinal epithelial cells, primary intestinal fibroblasts, and a basement membrane matrix to show that direct physical interactions between fibroblasts and epithelial cells drive a large-scale organization of the fibroblast network. This spatial reorganization, in turn, promotes persistent and oriented migration of epithelial cells, ultimately enabling restoration of the intestinal epithelium in an in vitro gap-closure assay. Overall, while the authors use an elegant in vitro model to study intestinal wound closure, and more specifically the role of fibroblasts in this context, I find this manuscript not suitable for publication in its present form. The data are overinterpreted, the novelty is limited, and the molecular mechanisms underlying WAE-fibroblast interactions are insufficiently addressed.

      • *

      We thank the reviewer for their contribution to the revision process with their valuable assessments. We will address their specific points below.

      • *

      Figure 1 - What are the units of the "fraction gap closure" shown in panels d and e? Is it expressed as a percentage?

      We thank the reviewer for pointing this out. The "fraction of gap closed" was calculated as (A(t = 0h)-A(t))/A(t = 0h), where A(t = 0h) corresponds to the initial gap area and A(t) is the area of the gap measured at the time point t. With this definition, the fraction of gap closed is dimensionless, it is 0 at the initial time point, will reach 1 if the gap is fully closed and will have negative values if the gap area increases beyond the initial size, as observed in some replicates of the control condition. To avoid misinterpretation, we will express this quantity as a percentage (i.e., multiplied by 100), as suggested by the reviewer. Moreover, we realized it was ill defined in the methods section. This will be corrected as well in the revised version.

      • *

      "Actually, epithelial monolayers achieved the most effective gap closure when cultured in direct physical contact with fibroblasts (Figure 1e and Movies 2 and 3)." From the data shown in panels c, d, and e, it appears that fibroblast-conditioned medium alone promotes efficient gap closure, comparable to the + fibroblast condition.

      We agree with the reviewer that the original closing sentence overstated the effect. While both fibroblast-conditioned medium and direct fibroblast contact promote efficient gap closure compared to control conditions, the data do not support a consistent difference between these two conditions. We will therefore remove this statement in the revised version to more accurately reflect the results.

      • *

      Figure 2 - The use of a cell proliferation inhibitor during the gap-closure assay would help determine the contribution of cell proliferation at the migration front.

      We agree with the reviewer that inhibiting proliferation would help assess the contribution of cell proliferation to gap closure. However, in the 2D gap-closure assay, our Ki67 immunostaining showed no significant differences in the proportion of proliferative cells between conditions, either within the monolayer or at the migration front. This suggests that differential proliferation is unlikely to account for the differences in gap closure observed between control and fibroblast-containing conditions.

      We note that, in a separate 3D organoid assay, fibroblast-derived signals induced a WAE-like transcriptional program associated with reduced Ki67 mRNA expression, indicating that fibroblasts can promote a more migratory epithelial state without increasing proliferation. Thus, while proliferation may contribute to epithelial homeostasis and repair, our data do not point it as the main determinant of the differences observed in the 2D gap-closure phenotypes.

      In addition, pharmacological inhibition of proliferation would likely perturb the homeostasis of the organoid-derived epithelial monolayers, in which proliferative crypt compartments are essential, and would be difficult to restrict to epithelial cells without also affecting fibroblasts in co-culture. For these reasons, although such experiments could inform the general contribution of proliferation to gap closure, we do not think they would directly clarify the differences observed between conditions in our system.

      • *

      Figure 2f and 2g - Has a dose-dependent effect of PGE2 been tested?

      We thank the reviewer for pointing this out. We did not perform a dose-response analysis of PGE2 in this study, as our aim was to assess the involvement of the PGE2-EP4 axis rather than to characterize its quantitative dynamics. We therefore selected a concentration based on previous work demonstrating dose-dependent induction of the WAE program in 3D organoid systems (Miyoshi et al., 2017). In that study, 1 µM PGE2 was sufficient to induce a significant increase in the WAE marker Cldn4, and we used this concentration as a biologically relevant reference condition. We will clarify this in the methods section.

      • *

      Figure 2i - The + fibroblast + EP4i condition (pink) is missing.

      We thank the reviewer for pointing this out. The + fibroblast + EP4i condition is present in the plot but not visually distinguishable because it overlaps with the + fibroblast condition and is therefore masked by it. As shown in Figure S4e, the + fibroblast + EP4i condition falls within the variability range of the + fibroblast condition. To improve clarity, we will revise the figure to ensure that this condition is visually identifiable.

      • *

      "This suggests a mechanical or contact-mediated role for fibroblasts in preserving epithelial integrity and promoting coordinated migration beyond their paracrine signaling." While PGE2-EP4 signaling does not appear to be involved in the fibroblast-mediated enhancement of gap-closure efficiency, the conclusion that physical interactions are more important than paracrine effects is overstated. For instance, an experimental condition in which fibroblast-conditioned medium is inactivated (boiling for 5 minutes) would strengthen this conclusion. In addition, inhibition of actomyosin contractility in fibroblasts would be informative.

      Figure 3 - The data presented here do not convincingly support the dismissal of conditioned medium as a contributing factor. The differences between the + fibroblast-conditioned medium and + fibroblast conditions are modest. In both cases, epithelial cells migrate and gaps close.

      We agree with the reviewer that inhibition of actomyosin contractility in fibroblasts would provide valuable insight into the role of force-dependent interactions in epithelial-stromal coupling. However, pharmacological inhibitors of the Rho-ROCK-myosin pathway (e.g., blebbistatin, ML-7, or the ROCK inhibitor Y-27632) would also affect epithelial contractility in our co-culture system, making it difficult to specifically attribute any observed effects to fibroblast mechanics.

      We also agree that paracrine signaling plays an important role in epithelial gap closure. Indeed, supplementation of control media with PGE improves gap closure compared to control conditions, although it does not reach the levels observed with fibroblast-conditioned medium, suggesting that additional soluble factors contribute beyond the PGE-EP4 axis. However, time-lapse imaging revealed direct and dynamic interactions between fibroblasts and epithelial cells (Movie 6; Figure S5a-d; Movie 7), which prompted us to further investigate the contribution of physical interactions, as addressed in Figure 3.

      In Figure 3, we analyzed migration at the single-cell level, in contrast to the tissue-level measurements used for gap closure quantification. In organoid-derived intestinal monolayers, two distinct compartments can be identified: crypt-like and villus-like regions. In vivo, these compartments exhibit different migration behaviors: cells in the crypt are primarily displaced due to crowding, whereas cells in the villus actively migrate, as suggested by the presence of cryptic lamellipodia (Krndija et al., 2019). Consistent with this, tracking individual cells revealed that crypt cells are largely static, while villus cells migrate toward the gap. This compartmentalized behavior was observed in both control and fibroblast-conditioned medium conditions. Strikingly, in the presence of fibroblasts, this differential behavior was reduced, resulting in coordinated migration of both crypt and villus regions.

      This mismatch between compartments in control conditions may contribute to the appearance of discontinuities ("holes") within the epithelial layer during migration. In control experiments, these defects failed to close, whereas in conditioned medium they closed slowly or incompletely. In contrast, in the presence of fibroblasts, these disruptions were rapidly and efficiently resolved, indicating improved tissue integrity.

      Additionally, analysis of individual trajectories near the migration front showed that cells exhibit significantly increased directional persistence (i.e., movement aligned with the direction of gap closure) in the presence of fibroblasts compared to conditioned medium alone.

      Taken together, while paracrine signaling from fibroblasts contributes to epithelial migration and gap closure, the physical presence of fibroblasts induces qualitative changes in epithelial behavior, including coordinated migration across compartments, improved hole closure, and enhanced directional persistence.

      • *

      Figure 4a - "Upon removal of the barrier (t = 0 h), fibroblasts at the epithelial front were small and evenly distributed, with no prominent α-SMA fibers present." Here, fibroblasts are α-SMA positive but not elongated. α-SMA may therefore not be the most appropriate marker. What are the levels of phosphorylated MLC2? These may increase during wound closure. Also, fibroblasts culture promotes aSMA expression, therefore, it may be possible that the fibroblasts used in this assay may not represent the healthy fibroblasts found in vivo.

      We agree with the reviewer that fibroblasts are α-SMA positive at early time points but are not yet elongated. In our system, we observe that α-SMA is already present at t = 0 h, while fibroblasts progressively elongate and reorganize α-SMA into prominent fiber structures over time. This suggests that changes in α-SMA organization, rather than its initial presence, are associated with fibroblast activation during gap closure.

      We note that baseline α-SMA expression may be influenced by in vitro culture conditions prior to the assay, which could differ from the state of fibroblasts in vivo. We will clarify this point in the Discussion to better contextualize our observations relative to native fibroblast populations.

      In addition, we agree that assessing phosphorylated myosin light chain 2 (pMLC2) levels would provide complementary information on contractile activity. We will therefore perform pMLC2 staining, as suggested, to further evaluate force generation by fibroblasts during the wound closure process.

      • *

      Figure 5 - Fibroblast alignment could also result from paracrine signals secreted by epithelial cells. This possibility should be tested.

      We thank the reviewer for this suggestion. To test whether fibroblast alignment could be driven by epithelial-derived paracrine signals, we will culture fibroblasts in conditioned medium collected from epithelial monolayers undergoing gap closure (control condition without fibroblasts) and quantify their alignment over time. This will be compared to fibroblasts maintained in standard fibroblast medium.

      This experiment will directly assess whether epithelial-derived soluble factors are sufficient to induce fibroblast alignment, or whether direct physical interactions are required.

      • *

      In summary, this manuscript demonstrates that epithelial cells migrate more efficiently on extracellular matrix proteins deposited and oriented by fibroblasts. This concept is not novel. Identifying the molecular mechanisms governing interactions between WAE and subepithelial fibroblasts would significantly enhance the novelty and impact of this study.

      • *

      Reviewer #2 (Significance (Required)):

      • *

      In this manuscript, the authors use a bioengineered epithelial-stromal system composed of organoid-derived intestinal epithelial cells, primary intestinal fibroblasts, and a basement membrane matrix to show that direct physical interactions between fibroblasts and epithelial cells drive a large-scale organization of the fibroblast network. This spatial reorganization, in turn, promotes persistent and oriented migration of epithelial cells, ultimately enabling restoration of the intestinal epithelium in an in vitro gap-closure assay. Overall, while the authors use an elegant in vitro model to study intestinal wound closure, and more specifically the role of fibroblasts in this context, I find this manuscript not suitable for publication in its present form. The data are overinterpreted, the novelty is limited, and the molecular mechanisms underlying WAE-fibroblast interactions are insufficiently addressed.

      *We thank the reviewer for this thorough and critical assessment. We have clarified the overstatements in the rebuttal and we will modify the text to address concerns regarding overinterpretation and clearly acknowledge the limitations of our approach. In particular, we will refine the framing of the study to better distinguish between the contributions of paracrine signaling and physical epithelial-stromal interactions. *

      *To address the reviewer's concerns regarding mechanism and novelty, we will perform additional experiments aimed at further characterizing epithelial-stromal cross-talk, and experiments to assess fibroblast contractility and its contribution to epithelial coordination. *

      We believe that these revisions and proposed experiments will strengthen the manuscript and clarify its conceptual contribution.

      • *

      Reviewer #3 (Evidence, reproducibility and clarity (Required)):

      • *

      Summary:

      - Provide a short summary of the findings and key conclusions (including methodology and model system(s) where appropriate).

      The study by Comelles et al. focuses on how primary intestinal fibroblasts contribute to organoid-derived intestinal epithelial migration in wound healing assays. Using fibroblast-epithelial co-cultures in a 2D in vitro gap closure system, the authors found that direct interaction with fibroblasts drives cohesive and directed migration of intestinal epithelia toward the gap. They further propose that long-range fibroblast alignment promotes the deposition of extracellular matrix (ECM) proteins in an oriented fashion, contributing to directed epithelial migration.

      Major comments:

      - Are the key conclusions convincing?

      Some of the key conclusions of this manuscript are not entirely convincing given the available data. The manuscript would benefit from additional evidence and/or clarifications to support their conclusions. See comments below.

      • *

      - Should the authors qualify some of their claims as preliminary or speculative, or remove them altogether?

      (Fig 4a) The authors claim that fibroblasts become activated during gap closure as evidenced by the enhanced assembly of a-SMA fibers 24 hours following barrier removal. Yet, long a-SMA fibers are also observed when fibroblasts are cultured in the absence of epithelial cells or barrier removal (Fig. S1b). To support this conclusion, the authors should consider including additional controls to account for potential time-dependent assembly of a-SMA fibers (e.g., fibroblast-only control).

      We thank the reviewer for pointing this out. We agree that a fibroblast-only control would be important to account for potential time-dependent assembly of α-SMA fibers. We will therefore perform additional experiments monitoring α-SMA organization in fibroblasts cultured alone over time, which will allow us to better interpret the dynamics observed in the co-culture conditions.

      • *

      (Fig. 5a) The authors conclude that fibroblasts align parallel to the direction of epithelial migration during gap closure. While quantifications are convincing, again, a fibroblast-only control accounting for time-dependent spreading and elongation (as seen in Fig. S1) is missing. Including such a control would strengthen their claim that alignment is specific to the gap closure context rather than a time-dependent phenotype.

      We agree with the reviewer that, given the intrinsic ability of fibroblasts to form ordered domains with long-range alignment, this control would be highly informative. We will therefore quantify fibroblast alignment over time in fibroblast-only cultures, which will allow us to determine to what extent the long-range organization observed in co-culture is specific to the gap closure context.

      • *

      (Fig 6) The authors claim that fibroblast-derived aligned ECM drives directional epithelial migration. While fibronectin fibers appear scarce and weakly aligned with the direction of migration, laminin and type IV collagen fibers are barely detectable (Fig. 6f). This may reflect a defect in ECM deposition rather than fiber alignment, which contrasts with Fig. S1, where fibroblasts are shown to deposit and assemble laminin and type IV collagen fibers. One possible explanation is that primary fibroblasts were not cultured long enough to allow robust ECM deposition. Alternatively, the observed effect may be specific to fibronectin, which is consistent with fibroblasts being its major source. The authors should revise their interpretation or provide additional evidence to support their current claim.

      We thank the reviewer for this important point. We agree that differences in ECM signal within the gap may reflect not only fiber alignment but also differences in the amount of protein deposited. In the +fibroblast condition, fibroblasts in the gap have more time to secrete ECM compared to the "empty gap" condition, where fibroblasts remain confined beneath the epithelium.

      In addition, the presence of Matrigel likely masks the contribution of certain ECM components, making laminin or type IV collagen more apparent than fibronectin. We will therefore revise the interpretation of these results to explicitly acknowledge the contribution of ECM abundance in addition to alignment.

      • *

      (Fig 6i) The authors propose that the presence of ECM alone within the gap enhances epithelial gap closure compared to empty gap conditions, although gap closure remains less effective than in the presence of primary fibroblasts. From the figure legend and methods, it seems that the decellularized ECM condition is generated using NIH-3T3 fibroblasts cultured for 8 days, whereas the other conditions used primary fibroblasts cultured for 1 day (Fig. 6a-h). This comparison is confounded by differences in cell source and ECM deposition time. If I am misunderstanding this, please clarify, otherwise consider repeating the decellularized ECM condition using primary fibroblasts and matching culture times for a fair comparison. Along these lines, please include images showing that ECM fibers remain intact following decellularization.

      We thank the reviewer for this suggestion. We will include additional staining to confirm that ECM fibers remain intact after decellularization in the revised version.

      Regarding the use of NIH-3T3 fibroblasts for CDM generation, this choice was made to minimize potential residual paracrine signaling from primary intestinal fibroblasts after decellularization. We acknowledge that this introduces differences in cell source.

      Concerning culture time, we followed established protocols for CDM formation, which recommend extended culture periods ({greater than or equal to}8 days) to allow robust ECM deposition (Cukierman et al., 2001; Franco-Barraza et al., 2016; Godeau et al., 2020). We will clarify these points in the revised manuscript and discuss the limitations associated with these differences.

      • *

      - Would additional experiments be essential to support the claims of the paper? Request additional experiments only where necessary for the paper as it is, and do not ask authors to open new lines of experimentation.

      Yes. The additional experiments outlined above would help support the current conclusions of the manuscript, rather than to explore new directions beyond its scope.

      • *

      - Are the suggested experiments realistic in terms of time and resources? It would help if you could add an estimated cost and time investment for substantial experiments.

      Yes, the additional experiments primarily involve the inclusion of controls and additional immunofluorescence imaging to their existing experimental setups. They should be relatively straightforward to implement (~2-3 months).

      • *

      - Are the data and the methods presented in such a way that they can be reproduced?

      Yes.

      • *

      - Are the experiments adequately replicated and statistical analysis adequate?

      Overall, yes. But some plot legends should specify the number of replicates analyzed (e.g. Fig. 2b, Fig. 2d, Fig. 3h).

      We will review and correct these issues.

      • *

      Minor comments:

      - Specific experimental issues that are easily addressable.

      (Fig. 1c-e) The authors state that intestinal epithelial monolayers exhibit the most effective gap closure when in direct contact with fibroblasts. However, fibroblast-conditioned media and co-cultures show comparable gap closure efficiencies (Fig. 1e). The authors should consider revising this interpretation based on the provided data.

      We thank the reviewer for pointing this out, which was also raised by Reviewer 2. As discussed above, we agree that the original statement overstated the effect. Both fibroblast-conditioned medium and direct fibroblast contact promote efficient gap closure compared to control conditions, and we will revise the text accordingly to reflect that no consistent quantitative difference is observed between these two conditions.

      • *

      (Fig. 3b) The authors suggest that crypt-like epithelial cells undergo migration when grown on fibroblasts, but not in conditioned media alone. This is interesting, but it is not clear how they identify crypt-like cells for tracking. The authors should clarify if crypt-like cells are defined based on markers or inferred from their morphology.

      We thank the reviewer for this comment. In these tracking analyses, crypt-like cells were identified based on morphology. As shown in Figure S3 and in Larrañaga et al., 2025, crypt-like cells, defined by specific molecular markers, are significantly smaller than villus-like cells and form high-density regions. These features allow their identification based on morphology in fluorescently labeled monolayers. We will clarify this criterion in the Methods section of the revised manuscript.

      • *

      (Fig 3f-h) The authors conclude that fibroblasts promote directed epithelial cell motility based on cell trajectory analysis. Although they state that this analysis is performed on epithelial monolayers, their tdTomato epithelial population appears sparse in some conditions (control and conditioned media; Fig. S6a). Such variability in cell density may bias measurements of migration directionality at the cell-level, unless a mixed population is being used for tracking. The authors should clarify whether this analysis was indeed conducted on confluent monolayers.

      We thank the reviewer for this comment. For trajectory analysis, we used a mixed population of tdTomato-positive and non-fluorescent epithelial cells in some experiments to facilitate individual cell tracking. Importantly, epithelial monolayers were confluent in all conditions analyzed. We will clarify this in the Methods section.

      • *

      (Fig 6b) Their gap closure experimental setup indicates that fibroblasts are cultured on a Matrigel-coated surface, which should already contain abundant laminin and type IV collagen. Thus, it is unclear why type IV collagen is not detected underneath fibroblasts. The authors should explain why this is the case for clarity.

      We thank the reviewer for pointing out this observation. Indeed, fibroblasts are cultured on a Matrigel-coated surface which contains laminin and collagen type IV among many other components. We observed thick collagen-rich structures between the fibroblasts and the epithelia that we atributed, not only to fibroblasts' secreted collagen, but also a rearrengement of the collagen available in the coated surface. We will clarify this in the discussion of the revised version for clarity.

      • *

      - Are prior studies referenced appropriately?

      Yes

      • *

      - Are the text and figures clear and accurate?

      Mostly. Figures 6d and 6g seem to be duplicated by mistake.

      We thank the reviewer for noting this. We will correct this mistake.

      • *

      - Do you have suggestions that would help the authors improve the presentation of their data and conclusions?

      There are some missing frames in Movie 2. If they are not available, it's okay to include black frames, so that the sequence remains consistent with the timestamps.

      The authors may consider using asterisks as significance indicators instead of reporting precise p-values directly on their plots. Having this format would facilitate visual comparison of statistical significance across conditions.

      Displaying single channels of experiments where co-cultures are used would help to better interpret their data.

      We thank the reviewer for pointing out these issues and for their valuable suggestions. We will correct the errors in the movie and improve the presentation as suggested where possible.

      • *

      Reviewer #3 (Significance (Required)):

      • *

      - Describe the nature and significance of the advance (e.g. conceptual, technical, clinical) for the field.

      This study provides a valuable contribution to understanding how fibroblasts influence intestinal epithelial migration. The main advance lies in the use of a co-culture system combining organoid-derived intestinal epithelial cells that assemble into a crypt-villus organization with primary intestinal fibroblasts in a 2D gap closure system. This approach allows the authors to examine epithelial-fibroblast interactions in a more physiologically relevant context compared to prior work.

      We thank the reviewer for their positive assessment of the significance of our work.

      • *

      - Place the work in the context of the existing literature (provide references, where appropriate).

      Addressed above.

      • *

      - State what audience might be interested in and influenced by the reported findings.

      Cell and developmental biology, extracellular matrix biology, tissue regeneration.

      • *

      - Define your field of expertise with a few keywords to help the authors contextualize your point of view. Indicate if there are any parts of the paper that you do not have sufficient expertise to evaluate.

      Tissue morphogenesis, cell motility, extracellular matrix dynamics.

      We thank the reviewer for their positive assessment and for their suggestions to improve the manuscript.

      • *
    2. Note: This preprint has been reviewed by subject experts for Review Commons. Content has not been altered except for formatting.

      Learn more at Review Commons


      Referee #3

      Evidence, reproducibility and clarity

      Summary:

      • Provide a short summary of the findings and key conclusions (including methodology and model system(s) where appropriate).

      The study by Comelles et al. focuses on how primary intestinal fibroblasts contribute to organoid-derived intestinal epithelial migration in wound healing assays. Using fibroblast-epithelial co-cultures in a 2D in vitro gap closure system, the authors found that direct interaction with fibroblasts drives cohesive and directed migration of intestinal epithelia toward the gap. They further propose that long-range fibroblast alignment promotes the deposition of extracellular matrix (ECM) proteins in an oriented fashion, contributing to directed epithelial migration.

      Major comments:

      • Are the key conclusions convincing?

      Some of the key conclusions of this manuscript are not entirely convincing given the available data. The manuscript would benefit from additional evidence and/or clarifications to support their conclusions. See comments below. - Should the authors qualify some of their claims as preliminary or speculative, or remove them altogether?

      (Fig 4a) The authors claim that fibroblasts become activated during gap closure as evidenced by the enhanced assembly of a-SMA fibers 24 hours following barrier removal. Yet, long a-SMA fibers are also observed when fibroblasts are cultured in the absence of epithelial cells or barrier removal (Fig. S1b). To support this conclusion, the authors should consider including additional controls to account for potential time-dependent assembly of a-SMA fibers (e.g., fibroblast-only control). (Fig. 5a) The authors conclude that fibroblasts align parallel to the direction of epithelial migration during gap closure. While quantifications are convincing, again, a fibroblast-only control accounting for time-dependent spreading and elongation (as seen in Fig. S1) is missing. Including such a control would strengthen their claim that alignment is specific to the gap closure context rather than a time-dependent phenotype. (Fig 6) The authors claim that fibroblast-derived aligned ECM drives directional epithelial migration. While fibronectin fibers appear scarce and weakly aligned with the direction of migration, laminin and type IV collagen fibers are barely detectable (Fig. 6f). This may reflect a defect in ECM deposition rather than fiber alignment, which contrasts with Fig. S1, where fibroblasts are shown to deposit and assemble laminin and type IV collagen fibers. One possible explanation is that primary fibroblasts were not cultured long enough to allow robust ECM deposition. Alternatively, the observed effect may be specific to fibronectin, which is consistent with fibroblasts being its major source. The authors should revise their interpretation or provide additional evidence to support their current claim. (Fig 6i) The authors propose that the presence of ECM alone within the gap enhances epithelial gap closure compared to empty gap conditions, although gap closure remains less effective than in the presence of primary fibroblasts. From the figure legend and methods, it seems that the decellularized ECM condition is generated using NIH-3T3 fibroblasts cultured for 8 days, whereas the other conditions used primary fibroblasts cultured for 1 day (Fig. 6a-h). This comparison is confounded by differences in cell source and ECM deposition time. If I am misunderstanding this, please clarify, otherwise consider repeating the decellularized ECM condition using primary fibroblasts and matching culture times for a fair comparison. Along these lines, please include images showing that ECM fibers remain intact following decellularization. - Would additional experiments be essential to support the claims of the paper? Request additional experiments only where necessary for the paper as it is, and do not ask authors to open new lines of experimentation.

      Yes. The additional experiments outlined above would help support the current conclusions of the manuscript, rather than to explore new directions beyond its scope. - Are the suggested experiments realistic in terms of time and resources? It would help if you could add an estimated cost and time investment for substantial experiments.

      Yes, the additional experiments primarily involve the inclusion of controls and additional immunofluorescence imaging to their existing experimental setups. They should be relatively straightforward to implement (~2-3 months). - Are the data and the methods presented in such a way that they can be reproduced?

      Yes. - Are the experiments adequately replicated and statistical analysis adequate?

      Overall, yes. But some plot legends should specify the number of replicates analyzed (e.g. Fig. 2b, Fig. 2d, Fig. 3h).

      Minor comments:

      • Specific experimental issues that are easily addressable.

      (Fig. 1c-e) The authors state that intestinal epithelial monolayers exhibit the most effective gap closure when in direct contact with fibroblasts. However, fibroblast-conditioned media and co-cultures show comparable gap closure efficiencies (Fig. 1e). The authors should consider revising this interpretation based on the provided data. (Fig. 3b) The authors suggest that crypt-like epithelial cells undergo migration when grown on fibroblasts, but not in conditioned media alone. This is interesting, but it is not clear how they identify crypt-like cells for tracking. The authors should clarify if crypt-like cells are defined based on markers or inferred from their morphology. (Fig 3f-h) The authors conclude that fibroblasts promote directed epithelial cell motility based on cell trajectory analysis. Although they state that this analysis is performed on epithelial monolayers, their tdTomato epithelial population appears sparse in some conditions (control and conditioned media; Fig. S6a). Such variability in cell density may bias measurements of migration directionality at the cell-level, unless a mixed population is being used for tracking. The authors should clarify whether this analysis was indeed conducted on confluent monolayers. (Fig 6b) Their gap closure experimental setup indicates that fibroblasts are cultured on a Matrigel-coated surface, which should already contain abundant laminin and type IV collagen. Thus, it is unclear why type IV collagen is not detected underneath fibroblasts. The authors should explain why this is the case for clarity. - Are prior studies referenced appropriately?

      Yes - Are the text and figures clear and accurate?

      Mostly. Figures 6d and 6g seem to be duplicated by mistake. - Do you have suggestions that would help the authors improve the presentation of their data and conclusions?

      There are some missing frames in Movie 2. If they are not available, it's okay to include black frames, so that the sequence remains consistent with the timestamps. The authors may consider using asterisks as significance indicators instead of reporting precise p-values directly on their plots. Having this format would facilitate visual comparison of statistical significance across conditions. Displaying single channels of experiments where co-cultures are used would help to better interpret their data.

      Significance

      • Describe the nature and significance of the advance (e.g. conceptual, technical, clinical) for the field.

      This study provides a valuable contribution to understanding how fibroblasts influence intestinal epithelial migration. The main advance lies in the use of a co-culture system combining organoid-derived intestinal epithelial cells that assemble into a crypt-villus organization with primary intestinal fibroblasts in a 2D gap closure system. This approach allows the authors to examine epithelial-fibroblast interactions in a more physiologically relevant context compared to prior work. - Place the work in the context of the existing literature (provide references, where appropriate). Addressed above.

      • State what audience might be interested in and influenced by the reported findings.

      Cell and developmental biology, extracellular matrix biology, tissue regeneration. - Define your field of expertise with a few keywords to help the authors contextualize your point of view. Indicate if there are any parts of the paper that you do not have sufficient expertise to evaluate.

      Tissue morphogenesis, cell motility, extracellular matrix dynamics.

    3. Note: This preprint has been reviewed by subject experts for Review Commons. Content has not been altered except for formatting.

      Learn more at Review Commons


      Referee #2

      Evidence, reproducibility and clarity

      Please find enclosed my review comments on the manuscript entitled "Fibroblast alignment coordinates epithelial migration and maintains intestinal tissue integrity" by Jordi Comelles et al. In this manuscript, the authors use a bioengineered epithelial-stromal system composed of organoid-derived intestinal epithelial cells, primary intestinal fibroblasts, and a basement membrane matrix to show that direct physical interactions between fibroblasts and epithelial cells drive a large-scale organization of the fibroblast network. This spatial reorganization, in turn, promotes persistent and oriented migration of epithelial cells, ultimately enabling restoration of the intestinal epithelium in an in vitro gap-closure assay. Overall, while the authors use an elegant in vitro model to study intestinal wound closure, and more specifically the role of fibroblasts in this context, I find this manuscript not suitable for publication in its present form. The data are overinterpreted, the novelty is limited, and the molecular mechanisms underlying WAE-fibroblast interactions are insufficiently addressed.

      Figure 1 - What are the units of the "fraction gap closure" shown in panels d and e? Is it expressed as a percentage? "Actually, epithelial monolayers achieved the most effective gap closure when cultured in direct physical contact with fibroblasts (Figure 1e and Movies 2 and 3)." From the data shown in panels c, d, and e, it appears that fibroblast-conditioned medium alone promotes efficient gap closure, comparable to the + fibroblast condition. Figure 2 - The use of a cell proliferation inhibitor during the gap-closure assay would help determine the contribution of cell proliferation at the migration front. Figure 2f and 2g - Has a dose-dependent effect of PGE2 been tested? Figure 2i - The + fibroblast + EP4i condition (pink) is missing. "This suggests a mechanical or contact-mediated role for fibroblasts in preserving epithelial integrity and promoting coordinated migration beyond their paracrine signaling." While PGE2-EP4 signaling does not appear to be involved in the fibroblast-mediated enhancement of gap-closure efficiency, the conclusion that physical interactions are more important than paracrine effects is overstated. For instance, an experimental condition in which fibroblast-conditioned medium is inactivated (boiling for 5 minutes) would strengthen this conclusion. In addition, inhibition of actomyosin contractility in fibroblasts would be informative. Figure 3 - The data presented here do not convincingly support the dismissal of conditioned medium as a contributing factor. The differences between the + fibroblast-conditioned medium and + fibroblast conditions are modest. In both cases, epithelial cells migrate and gaps close. Figure 4a - "Upon removal of the barrier (t = 0 h), fibroblasts at the epithelial front were small and evenly distributed, with no prominent α-SMA fibers present." Here, fibroblasts are α-SMA positive but not elongated. α-SMA may therefore not be the most appropriate marker. What are the levels of phosphorylated MLC2? These may increase during wound closure. Also, fibroblasts culture promotes aSMA expression, therefore, it may be possible that the fibroblasts used in this assay may not represent the healthy fibroblasts found in vivo. Figure 5 - Fibroblast alignment could also result from paracrine signals secreted by epithelial cells. This possibility should be tested. In summary, this manuscript demonstrates that epithelial cells migrate more efficiently on extracellular matrix proteins deposited and oriented by fibroblasts. This concept is not novel. Identifying the molecular mechanisms governing interactions between WAE and subepithelial fibroblasts would significantly enhance the novelty and impact of this study.

      Significance

      In this manuscript, the authors use a bioengineered epithelial-stromal system composed of organoid-derived intestinal epithelial cells, primary intestinal fibroblasts, and a basement membrane matrix to show that direct physical interactions between fibroblasts and epithelial cells drive a large-scale organization of the fibroblast network. This spatial reorganization, in turn, promotes persistent and oriented migration of epithelial cells, ultimately enabling restoration of the intestinal epithelium in an in vitro gap-closure assay. Overall, while the authors use an elegant in vitro model to study intestinal wound closure, and more specifically the role of fibroblasts in this context, I find this manuscript not suitable for publication in its present form. The data are overinterpreted, the novelty is limited, and the molecular mechanisms underlying WAE-fibroblast interactions are insufficiently addressed.

    4. Note: This preprint has been reviewed by subject experts for Review Commons. Content has not been altered except for formatting.

      Learn more at Review Commons


      Referee #1

      Evidence, reproducibility and clarity

      Background and unknown in the field:

      This study investigates how fibroblast alignment influences the migration of intestinal epithelial cells, contributing to tissue integrity and repair. It is well established that intestinal fibroblasts are important regulators in the tissue through their ability to secrete essential paracrine factors for the epithelium. However, it is less well understood if they also play additional structural, tissue architecture instructing role and how the communication between the fibroblasts and the epithelia is regulated.

      Advance over state of the art:

      Here the authors have set-up an elegant three-component system to investigate this. They have gone beyond the recent advances of culturing intestinal and colonic organoids in 2D (in a manner that preserves- and villus-like organization) and bioengineered epithelial-stromal model comprising organoid-derived intestinal epithelial cells (IECs), primary intestinal fibroblasts, and a basement membrane matrix. Using this model, they have uncovered fibroblasts enhancing the directed and persistent migration of intestinal epithelial cells (IECs). They used scRNAseq to carefully analyse the stromal cell populations present in their co-cultures of primary mouse intestinal subepithelial fibroblasts and organoid-derived intestinal mouse epithelial cells. They observed that this reflected well the stromal cell-type composition as well as the paracrine activity previously reported for these cells in tissue. Using a clever system with Matrigel and an elastomeric barrier, the authors were able to induce non-epithelial gaps in different scenarios (IECs alone or with fibroblasts or with conditioned media) and observe the wound-closure as well as the presence of specific cell types. They observed that the epithelial monolayers showed significant gap closure when in direct contact with fibroblasts compared to controls. Interestingly, the enhanced efficiency of epithelial migration and gap closure, in the presence of fibroblasts, was independent of PGE₂-EP4 signaling and was not due to differences in cell proliferation. Instead, the imaging revealed that the fibroblasts were in direct contact with the epithelium. The authors observed that in the absence of fibroblasts the migration properties of cells in the villus and the crypt regions were dramatically different and the fibroblast presence was necessary to efficiently synchronize these to support gap closure. In addition, the presence of fibroblasts enhanced the directionality of the epithelial cell migration. Detailed imaging and image analyses revealed that gap closure involved activation of the fibroblasts and co-ordinated coalignment of IECs and fibroblasts. They also explored matrix deposition of the fibroblasts during the process and found that they deposited aligned ECM fibers that guide epithelial migration. Mere cell-derived matrix (devoid of live fibroblasts) was able to partially recapitulate the fibroblast-coordinated epithelial migration that the fibroblast generated matrix and its alignment are key contributors to the phenotype.

      Comments:

      This is overall a very interesting and well-written study. The imaging and the image analysis are state-of-the art and the bioengineered model is an exciting advancement over current methods developed by these researchers and others. This study meets all the criteria for a publication in the since that all the experiments seem to be carefully conducted, with appropriate controls and sufficient quantifications and statistics. The claims made by the authors are supported by the data. This is currently suitable to be published as a method/protocol and as a descriptive study uncovering interesting cross-talk and co-dependencies of epithelial and stromal cells during injury repair. There are of course aspects that could improve the study further like more mechanistic insight into the underpinnings of the direct epithelia-fibroblast interaction and its involvement in the directed IEC migration. However, these may be topics to investigate in a future study.

      Significance

      The strengths of the study are the highly in vivo relevant model system that is amendable to imaging and detailed image analysis of distinct cell populations. This may be adapted by others in in the field and has the potential to transform the way cell dynamics in the intestinal epithelium are visualized and investigated in vitro

    1. eLife Assessment

      This useful study addresses the interesting question of how immune cells recognise infected erythrocytes in malaria. It proposes the parasite protein PfGBP-130 as an interaction partner of the human cell surface protein LFA 1, which could help explain how NK cells recognize infected erythrocytes. The conclusions are partially supported by pull-down and cell-based activation data. However, the overall evidence of direct interaction at the cell-cell interface and downstream effects is incomplete; stronger evidence is required to demonstrate surface exposure of PfGBP-130, as well as a direct role of this antigen in killing.

    2. Reviewer #1 (Public review):

      In this manuscript, the authors aim to determine the ligand on Plasmodium falciparum infected erythrocytes for the NK cell integrin, LFA-1, following up on previous evidence that LFA-1 is important for immune cell-mediated recognition of iRBCs.

      They start by incubating LFA-1 with iRBCs and show by flow analysis that a substantial population of these iRBCs binds to the LFA-1 (Fig 1C). They do conduct the control with uninfected RBCs, but put this in the supplementary material. As this is a critical control, I think that it should be moved to Figure 1C as it is essential to allow interpretation of the iRBC data. The authors also do not state which strain of P. falciparum they used (line 144). This is critical information, as different strains have different variant surface antigens and should be included. With these changes, this data seems convincing.

      They next incubated LFA-1 with the iRBCs, cross-linked and conducted a pulldown, identifying GP130 as a binding partner. Using cross-linkers is a dangerous strategy as it risks non-specific cross-linking. Did they try without cross-linking and find an interaction?

      They raised antibodies to PfGBP and showed IFA, which reveals that these antibodies stain iRBCs (Figure 2Ciii). This experiment lacks a critical control of uninfected RBCs, which needs to be included to show that the staining is specific. Without this, it is not possible to conclude that there is iRBC-specific staining with PfGBP.

      They then conduct a pulldown using LFA-Fc, which does show GP130 only in the presence of the LFA-Fc, but not when empty beads are used. This is convincing. BLI measurements are also used to study this interaction (Figure 2Ci). The BLI data is presented in such a way that any association phase is obscured by the y-axis, which makes it impossible to know whether there is binding here. I think that the data needs to be shown with some baseline before the addition of the ligand so that association can be seen. The data is also a bit messy with a downward drift and the curves showing different shapes, for example, with the 1.0uM curve seeming to have a different association rate. As this is the only data which shows a direct interaction between LFA1 and GBP, as pulldowns are done with lysates, which might mean bridging components. I think that it is important to repeat the BLI, or use additional biophysical methods to assess binding, to obtain more convincing data.

      The authors next do some modelling of the putative complex. This is done by homology modelling and docking, which is not the most up-to-date method and is overinterpreted. Personally, I would remove this data as I did not find it convincing and it is not important for the story. If the authors wish to include it, then I think that they should validate the modelling by mutagenesis to show that the residues which the models indicate might bind are involved in the interaction.

      They next made GP130 and tested the binding of this to THP-1 cells, which are often used as a model for macrophages. They observe greater binding of PfGBP-Fc to these cells when compared with hIgG and show that LFA-1 siRNA reduces this binding. I was a little confused about how the flow plots related to the graph in the bottom right corner of Figure 3Bii. In the flow plots, hIgG control shows 12.8% of cells in the gated region, while the unstained cells has 5.63%, but the MFI data shows a decrease in binding for hIgG vs unstained cells. How is this consistent? Also the siRNA reduces the number of cells in gated region from 66.6% to 25.9%, which is still substantially more that 5.63% in the unstained control. This also doesn't seem quite consistent with the MFI data. Could the authors explain this? Also perhaps an additional experiment would be to add soluble LFA-1 into this assay as an additional control to determine whether this blocks PfGBP binding to the THP-1 cells? It could. Be that there are additional mechanisms of binding which indicate why the siRNA has a partial effect. The same is true for the NK cell experiments in Figure 3Ci in which the siRNA has a partial effect. The authors also test binding to HEK, HepG2 and 'stem' cells and claim 'only background levels of binding', but in each case, there is more binding to these cells by PfGBP-Fc than by hIgG, albeit less than in THP-1 and NK cells. Why have the authors decided that these increases are not significant? All in all, these experiments do indicate a role for the GBP-LFA1 interaction in the binding of immune cells to iRBCs, but perhaps not as absolutely as is suggested.

      The authors next produce CHO cells with PfGBP on the surface. These cells bind to LFA-1 specifically. When these cells were incubated with primary NK cells, they did see increases in activation markers, which were reduced by addition of antiCD11a, suggesting these to be specific. They also conduct the same experiment with anti-GBP with iRBCs but this is in a different figure. It would be easier for the reader if Figure 5B were in the same figure as Figure 4B as it is related data using the same method. I found this data convincing, showing that the LFA1:GBP interaction does contribute to immune cell recognition and activation.

      The authors next conduct an experiment in which they assess parasite growth in the presence of NK cells and in the presence of anti-GBP. They use Heochst staining as a measure of parasite growth and claim that NK cells reduce the number of parasites, but that anti-GBP abolishes this effect (Figure 5A). I found this experiment very unconvincing as there are small effects and no demonstration of significance. More commonly used approaches to study parasite growth are lactate dehydrogenase GIA assays or calcein-AM labelling. I did not find this experiment convincing and would either remove or supplement with additional data using a more robust assay, with repeats and tests of statistical significance.

      In summary, the authors present a set of data which comes together to indicate an interaction between LFA1 and PfGBP on the Plasmodium infected erythrocyte surface. Pulldown studies show convincingly that these two proteins co-precipitate and BLI data suggest that this is direct. Also convincing is that NK cell activation can be reduced using antibodies against either LFA1 or PfGBP, indicating that this interaction does play a role in immune cell recognition of iRBCs.

      Comments on revised version:

      The authors made some minor changes in response to my review, but did not present any substantial new data to demonstrate a direct interaction between PfGBP and LFA1 or to convincingly show differences in NK cell-mediated killing.

    3. Reviewer #2 (Public review):

      Summary:

      The authors used an LFA-1 αI-Fc fusion protein to pull down potential ligands and LC-MS/MS, leading to selection of PfGBP-130 as a potential membrane protein on the surface of infected cells. PfGBP-130 antibodies were raised and used to support the surface localization. This putative ligand interacted strongly with LFA-1 (Kd = 15 nM). A presumed PfGBP-130 ectodomain interacts with monocytes and NK cells but not cells that lack LFA-1. PfGBP-130 antibodies also interfered with NK cell-mediated infected cell killing; the effect, although statistically significant, is modest. The authors propose that NK cells recognize infected cells via LFA-1 interaction with PfGBP-130 exposed on the host cell and that this interaction is critical to initiation of NK cell activation and killing of infected cells.

      Comments on revised version:

      The authors submit a minimally revised manuscript that does not address any of my comments, as itemized here:

      (1) This reviewer suggested immunoblotting with hypotonic lysis and alkaline extraction as a simple test of whether PfGBP-130 is a membrane protein as the authors propose despite PEXEL cleavage that removes a signal peptide they originally proposed to be a TM domain. Instead of performing this simple immunoblot, the authors state that it is unnecessary because their LC-MS/MS of membrane-associated proteins recovered PfGBP-130, it must be a membrane protein. Unfortunately, this is insufficient because the high sensitivity of LC-MS/MS leads to detection of many soluble proteins. (For example, it is almost certain that their LC-MS/MS recovered hemoglobin, which is soluble and not a surface-exposed protein on infected cells.)

      (2) I also suggested a simple immunoblot using a few different immature-stage cultures to detect the full-length and pre-proteins of PfGBP-130 because their immunoblot detected only a 95 kDa band whereas the PEXEL-processed protein is expected to migrate at 85 kDa. The authors state this is unnecessary because their LC-MS/MS of LFA-1 pulldowns enriched for PfGBP-130 and that a single band was detected in immunoblots. This is insufficient because pulldowns often enrich for more than one protein (e.g. some proteins adsorb onto the immunoprecipitation beads or precipitate with beads in certain buffers); immunoblotting often fails to detect some proteins depending on stringency of blocking and wash buffers. They state that the processed form at 85 kDa "may not be well resolved under our current conditions" as a reason not to perform the simple experiment. This reviewer's original statement that P. falciparum antigens frequently cross-react with nominally specific antibodies (with two examples provided in my original review) remains an important concern that would undermine the authors' main conclusion.

      (3) As PfGBP-130 is not essential, a knockout was suggested to more directly test their model given the above concerns. The authors state this cannot be done and that their "multiple orthogonal approaches" suggest it is unnecessary. This reviewer considers this an essential experiment to support a provocative, fundamentally new finding, such as the identification of the NK cell activation ligand.

      (4) This reviewer suggested that the authors add some speculation about why PfGBP-130 is retained in parasites if triggers NK cell-mediated killing and is nonessential. Rather than adding relevant hypotheses to the Discussion, the authors appear to dismiss this suggestion by stating that PfEMP1, STEVOR, and RIFIN are retained despite being nonessential. The problem with this response is that each of these other antigens has a clearly defined role on the surface of infected erythrocytes that benefits the parasite. It is not clear that the authors have considered possible advantages the parasite may gain from exposing PfGBP-130 on the red cell surface.

    4. Reviewer #3 (Public review):

      Summary:

      Malhotra and colleagues present evidence that the integrin LFA-1 on NK cells is a ligand for the Plasmodium falciparum protein GBP130 on the infected erythrocyte surface and that this interaction plays a role in the clearance of infected erythrocytes by NK cells.

      The authors first select a subdomain contained within the CD11a subunit of LFA-1 as a probe to discover possible binding proteins on the infected erythrocyte surface. Parasite-infected erythrocytes stained positively with this probe; the level of staining increased as the parasites progressed through the life cycle. Using the LFA-1-based probe in cross-linking pull-down experiments, GBP130 was identified by mass spectrometry as a co-purifying parasite protein. The N-terminal portion of GBP130 was recombinantly expressed and shown to interact with LFA-1 alpha-I by biolayer interferometry experiments. The full-length extracellular domain of GBP130 was then recombinantly expressed and used to stain primary human NK cells and THP-1 cells. Knocking down LFA-1 by siRNA reduced staining by GBP130. To assess the contribution of GBP130 to the activation of NK cells, CHO cells exogenously expressing GBP130 were incubated with primary NK cells. Transfecting CHO cells with GBP130 led to increased activation of co-incubated NK cells compared to mock-transfected and compared to GBP130 transfected cells, with the inclusion of anti-CD11a to block NK cell adhesion. Finally, CHO cells expressing GBP130 led to increased activation of NK cells compared to mock-transfected CHO cells.

      Overall, although the authors present data from NK cell killing assays that include appropriate controls, the data suggesting a direct interaction between PfGBP-130 and LFA-1 does not include the same necessary controls, for example, the use of blocking antibodies. Most critically, the biolayer interferometry experiments use a recombinant fragment of PfGBP-130, which does not include the residues predicted to be important for mediating specific interaction with LFA1. The biolayer interferometry data instead suggest non-specific interactions between PfGBP-130 and LFA1, as binding does not reach saturation.

      Comments on revised version:

      The authors have addressed all minor concerns, however the major point regarding the biophysical data supporting direct interaction between PfGB130 and LFA-1, in my opinion, has not been satisfactorily addressed. Biophysical data supporting the interaction was generated using a fragment of PfGB130, which does not include residues that the authors predict by structural modelling to be important for the interaction. The authors argue that PfGB130 is a repeat containing protein and may have multiple binding sites for LFA-1. If this is the best mechanistic hypothesis given the current data, the authors need to explain this in the results section.

      Overall though, I agree with Reviewer#1 that the structural modelling results are not convincing and given that the modelling data do not straightforwardly agree with the experiment, the clarity of the manuscript would benefit from their omission.

    5. Author response:

      The following is the authors’ response to the original reviews.

      Public Reviews:

      Reviewer #1 (Public review):

      (1) They start by incubating LFA-1 with iRBCs and show by flow analysis that a substantial population of these iRBCs binds to the LFA-1 (Figure 1C). They do conduct the control with uninfected RBCs, but put this in the supplementary material. As this is a critical control, I think that it should be moved to Figure 1C as it is essential to allow interpretation of the iRBC data. The authors also do not state which strain of P. falciparum they used (line 144). This is critical information as different strains have different variant surface antigens and should be included. With these changes, this data seems convincing.

      We thank the reviewer for this important suggestion. We agree that the uninfected RBC (uRBC) control is critical for interpreting the specificity of LFA-1 αI-Fc binding. In the revised manuscript, we have ensured that these control data are clearly presented and appropriately referenced in the main text; however, we have retained them in the Supplementary Information (Supplementary Figure S1) to maintain clarity and avoid overcrowding Figure 1, while still ensuring their visibility and accessibility to the reader. Importantly, these data demonstrate negligible binding of LFA-1 αI-Fc to uRBCs compared to iRBCs, supporting specificity. We have explicitly stated the parasite strain used (Plasmodium falciparum 3D7) in the Methods section (line 475).

      (2) They next incubated LFA-1 with the iRBCs, cross-linked and conducted a pulldown, identifying GP130 as a binding partner. Using cross-linkers is a dangerous strategy as it risks non-specific cross-linking. Did they try without cross-linking and find an interaction?

      We agree that cross-linking can introduce potential artefacts. To mitigate this, we included hIgG control pulldown experiments performed under identical conditions. Proteins identified in the control eluate were excluded as background (summarized in Supplementary Table S1). Importantly, PfGBP-130 was the only protein specifically enriched in the LFA-1 αI-Fc pulldown across all three biological replicates (Fig. 2A, Venn Diagram). While cross-linking was used to stabilize transient interactions, consistent enrichment of PfGBP-130 across the three biological replicates precludes any concerns of non-specificity.

      (3) They raised antibodies to PfGBP and showed IFA, which reveals that these antibodies stain iRBCs (Figure 2Ciii). This experiment lacks a critical control of uninfected RBCs, which needs to be included to show that the staining is specific. Without this, it is not possible to conclude that there is iRBC-specific staining with PfGBP.

      The question pertains to Fig. 2Biii. The IFA images include both infected and neighboring uninfected erythrocytes within the same field. No PfGBP-130 staining is observed in uninfected cells. PfGARP staining, specifically done to verify parasite-infected cell and surface localisation, shows complete resonance with PfGBP-130 staining. This unequivocally shows that the antibodies raised specifically recognise only infected RBCs.

      (4) They then conduct a pulldown using LFA-Fc, which does show GP130 only in the presence of the LFA-Fc, but not when empty beads are used. This is convincing. BLI measurements are also used to study this interaction (Figure 2Ci). The BLI data is presented in such a way that any association phase is obscured by the y-axis, which makes it impossible to know whether there is binding here. I think that the data needs to be shown with some baseline before the addition of the ligand so that the association can be seen. The data is also a bit messy with a downward drift and the curves showing different shapes, for example, with the 1.0uM curve seeming to have a different association rate. Also, is this n=1? I think that this data needs to be repeated and replicated. As this is the only data which shows a direct interaction between LFA1and GBP, as pulldowns are done with lysates, which might mean bridging components. I think that it is important to repeat the BLI or use additional biophysical methods to assess binding, to obtain more convincing data.

      We sincerely thank the reviewer for highlighting this important concern regarding the BLI data presentation and interpretation. We would like to clarify that the baseline signal prior to ligand addition was subtracted during data processing; therefore, the plotted curves represent the net response following ligand association. However, we agree that this may have obscured the visualization of the association phase. Accordingly, in the revised manuscript, we have re-plotted the data with adjusted y-axis scaling to better capture the association kinetics. In addition, to ensure robustness and reproducibility, the BLI experiments were performed in multiple independent replicates (n ≥ 3) using independently purified protein batches. The original figure showed a representative dataset; we have now included averaged sensorgrams along with standard deviation in the calculated KD values [K<sub>D</sub> = (1.7 ± 0.22) × 10<sup>-8</sup> M] (Figure 2C (i)). These revisions provide a clearer and more accurate representation of the binding interaction.

      (5) The authors next do some modelling of the putative complex. This is done by homology modelling and docking, which is not the most up-to-date method and is over-interpreted. Personally, I would remove this data as I did not find it convincing, and it is not important for the story. If the authors wish to include it, then I think that they should validate the modelling by mutagenesis to show that the residues which the models indicate might bind are involved in the interaction.

      We thank the reviewer for this thoughtful comment regarding the modelling analysis. We agree that computational docking and homology-based modelling have inherent limitations and should not be over-interpreted. In our study, these analyses were included strictly as supporting evidence to provide a structural framework for the PfGBP-LFA-1 interaction, while the primary conclusions are based on direct biochemical and functional validation, including pull-down, BLI measurements, receptor knockdown, and cellular inhibition assays. Importantly, the use of docking approaches such as ClusPro, followed by interface analysis and MD simulations, is a widely accepted and routinely used strategy to generate testable hypotheses for protein-protein interactions, particularly when experimental structures are unavailable (e.g., Comeau et al., 2004; Weng et al., 2019). We believe that the current modelling serves as a useful complementary analysis that is consistent with, and supportive of, the experimentally validated interactions.

      (6) They next made GP130 and tested the binding of this to THP-1 cells, which are often used as a model for macrophages. They observe greater binding of PfGBP-Fc to these cells when compared with hIgG and show that LFA-1 siRNA reduces this binding. I was a little confused about how the flow plots related to the graph in the bottom right corner of Figure 3Bii. In the flow plots, hIgG control shows 12.8% of cells in the gated region, while the unstained cells has 5.63%, but the MFI data shows a decrease in binding for hIgG vs unstained cells. How is this consistent? Also, the siRNA reduces the number of cells in the gated region from 66.6% to 25.9%, which is still substantially more that 5.63% in the unstained control. This also doesn't seem quite consistent with the MFI data. Could the authors explain this? Also, perhaps an additional experiment would be to add soluble LFA-1 into this assay as an additional control to determine whether this blocks PfGBP binding to the THP-1 cells? It could be that there are additional mechanisms of binding which indicate why the siRNA has a partial effect. The same is true for the NK cell experiments in Figure 3Ci, in which the siRNA has a partial effect. The authors also test binding to HEK, HepG2 and 'stem' cells and claim' only background levels of binding', but in each case, there is more binding to these cells by PfGBP-Fc than by hIgG, albeit less than in THP-1 and NK cells. Why have the authors decided that these increases are not significant? All in all, these experiments do indicate a role for the GBP-LFA1 interaction in the binding of immune cells to iRBCs, but perhaps not as absolutely as is suggested.

      We thank the reviewer for this insightful comment. The apparent discrepancy arises because the flow plots depict the percentage of cells within a defined positive gate, whereas the graphs quantify mean fluorescence intensity (MFI) across the entire population. We have revised figure legend accordingly to indicate the same. Regarding the partial reduction in binding upon LFA-1 (CD11a) knockdown, we agree that this indicates LFA-1 is a major but not exclusive contributor, which is biologically plausible given incomplete siRNA depletion and the known avidity-dependent nature of integrin interactions. Importantly, our conclusion is supported by multiple orthogonal approaches (αI-domain binding, LC-MS/MS identification, BLI, docking, receptor knockdown, and functional blockade). We also appreciate the suggestion of soluble LFA-1 competition, which we acknowledge as an important future experiment. Finally, we have revised the text regarding HEK293T, HepG2, and stem cells to reflect that PfGBP-Fc binding is minimal but not absent, consistent with low/non-expression of LFA-1 in non-immune cells. Overall, we have moderated our claims to state that PfGBP-LFA-1 interaction is a dominant and functionally relevant mechanism, while not excluding additional low-affinity or accessory interactions.

      Figure legend change: Representative flow plots depict the percentage of cells within a predefined positive gate, whereas the accompanying summary graph quantifies fluorescence intensity across the analyzed population. These two metrics report distinct properties of the distribution and are therefore not expected to be numerically identical.

      (7) The authors next produce CHO cells with PfGBP on the surface. These cells bind toLFA-1 specifically. When these cells were incubated with primary NK cells, they did see increases in activation markers, which were reduced by the addition of anti-CD11a, suggesting these to be specific. They also conduct the same experiment with anti-GBP with iRBCs, but this is in a different figure. It would be easier for the reader if Figure 5B were in the same figure as Figure 4B, as it is related data using the same method. I found this data convincing, showing that the LFA1:GBP interaction does contribute to immune cell recognition and activation.

      We thank the reviewer for this positive assessment and helpful suggestion regarding figure organization. We agree that the CHO-PfGBP and iRBC-based NK cell activation assays represent conceptually related experiments that both address LFA-1-PfGBP dependent activation using similar readouts. We have retained separate panels to distinguish the reductionist CHO-based system from the physiologically relevant iRBC context. We believe that the combined evidence from both systems strengthens the conclusion that PfGBP-LFA-1 interaction is a key contributor to NK cell recognition and activation.

      (8) The authors next conduct an experiment in which they assess parasite growth in the presence of NK cells and in the presence of anti-GBP. They use Heochst staining as a measure of parasite growth and claim that NK cells reduce the number of parasites, but that anti-GBP abolishes this effect (Figure 5A). I found this experiment very unconvincing as there are small effects and no demonstration of significance. More commonly used approaches to study parasite growth are lactate dehydrogenase GIA assays or calcein-AM labelling. I did not find this experiment convincing and would either remove or supplement with additional data using a more robust assay, with repeats and tests of statistical significance.

      We respectfully disagree that the assay should be removed, because flow-cytometric quantification of P. falciparum parasitemia using DNA dyes such as Hoechst is a widely used, accepted, and high-throughput approach for measuring infected erythrocytes and parasite growth, with clear separation of infected from uninfected RBCs and good reproducibility across malaria studies (Dent et. al., 2009; Jang et. al., 2014). Importantly, closely related immune-cell killing experiments in the malaria field have used the same general strategy, co-culture with effector cells followed by flow-cytometric enumeration of parasitemia to infer parasite control, including the seminal NK-cell study by Chen et. al., 2014, which our assay design follows conceptually, and later work showing reduced parasitemia after co-incubation with cytotoxic lymphocytes measured by nucleic-acid dye flow cytometry. We therefore believe the experiment is methodologically valid and directly relevant to the biological question, namely whether disrupting PfGBP-LFA-1 engagement alters NK-cell-mediated restriction of parasite expansion.

      Reviewer #2 (Public review):

      (1) PfGBP-130 is proposed to be a membrane protein based on a single predicted transmembrane domain. Figures 2b and 3a show ribbon schematics with this TM domain at residues 51-68, in agreement with TM prediction algorithms such as TMHMM 2.0 and Phobius. However, this predicted TM is upstream of the PEXEL motif (residues 84-88, sequence RILAE), a conserved sequence for parasite protein export to host cytosol that is proteolytically processed at its 4th residue. Thus, residues 1-87are removed from PfGBP-130 prior to export, yielding a mature protein without predicted TMs. Prior studies have determined that the mature PfGBP-130 lacks TMs and is retained as a soluble protein in host cell cytosol (PMID: 19055692, 35420481). Thus, the authors' model of PfGBP-130 as a surface-exposed membrane protein conflicts with both computational analysis of the mature protein and these prior reporter studies. An important simple experiment would be to evaluate PfGBP-130membrane association in immunoblots using the authors' PfGBP-130 antibody after hypotonic lysis (PMID: 19055692) and after alkaline extraction (e.g. 100 mM NaCO3, pH 11 as frequently used, PMID: 33393463). If the prior studies and computational analyses are correct, the protein will be predominantly in the soluble and/or alkaline supernatant fractions.

      We thank the reviewer for this important observation regarding PfGBP-130 topology and export. We agree that the presence of a PEXEL motif supports proteolytic processing and that the mature protein may lack a classical transmembrane domain. However, consistent with our model of surface accessibility, we would like to clarify that in an independent proteomic study performed in our laboratory on the membrane-enriched fraction of Plasmodium falciparum-infected erythrocytes, PfGBP-130 was reproducibly identified by LC-MS/MS among membrane-associated proteins (data not shown; can be provided upon request). These findings support the conclusion that, irrespective of the absence of a canonical transmembrane domain, PfGBP-130 is associated with the iRBC membrane compartment, likely via peripheral or protein-complex–mediated interactions, as described for several exported Plasmodium proteins.

      (2) Many findings rely on the specificity of antibodies generated against PfGPB-130 or NK cell receptors. Although the authors have included key controls (use of isotype control antibodies, lack of anti-PfGBP-130 binding to uninfected cells), cross-reactivity between P. falciparum antigens is well-recognized and could significantly undermine the interpretation of experiments (PMID: 2654292 and 1730474 provide key examples of antigens recognized by antibodies raised against other proteins). For example, the surface localization in IFA experiments (Figure 2B(iii)) could reflect anti-PfGBP-130binding to an unrelated parasite surface antigen, a possibility not addressed by any of the authors’ controls. As another example, the iRBC lysate immunoblot using this antibody in Fig. 2B(iv) suggests a MW of 95 kDa, which corresponds to the unprocessed pre-protein before export; cleavage in the PEXEL motif yields a processed mature protein of 85 kDa, which should be readily resolved from the pre-protein in immunoblots (PMID: 19055692). A better immunoblot using immature infected cell stages might show both the pre-protein and the mature protein as a doublet band.

      We thank the reviewer for raising this important concern regarding antibody specificity. We agree that cross-reactivity among P. falciparum antigens is a known issue and have taken multiple steps to ensure specificity in our study. First, the anti-PfGBP-130 antibodies were generated against a defined recombinant fragment and show no detectable binding to uninfected RBCs and no signal in hIgG control immunoprecipitates, supporting specificity. Importantly, in our LC-MS/MS analysis of LFA-1 αI-domain pull-downs, PfGBP-130 was specifically enriched and consistently identified across replicates, independently validating the target recognized by the antibody. Furthermore, the same antibody detects a single dominant band in both iRBC lysates and αI pull-down fractions, arguing against widespread cross-reactivity. Regarding the apparent molecular weight (~95 kDa), we agree that this likely corresponds to the precursor form, and that a processed form (~85 kDa) may not be well resolved under our current conditions.

      (3) PfGBP-130 is not essential for in vitro cultivation (PMID: 18614010 and MIS of 1.0 in the piggyBac mutagenesis screen as tabulated on plasmodb.org, indicating a highly dispensable gene). The authors should use the knockout line as a control in their IFA localization experiments to address antibody specificity. More fundamentally, their model predicts that NK cells should not recognize or kill infected cells from the knockout line when compared to their untransfected parent. Such results with the knockout line would compellingly support the authors' model without reliance on antibodies that may cross-react with other parasite antigens. PMID: 18614010reported that the PfGBP-130 knockout exhibited increased membrane rigidity, suggesting an intracellular scaffolding protein rather than a surface localization and use as a ligand for LFA-1 interaction and NK cell-mediated killing.

      We agree that a PfGBP-130 knockout line would provide a powerful genetic validation of both antibody specificity and the proposed functional role of PfGBP-130 in NK cell recognition. At present, such experiments were not included in this study, and we acknowledge this as an important limitation. However, we would like to emphasize that our conclusion does not rely on antibody-based localization alone; rather, it is supported by multiple orthogonal approaches, including LFA-1 αI-domain pull-down coupled to LC-MS/MS, biophysical interaction analysis, receptor knockdown, and functional blocking assays. In addition, in one of our previous proteomic analyses of the membrane-enriched fraction of infected erythrocytes, PfGBP-130 was identified among the proteins present in the membrane fraction, supporting its association with the iRBC membrane compartment despite lacking a classical mature transmembrane domain.

      (4) PfGBP-130 non-essentiality raises the question of why the gene would be retained if it triggers NK cell-mediated killing of infected cells in vivo. Presumably, this killing would pose strong selective pressure against retention of PfGBP-130. Some speculation is warranted to support the model.

      We thank the reviewer for this thoughtful evolutionary question. We agree that if PfGBP-130 enhances NK-cell recognition, its retention likely reflects a context-dependent fitness trade-off rather than a simple benefit or cost. This situation is not unusual in P. falciparum: several exported or surface-associated proteins are retained despite being immunogenic because they also provide advantages in other settings, such as erythrocyte remodeling, cytoadhesion, niche adaptation, immune modulation, or transmission. The clearest precedent is the PfEMP1/var system, in which highly immunogenic surface antigens are nevertheless strongly maintained because they mediate sequestration and in vivo fitness, while antigenic variation limits continuous immune exposure (Chew et. al., 2022). Similarly, other variant surface antigens such as STEVOR and RIFIN are retained despite immune recognition because they contribute to erythrocyte binding, antigenic diversity, and immune evasion or modulation (Niang et. al., 2009; Sakoguchi et. al., 2025). More broadly, many P. falciparum genes that appear dispensable in standard in vitro culture are nevertheless preserved because culture does not recapitulate the selective pressures present in vivo, including splenic clearance, endothelial interactions, immune attack, and within-host competition.

      Reviewer #3 (Public review):

      (1) Anti-GBP130 antibodies are used in the cellular assays to block the interaction between GBP130 and LFA1. They should therefore also block interactions betweenGBP130 and LFA1 recombinant proteins in the biolayer interferometry experiment. Do the authors have data to show this? Similarly, the anti-CD11a antibodies used to block the interaction in the cellular assays should also block the in vitro interaction between recombinant LFA1 and GBP130.

      We thank the reviewer for this insightful suggestion. We agree that demonstrating antibody-mediated inhibition of the recombinant PfGBP-LFA-1 interaction would provide an additional orthogonal validation of the interface. While such blocking experiments were not included in the original BLI dataset, our current study already establishes the specificity of this interaction through multiple independent approaches, including αI-domain pull-down and LC-MS/MS identification, BLI-derived high-affinity binding (KD ~10<sup>-8</sup> M), structural docking, receptor knockdown, and antibody-mediated inhibition in cellular systems. We note that antibody-mediated blocking in a purified biophysical system is not always directly comparable to cellular assays, as epitope accessibility, orientation on biosensor surfaces, and conformational states of integrins (which are known to undergo activation-dependent structural changes) can influence inhibition efficiency. Nonetheless, we fully agree that this represents an important validation experiment.

      (2) The structural modelling analysis of the predicted complex between GBP130 andLFA1 (Figure 2cii) predicts that the majority of the important GBP130 interface residues are located in the region D509-N607. However, the authors present BLI data for the GBP130-LFA1 interaction, which used the N-terminal fragment of GBP (residues 69-270), which does not include the GBP130 residues predicted to be important for the formation of the complex between the two proteins. Could the authors provide an explanation for how an interaction was observed with theGBP130-N fragment, which does not contain the residues predicted to be important for interacting with LFA1?

      We thank the reviewer for this important observation. We agree that the structural model predicts a major interaction interface within the D509-N607 region of PfGBP-130; however, this does not preclude the existence of additional or auxiliary binding determinants within the N-terminal region used in our BLI assays (aa 69-270). PfGBP-130 is a multi-domain, repeat-containing protein, and such proteins frequently exhibit distributed or multivalent interaction interfaces, where individual regions can independently engage binding partners with lower affinity while the full-length protein achieves higher avidity through cooperative interactions. In our study, the BLI data using the N-terminal fragment demonstrate that this region is sufficient to mediate direct interaction with the LFA-1 αI domain, whereas the structural model based on full-length predictions likely captures a dominant or higher-affinity interface in the C-terminal region. Importantly, the interaction is supported by multiple orthogonal datasets, including pull-down/LC-MS/MS, cellular binding assays, and functional inhibition, indicating that the observed binding is not an artefact of fragment choice.

      Author response image 1.

      To further examine this, we performed docking and binding energy analyses comparing the full-length PfGBP-130-LFA-1 complex with the N-terminal domain-LFA-1 complex. Using the PRODIGY server, the predicted binding affinity for the full-length complex was -9.8 kcal/mol, whereas the N-terminal domain complex exhibited a still favorable binding energy of -5.6 kcal/mol. Similarly, HawkDock (v2) analysis yielded binding energies of -22.2 kcal/mol for the full-length complex and -14.1 kcal/mol for the domain-only complex. While reduced relative to the full-length protein, these values remain well within the range of stable protein-protein interactions, supporting the ability of the N-terminal region to independently contribute to binding. These energy calculations take into account all non-covalent interactions. For clarity, hydrogen bonds have been specifically highlighted in the figure to represent key interaction interface.

      (3) There is no section in the materials and methods describing how the BLI was performed; this should be added. The highest concentration ofGBP130 used in the interaction measurements is 1.4uM, almost 100x the measured Kd (0.015uM) for the GBP130-LFA1 interaction. At these high concentrations ofGBP130, I would expect to start seeing saturation of binding, but the interferometry curves show that saturation is not close to being reached. This strongly suggests that the binding of GBP130 to LFA1 is non-specific.

      We thank the reviewer for raising these important technical points. We have included a detailed description of the biolayer interferometry (BLI) methodology in the Materials and Methods section in the manuscript. Regarding the concern about lack of saturation at higher analyte concentrations, we respectfully disagree that this necessarily indicates non-specific binding. In BLI assays, incomplete saturation can arise from several well-recognized factors, including suboptimal orientation or partial inaccessibility of immobilized ligand on the biosensor, mass transport limitations, or heterogeneous binding populations particularly relevant for integrins such as LFA-1, whose αI domain exists in multiple conformational states with distinct affinities. Importantly, the interaction exhibits clear concentration-dependent association and dissociation kinetics that fit a 1:1 binding model with a KD in the nanomolar range, which is inconsistent with non-specific interactions that typically show poor fitting and minimal dissociation. Furthermore, the specificity of the PfGBP-LFA-1 interaction is supported by multiple independent lines of evidence in our study, including selective enrichment in αI-domain pull-downs, absence in IgG controls, reduction upon CD11a knockdown, and functional inhibition by blocking antibodies in cellular assays. We have now clarified these points in the revised manuscript and tempered the interpretation to acknowledge potential experimental constraints of BLI while maintaining that the cumulative data strongly support a specific interaction.

      Minor points:

      (1) For the pulldown experiments, can the authors confirm that cross-linking was also performed for the protein A beads + hIgG control?

      Yes, DTSSP cross-linking was performed identically in the protein A beads + hIgG control arm. This is consistent with the control design described in the manuscript.

      (2) If the recombinant CD11a I subdomain used as a probe is correctly folded and functional, it should bind ICAM1. Do the authors have this data?

      We agree that ICAM-1 binding is an important functional validation for the recombinant CD11a αI probe (Hogg et. al., 1998). The isolated αI domain of LFA-1 is well established as the principal ICAM-1-binding module, and soluble αI-domain reagents have previously been shown to bind/block ICAM-1 interactions. We did not include this control in the current version.

      (3) Were the authors able to perform the reciprocal pull-down, using pfGBP130-N-Fc to pull down LFA1 from cell surfaces?

      We did not perform a reciprocal pull-down with PfGBP130-N-Fc and native cell-surface LFA-1 in the present study; we agree this would be a useful orthogonal experiment.

      (4) After identifying GBP130 as a co-purifying protein in the LFA-1 pull-down experiments, the authors select an N-terminal fragment of GBP130 to recombinantly express and use. How did the authors narrow down which region of GBP130interacted with LFA-1?

      The N-terminal PfGBP130 fragment (aa 69-270) was selected empirically as a tractable, soluble recombinant segment containing a defined repeat-containing extracellular region, rather than because we had already mapped the full LFA-1-binding interface. We agree with the reviewer that our structural model suggests that additional residues, including a likely dominant interface outside this fragment, may contribute to the full interaction, and we have clarified that the N-terminal fragment should be interpreted as a minimal binding-competent region, not necessarily the sole binding site.

      (5) As erythrocytes age, their surface undergoes biochemical changes, most notably a drop in levels of sialylation, decreasing the net repulsive negative charge, and they generally become more adherent. Can the authors exclude the possibility that, rather than binding to a parasite-derived ligand, LFA alpha 1 is instead binding to a marker of older erythrocytes? In the data presented, increased binding of LFA alpha 1 is observed as parasites progress through the life cycle, but the host erythrocytes will be ageing during parasite replication, which could account for the increased levels of LFA alpha 1 binding. To rule out this explanation, data from LFA alpha 1 staining of age-matched uninfected erythrocytes could be provided.

      We agree that erythrocyte aging can alter surface sialylation and adhesiveness, and loss of sialic acid is known to reduce erythrocyte surface charge and increase adhesiveness. However, our data argue against aging alone explaining the signal, because LFA-1 αI-Fc binding was compared with uninfected RBC controls and the interaction led to enrichment of a parasite-derived ligand, PfGBP130, in pull-down/MS analyses.

      (6) Figure 3b(i) Surface staining of THP1 cells was performed using GBP-130 Fc as a probe, which should detect all LFA1-positive cells. But no accompanying staining data using an anti-LFA1 antibody are shown, so it is not possible to determine whether staining profiles with GBP-130 Fc match staining profiles with anti-LFA1 antibodies. This is important to show what proportion of LFA1-positive cells can recognise parasite-derived GBP-130 Fc.

      (7) Figure 3c(i) Surface staining of peripheral NK cells is performed using GBP-130 Fc as a probe, which should detect all LFA1-positive cells. Here, as well, there are no staining data using an anti-LFA1 antibody. This would allow a comparison between cell population LFA1 staining with an anti-LFA1 antibody and cell population LFA1 staining with GBP-130 Fc. The two staining profiles should be similar as both probes bind the same surface marker. However, it appears this might not be the case because the staining data using GBP-130 Fc show that only a minor proportion of NK cells (~20%) stain positive, but the majority of peripheral NK cells usually express CD11a, as it is a key adhesion molecule in the formation of immune synapses with target cells. This suggests that GBP-130 can only bind to a subset of NK cells, and if it is binding LFA1, then it can only play a role in mediating the formation of an immune synapse with this subpopulation of NK cells. Could the authors include a comment in the manuscript making clear that the GBP-130 only assists a small proportion of NK cells in adhering to parasite-infected erythrocytes? Are there any reasonable hypotheses as to whyGBP-130 was only able to stain a small subpopulation of LFA1-expressing NK cells?

      For minor comment 6 and 7

      We agree that parallel staining with anti-CD11a would help relate PfGBP130-Fc binding to total LFA-1-positive THP-1 and NK-cell populations. Importantly, LFA-1 expression and ligand binding competence are not equivalent, because integrin binding depends strongly on activation/conformation and avidity state; in NK cells, only a subset can display LFA-1 in a partially activated conformation at baseline despite broader CD11a expression. Thus, a smaller PfGBP130-Fc-positive subset than the total CD11a-positive population is biologically plausible and does not imply inconsistency.

    1. Cultivated Meat Workshop

      I think there is the same problem that we have seen before, which is just too much words and information on the page, getting people lost in reading. I would suggest put all notes to popover boxes.

    1. eLife Assessment

      This manuscript investigates inter-hemispheric interactions in the olfactory system of Xenopus tadpoles. Using a combination of electrophysiology, pharmacology, imaging, and uncaging, the transection of the contralateral nerve is shown to lead to larger odor responses in the un-manipulated hemisphere, and implicates dopamine signaling, likely originating from the lateral pallium, in this process. The study convincingly uses a rich and sophisticated array of tools to investigate olfactory coding, and uncovers valuable mechanisms of signaling likely to be conserved across vertebrates.

    2. Reviewer #1 (Public review):

      In this study, the authors investigate responses to methionine in the olfactory system of the Xenopus tadpole. They show that the LFP response is local to the glomerular layer, arises ipsilaterally, and is blocked by pharmacological blockade of AMPA and NMDA receptors, with little modulation during blockade of GABA-A receptors. They then show that this response is translently enlarged following transection of the contralateral olfactory nerve, but not the optic lobe nerve. Measurement of ROS- a marker of inflammation- was not affected by contralateral nerve transection, and LFP expansion was not affected by pharmacological blockade of ROS production. Imaging biased towards presynaptic terminals suggests that the enlargement of the LFP has a presynaptic component. A D2 antagonist increases the LFP size and variability in intact tadpoles, while a GABA-B antagonist does not. Finally, the authors provide anatomical and physiological evidence that the contralateral dopamine signal may arise from the lateral pallium. Overall, I found the array of techniques and approaches applied in this study to be creatively and effectively employed.

    3. Author response:

      The following is the authors’ response to the original reviews.

      Public Reviews:

      Reviewer #1 (Public review):

      In this study, the authors investigate LFP responses to methionine in the olfactory system of the Xenopus tadpole. They show that this response is local to the glomerular layer, arises ipsilaterally, and is blocked by pharmacological blockade of AMPA and NMDA receptors, with little modulation during blockade of GABA-A receptors. They then show that this response is translently enlarged following transection of the contralateral olfactory nerve, but not the optic lobe nerve. Measurement of ROS- a marker of inflammation- was not affected by contralateral nerve transection, and LFP expansion was not affected by pharmacological blockade of ROS production. Imaging biased towards presynaptic terminals suggests that the enlargement of the LFP has a presynaptic component. A D2 antagonist increases the LFP size and variability in intact tadpoles, while a GABA-B antagonist does not. On this basis, the authors conclude that the increase driven by contralateral nerve transection is due to DA signaling.

      Overall, I found the array of techniques and approaches applied in this study to be creatively and effectively employed. However, several of the conclusions made in the Discussion are too strong, given the evidence presented. For example, the authors state that "The observed potentiation was not related to inflammatory mediators associated to inury, because it was caused by a release of the inhibition made by D2 dopamine receptor present in OSN axon terminals." This statement is too strong - the authors have shown that D2 receptors are sufficient to cause an increase in LFP, but not that they are required for the potentiation evoked by nerve transection. The right experiment here would be to get rid of the D2 receptors prior to transection and show that the potentiation is now abolished. In addition, the authors have not shown any data localizing D2 receptors to OSN axon terminals.

      Similarly, the authors state, "the onset of LFP changes detected in glomeruli is determined by glutamate release from OSNs." Again, the authors have shown that blockade of AMPA/NMDA receptors decreases the LFP, and that uncaging of glutamate can evoke small negative deflections, but not that the intact signal arises from glutamate release from OSNs. The conclusions about the in vivo contribution of this contralateral pathway are also rather speculative. Acute silencing of one hemisphere would likely provide more insight into the moment-to-moment contributions of bilateral signals to those recorded in one hemisphere.

      We thank the reviewer for their positive evaluation of our manuscript. We agree with their opinion about the necessity of including new experimental evidence to back up discussion and conclusions

      Recommendations for the authors:

      Reviewer #1 (Recommendations for the authors):

      This is a creative and careful study, but I felt that the conclusions in the Discussion were too strong. I think these could either be toned down or additional experiments could be done to support the idea that D2 receptors are required for the nerve transection-evoked potentiation, that the source of glutamatergic input is OSNs, and that contralateral interactions are mediated by DA. In particular, I think anatomical stains showing which neurons are carrying the DA signal and whether there is any potentiation of DA release after nerve transection would greatly strengthen the conclusions.

      This new version of the manuscript contains two new figures: 6 and 9.

      New figure 6 addresses the suggestion of this reviewer and provides anatomical evidence for the distribution of dopaminergic neurons in the olfactory bulb of X. tropicalis tadpoles using a tyrosine hydroxylase antibody (mouse monoclonal, Immunostar cat. no. 22941, 1:250; RRID:AB_57226). We identified a discrete neuronal population present in the border between the mitral cell layer and the glomerular layer that resembles the type1 TH+ population described in adult frogs (Boyd and Delaney 2002). TH+ neurons send their processes to innervate olfactory glomeruli and we provide evidence that they contact the GFP lateral glomerulus labelled in Dre.mxn1:GFP X. tropicalis tadpoles (Fig. 6C). These results reinforce a modulatory role for dopamine on glomerular neurotransmission. Materials & methods (lines 152-167), results (lines 393-399) and discussion (lines 550-563) have been modified accordingly.

      Figure 9 provides new evidence on the interhemispheric connections involved in the potentiation of glomerular responses. We first demonstrate that dorsolateral pallial neurons participate in the processing of olfactory information based on the general consideration that the lateral pallium is an olfactory cortex. We confirmed this possibility by stimulating the olfactory epithelium and recording ipsilateral calcium transients in pallial neurons of tubb2b:GCaMP6s tadpoles. We next injured the dorsolateral pallium and 24-48h afterwards we recorded odor-evoked responses in the GFP labelled glomerulus located contralaterally. We observed a ~70% potentiation of responses, which was comparable to the ~75% potentiation obtained by olfactory nerve transection. These results illustrated the involvement of pallial neurons in the control of glomerular output by likely modifying the activity of TH+ neurons. The results (473-506) and discussion (569-576) now include these new results.

      Does the contribution of DA signalling change across development? I think this would be helpful to interpret the results and relatively straightforward to do: apply raclopride at different developmental stages and measure how much potentiation occurs at each stage.

      This is indeed an interesting point, but conducting a comprehensive study of dopamine release throughout development would require a substantial amount of work and delay the publication of this paper. To perform these experiments, we should first implement new technical approaches, such as successfully injuring young tadpoles or recording from late premetamorphic stages. We believe that the proposed experiments could define a new line of arguments rather than complement the present work. Nonetheless, we acknowledge the suggestion of this reviewer.

      In this new version, we provide strong evidence for dopamine release in the glomerular layer, and a key question that arises is the nature of TH+ positive neurons. Recent findings obtained in mice show that there are five different types of dopaminergic interneurons present in the olfactory bulb (Kosaka, Pignatelli, and Kosaka 2020), and important functional differences exist between axon-bearing and anaxonic neurons (Dorrego-Rivas et al. 2025). This evidence suggests a key role for development. A completely new study based on transgenic X. tropicalis displaying labeled TH+ neurons could bring together development, anatomy, and physiology to gain an understanding of how dopaminergic signaling shapes glomerular function.

      In addition, there are several places where showing additional raw data in the figures and carefully quantifying variability would be helpful. For example, in Figure 3B, the authors should show equivalent raw traces from intact and transected tadpoles. In Figure 5D, it would be helpful to show raw traces for LFP equivalent to what is shown for presynaptic imaging in Figure 5E. In Figures 6E-F, it would be helpful to show raw traces.

      Thank you for this suggestion. The examples have been added to the figure panels.

      I found the last experiment with photobleaching somewhat inconclusive, and I am not sure what it adds to the study as presently written. Line 418: Please quantify how many OSNs remained. Line 423: What is the hypothesis for the source of variability?

      The goal of this experiment is to investigate the participation of chemotopy in the potentiation induced by contralateral injury. The elimination of 30-50% of topographically related OSNs did not alter contralateral glomerular responses. This evidence suggests that chemotopy was not relevant to the gain of function observed ; however, we cannot completely rule out a certain topographical contribution, as it was not possible to completely silence all inputs of the studied glomerulus. We now link these findings to the likely innervation of several glomeruli by TH+ neurons, which suggests the absence of a one-to-one glomerulus relationship. LFP amplitudes and their variance are now illustrated in box plots to highlight the absence of significant differences. Lines (457-471).

      An increase in the variance among the recordings obtained is a consistent empirical observation. Although it is a hallmark of the potentiation recorded, we cannot provide a mechanistic explanation. Considering that neurotransmitter release from OSN axon terminals is normally inhibited by dopamine, we hypothesize that disinhibition drives an increase in release probability , leading to larger variations in glutamate release. Such variations could be reflected in the amplitude of LFP negativities.

      It would be helpful to include a measurement of LFP over time so we have some idea of how stable the odor delivery is.

      The amplitude of LFP responses was stable for >30 min. Figure 3B shows recordings obtained during 30 min and new Figure 7F over 42 min. We believe that these examples illustrate that the amplitude, as well as kinetics of the responses obtained were consistent over the period studied.

      Line 227: Small upward deflection - could this be an electrical artifact? Can you run the stimulus delivery with no odor (say, with water) to see if you get the same signal?

      We do not know the precise source of this upward deflection. It is not an electrical artifact related to stimulation, which is sometimes evident (Fig 7A, methionine application). When present, it occurs after the activation of OSNs. One possibility is that the deflection originates in the layer of nerve fibers reflecting some aspect related to the conduction of APs and the relative position of the electrode. Interestingly, some recordings of LFP responses at the level of glomeruli carried out in rats also show a positive deflection (see Figs. 1B, 2A, 3B in (Lecoq, Tiret, and Charpak 2009), thus suggesting it is an intrinsic characteristic of this type of recordings.

      Line 237-239: I wasn't clear from the text whether this was a variation due to development, to transection, or natural variability.

      We now indicate that the relationship reflects normal development (lines 261-264).

      Line 521: N-type VGCCs: can these be targeted with pharmacology to strengthen the argument?

      We acknowledge this suggestion but we have not carried out these experiments as we believe that the interpretation could be complex due to the high density of synapses present in glomeruli and the likely involvement of other types of VGCCs in neurotransmitter release.

      Small issues:

      (1) Line 190-196: Some of this could potentially be moved to the Discussion section.

      These are some arguments to defend the validity of our experimental approach to record the response of the lateral glomerulus labeled by GFP. If we move them to the discussion, the information related to the spatial extent of our recordings would be split between results and discussion. We believe that the current format of the paper allows to focus the discussion on the interpretation of the results obtained.

      (2) Line 268: exponential recover phase.

      Thanks. Corrected.

      (3) Line 278: affected to -> arises from

      Thanks. Corrected.

      (4) Line 282: affect to -> can affect.

      Thanks. Corrected.

      (5) Line 403: 2Phatal technique: Please state briefly what this is

      It is now indicated: two-photon chemical apoptotic targeted ablation (2Phatal).

      NOTE:

      During the revision of this manuscript we realized that Figures 3C and 4B indicated mean±SD. The panels have been amended to show mean±s.e.m.

      References

      Boyd, J. D., and K. R. Delaney. 2002. "Tyrosine hydroxylase-immunoreactive interneurons in the olfactory bulb of the frogs Rana pipiens and Xenopus laevis." J Comp Neurol 454 (1):42-57. doi: 10.1002/cne.10428.

      Dorrego-Rivas, A., D. J. Byrne, Y. Liu, M. Cheah, C. Arslan, M. Lipovsek, M. C. Ford, and M. S. Grubb. 2025. "Strikingly different neurotransmitter release strategies in dopaminergic subclasses." Elife 14. doi: 10.7554/eLife.105271.

      Kosaka, T., A. Pignatelli, and K. Kosaka. 2020. "Heterogeneity of tyrosine hydroxylase expressing neurons in the main olfactory bulb of the mouse." Neurosci Res 157:15-33. doi: 10.1016/j.neures.2019.10.004.

      Lecoq, J., P. Tiret, and S. Charpak. 2009. "Peripheral adaptation codes for high odor concentration in glomeruli." J Neurosci 29 (10):3067-72. doi: 10.1523/JNEUROSCI.6187-08.2009.

    1. eLife Assessment

      This important study addresses the unresolved and long-debated question of whether atypical protein kinase C is required for the maintenance of synaptic potentiation and long-term memory. The convincing results confirm previous findings that persistent activity of PKMζ is required for lasting potentiation of hippocampal synapses and spatial memory. The study also adds new genetic evidence to support the earlier suggestion that enhanced expression of PKC iota/lambda compensates for the genetic reduction of PKM zeta to support synaptic potentiation and memory.

    2. Reviewer #1 (Public review):

      Summary:

      The authors convincingly demonstrate that when PKMzeta is genetically deleted from the hippocampus, the related atypical PKC, PKClambda is upregulated and compensates both neurophysiologically and behaviorally for the missing PKMzeta. Specifically, the upregulatiion of PKClambda supports late-phase hippocampal long-term potentiation (L-LTP) and long-term spatial memory in the PKMzeta knockout mice.

      Strengths:

      The study uses up-to-date transgenic techniques to alter the expression of the two atypical PKCs. The synaptic and behavioral experiments are well-controlled and appear to have been carefully executed.

      Weaknesses:

      None

    3. Reviewer #2 (Public review):

      Summary:

      The authors significantly advance understanding of the role of unconventional PKC's, PKCM𝛇 and PKC𝜄/𝝀 in maintenance of late-phase LTP. Their results help to clarify the interplay between "structural" and "biochemical/enzymatic" mechanisms of LTP and learning in the hippocampus.

      Strengths:

      A strength is the use of state-of-the-art conditional knock-outs of PKCM𝛇 and PKC𝜄/𝝀 to confirm that PKC𝜄/𝝀 compensates for KO of PKCM𝛇 in the hippocampus to maintain long-term potentiation even when PKCM𝛇 is conditionally knocked out in the adult. The authors use both electrophysiological and behavioral methods to assess the effects of genetic manipulations on late-phase LTP and long-term memory. The authors present an informative discussion of the possible molecular mechanisms that may enable compensation by PKC𝜄/𝝀 for KO of PKCM𝛇 in the hippocampus. They correctly emphasize that the notions of "structural" and "enzymatic" mechanisms for maintenance of LTP are not mutually exclusive. With this publication, the experimental case for a role of PKCM𝛇 in maintenance of late-phase LTP is now quite strong.

      Weaknesses:

      There are no significant weaknesses.

    4. Author response:

      The following is the authors’ response to the original reviews.

      Public Reviews:

      Reviewer #1 (Public review):

      Summary:

      An ongoing controversy in the field of learning and memory is the specific neural mechanism that maintains long-term memory (LTM). A prominent hypothesis proposed by Sacktor and Fenton and their colleagues is that LTM is maintained by the ongoing activity of the atypical PKC isoform PKMζ. Early evidence in support of this hypothesis came from experiments showing that an inhibitory peptide, ZIP, whose activity was purported to be specific for PKMζ, blocked late-phase hippocampal LTP (L-LTP) and LTM. However, in 2013, two articles reported that LTM was normal in PKMζ knockout mice and that ZIP erased LTM in the knockout mice, indicating that ZIP lacked specificity for PKMζ. In response, Sacktor and Fenton and colleagues reported in 2016 that in PKMζ null mice, there is an increase in the expression of PKC𝜾/𝛾, a related isoform of atypical PKC, and this increased expression can compensate for PKMζ; their data indicated that the upregulation of PKC 𝜾/𝛾 mediates L-LTP and LTM in the PKMζ. In the present article, the authors provide additional support for this idea. They replicate the finding of an upregulation of PKC 𝜾/𝛾 expression in the hippocampus of PKMζ knockout mice; in addition, they show that the expression of several other PKC isoforms is upregulated in the knockouts. They find that down-regulation of PKC𝜾/𝛾 expression in the hippocampus using the Cre-LoxP technology, the 2016 paper merely used an inhibitor to block the activity of PKC𝜾/𝛾-blocks L-LTP. Finally, the authors demonstrate that, although LTM is preserved in the single PKMζ knockout mouse, it is eliminated in the PKMζ/PKC𝜾/𝛾 double knockout mouse.

      Strengths:

      The experiments appear to have been carefully executed, the results reliable, and the paper well-written. Overall, the article provides significant additional support for the idea that the activity of PKMζ is critical for the maintenance of hippocampal L-LTP and LTM. The article uses genetic methods, rather than simply pharmacological ones, to demonstrate that when PKMζ is genetically deleted, PKC𝜾/𝛾, compensates for the missing PKCζ.

      Weaknesses:

      The paper sets up what I believe is probably a false dichotomy between a structural explanation - a change in the number of synaptic connections among neurons - and the persistent kinase activity explanation for memory maintenance. Why are these two explanations necessarily antithetical? It is possible that an increase in synaptic connections and the ongoing activity of PKMζ both contribute substantially to memory maintenance. The authors certainly don't provide any evidence that the number of synapses in the hippocampus remains unchanged after the induction of L-LTP or LTM. Indeed, I see no reason why persistent PKMζ activity could not be a mechanism for the maintenance of an enhanced number of synaptic connections following the induction of LTP/LTM. To the best of my knowledge, this possibility has not yet been explored. Consequently, I don't see why the present results would lead one to favor a biochemical explanation over a structural one for memory maintenance. Given the significant experimental evidence that LTM involves persistent structural changes in neurons, both explanations are equally plausible at present.

      As requested, we eliminated the discussion of a dichotomy between structural and biochemical mechanisms of long-term memory in the Abstract and Introduction. We now briefly address the relationship between the two hypotheses, which are not mutually exclusive, in the Discussion.

      Reviewer #2 (Public review):

      Summary:

      The authors are attempting to advance understanding of the role of unconventional PKCs, PKCM𝛇, and PKC𝜄/𝝀 in maintenance of late-phase LTP. Their results help to clarify the interplay between "structural" and "biochemical/enzymatic" mechanisms of LTP and learning in the hippocampus.

      Strengths:

      A strength is the use of conditional knock-outs of PKCM𝛇 and PKC𝜄/𝝀 to assess the role of these two enzymes in maintaining long-term potentiation and in compensating for each other when one of them is conditionally knocked out in the adult.

      Weaknesses:

      The paper is extremely difficult to read because the abstract does not clearly state the advances made over earlier studies by the use of conditional KO mutation. For example, in line nine of the abstract, the authors state, "Here, we found PKC𝜄/𝝀 persists in LTP and long-term memory when PKM𝛇 is genetically deleted." This is confusing because it sounds as though the experiments have repeated earlier published experiments in which the gene encoding PKM𝛇 is deleted in the embryo. The authors are not clear throughout the manuscript that they are using conditional KO of the two enzymes in the adult animal, rather than deletion of the gene. The term "genetically deleted" does not mean "conditionally deleted in the adult." The final sentences of the abstract are: "Whereas deleting PKM𝛇 and PKC𝜄/𝝀 individually induces compensation, deleting both aPKCs abolishes hippocampal late-LTP. Hippocampal 𝜄/𝝀-𝛇 -double-knockout eliminates spatial long-term memory but not short-term memory. Thus, in the absence of PKM𝛇 , a second persistent biochemical process compensates to maintain late-LTP and long-term memory." These sentences do not convey a clear logical conclusion. The Discussion does a better job of stating the importance of the experiments.

      We have clarified the genotypes of the mice in the abstract and throughout the text.

      Reviewer #3 (Public review):

      Summary:

      The manuscript addresses an important, yet unresolved and long-debated, question: whether atypical protein kinase C is required for the maintenance of late-long-term synaptic potentiation (L-LTP) and long-term memory (LTM). The authors confirm previous findings that persistent activity of PKMζ is required for hippocampal L-LTP and spatial memory. They demonstrate that genetically deleting PKCι/λ and PKMζ individually induces compensatory upregulation, whereas deleting both atypical PKCs abolishes hippocampal L-LTP spatial long-term memory. The study uses an elegant combination of immunoblots, electrophysiology, and behavioral assays. The use of Cre-recombinase to target specific hippocampal regions and neurons adds to the rigor of the findings.

      Strengths:

      The manuscript addresses an important, yet unresolved and long-debated, question; whether PKMζ is required for the maintenance of L-LTP and LTM. The study demonstrates that PKCι/λ, which was previously shown to be critical for the initial generation of the early phase of LTP and short-term memory, becomes persistently active in L-LTP and LTM in a PKMζ knock-out model, compensating for the loss of PKMζ. Furthermore, when the compensation mechanisms are eliminated by simultaneous deletion of both PKMζ and PKCι/λ, maintenance of LTP and long-term spatial memory, but not of short-term memory, is diminished. The strength of this study is that the authors used a double-knockout strategy to directly address the controversy concerning the roles of PKMζ in memory formation. By showing that PKCι/λ compensates when PKMζ is deleted, the authors provided a compelling explanation for previous contradictory findings.

      Weaknesses:

      (1) The authors should provide the numerical values for all data.

      (2) It appears that blind procedures were only used for the behavioral experiments. Some explanation is warranted.

      (3) The description of the immunoblotting procedures lacks sufficient detail. The authors state that immunoblots were stained with multiple antisera to visualize multiple PKCs on the same immunoblot. To conserve antisera, the immunoblots were cut to isolate the relevant proteins based on molecular weight. Isoforms with similar molecular weights were either stained with antisera of different species or on separate blots. Despite this explanation, it is unclear how immunoblotting was performed in practice. For example, in Figure 1B, the authors compared the changes of four conventional PKC isoforms. Because all four antibodies are mouse monoclonal antibodies recognizing proteins of similar molecular weights, each probing should presumably have its own actin loading controls. However, these controls are missing from the figure. Some clarification is warranted.

      (4) The statement in the legend to Figure 4B, that the increases of maximum avoidance time from pretraining to trial 1 are not different, indicates both groups of mice successfully established short-term memory, which is not correct. The analysis only reveals that there is no difference between the two groups. No differences could be due to both groups learning the same, as the authors suggest, or alternatively to no learning in either group.

      (5) The labeling on some of the illustrations (e.g., Figure 2B) is unreadable.

      (6) In Figure 4B, only the single statistical comparison between "pretaining" and "1 trial" is shown. The other comparisons described in the legend should also be illustrated.

      (7) There is no documentation to support the statement that "The prevailing textbook mechanism for how memory is retained asserts that stable structural changes at synapses, the result of initial protein synthesis and growth, sustain memory without the need for ongoing biochemical activity dedicated to storing information" or for the statement in the Discussion that the structural model of memory storage is the standard account.

      (1) Numerical data used in statistical analyses are now provided for LTP experiments in Figure 4 figure supplement 1. Numerical values for all other experiments are presented in the figures.

      (2) Blind procedures were performed for all experiments except for LTP experiments that involved the transfection of eGFP as control, as the eGFP could be detected visually in the hippocampal slice by the experimenter. This is now clarified in the Statistics section of the Methods.

      (3) The description of immunoblotting was clarified in the Methods, and actin loading controls presented for all immunoblots in Figure 1 and Figure 1 figure supplements 1 and 2.

      (4) Short-term memory (Figure 5B) is now determined by 2 methods. First, we show that for both groups the times to enter the shock zone increase in the first training trial, as compared to the pretraining session with the shock off. The increases are not different between the groups. Second, we show increases of the maximal avoidance time from pretraining to trial 1 for both groups are significant, and that the increases are not different. These data show that short-term memory was present in both groups and not measurably different between the groups.

      (5) The fonts of the figure labels were enlarged.

      (6) The comparisons between pretraining and training trial 1 and between training trials 1 and 3 for the two groups are now shown in Figure 5B.

      (7) We abbreviated our discussion of the structural model, which is now presented at the end of the Discussion (as per Reviewer 1), and removed the comment that it is the prevailing view, stating instead that the hypothesis is “widely held.”

      Additional points: As requested, the timing of tamoxifen injections and tissue collection for immunohistochemistry is clarified in the protocol schematic of a new Figure 2A and Figure 2A legend.

    1. Simplest Model

      This model is simple for researchers. However, for the purpose of reference by the general public, it may be still a overwhelming of information. Do we want to show this model during the workshop?

    1. 2036

      Given that the simple model provides year-based estimation and to make our question easier to answer, I would suggest to first ask "estimate of 2026", "estimate of 2031" then "estimate of 2036". This is consistent with short-medium-long run

    1. the disagreement

      This kind of disagreement may come from institutional factors. For instance, location/country-based cost difference (exchange rate?) I would suggest to adjust the question a little bitso that estimations are on the same level. I have provided notes also on the question page.

    2. Download slides (PDF, 2.7 MB) →

      The slide looks good here and works as a good supplementary. From audience perspective, I would be happy to preview. However, from experiment design perspective, this may effect the results of belief (say cost estimation). But no big problem.

    1. These tools are ideal for quick, hassle-free editing.

      These tools are ideal for quick, hassle-free editing.

      ai powered micro-saas value propositon include

      The Revolution will stat with no sign up

      No

      • sign up (hassle free)
      • storing of your data (privacy)
      • emails
      • tracking or
      • accounts
    1. Free Spell Checker (no sign-up required) - QuillBot AIQuillBothttps://quillbot.com › spell-checkerQuillBothttps://quillbot.com › spell-checkerQuillBot's free spell checker will automatically find and correct your spelling errors. Our spell checker will improve your writing and allow you to convey ...4,8(10 721) · Free · ‎Business/Productivity   More information about the review ratings.Reviews aren’t verified by Google Search

      Free Spell Checker (no sign-up required) - QuillBot AI

      QuillBot

      (no sign-up required)

      game changer top value proposition

      vibe coded micro SaaS

      sole entrepreneurship

    1. I think the part about going viral is interesting because it shows that fame online is not always positive. Many people want attention, but sudden attention can feel stressful or scary. It also connects to recommendation algorithms because platforms reward posts that get strong reactions. I wonder if social media should give users more control when their posts suddenly go viral.

    1. eLife Assessment

      This valuable study reports that the ALDH-abundant cells display stem cell properties and may play a key role in the endometrial epithelial development in the mouse. The data supporting the main conclusion are solid, although further improvements are needed to strengthen the conclusions. This work will be of great interest to reproductive biologists and biomedical researchers working on women's reproductive health.

    2. Reviewer #1 (Public review):

      The manuscript by Tang et al. characterizes the expression dynamics and functional roles of aldehyde dehydrogenase 1 activity in uterine physiology. Using a combination of in vivo lineage tracing and cell ablation coupled with organoid culture, the authors propose that Aldh1a1 lineage-marked cells contribute to uterine gland development and epithelial regeneration. The descriptive data will be of interest to reproductive biologists and clinicians and will build on established hypotheses in the field. The manuscript is well written and scientifically sound; however, several experimental limitations and interpretation caveats should be addressed.

      The methods surrounding the passage number and duration of culture following sorting prior to transcriptomic profiling should be clarified in the figure legends. Related to this, the representative images in Figures 1D and 1E do not appear consistent with the quantification presented in Figures 1F-H and should be reconciled.

      The conclusion that ALDH1A1+ cells are enriched in populations with stem cell characteristics relies primarily on transcriptomic analysis. Protein-level co-localization should be performed to strengthen this claim.

      The overlap of 19 genes between the data set here and AXIN2 HI data is presented as evidence of shared stemness identity, but no statistical assessment of this overlap is provided. A hypergeometric test should be performed to determine whether this overlap is greater than expected by chance.

      The impact of tamoxifen injection on Aldh1a1 expression should be characterized in the neonatal uterus, as tamoxifen itself has known estrogenic activity that could confound interpretation of the lineage tracing results at early postnatal timepoints. Related to this, while low-dose tamoxifen is shown to label individual cells within 24 hours of injection, the translation dynamics of the label following Cre-mediated recombination can require up to 72 hours. The presence of only a few labeled clones at PND8 but multiple separate clones per cross-section at later timepoints warrants discussion and may reflect labeling kinetics rather than clonal expansion.

      It would strengthen the in vivo ablation data to validate the degree of cell death following diphtheria toxin treatment directly. It is possible that a general decrease in cell number rather than specific loss of a stem cell population is responsible for the observed reduction in gland number and FOXA2 expression (Tongtong et al 2017).

      The lineage tracing data in the postpartum endometrium demonstrate that Aldh1a1-marked cells are present during regeneration, but it remains unclear whether these cells are preferentially activated or expanded in response to tissue injury. Coupling these studies with diphtheria toxin-mediated ablation during active regeneration would more directly test the proposed regenerative role of this population.

      The contribution of stromal Aldh1a1 lineage-positive cells is underexplored in the discussion, given the lineage tracing data showing stromal labeling across multiple timepoints and its potential relevance to mesenchymal-to-epithelial transition.

      Finally, the word 'control' may overstate the functional evidence presented. 'Contribute' may be more accurate given the partial and context-dependent nature of the phenotypes observed.

    3. Reviewer #2 (Public review):

      Tang et al. investigated the contribution of Aldh1a1+ cells, as putative stem/progenitor cells, to endometrial development, maintenance during the estrous cycle, and postpartum repair in mouse models. They employed in vitro organoid formation and in vivo lineage tracing models coupled with RNA-seq to test the stem-ness of Aldh1a1+ cells. They found that mouse endometrial cells with high ALDH activity (using the ALDEFLUOR assay) formed more and larger organoids and were enriched for stem/progenitor cell gene signatures. Similar results were shown using endometrial cells from a human patient sample. Epithelial ALDH1A1 expression was shown to be hormonally regulated, becoming more restricted to the glands, a putative epithelial stem cell niche, under estrogen stimulation. Using lineage-tracing initiated postnatally/prepubertally, Aldh1a1+ epithelial cells were shown to expand, contributing to both the luminal and glandular epithelium into adulthood, whereas adult initiation of labeling showed expansion of stromal Aldh1a1+ cells but not epithelial. Postnatal ablation of single-labeled Aldh1a1+ epithelial cells resulted in impaired gland development. Lastly, Aldh1a1-lineage traced cells (adult labeled) were present during postpartum endometrial repair as were epithelial/mesenchymal transitional cells.

      This study addresses an important area of research in the field of endometrial stem/progenitor cell biology. The authors are commended for their use of multiple complementary methods, including lineage tracing, DTR-mediated cell ablation, organoid assays, and RNA-seq in mouse and human models to assess the stem-like nature of Aldh1a1+ cells. The data support the stem/progenitor phenotype of Aldh1a1+ epithelial cells during endometrial development; however, there are noted discrepancies between organoid formation assays and lineage tracing experiments regarding the stemness of Aldh1a1+ epithelial cells in adults. Specifically, organoids were generated from adult cells and demonstrated in vitro stem cell activity; however, in vivo lineage-tracing of adult cells either during the estrous cycle or postpartum repair does not show expansion of Aldh1a1+ cells, suggesting they do not have stem/progenitor activity. Additionally, the stem-ness of epithelial vs stromal Aldh1a1+ cells is confounded in the study because epithelial cells were not purified for organoid experiments, epithelial cells were not exclusively lineage-traced as stromal cells were also labeled, and mesenchymal-epithelial transition was suggested to occur during postpartum repair. The following specific comments are presented to detail these concerns:

      (1) The statement in the brief summary, "...critical for lifelong endometrial regeneration," is not supported by the data provided.

      (2) AlDH1A1 is not restricted to the endometrial epithelium, and epithelial cells were not purified by flow cytometry for experiments in Figure 1. Figure 2 clearly shows the presence of mesenchymal cells, even using the described method for enriching for epithelial cells. Therefore, contaminating mesenchymal cells with high ALDH activity may confound the experimental results in Figure 1, either through promoting epithelial cell growth or through MET. The authors should provide clear evidence of epithelial purity in organoid experiments or that mesenchymal cells are not contained in the ALDHhi population. These comments also apply to the human organoid experiments in Figure 7.

      (3) Lines 186-187: Susd2 was increased in EpSC clusters, yet this is a mesenchymal stem/progenitor marker in humans. The authors should discuss the implications of this.

      (4) In Figure 5, RFP+ epithelial cells should be quantified as in previous figures to substantiate the statement in lines 279-280, "At PPD5, the proportion of RFP+ epithelial cells had expanded relative to PPD1 and PPD3 (Figure 5E-E')." Especially because in the low mag images (C-E), RFP+ epithelial cells appear to be most abundant at PPD1 and decrease at PPD3 and PPD5, suggesting that they may not be involved in endometrial regeneration/repair (contradicting the interpretation in line 285). Further, if there is in fact a decrease over postpartum repair, then regeneration should be removed from the title of the manuscript. RFP+ stromal cells should also be quantified.

      (5) For Figure 7F, it should be clearly stated in the main text that the results are from one patient sample and the data presented are experimental replicates, so as not to be confused with biological replicates (the same for Supplementary Figure S4). Were B and G in Figure 7 also from one patient?

      (6) Lines 425-427: "Ovariectomized mice treated with 90-day E2 pellets, on the other hand, showed a complete restriction of ALDH1A1 to the glandular crypts." In Figure 2 S' ALDH1A1+ cells are visible in the LE (the staining is lighter than in the GE but looks real), contradicting this statement.

      (7) Lines 466-467: "In cycling mice, we found sporadic cells that expressed both stromal and epithelial markers in the ALDHA1+ cells." These data are not presented.

      (8) These data support the role of Aldh1a1+ cells in endometrial epithelial development, but conclusions about their role in repair/regeneration should be tempered as the data are much weaker here.

    4. Reviewer #3 (Public review):

      Summary:

      Tan et al demonstrated the importance of ALDH-high cells in the epithelial development in the mouse endometrium, and these cells displayed properties of stem cells.

      Strengths:

      The findings are solid, supported and validated through a combination of technical methods. I appreciated this combined use of mouse and human endometrial cells to strengthen the findings. Genomic results from a single-cell sequencing dataset were informative as they depicted the different stages of the estrus cycle during the regeneration process. Verification with immunostainings with various markers made it convincing for readers to visualize the cell's location, progression, and status at different timepoints. Utilizing human endometrial cells further demonstrated that the phenomenon observed in mice can be translated to humans.

      This work will greatly advance the understanding of endometrial regeneration for reproductive biologists.

      Weaknesses:

      No major weaknesses were identified by this reviewer.

    1. eLife Assessment

      This important study examines the evolution of virulence and antibiotic resistance in Staphylococcus aureus under multiple selection pressures, specifically host immune function and antibiotic exposure. The evidence presented is convincing, supported by rigorous phenotypic and genomic data from within-host evolution experiments. The manuscript now provides a nuanced and robust interpretation of how pathogens adapt to complex selective landscapes.

    2. Reviewer #1 (Public review):

      Summary:

      The authors investigate how methicillin-resistant (MRSA) and sensitive (MSSA) Staphylococcus aureus adapt to a new host (C. elegans) in the presence or absence of a low dose of the antibiotic oxacillin. Using an "Evolve and Resequence" design with 48 independently evolving populations, they track changes in virulence, antibiotic resistance, and other fitness-related traits over 12 passages. Their key finding is that selection from both the host and the antibiotic together, rather than either pressure alone, synergistically results in the evolution of the most virulent pathogens. Genomically, they find that this adaptation repeatedly involves parallel mutations in a small number of key regulatory genes, most notably codY, agr, and saeRS.

      Strengths:

      The main advantage of the research lies in its strong and thoroughly replicated experimental framework, enabling significant conclusions to be drawn based on the concept of parallel evolution. The study successfully integrates various phenotypic assays (virulence, growth, hemolysis, biofilm formation) with whole-genome sequencing, offering an extensive perspective on the adaptive landscape. The identification of certain regulatory genes as common targets of selection across distinct lineages is an important result that indicates a level of predictability in how pathogens adapt. Furthermore, the detailed mapping of specific parallel mutations provides a highly useful genomic resource for the microbiology community.

      Revisions and Re-Appraisal:

      In the initial version of the manuscript, a primary limitation was the use of causal language to link specific mutations to phenotypes, despite the evidence from the evolution experiment being correlational. In this revised version, the authors have excellently addressed this limitation. They have meticulously revised the text to accurately reflect these relationships as strong, statistically significant genetic associations rather than confirmed facts. Furthermore, they explicitly acknowledge that future ancestral reconstruction experiments will be required to confirm direct causality. The authors have also appropriately clarified the visual interpretations of their data (such as the PCA clustering) and refined their discussion of mutation rates. With these revisions, the claims made are fully supported by the data presented.

      Impact and Context:

      The authors successfully achieve their aims, demonstrating that the combined effects of host and antibiotic pressures collaboratively propel the evolution of heightened virulence. While the nematode model does not perfectly mimic human or mammalian infection, the evolutionary principles uncovered here are highly relevant to both evolutionary biology and infectious disease management. The evidence presented is compelling, and the strong correlational hypotheses generated by this study offer a robust and significant basis for upcoming mechanistic research into pathogen adaptation.

      Comments on revisions:

      I commend the authors for their thorough, thoughtful, and highly constructive revision. You have successfully addressed all of my major and minor comments. The addition of Table S2 and the careful revisions to the causal language have significantly strengthened the manuscript and clarified the data interpretation. I have no further recommendations. Great work!

    3. Reviewer #2 (Public review):

      Summary:

      The manuscript describes the results of an evolution experiment where Staphylococcus aureus was experimentally evolved via sequential exposure to an antibiotic followed by passaging through C. elegans hosts. Because infecting C. elegans via ingestion results in lysis of gut cells and an immune response upon infection, the S. aureus were exposed separately across generations to antibiotic stress and host immune stress. Interestingly, the dual selection pressure of antibiotic exposure and adaptation to a nematode host resulted in increased virulence of S. aureus towards C. elegans.

      Strengths:

      The data presented provide strong evidence that in S. aureus traits involved in adaptation to a novel host and those involved in antibiotic resistance evolution are not traded-off. On the contrary, they seem to be correlated, with strains adapted to antibiotics having higher virulence towards the novel host. As increased virulence is also associated with higher rates of haemolysis, these virulence increases are likely to reflect virulence levels in vertebrate hosts.

      Weaknesses:

      Right now, the results are presented in the context of human infections being treated with antibiotics, which, in my opinion, is inappropriate. This is because

      (1) exposure to the host and antibiotics was sequential, not simultaneous, and thus does not reflect the treatment of infection, and

      (2) because the site of infection is different in C. elegans and human hosts.

      Nevertheless, the results are of interest; I just think the interpretation and framing should be adjusted.

      Comments on revisions:

      Following the revision, I now think the weakness I initially described has been addressed well by the authors.

    4. Reviewer #3 (Public review):

      Summary:

      Su et al. sought to understand how the opportunistic pathogen Staphylococcus aureus responds to multiple selection pressures during infection. Specifically, the authors were interested in how the host environment and antibiotic exposure impact the evolution of both virulence and antibiotic resistance in S. aureus. To accomplish this, the authors performed an evolution experiment where S. aureus were fed to Caenorhabditis elegans as a model system to study the host environment and then either subjected to the antibiotic oxacillin or not. Additionally, the authors investigated the difference in evolution between an antibiotic-resistant stain MRSA and an isogenic susceptible strain MSSA. They found that MRSA strains evolved in both antibiotic and host conditions became more virulent and that strains evolved outside these conditions lost virulence. Looking at the strains evolved in just antibiotic conditions, the authors found that S. aureus maintained its ability to lyse blood cells. Mutations in codY, gdpP and pbpA were found to be associated with increased virulence. Additionally, these mutations identified in these experiments were found in S. aureus strains isolated from human infections.

      Strengths:

      The data are well-presented, thorough, and are an important addition to the understanding of how certain pathogens might adapt to different selective pressures in complex environments.

      Comments on revisions:

      For the most part, my comments have been addressed. It seems that the authors have not addressed my comments about quantifying population sizes in order to understand mutation supply, particularly in light of which experimental phase exhibits the strongest selection and possible increases in mutation rates. While I think this information would be very useful if they had collected it during the experiment, I don't think it is important enough to require additional experiments. I am therefore satisfied with the current state of the manuscript.

    5. Author response:

      The following is the authors’ response to the original reviews.

      eLife Assessment

      This important study examines the evolution of virulence and antibiotic resistance in Staphylococcus aureus under multiple selection pressures. The evidence presented is convincing, with rigorous data that characterizes the outcomes of the evolution experiments. However, the manuscript's primary weakness is in its presentation, as claims about the causal relationship between genotypes and phenotypes are based on correlational evidence. The manuscript needs to be revised to address these limitations, clarify the implications of the experimental design, and adjust the overall narrative to better reflect the nature of the findings.

      Thank you for your feedback. Here, we summarize the major changes made in the revised manuscript:

      (1) We did not test causality between mutations and phenotypes in our study. We were intentional about not using causal wording (“mutation X caused/led to/resulted in phenotype Y”), and only discussed these results using the terms “correlation” and “association”, and only when they were statistically significant. We understand that some readers may view these terms as being equivalent to “causation”, thus in the revision, we have modified our wording as suggested (please see below for specific lines).

      (2) We agree that experimental evolution in nematodes is not a direct simulation of evolution in humans. The goal of our study was first and foremost, a test of how multiple selective pressures can shape pathogen evolution. This point was presented in the first paragraph, the second to last paragraph of the Introduction (which included our hypotheses), and the last paragraph of the manuscript. References to humans and other mammalian systems were intended to point out similarities between our findings and what had already been found in S. aureus outside the lab. Despite differences between mammals and nematodes, several parallels arose at both the phenotypic and genomic levels, which is interesting from an evolutionary standpoint. We understand that more experiments and tests would be needed before we can make claims about the selective pressures acting on S. aureus outside the lab. We presented some information in the context of humans because a large part of the literature on S. aureus is on its role as a major bacterial pathogen; we did not want to neglect this aspect of its natural life history.

      In the revised manuscript, we are more explicit in stating these points, as well as tempering some language regarding human infection, and removing some references to humans. Please see below for specific lines as well as justification for specific references to humans/mammalian systems.

      (3) We have including additional details on the experimental design below. We hope this is sufficiently clarifying.

      Public Reviews:

      Reviewer #1 (Public review):

      Summary:

      The authors investigate how methicillin-resistant (MRSA) and sensitive (MSSA) Staphylococcus aureus adapt to a new host (C. elegans) in the presence or absence of a low dose of the antibiotic oxacillin. Using an "Evolve and Resequence" design with 48 independently evolving populations, they track changes in virulence, antibiotic resistance, and other fitness-related traits over 12 passages. Their key finding is that selection from both the host and the antibiotic together, rather than either pressure alone, results in the evolution of the most virulent pathogens. Genomically, they find that this adaptation repeatedly involves mutations in a small number of key regulatory genes, most notably codY, agr, and saeRS.

      Strengths:

      The main advantage of the research lies in its strong and thoroughly replicated experimental framework, enabling significant conclusions to be drawn based on the concept of parallel evolution. The study successfully integrates various phenotypic assays (virulence, growth, hemolysis, biofilm formation) with whole-genome sequencing, offering an extensive perspective on the adaptive landscape. The identification of certain regulatory genes as common targets of selection across distinct lineages is an important result that indicates a level of predictability in how pathogens adapt.

      Thank you very much.

      Weaknesses:

      (1) The main limitation of the paper is that its findings on the function of specific genes are based on correlation, not cause-and-effect evidence. While the parallel evolution evidence is strong, the authors have not yet performed the definitive tests (i.e., reconstruction of ancestral genes) to ensure that the mutations identified in isolation are enough to account for the virulence or resistance changes observed. This makes the conclusions more like firm hypotheses, not confirmed facts.

      We have replaced instances of “association” and “correlation” with wording similar to that suggested where applicable, including:

      L 342 – 344: “The loss of SCCmec and ACME was more often identified in populations exhibiting an increase in total growth from the ancestor outside the host…”

      L 371 – 375: “Mutations in three genes were regularly identified in populations exhibiting significant increases in virulence from the ancestor: codY, gdpP, and pbpA. Mutations in agr in general were not associated with changes in overall virulence, but MSSA populations harboring mutations in this gene were more likely to exhibit greater virulence compared to MRSA populations (Wilcoxon rank sum exact test P = 0.045).”

      L 377: “Mutations in specific genes were often found in populations able to hemolyze red blood cells…”

      L 379 – 381: “There were also significant differences between the mutations regularly identified in oxacillin-resistant populations evolved from the MSSA ancestor...”

      L 384 – 385: “By contrast, mutations in agr were often in populations exhibiting loss of hemolytic activity, consistent with previous findings...”

      L 409 – 410: “Mutations that arose during experimental evolution are regularly found in strains associated with human systemic infections.”

      We have also stated that ancestral reconstruction is needed:

      L 553 – 555: “Future experiments may include introducing these mutations into the ancestral background to directly link the mutations in these genes to evolved virulence.”

      (2) In some instances, the claims in the text are not fully supported by the visual data from the figures or are reported with vagueness. For example, the display of phenotypic clusters in the PCA (Figure 6A) and the sweeping generalization about the effect of antibiotics on the mutation rates (Figure S5) can be more precise and nuanced. Such small deviations dilute the overall argument somewhat and must be corrected.

      In reference to Fig. 6A, we have revised the statement as suggested: “…where populations exposed to host and sub-MIC oxacillin clustered together, largely separating from all other treatments…” Line 442

      In reference to Fig. S5, we conducted statistics to include both MRSA and MSSA populations and examined the effect of oxacillin on the number of mutations. While oxacillin had a significant effect on the number of mutations, we agree with the reviewer that this may be driven by the MRSA populations and have clarified: “Sub-MIC oxacillin selection also resulted in more mutations than in its absence ( = 5.92, P = 0.015), although this is likely driven by MRSA populations.” Lines 310 – 311

      Reviewer #2 (Public review):

      Summary:

      The manuscript describes the results of an evolution experiment where Staphylococcus aureus was experimentally evolved via sequential exposure to an antibiotic followed by passaging through C. elegans hosts. Because infecting C. elegans via ingestion results in lysis of gut cells and an immune response upon infection, the S. aureus were exposed separately across generations to antibiotic stress and host immune stress. Interestingly, the dual selection pressure of antibiotic exposure and adaptation to a nematode host resulted in increased virulence of S. aureus towards C. elegans.

      Strengths:

      The data presented provide strong evidence that in S. aureus, traits involved in adaptation to a novel host and those involved in antibiotic resistance evolution are not traded off. On the contrary, they seem to be correlated, with strains adapted to antibiotics having higher virulence towards the novel host. As increased virulence is also associated with higher rates of haemolysis, these virulence increases are likely to reflect virulence levels in vertebrate hosts.

      Weaknesses:

      Right now, the results are presented in the context of human infections being treated with antibiotics, which, in my opinion, is inappropriate. This is because

      (1) exposure to the host and antibiotics was sequential, not simultaneous, and thus does not reflect the treatment of infection, and

      (2) because the site of infection is different in C. elegans and human hosts.

      We have removed the two sentences referencing site of infection:

      Introduction: “In the host, antibiotic concentrations will gradually decline after administration due to metabolism and excretion.”

      Discussion: “…in addition to infection of antibiotic-treated hosts, where there is uneven distribution of drugs across tissues.”

      For our rationale for discussing humans in general, please see below.

      Nevertheless, the results are of interest; I just think the interpretation and framing should be adjusted.

      Thank you very much.

      Reviewer #3 (Public review):

      Summary:

      Su et al. sought to understand how the opportunistic pathogen Staphylococcus aureus responds to multiple selection pressures during infection. Specifically, the authors were interested in how the host environment and antibiotic exposure impact the evolution of both virulence and antibiotic resistance in S. aureus. To accomplish this, the authors performed an evolution experiment where S. aureus was fed to Caenorhabditis elegans as a model system to study the host environment and then either subjected to the antibiotic oxacillin or not. Additionally, the authors investigated the difference in evolution between an antibiotic-resistant strain, MRSA, and an isogenic susceptible strain, MSSA. They found that MRSA strains evolved in both antibiotic and host conditions became more virulent, and that strains evolved outside these conditions lost virulence. Looking at the strains evolved in just antibiotic conditions, the authors found that S. aureus maintained its ability to lyse blood cells. Mutations in codY, gdpP, and pbpA were found to be associated with increased virulence. Additionally, these mutations identified in these experiments were found in S. aureus strains isolated from human infections.

      Strengths:

      The data are well-presented, thorough, and are an important addition to the understanding of how certain pathogens might adapt to different selective pressures in complex environments.

      Thank you very much.

      Weaknesses:

      There are a few clarifications that could be made to better understand and contextualize the results. Primarily, when comparing the number of mutations and selection across conditions in an evolution experiment, information about population sizes is important to be able to calculate the mutation supply and number of generations throughout the experiment. These calculations can be difficult in vivo, but since several steps in the methodology require plating and regrowth, those population sizes could be determined. There was also no mention of how the authors controlled the inoculation density of bacteria introduced to each host. This would need to be known to calculate the generation time within the host. These caveats should be addressed in the manuscript.

      While the population sizes within hosts and generation time could be determined, we would need to conduct additional experiments (e.g., infecting nematodes with S. aureus, then crushing, plating, and counting colony forming units across time intervals) in order to obtain measurements for pathogen growth in hosts across time. For experimental evolution, we crushed a set number of dead nematodes (30) and all bacteria that were released were allowed to grow in liquid media before an aliquot (25%) was used to seed the next passage. Picking and crushing nematodes across 48 populations for one time point was an arduous task. The additional steps of picking, crushing, and plating nematodes across multiple time intervals at the same time experimental evolution was being performed would not be logistically sound.

      In terms of the inoculation density of bacteria, all nematodes were placed on abundant lawns of S. aureus. Nematodes were exposed to full lawns the entire infection step; bacteria remained in abundance. While we do not know the exact inoculum each individual nematode was exposed to, we know that they ingested the bacteria because of the high mortality rate. Furthermore, we followed the same procedure for every replicate across every host-associated treatment. Host individuals within and across passages were also genetically identical to one another. Altogether, these factors allowed for more consistency across the experiment, such that relative inoculum size should be similar across individual hosts. Please refer to the evolution experiment diagram (Author response image 1) for more details.

      Ultimately, while knowing the absolute population size, inoculum size, and generation time within the host is interesting, the rounds of selection (the number of times each population was exposed to the selective pressures) is also important in addressing our major question. Every treatment, which started out from one ancestral clone (MRSA or MSSA), was exposed to the same number of bouts of selection (passages), yet we see significant divergence in terms of traits and mutations. Future directions would certainly involve determining the number of steps (e.g., number of generations within hosts) required to reach these end points, but not knowing exactly how many steps were required do not detract from addressing the larger question of determining how pathogens respond to multiple selective pressures.

      Another concern is the number of generations the populations of S. aureus spent either with relaxed selection in rich media or under antibiotic pressure in between the host exposure periods. It is probable then that the majority of mutations were selected for in these intervening periods between host infection. Again, a more detailed understanding of population sizes would contribute to the understanding of which phase of the experiment contributed to the mutation profile observed.

      We conducted every step of the evolution experiment on the same timeline. For example, all replicates across treatments were grown in liquid media at the same time (see Author response image 1.). All populations were exposed to the same selective pressures at this step of the experiment. We can then compare populations that were subsequently exposed to hosts against those that were not. Populations passaged without a host served as the control. Mutations that were solely unique to host-exposed populations would more likely contribute to the traits of interest, compared to mutations that were in common between the host-exposed and no-host treatments. Similar comparisons could be made with the oxacillin-exposed and no-oxacillin populations.

      In general, the only differences between treatments would be driven by the treatments themselves. Given that we are interested in treatment-level effects, any differences in population size or generation time between treatments could contribute to the treatment effects we observe, and thus were not something we aimed to hold uniform across our experiment.

      Author response image 1.

      Schematic of procedural steps involved in one passage of S. aureus through nematodes (+host -ox) compared to without nematodes (-host -ox).

      Recommendations for the authors:

      Reviewing Editor Comments:

      We encourage you to address all other comments raised by the reviewers; however, the review team has identified the following points as the most critical and fundamental to improve your manuscript:

      (i) Reframing the narrative: You will need to adjust the narrative so that the study is presented as a "proof of principle" rather than a direct simulation of a human infection.

      While we referenced human infection, we believe the study had been presented as a proof of principle. Examples include:

      (1) We discussed the gap of knowledge in the first paragraph: “It is unclear how virulence evolves in the face of more than one selective pressure and whether this trait is constrained or facilitated by antibiotic resistance.” Lines 86 – 88

      (2) In the second to last paragraph in the Introduction, we presented the main hypotheses: “Adaptation may require resources to be expended toward either virulence or antibiotic resistance, leading to a trade-off between these traits (Ferenci, 2016). Alternatively, weaker selection from sub-MIC antibiotics may interact synergistically with hosts and facilitate the evolution or maintenance of high virulence and antibiotic resistance.” Lines 176 – 179

      (3) The last paragraph concluded with “Our findings ultimately emphasize the importance of considering the host context in the evolution of antibiotic resistance. Integrating multiple traits, such as virulence, antibiotic resistance, and fitness may be critical in identifying the factors that facilitate host shifts and persistence of drug-resistant pathogens.” Lines 613 – 616

      These paragraphs, which set up the context for our work, did not primarily discuss human infections.

      In the revised manuscript, we have further tempered language regarding human infection:

      L 169 - 172: “Experimentally evolving S. aureus in C. elegans thus allows us to track the early stages of virulence and antibiotic resistance evolution in novel host populations with the potential to identify conserved genomic regions underlying evolved traits.”

      L 595 – 596: “Additional direct tests are needed to evaluate the role of these mutations in adaptation of S. aureus to different infection sites.”

      L 610 – 611: “Pathogen evolution in a tractable invertebrate animal model yielded phenotypes and genotypes similar to those identified in mammalian hosts, highlighting the utility of evolution experiments to identify potential ecological and genetic mechanisms that may give rise to pathogen traits conserved across systems.”

      And removed some references to humans:

      In the Introduction: “In the host, antibiotic concentrations will gradually decline after administration due to metabolism and excretion.”

      In the Discussion: “…in addition to infection of antibiotic-treated hosts, where there is uneven distribution of drugs across tissues.”

      Otherwise, our rationale for referencing humans/mammalian systems in our Introduction include:

      Setting the context of our study system: we discussed humans and clinical significance when we first introduced S. aureus (lines 132 – 151) and experimental evolution (lines 153 – 172). Much of what is known about S. aureus outside the lab is when it is interacting with humans, thus we weaved in relevant information that has been discovered in other organisms.

      Hemolysis: This ability is important for S. aureus virulence toward C. elegans (Sifri et al., 2003).

      S. aureus genomic database: we intended to leverage this large-scale database of genomes isolated from S. aureus outside the lab to compare patterns emerging from experimental evolution to those in existing isolates. Due to its relevance as a major bacterial pathogen, most of the isolates happen to be from clinical settings.

      (ii) Adjusting the causal language: You will need to soften the language so that correlational claims do not appear to be causal.

      We have adjusted language as noted above.

      (iii) Clarifying methodological aspects: You will need to provide more details on the methodology, such as population sizes, and clarify the implications of these in the conclusions of the work.

      We have provided additional explanation of methodology and the role of control (no host) treatments above.

      Reviewer #1 (Recommendations for the authors):

      The paper is robust, and the study is of great significance. Tackling the subsequent issues would greatly enhance the paper and elucidate its findings.

      Major Recommendations:

      (1) Revising Causal Language: The main flaw of the manuscript lies in its presentation of correlational data as if it were causal. We highly suggest a thorough review of the text to soften causal language when connecting genotypes to phenotypes. The absence of ancestral reconstruction should be recognized as a constraint. Assertions ought to be presented as robust, evidence-based hypotheses. For instance, rather than saying a mutation "associated with significant increases in virulence," you might say "was regularly identified in groups that developed increased virulence, strongly suggesting this gene's role in the adaptation." This will more precisely clarify the contribution of the work.

      We have softened language and stated that ancestral reconstruction is needed as noted above.

      (2) Expand on Parallel Mutations: The examination of parallel evolution in Figure 4A is intriguing but would be notably stronger with additional details. I suggest including an additional supplementary figure or table detailing the specific non-synonymous mutations identified in the highly parallel genes (e.g., codY, agr, gdpP). It is essential for the reader to understand whether parallel evolution is happening at the gene level (different mutations in a single gene) or at the nucleotide level (the precise same mutation appearing again). Kindly specify if any of these mutations were nonsense mutations, as this suggests that the loss-of-function is advantageous.

      The full table of mutations is in fig share (10.6084/m9.figshare.28745558). We have added a Supplemental Table (Table S2) containing mutations in genes occurring in more than two populations. Many of these mutations were not the same, indicating parallel evolution at the gene level (lines 315 – 317).

      Minor Recommendations for Clarity and Accuracy:

      (1) Introduction:

      Lines 176-177: Please add a citation for the statement describing the function of the SCCmec cassette, as this is established knowledge.

      Done.

      (2) Results:

      Section Title (Line 254): The title "Host and sub-MIC antibiotic promoted growth..." is imprecise. Figure 3B shows that it is the combination of these factors that promotes growth in MRSA, while oxacillin alone is detrimental. Please revise the title to reflect this synergistic effect.

      “Synergistically” has been added to the title: “Host and sub-MIC antibiotic synergistically promoted growth of MRSA…” Lines 269 – 270

      Lines 261-263: The description of Figure 3B is incomplete. The text should explicitly state that the -host+ox treatment resulted in the lowest growth for MRSA, which provides a critical contrast and suggests a fitness cost.

      We have added “By contrast, exposure to sub-MIC oxacillin alone yielded the lowest growth, suggesting a fitness cost.” Lines 277 – 278

      Line 294: The claim that "Sub-MIC oxacillin selection also resulted in more mutations" is a generalization not supported for the MSSA genotype, according to Figure S5. Please revise this sentence to specify that this effect was observed in the MRSA populations.

      We have clarified: “Sub-MIC oxacillin selection also resulted in more mutations than in its absence ( = 5.92, P = 0.015), although this is likely driven by MRSA populations.” Lines 310 – 311

      Lines 419-421: The claim that the +host+ox populations in Figure 6A "formed a distinct cluster" is an overstatement, as there is visible overlap with one other treatment (e.g., host-ox). Please revise this to more accurately describe the visual data (e.g., "clustered together, largely separating...").

      We have revised the statement as suggested: “…where populations exposed to host and sub-MIC oxacillin clustered together, largely separating from all other treatments…” Lines 442 – 443

      Lines 422-424: The interpretation of the MRSA PCA (Figure 6A) focuses on the correlation between virulence and sub-MIC growth. However, the correlation between "biofilm production" and "growth without oxacillin" appears visually stronger. Please address this correlation as well for a more complete interpretation.

      We have added “For MRSA populations, biofilm production and growth without oxacillin also appeared to be positively correlated.” Lines 447 – 448

      (3) Discussion:

      Lines 469-470: The statement that "exposure to oxacillin resulted in pathogens causing the greatest host mortality" is imprecise. The data in Figure 2A show that it is the combination of host and oxacillin. Please revise this for accuracy and add a direct citation to Figure 2A here.

      We have added clarification: “Nonetheless, we observed differing evolutionary trajectories, where exposure to oxacillin in host-associated treatments resulted in pathogens causing the greatest host mortality.” Lines 496 – 498

      Reviewer #2 (Recommendations for the authors):

      After reviewing the paper and reading the previous reviews from PLoS Biology, my biggest criticism of the paper is the way the story is told. In principle, the results are interesting and relevant, but the analogy to human infection and immune system/ antibiotic treatment strategies does not fit entirely with the experimental design or the results. I think the motivation needs to be reframed. In the study, antibiotic exposure is purely environmental, i.e., not in the host. How does environmental antibiotic use affect in vivo evolution, as this is not tested? As previous reviewers have pointed out, S. aureus is not an enteric pathogen in humans but most often causes skin infections. Furthermore, much of the results and discussion is focused on haemolysis of red blood cells, a cell type that C. elegans does not have. What the paper does present, on the other hand, and something that is interesting and novel, is a test in a model system of how a bacterial pathogen evolves to competing selection pressures. I might have hypothesised a priori that these competing pressures result in trade-offs, something which there is no evidence of, even though growth rate does not appear to be negatively impacted as a consequence of selection for drug resistance and virulence together. Instead, many traits are correlated and seemingly at the mechanistic level. This is cool and is a proof of principle, even if the system does not completely mirror reality, and I think the story should be told as such.

      We agree entirely with the reviewer that testing how pathogens respond to multiple selective pressures and the resulting lack of trade-offs are significant and interesting. We presented this question (lines 86 – 88) and our hypothesis about such trade-off in the Introduction (lines 176 – 179). As stated above, we had framed our paper to highlight these points and have removed references to antibiotic concentrations in treated humans.

      We measured and discussed hemolysis because it is important for virulence toward C. elegans (lines 195 – 197) (Sifri et al., 2003). We believe our manuscript contained a reasonable discussion of this trait. For example, three panels of the main figures presented the main hemolysis results (Figures 2B, 2C, and 2D), whereas 23 other panels did not at all involve hemolysis. In the Discussion, hemolysis took up half of the shortest paragraph (lines 509 – 519) and an additional sentence (line 589 – 591), out of seven total paragraphs.

      Specific comments:

      (1) L137-138. Can S. aureus really survive for long periods of time outside of the host? Can you clarify this statement? Do you mean it is an opportunistic pathogen and can also replicate in the environment?

      S. aureus can form biofilms and persist for weeks on inert surfaces (Kramer et al., 2024; Tran et al., 2023), indicating that it may replicate in non-host environments. We have included the phrase “opportunistic pathogen” to clarify (line 145).

      (2) L187 - to ascertain

      Corrected.

      (3) Figure 2B - there seems to be a benefit of haemolysis activity to oxacillin resistance, perhaps a crossover in mechanism? In MSSA, without a host, it goes to complete fixation, whereas it is completely lost when antibiotics aren't present. I know this is discussed later, but I would appreciate a more detailed hypothesis of why this could be.

      Antibiotics have been found to induce expression of virulence traits, such as in the case of oxacillin and hemolysis. Thus, it is reasonable that exposure to oxacillin during evolution would maintain MSSA’s hemolytic ability. We hypothesize that the loss of hemolysis in the absence of oxacillin may be due to the cost of hemolysis expression without a stimulant (oxacillin), hemolysis may not be expressed as often and be subject to deleterious mutations. Alternatively, the stress that cells were under favored virulence in some way, rather than the direct action of the antibiotic.

      (4) L225-228 - As C. elegans do not have red blood cells, why would we expect this? Do you see increased lysis of C. elegans gut cells? Or could it be due to iron accumulation as you are growing the staph on BHI?

      We measured and correlated nematode mortality with hemolytic ability because hemolysis had been found to be involved in virulence toward C. elegans (Sifri et al., 2003). The hemolysis phenotype is a surrogate for S. aureus virulence gene expression.

      (5) Figure 3A - There seems to be a growth cost of evolving oxacillin resistance in the absence of a host. Why might this be?

      MRSA populations exposed to oxacillin without a host during evolution visually exhibited the lowest growth rate. While this is an interesting question, the result was not statistically significant, so we cannot speculate in the manuscript.

      Reviewer #3 (Recommendations for the authors):

      (1) Some claims in the introduction are either non cited or not correctly stated. The second sentence has a claim about the interplay between antibiotic resistance and virulence with no citation listed. Additionally, there is a claim about S. aureus "evading detection" by attacking the host's immune cells. That is by definition not avoiding detection. Perhaps phrasing it as resisting host immune function would make it clearer.

      We have added a citation (lines 80 – 81) and clarified our wording: “Once inside the host, S. aureus resists host immune function by hindering or lysing immune cells.” Lines 140 – 141

      (2) Once in the introduction and in the discussion, the authors referred to S. aureus as a novel pathogen for C. elegans, I do not think enough is known to make this statement.

      This S. aureus strain is novel because it was isolated from humans, so at least in its recent evolutionary past, it has not interacted with C. elegans. Furthermore, we used a C. elegans isolate (N2) that had been frozen and maintained in the lab on E. coli, and had not been exposed to other microbes in its recent evolutionary past. Finally, S. aureus has not been found to be a native pathogen of C. elegans in nature (Ekroth et al., 2021).

      (3) Key suggestion: Change Figure 1C to reflect the design better. So you could have the +OXA before the host and then have an arrow looping back again to show the cycle of each step. So a figure that would have something like: MRSA > +OXA > +host>+OXA --> MRSA .

      We have updated the figure as suggested.

      (4) Suggest changing "greatest" on line 191, section header to greater.

      Done.

      (5) Line 258: Rich media can still provide selective pressures that are difficult to quantify - fast growth, cofactor and other nutrient limitations due to that fast growth

      We have adjusted our wording: “Importantly, rich media reduced the risk of introducing additional selective pressures than those being tested.” Lines 273 – 274

      (6) Why were intergenic mutations routinely ignored? These can often be very important phenotypically.

      We had focused on genes because there was a sufficient number of genes to discuss, but we have added a Supplemental Table (Table S2) containing all mutations (including intergenic and synonymous) appearing in more than 2 populations. We have also added information regarding mecA, an accessory gene, highlighting the role non-core genes may have in shaping bacterial evolution:

      “Despite evolving in similar environments, MRSA and MSSA populations differing only in the presence of an intact accessory gene (mecA)—proceeded on divergent evolutionary paths…” Lines 66 – 68

      “Carriage of Staphylococcal cassette chromosome mec (SCCmec), which encodes mecA, an accessory gene that provides resistance…” Lines 187 – 188

      “As MRSA and MSSA only differed in the presence of an intact mecA gene at the start of the experiment, accessory genes may play important roles in shaping bacterial evolution (Jackson et al., 2011).” Lines 472 – 474

      (7) Line 294: more mutations than what?

      We have clarified the sentence: “Sub-MIC oxacillin selection also resulted in more mutations than in its absence…” Lines 310 – 311

      (8) Lines 295-297: wording is pretty confusing. It seems that the discussion is about increased mutation rates, possibly due to hypermutators resulting from mutL or recA mutations, but this isn't well-thought out and much is implied here. Furthermore, see the above comment about comparing mutations across conditions - it's hard to make inferences of mutation rates without knowing the mutation supply as a result of varying population sizes across conditions and through the experiment.

      We have clarified the sentence: “…there were only two mutations in DNA and mismatch repair genes (mutL and recA), suggesting repair genes were not the sole mechanism involved.” Lines 313 – 314

      Because all populations evolved from one ancestral clone (either MRSA or MSSA), all mutations that are found at the end of the experiment would have arisen de novo from that ancestor. Since all populations experienced the same number of passages/rounds of selection, we determined mutation rate by counting the number of mutations that were found at the last passage for each replicate population. Populations that acquired significantly more mutations had a higher mutation rate in terms of # of mutations/# of selection rounds.

      (9) Line 486: typo "Mutations genes".

      Corrected.

      (10) Line 487: "antibiotics may allow" is awkward; suggest changing to more precise language, possibly relating to pleiotropy if that is what was meant here.

      We had intended to mean “adaptation [to antibiotics] may allow”. We have clarified: “Mutations in genes involved in resistance to antibiotics were found more often in populations with increased virulence, suggesting that antibiotic adaptation may also favor evolution of virulence.” Lines 514 – 516

      REFERENCES

      Ekroth AKE, Gerth M, Stevens EJ, Ford SA, King KC. 2021. Host genotype and genetic diversity shape the evolution of a novel bacterial infection. ISME Journal 15:2146–2157. DOI: https://doi.org/10.1038/s41396-021-00911-3, PMID: 33603148

      Kramer A, Lexow F, Bludau A, Köster AM, Misailovski M, Seifert U, Eggers M, Rutala W, Dancer SJ, Scheithauer S. 2024. How long do bacteria, fungi, protozoa, and viruses retain their replication capacity on inanimate surfaces? A systematic review examining environmental resilience versus healthcare-associated infection risk by “fomite-borne risk assessment.” Clinical Microbiology Reviews. PMID: 39388143

      Sifri CD, Begun J, Ausubel FM, Calderwood SB. 2003. Caenorhabditis elegans as a model host for Staphylococcus aureus pathogenesis. Infection and Immunity 71:2208–2217. DOI: https://doi.org/10.1128/IAI.71.4.2208-2217.2003, PMID: 12654843

      Tran NN, Morrisette T, Jorgensen SCJ, Orench-Benvenutti JM, Kebriaei R. 2023. Current therapies and challenges for the treatment of Staphylococcus aureus biofilm-related infections. Pharmacotherapy 43:816–832. DOI: https://doi.org/10.1002/phar.2806, PMID: 37133439

    1. “Baas,” the black man asks at last, “Why has your house no windows and no doors?”The white man has become very sad. “That, too, you cannot understand,” he says. “Long ago in another country my forefathers built walls to keep out the sea. Thick, watertight walls. That’s why my house too, has no windows and no doors.”

      Alternate perspective: In this scene the white man has become sad and shows a change in emotion from once being hostile towards the black man. He acts as a different person complicating his character because now he is not just seen as an opressor but as someone who might feel regret for their actions but won't change due to the oppressive system his ancestors established. The emotional shift occurs as they are finishing the house and changes from dominance to regret but the end goal of segregation remains.

      Most difficult passage: I feel that the reading was overall easy to understand after, but what made this paragraph difficult to understand was the change in emotion from the white man. Why is there a shift in emotion in the white man? And why does he continue to build the house after he feels sad? Why are there no windows and no doors? The passage does not explicitly state the reason behind his change in perspective, but one can infer that the white man is aware that segregation is wrong but does not have it in him to change.

    2. You’re the sea, the white man thinks, but is too sad to explain

      Example illustrating a main point The purpose of the white man building the house was to keep the "sea" out, but in truth he is separating himself from the black man. This illustrates the main idea of segregation and also demonstrates that the barrier created has long existed and the white man is simply following what he has been taught.