278Dædalus, the Journal of the American Academy of Arts & SciencesThe Turing Trap: The Promise & Peril of Human-Like Artificial IntelligenceIn 1988, robotics researcher Hans Moravec noted that “it is comparatively easyto make computers exhibit adult level performance on intelligence tests or play-ing checkers, and difficult or impossible to give them the skills of a one-year-oldwhen it comes to perception and mobility.”33 But I would argue that in many do-mains, Moravec was not nearly ambitious enough. It is often comparatively easierfor a machine to achieve superhuman performance in new domains than to matchordinary humans in the tasks they do regularly.Humans have evolved over millions of years to be able to comfort a baby, nav-igate a cluttered forest, or pluck the ripest blueberry from a bush. These tasksare difficult if not impossible for current machines. But machines excel when itcomes to seeing X-rays, etching millions of transistors on a fragment of silicon, orscanning billions of webpages to find the most relevant one. Imagine how feebleand limited our technology would be if past engineers set their sights on merelymatching human-levels of perception, actuation, and cognition.Augmenting humans with technology opens an endless frontier of new abili-ties and opportunities. The set of tasks that humans and machines can do togetheris undoubtedly much larger than those humans can do alone (Figure 1). Machinescan perceive things that are imperceptible to humans, they can act on objects inways that no human can, and, most intriguingly, they can comprehend things thatare incomprehensible to the human brain. As Demis Hassabis, CEO of DeepMind,put it, the AI system “doesn’t play like a human, and it doesn’t play like a program.It plays in a third, almost alien, way . . . it’s like chess from another dimension.”34Computer scientist Jonathan Schaeffer explains the source of its superiority: “I’mabsolutely convinced it’s because it hasn’t learned from humans.”35 More funda-mentally, inventing tools that augment the process of invention itself promises toexpand not only our collective abilities, but to accelerate the rate of expansion ofthose abilities.What about businesspeople? They often find that substituting machinery forhuman labor is the low-hanging fruit of innovation. The simplest approach is toimplement plug-and-play automation: swap in a piece of machinery for each taska human is currently doing. That mindset reduces the need for more radical chang-es to business processes.36 Task-level automation reduces the need to understandsubtle interdependencies and creates easy A-B tests, by focusing on a known taskwith easily measurable performance improvement.Similarly, because labor costs are the biggest line item in almost every company’sbudget, automating jobs is a popular strategy for managers. Cutting costs–whichcan be an internally coordinated effort–is often easier than expanding markets.Moreover, many investors prefer “scalable” business models, which is often a syn-onym for a business that can grow without hiring and the complexities that entails.But here again, when businesspeople focus on automation, they often set outto achieve a task that is both less ambitious and more difficult than it need be.151 (2) Spring 2022279Erik BrynjolfssonTo understand the limits of substitution-oriented automation, consider a thoughtexperiment. Imagine that our old friend Dædalus had at his disposal an extreme-ly talented team of engineers 3,500 years ago and built human-like machines thatfully automated every work-related task that his fellow Greeks were doing.9 Herding sheep? Automated.9 Making clay pottery? Automated.9 Weaving tunics? Automated.9 Repairing horse-drawn carts? Automated.9 Incense and chanting for victims of disease? Automated.The good news is that labor productivity would soar, freeing the ancientGreeks for a life of leisure. The bad news is that their living standards and healthoutcomes would come nowhere near matching ours. After all, there is only somuch value one can get from clay pots and horse-drawn carts, even with unlimit-ed quantities and zero prices.In contrast, most of the value that our economy has created since ancient timescomes from new goods and services that not even the kings of ancient empireshad, not from cheaper versions of existing goods.37 In turn, myriad new tasks areFigure 1Opportunities for Augmenting Humans Are Far Greater thanOpportunities to Automate Existing TasksNew Tasks ThatHumans Can Do withthe Help of MachinesTasks ThatHumans Can DoHuman TasksThat MachinesCould Automate280Dædalus, the Journal of the American Academy of Arts & SciencesThe Turing Trap: The Promise & Peril of Human-Like Artificial Intelligencerequired: fully 60 percent of people are now employed in occupations that did notexist in 1940. 38 In short, automating labor ultimately unlocks less value than aug-menting it to create something new.At the same time, automating a whole job is often brutally difficult. Every jobinvolves multiple different tasks, including some that are extremely challengingto automate, even with the cleverest technologies. For example, AI may be able toread mammograms better than a human radiologist, but it is not very good at theother twenty-six tasks associated with the job, according to O-NET, such as com-forting a concerned patient or coordinating on a care plan with other doctors.39My work with Tom Mitchell and Daniel Rock on the suitability for machine learn-ing analyzed 950 distinct occupations. We found that machines could perform atleast some tasks in most occupations, but zero in which machine learning coulddo 100 percent of the tasks.40The same principle applies to the more complex production systems that in-volve multiple people working together.41 To be successful, firms typically need toadopt a new technology as part of a system of mutually reinforcing organizationalchanges. 42 Consider another thought experiment: Imagine if Jeff Bezos had “au-tomated” existing bookstores by simply replacing all the human cashiers with ro-bot cashiers. That might have cut costs a bit, but the total impact would have beenmuted. Instead, Amazon reinvented the concept of a bookstore by combining hu-mans and machines in a novel way. As a result, they offer vastly greater productselection, ratings, reviews, and advice, and enable 24/7 retail access from the com-fort of customers’ homes. The power of the technology was not in automating thework of humans in the existing retail bookstore concept but in reinventing andaugmenting how customers find, assess, purchase, and receive books and, in turn,other retail goods.Third, policy-makers have also often tilted the playing field toward automat-ing human labor rather than augmenting it. For instance, the U.S. tax code cur-rently encourages capital investment over investment in labor through effectivetax rates that are much higher on labor than on plants and equipment.43Consider a third thought experiment: Two potential ventures each use AI tocreate $1 billion of profits. If one of them achieves this by augmenting and em-ploying a thousand workers, the firm will owe corporate and payroll taxes, whilethe employees will pay income taxes, payroll taxes, and other taxes. If the secondbusiness has no employees, the government may collect the same corporate taxes,but no payroll taxes and no taxes paid by workers. As a result, the second businessmodel pays far less in total taxes.This disparity is amplified because the tax code treats labor income moreharshly than capital income. In 1986, top tax rates on capital income and laborincome were equalized in the United States, but since then, successive changeshave created a large disparity, with the 2021 top marginal federal tax rates on labor151 (2) Spring 2022281Erik Brynjolfssonincome of 37 percent, while long capital gains have a variety of favorable rules, in-cluding a lower statutory tax rate of 20 percent, the deferral of taxes until capitalgains are realized, and the “step-up basis” rule that resets capital gains to zero,wiping out the associated taxes, when assets are inherited.The first rule of tax policy is simple: you tend to get less of whatever you tax.Thus, a tax code that treats income that uses labor less favorably than income de-rived from capital will favor automation over augmentation. Treating both busi-ness models equally would lead to more balanced incentives. In fact, given thepositive externalities of more widely shared prosperity, a case could be made fortreating wage income more favorably than capital income, for instance by expand-ing the earned income tax credit.44 It is unlikely that any government official candefine in advance exactly which technologies and innovations augment humansrather than merely substitute for them; indeed, most technologies have elementsof each and the outcome depends a great deal on how they are deployed. Thus,rather than prescribe or proscribe specific technologies, a broad-based set of in-centives can gently nudge technologists and managers toward augmentation onthe margin, much as carbon taxes encourage myriad types of cleaner energy orresearch and development tax credits encourage greater investments in research.Government policy in other areas could also do more to steer the economy clearof the Turing Trap. The growing use of AI, even if only for complementing work-ers, and the further reinvention of organizations around this new general-purposetechnology imply a great need for worker training or retraining. In fact, for eachdollar spent on machine learning technology, companies may need to spend ninedollars on intangible human capital.45 However, education and training sufferfrom a serious externality issue: companies that incur the costs to train or retrainworkers may reap only a fraction of the benefits of those investments, with therest potentially going to other companies, including competitors, as these work-ers are free to bring their skills to their new employers. At the same time, work-ers are often cash- and credit-constrained, limiting their ability to invest in theirown skills development. 46 This implies that government policy should directlyprovide education and training or provide incentives for corporate training thatoffset the externalities created by labor mobility. 47In sum, the risks of the Turing Trap are increased not by just one group in oursociety, but by the misaligned incentives of technologists, businesspeople, andpolicy-makers.T he future is not preordained. We control the extent to which AI either ex-pands human opportunity through augmentation or replaces humansthrough automation. We can work on challenges that are easy for ma-chines and hard for humans, rather than hard for machines and easy for humans.The first option offers the opportunity of growing and sharing the economic pie282Dædalus, the Journal of the American Academy of Arts & SciencesThe Turing Trap: The Promise & Peril of Human-Like Artificial Intelligenceby augmenting the workforce with tools and platforms. The second option risksdividing the economic pie among an ever-smaller number of people by creatingautomation that displaces ever-more types of workers.While both approaches can and do contribute to productivity and progress,technologists, businesspeople, and policy-makers have each been putting a fingeron the scales in favor of replacement. Moreover, the tendency of a greater concen-tration of technological and economic power to beget a greater concentration ofpolitical power risks trapping a powerless majority into an unhappy equilibrium:the Turing Trap.The backlash against free trade offers a cautionary tale. Economists have longargued that free trade and globalization tend to grow the economic pie through thepower of comparative advantage and specialization. They have also acknowledgedthat market forces alone do not ensure that every person in every country willcome out ahead. So they proposed a grand bargain: maximize free trade to max-imize wealth creation and then distribute the benefits broadly to compensate anyinjured occupations, industries, and regions. It has not worked as they had hoped.As the economic winners gained power, they reneged on the second part of the bar-gain, leaving many workers worse off than before.48 The result helped fuel a popu-list backlash that led to import tariffs and other barriers to free trade. Economistswept.Some of the same dynamics are already underway with AI. More and moreAmericans, and indeed workers around the world, believe that while the technolo-gy may be creating a new billionaire class, it is not working for them. The more tech-nology is used to replace rather than augment labor, the worse the disparity may be-come, and the greater the resentments that feed destructive political instincts andactions. More fundamentally, the moral imperative of treating people as ends, andnot merely as means, calls for everyone to share in the gains of automation.The solution is not to slow down technology, but rather to eliminate or reversethe excess incentives for automation over augmentation. A good start would be toreplace the Turing Test, and the mindset it embodies, with a new set of practicalbenchmarks that steer progress toward AI-powered systems that exceed anythingthat could be done by humans alone. In concert, we must build political and eco-nomic institutions that are robust in the face of the growing power of AI. We canreverse the growing tech backlash by creating the kind of prosperous society thatinspires discovery, boosts living standards, and offers political inclusion for ev-eryone. By redirecting our efforts, we can avoid the Turing Trap and create pros-perity for the many, not just the few.151 (2) Spring 2022283Erik Brynjolfssonauthor’s noteThe core ideas in this essay were inspired by a series of conversations with JamesManyika and Andrew McAfee. I am grateful for valuable comments and sugges-tions on this work from Matt Beane, Seth Benzell, Avi Goldfarb, Katya Klinova, Ale-na Kykalova, Gary Marcus, Andrea Meyer, Dana Meyer, and numerous participantsat seminars at the Stanford Digital Economy Lab and the University of TorontoCreative Destruction Lab, but they should not be held responsible for any errors oropinions in the essay.about the authorErik Brynjolfsson is the Jerry Yang and Akiko Yamazaki Professor and SeniorFellow at the Institute for Human-Centered AI and Director of the Digital Econ-omy Lab at Stanford University. He is also the Ralph Landau Senior Fellow at theInstitute for Economic Policy Research and Professor by Courtesy at the Gradu-ate School of Business and Department of Economics at Stanford University; and aResearch Associate at the National Bureau of Economic Research. He is the authoror coauthor of seven books, including Machine, Platform, Crowd: Harnessing Our Digi-tal Future (2017), The Second Machine Age: Work, Progress, and Prosperity in a Time of Bril-liant Technologies (2014), and Race against the Machine: How the Digital Revolution Is Acceler-ating Innovation, Driving Productivity, and Irreversibly Transforming Employment and the Econ-omy (2011) with Andrew McAfee, and Wired for Innovation: How Information TechnologyIs Reshaping the Economy (2009) with Adam Saunders.endnotes1 Alan Turing, “Computing Machinery and Intelligence,” Mind 59 (236): 433–460, https://doi.org/10.1093/mind/LIX.236.433. An earlier articulation of this test comes from Des-cartes in The Discourse, in which he wrote,If there were machines which bore a resemblance to our bodies and imitated ouractions as closely as possible for all practical purposes, we should still have twovery certain means of recognizing that they were not real men. The first is thatthey could never use words, or put together signs, as we do in order to declare ourthoughts to others. . . . Secondly, even though some machines might do some thingsas well as we do them, or perhaps even better, they would inevitably fail in others,which would reveal that they are acting not from understanding.2 Carolyn Price, “Plato, Opinions and the Statues of Daedalus,” OpenLearn, updatedJune 19, 2019, https://www.open.edu/openlearn/history-the-arts/philosophy/plato-opinions-and-the-statues-daedalus; and Andrew Stewart, “The Archaic Period,” PerseusDigital Library, http://www.perseus.tufts.edu/hopper/text?doc=Perseus:text:1999.04.0008:part=2:chapter=1&highlight=daedalus.3 “The Origin of the Word ‘Robot,’” Science Friday, April 22, 2011, https://www.sciencefriday.com/segments/the-origin-of-the-word-robot/.4 Millions of people are now working alongside robots. For a recent survey on the diffusionof robots, AI, and other advanced technologies in the United States, see Nikolas Zolas,284Dædalus, the Journal of the American Academy of Arts & SciencesThe Turing Trap: The Promise & Peril of Human-Like Artificial IntelligenceZachary Kroff, Erik Brynjolfsson, et al., “Advanced Technologies Adoption and Useby U.S. Firms: Evidence from the Annual Business Survey,” NBER Working Paper No.28290 (Cambridge, Mass.: National Bureau of Economic Research, 2020).5 Apologies to Arthur C. Clarke.6 See, for example, Daniel Zhang, Saurabh Mishra, Erik Brynjolfsson, et al., “The AI Index2021 Annual Report,” arXiv (2021), esp. chap. 2, https://arxiv.org/abs/2103.06312. Inregard to image recognition, see, for instance, the success of image recognition systemsin Olga Russakovsky, Jia Deng, Hao Su, et al., “Imagenet Large Scale Visual Recogni-tion Challenge,” International Journal of Computer Vision 115 (3) (2015): 211–252. A broadarray of business application is discussed in Erik Brynjolfsson and Andrew McAfee,“The Business of Artificial Intelligence,” Harvard Business Review (2017): 3–11.7 See, for example, Hubert Dreyfus, What Computers Can’t Do (Cambridge, Mass.: MIT Press,1972); Nils J. Nilsson, “Human-Level Artificial Intelligence? Be Serious!” AI Magazine26 (4) (2005): 68; and Gary Marcus, Francesca Rossi, and Manuela Veloso, “Beyondthe Turing Test,” AI Magazine 37 (1) (2016): 3–4.8 Nilsson, “Human-Level Artificial Intelligence?” 68.9 John Searle was the first to use the terms strong AI and weak AI, writing that with weak AI,“the principal value of the computer . . . is that it gives us a very powerful tool,” whilestrong AI “really is a mind.” Ed Feigenbaum has argued that creating such intelligenceis the “manifest destiny” of computer science. John R. Searle, “Minds, Brains, and Pro-grams,” Behavioral and Brain Sciences 3 (3) (1980): 417–457.10 However, this does not necessarily mean living standards would rise without bound.In fact, if working hours fall faster than productivity rises, it is theoretically possible,though empirically unlikely, that output and consumption (other than leisure time)would fall.11 See, for example, Robert M. Solow, “A Contribution to the Theory of Economic Growth,”The Quarterly Journal of Economics 70 (1) (1956): 65–94.12 See, for example, Daron Acemoglu, “Directed Technical Change,” Review of EconomicStudies 69 (4) (2002): 781–809.13 See, for instance, Erik Brynjolfsson and Andrew McAfee, Race Against the Machine: Howthe Digital Revolution Is Accelerating Innovation, Driving Productivity, and Irreversibly TransformingEmployment and the Economy (Lexington, Mass.: Digital Frontier Press, 2011); and DaronAcemoglu and Pascual Restrepo, “The Race Between Machine and Man: Implicationsof Technology for Growth, Factor Shares, and Employment,” American Economic Review108 (6) (2018): 1488–1542.14 For instance, the real wage of a building laborer in Great Britain is estimated to havegrown from sixteen times the amount needed for subsistence in 1820 to 167 times thatlevel by the year 2000, according to Jan Luiten Van Zanden, Joerg Baten, Marco Mirad’Ercole, et al., eds., How Was Life? Global Well-Being since 1820 (Paris: OECD Publishing,2014).15 For instance, a majority of aircraft on U.S. Navy aircraft carriers are likely to be un-manned. See Oriana Pawlyk, “Future Navy Carriers Could Have More Drones ThanManned Aircraft, Admiral Says,” Military.com, March 30, 2021. Similarly, companieslike Kittyhawk have developed pilotless aircraft (“flying cars”) for civilian passengers.151 (2) Spring 2022285Erik Brynjolfsson16 Loukas Karabarbounis and Brent Neiman, “The Global Decline of the Labor Share,” TheQuarterly Journal of Economics 129 (1) (2014): 61–103; and David Autor, “Work of the Past,Work of the Future,” NBER Working Paper No. 25588 (Cambridge, Mass.: National Bu-reau of Economic Research, 2019). For a broader survey, see Morgan R. Frank, DavidAutor, James E. Bessen, et al., “Toward Understanding the Impact of Artificial Intelli-gence on Labor,” Proceedings of the National Academy of Sciences 116 (14) (2019): 6531–6539.17 Daron Acemoglu and David Autor, “Skills, Tasks and Technologies: Implications forEmployment and Earnings,” Handbook of Labor Economics 4 (2011): 1043–1171.18 Seth G. Benzell and Erik Brynjolfsson, “Digital Abundance and Scarce Architects:Implications for Wages, Interest Rates, and Growth,” NBER Working Paper No. 25585(Cambridge, Mass.: National Bureau of Economic Research, 2021).19 Prasanna Tambe, Lorin Hitt, Daniel Rock, and Erik Brynjolfsson, “Digital Capital andSuperstar Firms,” Hutchins Center Working Paper #73 (Washington, D.C.: HutchinsCenter at Brookings, 2021), https://www.brookings.edu/research/digital-capital-and-superstar-firms.20 There is some evidence that capital is already becoming an increasingly good substitutefor labor. See, for instance, the discussion in Michael Knoblach and Fabian Stöckl,“What Determines the Elasticity of Substitution between Capital and Labor? A Litera-ture Review,” Journal of Economic Surveys 34 (4) (2020): 852.21 See, for example, Tyler Cowen, Average Is Over: Powering America beyond the Age of the GreatStagnation (New York: Penguin, 2013). Or more provocatively, Yuval Noah Harari,“The Rise of the Useless Class,” Ted Talk, February 24, 2017, https://ideas.ted.com/the-rise-of-the-useless-class/.22 Anton Korinek and Joseph E. Stiglitz, “Artificial Intelligence and Its Implications for In-come Distribution and Unemployment,” in The Economics of Artificial Intelligence, ed. AjayAgrawal, Joshua Gans, and Avi Goldfarb (Chicago: University of Chicago Press, 2019),349–390.23 Erik Brynjolfsson and Andrew McAfee, “Artificial Intelligence, for Real,” Harvard BusinessReview, August 7, 2017.24 Robert D. Putnam, Our Kids: The American Dream in Crisis (New York: Simon and Schuster,2016) describes the negative effects of joblessness, while Anne Case and Angus Deaton,Deaths of Despair and the Future of Capitalism (Princeton, N.J.: Princeton University Press,2021) documents the sharp decline in life expectancy among many of the same people.25 Simon Smith Kuznets, Economic Growth and Structure: Selected Essays (New York: W. W.Norton & Co., 1965).26 Friedrich August Hayek, “The Use of Knowledge in Society,” The American Economic Review35 (4) (1945): 519–530.27 Erik Brynjolfsson, “Information Assets, Technology and Organization,” ManagementScience 40 (12) (1994): 1645–1662, https://doi.org/10.1287/mnsc.40.12.1645.28 For instance, in the year 2000, an estimated 85 billion (mostly analog) photos were tak-en, but by 2020, that had grown nearly twenty-fold to 1.4 trillion (almost all digital)photos.286Dædalus, the Journal of the American Academy of Arts & SciencesThe Turing Trap: The Promise & Peril of Human-Like Artificial Intelligence29 Andrew Ng, “What Data Scientists Should Know about Deep Learning,” speech pre-sented at Extract Data Conference, November 24, 2015, https://www.slideshare.net/ExtractConf/andrew-ng-chief-scientist-at-baidu (accessed September 9, 2021).30 Sanford J. Grossman and Oliver D. Hart, “The Costs and Benefits of Ownership: A The-ory of Vertical and Lateral Integration,” Journal of Political Economy 94 (4) (1986): 691–719; and Oliver D. Hart and John Moore, “Property Rights and the Nature of the Firm,”Journal of Political Economy 98 (6) (1990): 1119–1158.31 Erik Brynjolfsson and Andrew Ng, “Big AI Can Centralize Decisionmaking and Power.And That’s a Problem,” MILA-UNESCO Working Paper (Montreal: MILA-UNESCO,2021).32 “Simon Electronic Brain–Complete History of the Simon Computer,” History Com-puter, January 4, 2021, https://history-computer.com/simon-electronic-brain-complete-history-of-the-simon-computer/.33 Hans Moravec, Mind Children: The Future of Robot and Human Intelligence (Cambridge,Mass.: Harvard University Press, 1988).34 Will Knight, “Alpha Zero’s ‘Alien’ Chess Shows the Power, and the Peculiarity, of AI,”Technology Review, December 2017.35 Richard Waters, “Techmate: How AI Rewrote the Rules of Chess,” Financial Times, Janu-ary 12, 2018.36 Matt Beane and Erik Brynjolfsson, “Working with Robots in a Post-Pandemic World,”MIT Sloan Management Review 62 (1) (2020): 1–5.37 Timothy Bresnahan and Robert J. Gordon, “Introduction,” The Economics of New Goods(Chicago: University of Chicago Press, 1996).38 David Autor, Anna Salomons, and Bryan Seegmiller, “New Frontiers: The Origins andContent of New Work, 1940–2018,” NBER Preprint, July 26, 2021.39 David Killock, “AI Outperforms Radiologists in Mammographic Screening,” NatureReviews Clinical Oncology 17 (134) (2020), https://doi.org/10.1038/s41571-020-0329-7.40 Erik Brynjolfsson, Tom Mitchell, and Daniel Rock, “What Can Machines Learn, andWhat Does It Mean for Occupations and the Economy?” AEA Papers and Proceedings(2018): 43–47.41 Erik Brynjolfsson, Daniel Rock, and Prasanna Tambe, “How Will Machine LearningTransform the Labor Market?” Governance in an Emerging New World (619) (2019), https://www.hoover.org/research/how-will-machine-learning-transform-labor-market.42 Paul Milgrom and John Roberts, “The Economics of Modern Manufacturing: Technol-ogy, Strategy, and Organization,” American Economic Review 80 (3) (1990): 511–528.43 See Daron Acemoglu, Andrea Manera, and Pascual Restrepo, “Does the U.S. Tax CodeFavor Automation?” Brookings Papers on Economic Activity (Spring 2020); and Daron Ace-moglu, ed., Redesigning AI (Cambridge, Mass.: MIT Press, 2021).44 This reverses the classic result suggesting that taxes on capital should be lower than taxeson labor. Christophe Chamley, “Optimal Taxation of Capital Income in General Equi-librium with Infinite Lives,” Econometrica 54 (3) (1986): 607–622; and Kenneth L. Judd,“Redistributive Taxation in a Simple Perfect Foresight Model,” Journal of Public Econom-ics 28 (1) (1985): 59–83.151 (2) Spring 2022287Erik Brynjolfsson45 Tambe et al., “Digital Capital and Superstar Firms.”46 Katherine S. Newman, Chutes and Ladders: Navigating the Low-Wage Labor Market (Cam-bridge, Mass.: Harvard University Press, 2006).47 While the distinction between complements and substitutes is clear in economic theory,it can be trickier in practice. Part of the appeal of broad training and/or tax incentives,rather than specific technology mandates or prohibitions, is that they allow technol-ogies, entrepreneurs, and, ultimately, the market to reward approaches that augmentlabor rather than replace it.48 See David H. Autor, David Dorn, and Gordon H. Hanson, “The China Shock: Learningfrom Labor-Market Adjustment to Large Changes in Trade,” Annual Review of Economics8 (2016): 205–240.
10,000 Matching Annotations
- Last 7 days
-
www.jstor.org www.jstor.org
-
-
www.ystrickler.com www.ystrickler.com
-
Antienshittification
-
-
www.biorxiv.org www.biorxiv.org
-
Note: This preprint has been reviewed by subject experts for Review Commons. Content has not been altered except for formatting.
Learn more at Review Commons
Referee #3
Evidence, reproducibility and clarity
Summary
In this manuscript, the authors investigate the role of the tubulin polyglutamylase TTLL6 in maintaining colonic epithelial homeostasis and its potential role in colorectal cancer (CRC). Using transcriptomic analyses, mouse genetics, histology, and proteomics, the authors report that TTLL6 is highly expressed in colonic epithelial cells and decreases during CRC progression. Constitutive and epithelial-specific deletion of Ttll6 in mice leads to elongated colonic crypts, expansion of proliferative and stem cell compartments, and increased susceptibility to chemically induced colitis-associated carcinogenesis. Mechanistically, the authors identify the nucleic acid-binding protein PurA as a potential non-tubulin substrate of TTLL6. They propose that TTLL6-mediated polyglutamylation of PurA regulates its nuclear localization, thereby contributing to epithelial homeostasis in the colon. Together, the study suggests a TTLL6-PurA axis that may restrain early colorectal tumorigenesis.
Major comments
- Evidence that PurA is a physiologically relevant TTLL6 substrate remains incomplete. A central conclusion of the manuscript is that PurA is a substrate of TTLL6 whose polyglutamylation regulates nuclear localization. While the authors present several lines of evidence (PolyE immunoprecipitation, co-transfection experiments, and mutagenesis of the PurA C-terminal glutamate residues), the physiological relevance of this modification remains somewhat indirect. For example, polyglutamylation of endogenous PurA in colonic epithelial cells is inferred but not directly demonstrated. The PolyE antibody detects glutamate chains but does not identify the specific modified protein in tissue. Direct evidence that PurA is polyglutamylated in vivo (e.g., MS identification of the modification site on PurA or PurA immunoprecipitation followed by PolyE detection) would strengthen the mechanistic claim. At present, the data convincingly show that TTLL6 can glutamylate PurA in an overexpression system, but the endogenous modification remains less clearly demonstrated.
- Mechanistic link between PurA localization and the epithelial phenotype is not established. The authors propose that loss of TTLL6 disrupts PurA nuclear localization and thereby alters epithelial homeostasis. However, the manuscript does not establish a causal relationship between PurA localization and the observed crypt phenotypes. Specifically, it is not shown whether PurA loss phenocopies Ttll6 deficiency in the colon. No experiments test whether restoring nuclear PurA rescues the Ttll6 phenotype. Downstream transcriptional or signaling pathways regulated by PurA are not explored. Thus, while the TTLL6-PurA relationship is intriguing, the study remains largely correlative with respect to functional consequences.
- Interpretation of the tumorigenesis data should be tempered. The authors conclude that Ttll6 deficiency promotes colon carcinogenesis. However, the tumor data appear somewhat limited. Increased tumor numbers are reported only at an early time point (day 40) and are described as a trend toward significance. By day 70, tumor numbers and sizes appear comparable between groups. The increased incidence of vimentin-positive crypts is interesting but does not clearly establish increased tumor burden. Given these results, the conclusion that TTLL6 restrains tumorigenesis may be stronger than supported by the data. The authors may wish to frame this as enhanced early tumor development or altered tumor progression rather than increased tumorigenesis per se.
- Expansion of multiple epithelial cell populations requires clarification. The authors report that Ttll6-deficient colons exhibit expansion of stem/progenitor compartments as well as increased numbers of differentiated cells (e.g., goblet cells and enterocytes). While these findings are interesting, the biological interpretation is somewhat unclear. For example, expansion of stem/progenitor compartments typically accompanies reduced differentiation rather than increased differentiation. It is not clear whether the increased numbers of differentiated cells reflect overall crypt enlargement or altered lineage allocation. Quantification of cell-type proportions rather than absolute cell numbers would help clarify whether differentiation programs are altered.
- Nuclear polyglutamylation requires further clarification The authors report nuclear PolyE staining in colonic epithelial cells and propose that this reflects polyglutamylation of non-tubulin substrates such as PurA. However, it is not clear whether other nuclear proteins could account for this signal. The specificity of the nuclear PolyE signal should be better validated. Additional controls (e.g., peptide competition or validation with alternative approaches) would strengthen the interpretation.
Minor comments
- The manuscript would benefit from clearer distinction between tubulin vs non-tubulin glutamylation throughout the text.
- Some conclusions in the Discussion appear slightly overstated relative to the data (e.g., the role of the TTLL6-PurA axis in tumor suppression).
- The description of the Ttll6 mouse models (constitutive vs conditional deletion) could be clarified earlier in the Results section.
- Quantification methods for histological analyses (crypt length, cell counts, marker-positive cells) should be described in greater detail in the Methods.
- It would be useful to include representative images of PurA localization in control vs Ttll6-deficient colon tissue in the main figures.
- Several minor typographical issues appear throughout the manuscript and should be corrected during revision.
Significance
General assessment
This study investigates the role of the polyglutamylase TTLL6 in intestinal epithelial biology and colorectal cancer. The identification of a potential non-tubulin substrate (PurA) is conceptually interesting and expands the emerging view that tubulin-modifying enzymes can regulate additional cellular proteins. The study combines mouse genetics, histological analysis, transcriptomic datasets, and proteomics, which together provide a substantial dataset supporting a role for TTLL6 in regulating crypt architecture and epithelial proliferation. However, the mechanistic link between TTLL6 activity, PurA modification, and epithelial homeostasis remains incompletely resolved. The tumorigenesis data also suggest only modest effects on carcinogenesis.
Advance relative to previous literature
Previous studies have linked members of the TTLL family primarily to microtubule regulation and ciliary biology. This work extends these findings by suggesting a tissue-specific function of TTLL6 in the colon, and the existence of non-tubulin substrates regulating epithelial biology. If further validated, the identification of PurA polyglutamylation could represent an interesting conceptual advance.
The manuscript will likely be of interest to researchers working in cytoskeletal post-translational modifications, intestinal epithelial biology, colorectal cancer biology
My expertise lies in cytoskeletal regulation, epithelial biology, and intestinal tissue organization, which are directly relevant to the central themes of this manuscript.
-
Note: This preprint has been reviewed by subject experts for Review Commons. Content has not been altered except for formatting.
Learn more at Review Commons
Referee #2
Evidence, reproducibility and clarity
Summary: In this study, the authors investigate novel functions of the tubulin typrosine ligase-like protein 6 (TTLL6), which covalently adds glutamate residues to the C-terminus of a given protein. The authors have already published previously on this topic. In the current study, the role of TTLL6 in colon function and pathologies was investigated. The study consists of two major parts. In the first part, a mouse model is used to show that TTLL6 is expressed at elevated levels and activity in epithelial cells of the colon. A database search indicated that TTL6 expression positively correlates with prognosis of patients with colorectal cancer. The authors generated a TTLL6 KO mouse and showed that induced tumor growth at 40 days was more positive for vimentin in the crypts of these mice, which should correlate with tumor aggressiveness. This difference was not observed anymore after 70 days. Morphological analyses of the crypts showed that in TTLL6 KO mice the crypts increased in length, a difference in proliferation markers, and a change of cell types in the crypts was observed.<br /> In the second part, the authors used a modification-specific antibody to immunoprecipitate (IP) proteins modified by TTLLs. To identify TTLL6-dependently modified target proteins, they compared these results with IPs from TTLL6 KO mice. A total of 43 proteins were identified this way. Because of their similarity to the tubuline tail sequence, two of the enriched proteins, PurA and PurB, were further analyzed. The authors provide evidence that PurA but not PurB is modified by TTLL6, which as a result changes its subcellular localization. While the first part of this work provides convincing novel insights into TTLL6's function with potential pathological relevance, the second part raises some concerns. I would therefore tend to rate the quality of the first part significantly higher than the second part.
Major comments:
1) When considering the results of the induced colorectal cancer test, the only significant difference between WT and KO was the moderately higher expression of Vimentin (figure 5E-F). Since this is the main evidence for a pathological relevance of TTLL6 in cancer, it is important to understand how the quantification of Vimentin in the complex tissue shown in figure 5E was done. A detailed description of how these images were analysed and perhaps a table with raw data would be essential to convince the reader of the conclusions. In the currently presented form, I find the analyses not too convincing.
2) Figure 7A: It was somewhat surprising that two of the least significant (PurA is just below the cutoff) were used for further analyses. Although the authors explain that both proteins have strong sequence similarity to the know TTLL6 target, tubuline, the C-terminal, genomically encoded protein sequence of PurA and PurB already contain several glutamates. This raises the concern that the polyE antibody in the IP possibly detected the non-modified C-terminal tail of PurA and PurB and that both proteins may not be modified by TTLL6. Because of this and the lower significance than other candidates, the authors should consider focussing on other hits (OPTIONAL). Besides being much more significant, they lack an accumulation of glutamates in their C-terminus (at least the ones I looked at). Alternatively, the concern of having potentially IP-ed unmodified proteins should be addressed.
3) Figure 8A: this figure compares PurA with a modified PurA that lacks the C-terminal EEE stretch. The authors conclude that the subcellular localization is different between both and that the nuclear localization of WT PURA must be due to modification by the co-expressed TTLL6. There are two major concerns with this conclusion: Firstly, the expression of PurA without TTLL6 co-expression is a missing essential control. This would show if PurA itself is already predominantly located in the nucleus regardless of potential modifications (PurA seems to have different nucleocytoplasmic localization in different cell types). Secondly, both depicted cells look very different. In PurA the nuclei are much smaller and the cytoplasm seems also much smaller than in the PurA DDD-expressing cells. Furthermore, IF staining without proper quantification of several cells seem less than ideal for such conclusions. In case, the authors want to convincingly validate this conclusion such a quantification with several cells would be required. OPTIONAL: an alternative approach would be a nucleo-cytoplasmic fractionation experiment followed by a western blot.
Figure 8B: it seems that the contrast between the images of the upper and lower panel is very different. For this reason, I find it difficult to follow the conclusions. However, even when ignoring this aspect, I have great problems coming to the same conclusions as the authors.
Minor comments:
1) In figure 3A it would help if the legend describes what exactly "Control (+ or -)" means.
2) In figure 3E-F, a label inside of the figure (what is the red bar, what the blue) would help the reader to faster grasp the subfigures.
3) Figure 7C-D: these experiments are based on strong overexpression of TTLLs, which might result in unphysiological modifications of PurA. I would suggest to include a note of caution in the discussion that this is a possibility.
4) In the discussion (page 9, last paragraph), it is stated: "Our findings suggest that the polyglutamylation of PurA is essential for maintaining colonic homeostasis". I do not understand this statement, as this study does not provide any evidence that modification of PurA does play a functional role in the colon (expression itself is not an evidence for function importance or even being "essential"). I recommend to remove this statement.
5) Not all abbreviations are introduced properly (like CRC).
Significance
In general, this study addresses a very interesting aspect - i.e. the covalent addition of multiple glutamate residues to the C-terminus of a target gene by the enzyme TTLL6. The authors convincingly show that this protein regulates the morphology and composition of crypts in subregions of the colon. This is certainly a new and important finding that expands our knowledge about the functional breadth of this class of enzymes. If convincingly validated (see major concerns), also the pathological relevance of this enzyme for cancer progression would be of general interest. However, this statement has to be considered with a note of caution as this is not my area of expertise.
The validation of novel targets of TTLL6 after IP is - at this stage of the manuscript - not very convincing to me. In particular the claim that PurA does play a functional role in the TTLL6-dependent regulation (of crypts) is not justified by the data. However, given that the list of other candidates contains several important gene regulators, this work might have the potential to open up to open up the field for new research directions.
The reviewer's areas of expertise: cell biology, biochemistry, histology.
-
Note: This preprint has been reviewed by subject experts for Review Commons. Content has not been altered except for formatting.
Learn more at Review Commons
Referee #1
Evidence, reproducibility and clarity
Summary:
This study shows that loss of TTLL6 affects colonic epithelial homeostasis (crypt architecture and proliferation/differentiation markers) and proposes that TTLL6 contributes to a nuclear glutamylation signal, with PurA presented as a candidate non-tubulin substrate. The authors also connect TTLL6 mRNA levels to human CRC progression and outcome. Overall, the observations are potentially interesting, but the manuscript currently does not establish a clear mechanistic link between TTLL6 activity, PurA, and the in vivo phenotype.
Major comments:
- The "TTLL6-PurA link" framing is currently too strong. The pull-down data indicate multiple candidate substrates, and the study does not show that PurA is the key functional mediator of the epithelial phenotype. As written, the manuscript reads as though PurA is the central downstream effector, which is not yet supported. Requested change: Either add substrate-specific functional evidence (additional KO/rescue-type experiments) or soften the language throughout (title/abstract/discussion) to reflect that PurA is one candidate among several.
- PurA glutamylation should be demonstrated directly by MS. PolyE/GT335 immunoblotting and enrichment in PolyE pull-downs are suggestive, but they do not conclusively establish glutamylation of PurA at the C-terminal end (antibody specificity and/or co-precipitating glutamylated proteins remain possible explanations). Essential experiment: MS/MS identification of glutamylated residue(s) on PurA, ideally with evidence that the modification is TTLL6-dependent (WT vs KO or epithelial-inducible KO).
- Regional TTLL6 expression vs phenotype needs to be reconciled. TTLL6 expression is reported to be highest in distal colon, yet the strongest crypt-length phenotype appears in transverse colon (as presented). Proximal colon data are not shown in the main text. Requested revision: Provide complete regional analyses (proximal/transverse/distal) with consistent quantification and statistics, and discuss explicitly why TTLL6 expression levels and phenotype do (or do not) align.
- Several internal inconsistencies and missing statistics.
- Fig. 1A vs 1B: CEC enrichment appears ~80-fold in panel A and ~4-fold in the panel B; if these reflect the same enrichment workflow, this discrepancy needs a clear explanation (normalization, starting material, ....).
- Fig. 2A: statistics are missing.
- Fig. 5D: the effects appear borderline; the conclusions should match the statistical support/significance. Requested revision: Ensure complete statistical reporting in the manuscript (n, definition of replicates, test used, p-values/thresholds) and avoid interpretive language where differences are not significant.
- PurA Localization claims would benefit from stronger imaging and quantification. For nuclear localization/redistribution conclusions (main Fig. 8 and related supplement), confocal imaging with Z-stacks (and orthogonal views) would be more convincing than representative single-plane images. In addition, conditions with PurA-only expression need a clear baseline description and quantification. Requested additions: confocal Z-stacks + blinded quantification of nuclear/cytosolic localization across replicates; ideally support with subcellular fractionation and quantitative immunoblotting.
- Overexpression artifacts should be considered more carefully. If TTLL6 has been described as an elongase in prior work (Mahalingan, NSMB, 2020, DOI: 10.1038/s41594-020-0462-0) high-level overexpression may generate non-physiological modifications or localization patterns. Requested revision: Soften conclusions drawn from overexpression experiments and provide appropriate expression controls and/or supportive evidence in more physiological settings.
- Mouse tumor data should be interpreted more cautiously relative to the human correlations. The human datasets suggest a correlation between TTLL6 mRNA levels and clinical features/outcome (including recurrence-free survival), which is potentially interesting. In contrast, the mouse CAC results appear modest/borderline and, in places, are interpreted as stronger evidence than the data support. Requested change: Avoid strong claims about TTLL6 promoting or suppressing tumor growth unless supported by robust, clearly significant differences and comprehensive burden metrics.
Minor comments:
- Every figure should clearly state n (biological vs technical), statistical test, and multiple-comparison correction where applicable.
- Where effects are segment-specific, the text should reflect that specificity and avoid global statements.
- The Discussion would benefit from a clearer separation of what is directly shown versus what is proposed (especially near the end).
- TTLL6 expression is largely presented at the transcript level; it would help to make this explicit throughout and avoid wording that implies protein-level validation where it is not shown.
Significance
The manuscript has the potential to be of interest because it points to a possible role for TTLL6 in non-tubulin, nuclear glutamylation in the intestinal epithelium, and it links TTLL6 expression to human CRC datasets. At present, however, the broader impact is limited by (i) insufficient direct evidence that PurA is glutamylated in vivo and (ii) the lack of a causal connection between PurA and the epithelial phenotype. In addition, while the human data show correlations between TTLL6 expression and clinical parameters/outcome, the mouse CAC phenotype appears comparatively modest/borderline and should be interpreted with appropriate caution. With stronger biochemical validation (MS), improved localization quantification, and more restrained framing (or additional functional data), the work could appeal to readers in intestinal epithelial biology, post-translational modification biology, and CRC research.
Expertise: enzymology; post-translational modifications; microscopy; cancer mechanisms.
-
-
www.youtube.com www.youtube.com
-
Rapport de Synthèse : Le Traitement Judiciaire de l’Inceste Parental sur Mineurs
Résumé Exécutif
Ce document synthétise les témoignages et analyses de Mme Hélène Romano (psychologue et docteure en droit) et de Mme Eugénie Izard (pédopsychiatre) lors de leur audition par la commission d'enquête sur l'inceste.
Le constat est celui d'un échec structurel du système français : seuls 8 % des enfants ayant révélé des faits d'inceste sont effectivement protégés, tandis que 95 % des procédures sont classées sans suite.
Les points critiques identifiés sont :
-
L'institutionnalisation du doute : Un basculement idéologique post-affaire d'Outreau qui érige l'enfant en menteur de principe et le parent protecteur en manipulateur.
-
L'absence de méthodologie scientifique : L'inexistence d'outils standardisés (comme le protocole SVA) pour évaluer la crédibilité de la parole de l'enfant.
-
Le rôle délétère de l'Ordre des Médecins : Une institution accusée de réduire les médecins au silence et de sanctionner ceux qui signalent des maltraitances.
-
La primauté de la famille sur l'enfant : Une sacralisation de la "coparentalité" et du lien biologique qui contraint les enfants à maintenir des liens avec leurs agresseurs présumés.
--------------------------------------------------------------------------------
1. Un Système Structurellement Défaillant
L'inceste n'est pas une accumulation de faits divers conjoncturels, mais un phénomène systémique et organisé.
Malgré une libération de la parole médiatique, les statistiques révèlent une impunité persistante.
Chiffres clés du traitement de l'inceste en France
| Indicateur | Donnée | | --- | --- | | Enfants victimes de violences sexuelles par an | 160 000 | | Part des violences étant d'ordre incestueux | 80 % | | Taux de protection des enfants après révélation | 8 % | | Taux de procédures classées sans suite | 95 % | | Condamnations annuelles | Environ 1 000 |
Le système actuel est décrit comme une "inversion perverse" où l'enfant qui parle n'est pas entendu et se voit souvent remis à la garde du parent désigné comme agresseur.
--------------------------------------------------------------------------------
2. L'Idéologie du Doute et l'Inversion de la Culpabilité
Depuis l'affaire d'Outreau, une "idéologie du mensonge" imprègne les institutions judiciaires et médico-sociales.
La disqualification du parent protecteur
Majoritairement des mères (95 % des auteurs d'inceste étant des hommes), les parents protecteurs subissent un processus de disqualification en plusieurs étapes :
-
Disqualification psychologique : Mère jugée "trop fusionnelle", fatiguée ou déprimée.
-
Biais de confirmation : L'épuisement de la mère face au système est utilisé pour confirmer son instabilité psychique.
-
Accusations de pathologie : Recours au Syndrome d'Aliénation Parentale (SAP) ou au Syndrome de Münchhausen par procuration pour accuser la mère de manipuler l'enfant.
Note : Le SAP n'est pas reconnu par le DSM et son usage est proscrit par plusieurs instances internationales, mais il reste largement utilisé pour discréditer les signalements.
Les conséquences pour l'enfant
L'enfant est souvent réduit à l'état d'objet.
S'il ne parle pas (contexte de terreur, handicap, bas âge), son silence est utilisé contre lui.
S'il parle, il subit une "sur-violence" institutionnelle : répétition épuisante des récits (parfois plus de 20 fois), confrontations traumatisantes et absence de protection.
--------------------------------------------------------------------------------
3. Défaillances de l'Expertise et Absence de Méthodologie
La France souffre d'un manque criant de professionnels formés spécifiquement au psychotrauma de l'enfant et à l'évaluation de sa parole.
-
Le "Chifoumi" judiciaire : En l'absence de méthodes validées, les décisions sont souvent le fruit de biais cognitifs et de stéréotypes (ex: "les enfants mentent", "l'inceste n'existe pas").
-
L'outil SVA (State Validity Assessment) : Cette méthode, utilisée à l'étranger mais proscrite en France après Outreau, repose sur 19 critères permettant de distinguer un récit vécu d'un récit fabriqué (cohérence, détails atypiques, dialogues rapportés).
-
Incompétence des experts : Des experts psychiatres d'adultes sont parfois mandatés pour des enfants sans avoir de pratique clinique pédiatrique, rendant des rapports basés sur des entretiens de quelques minutes.
--------------------------------------------------------------------------------
4. L'Ordre des Médecins : Un Obstacle à la Protection
Le témoignage du Dr Izard met en lumière une "silenciation" des médecins par leur propre institution.
-
Pressions et sanctions : Des médecins sont interdits d'exercer pour avoir signalé des enfants en danger, l'Ordre invoquant souvent "l'immixtion dans les affaires de famille".
-
Entrave à la loi : Bien que la loi de 2015 dégage les médecins de leur responsabilité en cas de signalement de bonne foi, l'Ordre est accusé d'ignorer la loi pénale pour sanctionner disciplinairement les praticiens.
-
Résultat : Seul 1 % des signalements de violences sexuelles incestueuses proviennent de médecins, par crainte de représailles ordinales.
--------------------------------------------------------------------------------
5. La Sacralisation du Lien Familial et de la Coparentalité
Le système français privilégie le maintien du lien familial au détriment de la sécurité de l'enfant.
-
Le paradigme de la réparation : L'enfant est souvent utilisé comme un "outil de réparation" pour le parent agresseur via des visites médiatisées forcées, au nom de la coparentalité.
-
Le conflit vs la violence : Le terme "conflit parental" est abusivement utilisé pour invisibiliser les violences sexuelles.
Or, il ne peut y avoir de coparentalité dans une situation d'inceste.
- La violence judiciaire : Le cas de Mme Romano illustre l'extrême violence subie par les parents protecteurs : gardes à vue humiliantes, perquisitions, ruine financière (frais d'avocats s'élevant à plusieurs centaines de milliers d'euros) et condamnations pour "non-représentation d'enfant" même face à des preuves médicales de violences.
--------------------------------------------------------------------------------
6. Pistes de Réformes et Recommandations
Les intervenantes proposent plusieurs leviers pour transformer radicalement la prise en charge :
Réformes Procédurales et Judiciaires
-
Création d'un crime d'inceste spécifique dans le code pénal, intégrant la notion de domination et de crime contre l'humanité de l'enfant.
-
Reconnaissance de l'imprescriptibilité pour les crimes sexuels sur mineurs.
-
Priorisation de l'ordonnance de protection immédiate dès la révélation.
-
Saisine directe du Juge aux Affaires Familiales (JAF) par le procureur pour suspendre les droits du parent mis en cause pendant l'enquête.
-
Suppression du délit de non-représentation d'enfant en cas de suspicion de violences.
Évaluation et Santé
-
Usage de méthodologies standardisées (SVA, protocole NICHD) pour l'audition et l'expertise.
-
Enregistrement audiovisuel systématique de toutes les expertises.
-
Création de collèges d'experts spécialisés en psychotraumatologie infantile.
-
Immunité disciplinaire effective pour les médecins signalant des maltraitances de bonne foi.
-
Anonymat possible pour les professionnels signalant des faits graves.
Transformation Sociétale
-
Sortir du déni de la domination masculine et patriarcale au sein de la famille.
-
Former massivement tous les professionnels au contact des enfants (école, santé, social) au repérage des troubles spécifiques.
-
Protéger l'enfant avant de protéger la famille, en cessant de considérer le lien biologique comme sacré au-delà de la sécurité physique et psychique.
-
-
-
pmc.ncbi.nlm.nih.gov pmc.ncbi.nlm.nih.gov
-
RRID:AB_2224574
DOI: 10.1038/s41419-026-08605-4
Resource: (Proteintech Cat# 10176-2-AP, RRID:AB_2224574)
Curator: @scibot
SciCrunch record: RRID:AB_2224574
Tags
Annotators
URL
-
-
www.sciencedirect.com www.sciencedirect.com
-
此外,通过三种典型的等温模型(Langmuir、Freundlich 和 Temkin 模型)分析了吸附剂(CUH 和 CUF)与吸附质(磺胺甲恶唑)之间的吸附相互作用,结果如图 4b-d 和表 S4 所示。CUH 和 CUF 的实验数据与 Freundlich 模型拟合度最高(R 2 最接近),表明多分子层吸附占主导作用。Freundlich 指数(n = 异质性因子)的值可用于解释三种吸附行为:当 1/n < 1、=1 和>1 时,分别对应物理过程、线性过程和化学过程[34]。CUH 和 CUF 的 n 值分别为 0.894 和 0.868,表明催化剂表面存在物理吸附。
freundlish吸附线和其他等温吸附线判断吸附类型
-
-
www.computerworld.com www.computerworld.com
-
“You are my intellectual sparring partner. Your job is to disagree with me constructively, not to agree. For every idea I present: 1) identify and challenge hidden assumptions; 2) build a strong counter-argument; 3) stress-test my logic for flaws, logical gaps, or weaknesses; 4) offer alternative perspectives to mine; and 5) prioritize truth over consensus.”
Annotating this to keep the prompt handy. I am going to test this to see how the opinion is swayed.
-
-
www.datapulseresearch.com www.datapulseresearch.com
-
Schweiz beim Wohlstand auf Platz 4 in Europa
By what measurement? I would expect them to be No 1 or 2 by BIP
-
-
uj-cm-workshop.netlify.app uj-cm-workshop.netlify.app
-
Claude: Resources page shortening suggestions:
-
Remove duplicate tool cards — the Dashboard + Learn page cards are identical to what's on the About page. Replace with a compact one-liner: 'Interactive tools: Dashboard · How CM is Made · TEA Comparison · Technical Docs'
-
Add TEA Comparison link — the new compare.html page systematically compares Pasitka, Humbird, CE Delft, GFI, and Goodwin. This is directly relevant to the reading list context.
-
Keep the Shared Reading Collection — it serves a unique purpose (downloadable PDFs) not available elsewhere.
-
Keep the PQ Database section — it's the canonical link set.
-
-
-
unjournal.github.io unjournal.github.io
-
Claude: Content trimming plan for this page (1,147 lines → ~700 target)
Proposed changes in priority order: 1. Fold FBS/serum-free section — historical context, no longer reflects current practice. One visible sentence + collapsed detail. 2. Move jurisdiction & 'Which market?' discussions to workshop — these are workshop topics, not dashboard content. Replace with one-line links. 3. Fold GF signaling diagram — educational but not cost-relevant. Keep the price/solutions tables visible. 4. Bold audit — reduce bold to headings + key numbers only (addresses multiple reviewer comments). 5. Trim Further Resources — link to workshop resources page for full list. 6. CSS fixes — larger diagrams, less whitespace around SVGs.
Optional: fold 2-3 SVG diagrams (cell banking, seed train) to reduce scroll length — the text already explains these steps.
Full plan at
.private/content_trimming_plan.md. Feedback welcome here or in chat.
-
-
wowlit.org wowlit.org
-
Translanguaging does not demarcate children’s languages; instead, translanguaging maintains children’s active negotiation of language resources and practices on a continuum in order to express themselves in particular contexts.
I find this description of translanguaging to be a very good one because translanguaging does not limit or isolate language and rather it sees it as a collection of linguistic abilities that can be used in unison to express meaning and feeling. Being worded as an "active negotiation of language" is such an interesting way to put it because as somebody who translanguages every single day, it sounds like a good way to express the idea that the two languages aren't competing, but are instead flowing in our brains and bargaining depending on the situation or circumstance that we find ourselves in.
-
-
www.biorxiv.org www.biorxiv.org
-
Author Response:
The following is the authors’ response to the original reviews.
Public Reviews:
Reviewer #1 (Public review):
(1) The sample size for the ex vivo electrophysiology is small. Given the difficulty and complexity of the preparation, this is understandable. However, a larger sample size would have strengthened the authors' conclusions.
We appreciate that the sample size is small, but this was limited by the technical difficulty and relatively low yield with this preparation. From a total of 16 experiments, we were able to obtain successful recordings in 6 cases, and these provided the characterisation of the 11 cells reported in Figure 4. We believe that this is sufficient to “strongly suggest” that the cells with dense Trpm8 input correspond to cold-selective cells. We have toned down the statements in the abstract (line 23) and the Results section (line 246).
(2) The authors used tdTomato expression to identify brain targets innervated by these coldselective lamina I projection neurons. Since tdTomato is a soluble fluorescent protein that fills the entire cell, using synaptophysin reporters (e.g., synaptophysin-GFP) would have been more convincing in revealing the synaptic targets of these projection neurons.
As the Reviewer says, tdTomato labelling fills the entire cell. However, examination at high magnification reveals numerous varicosities along the labelled axons, presumably corresponding to synaptic boutons. We now illustrate this in Figure 6–figure supplement 2F.
In addition, we have provided further evidence that these varicosities correspond to (glutamatergic) synaptic boutons by immunostaining sections through the LPB for the postsynaptic density protein Homer1, and showing Homer1 puncta apposed to varicosities (Figure 6–figure supplement 2 G,H). This new information now appears in the Results section (lines 374-380).
(3) The summary cartoon shown in Figure 7 can be misleading because this study did not determine whether these cold - selective lamina I projection neurons have collateral branches to multiple brain targets or if there are anatomical subtypes that may project exclusively to specific targets. For example, a recent study (Ding et al., Neuron, 2025) demonstrated that there are PBN-projecting spinal neurons that do not project to other rostral brain areas. Furthermore, based on the authors' bulk labeling experiments, the three main brain targets are NTS, PBNrel, and cPAG. The VPL projection is very sparse and almost negligible.
We agree that branches to different brain nuclei may originate from specific subsets of ALS3 neurons and this is now stated in the figure legend. It is true that there are projections to other brain regions (including NTS). These are not included in the diagram, because their circuitry in relation to cold-sensing is less well understood. Although the projection to VPL from lumbar cord is sparse, this is likely to be explained by the very low proportion of lamina I projection neurons with axons that reach the thalamus. Our retrograde tracing data (e.g. Figure 6-figure supplement 4) had already revealed many cells in the C7 segment that were densely coated with Trpm8 afferents and retrogradely labelled from the lateral thalamus. We have carried out additional experiments in which AAV1.Cre<sup>ON</sup>.td Tomato was injected into the cervical enlargement of Calb1<sup>Cre</sup> mice.This resulted in much denser labelling in the VPL and PoT thalamic nuclei, supporting the suggestion that cold-selective lamina I neurons in the cervical enlargement project to these nuclei. This is now described in lines 381-387 and illustrated in Figure 6–figure supplement 3.
Reviewer #2 (Public review):
(1) In the characterization of recorded neurons in close contact or in the absence of this contact with TRPM8 afferents, the number of recorded neurons is relatively low. In addition, the strength of thermal stimuli is not very well controlled, preventing a more precise characterization of the connectivity.
We fully accept that the sample size is small (please see response to Reviewer 1 above). We also accept that the thermal stimulation was not that well controlled. Unfortunately, commercially available probes for controlling skin temperature are too large to apply to the skin in this preparation. For this reason, we have used application of hot and cold saline, as in our previous studies with this preparation.
(2) The authors could provide some sense of the effort needed to record from the 6 coldactivated neurons described. How many preparations were needed, etc?
We now state that 6 out of 16 experiments resulted in successful recordings for this part of the study (lines 858-861).
Reviewer #3 (Public review):
(1) While anatomical evidence for direct synaptic connectivity between Trpm8+ afferents and lamina I projection neurons is compelling, a physiological demonstration of strict monosynaptic transmission is not shown. The conclusion that these inputs are exclusively monosynaptic should be toned down. Similarly, the statement that "Lamina I ALS neurons that are surrounded by Trpm8 afferents are cold-selective" should also be toned down as only a few neurons have been tested and it cannot be excluded that other neurons with similar characteristics may be polymodal.
We have now carried out optogenetic experiments by expressing channelrhodopsin in Trpm8 afferents and retrogradely labelling ALS neurons with tdTomato. This has allowed us to directly demonstrate monosynaptic input. This is described in the Results section (lines 180-202) and the Methods section has been updated. As noted above, we have toned down the statement about lamina I neurons surrounded by Trpm8 afferents being coldselective (line 246).
Recommendations for the authors:
Reviewer #1 (Recommendations for the authors):
(1) The patch innervation of Trpm8+ sensory neurons in lamina I of the spinal cord dorsal horn is interesting. Do they occupy specific areas within lamina I along the mediolateral axis, or are their placements random? Quantifying the distribution of these terminals in lamina I might be worthwhile.
Although we have not studied the mediolateral distribution systematically, it appears that the locations of the patches in the mediolateral axis is random, and they could be seen in medial, central and lateral parts of lamina I (as shown in Figure 2). We have added a comment to this effect in the Results section (lines 114-116). Quantifying Trpm8 terminals would be very labour-intensive, and we do not feel that this would be of great benefit.
(2) Quantification for the percentage of Trpm8+ boutons contacting Phox2a+ neurons that are vGlut3+
The main purpose of this part of the study was to provide a possible explanation for the finding by Li et al (2015) that some lamina I cells were associated with Vglut3-
immunoreactive boutons. We found that the percentages of Trpm8+ boutons that contained Vglut3 varied considerably from cell to cell, and this is now stated in the text (lines 133134). However, knowing exact proportions was not an important aspect of the study, we have therefore not carried out a detailed analysis.
(3) Quantification for the percentage of PBN projections neurons densely innervated by Trpm8+ axons that are calb1+.
As requested, we have carried out immunohistochemistry to determine the proportion of lamina I ALS neurons with dense Trpm8 input that are calbindin-immunoreactive. We examined 31 neurons from 3 different mice and found that all but 4 (i.e. 87%) were immunoreactive. This is now described (lines 287-293) and illustrated (Figure 5–figure supplement 1). We have now put the electrophysiological characterisation that was in this figure into a separate supplement (Figure 5–figure supplement 2).
(4) It might be helpful to confirm the brain projection targets of Cal1b+ lamina 1 projection neurons using AAV1-CreON-Synaptophysin-GFP (or other fluorescent proteins) injections
Please see our response to Public review Reviewer 1 comment 2 above. We have provided further evidence that the brain regions that received input from the Calb1+ cells contain axonal boutons (lines 374-380 and Figure 6–figure supplement 2F-H).
(5) Figure 6 - Figure Supplements 3 and 4 are duplicated
We apologise for this duplication, which was made in error in the version originally submitted to eLife. This has now been corrected.
Reviewer #2 (Recommendations for the authors):
(1) As mentioned, in the characterization of recorded neurons in close contact or in the absence of this contact with TRPM8 afferents, the number of recorded neurons is relatively low, some recorded in current clamp, a few in voltage clamp. This prevents any solid statistical evaluation of the findings
Please see response to response to the first point made by Reviewer 1 in the Public reviews. As stated above, we have toned down the statement about the relationship between cells with dense Trpm8 input and cold-selective cells (line 246).
(2) In addition, the strength of thermal stimuli is not very well controlled, preventing a more precise characterization of the synaptic connection between afferents and ALS projection neurons.
Please see our response to the Public review comment made by this Reviewer.
(3) Line 35. In the description of the anterolateral system and the effects of lesions, the species(s) should be specified since rodents and humans have a different anatomical distribution of spinal tracts.
We now state that while ALS axons ascend in the anterolateral quadrant in humans, they are located in the dorsolateral white matter in rodents (lines 40-42)
(4) To describe the semi-intact preparation used for recording and stimulation from the periphery, the authors cite a study by Julien Allard (reference 25). However, that study describes an in vivo preparation. I believe there is an error in the citation.
We thank the Reviewer for pointing this out – it has now been corrected.
(5) Line 726. Dorsal horn recordings were performed at 25 ºC. What is the temperature of the skin? How would this low temperature affect the excitability of cold afferents and their axons? Perhaps a comment about this issue would be appropriate.
The skin temperature in this preparation is the same as that of the spinal cord (25 °C). At this temperature, Trpm8 afferents would be active, but are likely to have adapted during the course of the experiment. Since this temperature is below 37 °C, it is likely that the conduction velocity of these afferents will be slower than in the in vivo situation. We have added a comment to this effect (lines 818-821).
(6) Line 401. The authors could not detect Trpv1-immunoreactivity in the central terminals of Trpm8Flp;RCE:FRT mice. Could they detect Trpv1 immunoreactivity in any central terminal? Do they have positive evidence that their immunostaining worked?
Trpv1 was readily detected in central terminals with the Trpv1 antibody. An example showing lack of detectable Trpv1-immunoreactivity in GFP-labelled (Trpm8-expressing) afferents is now shown in Figure 2–figure supplement 1K-M.
(7) Line 437. What is the expected anterograde transport time for YFP from the lumbar cord to the brainstem? Are 2-3 weeks not sufficient based on the literature? I noticed the authors are using longer survival times after intraspinal injections
In preliminary experiments for a previous study Substance P-expressing excitatory interneurons in the mouse superficial dorsal horn provide a propriospinal input to the lateral spinal nucleus | Brain Structure and Function we had found that a 2 week survival time after injection of AAV1.Cre<sup>ON</sup>.GFP into the lumbar spinal cord of Tac1<sup>Cre</sup> mice was not sufficient to label axons in the brain, although at 4 weeks we saw brain labelling. We have also found that extending survival times from 4 to 6 weeks gives greatly improved labelling, especially in the thalamus.
(8) Figure 5A. Many of the labelled cells appear to have the somas in the white matter, which makes little sense. It seems the reference section to plot the cells is not optimal
The placement of cells is accurate. Many spinal projection neurons are present outside the main region of grey matter (i.e. laminae I-X). These cells are found in 2 main regions – the lateral spinal nucleus (LSN) and the lateral reticulated part of lamina V. These two regions are intermediate between grey and white matter – i.e. they contain scattered cell bodies amongst a dense collection of axons. For this reason they appear outside the grey/white border as it is conventionally shown on diagrams of this type. This has been reported in numerous studies, e.g. see Figure 2 in The cells of origin of the spinothalamic tract of the rat: a quantitative reexamination - PubMed.
(9) Recent transcriptomic studies suggest the presence of more than one subpopulation of Trpm8-expressing DRG or trigeminal neurons. It is unclear to what extent the Trpm8-Flp line is capturing this diversity.
We are aware that there are at least 3 transcriptomic subsets of Trpm8-expressing primary sensory neurons. However, we are not aware of any suitable molecular markers that would allow us to discriminate between them, and therefore address this point.
(10) Could the patchy distribution of Trpm8 afferents in lamina I reflect incomplete recombination; the empty spaces could be occupied by unmarked afferents?
In theory it could, but this seems unlikely. The Trpm8<sup>Flp</sup> line (crossed with RCE:FRT) captures ~83% of Trpm8-positive cell bodies, and it seems very unlikely that the remaining 17% of Trpm8-expressing afferents would fill the spaces between GFP bundles that we see in lamina I. This is now stated in the Results section (lines 116-120).
Reviewer #3 (Recommendations for the authors):
(1) It would be a nice addition to the validation of the Trpm8-Flp line to specify what ages (if multiple) have been analysed and whether there are any differences. In addition, is labelling different at different levels of the spinal cord, and is there any labeling in supraspinal regions?
The tissue used for this part of the study was obtained from mice aged 5-9 weeks and this is now stated (lines 78-79). We did not observe any differences with age, but we did not look at this in detail. Labelling was similar at different levels of the spinal cord, and this is stated (lines 108-109). We have added a brief account of the distribution of GFP labelling in the brain (lines 140-144).
(2) Line 169. It is not clear how ALS neurons are labeled. It is explained in the material and methods (I believe it is AAV9.mCherry into the LPB or CVLM). Although I could not find a mention of a tdTomato AAV, maybe I missed it. In any case, it would be great to have the experimental strategy briefly explained in the text. For the same reason, I would recommend moving Figure 4 Supplement 1A and 1B schematics to the main figure, very helpful for understanding the experiment.
We thank the Reviewer for this suggestion. We now explain in the Results section how the ALS neurons were labelled (lines 209-212), and as the Reviewer recommends we have put the schematic diagrams from Figure 4–figure supplement 1 into the main Figure. As noted in the text, the tdTomato labelling resulted from injection of an AAV coding for Cre into mice that contained the Ai9 allele. We have also updated the descriptions of brain injections in the Methods section to cover the new experiments (optogenetics, and calbindin immunohistochemistry).
(3) Line 184. "Figure 4" would be good to specify the panels; I believe it should be 4A-C. Same for line 194, 4D-F?
We apologise that this was omitted from the original version – we have now specified the panels.
(4) Line 179. It would be great to specifiy in the text and figures the temperature used for hot and warm water. In addition, would the responses be different using different temperatures? Can you test ramps? These would go a great way to compare with responses shown in vivo by Ran and colleagues.
We now specify the hot and cold saline temperatures used to stimulate the skin in the semiintact preparation in the legend for Figure 4 and in the Results section (lines 222-223). As noted above, it is difficult to use more accurate thermal stimuli in this preparation. Please see response to Reviewer 2 public comment 1.
(5) Figure 4-Figure supplement 1F. It looks like these are very slow responses (1 sec?) for monosynaptic connectivity.
In this figure (now part 1D) the action potential frequency was determined from counts of APs in 1 sec bins, and this is now stated in the legend. This might have given the impression of slow responses.
(6) Line 203. I would tone down the statement, as only 6 cells "that were clearly associated with numerous GFP-labelled afferents" have been tested. Thus, it cannot be excluded that other cells with similar anatomical characteristics may also respond to other stimuli
As requested, we have toned down this statement (line 246).
(7) Line 230. Here AAV11.CreON.td Tomato is used, in previous retrograde experiments, AAV9 has been used (Figure 4), why the switch to 11? Is the tropism the same? Is it possible that because you are using a different serotype, you are targeting different neurons?
We have found that although AAV9 coding for fluorescent proteins is very good for retrograde labelling, AAV9 coding for Cre-dependent constructs (e.g. AAV.Cre<sup>ON</sup>.tdTomato) gives very poor recombination in spinal projection neurons, for reasons that we do not understand. We recently became aware of the AAV11 serotype, which was recommended as being suitable for retrograde transport AAV11 enables efficient retrograde targeting of projection neurons and enhances astrocyte-directed transduction | Nature Communications. We have found that this works very well for labelling ALS cells throughout the spinal cord when using Cre-dependent constructs. We have added a reference to this paper at this point in the text. We are not able to say whether tropism is the same or different, but in each case many ALS neurons (including many of those in lamina I) are captured.
(8) Line 234. Is there any positional organization for the "tdTomato-labelled cells densely innervated byTrpm8 afferents", do they preferentially cluster in some position of lamina I?
These cells are found throughout the mediolateral extent of the dorsal horn, and this is now stated (lines 279-280).
(9) Line 237. The actual number of cells/mm would be informative.
This would be difficult to estimate, as the sections were cut in the horizontal plane, which means that lamina I can appear on a variable number of sections.
(10) Line 249. From the figures, the action potentials of the Calb+ neurons seem to have a delayed onset (at the end of cold saline treatment, Figure 5, Supplement 1l) compared to lamina I ALS neurons recorded in Figure 4, Supplement 1f. If real, it is an interesting difference in the time-course of response that could indicate different coding properties e.g., response to cooling (general neurons) vs. response to absolute temperature (calb + neurons).
As for Fig 4-figure supplement 4 (see response to point #5 above), action potential frequency was determined from APs counted in 1 sec bins, and this is now stated in the legend.
(11) Figure 7. In the model, the disynaptic pathway should also be shown
We have added a comment to the legend stating that there may also be indirect (“polysynaptic”) input from Trpm8 afferents to ALS3 neurons.
-
-
www.medrxiv.org www.medrxiv.org
-
Reviewer #2 (Public review):
Summary:
This article addresses a very pertinent question - what are the computational mechanisms underlying risky behaviour in patients having attempted suicide. In particular, it is impressive how the authors find a broad behavioral effect whose mechanisms they can then explain and refine through computational modeling. This work is important because currently, beyond previous suicide attempts, there has been a lack of predictive measures. This study is the first step towards that: understanding the cognition on a group level. Before then being able to include it in future predictive studies (based on the cross-sectional data, this study by itself cannot assess the predictive validity of the measure).
Strengths:
- Large sample size<br /> - Replication of their own findings<br /> - Well-controlled task with measures of behaviour and mood + precise and well-validated computational modeling
Questions, based on revised manuscript and replies to other reviewers:
(1) Replies to reviewers in general: Bayes Factors have been added, it would be good to also use common verbal terms to describe them (e.g. 'anecdotal', 'moderate' etc). For example, my reading of table S8 would be that for gambling rate there is only anecdotal evidence that it does not relate to PSWQ, BDI, and moderate evidence it does not relate to TAI.
(2) Reply to reviewer 1 Q2 (Predicting STB):<br /> For the regression predicting suicidal ideation, it seems to me that what you did was a regression STB ~ gambling behaviour + approach + mood? Could you clarify? I had expected as a test of whether the task can predict STB risk something slightly different - a cross-validation (LOO or maybe 5-fold in the large sample): STB ~ gambling behaviour + approach [parameter from model] + mood [parameter from model]; and then computing in the left out participants: predicted STB. Then checking correlation between STB and predicted STB. This would allow testing whether the diverse task measures together predict STB (with the caveat, that it's cross-validated, rather than hold-out sample, unless you could train on one sample (in lab) and test on the other (online).
(3) Reply to reviewer 2 Q1 (parameter recovery): I'm looking at S3, it seems to still show only the scatter plots and not the correlation matrices, which are now added as text notes. Can you actually show these matrices? An off-diagonal correlation of 0.63 appears quite high. I think it needs to be discussed exactly which parameters those are, and whether that impacts the interpretation of the results.
(4) Reply to reviewer 3 Q3 (mood model): I would have imagined that the response would involve changing the mood equations (equation 8 main text) to include a term for whether the participant gambled or not, independent of the gamble value.
-
Author response:
The following is the authors’ response to the original reviews
eLife Assessment
This valuable study combined careful computational modeling, a large patient sample, and replication in an independent general population sample to provide a computational account of a difference in risk-taking between people who have attempted suicide and those who have not. It is proposed that this difference reflects a general change in the approach to risky (high-reward) options and a lower emotional response to certain rewards. Evidence for the specificity of the effect to suicide, however, is incomplete, which would require additional analyses.
We thank the editors and reviewers for this important assessment. Based on clinical interviews, we included patients with and without suicidality (S<sup>+</sup> and S<sup>-</sup> groups). However, in line with suicidal-related literature (e.g., Tsypes et al., 2024), two groups also differed substantially in the severity of symptoms (see Table 1). To address the request for evidence on specificity to suicidality beyond general symptom severity, we performed separate linear regressions to explain in gambling behaviour, value-insensitive approach parameter (β<sub>gain</sub>), and mood sensitivity to certain rewards (β<sub>CR</sub>) with group as a predictor (1 for S<sup>+</sup> group and 0 for S<sup>-</sup> group) and scores for anxiety and depression as covariates. Results remained significant after controlling anxiety and depression (ps < 0.027; Table S8). Given high correlations among anxiety and depression questionnaires (rs > 0.753, ps < 0.001), we performed Principal Components Analysis (PCA) on the clinical questionnaire to extract the orthogonal components, where each component explained 86.95%, 7.09%, 3.27%, and 2.68% variance, respectively. We then performed linear regressions using these components as covariates to control for anxiety and depression. Our main results remained significant (ps < 0.027; Table S9). We believe that these analyses provide evidence that the main effects on gambling and on mood were specific to suicide.
Moreover, as Reviewer 3 pointed out, these “absence of evidence” cannot provide insights of “evidence of absence”. Although we median-split patients by the scores of general symptoms (e.g., depression and anxiety-related questionnaires) and verified no significant differences in these severities (Figure S11), we additionally conducted Bayesian statistics in gambling behavior, value-insensitive approach parameter, and mood sensitivity to certain rewards. BF<sub>01</sub> is a Bayes factor comparing the null model (M<sub>0</sub>) to the alternative model (M<sub>1</sub>), where M<sub>0</sub> assumes no group difference. BF<sub>01</sub> > 1 indicates that evidence favors M<sub>0</sub>. As can be seen in Table S7, most results supported null hypothesis, suggesting that general symptoms of anxiety and depression overall did not influence our main results. Overall, we believe that these analyses provide compelling evidence for the specificity of the effect to suicide, above and beyond depression and anxiety.
Beyond these specific findings, this work highlights the broader utility of computational modelling and mood to better understand behavioral effect, showing how to use both mood and choice data to better comprehend a psychiatric issue.
Public Reviews:
Reviewer #1 (Public review):
Summary:
The authors use a gambling task with momentary mood ratings from Rutledge et al. and compare computational models of choice and mood to identify markers of decisional and affective impairments underlying risk-prone behavior in adolescents with suicidal thoughts and behaviors (STB). The results show that adolescents with STB show enhanced gambling behavior (choosing the gamble rather than the sure amount), and this is driven by a bias towards the largest possible win rather than insensitivity to possible losses. Moreover, this group shows a diminished effect of receiving a certain reward (in the non-gambling trials) on mood. The results were replicated in an undifferentiated online sample where participants were divided into groups with or without STB based on their self-report of suicidal ideation on one question in the Beck Depression Inventory self-report instrument. The authors suggest, therefore, that adolescents with decreased sensitivity to certain rewards may need to be monitored more closely for STB due to their increased propensity to take risky decisions aimed at (expected) gains (such as relief from an unbearable situation through suicide), regardless of the potential losses.
Strengths:
(1) The study uses a previously validated task design and replicates previously found results through well-explained model-free and model-based analyses.
(2) Sampling choice is optimal, with adolescents at high risk; an ideal cohort to target early preventative diagnoses and treatments for suicide.
(3) Replication of the results in an online cohort increases confidence in the findings.
(4) The models considered for comparison are thorough and well-motivated. The chosen models allow for teasing apart which decision and mood sensitivity parameters relate to risky decision-making across groups based on their hypotheses.
(5) Novel finding of mood (in)sensitivity to non-risky rewards and its relationship with risk behavior in STB.
Weaknesses:
(1) The sample size of 25 for the S- group was justified based on previous studies (lines 181-183); however, all three papers cited mention that their sample was low powered as a study limitation.
We thank the Reviewer for rising this concern. We agree that the sample size for S<sup>-</sup> group (n=25) is modest, and the prior studies we cited also acknowledged limited power. We wanted to point out that we obtained a comparable sample size to a prior study. In the revision, we therefore updated the section to justify this sample size in which we acknowledge the limited power of our study in the limitation section. Please see our clarification below:
Page 32:
“Third, despite replicating our main results in an independent dataset (n=747), the modest S<sup>-</sup> subgroup size (n=25) has a limited statistical power.”
(2) Modeling in the mediation analysis focused on predicting risk behavior in this task from the model-derived bias for gains and suicidal symptom scores. However, the prediction of clinical interest is of suicidal behaviors from task parameters/behavior - as a psychiatrist or psychologist, I would want to use this task to potentially determine who is at higher risk of attempting suicide and therefore needs to be more closely watched rather than the other way around (predicting behavior in the task from their symptom profile). Unfortunately, the analyses presented do not show that this prediction can be made using the current task. I was left wondering: is there a correlation between beta_gain and STB? It is also important to test for the same relationships between task parameters and behavior in the healthy control group, or to clarify that the recommendations for potential clinical relevance of these findings apply exclusively to people with a diagnosis of depression or anxiety disorder. Indeed, in line 672, the authors claim their results provide "computational markers for general suicidal tendency among adolescents", but this was not shown here, as there were no models predicting STB within patient groups or across patients and healthy controls.
Thank you for these thoughtful comments. Our study focuses on why adolescent patients with suicidality have increased risk behavior, aiming to provide a mechanism-based target for suicide prevention. Therefore, our dependent variable in the mediation model was gambling behavior. We also agree that the clinically relevant question is whether suicidality can be predicted from task-derived behavior/parameters. We thus used risky behavior and the potential mental parameters to predict STB. Linear regressions showed that gambling behavior, as well as the value-insensitive approach parameter, can predict suicidal symptom scores among patients (former: β = 9.189, t = 2.004, p = 0.048; latter: β = 5.587, t = 2.890, p = 0.005). In healthy controls, these predictions failed (gambling behavior: β = 1.471, t = 0.825, p = 0.411; approach: β = 0.874, t = 1.178, p = 0.241). These results suggest that clinical relevance of these findings apply exclusively to people with a diagnosis of depression or anxiety disorder. We found same patterns for the mood parameter (mood sensitivity to certain rewards: patients: β = -28.706, t = -2.801, p = 0.006; healthy controls: β = -2.204, t = -0.528, p = 0.599). In sum, we believe that our statement of “computational markers for general suicidal tendency among adolescents” is reasonable now. Please see our revisions below:
Page 17:
“Furthermore, linear regression showed that gambling rate can predict the current suicidal ideation score (BSI-C, β = 9.189, t = 2.004, p = 0.048) among patients, but not among HC (β = 1.471, t = 0.825, p = 0.411), suggesting that gambling behavior has patient-specific predictive utility for suicidal symptoms.”
Page 19:
“Furthermore, linear regression showed that approach parameter can predict the current suicidal ideation score (β = 5.587, t = 2.890, p = 0.005) among patients, but not among HC (β = 0.874, t = 1.178, p = 0.241), suggesting that value-insensitive approach parameter has patient-specific predictive utility for suicidal symptoms.”
Page 21:
“Furthermore, linear regression showed that mood sensitivity to CR can predict the current suicidal ideation score (β = -28.706, t = -2.801, p = 0.006) among patients, but not among HC (β = -2.204, t = 0.528, p = 0.599), suggesting that mood sensitivity to CR has patient-specific predictive utility for suicidal symptoms.”
(3) The FDR correction for multiple comparisons mentioned briefly in lines 536-538 was not clear. Which analyses were included in the FDR correction? In particular, did the correlations between gambling rate and BSI-C/BSI-W survive such correction? Were there other correlations tested here (e.g., with the TAI score or ERQ-R and ERQ-S) that should be corrected for? Did the mediation model survive FDR correction? Was there a correction for other mediation models (e.g., with BSI-W as a predictor), or was this specific model hypothesized and pre-registered, and therefore no other models were considered? Did the differences in beta_gain across groups survive FDR when including comparisons of all other parameters across groups? Because the results were replicated in the online dataset, it is ok if they did not survive FDR in the patient dataset, but it is important to be clear about this in presenting the findings in the patient dataset.
Thank you for raising the important issue of multiple testing and for asking us to clarify exactly which tests were covered by the FDR procedure. In the clinical dataset we conducted a large number of inferential tests (χ<sup>2</sup>, t-tests, ANOVAs, regressions) spanning: (i) group differences in demographic/clinical characteristics; (ii) sanity checks (e.g., anxiety/depression questionnaires); (iii) primary hypotheses (e.g., group differences in risky behavior); (iv) model-based analyses (parameter checks and between-group contrasts); and (v) control/sensitivity analyses. Post-hoc t-tests were performed only when the three-group ANOVA was significant. This yielded >150 p-values. FDR was applied using all these p-values. Please see our clarification below:
Supplementary Page 4:
“Supplementary Note 8: Clarification for FDR correction.
In the clinical dataset we conducted a large number of inferential tests (χ<sup2\</sup>, t-tests, ANOVAs, regressions) spanning: (i) group differences in demographic/clinical characteristics; (ii) sanity checks (e.g., anxiety/depression questionnaires); (iii) primary hypotheses (e.g., group differences in risky behavior); (iv) model-based analyses (parameter checks and between-group contrasts); and (v) control/sensitivity analyses. Post-hoc t-tests were performed only when the three-group ANOVA was significant. This yielded >150 p-values. FDR was applied using all these p-values.”
(4) There is a lack of explicit mention when replication analyses differ from the analyses in the patient sample. For instance, the mediation model is different in the two samples: in the patient sample, it is only tested in S+ and S- groups, but not in healthy controls, and the model relates a dimensional measure of suicidal symptoms to gambling in the task, whereas in the online sample, the model includes all participants (including those who are presumably equivalent to healthy controls) and the predictor is a binary measure of S+ versus S- rather than the response to item 9 in the BDI. Indeed, some results did not replicate at all and this needs to be emphasized more as the lack of replication can be interpreted not only as "the link between mood sensitivity to CR and gambling behavior may be specifically observable in suicidal patients" (lines 582-585) - it may also be that this link is not truly there, and without a replication it needs to be interpreted with caution.
Thank you for these important comments. This study focused on cognitive and affective computational mechanisms underlying increased risky behavior in STB. Accordingly, we compared patients with STB (S<sup>+</sup>) with patients without STB (S<sup>-</sup>) and healthy controls (HC) to examine the effects of STB on risky behavior. Therefore, group comparison, instead of dimensional measure of suicidal symptoms by Beck Scale for Suicidal Ideation, can answer our research questions directly.
To enhance consistency between the clinical and replication datasets, we included all participants in each dataset when performing the mediation analysis. Given that S<sup>-</sup> and HC did not differ in gambling behavior or the approach parameter in the clinical dataset, we merged these two groups. In the replication dataset, to mirror the S<sup>+</sup> vs. S<sup>-</sup> contrast used clinically, we categorized the general sample into S+ and S<sup>-</sup> based on BDI item 9. The mediation results remained significant in both datasets (the clinical dataset: a×b = 0.321, 95% CI = [0.070, 0.549], p = 0.016; the replication dataset: a×b = 0.143, 95% CI = [0.016, 0.288], p = 0.031), suggesting that STB is associated with increased risk behavior via stronger approach motivation.
We also acknowledge the non-replication of the correlation between gambling behavior and mood sensitivity to certain rewards in the online sample. While this pattern might indicate that the link is specific to suicidal patients, it may also reflect sample-specific or unstable effects; thus, we now state this explicitly and interpret the finding with caution. Please see our revisions below:
Page 15:
“We next verified our results in an independent dataset, including the same task and BDI questionnaire in 747 general participants (500 females; age: 20.90±2.41) (46). One item in BDI involves the measurement of STB. In item 9 of BDI, participants chose one option that describes them best: Option 1, “I don't have any thoughts of killing myself.”; Option 2, “I have thoughts of killing myself, but I would not carry them out.”; Option 3, “I would like to kill myself.”; Option 4, “I would kill myself if I had the chance.”. In line with the current definition of S<sup>+</sup>/S<sup>-</sup> in the clinical dataset, we identified S<sup>+</sup> group as choosing Option 2, 3, or 4, while participants selecting Option 1 were categorized as S<sup>-</sup> group.”
Page 19:
“Given significant correlations between group, approach parameter, and gambling rate for gain trials (ps < 0.017), we further conducted a mediation analysis with the assumption of the mediating effect of approach motivation of suicidality on the risk behavior. Given that we aimed to test the effect of STB, with S<sup>-</sup> and HC as controls, and given that S<sup>-</sup> and HC did not differ in gambling behavior or in the approach parameter, we merged these two groups for the mediation analysis. Results supported our hypothesis (a×b = 0.321, 95% CI = [0.070, 0.549], p = 0.016; Figure 2C), confirming that suicidal thoughts and behavior increase risk behavior through stronger approach motivation.”
Page 26:
“However, we did not observe any significant correlation between mood sensitivity to CR and gambling behavior (ps > 0.389), which suggests that the link between mood sensitivity to CR and gambling behavior may be specifically observable in suicidal patients. Alternatively, this non-replicated result may also reflect sample-specific or unstable effects, which needs to be interpreted with caution.”
(5) In interpreting their results, the authors use terms such as "motivation" (line 594) or "risk attitude" (line 606) that are not clear. In particular, how was risk attitude operationalized in this task? Is a bias for risky rewards not indicative of risk attitude? I ask because the claim is that "we did not observe a difference in risk attitude per se between STB and controls". However, it seems that participants with STB chose the risky option more often, so why is there no difference in risk attitude between the groups?
Thank you for pointing out the ambiguity. In our manuscript, “motivation” and “risk attitude” are defined at the computational level. Following prior work with this task Rutledge et al., (2015, 2016), we decompose observed gambling into (i) value-dependent valuation parameters that capture risk attitude (e.g., risk aversion and loss aversion, which scale the subjective value of outcomes), and (ii) value-insensitive, valence-dependent biases that capture approach/avoidance motivation. Accordingly, a higher gambling rate does not imply a change in risk attitude per se: it can arise from an increased value-insensitive approach bias even when risk-attitude parameters are comparable between groups—which is what we observe for S<sup>+</sup> vs. controls. We have clarified this point in the computational modeling section.
Pages 12-13:
“Please note that a higher gambling rate does not imply a change in risk attitude per se: it can arise from an increased value-insensitive approach bias even when risk-attitude parameters are comparable between groups. Risk attitude is indeed conceptualized in economics as the curvature of the utility function (i.e., the subjective value) of the objective outcomes, with concave curves associated with risk aversion, and convex curves associated with risk seeking (54,56). By contrast, the approach or avoidance bias apply to all the value. A possible interpretation of the approach bias is that participant approach the option with the highest possible gain (the lottery) in the gain frame; the avoidance bias would then reflect a tendency to systematically avoid the highest potential losses (the lottery) in the loss frame.”
Reviewer #2 (Public review):
Summary:
This article addresses a very pertinent question: what are the computational mechanisms underlying risky behaviour in patients who have attempted suicide? In particular, it is impressive how the authors find a broad behavioural effect whose mechanisms they can then explain and refine through computational modeling. This work is important because, currently, beyond previous suicide attempts, there has been a lack of predictive measures. This study is the first step towards that: understanding the cognition on a group level. This is before being able to include it in future predictive studies (based on the cross-sectional data, this study by itself cannot assess the predictive validity of the measure).
Strengths:
(1) Large sample size.
(2) Replication of their own findings.
(3) Well-controlled task with measures of behaviour and mood + precise and well-validated computational modeling.
Weaknesses:
I can't really see any major weakness, but I have a few questions:
(1) I can see from the parameter recovery that the parameters are very well identified. Is it surprising that this is the case, given how many parameters there are for 90 trials? Could the authors show cross-correlations? I.e., make a correlation matrix with all real parameters and all fitted parameters to show that not only the diagonal (i.e., same data is the scatter plots in S3) are high, but that the off-diagonals are low.
Thank you for raising these thoughtful concerns. The current task consisted of 90 choices and 36 mood ratings. There were 5 choice parameters and 4 mood parameters. The apparently strong identifiability is not unexpected, as 90 choice trials and 36 mood ratings are comparable to those in prior computational modeling literature (Blain & Rutledge, 2022).
As suggested, we computed cross-correlations between all generating (“true”) and recovered (“fitted”) parameters. The resulting matrix showed high diagonal (choice winning model: rs > 0.91; mood winning model: rs > 0.90) and low off-diagonal (choice winning model: abs(rs) < 0.63; mood winning model: abs(rs) > 0.40) correlations, further supporting parameter recovery. Please see our clarifications below:
Supplementary Pages 2-3:
“Parameter recovery: Figure S3 shows good parameter recovery for both choice and mood winning model (choice: rs > 0.91, ps < 0.001; intraclass coefficients > 0.78; mood: rs > 0.90, ps < 0.001; intraclass coefficients > 0.86). Moreover, we computed cross-correlations between all generating (“true”) and recovered (“fitted”) parameters. The resulting matrix showed high diagonal (choice winning model: rs > 0.91; mood winning model: rs > 0.90) and low off-diagonal (choice winning model: abs(rs) < 0.63; mood winning model: abs(rs) > 0.40) correlations, further supporting parameter recovery.”
Page 10:
“The numbers of choice trials and mood ratings were comparable to those in prior computational modeling studies (34,35).”
(2) Could the authors clarify the result in Figure 2B of a correlation between gambling rate and suicidal ideation score, is that a different result than they had before with the group main effect? I.e., is your analysis like this: gambling rate ~ suicide ideation + group assignment? (or a partial correlation)? I'm asking because BSI-C is also different between the groups. [same comment for later analyses, e.g. on approach parameter].
Thank you for pointing out the lack of clarity. We performed group difference analysis and correlation of suicidal ideation analysis, separately. We first performed group difference analysis to test our hypothesis of STB effects. We then conducted correlational analysis to further specify our findings.
(3) The authors correlate the impact of certain rewards on mood with the % gambling variable. Could there not be a more direct analysis by including mood directly in the choice model?
Thank you for this insightful suggestion. As suggested, we tried to integrate mood into choice models by adding mood bias component(s) in line with previous literature (Vinckier et al., 2018). The first model (mcM1) assumes that mood biases choice, building on cM3 (the winning choice model). cmM2 further separated the mood bias parameter into two components according to participants’ choices.


However, model comparison using BIC supported cM3 (Table S6), that is, without consideration of mood in choice modeling. This can be due to the lack of block design in our experimental design unlike e.g., Vinckier et al., (2018) and Eldar & Niv, (2015). Please see our clarifications below:
Supplementary Pages 3-4:
“Supplementary Note 6: integration of mood into choice models
Although we modeled choice and mood separately to examine cognitive and affective mechanisms underlying increased risk behavior in adolescent suicidal patients, one interesting question was whether mood responses influence subsequent gambling choices and how to model them. First, we median-split mood responses (except the final rating) to compare gambling rate. Results showed a trend for less gambling rate in higher mood (t = -1.971, p = 0.050). However, there was no significant group difference (F = 0.680, p = 0.507). Second, with the assumption that mood biases choice, we constructed mcM1 based on cM3 (the winning choice model).


Based on our finding of the negative correlation between mood sensitivity to certain rewards and gambling rate in S<sup>+</sup>, we separated β<sub>Mood</sub> parameter into β<sub>Mood-CR</sub> and β<sub>Mood-GR</sub> (cmM2).

Model comparison using BIC supported cM3 (Table S6), that is, without consideration of mood in choice modeling. The mood bias parameters in neither cM2 nor cM3 reached significance (ps > 0.091), which may be due to the absence of a blocked design in our experiment, unlike in Vinckier et al. (2018) and Eldar and Niv (2015).”
(4) In the large online sample, you split all participants into S+ and S-. I would have imagined that instead, you would do analyses that control for other clinical traits. Or, for example, you have in the S- group only participants who also have high depression scores, but low suicide items.
Thank you for this insightful suggestion. Following prior suicide-related literature (Tsypes et al., 2024), we controlled for depression by including them as covariates. Note that depression scores were derived from our established bifactor model (Wang et al., 2025), which decomposed depression from the anxiety. These results remained largely significant (ps ≤ 0.050), except a marginally significant effect of group on gambling behavior (p = 0.059). Despite a trend, this effect with covariates of depression-related questionnaires is strong in our clinical cohort (p = 0.024; Table S8). This suggests that the link between suicidality and risky behavior persists above and beyond general depressive symptoms.
Please see our clarifications below:
Page 26:
“After controlling for depression severity using our established bifactor model (see ref 60 for details), these results remained significant (ps ≤ 0.050), except a marginally significant effect of group on gambling behavior (p = 0.059). Despite a trend, this effect with covariates of depression-related questionnaires is strong in our clinical cohort (p = 0.024; Table S8). This suggests that the link between suicidality and risky behavior persists above and beyond general depressive symptoms.”
Reviewer #3 (Public review):
This manuscript investigates computational mechanisms underlying increased risk-taking behavior in adolescent patients with suicidal thoughts and behaviors. Using a well-established gambling task that incorporates momentary mood ratings and previously established computational modeling approaches, the authors identify particular aspects of choice behavior (which they term approach bias) and mood responsivity (to certain rewards) that differ as a function of suicidality. The authors replicate their findings on both clinical and large-scale non-clinical samples.
(1) The main problem, however, is that the results do not seem to support a specific conclusion with regard to suicidality. The S+ and S- groups differ substantially in the severity of symptoms, as can be seen by all symptom questionnaires and the baseline and mean mood, where S- is closer to HC than it is to S+. The main analyses control for illness duration and medication but not for symptom severity. The supplementary analysis in Figure S11 is insufficient as it mistakes the absence of evidence (i.e., p > 0.05) for evidence of absence. Therefore, the results do not adequately deconfound suicidality from general symptom severity.
Thank you for this important comment. Based on clinical interviews, we included patients with and without suicidality (S<sup>+</sup> and S<sup>-</sup> groups). However, in line with suicidal-related literature (e.g., Tsypes et al., 2024), two groups also differed substantially in the severity of symptoms (see Table 1). To address the request for evidence on specificity to suicidality beyond general symptom severity, we performed separate linear regressions to explain in gambling behaviour, value-insensitive approach parameter (β<sub>gain</sub>), and mood sensitivity to certain rewards (β<sub>CR</sub>) with group as a predictor (1 for S<sup>+</sup> group and 0 for S<sup>-</sup> group) and scores for anxiety and depression as covariates. Results remained significant after controlling anxiety and depression (ps < 0.027; Table S8). Given high correlations among anxiety and depression questionnaires (rs > 0.753, ps < 0.001), we performed Principal Components Analysis (PCA) on the clinical questionnaire to extract the orthogonal components, where each component explained 86.95%, 7.09%, 3.27%, and 2.68% variance, respectively. We then performed linear regressions using these components as covariates to control for anxiety and depression. Our main results remained significant (ps < 0.027; Table S9). We believe that these analyses provide evidence that the main effects on gambling and on mood were specific to suicide.
As pointed out, these “absence of evidence” cannot provide insights of “evidence of absence”. Although we median-split patients by the scores of general symptoms (e.g., depression and anxiety-related questionnaires) and verified no significant differences in these severities (Figure S11), we additionally conducted Bayesian statistics in gambling behavior, value-insensitive approach parameter, and mood sensitivity to certain rewards. BF<sub>01</sub> is a Bayes factor comparing the null model (M<sub>0</sub>) to the alternative model (M₁), where M<sub>0</sub> assumes no group difference. BF<sub>01</sub> > 1 indicates that evidence favors M<sub>0</sub>. As can be seen in Table S7, most results supported null hypothesis, suggesting that general symptoms of anxiety and depression overall did not influence our main results. Overall, we believe that these analyses provide compelling evidence for the specificity of the effect to suicide, above and beyond depression and anxiety.
Please see our revisions below:
Page 17:
“Within patients, this group effect on gambling rate remained significant after controlling for sex, illness duration, family history, diagnosis, and various medications use (ps < 0.05), as well as general symptoms (e.g., depression and anxiety; p = 0.024; also see Figure S11, Table S7 and Table S8). Given high correlations among anxiety and depression questionnaires (rs > 0.753, ps < 0.001), we performed Principal Components Analysis (PCA) to extract main components, where each component explained 86.95%, 7.09%, 3.27%, and 2.68% variance, respectively. To further control for anxiety and depression, linear regression using these components as covariates revealed that the group effect on gambling rate remained significant (p = 0.024; Table S9).”
Pages 18-19:
“Within patients, this group effect on the approach parameter remained significant after controlling for sex, illness duration, family history, diagnosis, and various medications use (ps < 0.05), as well as general symptoms (e.g., depression and anxiety; p = 0.027; also see Figure S11, Table S7 and Table S8). Linear regression using PCA components as covariates revealed that the group effect on approach parameter remained significant (p = 0.027; Table S9).”
Page 21:
“Within patients, this group effect on βCR remained significant after controlling for gambling rate, earnings, mood-related outcome effect, mood drift effect, sex, illness duration, family history, diagnosis, and various medications use (ps < 0.032), as well as general symptoms (e.g., depression and anxiety; p = 0.001; also see Figure S11, Table S7 and Table S8). Linear regression using PCA components as covariates revealed that the group effect on this mood parameter remained significant (p = 0.001; Table S9).”
(2) The second main issue is that the relationship between an increased approach bias and decreased mood response to CR is conceptually unclear. In this respect, it would be natural to test whether mood responses influence subsequent gambling choices. This could be done either within the model by having mood moderate the approach bias or outside the model using model-agnostic analyses.
Thank you for this important suggestion. As suggested, one interesting question was whether mood responses influence subsequent gambling choices and how to model them. First, we median-split mood responses (except the final rating) to compare gambling rate. Results showed a trend for less gambling rate in higher mood (t = -1.971, p = 0.050). However, there was no significant group difference (F = 0.680, p = 0.507). Second, with the assumption that mood biases choice, we constructed mcM1 based on cM3 (the winning choice model). Based on our finding of the negative correlation between mood sensitivity to certain rewards and gambling rate in S<sup>+</sup>, we separated β<sub>Mood</sub> parameter into β<sub>Mood-CR</sub> and β<sub>Mood-GR</sub> (cmM2). Model comparison using BIC supported cM3 (Table S6), that is, without consideration of mood in choice modeling. This can be due to the lack of block design in our experimental design unlike e.g., Vinckier et al., (2018) and Eldar & Niv, (2015). Please see Supplementary Pages 3-4:
(3) Additionally, there is a conceptual inconsistency between the choice and mood findings that partly results from the analytic strategy. The approach bias is implemented in choice as a categorical value-independent effect, whereas the mood responses always scale linearly with the magnitude of outcomes. One way to make the models more conceptually related would be to include a categorical value-independent mood response to choosing to gamble/not to gamble.
We apologise for the unclear statement. The approach bias is implemented in choice as a continuous value-independent effect, ranging from -1 to 1.
It was true that the mood responses always scale with the magnitude of outcomes, since mood ratings were request after the outcomes. Therefore, mood parameters and the approach bias were both continuous.
We also attempted to integrate mood into choice modelling. See Response 2 for Reviewer 3 for details.
(4) The manuscript requires editing to improve clarity and precision. The use of terms such as "mood" and "approach motivation" is often inaccurate or not sufficiently specific. There are also many grammatical errors throughout the text.
Thank you for this important suggestion. We have now explained motivation and mood in the Introduction section and the computational modeling section. Please see our clarifications below:
Pages 3-4:
“A growing literature indeed shows that risky behavior can be far better explained after adding value-insensitive approach and avoidance components to prospect theory(18,19), that is by including a decision bias in favor of the highest gain (approach) and another decision bias against the lowest loss (avoidance), above and beyond options value difference. This class of models highlights the important role of value-insensitive motivational components in decision making in addition to risk attitude-driven valuation (e.g., loss/risk aversion)(20).”
Page 5:
“Although mood is thought to persist for hours, days, or even weeks(30-33), momentary mood, measured over the timescale in the laboratory setting, represents the accumulation of the impact of multiple events at the scale of minutes(30,32,34-38). Momentary mood external validity is demonstrated e.g., through its association with depression symptoms(37). Mood is different from emotions, which reflect immediate affective reactivity and is more transient (e.g., from surprise to fear)(31-33,39).”
We have corrected grammatical errors throughout the manuscript.
5) Claims of clinical relevance should be toned down, given that the findings are based on noisy parameter estimates whose clinical utility for the treatment of an individual patient is doubtful at best.
Thank you for this comment. We agree that we did not evaluate the noise in our estimate e.g., by assessing the test-retest reliability on the task parameters, which is outside the scope of the study, and it is indeed possible that parameter estimate is somehow noisy. Therefore, we tone down the clinical relevance of our results. Please see our revision below:
Page 32:
“Next, we did not evaluate the noise in our estimate e.g., by assessing the test-retest reliability on the task parameters and it is indeed possible that parameter estimate is somehow noisy.”
Recommendations for the authors:
Reviewer #1 (Recommendations for the authors):
(1) Title: I believe "aberrant mood dynamics" is both too general and overstating the results of this study, which did not measure mood dynamics longitudinally. "Aberrant" is also overly pathologizing. I would suggest sticking more directly to the results, for instance, "Insensitivity of momentary mood to non-risky rewards in adolescent suicidal patients".
Thank you for this suggestion. We have now corrected it.
(2) Abstract: in line 61, "Our study uncovers the cognitive and affective mechanisms" suggests that these are the only ones, and you uncovered them. Of course, there could be more mechanisms contributing to risk behavior in STB, so I would suggest removing the word "the" or adding "one of the".
Thank you for this suggestion. We have now corrected it.
(3) One major weakness of this study is that suicidal thoughts and behaviors were not assessed via a clinical instrument such as the Columbia Suicide Severity Rating Scale - this should be mentioned upfront.
Thank you for this comment. According to medical records and information from family and friends by the researcher and psychiatrists, patients with suicidal thoughts and behaviors were categorized as suicidal group (S<sup>+</sup>), while patients without suicidal thoughts and behaviors were identified as control group (S<sup>-</sup>). Note that medical records and information were recorded from clinical interviews where the psychiatrists were vigilant for signs of suicidal ideation and inquired about suicidal-related thoughts and behaviors from both the patients and their families. Therefore, the current group operation was possibly comparable to Columbia Suicide Severity Rating Scale.
(4) Table 1: female/male are sex, not gender (gender is man/woman/transgender/non-binary).
Thank you for this suggestion. We have now corrected it.
(5) Equation 1: It would be good to clarify what happens in gain-only or loss-only trials (the other value is then 0, but this can be clarified as it is not technically a loss or a gain).
Thank you for this suggestion. We have now corrected it. Please see below for our revision:
Page 12:
“Please note that V<sub>gain</sub> is 0 in gain trials and V<sub>loss</sub> is 0 in loss trials.”
(6) Figure 1E: The model prediction is not informative here. Given the linear regression model, there is no other option except that the mean prediction would overlap with the mean empirical measurement (unless the model was specified incorrectly). The same is true in Figure 2A.
Thank you for this suggestion. We have now removed plots for model prediction.
(7) Figure 1G: There was no analysis of the differences between groups in terms of earnings, given that the ANOVA was not significant. Still, if the claim is that risky behavior is sometimes suboptimal in this task, it would be good to show that there is a correlation between, say, symptoms of STB across groups and 1) risky behavior and 2) earnings.
Thank you for this insightful comment. In the patient cohort, risky behavior (gambling rate)—but not earnings—predicted the current suicidal ideation score (BSI-C, β = 9.189, t = 2.004, p = 0.048; earnings, β = 0.001, t = 0.582, p = 0.562). The lack of association for earnings is consistent with the task design, in which there is no stable optimal policy and payouts are only a coarse proxy for decision quality. Future work in learning paradigms, where optimality is well defined, may be better suited to test earnings-based links to STB. We have clarified this point below:
Page 32:
“Second, although we assumed that increased risky behavior in STB was suboptimal, the current task was not suited to test this, given the task design of random feedback for gambling option. Future work in learning paradigms, where optimality is well defined, may be better suited to test earnings-based links to STB.”
(8) Line 290: "beta_gain: -1-1" is unclear. I believe you meant beta_gain \in [-1,1].
Thank you for this suggestion. We have now corrected it to make it clear.
(9) The gain and loss biases are modeled as minimum and maximum probabilities for choosing the gamble. This is a legitimate choice for value-agnostic biases, but it is not the traditional choice (as far as I know). I wonder if the same results would hold with the more traditional formulation of the bias as an added constant to the utility of the gamble, i.e., p(gamble) = 1/(1+ exp(-mu(U_gamble + beta_gain - U_certain)). I believe in this case, you would also not have to specify different equations for positive or negative biases, or to limit the bias to the range of [-1,1] (indeed, the bias would be in reward-equivalent units).
Thank you for this suggestion. The winning choice model we used here was consistent with previous literature (Rutledge et al., 2015 & 2016), which decomposed the decision process into risk-attitude-driven valuation (e.g., loss and risk aversion) and value-insensitive motivational components. These approach/avoidance parameters are a decision bias in favor of the highest gain (approach) and another decision bias against the lowest loss (avoidance), above and beyond options value difference.
As suggested, we also compared the traditional bias choice model. Model comparison did not support this. Please see our revision below:
Supplementary Page 4:
“We also considered the traditional bias parameter (cM4), rather than approach/avoidance parameters. We limited the bias to the range of [-100, 100], which was in reward-equivalent units.

However, model comparison did not support cM4 (Table S6).”
(10) Also, for equations 5-8, it seems that 5-6 are identical to 7-8 except for the use of beta_gain versus beta_loss. You might want to consider simplifying by putting beta in the equations and specifying in the text that, depending on the trial type (loss or gain), the relevant beta is used.
Thank you for this suggestion. We have now simplified it. Please see response to Reviewer 2, point 3.
(11) It is not clear what equations are applied to mixed trials in cM3.
Sorry for the confusion. We have now clarified this point.
Page 12:
“Approach/avoidance parameters are not applied to in mixed trials.”
(12) Model comparison: the mood models are nested within each other (e.g., mM3 can be derived from mM1 by setting beta_EV = beta_RPE). In this case, model comparison can use the likelihood ratio test instead of BIC, which can be too conservative (and therefore does not support the extra beta parameter for RPE, different from previous results in the literature). I wonder if a likelihood ratio test would lead to results more in line with previous findings with this task?
Thanks for this suggestion. We agree that mM1 (CR+EV+RPE) and mM3 (CR+GR) are nested. However, our model space also included unnested models, such as mM5 (CR+GR<sub>better</sub>+GR<sub>worse</sub>). Therefore, it was not reasonable in our model space to use likelihood ratio tests.
(13) Line 346: The replication sample is described as "healthy participants," however, their health (or mental health) status was not assessed, and they may as well have mental health concerns. I would suggest calling this a general sample or an undifferentiated sample - but not a healthy sample.
Sorry for the confusion. We have now corrected this phrase.
(14) Line 363: "in addition to the replication of previous findings in the validation dataset" is unclear. Are those tests not two-tailed?
Sorry for the unclear statement. In the replication analyses, we used one-tailed t-tests because the direction of the effect was revealed on the clinical dataset. Please see our clarification below:
Page 15:
“For the replication of previous findings in the validation dataset, we used one-tailed tests in line with our clinically motivated directional hypothesis.”
(15) Line 372: "validating our group manipulation" - the presented work does not have a manipulation. Maybe you meant "validating our grouping of participants"?
Thank you for this suggestion. We have now corrected it to make it clear.
(16) Figure 2B: It is not clear how the data were binned for illustration purposes only, and why this binning is necessary (I have not seen it in other papers) - presenting the data from each subject and the correlation line with error margins (as is done here) should be sufficient.
Thank you for flagging this. For illustration only, we binned the data proportional to group sizes: in the patient sample (S<sup>-</sup> n = 25; S<sup>+</sup> n = 58; ≈1:2), we displayed 3 bins for S<sup>-</sup> and 6 bins for S<sup>+</sup>. We agree that binning is not necessary; all statistics were computed on raw, unbinned data. The binned panel was included solely for visualization, consistent with our prior work (Blain et al., 2023).
(17) Table 2: delta BIC should be presented per subject (that is, divided by the number of subjects in each group), as the groups are of different sizes, so as presented now, the columns are not comparable across groups.
Thank you for the helpful suggestion. Our goal in Table 2 is not to compare ΔBIC magnitudes across groups, but to identify the winning model within each group. The ΔBICs are aggregated at the group level solely to rank models for that group. Dividing by the number of participants would rescale each group’s column by a constant and would therefore not affect the within-group ranking or the conclusion that cM3 is the best model in all groups. For this reason, we retain the current presentation and interpret each column within group rather than across groups.
(18) Line 640 - the effect of expectations and prediction errors on mood was not only shown in healthy people, but also in people with depression (Rutledge et al., 2007, https://pubmed.ncbi.nlm.nih.gov/28678984/)
Thank you for this comment. Indeed, Rutledge et al., (2017) showed evidence for CR+EV+RPE mood model in adult people with depression. However, our study recruited adolescents with depression or anxiety, given that adolescent period might provide a developmental window for opportunities for early intervention of suicidality. Therefore, it is also possible that the current winning model was specific to adolescents. Please see our clarifications below:
Page 28:
“It is also possible that the current winning model was specific to adolescents. Given that Rutledge et al., (2017) supported the “CR-EV-RPE model” in adults with depression, our study with adolescent populations may suggest a developmental change for mood sensitivities.”
(19) Supplemental material: Is the R2 section about R-squared? Perhaps you can use superscript on the 2 to make that clearer? For Figure S2, how was model recovery determined? Should I interpret the confusion matrix as suggesting that the winning model for each and every simulated subject was the generating model, or was the winning model determined for the whole simulated population in each of the 100 simulations? Traditionally, confusion matrices use the former measure, but the results of 100% recoverability make me suspect the latter was used here. In Figure S3, should we not be looking at simulated parameters and recovered parameters? What are "real parameters" here?
Thank you for these important comments. We now consistently denote the coefficient of determination as R<sup>2</sup> (with a superscript 2) throughout the manuscript and Supplementary Materials.
For the model recovery analysis in Figure S2, we have clarified that the confusion matrix is computed at the population level. Specifically, for each of the 100 simulations we generated a full dataset under each candidate model, fit all models to that dataset, and selected the winning model based on group-level model evidence (BIC). Each cell in the confusion matrix therefore reflects the proportion of simulations in which model j was selected as the best-fitting model when the data were generated by model i. This operation was reasonable because the decision of the winning model is made on the population-level dataset rather than on individual subjects.
In Figure S3, the term “real parameters” referred to the parameters used to generate the simulated data. To avoid confusion, we now relabel these as “simulated (generating) parameters” and explicitly describe the figure as showing the relationship between simulated (generating) parameters and recovered parameters. Please see our revisions below:
Supplementary Pages 2-3:
“Model recovery: We generated 100 simulated datasets for each model (3 choice models and 8 mood models) using the fitted parameters of each model as the ground truth. Each dataset contained 201 trials and included 3 (or 8) sets of simulated data corresponding to the respective models. For each simulated dataset, we then fit all models and determined the winning model at the population level based on group-level BIC, yielding a confusion matrix in which each entry represents the proportion of simulations in which model j was selected as the best-fitting model when the data were generated by model i. As shown in Figure S2, all models are highly identifiable, indicating excellent recovery performance for both the choice and mood models.”
“Parameter recovery: Figure S3 shows good parameter recovery for both choice and mood winning model (choice: rs > 0.91, ps < 0.001; intraclass coefficients > 0.78; mood: rs > 0.90, ps < 0.001; intraclass coefficients > 0.86). Moreover, we computed cross-correlations between all generating (“generating”) and recovered (“fitted”) parameters. The resulting matrix showed high diagonal (choice winning model: rs > 0.91; mood winning model: rs > 0.90) and low off-diagonal (choice winning model: abs(rs) < 0.63; mood winning model: abs(rs) > 0.40) correlations, further supporting parameter recovery.”
Typos:
(1) Line 90: original → originate
(2) Line 596-598 - the same phrase is repeated twice.
(3) Line 616: on the other word → hand.
Sorry for the mistakes. We have now corrected them throughout the manuscript.
Reviewer #2 (Recommendations for the authors):
For people unfamiliar with interpersonal theory or motivational-volitional model, or three-step theory (lines 105-106), could you briefly explain the key idea of mood and suicide before going to the decision-making tasks? And from this, maybe motivate the predictions in your task? In particular, in the abstract and introduction, the phrasing could be a bit more concise and simpler. In the abstract, sentences were sometimes quite long. In the introduction, some paragraphs are somewhat repetitive. In the discussion, there were some typos.
Thank you for these suggestions. We have now explained the key idea of mood and suicide before going to the decision-making tasks in the introduction, which can be seen below:
Pages 4-5:
“Contemporary theories of suicide converge on the idea that STB is initially caused by low mood experience. The interpersonal theory of suicide proposes that suicidal desire arises when people simultaneously feel socially disconnected (“thwarted belongingness”) and like a burden on others (“perceived burdensomeness”), experiences that are tightly linked to chronically low mood(25). The motivational–volitional model(26) and the three-step theory(27,28) similarly emphasize that when negative mood and feelings of defeat or entrapment are experienced as inescapable, they can give rise to suicidal ideation, and that the progression from ideation to suicide attempts depends on additional factors such as reduced fear of death, increased pain tolerance, and a tendency to act impulsively under intense affect. Some official organizations, e.g., National Institute of Mental Health, have also listed mood problems as warning signals(8). Interestingly, within the framework of decision making under uncertainty, gambling on lotteries with a revealed outcome has been found to induce high mood variance(29), providing an opportunity to assess the relationship between deficient mood and increased gambling decisions in STB.”
We have also refined the wording and corrected typos throughout the manuscript.
Reviewer #3 (Recommendations for the authors):
(1) Since many readers might only read the abstract, it is important that it is both informative and accurate. I have two suggestions in this respect. First, for the abstract to be more informative, it may be helpful to indicate already there that these are value-insensitive approach-avoidance parameters, in the sense that they favor/disfavor the gamble regardless of the potential outcomes' magnitude or probability. This issue is also present throughout the text, where the phrases "approach and avoidance motivation" are referred to as if they have established and precise computational definitions. In my view, these terms could just as easily be interpreted as parameters that multiply the value of potential gains or losses, which is not what the authors mean. It would be helpful to clarify this terminology.
Thank you for these suggestions. In line with previous literature (Rutledge et al., 2015 & 2016), approach and avoidance motivation are indeed defined at the computational level, referring to a decision bias in favor of the highest gain (approach) and another decision bias against the lowest loss (avoidance), above and beyond options value difference. We have cited these papers in the manuscript. We also make it clear to further clarify approach and avoidance parameters in the abstract and introduction. Please see our revisions below:
Page 2 (Abstract):
“Using a prospect theory model enhanced with value-insensitive approach-avoidance parameters revealed that this rise in risky behavior resulted only from a heightened approach parameter in S<sup>+</sup>.Altogether, model-based choice data analysis indicated dysfunction in the approach system in S<sup>+</sup>, leading to greater propensity for gambling in the gain domain regardless of the lottery expected value.”
Page 3 (Introduction):
“A growing literature indeed shows that risky behavior can be far better explained after adding value-insensitive approach and avoidance components to prospect theory(18,19), that is by including a decision bias in favor of the highest gain (approach) and another decision bias against the lowest loss (avoidance), above and beyond options value difference. This class of models highlights the important role of value-insensitive motivational components in decision making in addition to risk attitude-driven valuation (e.g., loss/risk aversion)(20).”
(2) The statement "our study uncovers the cognitive and affective mechanisms contributing to increased risk behavior in STB" is overstating the findings, as the study may have uncovered some contributing mechanisms, but likely not all of them. Removing the word "the" would fix this issue.
Thank you for this suggestion. We have now corrected it.
(3) Since mood is typically defined as lasting hours, it's inappropriate to refer to ratings that only reflect the last few trials as self-reports of mood. To be sure, I view the distinction between emotions and moods as quantitative, not qualitative, so I do not think there is a problem studying the former to understand the latter, but to avoid confusion, the terminology should follow common usage.
Thank you for this suggestion. We follow previous work and operational definitions regarding mood (Rutledge et al., 2014, Eldar & Niv, 2015, Vinckier et al., 2018). Emotion is usually a very brief response to a specific stimulus (Emanuel & Eldar, 2023), e.g., leading to rapid changes like surprise then fear. In contrast, mood is defined as a diffuse state that is not specific to one stimulus. Here, we operationally and computationally define mood as an affective state reflecting the recent history of safe and gamble outcomes. We now clarify that point in the main text. Please see our revision below:
Page 5:
“Although mood is thought to persist for hours, days, or even weeks(30-33), momentary mood, measured over the timescale in the laboratory setting, represents the accumulation of the impact of multiple events at the scale of minutes(30,32,34-38). Momentary mood external validity is demonstrated e.g., through its association with depression symptoms(37). Mood is different from emotions, which reflect immediate affective reactivity and is more transient (e.g. from surprise to fear)(31-33,39).”
(4) Line 78: The phrases "increase in risk attitude", "decrease in loss attitude", and "decrease in value-independent choice biases" are unclear to me in terms of their directionality. An attitude might be avoidant or embracing. If it is the former then increasing it would decrease risk-taking.
Thank you for pointing out the ambiguity. We have now corrected them throughout the manuscript. Please see our revision below:
Page 4:
“We therefore hypothesized that heightened approach motivation, or weakened avoidance motivation, would account for increased risk behavior in STB.”
(5) Line 125: I was not sure why one would expect the mood response to gamble-related quantities (EV and RPE) to be lower in STB and not higher.
Sorry for the typo. We hypothesized that mood would respond more strongly to gambling-related quantities—expected value (EV) and reward prediction error (RPE)—in adolescents with STB than in controls, given prior evidence that STB is associated with greater risk-taking.
(6) The text could use proofreading, as there are many typos. These are from the first 100 lines alone:
a) Abstract: regardless the lotteries -> regardless of the lotteries'.
b) Line 78: it remains whether.
c) Line 80: can each -> each can.
d) Line 90: may original from.
Sorry for the mistakes. We have now corrected them throughout the manuscript.
(7) The rationale for focusing on the S+ group for mood model comparison is incorrect. The purpose is to identify parameters that vary as a function of suicidality, and for that, the S- group is just as important.
Thank you for this comment. We agree that the S<sup>-</sup> group is as important as the S<sup>+</sup> group. A direct comparison was complicated because the winning mood models differed (S<sup>+</sup>: mM3; S<sup>-</sup>: mM5; Table 3). To ensure comparability, we checked results from both model specifications (mM3 and mM5). The conclusions were convergent: mood sensitivity to certain rewards (CR) was lower in S<sup>+</sup> than in S<sup>-</sup> (see Fig. 3 for mM3 and Fig. S8 for mM5).
(8) There appears to be a contradiction between the inclusion criteria, which include having experienced suicidal thoughts and behaviors, and the definition of the S- group as not having suicidality.
Thank you for pointing out this mistake. The corrected version of inclusion criteria can be seen on Page 7:
“Patients were included if they met the following criteria: 1) both the researcher and psychiatrists agreed on their group classification; 2) they had a current diagnosis of major depressive disorder (MDD; unipolar depression), generalized anxiety disorder (GAD), or bipolar disorder with depressive episodes (BD), confirmed by two experienced psychiatrists using the Structured Clinical Interview for DSM-IV-TR-Patient Edition (SCID-P, 2/2001 revision; see Supplementary Note 1 for details); 3) they were between 10 and 19 years of age; 4) they had no organic brain disorders, intellectual disability, or head trauma; 5) they had no history of substance abuse; 6) they had no experience of electroconvulsive therapy.”
(9) It would be helpful to specify whether mood modeling was based on objective or subjective values, and why.
Thank you for this helpful suggestion. We have now clarified whether mood modeling was based on objective or subjective values, and why. Specifically, we constructed two model families: one in which mood was driven by objective monetary outcomes (objective values) and one in which mood was driven by subjective values derived from each participant’s fitted choice model (subjective values). We then used the VBA_groupBMC function in the VBA toolbox to perform family-wise model comparison, with 8 candidate mood models within each family. Consistent with previous literature, the objective-value family provided a clearly superior fit to the data (exceedance probability, EP = 1.000). Based on this result and for parsimony, we report and interpret the mood modeling results from the objective-value family in the main text. We have clarified this point below:
Supplement Pages 4-5:
“Supplementary Note 9: Mood model comparison using subjective values.
To identify whether mood modeling was based on objective or subjective values, we constructed two model families: one in which mood was driven by objective monetary outcomes (objective values) and one in which mood was driven by subjective values derived from each participant’s fitted choice model (subjective values). We then used the VBA_groupBMC function in the VBA toolbox (Daunizeau et al., 2014) to perform family-wise model comparison, with 8 candidate mood models within each family. Consistent with previous literature, the objective-value family provided a clearly superior fit to the data (exceedance probability, EP = 1.000).”
-
-
www.biorxiv.org www.biorxiv.org
-
Author response:
The following is the authors’ response to the original reviews.
Public Reviews:
Reviewer #1 (Public review):
Summary:
CCK is the most abundant neuropeptide in the brain, and many studies have investigated the role of CCK and inhibitory CCK interneurons in modulating neural circuits, especially in the hippocampus. The manuscript presents interesting questions regarding the role of excitatory CCK+ neurons in the hippocampus, which has been much less studied compared to the well-known roles of inhibitory CCK neurons in regulating network function. The authors adopt several methods, including transgenic mice and viruses, optogenetics, chemogenetics, RNAi, and behavioral tasks to explore these less-studied roles of excitatory CCK neurons in CA3. They find that the excitatory CCK neurons are involved in hippocampal-dependent tasks such as spatial learning and memory formation, and that CCK-knockdown impairs these tasks.
However, these questions are very dependent on ensuring that the study is properly targeting excitatory CCK neurons (and thus their specific contributions to behavior). There needs to be much more characterization of the CCK transgenic mice and viruses to confirm the targeting. Without this, it is unclear whether the study is looking at excitatory CCK neurons or a more general heterogeneous CCK neuron population.
Strengths:
This field has focused mainly on inhibitory CCK+ interneurons and their role in network function and activity, and thus, this manuscript raises interesting questions regarding the role of excitatory CCK+ neurons, which have been much less studied.
Weaknesses:
(1a) This manuscript is dependent on ensuring that the study is indeed investigating the role of excitatory CCK-expressing neurons themselves and their specific contribution to behavior. There needs to be much more characterization of the CCK-expressing mice (crossed with Ai14 or transduced with various viruses) to confirm the excitatory-cell targeting. Without this, it is unclear whether the study is looking at excitatory CCK neurons or a more general heterogeneous CCK neuron population.
Thank you for this constructive comment. Indeed, the current study lacks comprehensive strategies to unequivocally distinguish excitatory CCK neurons from heterogeneous CCK neuronal populations. Nevertheless, we provide multiple lines of evidence supporting the distribution of CaMKIIα/Vglut1-expressing CCK<sup>+</sup> neurons in the hippocampus (Figure 1F), using complementary approaches including transgenic mouse models as well as viral and antibody-based labeling (Figure 1A, Figure 1H-I). In addition, we demonstrate that 635 nm light reliably evokes field excitatory postsynaptic potentials (fEPSPs) at CA3-Schaffer collateral synapses expressing DIO-CaMKIIα-ChrimsonR in vitro (Figure 2A-F). Importantly, these light-evoked excitatory synaptic responses are abolished by AMPA and NMDA receptor antagonists (CNQX and APV), confirming the excitatory nature of the DIO-CaMKIIα-ChrimsonR-expressing synapses. To demonstrate the future works that can further support our findings and conclusions, we have added the strategies that can be conducted in the Discussion section in the revision:
“Due to technical limitations at the current stage, we were unable to perform whole-cell recordings or pharmacological manipulations using CCK receptor antagonists. In future studies, the application of these approaches to directly record and selectively block EPSPs from excitatory CCK neurons in the hippocampus will further strengthen and validate our conclusions.” (Line 265 - line 269 in the revision).
(1b) For the experiments that use a virus with the CCK-IRES-Cre mouse, there is no information or characterization on how well the virus targets excitatory CCK-expressing neurons. (Additionally, it has been reported that with CaMKIIa-driven protein expression, using viruses, can be seen in both pyramidal and inhibitory cells.
We thank the reviewer for this insightful comment regarding the specificity of viral targeting in CCK-IRES-Cre mice.
To address this concern, we performed additional characterization of viral expression in CA3. We found that DIO-CaMKIIα-mCherry expression showed a high degree of colocalization with CaMKIIα immunoreactivity, indicating preferential targeting of excitatory neurons (sFigure 1A-B; sFigure 2A-B; sFigure 3A-B). We showed an example to confirmed the high specificity of the AAV for infecting the excitatory CCK neurons in CA3 area.
Besides, we acknowledge prior reports showing that CaMKIIα-driven viral expression can, in some cases, be detected in a small subset of inhibitory neurons. However, because CA3-Schaffer collateral projections to CA1 arise exclusively from excitatory CA3 pyramidal neurons, any potential expression in inhibitory CCK<sup>+</sup> interneurons are unlikely to directly contribute to the recorded CA1 synaptic responses in our electrophysiological experiments. That said, we cannot fully exclude the possibility that a minor population of inhibitory CCK⁺ neurons could indirectly modulate CA3 pyramidal neuron activity via local circuit mechanisms, particularly in experiments involving optogenetic manipulation or shRNA expression. We now explicitly acknowledge this limitation in the revised manuscript:
“Importantly, to further improve cell-type specificity, we propose an intersectional genetic strategy using CCK-IRES-Cre × VGlut1-Flp mice combined with a Cre-On/Flp-On (Con/Fon) AAV, which would restrict expression exclusively to excitatory CCK-expressing neurons and eliminate potential contributions from inhibitory CCK<sup>+</sup> cells. This approach will be implemented in future studies to refine circuit specificity.” (Line 269 - line 273 in the revision).
(2) The methods and figure legends are extremely sparse, leading to many questions regarding methodology and accuracy. More details would be useful in evaluating the tools and data. More details would be useful in evaluating the tools and data. Additionally, further quantification would be useful-e.g. in some places, only % values are noted, or only images are presented.
Thank you for these constructive comments. We have expanded the methodological descriptions in both the Methods section and the figure legends to provide sufficient detail for evaluating the experimental tools and data accuracy. In addition, we have added quantitative analyses where previously only representative images or percentage values were shown. Specifically, quantification has now been included for each AAV condition in the corresponding figures in the revised manuscript.
(3) It is unclear whether the reduced CCK expression is correlated, or directly causing the impairments in hippocampal function. Does the CCK-shRNA have any additional detrimental effects besides affecting CCK-expression (e.g., is the CCK-shRNA also affecting some other essential (but not CCK-related) aspect of the neuron itself?)? Is there any histology comparison between the shRNA and the scrambled shRNA?
Recent studies from our lab demonstrated that knockout the CCK gene expression significantly attenuates the hippocampal-dependent spatial learning and CA3-CA1 LTP, indicating CCK plays a critical role in modulating the hippocampal functions[1,2]. Additionally, CCK-shRNA or CCK-scramble did not significantly affect the excitatory synaptic transmission in the CA3-CA1 projections, hinting that CCK-shRNA may exhibits no obvious adverse effect on other neural components.
Finally, we have provided the histology comparison between the shRNA and the scrambled shRNA regrading the expression level of the CCK protein (Pro-CCK) in the revision. Our result shows that CCK-shRNA (left panel) significantly reduced CCK expression in CA3<sup>CCK</sup>-positive neurons compared with the CCK-Scramble group (right panel).
Citation:
(1) Wang, J. L., Sha, X. Y., Shao, Y., Zhang, Z. H., Huang, S. M., Lin, H., ... & Sun, J. P. (2025). Elucidating pathway-selective biased CCKBR agonism for Alzheimer’s disease treatment. Cell.
(2) Zhang, N., Sui, Y., Jendrichovsky, P., Feng, H., Shi, H., Zhang, X., ... & He, J. (2024). Cholecystokinin B receptor agonists alleviates anterograde amnesia in cholecystokinin-deficient and aged Alzheimer's disease mice. Alzheimer's research & therapy, 16(1), 109.
https://doi.org/10.7554/eLife.109001.1.sa2
Reviewer #2 (Public review):
Summary:
In this study, the authors have demonstrated, through a comprehensive approach combining electrophysiology, chemogenetics, fiber photometry, RNA interference, and multiple behavioral tasks, the necessity of projections from CCK+ CAMKIIergic neurons in the hippocampal CA3 region to the CA1 region for regulating spatial memory in mice. Specifically, authors have shown that CA3-CCK CAMKIIergic neurons are selectively activated by novel locations during a spatial memory task. Furthermore, authors have identified the CA3-CA1 pathway as crucial for this spatial working memory function, thereby suggesting a pivotal role for CA3 excitatory CCK neurons in influencing CA1 LTP. The data presented appear to be well-organized and comprehensive.
Strengths:
(1) This work combined various methods to validate the excitatory CCK neurons in the CA3 area; these data are convincing and solid.
(2) This study demonstrated that the CA3-CCK CAMKIIergic neurons are involved in the spatial memory tasks; these are interesting findings, which suggest that these neurons are important targets for manipulating the memory-related diseases.
(3) This manuscript also measured the endogenous CCK from the CA3-CCK CAMKIIergic neurons; this means that CCK can be released under certain conditions.
Weaknesses:
(1) The authors do not mention which receptors of the CCK modulate these processes.
We appreciate the reviewer for raising this important question. Based on our recent work, CCK-B receptors are the primary neural components mediating CCK functions in the hippocampus at both the synaptic plasticity and behavioral levels (Su et al., 2023; Zhang et al., 2024; Wang et al., 2025). To clarify this mechanism, we have added the following content to the revised manuscript:
“Based on our recent work, CCK signaling in the hippocampus is predominantly mediated by CCK-B receptors, which play a critical role in regulating synaptic plasticity and spatial memory-related behaviors.” (Line 105 - line 106 in the revision).
(2) This author does not test the CCK gene knockout mice or the CCK receptor knockout mice in these neural processes.
Thank you for this insightful comment. We previously tested these experiments in an earlier study. Our results showed that high-frequency electrical stimulation failed to induce significant LTP in the CA3-CA1 pathway in both CCK gene knockout (CCK-KO) mice and CCK-B receptor knockout (CCK-BR-KO) mice in vitro (Su et al., 2023; Zhang et al., 2024; Wang et al., 2025). These findings indicate that CCK mediates its synaptic effects predominantly through CCK-B receptors in the CA3-CA1 pathway. Accordingly, we have added this description to the revised manuscript.
“Additionally, high-frequency electrical stimulation fails to induce LTP in the CA3-CA1 pathway in both CCK-KO and CCK-BR-KO mice, indicating that CCK-dependent synaptic plasticity in this circuit is primarily mediated by CCK-B receptors.” (Line 170 - line 173 in the revision).
(3) The author does not test the source of CCK release during the behavioral tasks.
We thank the reviewer for raising this important point. In our previous work, we directly monitored CCK release in the hippocampus during an object-exploration task using a GPCR-based CCK-BR sensor combined with fiber photometry (Su et al., 2023). During object exploration, we observed a rapid and robust increase in CCK-BR sensor fluorescence, indicating activity-dependent CCK release in the hippocampus. Based on these findings, we deduced that hippocampal CCK release plays a critical role in hippocampus-dependent behavioral tasks.
We acknowledge that hippocampal neurons receive CCK-positive projections from multiple brain regions, making it technically challenging to isolate and monitor the precise source of CCK release in the CA1 area during behavioral tasks in vivo. One potential strategy to address this limitation is selective overexpression of CCK in CA3 neurons (e.g., AAV-CCK delivery), followed by assessment of CCK-BR sensor responses during hippocampal-dependent behaviors. We have added this discussion to the revised manuscript to clarify the source and functional relevance of CCK release during behavioral tasks.
“Besides, using a GPCR-based CCK-BR sensor combined with fiber photometry, our previous work demonstrated rapid, activity-dependent CCK release in the hippocampus during object-exploratory behavior, supporting a functional role for hippocampal CCK signaling in cognitive tasks (Su et al., 2023). Given that hippocampal neurons receive CCK-positive projections from multiple brain regions, it remains technically challenging to precisely identify the cellular source of CCK release in CA1 during behavior. Future studies employing selective CCK overexpression in CA3 neurons, together with CCK-BR sensor recordings, may help further delineate the contribution of CA3-derived CCK to hippocampal-dependent behaviors.” (Line 313 - line 321 in the revision).
Citation:
(1) Wang, J. L., Sha, X. Y., Shao, Y., Zhang, Z. H., Huang, S. M., Lin, H., ... & Sun, J. P. (2025). Elucidating pathway-selective biased CCKBR agonism for Alzheimer’s disease treatment. Cell.
(2) Zhang, N., Sui, Y., Jendrichovsky, P., Feng, H., Shi, H., Zhang, X., ... & He, J. (2024). Cholecystokinin B receptor agonists alleviates anterograde amnesia in cholecystokinin-deficient and aged Alzheimer's disease mice. Alzheimer's research & therapy, 16(1), 109.
(3) Su, J., Huang, F., Tian, Y., Tian, R., Qianqian, G., Bello, S. T., ... & He, J. (2023). Entorhinohippocampal cholecystokinin modulates spatial learning by facilitating neuroplasticity of hippocampal CA3-CA1 synapses. Cell Reports, 42(12).
https://doi.org/10.7554/eLife.109001.1.sa1
Reviewer #3 (Public review):
Summary:
Fengwen Huang et al. used multiple neuroscience techniques (transgenetic mouse, immunochemistry, bulk calcium recording, neural sensor, hippocampal-dependent task, optogenetics, chemogenetics, and interfer RNA technique) to elucidate the role of the excitatory cholecystokinin-positive pyramidal neurons in the hippocampus in regulating the hippocampal functions, including navigation and neuroplasticity.
Strengths:
(1) The authors provided the distribution profiles of excitatory cholecystokinin in the dorsal hippocampus via the transgenetic mice (Ai14::CCK Cre mice), immunochemistry, and retrograde AAV.
(2) The authors used the neural sensor and light stimulation to monitor the CCK release from the CA3 area, indicating that CCK can be secreted by activation of the excitatory CCK neurons.
(3) The authors showed that the activity of the excitatory CCK neurons in CA3 is necessary for navigation learning.
(4) The authors demonstrated that inhibition of the excitatory CCK neurons and knockdown of the CCK gene expression in CA3 impaired the navigation learning and the neuroplasticity of CA3-CA1 projections.
Weaknesses:
(1) The causal relationship between navigation learning and CCK secretion?
Thank you for pointing out this important issue. Previous studies have shown that CCK can be rapidly secreted during exploratory behaviors, as detected by the CCK-BR sensor. In parallel, CCK-positive neurons have been demonstrated to play a critical role in the precise execution of hippocampus-dependent spatial learning. Together, these findings suggest that exploratory behavior induces CCK secretion, which in turn contributes to the accuracy of hippocampal-dependent learning and memory processes. Based on this evidence, we propose that CCK secretion serves as a functional link between behavioral exploration and spatial learning. We have added these explanations in the revised manuscript to better clarify the causal relationship between behavioral exploration and CCK secretion:
“Besides, using a GPCR-based CCK-BR sensor combined with fiber photometry, our previous work demonstrated rapid, activity-dependent CCK release in the hippocampus during object-exploratory behavior, supporting a functional role for hippocampal CCK signaling in cognitive tasks (Su et al., 2023). Given that hippocampal neurons receive CCK-positive projections from multiple brain regions, it remains technically challenging to precisely identify the cellular source of CCK release in CA1 during behavior. Future studies employing selective CCK overexpression in CA3 neurons, together with CCK-BR sensor recordings, may help further delineate the contribution of CA3-derived CCK to hippocampal-dependent behaviors.” (Line 313 - line 321 in the revision)
(2) The effect of overexpression of the CCK gene on hippocampal functions?
We thank the reviewer for this comment. In fact, an earlier study from our laboratory demonstrated that intraperitoneal injection of exogenous CCK-4 significantly improved performance in hippocampus-dependent spatial learning tasks in both CCK gene knockout (CCK-KO) mice and Alzheimer’s disease (AD) mouse models. These findings suggest that enhancing CCK signaling can ameliorate hippocampal dysfunction at both the behavioral and synaptic plasticity levels (Zhang et al., 2024; Wang et al., 2025). Accordingly, although direct genetic overexpression of CCK in the hippocampus has not yet been extensively characterized, the observed benefits of exogenous CCK delivery support the notion that increased CCK availability positively modulates hippocampal function and spatial learning. We have cited this study in the revised manuscript to support this interpretation.
“Interestingly, an earlier study demonstrated that intraperitoneal injection of exogenous CCK-4 significantly improved performance in hippocampus-dependent spatial learning tasks in both CCK gene knockout (CCK-KO) mice and Alzheimer’s disease (AD) mouse models (Zhang et al., 2024). These findings suggest that enhancing CCK signaling can ameliorate hippocampal dysfunction at both the behavioral and synaptic plasticity levels.” (Line 291 - line 297 in the revision)
(3) What are the functional differences between the excitatory and inhibitory CCK neurons in the hippocampus?
In the hippocampus, CCK-expressing neurons consist of two major populations with distinct functions: excitatory (glutamatergic) and inhibitory (GABAergic) neurons. Excitatory CCK neurons are relatively sparse and intermingled with pyramidal cells. By releasing glutamate, they directly contribute to excitatory transmission and are thought to participate in synaptic plasticity and information processing related to learning and memory. In contrast, inhibitory CCK neurons are more abundant and include well-characterized interneuron subtypes such as CCK-positive basket cells. These neurons release GABA and primarily target the perisomatic region of pyramidal neurons, providing strong control over neuronal firing. Notably, inhibitory CCK interneurons are highly sensitive to neuromodulatory signals, particularly endocannabinoids via CB1 receptors, enabling dynamic regulation of inhibitory tone and network activity. Together, excitatory CCK neurons mainly support hippocampal excitation and plasticity, whereas inhibitory CCK neurons regulate network dynamics and spike timing. As the focus of the present study is on excitatory CCK neurons, a detailed comparison between these two populations was not included in the original manuscript.
(4) Do CCK sources come from the local CA3 or entorhinal cortex (EC) during the high-frequency electrical stimulation?
Thank you for this insightful comment. Our data indicate that the CCK detected during high-frequency stimulation originates from CA3 neurons rather than the entorhinal cortex (EC). As shown in Figure 2, we used an optogenetic approach combined with a GPCR-based CCK sensor to selectively examine CCK release from the CA3-CA1 pathway. ChrimsonR was specifically expressed in CA3 neurons projecting to CA1, restricting light stimulation to CA3 axon terminals. In parallel, the CCK sensor was locally expressed in CA1, allowing real-time detection of CCK release at CA3 presynaptic sites. High-frequency light stimulation robustly evoked CCK signals in CA1, demonstrating activity-dependent CCK release from CA3 terminals. Importantly, EC inputs were neither genetically targeted nor optically stimulated in this experiment, excluding the EC as a source of the detected CCK. Together, these results support the conclusion that CCK released during high-frequency stimulation is derived from local CA3 projections to CA1. Similarly, as the focus of the present study is on excitatory CCK neurons in the CA3 area, a detailed comparison between these two CCK sources was not included in the original manuscript.
Citation:
(4) Wang, J. L., Sha, X. Y., Shao, Y., Zhang, Z. H., Huang, S. M., Lin, H., ... & Sun, J. P. (2025). Elucidating pathway-selective biased CCKBR agonism for Alzheimer’s disease treatment. Cell.
(5) Zhang, N., Sui, Y., Jendrichovsky, P., Feng, H., Shi, H., Zhang, X., ... & He, J. (2024). Cholecystokinin B receptor agonists alleviates anterograde amnesia in cholecystokinin-deficient and aged Alzheimer's disease mice. Alzheimer's research & therapy, 16(1), 109.
(6) Su, J., Huang, F., Tian, Y., Tian, R., Qianqian, G., Bello, S. T., ... & He, J. (2023). Entorhinohippocampal cholecystokinin modulates spatial learning by facilitating neuroplasticity of hippocampal CA3-CA1 synapses. Cell Reports, 42(12).
-
-
www.biorxiv.org www.biorxiv.org
-
Reviewer #1 (Public review):
Summary:
The authors test whether the frog buccal ventilatory rhythm generator behaves as a discrete, anatomically localized oscillator or as a distributed, state-dependent network. They combine reduced preparations (segment/subsegment work), systematic extracellular unit surveys over a defined grid, and local AMPA/GABA microinjections in a hemisected brainstem preparation. Based on these approaches, the authors conclude that mild global excitation (bath AMPA) broadens the distribution of rhythmically active units and renders a previously defined "buccal area" functionally non-identifiable as a unique necessary/sufficient locus.
The central idea is plausible, and the overall experimental strategy is appropriate for the question being asked. However, in its current form, the manuscript overstates the strength of inference supporting the "expansion" and "loss of necessity/sufficiency" conclusions. This is primarily due to (a) statistical treatment of unit-mapping data that does not respect clustering by preparation/animal, (b) inconsistent statistical reporting across sections, and (c) limited interpretability of focal inhibitory perturbations under a globally excited state.
Strengths:
(1) The manuscript addresses a clear mechanistic question with broader relevance: whether rhythm generation is best conceptualized as a localized kernel or as an emergent distributed property that changes with excitatory state.
(2) The authors use convergent approaches (reduced preparations, mapping, and necessity/sufficiency-style pharmacological perturbations), which is appropriate for circuit-level inference.
(3) A strong element is the within-unit analysis supporting state-dependent changes in phase coupling for a subset of units ("lung" units adopting a buccal-like pattern). The authors' offline PCA-based spike sorting (with cluster-quality selection via silhouette score) provides some reassurance that the reported pre/post injection changes are not simply driven by unit misidentification.
Weaknesses:
(1) Pseudoreplication in unit-survey statistics undermines the main mapping inference. The Methods state that "Units were pooled from multiple preparations" and that chi-squared tests were used to compare proportions across conditions (baseline vs 60 nM AMPA). The Results similarly report proportion changes (e.g., 110 units pooled from three preparations vs 137 units pooled from three additional animals) analyzed with chi-squared tests. Because many units come from the same preparation/animal, independence is unlikely to hold; therefore, inference about state-dependent reorganization at the systems level should be made at the preparation/animal level or via hierarchical models that explicitly account for clustering.
(2) Statistical methods are inconsistently described and need harmonization. In the segment dose-response "Analysis," values are described as compared to zero using a "One-sample t-test." Yet Table 1 is titled as using a "Wilcoxon One-sample Test." These discrepancies must be resolved throughout (Methods, Results, figure legends, and tables), including clear reporting of the unit of n and exact test statistics.
(3) Unit classification and operational definitions raise interpretational concerns. The unit classification scheme defines "buccal units" as those firing during buccal bursts as well as lung bursts, and explicitly notes that "no units were found which fired only during buccal bursts." This is a consequential result, and it currently reads more like a limitation of detection/classification (or state-space sampled) than a robust biological conclusion. Without additional evidence, it weakens claims about a distinct buccal rhythmogenic module and complicates the interpretation of "buccal identity" changes under excitation.
(4) Microinjection mapping: high exclusion rate and alternative explanations for 'loss of necessity' under excitation. The manuscript reports that 15 experiments were conducted, but 9 were excluded because the buccal area was not found or the preparation was "overdriven." This exclusion rate is too high to leave implicit; it raises concerns about selection bias and demands transparent accounting. Moreover, under baseline conditions, GABA (or AMPA-GABA) microinjections reliably reduce/abolish buccal bursts, but under bath 60 nM AMPA, the same injections produce no significant change in instantaneous frequency. This pattern can be interpreted as network redistribution, but it can also reflect state-dependent changes in gain, dynamic range, or local pharmacological impact (e.g., inhibition being comparatively underpowered in the globally excited state). Additional controls/analyses are required to distinguish these explanations.
-
Reviewer #2 (Public review):
Summary:
In this manuscript, the authors investigate the response of the amphibian respiratory rhythm generator under varying excitability conditions. They use pharmacological agents to increase and/ or decrease synaptic excitability and demonstrate the resilience of buccal rhythms under different conditions. They employ these results to formulate their primary thesis, that there is no obligatory locus of the buccal respiratory rhythm in the frog, and that their respiratory rhythmogenic mechanisms should be considered diffuse and anatomically distributed across a larger brainstem region.
Strengths:
This manuscript is well written, with a sufficiently large number of experiments, for which the authors should be congratulated.
Weaknesses:
The presented results don't support the authors' main conclusions, and the interpretation of the data is heavily biased toward their hypothesis. This impregnates an unsubstantiated narrative in the Abstract, Introduction, and Discussion of this manuscript, which must be reexamined with the following points in consideration:
(1) The authors seem to confuse degeneracy with redundancy. For instance, at line 54, they state, "These findings support the broader hypothesis that respiratory rhythm-generating circuits can switch to being diffuse and redundant, with discrete oscillators quickly drowning in a sea of excitations."
Redundancy means having the same component repeated multiple times to buffer the failure of any single component, whereas degeneracy means different functional components that compensate for one another under perturbations (Goaillard and Marder, ARN 2021)
Since the premotor-lung units get converted to buccal units under high excitability, this suggests a degenerate mechanism for respiratory rhythm generation- rather than a redundant mechanism, where there should be multiple buccal units that get recruited under different excitability conditions.
(2) Line 83, "but the essential requirement for a discrete, rudimentary buccal oscillator is also lost".
This statement is not supported by the data presented in this study. How does the expansion of the buccal unit imply that the essential requirement for discreteness is lost? Under increased excitability, does the burst/rhythm initiation zone also expand? Or does it still remain centered around the location of buccal units under physiological conditions? Increased excitability can lead to recruitment of a larger area, without a change in the location of the rhythmogenic kernel.
(3) Line 86, "... oscillators should be viewed as promiscuous flexible functional entities that expand or contract...".
Oscillators can be regarded as promiscuous only if, under physiological conditions, they switch positions. Under high excitability, only the flexibility argument holds, which has been established in mammals before (e.g., CA Del Negro, K Kam, JA Hayes, JL Feldman, The Journal of physiology 587 (6), 1217-1231; CA Del Negro, C Morgado-Valle, JL Feldman,Neuron 34 (5), 821-830; NA Baertsch, LJ Severs, TM Anderson, JM Ramirez, Proceedings of the National Academy of Sciences 116 (15), 7493-7502; NA Baertsch, HC Baertsch, JM Ramirez Nature communications 9 (1), 843).
Results:
(4) Interpretation of data in Figure 6.
How does the Buccal activity and L2 Power stroke change with 60nm AMPA (in CN5)? Does the increase in the Buccal neurons and decrease in power stroke neurons also reflect in the CN5 activity? Also see comments on Figure 9 data below.
(5) Interpretation of data in Figure 7.
Here, classifying buccal neurons solely by spiking may obscure the fact that the 'silent' neurons under baseline conditions were part of the rhythmic network but could not spike due to subthreshold inputs. 60 nM AMPA increased their firing in response to previously subthreshold synchronous inputs during the buccal burst. Intracellular recordings are required to negate this possibility and establish that the neuronal classification is robust.
(6) Interpretation of data in Figure 8.
"Lung units can transform into buccal units under excitation".<br /> CN5 buccal and lung bursts need to be compared before and after AMPA injection. From Figure 8 A-D, it is apparent that the example Unit2's activity increases during the buccal bursts, after AMPA injection. However, they are also present in buccal burst pre-AMPA, albeit with less frequency.
It is striking that the pre-AMPA epoch (panel A) is less than half of the post-AMPA epoch. This would, in itself, lead to a biased estimate of lung units that are active under the baseline condition during the buccal bursts.
Figure 8G, meta-analysis of lung units spiking during the baseline buccal bursts is warranted to interpret the main claim of this figure. Similarly, analysis of spiking per lung burst for the post-AMPA condition is essential for comparing the lung unit's contribution under high excitability.
(7) Interpretation of data in Figure 9
"Buccal area loses importance under increased excitation."
This interpretation is not fully supported by the data presented in this manuscript. Under 60 nm AMPA, does the ratio of lung burst to buccal burst change in CN5? This analysis is crucial for determining whether the lung units are indeed converted into buccal bursts at the expense of lung activity or whether their appearance during buccal bursts is incidental due to increased excitability. In the baseline, there are 4-5 buccal bursts per lung burst, whereas under high excitability, there are 2-3 buccal bursts per lung burst (Figure 9 A-B). This seems inconsistent with the conclusion that increased excitability converts lung units into buccal units (Figures 6 &7).
Could the authors comment on the connectivity between the lung and the buccal units? Results in Figure 9A-B indicate that lung units may receive an efference copy of buccal units, and under high excitability, their spikes may generate negative feedback onto the buccal units, terminating their bursts. This could explain the decrease in the buccal-to-lung burst in high-AMPA conditions. This type of circuit interaction resembles the mammalian breathing CPG, in which the parafacial/RTN (which controls the abdominal muscles) and preBötC (which controls the diaphragm) interact and cross-inhibit each other.
(8) Line 382.
"Buccal-like bursting produced from two independent slices".
The two "independent" slices have portions of the same anatomical kernel, the buccal rhythm generator. This experiment is like the sandwich slice preparation of preBötC (Del Negro Lab), in which two thinner slices exhibit rhythmic activity. Thus, the two slices are not independent; they are anatomically adjacent and functionally overlapping.
-
Author response:
Reviewer #1 (Public review):
Hierarchical Inference (Unit Survey)
We agree that pooling units across preparations can overstate the strength of inference if preparation-level clustering is ignored. We will therefore reanalyze the unit-survey dataset using a hierarchical approach in which the preparation/animal is treated as the unit of inference. Our pooled dataset was derived from three chunk preparations exposed to AMPA and three baseline preparations, allowing us to report per-preparation proportions and variability as requested.
A preliminary reanalysis of the buccal segment preparations is summarized below. In this analysis, the unit of inference is shifted from individual recorded units to the preparation level (n = 3 baseline; n = 3 at 60 nM AMPA), thereby accounting for potential within-preparation dependence.
Author response table 1.
The distribution of units for each of the three preparations per condition is as follows:
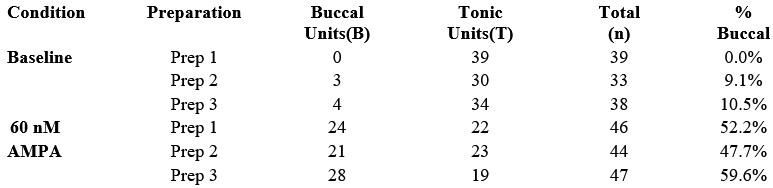
Using the proportion of buccal units per preparation as the dependent variable:
Baseline (n = 3): mean proportion of buccal units = 6.5% (SD 5.7%).
60 nM AMPA (n = 3): mean proportion of buccal units = 53.2% (SD 6.0%).
Absolute difference in proportions = 46.7% (95% CI 33.4% to 59.8%).
Independent-samples t-test on per-preparation proportions: t(4) = 9.77, p = 0.0006.
Thus, this preliminary hierarchical reanalysis indicates that the observed recruitment is consistent across preparations and is not driven by outlier data from a single animal. These results support substantial expansion of the buccal oscillator with excitation.
Statistical Standardization: In the revision, we will better justify our use of parametric and non-parametric versions of the one-sample tests and review usage in the Methods, Table 1, and figure legends for consistency.
Exclusion criteria for microinjection experiments: We will extend the description of these experiments by including a flow diagram summarizing the 15 attempted microinjection experiments and documenting the technical reasons for the 9 exclusions. These exclusions reflected the technical requirements of the preparation: (a) the buccal area had to be localized before AMPA excitation so that the effects of buccal-area manipulation during excitation could be interpreted reliably, which was not always possible; and (b) preparations had to exhibit sufficiently sustained periods of consecutive buccal bursting to permit quantification of buccal burst frequency, whereas some preparations expressed motor patterns dominated by lung bursts.
Pharmacological Potency and Necessity: We will revise the wording of this section to make the causal interpretation more precise. Our data already show that local GABA microinjections can reverse the excitatory effects of local AMPA microinjections, providing an internal control for local pharmacological efficacy of GABA when the local network is excited. Notably, the local AMPA concentration used in these experiments (5 µM) is nearly two orders of magnitude greater than the 60 nM concentration used in bath application. We therefore interpret the failure of focal GABA inhibition to abolish rhythm during global excitation as being consistent with expansion of rhythmogenic capacity beyond the spatial reach of the local injection, rather than with failure of the GABA manipulation itself.
Finding an inhibitory site that remains sensitive in bath applied AMPA is an interesting experiment but this would require identifying the anatomical substrate of a brainstem circuit for a non-ventilatory circuit in Rana that is guaranteed not to undergo reconfiguration with AMPA. This is beyond the scope of the current manuscript; based on our work to identify the neuronal substrate for ventilation in Rana, this would take at least five years to complete. In addition, having identified such a circuit there would be no guarantee that AMPA would not cause reconfiguration in this case too. With regards to transection boundaries and location of injections, we agree these would be useful refinements. We used the location of nerves as reliable landmarks to guide transections and located the buccal area using stereotactic coordinates to guide micropipette insertion and functional criteria (AMPA and GABA sufficiency and necessity tests) to locate the exact position based on our previous work.
Unit Classification: We will review the nomenclature we use to define units to ensure it does not cause confusion and provide more explicit criteria for unit classes. This will include clarification of the absence of “buccal-only” units as currently defined. Specifically, when both buccal and lung rhythms are present, units active during buccal bursts are also active during lung bursts in our preparation. This does not conflict with the multiple interacting oscillator model we have proposed previously. Rather, recruitment of buccal-area neurons during lung bursts is consistent with a model in which the lung oscillator excites the buccal oscillator. It is also consistent with prior evidence that lung bursts persist after buccal-area ablation. In addition, burst frequency during lung episodes exceeds buccal burst frequency during intervening buccal periods. We will revise the text to make this logic clearer.
Reviewer #2 (Public review):
(1) Degeneracy vs. Redundancy
We agree that degeneracy is the more precise term for the phenomenon our data demonstrate, in which structurally and functionally distinct neurons (lung units) acquire the capacity to participate in buccal rhythm generation under excitation. The Discussion already uses this language (e.g., "necessity and sufficiency may not work in a large degenerate network where rhythm generation is distributed across many elements"), but we used the word "redundant" in the Key Points Summary and Abstract in the broader sense of distributed robustness that a wider readership could grasp. Nonetheless, we recognize the distinction drawn by Goaillard and Marder (2021) and, considering the reviewers concerns, we will revise the Abstract and Key Points to adopt the degeneracy framework consistently.
(2) Loss of Essential Requirement for a Discrete Oscillator
The reviewer asks whether expansion of the rhythmically active region necessarily implies loss of the rhythmogenic kernel. We believe our necessity and sufficiency experiments (Figure 9) directly address this. Under baseline conditions, GABA microinjection into the buccal area reliably abolishes buccal bursting; under 60 nM bath AMPA, the same injection at the same location and volume has no significant effect on buccal frequency. If the kernel remained essential and the surrounding recruitment were merely supplementary, local inhibition of the kernel should still slow or abolish the rhythm. It does not. We interpret this as evidence that the essential requirement for the discrete buccal area is lost under excitation, not merely that a larger area has been recruited around a still-critical core. We acknowledge, however, that the word "lost" could be read as implying permanent elimination rather than state-dependent suspension, and we will temper this language in the revision.
(3) Novelty Relative to Mammalian Studies
We appreciate the reviewer drawing attention to the cited mammalian literature (Del Negro et al., 2002, 2009; Baertsch et al., 2018, 2019), which we discuss in detail in the manuscript. However, we respectfully note that our findings extend this literature in several ways that the public review does not acknowledge. First, Baertsch et al. demonstrated recruitment of tonic or silent neurons to become phasically active during inspiration; we show that neurons already assigned to one oscillator phase (lung) can be dynamically reassigned to another (buccal), which represents a qualitatively different form of reconfiguration. Second, we developed a novel approach to functionally ablate motor neuron pools using high-frequency nerve stimulation, enabling the unit survey to be interpreted at the premotor level which was not achieved in the mammalian studies cited. Third, our data provide the first demonstration of state-dependent oscillator expansion in a non-mammalian tetrapod, offering evolutionary context that strengthens the generality of the principle. We will revise the term "promiscuous" if it overstates the claim, but we maintain that our data support the conclusion that oscillator boundaries are flexible, which goes beyond what has been shown in mammals.
(4) Figure 6, CN5 Output Under AMPA
The reviewer asks whether the shift in premotor unit composition is reflected in CN5 motor output. This is a reasonable question. As noted in the manuscript, 60 nM AMPA produces only minor changes in the overt motor pattern as recorded from CN5, which is precisely why we interpret the premotor changes as a reorganization of the network's internal architecture that is not readily apparent from motor output alone. This is in sharp contrast to observations of substantive network reconfiguration in mammals in which eupnea is replaced by the pathological condition of gasping. We will add quantification of CN5 burst parameters (amplitude, duration, frequency) under baseline and 60 nM AMPA to make this point explicit.
(5) Subthreshold Recruitment vs. Network Expansion
The reviewer suggests that neurons classified as newly rhythmic under AMPA may have been part of the rhythmic network all along, receiving subthreshold inputs at baseline. We are grateful to the reviewer for highlighting this and hope they would agree that the literature clearly demonstrates that all respiratory neurons receive subthreshold phasic inputs of one kind or another, perhaps providing a clue that reconfiguration is a common feature of respiratory networks generally. Regardless of the implications for other animals, we agree this is likely the mechanism at work in the frog, and indeed our manuscript states that "this increase in the number and proportion of premotor buccal units is due in part to recruitment of sub-threshold buccal neurons that, under low excitability, only fire during lung bursts," citing intracellular evidence from Kogo and Remmers (1994) that lung neurons in this region receive subthreshold buccal-timed input. We note that this observation does not diminish our conclusion and likely explains the mechanism by which network expansion occurs. Whether one calls these neurons "newly recruited" or "pushed above threshold," the functional consequence is the same: a larger population of neurons is now rhythmically active during buccal bursts, and the necessity of the original buccal area is lost. We will clarify this reasoning in the revision and acknowledge the limitation that additional intracellular recordings from our preparation would be needed to fully characterize the subthreshold dynamics.
(6) Figure 8, Epoch Length and Meta-analysis
The reviewer notes that the pre-AMPA epoch appears shorter than the post-AMPA epoch in Figure 8A, which could bias unit classification. We will address this in the revision by reporting epoch durations explicitly and addressing its implication on spike counts where appropriate. Regarding the request for meta-analysis of lung unit spiking during baseline buccal bursts: this analysis is part of the rationale for the phase-recruitment panels, and we will expand Figure 8 to include the requested cross-condition comparisons (lung unit activity during baseline buccal bursts, and during post-AMPA lung bursts) as also suggested by Reviewer 3.
(7) Figure 9, Buccal-to-Lung Burst Ratio
The reviewer observes that the ratio of buccal to lung bursts decreases from approximately 4-5:1 under baseline to 2-3:1 under 60 nM AMPA, and suggests this is inconsistent with conversion of lung units into buccal units. We do not believe this is inconsistent. The buccal-to-lung burst ratio reflects the overt motor pattern, which is determined by the interaction of multiple oscillators and is influenced by AMPA at both buccal and lung levels. A change in this ratio does not speak to whether individual premotor units have acquired buccal-timed activity; the unit survey and the single-unit transformation data (Figure 8) address that question directly. Regarding the alternative model involving efference copy and cross-inhibition: this is an interesting hypothesis, but it is speculative and not tested by the current dataset. We are happy to discuss lung-buccal interactions more fully in the revision, including the parallels to parafacial/preBötC interactions in mammals, but we note that our data on unit transformation are better explained by network reconfiguration than by a feedback model that remains to be tested.
(8) "Independent" Slices
The reviewer compares our Level 2 transection to the preBötC sandwich slice preparation and argues the two resulting slices are not independent. We take the reviewer's point that "independent" may be read as implying no shared developmental or functional origin, which is not our intent. By "independent" we mean that the two physically separated slices can each generate rhythmic output without being synaptically connected to each other. This is, in fact, our central point: rhythmogenic capacity is distributed across a region broad enough to endow two separated slices with independent rhythm-generating capability when excited. We note that the analogy to the sandwich slice is imperfect because in our Level 1 cuts, only the rostral slice containing the buccal area generates rhythm -- the caudal slice does not -- whereas Level 2 cuts that bisect the buccal area produce rhythmicity in both halves, consistent with distributed capacity specifically within the buccal region. We will revise the wording to clarify what we mean by "independent" in this context.
Reviewer #3 (Public review):
Physiological Parallels: We will expand the Discussion to place these findings in a broader comparative context, including the eupnea-to-gasping transition in mammals as an example of state-dependent reconfiguration of respiratory networks. This will also allow us to clarify two advances that may otherwise be missed when comparing our work to that in mammals: (a) we developed a novel approach to functionally eliminate motor neurons, allowing mapped units to be interpreted as premotor; and (b) the state-dependent reconfiguration of the buccal oscillator occurred without qualitative changes in the overt lung-buccal motor pattern.
Unit Transformation Analysis: We will revise Figure 8 to improve clarity around the observed lung-to-buccal transformation by expanding the phase-recruitment panels as suggested and will revisit the operational definitions of lung and buccal unit identity to reduce ambiguity. The central observation is that some units active only during lung bursts under one condition become active during buccal bursts when network excitation is increased.
Saturation vs. Network Expansion: We will directly address the possibility that 60 nM bath-applied AMPA simply pushes the network toward a frequency ceiling. Two observations strongly argue against this interpretation: (a) 60 nM global AMPA produced only mild changes in buccal frequency, whereas local AMPA injection at much higher concentrations produced larger effects; and (b) local GABA was sufficient to reverse the effects of high-concentration local AMPA microinjections but insufficient to abolish rhythm during low-concentration global AMPA application. Together, these findings are more consistent with global AMPA endowing the network with distributed rhythm-generating capacity than with simple saturation of a discrete local oscillator. Notwithstanding these arguments, we will attempt to extend AMPA/GABA dose response experiment as suggested or add the lack of such experiments as a caveat to our interpretation.
Figure 9C Correction: We will correct the statistical markings in Figure 9C to align with the text in the Results regarding the significance of frequency changes under 60 nM AMPA.
In total, we believe these revisions will improve the rigor and clarity of the manuscript while preserving the central conclusion supported by the data: that the organization of the frog respiratory rhythmogenic network is state dependent and becomes more distributed under excitation.
-
-
www.biorxiv.org www.biorxiv.org
-
Reviewer #1 (Public review):
This manuscript investigates how dentate gyrus (DG) granule cell subregions, specifically suprapyramidal (SB) and infrapyramidal (IB) blades, are differentially recruited during a high cognitive demand pattern separation task. The authors combine TRAP2 activity labeling, touchscreen-based TUNL behavior, and chemogenetic inhibition of adult-born dentate granule cells (abDGCs) or mature granule cells (mGCs) to dissect circuit contributions.
This manuscript presents an interesting and well-designed investigation into DG activity patterns under varying cognitive demands and the role of abDGCs in shaping mGC activity. The integration of TRAP2-based activity labeling, chemogenetic manipulation, and behavioral assays provides valuable insight into DG subregional organization and functional recruitment. However, several methodological and quantitative issues limit the interpretability of the findings. Addressing the concerns below will greatly strengthen the rigor and clarity of the study.
Major points:
(1) Quantification methods for TRAP+ cells are not applied consistently across panels in Figure 1, making interpretation difficult. Specifically, Figure 1F reports TRAP+ mGCs as density, whereas Figure 1G reports TRAP+ abDGCs as a percentage, hindering direct comparison. Additionally, Figure 1H presents reactivation analysis only for mGCs; a parallel analysis for abDGCs is needed for comparison across cell types.
(2) The anatomical distribution of TRAP+ cells is different between low- and high-cognitive demand conditions (Figure 2). Are these sections from dorsal or ventral DG? Is this specific to dorsal DG, as itis preferentially involved in cognitive function? What happens in ventral DG?
(3) The activity manipulation using chemogenetic inhibition of abDGCs in AsclCreER; hM4 mice was performed; however, because tamoxifen chow was administered for 4 or 7 weeks, the labeled abDGC population was not properly birth-dated. Instead, it consisted of a heterogeneous cohort of cells ranging from 0 to 5-7 weeks old. Thus, caution should be taken when interpreting these results, and the limitations of this approach should be acknowledged.
(4) There is a major issue related to the quantification of the DREADD experiments in Figure 4, Figure 5, Figure 6, and Figure 7. The hM4 mouse line used in this study should be quantified using HA, rather than mCitrine, to reliably identify cells derived from the Ascl lineage. mCitrine expression in this mouse line is not specific to adult-born neurons (off-targets), and its expression does not accurately reflect hM4 expression.
(5) Key markers needed to assess the maturation state of abDGCs are missing from the quantification. Incorporating DCX and NeuN into the analysis would provide essential information about the developmental stage of these cells.
Minor points:
(1) The labeling (Distance from the hilus) in Figure 2B is misleading. Is that the same location as the subgranular zone (SGZ)? If so, it's better to use the term SGZ to avoid confusion.
(2) Cell number information is missing from Figures 2B and 2C; please include this data.
(3) Sample DG images should clearly delineate the borders between the dentate gyrus and the hilus. In several images, this boundary is difficult to discern.
(4) In Figure 6, it is not clear how tamoxifen was administered to selectively inhibit the more mature 6-7-week-old abDGC population, nor how this paradigm differs from the chow-based approach. Please clarify the tamoxifen administration protocol and the rationale for its specificity.
Comments on revisions:
I appreciate the authors' careful and thorough revisions. They have addressed all of my previous concerns satisfactorily, and the manuscript is now significantly strengthened. I have no further concerns.
-
Reviewer #3 (Public review):
This study examines the role of dentate gyrus neuronal populations, reflecting neurogenesis and anatomical location (suprapyramidal vs infrapyramidal blade), in a mnemonic discrimination task that taxes the pattern separation functions of the dentate. The authors measure dentate gyrus activity resulting from cognitive training and test whether adult neurogenesis is required for both the anatomical patterns of activity and performance in the cognitive task. The authors find that more cognitively challenging variants of the task evoked more dentate activity, but also distinct patterns of activity (more activity in the suprapyramidal blade, less in the infdrapyramidal blade). Using chemogenetic approaches they silence mature vs immature dentate gyrus neurons and find that only mature neurons (either the general population or specifically mature adult-born neurons), and not immature adult-born neurons, are required for the difficult version of the task. Inhibition of mature adult-born neurons furthermore increased overall activity in the dentate and reduced the biased pattern of activity across the blades, consistent with evidence that adult-born neurons broadly regulate dentate gyrus activity.
Comments on revisions:
I appreciate the efforts the authors have taken to revise this manuscript. I have only minor concerns with this revised version of the manuscript:
Methods state that significance is defined as P<0.05 but some results are interpreted as significant when P=0.05. Either the alpha value needs to change or the interpretation needs to change.
I believe the statistical results for group and blade effects for the ANOVAs, in Figs 2,3 & 4, appear to be switched (blade should be significant, not group).
I appreciate that sometimes there is not a perfect overlap between immunohistochemical signals, but I continue to believe that the spatially-non-overlapping TRAP and EDU signals in Fig 3 is caused by these 2 markers being in different cells. A Z-stack or orthogonal projection could verify/disprove this concern.
-
Author Response:
The following is the authors’ response to the original reviews.
Public Reviews:
Reviewer #1 (Public review):
This manuscript investigates how dentate gyrus (DG) granule cell subregions, specifically suprapyramidal (SB) and infrapyramidal (IB) blades, are differentially recruited during a high cognitive demand pattern separation task. The authors combine TRAP2 activity labeling, touchscreen-based TUNL behavior, and chemogenetic inhibition of adult-born dentate granule cells (abDGCs) or mature granule cells (mGCs) to dissect circuit contributions.
This manuscript presents an interesting and well-designed investigation into DG activity patterns under varying cognitive demands and the role of abDGCs in shaping mGC activity. The integration of TRAP2-based activity labeling, chemogenetic manipulation, and behavioral assays provides valuable insight into DG subregional organization and functional recruitment. However, several methodological and quantitative issues limit the interpretability of the findings. Addressing the concerns below will greatly strengthen the rigor and clarity of the study.
Major points:
(1) Quantification methods for TRAP+ cells are not applied consistently across panels in Figure 1, making interpretation difficult. Specifically, Figure 1F reports TRAP+ mGCs as density, whereas Figure 1G reports TRAP+ abDGCs as a percentage, hindering direct comparison. Additionally, Figure 1H presents reactivation analysis only for mGCs; a parallel analysis for abDGCs is needed for comparison across cell types.
In Figure 1G and 1H we report TRAP+ abDGCs as a percentage rather than density because we are analyzing colocalization of the two markers, which are very sparse in this population. Given the very low number of double-labeled abDGCs, calculating density would not be practical. In the revised manuscript we have clarified the rationale for using these measures. As noted in the current text, we did not observe abDGCs co-expressing TRAP and c-Fos; we have made this point more explicit to guide interpretation of these data.
(2) The anatomical distribution of TRAP+ cells is different between low- and high-cognitive demand conditions (Figure 2). Are these sections from dorsal or ventral DG? Is this specific to dorsal DG, as it is preferentially involved in cognitive function? What happens in ventral DG?
The sections shown in Figure 2 were obtained from the dorsal dentate gyrus (see Methods, “Histology and imaging”: stereotaxic coordinates −1.20 to −2.30 mm relative to bregma, Paxinos atlas). From a feasibility standpoint, it is not possible to analyze the entire longitudinal extent of the hippocampus with these low-throughput histological approaches. We therefore focused on the dorsal DG, for which there is a strong functional rationale. A large body of work indicates that the dorsal hippocampus, and specifically the dorsal DG, is preferentially involved in spatial memory and in the fine contextual discrimination that underlies pattern separation. The dorsal hippocampus is critical for encoding and distinguishing similar spatial representations, a core component of the high-cognitive demand task used here. In contrast, the ventral DG is more strongly associated with emotional regulation and affective memory processing and is less implicated in high-resolution spatial encoding. For these reasons, the present study was designed to assess TRAP+ cell distributions specifically in the dorsal DG.
(3) The activity manipulation using chemogenetic inhibition of abDGCs in AsclCreER; hM4 mice was performed; however, because tamoxifen chow was administered for 4 or 7 weeks, the labeled abDGC population was not properly birth-dated. Instead, it consisted of a heterogeneous cohort of cells ranging from 0 to 5-7 weeks old. Thus, caution should be taken when interpreting these results, and the limitations of this approach should be acknowledged.
We agree that prolonged tamoxifen administration results in labeling a heterogeneous population of abDGCs spanning approximately 0 to 5–7 weeks of age, rather than a precisely birth-dated cohort. This is a limitation of this approach and we have included discussion of this in more detail in the revised manuscript.
(4) There is a major issue related to the quantification of the DREADD experiments in Figure 4, Figure 5, Figure 6, and Figure 7. The hM4 mouse line used in this study should be quantified using HA, rather than mCitrine, to reliably identify cells derived from the Ascl lineage. mCitrine expression in this mouse line is not specific to adult-born neurons (off-targets), and its expression does not accurately reflect hM4 expression.
We agree that mCitrine is not a marker that allows localization of hM4Di as it is well known that the mCitrine can be independently expressed in a Cre independent manner in this mouse. As suggested, we have removed the figure that showed the mCitrine and have performed immunohistochemical localization of the DREADD with an antibody against the HA tag. This is now shown in Figure 5.
(5) Key markers needed to assess the maturation state of abDGCs are missing from the quantification. Incorporating DCX and NeuN into the analysis would provide essential information about the developmental stage of these cells.
The goal of this study was to examine activity patterns of adult-born versus mature granule cells, rather than to assess maturation state. The adult-born neurons analyzed were 25–39 days old, an age at which point most cells have progressed beyond the DCX⁺ stage and are expected to express NeuN based on prior work. We therefore do not think that including DCX or NeuN quantification would provide additional information relevant to the aims or interpretation of this study.
Minor points:
(1) The labeling (Distance from the hilus) in Figure 2B is misleading. Is that the same location as the subgranular zone (SGZ)? If so, it's better to use the term SGZ to avoid confusion.
We have updated Figure 2B, the Methods, and the main text to more explicitly localize this which it the boundary between the subgranular zone (SGZ) and the hilus.
(2) Cell number information is missing from Figures 2B and 2C; please include this data.
We have now added the cell number information to the figure legends. In Figures 2B and 2C, each point corresponds to a single cell, with an equal number of mice per group. The total number of TRAP⁺ cells per mouse is shown in Figure 1F, which reports TRAP⁺ cell densities by group.
(3) Sample DG images should clearly delineate the borders between the dentate gyrus and the hilus. In several images, this boundary is difficult to discern.
We made the DG-hilus boundaries clearer in the sample images to improve visualization and interpretation.
(4) In Figure 6, it is not clear how tamoxifen was administered to selectively inhibit the more mature 6-7-week-old abDGC population, nor how this paradigm differs from the chow-based approach. Please clarify the tamoxifen administration protocol and the rationale for its specificity.
We apologize for the confusion here. The protocol used in Figure 6 is the same tamoxifen chow–based approach as in Figure 5, differing only in the duration of tamoxifen exposure. Mice in Figure 5 received tamoxifen chow for 7 weeks, whereas mice in Figure 6 received it for 4 weeks, restricting labeling to a younger and narrower cohort of adult-born DGCs. Thus, the population targeted in Figure 6 is younger than that in Figure 5 and does not correspond to mature 6–7-week-old neurons. By contrast, the experiment in Figure 4 targets a more mature population, consisting predominantly of ~5-week-old adult-born neurons as well as mature granule cells, which are Dock10-positive and express Cre endogenously, allowing selective manipulation of this later-stage population.
We have corrected the paragraph accordingly and clarified the age range of the labeled populations in the revised manuscript.
Reviewer #2 (Public review):
Summary
In this manuscript, the authors combine an automated touchscreen-based trial-unique nonmatching-to-location (TUNL) task with activity-dependent labeling (TRAP/c-Fos) and birth-dating of adult-born dentate granule cells (abDGCs) to examine how cognitive demand modulates dentate gyrus (DG) activity patterns. By varying spatial separation between sample and choice locations, the authors operationally increase task difficulty and show that higher demand is associated with increased mature granule cell (mGC) activity and an amplified suprapyramidal (SB) versus infrapyramidal (IB) blade bias. Using chemogenetic inhibition, they further demonstrate dissociable contributions of abDGCs and mGCs to task performance and DG activation patterns.
The combination of behavioral manipulation, spatially resolved activity tagging, and temporally defined abDGC perturbations is a strength of the study and provides a novel circuit-level perspective on how adult neurogenesis modulates DG function. In particular, the comparison across different abDGC maturation windows is well designed and narrows the functionally relevant population to neurons within the critical period (~4-7 weeks). The finding that overall mGC activity levels, in addition to spatially biased activation patterns, are required for successful performance under high cognitive demand is intriguing.
Major Comments
(1) Individual variability and the relationship between performance and DG activation.
The manuscript reports substantial inter-animal variability in the number of days required to reach the criterion, particularly during large-separation training. Given this variability, it would be informative to examine whether individual differences in performance correlate with TRAP+ or c-Fos+ density and/or spatial bias metrics. While the authors report no correlation between success and TRAP+ density in some analyses, a more systematic correlation across learning rate, final performance, and DG activation patterns (mGC vs abDGC, SB vs IB) could strengthen the interpretation that DG activity reflects task engagement rather than performance only.
As mentioned, we previously reported no correlation between task success and TRAP+ density. We have now performed additional analyses examining correlations with learning rate, final performance, and DG activation patterns (mGC vs abDGC, SB vs IB), and found no significant relationships. Therefore, as we did not find any positive correlations the original interpretation that DG activity primarily reflects task engagement rather than performance level seems the most parsimonious.
(2) Operational definition of "cognitive demand".
The distinction between low (large separation) and high (small separation) cognitive demand is central to the manuscript, yet the definition remains somewhat broad. Reduced spatial separation likely alters multiple behavioral variables beyond cognitive load, including reward expectation, attentional demands, confidence, engagement, and potentially motivation. The authors should more explicitly acknowledge these alternative interpretations and clarify whether "cognitive demand" is intended as a composite construct rather than a strictly defined cognitive operation.
We agree that reducing spatial separation between stimuli likely engages multiple behavioral and cognitive processes beyond a single, strictly defined operation. We have now clarified this point in the manuscript and explicitly state that our use of the term “cognitive demand” reflects a multidimensional behavioral challenge rather than a singular cognitive process (see Discussion).
(3) Potential effects of task engagement on neurogenesis.
Given the extensive behavioral training and known effects of experience on adult neurogenesis, it remains unclear whether the task itself alters the size or maturation state of the abDGC population. Although the focus is on activity and function rather than cell number, it would be useful to clarify whether neurogenesis rates were assessed or controlled for, or to explicitly state this as a limitation.
While the primary goal of this study was to examine activity and functional recruitment of adult-born granule cells, we also quantified the survival of birth-dated neurons at the end of behavioral training. Density measurements of BrdU⁺ and EdU⁺ cells revealed no differences across experimental groups, indicating that engagement in the pattern separation task, across low to high cognitive demand conditions, did not significantly alter survival of adult-born neurons. In addition, we examined the spatial distribution of BrdU⁺ and EdU⁺ neurons between the suprapyramidal and infrapyramidal blades of the dentate gyrus. The proportion of newborn neurons was consistent across all groups, with approximately 60% located in the suprapyramidal blade and 40% in the infrapyramidal blade. These findings indicate that behavioral training did not alter the baseline distribution of adult-born neurons. We have now clarified these points in the manuscript (See Results).
(4) Temporal resolution of activity tagging.
TRAP and c-Fos labeling provide a snapshot of neural activity integrated over a temporal window, making it difficult to determine which task epochs or trial types drive the observed activation patterns. This limitation is partially acknowledged, but the conclusions occasionally imply trial-specific or demand-specific encoding. The authors should more clearly distinguish between sustained task engagement and moment-to-moment trial processing, and temper interpretations accordingly. While beyond the scope of the current study, this also motivates future experiments using in vivo recording approaches.
We agree and have made changes to the manuscript to discuss these points (see Discussion and Limitations).
(5) Interpretation of altered spatial patterns following abDGC inhibition.
In the abDGC inhibition experiments, Cre+ DCZ animals show delayed learning relative to controls. As a result, when animals are sacrificed, they may be at an intermediate learning stage rather than at an equivalent behavioral endpoint. This raises the possibility that altered DG activation patterns reflect the learning stage rather than a direct circuit effect of abDGC inhibition. Additional clarification or analysis controlling for the learning stage would strengthen the causal interpretation.
We agree that differences in learning stage could in principle confound the interpretation of DG activation patterns. However, although Cre+ DCZ-treated mice exhibited delayed learning, they ultimately reached the same performance criterion as control animals. Thus, adult-born DGC inhibition did not prevent learning but increased the time required to reach criterion, indicating that these neurons are beneficial for learning efficiency rather than strictly necessary for task acquisition. Importantly, all animals were sacrificed only after reaching the predefined success criterion. Therefore, the immunohistochemical analyses were performed at the same behavioral endpoint for Cre+ DCZ and control groups, even though the number of training days differed. Consequently, the observed differences in DG activation reflect circuit recruitment at equivalent task mastery rather than differences in learning stage.
(6) Relationship between c-Fos density and behavioral performance.
The study reports that abDGC inhibition increases c-Fos density while impairing performance, whereas mGC inhibition decreases c-Fos density and also impairs performance. This raises an important conceptual question regarding the relationship between overall activity levels and task success. The authors suggest that both sufficient activity and appropriate spatial patterning are required, but the manuscript would benefit from a more explicit discussion of how different perturbations may shift the identity, composition, or coordination of the active neuronal ensemble rather than simply altering total activity levels.
We agree that our findings highlight that successful performance is not determined solely by the overall level of dentate gyrus activity, but rather by the composition and spatial organization of the active neuronal ensemble. In our study, inhibition of abDGCs increased overall mGC activity while disrupting the spatially organized, blade-biased activation pattern and impaired performance. In contrast, direct inhibition of mGCs reduced global excitability but preserved the relative spatial organization of active neurons in animals that continued to perform the task. These findings suggest that different perturbations alter task performance by shifting the identity and coordination of the active neuronal ensemble, rather than simply increasing or decreasing total activity levels. We have now expanded the Discussion to more explicitly address how dentate gyrus computations may depend on the structured recruitment of granule cell ensembles and how distinct manipulations differentially disrupt this organization.
Reviewer #3 (Public review):
Summary:
The authors used genetic models and immunohistochemistry to identify how training in a spatial discrimination working memory task influences activity in the dentate gyrus subregion of the hippocampus. Finding that more cognitively challenging variants of the task evoked more and distinct patterns of activity, they then investigated whether newborn neurons in particular were important for learning this task and regulating the spatial activity patterns.
Strengths:
The focus on precise anatomical locations of activity is relatively novel and potentially important, given that little is known about how DG subregions contribute to behavior. The authors also use a task that is known to depend on this memory-related part of the brain.
Weaknesses:
Statistical rigor is insufficient. Many statistical results are not stated, inappropriate tests are used, and sample sizes differ across experiments (which appear to potentially underlie null results). The chemogenetic approach to inhibit adult-born neurons also does not appear to be targeting these neurons, as judged by their location in the DG.
Please refer to the updated statistical analyses in response to the recommendations below.
Recommendations for the authors:
Reviewing Editor Comments
Please note that reviewers agreed that appropriate revisions are needed to increase the strength of evidence for the paper's claims. Concerns were raised about a lack of statistical rigor in the statistical analyses used. Results of statistical tests were not consistently provided (i.e., statistic applied, value of statistic, degrees of freedom, p-value), and seemingly inappropriate statistical tests were used in some instances. Also, some comparisons had lower statistical power than others. When clarifying the statistical approaches used in the manuscript, we also encourage you to consider reading this article that outlines common statistical mistakes (Makin TR, Orban de Xivry JJ. Ten common statistical mistakes to watch out for when writing or reviewing a manuscript. Elife. 2019 Oct 9;8:e48175. doi: 10.7554/eLife.48175.), such as the importance of not basing conclusions on a significant p-value for one pair-wise comparison vs a non-significant p-value for another pairwise comparison (i.e., groups that are being compared should be included in the same statistical analysis, and interaction effects should be reported when appropriate). We hope that you find this information to be helpful should you decide to submit a revised manuscript to eLife.
Reviewer #1 (Recommendations for the authors):
(1) Standardize TRAP+ quantification across Figure 1.
Please report TRAP+ cell numbers using consistent metrics (e.g., density or percentage) to enable comparison across cell types. In addition, extend the TRAP+ reactivation analysis in Figure 1H to include abDGCs so that reactivation dynamics can be compared directly between mGCs and abDGCs.
Reply in Public Review
(2) Clarify whether dorsal or ventral DG was analyzed in Figure 2.
The differing anatomical distributions of TRAP+ cells under low- and high-demand conditions raise important questions about DG axis specificity. Please indicate whether analyses were performed in dorsal DG, ventral DG, or both, and provide data or justification accordingly.
Reply in Public Review
(3) Acknowledge limitations of the tamoxifen-chow labeling strategy in AsclCreER; hM4 experiments.
Since tamoxifen chow administered over 4-7 weeks labels a heterogeneous abDGC population spanning a broad age range, this approach does not generate birth-dated cohorts. This limitation should be clearly addressed in the text and interpretations, particularly related to cell age-dependent effects, should be tempered.
Reply in Public Review
(4) Revise DREADD quantification using HA rather than mCitrine.
The hM4 mouse line requires HA immunostaining to accurately identify Ascl-lineage cells expressing the DREADD receptor. Because mCitrine is not specific to adult-born neurons and does not reliably reflect hM4 expression, quantification based on mCitrine should be revised.
Reply in Public Review
(5) Include markers to assess abDGC maturation state.
Adding quantification of DCX and NeuN would help define the developmental stage of abDGCs in key experiments and improve the interpretation of cell-age-dependent effects.
Reply in Public Review
(6) Clarify DG layer boundaries and terminology in Figure 2.
If the metric labeled "Distance from the hilus" corresponds to the subgranular zone (SGZ), using SGZ terminology would prevent confusion. Additionally, please provide clearer delineation of DG and hilus borders in sample images.
Reply in Public Review
(7) Provide missing cell number data for Figures 2B and 2C.
Reply in Public Review
(8) Clarify the tamoxifen administration protocol in Figure 6.
Please describe how the protocol selectively targets 6-7-week-old abDGCs and how it differs from the chow-based approach. This will help readers understand the intended specificity of the manipulation.
Reply in Public Review
Reviewer #2 (Recommendations for the authors):
(1) EdU birth-dating timeline
The manuscript would benefit from a clearer description of the EdU birth-dating timeline, ideally with a schematic similar to that provided for BrdU in Supplementary Figure 1.
We appreciate the suggestion. However, we did not include a separate schematic for EdU because its use and birth-dating logic are identical to BrdU (both are thymidine analogs administered systemically and incorporated during S-phase). Therefore, the timeline shown in Supplementary Figure 1 applies equally to both markers. We have clarified this point in the Methods section to avoid confusion.
(2) Clarity of TUNL task description.
The description of the TUNL task, particularly for readers unfamiliar with touchscreen-based paradigms, is difficult to follow without consulting prior literature. A simplified schematic or a clearer step-by-step explanation in the main text or supplementary material would improve accessibility.
We note that the main steps of the TUNL protocol are illustrated in Figure 1A, Supplementary Figure 2A and 2B. Nevertheless, we agree that the description in the text can be made clearer for readers less familiar with touchscreen-based tasks. Thus , we have now revised the Methods section to provide a clearer step-by-step description of the TUNL.
(3) Influence of outliers in Figure 1G.
In Figure 1G, the reported trend that ~1% of 25-39-day-old abDGCs are TRAP+ during LS trials appears to be driven by a small number of outliers. This should be acknowledged, and the wording of the conclusion moderated to reflect the variability in the data.
We agree with the reviewer that the apparent outliers reflect the inherent sparsity of TRAP labeling in this population. In absolute terms, this corresponds to between 0 and 2 TRAP⁺ 25–39-day-old abDGCs per mouse, such that the presence or absence of a small number of labeled cells can appear as outliers when expressed as a percentage. We have revised the text to acknowledge this (see Results).
(4) Presentation of learning curves.
Rather than focusing primarily on "days before criterion" (DBC), it would be helpful to show full learning curves across the entire training period. This would provide a clearer picture of acquisition dynamics and inter-animal variability.
We agree that learning curves can be informative in many behavioral paradigms. However, in our protocol, mice do not undergo the same number of training days because training stops individually once each animal reaches criterion. As a result, plotting full learning curves would produce trajectories of different lengths, making group comparisons difficult and visually cluttered. For this reason, we aligned animals based on days before criterion (DBC), which allows direct comparison of learning dynamics relative to task acquisition. We also consider the cumulative probability representation to be the most appropriate way to summarize learning progression across animals in this context which are also included in the figures.
(5) Clarification of Figure 3B labeling
In Figure 3B, the identity of the orange-labeled group above the LS condition is unclear. Clarification in the figure legend would improve interoperability.
Figure 3B includes two experimental groups. One group performed both the large- and small-separation conditions; this group is shown in orange and labeled LS. Within this group, the upper orange trace corresponds to performance in the large-separation condition, while the lower orange trace corresponds to performance in the small-separation condition. The second group is a control group that performed only the large-separation configuration, and therefore only a single green trace is shown. We agree that this distinction was not sufficiently clear and have revised the figure legend and text to clarify the identity of each trace.
Reviewer #3 (Recommendations for the authors):
(1) Please label figures and, even better, put the legends on the same page.
(2) Just to confirm, in establishing the task, mice performed above 70% for the small separation trials in one of the sessions on 2 consecutive days, for each criterion? Performance seems to be below 70%.
Yes. To meet the criterion, each mouse had to reach ≥70% correct performance in at least one of the two daily sessions on two consecutive days. We then averaged the performance across both sessions for each of those days. As a result, if one session was ≥70% but the other was lower, the daily average could fall below 70%. The values shown in the figure correspond to these daily averages, further averaged across mice.
(3) mGC needs to be explicitly defined. Am I assuming any non-birthdated GC is an mGC according to the authors? (which means it is unknown whether they are in fact mature, though likely most of them are).
In this study, “mature granule cells” (mGCs) refer operationally to granule cells that are not birth-dated with BrdU or EdU and therefore are not classified as adult-born neurons within the defined labeling window. We agree that this population is not directly age-defined, and that while the majority are expected to be mature based on their birth timing relative to the labeling period, we cannot exclude the possibility that a small fraction may include younger, unlabeled neurons. We have now explicitly defined this usage of mGCs in the Methods and clarified this point in the text to avoid ambiguity.
(4) Methods state that Kruskal-Wallis tests were used when more than 3 groups were compared, but I don't see these stats presented (e.g., for trap data in Figure 1, blade x task TRAP expt in Figure 3 (should be 2-way RM anova here and elsewhere), etc) or any corrections for multiple comparisons. I appreciate that the mean rates of TRAPed abGCs are higher in the S and LS groups than in the shaping group, but most mice do not have any BrdU+ cells that are also TRAPed, and there are no statistics here to support the claim. I don't think there is enough sampling to accurately quantify activation of abGCs. Also, no stats to support the claim that TRAPing increases at the "tip of the SB after the more demanding LS task".
We agree with this comment. We have now systematically tested all datasets for normality (by group) and applied parametric tests when the data met normality assumptions, and non-parametric tests otherwise. The statistical analyses have been revised accordingly. We added the appropriate tests (including two-way ANOVA where relevant, such as for blade × group comparisons) and now report full statistics in the figure legends and results sections. For the TRAP analyses in adult-born DGCs, we explicitly acknowledge the very low number of BrdU⁺/TRAP⁺ cells, which limits statistical power and, in some cases, precludes robust statistical testing. These limitations are now clearly stated in the Results and Discussion, and the corresponding interpretations have been tempered. For all Kruskal–Wallis tests, post hoc pairwise comparisons were performed using Dunn’s test, with Bonferroni correction for multiple comparisons, as now specified in the Methods section. We also expanded the Methods to describe the statistical workflow in detail. In addition, we have added the previously missing statistical analysis for Figure 2C. Comparisons were performed between the 0–50% and 50–100% portions of the blade, where 0% corresponds to the apex and 100% corresponds to the distal tip of the blade.
(5) Figure 3I: I can't figure out which effect is statistically significant here (what does the asterisk signify?). Why no individual data points in this graph?
We agree that the absence of individual data points reduced interpretability, and we have now updated the figure to include individual data points to better illustrate data distribution and variability.
(6) The gradient of activity (shap < S < LS) could be due to how long they've been trained on a given stage (e.g. less activity during shaping because they have habituated, and neurons encoding that task phase have already been selected)
We agree that task duration and habituation could, in principle, influence activity levels. Under this interpretation, higher activity would primarily reflect task novelty rather than cognitive demand. However, our data do not support this explanation. Specifically, we found no correlation between the number of training days required to reach criterion and c-Fos–positive or TRAP-positive cell density within a given stage. Thus, animals that reached criterion rapidly did not show higher activity levels than animals that required more days of training and were presumably more habituated to the task demands. This suggests that the observed activity gradient (shaping < S < LS) is not driven by exposure duration or habituation, but rather reflects differences in cognitive demand across task stages.
(7) The TRAP+ EDU+ cell in Figure 3 looks odd because the BrdU signal is (a lot) larger than the TRAP signal, but BrdU is in the nucleus and should be smaller.
We agree that the example in Figure 3 is not optimal. In dividing cells, BrdU/EdU signals can sometimes appear broader or closely apposed, which may affect their apparent size.
(8) For the Ascl-HM4Di experiment, HM4Di appears to be expressed in all of the areas of the granule cell layer where abGCs are NOT located (i.e. no expression in the deep cell layer, near the sgz). This is problematic because it suggests perhaps abGCs are not inhibited as expected.
As noted in our response to Reviewer #1, we did not use the mCitrine to localize the DREADD receptor as it has been demonstrated that mCitrine expression is expressed in a Cre-independent manner and not correlated with hM4Di expression. In the revised manuscript we include a representative image were we performed immunostaining using an HA antibody to directly visualize hM4Di and confirm its expression in adult-born granule cells (Figure 5).
(9) Line 267: "6-7 week old neurons by themselves do not influence either the performance of mice in the task". I don't think this is fair because this experiment wasn't designed with as much power to detect an effect. The group trends are in the same direction, but there are many fewer mice in this experiment (n=6/group) than in the =<7w experiment (n=11/group), where the effect just reached statistical significance.
We are sorry for this confusion which came from an incorrect version. The experiment shown in Figure 6 does not target 6–7-week-old neurons specifically. It uses the same tamoxifen chow–based protocol as Figure 5, but with a shorter exposure (4 weeks vs. 7 weeks), thereby labeling a younger and more restricted cohort of adult-born DGCs. By contrast, Figure 4 targets a more mature population, consisting predominantly of ~5-week-old adult-born neurons as well as mature granule cells (Dock10+).
We have corrected the paragraph accordingly and clarified the age range of the labeled populations in the revised manuscript.
-
-
www.biorxiv.org www.biorxiv.org
-
Author Response:
The following is the authors’ response to the original reviews.
We thank the reviewers for their constructive comments. A central concern raised is the comparison of performance with existing motion-correction methods. In response, we performed motion correction using several widely used approaches and compared results using the number of particles detected by 2DTM and their associated SNR. To minimize potential bias, we selected parameters to give each method a comparable level of model flexibility so that the results are as directly comparable as possible. Overall, Unbend performs the best. We note that extensive, method-specific parameter optimization could further affect absolute performance, and a comprehensive benchmarking study is therefore beyond the scope of this work
Public Reviews:
Reviewer #1 (Public review):
Kong et al.'s work describes a new approach that does exactly what the title states: "Correction of local beam-induced sample motion in cryo-EM images using a 3D spline model." I find the method appropriate, logical, and well-explained. Additionally, the work suggests using 2DTM-related measurements to quantify the improvement of the new method compared to the old one in cisTEM, Unblur. I find this part engaging; it is straightforward, accurate, and, of course, the group has a strong command of 2DTM, presenting a thorough study.
However, everything in the paper (except some correct general references) refers to comparisons with the full-frame approach, Unblur. Still, we have known for more than a decade that local correction approaches perform better than global ones, so I do not find anything truly novel in their proposal of using local methods (the method itself- Unbend- is new, but many others have been described previously). In fact, the use of 2DTM is perhaps a more interesting novelty of the work, and here, a more systematic study comparing different methods with these proposed well-defined metrics would be very valuable. As currently presented, there is no doubt that it is better than an older, well-established approach, and the way to measure "better" is very interesting, but there is no indication of how the situation stands regarding newer methods.
Regarding practical aspects, it seems that the current implementation of the method is significantly slower than other patch-based approaches. If its results are shown to exceed those of existing local methods, then exploring the use of Unbend, possibly optimizing its code first, could be a valuable task. However, without more recent comparisons, the impact of Unbend remains unclear.
We thank the reviewer for this important point. We agree that comparing against modern local motion-correction approaches is a valuable task. To address this, we added a new benchmarking section (pp. 17–18, lines 444–492, Fig. 8, Fig. 8—figure supplement 1) that compares Unbend against widely used patch-based local correction methods, including MotionCor2, MotionCor3, Warp, and CryoSPARC. Using the same 2DTM-based metrics described in the manuscript (detections per micrograph and SNR distributions for commonly detected particles), we find that Unbend provides the most stable performance across the tested datasets and, in most cases, yields higher detection counts and higher SNR than the alternative methods.
Regarding runtime, the current implementation is CPU-based and is therefore slower than some optimized GPU-accelerated packages. We now clarify this limitation in the manuscript (line 498–499). Our primary goal in this study is to improve motion-correction accuracy and quantify its impact using 2DTM-based measures. Importantly, higher-quality motion-corrected micrographs can reduce downstream processing cost (e.g., by increasing particle detection efficiency and reducing ambiguous candidates), so modest additional compute times at the motion-correction stage can be offset later in the workflow. We also note that GPU acceleration and additional code-level optimizations are planned for future releases (line 501-503); however, they are not required to evaluate the methodological contribution and the benchmarking results presented here.
Reviewer #2 (Public review):
Summary:
The authors present a new method, Unbend, for measuring motion in cryo-EM images, with a particular emphasis on more challenging in situ samples such as lamella and whole cells (that can be more prone to overall motion and/or variability in motion across a field of view). Building on their previous approach of full-frame alignment (Unblur), they now perform full-frame alignment followed by patch alignment, and then use these outputs to generate a 3D cubic spline model of the motion. This model allows them to estimate a continuous, per-pixel shift field for each movie frame that aims to better describe complex motions and so ultimately generate improved motion-corrected micrographs. Performance of Unbend is evaluated using the 2D template matching (2DTM) method developed previously by the lab, and results are compared to using full-frame correction alone. Several different in situ samples are used for evaluation, covering a broad range that will be of interest to the rapidly growing in situ cryo-EM community.
Strengths:
The method appears to be an elegant way of describing complex motions in cryo-EM samples, and the authors present convincing data that Unbend generally improves SNR of aligned micrographs as well as increases detection of particles matching the 60S ribosome template when compared to using full-frame correction alone. The authors also give interesting insights into how different areas of a lamella behave with respect to motion by using Unbend on a montage dataset collected previously by the group. There is growing interest in imaging larger areas of in situ samples at high resolution, and these insights contribute valuable knowledge. Additionally, the availability of data collected in this study through the EMPIAR repository will be much appreciated by the field.
Thank you for this positive assessment.
Weaknesses:
While the improvements with Unbend vs. Unblur appear clear, it is less obvious whether Unbend provides substantial gains over patch motion correction alone (the current norm in the field). It might be helpful for readers if this comparison were investigated for the in situ datasets. Additionally, the authors are open that in cases where full motion correction already does a good job, the extra degrees of freedom in Unbend can perhaps overfit the motions, making the corrections ultimately worse. I wonder if an adaptive approach could be explored, for example, using the readout from full-frame or patch correction to decide whether a movie should proceed to the full Unbend pipeline, or whether correction should stop at the patch estimation stage.
We thank the reviewer for suggesting an adaptive criterion to decide whether to proceed patch alignment or not. We agree that such an approach could be valuable for efficiency and for avoiding unnecessary model flexibility. However, our results indicate that a simple criterion based on the magnitude of estimated local patch motion is unlikely to be sufficient. For example, in the BS-C-1 cell lysate dataset, (see line 412-417 on page 16), we observe minimal local motion (Figure 4b) with mean patch shifts of only 0.7Å and full-frame alignment already yields comparable detection counts, yet local correction still produces a measurable SNR gain (13.84 ± 0.04 to 14.25 ± 0.04, 3%) and improves SNR for ~70% of the commonly detected targets (Figure 6c). This suggests that residual local distortion can remain even when overall local motion appears small. Establishing a robust, dataset-agnostic stopping rule would therefore require a dedicated, systematic benchmarking study across many samples and acquisition conditions.
Reviewer #3 (Public review):
Summary
Kong and coauthors describe and implement a method to correct local deformations due to beam-induced motion in cryo-EM movie frames. This is done by fitting a 3D spline model to a stack of micrograph frames using cross-correlation-based local patch alignment to describe the deformations across the micrograph in each frame, and then computing the value of the deformed micrograph at each pixel by interpolating the undeformed micrograph at the displacement positions given by the spline model. A graphical interface in cisTEM allows the user to visualise the deformations in the sample, and the method has been proven to be successful by showing improvements in 2D template matching (2DTM) results on the corrected micrographs using five in situ samples.
Impact
This method has great potential to further streamline the cryo-EM single particle analysis pipeline by shortening the required processing time as a result of obtaining higher quality particles early in the pipeline, and is applicable to both old and new datasets, therefore being relevant to all cryo-EM users.
Strengths
(1) One key idea of the paper is that local beam induced motion affects frames continuously in space (in the image plane) as well as in time (along the frame stack), so one can obtain improvements in the image quality by correcting such deformations in a continuous way (deformations vary continuously from pixel to pixel and from frame to frame) rather than based on local discrete patches only. 3D splines are used to model the deformations: they are initialised using local patch alignments and further refined using cross-correlation between individual patch frames and the average of the other frames in the same patch stack.
(2) Another strength of the paper is using 2DTM to show that correcting such deformations continuously using the proposed method does indeed lead to improvements. This is shown using five in situ datasets, where local motion is quantified using statistics based on the estimated motions of ribosomes.
Thank you for this positive assessment.
Weaknesses
(1) While very interesting, it is not clear how the proposed method using 3D splines for estimating local deformations compares with other existing methods that also aim to correct local beam-induced motion by approximating the deformations throughout the frames using other types of approximation, such as polynomials, as done, for example MotionCor2.
We thank the reviewer for this suggestion. We agree that positioning Unbend relative to existing local motion-correction methods is important. In the revised manuscript, we added a dedicated benchmarking section comparing Unbend with widely used local correction approaches, including MotionCor2, MotionCor3, Warp, and CryoSPARC, using the same 2DTM-based metrics (Fig. 8, Fig. 8—figure supplement 1). This section is included on pp. 17–18, lines 444–492. To make the comparison as fair as possible, we matched nominal model flexibility across methods and otherwise used default parameters to reduce method-specific tuning. This expanded comparison provides a direct baseline against current patch-/spline-based approaches and shows that Unbend performs consistently across the in situ datasets evaluated here, with improvements in detection counts and/or SNR in multiple cases.
(2) The use of 2DTM is appropriate, and the results of the analysis are enlightening, but one shortcoming is that some relevant technical details are missing. For example, the 2DTM SNR is not defined in the article, and it is not clear how the authors ensured that no false positives were included in the particles counted before and after deformation correction. The Jupyter notebooks where this analysis was performed have not been made publicly available.
We agree that these technical details improve clarity and reproducibility. We have therefore made three changes.
(1) Definition of 2DTM SNR. We added an explicit definition of the 2DTM SNR in Section “2DTM provides a one-step verification for motion correction”, pp. 11, lines 277–287). Briefly, at each image location we compute cross-correlation values over the searched orientation space and define the 2DTM SNR as the maximum per location z-score across orientations.
(2) False-positive control / detection threshold. We clarified how detection thresholds were set to control false positives (pp. 11, lines 285–287). Specifically, we used the standard 2DTM statistical framework in which the threshold is chosen using the one-false-positive (1-FP) criterion (or equivalently, a specified expected false-positive rate). We applied the same thresholding procedure consistently across all motion-corrected micrographs. This ensures that particle counts before/after correction reflect changes in signal recovery.
(3) Reproducibility of the analysis. We have made the script used for the benchmarking and figure generation publicly available (pp. 24 line 622-623), and we provide a link in the Data Availability statement (pp. 25 line 650). The repository includes sample .star files and a python package that computes detections per micrograph, commonly detected particles, and SNR comparisons.
(3) It is also not clear how the proposed deformation correction method is affected by CTF defocus in the different samples (are the defocus values used in the different datasets similar or significantly different?) or if there is any effect at all.
We thank the reviewer for raising this point. In the revised manuscript, we now report the defocus ranges used for each dataset (Table 1) and clarify that all motion-correction comparisons were performed within each dataset using the same CTF estimation and 2DTM settings (pp. 23 line 615-618). Across the five datasets, four were collected at similar defocus ranges (1.0 µm to 1.5µm), whereas one dataset includes near-focus (0.4 µm) micrographs (Table 1). Because Unbend operates on frame alignment/warping rather than CTF modeling, we do not expect a defocus specific effect beyond indirect influences through image SNR and reliability of cross-correlation-based alignment.
Recommendations for the authors:
Reviewer #1 (Recommendations for the authors):
The obvious recommendation would be to use their 2DTM approach for a comparison of their new method with other currently used ones
We agree and added a new comparison section (pp. 17–18, lines 444–492). Addressed above in Response to Reviewer #1 Public Review.
Reviewer #2 (Recommendations for the authors):
(1) Line 29, typo. 3 ~ 8% > 3 - 8%.
Corrected.
(2) Lines 220 and 226. Should this be e-/Angstrom squared for the exposure?
Corrected to e<sup>-</sup>/Å<sup>2</sup> (Now pp. 9 lines 230, 236).
(3) Figure 2 c-d. These are good for instinctively seeing the movement, but I found the legend confusing, as a 10 x 10 pixel array is mentioned, yet the schematics show a higher sampling (30 x 30 pixels? in c-e).
Thank you for pointing this out. The “10×10” annotation refers to the physical scale, whereas the grid represents pixel sampling. We removed the “10×10” label and now show only the pixel grid to avoid confusion. The caption has been updated to state that the grid corresponds to a 30×30 pixel sampling. (Fig. 2c, d; pp. 31, line 766)
(4) Figure 4. It would be good if the n of movies analyzed was given in the figure legend.
Thank you for noticing this. We report the number of movies per dataset in the corresponding summary table (Table 1).
(5) Figure 5. X/Y axes labels missing (assume pixels). Also, suggest changing the strain scale to % to match the main text description of this figure.
We added X/Y axis labels, changed the strain scale to % (Figure 5), and specified that the strains are per pixel on pp. 14 line 367. Correspondingly, the X/Y labels and strain scale in strain plots in Figure 4—figure supplementary 1 to 5 are also changed.
(6) Unify labelling of Figure 4 and 6 (i.e., Bacteria vs. M. pneumoniae, etc.).
Corrected. Sample labels are now consistent across figures. (Figures 4 and 6)
Reviewer #3 (Recommendations for the authors):
Some recommendations related to the points mentioned in the 'Weaknesses' section in the public review:
(1) If feasible, it would be useful to see a comparison with other existing methods that estimate local deformations (e.g., MotionCor2), at least on some of the datasets. For example, does the proposed method lead to better 2DTM SNR in the detected particles compared to other methods, or higher detection numbers? Alternatively, if such a comparison would require too much additional work and the authors have good reasons to believe that the results are evident, it would be helpful to include a discussion about why the proposed method is expected to perform better, both in terms of the general approach and specific implementation details.
We agree that this comparison is important. (pp. 17–18, lines 444–492). Addressed above in Response to Reviewer #3 Public Review (1).
(2) It would be useful to define the 2DTM SNR in the main text of the paper, as well as to address the point about false positives in the picked particles.
We added an explicit definition of 2DTM SNR and clarified the detection thresholding/false-positive control used in our analysis (pp. 11, lines 277–287). Addressed above in Response to Reviewer #3 Public Review (2.1 and 2.2).
(3) Regarding the results shown in Figures 4 and 6: do the authors have any insight about how the CTF defocus affects the deformation estimation and correction across the different sample types?
We now report the defocus ranges used for each dataset (Table 1). We have addressed this problem in Response to Reviewer #3 Public Review (3).
(4) Will the Jupyter notebooks used for the 2DTM analysis be made publicly available?
Yes. We have deposited a python script used for the 2DTM benchmarking and figure generation in a public repository and added the link in Data Availability statement. (pp. 23 line 622, pp. 25 line 650). Addressed above in Response to Reviewer #3 Public Review (2.3).
(5) I would also appreciate a few words about the implementation details of the 3D spline model (e.g., what libraries have been used, if any, or if the authors have implemented their own code for this).
The 3D spline model and warping code were implemented by us (no external spline library was used) and the relevant implementation details are described in the “Sample distortion modeling and correction” section (pp. 7–10, lines 174–246). For optimization, we used the L-BFGS implementation provided by the dlib library, which is now explicitly cited (pp. 10, line 264).
Some comments regarding the presentation of the work:
(1) I found the mathematical background on splines on pages 7-9 a little distracting from the main ideas of the paper, and I believe it could be moved to the methods section. A short description of this in the main text of the paper would suffice, and it would be useful to state clearly when this is background material and when it is the authors' contribution.
We appreciate the suggestion. Because Unbend includes an in-house spline implementation (no external spline library) and it is the central part of this work, we retained the spline description to support reproducibility. (pp. 7–10, lines 174–246).
(2) More generally, I found the whole method very interesting, but understanding exactly what all the steps involved were was a bit cumbersome, as they are spread across different sections of the main text. I think it would be useful to have a dedicated section giving the exact steps taken in the algorithm, possibly pointing to the relevant section in the text for more details about each step. This could be, for example, in the form of an 'Algorithm' box or a flowchart.
We added an Algorithm box as Figure 2 supplement summarizing the end-to-end workflow and pointing to the relevant sections for details (Figure 2—figure supplement 1 Algorithm, pp. 4, line 96–103, pp. 32 line 799). This is intended to make the sequence of steps easier to follow.
(3) In Figure 3, panels (b) and (c), the difference between the two micrographs, before and after correction, is not very noticeable, particularly the Thon rings in the spectra. I don't know if this is due to the image quality in the paper or if a better example could be shown. For example, the differences are clear in some of the supplementary figures.
Thank you for the suggestion. We revised the figure by adding annotations to show the recovered Thon rings. This figure shows a vertex motion and is intended not only to show improvement but also to illustrate complex, spatially varying deformation patterns that motivate the 3D spline model (pp. 12, lines 304–308). The supplementary figures display those with highest motions in each sample type, thus the Thon rings for the motion corrected micrograph in higher frequency space look more obvious. We also refer readers to the supplementary examples where the differences are more pronounced (pp. 12, lines 310–312).
-
-
www.biorxiv.org www.biorxiv.org
-
Author Response:
The following is the authors’ response to the previous reviews
Public Reviews:
Reviewer #1 (Public review):
Summary:
Here Bansal et al., present a study on the fundamental blood and nectar feeding behaviors of the critical disease vector, Anopheles stephensi. The study encompasses not just the fundamental changes in blood feeding behaviors of the crucially understudied vector, but then use a transcriptomic approach to identify candidate neuromodulation path ways which influence blood feeding behavior in this mosquito species. The authors then provide evidence through RNAi knockdown of candidate pathways that the neuromodulators sNPF and Rya modulate feeding either via their physiological activity in the brain alone or through joint physiological activity along the brain-gut axis (but critically not the gut alone). Overall, I found this study to be built on tractable, well-designed behavioral experiments.
Their study begins with a well-structured experiment to assess how the feeding behaviors of A. stephensi changes over the course of its life history and in response to its age, mating and oviposition status. The authors are careful and validate their experimental paradigm in the more well-studied Ae. aegypti, and are able to recapitulate the results of prior studies which show that mating is pre-requisite for blood feeding behaviors in Ae. aegypt. Here they find A. stephensi like another Anopheline mosquitoes has a more nuanced regulation of its blood and nectar feeding behaviors.
The authors then go on to show in a Y- maze olfactometer that to some degree, changes in blood feeding status depend on behavioral modulation to host-cues, and this is not likely to be a simple change to the biting behaviors alone. I was especially struck by the swap in valence of the host-cues for the blood-fed and mated individuals which had not yet oviposited. This indicates that there is a change in behavior that is not simply desensitization to host-cues while navigating in flight, but something much more exciting happening.
The authors then use a transcriptomic approach to identify candidate genes in the blood feeding stages of the mosquito's life cycle to identify a list of 9 candidates which have a role in regulating the host-seeking status of A. stephensi. Then through investigations of gene knockdown of candidates they identify the dual action of RYa and sNPF and candidate neuromodulators of host-seeking in this species. Overrall, I found the experiments to be welldesigned. I found the molecular approach to be sound. While I do not think the molecular approach is necessarily an all-encompassing mechanism identification (owing mostly to the fact that genetic resources are not yet available in A. stephensi as they are in other dipteran models), I think it sets up a rich lines of research questions for the neurobiology of mosquito behavioral plasticity and comparative evolution of neuromodulator action.
Strengths:
I am especially impressed by the authors' attention to small details in the course of this article. As I read and evaluated this article I continued to think how many crucial details I may have missed if I were the scientist conducting these experiments. That attention to detail paid off in spades and allowed the authors to carefully tease apart molecular candidates of blood-seeking stages. The authors top down approach to identifying RYamide and sNPF starting from first principles behavioral experiments is especially comprehensive. The results from both the behavioral and molecular target studies will have broad implications for the vectorial capacity of this species and comparative evolution of neural circuit modulation.
I believe the authors have adequately addressed all of my concerns; however, I think an accompanying figure to match the explained methods of the tissue-specific knockdown would help readers. The methods are now explicitly written for the timing and concentrations required to achieve tissue-specific knockdown, but seeing the data as a supplement would be especially reassuring given the critical nature of tissue-specific knockdown to the final interpretations of this paper.
We thank the reviewer for the suggestion and have now incorporated a schematic in the supplementary figure S9B, explaining our methodology for achieving tissue-specific knockdowns.
Reviewer #2 (Public review):
Summary:
In this manuscript, Bansal et al examine and characterize feeding behaviour in Anopheles stephensi mosquitoes. While sharing some similarities to the well-studied Aedes aegypti mosquito, the authors demonstrate that mated-females, but not unmated (virgin) females, exhibit suppression in their blood-feeding behaviour. Using brain transcriptomic analysis comparing sugar fed, blood fed and starved mosquitoes, several candidate genes potentially responsible for influencing blood-feeding behaviour were identified, including two neuropeptides (short NPF and RYamide) that are known to modulate feeding behaviour in other mosquito species. Using molecular tools including in situ hybridization, the authors map the distribution of cells producing these neuropeptides in the nervous system and in the gut. Further, by implementing systemic RNA interference (RNAi), the study suggests that both neuropeptides appear to promote blood-feeding (but do not impact sugar feeding) although the impact was observed only after both neuropeptide genes underwent knockdown.
While the authors have addressed most of the concerns of the original manuscript, a few issues remain. Particularly, the following two points:
(5) Figure 4
The authors state that there is more efficient knockdown in the head of unfed females; however, this is not accurate since they only get knockdown in unfed animals, and no evidence of any knockdown in fed animals (panel D). This point should be revised in the results test as well.
Perhaps we do not understand the reviewer's point or there has been a misunderstanding. In Figure 4D, we show that while there is more robust gene knockdown in unfed females, bloodfed females also showed modest but measurable knockdowns ranging from 5-40% for RYamide and 2-21% for sNPF.
NEW-
In both the dsRNA treatments where animals were fed, neither was significantly different from control. Therefore, there is no change, and indeed this is confirmed by the author's labelling of the figure stats in panel 4D.
We agree with the reviewer and thank them for pointing it out. We have now revised the figure legend and the text to reflect these results (see lines 351-354).
In addition, do the uninjected and dsGFP-injected relative mRNA expression data reflect combined RYa and sNPF levels? Why is there no variation in these data,...
In these qPCRs, we calculated relative mRNA expression using the delta-delta Ct method (see line 975). For each neuropeptide its respective control was used. For simplicity, we combined the RYa and sNPF control data into a single representation. The value of this control is invariant because this method sets the control baseline to a value of 1.
NEW-
The authors are claiming that there is no variation between individual qPCR experiments (particularly in their controls)? Normally, one uses a known standard value (or calibrator) across multiple experiments/plates so that variation across biological replicates can be assessed. This has an impact on statistical analyses since there is no variation in the control data. Indeed, this impacts all figures/datasets in the manuscript where qPCR data is presented. All the controls have zero variation!
We are truly thankful to this reviewer for insisting on this point. It has made us revisit what we thought we understood and now realise were doing wrong (though many in literature do it this way!). We were – incorrectly – setting each control to 1 and calculating relative fold changes for each replicate independently. While this is often seen in literature, we now realise that it is incorrect. We have revisited all our analyses and normalized all samples to the mean ΔCt of the control group, which captures biological variation in both control and experimental groups. All data are now re-plotted to show individual data points for both control and experimental groups, and the error bars on controls represent the biological variation across replicates (Figure 4D, 4F, 4G, S8, S9). Statistical analyses were also revised accordingly, and, importantly, they do not change any conclusions. Please note that the abdominal expression of sNPF and RYa are so low that the controls show very variable baseline expression values.
Reviewer #3 (Public review):
Summary:
This manuscript investigates the regulation of host-seeking behavior in Anopheles stephensi females across different life stages and mating states. Through transcriptomic profiling, the authors identify differential gene expression between "blood-hungry" and "blood-sated" states. Two neuropeptides, sNPF and RYamide, are highlighted as potential mediators of host-seeking behavior. RNAi knockdown of these peptides alters host-seeking activity, and their expression is anatomically mapped in the mosquito brain (sNPF and RYamide) and midgut (sNPF only).
Strengths:
(1) The study addresses an important question in mosquito biology, with relevance to vector control and disease transmission.
Transcriptomic profiling is used to uncover gene expression changes linked to behavioral states.
(2) The identification of sNPF and RYamide as candidate regulators provides a clear focus for downstream mechanistic work.
(3) RNAi experiments demonstrate that these neuropeptides are necessary for normal hostseeking behavior.
(4) Anatomical localization of neuropeptide expression adds depth to the functional findings.
Weaknesses:
(1) The title implies that the neuropeptides promote host-seeking, but sufficiency is not demonstrated and some conclusions appear premature based on the current data. The support for this conclusion would be strengthened with functional validation using peptide injection or genetic manipulation.
(2) The identification of candidate receptors is promising, but the manuscript would be significantly strengthened by testing whether receptor knockdowns phenocopy peptide knockdowns. Without this, it is difficult to conclude that the identified receptors mediate the behavioral effects.
(3) Some important caveats, such as variation in knockdown efficiency and the possibility of offtarget effects, are not adequately discussed.
These comments were addressed in the previous round.
Recommendations for the authors:
Reviewer #1 (Recommendations for the authors):
Awesome paper everyone. A delight to read and review.
Thank you very much! We appreciated your comments too!
-
-
www.biorxiv.org www.biorxiv.org
-
Reviewer #1 (Public review):
Summary:
The authors aimed to investigate how short-term visual deprivation influences tactile processing in the primary somatosensory cortex (S1) of sighted rats. They justify the study based on previous studies that have shown that long-term blindness can enhance tactile perception, and aim to investigate the change in neural representations underlying rapid, short-term cross-modal effects. The authors recorded local field potentials from S1 as rats encountered different tactile textures (smooth and rough sandpaper) under light and dark conditions. They used deep learning techniques to decode the neural signals and assess how tactile representations changed across the four different conditions. Their goal was to uncover whether the absence of visual cues leads to a rapid reorganization of tactile encoding in the brain.
Strengths:
The study effectively integrates high-density local field potential (LFP) recordings with convolutional neural network (CNN) analysis. This combination allows for decoding high-dimensional population-level signals, revealing changes in neural representations that traditional analyses (e.g., amplitude measures) failed to detect. The custom treadmill paradigm permits independent manipulation of visual and tactile inputs under stable locomotion conditions. Gait analysis confirms that motor behavior was consistent across conditions, strengthening the conclusion that neural changes are due to sensory input rather than movement artifacts.
Weaknesses:
(1) While the study interprets the emergence of more distinct texture representations in the dark as evidence of rapid cross-modal plasticity, the claim rests on correlational data from a short-term manipulation and decoding analysis. The authors show that CNN-derived feature embeddings cluster more clearly by texture in the dark, but this does not directly demonstrate plasticity in the classical sense (e.g., synaptic or circuit-level reorganization). The authors have noted this as a limitation and have clarified that the observed changes reflect functional reorganization rather than structural plasticity.
(2) Although gait was controlled, changes in arousal or exploratory behavior in light versus dark conditions might play a role in the observed neural differences. The authors have controlled for various factors in relation to locomotion, but future studies would benefit from more direct behavioural readouts of arousal states (e.g., via pupillometry or cortical state indicators).
(3) It should be noted that the time course of the observed changes (within 10 minutes) is quite rapid, and while intriguing, the study does not include direct evidence that the underlying circuits were reorganized-only that population-level signals become more discriminable. The authors have adequately discussed this as an avenue for more mechanistic future research.
(4) The authors have adequately discussed that, while these findings are consistent with somatotopy and context-dependent dynamics, they do not provide strong independent evidence for novel spatial or temporal organization.
(5) The authors have also discussed that, while the neural data suggest enhanced tactile representations, the study does not assess whether rats' actual tactile perception improved. Future studies including an assessment of a behavioral readout (e.g., discrimination accuracy), would be insightful.
(6) The authors' discussion about the implications for sensory rehabilitation, including Braille training and haptic feedback enhancement was a bit premature, but they have amended this, and it remains an interesting translational potential to be explored in future studies.
(7) While the CNN showed good performance, more transparent models (e.g., linear classifiers or dimensionality reduction) appear to not exceed chance level. The implications of this are that there is an underlying complex structure in the LFPs that has yet to be fully uncovered, on the mechanistic level. This would be important to push the findings forward in future studies.
Therefore, while the authors raise interesting hypotheses around rapid plasticity, somatotopic dynamics, and rehabilitation, the evidence for each is indirect. Stronger claims will require future causal experiments, behavioral readouts, and mechanistic specificity beyond what the current data provides. However, the work represents an interesting starting point to a more mechanistic understanding in the future.
-
Author Response:
The following is the authors’ response to the original reviews.
Public Reviews:
Reviewer #1 (Public review):
(1) While the study interprets the emergence of more distinct texture representations in the dark as evidence of rapid cross-modal plasticity, the claim rests on correlational data from a short-term manipulation and decoding analysis. The authors show that CNN-derived feature embeddings cluster more clearly by texture in the dark, but this does not directly demonstrate plasticity in the classical sense (e.g., synaptic or circuit-level reorganization).
Thank you for this insightful comment. We acknowledge that our claim of “rapid cross-modal plasticity” is based on correlational evidence and does not directly address synaptic or circuit-level reorganization, which would require more invasive methods. Our study instead focuses on changes in the representational structure of tactile stimuli when visual input is temporarily removed, highlighting the adaptability of sensory coding to environmental context. We agree that this distinction is important and have revised the manuscript to clarify that the observed changes reflect functional reorganization rather than structural plasticity, as indicated by the enhanced separability of texture representations in S1 during darkness.
(2) Although gait was controlled, changes in arousal or exploratory behavior in light versus dark conditions might contribute to the observed neural differences. These factors are acknowledged but not directly measured (e.g., via pupillometry or cortical state indicators).
Thank you for your insightful comment. We agree that arousal and exploratory behavior could influence neural differences and have considered these factors in our study. While gait was controlled, we did not directly measure arousal (e.g., via pupillometry or cortical indicators).
To partially address this, we reviewed locomotor-speed traces (Supplementary Figure 1), which showed no significant differences between light and dark conditions, suggesting movement speed did not drive the neural differences. We also reversed the order of light and dark conditions, and although the separability of textures was not significantly different, it further supports that motivation did not confound our results.
However, we acknowledge that arousal may still affect cortical dynamics, especially in the dark condition, where the lack of visual input might alter exploratory behavior. Due to technical limitations, we could not directly measure arousal states, and this is now discussed in the revised manuscript. While we cannot rule out the influence of arousal, the enhanced separability of texture representations suggests that sensory reorganization due to visual deprivation likely played a substantial role.
(3) Moreover, the time course of the observed changes (within 10 minutes) is quite rapid, and while intriguing, the study does not include direct evidence that the underlying circuits were reorganized - only that population-level signals become more discriminable. As such, the term "plasticity" may overstate the conclusions and should be interpreted with caution unless validated by additional causal or longitudinal data.
Thank you for your important comment. We agree that the term "plasticity" may overstate our conclusions, as our study focuses on population-level signal changes rather than direct evidence of circuit-level reorganization.
To address this, we have revised the manuscript to clarify that while the observed changes in neural separability suggest functional reorganization of sensory representations, they do not confirm structural plasticity. We have updated the wording throughout the manuscript to emphasize that these findings reflect functional reorganization in response to short-term visual input loss, rather than structural or long-term plasticity.
We also updated the discussion to highlight the need for future research with more invasive approaches to validate the causal mechanisms behind these rapid changes in neural dynamics.
(4) The study highlights the forelimb region of S1 and a post-contact temporal window as particularly important for decoding texture, based on occlusion and integrated gradient analyses. However, this finding may be somewhat circular: The LFPs were aligned to forelimb contact, and the floor textures were sensed primarily via the forelimbs, making it unsurprising that forelimb electrodes were most informative. The observed temporal window corresponds directly to the event-aligned epoch, and while it may shift slightly in duration in the dark, this could reflect general differences in sensory gain or arousal, rather than changes in stimulus-specific encoding. Thus, while these findings are consistent with somatotopy and context-dependent dynamics, they do not provide strong independent evidence for novel spatial or temporal organization.
Thank you for your insightful comment. We understand your concern that the finding of forelimb electrodes being most informative might seem circular, given that the LFPs were aligned to forelimb contact, and the floor textures were primarily sensed by the forelimbs. This design choice was intentional, as the task focused on texture perception through the forelimb, and the forelimb subregion of S1 is naturally expected to play a dominant role in this process. While this somatotopic specificity may make the results predictable, our aim was to emphasize the changes in temporal dynamics of neural processing under visual deprivation.
We observed a shift in the temporal window's duration in the dark condition, which we interpret as a change in how texture information is processed without visual input. While this could reflect sensory gain or arousal differences, the lack of significant differences in locomotor speed or other behavioral measures (Supplementary Figure 1) suggests that these changes are more likely due to functional reorganization of sensory processing.
We have clarified in the discussion that the shift in the temporal window is consistent with previous research on sensory reorganization involving both spatial and temporal cortical adjustments. While we do not claim novel spatial or temporal organization, we emphasize that the shift in temporal dynamics suggests adaptation in encoding strategy for texture perception in the absence of visual input. Future studies measuring arousal states (e.g., pupil diameter or cortical state markers) would help distinguish the contributions of arousal versus sensory reorganization to these dynamics.
(5) While the neural data suggest enhanced tactile representations, the study does not assess whether rats' actual tactile perception improved. Without a behavioral readout (e.g., discrimination accuracy), claims about perceptual enhancement remain speculative.
Thank you for raising this important point. We agree that while the neural data suggest enhanced separability of tactile representations in the dark condition, we do not directly assess whether these changes translate into improved tactile perception behaviorally.
However, the primary aim of our study is not to claim perceptual enhancement, but to demonstrate that neural representations in the somatosensory cortex can rapidly reorganize in response to visual deprivation. To clarify this distinction, we have revised the manuscript to emphasize that the observed neural changes in S1 are consistent with functional reorganization of tactile representations, rather than a direct indication of perceptual improvement.
Future studies will be crucial to directly test whether the enhanced separability of tactile representations in S1 correlates with improved tactile perception in a behavioral task. We have highlighted this as an avenue for future research to better understand the link between neural changes and perceptual outcomes.
(6) In addition to point 4, the authors discuss implications for sensory rehabilitation, including Braille training and haptic feedback enhancement. However, the lack of actual chronic or even more acute pathological sensory deprivation, behavioral data, or subsequent intervention in this study limits the ability to draw translational conclusions. It remains unknown whether the more distinct neural representations observed actually translate into better tactile performance, discriminability, or perception. Additionally, extrapolating from rats walking on sandpaper in the dark to human rehabilitative contexts is speculative without a clearer behavioral or mechanistic bridge. The potential is certainly there, but the claim is currently aspirational rather than empirically grounded.
Thank you for raising this important point. Upon careful consideration, we have decided to remove the discussion of sensory rehabilitation implications from the revised manuscript. We have refocused the manuscript to concentrate solely on the neural findings related to tactile encoding reorganization in response to short-term sensory deprivation, avoiding speculative extrapolation to human rehabilitative contexts. This revised approach ensures that the manuscript emphasizes the empirical findings without overstating the translational potential.
(7) While the CNN showed good performance, details on generalization robustness and validation (e.g., cross-validation folds, variance across animals) are not deeply discussed. Also, while explainability tools were used, interpretability of CNNs remains limited, and more transparent models (e.g., linear classifiers or dimensionality reduction) could offer complementary insights.
We appreciate the reviewer’s valuable feedback. In response to the concern about generalization robustness and validation, we have now conducted 5-fold cross-validation to assess the model's performance within animals (Figure 6C). We also have added supplementary information on the average silhouette scores across the different folds and animals (Supplementary Table 1, 2). These details are provided in the methods section and discussed in the results to offer a clearer picture of the model's robustness and consistency across rats.
Regarding the interpretability of CNNs, we acknowledge that deep learning models can lack transparency. We also attempted classification using more transparent models such as PCA and SVM, but their performance did not exceed chance level (Supplementary Figure 2). This indicates that while these simpler models are more interpretable, they cannot capture the complex representations in the LFPs, making deep learning models like CNNs necessary for extracting these insights.
Reviewer #2 (Public review):
(1) Despite applying explainability techniques to the CNN-based decoder, the study does not clearly demonstrate the precise "subtle, high-dimensional patterns" exploited by the CNN for surface roughness decoding, limiting the physiological interpretability of the results. Additional analyses (e.g., detailed waveform morphology analysis on grand averages, time-frequency decompositions, or further use of explainability methods) are necessary to clarify the exact nature of the discriminative activity features enabling the CNN to decode surface roughness and how these change with the sensory context (i.e., in light or darkness).
Thank you for your insightful comment. We recognize the importance of clarifying the exact nature of the high-dimensional neural patterns that the CNN exploits for surface roughness decoding. In response, we have performed additional analyses to provide a more detailed explanation of the CNN's decision-making process and the discriminative features it learned:
Grand-Average LFP Waveforms Analysis: We calculated the grand-average LFP waveforms for each texture × lighting condition (Figure 4A). While visual inspection did not reveal distinct features in the averaged waveforms, we explored the channel-wise correlations between textures under both light and dark conditions (Figure 4B). We found that the correlation between textures was lower in the dark condition, suggesting that LFPs become more distinct between textures when visual input is absent, which aligns with the CNN’s output.
Time-Frequency Decomposition (Wavelet Analysis): We also performed time-frequency decomposition of the LFPs using wavelet transforms (Figure 4D). No prominent differences emerged across texture × lighting conditions in the spectral domain. However, upon computing differences in wavelet features between light and dark conditions and analyzing the relationship with the CNN's attribution scores (Supplementary Figures 5A-C), we observed a negative correlation in the 50-60 Hz range and a positive correlation in the 80-90 Hz range. This suggests frequency-specific modulation in LFP activity that may contribute to texture representations, providing further support for the CNN’s learned features.
(2) The claim regarding cross-modal representation reorganization heavily relies on a silhouette analysis (Figure 5C), which shows a modest effect size and borderline statistical significance (p≈0.05 with n=9+2). More rigorous statistical quantification, such as permutation tests and reporting underlying cluster distances for all animals, would strengthen confidence in this finding.
Thank you for your thoughtful comment. We appreciate your suggestion to strengthen the statistical rigor of our analysis regarding the cross-modal representation reorganization. In response, we have implemented several additional analyses to more rigorously quantify the separability of neural representations between light and dark conditions:
(1) Permutation Test for Cluster Separability: We performed a permutation test to assess whether the observed differences in cluster separability between light and dark conditions were statistically significant or could have arisen by chance. The results showed that the silhouette scores for the dark condition consistently exceeded the 95th percentile of the null distribution (Supplementary Figure 4). This permutation test strengthens the validity of our findings, indicating that the enhanced separability in darkness is a systematic reorganization of neural representations, not due to random fluctuations.
(2) Reporting Cluster Distances: To address concerns about the modest effect size and borderline significance, we have explicitly reported the underlying cluster distances in the form of silhouette scores for each individual animal (Supplementary Table 1, 2). These values reflect the Euclidean distance between clusters within each rat, providing a clearer understanding of the separability observed.
(3) Additional Statistical Analysis on Silhouette Scores: To further enhance the rigor of our statistical analysis, we recalculated the silhouette scores using 5-fold cross-validation within each animal, ensuring that our results are robust across multiple data splits (Figure 6C).
By incorporating these additional analyses and reporting detailed cluster distances, we believe we have significantly strengthened the confidence in our claim of cross-modal reorganization.
(3) While the authors recorded in the somatosensory cortex, primarily known for its tactile responsivity, I would be cautious not to rule out a priori the presence of crossmodal (visual) responses in the area. In this case, the stronger texture separation in darkness might be explained by the absence of some visually-evoked potentials (VEPs) rather than genuine cross-modal reorganization. Clarification is needed to rule out visual interference and this would strengthen the claim.
Thank you for raising this important point. In response to your concern, we carefully examined whether visually-evoked potentials (VEPs) could be present in the S1 recordings, particularly under the light condition. However, we observed that this experiment did not involve any cue-guided visual stimulation, such as flashing lights or visual cues aligned with the LFP recordings. Without such external visual stimuli, it is unlikely that VEPs would be reliably evoked in the S1. Therefore, we believe the stronger texture separation observed in the dark condition is not due to visual interference, but rather reflects a genuine sensory reorganization in response to the absence of visual input.
(4) Behavioural controls are limited to gross gait parameters; more detailed analyses of locomotor behavior and additional metrics (e.g., pupil size or locomotor variance) would robustly rule out potential arousal or motor confounds.
Thank you for your insightful comment regarding behavioral controls. In response, we have added locomotor speed traces aligned with corresponding LFPs (Supplementary Figure 1) to demonstrate that locomotion remained consistent across trials, irrespective of environmental condition (light vs. dark). Additionally, we report locomotor speed variance over 10-minute blocks to confirm no significant motor changes affecting neural recordings. These analyses indicate that LFP differences are unlikely due to locomotor confounds.
While measuring pupil size could be useful for assessing arousal, the camera resolution in our study was insufficient for reliable measurements. We have noted this limitation in the Discussion and recommend that future studies with high-resolution eye-tracking explore arousal's role in sensory processing in S1.
(5) The consistent ordering of trials (10 minutes of light then 10 minutes of dark) could introduce confounds such as fatigue or satiation (and also related arousal state), which should be controlled by analyzing sessions with reversed condition ordering.
Thank you for highlighting the potential confounds due to trial ordering. To address this, we reversed the condition order (dark before light) in a subset of sessions from six rats and reanalyzed the data (Supplementary Figure 3). The results showed not significant, but increase separability in the dark condition, suggesting that the enhanced separability in the dark condition is not due to trial order effects like fatigue or satiation. While order effects may contribute to trial-to-trial variability, the consistent pattern of enhanced separability in the dark further supports the interpretation that visual deprivation directly influences the reorganization of tactile representations in S1.
(6) The focus on forelimb-aligned LFP analyses raises the possibility that hindlimb-aligned data might yield different conclusions, suggesting alignment effects might bias the results.
Thank you for your insightful comment on the potential bias of forelimb-aligned LFP analyses. We acknowledge that the choice of alignment event can influence the results and appreciate the suggestion to consider hindlimb-aligned data. However, our experimental design specifically focused on forelimb S1. The forelimb region of S1 was oversampled in our array, and as expected, we observed larger responses there, consistent with the known somatotopic organization of S1.
While hindlimb-aligned data could provide additional insights, it is not directly relevant to the primary question of how forelimb S1 codes tactile information under visual deprivation. We do not believe the forelimb alignment introduces a bias, as it aligns with the sensory task being investigated. However, we recognize the value of exploring alternative alignments and have now included a discussion in the Methods section regarding the rationale for our design choices.
(7) The authors' dismissal of amplitude-based metrics as ineffective is inadequately substantiated. A clearer demonstration (e.g., event-related waveforms averaged by conditions, presented both spatially and temporally) would support this claim.
Thank you for your constructive comment. In response, we have added a more detailed analysis of event-related waveforms, averaged across conditions (light vs. dark, smooth vs. rough textures), and presented them spatially and temporally aligned to forelimb contact (Figure 4A). These waveforms did not show clear, distinct features that could differentiate conditions, which highlights the limitations of traditional amplitude-based metrics in detecting subtle neural activity changes related to visual deprivation.
We further performed channel-wise correlation analyses (Figure 4B), revealing stronger texture correlations in the light condition, indicating that averaged waveforms do not capture the nuanced differences in neural dynamics. Additionally, time-frequency spectrograms and channel–channel correlation matrices (Figures 4C and 4D) did not show distinct condition differences, reinforcing the limitations of amplitude-based metrics.
These findings, along with the superior performance of machine learning-based decoding methods (e.g., CNN), support our claim that amplitude-based approaches are insufficient for fully capturing the complexity of the neural data.
(8) Wording ambiguity regarding "attribution score" versus "activation amplitude" (Figure 5) complicates the interpretation of key findings. This distinction must be clarified for proper assessment of the results.
Thank you for pointing out the ambiguity between "attribution score" and "activation amplitude." To address this, we have revised the manuscript to use "attribution score" only.
(9) Generalization across animals remains unaddressed. The current within-subject decoding setup limits conclusions regarding shared neural representations across individuals. Adopting cross-validation strategies and exploring between-animal analyses would add significant value to the manuscript.
Thank you for highlighting the importance of generalization across animals. While our study focused on within-subject decoding, we acknowledge that this limits conclusions about shared neural representations across individuals. We expect that inter-animal generalization would be challenging, as models trained on data from a single rat may not perform well on data from others due to differences in electrode placement, brain anatomy, and neural representations. We recognize the value of cross-validation strategies and between-animal analyses and will consider them in future work to address this limitation.
Recommendations for the authors:
Reviewer #1 (Recommendations for the authors):
(1) I would strongly recommend that the authors refine their introduction to be more concise. Many concepts and study aims are repeated many times and, therefore, present as highly redundant text. The introduction may be half the length and still contain the important concepts to set up the justification for the study. I would also suggest refining to be less about sensory deprivation (e.g., with blindness) and more in relation to context, as the acute nature of the study allows one to conclude more about the latter than the former.
Thank you for your feedback on the introduction. We have revised the section to reduce redundancy and present the key concepts more concisely. We also streamlined the study aims and focused more on the context of the acute nature of the study, as you suggested, rather than emphasizing sensory deprivation. This revision better aligns with the main focus of the research and improves clarity. We believe the updated introduction provides a more direct justification for the study.
(2) I am not sure if Figures 1-3 are meant to be in grey-scale for some reason (perhaps to represent light and dark), but I would encourage the authors to examine if this is necessary, as the use of color generally helps one more easily follow Figures.
Thank you for this suggestion. Upon review, we agree that the use of color would enhance the clarity and readability of our figures. We have revised the figures including the newly added supplementary figures to incorporate color.
(3) Figure 5, Figure legend title - check wording.
Thank you for pointing this out. The title has been adjusted for consistency with the other figure legends.
Reviewer #2 (Recommendations for the authors):
(1) Analyses that would strengthen the main claims (major):
(a) Identify the features exploited by the CNN.
(i) Provide grand-average LFP waveforms for each texture × lighting condition (fore- and hind-limb channels shown separately, spatially arranged as in Figure 3C) and try to relate them to the decoding strategy learned by the CNN.
Thank you for your helpful suggestion. We have calculated the grand-average LFP waveforms for each texture × lighting condition and included them in Figure 4A, with fore- and hind-limb channels shown separately and spatially arranged as in Figure 3C. Upon visual inspection, the mean waveforms did not reveal clear, distinct features. To further investigate, we computed the channel-wise correlation between different textures under both dark and light conditions. By subtracting the correlation coefficients for the dark environment from those in the light, we observed that the correlation between textures was lower in the dark environment (Figure 4B). This suggests that LFPs are more distinct between textures in the dark, supporting the CNN model's output. However, this also indicates that the CNN has captured more complex, nuanced information, as it is able to discriminate between LFPs on a single-trial basis, rather than relying on mean traces.
To assess how the correlation between average LFP waveforms varied across channels, we also calculated the channel-channel correlation matrix for all 32 channels in each condition. While we found stronger correlations within each S1 subregion, we did not observe clear differences of correlation matrix between light and dark conditions, nor between different textures (Figure 4C).
(ii) Add channel-wise and time-frequency maps (e.g., wavelet or spectrograms) for each texture × lighting condition and try to relate them to the decoding strategy learned by the CNN.
Thank you for the valuable suggestion. We calculated wavelet features for each LFP segment and averaged them across trials to assess differences in LFP between light and dark conditions, as well as across textures (Figure 4D). However, no distinct differences were observed in the spectral map. To investigate further, we computed the differences in spectral maps for LFPs in light and dark trials. We then calculated the difference in attribution scores derived from the integrated gradient map (Supplementary Figure 4A). Subsequently, we calculated the correlation coefficients between the differences in integrated gradients and the differences in power across each frequency band in the spectral map (Supplementary Figures 4B and 4C). A negative correlation was found in the 50-60 Hz range, while a positive correlation was observed in the 80-90 Hz range. These findings suggest that frequency-specific patterns of LFP activity in different conditions may be linked to the texture representations captured by the CNN model. We have included a discussion of these findings in [lines 463-468].
(b) Quantify the "enhanced separability in darkness" more rigorously.
(i) Report cluster-distances (e.g. Euclidean) for each individual animal.
We thank the reviewer for this helpful comment. When calculating the silhouette score, we used Euclidean distance as the distance metric. The silhouette score is defined for each data point as the difference between the average distance to points within its assigned cluster and the average distance to points in the nearest other cluster, normalized by the larger of the two values. Thus, the silhouette score inherently reflects the relative cluster distances both within and across conditions for each individual animal. Because we report and statistically analyze silhouette scores (Figure 6C), these values already quantify and compare the Euclidean cluster distances across conditions at the animal level. For clarity, we have now added a definition of the silhouette score in the Methods section of the main text [lines 269-278]. We also included the calculated silhouette scores in Supplementary Table 1.
(ii) Run a permutation or bootstrap test (shuffling darkness/light labels within animals) to obtain an empirical null distribution for cluster separability in the network embedding space.
We thank the reviewer for this important suggestion. In response, we implemented a permutation test to assess the robustness of our cluster separability results. Specifically, we shuffled the darkness/light labels within each animal and recalculated silhouette scores across 1000 resamples to generate an empirical null distribution. The observed separability between light and dark conditions consistently exceeded the 95th percentile of the null distribution (Supplementary Figure 3). This confirms that the enhanced cluster separability in darkness was not attributable to random fluctuations in labeling but instead reflected a systematic reorganization of neural representations.
(c) Control for possible visually-evoked potentials (VEPs).
(i) Search the LFPs recorded in light for stereotyped VEP components and/or comment on this possible confound (i.e., VEPs in S1?).
Thank you for raising this point. Although it would be interesting to observe if a VEP is present in the S1 of rats, this experiment did not involve cue-guided visual stimulation. Additionally, there was no environmental visual cue that could serve as an external trigger to align the LFPs for VEP analysis in S1. Furthermore, since even the somatosensory evoked potential was not clearly visible in the S1 LFP without averaging the aligned LFPs, it is unlikely that we would be able to observe VEPs in single trials.
(d) Address behavioral and arousal confounds.
(i) Provide example locomotor-speed traces (aligned with corresponding LFPs) and report locomotor-speed variance across the 10-min blocks.
Thank you for your comment. We had speedometer installed for the recording of the last two rats. We have now provided example speed traces and the speed variance across blocks in Supplementary Figure 1. The traces show that the locomotor-speed was stable in each trial.
(ii) If available from the camera recordings, include pupil diameter as a proxy for arousal; otherwise, discuss explicitly how arousal changes might affect S1 LFPs.
Thank you for this suggestion. We strongly agree that measuring pupil diameters should be incorporated into future studies. However, because our camera did not have sufficient resolution to capture pupil diameters, we have addressed this limitation in the discussion section [lines 525-537].
(e) Address order effects (and motivation/satiety confounds)
(i) Present at least a subset of sessions in which the dark block precedes the light block; re-analyze the silhouette score/discriminability with block order as a factor.
Thank you for this helpful suggestion. We conducted additional analyses using sessions from 6 rats in which the dark block preceded the light block (Supplementary Figure 5A). Using the same model architecture, we calculated the silhouette score for each rat (Supplementary Figure 5B). However, when the order was reversed (dark preceding light), this discriminability effect disappeared. Thus, while we observed a trend toward higher scores in the dark condition, no statistically significant differences in texture discriminability were observed.
If trial order alone accounted for the increase in discriminability, reversing the order would be expected to yield higher silhouette scores in the light condition. Our findings suggest that factors related to order (e.g., thirst or motivation, as you proposed) are not the sole contributors. Furthermore, previous studies in human participants have shown that brief blindfolding can produce lingering increases in tactile sensitivity, indicating a lasting effect of visual deprivation. Thus, the absence of significant differences in texture representation when the dark condition preceded the light condition may reflect such lasting effects. We have included a discussion in [lines 441-452].
(ii) Discuss explicitly the potential confounding effect of motivational state/thirst.
We appreciate the reviewer’s insightful comment. In the revised manuscript, we now explicitly address the potential confounding role of motivational state and thirst in shaping our results. Because animals were water-restricted to maintain task engagement, it is possible that increasing thirst or fluctuating motivation over the course of a session could alter arousal or attentional state, thereby influencing neural separability. However, when the trial order was reversed (dark condition preceding light), silhouette scores did not show a significant increase in the second (light) trial. Thus, while we acknowledge that motivational state may contribute to trial-to-trial variability, the systematic increase in separability during darkness cannot be fully explained by thirst or motivational confounds. This addition has been incorporated into the discussion section [lines 441-452].
(f) Alignment control and the role of forelimb S1.
(i) Repeat the decoding analysis with LFPs aligned to hind-limb strike; report whether the fore-limb dominance persists.
Thank you for your thoughtful suggestion. We appreciate the opportunity to clarify. Our study was designed to ask a different question: how the absence of visual input reorganizes tactile encoding for the body part that actually initiates texture contact in our paradigm (the forepaw). Accordingly, all analyses were aligned to forelimb strike and our array intentionally oversampled S1-forelimb relative to S1-hindlimb (18 vs. 14 electrodes; Fig. 1F–G), yielding clear topographic forelimb-locked event-related responses (Fig. 3B–D) and forelimb-channel dominance in the decoding explainability analyses (Fig. 5D–E). Repeating the full decoding locked to hind-limb strike would test a different hypothesis and would be difficult to interpret for three reasons:
Design/measurement alignment. Our kinematic detection was built to identify forelimb foot strikes. Extending the detector to hindlimb would require new model training/validation and introduces uncertainty in the exact contact timing relative to the LFP segments we analyze.
Sampling asymmetry. The array and cortical magnification are not balanced across subregions (18 forelimb vs. 14 hindlimb electrodes; Fig. 1G), so a hind-limb–aligned comparison would be confounded by unequal coverage and signal-to-noise across S1 subdivisions rather than reflecting true “dominance.”
Scope of the claim. We do not claim that the forelimb is globally more informative about texture; we show the intuitive and topographically specific result that “forelimb S1 codes textures touching the forelimb,” and that these representations become more separable in darkness (silhouette increase; Fig. 5C). A hind-limb–locked re-analysis would likely reveal hindlimb contributions when the hindpaw is the alignment event — but that would not change the central conclusion about darkness enhancing tactile representational separability.
To address the underlying concern about generality without introducing the above confounds, we have clarified these design choices and limitations in the revised Methods [lines 194-197].
(g) Amplitude-based baseline.
(i) Show that a simple linear discriminant or logistic-regression model on peak amplitudes (and/or other simple features like trough width/slope) cannot reach the CNN's accuracy. This kind of "baseline" analysis could also be useful to pinpoint the discriminative features learned by the CNN.
Thank you for your insightful suggestion. We agree that performing a baseline comparison with a simpler model could help highlight the advantage of using a CNN. However, in our dataset, individual LFP traces do not exhibit clear peaks or well-defined features such as peak amplitude, width, or energy, which makes feature extraction using traditional methods like linear discriminants or logistic regression challenging.
To address this, we performed principal component analysis (PCA) on the raw LFP traces to reduce the dimensionality and applied a support vector machine (SVM) classifier on the reduced features, in line with the approach used for the CNN models (Supplementary Figure 2A). The results of this analysis, demonstrate that the SVM model struggles to effectively discriminate between conditions, further reinforcing the necessity of the CNN model. The CNN’s ability to automatically learn complex features from the raw LFP data appears to be a crucial factor in achieving superior classification performance (Supplementary Figure 2B).
(h) Cross-validation and inter-animal generalization.
(i) Consider replacing the single 80/20 split with k-fold cross-validation within animals.
Thank you for this suggestion. Instead of using an 80/20 split, we performed 5-fold cross-validation on all rats. The silhouette scores were averaged within each animal across the five folds, and Figure 6C was updated accordingly. After performing a paired t-test, we still observed a significant difference in silhouette scores between the light and dark conditions.
(ii) Comment on inter-animal generalization.
Thank you for this valuable feedback. Although we did not explicitly test inter-animal generalization, it is unlikely that a model trained on data from one rat would perform equally well when classifying data recorded from another animal. This limitation arises from two main factors. First, despite careful efforts to implant electrodes in the same brain region and cortical layer across experiments, it is impossible to align all 32 electrodes to identical coordinates. Consequently, the recorded LFPs are obtained from slightly different locations, which may reflect distinct neural processing. Second, even within the same species, individual animals differ in brain size and neural circuit organization. Thus, even if electrodes could be placed at identical anatomical locations, inter-individual variability in brain structure would still lead to differences in the recorded signals. Because deep learning models are often sensitive to small perturbations in their input data, we believe that robust inter-animal generalization is unlikely without fine-tuning the model using data from the target animal. This comment has been inserted in the Discussion [lines 494-507].
(2) Writing, figure and terminology improvements (minor):
(a) Figure 5F-G axis label. Decide on either "attribution score" or "activation amplitude" and use that term consistently in panels, legend, and text (currently, I believe it could be confused with raw signal amplitude).
We have unified the terminology to "attribution score" and applied this consistently across the panels, legend, and text.
(b) Throughout the manuscript, use "population-level activity" or "average population dynamics" when discussing LFPs (I believe it is more correct to reserve "population code" for multiple single-unit datasets).
We agree with the reviewer’s point and have adapted the term "population dynamics" to describe LFP information consistently throughout the manuscript.
(c) Lines 219-221, state down-sampling to 2 kHz, whereas line 289 mentions 10 kHz. Reconcile these numbers.
We apologize for the confusion and thank the reviewer for thoroughly reading the manuscript. Our original sampling rate was 30 kHz, and all analyses were performed on data resampled to 10 kHz. The reference to 2 kHz was an error, and we have corrected it.
(d) Specify the tail of each statistical test mentioned in the manuscript and any multiple-comparison correction used.
We have specified the tail of each statistical test and any multiple-comparison corrections used in the "Data Analysis" section of the Methods.
(e) Line 244: "variables (He et al., 2015)" → "variables (He et al., 2015)".
We have corrected this formatting issue and revised it to "variables (He et al., 2015)".
(f) Line 253: "one-dimentional" → "one-dimensional".
We have corrected the spelling error and revised it to "one-dimensional".
(3) Data and code sharing:
(a) Consider depositing data and code for the analysis in public open repositories.
Thank you for your suggestion. We have set up a public GitHub repository to share the code. Since the full dataset is quite large (~400GB), we have uploaded a smaller example dataset for the analysis.
-
-
www.biorxiv.org www.biorxiv.org
-
Reviewer #2 (Public review):
Summary:
An abundant literature documents molecular changes in the rodent hypothalamus that occur during the transition from prepubertal to mature reproductive physiology. Equally well documented is the role of sex steroids and their receptors during this important period of reproductive development, as well as the importance of GABAergic and glutamatergic neurons. The medial preoptic area (MPOA) is known to play a central role in expression of sexually dimorphic reproductive function and previously reported sexually dimorphic patterns of gene expression are consistent with this role. The present manuscript extends this knowledge base and reports the results of a detailed evaluation of transcriptional dynamics in the MPOA during the adolescent transition to maturity with a particular focus on the role of the estrogen receptor gene (Esr1). Both single cell RNA sequencing (scRNseq) and multiplex in situ hybridization methods were employed and the results subjected to detailed computational analyses to demonstrate that the transcriptomic structure of MPOA neurons displays both sex and cell type specific expression profiles. In addition, both hormonal and genetic manipulations of Esr1 signaling during puberty altered the transcriptional profiles of MPOA neurons, and these changes aligned with maturation of hormone-dependent reproductive function. The authors provide this evidence to illustrate Esr1-dependent control of gene regulatory networks required for normal expression of reproductive behaviors expressed during the transition from adolescence to adulthood. The results presented in this manuscript are extensive and represent the most comprehensive evaluation of transcriptomic changes during reproductive maturation to date. The methods appear strong and the results provide a rich data set that will support a good deal of future analysis.
Strengths:
(1) The major strength of this manuscript is the extensive set of images and graphs that illustrate molecular changes that occur in MPOA neurons during adolescence, although additional spatial detail as to locations of the source neurons would be welcome in order to place the changes in the proper circuitry context.
(2) Targeting Esr1 deletion to MPOA GABA neurons is a good choice, given how these cells have been implicated in sexual differentiation of reproductive behavior previously, and the lack of comparable responses in glutamatergic neurons is convincing. The AAV-frtFlex-Cre virus created by the investigators is a most useful tool for such studies. Profiling distinct transcriptomic trajectories in GABA and glutamatergic neurons during reproductive maturation is impressive and leads to some of the best supported conclusions in this paper.
(3) Cellular and molecular resolution of the transcriptomics data appears excellent, however, because the source tissue for the scRNAseq analysis was obtained by bulk dissection of the MPOA anatomical resolution is limited. This problem is addressed to some extent by careful comparison of scRNAseq results with previously published spatial transcriptomics data. The HM-HCR-FISH analysis clearly documents spatially restricted changes in gene expression, but it is hard to discern where these changes occur based on the images presented or the descriptions included in the Results. The anatomical schematic included in Figure 4 suggests that investigators are not familiar with components of the MPOA (see Allen Mouse Brain Atlas).
Weaknesses:
(1) A major conceptual flaw is that the authors do not distinguish between genetically determined sex differences in patterns of gene expression and differences caused by the fact that MPOA neurons are exposed to different endocrine environments in adolescent males and females, which can cause different transcriptional trajectories independent of genetic sex. This issue does not render their results invalid, but their terminology should address the issue in the discussion and "limitations" section. At the very least the endocrine status of "intact females" should be included.
(2) A major technical flaw is that the MPOA is treated as a functionally distinct brain region (block dissections) with uniform distribution of cell types (FISH data are not illustrated or reported with sufficient spatial detail). Thus, an enormous amount of molecular data is provided that cannot be mapped to distinct neural circuits, thereby limiting the neurobiological impact. This is also a weakness of the FISH data, which is presented with only small regions illustrated without anatomical detail. In fact, some images are compared that appear to illustrate different MPOA structures, although it is impossible to be certain of this due to the lack of morphological landmarks. The analysis of how Esr1 orchestrates regulatory gene networks is impressive and interesting, but the fact that many of the observed transcriptional events occur in neural circuits that do not overlap confounds interpretation.
(3) The locations of the AAV injections should be characterized because deleting Esr1 in multiple distinct parts of the MPOA will likely confound interpretation. This is especially problematic given the limited number of mice used for parts of the RNAscope analysis.
(4) Although the focus of these experiments on adolescence is welcome, neither the Introduction nor the Discussion do a good job of placing these studies in the context of what is already known about brain maturation during puberty. It is true that this is very much a results-focused manuscript, but the scholarship can be improved. Simply stating that your results are consistent with previous reports places an undue burden on the reader to go figure out what is new.
(5) Throughout the manuscript, the authors utilize obscure abbreviations, which often makes reading their text overly cumbersome. This is certainly justified in certain instances where complex names of analytical methods are used repeatedly, but the authors are encouraged to try and simply their use of non-standard abbreviations.
Comments on revisions:
The authors have considered issues raised during the initial review. Although there do not appear to be significant changes to analyses, figures or conclusions, the authors have added important revisions listing limitations in study design and methodology that impact interpretation.
-
Author Response:
The following is the authors’ response to the original reviews.
Public review:
Reviewer #1 (Public review):
Weaknesses:
Two minor comments
(1) Fig 4 (hormone treatment): In this experiment, testosterone is given to males, yet in Sup Fig 6 it is argued that Esr1 is more influential in driving transcriptional changes compared to AR. Does DHT treatment have the same outcome as testosterone? Or, does estrogen treatment in males have the same outcome as testosterone?
We agree that to distinguish AR and Esr1 activation by testosterone and converted estrogen respectively is a limitation in our study. We added discussion in the “limitation of the study” section.
Although HM-HCR experiments showed the bidirectional control of transcriptional progression during adolescence, it is unclear if the facilitation in male by testosterone supplement is via activation of AR or Esr1 or both because testosterone will likely be converted to estrogen in the brain. Future studies using dihydrotestosterone (DHT) and estrogen to males may address this issue.
(2) Fig 3i: There appears to be an age-dependent transcriptional change in male Vgat HR-low cells. Can the authors comment on age-dependent (hormone-independent) transcriptional changes in males versus females.
We agree that it is important to clarify hormone dependent changes and age dependent changes. We added pair-wise DE results in Vgat HR low population in the main text. As consistent with trajectory analysis, the number of age-dependent genes were fewer than hormonally associated genes.
“Pair-wise DEG analysis consistently showed that larger number of DEGs between P35 and P23 in Vgat+Esr1+ (male: 146 genes; female: 162 genes) than Vgat+ hormone R<sup>Low</sup> (male: 26 genes; female: 1 gene).”
Reviewer #2 (Public review):
Weaknesses:
(1) A major conceptual flaw is that the authors do not distinguish between genetically determined sex differences in patterns of gene expression and differences caused by the fact that MPOA neurons are exposed to different endocrine environments in adolescent males and females, which can cause different transcriptional trajectories independent of genetic sex. This issue does not render their results invalid, but their terminology should address the issue in the discussion and "limitations" section. At the very least the endocrine status of "intact females" should be included.
We agree that this was ideal if perinatal and pubertal dynamics are analyzed within the same study to distinguish these two processes. We added discussion in the “limitation section”.
“2. Although we have identified hormone/Esr1 dependent transcriptional trajectories during adolescence, the relations and interplay with genetically determined perinatal event, which is earlier and robust, are unclear. Some sex differences during adolescence might be an extension of perinatally established sex differences while others might be unique adolescent changes.”
(2) A major technical flaw is that the MPOA is treated as a functionally distinct brain region (block dissections) with uniform distribution of cell types (FISH data are not illustrated or reported with sufficient spatial detail). Thus, an enormous amount of molecular data is provided that cannot be mapped to distinct neural circuits, thereby limiting the neurobiological impact. This is also a weakness of the FISH data, which is presented with only small regions illustrated without anatomical detail. In fact, some images are compared that appear to illustrate different MPOA structures, although it is impossible to be certain of this due to the lack of morphological landmarks. The analysis of how Esr1 orchestrates regulatory gene networks is impressive and interesting, but the fact that many of the observed transcriptional events occur in neural circuits that do not overlap confounds interpretation.
We agree that while MPOA is defined based on brain atlas consistently across samples, the boundary is somewhat less obvious compared to other nuclei (e.g. hippocampus, VHM etc). To minimize the contaminations from adjacent areas, we have restricted quantitative analysis to mostly Vgat+ Esr1+ population which are densely located within the MPOA but not in immediately adjacent areas, except posterior BNST which is readily distinguishable. We added clarification in the method as well as added technical limitation in the discussion below.
Method
“To disambiguate the MPOA and adjacent brain regions, quantitative analysis is restricted to Vgat+ Esr1+ neurons and is devoid of posterior BNST.”
Discussion
“3. While we have observed robust effect of Esr1-KO in scRNAseq experiment which was further validated with FISH experiment, it is possible that there are further heterogeneous Vgat-Esr1 populations in the MPOA which might be differentially targeted in each virally injected sample. To mitigate this, 3-4 mice were pooled for each sample in scRNAseq experiment and in HCR-FISH experiment, in addition to confirming recombinase RNA expression within the MPOA, we included samples with robust Esr1 deletion in the MPOA. Interestingly, due to the technical challenge, Esr1 deletion tends to be more robust than weakly detected recombinase RNA expression (data not shown).”
(3) The locations of the AAV injections should be characterized because deleting Esr1 in multiple distinct parts of the MPOA will likely confound interpretation. This is especially problematic given the limited number of mice used for parts of the RNAscope analysis.
We agree that similar to #2, this is an important matter. For HCR experiment, we only included animal with recombinase RNA (Cre or Flp) expression within MPOA. Although the recombinase expression was sufficient enough to qualitatively determine the hit or miss, the detection was weak and it was challenging to determine the extent of viral spread. Thus, we also used successful Esr1 deletion as an additional inclusion criteria for AAV-Cre-YFP group. We have added inclusion criteria in the method and technical consideration in discussion.
Method
“For HCR2, AAV was injected unilaterally so that successful targeting of the MPOA with AAVCre-YFP (detection of recombinase RNA within the MPOA) and the deletion of Esr1 were confirmed for inclusion of samples.”
Discussion
“3. While we have observed robust effect of Esr1-KO in scRNAseq experiment which was further validated with FISH experiment, it is possible that there are further heterogeneous Vgat-Esr1 populations in the MPOA which might be differentially targeted in each virally injected sample. To mitigate this, 3-4 mice were pooled for each sample in scRNAseq experiment and in HCR-FISH experiment, in addition to confirming recombinase RNA expression within the MPOA, we included samples with robust Esr1 deletion in the MPOA. Interestingly, due to the technical challenge, Esr1 deletion tends to be more robust than weakly detected recombinase RNA expression (data not shown).”
(4) Although the focus of these experiments on adolescence is welcome, neither the Introduction nor the Discussion do a good job of placing these studies in the context of what is already known about brain maturation during puberty. It is true that this is very much a results focused manuscript, but the scholarship can be improved. Simply stating that your results are consistent with previous reports places an undue burden on the reader to go figure out what is new.
We agree that contextualizing our study in the scholarship will clarify the novelty and impacts that this study provides to the community. We have updated the introduction adding a review highlighting puberty associated genomic studies in the brain, which are all bulk (brain region level) as well as the very first puberty scRNAseq study in Human testis.
“Despite the well-established role of these hormones in shaping behavior, the molecular mechanisms underlying their influence on brain development during adolescence are still limited to brain-region level (bulk)[8]in humans and model organisms and adolescent transcriptional dynamics at single cell resolution in the brain remain poorly understood (but see a pioneering study in the human testis[9]).”
(5) Throughout the manuscript the authors utilize obscure abbreviations, which often makes reading their text overly cumbersome. This is certainly justified in certain instances where complex names of analytical methods are used repeatedly, but the authors are encouraged to try and simplify their use of non-standard abbreviations.
We agree that this is helpful for readers to have the reference of abbreviations in handy at single location. We added an “abbreviation” section as a reference for readers.
Medial preoptic area (MPOA)
Single-cell RNA sequencing (scRNAseq)
Estrogen receptor 1 (Esr1)
GABAergic neurons (Vgat+)
Glutamatergic neurons (Vglut2+)
Hybridized chain reaction fluorescent in situ hybridization (HCR-FISH)
Gonadectomized (GDX)
Partition-based graph abstraction (PAGA)
Hormone-associated differentially expressed genes (HA-DEGs)
Multiplexed error-robust fluorescence in situ hybridization (MERFISH) differential gene expression (DE)
Differentially expressed genes (DEGs)
Support vector machine (SVM)
Manifold Enhancement Latent Dimension (MELD)
Potential of Heat-diffusion for Affinity-based Trajectory Embedding (PHATE)
Androgen receptor (AR)
single-cell regulatory network inference (SCENIC)
Reviewer #3 (Public review):
We appreciate reviewer for the constructive comments to improve our manuscript.
Weaknesses:
We already know that Esr1 is important within GABAergic but not glutamatergic neurons for mating behavior. However, there is not enough data to support the claim that disrupting Esr1 in glutamatergic MPOA neurons "had no observable effect." The MPOA is involved in many behaviors and physiologies that were not investigated. More assays would be required to report "no observable effect."
The small number of cells included in the transcriptional studies is a general concern, as noted by the authors. This is a particular concern for conclusions related to the role of adolescence in glutamatergic MPOA neurons. The paper reports 24,627 neurons across all treatment groups, which include 3 time points, 2 sexes, and GDX conditions. It seems likely that not much was detected in the glutamatergic neurons because of insufficient power.
Esr1 knockout is initiated in adolescence, not restricted to adolescence. Do we know that the effects on mating behavior are due to what is happening in adolescence vs. the function of Esr1 in adults? Are the effects different if Esr1 is knocked out in mature adults? This comparison would be important to demonstrate that adolescence is a critical time window for Esr1 function.
We agree that 1. the relatively mild effects observed in Glutamatergic neurons may be partially due to the scale of the study, and 2. Esr1 deletion is permanent once induced and it is challenging to distinguish adolescent and adult transcriptional dynamics using existing viral strategies.
We added discussion in the “limitation” section.
“4. While we have observed robust transcriptional progression in Vgat<sup>+</sup> Esr1<sup>+</sup> neurons during adolescence, we observed more mild alternations in VgluT2<sup>+</sup> neurons. Although the scale of our study is comparable or exceeds prior scRNAseq studies in MPOA[22,29], future larger studies may have more sensitivity to detect adolescent transcriptional dynamics in VgluT2<sup>+</sup> neurons.”
“5. Although we demonstrated adolescent transcriptional changes were observed as early as P35, and either hormonal deprivation or Esr1 KO in prior to adolescence prevented the transcriptional progression (arrested transcriptional state even at adult), given the viral incubation time and permanent deletion of Esr1 after viral injection, it is challenging to disambiguate the role of Esr1 during adolescence and adult. Future studies injecting the virus at adult may provide additional insights on the similarity and difference between transcriptional changes during puberty and maintained transcriptional states at adult.”
-
-
www.biorxiv.org www.biorxiv.org
-
Reviewer #1 (Public review):
Summary:
Overall, this is an interesting and well-written manuscript on a fascinating question in a "charismatic" model system.
Strengths:
1) The Introduction is concise, though it might be helpful to the non-specialist reader to learn a bit more about what is known about the social control of somatic growth across diverse species (including humans), which would help to make this work more generally interesting.
(2) The experiment is well-designed.
(3) The data collected are comprehensive.
(4) The complementary analysis of both feeding and aggression/submission data with and without known social roles is a neat idea and compelling!
Weaknesses:
(1) I was surprised that the HPA/stress axis was not considered here at all. Wouldn't we expect that subordinates have increased stress axis activation, which in turn could inhibit their growth and aggressive behavior?
(2) To what extent are growth, food intake, agonistic behavior, and/or gene expression patterns coordinated across P1 vs P2 pairs? The lack of such an analysis seems like a missed opportunity.
(3) What was the rationale for using whole bodies for the transcriptome analysis? Given the hypotheses, the forebrain or hypothalamus and certain other organ systems (e.g., liver, gonads, skin, etc.) would have been obvious candidate tissues here. I realize that cost is always a consideration, but maybe a focus on the fore-/midbrain could have been prioritized.
(4) Given the preceding point, why was a fold-change threshold used for assessing DEGs (supplementary Figure 3)? There is no biological justification to ever use a fold-change threshold, especially in bulk RNA-seq analysis. This is particularly true here, where whole bodies were used for RNA-seq analysis, which is a bit unusual. Relatively small cell populations (such as hypothalamic neurons that regulate growth or food intake) may show substantial gene expression variation across social types, yet will be masked by the masses of other cells in the whole body sample. However, gene expression may still vary significantly, albeit the fold-difference may be small. I therefore suggest a reanalysis that omits any fold-change threshold.
(5) Why is the analysis of color (hue, saturation) buried in the supplementary materials? Based on the hypotheses that motivated the study, color seems just as relevant as food intake, growth, and agonistic behavior, so even if the results are negative, they should be presented in the main paper.
(6) The Discussion is sometimes difficult to follow. The authors may want to consider including a conceptual graphic that integrates the different aspects of growth and satiety regulation, etc., into a work-in-progress model of sorts, which would also facilitate clearer hypotheses for future research.
-
Reviewer #2 (Public review):
In this manuscript, the authors test growth, behavior, and gene expression in pairs of clownfish as they establish social dominance hierarchies, examining patterns of gene expression in these pairs after dominance has been established. The authors show solid evidence that emerging dominant clownfish show increased growth, aggression, and food consumption compared to their submissive or solitary counterparts, eventually adopting distinct gene expression profiles.
Major Comments:
(1) The Introduction is comprehensive, but it could be condensed. Likewise, the discussion could be condensed. There is considerable redundancy between the methods, the results, and the legend in Figure 1. The authors should consolidate and remove the redundancy.
(2) For Figure 3, the authors are showing PC2 and PC3; why is PC1 not shown? There is so much overlap between the three groups in PC2 vs PC3; it seems unlikely that researchers could conclusively identify any individual as belonging to a group based on the expression profile. The ovals shown do not capture all the points within each of the groups, and particularly the grey S oval seems misaligned with the datapoints shown.
(3) The authors indicate that the 15 replicates exhibiting the greatest size difference between P1 and P2 were selected for gene profiling. Does this mean that each of the P1 and P2 were pairs with each other? Have the authors tried examining the gene expression patterns in a paired manner? E.g., for the pairs that showed the greatest size differences, do they also show the greatest differences in gene expression? Do the P1s show the most extreme differences from P2s that also show the most extreme P2 differences? Perhaps lines on Figure 3A connecting datapoints from the P1 and P2 pairs would be informative.
(4) For the specific target pathways that are up- and downregulated in the different backgrounds, I recommend that the authors include boxplots (or heatmaps) showing the actual expression values for these targets. Figure 6 shows a heatmap for appetite-related genes, and it would be great to see a similar graph for the metabolism and glycolysis genes; it would also be informative to see similar graphs for hormonal and sexual maturation pathways as well.
(5) Particularly given that there is a relatively small number of genes enriched in the different rank conditions, I did not understand the need to do the WGCNA module analysis. I thought that an analysis of GO terms across the dataset would have been more meaningful than the GO term analysis shown in Figure 4, which considers only genes assigned to the "brown WGCNA module". This should be simplified or clarified.
(6) The authors say that they have identified coordinated changes in behaviors and the "underlying gene expression, leading to the emergence" of social roles. This is a little bit misleading, since the gene expression analysis occurred well after the behavioral and phenotypic differences emerged. Presumably, the hormonal and genetic shifts that actually caused the behavioral and phenotypic difference occurred during the weeks during which the experiment was underway, and earlier capture of the transcriptome would presumably reveal different patterns, and ones that would be considered more causative. The authors acknowledge this in 434-435, but it could be emphasized further.
(7) The authors have measured a number of differences between the different dominance classes of fish. All these differences were measured relative to the other classes, but in my view, the Solitary group was the closest to a baseline control. So I'm not sure that it is fair to say that "P2 and S individuals showed consistent downregulation of these genes and pathways" (line 401). I encourage the authors to emphasize the differences in gene expression from the "perspective" of the P1 individuals compared to the baseline of P2 and S individuals. Line 474 says that "P2 fish showed significant upregulation" of a number of pathways. It should be very clear what that is compared to (compared to P1, presumably?)
(8) Along the same lines, the authors say in line 514 that subordinates and solitaries strategically downregulate their growth. I'm not convinced that this is the case: I would consider this growth trajectory to be the default and the baseline. I would interpret that under certain social conditions, a P1 dominant pattern of growth, behavior, and gene expression is allowed to emerge.
-
Author Response:
Public Reviews:
Reviewer #1 (Public review):
Summary:
Overall, this is an interesting and well-written manuscript on a fascinating question in a"charismatic" model system.
Strengths:
(1) The Introduction is concise, though it might be helpful to the non-specialist reader to learn a bit more about what is known about the social control of somatic growth across diverse species (including humans), which would help to make this work more generally interesting.
(2) The experiment is well-designed.
(3) The data collected are comprehensive.
(4) The complementary analysis of both feeding and aggression/submission data with and without known social roles is a neat idea and compelling!
Thank you for the positive feedback!
Here, we investigate phenotypic plasticity associated with the adoption of social roles in the clown anemonefish, with strategic growth being just one aspect of that plasticity. Strategic growth, also known as social control of growth, is a fascinating form of adaptive phenotypic plasticity, whereby individuals modify their growth and size in response to fine-scale changes in social conditions (Buston & Clutton-Brock, 2022). In cooperative breeding systems with high reproductive skew, particularly fishes and mammals (possibly including humans), individuals have been shown to i) increase growth/size on the acquisition of dominant status (Dengler-Crish & Catania, 2007; Johnston et al., 2021; Thorley et al., 2018; Van Schaik & Van Hooff, 1996; Walker & McCormick, 2009), ii) increase growth/size when paired with size matched reproductive rivals (Huchard et al., 2016; Reed et al., 2019; this study), and iii) decrease growth/size to avoid conflict (Buston, 2003; Heg et al., 2004; Wong et al., 2007). While strategic growth is fascinating and clearly occurring in this study, we show coordinated changes of multiple aspects of the phenotype as fish adopt social roles. Therefore, we deliberately framed the Introduction broadly to avoid biasing the reader toward viewing growth as the sole or main driver.
Weaknesses:
(1) I was surprised that the HPA/stress axis was not considered here at all. Wouldn't we expect that subordinates have increased stress axis activation, which in turn could inhibit their growth and aggressive behavior?
We also expected to see the HPA/stress axis activated in subordinates, which is why we carried out a targeted exploration of genes known to play a role in this axis. We did not find any genes that were significantly differentially expressed. We believe that there could be two explanations for this. First, from a methodological perspective, it could be due to our use of a whole-body RNA-seq, which may have masked this signal. Alternatively, the stress axis might play a more complex role than just acting as a simple on/off switch for reduced growth. Its activation may peak when competition over size is at its highest (during week one) or, conversely, it may peak later and help maintain reduced growth once hierarchies are firmly established (particularly after the dominant individual reaches its maximum size). To understand the role of the stress axis, future studies should observe how its activation varies over time. We acknowledge that the absence of a stress‑axis signal and its potential explanations were not clearly discussed in the original manuscript, in the revised version, we will address this issue.
(2) To what extent are growth, food intake, agonistic behavior, and/or gene expression patterns coordinated across P1 vs P2 pairs? The lack of such an analysis seems like a missed opportunity.
We had a similar thought. Specifically, we were interested in testing the hypothesis that the final size ratio of pairs, which is indicative of the amount of conflict remaining, would predict gene expression. We examined gene expression within pairs to test for coordinated changes and repeated the analysis, accounting for the pair size ratio. In both cases, we found no clear or consistent pattern within pairs. We will consider including these figures in the Supplementary Materials document.
(3) What was the rationale for using whole bodies for the transcriptome analysis? Given the hypotheses, the forebrain or hypothalamus and certain other organ systems (e.g.,liver, gonads, skin, etc.) would have been obvious candidate tissues here. I realize that cost is always a consideration, but maybe a focus on the fore-/midbrain could have been prioritized.
We decided to use whole-body samples for this initial transcriptomic analysis to capture a broad view of gene-expression differences while keeping sequencing costs and sample requirements manageable. We agree with the reviewer that future work should explore specific tissues sampled from individuals at multiple time points to disentangle transcriptomic differences across tissue types.
(4) Given the preceding point, why was a fold-change threshold used for assessing DEGs (supplementary Figure 3)? There is no biological justification to ever use a fold-change threshold, especially in bulk RNA-seq analysis. This is particularly true here, where wholebodies were used for RNA-seq analysis, which is a bit unusual. Relatively small cell populations (such as hypothalamic neurons that regulate growth or food intake) may show substantial gene expression variation across social types, yet will be masked by the masses of other cells in the whole body sample. However, gene expression may still vary significantly, albeit the fold-difference may be small. I therefore suggest a reanalysis that omits any fold-change threshold.
We thank the reviewer for this important point, and agree that an arbitrary fold‑change cutoff is inappropriate/unnecessary. It should be noted that this fold-change cut-off was only used in this single figure, and all other analyses used p-values from the entire dataset. We will remove the fold‑change threshold cutoff and correct Supplementary Figure 3, and any corresponding text.
(5) Why is the analysis of color (hue, saturation) buried in the supplementary materials?Based on the hypotheses that motivated the study, color seems just as relevant as food intake, growth, and agonistic behavior, so even if the results are negative, they should be presented in the main paper.
We agree that color can be an important social signal, so we included color measurements in our experimental design. However, after careful consideration of the color results, we decided that our experimental timing and husbandry changes introduced multiple confounding factors, preventing us from drawing confident conclusions. Specifically, our fish were ≈1 month old at the transfer from larval to experimental tanks and had already begun to deepen their orange hue, before our experiment. (In the wild, they would settle at two weeks of age, prior to the deepening of the orange hue). Once individuals attain a certain hue, it seems that color development can be halted, but not reversed. The transfer also involved changes in lighting, tank background, and diet, factors known to strongly affect coloration. Our results show a uniform shift in orange hue and saturation across social groups, suggesting that these confounding factors might have dominated changes in hue.
For transparency, we report the color data in the Supplementary Materials, but we caution against drawing any strong conclusions. In the revised manuscript, we will recommend that future work include a targeted experiment to robustly test for the effect of the adoption of social roles on coloration or the effect of coloration on the adoption of social roles.
(6) The Discussion is sometimes difficult to follow. The authors may want to consider including a conceptual graphic that integrates the different aspects of growth and satiety regulation, etc., into a work-in-progress model of sorts, which would also facilitate clearer hypotheses for future research.
Thank you for flagging that parts of the Discussion are a bit difficult to follow. In the revised manuscript, we will work to improve readability of the Discussion. We also appreciate the suggestion of including a conceptual schematic. We will consider whether adding such a graphic will add value to this manuscript or future manuscripts.
Reviewer #2 (Public review):
In this manuscript, the authors test growth, behavior, and gene expression in pairs of clownfish as they establish social dominance hierarchies, examining patterns of gene expression in these pairs after dominance has been established. The authors show solid evidence that emerging dominant clownfish show increased growth, aggression, and food consumption compared to their submissive or solitary counterparts, eventually adopting distinct gene expression profiles.
Major Comments:
(1) The Introduction is comprehensive, but it could be condensed. Likewise, the discussion could be condensed. There is considerable redundancy between the methods, the results,and the legend in Figure 1. The authors should consolidate and remove the redundancy.
Thank you for flagging that parts of the manuscript could be condensed, we will work on this as we revise the manuscript.
(2) For Figure 3, the authors are showing PC2 and PC3; why is PC1 not shown? There is so much overlap between the three groups in PC2 vs PC3; it seems unlikely that researchers could conclusively identify any individual as belonging to a group based on the expression profile. The ovals shown do not capture all the points within each of the groups, and particularly the grey S oval seems misaligned with the datapoints shown.
We understand the concern raised by the reviewer about the overlap among points in the PCA. We have explored PC1-PC3 and found that PC2 and PC3 showed the clearest, statistically significant clustering by social position, while PC1 did not capture any variation due to social position. We have explored whether other factors might be masking differences, such as genetic relatedness, tank effects, total read count per sample, and found that none of these factors explained sample clustering. Regarding the ellipses shown around the points, they were not intended to capture all points, but rather they show the estimated 95% multivariate t-distribution for that given social group. We will make sure this is clearly explained in the figure legend, and Methods section. In addition, in the revised version, we will show PC1 and PC2, and PC1 and PC3, in the Supplements for transparency.
(3) The authors indicate that the 15 replicates exhibiting the greatest size difference between P1 and P2 were selected for gene profiling. Does this mean that each of the P1and P2 were pairs with each other? Have the authors tried examining the gene expression patterns in a paired manner? E.g., for the pairs that showed the greatest size differences,do they also show the greatest differences in gene expression? Do the P1s show the most extreme differences from P2s that also show the most extreme P2 differences? Perhaps lines on Figure 3A connecting datapoints from the P1 and P2 pairs would be informative.
Yes, “15 replicates exhibiting the greatest size difference between P1 and P2 were selected for gene profiling” refers to pairs of P1 and P2, we will make sure this is clearly stated in the revised Methods. Yes, we have explored gene expression data considering the size difference between pairs, and found that it showed no clear differences in gene expression patterns (see earlier response to Reviewer #1). We will consider including these figures in the Supplementary Materials document, as well as adding a version of Figure 3A that clearly shows information on pairs, as suggested by the reviewer.
(4) For the specific target pathways that are up- and downregulated in the different backgrounds, I recommend that the authors include boxplots (or heatmaps) showing the actual expression values for these targets. Figure 6 shows a heatmap for appetite-related genes, and it would be great to see a similar graph for the metabolism and glycolytic genes; it would also be informative to see similar graphs for hormonal and sexual maturation pathways as well.
We have explored genes across a broad set of metabolic pathways (glycolysis, TCA cycle, lactic fermentation, PDH complex, cholesterol biosynthesis, fatty-acid synthesis, and beta-oxidation) and show all metabolic genes that showed significant differential expression between P1, P2, and S in Figure 6. Overall, very few metabolism-associated genes were significantly differentially expressed, which is why we decided to combine appetite-regulation and metabolism-associated genes into a single figure (Figure 6). In the revised version, we will ensure that Figure 6 clearly shows the gene sets associated with appetite and metabolism.
We also examined hormonal pathways (glucocorticoid and thyroid signaling), but did not find genes in these pathways that were significantly differentially expressed. Finally, we would like to clarify that our samples consist of two-month-old juvenile individuals that are sexually immature —under ideal conditions, clown anemonefish can mature in one to two years, but they can also remain sexually immature for a decade or more (Buston & García, 2007) — which is why we did not observe distinct molecular signatures of sexual maturation. We recognize that the sentence at line 520 may be misleading, as we did not identify any gene expression signature that we could confidently associate with signs of sexual maturation. We will make sure that these are clearly stated in the revised version of the manuscript.
(5) Particularly given that there is a relatively small number of genes enriched in the different rank conditions, I did not understand the need to do the WGCNA module analysis. I thought that an analysis of GO terms across the dataset would have been more meaningful than the GO term analysis shown in Figure 4, which considers only genes assigned to the "brown WGCNA module". This should be simplified or clarified.
To clarify, GO enrichment analysis does not establish correlations with traits, it only describes which functions or pathways are over-represented in a given gene set. That is why we began by using WGCNA to define gene sets (modules) that are correlated to phenotypes. Our primary rationale for WGCNA was to identify modules of co-expressed genes that show significant statistical correlation with the phenotypes of interest (social role: P1, P2, S; growth; and food intake). Pairwise differential expression analysis (Figure 3B) identified a few hundred significantly differentially expressed genes, but those tests treat genes independently and are not able to help us link coordinated changes of co-expressed genes to phenotypes of interest. Because WGCNA is blind to traits, it first identifies groups of co-expressed genes, which can help resolve gene expression patterns.
We therefore ran WGCNA on the rlog-transformed dataset to identify modules of co-expressed genes that show significant correlation with phenotypes of interests. For every module that showed such a correlation, we performed GO enrichment and carefully evaluated the resulting GO enrichment trees (see Supplementary Figs. 4–5). The brown module was highlighted in the main text because it was one of the modules with a significant correlation to growth, and its associated GO enrichment showed clear growth-related signals that were not identified in the pairwise differential expression analysis results.
(6) The authors say that they have identified coordinated changes in behaviors and the"underlying gene expression, leading to the emergence" of social roles. This is a little bit misleading, since the gene expression analysis occurred well after the behavioral and phenotypic differences emerged. Presumably, the hormonal and genetic shifts that actually caused the behavioral and phenotypic difference occurred during the weeks during which the experiment was underway, and earlier capture of the transcriptome would presumably reveal different patterns, and ones that would be considered more causative.The authors acknowledge this in 434-435, but it could be emphasized further.
We appreciate the reviewer raising this point. In the updated version of the manuscript, we will revise wording to convey that food intake, agonistic behavior, size and growth, and gene expression are all changing continuously, in response to each other and in response to social feedback. An underappreciated aspect of this system (and likely many other systems) is that phenotype (including transcriptome) influences the outcome of social interactions, and the outcome of social interactions influences the phenotype (including the transcriptome). Earlier capture of the transcriptome would reveal different levels of gene expression, reflecting the state of the system at that moment in time.
(7) The authors have measured a number of differences between the different dominance classes of fish. All these differences were measured relative to the other classes, but in my view, the Solitary group was the closest to a baseline control. So I'm not sure that it is fair to say that "P2 and S individuals showed consistent downregulation of these genes and pathways" (line 401). I encourage the authors to emphasize the differences in gene expression from the "perspective" of the P1 individuals compared to the baseline of P2and S individuals. Line 474 says that "P2 fish showed significant upregulation" of a number of pathways. It should be very clear what that is compared to (compared to P1, presumably?)
We agree with the reviewer that solitary individuals are the most intuitive baseline. Indeed, the experimental design included solitary fish because we expected they would serve as a useful control. Without social restraint, we anticipated they would show unrestricted growth, feeding, behavior, and associated gene‑expression patterns, similar to dominants.
We initially ran analyses using solitaries as the baseline, but after examining the results, which showed subordinate‑like characteristics for the solitary individuals, we concluded that solitary individuals are not an ecologically appropriate control for this context. Removing juveniles from a social context and housing them in isolation may be stressful and can affect physiology and behavior in ways that do not reflect a natural baseline. From a life‑history standpoint, solitary living is not the typical state for A. percula.
For these reasons, we reanalysed the dataset using the dominant (P1) as the reference to enable more ecologically meaningful comparisons (this choice was somewhat arbitrary, subordinates could also have been used as the reference). Given that gene expression is relative, we interpret results from both the dominant (P1) and subordinate (P2) perspectives in the Discussion to provide a complete view. We will clarify wording throughout the manuscript to make it clear that everything is relative (e.g., revising Line 474).
(8) Along the same lines, the authors say in line 514 that subordinates and solitaries strategically downregulate their growth. I'm not convinced that this is the case: I would consider this growth trajectory to be the default and the baseline. I would interpret that under certain social conditions, a P1 dominant pattern of growth, behavior, and gene expression is allowed to emerge.
We respectfully disagree with the idea that a single baseline/reference growth trajectory exists for any individual of this species. Growth of individuals is entirely social context-dependent: neither fast nor slow growth represents an inherent baseline. When two size‑matched juveniles meet and compete to establish dominance, accelerated growth is the expected trajectory. By contrast, juveniles joining an existing hierarchy are expected to exhibit reduced growth, which minimizes conflict and facilitates their social integration. Unlike species that show non socially mediated growth trajectories, clown anemonefish do not have a context‑independent growth rate, rather, individuals constantly readjust their growth according to their immediate social environment.
Therefore, growth trajectories must be considered from the perspective of all group members, because they emerge from interactions among individuals rather than reflecting an intrinsic baseline. In this study, we were interested in the establishment of dominance hierarchy and how individuals adjust their phenotypes during this process. By experimentally pairing size‑matched rivals, both individuals are initially expected to pursue the dominant trajectory, and thus neither individual represents a default state. Instead, the outcome reflects a social decision, after which both individuals reinforce their emerging social roles through coordinated changes.
Reviewer #3 (Public review):
Summary:
The authors tested the hypothesis that interactions among size- and age-matched rivals will lead to the emergence of social roles, accompanied by divergence in four aspects of individual phenotypes: growth, feeding behavior, fighting behaviors, and gene expression in clownfish.
Strengths:
The data on growth, feeding rate, and fighting behaviors support the authors' claims.
Thank you for the positive feedback!
Weaknesses:
Gene analysis conducted in this study is not sufficient to clarify how the relevant genes actually regulate growth and behavior.
The information obtained from whole-body gene expression analysis is very limited.Various gene expression is associated with the regulation of fighting behaviors, food intake, growth, and metabolism, and these genes are regulated differently across tissues,even within a single individual. Gene expression analysis should be performed separately for each tissue.
We understand the reviewer’s concern about whole‑body transcriptomes and agree that tissue‑specific sampling would provide greater resolution of the mechanisms linking gene expression to growth, agonistic behaviors, and food intake. For this initial study, however, we deliberately chose whole‑body samples to capture a broad, unbiased view of gene expression differences while keeping sequencing costs and sample requirements manageable. We explicitly acknowledge the resulting interpretational limits in the Discussion (lines 464; 529–533), and suggest in the last paragraph that the patterns reported here should be used to build on in future studies exploring targeted, tissue‑specific hypotheses.
Clownfish undergo sex change depending on social status and body size, as the authors mention in the manuscript. Numerous gene expressions are affected by sex change. It is unclear how this issue was addressed.
We thank the reviewer for raising this point. Sex change and sexual maturation can indeed drive major transcriptional shifts in clown anemonefish, but our experiment did not encompass such a life‑history transition. All individuals in this experiment were juveniles (≈1 month old at the start, ≈2 months old at the end) and were sexually immature at these ages. Clown anemonefish reach sexual maturation around one to two years under ideal conditions, can delay sexual maturation for years under normal conditions (Buston & García, 2007), and sex change in the genus Amphiprion is known to take over ~5 months (Moyer & Nakazono, 1978). Accordingly, individuals in this study were not sexually mature, and sex change was not biologically plausible over the five-week experimental period of our study. We recognize that the sentence at line 520 may be misleading, as we did not identify any gene expression signature that we could confidently associate with signs of sexual maturation. We will make sure that it is clearly stated that the fish in this study were sexually immature in the revised version.
References:
Buston, P. (2003). Forcible eviction and prevention of recruitment in the clown anemonefish. Behavioral Ecology, 14(4), 576–582. https://doi.org/10.1093/beheco/arg036
Buston, P. M., & García, M. B. (2007). An extraordinary life span estimate for the clown anemonefish Amphiprion percula. Journal of Fish Biology, 70(6), 1710–1719. https://doi.org/10.1111/j.1095-8649.2007.01445.x
Buston, P., & Clutton-Brock, Tim. (2022). Strategic growth in social vertebrates (WITH REVIEWER COMMENTS). Trends in Ecology & Evolution, 37(8), 694–705. https://doi.org/10.1016/j.tree.2022.03.010
Dengler-Crish, C. M., & Catania, K. C. (2007). Phenotypic plasticity in female naked mole-rats after removal from reproductive suppression. THE JOURNAL OF EXPERIMENTAL BIOLOGY.
Heg, D, Bender, N, & Hamilton, I. (2004). Strategic growth decisions in helper cichlids. Proceedings of the Royal Society of London. Series B: Biological Sciences, 271(suppl_6). https://doi.org/10.1098/rsbl.2004.0232
Huchard, E, English, S, Bell, M B. V., Thavarajah, N, & Clutton-Brock, T. (2016). Competitive growth in a cooperative mammal. Nature, 533(7604), 532–534. https://doi.org/10.1038/nature17986
Johnston, R A., Vullioud, P, Thorley, J, Kirveslahti, H., Shen, L., Mukherjee, S., Karner, C. M., Clutton-Brock, T, & Tung, J (2021). Morphological and genomic shifts in mole-rat ‘queens’ increase fecundity but reduce skeletal integrity. eLife, 10, e65760. https://doi.org/10.7554/eLife.65760
Moyer, J. T., & Nakazono, A. (1978). Protandrous Hermaphroditism in Six Species of the Anemonefish Genus Amphiprion in Japan (No. 2). The Ichthyological Society of Japan. https://doi.org/10.11369/jji1950.25.101
Reed, C., Branconi, R., Majoris, J., Johnson, C., & Buston, P. (2019). Competitive growth in a social fish. Biology Letters, 15(2), 20180737. https://doi.org/10.1098/rsbl.2018.0737
Thorley, J, Katlein, N, Goddard, K, Zöttl, M, & Clutton-Brock, T. (2018). Reproduction triggers adaptive increases in body size in female mole-rats. Proceedings of the Royal Society B: Biological Sciences, 285(1880), 20180897. https://doi.org/10.1098/rspb.2018.0897
Van Schaik, C P., & Van Hooff, J A. R. A. M. (1996). Toward an understanding of the orangutan’s social system. In Linda F. Marchant, Toshisada Nishida, & William C. McGrew (Eds.), Great Ape Societies (pp. 3–15). Cambridge University Press. https://doi.org/10.1017/CBO9780511752414.003
Walker, S P. W., & McCormick, M I. (2009). Sexual selection explains sex-specific growth plasticity and positive allometry for sexual size dimorphism in a reef fish. Proceedings of the Royal Society B: Biological Sciences, 276(1671), 3335–3343. https://doi.org/10.1098/rspb.2009.0767
Wong, M. Y. L., Buston, P. M., Munday, Philip L., & Jones, Geoffrey P. (2007). The threat of punishment enforces peaceful cooperation and stabilizes queues in a coral-reef fish. Proceedings of the Royal Society B: Biological Sciences, 274(1613), 1093–1099. https://doi.org/10.1098/rspb.2006.0284
-
-
www.biorxiv.org www.biorxiv.org
-
Author response:
The following is the authors’ response to the previous reviews
Public Reviews:
Reviewer #1 (Public review):
Summary:
In this paper, the authors investigate the effects of Miro1 on VSMC biology after injury. Using conditional knockout animals, they provide the important observation that Miro1 is required for neointima formation. They also confirm that Miro1 is expressed in human coronary arteries. Specifically, in conditions of coronary diseases, it is localized in both media and neointima and, in atherosclerotic plaque, Miro1 is expressed in proliferating cells.
However, the role of Miro1 in VSMC in CV diseases is poorly studied and the data available are limited; therefore, the authors decided to deepen this aspect. The evidence that Miro-/- VSMCs show impaired proliferation and an arrest in S phase is solid and further sustained by restoring Miro1 to control levels, normalizing proliferation. Miro1 also affects mitochondrial distribution, which is strikingly changed after Miro1 deletion. Both effects are associated with impaired energy metabolism due to the ability of Miro1 to participate in MICOS/MIB complex assembly, influencing mitochondrial cristae folding. Interestingly, the authors also show the interaction of Miro1 with NDUFA9, globally affecting super complex 2 assembly and complex I activity.<br /> Finally, these important findings also apply to human cells and can be partially replicated using a pharmacological approach, proposing Miro1 as a target for vasoproliferative diseases.
Strengths:
The discovery of Miro1 relevance in neointima information is compelling, as well as the evidence in VSMC that MIRO1 loss impairs mitochondrial cristae formation, expanding observations previously obtained in embryonic fibroblasts.
The identification of MIRO1 interaction with NDUFA9 is novel and adds value to this paper. Similarly, the findings that VSMC proliferation requires mitochondrial ATP support the new idea that these cells do not rely mostly on glycolysis.
The revised manuscript includes additional data supporting mitochondrial bioenergetic impairment in MIRO1 knockout VSMCs. Measurements of oxygen consumption rate (OCR), along with Complex I (ETC-CI) and Complex V activity, have been added and analyzed across multiple experimental conditions. Collectively, these findings provide a more comprehensive characterization of the mitochondrial functional state. Following revision, the association between MIRO1 deficiency and impaired Complex I activity is more robust.
Although the precise molecular mechanism of action remains to be fully elucidated, in this updated version, experiments using a MIRO1 reducing agent are presented with improved clarity
Although some limitations remain, the authors have addressed nearly all the concerns raised, and the manuscript has substantially improved
Weaknesses:
Figure 6: The authors do not address the concern regarding the cristae shape; however, characterization of the cristae phenotype with MIRO1 ΔTM would have strengthened the mechanistic link between MIRO1 and the MIB/MICOS complex
Although the authors clarified their reasoning, they did not explore in vivo validation of key biochemical findings, which represents a limitation of the current study. While their justification is acknowledged, at least a preliminary exploratory effort could have been evaluated to reinforce the translational relevance of the study.
Finally, in line with the explanations outlined in the rebuttal, the Discussion section should mention the limits of MIRO1 reducer treatment.
Reviewer #2 (Public review):
Summary:
This study identifies the outer‑mitochondrial GTPase MIRO1 as a central regulator of vascular smooth muscle cell (VSMC) proliferation and neointima formation after carotid injury in vivo and PDGF-stimulation ex vivo. Using smooth muscle-specific knockout male mice, complementary in vitro murine and human VSMC cell models, and analyses of mitochondrial positioning, cristae architecture and respirometry, the authors provide solid evidence that MIRO1 couples mitochondrial motility with ATP production to meet the energetic demands of the G1/S cell cycle transition. However, a component of the metabolic analyses are suboptimal and would benefit from more robust methodologies. The work is valuable because it links mitochondrial dynamics to vascular remodelling and suggests MIRO1 as a therapeutic target for vasoproliferative diseases, although whether pharmacological targeting of MIRO1 in vivo can effectively reduce neointima after carotid injury has not been explored. This paper will be of interest to those working on VSMCs and mitochondrial biology.
Strengths:
The strength of the study lies in its comprehensive approach assessing the role of MIRO1 in VSMC proliferation in vivo, ex vivo and importantly in human cells. The subject provides mechanistic links between MIRO1-mediated regulation of mitochondrial mobility and optimal respiratory chain function to cell cycle progression and proliferation. Finally, the findings are potentially clinically relevant given the presence of MIRO1 in human atherosclerotic plaques and the available small molecule MIRO1.
Weaknesses:
(1) High-resolution respirometry (Oroboros) to determine mitochondrial ETC activity in permeabilized VSMCs would be informative.
(2) Therapeutic targeting of MIRO1 failed to prevent neointima formation, however, the technical difficulties of such an experiment is appreciated.
Reviewer #3 (Public review):
Summary:
This study addresses the role of MIRO1 in vascular smooth muscle cell proliferation, proposing a link between MIRO1 loss and altered growth due to disrupted mitochondrial dynamics and function. While the findings are useful for understanding the importance of mitochondrial positioning and function in this specific cell type, the main bioenergetic and mechanistic claims are not strongly supported.
Strengths:
This study focuses on an important regulatory protein, MIRO1, and its role in vascular smooth muscle cell (VSMC) proliferation, a relatively underexplored context.
This study explores the link between smooth muscle cell growth, mitochondrial dynamics, and bioenergetics, which is a significant area for both basic and translational biology.
The use of both in vivo and in vitro systems provides a useful experimental framework to interrogate MIRO1 function in this context.
Weaknesses:
The proposed link between MIRO1 and respiratory supercomplex biogenesis or function is not clearly defined.
Completeness and integration of mitochondrial assays is marginal, undermining the strength of the conclusions regarding oxidative phosphorylation.
We thank the reviewers for their thoughtful and constructive feedback. We appreciate their recognition of our work’s value and the improvements made in this revised version.
We are particularly grateful to Reviewer 3 for their detailed and insightful comments, which identified errors we (and other reviewers) had unfortunately overlooked. To address these concerns and ensure the manuscript meets the high standards of clarity and rigor we aim for, we have made additional corrections and refinements.
As part of this process, we conducted a thorough review of the original source files. This was especially important given that the project spanned from 2018 to 2025, and many co-authors have since left their previous positions.
We appreciate the opportunity to resubmit this manuscript and are confident that these updates fully address the concerns raised by the reviewer and the editorial team.
Reviewer #3 (Recommendations for the authors):
(1) I still do not see the data in WB 2G reflecting the quantification in 2H and 2I. Moreover, the authors state they performed 1 additional experiment, but it appears not to have been included in the analysis of 2H and 2I since the graphs remained the same from the last version of the manuscript.
We apologize for this oversight. The additional experiment has now been incorporated into the analysis for Figures 2H and 2I, and the graphs have been updated accordingly. While we had uploaded the new blot, we inadvertently forgot to update the analysis graphs. Thank you for bringing this to our attention.
(2) The authors talk several times about "supercomplexes 1 and 2" without testing their precise composition (there is a ton of literature about SC species in several mouse cell types, and separate BN-PAGE immunoblotting of individual MRC complexes would precisely define them in this context)
We agree with the reviewer that this is an important point. However, structural differences between supercomplexes were outside the scope of this paper, and we did not perform such analyses. That said, examining the precise composition of supercomplexes could be a valuable direction for future work.
(3) Steady-state levels of MRC subunits do not match the observations from BN-PAGE results. That might be potentially interpreted and explained by the possible accumulation of intermediates but this is not explored.
We appreciate the reviewer’s observation. There is indeed a strong possibility that differences in the expression of structural components of mitochondrial complexes exist between WT and Miro1 -/- cells. However, in this study, we chose to focus on assessing potential differences in the enzymatic activities of the complexes rather than examining their structural composition. Exploring the accumulation of intermediates and structural differences could be an interesting avenue for future investigations.
(4) Citrate synthase normalization of kinetic enzyme activities is claimed, yet it is not shown in any graph and no description of the method is provided.
We sincerely thank the reviewer for pointing out this discrepancy. Upon careful review, we realized that our statement regarding citrate synthase normalization of kinetic enzyme activities in the last revised version was made in error. This was a miscommunication between co-authors, and we did not perform citrate synthase normalization. Instead, the normalization was performed against protein concentration, determined by the BCA assay as described in the manuscript. We regret this oversight and appreciate the opportunity to clarify this.
(5) Complex I activity is still wrongfully described as NADPH oxidation in the methods
We corrected this error.
(6) The authors state 'Thank you for this comment. We believe this is due to a technical issue. Complex IV can be challenging to detect consistently, as its visibility is highly dependent on sample preparation conditions. In this specific case, we suspect that the buffer used during the isolation process may have influenced the detection of Complex IV'. I do not understand this, I find this justification insufficient and not substantiated by any experimental evidence. What buffer has been used for isolation? There are hundreds of protocols for isolation of intact mitochondria and MRC complexes. Also, DDM and digitonin are the gold-standard detergents for MRC complexes isolation and separation via BN-PAGE.
We thank the reviewer for raising this important point. We have revised the response to clarify the exact experimental conditions and to provide supporting data.
For BN-PAGE, mitochondrial fractions purified from cultured VSMCs or aortic tissue were prepared using a standard protocol (now explicitly detailed in the Methods). Briefly, mitochondria were resuspended in 6-aminocaproic acid (ACA) buffer containing 750 mM ACA, 50 mM Bis-Tris (pH 7.0), and protease inhibitors. Forty micrograms of mitochondrial protein were solubilized with 1.5% digitonin, using a final detergent-to-protein ratio of 8:1, and incubated on ice for 20 minutes prior to clarification by centrifugation at 16,000 g for 30 minutes at 4°C. Thus, consistent with established standards, digitonin—one of the gold-standard detergents for MRC complex solubilization and BN-PAGE—was used throughout.
Despite using these widely accepted conditions, we found that detection of fully assembled Complex IV by BN-PAGE was inconsistent, a limitation that has been reported by others and is known to be sensitive to mitochondrial source, tissue type, and solubilization efficiency. To address this directly and avoid over-interpretation, we assessed Complex IV integrity by examining core subunits. As shown in Figure 6—figure supplement 1 (panels B and C), expression levels of MTCO1 and MTCO2, both essential core components of Complex IV, do not differ significantly between WT and Miro1-/- cells, supporting the conclusion that Complex IV abundance is not altered.
We have revised the manuscript to clarify these methodological details and to explicitly state that conclusions regarding Complex IV are based on subunit analysis rather than BN-PAGE visualization alone.
(7) Complex V IGA also does not seem to reflect its quantification.
Thank you for highlighting this concern. To address it, we will include the numerical data alongside the figures to ensure clarity and alignment with our findings. We hope this will provide a more comprehensive understanding and resolve any ambiguity.
(8) Figure 6 supplement 1, the authors state 'we concentrated on ETC1 and 5 and performed experiments in cells after expression of MIRO1 WT and MIRO1 mutants'. I do not understand, what background is being used? what mutants are being expressed? all the figures refer to Miro1 -/- which is, according to standard genetic nomenclature, a loss-of-function allele (KO).
Thank you for your comment. To clarify, we first infected MIRO1fl/fl VSMCs with an adenovirus expressing the DNA recombinase Cre or a control adenovirus. Cells infected with the adenovirus expressing Cre are labeled as MIRO1-/- cells. In these MIRO1-/- cells, we then introduced MIRO1 wild type (WT) and MIRO1 mutants via adenoviral expression.
The mutants include one lacking the transmembrane domain (MIRO1-ΔTM), and another in which the two EF hands of MIRO1 were point-mutated (MIRO1-KK). MIRO1-WT is denoted as Ad WT, the mutant MIRO1-KK as Ad KK, and MIRO1-ΔTM as Ad ΔTM in the figures. We hope this explanation clarifies the experimental background and nomenclature used.
(9) Figure 6 supplement 1B, no normalization is provided (e.g. VDAC, TOM20 etc.). Interestingly, VDAC is then used to normalize the data in C-D-E-F-G. Also, why is MIRO1 detected in lane 4? Is the mutant stable or not? There is zero signal in A.
Thank you very much for pointing out that the immunoblot for VDAC1 was missing in Figure 6—Supplement 1B. This figure has been reviewed several times, and unfortunately, this error was not detected. We sincerely apologize for this oversight. We have now revised the figure to include the immunoblot for VDAC1 to address this issue.
Regarding the detection of MIRO1 in lane 4, we confirm that the "mutant" is not stable. To generate MIRO1 knockout cells, aortic smooth muscle cells from MIRO1fl/fl mice were isolated and cultured, followed by infection with an adenovirus expressing Cre. As these are primary cells and the deletion was induced by Cre expression, the recombination efficiency can vary, which is reflected in the variability observed in lanes 2 and 4 of the immunoblot.
(10) Why are COX4 levels so low in the 2nd replicate in 7A? the authors 'We also performed anti-VDAC immunoblots on the same membranes as alternative loading control (see image below)'. I could not find the image.
Thank you for your comment. The second pair of samples in Figure 7A is from a different preparation of mitochondria. In our experimental design, a control sample and a MIRO1 knockdown sample were processed side by side and run next to each other on the immunoblot.
Regarding the anti-VDAC immunoblot, the image was included in our response to reviewers during the previous revision, as we did not believe it altered the message conveyed by the COX4 blot. However, to ensure clarity and address your concern, we have now included the anti-VDAC immunoblot directly in the figure. We hope this addition resolves any ambiguity and provides further confidence in the data presented.
(11) The proposed interaction between MIRO1 and NDUFA9 is very difficult to reconcile, as the two proteins reside in distinct mitochondrial compartments. MIRO1 is anchored to the outer mitochondrial membrane (OMM), with its functional domains facing the cytosol, whereas NDUFA9 is a matrix-facing accessory subunit of mitochondrial Complex I, positioned at the interface between the N- and Q-modules.
We appreciate the reviewer’s comment and agree that MIRO1 and NDUFA9 occupy distinct mitochondrial compartments. MIRO1 is anchored to the outer mitochondrial membrane with cytosol-facing domains, whereas NDUFA9 is a matrix-facing accessory subunit of Complex I at the N/Q-module interface.
Our data do not suggest a stable, constitutive interaction within intact mitochondria. Rather, the observed association likely reflects an indirect, transient, or context-dependent interaction, potentially occurring during mitochondrial stress, remodeling, or turnover. Such associations may be mediated by multi-protein complexes spanning mitochondrial membranes, dynamic contact sites, or post-lysis interactions detected under experimental conditions. Increasing evidence supports functional coupling between outer mitochondrial membrane proteins and inner membrane or matrix pathways without direct physical binding.
Additional comments:
(12) All the raw data should be provided to the readers (uncropped and annotated WB, IHC images, numerical data with statistics applied).
We agree with the reviewer and appreciate the emphasis on transparency. In accordance with eLife submission requirements, we have provided all raw data. The Source Data files associated with each figure now include uncropped and annotated immunoblots, as well as the numerical source data for all quantified analyses.
During the compilation of these materials, we were unable to locate the original source files for Figure 2A. The control experiment depicted in the previous version, which demonstrates in vitro recombination, was performed in 2018. However, this experiment was repeated several times throughout the project. Therefore, to ensure the manuscript remains complete, we have replaced this panel with a representative immunoblot from a similar experiment. Additionally, during our review, we discovered a labeling error in Figure 3D and G. We have corrected these figures to ensure accuracy.
All source files have been provided and carefully labeled to facilitate independent evaluation.
-
-
www.biorxiv.org www.biorxiv.org
-
Reviewer #1 (Public review):
Summary:
In this work, the authors investigate the mechanisms of low-frequency synaptic depression at cerebellar parallel fiber to interneuron synapses using unitary recordings that allow direct quantification of synaptic vesicle release. They show that sparse stimulation can induce robust synaptic depression even in the absence of substantial vesicle consumption, and that this depressed state is rapidly reversed when stimulation frequency is increased. To account for these observations, the authors propose a model in which low-frequency depression reflects a redistribution of vesicles within the readily releasable pool, in particular, a reduction in docking site occupancy due to vesicle undocking.
Strengths:
I found the experimental work to be of high quality throughout. The use of simple synapse recordings to count individual vesicle release events is particularly powerful in this context and allows questions to be addressed that are difficult to approach with more conventional approaches. The demonstration that low-frequency depression can occur independently of prior vesicle release, together with the rapid recovery observed during high-frequency stimulation, places strong constraints on possible underlying mechanisms and represents a clear strength of the study.
The modeling framework is clearly laid out and helps organize a broad set of observations across stimulation frequencies. Several of the experimental tests appear well-motivated by the model, including the recovery train experiments, the analysis of failures, and the use of doublet stimulation. Taken together, the data provide a coherent phenomenological description of low-frequency depression and its relationship to vesicle availability within the readily releasable pool.
Weaknesses:
While the experimental results are strong, the manuscript would benefit from rebalancing the strength of the mechanistic conclusions drawn from the modeling in light of its limitations. The framework is clearly useful and provides a coherent interpretation of the data, but it is not uniquely constrained by the experimental observations, and alternative models or interpretations could plausibly account for the findings. The use of different model regimes concatenated across time, with substantially different parameter values, highlights the abstract nature of the approach. For these reasons, the model seems best presented as one plausible explanatory framework rather than a definitive biological mechanism. Clarifying the distinction between data-driven observations and model-based inferences would help readers assess which conclusions are strongly supported and which remain more speculative.
The interpretation of the Ca2+-related experiments would benefit from more cautious wording. The absence of detectable changes in presynaptic Ca2+ signals does not exclude more localized or subtle Ca2+-dependent mechanisms, and conclusions regarding Ca2+ independence should therefore be framed accordingly. In addition, while low-frequency depression is still observed at reduced extracellular Ca2+, these experiments appear less diagnostic of the specific model-derived mechanism emphasized elsewhere in the manuscript - namely, a selective reduction in docking-site occupancy - and should be discussed with appropriate qualification in the text.
Major points:
(1) Clarify and qualify mechanistic claims derived from the model.
Throughout the manuscript, changes in model parameters are at times described as if they directly reflected underlying physiological mechanisms. As a result, the conceptual distinction between experimentally observed phenomena, model-derived variables, and biological interpretation is not always clear. Several conclusions in the Results and Discussion are phrased as mechanistic statements, although they rest on assumptions intrinsic to the modeling framework. The authors should systematically review the text and explicitly distinguish between (i) experimentally observed changes in synaptic responses and (ii) inferences about vesicle docking states or transitions within the model.
In particular, statements implying that vesicle undocking is the mechanism underlying low-frequency depression should be rephrased to reflect that this is an interpretation within the proposed framework rather than a uniquely demonstrated biological process. For example, statements such as "Low-frequency depression is caused by synaptic vesicle undocking" should be replaced with formulations such as "Within the framework of our model, low-frequency depression is accounted for by a redistribution of synaptic vesicles away from docking sites" or "Our results are consistent with a model in which changes in vesicle docking-state occupancy contribute to low-frequency depression."
A particularly problematic example is the statement that "these experiments further confirm that LFD only involves a decrease in δ, without accompanying changes in ρ or IP size." Here, an experimentally defined phenomenon (LFD) is directly equated with changes in model-derived variables. Such statements should be revised to make clear that δ, ρ, and IP size are inferred quantities within the model, and that the experimental data are interpreted through this framework rather than directly confirming changes in these parameters. Similarly, over-generalizing statements such as "Undocking therefore represents the key mechanism controlling short-term depression across stimulation frequencies" should be softened to reflect that this conclusion emerges from the model rather than from direct experimental evidence.
(2) Address the biological interpretation of time-dependent model regimes.
The model relies on distinct parameter regimes applied at different time points, with some transitions effectively suppressed in certain regimes. While this approach captures the data well, its biological interpretation remains unclear. The authors should either (i) expand the discussion to outline plausible biological processes that could give rise to such regime changes (for example, calcium-dependent modulation of transition rates or activity-dependent changes in vesicle state stability), or (ii) more explicitly frame this aspect of the model as a descriptive abstraction rather than a mechanistic proposal. This further underscores the need to clearly separate the descriptive role of the model from claims about underlying biological mechanisms.
(3) Reframe conclusions drawn from calcium-related experiments.
The calcium imaging data demonstrate no detectable changes in the measured presynaptic calcium signals under the tested conditions, but they do not rule out that calcium signals contribute in ways undetectable by the assay. Conclusions should therefore be revised to reflect this limitation, avoiding statements that exclude a role for calcium-dependent mechanisms. Wording such as "we did not detect evidence for..." would be more appropriate than conclusions implying the absence of an effect.
Similarly, while low-frequency depression is still observed at reduced extracellular calcium (1.5 mM Ca²⁺), the specific mechanistic signature emphasized elsewhere in the manuscript - namely a selectively reduced first response during a high-frequency recovery train - is no longer apparent. These experiments should therefore be discussed as consistent with the proposed framework, but not as providing independent support for a selective reduction in docking-site occupancy. Explicitly acknowledging this limitation would improve clarity and avoid over-interpreting these data.
(4) Soften interpretations based on non-significant comparisons.
In several places, comparisons that do not reach statistical significance are used to argue for equivalence between conditions (for example, comparisons involving failure versus non-failure trials or different LFD conditions). These conclusions should be revised to emphasize the limits of statistical power and framed as a lack of evidence for a difference rather than evidence of independence.
-
Reviewer #3 (Public review):
Summary:
The manuscript builds on the observation that, at some synapses, low-frequency stimulation causes synaptic depression, which can be reversed by subsequent high-frequency stimulation. Such low-frequency depression (LFD) cannot be easily explained by the depletion of a single vesicle pool. Here, Silva and colleagues propose a model of activity-dependent vesicle trafficking to explain LFD at synapses between cerebellar granule cells and molecular layer interneurons.
Strengths:
Overall, LFD is interesting and worthy of examination, and the authors provide new experimental results that are of the high quality expected from this group.
Weaknesses:
The study proposes a novel model of vesicle trafficking that is not explained by known biological mechanisms, and the manuscript does not adequately compare or discuss alternative models.
I have several concerns about how the authors interpret the data. First, the manuscript's primary conceptual advance is the idea that LFD involves vesicle undocking, rather than depletion. However, most experiments were performed under conditions that promote vesicle depletion (3 mM extracellular Ca2+). When experiments were repeated in physiological Ca2+, there appeared to be little or no LFD (stats are not provided). Second, the RS/DS/DU/undocking model, though not outside the realm of possibility, is not readily explained by known mechanisms and is only loosely supported by experimental findings. Third, when simulating LFD, the authors do not compare alternative models and use inappropriate language to imply that a model fit represents the truth (e.g., "the finding of identical experimental and simulated values confirms that the undocking mechanism accounts for LFD"). Finally, the model is presented in an overly complicated manner. The sheer amount of terms and nomenclature makes the manuscript confusing and difficult to read. Overall, the manuscript would benefit from added experiments and more statistics, a better justification and evaluation of the model, and more nuanced language.
Major concerns:
(1) Most experiments were performed under conditions that exacerbate depletion
In order to attribute LFD to vesicle undocking rather than depletion, it is important to show LFD under conditions where depletion is minimal. As mentioned above, the authors only report significant LFD in elevated extracellular Ca2+. In a small number of experiments performed in more physiological Ca2+ (1.5 mM), there is no depression after a single stimulus, and it is not clear that there was statistically significant depression during a low-frequency train. Several studies cited in support of LFD share this problem:
• Abrahamsson et al., (2007) recorded from Schaffer collaterals in 4 mM Ca, 3-4X physiological Ca2+.
• Doussau et al., (2010) recorded from aplysia synapses in 3X Ca compared to seawater.
• Rudolph et al., (2011) is cited as an example of LFD. However, this study performed experiments at high release probability cerebellar climbing fibers, and reported depression that increased monotonically with
stimulation frequency, so it does not resemble the phenomenon studied in this paper. Lin et al., (2022) also largely describe monotonic depression at the calyx.
The authors note that their results differ from those of Atluri and Regehr, but do not mention that a possible reason for the difference is the increased release probability in their experiments.
The authors should provide statistics for the data obtained in 1.5 mM Ca, and discuss why LFD is increased in conditions that also elevate vesicle release probability.
(2) Lack of biological mechanisms supporting the model
The model is presented without compelling biological support. The evidence in support of vesicle undocking comes from experiments by the Watanabe lab, which showed fewer-than-expected docked vesicles under EM when cultured synapses were stimulated immediately prior to high-pressure freezing. Kusick et al were careful to note that these vesicles may have been lost to fusion.
The putative undocking Kusick describes is immediate (< 5 ms after stimulation), and was not shown to be Ca2+ sensitive. This manuscript describes "calcium-dependent undocking" that proceeds from 10 ms - 200 ms. Multiple studies from the Watanabe lab show that a single stimulus lowers the number of docked vesicles, and subsequently, there is a transient redocking of vesicles that can be blocked by EGTA or Syt7 knockout.
I also question the rationale for the authors' model that 2 vesicles are coupled in series to a single release site. Previous papers from this lab cited EM studies from frog and neuromuscular that showed filamentous connections between vesicles (do these synapses show LFD?). Here, the authors primarily cite their previous models to support their arguments. I encourage them to continue searching for ultrastructural evidence for 2-vesicle-docking-units and to cite such studies.
(3) Comparison to other vesicle models
The authors use overly assertive language to suggest that the model proves a mechanism. "Altogether, these results indicate that the slow phase of LFD ... reflects a δ decrease without significant changes in pr, in ρ or in IP size". Simulating data does not conclusively "indicate" the underlying mechanism, but the authors could state their data can be "explained by a model where..".
However, LFD does not require activity-dependent undocking. Instead, the phenomenon has been explained by high-release probability, paired with an activity-dependent increase in either docking or release probability (Chiu and Carter, 2024; Doussau et al., 2017). Does the new model do a better job of replicating some facet of the data? If multiple models can explain the same data, how can we determine which model is correct? The "Alternative Presynaptic Depression Mechanisms" should be expanded to discuss these issues.
-
Author response:
Public Reviews:
Reviewer #1 (Public review):
Summary:
In this work, the authors investigate the mechanisms of low-frequency synaptic depression at cerebellar parallel fiber to interneuron synapses using unitary recordings that allow direct quantification of synaptic vesicle release. They show that sparse stimulation can induce robust synaptic depression even in the absence of substantial vesicle consumption, and that this depressed state is rapidly reversed when stimulation frequency is increased. To account for these observations, the authors propose a model in which low-frequency depression reflects a redistribution of vesicles within the readily releasable pool, in particular, a reduction in docking site occupancy due to vesicle undocking.
Strengths:
I found the experimental work to be of high quality throughout. The use of simple synapse recordings to count individual vesicle release events is particularly powerful in this context and allows questions to be addressed that are difficult to approach with more conventional approaches. The demonstration that low-frequency depression can occur independently of prior vesicle release, together with the rapid recovery observed during high-frequency stimulation, places strong constraints on possible underlying mechanisms and represents a clear strength of the study.
The modelling framework is clearly laid out and helps organize a broad set of observations across stimulation frequencies. Several of the experimental tests appear well-motivated by the model, including the recovery train experiments, the analysis of failures, and the use of doublet stimulation. Taken together, the data provide a coherent phenomenological description of low-frequency depression and its relationship to vesicle availability within the readily releasable pool.
We thank the Reviewer for his positive assessment of our work.
Weaknesses:
While the experimental results are strong, the manuscript would benefit from rebalancing the strength of the mechanistic conclusions drawn from the modelling in light of its limitations. The framework is clearly useful and provides a coherent interpretation of the data, but it is not uniquely constrained by the experimental observations, and alternative models or interpretations could plausibly account for the findings. The use of different model regimes concatenated across time, with substantially different parameter values, highlights the abstract nature of the approach. For these reasons, the model seems best presented as one plausible explanatory framework rather than a definitive biological mechanism. Clarifying the distinction between data-driven observations and model-based inferences would help readers assess which conclusions are strongly supported and which remain more speculative.
The interpretation of the Ca<sup>2+</sup>-related experiments would benefit from more cautious wording. The absence of detectable changes in presynaptic Ca<sup>2+</sup> signals does not exclude more localized or subtle Ca<sup>2+</sup>-dependent mechanisms, and conclusions regarding Ca<sup>2+</sup> independence should therefore be framed accordingly. In addition, while low-frequency depression is still observed at reduced extracellular Ca<sup>2+</sup>, these experiments appear less diagnostic of the specific model-derived mechanism emphasized elsewhere in the manuscript - namely, a selective reduction in docking-site occupancy - and should be discussed with appropriate qualification in the text.
Concerning Ca<sup>2+</sup> signals, the Reviewer is right. While we found no change in Ca<sup>2+</sup> signalling apart from a slow Ca<sup>2+</sup> accumulation during long trains at 1 Hz, the possibility of an undetected change cannot be excluded. We have added a word of caution in this direction on p. 11. Concerning the 1.5 mM Ca<sup>2+</sup> experiments, the Reviewer presumably alludes to the first recovery train (yellow) point in Supplementary Fig. 2C. This is also the last point (s11) of the slow train at 0.5 Hz because no delay at all was interposed between the slow train and the recovery train. We have now included one more experiment (with a present total number n = 6), and we have corrected Fig. S2C accordingly. In the new version the depression measured for s4-s10 vs s1 during the 0.5 Hz trains is 0.69 +/- 0.05 (p = 0.00058, paired one-tail t-test). The ratio of the s1 value of the recovery train compared to control s1 is 0.83 +/- 0.08 (p = 0.028, paired one-tail t-test).
Major points:
(1) Clarify and qualify mechanistic claims derived from the model.
Throughout the manuscript, changes in model parameters are at times described as if they directly reflected underlying physiological mechanisms. As a result, the conceptual distinction between experimentally observed phenomena, model-derived variables, and biological interpretation is not always clear. Several conclusions in the Results and Discussion are phrased as mechanistic statements, although they rest on assumptions intrinsic to the modelling framework. The authors should systematically review the text and explicitly distinguish between (i) experimentally observed changes in synaptic responses and (ii) inferences about vesicle docking states or transitions within the model.
In particular, statements implying that vesicle undocking is the mechanism underlying low-frequency depression should be rephrased to reflect that this is an interpretation within the proposed framework rather than a uniquely demonstrated biological process. For example, statements such as "Low-frequency depression is caused by synaptic vesicle undocking" should be replaced with formulations such as "Within the framework of our model, low-frequency depression is accounted for by a redistribution of synaptic vesicles away from docking sites" or "Our results are consistent with a model in which changes in vesicle docking-state occupancy contribute to low-frequency depression."
A particularly problematic example is the statement that "these experiments further confirm that LFD only involves a decrease in δ, without accompanying changes in ρ or IP size." Here, an experimentally defined phenomenon (LFD) is directly equated with changes in model-derived variables. Such statements should be revised to make clear that δ, ρ, and IP size are inferred quantities within the model, and that the experimental data are interpreted through this framework rather than directly confirming changes in these parameters. Similarly, overgeneralizing statements such as "Undocking therefore represents the key mechanism controlling short-term depression across stimulation frequencies" should be softened to reflect that this conclusion emerges from the model rather than from direct experimental evidence.
As suggested, we clarify the distinction in the revised version between experimental data and modelling, and we refrain from making definitive statements on underlying cellular mechanisms.
(2) Address the biological interpretation of time-dependent model regimes.
The model relies on distinct parameter regimes applied at different time points, with some transitions effectively suppressed in certain regimes. While this approach captures the data well, its biological interpretation remains unclear. The authors should either (i) expand the discussion to outline plausible biological processes that could give rise to such regime changes (for example, calcium-dependent modulation of transition rates or activity-dependent changes in vesicle state stability), or (ii) more explicitly frame this aspect of the model as a descriptive abstraction rather than a mechanistic proposal. This further underscores the need to clearly separate the descriptive role of the model from claims about underlying biological mechanisms.
We thank the Reviewer for drawing our attention to this important point. Below 10 ms, rate constants are largely determined by the large amplitude, fast decaying Ca<sup>2+</sup> signal occurring near voltage-dependent Ca<sup>2+</sup> channels (‘Ca<sup>2+</sup> nanodomain’). After 10 ms, the rate constants depend on the low amplitude, slowly decaying Ca<sup>2+</sup> signals averaged over the entire varicosity (‘volume-averaged Ca<sup>2+</sup>’). We explain this better in the revised version (Materials and Methods, p. 21).
(3) Reframe conclusions drawn from calcium-related experiments.
The calcium imaging data demonstrate no detectable changes in the measured presynaptic calcium signals under the tested conditions, but they do not rule out that calcium signals contribute in ways undetectable by the assay. Conclusions should therefore be revised to reflect this limitation, avoiding statements that exclude a role for calcium-dependent mechanisms. Wording such as "we did not detect evidence for..." would be more appropriate than conclusions implying the absence of an effect.
Similarly, while low-frequency depression is still observed at reduced extracellular calcium (1.5 mM Ca<sup>2+</sup>), the specific mechanistic signature emphasized elsewhere in the manuscript - namely a selectively reduced first response during a high-frequency recovery train - is no longer apparent. These experiments should therefore be discussed as consistent with the proposed framework, but not as providing independent support for a selective reduction in docking-site occupancy. Explicitly acknowledging this limitation would improve clarity and avoid overinterpreting these data.
This has been discussed above (‘weaknesses’).
(4) Soften interpretations based on non-significant comparisons.
In several places, comparisons that do not reach statistical significance are used to argue for equivalence between conditions (for example, comparisons involving failure versus non-failure trials or different LFD conditions). These conclusions should be revised to emphasize the limits of statistical power and framed as a lack of evidence for a difference rather than evidence of independence.
We have attended this point in the revised version.
Reviewer #2 (Public review):
Summary:
Silva and co-workers exploit their previously established methods of analyzing release events at single parallel fiber to molecular layer interneuron synapses. They observed synaptic depression at low transmission frequencies (< 5 Hz), which rapidly recovers during high-frequency transmission. Analysis of the time course of low-frequency depression revealed an initial rapid and a slow linearly increasing time course. Strikingly, the initial depression occurred even in the absence of preceding release, arguing against vesicle depletion as the underlying mechanism.
Strengths:
The main strength of the study is the careful demonstration of an interesting synaptic phenomenon challenging the classical vesicle-centered interpretation of synaptic depression.
We thank the Reviewer for his positive assessment of our work.
Weaknesses:
No major weaknesses were identified by this reviewer.
The finding of release-independent synaptic depression is important and would have widespread implications. Therefore, some more analyses to increase the confidence in these findings could be performed.
My concern is whether rundown could explain the findings. If the rate of failures in s1 increases and at the same time the amplitude decreases during the experiments, an apparent depression in s2 could arise. The Supplementary Figure 5A addresses run-down, but the figure is not easy to understand, and, as far as I understood, it does not address the question of whether the release-independent depression could be caused by a rundown. To address this, the analysis of Figure 5 could be repeated by investigating the failure rate and amplitude separately or by analyzing the 1st and 2nd half of the recordings separately.
The Reviewer makes a very important point that had escaped our attention. If the responses were declining over the course of an experiment, near the end of the recordings, a high proportion of failures would be associated with a weak response to the second AP. This could distort the relation between initial failures and amount of LFD, perhaps to the point of indicating LFD after failures when there were none. As suggested by the Reviewer, we tested this possibility by examining the stability of the synaptic responses during experiments. We found a mean s<sub>1</sub> value of 0.87 ± 0.13 for the first half of the experiments used in Fig. 5, and of 1.10 ± 0.17 for the second half (p > 0.05, n = 10). This analysis shows that there was no rundown during these experiments. We show in Author response image 1 a plot of s1 as a function of the number of experiments. These plots do not suggest any artefactual correlation between failures, mean s1, and rundown.
Author response image 1.
Plot of s1 as a function of train number for the experiments of Fig. 5. In response to a request of Reviewer 2, this figure illustrates the evolution of s1 values as a function of train number for the experiments used to produce Figure 5. In each experiment, about 20 s1 values were obtained at two ISIs (either 10 ms and 500 ms, or 800 ms and 1600 ms). The figure shows two examples of s1 values as a function of train number (these values fluctuate widely between 0 and 3), and the average across cells and ISI values. There is no indication of a rundown of S1 values as a function of train number
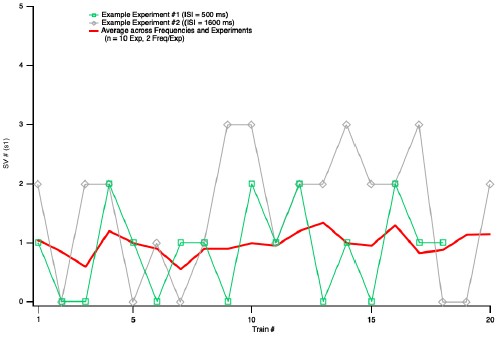
Reviewer #3 (Public review):
Summary:
The manuscript builds on the observation that, at some synapses, low-frequency stimulation causes synaptic depression, which can be reversed by subsequent high-frequency stimulation. Such low-frequency depression (LFD) cannot be easily explained by the depletion of a single vesicle pool. Here, Silva and colleagues propose a model of activity-dependent vesicle trafficking to explain LFD at synapses between cerebellar granule cells and molecular layer interneurons.
Strengths:
Overall, LFD is interesting and worthy of examination, and the authors provide new experimental results that are of the high quality expected from this group.
Weaknesses:
The study proposes a novel model of vesicle trafficking that is not explained by known biological mechanisms, and the manuscript does not adequately compare or discuss alternative models.
I have several concerns about how the authors interpret the data. First, the manuscript's primary conceptual advance is the idea that LFD involves vesicle undocking, rather than depletion. However, most experiments were performed under conditions that promote vesicle depletion (3 mM extracellular Ca<sup>2+</sup>). When experiments were repeated in physiological Ca<sup>2+</sup>, there appeared to be little or no LFD (stats are not provided). Second, the RS/DS/DU/undocking model, though not outside the realm of possibility, is not readily explained by known mechanisms and is only loosely supported by experimental findings. Third, when simulating LFD, the authors do not compare alternative models and use inappropriate language to imply that a model fit represents the truth (e.g., "the finding of identical experimental and simulated values confirms that the undocking mechanism accounts for LFD"). Finally, the model is presented in an overly complicated manner. The sheer amount of terms and nomenclature makes the manuscript confusing and difficult to read. Overall, the manuscript would benefit from added experiments and more statistics, a better justification and evaluation of the model, and more nuanced language.
We respectfully disagree with these sweeping criticisms, as described in more detail below.
Major concerns:
(1) Most experiments were performed under conditions that exacerbate depletion
In order to attribute LFD to vesicle undocking rather than depletion, it is important to show LFD under conditions where depletion is minimal. As mentioned above, the authors only report significant LFD in elevated extracellular Ca<sup>2+</sup>. In a small number of experiments performed in more physiological Ca<sup>2+</sup> (1.5 mM), there is no depression after a single stimulus, and it is not clear that there was statistically significant depression during a low-frequency train. Several studies cited in support of LFD share this problem:
- Abrahamsson et al., (2007) recorded from Schaffer collaterals in 4 mM Ca, 3-4X physiological Ca<sup>2+</sup>.
- Doussau et al., (2010) recorded from Aplysia synapses in 3X Ca compared to seawater.
- Rudolph et al., (2011) is cited as an example of LFD. However, this study performed experiments at high release probability cerebellar climbing fibers, and reported depression that increased monotonically with stimulation frequency, so it does not resemble the phenomenon studied in this paper. Lin et al., (2022) also largely describe monotonic depression at the calyx.
The Reviewer suggests that LFD may only occur under non-physiological conditions, if the release probability has been increased by artificially elevating the extracellular Ca<sup>2+</sup>. The implication is that LFD is at best a curiosity with little or no significance for brain signalling. We disagree with this point of view for several reasons.
Concerning the statement ‘In order to attribute LFD to vesicle undocking rather than depletion, it is important to show LFD under conditions where depletion is minimal’: This is the purpose of the analysis shown in Fig. 5.
The statement ‘the authors only report significant LFD in elevated extracellular Ca<sup>2+</sup>’ is inaccurate. Fig. S2C shows a clear LFD in 1.5 mM Ca<sup>2+</sup>, as acknowledged by Reviewer 1 (‘low-frequency depression is still observed at reduced extracellular Ca<sup>2+</sup>’). However, we failed to provide a p-value for the depression in the initial version of the paper (p = 0.004, n = 5, with this data set; paired t-test, one-tailed). In the revised version, we document the 1.5 mM results more extensively, including the incorporation of the results of an additional experiment, and an explicit statistical analysis of the data (p = 0.00058, n = 6; paired t-test, one-tailed).
Concerning the statement ‘there is no depression after a single stimulus’: We find that the onset kinetics of LFD is slower in 1.5 Ca<sup>2+</sup> than in 3 Ca<sup>2+</sup> (respectively 1.8 ISI and 0.51 ISI, Fig. 2C and Fig. S2C). This explains that the PPR is not significantly <1 in 1.5 Ca<sup>2+</sup> without implying any weakening of extent of LFD at steady state.
As explained in the manuscript (p. 5), in a previous work, we developed a method to ascribe changes in SV pools, within the RS/DS model, with specific modifications of s1, s2 and s5-s8 during test 100 Hz trains (Tran et al., 2022). This method was developed in 3 mM Ca<sup>2+</sup> conditions, and for this reason, we performed most experiments for the present work in 3 mM Ca<sup>2+</sup>.
Chiu and Carter (2024) demonstrated LFD in neocortical synapses; they performed their study in 1.2 mM Ca<sup>2+</sup>, not in elevated Ca<sup>2+</sup>.
Rudolph et al. (2011) showed low frequency depression not only in elevated external Ca<sup>2+</sup>, but also in 0.5 mM Ca<sup>2+</sup>. While Rudolph et al. (2011) did not make an explicit link between their observations and LFD, there is no reason to doubt that these observations are an example of LFD. They showed a biphasic depression when switching the stimulation frequency from 0.05 Hz to 2 Hz. In one of the founding papers of LFD, Doussau et al. (2010) describe a biphasic depression when switching the stimulation frequency from 0.025 Hz to 1 Hz; the Fig. 1 of the two papers (Rudolph 2011 and Doussau 2010) are strikingly similar.
Lin et al. (2022) would probably not agree with the statement that the depression at the calyx is ‘largely monotonic’, as they stress the finding of quasi-constant depression between 5 and 50 Hz.
The authors note that their results differ from those of Atluri and Regehr, but do not mention that a possible reason for the difference is the increased release probability in their experiments.
In fact, we clearly listed the difference in external Ca<sup>2+</sup> as a likely source of the discrepancy by saying ‘This discrepancy presumably stems from differences in experimental conditions (room temperature, stimulation of multiple presynaptic PFs and 2 mM external Ca<sup>2+</sup> concentration in the previous work, vs. near-physiological temperature, single presynaptic stimulation and 3 mM external Ca<sup>2+</sup> here)’.
The authors should provide statistics for the data obtained in 1.5 mM Ca, and discuss why LFD is increased in conditions that also elevate vesicle release probability.
See our comments above: the revised version includes the requested statistics. On p. 6 of the manuscript, we do provide an explanation for the apparent lack of LFD at 1.5 Ca<sup>2+</sup> and 2 Hz, namely a superimposition of LFD with facilitation. At 1.5 Ca<sup>2+</sup> and 0.5 Hz, our LFD numbers are not weaker than at 3 mM Ca<sup>2+</sup> and 0.5 Hz of 1 Hz.
Altogether, it is correct that many LFD experiments have been carried out in high release probability synapses, and/or under conditions of elevated Ca<sup>2+</sup>. However, the reasons underlying these choices are diverse (in our case, to build on the previous SV pool analysis developed in Tran et al. 2022 in 3 Ca<sup>2+</sup> conditions) and do not imply a limitation to the phenomenon. LFD is present in physiological conditions for low-to-moderate release probability synapses (as shown in our work), and altogether, there is no reason to dismiss LFD as nonphysiological.
(2) Lack of biological mechanisms supporting the model
The model is presented without compelling biological support. The evidence in support of vesicle undocking comes from experiments by the Watanabe lab, which showed fewerthanexpected docked vesicles under EM when cultured synapses were stimulated immediately prior to high-pressure freezing. Kusick et al were careful to note that these vesicles may have been lost to fusion.
The Watanabe lab showed an SV deficit at docking sites at times ranging from about 100 ms to several seconds (Kusick et al., 2020, their Fig. 5E). This corresponds to the ISI values where we see paired-pulse depression. In their Summary, Kusick et al. raise the possibility of SV fusion as an alternative to undocking at the 100 ms time point. But, the same issue had previously been considered in Miki et al., 2018 with other techniques (their Fig. 2d), where it was shown that the SV deficit seen in paired-pulse experiments could not be explained by fusion. This leaves undocking as the most likely explanation, at least in our preparation. We have added a new paragraph on p. 14 to clarify this point.
The putative undocking Kusick describes is immediate (< 5 ms after stimulation), and it was not shown to be Ca<sup>2+</sup> sensitive. This manuscript describes "calcium-dependent undocking" that proceeds from 10 ms - 200 ms. Multiple studies from the Watanabe lab show that a single stimulus lowers the number of docked vesicles, and subsequently, there is a transient redocking of vesicles that can be blocked by EGTA or Syt7 knockout.
This is not an accurate description of the Kusick results or of our results. In the Kusick paper, the SV deficit seen at <5 ms after stimulation is attributed to exocytosis, not to undocking. Clearly, it is Ca<sup>2+</sup> dependent. Our manuscript describes potential calcium-dependent undocking not during the time 10 ms- 150 ms, during which our undocking rate is assumed to be calcium-independent, but starting at 150 ms, and lasting a few hundred ms thereafter.
I also question the rationale for the authors' model that 2 vesicles are coupled in series to a single release site. Previous papers from this lab cited EM studies from frog and neuromuscular that showed filamentous connections between vesicles (do these synapses show LFD?). Here, the authors primarily cite their previous models to support their arguments. I encourage them to continue searching for ultrastructural evidence for 2-vesicle-docking-units and to cite such studies.
It is important to remember that our sequential two-step model was not based on EM data, but on a series of functional data including variance-mean analysis of summed SV release numbers; covariance analysis among subsequent SV release numbers; analysis of release latencies as a function of stimulus number during an AP train; analysis of SV release numbers under conditions of very high release probability. We note that the phenomenon of Ca<sup>2+</sup>-dependent docking that we proposed based on these observations has been consistent with flash-and-freeze or zap-and-freeze results from several laboratories. Concerning potential filamentous connections between SVs and the AZ plasma membrane at a distance of several 10s of nm, this has been seen not only in frog or mice neuromuscular junctions, but also at brain synapses (ex: Siksou et al., Journal of Neuroscience 2007; Cole et al., Journal of Neuroscience 2016; Fernandez-Busnadiego, Journal of Cell Biology 2010; 2013).
(3) Comparison to other vesicle models
The authors use overly assertive language to suggest that the model proves a mechanism. "Altogether, these results indicate that the slow phase of LFD ... reflects a δ decrease without significant changes in pr, in ρ or in IP size". Simulating data does not conclusively "indicate" the underlying mechanism, but the authors could state their data can be "explained by a model where..".
Please see our response above to a similar point by Reviewer 1.
However, LFD does not require activity-dependent undocking. Instead, the phenomenon has been explained by high-release probability, paired with an activity-dependent increase in either docking or release probability (Chiu and Carter, 2024; Doussau et al., 2017). Does the new model do a better job of replicating some facet of the data? If multiple models can explain the same data, how can we determine which model is correct? The "Alternative Presynaptic Depression Mechanisms" should be expanded to discuss these issues.
We could not find statements in the Chiu and Carter paper or in the Doussau et al. paper explaining LFD ‘by high-release probability, paired with an activity-dependent increase in either docking or release probability’. As far as we can see, Chiu and Carter do not propose any specific mechanism for LFD, beyond saying that depression and facilitation must be separate. Doussau et al. (their Fig. 6) clearly frame their interpretation in a sequential two-step model. As in the preceding Miki et al. paper (which they cite extensively), they assume a rapid (a few ms), Ca-dependent transition between their ‘reluctant pool’ and their ‘fully-releasable pool’, respectively homologous to RS and DS. Thus, the Doussau et al. interpretation is close to that presented in our present work, even though significant differences exist. An important difference is that Doussau et al. did not use simple synapses, so that they did not have access to key synaptic parameters such as the number of docking sites or the release probability per docking site. Consequently, the model in Doussau et al. does not have the same level of detail as ours. The revised version explains better the differences and similarity between the models of Doussau et al. and that exposed in our work (new paragraph on p. 14).
-
-
www.biorxiv.org www.biorxiv.org
-
Reviewer #1 (Public review):
Sensory hair cells of the inner ear convert mechanical sound vibrations into electrical signals through mechano-electrical transduction (MET), a process critically dependent on the specialized organization and lipid composition of their plasma membrane. Although the protein components of the MET complex are relatively well characterized, the role of the lipid environment remains poorly understood and often overlooked. Recent discoveries that core MET proteins TMC1 and TMC2 function as lipid scramblases, disrupting membrane lipid asymmetry, expose a significant gap in our understanding of how lipid homeostasis is regulated in hair cells and how membrane dynamics influence MET function.
In this study, the authors address this gap by identifying the P4-ATPase ATP8B1 and its chaperone TMEM30B as essential regulators of membrane lipid asymmetry in outer hair cells. They also generated HA-tagged knock-in mice to precisely localize the P4-ATPase ATP8B1 and its chaperone TMEM30B within outer hair cells, demonstrating their enrichment in stereocilia, and convincingly demonstrate that loss of these proteins causes phosphatidylserine externalization, hair cell degeneration, and hearing loss in mouse models, phenocopying defects observed in TMC1 mutant mice with constitutive scrambling activity. While these findings establish lipid flippase pathways as critical for hair cell survival and auditory function, they also raise important questions about the precise mechanisms linking lipid asymmetry disruption to MET dysfunction and hair cell pathology.
Overall, the data convincingly support the conclusion that ATP8B1-TMEM30B flippase activity is required to maintain stereocilia lipid asymmetry and auditory function. The study substantially advances understanding of how lipid homeostasis intersects with MET. However, several points require clarification to ensure that localization claims and mechanistic interpretations are fully supported by the presented data.
Revisions considered essential by this reviewer are:
(1) Figure 1D.<br /> The authors should clarify how the qPCR data were normalized and specify the reference (housekeeping) genes used. This information is necessary to evaluate the robustness and comparability of the gene expression data.
(2) Figure 1F.<br /> The lack of F-actin staining at the hair cell base raises the possibility that the permeabilization conditions may have limited antibody access to certain membrane regions. This is especially important given that the authors used a gentle permeabilization agent such as saponin to preserve membrane integrity. Because the authors conclude that ATP8B1 and TMEM30B are localized "almost exclusively to OHC bundles and the apical membrane, with minimal staining in the remaining plasma membrane," (line 128). Including co-labeling with a plasma membrane marker or more comprehensive F-actin visualization of lateral and basal regions would help ensure that the restricted localization is biological rather than technical. In the absence of such controls, the localization claim may be somewhat overstated and should be tempered accordingly.
(3) Figure 7B.<br /> Although quantification of ATP8B1-HA intensity at the bundle appears similar between WT and Cib2 KO samples, the representative image suggests that some bundles lack detectable labeling. To better capture phenotype variability, it would be helpful to include an additional quantification showing the fraction or number of bundles with detectable ATP8B1-HA signal in Cib2 KO mice.
(4) Lines 346-349.<br /> The manuscript suggests that IHCs lack stereocilia-enriched P4-ATPases. However, this conclusion is not directly supported by the presented data. The authors should either provide supporting localization or expression data for other P4-ATPases or soften the statement to indicate that no stereocilia-enriched P4-ATPases were detected under the conditions examined.
Recommendations:
(5) The authors convincingly demonstrate that TMEM30B loss results in ATP8B1 mislocalization. While not essential to the central conclusions, examining TMEM30B localization in ATP8B1 KO hair cells would clarify whether this interdependence is reciprocal, as described for other P4-ATPase-CDC50 complexes.
(6) Lines 359-374.<br /> The discussion of Annexin V labeling is careful and balanced. This paragraph would benefit from referencing other studies that showed minimal Annexin V labeling in healthy P6 organ of Corti, reinforcing that robust PS externalization in the present study is pathological rather than developmental.
(7) Lines 392-399.<br /> The proposed feedback model linking MET activity and ATP8B1-TMEM30B localization is compelling. The discussion could be strengthened by noting that in TMC1/2 double knockout hair cells, PS externalization is not observed, consistent with the idea that flippase activity becomes critical specifically when scrambling occurs. The mislocalization observed in Cib2 KO hair cells further supports the coupling between TMC-mediated scrambling and flippase-mediated membrane restoration.
-
Reviewer #2 (Public review):
Summary:
Prior work identified TMEM30B (knockout mice) as well as ATP8B1 (human genetics and mouse model), ATP8A2 (knockout mice), and ATP811A (human genetics) as relevant for hearing. The authors also reasoned that, given the recent discovery of TMC1 and TMC2's dual function as mechanotransduction channels of the inner ear and as lipid scramblases, a counterpart flippase should be in the sensory hair-cell stereocilia bundle where mechanotransduction happens. They use CRISPR/CAS to modify the endogenous mouse genes and add an HA tag at the N-terminus of the ATP8B1, ATP8A1, ATP8A2, and ATP11A proteins. Their experiments with these mice unambiguously localized ATP8B1 at the base of outer hair cell stereocilia bundles. Knockout of ATP8B1 results in loss of outer hair cells, deficient auditory function (ABR), and degeneration of outer hair cell stereocilia bundles. Similarly, hair cells from genetically modified mice with endogenous HA-tagged TMEM30B proteins show localization of this protein to outer hair cell stereocilia bundles. TMEM30B knock-out mice phenocopy the ATP8B1 knock-out model. Interestingly, the authors show that annexing V staining precedes hair cell loss in ATP8B1 and TMEM30B knockout mice and that proper localization of these proteins is lost in mice that lack CIB2, a protein essential for hair cell mechanotransduction.
Strengths:
(1) Use of knock-in HA-tagged proteins, rather than antibody staining, to unambiguously localize ATP8B1 and TMEM30B.
(2) Systematic characterization of auditory function (ABR), hair cell loss, and hair-cell stereocilia bundle morphology.
(3) Advances our understanding of the role played by lipid homeostasis in auditory function.
(4) Reports on mouse models that will be helpful to further understand the mechanistic role played by ATP8B1 and TMEM30B in normal hearing and hereditary deafness.
Weaknesses:
(1) Are the HA tags causing any functional issues? Function and localization of tagged proteins can sometimes be compromised. It would be good to know, for each knock-in model (TMEM30B, ATP8B1, ATP8A1, ATP8A2, and ATP11A ), whether the HA-tagged protein is causing any issues with the mice and particularly with hearing (ABRs). Are these mice normal? Can they hear? These data are missing.
(2) Following on the point above, is it possible that ATP8B1-HA is well localized, but localization for the other three flippases (ATP8A1-HA, ATP8A2-HA, and ATP11A-HA) is compromised by the tag? Is this potential mislocalization causing any functional phenotypes? (ABRs of point 1). I find it surprising that there are flippases only in outer hair cells, and only formed by ATP8B1. A possible explanation is that the tag is interfering with trafficking. If so, there should be a phenotype (ABRs), although this might be masked by redundancy among these flippases or caused by systemic issues (admittedly difficult to sort out). Given that this manuscript will likely become foundational, and that there is evidence that at least two of the other flippases are involved in hearing loss, it would be good to provide more information about the mice and HA-tagged proteins in the other knock-ins (ATP8A1-HA, ATP8A2-HA, and ATP11A-HA). Depending on the data available for the knock-ins, the authors may want to discuss these scenarios and soften the statement indicating that inner-hair cells may lack flippase activity altogether.
(3) Expression of ATP8B1 at P0 (Figure 1D), when there should not be protein in outer hair cells yet, seems high. Does this mean that other cells in the cochlea also express ATP8B1? Is this a concern?
(4) Fluorescence scales in Figure 6 B and D and Figure 7 B and D are very different. So are the values for WT. One would expect that the WT would be similar in all cases (at least within the same compartments), given that the methods section indicates that "All images were collected using identical acquisition parameters, including zoom and laser power, across genotypes". If WT shows such variability, how can we compare?
-
Author Response:
Summary of Planned Revisions:
We will clarify the qPCR methodology and interpretation to address potential misunderstandings.
We will assess hearing in the generated HA-tagged mouse lines and, where appropriate, include a properly powered ABR analysis in the revised manuscript.
We will address concerns regarding the z-stack in Figure 1f.
We will include additional quantification for Figure 7B to strengthen the analysis.
We will revise the relevant statement to read: “No IHC stereocilia-enriched P4-ATPases were detected under the conditions examined.”
While we appreciate the suggestion to examine TMEM30B localization on the ATP8B1 KO background, this is not feasible within a reasonable timeframe; we will clarify this limitation in the manuscript.
We will incorporate relevant prior work (e.g., George and Ricci, 2026) demonstrating minimal Annexin V labeling prior to P6 and lack of PS externalization in TMC1/2 double knockout models.
We will clarify that hearing thresholds for TMEM30B-HA and ATP8B1-HA lines will be addressed in this study, while additional HA-tagged flippase lines (ATP8A1, ATP8A2, ATP11A) are part of ongoing work to be reported separately.
We will soften statements regarding HA-tag insertion and clarify that, to our knowledge, localization and function are not disrupted, while acknowledging this as a potential limitation.
We will revise the Methods section to clarify differences in fluorescence measurements across experiments.
In addition to the experiments in response to reviewer’s suggestions, we will add the following data that we have generated while the paper was in review:
Distortion product otoacoustic emission (DPOAEs) of the Atp8b1 KO and Tmem30b KO mice. Consistent with OHC function, their DPOAEs thresholds were elevated.
Public Reviews:
Reviewer #1 (Public review):
(1) Figure1D.
The authors should clarify how the qPCR data were normalized and specify the reference (housekeeping) genes used. This information is necessary to evaluate the robustness and comparability of the gene expression data.
We thank the reviewer for this comment. qPCR data were normalized to GAPDH as the reference (housekeeping) gene. We will clarify this in the Methods section to ensure transparency and reproducibility.
(2) Figure 1F.
The lack of F-actin staining at the hair cell base raises the possibility that the permeabilization conditions may have limited antibody access to certain membrane regions. This is especially important given that the authors used a gentle permeabilization agent such as saponin to preserve membrane integrity. Because the authors conclude that ATP8B1 and TMEM30B are localized "almost exclusively to OHC bundles and the apical membrane, with minimal staining in the remaining plasma membrane," (line 128). Including co-labeling with a plasma membrane marker or more comprehensive F-actin visualization of lateral and basal regions would help ensure that the restricted localization is biological rather than technical. In the absence of such controls, the localization claim may be somewhat overstated and should be tempered accordingly.
We appreciate this important point. The image shown represents a single z-slice from a larger stack, and the hair cell body lies outside the plane of this section. To clarify this, we will revise the figure presentation. Specifically, we can provide the full z-stack (already available via OSF) and/or replace the image with a resliced whole-mount view to better visualize the full cellular context.
In terms of the possibility that the lack of staining in the hair cell’s plasma membrane might be due to insufficient antibody penetrance, we routinely perform Prestin (located in OHC plasma membrane) staining after saponin-mediated permeabilization and have never experienced antibody accessibility issues. Nevertheless, we will perform co-labeling for Prestin and include in the new submission.
(3) Figure 7B.
Although quantification of ATP8B1-HA intensity at the bundle appears similar between WT and Cib2 KO samples, the representative image suggests that some bundles lack detectable labeling. To better capture phenotype variability, it would be helpful to include an additional quantification showing the fraction or number of bundles with detectable ATP8B1-HA signal in Cib2 KO mice.
We thank the reviewer for this suggestion. To better capture variability, we will include an additional quantification measuring the fraction of hair cell bundles with detectable ATP8B1-HA and TMEM30B-HA signal per field of view. This analysis will complement the existing intensity-based quantification.
(4) Lines 346-349
The manuscript suggests that IHCs lack stereocilia-enriched P4-ATPases. However, this conclusion is not directly supported by the presented data. The authors should either provide supporting localization or expression data for other P4-ATPases or soften the statement to indicate that no stereocilia-enriched P4-ATPases were detected under the conditions examined.
We agree with the reviewer and will revise this statement to read: “No IHC stereocilia-enriched P4-ATPases were detected under the conditions examined.”
Recommendations:
(5) The authors convincingly demonstrate that TMEM30B loss results in ATP8B1 mislocalization. While not essential to the central conclusions, examining TMEM30B localization in ATP8B1 KO hair cells would clarify whether this interdependence is reciprocal, as described for other P4-ATPase-CDC50 complexes.
We appreciate this insightful suggestion. However, performing this experiment would require generating a compound mouse line (crossing TMEM30B-HA into the ATP8B1 knockout background), which is not feasible within the revision timeframe. Additionally, the lack of a robust commercial antibody for TMEM30B further complicates this approach. We will note this as a future direction in the revised manuscript.
(6) Lines 359-374.
The discussion of Annexin V labeling is careful and balanced. This paragraph would benefit from referencing other studies that showed minimal Annexin V labeling in healthy P6 organ of Corti, reinforcing that robust PS externalization in the present study is pathological rather than developmental.
We thank the reviewer for this suggestion and will incorporate relevant prior work, including George and Ricci (2026), which demonstrates minimal Annexin V labeling prior to P6, and further supports our interpretation.
(7) Lines 392-399.
The proposed feedback model linking MET activity and ATP8B1-TMEM30B localization is compelling. The discussion could be strengthened by noting that in TMC1/2 double knockout hair cells, PS externalization is not observed, consistent with the idea that flippase activity becomes critical specifically when scrambling occurs. The mislocalization observed in Cib2 KO hair cells further supports the coupling between TMC-mediated scrambling and flippase-mediated membrane restoration.
We agree and will expand the discussion to include that TMC1/2 double knockout hair cells do not exhibit phosphatidylserine externalization, supporting the idea that flippase activity becomes critical in the context of scrambling.
Reviewer #2 (Public review):
Weaknesses:
(1) Are the HA tags causing any functional issues? Function and localization of tagged proteins can sometimes be compromised. It would be good to know, for each knock-in model (TMEM30B, ATP8B1, ATP8A1, ATP8A2, and ATP11A), whether the HA-tagged protein is causing any issues with the mice and particularly with hearing (ABRs). Are these mice normal? Can they hear? These data are missing.
We thank the reviewer for raising this important point. In this study, we will focus on TMEM30B-HA and ATP8B1-HA mouse lines, while additional HA-tagged flippase lines (ATP8A1, ATP8A2, ATP11A) are part of ongoing work to be reported separately.
Both TMEM30B-HA and ATP8B1-HA mice are viable and exhibit normal breeding and aging. Preliminary (pilot) ABR measurements indicate wild-type–like hearing thresholds. We agree that this is important and will attempt to raise sufficient mouse numbers (in the time given) for a properly powered ABR analysis in the revised manuscript.
(2) Following on the point above, is it possible that ATP8B1-HA is well localized, but localization for the other three flippases (ATP8A1-HA, ATP8A2-HA, and ATP11A-HA) is compromised by the tag? Is this potential mislocalization causing any functional phenotypes? (ABRs of point 1). I find it surprising that there are flippases only in outer hair cells and only formed by ATP8B1. A possible explanation is that the tag is interfering with trafficking. If so, there should be a phenotype (ABRs), although this might be masked by redundancy among these flippases or caused by systemic issues (admittedly difficult to sort out). Given that this manuscript will likely become foundational, and that there is evidence that at least two of the other flippases are involved in hearing loss, it would be good to provide more information about the mice and HA-tagged proteins in the other knock-ins (ATP8A1-HA, ATP8A2-HA, and ATP11A-HA). Depending on the data available for the knock-ins, the authors may want to discuss these scenarios and soften the statement indicating that inner-hair cells may lack flippase activity altogether.
We appreciate this concern. To our knowledge, the HA tag does not appear to disrupt localization or function of the tagged proteins. However, we agree that this cannot be fully excluded. We will therefore soften our conclusions about IHC flippases and clarify that additional flippases (ATP8A1, ATP8A2, ATP11A) are under investigation and will be described in a separate study.
(3) Expression of ATP8B1 at P0 (Figure 1D), when there should not be protein in outer hair cells yet seems high. Does this mean that other cells in the cochlea also express ATP8B1? Is this a concern?
We thank the reviewer for this observation. We interpret the elevated signal at P0 as reflecting transcription preceding detectable protein expression. While expression in other cochlear cell types is possible, we have not observed detectable ATP8B1 localization outside hair cells using the HA-tagged model. We will clarify this point in the manuscript.
(4) Fluorescence scales in Figure 6 B and D and Figure 7 B and D are very different. So are the values for WT. One would expect that the WT would be similar in all cases (at least within the same compartments), given that the methods section indicates that "All images were collected using identical acquisition parameters, including zoom and laser power, across genotypes". If WT shows such variability, how can we compare?
We appreciate the need for clarification. Identical acquisition parameters were maintained within each experiment used for direct comparison (e.g., within a given panel). However, different panels (e.g., Figures 6B vs. 6D) were acquired on different days using different imaging settings.
We will revise the Methods section to explicitly state this and clarify that comparisons are intended only within panels, not across experiments.
-
-
www.medrxiv.org www.medrxiv.org
-
- The WHO MDA program administered in 2023 should have been described in the background, including its extent (e.g., how many persons received MDA; what was coverage).
- Looking at table 1, it seems that the surge occurred only from 2022-2023, and thus the costing for those two years can be averaged and compared to the pre-surge (2021) and post-surge/post-WHO MDA (2024)
- For Table 2-Pls give how many grams of the permethrin 5% ointment per tube and what dosage frequency they were administered (single dose or 2 weekly doses?). also how many ml was flucloxacillin syrup, how many mg was cetirizine tab and syrup; Pls indicate currency of unit cost per drug; Pls provide costs for IPC supplies
- What software was used to compute for costing?
Sentences in lines 138 and 139 are duplicates Table 2 is not cited Table 1 - pls provide total consultations for each year, which served as denominator to get the proportional morbidity Vancouver style is not followed in some references Ref 2 - only 1st letter of 1st word should be capitalized) Ref#6 has unnecessary symbols (stars) after title Ref #14-16 have no date of citation Ref 4 and 8 should not have editor's names
-
-
www.medrxiv.org www.medrxiv.org
-
R0:
Reviewer #1:
Thank you for the opportunity to review this manuscript examining determinants of measles vaccine (MR1–MR2) dropout in an urban slum setting. The topic is highly relevant to measles elimination efforts, particularly in vulnerable urban populations where service continuity remains challenging. The study addresses an important operational question and employs an appropriate case–control design. However, several aspects of the manuscript require clarification and strengthening before it can be considered for publication.
Introduction 1. The Introduction does not crisply say what is unknown about measles dropout in the Dhaka slum context. You need a single paragraph that: (a) identifies the knowledge gap, (b) explains why Korail/slum populations require focused study, and (c) states the study’s unique contribution. 2. Terminology and consistency. Use consistent vaccine labels (Penta1, MCV1, MR1, MR2). Early in the Introduction define what you mean by “drop-out” (the operational definition appears later in Methods — bring a short definition into the Introduction). 3. Some background facts belong in Methods/Results. E.g., the specific urban slum population size and annual vaccination target are Methods details and should not be in the Introduction. 4. At present the Introduction jumps between global stats, EPI history, WHO recommendations, and local data without clear transitions. Reorder so each paragraph follows logically (global → regional → national → evidence on determinants → gap in urban slums → study aim). 5. Missing justification of novelty. Say explicitly why this study adds new evidence (e.g., limited studies in Dhaka slums, few case–control analyses of MR1–MR2 drop-out in highly mobile urban slum populations, service-delivery factors not well quantified in Dhaka). This is essential for reviewers. 6. The intro cites Ethiopia, Somalia, Pakistan; add (or at least state you reviewed) South-Asia or Bangladesh-specific evidence on urban slums and drop-out. If those studies are sparse, say that explicitly — that is the gap.
Methods Section 1. Please provide a precise definition of dropout, including the age/time cutoff for MR2 completion and whether delayed vaccination was considered acceptable. 2. It should be explicitly stated that both groups were drawn from the same source population using identical eligibility criteria to minimize selection bias. 3. Provide more detail on the sampling frame and recruitment process. Specify whether participants were identified through EPI registers, household listings, or community census data, and clarify whether random or convenience sampling was used. 4. Expand the description of the sample size calculation. Include the assumed effect size (odds ratio), exposure prevalence among controls, alpha level, statistical power, and the formula or software used. 5. Clearly define how key variables (e.g., maternal education, household income, waiting time, ANC/PNC visits) were categorized and justify the chosen cutoffs. 6. Clarify the source and validation of vaccination data. Indicate whether vaccination status was verified through vaccination cards, caregiver recall, or both, and explain how discrepancies were handled. 7. Provide more detail on bias control measures. Describe steps taken to minimize selection bias, recall bias, and information bias, including interviewer training and standardization procedures. 8. Strengthen the description of data management and quality control. Indicate whether data were double-entered, validated, and which statistical software (including version) was used. 9. Clarify ethical procedures. Provide the name of the approving ethics committee, approval number, and details on how informed consent was obtained and documented.
Results Section 1. Strengthen the presentation of multivariable findings. Adjusted odds ratios (AORs), 95% confidence intervals, and p-values should be consistently reported in both tables and narrative text. Emphasize adjusted results over crude associations to avoid overinterpretation of unadjusted findings. 2. Clarify reference categories in tables. Tables presenting logistic regression results should clearly indicate the reference group for each categorical variable. This is essential for accurate interpretation of odds ratios. 3. Improve consistency between tables and text. Ensure that all key numerical results mentioned in the text match those in the tables (including decimal places). Avoid repeating entire tables in narrative form; instead, summarize the most important findings.
Discussion and Conclusion 1. Strengthen the synthesis between findings and existing literature. While prior studies are cited, the discussion would benefit from more critical comparison. Clearly indicate whether your findings confirm, contradict, or extend previous evidence, particularly in South Asian or urban slum contexts. 2. Deepen interpretation beyond statistical significance. Move beyond reporting that associations were significant and elaborate on potential mechanisms (e.g., health system barriers, caregiver perceptions, structural inequities) that may explain the observed relationships. 3. Expand the discussion of public health and programmatic implications. The manuscript would benefit from clearer operational recommendations. For example, explain how EPI managers or urban health planners could translate these findings into targeted interventions. 4. Explicitly discuss potential biases (selection bias, recall bias, residual confounding), the inherent limitations of the case–control design, and issues of generalizability beyond Korail slum. 5. The discussion should more explicitly state what new knowledge this study adds compared to prior research—particularly regarding urban informal settlements and MR1–MR2 dropout.
Reviewer #2:
Beyond the reduced confirmed incidence of measles from 2019 (31.4) to 2022 (1.34 per million), at national level needs to include the measles case- based surveillance sensitivity indicators if they are met (Non measles febrile rash illness rate and % specimen collected from suspected cases ) Measles case-based surveillance indicators if achieved or not need to be described for the period of the study 15/10/2023 to 30/04/2024 for Dahka
Reviewer #3:
In this manuscript, Alam et al. report a study investigating factors associated with measles vaccination drop-out in children aged 12-23 months in urban areas in Bangladesh. It is quite interesting that the author found that maternal occupation, birth order, and waiting time for vaccination were among factors that were significantly associated with vaccination drop-out. Overall, the manuscript is modestly presented. My comments are summarized below. 1. What are MCV1, MCV2? 2. What is included in a pentavalent dose? 3. The statement in lines 53-54 needs to be supported by a reference. Particularly, to better protect children against measles, a herd immunity level of 95% is needed. And if the statement remains correct, what is the problem when the drop-out rate in Bangladesh is 3.4-5.5%? 4. The differences in vaccine coverage between urban and rural areas (lines 61-62) are significant? And is it due to vaccination drop-out? 5. Paragraphs in lines 53-60 and 63-70 are duplicated. 6. I think the introduction needs to be revised. It remains unclear why this study is conducted. 7. If possible, please make the questionnaire available for review and describe how the questionnaire is evaluated. 8. Some language errors in Table 4. 9. The conclusion of the manuscript introduces new information (measles elimination in Bangladesh), but it seems likely irrelevant.
-
-
www.medrxiv.org www.medrxiv.org
-
R0:
Reviewer #1: Manuscript Number: PGPH-D-25-02685 Review Report Male Allyship Overall summary of the review Strength This manuscript addresses the important topic of male allyship in advancing women’s leadership in global health academia, using a well-structured qualitative approach and presenting findings across individual, institutional, and societal levels. Strengths include clear objectives, rigorous methods, and practical insights for policy and leadership. Areas that need improvement include: • Clarify the study type in the title and make it action-oriented. • Expand geographic representation beyond the U.S. and Canada. • Provide context for participant quotes. • Report data saturation and response rates. • Improve readability by breaking up long sentences and structuring results around clear subthemes. • acknowledge limitation for geographic representation beyond the U.S. and Canada Point by point feedback Title: - Male Allyship to Advance Women's Global Health Leadership in the Academy Strength • It addresses a timely and high-Impact Topic: The study area is forgotten by global community especially in academia on the importance of gender equity and leadership. • The title accurately reflects the manuscript’s core theme male allyship in academic global health leadership. • Timely and High-Impact Topic: The study addresses a significant gap in global health leadership literature—moving beyond simply identifying barriers to focusing on actionable solutions (allyship and sponsorship). This shift in focus is highly valuable for policymakers and institutional leaders Weakness • The short and long title of the manuscript is the same; no difference • The title talks about two things one “Global Health Leadership” and second “the academic institution in North America”. the focus of study population is not clear • The kind of the study type is no clearly indicated in the title. • The phrase “in the Academy” could be slightly ambiguous to international audiences—consider specifying “in academic global health institutions.” Suggested Revision • It is better if the title is an action oriented Like “Exploring Male Allyship to Advance Women’s Leadership in Global Health Academia: A Qualitative Study” or Male Allyship to Advance Women’s Leadership in Global Health Academia: A Qualitative Study Abstract Strengths: Introduction • Well-structured abstract with clear objectives, methods, and findings. • Strong justification for the study, citing global gender disproportionate disparities and responsibilities gaps in global health leadership. • Appropriate Methodology: It used a qualitative, semi structured interview approach to explore the perception, experiences and perceptions of high level leaders. Clear thematic analysis • It use clear research question on the experience of global leaders • Findings: Clearly structured around three levels—individual male ally, institutional, and societal level which offers a useful conceptual framework to shift cultural norms on gender roles for practical implications Area of improvement: • Introduction looks like an advocacy; no clearer separation between background and rationale. • • Participants were drawn only from the U.S. and Canada, which limits the geographic coverage of the study. In addition, selecting participants exclusively from the WomenLift Health network may reduce the diversity of perspectives and potentially affect the credibility of the findings. • Conceptual clarity: The term male allyship could be briefly defined in one sentence for clarity. • The conclusion partially repeats ideas from the introduction it looks like the summary of the introduction and better if based on the findings and highlighting the practical or policy relevance to enhance the impact Main Manuscript • The study team approached participants via email and invited them to participate and conduct the interview via zoom; so why the study participants restricted to two high-income countries? Result • Line 178-183: The results section reports the number of participants but does not indicate whether data saturation was achieved. In qualitative research, explaining when and how saturation was reached strengthens the credibility and adequacy of the sample size. • Reporting the response rate as a percentage would help readers interpret the level of participation more easily. • Line 185-191: The paragraph communicates the general findings, better if key themes are mentioned to give readers a concrete examples • Line 202: The quote is powerful, but providing brief context about the respondent role, experience, or institution better if included. • Line Motivation and incentives it is more plausible to read if concrete example of participant quotes are included • Line 252 to 278: the section contains valuable insights, but some sentences are long and dense. Breaking them into shorter sentences will improve readability. Consider structuring the section around clear subthemes: like awareness, role modeling etc., • Line 332-341 quote -P7, F, 40-44 is clear and conventional; however it’s a bit long and better if lightly edit for readability while retaining authenticity Discussion Strength • It is strong in structure, logic, and scholarly tone. It clearly links findings to prior research and offers practical and theoretical insights • Line 633 Toking et al reference number (54). Line 638 Sinha et al (59) need consistency Limitation Strength: Clearly states the population studied & acknowledges selection of diverse perspectives Area of Improvement: Findings may not generalize to early-career leaders, non-academic settings, or global contexts.
Reviewer #2: This paper examines an important topic: male allyship in global health. A key strength of the paper is its focus on solutions as reported by participants. This helps move the focus away from challenges women in global health face, to exploring actual solutions to the problem. The paper presents many examples of what male allyship looks like, many of these being very actionable. I commend the authors for this. That said, there are several areas that need attention.
-
The findings could be synthesized and made more concise. The authors present A LOT of information, which is overwhelming. There are many ways to address this. First, the authors can use much shorter direct excerpts from participants. Second, the authors could move participant excerpts into a table. Third, the authors could synthesize their findings much more which would reduce the number of themes/issues and tell the story a bit differently. The paper would read better if they structured the results based on the subheadings used in Fig 1. It would help tell a more succinct story.
-
It is not clear what Fig 2 is showing.
-
I wonder if to would help to present the findings by gender, that is, by showing similarities and differences between female and male participants.
-
Could the authors present more details on the study participants. Sone of the content in the excerpts suggests that they were from academic institutions. A demographics table would help, in terms of academic vs non-academic institutions etc. The authors should also provide more details on the sampling and recruitment method: how exactly did they find these 21 participants?
-
The Discussion could be strengthened by a more critical analysis of the concept of male allyship. The authors should consider what their findings/study implications are for the potential and pitfalls of the concept.
-
-
-
-
Reviewer #1 (Public review):
Summary:
This paper examines plasticity in early cortical (V1-V3) areas in an impressively large number of rod monochromats (individuals with achromatopia). The paper examines three things:
(1) Cortical thickness. It is now well established that early complete blindness leads to increases in cortical thickness. This paper shows increased thickness confined to the foveal projection zone within achromats. This paper replicates work by Molz (2022) and Lowndes (2021), but the detailed mapping of cortical thickness as a function of eccentricity and the inclusion of higher retinotopic areas is particularly elegant.
(2) Failure to show largescale reorganization of early visual areas using retinotopic mapping. This is a replication of a very recent study of Molz et al. but I believe, given anatomical variability, the larger n in this study, and how susceptible pRF findings are to small changes in procedure, this replication is also of interest.
(3) Connective field modelling, examining the connections between V3-V1. The paper finds changes in the pattern of connections, and smaller connective fields in individuals with achromatopsia than normally sighted controls, and suggests that these reflect compensatory plasticity, with V3 compensating for the lower resolution V1 signal in individuals with achromatopsia.
This is a carefully done study (both in terms of data collection and analysis) that is an impressive amount of work.
*Effects of eye-movements
The authors have carried out the eye-movement analyses I asked of them. Unfortunately, in 4 individuals they couldn't calibrate the eyetracker (it's impressive they managed in 10). I think this means that 4 of 13 (since a different participant was excluded from head motion) individuals weren't included in correlation analyses. Limiting the correlation analysis to individuals with better fixation has obvious issues. I'd recommend redoing (or additionally including) stats using non-parametric measures while classifying these 4 as having fixation instability of 3 (i.e. greater instability than the participant with the worst fixation who was successfully calibrated).
*Interpreting pRFs
The paper would be strengthened by a little more explicit clarity about what pRFs represent and how that affects their interpretation of their findings as plasticity vs. non-plasticity (I know the authors are aware of this, but I think it would be helpful for readers who are less experienced in pRFs). In the introduction it would be helpful to point out that pRFs represent the collective response of a large population of neurons, and as a result pRF estimates can vary depending on which population of neurons that stimulus drives.
For example, imagine for the sake of argument that rods only project to V1 neurons with larger receptive fields. If one measured pRFs in a control observer under phototopic vs. scotopic conditions one would see smaller pRFs in the photopic conditions. This wouldn't represent 'plasticity' - it would represent the fact that the firing neurons contributing to the pRF signal are a slightly different population because of a change in the stimulus content. This is of course exactly what you see in 2C. And indeed, the authors make this identical point ". In the non-selective condition, the smaller pRFs in controls are in line with the higher spatial resolution of the<br /> cone system, which is not active in the achromat group." But this point would be clearer if more of the conceptual underpinnings were made explicit in the introduction (or at this point in the paper).
Shifts in which population of neurons drive your pRFs can explain main of the more puzzling results in the paper without detracting from your main conclusions. For example, in 2D, I don't think it's differences in S/N driving your results (pRFs are at least theoretically meant to be robust to S/N). If smaller RFs 'drop out' under low luminance and these smaller RFs also tend to be more central, then one would expect the control results of 1D. And I think a similar argument might even be made for the smaller difference in the rod monochromats.
It would be possible to make the point of Figure 4B more simply if Figure 4B was replaced by additional Panels in Figure 2 simply showing V3 pRF sizes/eccentricity distributions. That would make the point that you don't see the same expansion in pRF sizes in V3 in a way that is just as clear, and is closer to the data.
*Interpreting cRFs
Similarly, I think the paper would be improved with more clarity about the underlying signal in CF modeling. Once again, I appreciate that the authors are familiar with this, but it will help the reader in interpretation. (And I do believe thinking carefully about this may alter your interpretations). CF receptive fields 'find' the region in V1 that best predict the V3 signal in a given voxel. In resting state this likely represents a combination of:
(1) visually driven signal - correlations that may or may not reflect connectivity but represent the fact that regions that represent the same region of visual space will be active at the same time.
(2) global bilaterally symmetrical signal consisting of enhanced correlations between iso-eccentric regions (Raemaekers et al., 2014), which may arise from vasculature that symmetrically stems from the posterior cerebral artery (Tong et al., 2013; Tong and Frederick, 2014).
(3) intrinsic neural fluctuations that are more strongly correlated between connected neurons. These are likely quite weak compared to the other contributions.
I think if you ignore 2, (which is not likely to differ between rod mono and controls) and model 1 and 3, you might well see shifts in CFs towards the boundary of the scotoma - essentially the CF's location will be biased towards the region of V1 that has stronger correlations - which = the region which has a visual signal.
I do find convincing the argument that you don't see the same shift in controls in the rod-selective condition. So I think the results of 4A are fine. But a little more clarity about 'what's under the hood' in CF modeling would be nice.
*Interpreting the relationship between pRFs and cRFs
So there's something here that confuses me. We are all agreed that V3 pRF sizes are similar across RM and control. V1 pRFs are larger in RM. It feels intuitive that smaller CFs would compensate but I can't make it make sense to myself when I think it through. Each pRF represents a combination of receptive field location scatter and bandwidth. You want to argue that eccentricity mapping looks pretty normal, so there's no reason to think increased rf scatter, and I can believe that (though I do think this assumption should be discussed explictly).
So far I think we agree.
But let's think about what drives a CF during visual stimulation ... Specifically lets think about 'the pRF of the CF' (the region of visual space represented by the cluster of voxels in the CF). If pRFs for individual voxels in V1 are big, then the pRF for the CF is also going to be large. But we know that pRFs for V3 are normal size. So, the V3 CF will 'find' a smaller number of voxels in V1, in order to try to find the 'correct sized' CF pRF. Note that this explanation is very similar to yours. But doesn't require ANY 'intrinsic' connectivity. It's really just assuming the whole thing is driven by the visual signal and the CF size is determined by the ratio of the pRF sizes in V3 vs. V1.
One possible solution would be to regress out the visual stimulus and redo this analysis based on the residuals.
-
Author response:
The following is the authors’ response to the original reviews.
Public Reviews:
Reviewer #1 (Public review):
Summary:
This paper examines plasticity in early cortical (V1-V3) areas in an impressively large number of rod monochromats (individuals with achromatopia). The paper examines three things:
(1) Cortical thickness. It is now well established that early complete blindness leads to increases in cortical thickness. This paper shows increased thickness confined to the foveal projection zone within achromats. This paper replicates the work by Molz (2022) and Lowndes (2021), but the detailed mapping of cortical thickness as a function of eccentricity and the inclusion of higher visual areas is particularly elegant.
(2) Failure to show largescale reorganization of early visual areas using retinotopic mapping. This is a replication of a very recent study by Molz et al. but I believe, given anatomical variability (and the very large n in this study) and how susceptible pRF findings are to small changes in procedure, this replication is also of interest.
(3) Connective field modelling, examining the connections between V3-V1. The paper finds changes in the pattern of connections, and smaller connective fields in individuals with achromatopsia than normally sighted controls, and suggests that these reflect compensatory plasticity, with V3 compensating for the lower resolution V1 signal in individuals with achromatopsia.
Strengths:
This is a carefully done study (both in terms of data collection and analysis) that is an impressive amount of work. I have a number of methodological comments but I hope they will be considered as constructive engagement - this work is highly technical with a large number of factors to consider.
Weaknesses:
(1) Effects of eye-movements
I have some concerns with how the effects of eye-movements are being examined. There are two main reasons the authors give for excluding eye-movements as a factor in their results. Both explanations have limitations.
(a) The first is that R2 values are similar across groups in the foveal confluence. This is fine as far as it goes, but R2 values are going to be low in that region. So this shows that eyemovements don't affect coverage (the number of voxels that generate a reliable pRF), but doesn't show that eye-movements aren't impacting their other measures.
We agree with the reviewer that eye movements could affect pRF measures. We have now also included data for all participants where we were able to obtain eye tracking measures and directly tested this relationship. Relevant results are copied below.
Recap of results: 1) as expected gaze was less stable in achromats than controls, 2) achromats with more stable gaze did not show more activation in the scotoma projections zone, which we might have observed if fixation instability masks signals in this region 3) Gaze instability was not correlated with pRF size and eccentricity across V1 in achromats. We note that the relationship between nystagmus and visual sampling is complex - patients experience a stable image and may sample only during a specific phase of the eye movement. It is therefore not inherently clear if and how nystagmus affects pRF size.
Relevant Manuscript text incorporating these analyses is copied below.
To quantify eye movement, we used the following methods added to the manuscript:
“Fixation stability
Participants’ gaze was tracked throughout all pRF mapping runs. Collecting reliable gaze data from individuals with nystagmus is a challenge because out of the box calibration procedures mostly fail without stable fixation. To account for this, we implemented a post-hoc custom calibration procedure (Tailor et al., 2021). The eye-tracker was first precalibrated on a typically sighted individual. Then, before every other run, we collected gaze data from a 5-point fixation task (at fixation and above, below, left, and right of fixation at 5 eccentricity). This data allowed us to subsequently map the patient's recorded gaze coordinates to their precise locations on the screen. In 10 out of the 14 achromats we acquired reliable enough data to assess fixation stability.
Calibration data processing: We first removed the first 0.5 seconds for each fixation location to allow for fixation to arrive on the target. We then performed (a) blink removal, (b) filtered out time points with eye movement velocity outliers (±2SD), and (c) filtered out any positions >3SDs to the left or right of the mean fixation location, and >1SD above or below. We took the median of the remaining gaze measurements as an approximate fixation estimate. The resulting 5 median fixation locations were used to fit an affine transformation that remapped the recorded gaze positions into screen space.
Quantifying fixation stability: after applying the transformation of the post-hoc calibration, data was filtered for blinks and extreme velocities (<2SD). For each functional run, fixation instability was measured as the standard deviation of gaze x-positions across 1second windows. Measures were then averaged across the two run repeats.”
We report the resulting new fixation data results as follows:
Results (coverage section):
“Another potential confound in our findings is fixation instability. In pRF mapping, which is usually conducted under photopic (cone-dominant) conditions, unstable fixation can cause a signal drop in the foveal projection zone. As expected due to nystagmus, the achromatopsia group showed higher fixation instability compared to controls (rodselective: t<sub>(9.08)</sub>=-3.19, p=0.01; non-selective: t<sub<(9.41)</sub>=-4.88, p<0.001 degrees-offreedom corrected for unequal-variance; see Supplement Figure S2a). However, several lines of evidence suggest this instability cannot fully account for the lack of "filling in" in achromats. First, within the achromat group, we found no correlation between fixation stability and coverage (rod-selective: spearman-r<sub>(8)</sub> = -0.36, p=0.31; non-selective spearman-r<sub>(8)</sub>=0.07,p=0.85); Individuals with more stable, control-like fixation did not show more signal inside the scotoma (see Supplement 2). Second, in adults with achromatopsia, typically with less severe nystagmus (Kohl et al., 1993), two recent studies also found absence of filling in (Anderson et al., 2024; Molz et al., 2023).
So, while we cannot fully exclude nystagmus masking foveal signals in the cortex of some patients, this converging evidence from structural and functional MRI measures across different studies and groups, strongly suggests that the deprived cortex does not substantially ‘fill in’ with peripheral rod inputs in achromatopsia.”
Results (pRF size + eccentricity):
“Larger pRFs indicate that neuronal populations in achromats’ V1 cortex, combine information across larger areas in visual space than in typically sighted controls. This could reflect true neural tuning differences as well as be driven by larger eye movement. However, fixation instability in achromats do not significantly correlate with pRF size in our sample (rod-selective: spearman-r<sub>(8)</sub> = -0.41, p=0.24; non-selective spearman-r<sub>(8)</sub>=0.37,p=0.29)
It has been shown that fitting artefacts around scotoma edges, can give rise to similar outward eccentricity shifts (Binda et al., 2013). However, when accounting for fitting artefacts around the foveal scotoma edge by modelling the rod-free zone during pRF fitting, pRF size and eccentricity differences remain unchanged (see Supplement 3). Finally, we found no significant correlations between gaze stability and the eccentricity shift (rod-selective: spearman-r<sub>(8)</sub> = 0.58, p=0.08; non-selective spearman-r<sub>(8)</sub>=0.09,p=0.8, Supplement 4D)
Together, these analyses reveal subtle differences in how V1 of achromats responds to rod signals outside the foveal zone, which are consistent with results from other studies (Molz et al. 2023, Anderson et al. 2024). While we found no direct evidence that these are being driven by confounding factors such as eye-movements or fitting artefacts, more work is needed to understand the underlying processes that give rise to these shifts.”
The following text has been added to Supplement 2
“As expected, achromats showed significant higher fixation instability compared to controls (as reported in the main text). We found no significant correlation between fixation instability and either coverage, pRF size, eccentricity in achromats. Results of Spearman R correlations in both rod- and non-selective conditions are reported in the figure. We note that the relationship between nystagmus and visual sampling is complex- patients experience a stable image and may sample only during specific eyemovement phases. It is therefore not fully clear if and how nystagmus should give rise to altered pRFs.”
(b) The authors don't see a clear relationship between coverage and fixation stability. This seems to rest on a few ad hoc examples. (What happens if one plots mean fixation deviation vs. coverage (and sets the individuals who could not be calibrated as the highest value of calibrated fixation deviation. Does a relationship then emerge?).
In any case, I wouldn't expect coverage to be particularly susceptible to eye-movements. If a voxel in the cortex entirely projects to the scotoma then it should be robustly silent. The effects of eye-movements will be to distort the size and eccentricity estimates of voxels that are not entirely silent.
There are many places in the paper where eye-movements might be playing an important role.
Examples include the larger pRF sizes observed in achromats. Are those related to fixation instability?
We thank the reviewer for their comment. As detailed in our previous response, we have now extracted fixation instability data from additional patients and have expanded our discussion of its potential effects throughout the manuscript.
Given that fixation instability is expected to increase pRF size by a fixed amount, that would explain why ratios are close to 1 in V3 (Figure 4).
We agree with the reviewer’s point, that the ratio change on its own is not strong evidence of compensation, this analysis was meant to complement the CF result. The plot in Figure 4 is intended to reconcile the connective field (CF) and pRF results. Its purpose is to illustrate that even though larger pRFs in achromats might seem counterintuitive alongside their smaller V3 CF sizes, the pRF data do not contradict the CF findings but they are in fact consistent with one another. We also agree that there are alternative explanations for the differences in pRF size, such as fixation stability, and we have now added this point to the text.
Results (CF size):
“To understand how this finer cortical sampling in V3 (smaller connective fields) impacts visual processing, we consider its effect on population receptive fields (pRFs). In V1, pRF sizes in achromats were significantly larger than in controls for both stimulus conditions, indicating coarser spatial tuning at the cortical input stage (Figure 4C, left). By selectively sampling from a smaller area of the V1 surface (smaller CFs), V3 can effectively compensate for this coarser input. If so, this process should result in a relative normalisation of pRF size in V3 compared to V1 (Figure 4C, right).
To test this prediction, we plotted the ratio of pRF sizes between achromats and controls, where a value of 1 indicates parity between the groups (Figure 4B). As our compensatory connective field hypothesis predicts, the ratio was closer to 1 in V3 than in V1 across both stimulus conditions, confirming the pRF size difference was significantly reduced at the higher cortical stage. Together this shows converging evidence across the two models (pRF and CF) of hierarchical refinement as a possible compensatory mechanism, where V3's altered connectivity helps to normalize the processing of degraded sensory input from V1.”
Discussion:
“The hierarchical reorganisation observed in V3 is unlikely to be driven by fixation instability. Connective field (CF) estimates are robust to eye movements (Tangtartharakul et al., 2023), because they are anchored to V1 inputs rather than absolute screen position. Considered alone, the pRF results could alternatively be explained by eye movements introducing a fixed size offset that affects smaller V1 pRFs more strongly than those in V3. While we found no evidence for this relationship between pRF size and gaze measures in our patients, we cannot fully rule out the possibility. Nevertheless, the internal consistency between the CF and pRF measures provides a more parsimonious account; that sampling across the hierarchy accounts for coarser tuning at the input stage.”
(2) Topography
The claim of no change in topography is a little confusing given that you do see a change in eccentricity mapping in achromats.
Either this result is real, in which case there *is* a change in topography, albeit subtle, or it's an artifact.
Perhaps these results need a little bit of additional scrutiny.
One reason for concern is that you see different functions relating eccentricity to V1 segments depending on the stimulus. That almost certainly reflects biases in the modelling, not reorganization - the curves of Figure 2D are exactly what Binda et al. predict.
Another reason for concern is that I'm very surprised that you see so little effect of including/not including the scotoma - the differences seem more like what I'd expect from simply repeating the same code twice. (The quickest sanity check is just to increase the size of the estimated scotoma to be even bigger?).
We thank the reviewer for their comment. We have double-checked our scotoma modelling, confirming its correct implementation. The results of the scotoma modelling are not identical to the full one, just similar (see below).
Previous studies on “artificial scotomas” (such as the one reported by Binda et al.) have shown mixed results. While Binda and colleagues found that modelling artificial scotomas normalised pRF shifts, others found no effect (Haak et al. 2012, Prabhakaran et al. 2020). Notably, the rodfree zone in achromatopsia is considerably smaller (~0.5° radius) than most tested artificial scotomas. Moreover, it is unclear whether scotoma modelling is beneficial in clinical populations as artificial scotomas (screen-based masking) are not equivalent to retinal scotomas from inactive photoreceptors. A recent achromatopsia study (Anderson et al. 2024) also found no change in pRF estimates with scotoma modelling.
In our scotoma analyses, we found meaningful differences only in the non-selective condition in controls where cones in the rod-free zone are stimulated - which would be the main expected effect of this modelling exercise (see below). In all other conditions (rod-selective in controls, both conditions in achromats), only rods are stimulated, we found no difference in coverage, eccentricity or pRF size when modelling the scotoma likely because the foveal signal is weak/absent, and did not contribute much to pRF estimates in the unmasked analyses.
This means we cannot account for the eccentricity shift as an edge effect with this scotoma model – but we remain cautious about interpreting it as real. This is because first, as we mention in the paper, in the non-selective condition, which has a higher signal-to-noise ratio, the eccentricity estimates in achromats match those of the control group's rod system. Second, it is still possible that the observed shift is an artefact of modelling that was not accounted for by the approach of scotoma modelling.
Our claim of "no change in topography" specifically referred to the absence of "filling-in" as measured by cortical coverage - the percentage of activated tissue regardless of fitted parameters. However, to avoid confusing given the eccentricity and pRF size results we now rephrased our claim.
Abstract:
“Cortical input stages (V1) exhibited high stability, with input-deprived cortex showing no retinotopic remapping and exhibiting structural hallmarks of deprivation.”
Results (pRF eccentricity):
“It has been shown that fitting artefacts around scotoma edges, can give rise to similar outward eccentricity shifts (Binda et al., 2013). However, when accounting for fitting artefacts around the foveal scotoma edge by modelling the rod-free zone during pRF fitting, pRF size and eccentricity differences remain unchanged (see Supplement 3). Finally, we found no significant correlations between gaze stability and the eccentricity shift (rod-selective: spearman-r<sub>(8)</sub> = 0.58, p=0.08; non-selective spearman-r<sub>(8)</sub>=0.09,p=0.8, Supplement 4D)
Together, these analyses reveal subtle differences in how V1 of achromats responds to rod signals outside the foveal zone, which are consistent with results from other studies (Molz et al. 2023, Anderson et al. 2024). While we found no direct evidence that these are being driven by confounding factors such as eye movements or fitting artefacts, more work is needed to understand the underlying processes that give rise to these shifts.”
To better illustrate the effect of scotoma modelling text has been added to Supplement 3:
“Studies on artificial scotomas, where part of the visual field is masked, suggest that pRF estimates of eccentricity and size can be biased by fitting scotoma-edge artefacts, and that these can be mitigated by modelling the scotoma in the pRF fitting procedure (e.g., Binda et al. 2013).
We therefore repeated the pRF modelling procedure with the rod-scotoma being modelled as a black oval mask (1.25°x0.9°) over the stimulus aperture model. As expected, a visible difference between the two models is only apparent in the nonselective condition in controls where the cones in the rod-free zone are being stimulated. In all the other conditions (rod-selective in controls, and both stimulation conditions in achromats) only the rods are stimulated, therefore the masked stimulus still matches the retinal activation, and no major differences can be observed. Performing the same statistical tests applied to the full model in the main text yields equivalent results of equivalent coverage in the rod-selective condition, with equivalent coverage across groups(t(47) = 0.78, p=0.43, BF10=0.31) and controls show a higher coverage in the non-selective stimulation condition compared to achromats (Mann U(52)=141, p<0.01; unequal variance, reverted to non-parametric).
This consistency in pRF properties when modelling the rod scotoma, is in line with previous results from scotoma modelling; While Binda and colleagues found that this normalised pRF shifts, others found no effect (Haak et al. 2012, Prabhakaran et al. 2020). Notably, the rod-free zone in achromatopsia is considerably smaller (~0.5° radius) than most tested artificial scotomas, and as artificial scotomas (screen-based masking) are not equivalent to retinal scotomas from inactive photoreceptors, it is unclear how artificial scotoma findings generalise to clinical populations. Our results are in line with a recent achromatopsia study (Anderson et al. 2024) which also found no change in pRF estimates with scotoma modelling.”
I'd also look at voxels that pass an R2>0.2 threshold for both the non-selective and selective stimulus. Are the pRF sizes the same for both stimuli? Are the eccentricity estimates? If not, that's another clear warning sign.
Comparable results were obtained when using higher R2 thresholds. These results are now included in Supplement 6.
(3) Connective field modelling
Let's imagine a voxel on the edge of the scotoma. It will tend to have a connective field that borders the scotoma, and will be reduced in size (since it will likely exclude the cortical region of V1 that is solely driven by resting state activity). This predicts your rod monochromat data. The interesting question is why this doesn't happen for controls. One possibility is that there is topdown 'predictive' activity that smooths out the border of the scotoma (there's some hint of that in the data), e.g., Masuda and Wandell.
One thing that concerns me is that the smaller connective fields don't make sense intuitively. When there is a visual stimulus, connective fields are predominantly driven by the visual signal. In achromats, there is a large swath of cortex (between 1-2.5 degrees) which shows relatively flat tuning as regards eccentricity. The curves for controls are much steeper, See Figure 2b. This predicts that visually driven connective fields should be larger for achromats. So, what's going on?
The reviewer raises interesting points about the interpretation of our connective field results. The possibility of differential top-down modulation between controls and achromats is intriguing, however it is not supported by the data, if top-down modulation is activating foveal V1 in controls then we shouldn’t see a drop in the amount of significant vertices sampling from the fovea in the rod-selective condition compared to the non-selective, but in fact we do see quite a large drop in the amount of significant vertices in that area in the rod-selective condition. Therefore, at the moment we do not think there is strong basis to assume our data could be explained by achromats lacking top-down predictive activity in the scotoma area that is present in controls.
Regarding the concern about smaller CFs seeming counterintuitive given the flat eccentricity tuning in achromats' V1: we believe there is not a straightforward prediction from pRF properties to CF sizes. The relationship between V1 pRF characteristics and V3 CF sampling is complex and not well-established in the literature, and the two can be decoupled to some degree. For instance, in our data, controls show flat V1 pRF sizes in the rod-selective condition (similar to achromats), yet their V3 CF sizes maintain the typical eccentricity-dependent increase seen in the non-selective condition. This suggests that CF size patterns don't simply mirror V1 pRF properties or visual stimuli responses.
Importantly, CF modelling fundamentally differs from pRF analysis in how it might be affected by scotomas. Unlike pRF analysis where a scotoma creates a "silent" region in visual space, in CF modelling the deprived cortex remains physically present and continues generating neural signals (albeit not visually-driven ones). If V3-V1 connectivity were anatomically fixed, V3 would continue sampling from deprived V1 regions even if they do not produce visual-driven signals. A change in this sampling pattern, as we see in our data, is therefore evidence for plasticity.
Our data support this interpretation. First, in achromats, the CF size pattern observed cannot be easily explained by scotoma-edge artefacts. V3 vertices sampling from the immediate vicinity of the scotoma (1°-3°) show CF sizes comparable to controls. The effect is only significant further away from the scotoma (4°-6°).
Second, to assess how the presence of a scotoma affects CF measure we can compare the two conditions in the controls, since the rod-selective condition has a scotoma present and the nonselective condition does not. For this purpose, we performed an additional analysis, quantifying on a vertex-by-vertex level the differences in CF fitted parameters between the two stimulation conditions across V1. See results below. In achromats there are no systematic shifts between the stimulation conditions, as expected as both are rod-driven. In controls, this analysis reveals only subtle shifts (~0.45° in the rod-selective condition). CF size has also changed slightly although not significantly different from that observed in achromats. These shifts are much smaller than the CF size and eccentricity differences between controls and achromats, so we consider it unlikely that our findings are driven by scotoma artefacts.
Author response image 1.
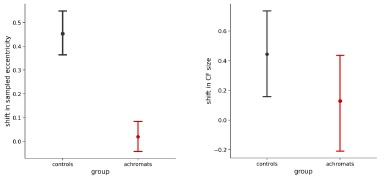
Results (CF size):
“The significant CF size differences are unlikely to be a model-fitting bias around a scotoma edge, as V3 vertices sampling from the immediate vicinity of the scotoma (1°3°) show CF sizes comparable to controls. The significant reduction in CF size occurs only further in the periphery (4°-6°), in regions that are primarily stimulus-driven.
To understand how this finer cortical sampling in V3 (smaller connective fields) impacts visual processing, we consider its effect on population receptive fields (pRFs). In V1, pRF sizes in achromats were significantly larger than in controls for both stimulus conditions, indicating coarser spatial tuning at the cortical input stage (Figure 4C, left). By selectively sampling from a smaller area of the V1 surface (smaller CFs), V3 can effectively compensate for this coarser input. If so, this process should result in a relative normalisation of pRF size in V3 compared to V1 (Figure 4C, right).
To test this prediction, we plotted the ratio of pRF sizes between achromats and controls, where a value of 1 indicates parity between the groups (Figure 4B). As our compensatory connective field hypothesis predicts, the ratio was closer to 1 in V3 than in V1 across both stimulus conditions, confirming the pRF size difference was significantly reduced at the higher cortical stage. Together this shows converging evidence across the two models (pRF and CF) of hierarchical refinement as a possible compensatory mechanism, where V3's altered connectivity helps to normalize the processing of degraded sensory input from V1.”
Discussion (added paragraph):
“The hierarchical reorganisation observed in V3 is unlikely to be driven by fixation instability. Connective field (CF) estimates are robust to eye movements (Tangtartharakul et al., 2023), because they are anchored to V1 inputs rather than absolute screen position. Considered alone, the pRF results could alternatively be explained by eye movements introducing a fixed size offset that affects smaller V1 pRFs more strongly than those in V3. While we found no evidence for this relationship between pRF size and gaze measures in our patients, we cannot fully rule out the possibility. Nevertheless, the internal consistency between the CF and pRF measures provides a more parsimonious account; that sampling across the hierarchy accounts for coarser tuning at the input stage.”
The beta parameter is not described (and I believe it can alter connective field sizes).
In Author response image 2, we plot the beta parameter of the pRF modelling in V1 with no R<sup>2</sup> filtering, error bars are 95% CIs:
Author response image 2.
The reviewer did not specify how beta might alter connective field sizes. We assume he meant that as in pRF mapping, the slope of activity from deprived to non-deprived cortex will artefactually create a CF model fit with smaller CF sizes. To test this, we calculated the slope of beta values between 0° and 3° in each participant in the rod-selective condition, as this range includes the scotoma and the area at the edge of the scotoma. We then used the slope as a covariate in an ANCOVA when comparing the CF sizes across groups in each sampled V1 segment. Accounting for the beta slope of V1 did not change the reported results. This analysis still shows smaller CF sizes in V3 in the rod-selective conditions between 4°-6° eccentricity – these differences remain significant (p<0.001 for 4°-5° and p<0.05 for 5°-6° when comparing achromats vs controls).
Similarly, it's possible to get very small connective fields, but there wasn't a minimum size described in the thresholding.
CF sizes were fit with a grid fit. Possible values were [0.5,1,2,3,4,5,7,10]. Therefore, the minimum size is 0.5. Filtering out the smallest connective field sizes does not change the results:
Author response image 3.
I might be missing something obvious, but I'm just deeply confused as to how the visual maps and the connectome maps can provide contradictory results given that the connectome maps are predominantly determined by the visual signal. Some intuition would be helpful.
We agree that this appears counterintuitive, and now added further clarification. The two models (pRF and CF) fundamentally differ in what they measure and how they relate to visual processing. V1 pRF sizes reflect the relationship between neural activity and visual stimuli - essentially how much of a visual stimulus drives a voxel's response - while V3 CF sizes reflect how V3 samples from the V1 cortical surface, indicating how many V1 voxels contribute to a V3 voxel's activity.
The measures constrain each other, as a V3 voxel's pRF size is expected to match the pooling of its connected V1 inputs. But they can be decoupled: A V3 voxel could sample from a small area of V1 cortex (a small CF in mm) that happens to represent a large area of visual space if those V1 voxels have large pRFs. The aim of Figure 4B is to clarify that the measures are consistent with one another even though they diverge in direction. In achromats, where V1 voxels have larger pRFs (coarser spatial resolution), V3 appears to compensate by sampling more selectively from V1 via smaller CF sizes. Theoretically, this should reduce the pRF size difference between controls and patients in V3, a prediction that our data supports.
Results (CF size):
“To understand how this finer cortical sampling in V3 (smaller connective fields) impacts visual processing, we consider its effect on population receptive fields (pRFs). In V1, pRF sizes in achromats were significantly larger than in controls for both stimulus conditions, indicating coarser spatial tuning at the cortical input stage (Figure 4C, left). By selectively sampling from a smaller area of the V1 surface (smaller CFs), V3 can effectively compensate for this coarser input. If so, this process should result in a relative normalisation of pRF size in V3 compared to V1 (Figure 4C, right).
To test this prediction, we plotted the ratio of pRF sizes between achromats and controls, where a value of 1 indicates parity between the groups (Figure 4B). As our compensatory connective field hypothesis predicts, the ratio was closer to 1 in V3 than in V1 across both stimulus conditions, confirming the pRF size difference was significantly reduced at the higher cortical stage. Together this shows converging evidence across the two models (pRF and CF) of hierarchical refinement as a possible compensatory mechanism, where V3's altered connectivity helps to normalize the processing of degraded sensory input from V1.”
Discussion (added paragraph):
“The hierarchical reorganisation observed in V3 is unlikely to be driven by fixation instability. Connective field (CF) estimates are robust to eye movements (Tangtartharakul et al., 2023), because they are anchored to V1 inputs rather than absolute screen position. Considered alone, the pRF results could alternatively be explained by eye movements introducing a fixed size offset that affects smaller V1 pRFs more strongly than those in V3. While we found no evidence for this relationship between pRF size and gaze measures in our patients, we cannot fully rule out the possibility. Nevertheless, the internal consistency between the CF and pRF measures provides a more parsimonious account; that sampling across the hierarchy accounts for coarser tuning at the input stage.”
Some analyses might also help provide the reader with insight. For example, doing analyses separately on V3 voxels that project entirely to scotoma regions, project entirely to stimulusdriven regions, and V3 voxels that project to 'mixed' regions.
We agree that it is important to plot the connective field dynamics across the scotoma region.
In Figure 4A we split the V3 vertices based on the V1 area they sample from. Therefore the 0°-1° would be considered as mainly sampling from the “scotoma” region and the higher the eccentricity is, the less “scotoma” it includes. The V3 vertices that have a significantly smaller CF size compared to controls are those sampling from mostly if not entirely stimulusdriven regions 4°-5° and 5°-6°. We are not sure how further binning the data by within, across and outside scotoma would be more informative.
However, in Author response image 4, we plot in more details the distribution of CF sizes sampling from a V1 segment clearly inside and clearly outside the scotoma. The top figure shows the CF size distribution of V3 vertices that sample from a V1 0°-1° segment, where V1 is deprived of input due to the rod scotoma. In achromats, there is a clear drop in vertices with a very small (0.5) CF size. The bottom figure shows the distribution of V3 vertices that sample from the V1 4°-5° segment which falls outside the scotoma and shows a significant difference in CF size across the groups. Here in achromats you can see a drop in larger V3 CF sizes sampling from the V1 region, and an increase in smaller ones (note that this further addresses a previous concern that connective field differences across groups are solely driven by very small CFs).
Author response image 4.
Following the reviewer’s comment we have added the following statement in the results section discussing CF size:
“The significant CF size differences are unlikely to be a model-fitting bias around a scotoma edge, as V3 vertices sampling from the immediate vicinity of the scotoma (1°3°) show CF sizes comparable to controls. The significant reduction in CF size occurs only further in the periphery (4°-6°), in regions that are primarily stimulus-driven.”
The finding that pRF sizes are larger in achromats by a constant factor as a function of eccentricity is what differences in eye-movements would predict. It would be worth examining the relationship between pRF sizes and fixation stability.
We found no relationship between fixation stability and pRF size in V1, although as we explain in response to an earlier point, this does not fully exclude the reviewers alterative explanation, which we now add to the discussion.
Discussion:
“The hierarchical reorganisation observed in V3 is unlikely to be driven by fixation instability. Connective field (CF) estimates are robust to eye movements (Tangtartharakul et al., 2023), because they are anchored to V1 inputs rather than absolute screen position. Considered alone, the pRF results could alternatively be explained by eye movements introducing a fixed size offset that affects smaller V1 pRFs more strongly than those in V3. While we found no evidence for this relationship between pRF size and gaze measures in our patients, we cannot fully rule out the possibility. Nevertheless, the internal consistency between the CF and pRF measures provides a more parsimonious account; that sampling across the hierarchy accounts for coarser tuning at the input stage.”
Reviewer #2 (Public review):
Summary:
The authors inspect the stability and compensatory plasticity in the retinotopic mapping in patients with congenital achromatopsia. They report an increased cortical thickness in central (eccentricities 0-2 deg) in V1 and the expansion of this effect to V2 (trend) and V3 in a cohort with an average age of adolescents.
In analyzing the receptive fields, they show that V1 had increased receptive field sizes in achromats, but there were no clear signs of reorganization filling in the rod-free area. In contrast, V3 showed an altered readout of V1 receptive fields. V3 of achromats oversampled the receptive fields bordering the rod-free zone, presumably to compensate and arrive at similar receptive fields as in the controls.
These findings support a retention of peripheral-V1 connectivity, but a reorganization of later hierarchical stages of the visual system to compensate for the loss, highlighting a balance between stability and compensation in different stages of the visual hierarchy.
Strengths:
The experiment is carefully analyzed, and the data convey a clear and interesting message about the capacities of plasticity.
Weaknesses:
The existence of unstable fixation and nystagmus in the patient group is alluded to, but not quantified or modeled out in the analyses. The authors may want to address this possible confound with a quantitative approach.
We have responded to this in the “Recommendations for the authors” section of this reviewer, as they included a more detailed description of these points there.
Recommendations for the authors:
Reviewer #1 (Recommendations for the authors):
(1) I think the term rod monochromats should be included early in the paper since it's a more intuitive term to describe this population.
We agree with the reviewer that the term “rod monochromats” is more intuitive as it clarifies the retinal source of the disease but have chosen the term achromats for consistency with a wide literature of published work in this group, including our own and our close collaborators’. To clarify, in the first mention of the group as achromats in the introduction we have now added this term:
“Achromatopsia (also known as rod monochromacy) causes cone photoreceptors in the retina to be inactive from birth (Aboshiha et al., 2014).”
(2) The paper essentially contains two definitions of 'eccentricity'. One (atlas/segments) comes from the Benson atlas and the other (functional) comes from pRF mapping. It would be good to make this distinction terminology clearer earlier in the paper. It would also be good to use more consistent terminology. I assume 'sampled atlas V1 eccentricity' in 3A is the same as 'V1 segment' in 1A?
For consistency we have now referred to these as V1 segment and sampled V1 segment in the figures when describing the atlas-based definition, and eccentricity for the measured pRF-based eccentricity.
(3) The 'stability vs. plasticity' framing in the introduction could be tightened slightly.
We have made the following changes following the reviewer’s comment:
“In the visual domain, the focal point of the debate on plasticity and stability has hinged on the extent to which retinal input deprivation can drive local reorganisation in early visual cortex, for example, for deprived tissue to take on inputs from spared retinal locations (Adams et al., 2007; Baker et al., 2005, 2008; Baseler et al., 2002, 2011; Calford et al., 2005; Dilks et al., 2009; Dumoulin & Knapen, 2018; Ferreira et al., 2016; Goesaert et al., 2014; Haak et al., 2015; Molz et al., 2023; Ritter et al., 2019; Schumacher et al., 2008). In reality visual impairment is a more global phenomenon, affecting all levels of visual processing, with complex dynamics beyond constricted local retinocortical projection zones(Carvalho et al., 2019).”
(4) Figure 1A, define the x axis as degrees.
We have now added the ° sign to all the tick labels indicating Benson map eccentricity.
(5) Figure 2B, is there room for pictures of the silent substitution/standard stimulus
We have now added images in a Supplement 5 to avoid cluttering the main Figure 2B
(6) Figure 2
Panel A has a slightly weird organization. The reader is supposed to compare the square symbols to each other, and the circles to each other, why not organize the figure so they are adjacent in the graph (i.e. non selective control, non-selective achromat, selective control, selective achromat)? That also helps the reader orient that in the non-selective conditions you have almost complete pRF coverage.
We have taken on the reviewer’s suggestion and changed the order.
In the inset, maybe use empty symbols? That's the traditional way to say that the square/circle applies to both red and black.
We prefer the current format.
Figure 2C - the symbols change to circles? Why not keep the symbols of A?
We have now changed the symbols of 2C&D.
I'd put the non-selective maps above the selective maps?
We appreciate the feedback but prefer to keep it as it is, as we feel the critical point is conveyed by the rod maps.
(7) 'We propose a new hierarchical model of neural adaptation'. These ideas are hardly new. There are also other models, that would explain your data (cumulative plasticity) https://www.ncbi.nlm.nih.gov/pmc/articles/PMC5953572/
We thank the reviewer for the reference. We have now cited it in our discussion and removed the word “new” form the mentioned sentence.
“Therefore, there is theoretically broader scope for experience-dependent reweighting of inputs (Beyeler et al., 2017; Makin & Krakauer, 2023) and to optimise use of inputs that are still available, more reliable, or more relevant in the impaired system. Conversely, higher-order visual areas may appear more plastic simply because they integrate the cumulative effects of learning from multiple lower stages (Beyeler et al., 2017).”
We propose a hierarchical model of neural adaptation…” [deleted the word new]
(8) Line 508. No image of the stimulus is contained in the paper
Corrected
(9) Line 620. I believe the Figure is 1B, not 1C.
Corrected
(10) Figure 4A. CF Size - add mm2 to the axes.
Corrected
Reviewer #2 (Recommendations for the authors):
I am not an expert on pRF mapping, and as such, I am unsure how to relate to pRF mapping performed in patients with unstable fixation (not quantified, but referred to) and nystagmus, such as the achromatic population here. Since the majority of the results hinge on this analysis, I would appreciate more data about the differences between the groups. Supplement 2, which is meant to speak to this, shows only the data from 3 typical participants, and in itself is not evidence for "no correlation between stable fixation and enhanced foveal". Additionally, I'd appreciate a clear methods explanation of how the authors address these confounds; this is too important a concern to be left for the discussion section.
We agree with the reviewer that eye movements could affect pRF measures. We have now also included data for all participants where we were able to obtain eye tracking measures and directly tested this relationship. Relevant results are copied below.
Recap of results: 1) as expected gaze was less stable in achromats than controls, 2) achromats with more stable gaze did not show more activation in the scotoma projections zone, which we might have observed if fixation instability masks signals in this region 3) Gaze instability was not correlated with pRF size and eccentricity across V1 in achromats. We note that the relationship between nystagmus and visual sampling is complex - patients experience a stable image and may sample only during a specific phase of the eye movement. It is therefore not inherently clear if and how nystagmus affects pRF size.
Relevant Manuscript text incorporating these analyses is copied below.
To quantify eye movement, we used the following methods added to the manuscript:
“Fixation stability
Participants’ gaze was tracked throughout all pRF mapping runs. Collecting reliable gaze data from individuals with nystagmus is a challenge because out of the box calibration procedures mostly fail without stable fixation. To account for this, we implemented a post-hoc custom calibration procedure (Tailor et al., 2021). The eye-tracker was first precalibrated on a typically sighted individual. Then, before every other run, we collected gaze data from a 5-point fixation task (at fixation and above, below, left, and right of fixation at 5 eccentricity). This data allowed us to subsequently map the patient's recorded gaze coordinates to their precise locations on the screen. In 10 out of the 14 achromats we acquired reliable enough data to assess fixation stability.
Calibration data processing: We first removed the first 0.5 seconds for each fixation location to allow for fixation to arrive on the target. We then performed (a) blink removal, (b) filtered out time points with eye movement velocity outliers (±2SD), and (c) filtered out any positions >3SDs to the left or right of the mean fixation location, and >1SD above or below. We took the median of the remaining gaze measurements as an approximate fixation estimate. The resulting 5 median fixation locations were used to fit an affine transformation that remapped the recorded gaze positions into screen space.
Quantifying fixation stability: after applying the transformation of the post-hoc calibration, data was filtered for blinks and extreme velocities (<2SD). For each functional run, fixation instability was measured as the standard deviation of gaze x-positions across 1second windows. Measures when then averaged across the two run repeats.”
Results (coverage section):
“Another potential confound in our findings is fixation instability. In pRF mapping, which is usually conducted under photopic (cone-dominant) conditions, unstable fixation can cause a signal drop in the foveal projection zone. As expected due to nystagmus, the achromatopsia group showed higher fixation instability compared to controls (rodselective: t<sub>(9.08)</sub>=-3.19, p=0.01; non-selective: t<sub<(9.41)</sub>=-4.88, p<0.001 degrees-offreedom corrected for unequal-variance; see Supplement Figure S2a). However, several lines of evidence suggest this instability cannot fully account for the lack of "filling in" in achromats. First, within the achromat group, we found no correlation between fixation stability and coverage (rod-selective: spearman-r<sub>(8)</sub> = -0.36, p=0.31; non-selective spearman-r<sub>(8)</sub>=0.07,p=0.85); Individuals with more stable, control-like fixation did not show more signal inside the scotoma (see Supplement 2). Second, in adults with achromatopsia, typically with less severe nystagmus (Kohl et al., 1993), two recent studies also found absence of filling in (Anderson et al., 2024; Molz et al., 2023).
So, while we cannot fully exclude nystagmus masking foveal signals in the cortex of some patients, this converging evidence from structural and functional MRI measures across different studies and groups, strongly suggests that the deprived cortex does not substantially ‘fill in’ with peripheral rod inputs in achromatopsia.”
Results (pRF size + eccentricity):
“Larger pRFs indicate that neuronal populations in achromats’ V1 cortex, combine information across larger areas in visual space than in typically sighted controls. This could reflect true neural tuning differences as well as be driven by larger eye movement. However, fixation instability in achromats do not significantly correlate with pRF size in our sample (rod-selective: spearman-r<sub>(8)</sub> = -0.41, p=0.24; non-selective spearman-r<sub>(8)</sub>=0.37,p=0.29)
It has been shown that fitting artefacts around scotoma edges, can give rise to similar outward eccentricity shifts (Binda et al., 2013). However, when accounting for fitting artefacts around the foveal scotoma edge by modelling the rod-free zone during pRF fitting, pRF size and eccentricity differences remain unchanged (see Supplement 3). Finally, we found no significant correlations between gaze stability and the eccentricity shift (rod-selective: spearman-r<sub>(8)</sub> = 0.58, p=0.08; non-selective spearman-r<sub>(8)</sub>=0.09,p=0.8, Supplement 4D)
Together, these analyses reveal subtle differences in how V1 of achromats responds to rod signals outside the foveal zone, which are consistent with results from other studies (Molz et al. 2023, Anderson et al. 2024). While we found no direct evidence that these are being driven by confounding factors such as eye-movements or fitting artefacts, more work is needed to understand the underlying processes that give rise to these shifts.”
The following text has been added to Supplement 2
“As expected, achromats showed significant higher fixation instability compared to controls (as reported in the main text). We found no significant correlation between fixation instability and either coverage, pRF size, eccentricity in achromats. Results of Spearman R correlations in both rod- and non-selective conditions are reported in the figure. We note that the relationship between nystagmus and visual sampling is complex- patients experience a stable image and may sample only during specific eyemovement phases. It is therefore not fully clear if and how nystagmus should give rise to altered pRFs.”
The field connectivity analysis similarly seems to be used only on task data from the same design; if it was replicated from resting-state data, that would be a good way to show consistency which is independent of measures requiring fixation.
We agree that resting-state data would be valuable; however, we did not collect such data in these individuals due to time limitations. Instead, we demonstrate the consistency and reliability of our results by replicating our findings across two different stimulation conditions (rod-selective and non-selective), which differ in luminance, contrast and signal amplitude in both groups and for controls also in the photoreceptors involved. The convergence of results across these distinct visual conditions strengthens our confidence in the reliability of the observed effects. Also, notably, CF estimates have been shown to be robust to large eye movements, and therefore also to differences in fixation stability across groups (Tangtartharakul et al., 2023).
The authors may want to contextualize their findings in relation to what reorganization exists in cases of late-onset loss of part of the visual field on one hand (stroke recovery), and in the case of complete blindness from early life on the other, as both speak to different levels of plasticity the visual system is capable of.
We thank the reviewer for their comment and have added a new paragraph discussing this topic.
Discussion:
“Our findings on hierarchical adaptation have broader implications for other visual disorders, depending on their timing and nature. For instance, a central scotoma acquired in adulthood, as in macular degeneration, may not trigger the same V3 sampling shifts (Haak et al., 2016), suggesting a sensitive window for this form of plasticity, after which connective fields remain more stable. This also raises questions about congenital blindness, where the absence of any driving input could lead to weakening or repurposing of hierarchical connections (Saccone et al., 2024). Moreover, principles may differ between a deprived but structurally intact cortex, as in retinal dystrophies, and a physically damaged cortex, as in stroke. In the latter, more extensive reorganisation may be required to sample effectively from surviving, and potentially disparate, regions of V1. Perceptual training effects in stroke rehabilitation may reflect such dynamics (Cavanaugh et al., 2025; Elshout et al., 2021).”
A more minor point: Can the authors clarify what the dark adaptation is used for, and provide the supplementary analysis showing that the duration difference for some of the participants didn't impact the results (stated but not shown).
The dark adaptation period before the rod-selective condition allowed rod photoreceptors to recover from bleaching caused by prior mesopic light exposure, ensuring optimal rod sensitivity under scotopic conditions. To verify that our 15-minute adaptation period was sufficient, we tested 10 control participants with an extended 45-minute adaptation period. As we found no differences in the resulting rod maps between standard and extended adaptation protocols, these participants were combined with the main control group for all analyses. Author response image 5 are the plots for the two dark adaptation periods.
Author response image 5.
-
-
www.medrxiv.org www.medrxiv.org
-
On 2021-06-13 21:16:52, user thomas wrote:
I am not in the health field (that may be obvious from the questions I have) but I am very interested in this study because my parents (in their 70's) both had and recoverd from covid. They have not received a vax yet.
-
Why wouldn't having the infection give immunity? Is there something about this specific virus, or this type of virus in general, that it wouldn't be expected to give immunity?
-
If infection doesn't give immunity, how will the vaccines work? I realize some vaccines are mRNA or viral vector, but at least the two Chinese ones, the Indian one, and a new one the French are working on are all based on using a dead/weakened virus. Shouldn't recovering from an actual infection work just as good as the simulated infection of a vaccine?
-
Is 1,359 subjects really considered small? How big where the sample sizes for the initial vaccine studies? What would be an acceptable size? My background is more in the social sciences, and we often see samples in the hundreds.
-
Is it really correct to assume that people who had COVID would be more careful afterwards? I know with my parents, they were almost consumed with fear about catching the disease, but once they did and recovered, much of that went away. I wasn't around to see their behavior, but just based on conversations, I find it hard to believe they were more careful.
When my parents saw the doctor after recovering, he told them they could not get the vaccine for at least 3 months and that they didn't need to get it until after 6 months. So this study seems in line with what the medical establishment was already saying (they had COVID back in March).
-
-
On 2021-06-11 13:41:25, user Christy Blanchford wrote:
We don't develop long lasting immunity to the other 4 common covid viruses so why would we have long term immunity to covid 19? This was only 42 days out, we get reinfected with the covid common cold after 1-2 years. Manus, Brazil showed us that despite 80% covid infection rate that should have conferred herd immunity , 6 months later they were digging mass graves again. This paper is doing a disservice....
-
-
www.medrxiv.org www.medrxiv.org
-
On 2020-04-30 19:12:43, user Sinai Immunol Review Project wrote:
Main findings<br /> This report describes the use of systemic tissue plasminogen activator (tPA) to treat venous thromboembolism (VTE) seen in four critically ill COVID-19 patients with respiratory failure. These patients all exhibited gas exchange abnormalities, including shunt and dead-space ventilation, despite well-preserved lung mechanics. A pulmonary vascular etiology was suspected.
All four patients had elevated D-dimers and significant dead-space ventilation. All patients were also obese, and 3/4 patients were diabetic.
Not all patients exhibited an improvement in gas exchange or hemodynamics during the infusion, but some did demonstrate improvements in oxygenation after treatment. Two patients no longer required vasopressors or could be weaned off them, while one patient became hypoxemic and hypotensive and subsequently expired due to a cardiac arrest. Echocardiogram showed large biventricular thrombi.
Limitations<br /> In addition to the small sample size, all patients presented with chronic conditions that are conducive to an inflammatory state. It is unclear how this would have impacted the tPA therapy, but it is likely not representative of all patients who present with COVID-19-induced pneumonia. Moreover, each patient had received a different course of therapy prior to receiving the tPA infusion. One patient received hydroxychloroquine and ceftriaxone prior to tPA infusion, two patients required external ventilator support, and another patient received concurrent convalescent plasma therapy as part of a clinical trial. Each patient received an infusion of tPA at 2 mg/hour but for variable durations of time. One patient received an initial 50 mg infusion of tPA over two hours. 3/4 patients were also given norepinephrine to manage persistent, hypotensive shock. Of note, each patient was at a different stage of the disease; One patient showed cardiac abnormalities and no clots in transit on an echocardiogram, prior to tPA infusion.
Significance<br /> The study describes emphasizes the importance of coagulopathies in COVID-19 and describes clinical outcomes for four severe, COVID-19 patients, who received tPA infusions to manage poor gas exchange. While the sample size is very limited and mixed benefits were observed, thrombolysis seems to warrant further investigation as a therapeutic for COVID-19-associated pneumonia that is characterized by D-dimer elevation and dead-space ventilation. All four patients had normal platelet levels, which may suggest that extrinsic triggers of the coagulation cascade are involved.
The authors suspect that endothelial dysfunction and injury contribute to the formation of pulmonary microthrombi, and these impair gas exchange. Pulmonary thrombus formation has also been reported by other groups; post-mortem analyses of 38 COVID-19 patients' lungs showed diffuse alveolar disease and platelet-fibrin thrombi (Carsana et al., 2020). Inflammatory infiltrates were macrophages in the alveolar lumen and lymphocytes in the interstitial space (Carsana et al., 2020). Endothelial damage in COVID-19 patients has also been directly described, noting the presence of viral elements in the endothelium and inflammatory infiltrates within the intima (Varga et al., 2020). One hypothesis may be that the combination of circulating inflammatory monocytes (previously described to be enriched among PBMCs derived from COVID-19 patients) that express tissue factor, damaged endothelium, and complement elements that are also chemotactic for inflammatory cells may contribute to the overall pro-coagulative state described in COVID-19 patients.
References<br /> Carsana, L., Sonzogni, A., Nasr, A., Rossi, R.S., Pellegrinelli, A., Zerbi, P., Rech, R., Colombo, R., Antinori, S., Corbellino, M., et al. (2020) Pulmonary post-mortem findings in a large series of COVID-19 cases from Northern Itality. medRxiv. 2020.04.19.20054262.
Varga, Z., Flammer, A.J., Steiger, P., Haberecker, M., Andermatt, R., Zinkernagal, A.S., Mehra, M.R., Schuepbach, R.A., Ruschitzka, F., Moch, H. (2020) Endothelial cell infection and endotheliitis in COVID-19. Lancet. 10.1016/S0140-6736(20)30937-5.
The study described in this review was conducted by physicians of the Divisions of Pulmonary, Critical Care, and Sleep Medicine, Cardiology, Nephrology, Surgery, and Neurosurgery and Neurology at the Icahn School of Medicine at Mount Sinai.
Reviewed by Matthew D. Park as part of a project by students, postdocs, and faculty at the Immunology Institute of the Icahn School of Medicine, Mount Sinai.
-
-
www.medrxiv.org www.medrxiv.org
-
On 2021-06-23 21:55:50, user David Wiseman PhD wrote:
Summary:<br /> Regarding the continued and unnecessary confusion related to the Argoaic and Artuli comments.<br /> 1. These are in reality distractions from the central issue that the original NEJM paper remains uncorrected in NEJM as to shipping times. Although a secondary issue, also uncorrected is the "days" nomenclature that is the reason for confusion in the Argoaic and Artuli comments on this forum. Also uncorrected in the original paper is the exposure risk definition which were informed were also incorrect. Together, these issues controvert the conclusions of the original study.<br /> 2. The incorrect nomenclature for "days" in the NEJM paper as well as in a follow up work (Clin Infect Dis, Nicol et al.) inflates the number of "elapsed time" days. This has not been corrected by the original authors. We on the other hand have corrected this by providing the correct information in our preprint.<br /> 3. Dr. Argoaic seems to have been given a wrong and earlier version (10/26) of the data which, although contains a variable that is supposed to correct the above problem, does not. In fact one cannot come to any conclusion that there is a discrepancy based on this incorrect 10/26 version, unless you have some preconceived notion.<br /> 4. Other post hoc analyses reported in follow up works (including social media) by the original authors looking at time from last exposure, or using a pooled placebo group, although flawed for a several reasons, when examined closely, nonetheless support our conclusions that early PEP prophylaxis with HCQ is associated with a reduction of C19.
Detail:<br /> Any confusion about "days" would disappear once the original authors correct the NEJM June 2020 paper as well as a follow up letter in Dec 2020 Clin Infect Dis (see upper red graph in Nicol et al. pubmed.ncbi.nlm.nih.gov/332... "pubmed.ncbi.nlm.nih.gov/33274360/)"). These errors inflate the "DAYS" by 1 day because the nomenclature for describing "days" was incorrect. As far as we know those corrections have not been made in the journals where these errors appear and in a way that can be retrieved in pubmed etc..
As far as we can tell, anyone who has cited the NEJM paper (NIH guidelines, NEJM editorial, many meta-anlayses etc., our protocol in preprint version) also misunderstood the "days" to mean the inflated figure. So the authors need to correct this. As far as we know we are the only ones to do this. After we were informed of this error by the PI (who was unaware of the problem himself) we described this problem very clearly in our preprint, distinguishing between elapsed time and the day on which a study event occurred. For the benefit of those who remain confused, we will endeavor to make it even clearer in a future version. You can read our correspondence log referenced in the preprint to verify that the incorrect "days" nomenclature was unknown to the PI, at least until 10/27 when he informed us about it.
You are confusing "DAY ON which an event occurred" with "DAYS FROM when an event occurred." For example the original NEJM Table 1 says "1 day, 2 days etc." for "Time from exposure to enrollment". This falsely inflates the number of elapsed time days by 1, and as the authors informed us (documented in our preprint), this really means DAY ON which enrollment occurred, with Day 1 = day of exposure, so you need to subtract 1 from the days to get elapsed time FROM exposure. The same error is repeated in Nicol et al. (note: we discuss other unrelated issues relating to time estimates in our preprint).
To confuse matters further, the problem is not even corrected in the dataset linked (datestamp 10/26/20) in the Argoaic comment. In column FS there is a variable "exposure_days_to_drugstart." This appears to indicate elapsed time (ie DAYS FROM) when it actually means the "DAY ON" nomenclature. We were only informed of the nomenclature error on 10/27/20 and later provided with a new version of the dataset on 10/30 where an additional variable "Exposure_to_DrugStart" (column GR) was provided that corrects this error by subtracting 1 from all the values.
Why the Argoaic comment does not link to the correct 10/30 version is unclear, but in this incorrect 10/26 version, the values for the new variable "Exposure_to_DrugStart" (column GR) are IDENTICAL to those in the "exposure_days_to_drugstart" (column FS) variable (they should be smaller by 1). Accordingly, unless Drs. Argoaic and Artuli had a preconceived notion (without checking the data) that some alteration had occurred, it is impossible to draw such a conclusion (albeit one that is incorrect for other reasons) from this incorrect 10/26 dataset. A number of colleagues have downloaded the 10/26 dataset from the link provided in the Agoraic comment, and have verified this problem.
So in addition to the original data set released in August 2020, as well as the three revisions (9/9, 10/6 and 10/30) we describe in our preprint there is this incorrect 10/26 version. I don't know how many people this affects but it would be appropriate for them to be notified that the version they have may be an incorrect one. An announcement on the dataset signup page covidpep.umn.edu/data would also be in order (nothing there today).
Regarding the possibly higher placebo rate of C19 on numbered day 4 (18.9%). This is matched by a commensurate change in its respective treatment arm, yielding RR=0.624 similar to that for numbered days 2 (0.578) and 3 (0.624), justifying pooling. We don't know if the 18.9% represents normal variation or has biological meaning.
Although they used enrollment time data (completely irrelevant to considering whether or not early prophylaxis is beneficial), the original authors (Nicol et al.) in a post hoc analysis, used a pooled placebo cohort to compare daily event rates (red bar graph). This would mitigate possible effects of an outlying value in the placebo cohort. We applied this same pooled placebo method to the data that correctly takes into account shipping times. This method is still limited because it may obscure a poorly understood relationship between time and development of Covid-19. Although at best this would be considered a sensitivity analysis, we did it to answer the Artuli question. This approach yields the same trends as our primary analysis. Using 1-3 days elapsed time of intervention lag (numbered days 2-4) for Early prophylaxis, there is a 33% reduction trend in Covid-19 associated with HCQ (RR 0.67 p=0.12). Taking only 1-2 days elapsed time intervention lag, we obtain a 43% reduction trend (RR 0.57 p=0.09). This analysis appears to reveal a strong regression line (p=0.033) of Covid-19 reduction and intervention lag.
We also looked at the post hoc analysis provided by the original authors (Nicol et al.) that used “Days from Last Exposure to Study Drug Start,” a variable not previously described in the publication, protocol or dataset, so we have no way of verifying it from the raw data. As in a similar PEP study (Barnabas et al. Ann Int Med) this variable has limited (or no) value, as we are trying to treat as quickly as possible from highest risk exposure, not an event (ie Last Exposure) that occurs at an undefined time later. (even the use of highest risk exposure has some limitation, which the authors pointed out to us and which we discuss in our preprint). Further the Nicol analysis used a modified ITT cohort, rather than the originally reported ITT cohort. with these limitations, pooling data for days 1-3 and comparing with the pooled placebo cohort (yields a trend reduction in C19 associated with HCQ (it is unclear which "days" nomenclature is used) after last exposure from 15.2% to 11.2% (RR 0.74, p=0.179).
Taken together with these "sensitivity" analyses inspired by the original authors' methodology, suggests that this is not an artifact of subgroup analysis. It could be said that any conclusions made by the sort of analyses conducted by Nicol are equally prone to the "subgroup artifact" problem. (also note that in our paper, the demographics for placebo and treatment arms in the early cohort match well).
Mention has been made elsewhere of two other PEP studies (Mitja, Barnabas) which concluded no effect of HCQ. It is important to note that the doses used in these studies were much lower than those used in the Boulware et al. NEJM study. Further, according to the PK modelling of the Boulware group (Al-Kofahi et al.) these doses would not have been expected to be efficacious (the Barnabas study used no substantial loading dose). So citing the Mitja and Barnabas studies to support claims of HCQ inefficacy in the Boulware et al paper is unjustified. On the contrary, taken together three studies suggest a dose-response effect. We discuss this in detail in our preprint.
Lastly it is important to note the since the original NEJM study was terminated early, the entire original analysis can be thought of as a subgroup analysis, with all of the attendant problems referenced by the original authors (and us). There is certainly a great deal of under powering and propensity to Type 2 errors, among the issues inherent in a pragmatic study design. The study was not powered as an equivalence study and so no definitive statement can be made that the HCQ is not efficacious. Along with the still uncorrected (in the original journal) issues of shipping times, "days" nomenclature and exposure risk definitions, there are are certainly many efficacy signals that oppugn the original study conclusions,and controvert the statement made in a UMN press release (covidpep.umn.edu/updates) "covidpep.umn.edu/updates)") that the study provided a "conclusive" answer as to the efficacy of HCQ.
_________________<br /> Please note that despite our offer to Dr. Argoaic to contact us directly to walk though the data to try to identify any issues, we have not been contacted.That offer is still extended to anyone who remains confused. We have also attempted to locate both Drs. Argoaic and Artuli to try to clear up their confusion, but these names do not exist in the mainstream literature (i.e pubmed, medrxiv), nor do they appear to have any kind of internet footprint.
With regard to Table 1 of our preprint, the reason why there are no patients for “Day 1” is that there were no patients who received drug the same day as their high-risk exposure. This is consistent with the PIs comment on 8/25/20 (p10 of email log) (at a time when he thought that there was a “Day zero”) “Exposure time was a calculated variable based date of screening survey vs. data of high risk exposure. Same day would be zero. (Based on test turnaround time, I don’t think anyone was zero days).”
We notice an obvious typo in the heading for the second column of our Table 1, which says “To”. But it should say “nPos”, to match the 5th column (and other tables). It is patently absurd that there should be a category of “1 to 0” days or “7 to 5” days etc. “From” makes no sense either and these typos have absolutely no effect on the analysis, interpretation or conclusions. This will be corrected in a later version.
-
-
www.medrxiv.org www.medrxiv.org
-
On 2021-07-04 05:23:23, user PriyankaPulla wrote:
Major protocol violations occurred at the largest site of the Covaxin phase 3 trial, a private hospital called People's Hospital, which recruited 1700 participants. These violations are documented extensively by multiple media outlets. And these violations raise questions about the integrity of the Phase 3 trial data. They also raise questions about the sponsors' attitude to due process, and the independence/training of the DSMB: both sponsors (the Indian Council of Medical Research and Bharat Biotech) responded to the allegations with cursory dismissals, while the DSMB remained mum.
Further details here: https://www.thequint.com/co...
I am listing a few of the documented irregularities:
- Participants told media outlets that they didn't give their informed consent, an Indian legal requirement. Many participants belonged to disadvantaged tribal communities/were illiterate, which necessitates special consent protocols under Indian law, which investigators didn't follow.
Investigators admitted in a video-recorded press conference that they didn't give participants a copy of their informed-consent form during their first visit, unless participants explicitly asked for it. This strongly suggests that the investigators weren't trained in Indian legal requirements or Good Clinical Practices.
-
Investigators allegedly advertised the trial as a vaccination drive in communities of poor and illiterate people.
-
Dozens of participants say the trial team did not contact them to record solicited adverse events. These participants often didn't have their own mobile phones (mobile phones are the mode through which solicited adverse events were to be collected, as per trial protocol). Even though these participants came from poor communities, investigators didn't foresee the fact that they may not have their own mobile phones, and may be hard to contact. Nor did they attempt to contact them in their homes in the days following the doses.
-
People's Hospital recruited a record 1700 participants in 1.5 months (no other Covaxin trial site in India managed such numbers). In contrast, another government-run Covaxin site in Bhopal struggled to even recruit a few hundred participants, and was, therefore, excluded from the trial. This supports the allegation that People's Hospital misadvertised the trial as a vaccination drive.
-
Many participants told media outlets that they suffered Covid-like symptoms post jab, but the investigators never called them to collect this information. Nor did the participants know where to report their symptoms. This raises questions about how well Covid cases were recorded.
-
Participants say they were denied medical treatment at People's Hospital when they fell sick. This, again, raises questions about how well the investigators captured adverse-events.
-
When one participant at the Bhopal site died, investigators ignored his family's version of the participant's symptoms in their causality analysis. In the family's version, the participant suffered from very severe symptoms (vomiting, dizziness, weakness) for 7-8 days before death, while the investigators claimed he was fine during solicited-adverse event monitoring, and died suddenly.
The dismissal of the family's version of events, when the family was present during the participant's death (but the investigators weren't), raises serious questions about how Serious Adverse Events are investigated. No post-mortem report or causality analysis was shared with the family despite multiple requests. Further, the family alleges that the deceased participant received no phone calls from the investigators to record solicited adverse events in the days leading up to his death.
The investigators could easily have shared proof of their claims by sharing a record of the phone calls with the family. They haven't.
Despite the above serious concerns (which are supported by video testimony from participants broadcast on multiple media outlets, specifically NDTV), the trial's government sponsor, ICMR, and Bharat Biotech, denied all allegations in a cursory manner. Further, the preprint makes no mention of them, or explain how these irregularities were handled.
This raises questions about overall data integrity in Bharat Biotech's phase 3 trial. Bharat Biotech has been under substantial pressure from the government to roll out Covaxin fast, which may explain why the company is overlooking such data integrity issues. More details here: https://www.livemint.com/sc...
Reviewers of this paper, and licensing authorities, including the World Health Organisation, must investigate these allegations thoroughly.
-
-
www.medrxiv.org www.medrxiv.org
-
On 2021-08-28 18:17:03, user Squid Pro Crow wrote:
Despite the fact that I have no formal medical training, I think that I now have the real life experience to knowledgeably comment on this. My wife and I both had our second doses of the Phizer just under 5 months ago. Also my daughter and son-in-law had the Pfizer shots about 3-1/2 or 4 months ago. At the end of a 3 day stay of 2 grandkids i began to get a cough and slight fever, and lost my sense of smell and taste. So I got tested and it was positive, My wife has a cough and body aches and will be tested today. My daughter and son-in-law (in their low 40's) are also experiencing mild symptoms and will be tested today. The kids, of course had very minor symptoms for about a day, and are completely fine. So, assuming that the adults test positive, it seems evident that the delta strain does indeed spread rapidly and easily, and the vaccine(s) may not be as effective against it. HOWEVER, I feel that at my age, with asthma and possibly COPD history, I would be much worse off had I decided against the vaccine, as my symptoms are very mild now, except for the chest congestion that I have (which is already better) that I also get from just about every cold.
My main concern is that there is not enough focus on theraputics, and major health providers like Kaiser just expect even their at-risk patients like me to just sit at home and wait to see if their lips turn blue and they can't breathe, and make it to an E.R. for a company that is usually proactive about health care, this is just stupid. An apparently, this is the norm. There are some treatments that are effective if taken early, but our government and the health system that follows their dictates are afraid to prescribe safe drugs off-label that are semi-proven to be very helpful, like ivermectin, which I managed to get from a nearby Dr. It seems to be helping clear it up even faster--my sense of smell is even starting to come back.
-
-
www.medrxiv.org www.medrxiv.org
-
On 2020-09-08 12:00:16, user Wendy Olsen wrote:
I noted that the assumptions going into this model are a consistent proportion of Overseas and Home students, and a similar size student body, as last year. In addition the cases arriving at UK campuses would be over half from UK Home Students. So even if the assumption of consistent proportion from Overseas turns out untrue, there is still the problem that having more UK Home students will bring more cases into the campuses. I also noted the summary, written by the authors:
Their core estimate is that "81% of the 163 UK Higher Educational Institutes (HEIs) have more than a 50% chance of having at least one COVID-19 case arriving on campus when considering all staff and students. Across all HEIs it is estimated that there will be a total of approximately 700 COVID-19 cases (95% CI: 640 - 750) arriving on campus of which 380 are associated from UK students, 230 from international and 90 from staff. This assumes all students will return to campus and that student numbers and where they come from are similar to previous years. According to the current UK government guidance approximately 237,370 students arriving on campus will be required to quarantine because they come from countries outwith designated travel corridors. Assuming quarantining is 100% efficient this will potentially reduce the overall number of cases by approximately 20% to 540 (95% CI: 500 - 590). Universities must plan for COVID-19 cases ... and ... reduce the spread of disease. It is likely that the first two weeks will be crucial to stop spread of introduced cases. Following that, the risk of introduction of new cases onto campus will be from interactions between students, staff and the local community as well as students travelling off campus for personal, educational or recreational reasons.
"COVID-19 has resulted in the on-campus closure of HEIs across the UK in March 2020 (1). Since that point universities have been working predominantly as virtual establishments with most staff working from home. Autumn sees the start of the new academic term with the potential return of more than 1.5 million UK and almost half a million international students (2).
"The COVID-19 pandemic continues ... approximately 1000 new cases reported each day in the UK, 25,000 across Europe and 250,000 worldwide ((3) accessed 28/03/20). There have been a number of outbreaks of COVID-19 reported in universities in the USA (The University of North Carolina, Notre Dame in Indiana, Colorado College, Oklahoma State and University of Alabama (4)) where the national infection rate is approximately 10 times higher than the UK (3). advice ...(5, 6). However, it is currently unknown to what extent COVID-19 will be brought to campus by staff and students whether from the UK or abroad."
-
-
www.medrxiv.org www.medrxiv.org
-
On 2020-10-25 19:08:24, user Daniel Haake wrote:
Dear study team,
Thank you for your study, which shows that the risk of COVID-19 death increases significantly with age. To improve the quality of the study I have some comments regarding the statistical analysis of the study. In the following I would like to go into it.
The time of the determination of the death figures
You write that antibodies are formed in 95% of people after 17-19 days. In contrast, 95% of deaths are reported after 41 days. That is a difference of 22-24 days. Nevertheless, you take the number of deaths 28 days after the midpoint of the study. Why do you take a later point in time than you yourselve have determined? Even with this approach, you are 4 - 6 days too late and overestimate the number of deaths. Why even this would be too late, I will explain in more detail below.
The 41 days were given for the USA. But what is the situation in other countries? In Germany, for example, there is a legal requirement that the death must be reported after 3 working days at the latest. Of course there can also be unrecognized deaths in Germany, where it takes longer to report. But this should be the minority. If we transfer however this fact of the USA to other countries, in which the risk of the long reporting time does not exist in such a way, you take up too many deaths into the counter of the quotient with. This leads to a too high IFR.
Counting the deaths 28 days after the study midpoint is also problematic because in the meantime, further deaths may appear in the statistics that were not infected until after the infected persons identified in the study became infected. This is because not all deaths take as long to report. These are then deaths that are not related to the study. You yourself write that the average value of the report of a dead person lasts 7 days with an IQR of 2 - 19 days. These figures speak in the statistical sense for a right-skewed distribution in the reporting of death figures. This in turn means that the majority of the deceased have a rather shorter reporting time. The procedure leads to a too high number of deaths. This is a problem especially with still existing infection waves, even with already declining infection waves.
You write: “The mean time interval from symptom onset to death is 15 days for ages 18–64 and 12 days for ages 65+, with interquartile ranges of 9–24 days and 7–19 days.”<br /> If we assume the 3 days reporting time for Germany, we receive 18 days for the age 18-64 and 15 days for 65+. In contrast, 95% of the antibodies are formed after 17-19 days, which is about the same or later than the time when the dead appear in the statistics. For other countries this may be different and would therefore need to be investigated. In any case, a blanket assumption from the USA is not possible for studies outside the USA.
Since the mean time interval from onset of symptoms to death is 15 days for the age 18-64 with the interquartile range of 9-24 days, but the midpoint of the range would be 16.5 days, this suggests a right-skewed distribution in the values. The same applies to the mean time interval from the onset of symptoms of 12 days with interquartile range of 7-19 days for the age 65+, where the midpoint of this range is 13 days. This also speaks for a right-skewed distribution of the values. This would mean that the majority of the values would be below the mean value in each case, making shorter times more likely. This also shifts the time too far back. Therefore it would be better to assume the median value, because it is less prone to outliers.
Your example infection wave from figure 1 also shows the problem with this procedure. As you say, antibodies are formed in 95% of people after 17 - 19 days. Now you have an example study with the median 14 days after the start of infection. At that time, only a few of the infected persons have formed antibodies at all, since just 14 days before the infection wave starts with low numbers and then increases. Only 4 days before is the peak of the infection wave. This means that the time period, which is very strongly represented, cannot have developed any antibodies at all. This leads to the fact that only very few infected persons are recognized as infected. In your example, 95% of the deceased are now infected, but only very few of the infected. This leads to a clear overinterpretation of the IFR.
Due to the problems mentioned, the number of deaths should therefore be taken at the median time of the study. Of course, it would be best if the studies took place immediately after the end of a wave of infection, where the death rates are stable and the expression of antibodies is complete.
Antibody Studies
You write: "A potential concern about measuring IFR based on seroprevalence is that antibody titers may diminish over time, leading to underestimation of true prevalence and corresponding overestimation of IFR, especially for locations where the seroprevalence study was conducted several months after the outbreak had been contained.“
You have made many assumptions about the death figures and adjusted the death figures (upwards) accordingly. Here you find that the antibodies disappear over time and that this can lead to an underestimation of the number of infected persons. However, you do not adjust the number of infected persons upwards, unlike your approach to adjusting the death figures. For example, a study by the RKI found that 39.9% of those who tested positive for PCR before did not develop antibodies (https://www.rki.de/DE/Conte... "https://www.rki.de/DE/Content/Gesundheitsmonitoring/Studien/cml-studie/Factsheet_Bad_Feilnbach.html)"). From this, we could conclude that the antibody study only detected around 60% of those previously infected and that the number of infected persons would have to be adjusted accordingly. But you have not done that. I can understand that you did not do that. I wouldn't have done it either, because we don't know how this is transferable to other studies. But in adapting the dead, you have transferred such assumptions to other studies. This should therefore also be avoided. There, too, we do not know how transferable it is. If you only make an adjustment in the dead, but not justifiably in the infected, this leads to an overestimated IFR.
PCR tests from countries with tracing programs
You write in your appendix D: "By contrast, a seroprevalence study of Iceland indicates that its tracing program was effective in identifying a high proportion of SARS-CoV-2 infections“.
In my opinion this is a wrong conclusion. In my opinion, it is not the success of the tracing program, but the number of tests and thus fewer unreported cases. To date, Iceland has performed almost as many tests as there are inhabitants in Iceland. Therefore they could keep the number of unreported cases lower. Other countries did not test as much. Therefore the results are not easily transferable to other countries. The PCR tests only show the present, but not the past and not the untested.<br /> You write it yourself: „(…) hence we make corresponding adjustments for other countries with comprehensive tracing programs, and we identify these estimates as subject to an elevated risk of bias.“<br /> Nevertheless, you leave these studies in meta-analysis, although for the reasons mentioned above this leads to severe problems. The figures for countries with tracing programs should therefore not have been included. The estimated number of unreported cases is not known and cannot be taken over by Iceland.
Study selection
You sort out some seroprevelence studies. These include Australia [63], Blaine County, Idaho, USA [67], Caldari Ortona, Italy [72], Chelsea, Massachusetts, USA [73], Czech Republic [75], Gangelt, Germany [79], Ischgl, Austria [81], Riverside County, California, USA [98] , Slovenia [101] and Santa Clara, California, USA [116]. For the most part, these studies are sorted out because there is no age specification for seroprevelence. Since this is the study's investigation, this is of course understandable. However, these studies in particular have shown calculated IFR values between 0.1% and 0.5%. At the same time, you leave the numbers of PCR tests from countries with tracing programs in the meta-analysis. As already mentioned, this is not correct due to the unknown dark figure and the transfer from Iceland is also not possible, as described before. This leads to the fact that studies with low values are sorted out, but at the same time uncertain numbers with high values are left in the study. This shifts the calculated IFR value upwards in purely mathematical terms.
It is precisely the outliers upwards that cause problems in the calculation. Since the numbers are rather small (in a mathematical sense), there can be no deviation as strong downwards as upwards. This means that there may be studies that deviate perhaps 0.2 percentage points downwards, but other studies that deviate upwards by 1.2 percentage points. This is a problem for the regression, because the regression then leads to too high values. Therefore, outlier detection should be performed upstream and the outliers should be excluded. You can also make it easier by taking the median value, since it is less susceptible to outliers. But then you would have only one value.
You write: “The validity of that assumption is evident in Figure 3: Nearly all of the observations fall within the 95% prediction interval of the metaregression, and the remainder are moderate outliers.”<br /> You can see it in figure 3, but due to the logarithmic scale it is difficult to estimate the ratios. Better suited is Figure 4, which would be desirable for the different age groups to be able to make a better estimation there. Figure 4 shows that many studies are outside the confidence interval, often to a considerable extent and to a greater extent also towards the high IFR values. Looking at the values and the confidence interval, these studies must have significant z-scores, which would show that these are clearly outliers that should not be considered. This leads to the fact that the regression will be brought further in the direction of high values, which results in too high IFR values.
Adjustment of death rates for Europe due to excess mortality
In Appendix Q you write: "In the absence of accurate COVID-19 death counts, excess mortality can be computed by comparing the number of deaths for a given time period in 2020 to the average number of deaths over the comparable time period in prior calendar years, e.g., 2015 to 2019. This approach has been used to conduct systematic analysis of excess mortality in European countries.[159] For example, the Belgian study used in our metaregression computed age-specific IFRs using seroprevalence findings in conjunction with data on excess mortality in Belgium“
I understand why you want to do this. But there are some dangers involved. The above statement may be true for Belgium, but it cannot be transferred to other countries in a general way. Especially since you cannot say in general terms that every dead person above average is a COVID 19 dead person. Mathematically, this would mean that there have been COVID-19 deaths in some of the last few years, because there have been periods with more deaths than the average. This makes the average straight. Especially since, as I said, you can't simply say that every death above the average is a COVID-19 death. The majority will be it, but not necessarily everyone. Thus, even cancer operations that did not take place or untreated heart attacks due to the circumstances and unnoticed visits to the doctor may have contributed a share. Whether this is the case, we do not know without a study. A blanket assumption that every death above the mean value is a COVID-19 death is not correct. From the statement "For example, the Belgian study used in our metaregression computed age-specific IFRs using seroprevalence findings in conjunction with data on excess mortality in Belgium", we could also conclude that the number of reported COVID-19 deaths is correct and can therefore be used as the numerator of the quotient for calculating the IFR. <br /> If you take this as a blanket assumption, how do you deal with those countries that do not have excess mortality but have several thousand COVID-19 deaths in the official statistics? Would you then correct the number of COVID-19 deaths downwards, perhaps even to 0? Certainly not.
Variation in the IFR
You write: "We specifically consider the hypothesis that the observed variation in IFR across locations may primarily reflect the age specificity of COVID-19 infections and fatalities.“
It is also possible that the variation in the calculated IFRs occurs due to still different dark figures. If, for example, the PCR tests are taken in countries with a tracing app, but an IFR based on Iceland is calculated there, this can lead to incorrect and too high IFR values. Also the adjustments of the death rates themselves or the late time of the death rate determination 4 weeks after the study center can lead to this high variance.
Conspicuous features regarding the correct determination of the death figures
In Table 1 you write that on July 15 there were 8 million inhabitants with a projected 1.6 million infections. According to my research there are 8.4 million inhabitants. You calculate the 1.6 million infected on the basis of the 22.7% infected in the study. However, the blood samples were taken between April 19 and 28, so the infections occurred before or until the beginning/middle of April. So you now take the number of infected persons from the beginning/mid-April or from April 24 (study midpoint) and insert them for July 15, i.e. just under 3 months later! In the meantime, however, not only people have died, but have also become infected and formed antibodies. They thus increase the numerator of the quotient, but leave the denominator unchanged, although the denominator would also be higher. So you shift the IFR upwards here as well.
The study on Gangelt, which was not taken into account, shows a similar picture. You write that at the end of June there were 12 deaths and therefore the IFR rises to 0.6%. That is 8 weeks (!) after the study center. This does not take into account that in Germany the deaths must be reported after 3 days. If you have proceeded in this way when calculating the other IFRs from other studies, this suggests that the IFR values are too high.
Calculation of the IFR of Influenza
You calculate the IFR of influenza based on the CDC figures for the 2018/2019 influenza season and indicate the IFR as 0.05%. Firstly, it should be said that statistically it is never good to look at just one value. The average of a time series should be considered. You calculate the value by looking at the estimated deaths and looking at how many were estimated to be symptomatically infected with influenza. You use a study according to which about 43.4% of cases are asymptomatic or subclinical (95% CI 25.4%-61.8%). You then take the mean value from the confidence interval with the value 43.6% and use this figure to calculate how many people were probably infected with influenza. Statistically it is not correct to take the average value of 43.6%. The value of 43.4% must be taken. Due to the small difference, this does not make much difference, but it shows the statistically imprecise consideration that runs through the study and generally leads to an IFR that is too high or, in the case of influenza, too low.
Now a statement on the selection of the 2018/2019 flu season, the CDC writes: "These estimates are subject to several limitations. (...) Second, national rates of influenza-associated hospitalizations and in-hospital death were adjusted for the frequency of influenza testing and the sensitivity of influenza diagnostic assays, using a multiplier approach3. However, data on testing practices during the 2018-2019 season were not available at the time of estimation. We adjusted rates using the most conservative multiplier from any season between 2010-2011 and 2016-2017, Burden estimates from the 2018-2019 season will be updated at a later date when data on contemporary testing practices become available. (...) Fourth, our estimate of influenza-associated deaths relies on information about location of death from death certificates. However, death certificate data during the 2018-2019 season were not available at the time of estimation. We have used death certification data from all influenza seasons between 2010-2011 and 2016-2017 where these data were available from the National Center for Health Statistics. (…)
The CDC writes the same for the 2017/2018 season, so the values, which were always only estimated anyway, were estimated even more due to missing data. Therefore we should have considered the figures for the seasons 2010/2011 to 2017/2017. If we calculate the IFR of influenza in this way and also use the confidence interval to calculate the number of people potentially infected per season, we get an IFR of influenza of 0.077%, ranging from 0.036% to 0.164%. Every single year prior to the 2018/2019 season was above the 0.05% and the average of 0.077% is also 54% above your reported value. This means that influenza is still not as lethal as COVID-19 has been so far, but the factor is not as high as suggested by your study.
It should also be noted that it is not possible to compare an IFR calculation that is equally distributed over age with an IFR of influenza that is not equally distributed over age. You do not do it directly, but by naming these numerical values, this has been taken up by the media. The IFR just indicates the mortality per actually infected person. Therefore the IFR of the actually infected persons of COVID-19 must be compared with the IFR of influenza. You can of course calculate a hypothetical IFR assuming that every age is equally likely to be infected. In this case, however, the calculation must be performed not only for COVID-19, but also for influenza.
I hope I can help you to improve the study in terms of statistical issues. I remain with kind regards.
-
-
www.medrxiv.org www.medrxiv.org
-
On 2019-11-12 00:51:39, user Guyguy wrote:
EVOLUTION OF THE EPIDEMIC IN THE PROVINCES OF NORTH KIVU AND ITURI AT NOVEMBER 10, 2019
Monday, November 11, 2019<br /> Since the beginning of the epidemic, the cumulative number of cases is 3,287, of which 3,169 confirmed and 118 probable. In total, there were 2,193 deaths (2075 confirmed and 118 probable) and 1067 people cured.<br /> 411 suspected cases under investigation;<br /> No new cases confirmed;<br /> No new deaths of confirmed cases have been recorded;<br /> 3 people healed from the CTE in North Kivu in Mabalako;<br /> No health workers are among the newly confirmed cases. The cumulative number of confirmed / probable cases among health workers is 161 (5% of all confirmed / probable cases), including 41 deaths;
NEWS
Awareness and vaccination day for Beni mototaxi drivers with the support of Unicef S / Coordination MVE Beni, Wednesday 06-11 - 2019 HIVUM room
• There were many, about three hundred, the drivers of Mototaxi Beni invited to a day of awareness and vaccination against Ebola Virus Disease this Wednesday, November 06, 2019 in the HIVUM room.
• This day is welcome for the city of Beni during this period of EVD epidemic which, unfortunately, displays a lethality of 86.3% among motorcyclists, as pointed out by Dr. Pierre ADIKEY, Coordinator of the response of Sub Coordination of Beni.
• Thus, in his presentation, he focused his message on the risk of transmission of EVD among motorotaxi drivers and the conduct to be held in the exercise of their craft to protect themselves and the community.
• He asked bikers more often to respect the measures of prevention, namely: washing hands regularly, stopping at checkpoints, not being bribed to divert checkpoints, not carrying suspicious parcels and reporting and / or direct any suspicions of illness to colleagues or the community.
• In order to circumscribe the day, Dr. P. ADIKEY traced the path of the last Motard who died of EVD before his death confirmed at the CTE. To close his presentation, he made a reminder of the various events that prevented the teams of the response from working: among other things the days of the dead city, the fire of the vehicles of the riposte, the destruction of the structures of the care, the cases of resistance and others whose bikers were part of it.
• Dr. Bibiche MATADY, as Epidemiologist and Chair of the Monitoring Commission, introduced to the participants the importance of accepting to be listened to if you are in contact with a case, to let yourself be followed for the entire period indicated and to orient in a management structure as soon as the first sign appears. She also emphasized the collaboration between the bikers and the teams of the response.
• To justify this day again, one of the 3 Hikers shared his testimony and urged his colleagues to collaborate and follow the recommendations of the response teams starting with vaccination.
• Vaccination is one of the preventive measures against EVD, said Dr Adonis TERANYA, the Chair of the Immunization Subcommission. In his presentation, he explained the evolution of the vaccination protocol, the current targets, the side effects and the action to take in the event of an adverse event. Before calling for the voluntary vaccination of participants, he spoke about vaccines currently used in the DRC.
• In his words, the President of Bikers reiterated to the Coordinator the commitment of his organization and all its members to support the interventions of the response, while affirming its availability to any solicitation for the fight against the disease to Ebola virus in the city of Beni and its surroundings.
• The day ended with the vaccination of 100 Bikers and some of their dependents.
VACCINATION
- Since vaccination began on 8 August 2018, 250,234 people have been vaccinated;
- The only vaccine to be used in this outbreak is the rVSV-ZEBOV vaccine, manufactured by the pharmaceutical group Merck, following approval by the Ethics Committee in its decision of 20 May 2018.
MONITORING AT ENTRY POINTS
- Since the beginning of the epidemic, the total number of travelers checked (temperature rise) at the sanitary control points is 115,778,240 ;
- To date, a total of 111 entry points (PoE) and sanitary control points (PoCs) have been set up in the provinces of North Kivu and Ituri to protect the country's major cities and prevent the spread of the epidemic in neighboring countries.
As a reminder, the recommendations of the MULTISECTORAL COMMITTEE OF THE RESPONSE TO EBOLA VIRUS DISEASE are as follows:
- Follow basic hygiene practices, including regular hand washing with soap and water or ashes;
- If an acquaintance from an epidemic area comes to visit you and is ill, do not touch her and call the North Kivu Civil Protection toll-free number;
- If you are identified as a contact of an Ebola patient, agree to be vaccinated and followed for 21 days;
- If a person dies because of Ebola, follow the instructions for safe and dignified burials. It is simply a funeral method that respects funerary customs and traditions while protecting the family and community from Ebola contamination.
- For all health professionals, observe the hygiene measures in the health centers and declare any person with symptoms of Ebola (fever, diarrhea, vomiting, fatigue, anorexia, bleeding).<br /> If all citizens respect these health measures recommended by the Secretariat, it is possible to quickly end this 10th epidemic.
-
On 2019-11-15 16:53:09, user GuyguyKabundi Tshima wrote:
EVOLUTION OF THE EPIDEMIC IN THE PROVINCES OF NORTH KIVU AND ITURI AS AT NOVEMBER 13, 2019
Thursday, November 14, 2019
• Since the beginning of the epidemic, the cumulative number of cases is 3,292, of which 3,174 are confirmed and 118 are probable. In total, there were 2,193 deaths (2075 confirmed and 118 probable) and 1067 people cured.<br /> • 527 suspected cases under investigation;<br /> • 1 new case confirmed in North Kivu in Mabalako;<br /> • No new deaths of confirmed cases have been recorded;<br /> • No cured person has emerged from ETCs;<br /> • No health worker is among the new confirmed cases. The cumulative number of confirmed / probable cases among health workers is 163 (5% of all confirmed / probable cases), including 41 deaths;
NEWS
Ebola Virus Disease Response Co-ordination Announces Three Road Traffic Accident in Bunia, Ituri
• The overall coordination of the response to the Ebola Virus Disease epidemic in North, South Kivu and Ituri was informed on Thursday 13 November 2019 of the tragic traffic accident between two motorcycles, one of which carried three agents of the riposte;<br /> • These three officers, who work for the Epidemiological Surveillance Commission at the Point of Entry and Control, were returning from Bunia to Mambasa, where they are respectively delivering;<br /> • This accident occurred around Marabo in Bunia on the evening of Wednesday 13 November 2019;<br /> • The balance sheet reports an officer who died at the scene and two others who were seriously injured, including one in a coma. The two wounded were taken to the Nyakunde Reference General Hospital in Ituri for appropriate care;<br /> • The overall coordination of the response sends its deepest condolences to the grieving family and expresses all its compassion and solidarity to the injured officers, while wishing them a quick recovery.
Effective start of Johnson & Johnson vaccination in two Goma health areas
• Ebola vaccination with the Ad26.ZEBOV / MVA-BN-Filo vaccine, produced by Janssen Pharmaceuticals for Johnson & Johnson, began on Thursday, November 14, 2019 in two Karisimbi health areas in Goma City , North Kivu Province;<br /> • The Epidemic Response Coordinator for Ebola Virus Disease in North, South Kivu and Ituri. For this purpose, Prof. Steve Ahuka Mundeke visited the vaccination sites to inquire about the evolution of activities in the field. He was satisfied with the work of the teams;<br /> • He took the opportunity to invite the population of the targeted areas to be vaccinated in order to protect themselves from the resurgence of the Ebola virus;<br /> • Several people were present in Majengo and Kahembe health areas to get vaccinated. The first person to be vaccinated is a Kahembe community leader who has been protected against the Ebola virus today and also in case of a possible new Ebola outbreak. This community leader has appealed to all residents of his community and sites targeted to come take this second vaccine. "This is an opportunity not to be missed, because it is said that prevention is better than cure, " he said;<br /> • The logistics of this vaccination are provided by the international non-governmental organization Médecins Sans Frontières of France (MSF / France).<br /> • Approved October 22, 2019 by the Ethics Committee of the School of Public Health of the University of Kinshasa and October 23, 2019 by the National Ethics Committee, this second vaccine, called Ad26.ZEBOV / MVA-BN -Filo , is produced by Janssen Pharmaceuticals for Johnson & Johnson;<br /> • This new vaccine complements the first, the rVSV-ZEBOV, the vaccine used until then in this epidemic. Manufactured by the pharmaceutical group Merck, after approval of the Ethics Committee on May 20, 2018, it was recently approved.
Closing of the training workshop for media professionals in Beni on the role and responsibility of journalists during public health crises
• The Deputy Mayor of the city of Beni, Muhindo Bakwanamaha Modeste, closed this Thursday, November 14, 2019 in Beni in the province of North Kivu the training of media professionals on the role and responsibility during public health crises;<br /> • The coordinator of the Beni Ebola Ebola response sub-coordination, Dr. Pierre Adikey, on behalf of the Coordinator-General of the Response, Prof. Steve Ahuka, wished to see these kinds of trainings be organized, not only in other sub-Coordination of the response, but also throughout the Democratic Republic of the Congo so that journalists from all over the country are ready to face any possible epidemic crisis;<br /> • This training, he said, is part of the zero-case Ebola strategy and strengthening the health system of tomorrow;<br /> • The focal point of Beni's journalists, Moustapha MULONDA, reaffirmed the commitment of journalists to combat Ebola Virus Disease through various programs and publications disseminated and published by their respective media thanks to the new tools acquired during this period. training;<br /> • This training was organized by the Ministry of Health in collaboration with the World Health Organization and benefited from the facilitation of the overall coordination of the response, UNICEF, CDC Africa and MSF.
VACCINATION
• Since the start of vaccination on August 8, 2018 with the rVSV-ZEBOV vaccine, 251,637 people have been vaccinated;
• Vaccination with the second Ad26.ZEBOV / MVA-BN-Filo vaccine, produced by Janssen Pharmaceuticals for Johnson & Johnson, began on Thursday November 14, 2019 in Goma. This vaccine was approved on 22 October 2019 by the decisions of the Ethics Committee of the School of Public Health of the University of Kinshasa and 23 October 2019 of the National Ethics Committee;
• Until then, only one vaccine was used in this outbreak. This is the rVSV-ZEBOV vaccine, manufactured by the pharmaceutical group Merck, after approval of the Ethics Committee in its decision of 20 May 2018 and which has recently been approved.
MONITORING AT ENTRY POINTS
• A 27-year-old woman from Butembo for Goma, an escaped suspect from Makasi Hospital in Butembo, North Kivu, was intercepted at the Kanyabayonga checkpoint in Kayna. When she was intercepted, she experienced signs such as fever at 38.4 ° C, severe asthenia, abdominal pain and vaginal bleeding. It was sent to the KAYNA Transit Center.
• Since the beginning of the epidemic, the total number of travelers checked (temperature rise) at the sanitary control points is 116,622,388 ;
• To date, a total of 112 entry points (PoE) and sanitary control points (PoCs) have been set up in the provinces of North Kivu and Ituri to protect the country's major cities and prevent the spread of the epidemic in neighboring countries.
As a reminder, the recommendations of the MULTISECTORAL COMMITTEE OF THE RESPONSE TO EBOLA VIRUS DISEASE are as follows:
- Follow basic hygiene practices, including regular hand washing with soap and water or ashes;
- If an acquaintance from an epidemic area comes to visit you and is ill, do not touch her and call the North Kivu Civil Protection toll-free number;
- If you are identified as a contact of an Ebola patient, agree to be vaccinated and followed for 21 days;
- If a person dies because of Ebola, follow the instructions for safe and dignified burials. It is simply a funeral method that respects funerary customs and traditions while protecting the family and community from Ebola contamination.
- For all health professionals, observe the hygiene measures in the health centers and declare any person with symptoms of # Ebola (fever, diarrhea, vomiting, fatigue, anorexia, bleeding).<br /> If all citizens respect these health measures recommended by the Secretariat, it is possible to quickly end this 10th epidemic.
-
On 2019-11-30 17:00:40, user Guyguy wrote:
EVOLUTION OF THE EPIDEMIC IN THE PROVINCES OF NORTH KIVU AND ITURI AT NOVEMBER 27, 2019
Thursday, November 28, 2019<br /> • Since the beginning of the epidemic, the cumulative number of cases is 3,309, of which 3,191 are confirmed and 118 are probable. In total, there were 2,201 deaths (2,083 confirmed and 118 probable) and 1077 people healed.<br /> • 443 suspected cases under investigation;<br /> • 5 new confirmed cases, including:<br /> o 4 in Ituri in Mandima;<br /> o 1 in North Kivu in Mabalako;<br /> • 2 new deaths of confirmed cases, including:<br /> o 2 new community deaths in Ituri in Mandima;<br /> o No deaths among confirmed cases in CTEs;<br /> • No cured person has emerged from CTEs;<br /> • No health worker is among the new confirmed cases. The cumulative number of confirmed / probable cases among health workers is 163 (5% of all confirmed / probable cases), including 41 deaths.
NEWS
Three members of the Ebola Virus Epidemic response killed during an attack in Biakato, Ituri
• Following the attack on the sub-coordination of the Biakato response in Ituri on the night of Wednesday 27th to Thursday 28 November 2019, three members of the Ebola response teams in this sector lost their lives ;<br /> • It is a provider and a driver of the vaccination committee and another driver;<br /> • In addition to these three deaths, there are 7 wounded and 6 others with psychological disorders and extensive material damage.<br /> • A good number of these teams from Biakato were evacuated in three waves to Goma. As soon as they arrived, they were greeted by a coordination team led by Prof. Steve Ahuka, general coordinator, who also visited the wounded before going to inquire about the security conditions and accommodation of evacuees. He did not fail to comfort them.
VACCINATION
• The vaccination commission is in mourning. A service provider and a driver of his team were killed on the night of Wednesday 27 November 2019 following attacks at the Biakato base in Ituri;<br /> • 2nd day without vaccination activity with the 2nd J & J vaccine following the disorders initiated by young people related to the security situation in Beni;<br /> • 724 people were vaccinated, until Tuesday, November 26, 2019, with the 2nd Ad26.ZEBOV / MVA-BN-Filo vaccine (Johnson & Johnson) in the two health zones of Karisimbi in Goma;<br /> • Since the start of vaccination on August 8, 2018 with the rVSV-ZEBOV vaccine, 255,373 people have been vaccinated;<br /> • Approved October 22, 2019 by the Ethics Committee of the School of Public Health of the University of Kinshasa and October 23, 2019 by the National Ethics Committee, the second vaccine, called Ad26.ZEBOV / MVA-BN -Filo, is produced by Janssen Pharmaceuticals for Johnson & Johnson;<br /> • This new vaccine is in addition to the first, the rVSV-ZEBOV, vaccine used until then (since August 08, 2018) in this epidemic manufactured by the pharmaceutical group Merck, after approval of the Ethics Committee on May 20, 2018. has recently been pre-qualified for registration.
MONITORING AT ENTRY POINTS
• Sanitary control activities are disrupted in the towns of Beni and Butembo in North Kivu province following demonstrations by the population which decries killings of civilians;<br /> • Since the beginning of the epidemic, the total number of travelers checked (temperature measurement ) at the sanitary control points is 121,159,810 ;<br /> • To date, a total of 109 entry points (PoE) and sanitary control points (PoCs) have been set up in the provinces of North Kivu and Ituri to protect the country's major cities and prevent the spread of the epidemic in neighboring countries.
As a reminder, the recommendations of the MULTISECTORAL COMMITTEE OF THE RESPONSE TO EBOLA VIRUS DISEASE are as follows:
- Follow basic hygiene practices, including regular hand washing with soap and water or ashes;
- If an acquaintance from an epidemic area comes to visit you and is ill, do not touch her and call the North Kivu Civil Protection toll-free number;
- If you are identified as a contact of an Ebola patient, agree to be vaccinated and followed for 21 days;
- If a person dies because of Ebola, follow the instructions for safe and dignified burials. It is simply a funeral method that respects funerary customs and traditions while protecting the family and community from Ebola contamination.
- For all health professionals, observe the hygiene measures in the health centers and declare any person with symptoms of # Ebola (fever, diarrhea, vomiting, fatigue, anorexia, bleeding).<br /> If all citizens respect these health measures recommended by the Secretariat, it is possible to quickly end this 10th epidemic.
-
On 2019-09-30 05:15:29, user Guyguy wrote:
EVOLUTION OF THE EPIDEMIC IN THE PROVINCES OF NORTH KIVU AND ITURI AS AT SEPTEMBER 22, 2019
The epidemiological situation of the Ebola Virus Disease dated September 22, 2019
Monday, September 23, 2019
Since the beginning of the epidemic, the cumulative number of cases is 3,168, of which 3,057 are confirmed and 111 are probable. In total, there were 2.118 deaths (2007 confirmed and 111 probable) and 975 people healed. <br /> • 343 suspected cases under investigation; <br /> • 4 new confirmed cases, including: <br /> • 1 in North Kivu in Butembo; <br /> • 3 in Ituri, including 2 in Mandima and 1 in Mambasa. <br /> • 3 new confirmed deaths, including: <br /> • 2 community deaths, including 1 in North Kivu in Butembo and 1 in Ituri in Mambasa; <br /> • 1 confirmed death in Ituri in Mandima. <br /> • No health worker is among the new confirmed cases. The cumulative number of confirmed / probable cases among health workers is 160 (5% of all confirmed / probable cases), including 41 deaths.
NEWS
Beginning of trainers training in Goma on good clinical practices related to the second Ebola vaccine <br /> • The Ebola Virus Disease Response Information Management Coordinator, representing the Technical Secretariat, Mathias Mossoko, launched on Monday in Goma the training of trainers which runs from 23 to 28 September 2019 on the good clinical practices (PCBs) related to the second Ebola vaccine. <br /> • This training benefits from the expertise of CVD's Malians on the transmission of notions about good clinical practice. It aims to provide participants with the standards applicable to the design, conduct, monitoring and stopping of studies, to teach them the activities of audit, analysis, reporting and documentation with the guarantee that these studies 'rely on sound scientific and ethical principles. It is also intended to introduce participants to the correct documentation of the clinical properties of the vaccine tested or evaluated. <br /> • The Response Information Management Coordinator called the attendance participants to demonstrate better actors for the implementation of good practice in this second vaccine. <br /> • For its part, the chairman of the Immunization Committee, Stéphane Hans, said that this five-day training announces the forthcoming launch of the second vaccine that will come at any time in the targeted health zones. "We welcome this supplementary vaccine very positively compared to the first vaccine. This second vaccine has the advantage of preventing all strains of the Ebola virus. It is therefore positive for the population that will receive it, "he said while inviting all communities targeted by this vaccination to take ownership of this activity, once launched. <br /> • The training on good clinical practice will revolve around several presentations on different topics, among others, the Ebola virus disease, the responsibilities of the INRB for the QA system, study vaccines (storage, management, chain cold and accounting), inclusion and follow-up of pregnant women, community involvement and informed consent, etc. <br /> • This training was organized for the different actors involved in this project, including doctors, epidemiologists, clinicians and pharmacists. A total of 25 people from Kinshasa, including the INRB, UNIKIN, CUK and specialized programs and North Kivu, including the Provincial Health Inspectorate (IPS), the Provincial Division of Health Centers (DPS) and Health Zone Coordinating Offices (BCZS) are participating in this meeting. <br /> As a reminder, the recommendations of the MULTISECTORAL COMMITTEE ON THE RESPONSE TO THE EBOLA VIRUS DISEASE are as follows: * <br /> 1. Follow basic hygiene practices, including regular hand washing with soap and water or ashes; <br /> 2. If an acquaintance from an epidemic area comes to visit you and is ill, do not touch her and call the North Kivu Civil Protection toll-free number; <br /> 3. If you are identified as a contact of an Ebola patient, agree to be vaccinated and followed for 21 days; <br /> 4. If a person dies because of Ebola, follow the instructions for safe and dignified burials. It is simply a funeral method that respects funerary customs and traditions while protecting the family and community from Ebola contamination. <br /> 5. For all health professionals, observe the hygiene measures in the health centers and declare any person with symptoms of Ebola (fever, diarrhea, vomiting, fatigue, anorexia, bleeding). <br /> If all citizens respect these health measures recommended by the Secretariat, it is possible to quickly end this 10th epidemic.
VACCINATION <br /> Opening of an expanded vaccination ring around two confirmed cases from 19-21 Sept 2019 in the Madidi health area in Mambasa, Ituri. Another satellite ring was opened at the Kitatumba General Referral Hospital in the Butembo Health Zone in North Kivu around the case notified on 22 09 2019. This case started the disease in the health area of Kasindi in Mutwanga, North Kivu. <br /> • The Expanded Program of Vaccines has received 4320 doses of vaccine at the national level; <br /> • Since vaccination began on August 8, 2018, 226,722 people have been vaccinated; <br /> • The only vaccine to be used in this outbreak is the rVSV-ZEBOV vaccine, manufactured by the pharmaceutical group Merck, following approval by the Ethics Committee in its decision of 20 May 2018.
MONITORING AT ENTRY POINTS <br /> • High-risk contact was intercepted at Kangote PoC in Butembo, North Kivu. This is a 28-year-old unvaccinated woman on the 14th day (D14) follow-up who was listed around a confirmed case in the Katwa Health Zone. During her interception, this woman presented some signs related to the #Ebola Virus Disease. She was sent to the Butembo CTE for treatment. <br /> • Kituku PoC providers in Goma, North Kivu, were assaulted by about 20 onlookers called "Maibobo" who were avenging one of their drowned during the night of 20 to 21 September 2019. These providers feel insecure and ask to be supported by officers of the National Police (PNC) or FARDC. <br /> • Since the beginning of the epidemic, the total number of travelers checked (temperature measurement) at the sanitary control points up to 22 September 2019 is 96,998,860; <br /> • To date, a total of 111 entry points (PoE) and sanitary control points (PoCs) have been set up in the provinces of North Kivu and Ituri to protect the country's major cities and prevent the spread of the epidemic in neighboring countries.
LEXICON <br /> • A community death is any death that occurs outside a Ebola Treatment Center. <br /> • A probable case is a death for which it was not possible to obtain biological samples for confirmation in the laboratory but where the investigations revealed an epidemiological link with a confirmed or probable case.
-
On 2019-10-04 22:38:03, user GuyguyKabundi Tshima wrote:
EVOLUTION OF THE EPIDEMIC IN THE PROVINCES OF NORTH KIVU AND ITURI AS AT 03 OCTOBER 2019
Friday, October 04, 2019
Since the beginning of the epidemic, the cumulative number of cases is 3,201, of which 3,087 are confirmed and 114 are probable. In total, there were 2.139 deaths (2025 confirmed and 114 probable) and 999 people cured.<br /> 451 suspected cases under investigation;<br /> 3 new confirmed cases, including:<br /> 1 in North Kivu in Beni;<br /> 2 in Ituri, including 1 in Mambasa and 1 in Mandima;<br /> 2 new confirmed deaths in North Kivu, including 1 in Beni and 1 in Mabalako;<br /> 4 people healed from the CTE in North Kivu in Beni;<br /> No health workers are among the newly confirmed cases. The cumulative number of confirmed / probable cases among health workers is 161 (5% of all confirmed / probable cases), including 41 deaths.<br /> Day 18 without response activities in the Lwemba Health Area in Mandima, Ituri.
LEXICON<br /> • A community death is any death that occurs outside a Ebola Treatment Center.<br /> • A probable case is a death for which it was not possible to obtain biological samples for confirmation in the laboratory but where the investigations revealed an epidemiological link with a confirmed or probable case.
NEWS<br /> The 10th Ebola Virus Disease epidemic in the DRC reaches its 1000th cure<br /> - The thousandth cured of the Ebola Virus Disease came out Friday of the Mangina CTE in Mabalako in North Kivu Province;<br /> - Indeed, this 1000th cured is part of four healed Friday of this CTE. It is about a woman, quarantine gone, case contact of her nephew with the Air of Health of Lwemba with Mandima in Ituri. As soon as she felt the fever, she went to the Health Center, where she was detected as a suspected case and transferred directly to the CTE. She was confirmed and followed her treatment until recovery. She advises the population to go quickly to the Health Center and not fear the CTE to cure Ebola Virus Disease;<br /> - Among these four cures, there is also a health provider. This is an ambulance hygienist, the 1001 st healed, who was contaminated during the unloading of his personal protective equipment (PPE). He recommended a lot of protection and precautions to all hygienists when removing PPE. And in case of possible contamination, do not panic, but rather go quickly to the Health Center for appropriate treatment;<br /> - For the Ebola Epidemic Epidemic Response Coordinator, Dr. Faustin Bile Saka, these healers will be the ambassadors for the response in their respective communities and testify that when we arrive early we have the chance to come out healed like them. He handed out the certificates of release to the cured, with the various partners of the response, WHO and IMC to the 1000, 1001, 1002 and 1003 th cures of the Ebola Virus Disease in the DRC;<br /> - As a miracle, the 10th epidemic of the Ebola Virus Disease began around the end of July 2018 and declared in early August 2019 in Mangina and it is still in Mangina, where came the 1000th cured.
VACCINATION
- Since vaccination began on August 8, 2018, 232,725 people have been vaccinated;
- The only vaccine to be used in this outbreak is the rVSV-ZEBOV vaccine, manufactured by the pharmaceutical group Merck, following approval by the Ethics Committee in its decision of 20 May 2018.
MONITORING AT ENTRY POINTS
- Since the beginning of the epidemic, the total number of travelers checked (temperature measurement ) at the sanitary control points is 102,092,950 ;
- To date, a total of 111 entry points (PoE) and sanitary control points (PoCs) have been set up in the provinces of North Kivu and Ituri to protect the country's major cities and prevent the spread of the epidemic in neighboring countries.
As a reminder, the recommendations of the MULTISECTORAL COMMITTEE OF THE RESPONSE TO EBOLA VIRUS DISEASE are as follows:
- Follow basic hygiene practices, including regular hand washing with soap and water or ashes;
- If an acquaintance from an epidemic area comes to visit you and is ill, do not touch her and call the North Kivu Civil Protection toll-free number;
- If you are identified as a contact of an Ebola patient, agree to be vaccinated and followed for 21 days;
- If a person dies because of Ebola, follow the instructions for safe and dignified burials. It is simply a funeral method that respects funerary customs and traditions while protecting the family and community from Ebola contamination.
- For all health professionals, observe the hygiene measures in the health centers and declare any person with symptoms of # Ebola (fever, diarrhea, vomiting, fatigue, anorexia, bleeding).<br /> If all citizens respect these health measures recommended by the Secretariat, it is possible to quickly end this 10th epidemic.
-
On 2019-10-07 13:54:02, user GuyguyKabundi Tshima wrote:
EPIDEMIOLOGICAL SITUATION
EVOLUTION OF THE EBOLA EPIDEMIC IN THE PROVINCES OF NORTH KIVU AND ITURI OCTOBER 05, 2019<br /> Sunday, October 06, 2019<br /> Since the beginning of the epidemic, the cumulative number of cases is 3,204, of which 3,090 are confirmed and 114 are probable. In total, there were 2,142 deaths (2028 confirmed and 114 probable) and 1004 people healed.<br /> 414 suspected cases under investigation;<br /> No new cases confirmed;<br /> 1 new confirmed death at CTE in Ituri in Komanda;<br /> No one healed out of ETCs;<br /> No health workers are among the newly confirmed cases. The cumulative number of confirmed / probable cases among health workers is 161 (5% of all confirmed / probable cases), including 41 deaths.<br /> Day 19 without response activities in the Lwemba Health Area in Mandima, Ituri, where the dialogue continues in the community.
NEWS
Reconciliation between displaced people from Lwemba to Biakato and communities left in Lwemba in Mandima in Ituri
The Lwemba communities that moved to Biakato in Mandima in Ituri reconciled on Sunday 06 October 2019 with the communities that had remained in Lwemba in the presence of the response team led by the Deputy General Coordinator, Dr. Justus Nsio Mbeta, head of the Cheffery and Mandima MCZ, coordinator of Mangina's sub-coordination of the response, as well as some partners from the Ministry of Health, including WHO, MSF, UNICEF and United Nations ;<br /> - From this meeting, follows the following recommendations: setting up a community committee to support the response, the local recruitment of sensitizers in the monitoring of community-based surveillance, decontamination and the workforce in the community. burning houses. The Ministry of Health has promised the next supply of drugs to Lwemba;<br /> - The Deputy General Coordinator for the Ebola Virus Epidemic Response, representing the Ministry of Health and the Technical Secretariat of the CMRE, Dr. Justus Nsio Mbeta, took this opportunity to recall the regulatory role of the Ministry of Health and the role of each partner involved in the response;<br /> - For the community victim of the fire, they ask for the guarantee of their security, the emergency humanitarian aid, the compensation of their destroyed property and the reconstruction of their burned houses, the commitment or the hiring of all victims in the various services at all levels, the immediate arrest of all the alleged perpetrators of these uncivil acts and the care of the children affected;<br /> - These fires occurred following the death of a nurse from Lwemba, confirmed with Ebola Virus Disease. His death sparked the uprising of the population to burn down the houses and other property of all the unknowns of Lwemba. This remains the cause, even, the cessation of the activities of the response in this Health Area for more than 15 days;<br /> - The leaders of the Lwemba community also asked for the construction of the houses for the displaced, the organization of an intercommunal dialogue session by the Administrator of the territory or his delegate and the rehabilitation of the road leading to Lwemba ;<br /> - In the response, WHO is responsible for epidemiological surveillance, communication and prevention against infection (IPC) and immunization, UNICEF is in charge of communication, psychosocial care and PCI, MSF and ALIMA take care of the treatment of patients in Ebola treatment center and PCI and psychosocial support within CTE, WFP brings food products to contacts, IOM deals with Entry and Control Points (water supply, soap and chlorine);<br /> - As for the National Institute for Biomedical Research (INRB), Dr. Nsio stated that he is in charge of the diagnosis and gives MSF and ALIMA the medicines to treat patients with CTE.<br /> - The World Health Organization has pledged to rebuild burned houses, to provide community surveillance (community watch) and investigations of all suspected cases, as well as to build a transit center in LWEMBA, while UNICEF has pledged to improve communication and awareness through the use of space, to support ICH, decontamination and psychosocial, to provide water sources and to build latrines in 5 priority schools;<br /> - On the other hand, Médecins Sans Frontières intends to help the community of Lwemba to resume primary health care, to organize triage in the Health Zones present in the village and to break the PCI, as well as to train sensitizers;<br /> - At the end of this Lwemba meeting, all partners, including WHO, UNICEF and MSF, met around the Deputy General Coordinator at the Biakato Reference Health Center to review the joint and shared planning of activities in Lwemba.
VACCINATION
- Since vaccination began on August 8, 2018, 234,108 people have been vaccinated;
- The only vaccine to be used in this outbreak is the rVSV-ZEBOV vaccine, manufactured by the pharmaceutical group Merck, following approval by the Ethics Committee in its decision of 20 May 2018.
MONITORING AT ENTRY POINTS
- Three high-risk contacts were intercepted on Saturday 05 October 2019 at Maboya Checkpoint (PoC) in Butembo. They are all from the same family and came from the Kabasha Health Area to Kalunguta for Bunyuka in Vuhovi;
- They are all contacts of a confirmed case, died of the Ebola Virus Disease (EVD) of September 30, 2019 in Kabasha;
- The first contact is an unvaccinated 8-year-old girl who presented fever at 38 ° C. She was taken to the CTE of Butembo for the care after validation of the alert was validated;
- The 2nd contact is a 24 year old man vaccinated and asymptomatic. He is the biological father of the first contact;
- 3rd contact, first contact grandmother, 54 years old, unvaccinated and asymptomatic;
- Since the beginning of the epidemic, the cumulative number of travelers checked (temperature measurement ) at the sanitary control points is 102,840,774 ;
- To date, a total of 111 entry points (PoE) and sanitary control points (PoCs) have been set up in the provinces of North Kivu and Ituri to protect the country's major cities and prevent the spread of the epidemic in neighboring countries.
As a reminder, the recommendations of the MULTISECTORAL COMMITTEE OF THE RESPONSE TO EBOLA VIRUS DISEASE are as follows:
- Follow basic hygiene practices, including regular hand washing with soap and water or ashes;
- If an acquaintance from an epidemic area comes to visit you and is ill, do not touch her and call the North Kivu Civil Protection toll-free number;
- If you are identified as a contact of an Ebola patient, agree to be vaccinated and followed for 21 days;
- If a person dies because of Ebola, follow the instructions for safe and dignified burials. It is simply a funeral method that respects funerary customs and traditions while protecting the family and community from Ebola contamination.
- For all health professionals, observe the hygiene measures in the health centers and declare any person with symptoms of # Ebola (fever, diarrhea, vomiting, fatigue, anorexia, bleeding).<br /> If all citizens respect these sanitary measures recommended by the Secretariat, it is possible to quickly end this 10th epidemic.
-
On 2019-10-16 13:01:03, user GuyguyKabundi Tshima wrote:
EVOLUTION OF THE EPIDEMIC IN THE PROVINCES OF NORTH KIVU AND ITURI AS AT OCTOBER 13, 2019<br /> Monday, October 14, 2019<br /> Since the beginning of the epidemic, the cumulative number of cases is 3,220, of which 3,106 confirmed and 114 probable. In total, there were 2,150 deaths (2036 confirmed and 114 probable) and 1033 people healed.<br /> 383 suspected cases under investigation;<br /> 2 new confirmed cases at CTE in Ituri in Mandima;<br /> No new confirmed deaths have been recorded;<br /> 1 person healed out of CTE in Ituri in Mambasa;<br /> No health workers are among the newly confirmed cases. The cumulative number of confirmed / probable cases among health workers is 161 (5% of all confirmed / probable cases), including 41 deaths.
NEWS
Governors of North Kivu and Ituri Raise Awareness on Ebola Virus Disease in Biakato, Ituri<br /> - The Technical Secretariat of the Multisectoral Ebola Epidemic Response Committee (CMRE) in collaboration with the Governor of North Kivu, Carly Nzanzu and Ituri, Jean Bamanisa, organized this Monday October 14, 2019 an awareness raising day on Ebola Virus Disease in Biakato, Ituri;<br /> - This tripartite awareness-raising aimed to share the experience of North Kivu on Ebola Virus Disease and to show that the movement of people between the two provinces can encourage further spread of this epidemic in the region, as much as the last four cases recorded in North Kivu (in Beni and Kalunguta) came from Biakato;<br /> - The governor of North Kivu has indeed responded favorably to the invitation of the Technical Secretariat of the CMRE because he wants to reinforce the surveillance in his province and refuses to see his province plunge into the epidemic;<br /> - To achieve their objectives the two governors were accompanied each by a strong delegation, where one finds the presidents of their provincial assemblies and some influential deputies of their respective countries;<br /> - In addition, the Ebola Virus Epidemic Response Coordination Team, which has been in the Mambasa Health Zone in Ituri for the past week, has been monitoring Bavalakaniki Control Points and Mabakese in this health zone.
VACCINATION
- Since vaccination began on 8 August 2018, 237,956 people have been vaccinated;
- The only vaccine to be used in this outbreak is the rVSV-ZEBOV vaccine, manufactured by the pharmaceutical group Merck, following approval by the Ethics Committee in its decision of 20 May 2018.
MONITORING AT ENTRY POINTS
- Since the beginning of the epidemic, the total number of checked travelers (temperature rise) at the sanitary control points is 105,840,505 ;
- To date, a total of 111 entry points (PoE) and sanitary control points (PoCs) have been set up in the provinces of North Kivu and Ituri to protect the major cities of the country. countries and prevent the spread of the epidemic in neighboring countries.
As a reminder, the recommendations of the MULTISECTORAL COMMITTEE OF THE RESPONSE TO EBOLA VIRUS DISEASE are as follows:
- Follow basic hygiene practices, including regular hand washing with soap and water or ashes;
- If an acquaintance from an epidemic area comes to visit you and is ill, do not touch her and call the North Kivu Civil Protection toll-free number;
- If you are identified as a contact of an Ebola patient, agree to be vaccinated and followed for 21 days;
- If a person dies because of Ebola, follow the instructions for safe and dignified burials. It is simply a funeral method that respects funerary customs and traditions while protecting the family and community from Ebola contamination.
- For all health professionals, observe the hygiene measures in the health centers and declare any person with symptoms of # Ebola (fever, diarrhea, vomiting, fatigue, anorexia, bleeding).<br /> If all citizens respect these health measures recommended by the Secretariat, it is possible to quickly end this 10th epidemic.
-
On 2019-11-19 17:15:54, user Guyguy wrote:
EPIDEMIOLOGICAL SITUATION OF THE EVOLUTION OF THE EBOLA VIRUS DISEASE EPIDEMIC IN THE PROVINCES OF NORTH KIVU AND ITURI IN THE DEMOCRATIC REPUBLIC OF THE CONGO AT NOVEMBER 17, 2019
Monday, November 18, 2019
• Since the beginning of the epidemic, the cumulative number of cases is 3,296, of which 3,178 are confirmed and 118 are probable. In total, there were 2,196 deaths (2,078 confirmed and 118 probable) and 1,070 people healed.<br /> • 407 suspected cases under investigation;<br /> • 4 new confirmed cases in North Kivu, including 2 in Mabalako, 1 in Beni and 1 in Oicha;<br /> • 1 new death of confirmed cases, including:<br /> o 1 new community death in North Kivu in Oicha;<br /> o No new deaths among confirmed cases in CTEs;<br /> • No cured person has emerged from CTEs;<br /> • No health worker is among the new confirmed cases. The cumulative number of confirmed / probable cases among health workers is 163 (5% of all confirmed / probable cases), including 41 deaths;
NEWS
NOTHING TO REPORT
VACCINATION
• 147 people were vaccinated, until Saturday, November 16, 2019, with the 2nd Ad26.ZEBOV / MVA-BN-Filo vaccine (Johnson & Johnson) in the two health zones of Karisimbi in Goma;
• Since the start of vaccination on August 8, 2018 with the rVSV-ZEBOV vaccine, 253,545 people have been vaccinated;
• Approved October 22, 2019 by the Ethics Committee of the School of Public Health of the University of Kinshasa and October 23, 2019 by the National Ethics Committee, the second vaccine, called Ad26.ZEBOV / MVA-BN -Filo, is produced by Janssen Pharmaceuticals for Johnson & Johnson;
• This new vaccine is in addition to the first, the rVSV-ZEBOV, vaccine used until then (since August 08, 2018) in this epidemic manufactured by the pharmaceutical group Merck, after approval of the Ethics Committee on May 20, 2018. has recently been approved.
MONITORING AT ENTRY POINTS
• New positive case among Mukulya Checkpoint alerts in Beni, North Kivu. It is a lifeless body of a 35-year-old man from Oicha for burial at Kabasha in Butembo;<br /> • Since the beginning of the epidemic, the total number of travelers checked (temperature rise) at the sanitary control points is 117,987,763 ;
• To date, a total of 112 entry points (PoE) and sanitary control points (PoCs) have been set up in the provinces of North Kivu and Ituri to protect the country's major cities and prevent the spread of the epidemic in neighboring countries.
As a reminder, the recommendations of the MULTISECTORAL COMMITTEE OF THE RESPONSE TO EBOLA VIRUS DISEASE are as follows:
- Follow basic hygiene practices, including regular hand washing with soap and water or ashes;
- If an acquaintance from an epidemic area comes to visit you and is ill, do not touch her and call the North Kivu Civil Protection toll-free number;
- If you are identified as a contact of an Ebola patient, agree to be vaccinated and followed for 21 days;
- If a person dies because of Ebola, follow the instructions for safe and dignified burials. It is simply a funeral method that respects funerary customs and traditions while protecting the family and community from Ebola contamination.
- For all health professionals, observe the hygiene measures in the health centers and declare any person with symptoms of Ebola (fever, diarrhea, vomiting, fatigue, anorexia, bleeding).<br /> If all citizens respect these health measures recommended by the Secretariat, it is possible to quickly end this 10th epidemic.
-
On 2020-01-07 12:53:20, user Guyguy wrote:
EVOLUTION OF THE EPIDEMIC IN THE PROVINCES OF NORTH KIVU AND ITURI ON 05 JANUARY 2020
Monday, January 06, 2020
• Since the start of the epidemic, the cumulative number of cases has been 3,390, including 3,272 confirmed and 118 probable. In total, there were 2,233 deaths (2,115 confirmed and 118 probable) and 1,114 people healed;<br /> • 373 suspected cases under investigation;<br /> • 2 new confirmed cases in Ituri in Mambasa;<br /> • No new deaths among the confirmed cases, including:<br /> o No community deaths have been recorded;<br /> o No death among the confirmed cases;<br /> • No healed person has left the CTE;<br /> • No health worker is among the new confirmed cases. The cumulative number of confirmed / probable cases among health workers is 164 (approximately 5% of all confirmed / probable cases), including 41 deaths;<br /> • Mambasa again reported a confirmed case after 66 days of silence.
NEWS<br /> Organization of an evaluation session of awareness-raising activities in the Malepe health area in Beni<br /> • The sub-coordination of the response to the Ebola virus disease epidemic organized this Monday 06 December 2020 an evaluation session of awareness-raising activities in the Malepe health area in Beni;<br /> • According to the Coordinator of this Sub-coordination, Dr. Pierre-Céleste Adikey, this evaluation aims to intensify surveillance around visitors and raise alerts. These strategies, he said, will strengthen measures to protect the City against any possible reinfection of the City;<br /> • On this occasion, it was announced the resumption of free healthcare within the Malepe health center with the support of the NGO ALIMA which, from now on, provides drugs for the free care of the sick;<br /> • In addition, the Ebola Treatment Center (CTE) in Mangina unloaded the first eight Ebola winners in 2020 on Monday. These survivors, who were reintegrated into their respective communities, notably in Aloya / Canteen, testified to good care within this CTE.
VACCINATION<br /> • 4,802 people were vaccinated, until January 2, 2020, with the 2nd vaccine Ad26.ZEBOV / MVA-BN-Filo (Johnson & Johnson) in the two health areas from Karisimbi to Goma;<br /> • Since the start of vaccination on August 8, 2018 with the rVSV-ZEBOV vaccine, 261,596 people have been vaccinated;<br /> • Approved on October 22, 2019 by the Ethics Committee of the School of Public Health at the University of Kinshasa and on October 23, 2019 by the National Ethics Committee, the second vaccine, called Ad26.ZEBOV / MVA-BN -Filo, is produced by Janssen Pharmaceuticals for Johnson & Johnson;<br /> • This new vaccine complements the first, rVSV-ZEBOV, a vaccine used until then (since August 08, 2018) in this epidemic manufactured by the pharmaceutical group Merck, after approval by the Ethics Committee on May 20, 2018. It was recently pre-qualified for certification.
ENTRY POINT SURVEILLANCE<br /> • Since the start of the epidemic, the total number of travelers checked (temperature measurement ) at health checkpoints has been 135,503,900 ;<br /> • To date, a total of 109 entry points (PoE) and health control points (PoC) have been established in the provinces of North Kivu and Ituri in order to protect the country's major cities and avoid the spread of the epidemic in neighboring countries.
As a reminder, the recommendations of the MULTISECTORAL COMMITTEE OF THE EBOLA VIRUS DISEASE RESPONSE are as follows:
- Respect basic hygiene measures, in particular regular hand washing with water and soap or ash;
- If an acquaintance from an epidemic area comes to visit you and that he is sick, do not touch him and call the toll-free number for civil protection in North Kivu;
- If you are identified as a contact with an Ebola patient, agree to be vaccinated and followed for 21 days;
- If someone dies due to Ebola, follow the guidelines for dignified and secure burials. It is simply a mode of burial that respects funeral customs and traditions while protecting the family and the community from Ebola contamination.
- For all health professionals, observe hygiene measures in health centers and report any sick person showing symptoms of Ebola (fever, diarrhea, vomiting, fatigue, anorexia, bleeding).<br /> If all citizens respect these health measures recommended by the Secretariat, it is possible to quickly end this 10th epidemic.
-
On 2019-10-10 12:11:25, user GuyguyKabundi Tshima wrote:
EPIDEMIOLOGICAL SITUATION
EVOLUTION OF THE EPIDEMIC IN THE PROVINCES OF NORTH KIVU AND ITURI AT OCTOBER 06, 2019<br /> Monday, October 07, 2019<br /> Since the beginning of the epidemic, the cumulative number of cases is 3,205, of which 3,091 are confirmed and 114 are probable. In total, there were 2,142 deaths (2028 confirmed and 114 probable) and 1006 people healed.<br /> 363 suspected cases under investigation;<br /> 1 new confirmed case at CTE in North Kivu at Oicha;<br /> No new confirmed deaths<br /> 2 people healed from Butembo CTE;<br /> No health workers are among the newly confirmed cases. The cumulative number of confirmed / probable cases among health workers is 161 (5% of all confirmed / probable cases), including 41 deaths.
NEWS
7 people healed from Ebola Virus Disease released Monday at Komanda CTE<br /> - A total of 7 people cured of Ebola Virus Disease were released on Monday October 7th at the Ebola Treatment Center (ETC) in Komanda. ;<br /> - This is 4 people from Mambasa and 3 cases from Komanda Health Zone to whom discharge certificates were given by the director of this Ebola Treatment Center<br /> - This certificate of discharge bears as inscription: "On the date of issue of this document the bearer of this certificate does not present any risk of contaminating other people, because his test was negative for the Ebola virus disease. He / she is thus DECLARE GUERI (E) . His current state of health is not a danger to the community. That is why he / she can return to his household and his professional environment to continue the daily activities. The family, the community and the authorities are asked to welcome him to promote his social integration ".
VACCINATION
- Continuation of vaccination around the confirmed case of 04 October 2019 in the Tenambo Health Area in Oicha, North Kivu;
- Continuation of the vaccination of newly recruited front-line staff at the General Reference Hospitals of Katwa and Kyondo in North Kivu;
- Since vaccination began on 8 August 2018, 234,693 people have been vaccinated;
- The only vaccine to be used in this outbreak is the rVSV-ZEBOV vaccine, manufactured by the pharmaceutical group Merck, following approval by the Ethics Committee in its decision of 20 May 2018.
MONITORING AT ENTRY POINTS
- Since the beginning of the epidemic, the total number of travelers checked (temperature increase) at the sanitary control points is 103,167,809 ;
- To date, a total of 111 entry points (PoE) and sanitary control points (PoCs) have been set up in the provinces of North Kivu and Ituri to protect the country's major cities and prevent the spread of the epidemic in neighboring countries.
As a reminder, the recommendations of the MULTISECTORAL COMMITTEE OF THE RESPONSE TO EBOLA VIRUS DISEASE are as follows:
- Follow basic hygiene practices, including regular hand washing with soap and water or ashes;
- If an acquaintance from an epidemic area comes to visit you and is ill, do not touch her and call the North Kivu Civil Protection toll-free number;
- If you are identified as a contact of an Ebola patient, agree to be vaccinated and followed for 21 days;
- If a person dies because of Ebola, follow the instructions for safe and dignified burials. It is simply a funeral method that respects funerary customs and traditions while protecting the family and community from Ebola contamination.
- For all health professionals, observe the hygiene measures in the health centers and declare any person with symptoms of # Ebola (fever, diarrhea, vomiting, fatigue, anorexia, bleeding).<br /> If all citizens respect these health measures recommended by the Secretariat, it is possible to quickly end this 10th epidemic.
-
On 2019-10-17 18:36:39, user GuyguyKabundi Tshima wrote:
EVOLUTION OF THE EPIDEMIC IN THE PROVINCES OF NORTH KIVU AND ITURI AS OF OCTOBER 15, 2019
Wednesday, October 16, 2019<br /> Since the beginning of the epidemic, the cumulative number of cases is 3,227, of which 3,113 are confirmed and 114 are probable. In total, there were 2,154 deaths (2040 confirmed and 114 probable) and 1038 people healed.<br /> 530 suspected cases under investigation;<br /> 3 new confirmed cases, including:<br /> No cases in North Kivu;<br /> 3 in Ituri in Mandima;<br /> 1 new confirmed death, of which:<br /> 1 community death in Ituri in Mandima;<br /> No confirmed deaths;<br /> 2 people healed from the CTE in Ituri in Mambasa;<br /> No health workers are among the newly confirmed cases. The cumulative number of confirmed / probable cases among health workers is 161 (5% of all confirmed / probable cases), including 41 deaths.
NEWS
The state of play of the response at the center of an interview in Goma between the Technical Secretary of the CMRE and the United Nations Emergency Coordinator for Ebola<br /> - The Technical Secretary of the Multisectoral Committee on Epidemic Response to Ebola Virus Disease (ST / CMRE), Prof. Jean Jacques Muyembe Tamfum, granted a hearing on Wednesday, October 16, 2019 in Goma to the United Nations Emergency Coordinator for Ebola;<br /> - During their meeting, the two personalities discussed the state of play of the response to the 10th Ebola Virus Disease outbreak and the security situation in the areas affected by this epidemic;<br /> - It should be noted that the 10th Ebola epidemic has been taking place in the Democratic Republic of the Congo in areas of armed conflict, particularly in the provinces of North Kivu and Ituri, for more than a year;<br /> - Some time before this meeting, the technical secretary of the Multisectoral Committee for the Response to the Ebola Virus Disease Epidemic (ST / CMRE), Prof. Muyembe Tamfum, who is currently staying in Goma, North Kivu to inquire about the evolution of the response, chaired the morning meeting of the general coordination of the Ebola response to the epidemic.
Pygmies at Mahombo camp in Mambasa territory in Ituri pledge to fight Ebola Virus Disease
- The pygmies residing in Mahombo camp located more than 30 minutes walk from the main road from the village Nyangwe in the territory of Mambasa in ITURI, pledged Tuesday, October 15, 2019 to fight against Ebola by raising alerts with teams of the response;<br /> This commitment is the result of awareness raising by the Community Risk and Commitment (CREC) teams for 79 pygmies about the generalities of the Ebola virus disease, its methods of prevention and contamination;<br /> Pygmies have, for this purpose, asked for hand washing kits to break the chain of transmission of the Ebola virus in their respective communities.
VACCINATION
- Since vaccination began on 8 August 2018, 238,700 people have been vaccinated;
- The only vaccine to be used in this outbreak is the rVSV-ZEBOV vaccine, manufactured by the pharmaceutical group Merck, following approval by the Ethics Committee in its decision of 20 May 2018.
MONITORING AT ENTRY POINTS
- The Governor of North Kivu, Carly Nzanzu Kasivita accompanied by a strong delegation, visited Maboya Control Points (PoCs) in Kalunguta and Kangote in Butembo in North Kivu Province;
- The providers of the Mususa Point of Control (PoC) in Butembo, North Kivu, in collaboration with the Ndondo Primary School and the Kyambogho School Complex, participated in a mass sensitization session (travelers and riverside population) under the theme " All Eliminate Ebola Virus Disease "on International Handwashing Day;
- Since the beginning of the epidemic, the total number of travelers checked (temperature rise) at the sanitary control points is 106.625.956 ;
- To date, a total of 111 entry points (PoE) and sanitary control points (PoCs) have been set up in the provinces of North Kivu and Ituri to protect the country's major cities and prevent the spread of the epidemic in neighboring countries.
As a reminder, the recommendations of the MULTISECTORAL COMMITTEE OF THE RESPONSE TO EBOLA VIRUS DISEASE are as follows:
- Follow basic hygiene practices, including regular hand washing with soap and water or ashes;
- If an acquaintance from an epidemic area comes to visit you and is ill, do not touch her and call the North Kivu Civil Protection toll-free number;
- If you are identified as a contact of an Ebola patient, agree to be vaccinated and followed for 21 days;
- If a person dies because of Ebola, follow the instructions for safe and dignified burials. It is simply a funeral method that respects funerary customs and traditions while protecting the family and community from Ebola contamination.
- For all health professionals, observe the hygiene measures in the health centers and declare any person with symptoms of # Ebola (fever, diarrhea, vomiting, fatigue, anorexia, bleeding).<br /> If all citizens respect these health measures recommended by the Secretariat, it is possible to quickly end this 10th epidemic.
-
On 2019-11-17 04:20:48, user GuyguyKabundi Tshima wrote:
EVOLUTION OF THE EPIDEMIC IN THE PROVINCES OF NORTH KIVU AND ITURI AS AT NOVEMBER 15, 2019<br /> Saturday, November 16, 2019<br /> • Since the beginning of the epidemic, the cumulative number of cases is 3,292, of which 3,174 are confirmed and 118 are probable. In total, there were 2,195 deaths (2077 confirmed and 118 probable) and 1070 people healed.<br /> • 517 suspected cases under investigation;<br /> • No new confirmed cases;<br /> • No new deaths of confirmed cases have been recorded;<br /> • No cured person has emerged from CTEs;<br /> • No health worker is among the new confirmed cases. The cumulative number of confirmed / probable cases among health workers is 163 (5% of all confirmed / probable cases), including 41 deaths.
NEWS
Goma opens leadership capacity building workshop for Ebola epidemic response to Ebola Virus Disease.
• The coordinator of the epidemic response to Ebola Virus Disease in North and South Kivu Province and Ituri, Prof. Steve Ahuka Mundeke, opened this Saturday, November 16, 2019 in Goma North Kivu a workshop on building the capacity of actors involved in the response against Ebola;<br /> • For four days, participants, coordinating and sub-coordinating officers from the response, the Ministry of Health, the World Health Organization (WHO), national security, CDC and DFID will be equipped with management skills epidemics before, during and after the tenth epidemic of Ebola Virus Disease, especially in the event of any outbreak;<br /> • According to Prof. Ahuka, this workshop will not only benefit this epidemic, but will help, through acquired skills, to cope with other epidemics or other crises in a collective and individual way. " Each participant will be able to use these skills in his daily life ," he concluded;<br /> • This training for the response officers, from 16 to 20 November 2019, is organized by the Ministry of Health in collaboration with WHO with funding from UKaid from the British people.
VACCINATION
• 93 people were vaccinated with the 2nd Ad26.ZEBOV / MVA-BN-Filo vaccine (Johnson & Johnson) in the two Health Zones of Karisimbi in Goma;<br /> • Since the start of vaccination on August 8, 2018 with the rVSV-ZEBOV vaccine, 252,835 people have been vaccinated;<br /> • Approved October 22, 2019 by the Ethics Committee of the School of Public Health of the University of Kinshasa and October 23, 2019 by the National Ethics Committee, the second vaccine, called Ad26.ZEBOV / MVA-BN -Filo, is produced by Janssen Pharmaceuticals for Johnson & Johnson;<br /> • This new vaccine complements the first, the rVSV-ZEBOV, vaccine used until then (since August 08, 2018) in this outbreak, manufactured by the pharmaceutical group Merck, after approval of the Ethics Committee on May 20, 2018. It has recently been approved.
MONITORING AT ENTRY POINTS
• Since the beginning of the epidemic, the total number of travelers checked (temperature rise) at the sanitary control points is 117,333,420 ;<br /> • To date, a total of 112 entry points (PoE) and sanitary control points (PoCs) have been set up in the provinces of North Kivu and Ituri to protect the country's major cities and prevent the spread of the epidemic in neighboring countries.
As a reminder, the recommendations of the MULTISECTORAL COMMITTEE OF THE RESPONSE TO EBOLA VIRUS DISEASE are as follows:
- Follow basic hygiene practices, including regular hand washing with soap and water or ashes;
- If an acquaintance from an epidemic area comes to visit you and is ill, do not touch her and call the North Kivu Civil Protection toll-free number;
- If you are identified as a contact of an Ebola patient, agree to be vaccinated and followed for 21 days;
- If a person dies because of Ebola, follow the instructions for safe and dignified burials. It is simply a funeral method that respects funerary customs and traditions while protecting the family and community from Ebola contamination.
- For all health professionals, observe the hygiene measures in the health centers and declare any person with symptoms of # Ebola (fever, diarrhea, vomiting, fatigue, anorexia, bleeding).<br /> If all citizens respect these health measures recommended by the Secretariat, it is possible to quickly end this 10th epidemic.
-
On 2019-11-30 16:39:58, user Guyguy wrote:
EVOLUTION OF THE EPIDEMIC IN THE PROVINCES OF NORTH KIVU AND ITURI AT NOVEMBER 26, 2019<br /> Wednesday, November 27, 2019<br /> • Since the beginning of the epidemic, the cumulative number of cases is 3,304, of which 3,186 are confirmed and 118 are probable. In total, there were 2,199 deaths (2081 confirmed and 118 probable) and 1077 people cured.<br /> • 366 suspected cases under investigation;<br /> • No new confirmed cases;<br /> • No new deaths among confirmed cases;<br /> • No cured person has emerged from CTEs;<br /> • No health worker is among the new confirmed cases. The cumulative number of confirmed / probable cases among health workers is 163 (5% of all confirmed / probable cases), including 41 deaths.
NEWS
Closure of training of Ebola Rapid Response Teams in Goma
• The Ebola response coordinator for the Ebola response to operations, Dr. Luigino Mikulu, closed on Wednesday 27 November 2019 the training of Rapid Response Teams (RRTs), composed of units of the Armed Forces. (FARDC) and the Congolese National Police (PNC), on the Ebola virus disease that took place in Goma, capital of North Kivu Province from 22 to 26 November 2019;<br /> • For Dr. Luigino, this team is the first in the Rapid Response Teams to be composed of elements from other sectors, such as those of the Ministries of Defense and Security and the Ministry of the Interior;<br /> • This training aligns with the vision of the Technical Secretariat of the Multisectoral Ebola Virus Disease Response Committee (ST / CMRE), through the overall coordination of the response, to expand its mixed and multidisciplinary teams available and able to intervene 24 hours a day, 7 days a week and everywhere, where they will be deployed, not only for the response to this epidemic to Ebola Virus Disease, but also for other epidemics;<br /> • This training was a pride for WHO to accompany the Ministry of Health in order to capitalize the capacity building of FARDC and PNC units in public health;<br /> • The participants, in turn, reassured the overall coordination of the response, the Ministry of Health and all those who contributed to the delivery of this training, particularly to WHO and all facilitators, to be faithful disciples in the field by putting into practice all the notions learned during these sessions;<br /> • At the end of this training, the thirty participants, including the facilitators, received a participation certificate.
VACCINATION
• Despite the tense situation of the city of Beni, a vaccination ring was opened around the confirmed case of 24 October 2019 in the Kanzulinzuli Health Area of the General Reference Hospital;<br /> • 724 people were vaccinated, until Tuesday, November 26, 2019, with the 2nd Ad26.ZEBOV / MVA-BN-Filo vaccine (Johnson & Johnson) in the two health zones of Karisimbi in Goma;<br /> • Since the start of vaccination on August 8, 2018 with the rVSV-ZEBOV vaccine, 255,247 people have been vaccinated;<br /> • Approved October 22, 2019 by the Ethics Committee of the School of Public Health of the University of Kinshasa and October 23, 2019 by the National Ethics Committee, the second vaccine, called Ad26.ZEBOV / MVA-BN -Filo, is produced by Janssen Pharmaceuticals for Johnson & Johnson;<br /> • This new vaccine is in addition to the first, the rVSV-ZEBOV, vaccine used until then (since August 08, 2018) in this epidemic manufactured by the pharmaceutical group Merck, after approval of the Ethics Committee on May 20, 2018. has recently been pre-qualified for registration.
MONITORING AT ENTRY POINTS
• Sanitary control activities are disrupted in the towns of Beni and Butembo in North Kivu province following demonstrations by the population which decries killings of civilians;<br /> • Since the beginning of the epidemic, the total number of travelers checked (temperature measurement ) at the sanitary control points is 121,159,810 ;<br /> • To date, a total of 109 entry points (PoE) and sanitary control points (PoCs) have been set up in the provinces of North Kivu and Ituri to protect the country's major cities and prevent the spread of the epidemic in neighboring countries.
As a reminder, the recommendations of the MULTISECTORAL COMMITTEE OF THE RESPONSE TO EBOLA VIRUS DISEASE are as follows:
- Follow basic hygiene practices, including regular hand washing with soap and water or ashes;
- If an acquaintance from an epidemic area comes to visit you and is ill, do not touch her and call the North Kivu Civil Protection toll-free number;
- If you are identified as a contact of an Ebola patient, agree to be vaccinated and followed for 21 days;
- If a person dies because of Ebola, follow the instructions for safe and dignified burials. It is simply a funeral method that respects funerary customs and traditions while protecting the family and community from Ebola contamination.
- For all health professionals, observe the hygiene measures in the health centers and declare any person with symptoms of # Ebola (fever, diarrhea, vomiting, fatigue, anorexia, bleeding).<br /> If all citizens respect these health measures recommended by the Secretariat, it is possible to quickly end this 10th epidemic.
-
On 2019-11-09 20:30:28, user GuyguyKabundi Tshima wrote:
EVOLUTION OF THE EPIDEMIC IN THE PROVINCES OF NORTH KIVU AND ITURI AT 07 NOVEMBER 2019<br /> Friday, November 08, 2019<br /> • Since the beginning of the epidemic, the cumulative number of cases is 3,286, of which 3,168 are confirmed and 118 are probable. In total, there were 2,192 deaths (2074 confirmed and 118 probable) and 1064 people healed.<br /> • 560 suspected cases under investigation;<br /> • No new confirmed cases;<br /> • No new confirmed deaths have been recorded;<br /> • 1 person cured out of the CTE of Butembo;<br /> • No health worker is among the new confirmed cases. The cumulative number of confirmed / probable cases among health workers is 161 (5% of all confirmed / probable cases), including 41 deaths;
NEWS
End of tour of the general coordinator of the Ebola response in North Kivu and Ituri
• The Epidemic Response Coordinator for Ebola Virus Disease, Prof. Steve Ahuka Mundeke, was on mission from 05 to 07 November 2019 in a few areas affected by Ebola Virus Disease in North Kivu and Ituri, to inquire about the epidemiological and security evolution of the response. During this mission, he visited some sites of the response to Beni in North Kivu, including the Mangango camp where the vaccination of pygmies took place;
• In Ituri, Prof Ahuka traveled to Biakato Mines in Mandima, Mambasa Territory, where he first reinserted three of the four cured patients he had discharged well into the Mangina Ebola Treatment Center in the area. Mabalako health center in North Kivu. He also comforted the family of the retaliating agent and journalist, murdered on the night of Saturday, November 2, 2019 in Lwemba in Mambasa territory in Ituri;
• He also chaired the daily meeting on the activities of the response in the sub-coordination of Biakato Mines;
• On his way back, the general coordinator of the riposte went to the Mangina Subcommittee, where he chaired under the trees the morning meeting in Mangina. He also visited the Health Center "Case of Salvation" which collaborates with the response and to whom he handed over a large batch of mattresses in the presence of the WHO coordinator of Mangina's sub-coordination. He again visited the Mangango camp, where the pygmies who have joined the activities of the riposte live to help the response reach all the other pygmies;
• He closed his tour of North Kivu and Ituri with a visit to the Ebola Treatment Center in Beni.
VACCINATION
• Pygmy vaccination continues in Mabalako at Mangango camp, 19/19 vaccinated pygmies;<br /> • Continuation of vaccination in expanded ring, around 3 confirmed cases on 04/11/2019 and 2 cases confirmed on 05/11/2019 and the vaccination of the biker as contacts, in Beni in five (5) areas health care, including in Butsili, Ngongolio, Tamende, mandrandele and Kasabinyole;<br /> • Since vaccination began on August 8, 2018, 248,460 people have been vaccinated;<br /> • The only vaccine to be used in this outbreak is the rVSV-ZEBOV vaccine, manufactured by the pharmaceutical group Merck, following approval by the Ethics Committee in its decision of 20 May 2018.
MONITORING AT ENTRY POINTS
• Since the beginning of the epidemic, the total number of travelers checked (temperature rise) at the sanitary control points is 114,626,335 ;<br /> • To date, a total of 111 entry points (PoE) and sanitary control points (PoCs) have been set up in the provinces of North Kivu and Ituri to protect the country's major cities and prevent the spread of the epidemic in neighboring countries.
As a reminder, the recommendations of the MULTISECTORAL COMMITTEE OF THE RESPONSE TO EBOLA VIRUS DISEASE are as follows:
- Follow basic hygiene practices, including regular hand washing with soap and water or ashes;
- If an acquaintance from an epidemic area comes to visit you and is ill, do not touch her and call the North Kivu Civil Protection toll-free number;
- If you are identified as a contact of an Ebola patient, agree to be vaccinated and followed for 21 days;
- If a person dies because of Ebola, follow the instructions for safe and dignified burials. It is simply a funeral method that respects funerary customs and traditions while protecting the family and community from Ebola contamination.
- For all health professionals, observe the hygiene measures in the health centers and declare any person with symptoms of # Ebola (fever, diarrhea, vomiting, fatigue, anorexia, bleeding).<br /> If all citizens respect these health measures recommended by the Secretariat, it is possible to quickly end this 10th epidemic.
-
On 2019-11-10 21:15:52, user GuyguyKabundi Tshima wrote:
EVOLUTION OF THE EPIDEMIC IN THE PROVINCES OF NORTH KIVU AND ITURI AT 08 NOVEMBER 2019<br /> Saturday, November 09, 2019<br /> • Since the beginning of the epidemic, the cumulative number of cases is 3,286, of which 3,168 are confirmed and 118 are probable. In total, there were 2,192 deaths (2074 confirmed and 118 probable) and 1064 people healed.<br /> • 501 suspected cases under investigation;
THE LIST OF NO:
• No new cases have been confirmed;<br /> • No new confirmed deaths have been recorded;<br /> • No cured person has emerged from CTEs;<br /> • No health worker is among the new confirmed cases. The cumulative number of confirmed / probable cases among health workers is 161 (5% of all confirmed / probable cases), including 41 deaths;
NEWS
NOTHING TO REPORT
VACCINATION<br /> • Since vaccination began on August 8, 2018, 249,290 people have been vaccinated;<br /> • The only vaccine to be used in this outbreak is the rVSV-ZEBOV vaccine, manufactured by the pharmaceutical group Merck, following approval by the Ethics Committee in its decision of 20 May 2018.
MONITORING AT ENTRY POINTS<br /> • Since the beginning of the epidemic, the total number of travelers checked (temperature measurement ) at the sanitary control points is 115.036.328 ;<br /> • To date, a total of 111 entry points (PoE) and sanitary control points (PoCs) have been set up in the provinces of North Kivu and Ituri to protect the country's major cities and prevent the spread of the epidemic in neighboring countries.
As a reminder, the recommendations of the MULTISECTORAL COMMITTEE OF THE RESPONSE TO EBOLA VIRUS DISEASE are as follows:
- Follow basic hygiene practices, including regular hand washing with soap and water or ashes;
- If an acquaintance from an epidemic area comes to visit you and is ill, do not touch her and call the North Kivu Civil Protection toll-free number;
- If you are identified as a contact of an Ebola patient, agree to be vaccinated and followed for 21 days;
- If a person dies because of Ebola, follow the instructions for safe and dignified burials. It is simply a funeral method that respects funerary customs and traditions while protecting the family and community from Ebola contamination.
- For all health professionals, observe the hygiene measures in the health centers and declare any person with symptoms of # Ebola (fever, diarrhea, vomiting, fatigue, anorexia, bleeding).<br /> If all citizens respect these health measures recommended by the Secretariat, it is possible to quickly end this 10th epidemic.
-
On 2019-11-27 15:46:04, user Guyguy wrote:
EVOLUTION OF THE EPIDEMIC IN THE PROVINCES OF NORTH KIVU AND ITURI AS AT 25 NOVEMBER 2019<br /> Tuesday, November 26, 2019<br /> • Since the beginning of the epidemic, the cumulative number of cases is 3,304, of which 3,186 are confirmed and 118 are probable. In total, there were 2,199 deaths (2081 confirmed and 118 probable) and 1077 people cured.<br /> • 392 suspected cases under investigation;<br /> • 1 new case confirmed in North Kivu in Mabalako;<br /> • No new deaths among confirmed cases;<br /> • No cured person has emerged from CTEs;<br /> • No health worker is among the new confirmed cases. The cumulative number of confirmed / probable cases among health workers is 163 (5% of all confirmed / probable cases), including 41 deaths;
NEWS
NOTHING TO REPORT
VACCINATION
• Despite the tense situation of the city of Beni, a vaccination ring was opened around the confirmed case of 24 October 2019 in the Kanzulinzuli Health Area of the General Reference Hospital;<br /> • 724 people were vaccinated with the 2nd Ad26.ZEBOV / MVA-BN-Filo vaccine (Johnson & Johnson) in the two Health Zones of Karisimbi in Goma;<br /> • Since the start of vaccination on August 8, 2018 with the rVSV-ZEBOV vaccine, 255,215 people have been vaccinated;<br /> • Approved October 22, 2019 by the Ethics Committee of the School of Public Health of the University of Kinshasa and October 23, 2019 by the National Ethics Committee, the second vaccine, called Ad26.ZEBOV / MVA-BN -Filo, is produced by Janssen Pharmaceuticals for Johnson & Johnson;<br /> • This new vaccine is in addition to the first, the rVSV-ZEBOV, vaccine used until then (since August 08, 2018) in this epidemic manufactured by the pharmaceutical group Merck, after approval of the Ethics Committee on May 20, 2018. has recently been pre-qualified for registration.
MONITORING AT ENTRY POINTS
• Sanitary control activities are disrupted in the towns of Beni and Butembo in North Kivu province following demonstrations by the population which decries killings of civilians;<br /> • Since the beginning of the epidemic, the total number of travelers checked (temperature measurement ) at the sanitary control points is 120,825,670 ;<br /> • To date, a total of 109 entry points (PoE) and sanitary control points (PoCs) have been set up in the provinces of North Kivu and Ituri to protect the country's major cities and prevent the spread of the epidemic in neighboring countries.
As a reminder, the recommendations of the MULTISECTORAL COMMITTEE OF THE RESPONSE TO EBOLA VIRUS DISEASE are as follows:
- Follow basic hygiene practices, including regular hand washing with soap and water or ashes;
- If an acquaintance from an epidemic area comes to visit you and is ill, do not touch him/her and call the North Kivu Civil Protection toll-free number;
- If you are identified as a contact of an Ebola patient, agree to be vaccinated and followed for 21 days;
- If a person dies because of Ebola, follow the instructions for safe and dignified burials. It is simply a funeral method that respects funerary customs and traditions while protecting the family and community from Ebola contamination.
- For all health professionals, observe the hygiene measures in the health centers and declare any person with symptoms of Ebola (fever, diarrhea, vomiting, fatigue, anorexia, bleeding).<br /> If all citizens respect these health measures recommended by the Secretariat, it is possible to quickly end this 10th epidemic.
-
-
www.medrxiv.org www.medrxiv.org
-
On 2020-04-22 02:20:27, user Mike wrote:
This was certainly an interesting paper. It's done a lot of work and the findings are notable. IMHO it warrants as much attention as the pro-HCQ study via Dr. Raoult. While it is entertaining, I will add that it is not conclusive, nor without fault. A double-blind study is still required, but it is worth the read.
Observations/Questions:
1. "hydroxychloroquine, with or without azithromycin, was more likely to be prescribed to patients with more severe disease”<br /> 2. "we cannot rule out the possibility of selection bias or residual confounding”<br /> 3. demographic: 100% male, 66% black, median age ~70 (59 youngest)<br /> 4. uses PSM, which despite a common practice, could be considered controversial (https://gking.harvard.edu/f... "https://gking.harvard.edu/files/gking/files/psnot.pdf)")<br /> 5. Unless I missed it, I didn't see any specifics about how the treatments were administered.<br /> - How long before death were patients treated? <br /> - What was the quantity/frequency of the treatments? <br /> - Were the treatments consistent between hospitals?<br /> 6. The rate of ventilation was less in HC+AZ (half of the HC and no-HC rates). Why was that and what does that suggest?<br /> 7. Although they were statistically insignificant, what was the result of the 17 women not included in the study?<br /> 8. Why does the paper seem to address political points? It seems like the Abstract is editorialized, which I'm not accustomed to. The Conclusions portion (and page after) seeming to address topical issues of the times. Perhaps this introduces my own subjective bias, but I infer potential for analysis/deciphering bias when the study shows awareness of other controversial studies being conducted, rather than being a standalone independent study of its own; essentially, it leaves me to question motivations of the author, rather than that motivation being scientific discovery. I don't mind such commentary in the Discussion section, I'm just not as accustomed to seeing it in the Abstract.
-
On 2020-04-22 01:10:17, user Gunnar V Gunnarsson wrote:
After reading the paper I unfortunately find the usage of data to be misleading and I think you might have drawn the wrong conclusions.
The problem lies in the fact that once people went on ventilators they where given HC or HC+AZ. This re-categorised the patients by increasing the number of high risk patients in the HC and HC+AZ groups making the No HC an invalid control group.
Before ventilation the statistics was like this: (Table 4 in paper)
HC: 90 - 9 (10.0%) deaths - 69 (76.6%) recover - 12 (13.3%) onto ventilation
HC+AZ: 101 - 11 (10.9%) deaths - 83 (82.2%) recover - 7 (06.9%) onto ventilation
No HC: 177 - 15 ( 8.4%) deaths - 137 (77.4%) recover - 25 (14.1%) onto ventilation
We see that death-rate is about the same for all groups but HC+AZ seams to have the highest recovery rate but it might not be statistically significant.
Now once people hit ventilation the re-categorisation occurs. More patients where given HC and HC+AZ which moved them from the No HC group to the HC or HC+AZ group. These groups therefore have a much higher % of ventilation patients because they where given the drugs after they hit ventilation.
The following data can be derived from the paper but is not presented:<br /> Once people hit ventilation we have the following results.
HC: 19 - 18 (95%) deaths - 1 (11%) recover
HC+AZ: 19 - 14 (73%) deaths - 5 (27%) recover
No HC: 6 - 3 (50%) deaths - 3 (50%) recover
If you compare these 2 tables, you see that 25 patient with No HC reach ventilation. Once they reach ventilation, 19 of these where give HC or HC+AZ, thereby moved from the No HC group to the other two. 79.5% of all patients reaching ventilation died so arguably 14 patients that died where moved from the No HC group to the other 2 groups only once they reach the much higher risk state.
Here are the number of people per group that got ventilation:
HC: 97 - 19 (19.6%) got ventilation
HC+AZ: 113 - 19 (16.8%) got ventilation
No HC: 158 - 6 ( 3.4%) got ventilation
So in the end result the No HC group had a very low % of patients who got ventilation and therefore should have a significant lower death rate which is then totally unrelated to the treatment.
-
On 2020-04-23 02:46:06, user Raspee wrote:
(1) There appears to be a statistically significant imbalance in the arms with regard to disease severity.
“However, hydroxychloroquine, with or without azithromycin, was more likely to be prescribed to patients with more severe disease, as assessed by baseline ventilatory status and metabolic and hematologic parameters.”
The base line pulse oximetry data and baseline line absolute lymphocyte count (Table 2) - indicates a statistical difference at p = 0.024 - the subjects that received hydroxychloroquine had a worse baseline respiratory status - and a worse absolute lymphocyte count p = 0.021.
This is an inherent bias in the design that has not been adequately addressed. The analysis should compare treatment in subjects with the same disease severity.
(2) If we look at table 4 - (HC + AZ) - 82% were discharged without ventilation vs. 77% discharged without ventilation both in the HC and non- HC group - Apparently the HC + AZ group did better than the other two groups.
This is supported by the observation that the adjusted HR for ventilation is 0.43 (0.16 - 1.12) - It was better than the control arm with regard to disease progression and no different than the control for death.
So in patients that were sicker at baseline, HC + AZ appears to have had a better outcome - than the other two groups - with regard to being discharged without requiring an ICU admission.
(3) Please provide a better justification to exclude the 17 women Please go back and perform the analysis including the 17 women.
(4) What were the doses of azithromycin and hydroxychloroquine administered? How are the different doses and dose regimens adjusted in the analysis? Not everyone in the HQ and HQ + AZ groups were dosed in the same fashion. Is there a minimum number of doses that you used to include them in the treatment groups?
(5) If the control group had less severe illness at presentation, it stands to reason that the mortality rate would be lowest in the control group.
(6) Was there a sub analysis looking at impact of secondary bacterial pneumonia - which occurs in 5-15% of moderate to severe COVID-19 patients? Were the antibiotics utilized the same over the 3 cohorts or were they different?
(7) How many patients were on ace inhibitors and/or angiotensin receptor blockers? Were these medications balanced in the 3 arms? What about corticosteroid use in the 3 cohorts? Was corticosteroid use balanced?
(8) Please go back and re-run the analysis with an additional 14 days of COVID-19 data (using April 25th cut -off) as your sample size will undoubtedly be greater and we would expect that the HQ + AZ group will now have a p value < 0.05. for discharge without ventilation.
(9) Please include length of stay in your analysis as well
(10) Please include readmission rates to the hospital in your analysis
-
On 2020-04-22 00:53:03, user Mike Cee wrote:
This paper is flawed and should be withdrawn immediately.<br /> 1) This paper is flawed due to the limitation discussed on page 12 about the likelihood that the HCQ group, "However, hydroxychloroquine, with or without azithromycin, was more likely to be prescribed to patients with more severe disease, as assessed by baseline ventilatory status and metabolic and hematologic parameters."<br /> Doctors working the front lines have already noted that patients at SYMPTOMS ONSET + 14 days should not be prescribed HCQ<br /> 2) The important grouping by number of days since SYMPTOM ONSET was left out of this study. Previous studies, while anecdotal, suggest that patients should be prescribed HCQ early because it is believed to prevent the virus from infecting the type 2 lung cell through the ACE2 receptor and thus stops the progression of the disease.<br /> 3) This study did not document the dosage given to the patients. That would have been a helpful inclusion so we could understand if the patients who died were actually poisoned by excessive the treatment.<br /> 4) HCQ prescribed in patients in the first week after SYMPTOMS ONSET to include a zinc supplement which anecdotal evidence suggests a dual function of the combination: The HCQ provides an avenue for the zinc to enter the Type 2 lung cell where it interferes with the virus replication process.
-
-
www.medrxiv.org www.medrxiv.org
-
On 2020-05-01 10:56:16, user Ivan Berlin wrote:
Rentsch CT et al. Covid-19 Testing, Hospital Admission, and Intensive Care Among 2,026,227 United States Veterans Aged 54-75 Years. <br /> medRxiv preprint doi: https://doi.org/10.1101/202... version posted April 14, 2020<br /> Comment of the results concerning smoking related issues. Corrected Version. Please ignore the previous one.<br /> Ivan Berlin, Paris, France<br /> The title is somewhat misleading. Only 3789 persons were tested for SARS-CoV-2, no data on the 2,022,438 are reported.<br /> Data are extracted from the Veteran Administration (USA) Birth Cohort born between 1945 and 1965 electronic database. Between February 8 and March 30, 2020, 3789 persons were tested for SARS-CoV-2. Among them 585 were tested SARS-CoV-2 positive (15.4%) and 3204 SARS-CoV-2 negative. (Remark: the authors frequently confound testing for SARS-CoV-2 and having the disease: COVID-19 +.)<br /> Testing used nasopharyngeal swabs, 1% of the testing samples was from other unspecified sources. Testing was performed “in VA state public health and commercial reference laboratoires”, page 7. No further specification about the testing method is provided. Data are analyzed as if no between test-sources variability existed. However, it is unlikely that between test-source variability would influence the findings.<br /> It seems that only individuals with symptoms were tested, however this is not clearly stated.<br /> Data extraction included diagnostics by diagnostic codes of comorbidities, non-steroid inflammatory drug (NSAID), angiotensin converting enzyme inhibitor (ACE) and angiotensin II receptor blocker (ARB) use, vital signs, laboratory results, hepatic fibrosis score, presence or absence of alcohol use disorder and smoking status.<br /> Smoking status data, never, former, current smokers were extracted using the algorithm described in McGinnis et al. Validating Smoking Data From the Veteran’s Affairs Health Factors Dataset, an Electronic Data Source. Nicotine & Tobacco Research, Volume 13, Issue 12, December 2011, Pages 1233–1239, https://doi.org/10.1093/ntr... used for HIV patients. According to this paper, the algorithm correctly classified 84% of never-smokers 95% of current smokers but only 43% of former smokers. The reported overall kappa statistic was 0.66. When categories were collapsed into ever/never, the kappa statistic was somewhat better: 0.72 (sensitivity = 91%; specificity = 84%), and for current/not current, 0.75 (sensitivity = 95%; specificity = 79%). Thus, classification error cannot be excluded in particular in classifying former smokers. <br /> In unadjusted analyses (Table 1) factors associated significantly with SARS-CoV-2 positivity were: male sex, black race, urban residence, chronic kidney disease, diabetes, hypertension, higher body mass index, vital signs but not NSAID or ACE/ARB exposure. It is to note, that among the laboratory findings, severity of hepatic fibrosis was associated with positive SARS-CoV-2 tests. <br /> Among those with positive SARS-CoV2 alcohol use disorder was reported by 48/585 (8.2%), versus 480/3204 (15%) among those with negative SARS-CoV-2 test. Among those with alcohol use disorder, 9.1 tested positive. <br /> Among SARS-CoV-2 positives there were 216/585 (36.9%) never smokers vs 826/3204 (25.8%) among SARS-CoV-2 negatives. 20.7% tested positive among never smokers. Among SARS-CoV-2 positive persons 179 (30.6%) were former smokers vs 704 (22%) among SARS-CoV-2 negatives. 20.3 % tested positive among former smokers. Among SARS-CoV-2 positive individuals 159 (27.7%) were current smokers vs 1444 (45.1%) among SARS-CoV-2 negative individuals. 9.9% tested positive among current smokers. Expressed otherwise, among SARS-CoV-2 negative individuals, there were less never smokers, less former smokers and more current smokers. Among individuals with SARS-CoV-2 positivity there were 338/585 (61%) persons with smoking history (former + current smokers=ever smokers) and among those with SARS-CoV-2 negativity 2149/3204 (72%) were ever smokers. <br /> COPD, known to be strongly related to former or current smoking, was more frequent among SARS-CoV-2 negative (28.2%) than among SARS-CoV-2 positive (15.4%) individuals.<br /> In multivariable analyses (Table 2), male sex, black ethnicity, urban residence, lower systolic blood pressure, prior use of NSAID but not ACE/ARB use and obesity were associated with SARS-CoV-2 positive test; current smoking (OR: 0.45, 91% CI: 0.35-057), alcohol use disorder (OR 0.58, 95% CI: 0.41-0.83) and COPD (OR: 0.67, 95%CI: 0.50-0.88) were associated with decreased likelihood of SARS-CoV-2 positive test. No association with age and SARS-CoV-2 positive test was observed. The association with hepatic fibrosis with SARS-CoV-2 positive tests remained significant in the multivariable analysis and the authors point out (page 15) that the “pronounced independent association with FIB-4 (fibrosis) and albumin suggest that virally induced haptic inflammation may be a harbinger of the cytokine storm.”, page 15. <br /> The main risk factors for hospitalization or ICU among SARS-CoV-2 positive persons are those that associated with worse clinical signs (status). This is expected: clinical decision about severity is based on current clinical signs and not on previous history. <br /> Neither co-morbidities, nor smoking status or alcohol use disorder were associated with hospitalization/ICU. Surprisingly, age was inversely associated with hospitalization (Table 4) among SARS-CoV-2 positive individuals.<br /> Conclusion
To the best of our knowledge, this is the first report showing that there are less current smokers among SARS-CoV-2 positive persons. However, looking at smoking history (former + current smoking=ever smokers), less subject of classification bias, the difference seems to be less. It is not known what is the percent of former smokers who were recent quitters; duration of previous abstinence from smoking is a crucial variable in assessing associations with smoking status. There is no report of biochemical verification of smoking status. <br /> It is not known when smoking status is reported with respect of the SARS-CoV-2 testing. It is likely that individuals with clinical symptoms stopped smoking some days before testing and considered themselves as former smokers.
The fact that alcohol use disorder, which is frequently associated with tobacco use disorder, is also less frequent among SARS-CoV-2 positive individuals raises the question of the specificity of the smoking finding and raises the contribution of substance use disorders overall i.e. the finding about current smoking is part of a cluster of various previous or current substance use disorders e.g. cannabis use, potentially associated with SARS-CoV-2 negative test directly or through associated health disorders e.g. hepatic disorders as a consequence of alcohol use. <br /> COPD as well as current smoking are being reported to be more frequent among SARS-CoV-2 negative individuals raising the possibility that reduced respiratory function (entry of SARS-CoV-2 is by the respiratory tract) is associated with lower likelihood of SARS-CoV-2 positive tests. <br /> It seems that all individuals included were tested because they had symptoms suggestive of COVID-19. It is surprising that only 585/3789 (15.4%) tested positive. This should be discussed.<br /> The paper does not report on analyses of smoking by clinical signs/co-morbidities interactions. It is likely that former smokers or those with alcohol use disorders are more frequent among individuals with comorbidities. Based on previous knowledge about smoking associated health disorders, one can assume that more severe clinical signs were associated with current smoking or among recent quitters; the smoking x clinical signs interaction is not tested. <br /> The authors conclude on page 14 “To wit, we found that current smoking, COPD, and alcohol use disorder, factors that generally increase risk of pneumonia, were associated with decreased probability of testing positive. While they were not associated with hospitalization or intensive care, it is too early to tell if these factors are associated with subsequent outcomes such as respiratory failure or mortality.”<br /> The reduced current smoking rate among SARS-CoV-2 positive individuals is an interesting but preliminary finding. It is likely that it is part of a more complex symptomatology and not specific to current smoking. Smoking status should have been assessed on a more detailed manner. The current findings, from a retrospective, cross sectional analysis, are insufficient to support the hypothesis that current smoking protects against SARS-CoV-2 positivity.
-
On 2020-04-30 14:34:37, user Ivan Berlin wrote:
Rentsch CT et al. Covid-19 Testing, Hospital Admission, and Intensive Care Among 2,026,227 United States Veterans Aged 54-75 Years. <br /> medRxiv preprint doi: https://doi.org/10.1101/202... version posted April 14, 2020<br /> Review of the results concerning smoking related issues.<br /> Ivan Berlin<br /> The title is somewhat confusing. Only 3789 persons were tested for SARS-CoV-2.<br /> Data are extracted from the Veteran Administration (USA) Birth Cohort born between 1945 and 1965 electronic database. Between February 8 and March 30, 2020, 3789 persons were tested for SARS-CoV-2. Among them 585 were tested SARS-CoV-2 positive (15.4%) and 3204 SARS-CoV-2 negative. (Remark: the authors frequently confound testing for SARS-CoV-2 and having the disease: COVID-19.)<br /> Testing used nasopharyngeal swabs, 1% of the testing samples was from other unspecified sources. Testing was performed “in VA state public health and commercial reference laboratoires”, page 7. No further specification about the testing method is provided. Data are analyzed as if no between test-sources variability existed. However, it is unlikely that between test-source variability would influence the findings.<br /> Data extraction included diagnostics by diagnostic codes of comorbidities, non-steroid inflammatory drug (NSAID), angiotensin converting enzyme inhibitor (ACE) and angiotensin II receptor blocker (ARB) use, vital signs, laboratory results, hepatic fibrosis score, presence or absence of alcohol use disorder and smoking status.<br /> Smoking status data, never, former, current smokers were extracted using the algorithm described in McGinnis et al. Validating Smoking Data From the Veteran’s Affairs Health Factors Dataset, an Electronic Data Source. Nicotine & Tobacco Research, Volume 13, Issue 12, December 2011, Pages 1233–1239, https://doi.org/10.1093/ntr... used for HIV patients. According to this paper, the algorithm correctly classified 84% of never-smokers 95% of current smokers but only 43% of former smokers. The reported overall kappa statistic was 0.66. When categories were collapsed into ever/never, the kappa statistic was somewhat better: 0.72 (sensitivity = 91%; specificity = 84%), and for current/not current, 0.75 (sensitivity = 95%; specificity = 79%). Thus, classification error cannot be excluded in particular in classifying former smokers. <br /> In unadjusted analyses (Table 1) factors associated significantly with SARS-CoV-2 positivity were: male sex, black race, urban residence, chronic kidney disease, diabetes, hypertension, higher body mass index, vital signs but not NSAID or ACE/ARB exposure. It is to note, that among the laboratory findings, severity of hepatic fibrosis was associated with positive SARS-CoV-2 tests. <br /> Among those with alcohol use disorder, 48 (8.2%) tested positive versus 480 (15%) who tested negative (p<0.001).<br /> Among never smokers 216 (36.9%) tested positive vs 826 (25.8%) who tested negative. Among former smokers 179 (30.6%) tested positive vs 704 (22%) who tested negative. Among current smokers 159 (27.7%) tested positive vs 1444 (45.1%) who tested negative. Expressed otherwise, among SARS-CoV-2 negative individuals, there were less never smokers, less former smokers and more current smokers. To note: the reported OR for current smoking should be the inverse to that presented i.e. <1 and not >1. However, among individuals with SARS-CoV-2 positivity there were more persons with positive smoking history (former + current smokers): 57.8 % than with negative smoking history (never smokers): 36.9%. <br /> COPD, known to be strongly related to former or current smoking, was more frequent among SARS-CoV-2 negative (28.2%) than among SARS-CoV-2 positive (15.4%) individuals p<001).<br /> In multivariable analyses (Table 2), male sex, black ethnicity, urban residence, lower systolic blood pressure, prior use of NSAID but not ACE/ARB use and obesity were associated with SARS-CoV-2 positive test; current smoking (OR: 0.45, 91% CI: 0.35-057), alcohol use disorder (OR 0.58, 95%CI: 0.41-0.83) and COPD (OR: 0.67, 95%CI: 0.50-0.88) were associated with decreased likelihood of SARS-CoV-2 positive test. No association with age and SARS-CoV-2 positive test was observed. The association with hepatic fibrosis with SARS-CoV-2 positive tests remained significant in the multivariable analysis and the authors point out (page 15) that the “pronounced independent association with FIB-4 (fibrosis) and albumin suggest that virally induced haptic inflammation may be a harbinger of the cytokine storm.”, page 15. <br /> The main risk factors for hospitalization or ICU among SARS-CoV-2 positive persons are those that associated with a worse clinical signs (status). This is expected: clinical decision about severity is based on current clinical signs and not on previous history. <br /> Neither co-morbidities, nor smoking status or alcohol use disorder were associated with hospitalization/ICU. Surprisingly, age was inversely associated with hospitalization (Table 4) among SARS-CoV-2 positive individuals.<br /> Conclusion of the reviewer.<br /> This is the first report showing that there are less current smokers among SARS-CoV-2 positive persons. However, smoking history (former + current smoking) seems to be more frequent among SARS-CoV-2 positive individuals than never smoking. It is not known what is the percent of former smokers who were recent quitters; duration of previous abstinence from smoking is a crucial variable in assessing associations with smoking status. This raises the question of the validity of smoking status category classification. <br /> It is not known when smoking status is reported with respect of the SARS-CoV-2 testing. It is likely that individuals with clinical symptoms stopped smoking some days before testing and considered themselves as former smokers.
The fact that alcohol use disorder, which is frequently associated with tobacco use disorder, is also less frequent among SARS-COV-2 positive individuals raises the question of the specificity of the smoking finding and the raises the contribution of substance use disorders overall i.e. the finding about current smoking is part of a cluster of various previous or current substance use disorders e.g. cannabis use, potentially associated with SARS-CoV-2 negative test. <br /> COPD as well as current smoking are being reported to be more frequent among SARS-CoV-2 negative individuals raising the possibility that reduced respiratory function (entry of SARS-CoV-2 is by the respiratory tract) is associated with lower likelihood of SARS-CoV-2 positive tests. This hypothesis may suggest that reduced respiratory function and not smoking itself is associated with higher likelihood of SARS-CoV-2 negative tests. <br /> The paper does not report on analyses of smoking by clinical signs/co-morbidities interactions. It is likely that former smokers or those with alcohol use disoders are more frequent among individuals with comorbidities. Based on previous knowledge about smoking associated health disorders, one can assume that more severe clinical signs were associated with current smoking or among recent quitters; the smoking x clinical signs interaction is not tested. <br /> The authors conclude on page 14 “To wit, we found that current smoking, COPD, and alcohol use disorder, factors that generally increase risk of pneumonia, were associated with decreased probability of testing positive. While they were not associated with hospitalization or intensive care, it is too early to tell if these factors are associated with subsequent outcomes such as respiratory failure or mortality.”<br /> The reduced current smoking rate among SARS-CoV-2 positive individuals is an interesting but preliminary finding. It is likely that it is part of a more complex symptomatology and not specific to current smoking. Smoking status should have been assessed on a more detailed manner. The current findings, from a retrospective cross sectional analysis, certainly not support the hypothesis that current smoking protects against SARS-CoV-2 positivity.
-
-
www.medrxiv.org www.medrxiv.org
-
On 2020-04-16 21:17:49, user Sinai Immunol Review Project wrote:
Key findings:
The authors wanted to better understand the dynamics of production SARS-CoV-2-specific IgM and IgG in COVID-19 pneumonia and the correlation of virus-specific antibody levels to disease outcome in a case-control study paired by age. The retrospective study included 116 hospitalized patients with COVID-19 pneumonia and with SAR-CoV-2 specific serum IgM and IgG detected. From the study cohort, 15 cases died. SARS-CoV-2 specific IgG levels increased over 8 weeks after onset of COVID-19 pneumonia, while SARS-CoV-2 specific IgM levels peaked at 4 weeks. SARS-CoV-2 specific IgM levels were higher in the deceased group, and correlated positively with the IgG levels and increased leucocyte count in this group, a indication of severe inflammation. IgM levels correlated negatively with clinical outcome and with albumin levels. The authors suggest that IgM levels could be assessed to predict clinical outcome.
Potential limitations:
There are limitations that should be taken into account. First, the sample: small size, patients from a single-center and already critically ill when they were admitted. Second, the authors compared serum IgM levels in deceased patients and mild-moderate patients and found that the levels were higher in deceased group, however even if the difference is statistically significant the number of patients in the two groups was very different. Moreover, receiving operating characteritics (ROC) curves were used to evaluate IgM and IgG as potential predictors for clinical outcome. Given the low number of cases, specially in the deceased group, it remains to be confirmed if IgM levels could be predictive of worst outcome in patients with COVID-19 pneumonia. The study did not explore the role of SARS-CoV-2-specific IgM and IgG in COVID-19 pneumonia.
Overall relevance for the field:
Some results of this study have been supported by subsequent studies that show that older age and patients who have comorbidities are more likely to develop a more severe clinical course with COVID-19, and severe SARS-CoV-2 may trigger an exaggerated immune response. The study seems to demonstrate that the increase of SARS-CoV-2-specific IgM could indicate poor outcome in patients with COVID-19 pneumonia, however given the very small sample size, the results are not yet conclusive.
Review by Meriem Belabed as part of a project by students, postdocs and faculty at the Immunology Institute of the Icahn school of medicine, Mount Sinai.
-
-
www.medrxiv.org www.medrxiv.org
-
On 2022-02-08 21:10:34, user Sara wrote:
Thank you for your comment, unfortunately, I did not receive your comment once you replied. 1- we are in the era in the big data, more projects are aimed at generation of large cohort that we can depend upon to derive our clinical decision. <br /> The analysis used the data from US, the model will be deployed and can be used after that to predict the survival time of small cohorts. <br /> 2- We investigated the hazards assumption, we agree with you, we should add the results in the manuscript<br /> 3- SEER database identify the surgery as the surgical removal of the tumour.<br /> 4- I agree with you on the grade, it was on the old grading system for glioblastoma which is mentioned on SEER guidelines. Updated version will be posted and will update the analysis removing this one<br /> 5- we agree with you, we will change it in the updated comments<br /> 6- It is not insane! Developing models that consider these cases is a challenge. These models will be deployed for survival prediction of different cases of glioblastoma with different survival times.
7- we are developing a model that can be used for the routine data "we use", in this case US cancer data. We have a model that performed well so it can be deployed in the future for the clinical use for our routine data. the model is trained on large sample size that we believe it will achieve accurate prediction results for any routine data. The deployment of the model and its use in clinical practice is the goal. I hope you see the full picture.
Thank you for your comments.
-
-
www.medrxiv.org www.medrxiv.org
-
On 2022-06-24 22:03:50, user Charles Warden wrote:
Hi,
Thank you very much for posting this preprint. This certainly represents a large amount of work and careful consideration!
I have some questions / comments:
1) Is there a way for me to calculate enhanced scores for myself?
For example, I would like to learn more, but I was not very satisfied with the PRS that I listed for my own genomic sequence in this blog post:
https://cdwscience.blogspot...
2) In the blog post link above, there seemed to be a noticeable disadvantage to the PRS without taking the BMI into consideration for Type 2 Diabetes.
In this paper, age is an important factor in Figure 1 for the PRS.
If other non-genetic factors are known, do you have a comparison for non-PRS models? <br /> For example, I wonder how performance of age + BMI (+ other established factors) compares to the plot for Type 2 diabetes in Figure 1.
3a) I see that the percent variance explained is sometimes provided (such as Supplemental Figure 5), but sometimes it is not.
For example, in Figure 3, the effect per 1 SD of PRS is higher for LDL cholesterol than height. However, how does the ability to predict an individual's height from genetics alone compare to the ability to predict an individual's LDL from genetics alone?
After a certain age (as an adult), the exact value for my own LDL has varied more than my height. However, I was not sure how that variation by year compared to others and/or the variation over decades.
In general, I would like to have a better sense of how absolute predictability compares for height versus disease scores. I also understand that there are complications with binary versus continuous assignments, but it is something that I thought might be helpful.
3b) I see AUC statistics in Supplemental Figure 2, described as for AUROC. However, am I correct that some of the cases are not well balanced with controls?
If so, should something like AUPRC be provided (possibly as a complementary supplemental figure)? I believe the idea is described in Saito and Rehmsmeier 2015; the application is very different, but you can see the inflated AUROC values in Figure 1A of Xi and Yi 2021. I expect that there are other good ways to illustrate the differences with PRS in cases and controls of varying proportions, but that was one thought.
In the context of genomic risk, I might expect that high predictability in a small number of individuals may be preferable over a small difference in low predictability in a large number of individuals. There is emphasis on thresholds like top/bottom 3% (in many but not all figures), which I thought might be consistent with that opinion.
So, I think something like Figure 1 was helpful. In order to try and capture how false positives change when sensitivity increases, I am not sure if something similar for positive predictive value might help? I would consider that very important if the PRS might be used for screening purposes.
4) In the Supplemental Methods, I believe that you have a minor typo:
Current: 100,000 Genomes Project (100KGP). The 100,00 Genomes Project, run by Genomics England,<br /> Corrected: 100,000 Genomes Project (100KGP). The 100,000 Genomes Project, run by Genomics England,
Thank you very much!
Sincerely,<br /> Charles
-
-
www.medrxiv.org www.medrxiv.org
-
On 2025-07-24 23:50:17, user Rong Liu wrote:
Update on the association between influenza vaccination and cardiovascular outcomes
Dear readers,<br /> As the authors of a living systematic review on the association between influenza vaccination, cardiovascular mortality and hospitalization, (1) we want to update readers on the findings from our most recent search. The review protocol specifies updates every six months for a minimum of three years, commencing April 2022. The baseline search was conducted on 31 May 2022, with subsequent updates on 25 January 2023 and 1 September 2023. Results from these initial searches were published in Vaccine in January 2024. (1)
The latest search, completed on 31 March 2025, identified two studies that meet the eligibility criteria for review inclusion. Both are multi-center trials conducted within a single country, with a follow-up duration of at least 12 months. A third study was excluded due to its shorter follow-up period of only six months. (2,3) The eligible studies include a China-based trial (PANDA II) enrolling patients hospitalized for heart failure, (4) and an India-based trial (FLUENTI-MI) enrolling patients with recent myocardial infarction. (5,6) In both studies, the intervention is influenza vaccination. The comparator in FLUENTI-MI is saline placebo, and standard care in PANDA II. The primary outcome in both trials is a composite of all-cause mortality and all-cause hospitalization during the locally defined influenza season.
As of 6 June 2025, neither study has publicly available results, and therefore we are unable to update the meta-analysis at this time. Table 1 summarizes the study characteristics and expected timelines. PANDA II completed recruitment in February 2024 and is expected to report results within the next year. (4) FLUENTI-MI is projected to complete recruitment in October 2028. Given the current pace of research in this area, we believe that biannual updates are no longer necessary, and we will transition to annual updates for the next five years, starting from the date of this latest search.
Reference <br /> 1. Liu R, Fan Y, Patel A, et al. The association between influenza vaccination, cardiovascular mortality and hospitalization: A living systematic review and prospective meta-analysis. Vaccine. 2024/02/15/ 2024;42(5):1034-1041. doi: https://doi.org/10.1016/j.vaccine.2024.01.040 <br /> 2. Liu R, Patel A, Du X, et al. Association between influenza vaccination, all-cause mortality and cardiovascular mortality: a protocol for a living systematic review and prospective meta-analysis. BMJ Open. 2022;12(3):e054171. doi:10.1136/bmjopen-2021-054171<br /> 3. Tkaczyszyn M. Vaccination Against Influenza Pre-discharge in Heart Failure. https://clinicaltrials.gov/study/NCT06725927 <br /> 4. Zhang Y, Liu R, Zhao Y, et al. Influenza vaccination in patients with acute heart failure (PANDA II): study protocol for a hospital-based, parallel-group, cluster randomized controlled trial in China. Trials. 2024/11/25 2024;25(1):792. doi:10.1186/s13063-024-08452-8<br /> 5. Roy A. Influenza Vaccine to reduce cardiovascular events in patients with recent myocardial infarction: a multicentric randomized, double-blind palcebo-controlled trial. https://trialsearch.who.int/Trial2.aspx?TrialID=CTRI/2024/05/067056 <br /> 6. Roy A, Yadav S. Influenza vaccine in cardiovascular disease: Current evidence and practice in India. Indian Heart Journal. 2024/11/01/ 2024;76(6):365-369. doi: https://doi.org/10.1016/j.ihj.2024.11.247 <br /> https://uploads.disquscdn.c...
-
-
www.medrxiv.org www.medrxiv.org
-
On 2020-05-14 14:35:10, user Hans Tinger wrote:
3% after 1 Werk, 6%after 2 Weeks, 9% after 3 Weeks... I am curious for week 4-8. Will you publish preliminary results soon again?
-
-
www.medrxiv.org www.medrxiv.org
-
On 2020-03-25 21:03:54, user Sinai Immunol Review Project wrote:
Summary of Findings: <br /> - Clinical data from 116 hospitalized CoVID-19 patients analyzed over 4 weeks for correlation with renal injury. Comorbidities included chronic renal failure (CRF) in 5 patients (4.3%). <br /> - Approx 10.8% of patients with no prior kidney disease showed elevations in blood urea or creatinine, and 7.2% of patients with no prior kidney disease showed albuminuria. <br /> - Patients with pre-existing CRF underwent continuous renal replacement therapy (CRRT) alongside CoVID-19 treatment. Renal functions remained stable in these patients. <br /> - All 5 patients with CRF survived CoVID-19 therapy without progression to ARDS or worsening of CRF.
Limitations: <br /> - Renal injury biomarkers in patients with incipient kidney abnormalities not tabulated separately, making overall data hard to interpret. It will be critical to separately examine kidney function (BUN, urine creatinine and eGFR) in patients that developed any kidney abnormalities (7.2~10.8% of cohort). <br /> - No information on type of CoVID-19 therapy used across cohort; will be useful to correlate how treatment modality influences kidney function (and other parameters). <br /> - Invokes previous clinical-correlation studies that indicate low instances of kidney damage [1,2], but those studies did not track longitudinal urine samples for acute renal injury markers and viral shedding. <br /> - CRRT in patients with CRF is standard therapy irrespective of CoVID-19 status; it will be important to compare clinical parameters of these patients (n=5) with virus-naïve CRF patients (none in this study) to make any meaningful conclusions.
Importance/Relevance: <br /> - This study argues that renal impairment is uncommon in CoVID-19 and not associated with high mortaility, in stark contrast to a concurrent study (https://doi.org/10.1101/202... ). If supported by further studies, it suggests kidney impairment is secondary to cytokine storm/inflammation-induced organ failure, and not due to direct viral replication. <br /> - Will be important to comprehensively characterize larger datasets of CoVID-19 patients across hospitals (meta-analyses) to conclude if kidney function is actively disrupted due to viral infection, and if renal disease is a major risk factor for worse CoVID-19 outcomes.
References: <br /> 1. Wang D, Hu B, Hu C, et al. JAMA 2020; published online Feb 7. <br /> doi: 10.1001/jama.2020.1585
- Guan WJ, Ni ZY, Hu Y, et al. MedRvix 2020; <br /> doi: https://doi.org/10.1101/202....
Review by Samarth Hegde as part of a project by students, postdocs and faculty at the <br /> Immunology Institute of the Icahn school of medicine, Mount Sinai.
-
-
www.medrxiv.org www.medrxiv.org
-
On 2024-05-01 23:32:45, user ppgardne wrote:
This is an excellent paper, showing a clear association between variation in RNU4-2 and NDD phenotypes. The enrichment of variation in the gene between undiagnosed NDD and population cohorts was remarkable.
I thought there were a few areas where the manuscript could be improved slightly.
* Figure 1: Clearly define the measures “genotype quality”, “allele balance” and “total coverage”. We can infer what these mean, but definitions of each in the method section would be helpful.
* Table 1: I spent some time gathering the population sizes for each of the count columns. Please add an extra row or two, giving the number of individuals in GEL NDD, Non-GEL NDD and the population cohort.
* The statement “Humans have multiple genes that encode the U4 snRNA, although only two of these, RNU4-2 and RNU4-1, are highly expressed in the human brain” is slightly inaccurate. The HGNC database and reference (https://doi.org/10.15252/em... "https://doi.org/10.15252/embj.2019103777)") list just those two functional copies of U4 in the human genome. There are ~100 annotated pseudogenes however.
* You state that there is “97.2% homology” between RNU4-1 & RNU4-2 – this is a wrong (but common) use of the term homology. You should have stated “similarity” instead.
* Figure 3: I understand that the BrainVar RNAseq data are from samples of human dorsolateral prefrontal cortex. This should be stated in the caption.
* Figure 3: you state that “expression of RNU4-1 & 2 is tightly correlated”. Looking at the figure it appears the tissues with higher expression are also the ones were more samples were taken. Was the potential confounding of sample depth and/leverage accounted for in the analysis?
* Figure 4: it is unclear what this heatmap is showing. Is it really normalised on a per-gene basis, or is the null for SNV densities derived from the 1,000 random intergenic sequences mentioned in the methods? That would seem to be a more useful measure of variant enrichment or paucity. The ordering of the sequences is odd too, why are the paralogous genes U4/U4ATAC, U1/U11, U2/U12, U5 etc not next to each other? Surely the paralogs are more comparable. What is the justification for an 18bp window? –Other than that is the size of the variable region in RNU4-2.
* The recurrence of n.64_65insT is fascinating. And speculation on the mechanism is very worthwhile. You mention early in the manuscript the possibility of slippage in homopolymer regions, but this is not mentioned again in the appropriate section. You mention local secondary structure as a possible driver, but there seems to be very little evidence to support this based on free energy modelling.
-
-
www.medrxiv.org www.medrxiv.org
-
On 2024-11-30 22:32:43, user xPeer wrote:
Summary<br /> The preprint investigates the remodeling effects of icosapent ethyl (IPE) supplementation on plasma lipoproteins and its subsequent impact on cardiovascular disease (CVD) risk markers in normolipidemic individuals. The study finds that IPE supplementation significantly enhances eicosapentaenoic acid (EPA) levels in the plasma, reducing major CVD risk markers such as triglycerides, remnant cholesterol, and apoB levels. There are consistent alterations across all lipoprotein classes, influencing their lipidomes, reducing proteoglycan binding properties, and potentially decreasing the atherosclerotic risk. However, the study's small sample size and short duration limit the generalizability of findings.
Major Revisions
- Extended Sample Size and Duration:<br /> The study's findings are constrained by a limited sample size and short duration (28 days), impeding the generalizability to broader populations or those with pre-existing cardiovascular conditions.
-
Example: Expand the cohort size and extend the duration to assess long-term impacts and variability of EPA incorporation among different CVD risk groups (Discussion, Page 14).
-
Detailed Mechanistic Insights:<br /> The precise mechanisms by which IPE alters lipoprotein characteristics and its direct influence on cardiovascular outcomes remain unclear.
-
Example: Detailed mechanistic studies on how IPE-induced lipid species changes relate to atherosclerosis progression are needed (Results, Page 11).
-
Individual Variability Analysis:<br /> The study underscores substantial interindividual variability in response to IPE supplementation, calling for personalized treatment approaches.
-
Example: Investigate genomic or lifestyle factors contributing to variability in response to IPE (Results, Page 13).
-
Proteoglycan Binding and Aggregation:<br /> The study notes reduction in proteoglycan binding and different responses in LDL aggregation among participants but lacks detailed analysis.
- Example: Provide more comprehensive data and rationale behind the differential LDL aggregation responses post IPE-supplementation (Results, Page 8).
Recommendations
- Larger and Diverse Cohort Studies:<br /> Conduct studies with larger and more diverse cohorts to bolster the reliability and applicability of the findings across various population subsets.
- Longitudinal Studies:<br /> Extend the study duration to capture long-term effects of IPE on lipoprotein profiles and cardiovascular health outcomes.
- Mechanistic Pathway Research:<br /> Incorporate omics approaches (genomics, proteomics) to unravel the underlying mechanisms modified by IPE that contribute to reduced CVD risks.
- Personalized Medicine Approaches:<br /> Develop stratified medicine approaches to optimize IPE dosage and treatment protocols tailored to individual lipidomic profiles and genetic backgrounds.
- Detailed Biophysical Characterization:<br /> Enhance the biochemical and biophysical characterization of proteoglycan binding and lipoprotein aggregation properties altered by IPE supplementation.
Minor Revisions
- Textual and Formatting Errors:
- Ensure consistency in figure label fonts and styles across the manuscript.
- Correct minor typographical errors and ensure uniformity in section formatting (e.g., use of italics, bold).
-
Specific errors include inconsistent capitalization in headings and figure labels requiring standardization (Introduction, Page 2; Results, Page 8).
-
AI Content Analysis:
- Estimated AI Content: Approximately 10%.
- Highlighted AI-Detected Sections: Notable in the background and introduction sections with possible AI involvement in text generation.
- Assessed Epistemic Impact: The AI-generated content does not undermine the scientific rigor but would benefit from expert revision to enhance field-specific terminology and depth.
Overall, the preprint presents insightful preliminary findings on the cardioprotective impacts of IPE supplementation, recommending essential improvements and comprehensive validations for future extensive studies.
-
-
www.medrxiv.org www.medrxiv.org
-
On 2025-02-24 23:42:40, user Stephen Goldstein wrote:
Manuscript summary
The authors report a small study comparing patients with “post-vaccination syndrome” or “PVS” with vaccinated, healthy controls. They used a variety of immunological techniques and report they have identified potential immune signatures in PVS patients, which may reflect an underlying mechanism of this condition.
Personal disclaimer
This manuscript has received considerable attention and attracted much commentary, including critical commentary from myself on twitter (@stgoldst). I was immediately skeptical of these findings given the attention to it, small study size, and amplification by anti-vaccine activists. However, the potential for vaccine injury is a serious matter, so a rigorous review of this manuscript is a critical need. I attempt here to account for my biases, and to check for these I used a Google AI model to conduct an orthogonal review. That is posted separately.
Review
Overview
This study described by this manuscript is methodologically flawed to a degree that undermines the authors’ stated goal to identify biomarkers for post-vaccination syndrome (PVS). These flaws are systematic, ingrained into the study design, and compounded by analytic flaws throughout the manuscript. As is, this study provides weakly informative data at best towards understanding chronic illness following vaccination. The methodological flaws are listed below and subsequently expanded upon.
- PVS and control cohorts are very small, and even smaller when stratified by infection status.
- Prior infection status is poorly controlled – though this may be difficult to overcome
- The study does not include a control group of unvaccinated individuals reporting similar chronic symptoms as the PVS cohort.
- PVS is defined by self-reported symptoms with no clinical assessment or classification system.
- Small effect sizes and weak correlations are repeatedly described via their statistical significance, with no biological context provided by the authors.
-
The study provides no evidence for a causal link
-
PVS and control cohorts are very small, and even smaller when stratified by infection status.
The PVS cohort comprised only 44 patients originally, and was reduced to 39 due to pharmacological inhibition in 2 patients. The authors acknowledge that due to the small size of the study and its exploratory nature they did not conduct a power analysis. They acknowledge the difficulty in producing robust results due to the sample size. Despite acknowledging these problems, the authors repeatedly invoke the statistical significance of various analyses and in some cases rely on extremely involved statistical testing to identify weak signals. This presents an impression that the authors understand the inability, baked in from the start, of the study to be informative yet press ahead anyway.
- Prior infection status is poorly controlled – though this may be difficult to overcome. T
he authors stratify the cohorts by infection status, with the primary determination based on serological status of anti-nucleocapsid (N) antibodies. The study participants were recruited in December 2022 at the earliest, nearly 3 years after the first SARS-CoV-2 infections were identified in the United States. Given the expected decline in serum antibody titers over time, it’s likely that people infected in the first year of the pandemic (and possibly even later into the pandemic) would test seronegative. Therefore, the -I cohorts likely include individuals who were in fact infected with SARS-CoV-2 at some point. This is a critical issue. The number of individuals without infection history is likely even smaller than presented, reducing the utility of stratification. In addition, this may actually confound the ability to disentangle the effects of vaccination vs infection in the development of chronic illness. It would be difficult to methodologically correct for this without a prospective longitudinal study. However, larger sample sizes might allow researchers to mitigate its impact. Given these sample sizes and the inability to reliable sort by prior infection status, the issue precludes making robust inferences from the data.
- The study does not include a control group of unvaccinated individuals reporting similar chronic symptoms as the PVS cohort.
The authors describe the health of study participants based on GH VAS scores and note that PVS participants were in worse health than the control participants. In the Discussion, the authors expand on this, noting that PVS participants also had worse health than the U.S. general population. Given the real potential for other disease processes to impact every one of the biomarkers tested, the lack of unvaccinated, chronically ill participants (reporting the same syndromic profile as PVS patients) confounds any correlates between these biomarkers and vaccination. The study analyses are uninterpretable with respect to the impact of vaccination on health, as a result.
- PVS is defined by self-reported symptoms with no clinical assessment or classification system.
PVS was previously described by some of the same authors based on self-reported chronic sequelae following vaccination. This definition is then relied upon in this study. However, many of these symptoms are non-specific and certainly there is no evidence, given the lack of complete overlap, that they represent a single syndrome. There does not appear to be any clinical assessment to verify any of them. This is a repeated issue with descriptive studies of long covid (PACS) and now PVS, and I acknowledge the inherent challenges in establishing other criteria. Nevertheless, it represents a major problem in trying to describe a unified syndrome downstream of vaccination.
- Small effect sizes and weak correlations are repeatedly described via their statistical significance, with no biological context provided by the authors.
Throughout the manuscript the authors describe differences between PVS and patient cohorts solely through the p-value returned by statistical testing. Looking at the figures themselves the effect sizes turn out to be extremely small in virtually every case. Small effect sizes don’t mean there is no biological significance, but the authors in this study expend no effort to offer context or even a coherent hypothesis for why these effect sizes are significant. Expecting the reader to favorably interpret the data, or indeed interpret it all, based purely on p-values is…disconcerting. It’s not clear in the writing that the authors even consider effect sizes to be relevant, or if getting a sufficiently small p-value is good enough to report and believe a major finding. I’m not confident that the authors really interpreted the data to any depth themselves.
- The study provides no evidence for a causal link.
There is simply no causality evident in the data or really presented by the authors. Given the generally poor health of the PVS participants, all of the elevated inflammatory biomarkers and the elevated EBV reactivity could all be due to varied other disease processes, infectious or not. One clear example of this is Figure 4K where the authors correlate EBVgp42 reactivity with the percentage of CD8+ T cells producing TNF?. The Correlation R value is 0.47, indicating a weak to moderate link. Because EBV reactivation is tightly linked to general stress, the weakness of this correlation is highly suggestive of other disease processes making a significant contribution, or the PVS link being artifactual. The authors make no effort to account for this.
Specific Points
References 16 and 18 need to be corrected
“interaction with full-length S, its subunits (S1, S2), and/or <br /> peptide fragments with host molecules may result in <br /> prolonged symptoms in certain individuals16.”<br /> -Ref16 is a study describing circulating spike and S1 <br /> following vaccination, but does not mention anything about<br /> prolonged symptoms.
“Recently, a subset of non-classical monocytes has been shown to harbor S protein in patients with PVS18.” <br /> -Ref18 is a study on PACS (post-acute covid-19 sequelae) <br /> and does not mention vaccination or post-vaccination <br /> syndrome<br /> -Ctrl+F for “vaccine” “vaccination” “PVS” returns no results in <br /> this manuscript
Figure 3 on the kinetics of serological findings is generally confusing<br /> -For Control and PVS+I groups the authors report no decline <br /> in anti-spike antibodies over the course of months to year. <br /> -This runs counter to basic immunological principles and <br /> robust, repeatable findings with respect to anti-SARS-CoV-2<br /> spike antibodies in particular<br /> -One explanation for this is subsequent mild infections that <br /> boost antibody levels, but there are no spikes evident, but <br /> rather a steady maintenance.<br /> -The exception to this is PVS-I antibodies which decline at <br /> what is to the naked eye a normal rate. <br /> -This suggests an issue with the control or PVS+I cohorts, or <br /> a disturbing indication that they are not representative of the <br /> immunological state in their respective populations. Due to <br /> the small sample size, this seems likely<br /> -The authors should explain that because the PVS-I <br /> participants weren’t infected, their “days since post-<br /> exposure/vaccination” data are identical. Absent that, it’s <br /> confusing to notice that the PVS-I data in rows B and C are <br /> identical and raises concern about duplication in figures
The authors don’t describe the rationale for the EBV coinfection analysis displayed in Figure 4, and so there’s no way for the reader to interpret what (if any) significance to ascribe to it.<br /> -Figure 4D shows a small but statistically significant <br /> increase in IgG against EBVgp42 for PVS cohort relative to <br /> controls – however...<br /> -When the PVS cohort is stratified by prior infection status <br /> there is no statistically significant difference<br /> -This make it really difficult to interpret the difference when<br /> the PVS group remains together<br /> -It raises the question for me of whether the statistical <br /> significance is just sensitive to the number of data points,<br /> which for me makes it not robust<br /> -Again – as throughout the paper no biological context is<br /> given
Even the correlation between EBVgp42 in serum and EBVgp42 antibody reactivity is low<br /> -Again very difficult data to interpret and unclear what the <br /> biological significance would be<br /> -Problems with the correlation analysis in Figure 4K were <br /> discussed above<br /> Figure S4C is discussed in the text, but briefly and important data is ignored<br /> -It appears true that PVS participants have elevated<br /> autoantibodies of IgM and IgA isotypes, but their IgG <br /> autoantibodies are actually similar to controls<br /> -Not clear if there might be a class switching defect that <br /> could be related to a pathogenic process, or other<br /> explanation – the authors don’t address<br /> -The authors just say PVS patients just have autoantibodies,<br /> which obfuscates their own data that it’s isotype specific<br /> The interpretation of Figure 5C is also strange – most PVS patients have no circulating anti-S1 antibodies and the statistically significant difference is driven by a minority who do<br /> -The authors state there’s a difference without any effort to<br /> interpret it<br /> -This suggests that PVS, which the authors are trying to<br /> characterize as one syndrome, is either not one thing, or the<br /> presence or absence of anti-spike antibodies is ancillary<br /> -Unfortunately the authors gloss over any nuance in the data<br /> The data on specific biomarkers in Figure 5H is based on such small sample sizes I question whether it was even appropriate to do this analysis at all<br /> -To be clear, the issue isn’t whether the question is worth<br /> asking, it is. The issue is that one should not do an analysis<br /> that is so underpowered it will be definitionally <br /> uninterpretable<br /> -The fact that the authors had to jump through statistical<br /> hoops to find a statistically significant effect is concerning <br /> -the fact this includes a sub-group of only three patients is <br /> just methodologically inappropriate.<br /> Given the authors’ use of machine learning failed to reveal any coherent set of biomarkers further argues against the contention that PVS is a definable syndrome<br /> -Or, that this study is so small it lacks value in defining the <br /> syndrome
Final summary
Ultimately this study adds little value, at best, towards understanding post-vaccination sequelae experience and reported by some individuals. At worst, it injects claims and interpretations into the field and discourse that are unfounded, and will ultimately slow efforts to help patients. These results have already been used to advance anti-vaccine narratives in online discourse. If the data were robust, no one could complain. Because the data are not, it is tragic. Ultimately, there is no compelling evidence in this paper for an immunological signature associated with chronic illness following vaccination. Perhaps reflecting this, the authors provide almost no biological context for any of their findings, often reporting data merely as a p-value with no comment on the effect size (whether large or small). This leaves it unclear to a reader whether the authors are even aware of flaws in their work. Given the methodological flaws of this study, it is a questionable investment for researchers to follow up on it in a targeted way. Rather, well-powered, controlled, and methodologically sound studies should be conducted at scale to enable actionable findings to be made.
-
-
www.medrxiv.org www.medrxiv.org
-
On 2025-04-10 16:27:18, user Epidemiologist wrote:
This is a phenomenally bad study, which contains stark evidence of its bias in the Figure purportedly supporting its conclusions. To summarize:<br /> 1. They compare two groups of employees who received a trivalent, inactivated influenza vaccine. Those who received the vaccine (82%) and those who sought an exemption (18%).<br /> 2. As hospital employees, they are aware of the extent to which their work puts them at risk of exposure but the investigators make no effort to determine differences between these groups beyond very crude categorizations.<br /> 3. They find that, after 100 days, they see higher influenza rates in the vaccinated.<br /> 3. They provide no plausible explanation as to how the inactivated vaccine puts one at increased risk of influenza 100 days after vaccination.<br /> 4. That means the ONLY plausible explanation for a significantly higher risk in the vaccinated is a significantly higher exposure risk in the vaccinated. Ergo, the sample is biased.<br /> 5. It is notable that the infection rate among the vaccinated was only 2.5% in a high risk setting for infection. <br /> 6. In sum, the best explanation for their results is that the vaccine was very effective and their sample was biased.
-
On 2025-04-10 20:11:03, user Jeffrey_S_Morris wrote:
This study's conclusion of -27% negative effectiveness does not seem to be supported by the study, given they did not account for testing bias, which happens to also be 27%, with vaccinated testing on average a 27% higher rate than unvaccinated.
To their credit, the authors acknowledged this in the following plot:<br /> https://uploads.disquscdn.c... <br /> Here it can be seen in my replotting of their Figure 1a scatterplot on the log y axis (after extracting the data by applying AI tool to their scatterplot image), with the 27% increase being the (geometric) mean testing rate (vaccinated/unvaccinated) over the days they plotted.
https://uploads.disquscdn.c...
Incidentally, taking simple means (or fitting linear regressions) for a sample of ratios is not good statistical practice since the <1 and >1 parts are asymmetric, so instead the geometric mean (averaging on the log scale) should be used. For example, if one day is 4x higher for vaccine and one day 4x lower, they should average to be equivalent. The average on the raw scale (4 + 0.25)/2 = 2.125 would imply a mean 2.125x increase, which is incorrect, while a geometric mean (averaging on the log scale and then exponentiating) would get the correct result. 2^{log_2(4)+log_2(0.25)} = 2^(2 + -2) = 2^0 = 1. That is why I used geometric mean in the plot above and plot in the log scale, and think the authors should do the same in their paper.
While they acknolwedge the increased testing rate, the text of the paper dismisses it as a potential source of bias by claiming the test positivity rate is equivalent in vaccinated and unvaccinated. I agree with their logic that if test positivity were identical in vaccinated and unvaccinated, then the 27% higher testing rate could simply be a result of a 27% higher infection rate, and not from testing bias.
However, the analysis they present to support this assumption is not justified and seems flawed. They perform a linear regression of the ratio of testing positivity (vaccinated/unvaccinated) by day over time, and because the confidence bands intersect zero they conclude the test positivity is no different between vaccinated and unvaccinated, and thus the difference in testing rate is not a bias, but from the negative effectiveness that they conclude is true.<br /> https://uploads.disquscdn.c... <br /> However, this analysis is problematic for numerous reasons:<br /> 1. It is not clear why a regression over time should be done to answer this question, and not clear why one would assume any time trend is strictly linear. It would make much better sense to compute a (geometric) mean over time, or if wanting to model time trends to use a smooth nonparametric function.<br /> 2. Computing means or modeling time trends on ratios should not be done on the raw scale, but the log scale, for the reasons discussed above.
Plotting these numbers on the log scale (again, after using AI tool to extract it from their scatterplot image in the paper), I computed the geometric mean test positivity, and find it to be 0.80, meaning the "average" test positivity over time is 20% lower in vaccinated than unvaccinated, certainly not the same.
https://uploads.disquscdn.c... <br /> This lower test positivity is obscured in their original plot on the raw scale, since the ratios <1 got compressed and ratios>1 expanded.
If you have a situation with vaccinated having 1.27x the testing rate and 0.80x the test positivity, this would correspond to an infection rate that is 1.27 x 0.80 = 1.016x higher infection rate. This would correspond no difference in infection rate, certainly not a 27% increased infection rate in vaccinated.
While not a formal analysis, this demonstrates that vaccinated having a 27% higher testing rate along with a 20% lower test positivity rate could result in a 27% higher rate of confirmed flu infections even if the infection rate was equivalent between vaccinated and unvaccinated.
In that case. the 1.27x increased testing rate would be a testing bias that produces a spurious 1.27x confirmed infection rate even if the infection rate were not higher in the vaccinated.
Based on this, one cannot tell from the study whether the 1.27x increased rate of confirmed flu infections is from negative effectiveness (as claimed), or from the testing bias (which is not adjusted for in the analysis).
The authors cannot rule out the possibility that their results are caused by the testing bias, which is not accounted for in their analysis.
Thus, I don't think the conclusion of -27% VE is valid.
At most, they could say there is no evidence of any vaccine effectiveness vs. infection, but cannot conclude a significant negative effectiveness because of failure to account for the testing bias.
Of course, there are designs to adjust for this testing bias -- test negative designs -- but the authors eschew this design, seemingly because it gives odds ratios rather than relative rates which they express concern that they are not as intuitive to grasp.
To me, that seems like a relatively minor issue relative to testing bias of sufficient magnitude to drive spurious results.
If I were reviewing this paper, I'd require them to adjust for the testing bias, and ideally perform a test negative design, even if considered a secondary analysis.
Of course test negative designs have their own limitations and potential biases, but at least considering it as a secondary analysis would be useful to see if they obtain equivalent results using that design and, if not, should raise questions on whether they should boldly conclude negative effectiveness in this study, or instead more carefully conclude a lack of evidence of vaccine effectiveness in their cohort.
These concerns are also summarized in an http://x.com thread
-
-
www.medrxiv.org www.medrxiv.org
-
On 2025-10-20 15:20:57, user xPeer wrote:
Courtesy Double-Blind Peer Review Simulation from xPeerd :
Reviewer #1 Report
Summary<br /> The study aims to assess and compare the effectiveness of three advanced large language models (LLMs)—ChatGPT-5, DeepSeek V3, and Grok 4—in generating educational content about ADHD for non-specialist educators and outsourced physical education coaches. Employing a controlled prompt-based methodology and multiple readability/complexity indices, the manuscript investigates response accuracy, clarity, stability, and potential public health communication barriers in AI-generated outputs.
Major Comments
- Methodological Rigor & Generalizability<br /> The authors delineate a robust comparative framework, utilizing three guiding questions on ADHD for model interrogation. However, the scope is limited, as the testing population pivots exclusively on English-language outputs and Melbourne-based prompts. The authors themselves acknowledge:
-
"The study was conducted exclusively in English within a Melbourne-based testing environment, limiting generalizability to non-English-speaking populations" (page 21, Strengths and limitations).<br /> Reviewer suggestion: Future analyses should encompass a broader linguistic and cultural spectrum to truly capture the global applicability of AI for health education.
-
Depth of Statistical/Computational Analysis<br /> The study makes extensive use of readability indices (FKGL, SMOG, etc.), but does not sufficiently discuss their limitations when assessing AI-authored medical content. There is potential for bias when equating increased complexity with reduced accessibility; often, necessary clinical nuance may inherently raise reading levels. The manuscript states:
-
"Readability analyses further showed that DeepSeek V3 had the greatest variability, GPT-5 displayed steadily increasing complexity, and Grok-4 remained the most stable and comparatively less complex" (Discussion, page 17).<br /> Reviewer suggestion: A more critical lens is warranted—consider a combined readability/accuracy approach to better contextualize the trade-offs between precision and simplicity.
-
Real-World Impact and Usability<br /> Despite extensive quantitative comparison, the practical implications for coaches, teachers, and parents are relegated to future work. The manuscript admits, "The study focused primarily on textual readability and stability, rather than evaluating real-world comprehension or decision-making by specific user groups" (page 21).<br /> Reviewer suggestion: The next phase should prioritize empirical user testing to validate whether model outputs actually enhance pedagogical or clinical understanding and decision-making.
-
Novelty and Ethical Perspective<br /> The comparative model analysis is novel, considering recent LLM advances and lack of similar head-to-head studies tailored for disability inclusion in school settings. However, no ethical concerns are addressed regarding AI output veracity, data privacy, or the risk of erroneous instruction imparted to underqualified staff.
Minor Comments
- The referencing format is occasionally inconsistent and page numbers for tables/figures are absent in some cases.
- The abstract is concise and provides a clear structure; nonetheless, the results section could briefly mention statistical significance values or variability ranges.
- Some sentences are overly long or complex, detracting from readability—ironically contrary to the study's focus.
- In "Ethics approval and consent" (page 22), it is useful to state "Not applicable," but the authors might clarify that all AI-generated responses involved no human data or interventions.
Recommendation <br /> Major Revision. The manuscript exhibits methodological strength and addresses a pressing question. However, broader evidence on practical efficacy, nuanced readability analysis, and an explicit discussion of ethical boundaries are required prior to acceptance.
Reviewer #2 Report
Summary<br /> This manuscript sets out to systematically evaluate the readiness and reliability of LLMs to deliver inclusive, high-quality ADHD education materials, especially for outsourced PE instructors and non-specialist users—a group often neglected in the literature. The three chosen models represent current state-of-the-art options. The topic is pertinent and innovative.
Major Comments
- Overstatement of Claims and Realistic Outcomes<br /> The conclusion suggests that "model selection should be tailored to specific use cases," advocating for Grok-4, DeepSeek V3, and GPT-5 each in particular contexts (page 20, Discussion). However, the comparative exercise data provided fall short of substantiating such a granular recommendation; the outcome differences, though statistically noted, remain within a similar range of excessive complexity:
-
"All models exhibited high reading levels (FKGL > 12), exceeding recommended public-health standards" (page 2).<br /> Caution should be exercised when suggesting differential real-world deployment based on such preliminary and textual-only evidence.
-
Potential for Algorithmic and Sampling Bias<br /> The study design is at risk of sample/data selection bias by exclusively testing models with English-language queries and drawing all responses from the same geographical/IP base (Melbourne). This potentially disadvantages queries that might behave differently in other contextual deployments; more granular breakdowns by topic or scenario might add value.
-
Empirical/Practical Verification—A Missing Piece<br /> While the authors readily admit the absence of real-world user testing (page 21), at a minimum, the study could have incorporated expert review(s) by practicing educators or clinicians to validate the appropriateness, accuracy, and utility of the outputs. Relying strictly on “readability” as a performance surrogate is insufficient.
-
Accessibility and Communication Gaps<br /> The core finding—that "readability emerged as a persistent barrier across all models" (page 20)—is highly significant. However, the manuscript stops short of offering actionable guidance to AI developers or educators on how to bridge this gap (e.g., adaptive output tuning, multilayered content, or collaborative design with stakeholders).
-
Risk of Exacerbating Health Inequities<br /> The text insightfully warns, "the broad dissemination of LLM-generated health information risks exacerbating health inequities" (page 20). Surprisingly, no strategies or intervention suggestions are offered. It would strengthen the manuscript to suggest how LLM output might be scaffolded or tailored for vulnerable groups.
Minor Comments
- In the methods section, the protocol could be described more clearly, including how the ten independent attempts for each prompt were randomised or sequenced.
- The discussion occasionally rehashes results rather than linking them to broader theory or policy implications.
- The limitations section should be expanded to acknowledge not just the lack of user participation but also incomplete handling of model drift and update cycles.
Tone and Style<br /> The review has detected sporadic verbosity or ambiguous phrasing (e.g., “the findings demonstrate that stability of response generation is varied between models”—page 20). Succinct, active language would benefit the overall clarity.
Recommendation <br /> Major Revision. Useful, important groundwork is laid here, but the manuscript requires deeper, more practice-oriented exploration, and a more measured, cautious reporting of implications. The lack of empirical field validation is a critical limitation.
Editorial Decision<br /> Decision: Major Revision Required
Both reviewers acknowledge the relevance and methodological rigor of the comparative approach, but insist on more empirical user validation, a critical reappraisal of the readability/accuracy trade-off, and practical translation of findings for end-users and policy-makers. Ethical considerations and limitations should be explicitly elaborated.
-
-
www.medrxiv.org www.medrxiv.org
-
On 2023-05-28 06:54:51, user Stuart Gilmour wrote:
Dear authors, I really want to believe this study (I am vulnerable to Ramsay Hunt Syndrome and have got this vaccine, and I would love to believe it also reduces my risk of dementia!) but I think you have massively under-estimated the effectiveness of the vaccine, which is a real missed opportunity. I want to explain why and I hope you'll take my comments into account. I think there are three sources of error in your study which I list in order of severity: 1) failure to take into account period at risk, 2) the change in slope term and 3) confounding due to education/wealth in sub-analyses.
[Obviously, the comments that follow assume I have correctly understood your methods, so please forgive me if I have missed something your explanation]
1) is the reason I think the study under-estimates the effect. I wondered why it is that you found a vaccine efficacy (after adjusting for take-up of the vaccine) against shingles of 41%, while the 2005 NEJM study you reference finds it to be 55%, and I think this is because you have not properly accounted for follow-up time. Judging by how you report probabilities, you seem to have calculated the proportion of people over seven years who got shingles (Fig 2) or dementia (FIg 3). This is also clear from your equation (1), which is a linear probability model. But since shingles incidence, dementia incidence and death risk increase by age and your primary study cohort is 80 years old, follow-up time is a very important variable. Judging from your figure 2, the youngest people were 78 and the oldest 82 in this study. It's very likely therefore that the youngest people had to be followed for considerably longer before a diagnosis of shingles/dementia, and were also less likely to die of other causes. A person who dies of other causes before getting shingles/dementia should not be considered in the calculation, since we didn't find out whether they got it - they should be censored. Then, if we calculate incidence densities, we will find the youngest people (with the lowest proportion of cases) have a considerably longer follow-up time to diagnosis, and were less likely to drop out of follow-up early due to death. If you properly account for this in the model, I think you'll find that the rate in younger people is much lower than in older people and the discontinuity is greater.
I don't have UK data to hand, but I do have a life table by single year of age for the USA, which implies that there would probably be about 40% more follow-up time in the 78 year olds than the 82 year olds over the entire 7 years of the study, simply because of drop out due to death from all causes - a 78 year old american has a 4% chance of dying in one year, while an 82 year old has a 5.7% chance. Those differences add up over 7 years of follow-up!
This study is a classic survival study, and your decision not to use the follow-up time means that you have over-estimated the incidence density in young people and under-estimated it in older people. This also explains why your sex-stratified analysis finds no effect in men. How could the vaccine not work in men but work in women? Because at this age (~80 years old) men are dying much faster than women, with death rates increasing more rapidly over the study period, which attenuates the effectiveness more in men than in women.
If you use an incidence density (Poisson regression) or survival approach, it's easy to reproduce the approach described in equation (1) but you'll be properly accounting for follow-up time, avoiding the known problems associated with a linear probability model, and properly able to compare your results with those of the previous shingles vaccine studies.
[I'm sorry all my comments here hinge on my interpretation from your methods that you have assumed a 7 year follow-up for everyone, and simply calculated the proportion of events as the number who got shingles/dementia divided by the number at risk at the start of the 7 years. If I'm wrong about this, please ignore everything I wrote!]
For problem 2), the change of slope term, it seems obvious to me that the slope after week 0 in figure 3A is poorly fitted. If there was no change of slope term in this model, the change in level would be smaller and your study would show no effect. Was the beta3 term in your model for figure 3 statistically significant? I think it wasn't - there is no visible change of slope in the data shown there. Given how borderline your estimate of the change in level (Beta1) is, I think the conclusion of this analysis depends heavily on whether you choose to include the non-significant change of slope. Of course, this isn't very important because a) we should always report studies of this kind separately by sex and b) once you properly adjust for follow-up time the effect of the vaccine will be so huge that we'll immediately have a statistically significant effect with or without the change of slope term.
For problem 3), you estimate the CACE based on the assumption that there is "no other difference in characteristics that affects the probability of our outcomes occurring", and date of birth eligibility threshold "is a valid instrumental variable to identify the causal effect of receipt of the zoster vaccine on our outcomes". I'm not sure why you would believe this. People who receive any voluntary preventive health care in the UK are much more likely to be wealthy, to be better educated, and to be from certain occupations and backgrounds, and I would suggest it's highly likely that these factors are strongly associated with reduced risk of dementia. The method here is nice, but the assumption is completely unreasonable in the NHS context, and it's likely that these confounding factors would lead to a reduction in the CACE estimate. Again, if you properly account for follow-up time I doubt this will matter because the raw impact of the vaccine eligibility itself will be so much larger than your estimate that you will find a much bigger impact without needing to do any calculation of CACE (but anyway a simple caveat about this, or a calculation separately in each wealth stratum, might solve the issue).
I can't see any way that the lack of proper calculation of follow-up time would reduce the effectiveness of the intervention you have tested, so I'm going to continue to believe that this vaccine prevents dementia, but I worry that you have massively under-estimated the size of the effect and I guess there is a tiny chance the impact of this mis-calculation could go the other way.
I guess you could argue it doesn't matter if you've under-estimated the effect but I would say it does. I'm sure you're aware that in the UK the chickenpox vaccine is not part of the routine childhood immunization schedule. If your study finds a huge effect of shingles on dementia risk, this is a strong argument for preventing it at childhood, through inclusion of the vaccine in the routine schedule. But currently your study finds no benefit for men, a 20% overall reduction in relative risk, and about a 40% reduction in relative risk for women. I think if you properly account for follow-up time the effects will be much larger and consistent across men and women. Even a cursory consideration of such large numbers would surely be sufficient to tip even the UK's relatively anti-vaccination institutions into recommending both a) routine chickenpox vaccination of children b) routine shingles vaccination of adults and c) earlier implementation of adult vax. Currently for example in Japan the vaccination for shingles is recommended at age 50 but not covered under insurance, costs about 40,000 yen (350 pounds) and is not widely taken. If it has a huge impact on dementia risk the policy implications are enormous. So please don't undersell your work by using this linear probability model!!!
Thank you!<br /> Stuart Gilmour<br /> Professor, Biostatistics and Bioinformatics<br /> St. Luke's International University<br /> Tokyo<br /> Japan
-
-
www.medrxiv.org www.medrxiv.org
-
On 2024-01-17 12:03:28, user Leonardo Martins wrote:
This ancestral-reconstruction based phylogeographic approach has been used before by us in SARS-CoV-2 analyses: <br /> 1. for finding the number of transmission events into or outside Lebanon https://www.ncbi.nlm.nih.go... <br /> 2. For estimating migration patterns between regions of England https://www.nature.com/arti...<br /> 3. To count the number of exports and importations into Pakistan https://www.ncbi.nlm.nih.go...
In our case we used the mugration model as implemented in TreeTime or ASR models implemented in Castor for R (https://cran.r-project.org/... "https://cran.r-project.org/web/packages/castor/index.html)")
-
-
www.medrxiv.org www.medrxiv.org
-
On 2020-04-28 14:00:55, user Sinai Immunol Review Project wrote:
Main Findings<br /> This preprint sought to compare the daily deaths in countries using CQ/HCQ as a treatment from the beginning of the COVID-19 pandemic to those that did not. From a list of 60 countries in descending order by number of confirmed cases, 16 countries were selected for inclusion into either the high CQ/HCQ production or use group, versus not. Countries were included if they met the criteria for having data from the day of the 3rd death in the entire country and the daily deaths for the 10 days immediately following, until both groups were populated with a list of 16 (Figure 1: Table with the CQ/HCQ group list; Figure 2: Table with the “control” group list). For each group of countries, the average daily deaths were determined, and the curves projected to illustrate trajectories. In Figure 3, the author suggests that the deaths in the countries belonging to the control group follow an exponential curve, while the progression of average daily deaths in the countries with greater use of CQ/HCQ follow a polynomial curve.
The author then applies Auto Regressive Integrated Moving Average (ARIMA), a modeling tool used for time-series forecasting (i.e., predicting the future trajectory of data over time using the data from previous time points as predictors in a linear regression). The Auto Regressive component refers to each difference between two previous time points that make the model “stationary” (current – previous); the Moving Average is the number of forecast errors from calculating these differences that should go in the model. The author uses ARIMA to predict the next 10 days of mean deaths for the CQ/HCQ list (Figure 6) and the control countries (Figure 8). In figures 9 and 10, autocorrelations of residuals are performed to determine internal validity of the model, here defined as no significant autocorrelations.<br /> In conjunction, the author argues that these findings support major differences in death rates between countries that use/mass produce CQ/HCQ versus those that do not.
Limitations<br /> The title of this study refers to itself as an ecological study, an observational study in which the data are defined at the population level, rather than individual. Although this study design allows for rapid hypothesis testing in large datasets, a robust ecological study should account for as many known risk-modifying factors or confounders as possible. Subsequently, any results should be reviewed under strict criteria for causality, since there is high probability of the outcomes falling under the definition of ecological fallacy, which occurs when inferences about individuals are determined from inferences about a group to which they belong.
This study conflated the use and mass production of CQ/HCQ at the start of the COVID-19 pandemic in each respective country, with that country’s direct pandemic response. It is never explained whether use or production is the key output for any given country, which are vastly different metrics. The author fails to consider other reasons for having existing infrastructure for the mass production of drugs like hydroxychloroquine, whether the country was a global supplier of the medication (India), or is a region where malaria is endemic (India, Pakistan, Indonesia, Malaysia, South Korea), which may correlate to both chloroquine production and use. Notably, the countries from which studies of HCQ in the treatment of COVID-19 have been predominantly performed (China, France, USA), are all in the control list of countries. Additionally, the data for cases and deaths were collected from reports accessed from https://www.worldometers.in... data were not selected from the top countries using a methodological approach, but rather skipping certain countries to use only the most complete death data for the timeframe of interest, allowing for bias introduced by the reporting of each individual country.
With regards to the statistical methods applied, namely ARIMA, they are non-standard practices for interpreting the results of an ecological study. The first problem with this, in my opinion, is that the message will be difficult to interpret and criticize for many scientists, as ARIMA will be unfamiliar to most in the biological sciences. Further, the models applied (Table 4) do not take into account any confounders, which is a requirement for robust analysis of an ecological study. There are only 3 variables in this type of model: p, the autoregressive coefficient, q, the moving average coefficient, and d, the difference between points in the time-series. Any flaws or bias inherent to the input data are then upheld and propagated by the model, which does not allow for any other variable that would contribute to the risk of death.
Significance<br /> The faults of the stratification of countries into the groups proposed in this study, together with the unorthodox application of ARIMA modeling, make it challenging to accept the conclusion that the author draws in this study. The apparent decrease in death rate in countries with a high production/use/either/or of CQ/HCQ could be due to any number of other factors for which this study did not account. The top 5 countries in both confirmed cases and reported deaths are all in the control list, which has no relationship to the amount of CQ/HCQ production within those countries yet skews the data to make the dynamics of death rate appear more dramatic.
Reviewed by Rachel Levantovsky as part of a project by students, postdocs and faculty at the Immunology Institute of the Icahn School of Medicine at Mount Sinai.
-
-
www.medrxiv.org www.medrxiv.org
-
On 2025-11-30 07:05:45, user Ali Rahimi wrote:
Dear authors,
I have read your interesting article. I think the following revisions would strengthen the article:
Abstract<br /> Clarify that the 72.4% and 38.2% figures come from patients reporting barriers, not from the full sample, so the denominator is clear.<br /> Keep wording aligned with the design: change “barriers limit uptake of cataract surgery in Bangladesh” to “barriers were commonly reported among patients undergoing cataract surgery in Bangladesh.”<br /> Make the main statistical result consistent with the Results: state that education, income and prior surgery were associated with the number of barriers (Adj R² = 0.138).
Introduction<br /> A few sentences are long and repetitive around “accessibility” and “health inequities”. Tighten these into one concise paragraph without changing meaning.<br /> Where you describe evidence as “scarce”, add 1 sentence that positions your study among Bangladeshi work (rural children, Rohingya, etc) and makes clear that prior studies were population specific.
Methods<br /> In “Participants and data collection” clarify in one sentence that 595 patients consented, but analyses of barriers use 583 due to item non-response.<br /> Briefly describe how the “fear score (0–5)” and “barrier count” were constructed (number of items, response scale, direction).<br /> You model a count outcome with linear regression. Add one line acknowledging that barrier counts were approximately normal and that this approach was chosen for simplicity; alternatively mention that Poisson or negative binomial regression would give similar interpretation.
Results<br /> Ensure mean age is reported consistently (Abstract uses 62 years, Table 1 has 61.3). Choose one rounding rule and use it everywhere.<br /> Replace approximate p notation “p ? 0.003” and “p ? 0.221” with standard “p = 0.003” and “p = 0.221”.<br /> Table 3: the p value shown as “1” for “Afraid of surgery” under gender should be reported as “1.000” or the exact test result.<br /> Table 4: the p values for “Number of reported barriers” currently read “> 0.001”; this should be “< 0.001”.<br /> In the text for section 3.3, “The geographical barrier of transportation is predominant in our study” is misleading because cost is clearly highest. Rephrase to “an important barrier” rather than “predominant”.
Discussion<br /> Soften causal phrasing. Examples:<br /> “Patients who delay seeing an eye doctor are more likely to postpone surgery and show up with advanced cataracts” could be “Patients reporting delays in seeing an eye doctor often present with more advanced cataracts.”<br /> Any sentences that link barriers directly to “prolonging the waiting period” or “contributing to disability” should be framed as association, not cause.<br /> When you describe gender norms and decision making, keep language neutral and clearly signpost what comes from your data versus from cited literature.<br /> Consider one short sentence acknowledging that your barrier profile reflects people who ultimately accessed surgery and may under-represent those who never reach services.
Limitations<br /> Add explicit mention that the cross-sectional design and the hospital-based sample (only patients scheduled for surgery) limit causal inference and generalisability to all people with cataract in Bangladesh.<br /> You already mention possible social desirability bias; make that sentence more direct and link it to self-reported barriers.
Conclusion<br /> Tone down strength of generalisation: instead of “The study's strength lies in its inclusion of a diverse population, thereby increasing its generalizability” use “The inclusion of patients from hospital clinics and outreach camps provides some diversity, although findings still reflect one service network.”<br /> Rephrase recommendations as suggestions: “could help improve access” or “may help bridge the knowledge gap” rather than “can facilitate” or “will improve”.<br /> Keep the ending sentence tightly tied to your data: emphasis on cost, transport, time, fear, and gendered escort constraints.
Tables and Figures<br /> Check that the labels in Figure 1 and Figure 2 match exactly the barrier wording used in the questionnaire and in the text (for example “hospital too far / no transportation”).<br /> Consider adding “multiple responses allowed” to the figure legends for barriers.
-
-
www.medrxiv.org www.medrxiv.org
-
On 2025-11-30 17:00:32, user Cyril Burke wrote:
RESPONSE TO REVIEWER #2<br /> June 27, 2022<br /> Reviewer #2: Thank-you for the opportunity to review this work which highlights the importance of monitoring serum creatinine over time and how this can be a useful tool in detecting possible CKD. This is an important topic as the use of sCr on its own is certainly under-utilized and changes are often missed because they don’t fall into a predefined category.<br /> Thank you for considering our manuscript and for your detailed comments.
MAJOR CONCERNS
A. “Choi- rates of ESRD in Black and White Veterans” doesn’t fit with the rest of the paper including the title; the introduction and conclusion also don’t adequately address this portion of the paper. It feels disjointed from the main point of discussion which is the use of sCr in screening “pre-CKD”. This section and discussion should be removed and possibly considered for another type of publication.<br /> We have attempted to clarify this inclusion. This manuscript could be divided into three or four short papers, increasing the likelihood that any one of them would be read. However, different groups tend to read papers about screening for kidney impairment, racial disparities, cofactors in modeling physiologic parameters, or policy proposals to encourage best practices. Despite the appeal of perhaps three or four publications, we decided to tell a complete story in a single paper, but we are open to suggestions.
Black Americans suffer three times the kidney failure of White Americans. Other minority groups also have excessive rates of kidney disease. However, analysis of Veterans Administration interventions can bring that ratio close to one, similar interventions might also reduce to parity the risk for Hispanic, Asian, Native Americans, and others. Within-individual referencing should allow better monitoring of all patients and help to reveal the circumstances and novel kidney toxins that lead to progressive kidney decline. The ability to identify a healthy elderly cohort with essentially normal kidneys would help to calibrate expectations for all. Better modeling of GFR should help everyone, too.
Over eight decades, anthropologists have had little scholarly success in diminishing the inappropriate use of ‘race’. Keeping these parts together may be no more successful, but we feel compelled to try.
B. Cases 1 - 3, (lines 93 – 122): where are these cases from? There is no mention of ethics to publish these patient results, which appears to be a clear ethics violation. If so, these cases should be removed and patient consent and ethical approval obtained to publish them.<br /> The authors describe the reasons for not obtaining an ethics waiver for this secondary data analysis. Despite this, the relative ease of obtaining an ethics waiver for secondary data analysis usually means that this is done regardless.<br /> We take patient privacy seriously and have completely de-identified the Case data, as required by Privacy Act regulations. We understand that no authorization or waiver was necessary. We discussed the issues with an IRB representative, reviewed the relevant regulations, and confirmed no need for formal review of a secondary analysis of already publicly available IRB-approved data or of completely de-identified clinical data collected in the course of a treating relationship.
IRBs have a critical role to play, but many (including ours) are overworked. We understand the impulse authors feel to gain IRB approval even when the regulations clearly do not required it. As we discuss in the revision, there is a more significant matter that IRBs could help to resolve if they have the resources to do so. For all of these reasons, and even though we, too, felt the urge to obtain IRB approval, we resisted adding “just a little more” to their work.
C. The message of the article and data representation is unclear: do the authors wish to show that sCr is superior to eGFR in this “pre-CKD” stage, should both be used together? Do the authors wish to convey that a “creatinine blind range” does not exist? Or is the aim to demonstrate that continuous variables should not be interpreted in a categorical manner?<br /> Our interest is detection and prevention of progression of early kidney injury at GFRs above 60 mL/min – a range in which eGFR is especially unreliable. We have advanced the best argument we can to detect changes in sCr while kidney injury is still limited and perhaps reversible. If experience reveals that some avoidable exposure(s) begins the decline, then clinicians might alert patients and thereby reduce kidney disease. How best to use longitudinal sCr remains to be determined from experience. However, our message is that early changes in sCr can provide early warning of a decline in glomerular filtration. We are confident that clinicians can learn to separate other factors that may alter sCr, as we do for many other tests.
MINOR CONCERNS<br /> ABSTRACT<br /> A. Vague. Doesn’t give a clear picture of the study<br /> We have tried to clarify the title and abstract and are open to further suggestions.
INTRODUCTION<br /> B. 51 – 57: needs to state that these stats are from e.g. the US. The authors should consider adding international statistics to complement those from the US.<br /> We have updated the statistics on death rates from kidney disease to include US and global data.
C. 68: reference KDIGO guidelines, state year<br /> We now reference the KDIGO 2012 guidelines.
D. 75 – 77: is this reference of the New York Times the most appropriate?<br /> We have expanded this section with peer-reviewed, scholarly references. However, we found Hodge’s summary of the issue succinct and hence potentially more persuasive for some than decades of scholarly references that have had limited or no effect in the clinic.
E. 82: within-individual variation not changes (this is repetition of the point made in lines 425 – 427, but should match the language)<br /> We have matched the language.
F. 82 – 84: reference? If this is a question it should be presented as such<br /> We have attempted to clarify this statement.
G. 84: “normal GFR above 60” = guidelines (including KDIGO) do not refer to 60 as normal GFR, 60 – 89 is mildly decreased. (see line 126)<br /> We agree and have corrected the language.
H. 93: avoid the use of emotive words such as apparently (also in line 428)<br /> We wanted to emphasize appearance without proof and have made these changes.
I. 94: “Not meeting KDIGO guidelines”: KDIGO 2.1.3 includes a drop in category (including those with GFR >90). This would appear to include some of the cases listed. Additionally, albuminuria should have been measured for case 2 and 3.<br /> We have clarified that cases may or may not fit KDIGO categories, though that question will frequently arise in evaluating sCr changes. Where available, we have added urine protein and/or albumin results to the Cases.
J. 97: “progressive loss of nephrons equivalent to one kidney”: this is based on a single creatinine measurement.<br /> Since the original submission, we discovered for this Case (now Patient 3) early serum creatinine results and notes indicating a six-month period off thiazide diuretic. This data clarified the baseline and showed a remarkable effect of thiazide diuretic on sCr. We have added follow-up sCr results and details of thiazide use to the ASC chart.
K. 93 – 122: Could any of these shifts be explained by changes in creatinine methodology or standardization of assays, especially over 15 – 20 years (major differences between assays existed before standardization and arguably still exist with certain methods).<br /> It would be useful to see a comparison between serial sCr and eGFR measurements on the same figure. There appears to be significant (possibly more pronounced) changes when eGFR is used. As line 87 mentions changes in eGFR may be as useful (and in some situations more useful) than changes in sCr alone.
It would be helpful to have a chronology from each local laboratory with the date of every change in creatinine assay or standardization. However, any single shift draws attention but does not necessarily indicate significant change in glomerular filtration. After one or several incremental increases, over at least three months, the sCr pattern may meet the reference change value (RCV) that signals significant change. In the future, from age 20 or so, a patient’s medical record should retain the full range of the longitudinal sCr for true baseline comparison.
As noted in the revised manuscript, Rule et al showed that there is measurable nephrosclerosis even in the youngest kidney donors, suggesting that some injuries (perhaps exposure to dietary toxins) may begin in childhood and that early preventive counseling may be worthwhile. Experience will show whether this can slow progression to CKD. As we note, quoting Delanaye, sCr accounts for virtually 100% of the variability in eGFR equations based on sCr (eGFRcr), and these equations add their own uncertainties, so no, we do not believe that eGFR is more useful than sCr when GFR is above 60 mL/min and possibly much lower as well.
We have added eGFR results to the ASC charts (in blue), though availability was somewhat limited.
L. 127 – 142: should there be separate charts for males and females, the differences in creatinine between males and females needs to be discussed somewhere in the paper.
We do not think there should be separate charts for men and women based on size. The role of sex in eGFR equations is mainly based on the presumption that the average woman has less muscle mass than the average man. Clinicians care for individuals, not averages, and this sweeping generalization that increases agreement of the average of a population introduces unacceptable inaccuracy to individual care. Within-individual comparison eliminates the need for assumptions on relative size or muscle mass. Major changes in an individual’s muscle mass will usually be evident to the clinician who can adjust for them.
However, reports suggest significant influence of sex hormones on renal function, including effects of estrogen and estrogen receptors, such as reducing kidney fibrosis, increasing lupus nephritis, and increasing CKD after bilateral oophorectomy. The mechanism of these effects and how they might be incorporated into eGFR estimating equations is unclear, but the effort may benefit from a more individualized approach with focus on a measurand rather than matching population-based averages of a quantity value (calculated from measurands).
M. Similarly, is this suitable for all ages?<br /> We think so. Another sweeping generalization based on age merely introduces another inaccuracy which complicates the task of clinicians caring for individuals. Older persons have varying health, athleticism, muscle mass, dietary preferences, etc. Rule et al reported that biopsies of about 10% of older kidney donors had no nephrosclerosis. Within-individual comparison eliminates the need for assumptions on relative muscle mass or inevitable senescent decline in nephron number. We substitute the assumption that any change in an individual’s muscle mass will be evident and can be accounted for. A seemingly ubiquitous risk factor, or factors, starts injuring kidneys at a young age, which we may yet identify.
N. 162 – 163: rephrase<br /> Done.
METHODS<br /> O. 185 – 193: aim belongs in the introduction, can be adjusted to complement paragraph 178 – 182.<br /> Reorganized and rewritten.
P. 196 – 205: reference sources
References provided.
Q. 224 – 247: not in keeping with the rest of the article or title and conclusion
We have revised and restructured this section.
RESULTS<br /> R. If eGFR is treated as a continuous variable does inverted sCr still have higher accuracy?<br /> We believe so. Serum creatinine is a measurand and reflects the total sum of physiologic processes, known and unknown. In contrast, eGFR equations yield a quantity value, calculated from a measurand and dependent on the assumptions and approximations incorporated by their authors. The eGFR equations are thus necessarily less accurate than the measurands they are derived from, in this case, sCr. In a hyperbolic relationship, as the independent variable drops below one and approaches zero, the effect is to amplify the inaccuracy of the independent variable in the dependent variable. By avoiding the mathematical inverting, the data suggest that direct use of sCr is far more practical for pre-CKD.
S. As mentioned, the section on ESRD in black and white veterans doesn’t fit in with the rest of the article.<br /> We have revised, reorganized, and rewritten. We also outlined our rationale above.
DISCUSSION<br /> T. As mentioned, section 4.1 doesn’t fit in with the rest of the article. As the authors note the correlation between illiteracy and CKD is likely not causal.<br /> See above.
U. 387: erroneous creatinine blind range. The data presented does not show this is erroneous there is still a relative blind range. A distinction must be made between a population level “blind range” and an individual patient’s serial results. The data and figure 4 in particular demonstrate the lack of predictive ability of sCr above 40ml/min compared to below 40ml/min at a population level. For an individual patient this “blind range” is more relative, and a change in sCr even within the normal range may be predictive. (Note: the terminology “blind range” is problematic).<br /> We agree. On reading closer, Shemesh et al call attention to “subtle changes” in serum creatinine even though they had access only to the uncompensated Jaffe assay, so their recommendation to monitor sCr is even more forceful, today, due to more accurate and standardized creatinine assays. We have attempted to clarify this in the manuscript.
V. 399 – 400: “rose slowly at first and then more rapidly as mGFR decreased below 60” this refers to a relative blind range. Whether these slow initial changes can be distinguished from analytical and intra-individual variation is the question that needs to be answered before we can say a “blind-range” doesn’t exist for an individual patient.
We appreciate this observation. We believe longitudinal sCr is worth adopting to gain insights into individual sCr patterns, which may reveal early changes in GFR, among other influences on sCr. This is a low-cost, potentially high-impact population health measure, and there seems little risk in trying it because many clinicians already use components of the process.
W. 425 - 432: sCr is indeed very useful when baseline measurements are available. eGFR remains useful when baseline sCr is not available or when large intervals between measurements are found.<br /> As Delanaye et al noted, virtually 100% of the variability in longitudinal eGFR is due to sCr, so we understand that the errors in eGFR can be (and usually are) greater than but cannot be less than those in sCr.
X. 425: low analytical variation- if enzymatic methods are used<br /> Lee et al suggest that even the compensated Jaffe method provides some accuracy and reproducibility, which may allow longitudinal tracking of sCr even where more modern assays are as yet unavailable.
Y. 428: avoid the use of “apparently”<br /> Done.
Z. 430: reference 56 compares sCr and sCysC with creatinine clearance NOT with mGFR, this does not prove that mGFR has greater physiologic variability. Creatinine clearance is known to be highly variable (partially due to two sources of variability in the measurements of creatinine: serum and urine).<br /> The creatinine clearance is another form of mGFR, and our understanding of it begins with the units: if the clearance or removal of creatinine were being measured, the units should be umoles/minute, but they are mL/min. “Clearance” is an old concept coined by physiologists to describe many substances, such as urea, glucose, amino acids, and other metabolites. Since creatinine is mostly not reabsorbed and is only slightly secreted in the tubules, the “creatinine clearance” became a measure of GFR. The ratio of urine Creatinine to serum Creatinine is simply a factor for how much the original glomerular filtrate then gets concentrated (typically about 100-fold) by the kidney. Since the assumption is that the timed urine was once the rate of glomerular filtrate production, the creatinine clearance is a measure of the GFR.
Creatinine clearance has some inaccuracies based on tubular secretion, but also has some advantages: blood concentrations are essentially constant during urine collection, no need for exogenous administration, and reliable measurements in serum and urine. The methods that we often call mGFR also have problems, including unverifiable assumptions about distributions, dilutional effects, and others we cite in the text. None of these are direct measures of GFR. Due to changes in remaining nephrons, even true GFR itself is not strictly proportional to the lost number of functional nephrons, which seems the ultimate measure of CKD that Rule et al estimated from biopsy material.
AA. The limitations of sCr for screening should also be discussed: differences in performance and acceptability between enzymatic and Jaffe methods (still widely used in certain parts of the world), the effect of standardizing creatinine assays (an important initiative but one that could also produce shifts in results around the time of standardization- see cases), low InIx means that once-off values are exceedingly difficult to interpret, is a single raised creatinine value predictive (or should there be evidence of chronicity): similarly are there effects from protein rich meals, etc (The influence of a cooked-meat meal on estimated glomerular filtration rate. Annals of Clinical Biochemistry. 2007;44(1):35-42. doi:10.1258/000456307779595995)<br /> We have added discussion of additional references on reproducibility of sCr assays and discuss dietary meat and, in Part Three, possible dietary kidney toxins.
CONCLUSION<br /> BB. The discussion recommends using SCr above eGFR while the conclusion recommends the NKF-ASN eGFR for use in pre-CKD and ASC charts. While the use of both together in a complementary fashion is understandable- this needs to be congruent with the discussion, aims and results.<br /> We have rewritten this section. We would welcome any further recommendations.
Cyril O. Burke III, MD, FACP
-
On 2025-11-30 16:49:17, user Cyril Burke wrote:
[Note: This is the first of several reviews of an earlier version of our combined manuscript that aims to reduce ‘racial’ disparity in kidney disease. The comments were kindly offered by nephrologists, through a medical journal, and we remain grateful to them for the time and care they gave to improve our manuscript.
We removed identifying features and will include our responses in a subsequent comment. The changing title and line numbers refer to versions prior to our medRxiv preprints.]
April 1, 2022<br /> Screening for early kidney disease and population health using longitudinal serum creatinine
Dear Dr. Burke III,
REDACTED.
Reviewer #1: Burke et al submit a somewhat unusual paper, devoted to a topic of potential major clinical relevance, and as yet understudied.
General comments
-
The thesis of the authors, that using the baseline serum creatinine of a given patient would potentially improve the earlier diagnosis of kidney disease, even in the normal range, is in line with the experience of this reviewer, who always retrieves , whatever the difficulty of reaching that goal, past results of blood tests, and uses them as a way to date the onset of kidney disease, sometimes with important prognostic implications.
-
Yet, the authors do not provide data strongly supporting their thesis. For instance, when looking at case 2, should the last point (the most recent one) be omitted, there would be very little evidence supporting progressive early kidney disease.
-
The claim that the statistics fit the data better when all points are used (page 9,11) should not come as a surprise. Using thresholds instead of the full range of values has long been known to be more powerful for statistical analysis. But fitting the data does not equal to a high positive predictive value!
-
A key question is whether in a real world context, the earlier diagnosis of kidney disease would be possible, without too much background noise from intercurrent illness (functional), drugs (NSAIDS, etc..). In other words, would the specificity (or PPV) of the suspicion of early kidney disease be reasonable enough to catch the attention of clinicians
-
Even though there has been improvement in the standardization of measurement of serum creatinine (IDMS), the comparability of results measured by different labs remains suboptimal, at least in the experience of this reviewer, and medical shopping is not uncommon, making the availability of all previous results in the same graph a logistical challenge.
Specific comments
-
The authors should mention that the USPTFS decided a month ago to revisit the question of screening for kidney disease in high risk groups (page …)
-
Even though ESRD has a legal meaning in the USA, not very relevant to the topic of this paper about early kidney disease, the authors should stick to the nomenclature proposed by a recent KDIGO consensus conference (see Levey et al. Nature Reviews in Nephrology ). In particular, use kidney failure instead of ESRD/ESKD. When the topic is glomerular filtration, use that wording instead of kidney function (page…)
-
The authors allude to the concepts of prediabetes and prehypertension. But this reviewer points to the fact that the levels used to define those entities are currently “generic” , rather than based on previous values in an individual subject. Please discuss.
-
The authors repeatedly mention in the discussion section evidence that even small increases in serum creatinine have prognostic significance. This has indeed been known for decades but is a different topic: AKI . Admittedly, there is growing evidence that AKI and CKD are linked. But that the stability of a biological parameter is prognostically best is all except surprising: the same is true for body weight, mood, blood pressure etc…
Reviewer #2: Thank-you for the opportunity to review this work which highlights the importance of monitoring serum creatinine over time and how this can be a useful tool in detecting possible CKD. This is an important topic as the use of sCr on its own is certainly under-utilised and changes are often missed because they don’t fall into a predefined category.
MAJOR CONCERNS
“Choi- rates of ESRD in Black and White Veterans” doesn’t fit with the rest of the paper including the title; the introduction and conclusion also don’t adequately address this portion of the paper. It feels disjointed from the main point of discussion which is the use of sCr in screening “pre-CKD”. This section and discussion should be removed and possibly considered for another type of publication.
Cases 1 - 3, (lines 93 – 122): where are these cases from? There is no mention of ethics to publish these patient results, which appears to be a clear ethics violation. If so, these cases should be removed and patient consent and ethical approval obtained to publish them.<br /> The authors describe the reasons for not obtaining an ethics waiver for this secondary data analysis. Despite this, the relative ease of obtaining an ethics waiver for secondary data analysis usually means that this is done regardless.
The message of the article and data representation is unclear: do the authors wish to show that sCr is superior to eGFR in this “pre-CKD” stage, should both be used together? Do the authors wish to convey that a “creatinine blind range” does not exist? Or is the aim to demonstrate that continuous variables should not be interpreted in a categorical manner?
MINOR CONCERNS
ABSTRACT<br /> Vague<br /> Doesn’t give a clear picture of the study
INTRODUCTION<br /> 51 – 57: needs to state that these stats are from e.g. the US. The authors should consider adding international statistics to complement those from the US.
68: reference KDIGO guidelines, state year
75 – 77: is this reference of the New York Times the most appropriate?
82: within-individual variation not changes (this is repetition of the point made in lines 425 – 427, but should match the language)
82 – 84: reference? If this is a question it should be presented as such
84: “normal GFR above 60” = guidelines (including KDIGO) do not refer to 60 as normal GFR, 60 – 89 is mildly decreased. (see line 126)
93: avoid the use of emotive words such as apparently (also in line 428)
94: “Not meeting KDIGO guidelines”: KDIGO 2.1.3 includes a drop in category (including those with GFR >90). This would appear to include some of the cases listed. Additionally, albuminuria should have been measured for case 2 and 3.
97: “progressive loss of nephrons equivalent to one kidney”: this is based on a single creatinine measurement.
93 – 122: Could any of these shifts be explained by changes in creatinine methodology or standardisation of assays, especially over 15 – 20 years (major differences between assays existed before standardisation and arguably still exist with certain methods).<br /> It would be useful to see a comparison between serial sCr and eGFR measurements on the same figure. There appears to be significant (possibly more pronounced) changes when eGFR is used. As line 87 mentions changes in eGFR may be as useful (and in some situations more useful) than changes in sCr alone.
127 – 142: should there be separate charts for males and females, the differences in creatinine between males and females needs to be discussed somewhere in the paper. Similarly, is this suitable for all ages?
162 – 163: rephrase
METHODS<br /> 185 – 193: aim belongs in the introduction, can be adjusted to complement paragraph 178 – 182.
196 – 205: reference sources
224 – 247: not in keeping with the rest of the article or title and conclusion
RESULTS<br /> If eGFR is treated as a continuous variable does inverted sCr still have higher accuracy?
As mentioned, the section on ESRD in black and white veterans doesn’t fit in with the rest of the article.
DISCUSSION<br /> As mentioned, section 4.1 doesn’t fit in with the rest of the article. As the authors note the correlation between illiteracy and CKD is likely not causal.
387: erroneous creatinine blind range. The data presented does not show this is erroneous there is still a relative blind range. A distinction must be made between a population level “blind range” and an individual patient’s serial results. The data and figure 4 in particular demonstrate the lack of predictive ability of sCr above 40ml/min compared to below 40ml/min at a population level. For an individual patient this “blind range” is more relative, and a change in sCr even within the normal range may be predictive. (Note: the terminology “blind range” is problematic).
399 – 400: “rose slowly at first and then more rapidly as mGFR decreased below 60” this refers to a relative blind range. Whether these slow initial changes can be distinguished from analytical and intra-individual variation is the question that needs to be answered before we can say a “blind-range” doesn’t exist for an individual patient.
425 - 432: sCr is indeed very useful when baseline measurements are available. eGFR remains useful when baseline sCr is not available or when large intervals between measurements are found.
425: low analytical variation- if enzymatic methods are used
428: avoid the use of “apparently”
430: reference 56 compares sCr and sCysC with creatinine clearance NOT with mGFR, this does not prove that mGFR has greater physiologic variability. Creatinine clearance is known to be highly variable (partially due to two sources of variability in the measurements of creatinine: serum and urine).
The limitations of sCr for screening should also be discussed: differences in performance and acceptability between enzymatic and Jaffe methods (still widely used in certain parts of the world), the effect of standardizing creatinine assays (an important initiative but one that could also produce shifts in results around the time of standardization- see cases), low InIx means that once-off values are exceedingly difficult to interpret, is a single raised creatinine value predictive (or should there be evidence of chronicity): similarly are there effects from protein rich meals, etc (The influence of a cooked-meat meal on estimated glomerular filtration rate. Annals of Clinical Biochemistry. 2007;44(1):35-42. doi:10.1258/000456307779595995)
CONCLUSION<br /> The discussion recommends using SCr above eGFR while the conclusion recommends the NKF-ASN eGFR for use in pre-CKD and ASC charts. While the use of both together in a complementary fashion is understandable- this needs to be congruent with the discussion, aims and results.
-
-
-
www.medrxiv.org www.medrxiv.org
-
On 2020-04-30 16:31:03, user Dr SK Gupta wrote:
Authors have reported the high prevalence of Mycobacterium Tuberculosis infection in Covid19. Authors have tried to portray not only the Higher prevalence of MTBI but also more severe and rapid progression of disease. However, since their findings are not in tune with observational data on the subject all across the world. Rather corona infection has been found to be low in South East Asia, Africa and other places where the tuberculosis is rampant. Also burden of Covid-19 has been highest in United States and Europe where the prevalence of Tuberculosis is low.
These Observations have prompted the scientist to look for the role of BCG vaccination/ past TB infection in prophylaxis and treatment of Covid 19.
Authors have erroneously relied upon use of Interferon gamma release assay (IGRA) to diagnose MTB Infection using a kit X.DOT-TB kits (TB Healthcare, Foshan, China). Not much has been described in article about the methodology used in these kits, but as the name suggests probably it is T-spot test which measures the number of IFN-?-secreting T cells via an enzyme-linked immunospot (ELISPOT) assay.<br /> Two types of IGRAs available, the QuantiFERON-TB Gold In-Tube test and the T-SPOT.TB blood test. Though both these tests are approved by the Food and Drug Administration as indirect tests for TB infection (including active disease) when used in combination with other medical and diagnostic evaluations. Since aging leads to a decline in the strength of immune responses, it is also argued that these tests loose their sensitivity with advancing age.
Overall Interferon gamma release assay (IGRA) has a poor sensitivity and specificity for the diagnosis of Tuberculosis.<br /> In patients with Non Tuberculous Mycobacterial Disease specificity of only 74% for infection and a relatively high indeterminate rate was found for QuantiFERON®-TB Gold(QTF) test assay with a sensitivity of 81.7 %. Hence the test is not able to discriminate between tuberculosis(TB) and non-tuberculous mycobacterial (NTM) disease with high degree of specificity.
The problem gets compounded even more in countries like China and India where the prevalence of TB is high and use of Tuberculin Testing and BCG vaccination is a routine and such cases have all the likelihood of being labelled as positive despite no active disease.<br /> Contrary to current practice Authors have also not used the available gold standards to define active TB based on either a positive Mycobacterium culture or a positive TB polymerase chain reaction/Gene expert/CBNAAT.
Not only that present investigators have also not describe any base line x-ray lung findings like cavitation, fibro-infiltration, lymph node enlargement, Spirometry based poor Lung function suggestive of tuberculosis in patients with positive MTBI or active tubercular disease which may have contributed to the rapid progression of superimposed pneumonia of Covid 19 in these patients.
In Covid-19 disease pathogenesis initially it is the role of Innate immunity mediated by Neutrophils Macrophages which mount a protective response. In tuberculosis Cell mediated immunity or the adaptive immunity involving T cells and B cells is at work. This has prompted world scientists to look for the role of BCG in treatment and prophylaxis of Covid-19. BCG Vaccine for Health Care Workers as Defense Against COVID 19 (BADAS) (NCT04348370) in USA and Brace trial by an Australian University are such attempts.
The current study needs the support of larger data which doesnot seem to be coming from other countries like India where TB is rampant. Till now the observations don’t support the hypothesis of increased susceptibility of TB patients for Covid-19 nor are there any indicators of more severe/ rapid progression of disease in patients with TB infection.
Dr S K Gupta <br /> Senior Consultant Physician <br /> Secretary Community Health Care Foundation<br /> Dr Prabhat Prakash Gupta <br /> Dr Mrs Praveen Gupta
References:<br /> 1.Comparison of the Sensitivity of QuantiFERON-TB Gold In-Tube and T-SPOT.TB According to Patient Age Won Bae,Kyoung Un Park,Eun Young Song,Se Joong Kim,Yeon Joo Lee,Jong Sun Park,Young-ae Cho,Ho Il Yoon,Jae-Joon Yim,Choon-Taek Lee,Jae Ho Lee <br /> Published: June 3,216 https://doi.org/10.1371/jou...<br /> 2. Sensitivity of the QuantiFERON-TB Gold test in culture-verified NTM disease and TB in a Danish setting Thomas Stig Hermansen, Vibeke Østergaard Thomsen, Pernille Ravn <br /> European Respiratory Journal 2012 40: P426; DOI:<br /> 3. https://clinicaltrials.gov/...<br /> 4. COVID-19: a recommendation to examine the effect of hydroxychloroquine in preventing infection and progression Dan Zhou , Sheng-Ming Dai and Qiang Tong J Antimicrob Chemother<br /> doi:10.1093/jac/dkaa114<br /> 5. Covid-19 coronavirus pandemic. https://www.worldometers.in...<br /> 6. 1. Mehta P. Mc Auley DF, brown M et al. Covid-19, consider cytokine storm syndromes and immunosuppression. Lancet. 2020. doi.org/10.1016/S0140-6736(...
-
Roitt I, Brostoff J, Male D. Immunology (Fifth Edition). Philadelphia: Mosby; 1998. ?
-
Wang L, Cai Y, Cheng Q, Hu Y, Xiao H. Imbalance of Th1/ Th2 cytokines in patients with pulmonary ?tuberculosis. Zhonghua Jie He He Hu Xi Za Zhi. 2002; 25 (9) : 535-537. ?
-
Collins FM. Cellular antimicrobial immunity. Crit Rev Microbiol. 1979;7:27–91. ?
-
Bretscher PA. An hypothesis to explain why cell-mediated immunity alone can contain infections by ?certain intracellular parasites and how immune class regulation of the response can be subverted. ?Immunol Cell Biol. 1992;70:343–351.
-
-
-
www.medrxiv.org www.medrxiv.org
-
On 2020-05-01 10:16:00, user mendel wrote:
The specificity trials on page 19 are not normal.<br /> 7 trials show 100%, with N=30,70,1102,300,311,500,99, sum 2412.<br /> The 6 remaining trials:
368/371 = 99.2% (97.7-99.8)<br /> 198/200 = 99.0% (96.4-99.9)<br /> 29/31 = 93.6% (78.6-99.2)<br /> 146/150 = 97.3% (93.3-99.3)<br /> 105/108 = 97.2% (92.1-99.4)<br /> 50/52 = 96.2% (86.8-99.5)
Pooling these, I get 896/912=98.3% (97.2-99.0).
"We use the pooled test performance based on the available information:<br /> Sensitivity: 82.8% (exact binomial 95CI 76.0-88.4%)<br /> Specificity: 99.5% (exact binomial 95CI 99.2-99.7%)"
There is no trial that has exactly 1 false positive. There are 3 <br /> trials that don’t have 99.5% in the 95% CI (4 trials if you include <br /> 1102/1102). There is no trial that falls inside the 99.2-99.7 range (one<br /> straddles it). The specifity range they’re using is an empty space <br /> between the values that the trials are actually at. This is not a normal distribution.
187 samples had loss of smell and taste in <br /> the past 2 months. This is a very specific indicator for Covid-19, ~70% <br /> of patients (well, 33,9–85,6%, depending on the study, e.g. <br /> Mons/Belgium, Heinsberg/Germany) have that, and I don’t think this kind <br /> of nerve affliction has been reported for any other common illness. Yet <br /> only 11% of these samples test positive. For the 59 more recent samples,<br /> it’s 22%.
This looks like the prevalence this study should have measured is <br /> 267/3330 = 8%, and the test failed to pick up on that. It would fail to <br /> pick up on recent infections, because they wouldn’t have seroconverted <br /> (created enough antibodies) yet, and it would fail to pick up on <br /> infections that happened too long ago (because the antibody levels would<br /> have fallen off below the sensitivity of this test). This study really <br /> needed a more sensitive test, like an ELISA, which is actually available<br /> at Standford, and is able to detect much lower levels of antibodies.
This kit has not been validated against people who had the infection a month ago.
The presence of false positives is an indication that cross-reativity <br /> with outher cold viruses exists. If you test a sample with few people <br /> who haven’t had a severe cold recently, which probably includes most <br /> samples taken of people who check into the hospital for elective <br /> surgery, or samples taken in the summer months, you get an optmistic <br /> sensitivity that does not apply to the general population in early <br /> spring.
The WHO Early investigation protocol (Unity protocol) for the <br /> investigation of population prevalence mandates the use of an ELISA <br /> test, or the freezing of samples until a time when such a test becomes <br /> available. The WHO does not endorse the use of lateral flow assays for <br /> this kind of testing.<br /> —-<br /> P.S.: No study that does not measure prevalence in the older <br /> population where the majority of deaths occurs should speak on fatality <br /> rates. This study had 2/167 positives in the age 65+ population, that’s <br /> 0.1-4.3% (95% CI), a 30-fold spread, and hardly a representative sample,<br /> since I don’t expect residents from care homes were able to attend the <br /> drive-through testing.
-
On 2020-04-21 09:14:54, user Michael Rosenberg wrote:
Some additional information about performance of the Premier Biotech test is available at the distributors's web site. See links at the bottom of this page.
Package Insert shows false positive rate of 2/371 for IgG and 3/371 for IgM. It is not clear if same samples that tested positive for IgG also tested positive for IgM or these were different samples. Assuming best case scenario, cumulative FP rate for IgG and IgM is 3/371 (0.8%).
One could add to FP calculation 0/30 FPs reported in the preprint and 0/88 FPs mentioned by Dr. Sood in LA briefing yesterday. Adding these samples brings naive FP rate to 3/489 or 0.6%.
Distributor also provides what appears a submission for approval of the test by China FDA (link). This document shows 3/150 false positives for IgG and 1 - for both IgG and IgM. Therefore cumulative FP rate for IgG and IgM in this study is 4/150 or 2.7%. Note however that this number likely overestimates FP rate - all negative subjects in this study were COVID contacts excluded by PCR.
-
On 2020-04-18 05:16:02, user rodger bodoia wrote:
Deeply flawed methodology. Others have noted (as did the authors) the obvious inherent bias towards those seeking antibody testing (maybe they had symptoms, maybe they knew someone who had symptoms). Also note the bias that is inherent in the method of using Facebook as the messenger with a brief period between posting on FB and the actual testing. We would need significant information on the other behaviors of people who use FB this frequently and whether they are more or less likely to have engaged in practices that would have put them at risk of acquiring the virus.<br /> Back of the envelope "smell test": 48,000 infections and only 69 deaths (as of April 17) is an infection fatality rate of 0.14%. This is inconsistent with Diamond Princess data, even if we adjust for age differences. Also compare with https://www.nejm.org/doi/fu... in which they did UNIVERSAL screening of obstetric patients from March 22 to April 4 in NYC and found 15% positivity of SARS-CoV-2. Without lots of population-weighted adjustments we can interpret this as pretty good evidence of roughly 15% prevalence in NYC (say roughly 1.2 million infections) and roughly 9,000 deaths for infection fatality rate of 0.75%
-
On 2020-04-22 00:40:03, user Unko J wrote:
It's nice to read below what essentially IS the 'peer-review' for this pre-print online paper! I wish I had read these comments last night before having a heated debate with my fellow quarantinees. My point was how could these possibly be 2%-4% of the population that is positive and yet Santa Clara has only 83 deaths? These divergent sets of data can't really exist in one universe, unless either we're wildly wrong about either a) the mortality rate or b) how many people can be asymptomatic and test positive with an Ab test. So yeah, between cross-reactivity against non-Covid antibodies and other false positives, I think we've decided to reject this paper. And aren't some of the authors the same on both papers?
-
On 2020-04-22 20:36:24, user Konstantin Momot wrote:
The crucial issue here is sample selection. The participants essentially self-selected, but that is a potential source of huge bias. As a hypothetical scenario, if the people who chose to participate were predominantly people who’d had a cold and were curious to find out if it was COVID, then the cohort would a priori be hugely overweight with people who had a higher-than-average likelihood of COVID exposure. That would not be a good sample of the general population in that it would not represent the true percentage of CoV-exposed and CoV-naive people in the population as a whole. That would mean that the 2-4% figure is completely meaningless. Given how crucial this number is to any epidemiological modelling, I think it's important to remember that this is just one study with no guarantee of flawless methodology, and avoid making far-fetched conclusions based on limited evidence.
-
-
www.medrxiv.org www.medrxiv.org
-
On 2020-05-13 14:21:49, user Sinai Immunol Review Project wrote:
Main Findings: <br /> Given the urgent need for diagnostic testing for COVID-19, this study uses enzyme-linked immunoabsorbent assay (ELISA) to measure serum antibody levels against recombinant spike protein ectodomain as well as its receptor binding domain (RBD) to angiotensin-converting enzyme (ACE2). Twenty RT-PCR confirmed COVID-19 patients as well as 99 healthy donors were tested for IgG titers in their serum. Antibodies to spike protein ectodomain were detected in 17 out of 20 patients, of which 5 showed borderline levels. 15 out of 20 patients tested positive for antibodies against spike RBD, of which 7 indicated borderline levels. These findings suggest that while majority of COVID-19 patients develop antibodies against the RBD, some patient responses may target other epitopes of the spike protein. Furthermore, they show that circulating antibody levels (ie: positive vs borderline) do not correlate with clinical severity or recovery from COVID-19. Strikingly, 1 patient who recovered did not have detectable IgG antibodies against RBD, suggesting a potential role of cellular immunity in the clinical resolution of COVID-19. In addition, they report that 4 out of 10 healthy donor serum collected since January 2020 tested positive. This indicates that apparently healthy individuals may be asymptomatic carriers, which underscores the importance of developing effective methods for community wide testing.
Limitations: <br /> The authors cite a study in their introduction that demonstrates minimal cross reactivity of antibodies between SARS-CoV and SARS-CoV-2 patients suggesting a specific antibody response for each disease. However, their study showed that five out of 89 serum samples collected from healthy donors between 2017 to 2019 tested positive for antibodies against spike protein ectodomain, and acknowledge a possible cross reactivity from prior exposure to other strains of coronavirus. This result also stands in contrast with other recent studies*. Understanding whether or not there is indeed such cross reactivity would be important for interpreting their results and designing vaccines against this specific virus. Furthermore, their thresholds for determining positivity versus borderline antibody levels are arbitrary and can significantly influence the outcome of their assay. It will be critical to obtain a larger cohort to further validate the robustness of their thresholds for determining circulating antibody levels.
Significance: <br /> This study establishes a straightforward assay in testing for circulating antibodies against spike protein in the serum of COVID-19 patients. This is important not only for surveying the population for people with immunity, but also improves sensitivity for diagnosis when combined with RT-PCR. In addition, their finding of a patient who recovered without detectable antibodies against spike protein RBD provides important insights to designing therapies for COVID-19.
Reviewed by Joel Kim as part of a project by students, postdocs and faculty at the Immunology Institute of the Icahn School of Medicine, Mount Sinai.
References:<br /> *Amanat, F., et al. A serological assay to detect SARS-CoV_2 seroconversion in humans. medRxiv preprint (2020)
-
-
www.medrxiv.org www.medrxiv.org
-
On 2021-01-24 19:40:01, user Han-Kwang Nienhuys wrote:
I have further analyzed the data in fig. 2; the odds ratios (frequency ratio B.1.1.7 / other) grow exponentially with daily growth factors between 1.06 and 1.09 between 6 weeks and 1 week before the of the data (only considering the UK regions where the error bars in Fig. 4 were reasonably small: EE, EMid, London, NEE, SEE, SWE, WMid). For this I need to assume that a fraction of the SGTF cases are 'false positive', since most regions show a constant SGTF rate in October, before taking off with exponential growth.
Also notable, genomic analysis in UK SEE, Denmark, Netherlands, and Portugal show consistently growth rates between 7 %/d and 9.4 %/d with only Denmark showing a slowdown (from 12 %/d to 7 %/d).
Also, one would expect the odds ratio to grow exponentially over time if there are just two competing variants, each with their own transmissibility or reproduction number. However, the other strains that make up everything else than B.1.1.7 are likely to have slightly different transmissibilities. Over time, one would expect the transmissibility to drift to higher values, also among those other strains. The fact that the odds ratio growth rate is decreasing does not necessarily mean that the B.1.1.7 is getting less infectious; rather, the mixture of other strains could be getting more infectious over time, just because the contributions of the less infectious ones in the mix gradually decreases.
Summarizing: I believe that 6 %/d is an estimate that is significantly too low.
For graphs of my analysis, please see https://twitter.com/hk_nien... .
-
-
www.medrxiv.org www.medrxiv.org
-
On 2021-02-17 17:12:29, user Tim Pollington wrote:
Dear Epke and colleagues,
I would like to share some comments following reading your (v. relevant) paper on impact of COVID on VL in India at the country level. This is the second time I've commented on a preprint like this on medrxiv, and shared an 'open review' so I hope you receive it in the spirit it was intended. As I'm interested in doing similar studies your manuscript was relevant to me. And since I am funded by BMGF I thought it would be a waste of my funded time if I do not share these thoughts with you too, especially since you're at the preprint/pre-accepted stage.
I thought the paper could benefit from an additional author who has field experience of the IRS/ACD activities occurring there to back-up your assumption that "no IRS and ACD take place and that only passive case detection" during an interruption.
Given that the role of Asx in infecting others is still debated (some say recent xeno shows near zero contribution while ours last year did fit estimates consistently when relative Asx infectiousness of 0,1 or 2% were used), your use of the models E1 & E0 is a smart move to err on the cautious side.
Model structure and quantification section<br /> Thanks for much for following best practice and using PRIME-NTD. It is the first time I have seen it and I definitely plan to use it in my next modelling publication and also when initially planning a model re engagement with policymakers.
Given that the model runs for 30 years has population growth been taken into account?
Impact assessment section<br /> Although adding incidence rates in the same period is acceptable, as events share the same 'person time at risk' denominator (and if the events are mutually exclusive), I'm not sure if epidemiologically it's a correct calculation to sum up rates over the 30 years since the population will be changing in this time and thus the denominators are changing. Perhaps one can convert it into absolute cases in each year and then sum those up?
Discussion section - First paragraph<br /> It may help the reader if more emphasis was made on how a 1-year impacted delay by describing how it is amplified. ie How just one year interruption causes growth which needs to be curtailed before it turns over and falls, and the excess cases this generates. This concept of amplification could be strengthened.
Second paragraph<br /> "80% of [VL-endemic???] sub-districts..." Did this cover just Bihar or all 4/5? endemic states.
Third paragraph<br /> I think mortality rates are really relevant but can understand your caution re scant data. I think it's so important now considering the 1%CFR 2021-2030 target. Could this independent review help provide some rough estimates from pages 12-15 & 40? <br /> Even rough estimates from your model on excess VL cases and when they would likely be seen in the coming years, could be a useful starting place for resource planning of drugs.
I think a caveat needs to be noted that this analysis is country-level whereas the threshold targets are at the block-level, to avoid the reader making an ecological fallacy.
I hope that helps and also encourage you to comment on my work if I get to that stage!
All the best, Tim.
-
-
www.medrxiv.org www.medrxiv.org
-
On 2021-01-06 12:33:57, user C'est la même wrote:
The authors state that there were 25 cases of GBS in London during the sampling period, which would lead to an estimated occurrence rate of 0.82 GBS cases per 1000 COVID-19<br /> infections.<br /> Yet they discount this by citing a claim that 17.5% of individuals London had been infected by that time. We now know that estimate was wildly inaccurate.<br /> Serological survey data collected by the ONS found that prevalence in London was just under 0.4% around that date (https://www.medrxiv.org/con... "https://www.medrxiv.org/content/10.1101/2020.07.06.20147348v1)")
Which works out to around 36,000 people in comparison to the 26,784 PCR confirmed cases. <br /> This would lead to an estimated occurrence rate of ~0.6 GBS cases per 1000 COVID-19 infections which certainly seems suggestive of an association.
The authors also performed genomic analyses to rule out molecular mimicry due to epitope similarities.
I'd like to draw attention to the fact that many of the known viral triggers of GBS also do not have evidence of molecular mimic epitopes, instead suggesting other mechanisms of generating autoimmunity including the co-capture hypothesis, (http://www.pnas.org/content... "http://www.pnas.org/content/114/4/734)"), given that spike protein interactions with gangliosides have already been characterised in a substantial number of publications to date.
As such, while the lower population incidence during the observed period is compelling, that data alone is not enough to rule out the association of GBS with SARS-CoV-2, given the impact of lockdown measures on other infectious causes that happen to have lower infectivity (basic reproduction number) than SARS-CoV-2.
-
-
www.medrxiv.org www.medrxiv.org
-
On 2021-01-19 15:51:45, user Alter Ego wrote:
In the text it is written: "LamPORE reliably detected SARS-CoV-2 to 20 copies/ml of sample. SARS-CoV-2 reads were detected in the 0.2 copies/ml sample but this was below the threshold for calling as positive sample in LamPORE but were not detected via RT-qPCR (Table 1, Figure 3)." - I assume that with "sample" the original saliva or NP sample is meant. If this is true the assay would be amazing .... my question: ins't there an error and it should be written 20 copies/microliter ... and also 0.2 copies/microliter. This would better fit to the rather low sensitivity of the assay in Figure 4 and an overall performance that is rather on the lower side of other LAMP reports where generally a cut of of approx CT=30 has ben reported (corresponding to approx 20'000copes/millilitre. This Figure is otherwise consistent with the idea that the N2 priers are much better than the E1 and ORF1ab primers....
-
-
www.medrxiv.org www.medrxiv.org
-
On 2021-01-27 10:19:32, user Fred wrote:
I am not convinced of the data. Eg for Germany it is presumed that only about 1 of 10 infections is detected. The data I know from Germany say this number ist only 2-4 . So the IFR for Germany would not be O.2% but at least o.4 or even near to 1 %
-
-
www.medrxiv.org www.medrxiv.org
-
On 2020-03-29 22:38:51, user Sinai Immunol Review Project wrote:
Key findings:<br /> This study investigated the profile of the acute antibody response against SARS-CoV-2 and provided proposals for serologic tests in clinical practice. Magnetic Chemiluminescence Enzyme Immunoassay was used to evaluate IgM and IgG seroconversion in 285 hospital admitted patients who tested positive for SARS-CoV-2 by RT-PCR and in 52 COVID-19 suspected patients that tested negative by RT-PCR. A follow up study with 63 patients was performed to investigate longitudinal effects. In addition, IgG and IgM titers were evaluated in a cohort of close contacts (164 persons) of an infected couple.
The median day of seroconversion for both IgG and IgM was 13 days after symptom onset. Patients varied in the order of IgM/ IgG seroconversion and there was no apparent correlation of order with age, severity, or hospitalization time. This led the authors to conclude that for diagnosis IgM and IgG should be detected simultaneously at the early phase of infection.
IgG titers, but not IgM titers were higher in severe patients compared to non-severe patients after controlling for days post-symptom onset. Importantly, 12% of COVID-19 patients (RT-PCR confirmed) did not meet the WHO serological diagnosis criterion of either seroconversion or > 4-fold increase in IgG titer in sequential samples. This suggests the current serological criteria may be too stringent for COVID-19 diagnosis.
Of note, 4 patients from a group of 52 suspects (negative RT-PCR test) had anti-SARS-Cov-2 IgM and IgG. Similarly, 4.3% (7/162) of “close contacts” who had negative RT-PCR tests were positive for IgG and/or IgM. This highlights the usefulness of a serological assay to identify asymptomatic infections and/or infections that are missed by RT-PCR.
Limitations:<br /> This group’s report generally confirms the findings of others that have evaluated the acute antibody response to SARS-Cov-2. However, these data would benefit from inclusion of data on whether the participants had a documented history of viral infection. Moreover, serum samples that were collected prior to SARS-Cov-2 outbreak from patients with other viral infections would serve as a useful negative control for their assay. Methodological limitations include that only one serum sample per case was tested as well as the heat inactivation of serum samples prior to testing. It has previously been reported that heat inactivation interferes with the level of antibodies to SARS-Cov-2 and their protocol may have resulted in diminished quantification of IgM, specifically (Xiumei Hu et al, https://www.medrxiv.org/con... "https://www.medrxiv.org/content/10.1101/2020.03.12.20034231v1)").
Relevance:<br /> Understanding the features of the antibody responses against SARS-CoV is useful in the development of a serological test for the diagnosis of COVID-19. This paper addresses the need for additional screening methods that can detect the presence of infection despite lower viral titers. Detecting the production of antibodies, especially IgM, which are produced rapidly after infection can be combined with PCR to enhance detection sensitivity and accuracy and map the full spread of infection in communities, Moreover, serologic assays would be useful to screen health care workers in order to identify those with immunity to care for patients with COVID19.
-
-
www.medrxiv.org www.medrxiv.org
-
On 2020-04-12 08:33:12, user tsuyomiyakawa wrote:
Thanks, everyone, for your precious comments.
-
We are examining the potential confounders, which includes the ones mentioned here.
-
As Rosemary mentioned, BCG is an attenuated version TB and, indeed, big protective effect of TB prevalence against COVID-19 exists. We will incorporate the data in the next version.
-
We obtained the data from the web site of European Centre for Disease Prevention and Control, and are re-analyzing the growth of spreading in a more quantitive manner. Basically, there are significant effects of BCG/TB against COVID-19 growth, which will replace the data shown in Figure 3.
-
Regarding the tourists from China, according to a survey, the top 10 destination countries of China’s out bound countries are Japan, Thailand, South Korea, Indonesia, Singapore, Malaysia, Australia, UK, New Zealand, and Maldives, and 9 out of 10 of them are the ones with extremely low COVID-19 cases and deaths (4 or lower deaths per million) , as of April 13th, which makes it unlikely that the Traveling activity from China matters. This will be added to the discussion. Also, we evaluated the number of international arrivals in each country and it did not essentially affect the results (almost at all).
-
As for masks and green tea, they cannot explain 1) the differences between Eastern Europe and Western Europe and 2) low COVID-19 indices in Africa, South America and South East Asia. We may consider their potential effect, once we can get any good statistics representing those things, but so far, we set priority low for these potential confounders.
Anyway, we will upload next version sometime in next week and it will be appreciated if you could keep providing us critical comments, which will greatly improve our manuscript. Thank you!
-
-
-
www.medrxiv.org www.medrxiv.org
-
On 2020-04-16 21:55:50, user Sinai Immunol Review Project wrote:
Title:<br /> Immunopathological characteristics of coronavirus disease 2019 cases in Guangzhou, China<br /> The main finding of the article: <br /> This study analyzed immune cell populations and multiple cytokines in 31 patients with mild/moderate COVID-19 (ave. 44.5 years) and 25 with severe COVID-19 (ave. 66 years). Samples from patients with fever and negative for the SARS-COV-2 test were used as control. At inpatient admission, total lymphocytes number was decreased in severe patients but not in mild patients, whereas neutrophils were increased in severe patients. CD4+ and CD8+ T cells were diminished in all COVID-19 patients. CD19+ B cells and NK cells were decreased in both mild and severe patients, however, severe patients showed a notable reduction. These data might suggest a profound deregulation of lymphocytes in COVID-19 patients. Further analysis showed significant increases of IL-2, IL-6, IL-10 and TNF? in blood of severe patients at the admission. Sequential samples revealed that IL-2 and IL-6 peaked on day 15-20 and declined thereafter. A moderate increase of IL-4 was seen in mild/moderate patients. Thus, elevation of IL-2, IL-6 can be indicators of severe COVID-19.<br /> Critical analysis of the study: <br /> There is no information on when the patients were assessed as severe or mild/moderate, at inpatient admission or later. The authors could have analyzed the correlation between immune cell population and cytokine levels to see, for example, if severe lymphopenia correlated to higher elevation of IL-2.<br /> The importance and implications for the current epidemics:<br /> While similar findings have already been shown, the data corroborates alterations in circulating adaptive and innate immune cell populations and cytokines, and its correlation to disease severity. The increase of IL-2 and IL-6 at the admission might an indicator to start intensive therapies (like convalescent serum) at an early time.
-
-
www.medrxiv.org www.medrxiv.org
-
On 2021-07-14 20:26:08, user bruno ursino wrote:
I came by this article now, so sorry for posting a comment at this time but it seems to me that no one pointed this out: the formula for the evaluation of Rt is completely wrong, indeed this can be shown just by applying this same technique to a simple SIR model.
I think it's impossible to send here my plots, but I ask you to execute the following code using octave or matlab:<br /> `tf = 300;<br /> dt = 0.01;<br /> t = 0:dt:tf;
mu = 1.7/100;
T = 17;<br /> alfa = 1/T;
R0 = 4;
bN = R0*alfa;
S = zeros(1,numel(t));<br /> I = zeros(1,numel(t));<br /> R = zeros(1,numel(t));<br /> d = zeros(1,numel(t));
S(1) = 0.99999999;<br /> I(1) = 1 - S(1);
for k = 2:1:numel(t)
S(k) = S(k-1) + dt(- bNS(k-1)I(k-1));<br /> I(k) = I(k-1) + dt(bNS(k-1)I(k-1) - alfaI(k-1));<br /> R(k) = R(k-1) + dt(alfaI(k-1));<br /> d(k) = mu(R(k) - R(k-1));
end
T_steps = T/dt;
Ri = zeros(1,numel(t));
for k = (T_steps+1):1:(numel(t) - T_steps)
aux = dt(sum(d((k):1:(k+T_steps))) - musum(d((k-T_steps):1:(k))));<br /> Ri(k) = d(k+T_steps)/aux;
end
R_t = zeros(1,numel(t));
for k = (T_steps+1):1:(numel(t) - 2*T_steps)
R_t(k) = dt*(sum(Ri(k:1:(k+T_steps))));
end
figure, plot(t((T_steps+1):1:(numel(t) - 3T_steps)), R_t((T_steps+1):1:(numel(t) - 3T_steps)))<br /> grid minor<br /> hold on<br /> plot(t((T_steps+1):1:(numel(t) - 3T_steps)), R0.(1-R((T_steps+1):1:(numel(t) - 3*T_steps))))`
the blue line will be the Rt evaluated using your formula, while the red one will be the true Rt value. It's not only a matter of the exact values, but most importantly the issue is about the fact that your formula antedates the day in which Rt starts to decrease of a full month, thus it's not possible to use it to actually prove that the measures did or did not have an effect on the Rt value.
-
-
www.medrxiv.org www.medrxiv.org
-
On 2021-07-22 18:02:23, user Andriy Kolesnyk wrote:
1260 times at which point on timeline? Delta is faster (4 days vs 6), and in case of measuring the viral load at 6th day we can receive the result 1260 times bigger for Delta. Becouse Delta has 2 days more for multiplying the viral load.
-
-
www.medrxiv.org www.medrxiv.org
-
On 2021-08-02 22:47:42, user drwambier wrote:
Please revise: "No new serious adverse events assessed as related by investigators were reported after data cut-off for the previous report."
Previously reported: 2 deaths (BNT162b2) vs 4 (placebo), with zero deaths related to COVID19 in each arm. Death (any cause) is the main SERIOUS ADVERSE EVENT (SAE), and a higher number was reported, please revise accordingly.
"During the blinded, controlled period, 15 BNT162b2 and 14 placebo recipients died; during the open-label period, 3 BNT162b2 and 2 original placebo recipients who received BNT162b2 after unblinding died. None of these deaths were considered related to BNT162b2 by investigators. Causes of death were balanced between BNT162b2 and placebo groups (Table S4).”
Since you are reporting the 6 months data, please consider rephrasing to the full numbers: "18 deaths on BNT162b2 versus 16 deaths on the placebo (including the 2 deaths after receiving BNT162b2)." It is also important to specify the denominator for each group. It is unclear what is the total number of patients were followed-up for full 6 months, and how many were lost to follow-up (survivor bias?).
"Cumulative safety follow-up was available up to 6 months post-dose 2 from combined blinded and open-label periods for 12,006 participants originally randomized to BNT162b2. The longer follow-up for this report, including open-label observation of original BNT162b2 recipients and placebo recipients who received BNT162b2 after unblinding, revealed no new safety signals relative to the previous report”.
If 3 deaths happened in the BNT162b2 group until 1 month after Dose 2 during the blinded period and 5 in the placebo group, the new deaths after that month were: 15 for BNT162b2 and 11 for placebo (including the 2 deaths after receiving BNT162b2). Please verify if this is correct, if it is, please state specifically as this might be considered a safety signal.
200 HIV patients data is still not disclosed. I understand that this is per protocol. However, we ask to please disclose the current HIV+ data, since many are receiving the shots under EUA without data of their subgroup analysis.
Plus, assuming that those are in the 22,166 patients of BNT162b2 and 22,320 of placebo:<br /> Considering the “scenario of all patients followed, without unknown outcomes”:<br /> RR for death is 1.1328 (.5778-2.2208). An increase by 13% of all cause mortality in 6 months of follow-up including the part of vaccinating the placebo arm.<br /> The ages and gender of deaths would be informative for safety since populations were balanced by randomization please add a table with such information.
Current data suggests that within 6 months of follow-up, BNT162b2 does not reduce all-cause mortality. There is a signal that it might increase all-cause mortality. <br /> Assuming that it would be difficult for investigators to access if deaths were related to BNT162b2 since myocarditis or heart-related side effects were initially thought to be unrelated to BNT162b2, also no previous signals of thrombosis were reported.
Causes of death were assumed to be “Cardiac Arrest” or other "unknown" descriptions. There is even a “death” as cause of death on the table… "dementia?" For future trials or third injection, an active screening for myocarditis (Serum Cardiac Troponin T and Creatine Kinase–MB), and thromboembolic events would be prudent, specially in the >65 y.o. population, which may be more vulnerable to momentary reduction of cardiac muscle function through inflammation.
As this was a healthy population (not treatment of COVID-19, etc), and deaths were rare. <br /> It seems that all-cause mortality was indeed more common than deaths by COVID-19 in the current manuscript, thus, they cannot be left aside from the trial results discussion. Please discuss specifically about the comparison of COVID-19 deaths in the control group vs the relative increase of deaths detected in the BNT162b2 group and how putting those numbers in the balance.
About COVID-19 related deaths, the score was expected: 2 deaths on placebo (“COVID-19”) and 1 death in Vaccine ("COVID-19 pneumonia”). <br /> With the current safety data, caution is warranted, since the number to harm in the best scenario points that approximately 100 deaths could be attributed to the vaccine for every 1M fully vaccinated, if the increase in all-cause deaths is not a noise of low numbers.
"Safety monitoring will continue per protocol for 2 years post-dose 2 for participants who originally received BNT162b2 and for 18 months after the second BNT162b2 dose for placebo recipients who received BNT162b2 after unblinding.”
Was all the control group crossed-over to BNT162b2 post-unblinding? If so, please state and give the reasons why it was decided to do so. If there is no placebo arm for a safety control comparison, this safety monitoring will only be important if extreme flags happen: such as unexpected high number of serious adverse events emerge.
-
On 2021-08-02 23:49:42, user Maria Knoll wrote:
It would strengthen the duration of protection analysis in the table in Figure 2 if the potential for confounding by age, country and case ascertainment could be ruled out. The VE differed by age group and country (not statistically – wide 95%CIs), but I do not think they were adjusted for. Calendar time may also be a potential confounder if the 4+m period is capturing more post-holiday cases (Jan) while months 2-<4m period is capturing more pre-holiday (Nov). Changing rates in testing might also impact VE: if testing increased in the latter period due to increases in travel and as a result picked up more asymptomatic cases, that would lower its VE because VE is lower for asymptomatic infection than for symptomatic (99% of all cases >7d post dose 2 were non-severe but %symptomatic by period is not described). Also, if there was some unblinding (those with reactions may have correctly guessed they got the vaccine), vaccinees might put themselves at more risk (i.e., travel for the holidays) than placebo recipients which would mean vaccinees would have higher chance of infection (which would lower VE). It would be nice to see a sensitivity analysis performed on a restricted set of participants to try to remove some potential confounding, such as restrict to US only (which were 76% of the participants), restrict to adults (perhaps age 50+ or pick some narrower age range than the current age 12+), and adjust by calendar time of infection. Also describe the testing and positivity rates and proportion symptomatic among cases stratified by vaccinees/placebo and follow-up strata (i.e., 7d-<2m, 2m-<4m, 4m+) to see if case detection was similar across intervention groups and constant over the time periods.
-
-
www.medrxiv.org www.medrxiv.org
-
On 2020-06-12 04:50:15, user Paul_Vaucher wrote:
Dear authors,
Thank you for this interesting article of major interest. I find the process and research question to be most relevant. I however have a few questions that remain open to understand how the study could come to the conclusion that aerosols and surfaces were not important vectors of covid-19.
- What is the external validity of the results for making inferences over infectiousity on the entire period people could be carriers of the disease? In this study, most participants had already been in quarantine for 5 days. Repeated sampling has shown viral load to be optimal in the upper airway system 2 days before and 2 days after symptoms appear. Viral load from nasal and throat swabs drop to a rate where viral culture becomes difficult from 8 days onwards. Most of the study participants were probably beyond that point and were therefore not expected to be very infectious in the first place. If existant, infection through secondary contact and aerosols are however more likely when viral loads are high. It therefore seems difficult from the collected data to infer that household infection through these vectors are unlikely at all times.<br /> 2) When comparing risks from different surface types, how do authors justify the use of chi2 statistics with a sample smaller than 200 and all positive cells with less than 5 cases? In this condition, type 2 errors are very high and this test should not be used under this condition. The number of positif tests are too low to be able to answer the question of whether different surface types are more or less potential vectors of the disease.<br /> 3) Statistical inference assumes independence between measures. This is clearly not the case as a median of 9 samples were taken from each household. Statistical methods should therefore account for these clustering effects. However, the sample size is probably too small for this and a pure descriptive approach without inference could be more relevant.<br /> 4) Could we have any indication on viral load from throat swabs in household cases? If their viral loads were low, we wouldn’t then expect contamination to happen anyway. In two of your 21 housholds, there were apparently not a single case with a positive PCR. This might suggest viral loads to have been too low for any form of infection to have occurred in these households. It seems important to document to what extent each household had at least one person who could infect the air and surfaces.<br /> 5) Likewise, to document risks of infecting the air, were any samples from direct breathing taken from cases Within each household? This seems important as we would theoretically not expect ambient aerosols to be present in aerosols if viruses were difficult to find from air breathed out from cases.
This study investigates an important question. I am however not convinced the method used truly answers the question as the public seems to understand it. Their is indeed room for misinterpretation and for the public to consider contact and air contamination not to occur at any time.
To avoid any overinterpretation, it seems important to clarify that this study only tests risks of air and surface contacts days after people have been placed in quarantine when we don’t suspect them to be very infectious anymore.
-
-
www.medrxiv.org www.medrxiv.org
-
On 2020-08-02 00:11:16, user Michael Verstraeten wrote:
I would like to make also a suggestion. <br /> 1. Calculate the amount of people infected in the whole population on the highest result of your research, by age category. (That's a simplification since there are also other relevant factors then age, like comorbidity factors but ok). <br /> 2. Add to this amount the results from the positive PCR-tests in the hospitals until that moment (Also a problem since there is a % of false negative results, but ok) <br /> 3. Estimate the amount of patients whit a general problem who were refused to get a blood test due to a suspicion of Covid - 19 and were not admitted to the hospital (if possible). And add them to the grand total. <br /> 4. From there on you can make an estimate based on the weighted average evolution of the deaths from de date corresponding to the testdate pn (a few days later then the test dates). It seems to be a relatively good assumption to consider that de evolution of the infections will be relatively equal to the evolution of the deaths / age category. <br /> 5. There is one problem however: we are not sure about the exact amount of deaths due to Covid. 73 % of people deceased in the care homes were not diagnosed and the tests have a big error margin. And diagnoses are maybe wrong due to extended diagnose protocols. Maybe it would be a good idea to calculate an average on the evolution of deaths and hospital admissions. Even if the latter depends on the admission policy.
Even with the uncertainties and the quite big error margin, maybe it will be possible to come with such an exercise closer to the real number of the infected population.
-
-
www.medrxiv.org www.medrxiv.org
-
On 2020-11-15 21:13:34, user Atomsk's Sanakan wrote:
Some flaws in this study that render it's IFR estimate unreliable:
1) He uses many studies that over-estimate the number of people that were infected [and thus under-estimate IFR], since these studies were not meant to be representative of the general population Ioannidis applies them to. He doesn't even follow PRISMA guidelines for assessing studies for risk of bias in a study's research design. "Bias" here does not refer to the motivations of the study's authors, but instead that the design of their study would likely cause their results to not be representative of the general population.<br /> 2) He exploited collinearity by sampling the same region multiple times, in a way that skews his results towards a lower IFR. He conveniently tends to avoid sampling an area multiple times when that area has a higher IFR.<br /> 3) He adjusts IFR downwards for reasons not supported by the analysis he cites for that adjustment.<br /> 4) He takes at face-value areas that likely under-estimate COVID-19 deaths, such as Iran, causing him to under-estimate IFR further.<br /> 5) He uses inconsistent reasoning to evade government studies that show higher IFR, even though governments are doing much of the testing needed to determine IFR. That includes Ioannidis ignoring large studies from Italy and Portugal that are more representative of the general population they sampled.<br /> 6) His IFR from a study in Brazil contradicts the study's own IFR, and his explanation for that makes no sense. This conveniently allows him to cut the study's IFR by about a 1/3.<br /> 7) His use of blood donor studies does not make sense, even if one sets aside the fact that blood donor studies would over-estimate population-wide seroprevalence. For example, he uses a Danish blood donor study that leaves out deaths from people 70 and older, to claim an IFR of 0.27% for adults. When those researchers performed a subsequent study in which they included people 70 and older, they got an IFR for adults that's 3 times larger than Ioannidis claims [0.81% vs. 0.27%].
And so on.
The sources below provide further context on this:
https://rapidreviewscovid19...<br /> https://rapidreviewscovid19...<br /> https://rapidreviewscovid19...
https://twitter.com/GidMK/s...<br /> https://twitter.com/GidMK/s... [ https://threadreaderapp.com... ]<br /> https://www.medscape.com/vi... { http://archive.is/O3vGs , https://threadreaderapp.com... }<br /> https://hildabastian.net/in...<br /> https://twitter.com/AVG_Jos...<br /> https://twitter.com/Atomsks...<br /> https://twitter.com/Atomsks...<br /> https://twitter.com/Atomsks...
"Estimation without representation: Early SARS-CoV-2 seroprevalence studies and the path forward"<br /> Not-yet-peer-reviewed: "Assessing the age specificity of infection fatality rates for COVID-19: Meta-analysis & public policy implications" (comments on "selection criteria")
-
-
www.medrxiv.org www.medrxiv.org
-
On 2021-06-02 21:08:40, user Mike wrote:
"no pregnant or lactating individuals were included in the Phase 3 clinical trials of these vaccines despite belonging to a group at high risk for severe complications of COVID-19 infection" - Ok, so how are you concluding that it is not affecting these women when they weren't included in clinical trials?
"We show here that the mRNA from anti-COVID BNT162b2 (Pfizer) and mRNA-1273 (Moderna) vaccines is not detected in human breast milk samples collected 4-48 hours post-vaccine" - Two concerns with this statement: 1) they were only tested up to 48 hours afterward? Why are we to conclude that if they don't show up in 48 hours they never will? When other vaccines NEVER leave the shoulder muscle (according to Dr. Bridle) that would indicate that the possibility for much slower movement to the blood exists. 2 - Are you testing for the correct substance? Are you looking for the spike protein or mRNA? Are those the same?
-
-
www.medrxiv.org www.medrxiv.org
-
On 2020-03-20 20:57:29, user Sylvie Vullioud wrote:
Could authors provide information to dissipate high risks of bias:
- Manuscript was first published on mediterranee-infection.com website, not on medRxiv. On the manuscript on the website on mediterranee-infection.com, I can read 'In Press 17 March 2020 – DOI : 10.1016/j.ijantimicag.2020.105949'. It means that manuscript was already accepted by International Journal of Antimicrobial Agents at the time when the manuscript was deposit on the 20.03.2020 on medRxiv.
-> Pre-print on medRxiv is not a real pre-print to collect feed-back for manuscript improvement, as originally designed for. Moreover, medRxiv states: 'All preprints posted to medRxiv are accompanied by a prominent statement that the content has not been certified by peer review'.
-> There is an obvious potential conflict of interest, because last author Raoult is editor of the article collection COVID-19 Therapeutic and Prevention in International Journal of Antimicrobial Agents.
-> International Journal of Antimicrobial Agents is runned by Elsevier, suggesting 'If accepted for publication, we encourage authors to link from the preprint to their formal publication via its Digital Object Identifier (DOI)'.
-
Discussion on the controversy of main cited Chinese paper, ref 8 ?
-
According to paper, allocation of patients group was random but treated group is 51.2 years average and control group 37.3 years?
-
Article describes 3 conditions of patients: asymptomatic, low and high symptoms. Why?
-
Care to patients, biological and physiological sampling and analyses, and statistical analyses were not blinded. Why?
-
I think that no placebo was used. Why?
-
6 patients on total of 42 were excluded from study: three patients were transferred to intensive care unit, 1 stopped because of nausea, 1 died. One left hospital. <br /> It is written :'study results presented here are therefore those of 36 patients (20 hydroxychloroquine-treated patients and 16 control patients). Why were dead, intensive care, and nausea patients not included in statistical treatment? <br /> -> This may be a selection bias? <br /> -> What about unwanted very worrying effects of the treatment?
-
'The protocol, appendices and any other relevant documentation were submitted to the French National Agency for Drug Safety (ANSM) (2020-000890-25) and to the French Ethic Committee (CPP Ile de France) (20.02.28.99113) for reviewing and approved on 5th and 6th March, 2020, respectively'. Pre-print was posted on 20.03.2020. Time points on day 14 on patients.<br /> -> So recruitment and study started before approval of ANSM and French Ethic Committee? How is it possible?
-
How is it plausible that numerous authors (18!) participated equally to the work? Is it possible to add their respective contributions?
Thank you in advance for considering my questions. <br /> Regards, <br /> Sylvie Vullioud
-
-
www.medrxiv.org www.medrxiv.org
-
On 2021-05-25 20:24:16, user Green Ranger wrote:
The results and conclusions of this study are wrong. The authors mistook the ivermectin and control arms of one of the RCTs that they included. Look at figure 2. The results from Niaee 2020 are dramatically misreported. The actual results for that study are as follows:
Control groups: 11 deaths out of 60 patients.<br /> Ivermectin groups: 4 deaths out of 90 patients.
When this is corrected, the results of this meta-analysis confirm what other meta-analyses have found. Ivermectin use is associated with approximately 66% reduction in Covid fatalities. And this result is statistically significant.
-
-
www.medrxiv.org www.medrxiv.org
-
On 2021-04-24 23:50:51, user Chucky2017 wrote:
I'm not sure where to post for an expert opinion, but I have been searching and still can't find an answer. Maybe someone here could be kind enough to direct me.
If you delay the Phizer second dose for 3 months (or even 2 months) we see a fall off in antibodies. When you get your second shot what happens? Does it become less effective than if you had it in the 21 days? So basically is there a study that has someone who had it in 21 days, take their blood and compare them to a person that got it 3 months later and see what level of antibodies they have compared to the person with 21 days.
Canada is delaying the phizer shot by 4 months, would a person be better off not getting the second shot and redue the schedule again.
-
-
www.medrxiv.org www.medrxiv.org
-
On 2020-10-23 05:06:05, user Robert Clark wrote:
This is another paper where positive effects of HCQ are left out of the conclusions the paper reports. In the Table 2, the line for mortality at 28 days shows a cut by a factor of 0.54 on HCQ. The difference is not at the standard 0.05 significance level, with a p-value of 0.22. However this does not mean the result is false. It could just as well be the sample size is not large enough for the significance to reach the 0.05 level.
Too often this is overlooked in medical studies. For instance a significance level of 0.05 means there is 5% chance that the difference is just by chance. Or said another way there is a 95% chance that the difference is not by chance alone, meaning the difference is a real effect.
But by the same token a statistical significance of 0.22, i.e., the p-value being 0.22, means there is a 78% chance that it is a real effect. In other words in probability terms it’s more likely than not to be a real effect.<br /> {There are several online calculators of, for example, the Fishers Exact test of statistical significance, such as here: https://www.graphpad.com/qu...}
Yet, often when a result does not reach the 0.05 significance level, it is common, and mistakenly, reported as the result being proven wrong.
In this regard it must be remembered that these calculated levels of statistical significance are dependent on the sample size. For instance with the mortality rates for the HCQ and non-HCQ cases the very same as in this study but at a large enough sample size the statistical significance could be at the 0.05 level. This is especially important in a study such as this one where The originally planned on number of subjects had to be greatly reduced because of a reduced number of cases of the illness.
Another aspect of this Table 2 becomes apparent from unwrapping the data. The study uses what is called a “composite endpoint”, or “composite outcome”. This means two subcases are combined into one. In this study, the cases of “invasively mechanically ventilated”, i.e., intubated, and “deaths” are combined, called the “Primary outcome” in the Table 2.
But the number of deaths specifically on invasive mechanical ventilation is an important number to find out. This is because the mortality rates for that category have been so high. So, the RECOVERY trial for example counted it as a breakthrough when dexamethasone cut deaths in that category by 30%.
In this study, the “Primary outcome” is the union of the two sets, “invasively mechanically ventilated” and “deaths”. What we want though is the number of those ventilated patients who died, the intersection of the two sets.
Use the formula |A ? B| = |A| + |B| – |A ? B|, which simply means the number in the union is found by adding the numbers in the two sets minus the number in the overlap.
We want the number in the intersection though so we’ll turn it around to get:
|A ? B| = |A| + |B| – |A ? B|
For HCQ:<br /> |ventilated?deaths| = |ventilated| + |deaths| – |ventilated?deaths| = 3 + 6 – 9 = 0. So 0 deaths out of 3 patients on invasive ventilation on HCQ.
But for non-HCQ:<br /> |ventilated?deaths| = 4 + 11 – 12 = 3, so the number of deaths on invasive ventilation not taking HCQ was 3 out of 4.
The numbers are too small to draw firm conclusions though. It is unfortunate that the study could not be completed with the originally planned number of cases.
One last fact left out of the conclusions of the paper that supports benefits of HCQ:
Figure 2. Analysis of outcomes in predefined subgroups.<br /> For analysis of the primary outcome in the subgroup of patients receiving azithromycin at randomization, the relative risk could not be calculated because the primary endpoint occurred in 0 of 10 patients who received both azithromycin and hydroxychloroquine compared to 3 of<br /> 11 patients who received azithromycin and the placebo.
???????
Robert Clark
-
-
www.medrxiv.org www.medrxiv.org
-
On 2020-11-08 03:03:45, user perrottk wrote:
Comments on “A Benchmark Dose Analysis for Maternal Pregnancy Urine-Fluoride and IQ in Children”<br /> I question the validity of attempting to determine a BMC for the effect of fluoride intake on IQ without first ascertaining if there is a real effect. The problem of this document is that it assumes an effect without making a proper critical assessment of the evidence for a causal effect.<br /> The draft paper relies completely on two studies which reported very weak relationships from exploratory analyses. Nothing wrong with doing exploratory analyses – providing their limitations are accepted. Such analyses can indicate possibilities for future studies testing possibly causes – but, in themselves, they are not evidence of causation. These studies provide no evidence of causal effect<br /> The studies this draft relies as evidence that fluoride causes a lowering of child IQ illustrates have the following problems.<br /> 1: Correlation is not evidence of causation – no matter how good the statistical relationship. And reliance on p-values is not a reliable indicator of the strength of a relationship anyway The two studies relied on here do not report the full results of statical analyses which would have revealed the weaknesses of the relationships.<br /> 2: These two studies were exploratory – using existing data. They were not experiments specifically designed to establish a cause.<br /> 3: Many other factors besides those investigated can obviously be important in exploratory studies where there is no control of population selection. While authors may claim confounders are considered it is impossible to do this completely – there are so many possible factors to consider. Most are not included in the datasets used and the researchers may make their own selection, anyway.<br /> The study of Malin & Till (2015), referred to in this draft, illustrates the problems. Malin & Till (2015) reported what they considered reasonably strong relationships (p-values below 0.05 and R squared values of 0.21 to 0.34 indicating their relationships explained 21% to 34% of the variance in ADHD prevalence). However, their consideration of possible other risk-modifying factors was limited. They did not include state elevation which Huber et al (2015) showed was correlated with fluoridation. The strength of Huber’s relationship (R squared 0.31 indicating elevation explained 31% of the variance in ADHD prevalence) was similar to that reported by Malin & Till for fluoridation.<br /> Perrott (2018) showed that when elevation is included in the statistical analysis the relationship of ADHD prevalence with fluoridation was non-significant (p>0.05). This show the danger of relying on the results of statistical relationships from exploratory studies where consideration of other possible risk-modifying factors is limited.<br /> 4: This draft paper relies on the reported links between cognitive factors and F intake without testing for a causal effect. But it also does not critically assess those correlations. The problems of confounders have already been mentioned but these two studies report very weak relationships or, in most cases, no statistically significant relationships.<br /> For example, of the 10 relationships between measures of fluoride exposure and cognitive effects Green et al (2019) reported that only 4 were statistically significant (Perrott 2020). That is not evidence of a strong relationship and underlines the danger of assuming correlations (especially selected correlations) are evidence of causation. Incidentally, this draft paper mentions the study of Till et al (202) which also reported relationships between fluoride exposure with bottle-fed infants and later cognitive effects. In this case only three of the 12 relationships reported were statistically significant (Perrott 2020).<br /> Even those relationship reported as significant were still very weak. For example Green et al (2015) reported a relationship for boys which explained less than 5% of the variance of IQ measures.
The relationships reported by Bashash et al (2017) were also extremely weak – explaining only about 3.6% of the variance in IQ and 3.3% of the variance in GCI. This weakness is underlined by other reports of relationships found for the Mexican ELEMENT database. Thomas (2014) did not find a significant relationship of MDI with maternal urinary fluoride for children of ages 1 to 3 although in a conference poster paper Thomas et al (2018) reported a statistically significant relationship for urinary fluoride adjusted using creatinine concentrations.<br /> 5: As well as ignoring the incidence of non-significant relationships from these studies this draft paper also ignores the findings of positive relationships from other studies. For example, Santa-Marina et al (2019) reported a positive relationship between F intake indicated by maternal urinary F and child cognitive measures. Thomas (2014) also reported a positive relationship of child IQ (MDI for 6 – 15-year-old boys) with child urinary fluoride.<br /> 6: The draft paper describes the two studies it uses for its analysis as “robust” but ignores the fact that the findings in these and other relevant studies are contradictory. For example, the findings reported in the two papers differ in that Bashash et al (2017) did not report different effects for boys and girls whereas Green et al (2019) did. Santa-Marina et al (2019) reported opposite effect to those of Bashash et al (2017) and Green et al (2019). These contradictory findings, together with the lack of statistical significance for most of the relationships investigated, are perhaps what we should expect from relationships which are as weak as these are.<br /> Summary<br /> The paper relies on weak relationships from exploratory studies. Such relationships, even where strong, cannot be used as evidence for causation and to assume so can be misleading. BMCs and similar functions derived without any evidence of real effects are not justified. While the derived BMCs may be used by activists campaigning against community water fluoride, they will be misleading for policy makers. This sort of determination of BMC is a least premature and a worst meaningless.<br /> References:<br /> Bashash, M., Thomas, D., Hu, H., Martinez-mier, E. A., Sanchez, B. N., Basu, N., Peterson, K. E., Ettinger, A. S., Wright, R., Zhang, Z., Liu, Y., Schnaas, L., Mercado-garcía, A., Téllez-rojo, M. M., & Hernández-avila, M. (2017). Prenatal Fluoride Exposure and Cognitive Outcomes in Children at 4 and 6 – 12 Years of Age in Mexico. Enviromental Health Perspectives, 125(9).<br /> Green, R., Lanphear, B., Hornung, R., Flora, D., Martinez-Mier, E. A., Neufeld, R., Ayotte, P., Muckle, G., & Till, C. (2019). Association Between Maternal Fluoride Exposure During Pregnancy and IQ Scores in Offspring in Canada. JAMA Pediatrics, 1–9.<br /> Huber, R. S., Kim, T.-S., Kim, N., Kuykendall, M. D., Sherwood, S. N., Renshaw, P. F., & Kondo, D. G. (2015). Association Between Altitude and Regional Variation of ADHD in Youth. Journal of Attention Disorders.<br /> Malin, A. J., & Till, C. (2015). Exposure to fluoridated water and attention deficit hyperactivity disorder prevalence among children and adolescents in the United States: an ecological association. Environmental Health, 14(1), 17.<br /> Perrott, K. W. (2018). Fluoridation and attention deficit hyperactivity disorder a critique of Malin and Till (2015). British Dental Journal, 223(11), 819–822.<br /> Perrott, K. W. (2020). Health effects of fluoridation on IQ are unproven. New Zealand Medical Journal, 133(1522), 177–179.<br /> Santa-Marina, L., Jimenez-Zabala, A., Molinuevo, A., Lopez-Espinosa, M., Villanueva, C., Riano, I., Ballester, F., Sunyer, J., Tardon, A., & Ibarluzea, J. (2019). Fluorinated water consumption in pregnancy and neuropsychological development of children at 14 months and 4 years of age. Environmental Epidemiology, 3. <br /> Thomas, D. B. (2014). Fluoride exposure during pregnancy and its effects on childhood neurobehavior: a study among mother-child pairs from Mexico City, Mexico [University of Michigan].<br /> Thomas, D., Sanchez, B., Peterson, K., Basu, N., Angeles Martinez-Mier, E., Mercado-Garcia, A., Hernandez-Avila, M., Till, C., Bashash, M., Hu, H., & Tellez-Rojo, M. M. (2018). OP V – 2 Prenatal fluoride exposure and neurobehavior among children 1–3 years of age in mexico. Environmental Contaminants and Children’s Health, 75(Suppl 1), A10.1-A10.<br /> Till, C., Green, R., Flora, D., Hornung, R., Martinez-mier, E. A., Blazer, M., Farmus, L., Ayotte, P., Muckle, G., & Lanphear, B. (2020). Fluoride exposure from infant formula and child IQ in a Canadian birth cohort. Environment International, 134(September 2019), 105315.
-
-
www.medrxiv.org www.medrxiv.org
-
On 2021-09-12 01:57:32, user Swapnil Hiremath wrote:
The authors have undertaken an ambitious project: briefly, taking numerators from the VAERS database, denominators from vaccine numbers from elsewhere. They then perform a ‘harm-benefit’ analysis looking at COVID hospitalization as the only harm. The whole analysis is restricted to the 12-17 age group in whom the concern of myocarditis is admittedly higher. <br /> They report a risk which was anywhere from 1.5 to 6.1 times higher for vaccine associated myocarditis vs COVID causing hospitalization. Vaccines must be bad, surely.
However, several problems are quickly apparent. <br /> 1. The rate of myocarditis is much higher than the ones reported in Ontario: 160/million for 12-15 males compared to 72.5/million from Ontario (which includes Moderna as well - which has higher rates of myocarditis than the Pfizer/BioNTech). Why would this be so? There are many possible reasons, including the overestimation from VAERS being probable cause. On a perusal of the supplement, there are many which are other viral diseases which could be the reason; additionally many descriptions are quite vague (‘the doctor told us troponin was elevated’). It is very easy to submit cases to VAERS, so the numbers reported by the authors seem to be higher than the true value. The case ascertainment performed in Ontario seems a bit more reliable and trustworthy than user entered data in VAERS.
-
It was not clear why the authors chose Jan 1, when vaccines EUA for 16-17 started in March, and for 12-15 in May. In their database, there seems to be one case in March and most of the VAERS reports from May or later.
-
Secondly, the authors make many assumptions when it comes to who had comorbidities and who did not among the children, and multiply numbers to come up with some crude estimates. It would be useful for a pediatric diseases researcher to assess these assumptions. The 40% assumption of children hospitalized 'with COVID' and not due to COVID is a very crude untruth that the authors and others have needlessly perpetuated on social media with little foundation.
-
Most importantly, the authors assume that hospitalization is the only bad thing for children who develop COVID. 12-17 years olds have died due to COVID. Some developed MIS-C. Some developed longer term sequelae. To group them under ‘hospitalization’ seems overly simplistic. Similarly, from perusing some of the vaccine-myocarditis, many seem to have recovered with symptomatic care. The authors seem to be minimizing COVID and maximizing vaccine associated adverse events.
-
It should be noted that the involvement of children in the first two waves seems to be different than the one we have seen in the last 2 months with delta (for whatever reason - perhaps with lower immunization numbers in these).
-
Lastly, the pandemic is not yet done. Many more children are going to get COVID in the next few months and years. We are going to have many more hospitalization, morbidity and sadly many more deaths. There will be long term morbidity and sequalae. We do need better data to assess the risks and benefits. This study is not it.
-
-
-
www.medrxiv.org www.medrxiv.org
-
On 2022-02-21 11:05:51, user diveoceanos wrote:
Studies 4 through 6 are doing a matched-cohort analysis of Ct values between group 2 (unvaccinated and reinfected) and unvaccinated and infected individuals, individuals with breakthrough infections after BNT16262 vaccine and individuals with breakthrough infection after mRNA-1273 vaccine respectively.
Based on the data the mean Ct value is higher for the unvaccinated and reinfected individuals in all studies compared to the matched-cohort, with studies 4 and 5 reaching statistical significance, while in study 6 the P-value is at 0.104 indicating not a statistically significant difference.
In the text the authors are ranking the infectiousness in order of decreased magnitude in line with their findings i.e.
“The different comparisons suggest an overall hierarchy, present for both asymptomatic and symptomatic infections, where primary infections in unvaccinated persons are most infectious, followed by BNT162b2 breakthrough infections, mRNA-1273 breakthrough infections, and finally reinfections in unvaccinated persons.”
Figure 2 is clearly showing that reinfections are associated with higher Ct compared to all other studied groups.
However there is misleading information on tables 4 and 5. Specifically tables 4 and 5 are showing in the last two rows that infectiousness of breakthrough infections is less compared to infectiousness of reinfections in unvaccinated individuals:
• Infectiousness of BNT162b2-vaccine breakthrough infections relative to reinfections in unvaccinated individuals<br /> • Infectiousness of mRNA-1273-vaccine breakthrough infections relative to reinfections in unvaccinated individuals
Either the line descriptions should change to reflect the correct ratio (i.e. infectiousness of reinfections in unvaccinated individuals over the breakthrough infections or the relative infectiousness should be recalculated to reflect the line description.
-
-
www.medrxiv.org www.medrxiv.org
-
On 2021-12-13 22:59:33, user Just Because I can wrote:
Greetings RI team from Utah! I must begin with nicesties; "Go BRUNO"! My son graduated this past May 2021 from Brown. I am a speech and language pathologist with over 30 years of hospital, private and public school setting experiences. Over the past nine years, I have professionally focused on children ages 3-5 within the public preschool and private therapeutic settings. I service students and their parents with the most intensive and restrictive learning environments within our District due to cognitive, behavioral and communicative delays. I can't help but weigh in now, as I previously shared this article with my peers in August as I braced for the impact of the 2021 school year.
Given your single assessment tool (I professionally do not profess strong decisions based on a single evaluative instrument, even as widely accepted at the Mullen), I've found your results to be intriguing and frankly, just as we anticipated.
To compare to RI, our school district, closed schools for Remote Learning for only 3 mos. in the Spring of 2019 and returned to in person instruction with hybrid options in 2020. Of a caseload of 65 students, I had 3 that were online/virtual. In 2021, our District returned to essentially all in student learning.
My informal observations this school year in Utah has been as follows:
- Increase in new referrals and eligible "older" 4+ year old children scoring remarkably delayed communication (Standard scores <50 given a typical range of 85-115) and no previous history of EI or preschool interventions. Our TIER 3, most restrictive preschool program has a marked influx of new referrals (e.g., total students in May was 24 and currently rises at 36 with 8 new referrals in Jan.)
- Many declined or rarely attended virtual Early Intervention supports, skipped medical wellness visits including dentistry during the pandemic.
- Increase in parent report of primary concerns with behavioral components.
- Given the current timeframe, we are NOT seeing marked progress with an influx in discharges (no longer eligible due to more typical standard scores). We are seeing progress and we have continued to see progress through the pandemic (which at times surprised me) but the levels of improvement are not as remarkable or typical as years past.
- Typical communication, fine/gross motor and even cognitive delays are still present but the comorbidity of exceptional delays in social/pragmatic and ultimately, behavioral skills combined make measured learning and ultimately IEP progress at a slower rate. Social/pragmatic delays are interfering with overall progress.
- Parent involvement, participation, enthusiasm and grit appear markedly depressed. Educational teams walk a fine line between empathy, compassion and expecting parents and care givers to step in and "do hard things" in difficult times. The teams are using external motivators such as pizza cards to motivate parents to attempt, complete and turn in 2x monthly parent based home practice pages.
- Increased rate of meeting attendance with Virtual options.
Where do we go from here? I agree, measuring student outcomes is critical but supporting the parents (in any evidence based manner) is to me, a critical and crucial element. I thought the kids, once exposed to typical learning/situations and with repetition, our inflated numbers would flatten in a year and they would bounce back into typical ranges but it's the apathetic, tired, depressed parents that are lacking resilience and grit currently. I do think another component that would be most valuable and continues to need funding is Preschool for All (or most).
Thank you to any cohort, parent, professional person interested in this dialogue, for reading my insights.
-
-
www.medrxiv.org www.medrxiv.org
-
On 2021-08-29 21:48:43, user philipn wrote:
Thank you for this great trial!
I shared some of my thoughts in this twitter thread here: https://twitter.com/__phili....
RAAS components: preprints notes no impact of treatment on measured RAAS components. In studies I've read (non-COVID), ARBs raise Ang II (see e.g. https://pubmed.ncbi.nlm.nih...; "https://pubmed.ncbi.nlm.nih.gov/10082498/);") idea is less AT1R binding => more Ang II. But the trial found no impact on even Ang II with treatment.
Preprint doesn't mention how many participants had RAAS components measured, so maybe it wasn't enough for significance. But the preprint does give significant p-value for an association with baseline. In the above non-COVID study showing ARBs raise Ang II, n=12 wasn't enough for significance with 50mg losartan (but was for the other ARBs; 50mg losartan pictured as open diamond in Figure 4).
If argument is treatment was dosed to block AT1R sufficiently but had no impact on RAAS components, why Ang II isn't higher in the treatment group is an interesting question?
The preprint looks at PK data in n=7, "consistent with..maximal AT1R blockade." Earlier in preprint, "yielding an expected 70% inhibition of AT1R." 70% inhibition doesn't appear in citation (https://pubmed.ncbi.nlm.nih... mentions 77% at trough with 100mg bid).
In this paper (https://pubmed.ncbi.nlm.nih... "https://pubmed.ncbi.nlm.nih.gov/11392465/)") 50mg od losartan looks like ~35% in the peak window. In https://pubmed.ncbi.nlm.nih..., 50mg again looks like ~35% at peak (open diamonds in Figure 3).
I was unable to find a study that tests exactly 50mg bid losartan and looks these proxies for % AT1R blockade.
I think the preprint authors may be getting the 70% figure from an earlier citation, https://pubmed.ncbi.nlm.nih..., Fig 3 and ~205 ng/mL EXP3174 (median C_6h) => ~70% according to figure. It seems this argument is based on PK in this n=6 study. The PK study uses SBP response to Ang II but looks pretty different from https://pubmed.ncbi.nlm.nih....
https://twitter.com/__phili... - side by side figures are illustrative
Compare the ~50mg losartan (open diamonds in right figure, from https://pubmed.ncbi.nlm.nih... "https://pubmed.ncbi.nlm.nih.gov/10082498/)"). Looks like ~35% at peak vs ~70%. The graphs look pretty different.
The authors of the ~35% study address this difference, stating:
"The antagonism produced by 50 mg of losartan (ie, 35% to 45% blockade of AT1 receptors) was also weaker than expected on the basis of previous results of studies using 40 mg of losartan. To explain this difference, one must consider that in our study, the placebo had no effect on blood pressure response to exogenous Ang II, whereas it blunted the effect of Ang II by almost 20% in Christen et al’s6 study. Thus, if one corrects for the placebo effect, the percentage of inhibition obtained in the 2 studies is comparable."
So once the PK study’s placebo response is adjusted, results are similar. So isn’t the value ~35%, not 70%? Would be consistent with other studies, showing proxies for % blockade being around ~35% for 50mg losartan rather than 70%. I also wonder if “Labeled Ang II %” figures may be a better proxy for % AT1R blockade than SBP (less prone to placebo etc)?
--Philip Neustrom
-
-
www.medrxiv.org www.medrxiv.org
-
On 2021-08-31 19:11:00, user Andy Loening wrote:
I think this is a thought provoking model. However, I think there are some major flaws with the model (as I understand from the pre-print manuscript) that severely limit the interpretation of the results.
The biggest flaw I see is:<br /> 1) "Case-investigation of potential contacts is not conducted." So the "no testing" cases have NO contact tracing, which makes this not at all a far comparison. If they included contact tracing/testing (status quo), I would believe most (or all) the difference between their "testing" and "no testing" lines would go away.
Other flaws I see<br /> 2) As a previous comment pointed out, they assume an initial rate of infections coming into the school at ~10-20-fold greater rate then actually infection rates. Similarly the 1 new case coming into the school per week may be too high.<br /> 3) They don't seem to build in any allowance for the ~36-48 hrs it would take a RT-PCR test to get a positive result back. The model doesn't seem to take any of this delay in testing results into account. This would obviously blunt the positive effects that surveillance testing would have.<br /> 4) They seem to treat their student population as a single classroom of 500 kids, and do not take into account that kids (even in the pre-covid days) are mostly segregated into their classrooms for the majority of the day.<br /> 5) There are no error bars provided for the model. Presumably the model has randomization within it, so there should be some variation in the outputs, it would be interested to see what the spread of the outputs are to gauge the significance of the findings.
I would be really interested in the results of this manuscript if it was redone with more appropriate assumptions. My guess is that there would be a much smaller difference between the surveillance and non-surveillance groups.
-
-
www.medrxiv.org www.medrxiv.org
-
On 2024-08-21 16:23:52, user DUPA- Preprint Review wrote:
Overall, this is a well-designed and conducted analysis that provides valuable insights into comorbidity patterns among early COVID-19 deaths in the United States. The manuscript presents important findings on the morbidity patterns associated with COVID-19 mortality and offers valuable insights for public health strategies. The latent class analysis (LCA) is a widely utilized clustering method for investigating comorbidities, which effectively addresses the issue of collinearity among comorbidities in high-risk populations. It could help identify disease patterns and understand disease relationships. The findings give researchers and health departments detailed knowledge to quickly identify vulnerable populations and provide protection in these public health emergencies. However, addressing the suggestions outlined above will enhance the clarity, transparency, and impact of the study. Therefore, we recommend the manuscript for publication with minor and major revisions.
Major Comments:
In Materials and Methods section, line 6 of the second paragraph, it is noted that cardiovascular disease (CVD) includes a variety of diseases/conditions with different prevalence and severity. For example, hypertension may have a significantly higher prevalence compared to other diseases within the CVD group, potentially leading to a disproportionate representation. Is it possible to list the prevalence of individual diseases in the supplementary material? Additionally, It would be beneficial to separate the diseases that have more than 60%(or other value)prevalence as the sensitivity analysis. This approach could enhance the stability of the study by avoiding amplifyfication of the effects from individual diseases with high prevalence. On the other hand, it also provides more details and discussion for the formation of the present results.
Minor Comments:
-
In the Abstract, Results section line 3: the phrase “A low frequency of comorbidities” is not precise. Use several words to express “where the prevalence of each comorbidity group was less than that of the entire sample” could be clear.
-
In the Introduction, paragraph 1: <br /> The study effectively reaffirms the importance of cardiovascular disease and diabetes. Including a comparison with other studies conducted during the same period would provide valuable context.
-
In the Discussion section, paragraph 2, line 3-6:<br /> Cardiovascular disease was present at 23%, even in the "minimal prevalence" category, which includes cardiovascular disease and diabetes, prominent cardiovascular disease without diabetes, and "minimal prevalence." Is there a difference in the distribution of each disease? Could this same/different distribution further explain the large proportion of "minimal prevalence" in people over 85 years old?
-
In the Discussion section, paragraph 2, line 7-11:<br /> What are the mechanisms behind the high rankings for kidney disease and chronic lung disease.
-
In the Discussion section, paragraph 2, line 1:<br /> In addition, please briefly state the underlying mechanisms behind cardiovascular disease and diabetes, such as mechanisms of interaction between cardiovascular disease and diabetes.
-
In the Discussion Section, paragraph 4, line 2:<br /> The discussion effectively interprets the findings, particularly identifying the "minimal prevalence" class. But besides the eldest group, the proportions of this class still lead in other age groups. Is there any other explanation for why the "minimal prevalence" class still experienced significant mortality? It would also be helpful to provide more details based on citations 28,29(or other literature) to explain the reasonableness of proportions. This additional detail could offer deeper insights into the underlying factors contributing to their outcomes.
-
-
-
www.medrxiv.org www.medrxiv.org
-
On 2025-07-13 08:45:42, user Ben Auxier wrote:
In their pre-print Brackin et al. [1] present data suggesting nosocomial infections (that is, infections arising from the clinical environment) of patients infected with A. fumigatus. This is a surprising finding, given the near universal abundance of this fungus. As I detail below, there is no evidence of transmission chains within a hospital. Rather, the analyses presented fall victim to the statistics of detecting matches within populations of differing sizes, related to what is commonly referred to as “the birthday paradox”. The main data in this paper consists of whole genome sequencing data from 182 isolates from 15 patients (>2 samples from each patient), 101 isolates from patient’s homes, and 102 isolates from a medical centre that all patients visited. From these data, three comparisons are made between a) case samples and general environmental samples, b) case samples and their own home and c) case samples and the reference clinic.
The authors find that there are links for a), consistent with reports over the last several decades that A. fumigatus populations are highly recombinant, but includes widely dispersed clones [2–5]. More interestingly, they find no links for b) but abundant links in c), which would be consistent with hospital spread. However, while the sample sizes in b) and c) are equivalent, the comparisons are not. Across the 8 cases (average of 11.3 isolates per case) where the housing was also sampled, an average of 12.6 isolates per house (101 total) were used for whole genome sequencing. This leads to ~1000 comparisons being made, due to substructure in the data. Notably, since some patients have long-term infections of one genotype, this number is an overestimate due to within-patient correlations. Then, all 182 patient isolates (more than the 8 patients sampled) are compared against all 102 isolates from the medical centre, producing over 18,000 comparisons. Thus, using a null hypothesis of no difference between patient-hospital and patient-home data, since there are ~20X more patient-hospital comparisons (and 20% of patient samples match a hospital sample), a naïve expectation would be 1% of patient-home comparisons to be clonally related, likely detectable in the ~1000 comparisons.
Unfortunately, their analysis falls into the “birthday paradox”. Briefly stated, this paradox reflects the fact that while the chance that you share a birthday with someone else is 1/365, the chance that two people share a birthday within a classroom of 30 students is not 8% (30/365), but instead a surprisingly high 70%. This is because in the classroom situation you not only have a larger group, but also many more combinations. The chance of sharing a birthday can be considered as the chance of sampling two identical genotypes from a population of clones. Thus, while roughly equal numbers of isolates from homes and the reference center were used for genome sequencing, this difference in structure means that comparisons with patient isolates are unequal. However, the birthday paradox shows that this math is not intuitive and the chance of finding matches increases non-linearly. So, while perhaps 10 matches should have been expected between patients and their homes, which would already be a tenuous link, the expected number is effectively zero due to the smaller sample size.
The actual sites of infection for A. fumigatus is important to discern. The cryptic nature of initial infections makes this a challenging task, requiring creative experimental or observational studies. However, I would argue simply identifying clonal matches provides insufficient evidence..
References:<br /> 1. Brackin, A. P. et al. Genomic epidemiology links azole-resistant Aspergillus fumigatus hospital bioaerosols to chronic respiratory aspergillosis. 2025.07.04.25330042 Preprint at https://doi.org/10.1101/2025.07.04.25330042 (2025).
-
Chazalet, V. et al. Molecular Typing of Environmental and Patient Isolates of Aspergillus fumigatus from Various Hospital Settings. Journal of Clinical Microbiology 36, 1494–1500 (1998).
-
Rhodes, J. et al. Population genomics confirms acquisition of drug-resistant Aspergillus fumigatus infection by humans from the environment. Nat Microbiol 7, 663–674 (2022).
-
Shelton, J. M. G. et al. Landscape-scale exposure to multiazole-resistant Aspergillus fumigatus bioaerosols. 2022.11.07.515445 Preprint at https://doi.org/10.1101/2022.11.07.515445 (2022).
-
Snelders, E. et al. Widely dispersed clonal expansion of multi-fungicide-resistant Aspergillus fumigatus limits genomic epidemiology prospects. mBio 16, e03652-24 (2025).
-
-
-
www.medrxiv.org www.medrxiv.org
-
On 2019-07-17 16:54:37, user Guyguy wrote:
EVOLUTION OF THE EBOLA EPIDEMIC IN THE PROVINCES OF NORTH KIVU AND ITURI
Tuesday, July 16, 2019
The epidemiological situation of the Ebola Virus Disease dated July 15, 2019:<br /> Since the beginning of the epidemic, the cumulative number of cases is 2,512, 2,418 confirmed and 94 probable. In total, there were 1,676 deaths (1,582 confirmed and 94 probable) and 703 people healed.<br /> 423 suspected cases under investigation;<br /> 11 new confirmed cases, including 5 in Beni, 2 in Mandima, 1 in Mabalako, 1 in Vuhovi, 1 in Katwa and 1 in Komanda;<br /> 8 new confirmed cases deaths:<br /> 3 community deaths, 2 in Beni and 1 in Mandima;<br /> 5 deaths at Ebola Treatment Center, including 4 in Beni and 1 in Goma;<br /> 3 people cured out of Ebola Treatment Center including 2 in Butembo and 1 in Katwa.
136 Contaminated health workers
The cumulative number of confirmed / probable cases among health workers is 136 (5% of all confirmed / probable cases), including 41 deaths.
163,533 Vaccinated persons
The only vaccine to be used in this outbreak is the rVSV-ZEBOV vaccine, manufactured by the pharmaceutical group Merck, following approval by the Ethics Committee in its decision of 19 May 2018.
75,321,895 Controlled people
NEWS
Follow-up of the situation of the pastor's contacts who traveled to Goma
On Monday, July 15, 2019, 37 high-risk contacts and 40 Goma confirmed case contacts were vaccinated at the Afia Himbi health center where the patient had been isolated before being transferred to the Ebola Treatment Center. In total, 97 contacts in the broad sense have already been listed to date. Vaccination will continue until all identified contacts have been vaccinated.<br /> Among the contacts identified were two women from the pastor's family traveling with him. After the pastor's transfer to CTE, they hid in Goma and some people thought they fled to Bukavu in South Kivu province. Fortunately, the two women were found in Goma on Tuesday and will be vaccinated.
-
On 2019-07-18 18:38:41, user Guyguy wrote:
EVOLUTION OF THE EBOLA EPIDEMIC IN THE PROVINCES OF NORTH KIVU AND ITURI
Show solidarity with the Congolese people in the 10th Ebola outbreak declared a health emergency of international concern: understand a qualitative study of variables of hospital activities on infection control practices in Kinshasa city
Wednesday, July 17, 2019
Statement Ebola outbreak in DRC as a health emergency of international concern
Following the recommendations of the international expert committee, WHO declared on Wednesday, July 17, 2019, that the Ebola epidemic in the DRC was a health emergency of international concern.<br /> The Ministry of Health accepts the evaluation of the expert committee. The ministry hopes that this decision is not the result of the many pressures from different stakeholder groups who wanted to use this statement as an opportunity to raise funds for humanitarian actors despite the potentially harmful and unforeseen consequences for the affected communities that depend on them. greatly from cross-border trade for their survival.<br /> While the Government continues to openly share with partners and donors the way in which it uses the funds received, we hope that there will be greater transparency and accountability of humanitarian actors in their use of funds to respond. to this Ebola outbreak.<br /> The Ebola epidemic is above all a public health crisis that requires a response by actors with real technical expertise. However, the main difficulty is that this epidemic occurs in an environment characterized by problems of development and shortcomings of the health system.<br /> Furthermore, we regret that after spending almost a year in this epidemic, certain groups of people in the community continue to adopt irresponsible behavior that causes the geographical spread of the virus. It is important to remember that in the cases of Goma and Uganda, the patients knew that they were at risk but refused to respect the health recommendations and deliberately traveled to another area. The Government will consider what steps need to be taken to prevent these high-risk groups from continuing to spread the epidemic in the region.
Follow-up of the situation of the pastor's contacts who traveled to Goma<br /> Vaccination around the confirmed Goma case continues at the Afia Himbi Health Center in the Goma Health Zone. All contacts in the city were found in less than 72 hours, including the motorcycle taxi driver that the pastor had used to get to the health center. The response teams from Beni and Butembo continue the investigations to trace the pastor's journey and identify his contacts in these two cities.
The epidemiological situation of the Ebola Virus Disease dated 16 July 2019:<br /> Since the beginning of the epidemic, the cumulative number of cases is 2,522, 2,428 confirmed and 94 probable. In total, there were 1,698 deaths (1,604 confirmed and 94 probable) and 717 people cured.<br /> 374 suspected cases under investigation;<br /> 10 new confirmed cases, including 6 in Beni, 2 in Mabalako, 1 in Katwa and 1 in Mangurujipa;<br /> 10 new confirmed cases deaths:<br /> 5 community deaths, including 3 in Beni, 1 in Mabalako and 1 in Mangurujipa;<br /> 5 deaths at Ebola Treatment Center (ETC) including 4 in Beni and 1 in Katwa;<br /> 7 people cured out of Mabalako Ebola Treatment Center.
No health workers are among the newly confirmed cases. The cumulative number of confirmed / probable cases among health workers is 136 (5% of all confirmed / probable cases), including 41 deaths.
Deaths and cures data recorded in ETCs for the period 9-11 July 2019 are now available and have been added to the summary table.<br /> In total, 12 deaths were recorded in ETC during this period:<br /> 7 deaths at the ETC de Beni<br /> 3 deaths at Butembo ETC<br /> 2 deaths at Katwa ETC<br /> In total, 7 cures were discharged from ETC during this period:<br /> 5 cured at Butembo ETC<br /> 1 cured at the ETC of Beni<br /> 1 cured at Katwa ETC
75,697,081 Controlled people<br /> 80 entry points (PoE) and operational health checkpoints (PoC).
Source: Ministry of Health press team on the state of the response to the Ebola epidemic in the Democratic Republic of the Congo
-
On 2019-07-20 05:46:57, user Guyguy wrote:
EVOLUTION OF THE EBOLA EPIDEMIC IN THE PROVINCES OF NORTH KIVU AND ITURI
Friday, July 19th, 2019
The epidemiological situation of the Ebola Virus Disease dated 18 July 2019:<br /> Since the beginning of the epidemic, the cumulative number of cases is 2,546, of which 2,452 confirmed and 94 probable. In total, there were 1,715 deaths (1,621 confirmed and 94 probable) and 721 people healed.<br /> 478 suspected cases under investigation;<br /> 14 new confirmed cases, including 6 in Beni, 5 in Mandima, 1 in Katwa, 1 in Mabalako and 1 in Mambasa;<br /> 10 new confirmed cases deaths:<br /> 6 community deaths, 2 in Beni, 2 in Mandima, 1 in Mabalako and 1 in Mambasa;<br /> 4 CTE deaths, 2 in Butembo, 1 in Katwa and 1 in Mabalako;<br /> 3 people healed out of Beni ETC
.167 152 Vaccinated persons
76,319,878 Controlled people<br /> 80 entry points (PoE) and operational health checkpoints (PoC).
138 Contaminated health workers<br /> One health worker, vaccinated, is one of the new confirmed cases of Mandima.<br /> The cumulative number of confirmed / probable cases among health workers is 138 (5% of all confirmed / probable cases) including 41 deaths.
Source: Ministry of Health press team on the state of the response to the Ebola epidemic in the Democratic Republic of the Congo
-
-
www.medrxiv.org www.medrxiv.org
-
On 2020-01-25 10:47:13, user stucash wrote:
I am not sure if this is due to the "preprint" nature of paper, but a few points that look a bit suspicious:<br /> 1. The actual data set used to conduct the estimation was not disclosed in paper;<br /> 2. The research method for estimation was also not disclosed in paper<br /> 3. Reasoning for the employed assumptions and not others? Reasoning for the employed transmission model and not others? Apparently this should be part of research method elaboration yet there's none. <br /> 4. Do all med papers come in this short?? This paper is just too descriptive and only estimation results were presented.
I'd really wait for a full-fledged version, I am reluctant to call this research.
-
-
www.medrxiv.org www.medrxiv.org
-
On 2020-03-08 05:57:17, user James Nokes wrote:
Highly informative paper. Thank you. A few points/questions:
-
Table 1 indicates it is contact-based surveillance with higher proportion male than female contrary to the results text.
-
How was temperature measured and what was the definition of fever?
-
How were nasal samples collected (eg nasopharyngeal swab, per-nasal swab, aspirates). Did the method differ for contact and case-based surveillance?
-
Assessing severity status - (i) can you clarify if moderate required all three of fever, respiratory symptoms, and radiographic evidence of pneumonia? What is included in 'respiratory symptoms'? (ii) How did you measure oxygen saturation?
-
Table S1. It would be useful to include the proportions with fever. The proportion of cases from symptom-based surveillance with shortness of breath (4%) or difficulty breathing (3%) is remarkably low.
-
-
-
www.medrxiv.org www.medrxiv.org
-
On 2020-03-24 14:01:51, user Sinai Immunol Review Project wrote:
Main findings<br /> The authors collected data on 25 COVID-19 patients (n=11 men, n=14 women) using standard laboratory tests and flow cytometry. All patients were treated with antibiotics. Twenty-four of the 25 patients were also treated with anti-viral Umefinovir and 14 of the patients were treated with corticosteroids. 14 patients became negative for the virus after 8-14 days of treatment. The same treatment course was extended to 15-23 days for patients who were still positive for the virus at day 14. <br /> The authors found a negative association between age and resolution of infection. Patients with hypertension, diabetes, malignancy or chronic liver disease were all unable to clear the virus at day 14, though not statistically significant.<br /> Elevated procalcitonin and a trend for increased IL-6 were also found in peripheral blood prior to the treatment.<br /> A trend for lower NK cell, T cell and B cell counts in patients was also reported. B cell, CD4 and CD8 T cell counts were only increased upon treatment in patients who cleared the virus. NK cell frequencies remained unchanged after treatment in all the patients.
Limitations of the study<br /> 73% of the patients who remained positive for SARS-CoV2 after the 1st treatment, and 43% of all patients who cleared the virus were treated with corticosteroids. Corticosteroids have strong effects on the immune compartment in blood{1}. The authors should have accounted for corticosteroid treatment when considering changes in T, NK and B cell frequencies.<br /> Assessing if IL-6 concentrations were back to baseline levels following treatment would have provided insights into the COVID-19 cytokine storm biology. Patients with higher baseline levels of IL-6 have been reported to have lower CD8 and CD4 T cell frequencies{2}. Correlating IL-6 with cell counts before and after treatment would thus have also been of interest.<br /> The report of the laboratory measures in table 2 is incomplete and should include the frequencies of patients with increased/decreased levels for each parameter.<br /> Correction is needed for the 1st paragraph of the discussion as data does not support NK cell restoration upon treatment in patients who cleared the virus. NK cells remain unchanged after the 1st treatment course and only seem to increase in 2 out of 6 donors after the 2nd treatment course in those patients.
Relevance<br /> Previous reports suggest an association between disease severity and elevated IL-6 or pro-calcitonin concentrations in COVID-19 patients3,4. IL-6 receptor blockade is also being administered to patients enrolled in clinical trials (NCT04317092). This report thus contributes to highlight elevated concentrations of these analytes in COVID-19 patients. Mechanisms underlying the association between viral clearance and restoration of the T cell and B cell frequencies suggests viral-driven immune dysregulation, which needs to be investigated in further studies.
References
- The CHI Consortium et al. Effects of Systemically Administered Hydrocortisone on the Human Immunome. Sci Rep 6, 23002 (2016).
- Zhao, Z. et al. Clinical and Laboratory Profiles of 75 Hospitalized Patients with Novel Coronavirus Disease 2019 in Hefei, China. http://medrxiv.org/lookup/d... (2020) doi:10.1101/2020.03.01.20029785.
- Chen, X. et al. Detectable serum SARS-CoV-2 viral load (RNAaemia) is closely associated with drastically elevated interleukin 6 (IL-6) level in critically ill COVID-19 patients.<br /> http://medrxiv.org/lookup/d... (2020) doi:10.1101/2020.02.29.20029520.
- Lippi, G. & Plebani, M. Procalcitonin in patients with severe coronavirus disease 2019 (COVID-19): A meta-analysis. Clinica Chimica Acta 505, 190–191 (2020).
Review by Bérengère Salomé as part of a project by students, postdocs and faculty at the Immunology Institute of the Icahn school of medicine, Mount Sinai.
-
-
www.medrxiv.org www.medrxiv.org
-
On 2020-03-29 17:21:35, user Sinai Immunol Review Project wrote:
Title: A New Predictor of Disease Severity in Patients with COVID-19 in Wuhan, China
Keywords: disease severity – clinical data – Neutrophils/lymphocytes ratio – CRP – D-dimer
Main findings:<br /> 377 hospitalized patients were divided into two groups: severe and non-severe pneumonia. The laboratory results of their first day of admission were retrospectively analyzed to identify predictors of disease severity.<br /> After adjusting for confounding factors from chronic comorbidities (such as high blood pressure, type 2 diabetes, coronary heart disease, and chronic obstructive pulmonary disease), the independent risk factors identified for severe pneumonia were age, the ratio of neutrophil/lymphocytes counts, CRP and D-dimer levels.<br /> To further increase the specificity and sensibility of these markers, they showed that their multiplication [(Neutrophil/lymphocyte count) * CRP * D-dimer] was a better predictor of disease severity, with higher sensitivity (95.7%) and specificity (63.3%), with a cutoff value of 2.68.
Limitations:This study included 377 hospitalized patients. Among them, 45.6% patients tested positive for SARS-Cov-2 nucleic acid test results, and others were included in the study based on clinically diagnosis even if the molecular diagnosis was negative. Thus, additional studies are needed to verify this on a larger number of covid-19 certified patients and the cutoff value might be adjusted. Also, all the patients that did not have the clinical characteristics of severe pneumonia were included in the non-severe pneumonia group, but usually patients are also divided into moderate and mild disease.
Also, studying different subset of lymphocytes could lead to a more specific predictor. Another study showed that the neutrophils to CD8+ T cells ratio was a strong predictor of disease severity [1]. Another more precise study showed that the percentage of helper T cells and regulatory T cells decrease but the percentage of naïve helper T cells increases in severe cases [2]. Taking these subpopulations into account might make the predictor more powerful.<br /> Other studies also noted an inverse correlation between disease severity and LDH [3] or IL6 [4] levels, but the authors here do not discuss LDH nor IL6 levels, although this could help to strengthen the predictor.
The study is based on the results obtained on the first day of admission, studying the dynamic of the changes in patients might also be interesting to better predict disease severity.
Relevance:This study confirms that the neutrophil to lymphocyte ratio can be a predictor of disease severity as shown by many others [2], [5], [6]. The novelty here is that they show that a combination with other markers can enhance the specificity and sensibility of the predictor, although the study could be improved by taking into account sub-populations of lymphocytes and more biological factors from patients such as LDH and IL6.
References:<br /> 1. Longitudinal characteristics of lymphocyte responses and cytokine profiles in the peripheral blood of SARS-CoV-2 infected patients | medRxiv. https://www.medrxiv.org/con.... Accessed March 29, 2020.<br /> 2. Dysregulation of immune response in patients with COVID-19 in Wuhan, China | Clinical Infectious Diseases | Oxford Academic. https://academic-oup-com.do.... Accessed March 29, 2020.<br /> 3. Clinical findings in critical ill patients infected with SARS-Cov-2 in Guangdong Province, China: a multi-center, retrospective, observational study | medRxiv. https://www.medrxiv.org/con.... Accessed March 29, 2020.<br /> 4. Mortality of COVID-19 is Associated with Cellular Immune Function Compared to Immune Function in Chinese Han Population | medRxiv. https://www.medrxiv.org/con.... Accessed March 29, 2020.<br /> 5. Clinical Characteristics of 138 Hospitalized Patients With 2019 Novel Coronavirus-Infected Pneumonia in Wuhan, China. - PubMed - NCBI. https://www-ncbi-nlm-nih-go.... Accessed March 29, 2020.<br /> 6. Neutrophil-to-Lymphocyte Ratio Predicts Severe Illness Patients with 2019 Novel Coronavirus in the Early Stage | medRxiv. https://www.medrxiv.org/con.... Accessed March 29, 2020.
Review written by Emma Risson as part of a project of students, postdocs and faculty at the Immunology Institute of the Icahn school of medicine, Mount Sinai.
-
-
www.medrxiv.org www.medrxiv.org
-
On 2020-06-04 17:10:24, user Mandy Lyons wrote:
"only 37.4% of suspected SARS-CoV-2 patients seroconverted"<br /> 1) What are the criteria for suspected SARS-CoV-2 patients?
2) Do these suspected cases have SARS-CoV-2, or do they have an infection which mimics SARS-CoV-2?<br /> 3) Is the test testing for the test? I.e. is there something functionally different in the infection causing presumed cases which, if it actually is SARS-CoV-2, would cause the antibody test to be inaccurate?<br /> 4) Is there another illness circulating which mimics SARS-CoV-2 which has heretofore not been identified?<br /> 5) Is there any follow-up or investigation on these negative antibody cases in both the confirmed and suspected cases?
-
-
www.medrxiv.org www.medrxiv.org
-
On 2020-05-18 16:23:32, user Daniel Connelly wrote:
From the beginning, it was known that Zinc is the active portion of the HCQ & Zinc combination. The HCQ was necessary to increase intracellular Zinc to block viral replication. The organizers of this study are both brave and brilliant.....but they also were not fully truthful. They called it a retrospective study when it is really a prospective study. The experimental arm was with Zinc and the control was without Zinc. The cohorts for the 2 arms were well matched and the regimen standardized. HCQ was not officially part of the study as it was dosed the same in both cohorts. <br /> Why would they need to organize the study this way? IMO, because they would have been blocked from doing a prospective study around HCQ. That is to dirty politics that good physicians are fighting against to save lives.<br /> What does this "prospective" study of "Zinc" show????<br /> 1. All other studies which did not use Zinc along with HCQ are at best, irrelevant and at worst, fraudulent.<br /> 2. HCQ with or without Zinc is useless in severely ill ICU patients.....as expected.<br /> 3. Zinc with HCQ was effective early to increase recovery and prevent death....as expected.<br /> 4. The study strongly supports the proposed mechanism of action of HCQ as a zinc ionophore.
What we don't know:<br /> 1. How effective is HCQ + Zinc + Azithromycin when given in the ambulatory setting with the onset of symptoms?<br /> 2. How many hospitalizations would be avoided? Deaths?<br /> 3. How much is the transmission R0 value reduced for patients on this drug combo, especially in closed environments like nursing homes? How much is the environmental viral load decreased?
-
-
www.medrxiv.org www.medrxiv.org
-
On 2020-04-23 15:26:33, user Razvan Valentin Florian wrote:
According to https://jcm.asm.org/content... , the concentration of virus RNA in feces is about 4 x 10^3 RNA/ml undiluted, i.e. of the order of 10^6 RNA/l. Assuming a factor of dilution of 10^-2 of feces in wastewater, a factor of disintegration of less than 10^-1 of RNA on the way from toilet to collection point, and a factor of prevalence in the population of less than 10^-2, this leads to less than 10^1 RNA/l in wastewater at the collection point. The preprint mentions that "the quantification limit was 10^3 equivalent viral genomes per liter" and the graph indicates that they found 10^4-10^7 eq/L (probably equivalent RNA/l). This seems implausible according to the previous back-of-the-napkin computation. I would be happy if this estimate is invalidated, since if measuring concentration of virus RNA in wastewater would be possible, this would be a great tool for the management of the epidemic.
-
-
www.medrxiv.org www.medrxiv.org
-
On 2020-04-24 09:57:00, user Philip Davies wrote:
Well, well well,
This pre-print would make a good script for an episode of Columbo.
The retrospective analysis, as presented, leads the reader to just one conclusion in a bazaar of many possible conclusions.
I am even starting to have sympathy with D. Raoult and his team. I note his hot tempered response to this paper, where he lists two enormous factors that should be considered when wrestling with the data: the fact that the HCQ and HCQ & AZ cohorts were a sicker crowd (he lists lymphopenia) and that the sickest of the non-HCQ ventilated patients were then given HCQ (plus AZ in most cases) in a desperate last bid only for most to die.
Raoult's point is certainly valid.
We must remember that for most of the study period the use of HCQ was "ex-license" on a compassionate basis only. This means only the sickest patients got it. Remember also that this is a retrospective analysis, therefore observational. It was not run as a therapeutic trial. On the other hand, the use of AZ was already accepted (hence 30% of the non-HCQ cohort got it anyway).... although do be aware that by this time there had been quite a lot of focus on potentially dangerous QT lengthening when HCQ and AZ were used together in very sick patients.
The HCQ cohort was, across all key determinants, the weakest and sickest group (it had the poorest prospects looking at age, ethnicity, smoking status, congestive heart failure, peripheral vascular disease, cerebrovascular disease (strokes),dementia, COPD, Diabetes (with and without complications)! ... and indeed, the HCQ and HCQ & AZ cohorts did have 100% more lymphopenia than the non-HCQ group.
BUT, the big asymmetric issues become obvious when we look at the pre- and post- ventilator numbers.
In terms of patients discharged without needing ventilation, the "victorious" non-HCQ group performs poorer than the 2 treated groups. This despite having a better prognostic baseline. But the results for this group change dramatically (for the better) when we look at the outcomes of ventilation. 25 ventilated patients came from this group.... but 19 of these 25 patients were then started on HCQ or HCQ & AZ after ventilation was started. It is screamingly obvious that these would be the sickest patients in that group: they were given such compassionate drugs in extremis. So having ejected 19 of 25 ventilated patients into the other cohorts, the non-HCQ group only had 3 deaths from its remaining 6 ventilated patients.
The numbers of ventilated patients in the other cohorts (HCQ and HCQ & AZ) were thus substantially inflated with these new super-sick patients, who mostly died.
There really can be no conclusion at all when looking at a study of this nature without knowing much more about individual clinical conditions and guiding principles behind clinician's decision making. It's still possible to make some reasonable assumptions:
If I were Columbo?... I would say the non-HCQ cohort contained patients of extremes, with the best and worst potential. The worst would have been the very frail (malignancy and or congestive heart failure maybe ... see the stats), who probably were earmarked for 'supplemental oxygen' only from the very start. Such patients would not have been suitable for compassionate use of non proven drugs (remember, most of this came before the "emergency use" edict by FDA). This would explain the number of non-ventilated patients who died in this group (they may have been given AZ only, not being a controversial drug, but otherwise they did not get any significant interventional therapy). These patients would have had significant chronic disease and very poor obs/indices (including lymphopenia). But given that this cohort had, overall, a better starting prognosis than the other two groups, it means that the remaining patients in the group were promising candidates for survival (with better obs/indices). Such patients, not being part of a clinical trial, would not have been offered HCQ on a compassionate basis unless they got dramatically worse .... and of course, the ones who did get worse on the ventilator were started on HCQ (& often AZ as well) and thus swapped into the HCQ / HCQ & AZ cohorts.
If we can understand that, then we might start to think that in fact HCQ & AZ is the best performing cohort with the other 2 vaguely distant. But this is being unfair to the HCQ cohort:
The reason that a sick patient would be given one experimental drug on a compassionate basis (HCQ) but not have a rather less experimental drug further added (AZ), can really only be explained by considering risk versus benefit. A clinician would choose to use HCQ because the patient was particularly sick. The clinician would only add AZ if it was felt that this was worth the risk.... but a particularly sick patient with significant cardiovascular disease (the HCQ contained the most CVD risk) might then die of a more abrupt arrhythmia through adding yet another QT lengthening drug. I dare say the clinicians were tempted to make some "Hail Mary" plays, but we must remember, these patients were not part of an ongoing trial, these drugs were "ex-license" for compassionate use only and clinicians were still accountable for responsible actions. So for those particularly sick frail patients, it wasn't worth the risk.
I am pretty sure that the HCQ cohort (which had pretty good pre-ventilator stats) crashed badly because it was loaded with the sickest patients .... patients that were too sick to risk adding AZ.
So, the findings of this retrospective analysis are, in my opinion, likely to be incorrect.
I believe I can confidently state that:
- The HCQ cohort started with the sickest patients and had even more of the sickest added during ventilation. Some were too sick to risk the addition of AZ to existing HCQ.
- The HCQ/AZ cohort also had some very sick patients (again with more additions during ventilation).
- The Non-HCQ cohort had the best prognosis overall from the very start (although likely a polarized mixture of the most frail and the most promising)... and then its stats got even better when it jettisoned its sickest ventilated patients into the other 2 cohorts.
It is almost impossible to reach a conclusion from all this. BUT, the most likely finding is NOT that adding HCQ delivers a worse outcome than standard treatment. In fact, if we look at the pre-ventilator stats, the addition of HCQ might actually have provided considerable benefit to a particularly sick group of patients. Whether or not the addition of AZ to HCQ adds benefit is also unclear ... although my 'swingometer' is pointing slightly more to benefit than harm.
Once again. I suggest that a robust study into prophylaxis and early treatment (using sensible safer doses adjusted for pulmonary sequestration) will deliver the most interesting results for CQ/HCQ.
Dr Phil Davies<br /> Aldershot Centre For Health<br /> http://thevirus.uk
EditView in discussion<br /> Discussion on medrxiv 3 comments<br /> medrxiv viewer<br /> Philip Davies<br /> Philip Davies 4 days ago<br /> The low dose arm of this study is worth following.
The big problem for this study is comparison. It really has not defined the control population at all. The Italian and Chinese references are entirely different. Even the 2 Chinese populations referenced had massively different outcomes because the populations examined were different.
The Italian mortality rate was actually similar to the overall study average here (but much higher than the low dose arm). The Chinese study involved all patients admitted to the two hospitals ... that included a majority of patients with moderate ("ordinary" as the Chinese class it) disease severity. The patients in this Brazilian study were regarded as severe or critical ... such patients (looking at worldwide stats) would attract a mortality of 30-40% plus.
This is the most important factor. Do not compare apples with pears. So far this study points the "swingometer" in favor of benefit versus harm for the use of HQN in patients with advanced disease.
Once again however, we are looking at the potential impact of an orally administered drug to patients with advanced disease. That's a big ask.
For CQ and HCQ the most interesting results will likely come from studies looking at prophylaxis and early treatment (using safe doses, not silly high doses with added drugs that also lengthen QT). We can't yet guess how they will pan out.
Dr Philip Davies<br /> GP<br /> Aldershot Centre For Health, UK<br /> http://thevirus.uk
-
On 2020-04-24 01:46:41, user Mike wrote:
Note: the original version has been previously discussed at length. medrxiv is redirecting that paper to v2 (this paper), making those comments are no longer available. This is a link to those comments: https://disqus.com/home/dis...
Below is my original comment with updates for this version of the paper
This was certainly an interesting paper. They’ve done a lot of work and the findings are notable. IMHO it warrants as much attention as the original pro-HCQ study via Dr. Raoult (~3/15). While it is entertaining, I will add that it is not conclusive, nor without fault. A double-blind study is still required.
It is important to note that this is version 2 of a previously released paper and it is much the same, with no major differences in the conclusions reached compared to v1. Therefore, my previous comment still holds true. Below I’ve included them followed by a new list of observations.
Observations/Questions (updated)
1. "hydroxychloroquine, with or without azithromycin, was more likely to be prescribed to patients with more severe disease” (p.12)<br /> 2. “as expected, increased mortality was observed in patients treated with hydroxychloroquine, both with and without azithromycin” (p.12) — I assume it’s expected because the patients given drugs were in a more severe state (and more likely die regardless of treatment)<br /> 3. "we cannot rule out the possibility of selection bias or residual confounding” (p.13)<br /> 4. demographic: 100% male, 66% black, median age ~70 (59 youngest); (Table 2, p.17)<br /> 5. uses PSM, which despite a common practice, could be considered controversial (https://gking.harvard.edu/f... "https://gking.harvard.edu/files/gking/files/psnot.pdf)")<br /> 6. Unless I missed it, I didn't see any specifics about how the treatments were administered.<br /> - How long before death were patients treated?<br /> - What was the quantity/frequency/duration of the treatments?<br /> - Were the treatments consistent between hospitals?<br /> 7. The rate of ventilation was less in HC+AZ (half of the HC and no-HC rates). Why was that? What does that suggest?<br /> 8. Although they were statistically insignificant, what was the result of the 17 women not included in the study?<br /> 9. Why does the paper seem to address political points? It seems like the Abstract is editorialized, which I'm not used to. The result seems to address topical issues of the times, having awareness of other similar studies being conducted, rather than a standalone independent study of its own. I interpret this as potential for some analysis/deciphering bias. I don't mind in the Discussion sentence as it's normal, I'm just not as accustomed to seeing it in the Abstract.
New List of Observations
1. There seems to be some bias in the number of healthy people with no-HC treatment, but left in the study. Those people are going to be unlikely to die to begin with. This is not a comparison of apples to apples.??
To clarify:<br /> ?- Dramatic difference in percentage of people people that had fever temperatures (38.1-39.0ºC / 100.58-102.2ºF); HC:11.3%, HC+AZ:11.5%, no-HC:7.6%. There’s ~4% difference between treated and untreated fever temps (more likely to die) in favor of untreated cohort. ?<br /> - Compare that with the percentage of people that had normal temperatures (35-37ºC/95-98.6ºF);HC:56.7%, HC+AZ:52.2%, no-HC:61.4%. There’s a 5-9% difference between treated and untreated normal temps (likely to not die) in favor of untreated cohort.
??So in this study, there was a larger proportion of people that did not have fevers, suggesting the data may be padded. In absolute numbers it's approx. a 40 person swing, which is a fairly large percentage in such a small study/survey. Similar observations are for systolic blood pressure and breaths per minute. There appears to be more healthy people? again.
2. Creatinine is created when muscles breakdown creatine. It’s a waste product removed by the kidneys. Levels are elevated when the kidneys begin to fail. Notice, there’s a much larger presence in the HC-groups, which suggests there was a larger percentage of these patients experiencing kidney failure.?
3. There are an awful lot of missing data in solely the no-HC group for statistically significant criteria. For instance Erythrocytes (red blood cells that transport oxygen), there 11.4% (!) missing in no-HC patients, yet that category has a P-value of 0.001 (<0.05 is statistically significant).??
Hermatocrit is the same way (missing 11.4% for no-HC). It’s also related to red blood cells, it is the ratio of red blood cells to the blood volume. Same missing amount for Leukocytes (white blood cells) test. And also Lymphocytes —white blood cells in lymphatic system, which transports fatty acids from the digestive system and white blood cells from the lymph nodes into the bones— not only has a lot of missing data, but the disproportional low count (<800 per mm^3) may warrant further investigation.
4. Even looking at the statistically significant Cerebrovascular disease, there are a much larger percentage of HC-only patients per its cohort.?
5. Table 4 describes a greater percentage of people using HC+AZ being discharged (recovering) w/o ventilation; 5% more than no-HC patients. Keep in mind that 30% of the no-HC patients were given AZ.
-
On 2020-04-28 00:30:59, user Mark Reeder wrote:
I am advocating that the authors, in the interest of public health, fill in the blanks of the following statement:<br /> "It was found that ___ of the 7 patients reclassified from the 'No HC' to the HC group (after ventilation began) died. Likewise, ___ of the 12 patients reclassified form the 'No HC group' into the 'HC+AZ' group died."<br /> Based on a comparison of Tables 4 and 3, the first blank must be either 6 or 7 whereas the second blank must be between 7 and 12, inclusive.
If the groups are compared based on whether they were given the drug(s) PRIOR to ventilation or prior to discharge, the HC+AZ is better by either a 20% margin over the 'No HC' group or by a FACTOR of 6. <br /> To wit, let's assume that all 12 of reclassified as HC+AZ died. That would mean that only 2 in the original HC+AZ group died. Since we have no idea when the HC+AZ drug was administered to those who died without ventilation, a fair comparison would show that HC+AZ, one might justifiably count only the 2/90 (2.2%) in that group (excluding deaths w/o vent.) as having had HC+AZ early enough in treatment. It would also mean that 3+(6 or 7) + 12 out of 162 (13.6%, also excluding deaths prior to ventilation) eventually died. <br /> This would be a huge difference with HC+AZ coming out as a terrific alternative (factor of 6 better) if given early enough. By the same logic (pre-vent treatment only, excluding non-vent deaths), the worst case for HC+AZ would still mean a 20% IMPROVEMENT over the control group! <br /> But we cannot know unless the authors (or others) are ethical and transparent enough complete the sentence above. Even if they disagree with the foregoing analysis, what is the downside in providing those numbers?<br /> I understand the difficulty of dealing with imperfect data. But for that very reason, good science demands that all information be placed on the table.
-
-
www.medrxiv.org www.medrxiv.org
-
On 2020-05-06 08:05:15, user Prof Pranab Kumar Bhattacharya wrote:
Dear Editor<br /> In the world, Corona virus cases jumped up till 3rd May 2020 from December 2019 is 3,51,743 with death 2,45,617 (18%) and 31.5 death per one million people of infected.Almost 212 countries worldwide and most affected countries are USA,( death rate 304, followed by Spain (540),Itali 475, UK 414, France 379 per million population when in India total cases of positive by RT PCR is 40,266 death 1300 per one million people and in West Bengal province of India total infected is 963 with death 48 cases as per ministry of health government of India records on covid 19. The question is why such a huge percentage of death from this dangerous virus ( no more should be considered simple like influenza virus) inspite of lockdown, social distancing ventilation guided treatment protocol for mild moderate and severe pneumonia from covid 19?<br /> Mortality from covid 19 is higher in groups at higher risks of thromboembolism including hypertension, types 2DM, obesity, coronary artery disease ,cardiomyopathy, pre existing renal pathology as co morbid condition known to all. It has been also seen world wide that the risk of thromboembolism ( both venous and arterial) are more likely to occur when patients are admitted at ICU or in PEP ventilation, ànd in aged over 60 yrs( approximately 63% of death in India from covid 19).<br /> What did the autopsy studies revealed of these death, though very limited autopsy were performed with covid 19 death as the virus is HG 3 category virus. Brane Hanely (1) eral published in journal of clinical pathology of BMJ group showed histopathology of lungs on HE stain oedema, Type Ii pneumocytes hyperplasia,large pneumocytes with ground glass viral inclusions bodies focal inflammation, multinucleated giant cells,when no hyaline membrane ( a histopathological features of ARDS) diffuse alveolar damage. The pulmonary vessels showed hyaline necrosis with thrombus formation and capillary congestion.inflamatory infiltrate composed of alveolar macrophages in alveolar lumen and lymphocytes in interstitium. Zhe Xu et Al (2) in journal Lancet reported also one 50 year old man died on day 14 of covid 19 after being treated with lopinovir+retinovir+moxiflixain and high nasal cannula oxygen therapy and niddle autopsy of lungs liver and heart tissue showed diffuse alveolar damage with cellular fibrimyxiod exudate,dissquamation of pneumocytes and hyaline membrane formation (sign of ARDS) , interstitial mononuclear inflammatory infiltrate dominated by lymphocytes ( CD8) multi nucleated syncitial giant cells, atypical pneumocytes and microvascular thrombosis in pulmonary vessels (2).Sufang Tian et Al (3) did post mortem needle core autopsy of four patients who died of severe covid 19 pneumonia and patients age range were 59-81 years and time of death 15-52 days were in ventilation. Histology of their finding in lungs were again diffuse injury to alveolar epithelial cells, hyaline membrane formation, hyperplasia of type II pneumocytes , diffuse alveolar damage and consolidation by fibroblasts proliferation with extra cellular fibrin forming clusters.All these tour cases had vascular congestion with intravascular thrombus suggesting an acute phase components reaction and fibrinoid necrosis of blood vessels.The autopsy finding of heart was that endocardia and myocardia didn't contain inflammatory cellular infiltrate, although focally myocardium appeared irregular in shape with darkened cytoplasm and fibrinoid necrosis of blood vessels in myocardia.There were various degrees of focal oedema interstitial fibrosis and myocardial hypertrophy which suggests patients had underlying hypertension associated with hypertrophy or past ischemic injury. A large series of 38 cases of autopsy of lung by Luca carsana etall (5) showed from death cases of covid 19 in northern Itali on H&E stain showed also diffuse alveolar damage, capillary congratulations, necrosis, necrosis of pneumocytes, hyaline membrane, interstitial oedema,type II pneumocytes hyperplasia, platelet fibrin rich thrombus(5) .Electron microscopy showed viral particles within cytoplasmic vaccoule of pneumocytes.<br /> So from above post mortem studies, besides ARDS like pictures in terminal event , platelet fibrin rich thrombosis of pulmonary vessels, myocardial vessels, hyaline necrosis of blood vessels of both lungs and of myocardium are prominent picture along with endothelial dysfunction according to this author.The severe cases of pneumonia from covid 19 also shows increased D Dimer value (4) prognostically bad , increased c reactive protein, increased pro calcitonin and increased FDP value<br /> All these suggest to me that pathogenesis behind so many death in ventilation or at ICU of covid 19 patients are not ARDS itself but some kinds of coagulopathy or DIC occurred before death in severe pneumonia cases<br /> Though lymphopenia, inflammatory cytokine stroms ( raised IL6,raised TNF are for cytokine stroms)are typical abnormalities described in almost all literature in highly pathogenic Covid 19 infection with disease severity ,only one rapid response in BMJ (4) suggest , based on post mortem finding use of low molecular weight heparin (LMWH) to be included in the treatment modules of covid 19, particularly those who have high D Dimer high FDP value in serum though TT,APTT,PT,INR may not show any significant difference.use of heparin therapy with constant monitoring for bleeding manifestation should be instituted in patients showing clinical signs of turning towards severe pneumonia,along with antiviral therapy with remdesvir (within 7 days onset of symptoms at scheduled disease)<br /> If the pathology behind the death of severe pneumonia in covid 19 patients is DIC ( according to Autopsy finding the pneumocytes are not killed or destroyed by the virus nor by cytotoxic T cells, rather proliferation occur with much viral replication and virus load) there will be DIC , vascular congestion, thrombosis there will be AMI stroke ) then treatment at ICU with ventilation become useless unless if thromboembolism is not resolved first with LMWH infusion <br /> Referencs <br /> 1) Brain Hanley, Sebastian B Lucas,Esther youd,Benjamin swift,Michael Asbron "Autopsy in suspected covid 19 cases " JCP 73,(5):2020 http://dx.doi.org.10.1136/jclinpath-2020-20652<br /> 2) Xu Z,Shi L,Wang y eral "Pathological finding of covid 19 associated with acute respiratory distress syndrome " The Lancet respiratory medicine 8 (4):420-22 :2020<br /> 3) Sudan Tian, young xiong,Shu yuan xiao,Liu H et all "Study of 2019 novel Corona virus disease ( covid 19) through post mortem core biopsy" Modern pathology (Nature.com ) 14 th April 2020 http://doi.org/10.1038/s 41379-020-0536-<br /> 4) William Atenio ,Nadu Okonkwo "should prognostic models for covid 19 not also incorporate markers of thrombosis" Rapid Response published BMJ on 14th April 2020 to article"Prediction model for diagnosis and prognosis of covid 19 infection: systematic Review and clinical analysis" The BMJ 2020:369:m1328 published on 7th April 2020 https://doi.org/10.1136/bmj...<br /> 5)Luca carsana, Aurelo sanzogoni ,Ahmed Nast, Roberta Rossi etall"pulmonary post mortem finding in a large series of covid 19 cases from northern Itali" MedRxiv https://doi.org/1101/2020.0...
-
-
www.medrxiv.org www.medrxiv.org
-
On 2020-05-29 18:32:49, user Sinai Immunol Review Project wrote:
Main Findings<br /> The authors analyzed and compared the stability of viable SARS-COV-2 and SARS-CoV-1 inoculums in five environmental conditions (aerosol, copper, cardboard, steel, and plastic) by using Bayesian regression model. It was reported that SARS-COV-2 was still detected in aerosols at 3 hours, with an exponential reduction in infectious titer that was similarly observed for SARS-CoV-1. The study also concluded that both SARS-COV-2 and SARS-CoV-1 are more stable on stainless steel and plastic than cardboard and copper. Viable SARS-CoV-2 was detected up to 72 hours on stainless steel and plastic. On copper and cardboard, SARS-COV-2 was viable up to 4 hours and 24 hours, respectively, compared to SARS-CoV-1 which could be detected up to 8 hours on both material types. The half-lives between both viruses are similar, except for on cardboard.
Limitation of the study<br /> The strain used in the study was SARS-COV-2 nCoV-WA1-2020 (MN985325.1) from the first case of 2019 novel coronavirus in the US. However, mutation throughout the course of the pandemic is inevitable and may cause unpredictable consequences on its transmissibility and disease severity. Thus, follow-up on samples from various patients in different geographic and temporal time points should be conducted.
Significance<br /> The results support that modes of SARS-COV-2 transmission can be attributed to both aerosol and fomites, due to extended viability for hours in aerosol and up to 72 hours on stainless steel surfaces. The types of plastic, cardboard, copper, and stainless materials were selected to reflect typical hospital and household situations. It is important to compare with the SARS-CoV-1 as similarities between the two suggests methods of mitigating the pandemic by abrogating transmission both in the community and hospital.
Review by Joan Shang as part of a project by students, postdocs and faculty at the Immunology Institute of the Icahn School of medicine, Mount Sinai.
-
On 2020-03-16 16:32:43, user Bill Keevil wrote:
Although not peer reviewed yet, this work is not surprising because we showed long term survival of the similar coronavirus 229E on plastics, ceramics, stainless steel and glass for 4-5 days; the virus was inactivated on copper in just minutes and its RNA destroyedhttps://mbio.asm.o.... Another group showed SARS survived 5 days on stainless steel. We and others also showed flu survives several days. Implications are that in a closed environment a potentially infectious aerosol of small particle size can remain suspended in air for some time before landing on surfaces – hence being outdoors or opening windows is probably a good thing. It might question whether the 2 metre gap between people is sufficient in a confined space. As I have said before, survival of coronaviruses for days on touch surfaces (not the 2 hours cited by some advisers) is a hygiene risk, and it is difficult to avoid touching door handles, stair rails, public touch screens etc. It re-emphasises the need for good personal hygiene such as washing hands rigorously throughout the day, or using an alcohol hand gel, and avoid touching the eyes, nose and mouth.
Because this is a pre-print it is difficult to know exactly what they have done. Clearly they are using a different virus and culturing in Vero-E6 kidney cells while we used MRC-5 lung cells. An important difference may be that in their 2003 MERS paper they used 100ul culture onto unspecified size surfaces (“washers”) –McMaster-Carr, USA); for the new paper where they say they used 50ul of virus then we know that this can take a long time to dry out. Copper alloys kill bacteria and viruses when dry due to the inactivation mechanisms we have published. Our method to simulate hand contact uses 20ul onto 1 square cm, spread over the surface and then dries out in several minutes; sometimes we use 1ul when we have high concentrations of pathogen available.
Perhaps more importantly, our cells were maintained in minimal essential medium (MEM) supplemented with 1mM GlutaMax-1*, nonessential amino acids, and 5% fetal calf serum and incubated at 37°C and 5% CO2. Their cells were maintained in Dulbecco’s Modified Eagle Medium (DMEM; Sigma) supplemented with 2% fetal calf serum (Logan), 1 mM L-glutamine (Lonza), 50 U/ml penicillin and 50 µg/ml streptomycin (Gibco).
*(GlutaMAX™-1 (Gibco), L-alanyl-L-glutamine, is a dipeptide substitute for L-glutamine. GlutaMAX™-1 can be used as a direct substitute for L-glutamine at equimolar concentrations in both adherent and suspension mammalian cell cultures with minimal or no adaptation. GlutaMAX™-1 is highly soluble, heat-stable, and improves growth efficiency and performance of mammalian cell culture systems. GlutaMAX™-1 eliminates problems associated with thespontaneous breakdown of L-glutamine into ammonia during incubation, allowing for longer lasting cultures. )
Importantly, glutamine binds copper while it also spontaneously breakdowns at physiological pH to ammonia which reacts with copper to precipitate light blue Cu(OH)2. This would give a partial passivation effect, making the copper surfaces less antiviral while our GlutaMAX-1 would not; hence explaining their longer time for copper inactivation.
This is one of the reasons we decided GlutaMAX-1 was the better option to avoid subsequent potential copper binding problems in the surface contact experiments.
-
-
www.medrxiv.org www.medrxiv.org
-
On 2020-06-10 01:57:51, user Sinai Immunol Review Project wrote:
Main findings<br /> To improve understanding of the cellular changes in the T and B cell compartments of COVID-19 patients, both during and after disease, Fan et al. analyzed lymphocytes isolated from the PBMCs of 4 severe COVID-19 patients (n=4), 6 COVID-19 recovered patients (n=6), and 3 healthy controls (n=3). Of note, 3 recovered patients' samples were collected 7 days after a negative SARS-CoV-2 test (recovery-early stage; RE) and absence of clinical symptoms, whereas the other 3 samples were collected 20 days after these criteria (recovery-late stage; RL). The authors used single-cell RNA sequencing and single-cell V(D)J sequencing to perform their analysis.
The authors identified 9 classes of T cells, which included 4 sub-classes of CD4+ T cells and 5 sub-classes of CD8+ T cells. Not surprisingly, across severe COVID-19 patients, the proportion of T cells was reduced, compared to healthy controls. However, differential gene expression analysis revealed that T cells from severe COVID-19 patients highly expressed inflammatory markers, including IFNG and GZMA. Interestingly, when compared to these patients with active disease, RE samples showed significant enrichment of ICOS+ TH2-like follicular helper T cells (TFH), whereas RL samples showed a reportedly significant enrichment of a cluster identified as TH1 cells, though this result should be revisited for review (See biological limitations). These cell types were, in fact, reduced in severe COVID-19 patients. Generally, these T cells from recovering patients continued to indicate persistent activation and counter-regulation, based on expression of TCR activation-associated genes, including RNF125 and PELI1. Subsequent trajectory analyses of transcriptional dynamics indicated transition of effector CD8+ T cells to central memory T cells in RL patients. Ligand-receptor analysis revealed potential interactions between TH1 cells and CD14+ monocytes in severe COVID-19 patients. Finally, TCR sequencing identified several VJ combinations in high frequencies in severe COVID-19 patients, but not others.
Within the B cell compartments across patients, the authors identified 9 clusters of naive B cells, 2 clusters of memory B cells, 2 clusters of plasma B cells, and a cluster of plasmablasts. Of these clusters, one, in particular, expressed genes characteristic of FCRL5+ atypical memory B cells, which have been described to be induced by viral infections. Interestingly, ligand-receptor analyses of the clusters in each group of patient samples identified different degrees of TFH cell and B cell interactions, suggesting different stages of T cell help for B cell activation. Subsequent BCR characterizations revealed the presence of homogenous monoclonal and heterogeneous clonally expanded B cell populations; the latter population exhibited an enrichment of B cell activation genes. The authors, then, compare across patients to evaluate T and B cell clonality based on V(D)J recombination analyses of RE and RL patient samples (See technical limitations).
Interestingly, cytokine expression analysis revealed IL-6 expression by B cells. In contrast, B cells expressed IL12A in RE patients, while effector memory CD8, proliferative CD8, and CD4 T cells and plasma B cells highly expressed IL16 in RL patients. The authors report additional cytokine (and cellular) characteristics that distinguish severe COVID-19 patients and recovering patients.
Limitations<br /> Technical<br /> A primary technical limitation is the sample size of this study for each group. There is little clinical information about the patients and no details about disease severity in patients recruited after viral clearance. For example, age and CMV status have a huge impact on the TCR repertoire, therefore clinical data on the different groups should be presented. Moreover, without additional information on the clinical management of the severe COVID-19 patients and what therapies were given to the recovering COVID-19 patients, it is difficult to compare the cellular changes in the immune landscapes of the COVID-19 patients across samples. Longitudinal analysis would have been more informative especially with regards to repertoire analysis and how expanded clones during active infections might differentiate into particular phenotypes after viral clearance.CD8 expression should have been included in the violin plots, as it is usually more robust and reliable than CD4 expression.
Biological<br /> An immediate concern is whether the authors mis-characterized cluster 13 as a TH1 cell cluster. The cluster exhibits a low expression of CD3G and CD4. It’s neighboring clusters within the hierarchy belong to monocyte groups, so it is unexpected that a T cell subtype would be belong to their branch of the hierarchy tree. Consider also cluster 38, which shows more robust expression of CD3G and NKG7 and is arranged with the B cell group.
In addition, the authors did not highlight or discuss expression of co-inhibitory receptors that could elucidate the heterogeneity of T cell differentiation during COVID-19. As a result, it is difficult to truly assess the activation status of the CD8+ cytotoxic T cells and whether there are features of T cell exhaustion.
Finally, the distinction between naïve and some subsets of memory T cells by scRNA analysis can be challenging. It would be important for the authors to explore whether cluster 26, classified as a naïve CD8 T cell cluster predominant in RL group could be actually memory cells. It would have been important to show clonal diversity of the different clusters.
Significance<br /> In summary, Fan et al. provide a comparative analysis of lymphocyte changes between PBMCs of patients with ongoing COVID-19 progression and of patients recovering from the disease. Using a combination of single-cell RNA sequencing and V(D)J recombination sequencing, the authors describe specific changes in T and B cell subpopulations over the course of early and late-stage recovery.
This review was undertaken by Matthew D. Park as part of a project by students, postdocs and faculty at the Immunology Institute of the Icahn school of medicine, Mount Sinai.
-
-
www.medrxiv.org www.medrxiv.org
-
On 2020-06-15 01:10:48, user Serge wrote:
There are many inaccuracies in the report that may significantly affect the conclusions.<br /> 1. Diamond Princess analysis: the mortality data (in single digits) is not sufficient for a confident estimate of the mortality per jurisdiction (for some nations there was only a single case). Moreover, most countries started universal BCG vaccination around 1950s plus the effect of WWII would likely compromise any earlier program to a significant extent. That means that regardless of the country of origin, large part of over 70 population would not be protected and thus shouldn't be considered in verification of the hypothesis.<br /> 2. Certainly there can be no expectation that the protection effect would extend equally into a very advanced age, 60 years and longer after vaccination.<br /> 3. What is meant by the statement "BCG was provided mostly in Europe"? This is plain incorrect, please check "BCG World Atlas".<br /> 4. Country analysis: was the population taken into account? It is not clear from the description of diagrams. I would advise to attempt to calculate mortality per capita, from the most current data and compare it between jurisdictions at a similar period of exposure. Note that all countries with the highest M.p.c. adjusted for the time of exposure, never had a BCG program (or equivalent as in Spain where it was provided for 18 years out of 70) there's simply not a single exception.
-
-
www.medrxiv.org www.medrxiv.org
-
On 2023-12-19 12:39:03, user Christos Proukakis wrote:
Response to: “Is Gauchian genotyping of GBA1 variants reliable?”
Marco Toffoli1,2, Anthony HV Schapira1,2, Fritz J Sedlazeck2,3,4, Christos Proukakis1,2 *
- Department of Clinical and Movement Neurosciences, Queen Square Institute of Neurology, University College London, UK
- Aligning Science Across Parkinson’s (ASAP) Collaborative Research Network, Chevy Chase, MD 20815, USA
- Human Genome Sequencing Center, Baylor College of Medicine, Houston, TX, USA
- Department of Molecular and Human Genetics, Baylor College of Medicine, TX, USA
* To whom correspondence should be addressed: c.proukakis@ucl.ac.uk
We recently described two methods for GBA1 analysis, which is hampered by the adjacent highly homologous pseudogene: Gauchian, a novel algorithm for analysis of short-read WGS, and targeted long-read sequencing 1. Tayebi et al have applied the former to WGS from 95 individuals, and compared it to Sanger sequencing 2. They report concordant genotypes in 85, while 11 had discrepant calls (we note that this leads to a total of 96). In addition, they report 28 false Gauchian calls in 1000 Genomes Project (1kGP) samples. Gauchian was developed because the homology of the GBA region requires a short read variant caller that does not rely solely on read alignments, and can identify specific variants known to be pathogenic. To understand the cause of these discrepancies, we reviewed their data, and conclude that they are mis-interpreting Gauchian results in 8 of the 11 discrepant samples, and incorrectly using Gauchian to analyze low-coverage 1kGP samples.
Among the 11 (11.5%) samples with inconsistent calls with Sanger (Table 1), four (Pat_08, Pat_26, Pat_28 and Pat_58) were not called as the variants are not on Gauchian’s target list, which includes all ClinVar variants in December 2021. These variants, and any others, can be easily added (see Supplementary Information). Three other samples (Pat_75, Pat_76 and Pat_79) had low data quality resulting in large variation in sequencing depth across the genome, as shown by the median absolute deviation (MAD) of genome coverage: 0.269, 0.128 and 0.127 (three highest values among all samples). Gauchian recommends trusting calls in samples with MAD values <0.11, and produces a warning message if this is exceeded. In all three samples, the GBA1+GBAP1 copy number was a no-call (marked as “None” in the output file), indicating that Gauchian could not determine the copy number due to high coverage variation. Variants were not called because no further analysis was done beyond copy number calling. These should not be viewed as false negatives, as the warning message and the report of no-calls should prompt the user to obtain higher quality data or consider alternative sequencing. Among the remaining 4 samples with inconsistent results: Pat_03 had a Gauchian call of heterozygosity for p.Asn409Ser, while Sanger reports this as homozygous. Review of the IGV trace (Tayebi et al. Supp Figure 1) shows that at least 10 reads (around a fifth of the total) have the reference base, and therefore it is hard to conclude this is homozygous. Review of the Sanger trace (not provided) could determine whether there is a low peak representing the reference allele. We cannot provide a conclusion, and additional analysis is recommended. Mosaicism could be a plausible explanation, and this has been reported in GBA1 3,4, albeit not at this position. Pat_47 had a false negative p.Leu483Pro call. Pat_16 was indeed wrongly genotyped as homozygous for p.Asn409Ser, related to the adjacent c.1263del+RecTL deletion. Pat_92 had all expected variants called, but the heterozygous p.Asp448His was mis-genotyped as homozygous. In summary, there is one false negative and two wrongly genotyped variants (heterozygous variants called homozygous). Gauchian’s precision is therefore 98.9% (175 out of 177 calls are correct). Its allele-level recall/sensitivity is 99.4% after excluding alleles not on Gauchian’s target list, and samples which could not be analyzed due to high coverage variation. Alternatively, it can be calculated as 97.2% if only samples with high coverage variation are excluded, 96.2% if only alleles not on the target list are excluded, and 94.1% if all these samples are considered .
Tayebi et al. concluded that Gauchian is not able to call recombinant variants without providing orthogonal evidence. In Pat_95, Pat_71 and Pat_16, they examined alignments in IGV and reported absence of supporting reads for Gauchian calls, but all recombinant alleles called by Gauchian were consistent with Sanger. This highlights that read mapping in this region is unreliable (variant supporting reads may align to the pseudogene), making interpretation of alignments in IGV very challenging. Gauchian is designed to untangle ambiguous alignments, locally phase haplotypes and make correct calls. Particularly, in Pat_95, they claimed that Gauchian called the expected RecNciI variant but got the mechanism of the recombinant allele wrong (gene conversion vs. gene fusion). This claim appears to be based on incorrect interpretation of IGV alignments, i.e. seeing 3’ UTR mismatches associated with GBAP1 does not necessarily indicate gene fusion, as they can be misalignments, or even part of the gene conversion. The RecNciI in Pat_95 is a gene conversion, as indicated by the normal copy number between GBAP1 and GBA1. Tayebi et al. claimed that this is a gene fusion without orthogonal evidence. In addition, they claimed that Gauchian misreported copy numbers in Pat_92, Pat_42 and Pat_72, again without orthogonal evidence. We validated Gauchian copy number gains by digital PCR in four cases 1. While particular recombinants could be prone to erroneous copy number calling, we do not know what “other techniques'' identified a different copy number in Pat_92. Orthogonal validation using digital PCR would resolve this. Finally, it is true that Gauchian does not have all possible recombinants on its target list, as it is designed to focus on recombinant variants in exons 9-11, because others are rare and detectable with standard callers.
Tayebi et al. reported 4 samples where Gauchian missed variants in GRCh38 compared to GRCh37. Among these, two (Pat_35, Pat_75) were due to incorrect alignment settings that resulted in abnormally low mapping quality throughout the region. It is likely that ALT-aware alignment was on for all samples except these two. The remaining two (Pat_16, Pat_78) reflected an area of improvement for Gauchian to better call p.Asn409Ser, which is not a GBAP1-like variant, and can thus be called well by standard callers.
We reported Gauchian calls of 1000 Genomes Project (1kGP) samples, validating some by targeted long reads 1. Gauchian called zero samples with biallelic variant in exons 9-11. However, Tayebi et al. reported a completely different set of Gauchian calls in the same samples (in their Table 4). This was caused by incorrect use of Gauchian on old low coverage WGS (median coverage <10X, https://ftp.1000genomes.ebi... "https://ftp.1000genomes.ebi.ac.uk/vol1/ftp/phase3/data/)"), rather than 30X (https://ftp-trace.ncbi.nlm.... "https://ftp-trace.ncbi.nlm.nih.gov/1000genomes/ftp/1000G_2504_high_coverage/data/)").
We are grateful to Tayebi et al for assessing Gauchian analysis of this very challenging gene 2, but note that most discrepancies were due to incorrect use or misinterpretation of results. “No call” samples due to inadequate data quality cannot be considered false negative, as no calls are provided, and warnings of noisy coverage are given where applicable. Samples with inadequate coverage should obviously be avoided, as Gauchian is expected to perform at coverage >30X. Gauchian does not call variants not on its target list, which can be expanded. We provide updated recall (99.4%) and precision (98.9%) values. We have not seen any evidence of the alleged inability of Gauchian to call recombinant variants, and would welcome orthogonal copy number assessment of discrepancies. We show that Gauchian can be used for GBA1 assessment when coverage and data quality are adequate. We do note a limitation in genotyping p.Asn409Ser, a non-recombinant variant that can be called by standard variant callers, which we recommend running together with Gauchian for a complete call set. Finally, in clinical cases where absolute certainty is required, Sanger sequencing could be considered, with targeted long read sequencing another option 1,5–7.
Table 1. Details on the 11 samples where Gauchian and Sanger are inconsistent.
Gauchian calls Sanger Assessment,Tayebi et al. Our assessmentSample Copy Number of GBA1 and GBAP1 GBAP1-like variant in exons 9-11 Other unphased variants Genotype Prediction
Pat_08 4 None p.Asn409Ser p.Asn409Ser/p.Gln389Ter False Negative Missed variant is not on Gauchian's target list
Pat_28 4 None p.Arg535His p.Arg535His/Cys381Tyr False Negative Missed variant is not on Gauchian's target list
Pat_58 4 None p.Asn409Ser, p.Arg296Ter p.Asn409Ser, p.Arg296Ter, c.203delC False Negative Missed variant is not on Gauchian's target list
Pat_26 4 None p.Asn409Ser p.Asn409Ser/p.Arg502Cys False Negative Missed variant is not on Gauchian's target list.
Tayebi et al.’s Supplementary Figure 1 shows no variant at p.Arg502Cys (c.1504C>T), but a different variant at the neighboring position, p.Arg502His (c.1505G>A), which is not on Gauchian's target list.
Pat_75 None (No Call) NA NA p.Arg502Cys/p.Arg159Trp Missed Copy number is a no-calldue to high variation in depth so no further variant calling was performed. Coverage MAD 0.269
Pat_76 None (No Call) NA NA p.Asn409Ser/p.Asn409Ser Missed Copy number is a no-call due to high variation in depth so no further variant calling was performed. Coverage MAD 0.128
Pat_79 None (No Call) NA NA p.Leu483Pro/p.Arg502Cys Missed Copy number is a no-call due to high variation in depth so no further variant calling was performed. Coverage MAD 0.127
Pat_03 4 None p.Asn409Ser p.Asn409Ser/p.Asn409Ser False Negative Gauchian call is supported by reads, see Tayebi et al.’s Supplementary Figure 1.
Pat_47 4 None p.Asn409Ser p.Asn409Ser/p.Leu483Pro False Negative True false negative
Pat_16 3 c.1263del+RecTL/ p.Asn409Ser, p.Asn409Ser p.Asn409Ser, c.1263del+RecTL False Positive Heterozygous p.Asn409Ser misgenotyped as homozygous as Gauchian did not know the exact breakpoint of the c.1263del+RecTL deletion, which is very close to p.Asn409Ser.
Pat_92 7 p.Asp448His/p.Leu483Pro,p.Asp448His p.Asp448His/ p.Leu483Pro+Rec7 False Negative There is no false negative. Rec7 is reflected in the copy number call (copy number gain). This GBAP1 duplication does not have any functional impact on GBA, so Gauchian does not report it as a GBA variant. Heterozygous p.Asp448His misgenotyped as homozygous.
Acknowledgements
We are grateful to Xiao Chen and Michael Eberle for helpful comments. They are former employees of Illumina and current employees of Pacific Biosciences. This research was funded in in part by Aligning Science Across Parkinson's [Grant numbers 000430 and 000420] through the Michael J. Fox Foundation for Parkinson's Research (MJFF).
Competing interests
FJS receives research support from PacBio and Oxford Nanopore. AHVS has received consulting fees from AvroBio, Auxilius, Coave, Destin, Enterin, Escape Bio, Genilac, and Sanofi and speaking fees from Prada Foundation.
Supplementary Information
Add new variants to Gauchian’s config file
The four new variants can be added to Gauchian’s config file as follows.
For hg38, add the following lines to gauchian/data/GBA_target_variant_38.txt
chr1 155236304 A GBAP G c.1165C>T(p.Gln389Ter)<br /> chr1 155236327 T GBAP C c.1142G>A(p.Cys381Tyr)<br /> chr1 155239989 CGGGGGT GBAP CGGGGGGT c.203delC(p.Thr69fs)
Add the following line to gauchian/data/GBA_target_variant_homology_region_38.txt<br /> chr1 155235195 T 155214568 C c.1505G>A(p.Arg502His)
For GRCh37, add the following lines to gauchian/data/GBA_target_variant_37.txt<br /> 1 155206095 A GBAP G c.1165C>T(p.Gln389Ter)<br /> 1 155206118 T GBAP C c.1142G>A(p.Cys381Tyr)<br /> 1 155209780 CGGGGGT GBAP CGGGGGGT c.203delC(p.Thr69fs)
Add the following line to gauchian/data/GBA_target_variant_homology_region_37.txt<br /> 1 155204986 T 155184359 C c.1505G>A(p.Arg502His)
Bibliography
-
Toffoli, M. et al. Comprehensive short and long read sequencing analysis for the Gaucher and Parkinson’s disease-associated GBA gene. Commun. Biol. 5, 670 (2022).
-
Tayebi, N., Lichtenberg, J., Hertz, E. & Sidransky, E. Is Gauchian genotyping of GBA1 variants reliable? medRxiv (2023) doi:10.1101/2023.10.26.23297627.
-
Filocamo, M. et al. Somatic mosaicism in a patient with Gaucher disease type 2: implication for genetic counseling and therapeutic decision-making. Blood Cells Mol. Dis. 26, 611–612 (2000).
-
Hagege, E. et al. Type 2 Gaucher disease in an infant despite a normal maternal glucocerebrosidase gene. Am. J. Med. Genet. A 173, 3211–3215 (2017).
-
Pachchek, S. et al. Accurate long-read sequencing identified GBA1 as major risk factor in the Luxembourgish Parkinson’s study. npj Parkinsons Disease 9, 156 (2023).
-
Graham, O. E. E. et al. Nanopore sequencing of the glucocerebrosidase (GBA) gene in a New Zealand Parkinson’s disease cohort. Parkinsonism Relat. Disord. 70, 36–41 (2020).
-
Leija-Salazar, M. et al. Evaluation of the detection of GBA missense mutations and other variants using the Oxford Nanopore MinION. Mol. Genet. Genomic Med. 7, e564 (2019)
-
-
www.medrxiv.org www.medrxiv.org
-
On 2022-07-25 16:31:06, user Dr. D. Miyazawa MD wrote:
Please also refer to previous studies.
Hypothesis that hepatitis of unknown cause in children is caused by adeno-associated virus type 2 (08 May 2022)<br /> https://www.bmj.com/content...
Daisuke Miyazawa. Possible mechanisms for the hypothesis that acute hepatitis of unknown origin in children is caused by adeno-associated virus type 2. Authorea. May 16, 2022.<br /> DOI: 10.22541/au.165271065.53550386/v2
-
-
www.medrxiv.org www.medrxiv.org
-
On 2020-04-20 15:36:38, user Philip Davies wrote:
Interesting study, thank you.
This is another study that attempts to ascertain if oral HCQ tablets can be of clinical use in patients more than one week into symptomatic disease, hospitalized with bilateral pneumonia and with evidence of established inflammatory reaction (cytokine storm). That's a big ask for any oral medication.
The study is again small (both arms have less than 100 patients). The most significant outcome measured (death) is realized in very small numbers (3 and 4). The confidence levels are extremely wide.
The are several problems with this study. There are marked differences in the two populations. The study honestly attempts to accommodate these confounding factors using a propensity score method (IPTW). Normally this method is valuable but here I can’t see that it has been well applied.
It pays to look at the raw data. There is a significant difference (between the two arms) in the initial intensity of disease.
At baseline (admission), HCQ arm comprises 78.3% men (>20% more of these higher risk patients than control arm with 64.9%); HCQ arm has 21.9% patients with more severe disease in the form of CT showing >50% lung affected). This is >80% more than in control arm (12.1%). HCQ arm has 90.5% patients with CRP > 40mg/l (CRP is a good indicator of impending/current severity). This is 10% higher than control arm (81.9%). HCQ arm had median O2 flow on admission = 3 litres/minute (50% higher than control arm at 2 litres / minute).
So, at baseline, the HCQ arm had significantly more patients with severe disease than control arm. The O2 flow is actually more significant than first sight would suggest. 2 l/m is always the first step in O2 therapy. The data shows us that most patients in the control arm could hold their sats on this first step therapy. This also means they may have been OK on just 1 l/m. We don't know. But we do know that most patients in the HQN could not hold their sats at that first step and needed an increase (3 l/m ... so that's 50-300% more O2 than control arm).
Admittedly there were other confounding factors which compromised the control arm more than HCQ arm (some chronic disease elements). But it's clear to me that disease severity was markedly more established in the HCQ arm.
Another factor to note: the HCQ treatment was not initiated at the moment those baseline values were obtained (on admission). The HCQ was initiated within 48 hours. So let’s look again at the timelines. The median duration of symptoms at admission shows that the HCQ arm comprised patients who were further into worsening illness: they were admitted on D8 compared to control, D7. They may not have had HCQ initiated until D10.
Then we look at outcomes: the raw data shows that the disadvantaged HCQ arm actually does better in the two most important outcomes, death and ICU admission. The HCQ delivers 12% less death and ICU admissions than the control arm. Admittedly the numbers are small so the confidence levels are very wide.
So what does that tell us? The answer is not much. But even accepting the poorly aligned baseline for disease severity, the outcomes with their wide 95% confidence levels do deliver a mildly promising indication on the 'swingometer'. They point more towards benefit than harm when using HCQ in this advanced disease state.
As a final comment on significant side effects (increased QT interval) from the use of HCQ. Once again, this trial used a particularly high dose of HCQ (600mg/day...right at ceiling dose for rheumatological use and much higher than the total antimalarial treatment dose). They also added azithromycin (another QT lengthening drug) to 20% of the HCQ patients. It’s not surprising at all to find such QT lengthening in a sick, more elderly population taking these medications in particularly high doses).
Further trials should utilize conservative doses of CQ/HCQ which have been proven safe in many millions of patients.
We don't yet know how this will pan out. We urgently need proper evidence. Statistically robust studies into prophylaxis and early intervention are likely to deliver the most interesting results.
Dr Philip Davies<br /> Aldershot Centre For Health<br /> http://thevirus.uk
-
On 2020-04-20 00:46:27, user deutsch wrote:
A conclusion with only two days oh HCQ and such a smal sample is dishonest!<br /> The probability of missing real differences between the treatments is very high with such a small sample. For example with real death rate 2% vs 4% the probability of false conclusion is 90%....
-
-
www.medrxiv.org www.medrxiv.org
-
On 2021-05-26 15:18:37, user Turki Bin Hammad wrote:
The Astrazenca vaccine is reported to elicit much higher immune response when the second dose is given 2 to 3 months later compared to the 4-Week interval. Was the immune data for the AZD/Oxford vaccine in this study took into account the expected difference with various dosing schedules?
-
-
www.medrxiv.org www.medrxiv.org
-
On 2021-08-12 10:05:30, user Ken Sprenger wrote:
There are a number of concerns with the methodology and consistency in this study:<br /> 1. There is inconsistency in the description of the population of patients to be enrolled. The study registered on ClinicalTrials.gov (NCT 044297411) indicates that the study would include patients with mild to moderate COVID-19, whereas the title of the study published on medRxiv indicates that patients would have mild COVID-19. Then under Study Design in Methods in the publication, it indicates that the study would include mild to moderate COVID-19 patients. Then under Study Population in the publication it includes “asymptomatic cases”. In Table 1 All patients (N=89) and Symptomatic =72, therefore 17 (19%) of patients were asymptomatic. It would appear, therefore, that the definition of the study population had been substantially amended to include asymptomatic patients. There are a number of considerations:<br /> a. This was therefore no longer a study of ivermectin in patients with mild to moderate or even mild COVID-19, as stated in the publication and elsewhere.<br /> b. It would be important to know when the decision was made to enrol the asymptomatic patients and the reasons for this change.
-
Under Intervention in the Methods section of the publication, the authors say “Unexpectedly some patients who were isolated in the hotels as verified positive patients were found to be borderline or negative upon our RT-PCR test” and were withdrawn from the study. Figure 1 indicates that 7 patients assigned to the ivermectin arm and 14 patients assigned to the placebo arm had Ct values >35 in the “two first tests”. <br /> a. This means that 18% of patients were withdrawn after the start of the study as they had all been enrolled and randomized. <br /> b. The Ct values given in Figure 1 are all >35, and so it is difficult to understand why the text in the publication says “borderline or negative”. What did borderline mean in regard to Ct values? <br /> c. The authors state under Intervention in Methods that “… all RT-PCR tests, including verification that patients were positive on day zero, were conducted by the same lab, at the Israel Central Virology Laboratory of the Ministry Of Health (located at Sheba Medical Centre).”<br /> d. Withdrawing 18% of patients who initially qualified for the study (Ct confirmed by Ministry of Health laboratory) because they had reduced viral shedding (even if negative or approaching negative) in subsequent RT-PCR tests when reduction of viral shedding is the endpoint of the study, is problematic. Generally once patients are enrolled in a study they should not be withdrawn by the investigator except for safety reasons, or if the participant withdraws consent. An intention to treat analysis including these patients should have been performed.
-
There is a further change to the protocol which defines the time from symptom onset to start of medication. Initially start of study drug dosing appears to have been within 3 days of symptom onset, but then because of “delay in getting results in the community” of the RT-PCR this time was increased to 7 days from symptom onset. <br /> a. There is no indication of when this amendment was introduced, but it appears to be after the start of the study, in which case some patient’s day 6 (3 days from symptom onset + 3 days of study drug), will be different to others which will be 7 days from symptoms + 3 days of study drug. <br /> b. As it is possible that the viral load will be a little lower in patients on day 7 compared to day 3 after symptom onset, and the patients who started treatment on day 7 might reach Ct >30 at the end of 3 days of treatment sooner than patients who started treatment on day 3. <br /> c. Measuring the endpoint Ct (which will be changing with time, unrelated to study drug) at different intervals from baseline is potentially introducing a bias.
-
Medication is described differently in 3 places:<br /> a. Abstract in the publication: 0.2 mg/kg x 3 days.<br /> b. Randomisation section in Methods in the publication: in patients 40-69kg, 4 tablets (=12 mg daily) x 3 days and in patients >= 70 kg, 5 tablets (=15 mg daily) x 3 days.<br /> c. ClinicalTrials.com description: 3mg capsules, 15-20mg/day x 3 days.<br /> These three statements are all different doses and some are described as capsules, others as tablets. Consistency and the correct description of study medication is critical in a study which tests a drug against a placebo.
-
Primary outcome. Under Outcomes in the publication it states “The primary endpoint was viral clearance following a diagnostic swab taken on the sixth day (third day after termination of treatment), in the intervention group compared to placebo.” A negative swab was defined as RT-PCR Ct >30. The authors point out that the standard for a negative swab in Israel is a Ct >40 and, although they don’t mention this, the manufacturer of the RT-PCR kit used in the study (Seegene Allplex CoV19) recommends a cut-off Ct >40 in their manual. Despite these exiting standards they made a decision to use a Ct >30 because for a Ct >40 “reaching this level may take a few weeks, and there is significant evidence that a non-infectious state is usually achieved at Ct level >30”. <br /> a. It seems inappropriate in a study such as this, to change a commonly accepted standard (Ct >40) in Israel to save a “few weeks” of time. <br /> b. The point at which the decision was made to use the Ct >30 as negative is not declared and one would be concerned if it was taken after the start of the study and particularly if it was after unblinding of the study!
Conclusions:<br /> 1. There are numerous deviations from the ClinicalTrials.Gov description (amended version June 14, 2020) including: patient inclusion criteria, participant eligibility period post exposure (maximum 72 hours), study medication description, another 2 outcome measures which were not reported. Many deviations such as these raise concerns about the thoroughness with which the study was conducted and reported.<br /> 2. This was not a study of patients with mild to moderate COVID-19 as indicated in the publication title (or even with just mild COVID-19) as nearly 1 in 5 of randomized patients were asymptomatic. <br /> 3. A large number of patients (18%) were withdrawn from the study by the investigator as their RT-PCRs had Ct values >35) on day 2 and 4, after an initial positive. This is highly unusual and could have biased the study. An intention to treat analysis should have been performed. <br /> 4. The definition of a negative swab, which was really the endpoint, appears to have been made arbitrarily, as it did not align with Israel’s standards and the kit manufacturer’s manual, and there is no clarity as to when this decision was made. <br /> 5. A study amendment to the protocol which defined the time from symptom onset to start of study drug dosing was changed from 3 to 7 days. This could have biased the study.
It might be true that Ivermectin does reduce viral shedding time in mild to moderate COVID-19. However this study is not rigorous enough, includes amendments which could have introduced bias, and has methodological issues. In my opinion it should not be accepted as good evidence that ivermectin reduces viral loads and could reduce isolation time in patients with COVID-19.
-
-
-
www.medrxiv.org www.medrxiv.org
-
On 2023-06-29 09:40:33, user Nensi wrote:
The idea behind this study is truly interesting and highlights the critical importance of addressing the issues surrounding poor reporting and the quality of systematic reviews.<br /> However, some things could be changed to improve the quality of this study. Below you can find some of my comments regarding your manuscript.<br /> 1) The manuscript could use extensive language editing, as there are many grammatical and spelling errors. Many language editing programmes can be very useful for these purposes (Grammarly, Instatext etc.).<br /> 2) You begin the Methods section with the aim of your study, but you state that the aim was to do a study. You can see why that does not make sense. The aim of your study was to do a study. You should report here the specific purpose or what you wanted to assess (for example, the aim was to assess the reporting quality of systematic reviews published by authors from India from 2015 to 2020).<br /> 3) In Results, you decided to report the data in text and with two figures. However, when you have so much descriptive data, it could be presented more clearly with just a table. The table allows the authors to store large amounts of data in a small place, making it easier for the readers to go through the data and understand the results. <br /> 4) Another detail about presenting the results is that they should be written in the past tense instead of the present tense you used.<br /> 5) Also, when presenting descriptive data, it is recommended to report both absolute and relative numbers (for example, „Only 20 (15%) of the reviews have been registered in PROSPERO registry“).<br /> 6) You could benefit from using STROBE reporting guidelines for observational studies (https://www.equator-network... "https://www.equator-network.org/reporting-guidelines/strobe/)"). Reporting guidelines are handy in ensuring you have reported everything that needs to be written in an article.<br /> 7) There is also much room for improvement regarding the referencing. A small detail would be the in-text referencing where you put [1] after the full stop. So the general rule would be that if you use brackets, it should be placed inside the sentence, and if you want to put the number in superscript, it should be after the sentence. That could use a bit of tidying up. <br /> 8) Additionally, regarding the referencing, you have used different styles of referencing in the reference list and some of the references are not referenced correctly or at all. There are many programmes that can help you organize and write the references (EndNote, Zotero, Mendeley etc.).<br /> 9) And one more thing for future referencing, even though a study is methodological, it should be preregistered. All studies should be preregistered to promote open science and transparency in conducting scientific research.<br /> I hope these suggestions will help. Good luck with your work!
-
-
www.medrxiv.org www.medrxiv.org
-
On 2020-04-23 17:27:44, user Sinai Immunol Review Project wrote:
Presence of SARS-CoV-2 reactive T cells in COVID-19 patients and healthy donors
Braun J et al.; medRxiv 2020.04.17.20061440; https://doi.org/10.1101/202...
Keywords
• SARS-CoV-2 specific CD4 T cells
• Human endemic coronaviruses
• COVID-19
Main findings
In this preprint, Braun et al. report quantification of virus-specific CD4 T cells in 18 patients with mild, severe and critical COVID-19, including 10 patients admitted to ICU. Performing in vitro stimulation of PBMCs with two sets of overlapping SARS-CoV-2 peptide pools – the S I pool spanning the N-terminal region (aa 1-643) of the S protein, including 21 predicted SARS-CoV-1 MHC-II epitopes, and the C-terminal S II pool (aa 633-1273) containing 13 predicted SARS-CoV-1 MHC-II epitopes – the authors detected S-protein-specific CD4 T cells in up to 83% of COVID-19 patients based on intracellular 4-1BB (CD137) and CD40L (CD154) induction. Notably, peptide pool S II shares higher homology with human endemic coronaviruses (hCoVs) 229E, NL63, OC43, and HKU1 that may cause the common cold, but it does not include the SARS-CoV-2 receptor-binding domain (RBD), which has been identified as a critical target of neutralizing antibodies in both SARS-CoV-1 and SARS-CoV-2. S I-reactive CD4 T cells were found in 12 out of 18 (67%) patients, whereas CD4 T cells against S II were detected in 15 patients (83%). Intriguingly, S-specific CD4 T cells could also be found in 34% (n=23) of 68 SARS-CoV-2 seronegative donors, referred to as reactive healthy donors (RHD), with a preference for S II over S I epitopes. Only 6 of 23 RHDs also had detectable frequencies of S I-specific CD4 T cells, overall suggesting S II-reactive CD4 T cells had likely developed in response to prior infections with hCoVs. Of 18 out of 68 total healthy donors tested, all were found to have anti-hCoV antibodies, although this was independent of concomitant anti-S II CD4 T cell frequencies detected. This finding mirrors observations of declining numbers of specific CD4 T cells, but persistent humoral memory after certain vaccinations such as against yellow fever. The authors further speculate that these pre-existing virus-specific T cells against hCoVs might be one of the reasons why children and younger patients, usually considered to have a higher incidence of hCoV infections per year, are seemingly better protected against SARS-CoV-2. Unlike specific CD4 T cells found in RHDs, most S-specific CD4 T cells in COVID-19 patients displayed a phenotype of recent in vivo activation with co-expression of HLA-DR and CD38, as well as variable expression of Ki-67. In addition, a substantial fraction of peripherally found HLA-DR+/CD38+ bulk CD4 T cells was found to be refractory to peptide stimulation, potentially indicating cellular exhaustion.
Limitations
This is one of the first preprints reporting the detection of virus-specific CD4 T cells in COVID-19 (also cf. Dong et al., https://www.medrxiv.org/con... Weiskopf et al., https://www.medrxiv.org/con... "https://www.medrxiv.org/content/10.1101/2020.04.11.20062349v1.article-info)"). While it generally adds to our current knowledge about the potential role of T cells in response to SARS-CoV-2, a few limitations, some of which are discussed by the authors themselves, should be addressed. Findings in this study pertain to a relatively small cohort of patients of variable clinical disease. To corroborate the observations made here, larger studies including both more healthy donors and more patients of all clinical stages are needed to better assess the function of virus-specific CD4 T cells in COVID-19. Specifically, the presence of pre-existing, potentially hCoV-cross-reactive CD4 T cells in healthy donors needs to be explored in the context of COVID-19 immunopathogenesis. While the authors suggest a potentially protective role based on higher incidence of hCoV infection in children and younger patients, and therefore a presumably larger pool of pre-existing virus-specific memory T cells, the opposite could also be the case given cumulatively increased number of hCoV infections in older patients. In this context, it would therefore have been interesting to also measure anti-hCoV antibodies in COVID-19 patients. Furthermore, this study did not quantify virus-specific CD8 T cells. Based on observations in SARS-CoV-1, virus-specific memory CD8 T cells are more likely to persist long-term and confer protection than CD4 T cells, which were detected only at lower frequencies six years post recovery from SARS-CoV-1 (cf. Li CK et al., Journal of immunology 181, 5490-5500.) Morover, no other specifities such as against the N or M epitopes were evaluated. Robust generation of virus-specific T cells against the N protein was shown to be induced by SARS-CoV-2 in another pre-print by Dong et al. (Dong et al., https://www.medrxiv.org/con... "https://www.medrxiv.org/content/10.1101/2020.03.17.20036640v1)"), while Weiskopf et al. recently reported preference of both CD8 and CD4 T cells for S epitopes https://www.medrxiv.org/con... "https://www.medrxiv.org/content/10.1101/2020.04.11.20062349v1.article-info)"). Moreover, the authors seem to suggest that some of the virus-specific CD4 T cells detected could be potentially cross-reactive to predicted SARS-CoV-1 epitopes present in the peptide pools used. Indeed, this has been recently established for several SARS-CoV-2 binding antibodies, while it was found not to be the case for RBD-targeting neutralizing antibodies (cf. Wu et al., https://www.medrxiv.org/con... Ju et al., https://www.biorxiv.org/con... "https://www.biorxiv.org/content/10.1101/2020.03.21.990770v2)"). A similar observation has not been made for T cells so far and should be evaluated. Finally, since reactive healthy donors were only tested for anti-S1 IgG, however not for other more ubiquitous binding antibodies, e.g. against M, and only a fraction of these donors was additionally confirmed to be negative by PCR, there is, though unlikely, the possibility that some of the seronegative reactive donors had been previously exposed to SARS-CoV-2.
Significance
Quantification of virus-specific T cells in peripheral blood is a useful tool to determine the cellular immune response to SARS-CoV-2 both in acute disease and even more so post recovery. Ideally, once immunogenic T cell epitopes are better characterized, tetramer assays will allow for faster and more efficient detection of their frequencies. Moreover, assessing the potential role of pre-existing virus-specific CD4 T cells in healthy donors in the context of COVID-19 pathogenesis will be of particular importance. The observations made here are also highly relevant for the design and development of potential vaccines and should therefore be further explored in ongoing research on potential coronavirus therapies and prevention strategies.
This review was undertaken by V. van der Heide as part of a project by students, postdocs and faculty at the Immunology Institute of the Icahn school of medicine, Mount Sinai.
-
-
www.medrxiv.org www.medrxiv.org
-
On 2020-06-11 13:53:48, user peter tofts wrote:
please include: 1.) what type of corticosteroid was used (meythyleprednisolone) 2.) the dose (?1mg/kg or other v pulsed) duration etc... 3.) timing: the authors mention timing around 7 days from onset of symptoms- also Delay respect to Sx 13+/- 4.2 so I suppose maybe 6 days +/- 4 into their hospitalization? interesting paper thankyou
-
-
www.medrxiv.org www.medrxiv.org
-
On 2020-05-01 23:43:12, user Sinai Immunol Review Project wrote:
Title A single-cell atlas of the peripheral immune response to severe COVID-19<br /> Wilk, A.J. et al. MedRxiv ; doi:10.1101/2020.04.17.20069930
Keywords<br /> scRNAseq; Interferon-Stimulating Genes (ISGs); Activated granulocytes
Main Findings<br /> The authors performed single-cell RNA-sequencing (scRNAseq) on peripheral blood from 6 healthy donors and 7 patients, including 4 ventilated and 3 non-ventilated patients. 5 of the patients received Remdesivir.
scRNAseq data reveal 30 gene clusters, distributed among granulocytes, lymphocytes (NK, B, T cells), myeloid cells (dendritic cells DCs, monocytes), platelets and red blood cells. Ventilated patients specifically display cells containing neutrophil granule proteins that appear closer to B cells than to neutrophils in dimensionality reduction analyses. The authors named these cells “Activated Granulocytes” and suggest them to be class-switched B cells that have lost the expression of CD27, CD38 and BCMA and acquired neutrophil-associated genes, based on RNA velocity studies.
SARS-CoV2 infection leads to decreased frequencies of myeloid cells, including plasmacytoid DCs and CD16+ monocytes. CD14+ monocyte frequencies are unchanged in the patients, though their transcriptome reveals an increased activated profile and a downregulation of HLAE, HLAF and class II HLA genes. NK cell transcriptomic signature suggests lower CD56bright and CD56dim NK cell frequencies in COVID-19 patients. NK cells from patients have increased immune checkpoint (Lag-3, Tim-3) and activation marker transcripts and decreased maturation and cytotoxicity transcripts (CD16, Ksp-37, granulysin). Granulysin transcripts are also decreased in CD8 T cells, yet immune checkpoint transcripts remain unchanged in both CD8 and CD4 T cells upon SARS-CoV2 infection. The frequencies of memory and naïve CD4 and CD8 T cell subsets seem unchanged upon disease, though gdT cell proportions are decreased. SARS-CoV2 infection also induces expansion of IgA and IgG plasmablasts that do not share Ig V genes.
Interferon-signaling genes (ISGs) are upregulated in the monocyte, the NK and the T cell compartment in a donor-dependent manner. ISG transcripts in the monocytes tend to increase with the age, while decreasing with the time to onset disease. No significant cytokine transcripts are expressed by the circulating monocytes and IFNG, TNF, CCL3, CCL4 transcript levels remain unchanged in NK and T cells upon infection.
Limitations<br /> The sample size of the patients is limited (n=7) and gender-biased, as all of them are men.<br /> The activating and resting signatures in monocytes should be further detailed. The authors did not detect IL1B transcripts in monocytes from the patients, though preliminary studies suggest increased frequencies of CD14+ IL1B+ monocytes in the blood of convalescent COVID-19 patients[1].<br /> Decreased NK cells, B cells, DCs, CD16+ monocytes and gdT cells observed in peripheral blood might not only reflect a direct SARS-CoV2-induced impairment, but also the migration of these cells to the infected lung, in line with preliminary data suggesting unchanged NK cell frequencies in the patient lungs[2].<br /> The authors identified platelets in their cluster analyses. Recent reports of pulmonary complications secondary to COVID-19 describe thrombus formation that is probably due, in part, to platelet activation[3, 4]. A targeted characterization of the platelet transcriptome may thus benefit an increased understanding of this phenomenon.<br /> The transcriptome of the Activated Granulocytes should be further detailed. As discussed by the authors, IL24 and EGF might be involved in the generation of the Activated Granulocytes, though these cytokines are poorly represented in the blood of the patients. The generation of these cells should therefore be further investigated in future studies.
Significance<br /> The authors show a SARS-CoV2-induced NK cell dysregulation, in accordance with previous studies[5]. Alongside the upregulation of ISGs in NK cells, these findings suggest an impaired capacity of the NK cells to respond to activating signals in COVID-19 patients. The unchanged expression of immune checkpoints on CD4 and CD8 T cells suggest distinct SARS-CoV2 dysregulation pathways in the NK and the T cell compartments. In particular, the downregulation of transcripts encoding for class II HLA but not for the HLA-A, -B, -C molecules in monocytes suggest an impaired antigen presentation capacity to CD4 T cells, which should be further investigated.<br /> The authors provide preliminary results suggesting an age-related activation of the monocytes in the COVID-19 patients. Future studies will be needed to evaluate if the age impacts the involvement of the monocytes in the cytokine storm observed in COVID-19 patients.
References<br /> 1. Wen, W., et al., Immune Cell Profiling of COVID-19 Patients in the Recovery Stage by Single-Cell Sequencing. MedRxiv, 2020.<br /> 2. Liao, M., et al., The landscape of lung bronchoalveolar immune cells in COVID-19 revealed by single-cell RNA sequencing. MedRxiv, 2020.<br /> 3. Giannis, D., I.A. Ziogas, and P. Gianni, Coagulation disorders in coronavirus infected patients: COVID-19, SARS-CoV-1, MERS-CoV and lessons from the past. J Clin Virol, 2020. 127: p. 104362.<br /> 4. Dolhnikoff, M., et al., Pathological evidence of pulmonary thrombotic phenomena in severe COVID-19. J Thromb Haemost, 2020.<br /> 5. Zheng, M., et al., Functional exhaustion of antiviral lymphocytes in COVID-19 patients. Cell Mol Immunol, 2020.
Credit<br /> Reviewed by Bérengère Salomé and Zafar Mahmood as part of a project by students, postdocs and faculty at the Immunology Institute of the Icahn School of Medicine, Mount Sinai
-
-
www.medrxiv.org www.medrxiv.org
-
On 2020-05-04 18:15:10, user Dr SK Gupta wrote:
High Dose Chloroquine with Poor patient selection are the culprits- not the drug <br /> Investigators were over enthusiastic in using a higher dose of chloroquine in elderly patients. In China National Health and Care Commission officially included the Chloroquine as medical agent on 19 Feb 2020 to be used in corona virus treatment plan. The dose of 500mg of chloroquine twice a day was decided following in vitro studies EC50 values, PBPK modeling and mice RLTEC data projected on Human beings (1). <br /> The initial recommended dose of 500 mg of chloroquine phosphate salt twice per day can quickly approach danger thresholds with sustained use at the maximum course of 10 days (Total chloroquine base 6gm). The lethal dose of chloroquine base in adults is about 5g. In China, On Feb 26, 2020, the treatment guidelines were revised, shortening the maximum course to 7 days to keep the total dose of chloroquine base 4.2 gm much lower than toxic dose (2). <br /> Elderly population is particularly prone to chloroquine toxicity especially at high doses. It is unfortunate in present study, that a base line ECG was not done to measure the QTc interval because the drug should be avoided if the QTc was more than 500ms especially in patients with severe disease prone to develop myocarditis due to primary disease Covid-19 per se(3). On the contrary we find that the higher dose regimen included Older age population with mean [SD] age, 54.7 [13.7] years vs 47.4 [13.3] years with more heart disease (5 of 28 [17.9%] vs 0) as compared to lower dose regimen. We in India having hige experience of using the drug would refrain from using such high doses.<br /> Gao et al reported results from more than 100 patients demonstrated that chloroquine phosphate is superior to the control treatment: in inhibiting the exacerbation of pneumonia, improving lung imaging findings, promoting a virus-negative conversion, shortening the disease course. Severe adverse reactions to chloroquine phosphate were not noted in the aforementioned patients (4). <br /> Poor patient selection and use of toxic doses of chloroquine seems to have brought disrepute to a promising drug. More studies are required before condemning the drug in present indication of Covid 19<br /> References:<br /> 1. Wang M, Cao R, Zhang L, et al. Remdesivir and chloroquine effectively inhibit the recently emerged novel coronavirus (2019-nCoV) in vitro. Cell Res 2020; 30:269–71<br /> 2. COVID-19: a recommendation to examine the effect of hydroxychloroquine in preventing infection and progression Dan Zhou, Sheng-Ming Dai and Qiang Tong J Antimicrob Chemother doi:10.1093/jac/dkaa114
-
Cardiovascular risks of hydroxychloroquine in treatment and prophylaxis of COVID-19 patients: A scientific statement from the Indian Heart Rhythm Society<br /> Aditya Kapoor, Ulhas Pandurangi,Vanita Arora, Anoop Gupta, Aparna Jaswal et al. Indian Pacing and Electrophysiology Journal, https://doi.org/10.1016/j.i...
-
Gao J, Tian Z, Yang X. Breakthrough: chloroquine phosphate has shown apparent efficacy in treatment of COVID-19 associated pneumonia in clinical studies. Bioscience Trends 2020; 14:72–3
-
-
-
www.medrxiv.org www.medrxiv.org
-
On 2020-03-28 22:38:39, user Sinai Immunol Review Project wrote:
Summary of Findings: <br /> - Prospective cohort of 67 patients, clinical specimens taken and follow-up conducted. <br /> - Viral shedding, serum IgM, IgG antibody against NP evaluated and correlated to disease severity and clinical outcome <br /> - Viral RNA levels peaked at 1 week from febrile/cough symptom onset in sputum, nasal swabs, and stool samples. Shedding ranged from 12-19 days (median ranges) and was longer in severe patients. <br /> - IgM and IgG titers stratified patients into three archetypes as ‘strong vs weak vs non-responders’. Strong responders (with higher IgM/IgG titers) were significantly higher in severe patients.
Limitations (specific for immune monitoring <br /> - Patient cohort is small for such a study and no individuals who were asymptotic were included; thus we cannot clearly interpret antibody titer associations with disease severity without "immunity" response.<br /> - Not clear if stool RNA captured from live infection in intestine/liver or from swallowed sputum. Transmission electron microscopy (TEM) carried out on sputum samples as proof of concept, but not stools. TEM unreasonable for actual clinical diagnosis. <br /> - Several patients had co-morbidities (such as pulmonary and liver disease) that were not accounted for when tracking antibody responses. Viral kinetics and IgM/IgG titers in subsets of patients with underlying conditions/undergoing certain medication would be informative.
Relevance (specific for immune monitoring) <br /> - Three archetypes of antibody response to SARS-CoV-2 with different disease progression and kinetics is useful to stratify patients, and for future serological tests.
- Strong spike-IgG levels often correlate with lymphopenia and CoVID-19 disease severity (https://doi.org/10.1101/202... ), similar to macaque studies in SARS (1). It would be critical to see if anti-NP or anti-Spike IgG antibodies for SARS-CoV-2 also elicit similar detrimental effects before clinical use.
References: <br /> 1. Liu L, Wei Q, Lin Q, Fang J, Wang H, Kwok H, et al. JCI Insight 2019; 4(4): pii: 123158. <br /> Doi: 10.1172/jci.insight.123158
Review by Samarth Hegde as part of a project by students, postdocs and faculty at the Immunology Institute of the Icahn school of medicine, Mount Sinai.
-
-
www.medrxiv.org www.medrxiv.org
-
On 2023-06-07 16:45:42, user Nathan Pearson wrote:
In this study (of American patients to whom bivalents were available only as booster), all bivalent recipients by definition got 3+ total mRNA vaccine doses, while the current preprint text's control group got 2+.
As such, to compare equal dose counts (if not timing relative to prior waves etc.), can the authors please add a sub-analysis of peer bivalent (original or BA.4/5) vs. 3+ dose (not 2+) monovalent recipients?
Not doing so inherently confounds any additional benefit of bivalent vs. monovalent formulation with a group difference in total doses per participant.
Thanks
-
-
www.medrxiv.org www.medrxiv.org
-
On 2023-10-24 02:18:23, user CDSL JHSPH wrote:
Dear Dr. Bi et al,
Thanks to your work on influenza, which has provided a new proof that the residual repeat vaccination effect might be explained by different rates of subclinical infection between repeat and non-repeat vaccinees via two proposed mechanisms, the infection block hypothesis and enhanced vaccine immunogenicity and protection post-infection.
As a reader who doesn't know much about the field ,I can give you some reading feedback for your reference.<br /> First I think your article provides three important pieces of evidence. <br /> 1,Repeat vaccinees were vaccinated earlier in a season by one week.<br /> 2,Clinical infection influences individuals’ decision to vaccinate in the following season while protecting against clinical infection of the same (sub)type.<br /> 3,Adjusting for recent clinical infections did not strongly influence the estimated effect of prior-season vaccination.<br /> 4,Adjusting for subclinical infection could theoretically attenuate this effect.
On the basis of your good work, I would like to offer a bit of advice for readers who are not experts in this area. First is the article structure section. I hope this provides some perspective to help you publish. First of all the name of the title may be too long for non-specialized readers. It may lose some of the attention. Furthermore the explanations of within-season waning, recent clinical infection, and subclinical infection could have come in the INTRODUCTION instead of the METHOD before being mentioned. Another thing is that I think you could put in the conclusion that has some summarizing words underneath the fig so that readers might find them easier. Also the part you put in the appendix about theoretical modeling some of it is necessary for understanding the model, if you could summarize it necessary and put it in the body methodology would help understanding.
The next aspect is about research, first of all your work is very relevant and on this basis you are perfectly placed to capitalize on this aspect. First of all you can try to find some way (like sampling) to compare your theoretical model with the results of the data response you got, so that you can speculate about the effect of the vaccine in reality and the possible number of Subclinical infections.
After that comparing your model with real data would be an interesting aspect. And this can emphasize the correctness of your model and increase the credibility of your article. Although overall this article has been highly relevant with enough realistic data.
However, on this basis, one can consider whether the data from different regions (the five regions sampled) are very different? For example, are the probabilities of tuning into a vaccination strategy similar in different regions, and do repeat vaccinees in each region tend to get vaccinated earlier in the flu season than non-repeat vaccinees? These comparisons of data from different regions can be added to the article as they relate to the reproducibility and generalizability of your model's and conclusions.
Finally, thank you for this article, which provides very good evidence for the causes of Reduced effectiveness of repeat influenza vaccination, and this article has the advantage of incorporating a lot of details that were not considered in previous studies and provides a good interpretation of the errors, providing new ideas and theoretical models for the field. And I personally learned a lot of research ideas from you through this article, thank you for your work!
-
-
www.medrxiv.org www.medrxiv.org
-
On 2024-06-08 00:47:24, user Renzo Huber wrote:
The manuscript entitled “Laminar multi-contrast fMRI at 7T allows differentiation of neuronal excitation and inhibition underlying positive and negative BOLD responses” is a methods paper that estimated metabolic changes (CMRO2) across cortical layers.
The subject matter is relevant for the field. (layer-)fMRI suffers from the interpretability challenge of ‘only’ capturing an indirect measure of neural activity. This study aims to estimate neural energy demand more directly with a newly re-implemented multi-contrast sequence of CBV, CBF, and BOLD.
The method is benchmarked on previously established tasks (finger tapping) and applied on visual retinotopic stimuly.<br /> The study is clearly described and the results on positive responses look robust and convincing.<br /> The results on negative responses are weak and less clear and less convincing, though. <br /> One advantage of this study compared to previous laminar CMRO2 studies is that it does not rely on a Grubb coefficient that relates CBV and CBF. Instead, the study at hand measures both parameters concomitantly.
There are some model assumptions that are not really justified (detailed below).
I recommend the editors to publish this manuscript given the authors make a few small revisions.
Detailed comments are below:
1.) The Davis model on CMRO2 estimation is based on many assumptions that might not be valid for the spatial scale of laminar fMRI with GRASE. I believe the authors could spell out the assumptions that they are making and discuss if and how much they matter for the conclusions.
1a) The Davis model is based on the Fick’s principle. This assumes that delivered oxygen (via CBF) is either (i) sitting in the voxel -CBV , (ii) metabolized -CMRO2 or (iii) drained away - BOLD. Its a mass-balance principle. This assumption is valid for conventional 3mm voxels that cover the entire vascular tree. But for laminar resolution this is not valid anymore. The exchange (CBF) is happening in different layers than the draining (BOLD). So in superficial voxels, when there is a BOLD signal change without any CBV or CBF change, the Davis model results in unphysiological results.
1b) The Davis model is solely parametrizing venous CBV that is contributing to the BOLD signal. The Davis model does not include arterial CBV. In the study at hand, the authors take VASO and it’s estimation of total CBV, in the equation that is meant for venous CBV only. Given that venous CBV is weaker, slower, and has a different sensitivity to superficial layers [Huber 2014 10.1016/j.neuroimage.2014.04.022], this can result in skewed estimations of CMRO2. Previous studies on laminar CMRO2 have used a scaling factor to account for this [Guidi 2016 10.1016/j.neuroimage.2016.06.030]. The study at hand does not account for the mismatch between total CBV and venous CBV.
1c) The power law that equates BOLD signal changes with oxygenation changes is originally estimated based on a supralinear effect: “a linear large vessel component is combined with small vessel contributions, which tend toward a quadratic effect on relaxivity according to the Luz-Meiboom model for diffusion-mediated exchange on the capillary scale” (Davs paper 1998). In my understanding, this has always been applied with gradient echo BOLD. In the study at hand, the authors apply the same relationship to GRASE BOLD. Based on modeling work in [Scheffler 2021, https://doi.org/10.1002/mrm...], the vessel sensitivity and the relationship between intra and extravascular BOLD is dependent on vessel radius and flip angle. This is different from GE-BOLD which does not have these dependencies. This makes me wonder if it's justified to use an universal beta value in the Davis model for GRASE BOLD. Maybe beta varies a lot across layers and areas?
2.) The study by Bohrhaus et al 2023 also used laminar CBV, CBF and BOLD to estimate CMRO2 with a layer peak that seems much more superficial (monkeys) than the results shown here. The authors could acknowledge that this study exists and include it in the reference list?
Bohraus, Y., Merkle, H., Logothetis, N.K., Goense, J., 2023. Laminar differences in functional oxygen metabolism in monkey visual cortex measured with calibrated fMRI. Cell Reports 42, 113341. https://doi.org/10.1016/j.c...
3.) It seems that the profiles in Figs. 3,4 are group results. It is not clear if the corresponding maps are single participant maps. Are the inflated brains in Fig. 4 averages in FS-average?
4.) It is not clear to me to which experiment the results in Fig. 3 refer to. The heading suggests its experiment 1. The figure caption seems to suggest it refers to experiment 2.
5.) I think it would be helpful to add a zero line in Fig. 5d. It's not clear if the author hypothesizes that the superficial layer sees negative changes or if the deeper layers see positive changes.
6.) I found Fig. 8 a bit misleading. The scanner plots are mixing many different sources of variance. The spread across points might contain true spatial patterns as well as intersubject variability e.g. different fMRI gain due to different venous baseline oxygenation [Lu,et al., 2008. https://doi.org/10.1002/mrm...]. So it’s not clear what a higher correlation means. In the Davis model, CBF dominates the estimates of CMRO2. Thus, any thermal noise in CBF will be expected to translate to noise in CMRO2 estimates; Making them not independent parameters. Thus, I am not sure if the higher correlation in CBF-CMRO2 is an excelent measure to investigate which parameter is most closely related to CMRO2. But it also doesn’t hurt to keep the figure in there.
7.) In the discussion, the authors discuss their beta value with respect to the literature. I think it would be helpful to mention that beta is not solely a tissue property constant. It is expected to be different across field strength, TE and BOLD contrast (GE-SE).
8.) Typo in discussion “rang from 0.9…”
-
-
www.medrxiv.org www.medrxiv.org
-
On 2024-12-05 12:13:20, user xPeer wrote:
Courtesy review from xPeerd.com
Summary<br /> The study "Pre-existing anti-polyethylene glycol antibodies in pregnant women and newborns" investigates the prevalence and levels of pre-existing anti-PEG antibodies in pregnant women and their newborns, revealing significant safety concerns over the use of PEGylated drugs in these populations. The study highlights maternal age and certain lifestyle factors, such as cosmetic use and consumption of take-out food, as influencing the prevalence and levels of these antibodies. The implications for public health lie in the potential reduced efficacy and increased adverse reactions to PEGylated drugs.
Potential Major Revisions<br /> 1. Study Design and Population Detail Improvement: The current study design section provides a basic overview of the population criteria (pg. 7) but lacks deeper context about the broader representativeness of the sample size and demographics. Additional detail on potential regional and healthcare-specific biases can help contextualize the findings better for international readers.
-
Methodological Clarification: Some methodological aspects, such as the exact ELISA techniques used and their validation, are mentioned cursorily (pg. 11). A more comprehensive separate methodological section could provide greater clarity and benefit reproducibility.
-
Detailed Analysis of Influencing Factors: The discussion of influencing factors like maternal age and cosmetic use (pg. 11) needs expansion to delve into how these were statistically analyzed and how robust these findings are. The differences in antibody prevalence and levels based on lifestyle factors should be discussed with more supporting data.
-
Potential Confounders: Addressing potential confounding variables not examined in the study could enhance its robustness. Consider expanding the discussion around potential other environmental and genetic factors influencing anti-PEG antibodies not addressed in this study.
-
Discussion on Clinical Implications: While the study raises concerns about the safety of PEGylated drugs, it stops short of providing specific clinical recommendations or guidelines. This section could be expanded to address more direct implications for clinical practice and public health policies (pg. 10).
Recommendations<br /> 1. Expand and Detail the Methodological Section: Expand where necessary, especially focusing on the validation and comparison of ELISA techniques used between this study and previous studies.<br /> 2. In-depth Statistical Analysis: Include more detailed statistical tables and charts to back the discussions around influencing factors and antibody levels.<br /> 3. Address Confounders: Identify and address other potential influencing factors and confounders that were not examined and discuss their potential impact on the findings.<br /> 4. Clinical Guidelines Discussion: Provide a more detailed discussion with possible clinical guidelines or recommendations addressing the raised safety concerns about the use of PEGylated drugs in seropositive populations.
Potential Minor Revisions<br /> 1. Typographical Errors: Correct minor typographical errors, such as any found in the description and presentation of data in figures and tables (pg. 7).<br /> 2. Formatting Consistency: Ensure that formatting is consistent throughout the document, particularly around headings and subheadings for better readability.<br /> 3. AI-Generated Content Analysis: No significant AI-generated content was detected in the document. The content is likely produced by human authors, given the nuanced arguments and specific scientific context presented.
By addressing these points, the study could provide a more thorough and accessible analysis of its findings, enhancing its contribution to the understanding of pre-existing anti-PEG antibodies in pregnant women and newborns.
-
-
-
www.medrxiv.org www.medrxiv.org
-
On 2024-12-06 02:09:34, user xPeer wrote:
Courtesy review from xPeerd.com
Summary
The preprint titled "RGnet: Recessive Genotype Network in a Large Mendelian Disease Cohort" introduces RGnet, a novel tool for analyzing recessive genotypes in large cohorts, focusing on compound heterozygotes and homozygotes. The study applied RGnet to the SLC26A4 gene within a cohort of individuals with hearing loss, identifying significant pathogenic variants and demonstrating the tool's potential for advancing the understanding of recessive genetic disorders. The paper highlights the novelty of RGnet, the methodology involving variant preprocessing, phasing, network construction, and permutation-based enrichment analysis, and presents the results from its application to the CDGC cohort.
Potential Major Revisions
- Reproducibility and Data Availability:
- Ensure that the datasets and tools used in this study are accessible. Although the paper mentions the availability of RGnet on GitHub, details about accessing specific datasets (e.g., CDGC data) were not explicit.
-
Example: "RGnet is available from GitHub at https://github.com/jiayiiiZeng/RGnet " (page 1) but does not provide direct links or instructions for data access.
-
Robustness of the Methodological Framework:
- Explain the justification for the chosen phasing methods (trio-based, read-based, expectation-maximization algorithms) and their combination.
-
Example: "This study employs a combination of trio-based phasing, read-based phasing, and an expectation-maximization phasing algorithm" (page 3). However, specific reasons for selecting these methods are not provided.
-
Statistical Analysis:
- Provide a more detailed description of the permutation tests used for RG enrichment analysis and why 100,000 permutations were specifically chosen.
-
Example: The paper states that "100,000 permutations were performed" without detailing the basis for this choice (page 5).
-
Ethical Considerations:
- Include a section discussing ethical considerations, particularly concerning patient data privacy and consent given the sensitive nature of genetic data.
- There is no mention of ethical reviews or consent processes, which is crucial for studies involving human genetic information.
Potential Minor Revisions
- Typos and Grammar:
- Correct minor typos and ensure grammatical consistency. For example:
- Line 18, page 1: "To address this 18 gap" should be "To address this gap".
-
Line 58, page 2: "research3,4" should be "research" followed by proper citations.
-
Formatting Issues:
- Ensure consistent citation formatting throughout the text.
-
In the reference section, ensure that all references, such as URL links, are formatted and hyperlinked correctly. For example, repeat the formatting used for URL links like " https://doi.org/10.1101/2024.12.02.24318353 " for other references as well.
-
AI Content Analysis:
- The paper does not provide any indications of AI-generated content. It appears authentically authored by humans, considering its depth and technical specialization.
Recommendations
- Increase Transparency in Methodological Choices:
-
Provide a more granular explanation of the methodological decisions, particularly around the choice of phasing methods and permutation tests.
-
Enhance Data Accessibility:
-
Ensure that all datasets and supporting materials are accessible, with clear instructions for researchers wishing to replicate the study or apply the RGnet tool.
-
Incorporate an Ethical Review Section:
- Add an ethics section discussing how patient data was handled, the consent process, and any relevant ethical approvals obtained for this study.
By addressing these major and minor revisions, the paper can be significantly strengthened, ensuring clarity, reproducibility, and ethical adherence, which are vital for advancing research in genetic studies.
-
-
www.medrxiv.org www.medrxiv.org
-
On 2021-07-26 04:09:55, user Matthew Robertson wrote:
“Our models estimate that nearly a third of COVID-19 cases would have been prevented if one of two exposures (diet and deprivation) were not present.”
The above sentence from the discussion section implies a causative relationship, but this study can not demonstrate causality, as has been correctly identified in the limitations section. In fact, it’s likely that socioeconomic deprivation (especially as it is measured in this study – postcode) is at least partially a surrogate indicator for other factors. Socioeconomic status is correlated with many things which could conceivably be more direct causes, for example: Vitamin D status[1], mental health[2], self-regulation[3] (and downstream effects there of), delayed gratification (even in people merely provided with environmental cues of poverty[4] ).
Also, only relative metrics are reported. Are you able to give any indication of where the sample/population diet scores sit in absolute terms, the HR of each additional serving of each food type (and plateau/high point), and/or describe the FFQ data (intra-quartile medians/distributions of each food)? I see the data that could inform the above is available, but given that there is an accessibility barrier to the data, it would be helpful to provide such granular information in an annex.
It is not only the use of a FFQ that reduces the resolution of the data, but also the use of an index to report and reduce the dataset to a single number. A plateau effect is not uncommon (for example the plateau in all-cause mortality observed at >5 servings of fruit/veg per day in one meta-analysis[5] ), but the point of plateau could also be the point at which the metric (index) ceases to have utility, and a refined, non-reductive or conditional-reasoning metric(s) continues to be useful. This point is highly significant in making any conclusions at all about the relative contribution of diet vs. socioeconomic status to Covid risk.
References
[1] Léger-Guist'hau J, Domingues-Faria C, Miolanne M, et al. Low socio-economic status is a newly identified independent risk factor for poor vitamin D status in severely obese adults. J Hum Nutr Diet. 2017;30(2):203-215. doi:10.1111/jhn.12405
[2] Isaacs AN, Enticott J, Meadows G, Inder B. Lower Income Levels in Australia Are Strongly Associated With Elevated Psychological Distress: Implications for Healthcare and Other Policy Areas. Front Psychiatry. 2018;9:536. Published 2018 Oct 26. doi:10.3389/fpsyt.2018.00536
[3] Palacios-Barrios, E. E., & Hanson, J. L. (2019). Poverty and self-regulation: Connecting psychosocial processes, neurobiology, and the risk for psychopathology. Comprehensive Psychiatry, 90, 52–64. https://doi.org/10.1016/j.comppsych.2018.12.012
[4] Liu L, Feng T, Suo T, Lee K, Li H. Adapting to the destitute situations: poverty cues lead to short-term choice. PLoS One. 2012;7(4):e33950. doi:10.1371/journal.pone.0033950
[5] Wang, X., Ouyang, Y., Liu, J., Zhu, M., Zhao, G., Bao, W., & Hu, F. B. (2014). Fruit and vegetable consumption and mortality from all causes, cardiovascular disease, and cancer: systematic review and dose-response meta-analysis of prospective cohort studies. BMJ : British Medical Journal, 349(jul29 3), g4490–g4490. https://doi.org/10.1136/bmj.g4490
-
-
www.medrxiv.org www.medrxiv.org
-
On 2021-07-29 08:16:26, user Enzo wrote:
Comparing the rates of severe adverse events such as VTE or TCP between groups of vaccinated people and groups of Covid-19 patients is not likely to be a sufficient way to evaluate risk/benefit ratio. One should take into account that the number of people who get Covid in a year is many-fold smaller than the nummber of people receiving a vaccine jab. (Approx 200 million people got Covid in the world in 20 months, vs 2 billion people who received at least 1 dose, and 4 billion doses already received in 8 months.)<br /> So, even with a 15-fold higher rate of excess VTE/TCP among covid-19 patients than among vaccinated people, if the number of vaccinated people (or jabs) is more than 15-fold higher than the number of covid-19 infections during a given period of time, then vaccination campaigns are to produce more VTE/TCP victims than Covid-19.<br /> ("number of vaccinated people (or jabs)" because if the increased risk linked to vaccines is specific to not yet identified "at risk persons", the number of vaccinated people should be taken into account. If it's inherent to each injection, the number of doses should be taken into account.)
-
-
www.medrxiv.org www.medrxiv.org
-
On 2021-08-06 07:17:04, user disqus_UQJEvw3dWd wrote:
Dear Dr Austen El-Osta,
We read with interest this preprint article “What is the suitability of clinical vignettes in benchmarking the performance of online symptom checkers? An audit study”. Studies addressing the suitability of different evaluation methods are useful, and vignettes methods in particular have known advantages as well as known shortcomings (Fraser et al., 2018; Jungmann et al., 2019). Further detailed analysis into the overall utility of vignettes methodologies is certainly important. Whilst the approach taken for exploring vignette methodologies here is interesting and warrants reading and careful consideration, two aspects of the study conduct and reporting are deeply worrying.
We ask for the authors to correct aspects of the paper where there is unequal and unbalanced methodology applied to the funder symptom checker (Healthily), as compared to those applied to the symptom checkers of the funder’s competitors (Ada and Babylon).
We also ask that the authors report results in a balanced manner in the abstract. All outcome measures should be reported fairly, irrespective of whether the funder’s symptom checker performed well in any particular measure. Please see below for a detailed description of these aspects.
We do not state that the selective application of methodology and the selective reporting of results has been deliberately conducted to bias the study to the benefit of the funder. However, the degree of different treatment of the funder’s symptom checker is so large, that an independent reader could draw that conclusion. We suggest rectifying the highlighted issues in the preprint, and, before submitting the manuscript for peer review.
Should these issues not be addressed in any future peer review process, we will in due course, also write to the editor of the publishing peer review journal.
Major concern 1 of bias towards study funder: The paper not only assesses the utility of a methodology, it also applies that methodology to report on relative performance of different symptom checkers (i.e. benchmarking).
This approach would be fair if the same methodology were applied to all the symptom checkers, however, the study presents a grossly unmatched analysis. One approach has been used for the funder’s symptom checker (Healthily) and a second for the symptom checkers of two main competitors of the funder. This gives the appearance of fundamental bias in testing and reporting based on study funding. Although some degree of bias may be introduced in studies for a multitude of reasons, deliberate application of fundamentally different testing methodologies to the products of the funder compared to those applied for their competitors is unacceptable. The Healthily symptom checker was tested with 6 inputters (4 professional non-doctor & 2 lay), whilst, for no rational justification, the Ada and Babylon symptom checker were tested with a testing group of fundamentally different make-up (not just the number of testers, but a systematic and deliberate choice to use a different type of tester population, i,e. 4 professional non-doctor inputters).
The number of tests also differed greatly (n=816 for Healthily, vs n=272 for Ada and Babylon). Additionally, only one professional non-doctor inputter recorded the consultation outcome and triage recommendation using Ada and Babylon symptom checkers, for all 139 vignettes, which is in contrast to the approach the authors adopted for Healthily.
Major concern 2 of bias towards study funder: There is also an important bias in selecting the results in the abstract. <br /> With respect to condition suggestion: In the results section, it is reported that “Ada consistently performed better than Healthily and Babylon in providing the correct consultation outcome in D1, D2 and D3” (i.e. in the provision of correct condition suggestions). The difference in performance was large: “The correct consultation outcome for Ada against the RCGP Standard at any disposition was 54.0% compared to 37.4% for Healthily and 28.1% for Babylon”. It is acknowledged in the abstract that condition suggestion (referred to as disposition/diagnosis) is a main outcome measure, however this measure is not reported in the abstract. This looks like selective reporting in the abstract to avoid negative messages about the funder’s symptom checker.
With respect to ‘triage recommendation’:<br /> It is reported in the results that “In benchmarking against the original RCGP standard, Healthily provided an appropriate triage recommendation 43.3% (95% CI 39.2%, 47.6%) of the time, whereas Ada and Babylon were correct 61.2% (95% CI 52.5%, 69.3%) and 57.6%, (95% CI 48.9%, 65.9%) of the time respectively (p<0.001). Again, this is omitted from the abstract, where only the aspects of the relatively positive performance of the funder’s symptom checker are reported.
We would welcome a change in this study to remove bias towards the funder in methodology and results reporting.
Yours faithfully
On behalf of Ada Health GmbH<br /> Dr. Stephen Gilbert<br /> Clinical Evaluation Director<br /> Ada Health GmbH<br /> Karl-Liebknecht-Str. 1<br /> 10178 Berlin, DE <br /> +49 (0) 152 0713 0836
REFERENCES
Fraser, H., Coiera, E., Wong, D., 2018. Safety of patient-facing digital symptom checkers. The Lancet 392, 2263–2264. https://doi.org/10.1016/S01...
Jungmann, S.M., Klan, T., Kuhn, S., Jungmann, F., 2019. Accuracy of a Chatbot (Ada) in the Diagnosis of Mental Disorders: Comparative Case Study With Lay and Expert Users. JMIR Formative Research 3, e13863. https://doi.org/10.2196/13863
-
-
www.medrxiv.org www.medrxiv.org
-
On 2021-09-11 12:19:37, user William Brooks wrote:
This study finds similar results to studies looking at infections among South Asians in England [1] and foreign workers in Kuwait [2]: lockdown heightened the curve for groups with more crowded living conditions. The results also agree with those of the nearest thing we have to a lockdown RTC: higher secondary attack rates in asylum centres that mass-quarantined all residents in Germany [3].
Despite this, the authors claim lockdowns work. Like a pharmaceutical intervention, for a non-pharmaceutical intervention to be said to work, the intervention group (e.g. NY, CA) has to show significantly lower mortality and morbidity than the control group (e.g. FL, SD), which isn’t the case [4]. Also, for extremely authoritarian interventions to justify their many negative side-effects, hospitals in the control group would need to be overflowing like the models predicted, which has never come close to happening.
[1] https://doi.org/10.1016/j.e...<br /> [2] https://doi.org/10.1186/s12...<br /> [3] https://doi.org/10.1101/202...<br /> [4] https://doi.org/10.1101/202...
-
-
www.medrxiv.org www.medrxiv.org
-
On 2020-05-01 11:05:45, user Robin Whittle wrote:
Please see this report from Dr Mark Alipio, Davao Doctors College; University of Southeastern Philippines: Vitamin D Supplementation Could Possibly Improve Clinical Outcomes of Patients Infected with Coronavirus-2019 https://papers.ssrn.com/sol... . Hospitalised COVID-19 patients were classified into Mild (without pneumonia), Ordinary (CT confirmed pneumonia with fever and respiratory symptoms), Severe (hypoxia and respiratory distress) and Critical (respiratory failure).
Of the 55 patients with greater than 30ng/ml (20nmol/L) 25OHD, 47 had Mild symptoms, 4 Ordinary, 2 Severe and 2 Critical. Of the 157 patients with 30ng/ml or less, 2 had Mild symptoms, 55, Ordinary, 54 Severe and 46 Critical.
On this basis, if everyone had more than 30ng/ml 25OHD, very few people would be dying from COVID-19 and there would be no need for lockdowns, with their extremely high social, health and economic costs.
In this research, Gallagher et al. 2014 “Vitamin D supplementation in young White and African American women” https://www.ncbi.nlm.nih.go... , almost all the White women had less than 30ng/ml 25OHD. Those who took 2500IU vitamin D3 raised their levels significantly, but about 16% of them were still below 30ng/ml. 4000IU a day would improve on this considerably. African American women generally had lower levels.
4000IU is 0.1 milligrams a day. A gram would last for 27 years. The ex-factory price of vitamin D is USD$2.50 a gram, so the cost of this good, healthy, level of vitamin D supplementation is 9 cents a year, plus the cost of making and distributing and selling capsules. D3 need only be taken every week or two. My wife and I take a 50,000IU capsule three times a month.
Figure 3 at https://www.ncbi.nlm.nih.go... shows that normal weight people taking 4000IU a day will, on average, reach 47ng/ml (117nmol/L) which is about the average level of African herders and hunter gatherers reported in https://www.ncbi.nlm.nih.go... . Toxicity (https://www.ncbi.nlm.nih.go... "https://www.ncbi.nlm.nih.gov/pmc/articles/PMC6158375/)") may occur at levels three times this.
More links to research are at my page: http://aminotheory.com/cv19/
-
-
www.medrxiv.org www.medrxiv.org
-
On 2021-12-28 14:23:53, user Zacharias Fögen wrote:
Dear Authors,
Thank you for this study, which clearly demonstrates that there is no IgA response to vaccination, thus not causing immunity to infection. Yet, irritatingly, you claim the opposite.
Figure 2F shows that there is no significant RBD-IgA after 2 vaccinations.
As for Spike-IgA, there is a wrong labeling in Figure 2E, as the "ns" should belong to the comparison "neg-ctrl vs. mrna 2 doses" and not to "covid-19 vs.mrna 2 doses" the latter being clearly significant, the former showing that the median of "mrna 2 Doses" is below the positive cutoff.
Furthermore, your "Baseline" mean in figure 2K is much higher (about 2,5%) than "negative control" in figure 2E (about 0%). Since both "baseline" and "negative control" are not vaccinated, this points to a selection bias for your negative control.<br /> Figure 2K also shows that there is no significant difference concerning "Baseline" and "2-4 weeks post dose 2". Yet, there is a significant difference between doses 1 and 2, as well as 1 and baseline.<br /> When comparing "baseline" and "mrna 2 Doses", "mrna 2 doses" is as high as "2-4 weeks post dose 2", which is not significantly different from "baseline" (Figure 2K).
So, there is no significant IgA (both Spike-IgA and RBD-IgA) after 2 doses of vaccination.
As far as the increase after 1st dose, but not after the second dose, this either points to an unknown bias, or it shows that multiple vaccinations do not increase IgA production, hinting at a lack of booster efficiency.
In Version 2 you had 6 month follow-up values in figure 1, yet in figure 3 the 6-month follow up (now figure 2) was removed. Why is that?
I kindly ask for the underlying data.
Greetings, Zacharias Fögen
-
-
www.medrxiv.org www.medrxiv.org
-
On 2022-01-13 13:10:50, user David Knight wrote:
Scotland's latest official public health real world data tallies up with the negative effectiveness found by the scientists that carried out this study.
https://publichealthscotlan...
See Table 15.
People who had only 2 jabs were almost 3 times more likely to catch Covid in the week 25th Dec-31st Dec than the unvaccinated (who were similar to the 'boosted')
Unvaccinated 1,555,449, cases 20,276, 1.3%<br /> 2 Doses 1,522,961, cases 54,727, 3.59%<br /> Boosted 2,429,498, cases 30,222, 1.24%
But if you are boosted you appear to be at least 4 times less likely to be hospitalised or worse from Covid, than the 2 jabbed/unvaccinated. See tables 16 and 17. So there still is a case for the vaccines
-
-
www.medrxiv.org www.medrxiv.org
-
On 2020-07-21 16:14:03, user Kamran Kadkhoda wrote:
Baes on the current estimates, the sero-prevalence in Idaho is around 4% at most; such high percentages are most likely false positives; I refer authors to the study just posted here on medrxiv from China showing sero-prevalence of 2% or less in Wuhan! They used PRNT to confirm the results. That's the right way. <br /> Abbott is clear in their IFU by saying they did NOT use samples from cases with confirmed infection with common CoVs…<br /> Despite publications using "convenience samples" specificity shows its shortcoming while used large scale in the field...here's one example!
-
-
www.medrxiv.org www.medrxiv.org
-
On 2020-07-25 12:17:53, user John H Abeles wrote:
Hydroxychloroquine ( HCQ ) and Covid19
The negative observational and controlled clinical studies to date refer mainly to using hydroxychloroquine (HCQ) in serious, later stage, hospitalised Covid19 patients
In both the Solidarity/WHO study and the Recovery/UK study extremely high, even massive doses ( up to 6 times that recommended for early CoVid19 patients!) were used for unknown reasons - since the half-life of HCQ is around 21-30 days these daily massive doses could have caused very high blood levels and likely were fatal in some instances - so HCQ group deaths could have been caused by such high dose regimes, so probably skewed the results ..
Also this is likely the wrong group of patients to treat with maximum effect, in the first place — early Covid19 is the best arena for HCQ treatment in combination with zinc and either azithromycin or doxycycline...
It must be stated that no known oral antiviral for outpatients works maximally unless given quite early in disease eg oseltamivir/Tamiflu influenza; valacyclovir/Valtrex in herpes
Even iV remdesivir - a potent SARS-CoV-2 antiviral - didn’t achieve hoped for results in hospitalised patients
Later stage Covid19 patients are mostly suffering from the effects of hyperinflammation ( cytokine storm) and when viral titres are well beyond their peaks. Hyperinflammation can cause myocarditis which can certainly predispose to further cardiac toxicity.
[There are interesting thoughts that the hospitalised patients with cytokine storm / hyperinflammation in reality have a form of ADE ( antibody dependent enhancement of disease ) ie a hyperimmune reaction to a second SARS-CoV-2infection or as a result of a SARS-CoV-2 infection after a previous infection with a closely related virus]
HCQ was also used in the negative studies without added zinc which could be a design for failure, as one of the main, but certainly not only, antiviral actions of HCQ is as a zinc ionophore ie it gets zinc to enter cells much more easily where it can exert its added and established antiviral actions
HCQ is a known antiinflammatory and this action may be of some use in the hyperinflammation stage in hospitalised patients, but other more potent immunosuppressive ( and a few candidates that are nonimmusuppresive immunotherapies) could be more demonstrative in this regard.
Despite this there are some data to suggest benefit of HCQ even in hospitalised patients
For early Covid19 the usually prescribed course is for 5 to 7 days of around 400 mg daily HCQ with 100-200 mg zinc which would not invoke the long term side effects mentioned so often - and very few toxicities are reported even in long term therapy for autoimmune disorders. Any short-term arrhythmia concerns can be allayed by making sure of normal potassium blood levels
In the several thousands of outpatient Covid19 case reports published up to now , when used in early disease, there have been few if any major side effects noted.
(But in later stage, serious hospitalised patients many other drugs are also used, bringing into question the possibility of toxic interactions with HCQ. Also organ damage including myocarditis -heart inflammation-could be a particular predisposing factor in hospitalised patient toxicity predisposition to HCQ )
HCQ is a cheap, easily made generically available drug - and main manufacturers, like Novartis and Teva have donated billions of doses worldwide since the event of Covid19, so shortages, as some fear, for those taking it for malaria ( preventions or treatment) or for autoimmune diseases, like lupus or rheumatoid arthritis etc are highly unlikely
Here below are some pertinent positive references for further reading on the question of HCQ plus zinc plus either doxycycline ( my preferred choice because it isn’t associated with further small cardiac risk) or azithromycin
Note : Most of the successful reports of the use of HCQ plus zinc etc are in early stage, outpatients and not in late stage, hospitalised patients
The first link is a large data base (more than 50 studies ) on HCQ in Covid19 treatment
The second reference is an important review from a Yale University professor ...
The third and fourth are on a recent, large, well conducted observational study from Henry Ford Hospital ...
The fifth is an important outpatient study ...
https://academic.oup.com/aj...
https://www.ijidonline.com/...
https://www.henryford.com/n...
https://www.preprints.org/m...
https://www.ijidonline.com/...
https://www.preprints.org/m...
https://aapsonline.org/hcq-...
https://www.medrxiv.org/con...
https://www.preprints.org/m...
https://www.evms.edu/media/...
https://link.springer.com/a...
https://pjmedia.com/news-an...
https://www.medrxiv.org/con...
https://www.medrxiv.org/con...
https://www.middleeasteye.n...
http://www.ijmr.org.in/prep...
https://aapsonline.org/hydr...<br /> decide/
-
-
www.medrxiv.org www.medrxiv.org
-
On 2021-02-11 16:06:09, user David McAllister wrote:
Congratulations on this excellent work. The potential for ICS therapy to improve outcomes for intermediate risk individuals not yet vaccinated is tantalising.
No doubt the paper is currently under peer-review, but if the authors have time it would be great to know the following:-<br /> 1. How many of the primary endpoint events included hospitalisation.<br /> 2. How was such a high proportion of positive tests for SARS-CoV-2 obtained? Was this based on subjective clinical judgement, or was there some other factor driving the high pre-test probability ?<br /> 3. How difficult was it to teach adequate inhaler technique?<br /> 4. Did any of the participants have wheeze or other signs of reversible airflow obstruction?<br /> 5. Were any steps taken to exclude participants who might have had a lobar pneumonia (eg by excluding individuals with purulent sputum)?<br /> 6. In the Guardian interview it was mentioned that at least 5 other trials were investigating this use of ICS. Is it possible to say when these are due to report?
-
-
www.medrxiv.org www.medrxiv.org
-
On 2021-02-24 02:58:40, user Eric O'Sogood wrote:
- The trial was stopped early and did not enroll enough subjects to meet its own initial power calculations. 2. Single dose ivermectin at this stage is not the recommended regimen. 3. Ivm arm had the highest d dimer (p 0.01) and I do not see any discussion of anticoagulant beyond thromboprophylaxis. 4. Absorbtion of ivm with food rises ~4 fold, was it given on an empty stomach or with food? 5. The authors write that this is the first trial of ivm vs placebo. There are already 5.
-
-
www.medrxiv.org www.medrxiv.org
-
On 2021-04-30 14:31:06, user Gustavo Bellini wrote:
congratulations on the study! it would be interesting if the dose of cholecalciferol and calcifediol used was reported. patients supplemented with Colecalciferol may have had less protection because they were supplementing with low doses, which were not sufficient to raise the levels of 25OHD to the ideal range, so that vitamin D performs its immunomodulatory functions at maximum level. it would also be very interesting if 25OHD levels were reported in the supplemented groups and in a sample from the control group.
it is also important to note that a daily dose of around 5,000 IU (person weighing> 50 kg) of cholecalciferol will cause the 25OHD levels to gradually increase and stabilize at around 50ng / ml only after 4 months. on the other hand, an attack dose of 600,000 IU of cholecalciferol in people with low levels causes the 25OHD levels to rise in 3 days to the optimum range. the level starts to drop after 15 days, and in order to stay in the ideal range, a daily (5,000 IU) or weekly (35,000 IU) supplementation with realistic doses should be started. if supplementation is not done continuously, the 25OHD levels fall back to around 20ng / ml in a 2-month interval.
-
Daily oral dosing of vitamin D3 using 5000 TO 50,000 international units a day in long-term hospitalized patients: Insights from a seven year experience<br /> https://doi.org/10.1016/j.j...
-
Effect of a single oral dose of 600,000 IU of cholecalciferol on serum calciotropic hormones in young subjects with vitamin D deficiency: a prospective intervention study<br /> https://doi.org/10.1210/jc....
-
-
-
www.medrxiv.org www.medrxiv.org
-
On 2020-06-24 18:56:17, user André GILLIBERT wrote:
Title : Proposal for improved reporting of the Recovery trial<br /> André GILLIBERT (M.D.)1, Florian NAUDET (M.D., P.H.D.)2<br /> 1 Department of Biostatistics, CHU Rouen, F 76000, Rouen, France<br /> 2 Univ Rennes, CHU Rennes, Inserm, CIC 1414 (Centre d’Investigation Clinique de Rennes), F- 35000 Rennes, France
**Introduction**
Dear authors,<br /> We read with interest the pre-print of the article entitled “Effect of Dexamethasone in Hospitalized Patients with COVID-19: Preliminary Report”. This reports the preliminary results of a large scale randomized clinical trial (RCT) conducted in 176 hospitals in the United Kingdom. To our knowledge it is the largest scale pragmatic RCT comparing treatments of the COVID-19 in curative intent. The 28-days survival endpoint is objective, clinically relevant and should not be influenced by the measurement bias that may be caused by the open-label design. While 2,315 study protocols have been registered on ClinicalTrials.gov about COVID-19, as of June 24th 2020, Recovery is, to our knowledge, the only randomized clinical trial on COVID-19 that succeeded to include more than ten thousands patients. The open-label design and simple electronic case report form (e-CRF) may have helped to include a non-negligible proportion of all COVID-19 patients hospitalized in the United Kingdom (UK). Indeed, as of June 24th 2020, approximatively 43,000 patients died of COVID-19 in hospital in the UK, of whom approximatively 0.24 × 11,500 = 2,760, that is more than 6% of all hospital deaths of COVID-19, where included in the Recovery study.<br /> Having read with interest version 6.0 of the publicly available study protocol (https://www.recoverytrial.n... "https://www.recoverytrial.net/files/recovery-protocol-v6-0-2020-05-14.pdf)") we had hoped for more details in the reporting of methods and results of this trial and take advantage of the open-peer review process offered by pre-prints servers to suggest improving some aspects of the reporting before the final peer-reviewed publication. Please, find below some easy to answer comments that may help to improve the article overall.
**Interim analyses and multiple treatment arms**
The first information would be about interim analyses. The protocol (version 6.0) specifies that it is adaptive and that randomization arms may be added removed or paused according to decisions of the Trial Steering Committee (TSC) basing its decision on interim analyses performed by the Data Monitoring Committee (DMC) and communicated when “the randomised comparisons in the study have provided evidence on mortality that is strong enough […] to affect national and global treatment strategies” (protocol, page 16, section 4.4, 2nd paragraph). The Supplementary Materials of the manuscript specifies that “the independent Data Monitoring Committee reviews unblinded analyses of the study data and any other information considered relevant at intervals of around 2 weeks”. This suggests that many interim analyses may have been performed from the start (March 9th) to the end (June 8th) of the study.<br /> Statistically, interim analyses not properly taken in account generate an inflation of the type I error rate which may be increased again by the multiple treatment arms. Methods such as triangular tests make it possible to control the type I error rate. Most methods of control of type I error rate in interim analyses require that the maximal sample size be defined a priori and that the timing and number of interim analyses be pre-planned. This protocol being adaptive, new arms were added, implying new statistical tests in interim analyses, and no pre-defined sample size as seen in page 2 of the protocol: “[...] it may be possible to randomise several thousand with mild disease [...], but realistic, appropriate sample sizes could not be estimated at the start of the trial.” This make control of the type I error rate difficult. The fact that the study has been stopped on the final analysis as we understand from the current draft rather than interim analysis does not remove the type I error rate inflation. The multiple treatment arms lead to another inflation of the type I error rate.<br /> The current manuscript does not specify any procedure to fix these problems. The Statistical Analysis Plans (SAP) V1.0 (in section 5.5) and V1.1 (in section 5.6) specify that “Evaluation of the primary trial (main randomisation) and secondary randomisation will be conducted independently and no adjustment be made for these. Formal adjustment will not be made for multiple treatment comparisons, the testing of secondary and subsidiary outcomes, or subgroup analyses.” and nothing is specified about interim analysis. Therefore, we conclude that no P-value adjustment for multiple testing has been performed, neither for multiple treatment arms nor for interim analysis. If an interim analysis assessing 4 to 6 treatment arms at the 5% significance level has been performed every 2 weeks from march to June, up to 50 tests may have been performed, leading to major inflation of type I error rate. In our opinion, the best way to assess and maybe fix the type I error rate inflation, is to report with maximal transparency every interim analysis that has been performed, with the following information:<br /> 1. Date of the interim analysis and number of patients included at that stage<br /> 2. Was the interim analysis planned (e.g. every 2 weeks as planned according to supplementary material) or unplanned (e.g. due to an external event, for instance the article of Mehra et al about hydroxychloroquine published in The Lancet, doi:10.1016/S0140-6736(20)31180-6), and if exceptional, why?<br /> 3. Which statistical analyzes, on which randomization arms, have been performed at each stage <br /> 4. If predefined, what criteria (statistical or not) would have conducted to early arrest of a randomization arm for inefficiency and what criteria would have conducted to arrest for proved efficacy?<br /> 5. If statistical criteria were not predefined, did the DMC provide a rationale for his choice to communicate or not the results to the TSC? If yes, could the rationale be provided?<br /> 6. The results of statistical analyzes performed at each step<br /> 7. The decision of the DMC to communicate or not the results to the TSC and which results have been reported as the case may be<br /> The information about interim analyses and multiple randomization arms will help to assess whether the inflation of type I error rate is severe or not. A post hoc multiple testing adjustment, taking in account the many randomized treatments and interim analyses, should be attempted, and discussed, even though there may be technical issues due to the adaptative nature of the protocol.
**Adjustment for age**
An adjustment for age (in three categories <70 years, 70-79, >= 80 years, see legend of table S2) in a Cox model was performed for the comparison of dexamethasone to standard of care in the article. This adjustment was not specified in the version 6.0 of the protocol but was, according to the manuscript “added once the imbalance in age (a key prognostic factor) became apparent”. This is confirmed by the addition of a words ““However, in the event that there are any important imbalances between the randomised groups in key baseline subgroups (see section 5.4), emphasis will be placed on analyses that are adjusted for the relevant baseline characteristic(s).” in section 5.5 page 16 of the SAP V1.1 of June 20th compared to the SAP V1.0 of June 9th which specified a log-rank test. The SAP V1.0 of the 9th June may have been written before the database has been analyzed (data cut June 10th) but the SAP of the 20th has probably been written after preliminary analysis have been performed. This is consistent with the words “became apparent” of the manuscript. Therefore, in our opinion, this adjustment must be considered as a post hoc analysis rather than as the main analysis. Moreover, even though the SAP V1.1 specifies that an “important imbalance” will lead to an “emphasis” on adjusted analyses, it does not change the primary analysis (see section 5.1.1 page 14). It is not clear what “important imbalance” means. To interpret that, we will perform statistical tests to assess balance of key baseline subgroups specified in SAP V1.1 (see section 5.4):<br /> 1. Risk group (three risk groups with approximately equal number of deaths based on factors recorded at randomisation). Its distribution is shown in figure S2. A chi-square tests on the distribution of risk groups in Dexamethasone 1255/500/349 and Usual care 2680/926/715 groups, lead to a P-value=0.092. A chi-square test for trend yields a P-value equal to 0.23.<br /> 2. Requirement for respiratory support at randomisation (None; Oxygen only; Ventilation or ECMO). P-value=0.89 for chi-square test and P-value=0.86 for chi-square for trend.<br /> 3. Time since illness onset (<=7 days; >7 days). P-value=0.17<br /> 4. Age (<70; 70-79; 80+ years). P-value=0.016 for chi-square test, p=0.019 for chi-square test for trend<br /> 5. Sex (Male; Female). P-value=0.97 for chi-square test<br /> 6. Ethnicity (White; Black, Asian or Minority Ethnic). No data found.<br /> The criteria to define “important imbalance” seems to be statistical significance at the 0.05 threshold, however that should have been stated and tests for all other variables should have been provided too.<br /> First, this adjustment, from a theoretical point-of-view, was not necessary since the study was randomized; if the exact condition of imbalance triggering the adjustment was pre-specified in the protocol or SAP before the imbalance was known, it could induce a very slight reduction of the type I error rate and power. However, as it was performed when the imbalance was known, there is a risk that the sign of the imbalance (i.e. higher age in the dexamethasone group) have influenced the choice of adjustment. Indeed, an adjustment conditional to a higher age in the dexamethasone group will increase the estimated effect of dexamethasone in these conditions, and so, provide an inflation of the type I error rate. If the same conditional adjustment were further considered for other prognostic variables, the inflation could even be higher. <br /> Unless there is strong evidence that the amendment to the SAP was performed without knowledge of the sign of the imbalance (higher age in the dexamethasone group), we suggest that the primary analysis be kept as originally planned, without adjustment, and that the age adjustment be performed in a sensitivity analysis only. The knowledge of the sign of the unbalance is unclear in the last version of the SAP (V1.1, June 20th) and in the manuscript. In addition, in an open label trial, it is always better to stick to the protocol.
**Results in other treatment arms**
The manuscript specifies that “the Steering Committee closed recruitment to the dexamethasone arm since enrolment exceeded 2000 patients.” It is not stated whether any other treatment arm has exceeded 2000 patients or not and whether the study is still ongoing. Results of treatment arms that have been stopped should be provided (all arms having enrolled more than 2000 patients?). If not, the number of patients randomized in other treatment arms should, at least, be reported. If the study is completely stopped, all treatments should be analyzed and reported, unless there is a specific reason not to do so; that reason should be stated as the case may be. This data would be useful to provide evidence on other molecules. It would also clarify the number of statistical tests that have been performed or not, providing more information about the overall inflation of alpha risk.
**Sample size**
The paragraph about the sample size suggests that inclusions were planned, at some time, to stop when 2000 patients were included in the dexamethasone arm. The amended protocol (May 14th), the SAP V1.0 (June 9th) and the SAP V1.1 (June 20th, 4 days after the results have been officially announced) all have a paragraph about the sample size but all specify that the sample size is not fixed and none specify any criteria of arrest of the research based on sample size. There are 2104 patients included in this arm, which is substantially larger than the target of 2000 patients. The exact chronology and methodology should be clarified: when was the sample size computed and what was the exact criteria to arrest the research? Could the document (internal report?) related to this sample size calculation and statistical or non-statistical decision of arrest of the research be published in supplementary material?<br /> Indeed, assessment of the type I error rate requires knowing exactly when and why the research has been arrested: arrest for low inclusion rate of new patients or for reaching target sample size cannot be interpreted the same as arrest for high efficacy observed on an interim analysis.
**Future of the protocol**
With the new evidence about dexamethasone, the protocol will probably be stopped or evolve. The future recruitment may slow as the peak of the epidemic curve in United Kingdom is passed. The past, present and future of the protocol needs also to be known to assess the actual type I error rate. Indeed, future analyses, that have not yet been performed influence the overall type I error rate. That is why we suggest that author’s provide the daily or weekly inclusion rate from March to June and discuss the future of the study.
**Loss to follow-up**
Table S1 shows that the follow-up forms have been received for 1940/2104 (92.2%) patients of the dexamethasone group and 3973/4321 patients of the usual care group (91.9%). The patients without follow-up forms (8.5% overall) may either be lost to follow-up or have been included in the 28 last days before June 10th 2020 (data cut). The manuscript mentions that 4.8% of patients “had not been followed for 28 days by the time of the data cut”, suggesting that 8.5%-4.8% = 3.7% of patients are lost to follow-up, but that is our own interpretation. We suggest that authors report the actual number of loss to follow-up and how their data have been imputed or analyzed. The number of loss to follow-up may differ for different outcomes. For instance, if the Office of National Statistics (ONS) data has been used for vital status assessment, there should be no loss to follow-up on that outcome.
**Vital status**
The current manuscript only specifies the data of the web-based case report (e-CRF) form, filled by hospital staff, as source of information, suggesting that it is the only source of information about the vital status. The document entitled “Definition and Derivation of Baseline Characteristics and Outcomes” provided at https://www.recoverytrial.n... specifies many other sources. For instance, the vital status had to be assessed from the Office of National Statistics (ONS). Other sources, including Secondary Use Service Admitted Patient Care (SUSAPC) and e-CRF could be used for interim analysis. The ONS was considered as the defining source (most reliable). Whether the ONS data has been used or not should be clarified. If the ONS data have been used, statistics of agreement of the two data sources (e-CRF and ONS) may be provided to help assessing the quality of data. If the ONS data have not been used, this deviation from the planned protocol should be documented.<br /> The manuscript as well as the recovery-outcomes-definitions-v1-0.pdf file specifies that the follow-up form of the e-CRF is completed at “the earliest of (i) discharge from acute care (ii) death, or (iii) 28 days after the main randomisation”. If the follow-up form is not updated further, patients discharged alive before day 28 (e.g. day 14) may have incomplete vital status information at day 28. The following information should be specified:<br /> 1. Whether the follow-up form of the e-CRF had to be updated by hospital staff at day 28 for these patients<br /> 2. If response to (1) is yes, whether there was a means to distinguish between a lost to follow-up at day 28 (form not updated) and a patient discharged and alive at day 28 (form updated to “alive at day 28”)<br /> 3. If response to (2) is yes, how many patients discharged before day 28 were lost to follow-up at day 28<br /> 4. If response to (2) is yes, how has their vital status at day 28 been imputed or managed in models with censorships (log-rank, Kaplan-Meier, Cox)<br /> Of course, this information is really needed if the ONS and SUSAPC data have not been used.<br /> The quality of the vital status information is critical in such a large scale open-label multi-centric trial, because there is a risk that one or more center selectively report death, biasing the primary analysis.
**Inclusion distribution by center**
A multicentric study provides stronger evidence than a single-center study but sometimes, few centers include most patients, with a risk of low-quality data or selection bias. The very high number of included patients in the Recovery trial suggests that many centers included many patients but the distribution of inclusions per center could be reported.
**Randomization**
The protocol specifies that “in some hospitals, not all treatment arms will be available (e.g. due to manufacturing and supply shortages); and at some times, not all treatment arms will be active (e.g. due to lack of relevant approvals and contractual agreements).” This is further clarified in the SAP V1 (section 2.4.2 Exclusion criteria, page 8) by the sentence “If one or more of the active drug treatments is not available at the hospital or is believed, by the attending clinician, to be contraindicated (or definitely indicated) for the specific patient, then this fact will be recorded via the web-based form prior to randomisation; random allocation will then be between the remaining (or indicated) arms.” Showing that randomization arms may be closed on an individual basis, when the patient is included, with the argument of contraindication or definitive indication. It seems that the “standard of care” group could not be removed and that at least another randomization arm had to be kept as suggested by the words “random allocation will then be between the remaining arms (in a 2:1:1:1, 2:1:1 or 2:1 ratio)” in section 2.9.1 page 11 of the SAP V1.0. Even exclusion of a single randomization arm can lead to imbalance between groups. For instance, if physicians believed that a treatment was contraindicated for the most severe patients, only non-severe patients could be randomized to the treatment’s arm, while most severe patients would be randomized to other arms. Several things can be done to assess and fix this bias. First, report how many times this feature has been used and which randomization arms have been most excluded. If it has been used many times, provide the pattern of use that help to assess whether this is a collective measure (e.g. 2-weeks period of shortage of a treatment in a center ? no major selection bias) or individual measure. If its use has been rare, a sensitivity analysis could simply exclude these patients. If it has been frequent, we suggest a statistical method to analyze this data without bias, based on the following principles: patients randomized between 3 randomization arms A, B and C (population X) are comparable for the comparisons of A to B. Patients randomized between A, B and D (population Y), are comparable for the comparisons of A to B. Population X and population Y may differ but, inside each population, A can be compared to B. Therefore, the within-X comparison of A to B and within-Y comparison of A to B are both valid and can be meta-analyzed to assess a global difference between A and B. This can be simply done with an adjustment on the population (X or Y) in a fixed effects multivariate model. Pooling of X and Y populations should not be performed without adjustment.<br /> A second problem with randomization exists although the dexamethasone arm is the least affected. Randomization arms have been added in this adaptative trial. When a new randomization arm is added, new patients may be randomized to this arm and fewer patients are randomized to other arms. Consequently, the distribution of dates of inclusion may differ between groups. This may have some impact on the mortality at two levels: (1) the medical prescription of hospitalization may have evolved as the epidemic evolved, with hospitalization reserved to most severe patients at the peak of epidemic and maybe wider hospitalization criteria at the start of epidemic and (2) evolution of patients included in the Recovery trial. Indeed, even if centers should have included as many patients as possible as soon as their inclusion criteria were met, it is possible that they have only included part of eligible patients and that this part evolved with time. This bias can be easily assessed and fixed: the curves of inclusions in the different arms and mortality rate in the Recovery trial can be drawn as a function of date (from March to June) and an adjustment on date of inclusion may be performed in a sensitivity analysis.
**Conclusion**
Recovery is the study with the best methodology that we have seen on COVID-19 treatments in curative intent and we salute the initiative of publishing transparently the protocol, its amendments, the statistical analysis plan and the first draft of the report. We hope that our reporting suggestions will be taken in account in the final version of the paper. We think that discussing these points will qualify the interpretation of results, further improve the transparent approach adopted by designers of the study and improve the reliability of the conclusions. We expect a high-quality reporting of these final results, with full transparency on interim analyses, statistical analysis plans and statistical analysis reports. We hope that these comments are helpful and again we acknowledge that this study is not solely outstanding in terms of importance of the results but is also a stellar example for the whole field of therapeutic research. We invite other researchers to provide comments to this article to engage in Open Science.
-
-
www.medrxiv.org www.medrxiv.org
-
On 2020-06-25 04:04:22, user Greg WHITTEN wrote:
Thank you for your work. I am curious, however, about some parts of your article.
First, I read your paper and could not see where you tried to control for the introduction of other virus-containment measures such as school closures, lock-downs, and physical distancing. Did I miss something in your paper?
Second, I have a question about your model #4 on page 9. You wrote "All<br /> regression coefficients were statistically significant in this model." The coefficient for the non-mask wearing rate in late April and early May is significant but negative. I.e., not wearing a mask in late April and early may reduces deaths on May 13th. Do you have any thoughts about this?
Third, did you consider performing a panel regression using deaths on all days, say, starting from March 31st (about 2 weeks after the March mask non-wearing rate) instead of relying just on deaths from May 13? Although you did explain why you chose May 13th, it may be better to use all death dates after, say, the incubation period for the virus.
Fourth, your section "Prediction of mask non-wearing rates" suggests that your regression analysis suffers from multicollinearity. Do you have any concerns about this?
-
-
www.medrxiv.org www.medrxiv.org
-
On 2020-12-29 00:37:11, user Olga Matveeva wrote:
Several recent preprints support some of this manuscript findings.<br /> 1. Authors from Sweden and China in a study entitled “Pulmonary stromal expansion and intra-alveolar coagulation are primary causes of Covid-19 death” demonstrated that “The virus was replicating in the pneumocytes and macrophages but not in bronchial epithelium, endothelial, pericytes or stromal cells. doi: https://doi.org/10.1101/202...<br /> 2. Researchers in Brasil investigated SARS-CoV-2 infection of PBMCs and found that in vitro infection of whole PBMCs from healthy donors was productive of virus progeny. They also found that “SARS-CoV-2 was frequently detected in monocytes and B lymphocytes from COVID-19 patients, and less frequently in CD4+T lymphocytes” The preprint is entitled “Infection of human lymphomononuclear cells by SARS-CoV-2”. <br /> doi: https://doi.org/10.1101/202...<br /> 3. SARS-CoV-2 infection of macrophages and some other immune cells in deceased patients was suggested in other autopsy related preprint entitled “Broad SARS-CoV-2 cell tropism and immunopathology in lung tissues from fatal COVID-19” doi: https://doi.org/10.1101/202... The study was done by US researchers from Pittsburgh. <br /> 4. Researchers in France demonstrated “that SARS-CoV-2 efficiently infects monocytes and macrophages without any cytopathic effect.” Their findings are reported in the preprint entitled “Monocytes and macrophages, targets of SARS-CoV-2: the clue for Covid-19 immunoparalysis” doi: https://doi.org/10.1101/202...
-
-
www.medrxiv.org www.medrxiv.org
-
On 2022-05-22 17:15:49, user Teresa Moreno wrote:
UPDATE MAY 2022: lessons for the monkeypox viral outbreak?
According to the Johns Hopkins data repository (updated in Dong et al 2020), case numbers of COVID-19 in Spain rose steadily and rapidly after the early December 2021 holiday to an omicron-driven post-Christmas peak far higher than any other during the SARS-CoV-2 pandemic. On 8th December 26,412 new cases were recorded, whereas by 11th January 2022 this figure had risen an order of magnitude to 292,394. The entirely predictable threat of a countrywide viral superspreading event boosted by Christmas celebrations, many in poorly ventilated indoor environments, had become real, with deaths from the disease peaking in late February 2022.
In May 2022 cases of monkeypox suddenly emerged in several countries worldwide. The pathogen responsible for this enzootic disease is belongs to the Orthopoxvirus genus which includes the virus causing smallpox. How is this global outbreak of monkeypox being transmitted? As in the early days of the emergence of COVID-19, initial public health statements are emphasising personal hygiene and avoidance of close physical contact with the saliva or lesions of infected individuals (ECDC 2022; Koslov 2022). The World Health Organisation states that "monkeypox virus is transmitted from one person to another by close contact with lesions, body fluids, respiratory droplets and contaminated materials such as bedding" (WHO 2022). This initial reaction to a new pattern of infectious disease is familiar (Moreno and Gibbons 2021). The spread of the now-eradicated smallpox virus was similarly considered to have been transmitted primarily by fomites and close contact, until the classic nosocomial outbreak in the German town of Meschede. Study of this event concluded that cases spread inside the hospital were infected by virus particles disseminated by air over a considerable distance (Wehrle et al., 1970, see also Gelfand and Posch 1971; Fenner et al., 1988; Tellier et al., 2019). Reviewing the history of this disease, Milton (2012) concluded that "the weight of evidence suggests that fine particle aerosols were the most frequent and effective mode of smallpox transmission". Given our precautionary recent experience and slow start with SARS-CoV-2, we argue that we should be treating this unexpected new zoonotic poxvirus outbreak as likely being driven at least in part by viraerosol transmission. It is another wakeup call for treating indoor air ventilation issues more seriously.
References<br /> Dong E, Du H, Gardner L. An interactive web-based dashboard to track COVID-19 in real time. Lancet Infect Dis. 2020 May;20(5):533-534. doi: 10.1016/S1473-3099(20)30120-1. Epub 2020 Feb 19. Erratum in: Lancet Infect Dis. 2020 Sep;20(9):e215. PMID: 32087114; PMCID: PMC7159018.<br /> European Centre for Disease prevention and Control. Epidemiological update: Monkeypox outbreak. 20 May 2022. <br /> Fenner, F., D.A. Henderson, I. Arita, Z. Jezek, I.D. Ladnyi. Smallpox and its eradication. WHO, Geneva (1988), p. 1460p<br /> Gelfand, H.M., J. Posch. The recent outbreak of smallpox in Meschede. West Germany. Am. J. Epidemiol., 93 (4) (1971), pp. 234-340, 10.1093/oxfordjournals.aje.a121251<br /> Moreno, T., Gibbons, W. 2021. Aerosol transmission of human pathogens: From miasmata to modern viral pandemics and their preservation potential in the Anthropocene record. Geoscience Frontiers. DOI:10.1016/j.gsf.2021.101282<br /> Kozlov, M. 2022: https://www.nature.com/arti... "https://www.nature.com/articles/d41586-022-01421-8)")<br /> Milton, D.K.. What was the primary mode of smallpox transmission? Implications for biodefense. Front. Cell Infect. Microbiol, 2 (2012), p. 150, 10.3389/fcimb.2012.00150<br /> Tellier, R. Aerosol transmission of influenza A virus: a review of new studies. J. R. Soc. Interface, 6 (2009), pp. S783-S790, 10.1098/rsif.2009.0302.focus<br /> Wehrle, P.F., J. Posch, K.H. Richter, D.A. Henderson. An airborne outbreak of smallpox in a German hospital and its significance with respect to other recent outbreaks in Europe. Bull. World Health Organ., 43 (5) (1970), pp. 669-679<br /> World Health Organisation. Multi-country monkeypox outbreak in non-endemic countries. May 21 2022. https
-
-
www.medrxiv.org www.medrxiv.org
-
On 2022-05-23 11:58:04, user Jakub Fronczek, MD wrote:
Brilliant paper, congratulations - great to see net benefit assessment. The only part I found confusing is: "In sub-2% decision thresholds there is no net benefit in using our system, but these patients are not a subject of interest in this analysis and should always undergo a biopsy". Since the analysis includes BI-RADS 4 patients, shouldn't a probability <2% be of interest as a criterion for downgrading a patient to a lower risk category? Perhaps I'm missing something! Kind regards, Jakub Fronczek.
-
-
www.medrxiv.org www.medrxiv.org
-
On 2020-04-06 18:54:14, user Sinai Immunol Review Project wrote:
This study examined antibody responses in the blood of COVID-19 patients during the early SARS CoV2 outbreak in China. Total 535 plasma samples were collected from 173 patients (51.4% female) and were tested for seroconversion rate using ELISA. Authors also compared the sensitivity of RNA and antibody tests over the course of the disease . The key findings are:
• Among 173 patients, the seroconversion rates for total antibody (Ab), IgM and IgG were 93.1% (161/173), 82.7% (143/173) and 64.7% (112/173), respectively.
• The seroconversion sequentially appeared for Ab, IgM and then IgG, with a median time of 11, 12 and 14 days, respectively. Overall, the seroconversion of Ab was significantly quicker than that of IgM (p = 0.012) and IgG (p < 0.001). Comparisons of seroconversion rates between critical and non-critical patients did not reveal any significant differences.
• RNA tests had higher sensitivity in early phase and within 7 days of disease onset than antibody assays (66.7% Vs 38.3% respectively).
• The sensitivity of the Ab assays was higher 8 days after disease onset, reached 90% at day 13 and 100% at later time points (15-39 days). In contrast, RNA was only detectable in 45.5% of samples at days 15-39.
• In patients with undetectable RNA in nasal samples collected during day 1-3, day 4-7, day 8-14 and day 15-39 since disease onset, 28.6% (2/7), 53.6% (15/28), 98.2% (56/57) and 100% (30/30) had detectable total Ab titers respectively Combining RNA and antibody tests significantly raised the sensitivity for detecting COVID-19 patients in different stages of the disease (p < 0.001).
• There was a strong positive correlation between clinical severity and antibody titer 2-weeks after illness onset.
• Dynamic profiling of viral RNA and antibodies in representative COVID-19 patients (n=9) since onset of disease revealed that antibodies may not be sufficient to clear the virus. It should be noted that increases in of antibody titers were not always accompanied by RNA clearance.
Limitations: Because different types of ELISA assays were used for determining antibody concentrations at different time points after disease onset, sequential seroconversion of total Ab, IgM and IgG may not represent actual temporal differences but rather differences in the affinities of the assays used. Also, due to the lack of blood samples collected from patients in the later stage of illness, how long the antibodies could last remain unknown. For investigative dynamics of antibodies, more samples were required.
Relevance: Total and IgG antibody titers could be used to understand the epidemiology of SARS CoV-2 infection and to assist in determining the level of humoral immune response in patients.
The findings provide strong clinical evidence for routine serological and RNA testing in the diagnosis and clinical management of COVID-19 patients. The understanding of antibody responses and their half-life during and after SARS CoV2 infection is important and warrants further investigation
-
-
www.medrxiv.org www.medrxiv.org
-
On 2020-04-01 15:47:26, user JR Davis wrote:
Table 3 and 4 and 5 are all missing. Text mentions non-CoVID respiratory pathogens (n=10) also tested for, and listed in "Table 3"....with the additional Primer list in Table 4.<br /> However, both Table 3, 4, and 5 NOT provided in the PDF....only Table 1 and 2 found at the end of the document.<br /> Can you provide missing tables 3,4,5?
-
-
www.medrxiv.org www.medrxiv.org
-
On 2021-04-25 13:30:44, user Robert Saunders wrote:
Clery and colleagues state that “evidenced based treatments are available” for chronic fatigue syndrome. These are listed as Cognitive Behavioural Therapy-for-fatigue (CBT-f), Activity Management (AM) and Graded Exercise Therapy (GET).
In 2017 the US Centers for Disease Control and Prevention concluded that there are no effective treatments for CFS, after it re-examined the scientific evidence and removed CBT and GET as recommended treatments [1].
Similarly, the 2020 draft NICE guideline for ME/CFS specifically warns against the prescription of CBT and GET as treatments due to the evidence that they are ineffective and potentially harmful [2]. 89% of outcomes in studies of non-pharmacological interventions for ME/CFS have been graded as “very low quality” with a high or very high risk of bias by NICE’s independent experts. And no outcomes in any studies of CBT or GET are graded as better than “low quality” [3].
Clery and colleagues cite Nijhof et al (FITNET) [4] for their claim that “at least 15% of children with CFS/ME [sic] remain symptomatic after one year of treatment”. It should be noted that Nijhof et al used the 1994 CDC Fukada diagnostic criteria [5], which is less specific than other criteria as it does not require post-exertion malaise (PEM) as a symptom.
Evidence suggests that most people with fatigue and other persistent symptoms following viral infection will recover within 2 years with no treatment, but a minority with ME/CFS will not recover [6,7]. There is no reliable evidence to suggest that long term outcomes are any better for those who have been prescribed CBT or GET and there is good evidence to suggest that these interventions are harmful [8].
There is undoubtedly a need for children and adults with post-viral fatigue syndromes and ME/CFS to be given appropriate advice and support to manage and cope with the effects of their illnesses. However, acknowledgement of the very low quality of past studies and the evidence that CBT and GET are neither safe nor effective treatments for ME/CFS should be considered a prerequisite for any research pertaining to the provision of such services.
References:
-
-
www.medrxiv.org www.medrxiv.org
-
On 2021-12-07 10:40:57, user S. von Jan wrote:
I feel that some of the assumption that go into the model calculation are overestimated, others are underestimated, and some important further information is not considered. I am referring specifically to v (vaccine uptake), s (susceptibility reduction) and b (relative increase in the recovery rate after a breakthrough infection).
The authors assume a vaccination rate of 65% for the period between 11.10 and 7.11. For the sake of transparency, I think it should be mentioned in the study that in Germany an underestimation of the vaccination rate of up to 5 percentage points is assumed (1), perhaps this should also be considered in the scenarios. Moreover, the recovered cases are not mentioned at all, do they not play a role for the model?
For s in the "upper bound" scenario, a 72% efficacy of the vaccination in Germany is assumed (2), this figure comes from the German Robert Koch Institute (RKI) and is calculated based on the vaccination breakthroughs in Germany, i.e., it only includes the number of symptomatic cases in Germany. The RKI writes on the estimated vaccine effectiveness: "The values listed here must therefore be interpreted with caution and serve primarily to classify vaccination breakthroughs and to provide an initial estimate of vaccine effectiveness" (3, own translation). The vaccine effectiveness estimated here refers to the effectiveness of vaccination against Covid 19 infections with clinical symptoms, not against infection in general. However, there are indications that infections are more often asymptomatic in vaccinated persons ("vaccinated participants were more likely to be completely asymptomatic, especially if they were 60 years or older"(4)), and vaccinated people in Germany must rarely participate in Covid 19 tests. The RKI points out that vaccination would considerably reduce transmission of the virus to other people but assumes that even asymptomatically infected vaccinated people can be infectious: "However, it must be assumed that people become PCR-positive after contact with SARS-CoV-2 despite vaccination and thereby are infectious and excrete viruses. In the process, these people can either develop symptoms of an illness (which is mostly rather mild) or no symptoms at all" (5, own translation). So is the effectiveness of vaccination against symptomatic infections in this setting relevant when it comes to the role of the vaccinated/unvaccinated to the infection incidence?
In the "lower efficacy" scenario, s is given as 50% to 60% based on an English study. This percentage corresponds to the data from another study, which estimates the effectiveness of the Biontech/Pfizer vaccination against infection as 53% after 4 months in the dominant delta variant (6). Would this number not be more plausible for the "upper bound" scenario? The "lower efficacy" scenario could then be calculated with an efficacy of 34%, for example, as suggested by another study on infection among household members (7).
If we consider b, "an average infectious period that is 2/3 as long as this of unvaccinated infecteds" is assumed. This figure seems reasonable based on the available information on the faster decline of the viral load in vaccinated persons. However, there are statements, for example by Prof. Christian Drosten in an interview with the newspaper “Die Zeit”, that make this effect seem less significant: "The viral load - and I mean the isolatable infectious viral load - is quite comparable in the first few days of infection. Then it drops faster in vaccinated people. The trouble is, this infection is transmitted right at the beginning. I'm convinced that we have little benefit from fully vaccinated adults who don't get boostered" (8, own translation). Moreover, there is another issue that is not mentioned in the paper at all, but which I think should be taken into account: Unvaccinated people in Germany have to test themselves much more frequently than vaccinated people (e.g., at the workplace) due to the 3G rules (9, this means vaccinated, recovered or tested). Children and adolescents have a testing frequency of 3 rapid tests a week (10). Even if the effectiveness of the rapid Covid 19 tests for asymptomatic infections should be 58% (i.e., only 58% of infected persons are correctly identified as positive) (11), a test rate of 2 to 3 tests per week would still reduce the duration during which an unvaccinated person is infectious and not in quarantine. This consideration is not included in the model calculation.
Overall, it appears that several central parameters were underestimated or overestimated in the model calculation: The vaccination rate is actually higher, the effectiveness of vaccination against infection is certainly lower than the figure given in the “upper bound” scenario, and the period in which infected persons infect others is shortened for unvaccinated persons by 3G regulations, since they have to go into quarantine if they test positive. As a result, the contribution of the unvaccinated to the infection incidence in Germany is likely to be strongly overestimated in the model calculation, especially in the “upper bound” scenario.
(1) https://www.rki.de/DE/Conte... <br /> (2) For adolescents, s is even estimated at 92%, without explicit data being available here.<br /> (3) https://www.rki.de/DE/Conte.... <br /> (4) https://www.thelancet.com/j...<br /> (5) https://www.rki.de/SharedDo... <br /> (6) https://www.thelancet.com/j... <br /> (7) https://www.thelancet.com/j... <br /> (8) https://www.zeit.de/2021/46... <br /> (9) https://www.bundesregierung... <br /> (10) https://taz.de/Schulen-in-d... <br /> (11) https://www.cochrane.de/de/... This overview work does not yet refer to the delta variant.
-
-
www.medrxiv.org www.medrxiv.org
-
On 2020-06-09 16:22:37, user Sinai Immunol Review Project wrote:
Title <br /> Eosinopenia Phenotype in Patients with Coronavirus Disease 2019: A Multi-center Retrospective Study from Anhui, China
Keywords<br /> • Lymphopenia<br /> • Covid-19 severity<br /> Main Findings<br /> It was previously shown that more than 80% of severe COVID-19 cases presented eosinopenia, in a cohort of Wuhan [1]. In this preprint Cheng et al. aim to describe the clinical characteristics of COVID-19 patients with eosinopenia. In this retrospective and multicenter study, the COVID-19 patients were stratified in three groups: mild (n=5), moderate (n=46) and severe (n=8). All patients received inhalation of recombinant interferon and antiviral drugs, 50% of the eosinopenia patients received corticosteroids therapy compared to 13.8% of the non-eosinopenia patients according to the patients’ clinical presentation. The median age of eosinopenia patients was significantly higher than the non-eosinopenia ones (47 vs 36 years old) as well as body temperature (not significant). Eosinopenia patients had higher proportions of dyspnea, gastrointestinal symptoms, and comorbidities. Eosinopenia patients presented more common COVID-19 symptoms, such as cough, sputum, fatigue, than non-eosinopenia patients (33.3% vs 17.2%). Interestingly lymphocytes counts (median: 101 cells/ul) in eosinopenia patients were significantly less than in non-eosinopenia patients (median: 167 cells/ul, p<0.001). All patients within the severe group recovered and presented with similar numbers of eosinophils and lymphocytes compared with healthy individuals upon resolution of infection and symptoms. The results showed by Cheng et al. are similar to another study involving MERS-Cov [2], but is contradictory to the previous observation with infants infected with respiratory syncytial virus, where high amounts of eosinophils were found in the respiratory tract of patients [3].
Limitations<br /> The sample size of this study (n=59) is very narrow and could bias the observations described. The authors did not thoroughly measure potential confounding effects of or control for type of treatments, which were different across the patients. <br /> It is still unclear if SARS-COV-2 infection induces eosinopenia or eosinophilia in the respiratory tract, since all reports so far showed peripheral eosinophil counts. As eosinophils antiviral response to respiratory viral infections has been shown [4], it would be important have discussed if the high inflammatory response produced by eosinophils could contribute to the lung pathology during COVID-19, especially when vaccine candidates have been tested and could induce increased amounts of eosinophils.
Significance<br /> This study suggests that eosinophilia may be a clinical phenotype of COVID-19 that distinguishes eosinopenia patients from non-eosinopenia patients. The contribution of the present study is relevant and calls for experimental analysis to reveal the importance of eosinopenia in COVID-19.
Credit<br /> Reviewed by Alessandra Soares-Schanoski as part of a project by students, postdocs and faculty at the Immunology Institute of the Icahn School of Medicine, Mount Sinai.
- Du, Y., et al., Clinical Features of 85 Fatal Cases of COVID-19 from Wuhan: A Retrospective Observational Study. Am J Respir Crit Care Med, 2020.
- Hwang, S.M., et al., Clinical and Laboratory Findings of Middle East Respiratory Syndrome Coronavirus Infection. Jpn J Infect Dis, 2019. 72(3): p. 160-167.
- Harrison, A.M., et al., Respiratory syncytical virus-induced chemokine expression in the lower airways: eosinophil recruitment and degranulation. Am J Respir Crit Care Med, 1999. 159(6): p. 1918-24.
- Lindsley, A.W., J.T. Schwartz, and M.E. Rothenberg, Eosinophil responses during COVID-19 infections and coronavirus vaccination. J Allergy Clin Immunol, 2020.
-
-
www.medrxiv.org www.medrxiv.org
-
On 2020-07-15 07:10:13, user Dr Ahmed Sayeed wrote:
Section Review comments and notes Abstract, title and references The study appears to be new and promising in the current scenario of COVID pandemic In the objectives, the authors have the aim to describe the bronchoscopic findings in COVID patients but in the method, they have forgotten to mention how the bronchoscopic findings will be studied What is the meaning of COVID19 patients? Is suspected covid19 or confirmed COVID 19 with Nasopharyngeal swab(PCR or serology or Nuclear acid amplification test) The references are recent and relevant with the inclusion of appropriate study
Introduction/background In introduction line 4, the term bronchial alveolar lavage would be more appropriate than bronchial culture The author uses the term culture repeatedly which excludes other methods like PCR, grams stain, KOH stain, AFB and would be advised to use the broader term to include other methods of detection of organisms The limitations of the study are not mentioned Methods The study subjects The age group of the patients should be mentioned and the site of covid infection? lung also needs to be mentioned The variables are defined and measured Yes the study appears to valid and reliable
Results My knowledge of statistics is very limited and it is difficult for me to comment
Discussion and Conclusions<br /> There is a grammatical error in line 2 and 5 of the discussion Suggest difficult to do suction In paragraph 3 of the discussion the reference 18 is written twice The reference in the discussion are not quoted in serial order The limitations of the study need to be explained more
Overall The study design was appropriate This study added the to the scarcity of the novel virus literature and it showed that more hospital acquired infections are common in patients with covid I did not find any major flaws in the article
full review:
Overall statement or summary of the article and its findings
The article needs some correction and rewriting with some of my suggestion<br /> Some more literature needs to be done and added to the discussion with some new references
Overall strengths of the article and what impact it might have in the respiratory field
The article appears to be promising and will definitely add to the literature of BAL in COVID which not frequently performed in fear of spreading the infection to the health care staff Culture and sensitivity will make a difference in the management of COVID ventilated patients
Specific comments on the weaknesses of the article and what could be done to improve it Major points in the article which need clarification, refinement, reanalysis, rewrites and/or additional information and suggestions for what could be done to improve the article.
More literature review<br /> More references need to be added<br /> Minor points like figures/tables not being mentioned in the text, a missing reference, typos, and other inconsistencies.
English and grammar
-
-
www.medrxiv.org www.medrxiv.org
-
On 2020-05-11 01:41:57, user Sinai Immunol Review Project wrote:
Main findings<br /> The need for improved cellular profiling of host immune responses seen in COVID-19 has required the use of high-throughput technologies that can detail the immune landscape of these patients at high granularity. To fulfill that need, Chua et al. performed 3’ single-cell RNA sequencing (scRNAseq) on nasopharyngeal (or pooled nasopharyngeal/pharyngeal swabs) (NS), bronchiolar protected specimen brush (PSB), and broncheoalveolar lavage (BAL) samples from 14 COVID-19 patients with moderate (n=5) and critical (n=9, all admitted to the ICU; n=2 deaths) disease, according to WHO criteria. Four patients (n=2 with moderate COVID-19; n=2 with critical disease, n=1 on short-term non-invasive ventilation and n=1 on long-term invasive ventilation), were sampled longitudinally up to four times at various time points post symptom onset. In addition, multiple samples from all three respiratory sites (NS, PSB, BAL) were collected from two ICU patients on long-term mechanical ventilation, one of whom died a few days after the sampling procedure. Moreover, three SARS-CoV-2 negative controls, one patient diagnosed with Influenza B as well as two volunteers described as “supposedly healthy”, were included in this study with a total of n=17 donors and n=29 samples.
Clustering analysis of cells isolated from NS samples identified all major epithelial cell types, including basal, scretory, ciliated, and FOXN4+ cells as well as ionocytes; of particular note, a subset of basal cells was found to have a positive IFN? transcriptional signature, suggesting prior activation of these cells by the host immune system, likely in response to viral injury. In addition to airway epithelial cells, 6 immune cell types were identified and further subdivided into a total of 12 different subsets. These included macrophages (moMacs, nrMacs), DCs (moDCs, pDCs), mast cells, neutrophils, CD8 T (CTLs, lytic T cells), B, and NKT cells; however, seemingly neither NK nor CD4 T cells were detected and the Treg population lacked canonical expression of FoxP3, so it is unclear whether this population is truly represented.
Interestingly, secretory and ciliated cells in COVID-19 patients were shown to have upregulated ACE2 and coexpression with at least one S-priming protease indicative of viral infection; ACE2 expression on respiratory target cells increased by 2-3 fold in COVID-19 patients, compared to healthy controls. Notably, ciliated cells were mostly ACE2+/TMRPSS+, while secretory and FOXN4+ cells were predominantly ACE2+/TMRPSS+/FURIN+; accordingly, secretory and ciliated cells contained the highest number of SARS-CoV-2 infected cells. However, viral transcripts were generally low 10 days post symptom onset (as would be expected based on reduced viral shedding in later stages of COVID-19). Similarly, the authors report very low counts of immune cell-associated viral transcripts that are likely accounted for by the results of phagocytosis or surface binding. However, direct infection of macrophages by SARS-CoV-2 has previously been reported 1,2. Here, it is possible that these differences could be due to the different clinical stages and non-standardized gene annotation.
Pseudotime mapping of the obtained airway epithelial data suggested a direct differentiation trajectory from basal to ciliated cells (in contrast to the classical pathway from basal cells via secretory cells to terminally differentiated ciliated cells), driven by interferon stimulated genes (ISGs). Moreover, computational interaction analysis between these ACE2+ secretory/ciliated cells and CD8 CTLs indicated that upregulation of ACE2 receptor expression on airway epithelial cells might be induced by IFN?, derived from these lymphocytes. However, while IFN-mediated ACE2 upregulation in response to viral infections may generally be considered a protective component of the antiviral host response, the mechanism proposed here may be particularly harmful in the context of critical COVID-19, rendering these patients more susceptible to SARS-CoV-2 infection.
Moreover, direct comparisons between moderate and critical COVID-19 patient samples revealed fewer tissue-resident macs and monocyte-derived dendritic cells but increased frequencies of non-resident macs and neutrophils in critically ill COVID-19 patients. Notably, neutrophil infiltration in COVID-19 samples was significantly greater than in those obtained from healthy controls and the Influenza B patient. In addition, patients with moderate disease and those on short-term non-invasive ventilation had similar gene expression profiles (each n=1),; whereas, critical patients on long-term ventilation expressed substantially higher levels of pro-inflammatory and chemoattractant genes including TNF, IL1B, CXCL5, CCL2, and CCL3. However, no data on potentially decreasing gene expression levels related to convalescence were obtained. Generally, these profiles support findings of activated, inflammatory macrophages and CTLs with upregulated markers of cytotoxicity in critically ill COVID-19 patients. These inflammatory macrophages and CTLs may further contribute to pathology via apoptosis suggested by high CASP3 levels in airway epithelial cells. Interestingly, the CCL5/CCR5 axis was enriched among CTLs in PSB and BAL samples obtained from moderate COVID-19 patients; recently, a disruption of that axis using leronlimab was reported to induce restoration of the CD8 T cell count in critically ill COVID-19 patients 3.
Lastly, in critically ill COVID-19 patients, non-resident macrophages were found to have higher expression levels of genes involved in extravasation processes such as ITGAM, ITGAX and others. Conversely, endothelial cells were shown to express VEGFA and ICAM1, which are typical markers of macrophage/immune cell recruitment. This finding supports the notion that circulating inflammatory monocytes interact with dysfunctional endothelium to infiltrate damaged tissues. Of note, in the patient with influenza B, cellular patterns and expression levels of these extravasation markers were profoundly different from critically ill COVID-19.
Importantly, the aforementioned immune cell subsets were found equally in all three respiratory site samples obtained from two multiple-sample ICU donors, and there were no differences, with regards to upper vs. lower respiratory tract epithelial ACE2 expression. However, viral loads were higher in BAL samples as compared to NS samples, and lower respiratory tract macrophages showed overall greater pro-inflammatory potential, corresponding to higher CASP3 levels found in PSB and BAL samples. In general, the interactions between host airway epithelial and immune cells described in this preprint likely contribute to viral clearance in mild and moderate disease but might be excessive in critical cases and may therefore contribute to the observed COVID-19 immunopathology. Based on these findings and the discussed immune cell profiles above, the authors suggest the use of immunomodulatory therapies targeting chemokines and chemokine receptors, such as blockade of CCR1 by itself or in combination with CCR5, to treat COVID-19 associated hyperinflammation.
Limitations<br /> Technical<br /> In addition to the small sample size, it is unclear whether samples were collected at similar time points throughout the disease course of each patient, even with time since diagnosis normalized across patients. While sampling dates in relation to symptom onset are listed, it remains somewhat unclear what kind of samples were routinely obtained per patient at given time points (with the exception of the two patients with multiple sampling). Moreover, it would have been of particular interest (and technically feasible) to collect additional swabs from the convalescent ICU patient to generate a kinetic profile of chemokine gene expression levels, with respect to disease severity as well as onset of recovery. Again, with an n=1, the number of cases per longitudinal/multiple sampling subgroup is very limited, and, in addition to the variable sampling dates, overall time passed since symptom onset as well as disease symptoms and potential treatment (e.g. invasive vs non-invasive ventilation, ECMO therapy…) across all clinical subgroups, makes a comparative analysis rather difficult.
It is important to note that a lack of standardized gene annotation across different studies contributes to a significant degree of variability in characterizations of immune landscapes found in COVID-19 patients. As a result, inter-study comparisons are difficult to perform. For instance, an analysis of single-cell RNA sequencing performed on bronchoalveolar lavage samples by Bost et al. identified lymphoid populations that were not found in the present study. These include several enriched subtypes of CD4+ T cells and NK cells, among others. Ultimately, these transcriptomic descriptions will still need to be furthered with additional follow-up studies, including proteomic analysis, to move beyond speculation and towards substantive hypotheses.
Biological<br /> One additional limitation involved the use of the influenza B patient. Given that the patient suffered a rather mild form of the disease (no ICU admission or mechanical ventilation required, patient was discharged from hospital after 4 days) as opposed to the to authors’ assessment as a severe case, this patient may have served as an acceptable positive control for mild and some moderate COVID-19 patients. However, this approach should still be viewed cautiously, since the potential differences of pulmonary epithelial and immune cell pathologies induced by influenza compared to critical COVID-19 patients are still unclear. Moreover, it seems that one of the presumably healthy controls was recovering from a viral infection. Since it is unclear how a recent mild viral infection might have changed the respiratory cellular compartment and immune cell phenotype, this donor should have been excluded or not used as a healthy reference control.
Significance<br /> In general, this is a well-conducted study and provides a number of corroborative and interesting findings that contribute to our understanding of immune and non-immune cell heterogeneity in COVID-19 pathogenesis. Importantly, observations on ACE2 and ACE2 coexpression in airway epithelial cells generally corroborate previous reports. In addition, direct differentiation of IFN?+ basal cells to ACE2-expressing ciliated cells, as suggested by trajectory analysis, is a very interesting hypothesis, which, if confirmed, might contribute to progression of disease severity. The findings described in this preprint further suggest an important role for chemokines and chemokine receptors on immune cells, most notably macrophages and CTLs, which is highly relevant.
This review was undertaken by Matthew D. Park and Verena van der Heide as part of a project by students, postdocs and faculty at the Immunology Institute of the Icahn school of medicine, Mount Sinai.
References<br /> 1. Chen, Y. et al. The Novel Severe Acute Respiratory Syndrome Coronavirus 2 (SARS-CoV-2) Directly Decimates Human Spleens and Lymph Nodes. Infectious Diseases (except HIV/AIDS) (2020) doi:10.1101/2020.03.27.20045427.<br /> 2. Bost, P. et al. Host-viral infection maps reveal signatures of severe COVID-19 patients. Cell (2020) doi:10.1016/j.cell.2020.05.006.<br /> 3. Patterson, B. K. et al. Disruption of the CCL5/RANTES-CCR5 Pathway Restores Immune Homeostasis and Reduces Plasma Viral Load in Critical COVID-19. medRxiv (2020).
-
-
www.medrxiv.org www.medrxiv.org
-
On 2020-04-21 23:29:37, user Sinai Immunol Review Project wrote:
Title: Factors associated with prolonged viral shedding and impact of Lopinavir/Ritonavir treatment in patients with SARS-CoV-2 infection?<br /> Keywords: retrospective study – lopinavir/ritonavir – viral shedding
Main findings:<br /> The aim of this retrospective study is to assess the potential impact of earlier administration of lopinavir/ritonavir (LPV/r) treatment on the duration of viral shedding in hospitalized non-critically ill patients with SARS-CoV-2. <br /> The analysis shows that administration of LPV/r treatment reduced the duration of viral shedding (22 vs 28.5 days). Additionally, if the treatment was started within 10 days of symptoms onset, an even shorter duration of virus shedding was observed compared to patients that started treatment after 10 days of symptoms s onset (19 vs 27.5 days). Indeed, patients that started LPV/r treatment late did not have a significant median duration of viral shedding compared to the control group (27.5 vs 28.5 days). Old age and lack of LPV/r administration independently associated with prolonged viral shedding in this cohort of patients.
Limitations:<br /> In this non-randomized study, the group not receiving LPV/r had a lower proportion of severe and critical cases (14.3% vs 32.1%) and a lower proportion of patients also receiving corticosteroid therapy and antibiotics, which can make the results difficult to interpret.<br /> The endpoint of the study is the end of viral shedding (when the swab test comes back negative), not a clinical amelioration. The correlation between viral shedding and clinical state needs to be further assessed to confirm that early administration of LPV/r could be used in treating COVID-19 patients.
Relevance:<br /> Lopinavir/ritonavir combination has been previously shown to be efficient in treating SARS [1,2]. While this article raises an important point of early administration of LPV/r being necessary to have an effect, the study is retrospective, contains several sources of bias and does not assess symptom improvement of patients. A previously published randomized controlled trial including 200 severe COVID-19 patients did not see a positive effect of LPV/r administration [3], and treatment was discontinued in 13.8% of the patients due to adverse events. Similarly, another small randomized trial did not note a significant effect of LPV/r treatment [4] in mild/moderate patients. A consequent European clinical trial, “Discovery”, including among others LPV/r treatment is under way and may provide conclusive evidence on the effect and timing of LPV/r treatment on treating COVID-19.
- Treatment of severe acute respiratory syndrome with lopinavir/ritonavir: a multicentre retrospective matched cohort study. - PubMed - NCBI. https://www-ncbi-nlm-nih-go.... Accessed March 30, 2020.
- Role of lopinavir/ritonavir in the treatment of SARS: initial virological and clinical findings. - PubMed - NCBI. https://www-ncbi-nlm-nih-go.... Accessed March 30, 2020.
- Cao B, Wang Y, Wen D, et al. A Trial of Lopinavir–Ritonavir in Adults Hospitalized with Severe Covid-19. New England Journal of Medicine. March 2020. doi:10.1056/NEJMoa2001282
- Li Y, Xie Z, Lin W, et al. An Exploratory Randomized, Controlled Study on the Efficacy and Safety of Lopinavir/Ritonavir or Arbidol Treating Adult Patients Hospitalized with Mild/Moderate COVID-19 (ELACOI). Infectious Diseases (except HIV/AIDS); 2020. doi:10.1101/2020.03.19.20038984
Reviewed by Emma Risson as part of a project by students, postdocs and faculty at the Immunology Institute of the Icahn School of Medicine, Mount Sinai.
-
-
www.medrxiv.org www.medrxiv.org
-
On 2021-08-25 12:07:48, user Prof. W Meier-Augenstein, FRSC wrote:
What other than the difference in antibody titer post-vaccination and post-infection is the take-home message of this study? Surely, the decline in antibody titer per se months after vaccination or primary infection is not a surprising finding but could be expected? Antibodies have a finite life-span given by their Ig specific half-life (for example 21 days for IgGs). In the absence of a subsequent challenge (e.g. by a secondary infection) antibodies formed in response to the challenge posed by vaccination or primary infection will have all but cleared from serum after 6+ months. Furthermore, the difference in antibody titer between mRNA vaccinated and SARS-CoV-2 infected could not have come as a big surprise either considering mRNA vaccination results in expression of spike-protein “only” which means in contrast to a viral infection host cells are actually not infected and do not reproduce copious amounts of the virus which will take longer to fight and clear from the body than the spike protein. For the same reason, macrophages (phagocytes) are unlikely to be involved in the mRNA vaccinated group to the same degree as they are in the group infected by the virus. The natural decline of IG antibodies produced in response to the mRNA vaccine does not offer an exclusive explanation for breakthrough infection. Instead, breakthrough infection occurring 146+ days post vaccination are most likely the result of a “perfect storm”, an unfortunate coincidence of the higher virulence of the Delta variant of <<7 days incubation time, the associated higher viral load produced, and the fact the production of neutralising antibodies by B-memory cells takes up to 4-5 days to reach its peak.
-
-
www.medrxiv.org www.medrxiv.org
-
On 2020-04-08 00:15:34, user Sinai Immunol Review Project wrote:
Clinical features and the maternal and neonatal outcomes of pregnant women with coronavirus disease 2019
Keywords
Pregnancy, SARS-CoV2, neonatal and maternal Covid-19 outcome
Key findings
33 pregnant woman and 28 newborns were included in this retrospective multi-center study, conducted at 5 hospitals in Wuhan and Hubei province, China, between January 1 and February 20, 2020. All women were diagnosed with Covid-19 by qPCR or viral gene sequencing based on the Chinese New Corona Pneumonia Prevention and Control Program, 6th edition, and were further subdivided into four groups based on clinical severity: (1) mild, presence of mild clinical symptoms without radiological abnormalities; (2) moderate, fever or upper respiratory symptoms as well as radiological signs of pneumonia; (3) severe, at least one of the following: shortness of breath/respiratory rate >30/min, resting oxygen saturation SaO2<93%, Horowitz index paO2/FiO2 < 300 mmHg (indicating moderate pulmonary damage); and (4) severe-acute, acute respiratory distress with need for mechanical ventilation; systemic shock; multi-organ failure and transfer to ICU. Maternal admission to ICU, mechanical ventilation or death were defined as primary outcomes; secondary study outcomes comprised clinical Covid-19 severity in both mothers and newborns, including development of ARDS, neonatal ICU admission as well as mortality.
Maternal characteristics and outcome: 3 out of 33 women were in their second trimester of pregnancy (17, 20 and 26 weeks), and 15/33 (45.5%) had a previous history of underlying chronic health disorders including cardiovascular, cerebrovascular or nervous system disease. Common Covid-19 symptoms at presentation were fever (63.6%), dry cough (39.4%), fatigue (21.2%), and shortness of breath (21.2%). Less common symptoms included diarrhea, post-partum fever, muscle ache, sore throat and chest pain. 4 (12.1%) pregnant women had no apparent symptoms. The majority of cases were classified as mild (39.4%) or moderate (57.6%); however, one woman developed severe Covid-19. 40.6% of women were diagnosed with bilateral pneumonia, 43.8% presented with unilateral pneumonia, and 15.6% showed radiological ground-glass opacity. 87.9% of women required oxygen administration, and one (3%) woman had to be put on non-invasive mechanical ventilation (primary outcome). 81.5% of women had a C-section and only 5% had vaginal deliveries. Obstetrical complications were seen in 22.2% of women, including three cases of preterm rupture of membranes, two cases of hypertensive disorders of pregnancy, and one case of spontaneous preterm labor. Five pregnancies were ongoing at the end of the observation point of this study; one woman decided to have her pregnancy terminated. Neonatal outcome: Out of 28 newborns included in this study, 35.7% were born preterm at <37 weeks of gestation with Apgar scores ranging from 8-10/10 at 1 min and from 9-10/10 after 5 min, indicating normal heart and respiratory rates. 17.9% of newborns were of low birth weight (not specified) and 14.3% showed signs of fetal distress (also not specified). According to the authors of this study, none of the newborns presented with clinical Covid-19 symptoms. However, one newborn, delivered at 34 weeks of gestation, was diagnosed with (apparently Covid-19 unrelated?) ARDS and transferred to NICU (secondary outcome). Of 26 newborns tested for SARS-CoV2, only one was found positive and showed radiological signs of pneumonia, but no clinical symptoms of Covid-19. It remains unclear whether this was the same case as the newborn diagnosed with ARDS. The affected newborn did not require any treatment and was discharged at 16 days post birth. In summary, the primary outcome “mechanical ventilation” in pregnant women was rare (3%), no other primary outcomes were reached. Most Covid-19 cases in pregnant women were described as mild to moderate. Only one of 28 (3.57%) newborns was diagnosed with ARDS (secondary outcome).
Potential limitations
Major limitations of this study are its small size and the rudimentary and at times inadequate description of patient specifics. For example, underlying health conditions that might be affecting Covid-19 outcome in pregnant women should have been clearly specified (other than being of be listed (not just <37 weeks). Given that maternal infection status seemed mostly unknown at the time of birth and, more importantly, that the majority of cases in this study were clinically asymptomatic or mild to moderate, it remains unclear whether the C-sections performed were a medical necessity or elective procedures. This is of importance and should have been discussed. With regard to neonatal outcome, it is also not apparent whether the newborn found to be infected with SARS-CoV2 and the case diagnosed with ARDS were the same individual. If this was the case, it would be incorrect to refer to all newborns as asymptomatic. Additionally, it seems somewhat unlikely that a newborn with a near-perfect Apgar score would present with ARDS immediately after birth. Likewise, any individual diagnosed with ARDS would certainly be expected to receive supportive treatment including (invasive) mechanical ventilation. While it is highly relevant that overall clinical outcome in pregnant women diagnosed with Covid-19 seems better than in SARS or MERS (as discussed by the authors), it nevertheless needs to be stressed that more than 37% of newborns in this study were delivered preterm and that the obstetric complication rate of 22% seems higher than non-Covid-19 average.
Overall relevance for the field
Observations in this study confirm some of the findings published in a case series by Yu N et al. (Lancet Infect Dis 2020; https://doi.org/10.1016/ S1473-3099(20)30176-6). However, due to the relatively small study size of 33 pregnant women and 28 newborns, this study lacks statistical power and final conclusions on Covid-19 outcomes in pregnant women and newborns cannot be drawn. Yet, the data collected here are important and should be incorporated into larger data sets for more insight. Understanding the clinical course and effects of Covid19 in both pregnant women and newborns is essential, and while there are some recent publications on vertical SARS-CoV2 transmission between mothers and newborns (Dong L et al, JAMA March 26, 2020, doi:10.1001/jama.2020.4621; Zeng H et al, JAMA March 26, 2020, doi:10.1001/jama.2020.4861) as well as on neonatal infection at birth (Zeng L et al, JAMA March 26, 2020, doi:10.1001/jamapediatrics.2020.0878), our knowledge of how these patient subsets are affected is still very limited.
This review was undertaken as part of a project by students, postdocs and faculty at the Immunology Institute of the Icahn school of medicine, Mount Sinai.
-
-
www.medrxiv.org www.medrxiv.org
-
On 2020-04-13 14:09:18, user Ian Sinclair wrote:
This study seems to me potentially of enormous significance. I think it would gain greater acceptance if a) the authors explain why they chose to publish before they had reached the numbers specified in the protocol (100 for TAU and 100 for 4 mg group b) they say why they did not report the results for the 2 mg per day group c) they report the actual data on coughs temperature, numbers improved on radiology examination rather than just the significance levels d) they remedy a minor error in the summary (quotes 32 cases as against 31 e) they confirm that the measures were also made by staff who were blind to allocation f) they got themselves an editor who is a native English speaker. I absolutely do not think that the authors have anything to hide but they need to cope with a Western Audience that has been trained to be ultra critical, looking among other things for investigators who stop a trial the moment that it looks to be going their way. My guess is that this was not the case in this instance and that the study was running out of subjects or the authorities were asking for results or some other event that was out of the control of those running the trial. Given the potential world importance of this trial everyone should be trying to offer constructive suggestions for its greater acceptability rather than exercising their brains on ways in which mistakes might have been made.
-
-
www.medrxiv.org www.medrxiv.org
-
On 2020-04-16 06:58:38, user Kratoklastes wrote:
It would have been useful to tabulate critical illness (and deaths) - both by age cohort - and to have given some indication of the statistical properties of the estimators (beyond p-values).
The OR of 66× for the 75+ age cohort in the hospitalisation regression seems outlandish; the raw OR is 4× (i.e., the raw ratio of (Admitted|PosTest) for over-75s compared to the same quantity for 19-44 year olds).
That looks (to me) like a collinearity issue in the regressor matrix - a really wide CI for one really-obviously-important variable is another clue. (Call me a Bayesian!).
If your regressors were boolean (i.e., presence/absence) for comorbidities, VIF is not an appropriate test for collinearity: VIF performs poorly for categorical variables. Why not simply test the determinant of X´X, or its condition number, or its smallest eigenvalue?It's not a large matrix by modern standards - so it can't be a computational constraint. R's
mctestpackage does a good job too (omcdiagincludes the Farrar-Glauber test)I would suspect some rank deficiency caused by correlation between hypertension and variables that represent CVD-ish things; not necessarily pairwise - and this is the problem with booleans.
Weak collinearity can happen because of weighted sums of columns - 3 boolean columns can give a run of '2' values, that correspond 'enough' with the '1's in the hypertension column. Add in other correlates with hypertension (age, obesity and maleness) and it would be suspicious if there wasn't collinearity.
I don't think it would be viewed negatively if you dropped the 19 newborns (who are confounders in the 'hospitalisation' regression, since they are always hospitalised), so long as it was clearly disclosed: the presence of those 19 observations will also mess up the 'critical illness' regression as well (it would only require a handful of newborns to need critical care for things unrelated to COVID19, to bias up the OR for their age group, and their presence already biases up recovery rates).
Lastly: it would be relatively straightforward to furnish the R script and the parameters (and residuals) without furnishing the data - that way interested people could generate their own pseudo-data and run some Monte Carlo experiments to get an idea of the asymptotic properties of the estimates. (To do it properly it would be good to have a covariance matrix so that the pseudodata could be generated by an appropriate cupola).
.
It's a pity that (as far as I am aware) Disqus does not permit any type of maths markup.
-
-
www.medrxiv.org www.medrxiv.org
-
On 2023-06-15 13:36:40, user Rachel Gibson wrote:
This Scientific Correspondence has also been submitted to eLife.
Comment on ‘The clinical pharmacology of tafenoquine in the radical cure of Plasmodium vivax malaria: an individual patient data meta-analysis’<br /> Authors: Raman Sharma1, Chao Chen2, Lionel Tan2, Katie Rolfe1, Ioana-Gabriela Fita2, <br /> Siôn Jones2, Anup Pingle3, Rachel Gibson1, Navin Goyal4*, Isabelle Borghini Fuhrer5, <br /> Stephan Duparc5, Hema Sharma2†, Panayota Bird2<br /> Affiliations: 1GSK, Stevenage, UK; 2GSK, Brentford, UK; 3GSK, Mumbai, India; 4GSK, Upper Providence, PA, USA; 5Medicines for Malaria Venture, Geneva, Switzerland<br /> *At the time of submission of this Letter, Navin Goyal is no longer an employee of GSK and is affiliated to Johnson and Johnson<br /> †At the time of submission of this Letter, Hema Sharma is no longer an employee of GSK and is affiliated to AstraZeneca
Abstract<br /> A single 300 mg dose of tafenoquine, in combination with chloroquine, is currently approved in several countries for the radical cure (prevention of relapse) of Plasmodium vivax malaria in patients aged >=16 years. Watson et al.’s recent publication suggests, however, that the approved dose of tafenoquine is insufficient for radical cure and that a higher 450 mg dose should be recommended. In this response, the authors challenge Watson et al.’s assertion based on empirical evidence from dose-ranging and pivotal studies (published) as well as real-world evidence from post-approval studies (ongoing, therefore currently unpublished). The authors confidently assert that, collectively, these data confirm that the benefit–risk profile of a single 300 mg dose of tafenoquine, co-administered with chloroquine, for the radical cure of Plasmodium vivax malaria in patients who are not G6PD deficient, continues to be favourable.
Introduction<br /> The Plasmodium vivax malarial parasite has a major economic and public health impact, especially in regions such as East Africa, Latin America and South and East Asia.1,2 When present in blood, P. vivax can cause acute malaria with episodes of chills, fever, muscle pains and vomiting. The parasite also has a dormant liver hypnozoite stage, which can reactivate after weeks, months or years, leading to relapses and, potentially, to severe anaemia, permanent brain damage and death.1,2 For effective treatment, eradication of both the blood and liver stages of P. vivax is required (radical cure).2<br /> Since 2018, regulators from the United States initially, and subsequently from Australia, Brazil, Colombia, Thailand, Peru and The Philippines, have approved tafenoquine (as a single oral dose of 300 mg in combination with standard doses of chloroquine) for the radical cure (prevention of relapse) of P. vivax malaria in patients aged >=16 years.1,3-5 A paediatric formulation that allows weight-band-based dosing of children (aged >=2 years) and adolescents is also approved in Australia (since 2022).5 Like primaquine, tafenoquine is an 8-aminoquinoline derivative effective against hypnozoites and all other stages of the P. vivax lifecycle; however, although the World Health Organization (WHO) recommends a 7- or 14-day treatment course for primaquine, tafenoquine is the first single-dose treatment for the radical cure of P. vivax malaria and therefore has patient adherence and convenience advantages.1,3,6 Nonetheless, as an 8 aminoquinoline, the safety profile of tafenoquine is similar to that of primaquine, and both agents can cause oxidant haemolysis in people with glucose-6-phosphate dehydrogenase (G6PD) deficiency.7,8 Acute haemolysis is usually short-lived and does not need specific treatment; however, in rare cases, severe haemolysis may lead to life-threatening anaemia (requiring red blood cell transfusions) or haemoglobinuric renal failure.9 In malaria-endemic regions it has been estimated that 8% of the population are G6PD deficient, although significant variation is reported across regions, with the highest country-specific prevalence estimated in Africa and Western Pacific countries.10,11 G6PD deficiency is an X-linked disorder; males are either G6PD deficient or have normal G6PD activity, whereas females exhibit a wide range of G6PD deficiency.2 Females may be symptomatic if they are homozygous, or if they are heterozygous and inactivation of their normal X chromosome (lyonisation) is skewed towards a deficient phenotype.2,12 Caution is needed because inter-individual variability in the pattern of lyonisation may cause heterozygous females with levels of enzyme activity between 30% and 70% of normal to test as normal for G6PD deficiency using qualitative, phenotypic, rapid diagnostic screening tests.13,14 To reduce the risk of haemolysis, the G6PD status of all potential tafenoquine patients must be determined with a quantitative test capable of accurately differentiating deficient, intermediate and normal G6PD activity levels, and tafenoquine should be withheld from patients with G6PD enzyme levels below 70% of normal.3<br /> Importantly, appropriate clinical practice for the use of 8-aminoquinolines in P. vivax malaria has always been precariously balanced between providing adequate activity against hypnozoites and the real risk of haemolytic harm to patients with G6PD deficiency.15 The cautious benefit–risk balance involved with the single 300 mg dose of tafenoquine has been questioned in a recently published paper in which Watson et al., hypothesise that the current recommended dose of tafenoquine 300 mg is insufficient and that a 450 mg dose of tafenoquine would reduce the risk of relapse.16 That dose is 50% greater than the 300 mg dose approved by the US Food and Drug Administration (FDA), Australian Therapeutic Goods Administration (TGA) and other international regulatory authorities.1,3-5 Herein, the authors discuss concerns regarding the conclusions of Watson et al.<br /> • The benefit–risk profile of tafenoquine 450 mg is not appropriately considered. For example, there is minimal discussion of tafenoquine safety data and key findings from a phase 1 study in healthy female volunteers heterozygous for the G6PD Mahidol variant. This important study demonstrated not only that the haemolytic potential of tafenoquine was dose dependent but also that a single 300 mg dose of tafenoquine had the same potential to cause haemolytic harm as the WHO-recommended dose of primaquine for uncomplicated P. vivax malaria (15 mg/day for 14 days).17,18<br /> • The authors acknowledge that data from the phase 2b, paediatric, pharmacokinetic (PK) bridging study TEACH19 were not available before submission of the Watson et al. manuscript. However, in the TEACH study, in which the tafenoquine dosage in paediatric patients was chosen to match blood exposure in adults receiving 300 mg, tafenoquine was efficacious and generally well tolerated: no patients withdrew from the study because of adverse events.19<br /> • The model used by Watson et al. to predict the recurrence-free rate at 4 months after a 450 mg dose is hypothetical and does not consider data regarding the tafenoquine exposure–response relationship. Importantly, tafenoquine exposure achieved with a single 300 mg dose approaches the plateau of the exposure–response curve; therefore, the incremental recurrence-free rate gained by the proposed 50% increase in dose is small and unlikely to be justified by overall benefit–risk considerations.3 In addition, as primaquine and tafenoquine have different PK and metabolic profiles, the authors consider the extrapolation of data from primaquine to tafenoquine to be problematic.2,9<br /> • The authors feel that, overall, some of the conclusions do not acknowledge evidence-based safety concerns for a >300 mg dose of tafenoquine and do not consider additional data from the INSPECTOR study that the recurrence rate of P. vivax infection within 6 months of tafenoquine treatment was not significantly affected by bodyweight.20<br /> Watson et al. mentioned the phase 2b dose-selection study (DETECTIVE) of tafenoquine,21 from which a single 300 mg dose was chosen for phase 3 evaluation in adults. However, the authors did not point out that, in this study, exposure was a significant predictor of efficacy and doubling the tafenoquine dose from 300 mg to 600 mg was associated with only a marginal increase (from 89.2% to 91.9%) in the primary efficacy endpoint, relapse-free efficacy at 6 months.21 Moreover, in addressing the INSPECTOR study of tafenoquine in Indonesian soldiers, the authors did not specify that this was a study of tafenoquine administered with an artemisinin-based combination therapy rather than chloroquine and, as such, is not directly comparable due to poorly understood but confirmed interactions impacting tafenoquine efficacy.20 Watson et al. also suggest that tafenoquine 300 mg is likely inferior to ‘optimal primaquine regimens’, but it is unclear whether such regimens are the WHO-recommended schedules of primaquine or regimens defined as optimal based on non-regulatory studies of primaquine. The authors provided no specific reference or dosage characterising optimised primaquine therapy, so this a priori inferiority cannot be evaluated.<br /> Methods<br /> The hypothetical causal model proposed by Watson et al. for the clinical pharmacology of tafenoquine for the radical treatment of P. vivax malaria is similarly problematic. Central to this model are methaemoglobin (MetHb) production and active metabolites. However, MetHb is not a validated biomarker of tafenoquine efficacy, and currently there is no evidence, from non-clinical or clinical studies, of circulating active metabolites of tafenoquine; if such metabolites were fleetingly present, they would require extraordinary potency to exert any significant pharmacodynamic effect.22<br /> Regarding radical curative efficacy, Watson et al. selected P. vivax recurrence within 4 months as their primary endpoint. However, the trial-defined primary endpoint at 6 months from the pivotal tafenoquine clinical trials8,21,23 was an FDA requirement and was mandated for analysis purposes. This was to maximise the probability of capturing relapses, including those from regions with longer latency periods. Watson et al. used the INSPECTOR study20 as one of two reasons to justify the selection of a 4-month endpoint. Relapse rates differ greatly from country to country, so the duration of the endpoint should not be based on rates observed in a single country. Moreover, the 6-month rate of loss to follow-up (only 9.1%) does not justify a change of treatment endpoint from 6 months to 4 months.<br /> In their efficacy models, Watson et al. explored the association between the odds of P. vivax recurrence and the following predictors: mg/kg dose of tafenoquine; AUC0–?; peak plasma tafenoquine concentration; terminal elimination half-life; and Day 7 MetHb level. However, details of how the best predictor was selected and how statistical significance was judged were not provided.<br /> Results<br /> Use of a 4-month versus 6-month follow-up period<br /> A key focus of the Watson et al. manuscript is that the authors describe a possible association between tafenoquine mg/kg dose and the odds of recurrence (using logistic regression), with a 4-month rather than the original 6-month follow-up. An odds ratio of 0.66 (95% confidence interval [CI]: 0.51, 0.85) is cited by Watson et al. in their analysis of the effect of tafenoquine mg/kg dose in patients who received tafenoquine 300 mg, but descriptive details for this result and the analysis are limited. Figure 2 in the Watson et al. manuscript shows Kaplan–Meier survival curves for time to first recurrence, based on tafenoquine mg/kg dosing category, but some areas require clarification, such as how the dosing bands were selected.<br /> Rationale for tafenoquine dose selection<br /> Importantly, the classification and regression tree analysis, in which a clinically relevant breakpoint tafenoquine AUC value of 56.4 ug·h/mL was identified, was not discussed.24 Population PK modelling revealed that tafenoquine 300 mg would provide systemic exposure greater than or equal to the AUC breakpoint in approximately 93% of individuals, who would have a high probability (85%; 95% CI: 80, 90) of remaining relapse-free at 6 months.24 Therefore, this ‘… model-based approach was critical in selecting an appropriate phase 3 dose’ for tafenoquine.24 Although data from the TEACH paediatric study19 were not available when Watson et al. conducted their analysis, had the data been available, they would have validated the AUC approach to tafenoquine dose selection, with an overall efficacy of approximately 95%.19 Individuals (aged 2–15 years) were given tafenoquine, based on bodyweight, to achieve the same median AUC as the 300 mg dose in adults (children weighing >10–20 kg received tafenoquine 100 or 150 mg; >20–35 kg received 200 mg; and >35 kg received 300 mg). The recurrence-free rate at 4 months was 94.7% (95% CI: 84.6, 98.3),19 and the TEACH study supported the successful approval of tafenoquine for children aged 2–16 years by the Australian TGA in March 2022.5<br /> Another important counter to the mg/kg-based dose selection is that, when bodyweight categories were fitted as a continuous variable in the INSPECTOR study (using data for the time to recurrence for all participants), neither bodyweight nor bodyweight-by-treatment interactions were statistically significant (p=0.831 and p=0.520, respectively).20<br /> Use of an unvalidated biomarker<br /> Although Watson et al. state that increases in blood MetHb concentrations after tafenoquine administration were highly correlated with mg/kg dose, no correlation coefficients were presented. It should also be re-emphasised that MetHb is not a validated, surrogate biomarker of antimalarial treatment efficacy as a radical cure for P. vivax malaria and was used as a safety measure in the INSPECTOR study.20<br /> Potential safety concerns<br /> In the Tolerability and safety section, Watson et al. state that severe haemolytic events were rare; however, this is because all the studies were randomised and controlled, which excluded patients with <70% G6PD activity. In addition, no mention was made that, in one of the constituent studies (which examined the dose–response for haemoglobin decline in participants with 40–60% G6PD enzyme activity),17 dose escalation of tafenoquine from 300 mg to 600 mg was not attempted due to safety concerns about potential haemolysis in patients with G6PD deficiency. In tafenoquine-treated patients in the real-world setting, some instances of severe haemolysis might be expected, and it is already known from the previously highlighted phase 1 study that the haemolytic potential of tafenoquine increases with increasing dose.17 Watson et al.’s Tolerability and safety section also mentions that one tafenoquine-treated patient had a >5 g/dL decrease in haemoglobin level, but the baseline haemoglobin level and tafenoquine dose are not mentioned. The section may have benefitted from a holistic discussion of safety parameters per tafenoquine dose group: for example, the occurrence of serious adverse events, gastrointestinal adverse events (beyond the selective discussion of vomiting within 1 hour post dose) and neuropsychiatric adverse events.<br /> Discussion<br /> Watson et al. conclude that ‘the currently recommended adult dose is insufficient … increasing the adult dose to 450 mg is predicted to reduce the risk of relapse’; however, the authors have raised several concerns relating to these conclusions. In particular, the authors feel that the safety concerns associated with a higher-than-approved tafenoquine dose have not been thoroughly considered: the safety analysis is limited, and the increased risk of haemolysis in patients with G6PD deficiency that a 450 mg tafenoquine dose (which is 50% greater than the approved 300 mg dose) would pose in vulnerable populations in limited-resource settings is not adequately discussed. In some malaria-endemic regions, 8% of the population may be G6PD deficient, although wide variability exists, and in sub Saharan Africa and the Arabian peninsula the prevalence of G6PD deficiency may exceed 30%.10,11 Therefore, in regions with fragile healthcare systems and limited availability of relevant testing for G6PD deficiency, potential exists for a significantly increased risk of haemolysis if tafenoquine is administered at an above recommended dose (450 mg). Importantly, off-label use of a dose not robustly evaluated in clinical trials would pose a considerable risk to patient safety.<br /> Regarding tafenoquine efficacy, the rationale for a dose increase to 450 mg has limitations. Watson et al. suggest that a 50% increase in the adult dose of tafenoquine (from 300 mg to 450 mg) would prevent one relapse of malaria for every 11 patients treated. However, this number-needed-to-treat estimate is not balanced by a number-needed-to-harm estimate for acute haemolytic anaemia. In addition, the phase 2b part of the DETECTIVE study21 showed that, in countries where the trial was carried out, single doses of tafenoquine 300 mg and 600 mg had similar relapse-free efficacy at 6 months (89.2% and 91.9%, respectively); therefore, the lack of additional benefit for tafenoquine 600 mg in DETECTIVE and the phase 1 study, which demonstrated dose-dependent haemolytic potential for tafenoquine, favour a 300 mg dose.<br /> In summary, based on currently available data, dosing tafenoquine at the approved 300 mg dose, in combination with chloroquine, carefully balances efficacy and safety in the radical cure of P. vivax malaria; indeed, tafenoquine 300 mg demonstrated a favourable benefit–risk profile in a comprehensive clinical development programme that included at-risk populations in regions with fragile or resource-restricted healthcare systems. The arguments raised by Watson et al. come with the concerns articulated here, and the authors confidently assert that a tafenoquine dose increase from 300 mg to 450 mg is not supported by available fact-based evidence for the radical cure of P. vivax malaria in adults aged >=16 years.
References<br /> 1. GSK. US FDA approves Krintafel (tafenoquine) for the radical cure of P. vivax malaria [press release]. July 20, 2018. https://www.gsk.com/en-gb/media/press-releases/us-fda-approves-krintafel-tafenoquine-for-the-radical-cure-of-p-vivax-malaria/ (accessed 26 April 2023).<br /> 2. Hounkpatin AB et al. Clinical utility of tafenoquine in the prevention of relapse of Plasmodium vivax malaria: a review on the mode of action and emerging trial data. Infect Drug Resist 2019;12:553–570.<br /> 3. GSK. Krintafel. Highlights of prescribing information. https://www.accessdata.fda.gov/drugsatfda_docs/label/2018/210795s000lbl.pdf (accessed 26 April 2023).<br /> 4. GSK, Medicines for Malaria Venture. Perú becomes second malaria-endemic country in Latin America to approve single-dose tafenoquine for radical cure of P. vivax malaria [press release]. https://www.vivaxmalaria.org/sites/pvivax/files/content/attachments/2021-01-25/GSK%20-%20MMV%20PRESS%20RELEASE%20TAFENOQUINE%20APPROVED%20IN%20PERU.pdf (accessed 26 April 2023).<br /> 5. Medicines for Malaria Venture. Single-dose Kozenis (tafenoquine) approved for children with Plasmodium vivax malaria by Australian Therapeutic Goods Administration. https://www.mmv.org/newsroom/press-releases/single-dose-kozenis-tafenoquine-approved-children-plasmodium-vivax-malaria (accessed 26 April 2023).<br /> 6. World Health Organization. WHO guidelines for malaria, 14 March 2023. https://www.who.int/teams/global-malaria-programme (accessed 26 April 2023).<br /> 7. Milligan R et al. Primaquine at alternative dosing schedules for preventing relapse in people with Plasmodium vivax malaria. Cochrane Database Syst Rev 2019;7:CD012656.<br /> 8. Llanos-Cuentas A et al. Tafenoquine versus primaquine to prevent relapse of Plasmodium vivax malaria. N Engl J Med 2019;380:229–241.<br /> 9. Baird JK. 8-Aminoquinoline therapy for latent malaria. Clin Microbiol Rev 2019;32.<br /> 10. Howes RE et al. G6PD deficiency prevalence and estimates of affected populations in malaria endemic countries: a geostatistical model-based map. PLoS Med 2012;9:e1001339.<br /> 11. P. vivax information hub. G6PD global prevalence. https://www.vivaxmalaria.org/diagnosis-treatment/g6pd-deficiency/g6pd-global-prevalence#:~:text=G6PD%20Global%20Prevalence,-Photo%3A%20Jaya%20Banerji&text=G6PD%20deficiency%20affects%20around%20400%20million%20people%20globally (accessed 26 April 2023).<br /> 12. Domingo GJ et al. Addressing the gender-knowledge gap in glucose-6-phosphate dehydrogenase deficiency: challenges and opportunities. Int Health 2019;11:7–14.<br /> 13. Chu CS et al. Haemolysis in G6PD heterozygous females treated with primaquine for Plasmodium vivax malaria: a nested cohort in a trial of radical curative regimens. PLoS Med 2017;14:e1002224.<br /> 14. Baird JK et al. Noninferiority of glucose-6-phosphate dehydrogenase deficiency diagnosis by a point-of-care rapid test vs the laboratory fluorescent spot test demonstrated by copper inhibition in normal human red blood cells. Transl Res 2015;165:677–688.<br /> 15. Shanks GD. Historical 8-aminoquinoline combinations: not all antimalarial drugs work well together. Am J Trop Med Hyg 2022;107:964–967.<br /> 16. Watson JA et al. The clinical pharmacology of tafenoquine in the radical cure of Plasmodium vivax malaria: An individual patient data meta-analysis. Elife 2022;11:e83433.<br /> 17. Rueangweerayut R et al. Hemolytic potential of tafenoquine in female volunteers heterozygous for glucose-6-phosphate dehydrogenase (G6PD) deficiency (G6PD Mahidol variant) versus G6PD-normal volunteers. Am J Trop Med Hyg 2017;97:702–711.<br /> 18. World Health Organization. Guidelines for the treatment of malaria, 3rd ed. https://apps.who.int/iris/handle/10665/162441 (accessed 26 April 2023).<br /> 19. Velez ID et al. Tafenoquine exposure assessment, safety, and relapse prevention efficacy in children with Plasmodium vivax malaria: open-label, single-arm, non-comparative, multicentre, pharmacokinetic bridging, phase 2 trial. Lancet Child Adolesc Health 2022;6:86–95.<br /> 20. Sutanto I et al. Randomised, placebo-controlled, efficacy and safety study of tafenoquine co-administered with dihydroartemisinin-piperaquine for the radical cure of Plasmodium vivax malaria (INSPECTOR). Lancet Infect Dis [2023 May 23:S1473-3099(23)00213-X doi: 101016/S1473-3099(23)00213-X Epub ahead of print PMID: 37236221].<br /> 21. Llanos-Cuentas A et al. Tafenoquine plus chloroquine for the treatment and relapse prevention of Plasmodium vivax malaria (DETECTIVE): a multicentre, double-blind, randomised, phase 2b dose-selection study. Lancet 2014;383:1049–1058.<br /> 22. GSK. Investigator brochure. Data on file.<br /> 23. Lacerda MVG et al. Single-dose tafenoquine to prevent relapse of Plasmodium vivax malaria. N Engl J Med 2019;380:215–228.<br /> 24. Tenero D et al. Exposure-response analyses for tafenoquine after administration to patients with Plasmodium vivax malaria. Antimicrob Agents Chemother 2015;59:6188–6194.
Authors’ contributions<br /> Hema Sharma, Lionel Tan, Katie Rolfe, and Navin Goyal contributed to the conception or design of the studies the paper contains data from. All authors contributed to data analysis or interpretation. All authors contributed to the development and writing of this correspondence and approved the final submitted version.
Conflicts of interest statements <br /> Raman Sharma, Siôn Jones, Rachel Gibson, Katie Rolfe, Lionel Tan, Ioana-Gabriela Fita, Chao Chen, Panayota Bird, and Anup Pingle are employees of, and shareholders in GSK.<br /> Hema Sharma is a former employee of GSK, a shareholder in GSK and a current employee of AstraZeneca. Navin Goyal is a former employee and shareholder in GSK and a current employee of Johnson and Johnson. Isabelle Borghini Fuhrer and Stephan Duparc have no conflict of interest to report. <br /> Acknowledgements <br /> Medical writing support was provided by David Murdoch, a contract writer working on behalf of Apollo, and Alex Coulthard of Apollo, OPEN Health Communications, funded by GSK Biologicals SA, in accordance with Good Publication Practice 3 (GPP) guidelines (www.ismpp.org/gpp-2022) "www.ismpp.org/gpp-2022)").
Funding<br /> Funding for this article was provided by GSK Biologicals SA.
Data availability<br /> Data sharing is not applicable to this article as no datasets were generated or analysed.
-
-
www.medrxiv.org www.medrxiv.org
-
On 2020-05-07 03:52:42, user Alisha Geldert wrote:
We thank the authors for their detailed analysis of a suite of N95 decontamination approaches, with specific appreciation for the direct applicability to medical center needs. We see the manuscript – once published in a peer-reviewed journal – as being an excellent resource for medical center decision makers, as well as those working to implement the decontamination methods. With a spirit of attention to the existing peer-reviewed literature and rigor needed in this crisis, we offer a review of areas where improvements would benefit the study as well as (and more importantly) any readers who may adopt the approaches. The authors are aware of the following major comments summarized below, and are working diligently to provide necessary clarifications and revisions.
-
The UV-PX experimental design and choice of combination approach does not appear to be consistent with evidence on effective approaches for UVGI/UV-C ultraviolet decontamination of N95s, presenting a major concern. To address this, consider providing a reader with clearer justification for the ‘unconventional’ approach by perhaps answering the following questions:<br /> ---Were longer duration UV-PX treatments investigated? The fluence delivered during the 5-minute treatment time is unsupported by the evidence for UV-C decontamination of N95s [Lore et al., 2012; Mills et al, 2018; Heimbuch & Harnish, 2019].<br /> ---It is not clear why the authors suggest coupling of UV-PX with moderate RH heat before testing UV-PX alone, when the benefit of adding UV-PX is not described (perhaps stemming from the very low pathogen inactivation observed with UV-PX alone, as would be expected from the ~50X too low delivered germicidal fluence using this protocol). As the protocol deviates from CDC guidance [CDC, 2020], a rationale and supporting peer-reviewed references would be essential.
-
Important details are missing in the methods section. Please provide key details about the UV-PX setup to ensure replicable research reporting, specifically:<br /> ---Measures taken, if any, to ensure respirators are directly illuminated on both sides. <br /> N95 respirator placement relative to and distance from the light source. As irradiance, and therefore fluence, depends on distance between source and target, this is a critical parameter.<br /> ---Please specify the reflective material used in the UV room, the make and model number of the flame irradiance spectrometer, and whether the irradiance measurements reported in Supplementary Table 3 were measured within the UV room with reflective walls or within an alternative setting. Do the irradiance measurements represent the irradiance at the side of the N95 facing the Xenex UV-PX source or irradiance at areas indirectly exposed to UV light? <br /> ---Please clarify whether the measured irradiance represents the irradiance of one pulse or the average irradiance over multiple cycles.
-
There appears to be a potential issue with the conclusions reported in the abstract: the specific experimental parameters shown to yield high levels of pathogen inactivation (moderate RH heat) were not tested for N95 function, so the following statement might be confusing or misleading:<br /> “High levels of biological indicator inactivation were achieved following treatment with either moist heat or VHP. These same treatments did not significantly impact mask filtration or fit.”<br /> The limitations of the proposed approaches and the need for additional testing should be clarified.
References cited: <br /> 1. Lore et al., 2012: https://academic.oup.com/an...<br /> 2. Mills et al., 2018: https://www.ncbi.nlm.nih.go...<br /> 3. Heimbuch & Harnish, 2019: https://www.ara.com/sites/d...<br /> 4. CDC guidance on N95 decontamination: https://www.cdc.gov/coronav...
-
-
-
www.medrxiv.org www.medrxiv.org
-
On 2020-06-06 13:59:32, user Nayo57 wrote:
While the result of this interesting and meaningful analysis may be statistically correct: a reduction of R of 0.04 with 10% mobility reduction does not explain the vast reductions from R = 3-4 at outbreak to below 1. A rough analysis of WHO reported case data and Google mobility data gave a similar result e.g. for time to reach R<1 or cumulative cases per population, measures one would expect to be impacted by effective social distancing. The best conclusion may be that mobility index as provided is not a suitable measure to assess or guide policies to contain COVID-19: Fig1 (Germany: increase in mobiilty index while R stays <1), Fig. 2(USA: decrease in mobility by further increase in R) and the scatter in Fig 3 support this view.
The interpretation would rather be that BEHAVIOUR during mobility activities matter much more than the QUANTITY of mobility. Alternatively, more focussed indexes (restaurants/bars; cinemas/theaters..) may be worth while to examine if they could be useful.
-
-
www.medrxiv.org www.medrxiv.org
-
On 2020-06-13 03:34:34, user kpfleger wrote:
Why are the 25(OH)D levels reported here (43 or 44 nmol/L w/ IQRs of 32 or 31 respectively for the n=580 C19+ and n=723 C19- UK Biobank cases) so much higher than those reported in Hastie et al, "Vitamin D concentrations and COVID-19 infection..." Diabetes Metab Syndr., 2020: https://pubmed.ncbi.nlm.nih...<br /> which reported median 25(OH)D of 29nmol/L w/ IQR 10-44 for C19+ & 33 IQR 10-47.<br /> This is a huge difference for 2 papers with online publication dates 2 days apart both pulling data from the same source.
See also D'Avolio et al, "25-Hydroxyvitamin D concentrations are lower in patients with positive PCR for SARS-CoV-2", Nutrients, 2020 and Meltzer et al, “Association of vitamin D deficiency and treatment with COVID-19 incidence”, medRxiv, 2020 for 2 different studies that found in contrast to the top level conclusion here, that low D was associated with higher C19 incidence. Discussion of all 4 paper of these papers in the "D deficiency might be associated with higher infection risk" of the review: "Low vitamin D worsens COVID-19": http://agingbiotech.info/vi...
-
-
www.medrxiv.org www.medrxiv.org
-
On 2021-04-01 04:10:21, user Michal P wrote:
This study has a number of significant flaws and in my opinion should not be used for any decision making.
First, the sample size is very small - only 282 tests with only 2 positive cases. The authors state as their conclusion the rate of 7 positive cases out of 1000 visitors, even though according to their own analysis the 95% confidence interval is 1-24. And even though the authors provide such a wide confidence interval, their estimate of the number of infected arrivals is far narrower: 17-30 in the November-December period. This range should be substantially wider to accommodate the uncertainty of the test estimate.
Second, the study is performing the tests when the visitors are departing, and as the authors admit, they cannot rule out that the visitors were infected on Maui. Even if one of the two infections occured on Maui, that would completely change the result.
Finally, the study still suffers from selection bias. It sampled visitors arriving on a single day, with most of the visitors from California and Washington, during a time of high infections in the US. Current infection rate in the US is about 4 times lower than at the time the study is performed. This alone suggests that the likelihood of a visitor being infected now is 4 times lower than at the time the study was performed.
For this study to be useful for policy making it should be substantially larger to provide higher statistical power. And the estimate of the number of infected visitors should be conditional both on the number of arriving visitors as well as the prevalence of the infection in the locations the visitors are arriving from .
-
-
www.medrxiv.org www.medrxiv.org
-
On 2021-05-13 15:56:02, user Tatiana Araujo Pereira wrote:
It has been more than one year since the Coronavirus Disease 2019 (COVID-19) outbreak started. We already have effective vaccines around the world, but the imbalance between supply and demand allows Sars-CoV-2 to spread and mutate faster than mass immunization, especially in less developed countries. The arise of more transmissible variants is very worrying and motivates the search for biomarkers that enable early assessment of possible critical cases as well as therapeutic targets for the disease. In this sense Flora et al [1] performed laboratory and proteomic analysis of the plasma sample from a cohort of 163 COVID-19 patients admitted to Bauru State Hospital (São Paulo, Brasil) divided in three groups: “a) patients with mild symptoms that were discharged without admission to an ICU; b) patients with severe symptoms that were discharged after admission to an ICU; c) critical patients, who were admitted to an ICU and died”. The results point to a high concentration of ferritin (FTN) and absence of the IREB2 protein in volunteers exhibiting severe and critical symptoms, indicating that iron homeostasis would be a possible therapeutic target. These results are in line with previous researches, which also identified FTN levels directly related to the severity of the disease [2-5]. Ferritin is an iron reservoir protein, keeping it in its core shell to protect cells against oxidative stress. There are other proteins inhibiting iron redox reactivity in the body, helping with metal ions transport (Transferrin), import to (Divalent Metal Transport) and export from (Ferroportin) the cell [6, 7]. Due to its role in iron homeostasis, FTN is used to indirectly assess iron status in the body. Ordinarily, high levels of FTN mean iron overload [8]. However, circulating ferritin can be elevated independently of iron overload in inflammatory processes, in which it acts as immunosuppressant and proinflamatory modulator [4, 9, 10]. IREB2 is an Iron Regulatory Protein (IRP). When iron levels are low these proteins are able to attach to an untranslated region of mRNA known as Iron Responsive Elements (IRE). Through this mechanism it regulates expression of transferrin receptor and ferritin. In iron overload conditions the affinity of IRP for IRE is not enough to keep the attachment and the protein degrades or takes another role. IREB2 represses ferritin translation when bounded to IRE in FTN-mRNA and degrades in iron overload conditions [6, 11-13].<br /> Because of observed data, Flora et al [1] concluded that “increasing the expression of IREB2 might be a therapeutic possibility to reduce ferritin levels and, in turn, the severity of COVID-19”. Nonetheless, there is no data about iron status in the plasma of the subjects. So it is impossible to be sure whether the high levels of FTN and absence of IREB2 are associated with iron overload. In this case, suppressing ferritin production could culminate in greater oxidative damage, and even increase the risk of opportunistic infections, since intracellular segregation of iron is one of the main strategies to defend host against parasites [14]. In macrophages, this mechanism induces production of nitrogen and oxygen reactive species helping immune defenses [15, 16], but in chronic inflammation it affects iron recycling [17]. Another way to limit iron availability involves its main regulatory hormone hepcidin, which inhibits iron exit from the cell [18]. Hepcidin expression is induced by interleukine-6 (IL-6), which is produced in Sars-CoV-2 infection [19]. Also, Sepehr Ehsani identified a hepcidin mimetic in protein S region that plays a fundamental role in membrane fusion [20]. In this context it is important to verify the possibility that high levels of FTN are not associated with iron overload and only then consider increasing in IREB2 expression as a therapeutic strategy against COVID-19.
AUTHORS<br /> Pereira, T A and Espósito, B P.<br /> Institute of Chemistry – Univesity of São Paulo.
REFERENCES<br /> 1. Flora DC, Valle AD, Pereira HABS. et al. Quantitative plasma proteomics of survivor and non-survivor COVID19 patients admitted to hospital unravels potential prognostic biomarkers and therapeutic targets. MedRxiv; doi: https://doi.org/10.1101/202....<br /> 2. Cavezzi A, Troiani E, Corrao S. COVID-19: hemoglobin, iron, and hypoxia beyond inflammation. A narrative review. Clin Pract. 2020 May 28;10(2):1271.<br /> 3. Bellmann-Weiler R, Lanser L, Barket R, et al. Prevalence and Predictive Value of Anemia and Dysregulated Iron Homeostasis in Patients with COVID-19 Infection. J Clin Med. 2020;9(8):2429.<br /> 4. Colafrancesco S, Alessandri C, Conti F, Priori R. COVID-19 gone bad: A new character in the spectrum of the hyperferritinemic syndrome?. Autoimmun Rev. 2020;19(7):102573.<br /> 5. Perricone C, Bartoloni E, Bursi R et al. COVID-19 as Part of the Hyperferritinemic Syndromes: the Role of Iron Depletion Therapy. Immunologic Research, vol. 68, no. 4, 2020, pp. 213-224.<br /> 6. Halliwell B and Gutteridge JMC. Free Radicals in Biology and Medicine. 4th ed., Oxford: University Press, 2007.<br /> 7. Grotto HZW. Metabolismo do ferro: uma revisão sobre os principais mecanismos envolvidos em sua homeostase. Rev. Bras. Hematol. Hemoter., vol. 30, no 5, 2008, pp. 390-397.<br /> 8. World Health Organization, Centers for Disease Control and Prevention. Assessing the iron status of populations. 2nd ed., World Health Organization, 2007. ISBN: 978 92 4 1596107 (electronic version).<br /> 9. Ruddell RG, Hoang-Le D, Barwood JM et al. Ferritin functions as a proinflammatory cytokine via iron-independent protein kinase C zeta/nuclear factor kappaB-regulated signaling in rat hepatic stellate cells. Hepatology. 2009 Mar;49(3):887-900.<br /> 10. Chen TT, Li L, Chung DH et al. TIM-2 is expressed on B cells and in liver and kidney and is a receptor for H-ferritin endocytosis. J Exp Med. 2005;202(7):955-965.<br /> 11. Kuhn LC and Hentze MW. Coordination of Cellular Iron Metabolism by Post-transcriptional Gene Regulation. J Inorg Biochem, vol. 47, no 3-4, 1992, pp. 183-195.<br /> 12. Schalinske KL, Chen OS, Eisenstein RS. Iron differentially stimulates translation of mitochondrial aconitase and ferritin mRNAs in mammalian cells. Implications for iron regulatory proteins as regulators of mitochondrial citrate utilization. J Biol Chem, vol. 273, no 6, 1998, pp. 3740-3746.<br /> 13. Tong W.-H and Rouault TA. Metabolic Regulation Of Citrate And Iron By Aconitases: Role Of Iron-sulfur Clusters Biogenesis. Biometals, vol. 20, no 3-4, 2007, pp. 549-564.<br /> 14. Gan Z, Tang X, Wan Z et al. Regulation of macrophage iron homeostasis is associated with the localization of bacteria. Metallomics, vol. 11, no 3, 2019, pp. 454-461.<br /> 15. Ratledge C and Dover LG. Iron metabolism in pathogenic bacteria. Annu Rev Microbiol, vol. 54, 2000, pp. 881-941.<br /> 16. Schaible UE and Kaufmann SHE. Iron and microbial infection. Nature Reviews Microbiology, vol. 2, 2004, pp. 946–953.<br /> 17. Castro L, Tórtora V, Mansilla S, Radi R. Aconitases: Non-redox Iron-Sulfur Proteins Sensitive to Reactive Species. Acc Chem Res. 2019 Sep 17;52(9):2609-2619.<br /> 18. Martínez-Pastor M and Puig S. Adaptation to iron deficiency in human pathogenic fungi. Biochimica et Biophysica Acta (BBA) - Molecular Cell Research, vol. 1867, no 10, 2020.<br /> 19. Liu W, Zhang S, Nekhai S, Liu S. Depriving Iron Supply to the Virus Represents a Promising Adjuvant Therapeutic Against Viral Survival [published online ahead of print, 2020 Apr 20]. Curr Clin Microbiol Rep. 2020;1-7.<br /> 20. Ehsani S. Distant sequence similarity between hepcidin and the novel coronavirus spike glycoprotein: a potential hint at the possibility of local iron dysregulation in COVID-19. Biol Direct, vol. 15, 2020, p. 19.
-
-
www.medrxiv.org www.medrxiv.org
-
On 2024-12-28 04:44:14, user xPeer wrote:
Courtesy review from xPeerd.com
The paper, "Machine Learning Approaches to Predict Alcohol Consumption from Biomarkers in the UK Biobank," evaluates five machine learning (ML) models to predict alcohol consumption (DPW) using biomarkers. The study leverages biomarkers and covariates from the UK Biobank to enhance prediction accuracy. The highest-performing model, XGBOOST, achieved an r² of 0.356. The research findings indicate that using biomarkers significantly improves the prediction of heavy drinking and other related phenotypes.
Potential Major Revisions:
-
Biomarker Selection Justification: While the paper discusses known biomarkers, it does not provide a detailed rationale for selecting the specific 338 predictors used. The study should offer more context or references explaining why these particular biomarkers were chosen and how they relate to alcohol consumption prediction comprehensively (pg. 4).
-
Ethical Considerations and Limitations: Although the study briefly mentions the ethical limitations concerning the UK's demographics, it could expound on this point, addressing how the findings might translate to diverse populations not represented in the UK Biobank dataset (pg. 16).
-
Model Generalizability: The study should provide more details on the applicability and generalizability of the model findings to different populations with genetic diversity and varying socio-economic backgrounds (pg. 17). It must address how the model could adapt or fail in non-European cohorts as the generalizability might vary.
Potential Minor Revisions:
- Typographical and Minor Errors:
- Consistency in the abbreviation of DPW (Drinks Per Week) is essential. There are minor inconsistencies throughout the manuscript that could be formatted uniformly (pg. 7, 14).
-
Clarity and readability can be enhanced by eliminating repeated phrases (e.g., "Alcohol Consumption prediction using biomarkers" is repeated frequently which might be condensed or varied).
-
Formatting Issues:
- Figures and Tables: Ensure all figures and tables are referenced correctly in the text and positioned to avoid disrupting reading flow (p.13, Figures 3, 4, 8).
-
Supplementary Information: Cross-reference supplementary information more clearly within the text to aid readers in locating relevant data (e.g., Supplementary Table T3 and Figures S2).
-
AI Content Analysis:
- There is no explicit indication of AI-generated content in this paper. However, the paper exhibits some areas of redundancy which can be indicative of AI-aided writing:
- Assessed AI content reflects about 5% of the total document. These are sections that repeat information about statistical measures and known biological impacts without much nuanced discussion (e.g., discussion of model performances and the role of biomarkers) (pg. 10-11).
- The epistemic impact of this AI-generated content is minimal and does not undermine the scientific integrity of the paper. It would benefit from a more nuanced discussion of the statistical results and implications.
Recommendations:
- Improving Rationale and Discussion:
- Strengthen the section discussing the selection of specific biomarkers with comprehensive explanations or references.
-
Expand on the implications of the model predictions, especially in clinical and public health contexts, to enhance readability and relevance.
-
Enhancing Generalizability:
- Discuss in more detail how these predictive models could be adjusted or re-calibrated for non-European populations.
-
Provide more comprehensive demographic benefits and limitations to reinforce the findings' applicability and reliability.
-
Visual and Supplementary Data Clarity:
- Organize figures and tables to enhance their impact without disrupting the flow.
- Ensure all supplementary materials are accurately referenced and easy to locate within the text.
By addressing these major and minor revisions, the manuscript will achieve higher clarity, ethical robustness, and academic integrity while broadening its impacts across diverse populations and further grounding its findings within the literature.
-
-
-
www.medrxiv.org www.medrxiv.org
-
On 2020-09-14 19:25:30, user Vincent Fleury wrote:
Can you provide the distribution by age of the deaths, I can't find it in the paper. What I read is that there are 8 times more people in the stratum age>65yo, while the mortality is only 3 to 4 times higher. If mortality occurs only in the >65yo, then this work shows 1-that HCQ is not given to elderlies and 2-potentially that HCQ is actually harmful.
-
-
www.medrxiv.org www.medrxiv.org
-
On 2021-06-11 18:53:43, user SemperCogitens wrote:
A couple of things people really need to note here:<br /> 1) This is PRE-publication. It hasn't been peer-reviewed. Everything on this website is such. It cannot be regarded the same as something which has gone through the full process with a respected journal.<br /> 2) This is an observational study (retrospective cohort). It is NOT a randomized, placebo-controlled clinical trial. Only the RCT can prove causation. This is hypothesis-generating research only. It does not PROVE HCQ works, merely suggests that.
3) If you dig in a bit, they define "treatment" to include only 37 of the advertised 250ish patients in the cohort, specifically those receiving >3,000mg HCQ and >1g azithromycin. Small sample sizes should always be viewed with extreme skepticism. Less than 30ish and your p-value is essentially meaningless.
4) The overall mortality rate of the total group was ~80%! These people were old, unhealthy to begin with, admitted to the hospital after nearly a week of progressing symptoms, required ICU care, intubation, and mechanical ventilation. These were very sick patients.
5) Clinically, we see a pattern for the treatment of ARDS and secondary pneumonia, not COVID. High dose corticosteroids work (we know this for ARDS), tocilizumab, a potent anti-inflammatory works (we have some data for this in ARDS as well). And azithromycin is a very common drug to treat bacterial pneumonias that often pop up secondary to lung disease like this.
So, please avoid jumping to unsupported conclusions. If we want real answers, we have to keep our skepticism, and be very careful in our analysis. The key here is we need corroborating studies. An April 2020 study at the VA showed exactly the opposite effect of HCQ in a similar patient population (though the VA obviously serves more males).
-