Commoditizing complements doesn't always work because focus is scarce even for the largest, fastest growing businesses.
大多数人认为科技巨头拥有无限资源实施各种战略,但作者指出即使是最大、增长最快的企业也面临注意力稀缺问题。这一观点挑战了规模经济理论,暗示过度扩张可能导致核心竞争力的稀释。
Commoditizing complements doesn't always work because focus is scarce even for the largest, fastest growing businesses.
大多数人认为科技巨头拥有无限资源实施各种战略,但作者指出即使是最大、增长最快的企业也面临注意力稀缺问题。这一观点挑战了规模经济理论,暗示过度扩张可能导致核心竞争力的稀释。
The risk of this strategy to the ecosystem is that it makes previously attractive categories no longer viable. Commoditizing the complement does not demand a best-in-class replacement.
大多数人认为市场竞争会推动产品持续创新和改进,但作者认为免费化策略实际上降低了市场对卓越产品的需求,因为'足够好'的免费产品就能改变市场动态。这一观点挑战了传统创新经济学理论,暗示市场可能因免费化而停滞。
Several correlated but not strictly identical changes happened over the same few months: scaling inference compute, heavier use of RL in post-training, and models producing reasoning tokens.
大多数人可能将AI能力加速归因于单一因素(如模型规模增大),但作者指出这是多种因素共同作用的结果,包括推理计算扩展、强化学习在训练后阶段的使用增加以及模型生成推理标记的能力。这一多元归因挑战了单一因素决定论。
Tasks where correctness is harder to verify may not have seen the same speedup, so the acceleration we document here may not be as general as the headline numbers suggest.
大多数人可能被媒体报道的AI加速数据所影响,认为所有AI任务都在加速,但作者明确指出,那些正确性难以验证的任务可能没有相同的加速速度。这一观点挑战了人们对AI能力普遍加速的乐观预期。
The three metrics where we find acceleration are concentrated in programming and mathematics. These are areas that labs have explicitly targeted for improvement, and they share an important property: correctness is easy to verify automatically.
大多数人可能认为AI能力的加速是跨领域普遍发生的,但作者指出加速主要集中在编程和数学领域,因为这些领域正确性容易自动验证。这一发现挑战了人们对AI能力普遍提升的假设,暗示加速可能是有选择性的。
Our fourth metric, an index constructed from WeirdML V2 results, showed no sign of acceleration. A single global linear trend fit the data best.
大多数人可能认为所有AI能力指标都应该同步加速,但作者发现WeirdML V2指标没有显示出任何加速迹象,最佳拟合仍是简单的全局线性趋势。这一发现表明AI能力的加速并不是普遍现象,而是特定于某些任务领域。
Three of the four metrics (ECI, log METR 50% time horizon, and a math-focused index we constructed from several math benchmarks) show strong evidence that progress has sped up relative to a global linear trend fit to data from 2023 onward.
大多数人认为AI能力提升是渐进式的线性发展,但作者通过数据分析发现,在三个关键指标上,AI能力实际上已经加速,这挑战了人们对AI发展速度的普遍认知。这种加速现象发生在2023年之后,与推理模型的发布时间点吻合。
Each cell shows how often a given curve fit is not significantly worse than the fit with the best cross-validation accuracy.
研究使用交叉验证来评估不同曲线拟合的优劣,每个单元格显示给定曲线拟合与最佳拟合相比不显著差于的频率。这种方法提供了更稳健的统计评估,减少了过拟合风险。
Our fourth metric, an index constructed from WeirdML V2 results, showed no sign of acceleration. A single global linear trend fit the data best.
这个25%的指标没有显示出加速趋势,提供了一个重要的对比案例。作者推测这可能是因为WeirdML V2设置了资源限制环境(模型只有5次提交代码的机会,无法使用外部工具),这与当前RL训练的重点不符。这表明AI进步可能高度依赖于测试环境和评估标准。
We have been calling this the 'reasoning' / 'non-reasoning' split, but this is not a perfectly clean dichotomy. Several correlated but not strictly identical changes happened over the same few months: scaling inference compute, heavier use of RL in post-training, and models producing reasoning tokens.
这里承认了分类方法的局限性,指出2024年左右的AI能力加速可能是由多个因素共同作用的结果,而非仅仅是推理能力的提升。这表明文章作者对数据的复杂性有清醒认识,但缺乏对这些因素相对重要性的量化分析。
The best-performing model across these three metrics was a pair of independent linear trends: one for reasoning models and one for non-reasoning models.
这个模型选择结果(100%的三个指标)表明将模型分为推理和非推理两类是最优预测模型。这提供了强有力的统计证据,支持推理能力可能是AI加速发展的关键因素。然而,文章没有详细说明如何定义推理模型,这可能影响结果的可靠性。
Three of the four metrics (ECI, log METR 50% time horizon, and a math-focused index we constructed from several math benchmarks) show strong evidence that progress has sped up relative to a global linear trend fit to data from 2023 onward.
这是一个关键的统计数据,表明75%的AI能力指标显示出加速趋势。文章使用2023年后的数据进行线性拟合,发现三个指标偏离了线性趋势。这个比例相当高,但值得注意的是,样本量较小(n=4),可能影响统计显著性。需要更多指标来验证这一发现。
Get the latest from Epoch AI in your inbox
网站提供了一个订阅选项,但没有提供具体的订阅者数量或增长率数据,此处缺乏量化依据。
Within eight days, the same campaign had cascaded from GitHub Actions to Docker Hub, npm, PyPI, and the VS Code extension marketplace. With just one token across five ecosystems, thousands of organizations were potentially impacted.
大多数人认为软件供应链攻击通常是针对特定生态系统或缓慢扩散的,但作者展示了跨生态系统的快速级联攻击。这种攻击速度和范围远超传统认知,表明现代软件供应链的脆弱性被严重低估。
Modern-day security tooling looks for the wrong things. Most software composition analysis tools work by checking your dependencies against a database of known vulnerabilities – CVEs. But a deliberately planted backdoor doesn't have a CVE.
大多数安全团队依赖CVE数据库来评估风险,但作者指出这种方法对故意植入的后门完全无效。这一观点挑战了行业共识,暗示现有安全工具在新型供应链攻击面前已经过时,需要转向行为分析等新方法。
The result is a mismatch that should terrify anyone building software: the attack surface is expanding faster than any human can monitor, and the entities making dependency decisions are increasingly not human.
大多数人认为安全问题可以通过增加人力监控和审查来解决,但作者认为在AI时代,攻击面扩展速度已经超过了人类监控能力,且依赖决策越来越由AI而非人类做出。这一观点挑战了传统安全理念,暗示需要全新的自动化防御机制。
Socket, an a16z portfolio company, detected the malicious dependency in the Axios attack within 6 minutes of its publication. That's roughly 63,000 times faster than the industry average.
令人惊讶的是:Socket公司在Axios攻击发布后仅6分钟就检测到恶意依赖,这比行业平均水平快约63,000倍。这种速度差异凸显了传统安全工具与新型行为检测方法之间的巨大鸿沟,也展示了早期检测在防止供应链攻击中的关键作用。
Within eight days, the same campaign had cascaded from GitHub Actions to Docker Hub, npm, PyPI, and the VS Code extension marketplace. With just one token across five ecosystems, thousands of organizations were potentially impacted.
令人惊讶的是:一个单一的访问令牌可以在短短八天内横跨五个主要生态系统(GitHub Actions、Docker Hub、npm、PyPI和VS Code扩展市场),自动传播恶意代码,影响数千个组织。这种级联供应链攻击展示了现代软件生态系统的脆弱性。
The industry average time to detect a supply chain breach is 267 days. SolarWinds went undetected for 14 months. XZ Utils took two years to surface.
令人惊讶的是:软件供应链漏洞的平均检测时间长达267天,有些攻击如XZ Utils甚至需要两年才被发现。这意味着攻击者有充足的时间在系统中潜伏并造成广泛损害,而组织往往在损害发生后才意识到问题。
I had the intuition that these problems were kind of clustered together and they had some kind of unifying feel to them. And this new method is really confirming that intuition.
大多数人认为数学问题之间通常是独立且需要不同方法解决的,但作者认为这些问题实际上是相互关联的,有统一的方法可以解决,这挑战了我们对数学问题多样性的传统认知。
The LLM took an entirely different route, using a formula that was well known in related parts of math, but which no one had thought to apply to this type of question.
大多数人认为数学突破需要全新的理论或方法,但作者认为AI只是应用了一个已知但未被想到应用于此问题的公式,这挑战了数学创新必须依赖全新方法的传统观念。
The question Price solved—or prompted ChatGPT to solve—concerns special sets of whole numbers, where no number in the set can be evenly divided by any other.
大多数人认为解决复杂的数学问题需要深入的专业知识和复杂的推理过程,但作者表明一个简单的概念(不能互相整除的数字集合)可以构成一个60年未解决的难题,挑战了人们对数学问题复杂性的认知。
We have discovered a new way to think about large numbers and their anatomy. It's a nice achievement. I think the jury is still out on the long-term significance.
大多数人认为AI的数学突破具有重大意义,但作者认为其长期意义尚不确定,这挑战了人们对AI数学成就重要性的普遍预期,暗示技术突破不一定等同于长期价值。
I had the intuition that these problems were kind of clustered together and they had some kind of unifying feel to them. And this new method is really confirming that intuition.
大多数人认为数学问题各自独立,需要不同的方法解决,但作者认为这些问题实际上有某种统一性,挑战了数学问题多样性和独立性的传统认知。
The LLM took an entirely different route, using a formula that was well known in related parts of math, but which no one had thought to apply to this type of question.
大多数人认为数学突破需要全新的理论或方法,但作者认为AI只是将已知公式应用到新领域就能取得突破,这挑战了人们对数学创新本质的理解,暗示创新有时来自于跨领域应用而非全新创造。
What he does have is a ChatGPT Pro subscription, which gives him access to the latest large language models from OpenAI.
大多数人认为数学成就主要依赖于个人智力和训练,但Price的成功关键是他拥有AI工具访问权限,这暗示在未来的数学领域,技术资源可能比个人能力更重要,挑战了传统天才观念。
I had the intuition that these problems were kind of clustered together and they had some kind of unifying feel to them. And this new method is really confirming that intuition.
大多数人认为数学问题是孤立的,需要不同的方法解决,但Lichtman的直觉表明这些问题可能有内在联系,AI的发现证实了这一观点,暗示数学领域可能存在尚未被发现的深层统一性。
The LLM took an entirely different route, using a formula that was well known in related parts of math, but which no one had thought to apply to this type of question.
大多数人认为数学突破需要全新的理论或方法,但AI的解决方案使用了已知公式只是应用到了新领域,这表明创新可能更多来自于跨领域应用而非全新发明,挑战了我们对数学创新本质的理解。
You can open the Threads Sidebar from the icon in the bottom left, or via the keybinding option-cmd-j on macOS and ctrl-option-j on Linux and Windows.
文章提供了具体的键盘快捷键信息,这是一个具体的技术细节。option-cmd-j和ctrl-option-j是跨平台的快捷键组合,表明设计考虑了不同操作系统的用户习惯。这些具体的技术细节增加了文章的实用性,但缺乏关于这些快捷键的使用频率或用户满意度数据。
We spent days loading the system with hundreds of threads, refining rough edges and polishing corners that developers may never see.
文章提到团队使用'数百个线程'进行了数天的压力测试,这是一个具体的工作量指标。'数百个'虽然不是精确数字,但表明系统设计考虑了大规模并发场景。这种大规模测试表明开发团队对系统稳定性的重视程度,但缺乏具体的线程数量上限和性能指标数据。
Elevate your brand to the forefront of conversation around emerging technologies
这是一个营销声明,但缺乏具体数据支持。没有提供广告效果、转化率或投资回报率等关键指标。这种表述过于笼统,无法评估其广告服务的实际价值和效果。
Founded at the Massachusetts Institute of Technology in 1899
这个时间点与当前日期(2026年)相比,意味着该机构已经运营了127年。这使其成为美国历史最悠久的科技媒体之一,经历了从电力时代到数字时代的多次技术变革,积累了丰富的行业洞察。
We weren't able to find the page you were looking for.
这是一个404错误页面的标准提示,表明请求的URL不存在。虽然这不是文章内容,但作为网页错误信息,它反映了链接失效的问题,可能意味着原文章已被删除或URL结构发生变化。
Founded at the Massachusetts Institute of Technology in 1899
这个数据点表明MIT Technology Review有着127年的历史,是一家具有悠久传统的科技媒体。这个时间跨度意味着该机构经历了多次技术革命,其历史积淀为其内容提供了独特的视角和权威性。
eLife Assessment
This study provides fundamental insight by identifying C. elegans SET-19 as a key enzyme that deposits H3K23me to somatic chromatin. The evidence is compelling, using a broad and modern toolkit of biochemical, genetic, and genome-wide analyses that consistently support the main claims. The significance of the study is further strengthened by the fact that H3K23me is an understudied histone modification, which is also conserved in mammals.
Reviewer #1 (Public review):
Summary:
The authors wanted to determine whether the set-19 gene, one of 38 SET-domain containing genes in C elegans, has a clear function in vivo with respect to lysine methylation. The question is not only whether it can modify this histone tail residue, but also what the impact of a loss of this locus is on the inheritance of repressive chromatin states.
Strengths:
The authors clearly achieved their goal, and it is convincingly shown that SET_19 is indeed a somatic cell histone methyltransferase with a striking specificity for H3K23. There is both recombinant protein work, quantitative mapping in vivo, of histone marks and transcriptional changes, and the authors rule out some other hypotheses that have been in the literature. Overall, this provides a compelling argument that SET-19 is indeed the major somatic cell HMT for this residue. Interestingly, the phenotypes are rather minimal, consistent with redundancy in the physiological roles of histone methylation, and redundancy as well in HMT function. For the most part, the data are not over-interpreted. The genetic alleles used, assuming they are confirmed, were revealing and well-documented.
Weaknesses:
The major weaknesses are easily fixed. The major weaknesses mainly reflect a slight overstatement of certain data (claiming insignificance, when it is not clear how that was determined) and claiming a bit too much about SET-32, which was independently claimed to be an H3K23 HMT. Clearly, the two SET domain enzymes are not redundant, nor is the claim that SET-32 has no role in H3K23 methylation completely convincing. Especially in germline or embryonic conditions. Finally, the imaging is not of very high quality, nor are the images fully quantitated. These points can be easily remedied.
Reviewer #2 (Public review):
Summary:
This manuscript identifies SET-19 as a somatic H3K23 methyltransferase in C. elegans, building on previous genetic evidence for a role of set-19 in H3K23me3 regulation. The authors combine quantitative mass spectrometry, western blotting, in vitro methyltransferase assays, ChIP-seq, and RNA-seq to show that loss of set-19 causes a strong reduction of H3K23me3, particularly in somatic tissues, and is associated with derepression of a subset of genes enriched for H3K23me3. They further conclude that SET-19 is dispensable for canonical feeding RNAi and for transgenerational or intergenerational inheritance of RNAi, distinguishing its function from other heterochromatin-associated methyltransferases such as SET-25, SET-32, and the H3K27 HMTs. Overall, the work adds an important piece to the H3K23 methylation pathway and tissue-specific chromatin regulation in C. elegans.
Strengths:
Very strong genetic and biochemical evidence for SET-19 as the major H3K23me3 HMT.
The mass spectrometry and western blot data convincingly demonstrate a strong reduction of H3K23me3 in two independent set-19 alleles and rescue by GFP::SET-19, which is a major strength (Figure 1, including Figure 1f).
The in vitro methyltransferase assays (Figure 2) showing robust H3K23me1/2/3 activity for SET-19 SET+CC and only modest H3K23me activity for SET-32, together with the SAM titration experiment in Figure 2C, are very informative and nicely support the conclusion that SET-19 is a high-activity H3K23 methyltransferase compared to SET-32.
The ChIP-seq analysis is central to the conclusions that H3K23me3 is enriched on chromosome arms, co-localizes with H3K9me3/H3K27me3, and is strongly reduced in set-19 mutants.
Weaknesses:
(1) The global reduction of H3K23me3 in Figure 3b,c and Figure S4c is convincing, but the correlation analysis between H3K23me3 loss and mRNA changes in Figure 3g could be strengthened. Currently, the analysis appears to focus on broad categories; it would be helpful to provide:
Representative genome browser tracks (e.g., exemplary gene coverage plots) for several genes that show clear H3K23me3 peaks in wild type, reduction in set-19, and concomitant upregulation of mRNA levels, and for a few genes that retain H3K23me3 and do not change expression. This would make the link between chromatin changes and transcriptional output more concrete.
(2) In Figure S4C, the authors note a pronounced reduction of H3K23me3 mainly on chromosome arms, but in the current data, it appears that the impact might be arm-specific (i.e., stronger reduction in one arm than the other in a chromosome), with a notable pattern at the X chromosome tip where H3K23me3 seems increased. This is potentially interesting and should be briefly commented on in the Results or Discussion, for example, whether this reflects compensatory activity of another HMT, changes in chromatin organization, or could be a technical artifact.
(3) Figure 3d suggests that some actively expressed genes can also display relatively high H3K23me3 levels, which complicates a simple model of H3K23me3 as exclusively repressive. If feasible, a limited additional analysis stratifying genes by both H3K23me3 and H3K9me3/H3K27me3 status might clarify whether these highly expressed, H3K23me3‑marked genes differ in other chromatin features.
(4) The authors argue that SET-19 primarily affects H3K23me3 and not other canonical repressive marks, based largely on mass spectrometry. It would significantly strengthen the mechanistic conclusions if the authors could assess H3K9me3 and H3K27me3 profiles in set-19 mutants, ideally by ChIP-seq or at least by focused ChIP-qPCR at a subset of loci that lose H3K23me3 and are derepressed at the RNA level. This would address whether H3K23me3 loss occurs independently of changes in other heterochromatin marks, or whether there is crosstalk.
Author response:
Public Reviews:
Reviewer #1 (Public review):
Summary:
The authors wanted to determine whether the set-19 gene, one of 38 SET-domain containing genes in C elegans, has a clear function in vivo with respect to lysine methylation. The question is not only whether it can modify this histone tail residue, but also what the impact of a loss of this locus is on the inheritance of repressive chromatin states.
Strengths:
The authors clearly achieved their goal, and it is convincingly shown that SET_19 is indeed a somatic cell histone methyltransferase with a striking specificity for H3K23. There is both recombinant protein work, quantitative mapping in vivo, of histone marks and transcriptional changes, and the authors rule out some other hypotheses that have been in the literature. Overall, this provides a compelling argument that SET-19 is indeed the major somatic cell HMT for this residue. Interestingly, the phenotypes are rather minimal, consistent with redundancy in the physiological roles of histone methylation, and redundancy as well in HMT function. For the most part, the data are not over-interpreted. The genetic alleles used, assuming they are confirmed, were revealing and well-documented.
Thanks very much for the positive comments on our work.
The alleles used in this study were confirmed by PCR and Sanger sequencing, and the sequence information will be added in the revised manuscript.
Weaknesses:
The major weaknesses are easily fixed. The major weaknesses mainly reflect a slight overstatement of certain data (claiming insignificance, when it is not clear how that was determined) and claiming a bit too much about SET-32, which was independently claimed to be an H3K23 HMT. Clearly, the two SET domain enzymes are not redundant, nor is the claim that SET-32 has no role in H3K23 methylation completely convincing. Especially in germline or embryonic conditions. Finally, the imaging is not of very high quality, nor are the images fully quantitated. These points can be easily remedied.
Thanks very much for the comments.
We agree that some interpretations in the original manuscript were too strong, particularly regarding the negative results and the role of SET-32. Our in vitro assays show that SET-32 exhibits H3K23me1 activity and, at higher SAM concentrations, activity toward H3K23me2/3. These findings indicate that SET-32 does have a role in H3K23 methylation. SET-32 is expressed in germ cells, oocytes, and embryos. It is quite likely that redundancy of H3K23 methyltransferase activity exists in these tissues. In the revised manuscript, we will tone down the interpretations and expand the Discussion section to include this possibility. We will also replace the relevant images with higher-quality versions and provide quantitative analyses for Figures 6a and 6b.
Reviewer #2 (Public review):
Summary:
This manuscript identifies SET-19 as a somatic H3K23 methyltransferase in C. elegans, building on previous genetic evidence for a role of set-19 in H3K23me3 regulation. The authors combine quantitative mass spectrometry, western blotting, in vitro methyltransferase assays, ChIP-seq, and RNA-seq to show that loss of set-19 causes a strong reduction of H3K23me3, particularly in somatic tissues, and is associated with derepression of a subset of genes enriched for H3K23me3. They further conclude that SET-19 is dispensable for canonical feeding RNAi and for transgenerational or intergenerational inheritance of RNAi, distinguishing its function from other heterochromatin-associated methyltransferases such as SET-25, SET-32, and the H3K27 HMTs. Overall, the work adds an important piece to the H3K23 methylation pathway and tissue-specific chromatin regulation in C. elegans.
Strengths:
Very strong genetic and biochemical evidence for SET-19 as the major H3K23me3 HMT.
The mass spectrometry and western blot data convincingly demonstrate a strong reduction of H3K23me3 in two independent set-19 alleles and rescue by GFP::SET-19, which is a major strength (Figure 1, including Figure 1f).
The in vitro methyltransferase assays (Figure 2) showing robust H3K23me1/2/3 activity for SET-19 SET+CC and only modest H3K23me activity for SET-32, together with the SAM titration experiment in Figure 2C, are very informative and nicely support the conclusion that SET-19 is a high-activity H3K23 methyltransferase compared to SET-32.
The ChIP-seq analysis is central to the conclusions that H3K23me3 is enriched on chromosome arms, co-localizes with H3K9me3/H3K27me3, and is strongly reduced in set-19 mutants.
Thanks very much for the positive comments on our work.
Weaknesses:
(1) The global reduction of H3K23me3 in Figure 3b,c and Figure S4c is convincing, but the correlation analysis between H3K23me3 loss and mRNA changes in Figure 3g could be strengthened. Currently, the analysis appears to focus on broad categories; it would be helpful to provide:
Representative genome browser tracks (e.g., exemplary gene coverage plots) for several genes that show clear H3K23me3 peaks in wild type, reduction in set-19, and concomitant upregulation of mRNA levels, and for a few genes that retain H3K23me3 and do not change expression. This would make the link between chromatin changes and transcriptional output more concrete.
Thanks very much for the suggestion.
To address this point, we will include representative genome browser tracks for selected genes in the revised manuscript. These examples will help better illustrate the relationship between H3K23me3 loss and mRNA expression changes.
(2) In Figure S4C, the authors note a pronounced reduction of H3K23me3 mainly on chromosome arms, but in the current data, it appears that the impact might be arm-specific (i.e., stronger reduction in one arm than the other in a chromosome), with a notable pattern at the X chromosome tip where H3K23me3 seems increased. This is potentially interesting and should be briefly commented on in the Results or Discussion, for example, whether this reflects compensatory activity of another HMT, changes in chromatin organization, or could be a technical artifact.
Thanks very much for bringing up this point.
As shown in Figure S4C, the overall chromosomal distribution pattern of H3K23me3 is broadly similar between wild type and set-19 mutants, with pronounced enrichment over one chromosomal arm, whereas the center and the opposite arm show relatively lower signal. In set-19 mutants, this asymmetry becomes more pronounced, with a larger difference between the highly enriched arm and the lower-signal regions. This pattern is particularly evident on chromosomes I, II, V, and X. These observations suggest that the effect of set-19 loss on H3K23me3 is not uniform across chromosomal regions.
Substantial H3K23me3 signal remains in specific regions in set-19 mutants, suggesting that additional enzyme(s) also contribute to H3K23me3 methylation. For example, SET-19 appears to function predominantly in somatic tissues, yet the ChIP-seq assays were performed using whole animals, including the germline. Alternatively, there might be compensatory activity of another HMT. In the revised manuscript, we will state these points more explicitly in the Results section and discuss the residual and locally increased H3K23me3 signals.
(3) Figure 3d suggests that some actively expressed genes can also display relatively high H3K23me3 levels, which complicates a simple model of H3K23me3 as exclusively repressive. If feasible, a limited additional analysis stratifying genes by both H3K23me3 and H3K9me3/H3K27me3 status might clarify whether these highly expressed, H3K23me3 marked genes differ in other chromatin features.
Thanks very much for the suggestion.
To address this point, we will perform additional stratified analyses of H3K23me3-marked genes according to their H3K9me3 and/or H3K27me3 status. We will also compare highly and weakly expressed H3K23me3-marked genes to examine whether they differ in other chromatin features, including H3K9me3, H3K27me3, and, if feasible, H3K4me3 and H3K36me3.
(4) The authors argue that SET-19 primarily affects H3K23me3 and not other canonical repressive marks, based largely on mass spectrometry. It would significantly strengthen the mechanistic conclusions if the authors could assess H3K9me3 and H3K27me3 profiles in set-19 mutants, ideally by ChIP-seq or at least by focused ChIP-qPCR at a subset of loci that lose H3K23me3 and are derepressed at the RNA level. This would address whether H3K23me3 loss occurs independently of changes in other heterochromatin marks, or whether there is crosstalk.
Thanks very much for the suggestions.
As suggested, H3K9me3 and H3K27me3 ChIP-seq in wild-type and set-19 mutants will be performed. We will compare their genome-wide distributions and identify loci with significantly altered H3K9me3 and/or H3K27me3 enrichment. These analyses should help clarify whether H3K23me3 loss occurs largely independently of H3K9me3/H3K27me3 changes or reflects potential crosstalk among these repressive chromatin marks. In addition, we will examine H3K9me3 and H3K27me3 enrichment at genes showing both H3K23me3 loss and increased mRNA expression in set-19 mutants to assess whether derepression at these loci is accompanied by changes in other canonical repressive marks.
Déduction
Hey Afra, just a test to see how it runs! The deduction principle is easier to introduce than the two other hehe.
eLife Assessment
This valuable study examines the subcellular dynamics of the mammalian circadian clock proteins PER2, CRY1, and CK1, providing solid evidence that CK1 modulates the PER2-CRY1 interaction and drives the cytoplasmic localization of PER2 complexes. This could play a key role in modulating transcriptional repression by PER2, CRY1, and CK that contributes to the molecular circadian clock. There are minor concerns regarding the overexpression of the clock proteins in this study.
[Editors' note: this paper was previously reviewed by another journal.]
Reviewer #2 (Public review):
Summary:
This study aims to examine the effects of the subcellular localization of the mammalian clock protein PER2 and its dedicated binding partners CRY1 and the kinase CK1. Using a combination of transient transfection and a Dox-inducible expression system, they show that CRY1 promotes nuclear retention of PER2, and that phosphorylation of PER2 by CK1 promotes cytoplasmic localization and release of CRY1. Changes in complex assembly and subcellular localization could impact the transcriptional repressive function of the CK1-PER2-CRY1 complex in the molecular clock.
Strengths:
The study establishes a system of transient transfection and Dox-inducible expression that allows for strict temporal control of the presence of fluorescently-tagged clock proteins. This is essential to conduct time-lapse microscopy studies that determine changes in the apparent subcellular localization and stability of associated clock proteins. With the potential caveats of overexpression set aside, the authors make use of good controls and supplement cell-based work with in vitro experiments where possible. The discovery that phosphorylation of PER2 by CK1 in the nucleus leads to cytoplasmic localization of PER2 and PER2-CRY1 complexes is a new finding. Moreover, the apparent dissociation of CRY1 from PER2 after CK1 phosphorylation provides a potentially new mechanism by which the repressive activity of this complex could be regulated.
Weaknesses:
Overexpression of circadian clock components, normally expressed at low levels, could disrupt the stoichiometry of native interactions, Although the authors provide a reasonable rationale for the Dox-inducible approach and use appropriate controls throughout the experiments, there is still concern that overexpression of the components of this transcriptional repressive complex far exceed the concentration of the transcription factor they regulate, and this has not been taken into consideration here. In addition, the interesting discovery that CK1 phosphorylation of PER2 leads to dissociation of CRY1 has not identified the phosphorylation site(s) responsible for this, so the mechanism by which this occurs is still unknown. Still, this study provides some interesting hypotheses regarding CK1 regulation of PER2 and CRY1 that could drive future work in the field.
Comments on latest version:
This manuscript has already undergone two rounds of review at a reputable journal, and we have been provided with the previous reviewers' comments and the authors' responses. I am satisfied with the responses and changes to the manuscript made in these previous rounds of review and don't have any further experiments to suggest that wouldn't represent significant additional work.
Author response:
[These author responses are to reviews from another journal.]
Reviewer #1:
This manuscript investigates the behaviour of a variety of clock proteins in cultured cells when epitope tagged and transiently expressed and try to draw general implications for endogenous function of circadian clock proteins.
Clock proteins are expressed at low levels in most cells, and so the clock interacting proteins (other kinases, phosphatases, ubiquitin-conjugated enzymes, etc.) are likewise probably at low abundance. Over-expression of one or two or even three components of a multicomponent system is going to produce odd and obscure non-physiological imbalances. The authors do not extend detailed study of these imbalances to more physiologic levels so the importance of their observations to clock function is not clear, and importantly, they are not tested in more biologically relevant models.
To study the function of components within a system, the steady state must be perturbed in one way or another. This can be achieved through pharmacological treatment, mutagenesis, downregulation, or overexpression. Such interventions are inherently non-physiological, and the relevance of the resulting observations must therefore be carefully validated.
In our study, the purpose of PER2 overexpression was to investigate its subcellular dynamics in the absence and presence of CRYs, specifically CRY1. This is far less trivial than it might appear at first glance, because our data clearly show that PER2 overexpression triggers, within 24 h, the accumulation of endogenous CRY1 (Fig. 1A), due to PER2-mediated stabilization of CRY1 (Fig. 4). PER2 overexpression also induces the accumulation of endogenous PER1, CK1, and BMAL1 (Fig. 2).
This effect was not considered in previous studies, such as Yagita et al. (2002), in which PER2 subcellular localization was assessed at a single time point following transient transfection. Yagita et al. found roughly equal proportions of cells with PER2 exclusively in the nucleus, exclusively in the cytoplasm, or distributed between both compartments. Such extreme cell-to-cell variability cannot be explained solely by PER2’s shuttling dynamics, as that would imply synchronous export in one cell and synchronous import in another.
Our time-resolved analysis of DOX-induced PER2 expression strongly suggests that the variability reported by Yagita et al. reflects a heterogeneous population of unsynchronized cells at different temporal stages along a trajectory from cytoplasmic PER2 (unbound) to nuclear PER2 fully saturated with CRYs (bound), owing to stabilization of endogenous CRYs. Similarly, Öllinger et al. (2014) analyzed PER2 nuclear export in cells constitutively expressing PER2-Dendra. Under such steady-state conditions, PER2-Dendra is already in complex with endogenous CRYs. The slow export rate and lack of dependence on additional CRY1 expression therefore likely reflect export of the complex, which is intrinsically slow.
Thus, prior to our work, no data on the true shuttling dynamics of PER2 were available.
Importantly, our results show not only that CRY1 promotes nuclear accumulation of PER2 (as reported by Öllinger et al.) but also that, conversely, PER2 promotes cytosolic accumulation of CRY1, depending on their expression ratio. Since CRY1 is predominantly nuclear and PER2 predominantly cytosolic, and because a PER2 dimer can bind one or two CRY1 molecules, our data suggest that the shuttling equilibrium depends on PER2 saturation state: a PER2 dimer bound to one CRY1 remains cytosolic, whereas a dimer bound to two CRY1 is nuclear.
These observations are novel and have not been reported previously. They were only possible through time-resolved analysis of overexpressed proteins.
A number of the findings are confirmatory rather than novel - the phosphorylation-regulated nuclear-cytoplasmic shuttling of CK1 and PER proteins is long known, and it's not clearly stated what is novel here.
We acknowledge prior work by Milne et al. (2001), who showed that kinase-dead CK1 is predominantly nuclear and that prolonged treatment with leptomycin B (16 h) enhances its nuclear localization. We cite this study at the beginning of the relevant paragraph. While we confirm these earlier observations, our work extends them in several important and novel ways:
(1) Rapid dynamics of CK1 localization – We show that pharmacological inhibition of CK1 with PF670 induces rapid (within 1 h) depletion of CK1δ from the centrosome, accompanied by nuclear accumulation and elevated CK1δ levels. These kinetics have not previously been reported. We also show that proteasome inhibition with MG132 enhance centrosomal staining, indicating that centrosomal binding sites are not saturated. Together, the data show that CK1δ equilibrates rapidly between its binding partners.
(2) Integration of localization with protein stability – We relate the known localization patterns of WT CK1 and the kinase-dead mutant K38R to CK1 degradation dynamics and further compare them to the tau-like kinase mutant CK1δ-R1178Q. This integration of subcellular localization data with turnover mechanisms provides new mechanistic insight.
(3) Comprehensive regulatory model – In the revised manuscript, we now include a schematic summarizing how CK1δ is posttranslationally regulated via subcellular shuttling, nuclear degradation, and dynamic interactions with binding partners (Figure EV5C). To our knowledge, such a comprehensive view of CK1δ regulation, linking localization, stability, and partner association, has not been presented before.
We believe these additions clearly distinguish our findings from prior reports and highlight the novel aspects of our study.
The formation of PER and CRY and CK1 complexes likewise is well established. The finding that formation of multiprotein complexes stabilize otherwise unstable over-expressed proteins is interesting but not novel.
We fully agree that the existence of PER–CRY–CK1 complexes is well established. It is also known that PER2 stabilizes CRY1 by occupying the FBXL3 binding site and that CRY1 promotes the nuclear accumulation of PER2. We do not present these established interactions as novel findings.
Our novel contribution, as outlined above, is the discovery that the shuttling and subcellular localization of PER2 and CRY1 are mutually dependent on their expression ratio. Specifically, we show for the first time that the steady-state shuttling distribution PER2 alone is cytosolic due to its rapid nuclear export wherease CRY1 is predominantly nuclear (known). Given that CRY1 facilitates the nuclear import of PER2 (known) and that a PER2 dimer can bind either one or two CRY1 molecules, our data showing that cytoplasmic PER2-CRY1 foci contain less CRY1 than nuclear foci lead us to conclude that cytoplasmic PER2 complexes contain one CRY1 molecule, while nuclear complexes contain two.
This model provides a mechanistic explanation for the distribution of PER2 between the cytosol and nucleus and for the relatively lower cytosolic CRY1 levels. Moost importantly, we further show (for the first time) that CK1-mediated phosphorylation of PER2 displaces CRY1. This phosphorylation event would produce PER2 dimers with one or no CRY1 bound, promoting their export to the cytosol. We believe this represents a novel and potentially important mechanism for regulating circadian clock function.
The results from many of the imaging assays are not quantitated, and the figures often show single cells. It's hard to draw statistical significance from these.
The phenotypes we report here are result of multiple technical and biological replicates (n >3). Image analysis and statistical analysis was performed when required. We show additional examples in the EVs.
There are a number of phenomena seen whose physiological relevance is unclear. In figure 1, forced over-expression of CRY1 and PER2 leads to formation of nuclear foci. It is unlikely these foci form at non-overexpressed levels, and so the general interest and relevance is not high nor investigated. This reduces the impact of the finding.
It has been shown that PERs and CRYs do not form thermodynamically stable, large (detectable) foci under physiological conditions, as we have stated in the manuscript. Whether these proteins have the propensity to form smaller, more dynamic structures of physiological relevance is an interesting question that could be explored elsewhere, but it is not relevant to our study. In our work, these foci are simply convenient markers for analyzing the interaction and subcellular (co)localization of clock proteins under investigation. In the revised version, we have kept the analysis of these foci and the discussion of their potential relevance to a minimum in order to avoid confusion and unnecessary discussions.
The finding that CK1δ is keep in the dephosphorylated state by binding to PER has been established previously by Johnson and colleagues and should perhaps be mentioned (Qin JBR 2015 (doi: 10.1177/0748730415582127).
There is clearly a misunderstanding here. Qin et al.’s data show that, in a cell-free system, CK1ε phosphorylates PER2 and also autophosphorylates its C-terminal tail (autoradiograph, Fig. 1E).
However, because PER2 phosphorylation is carried out by CK1ε that is tightly anchored to PER2, there is competition between PER2 phosphorylation and tail autophosphorylation. As a result, the kinetics of tail phosphorylation are slower (Fig. 3B and quantification in C) than those observed with free CK1ε (as seen in the presence of the p53 substrate, Fig. 3A,C). We believe that his is also happening in the cell.
Author response image 1.
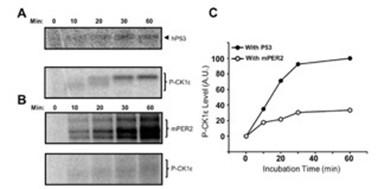
Our data, in contrast, address a different point. It has been known from the Virshup lab for decades that CK1δ/ε undergo futile cycles of (auto)phosphorylation and dephosphorylation, resulting in an active, dephosphorylated kinase in cells because cellular phosphatases are more efficient than CK1 autophosphorylation. We now show that CK1δ is also efficiently dephosphorylated when bound to PER2 (Fig. 3). Nevertheless, despite dephosphorylation of PER2-bound CK1δ, PER2 itself becomes hyperphosphorylated, indicating that cellular phosphatases act differently on these two substrates. To clarify this point, we inhibited phosphatases with calyculin A (CalA). Under these conditions, both PER2 and PER2-bound CK1δ became efficiently hyperphosphorylated (new Fig. 3).
The degradation of kinase-active but not inactive CK1 is only shown here with 50-fold overexpressed protein so it's interesting, but the relevance to circadian biology is not made clear. The fact that over-expressed CK1 is degraded primarily in the nucleus is interesting, but needs further characterization - is this affected by the epitope tag? Is it true of endogenous CK1 or only over-expressed CK1? Is this not seen with e.g. other forms of CK1, e.g. lacking the C-terminus?
The observation that unassembled kinase is rapidly degraded is most clearly demonstrated by overexpression experiments. However, Fig. 3 shows that overexpression of CRY1 and PER2 leads to the accumulation of elevated levels of endogenous CK1δ (untagged), indicating that endogenous kinase is likewise degraded in the absence of a stabilizing binding partner. In addition, we present data showing that overexpression of tagged CK1δ reduces the levels of endogenous, untagged CK1δ, further supporting the conclusion that unassembled endogenous CK1δ is unstable and subject to degradation.
Further characterization of the CK1 degradation pathway is of considerable interest and could form the basis of a separate study, particularly to identify the components that mediate activity-dependent nuclear export and activity-dependent nuclear degradation. The Δ-tail kinase is expressed at very low levels, although interpretation is complicated by the possibility that this reflects pleiotropic effects.
The final figure, showing that nuclear CK1 is the form responsible for shortening rhythms, is interesting. Is this because massive increases in nuclear CK1 alter PER, or BMAL/CLOCK, or proteasome activity?
Our data show that cells expressing either nuclear or cytosolic CK1 are viable, proliferate normally, and maintain a functional circadian clock. Therefore, overexpression of the kinase does not produce pleiotropic effects.
To assume it's due to PER phosphorylation is in disagreement with the studies of Meng et al. Neuron 2008 DOI 10.1016/j.neuron.2008.01.019.
The data are not in disagreement with Meng et al.; in fact, they align quite well. Meng et al. showed that CK1ε-tau shortens the circadian period, which we had also previously reported for CK1δ-tau-like (Marzoll et al., 2022). We now demonstrate that CK1δtau-like is enriched in the nucleus, contributing to its period-shortening phenotype. Furthermore, we show that active CK1δ (but not CK1δ-K38R) promotes cytoplasmic accumulation of PER:CRY complexes, consistent with PER2 degradation in the cytosol as described by Meng et al.
Taken together, these findings suggest that PER proteins acquire their CK1 in the nucleus, and this interaction determines the circadian period length. Following a time delay—set by the kinetics of PER2 phosphorylation—PER2:CRY complexes are exported to the cytosol along with their bound CK1, where they are subsequently degraded.
Reviewer #2:
Interactions between the circadian clock proteins PER1/2 with CK1d/e and CRY1/2 influence each of their stability, subcellular localization, and activity, as countless studies over the last two decades have shown. However, many questions still remain, especially in light of newer models of the transcription-translation feedback loop (TTFL) in which the repression phase relies on two distinct mechanisms, a phosphorylation-dependent displacement of the transcription factor by CK1-PER-CRY complexes from DNA early in repression, and a CRY1dependent sequestration of the transcription factor activation domain later in repression. In particular, questions remain about mechanisms triggering nuclear entry/export and activity of these proteins in the cytoplasm and nucleus.
Here, the authors utilize a system of induced and/or transient overexpression of proteins with or without with fluorophores to track subcellular localization, stability, and interactions. As the authors point out throughout the manuscript, the overexpression of these clock proteins often causes them to behave differently from the endogenous proteins. It looks as though the authors have done their best to account for these changes, and they have certainly been rigorous in pointing them out, but there is concern that some of the conclusions may be influenced by this overexpression. For example, the relevance of work related to the overexpression-dependent foci is unclear.
Same answer as to Reviewer 1: It has been shown that PERs and CRYs do not form thermodynamically stable, large (detectable) foci under physiological conditions, as we have stated in the manuscript. Whether these proteins have the propensity to form smaller, more dynamic structures of physiological relevance is an interesting question that could be explored elsewhere, but it is not relevant to our study. In our work, these foci are simply convenient markers for analyzing the interaction and subcellular (co)localization of the clock proteins under investigation. In the revised version, we have kept the analysis of these foci and the discussion of their potential relevance to a minimum in order to avoid confusion.
The findings that the stability of the kinase depend on localization, its intrinsic activity, and interaction with PER2 are interesting and important. Use of the CKBD deletion to show that CK1 stabilization depends on its anchoring interaction with PER2 is a nice touch. The authors bring up an excellent point that most of the potential phosphorylation sites on PER1 and PER2 have not been functionally characterized aside from the phosphoswitch mechanism. Their observation that CK1 eventually induces cytoplasmic localization of the CK1-PER-CRY1 complex and the release of CRY1 is intriguing. In particular, the finding that pretreatment of PER2 with CK1 in vitro blocked its ability to interact with CRY1 is very interesting. However, the absence of mechanistic data to explore this in more detail limits the impact of this conclusion. Using the system they have established here to identify the site(s) on PER2 and/or CRY1 that lead to this would help to solidify this work and increase the impact of this work. Overall, there are some interesting findings here but the inclusion of some competing viewpoints and mechanistic data would strengthen the impact of the work.
Major
(1) The characterization of the tau-like CK1 mutant R178C as less active than the wild type enzyme is not entirely correct-it is less active on the FASP region as described, but it has increased activity on S478 in the phosphodegron that is independent of inhibition from the FASP region (Gallego et al. PNAS, 2007 and Philpott et al. eLife, 2020). It is still possible that some of the period shortening effects of the mutant could arise from enhanced nuclear accumulation, but the oversimplified description of the mutant as less active should be corrected.
In the revised version, we discuss that the enhanced nuclear localization of the Tau-like kinase may contribute, at least in part, to period shortening, similar to how forced nuclear overexpression of wild-type kinase also shortens the period. We emphasize, however, that CK1 Tau is compromised in its priming-dependent activity, whereas its priming-independent activity is context-specific and enhanced toward the β-TrCP site.
(2) One of main conclusions from the paper, that CK1 induces cytoplasmic localization of the CK1-PER2-CRY1 complex and subsequent release of CRY1 would be strengthened significantly by identifying the phosphorylation site(s) responsible for the cytoplasmic localization of the complex and the release of CRY1. The system they have developed here seems ideal to identify these sites.
We fully agree with the reviewer. We substituted the known phosphorylation sites in PER2 surrounding the CRY-binding domain, but this had no effect on the phosphorylationdependent release of CRY1. Therefore, a more systematic analysis will be required, including the possibility that phosphorylations in CRY1 itself may contribute. To this end, we are generating PER2 and CRY1 variants in which all Ser/Thr residues are replaced by Ala. Using these constructs alongside the wild-type versions, we will by PCR systematically create hybrids in which specific regions containing phosphorylation sites are exchanged.
Nevertheless, this will require considerable time and effort, and we believe this investigation exceeds the scope of the present manuscript and will address it in future work.
(3) The concept of delayed release of CRY1 presented here is an interesting one. It's unclear why the authors have also not incorporated prior findings (Ukai-Tadenuma et al. Cell, 2012, Koike et al. Science, 2012) that peak levels of CRY1 are expressed in a later phase than CRY2, PER1, and PER2. It seems like figure EV6 should reflect the observation that CRY2 is the predominant cryptochrome present during early repression (Koike et al. Science, 2012).
The reviewer is absolutely right: the expression phases of CRY1, CRY2, PER1, and PER2 are important. I have recently discussed these issues in detail in a News & Views article in The EMBO Journal, commenting on a paper by Smyllie et al. In this News & Views article, I discuss that the presently available data suggest that CRY1 is always present throughout the circadian cycle and keeps circadian transcription partially repressed even at peak phases of expression. In the revised version, I refer to these publications, including those mentioned by the reviewer. However, I would like to keep the model presented in the supplementary figure as simple as possible and specifically focused on the work presented in this manuscript, rather than presenting a comprehensive conceptual model of the circadian clock.
(4) The model presented in figure EV6 and described throughout the text shows that PER-CRY complexes interact with CK1 in the nucleus, and not in the cytoplasm prior to nuclear entry. Prior work on endogenous protein complexes has shown that CK1-PER-CRY complexes exist in the cytoplasm very early on in the repression phase (Aryal et al. Mol Cell, 2017-ref. 14 in the manuscript). Work by Sancar and colleagues (Cao et al. PNAS, 2020) also shows with endogenous proteins that CK1d has a circadian pattern of nuclear entry (or possibly retention) concomitant with PER2 that is dependent on the presence of PERs and CRYs. Together, these data seem to be inconsistent with your model.
We think the data are not inconsistent. The recent Smyllie et al. paper in EMBO Journal shows that PER2 is present in both the cytosol and the nucleus at all times when it is expressed, but cytosolic PER2 is not saturated with CRY, which is more nuclear. Our data demonstrate that PER2 shuttles between the cytosol and the nucleus depending on its occupancy with CRYs (see schematic Fig. 1). Occupancy, in turn, depends on expression levels and binding affinities, including those of CRY2 and PER1. Consequently, PER2 complexes could shuttle continuously throughout the circadian cycle—either because they are not saturated with CRYs due to the balance between expression levels, freely available CRY, and binding affinity, or later in the cycle because CRYs are displaced by phosphorylation. If PER2 acquires casein kinase in the nucleus early in the cycle, it will shuttle out to the cytosol together with the bound CK1. We believe this does occur, but early in the circadian cycle the saturation of PER2 with casein kinase is likely to be very low due to the limited availability of CK1 in the nucleus. I am aware that not everyone will share this interpretation point by point, but discussing it in greater length and detail exceeds the scope of the present manuscript.
Reviewer #3:
This manuscript by Serrano and co-workers is a tight body of work that provides much needed insights into the regulation of clock proteins by CK1D, and into the regulation of CK1D itself. While the whole paper relies on artificial overexpression of chimeric/tagged proteins that may have significant differences in the function, the stability and subcellular distribution of the endogenous proteins they are suppose to model, this limitation was been clearly stated by the authors, and nevertheless their study still provides important insights.
While the authors have specified which Ck1d isoform (Ck1d1) they are overexpressing in their model cell lines, they may have thought to consider that the overexpression of one Ck1 homologue may affect the endogenous expression of the other homologues and their isoforms, e.g. ck1d1 overexpression may cause an increase in Ck1d2 or Ck1e, which would in turn affect the conclusions.
We show in revised Fig. 3 that overexpression of CK1δ1 reduces the expression of endogenous CK1δ1/2. This is consistent with our prediction that overexpressed and endogenous CK1 (including CK1ε) compete for the same stabilizing binding partners, leading to rapid degradation of unassembled kinases.
Moreover, the antibody they used for endogenous Ck1d (which is ab85320, also mentioned as AF12G4 but that is the clone number, not the catalogue number) is discontinued and its specificity against Ck1d1, Ck1d2 or even the highly identical Ck1e, has not been clearly demonstrated. We know from Fig 3 that it can detect Ck1d1 but it would be great if the authors would provide additional evidence for the specificity of this antibody, for example by overexpressing Ck1d1/Ck1d2/Ck1e to see really which "endogenous" Ck1 we are seeing.
Are the three bands for example seen in Fig 4A corresponding to the different isoforms? This simple experiment would reinforce the conclusions.
We show in the revised figure that the antibody recognizes CK1δ1 and CK1δ2, but not CK1ε. In U2OS cells, the antibody detects a single band (Figure); we do not know whether this represents predominantly one splice isoform or both, which are not resolved. However, this distinction is not relevant for our interpretation, because overexpression of tagged CK1δ1 reduces the expression of whichever endogenous kinase is present.
There are no minor comments, as the figures, the figure legends and main text are all of good quality and ready for publication.
Reviewers’ Responses to Point-by-Point Response to Peer Review
Referee #1:
I appreciated the additional efforts by the authors to improve the manuscript. Unfortunately, the underlying approach of forced over-expression remains artifact-prone, and has been largely supplanted by readily available knockin and targeted mutagenesis methods. Over-expression may give clues, but I think more rigorous mechanistic validation is needed to make this compelling. I cannot support publication of this manuscript.
Referee #2:
In their response to reviewers, the authors make the valid point that the steady state of a system is usually perturbed to study it. In this study, they have used overexpression of the clock proteins PER2, CRY1 and CK1 to study their effects on subcellular dynamics and stability. In justifying this choice, they refer to several papers that similarly overexpressed at least one of these components, stating that their time-resolved approach brings novel insights. However, there is a missed opportunity here to translate any lessons learned from overexpression studies to a system where the proteins are expressed at physiological levels and stoichiometry.
The authors reply to reviewer 1 stating that they conclude PER proteins acquire CK1 in the nucleus, but this does not account for other studies showing an apparent PER-CK1 complex in the cytoplasm during the early phases of repression and/or a pattern of PER-dependent nuclear entry of CK1 (Lee et al. 2001, Cell; Aryal et al. 2017 Mol Cell; Cao et al. 2021 PNAS). Given that all 3 of these studies were done with native expression levels, it seems incumbent upon the authors to demonstrate that their conclusions from the overexpression study are physiologically relevant by translating them in some way to a more native system. This also addresses a point made by reviewer 2, major concern 4 that was not satisfactorily addressed by the authors. Perhaps they could validate their hypothesis of PER shuttling and interactions with CK1 or CRY1 that alter this in a native system similar to Aryal or Cao et al. with the use of nuclear export inhibitors?
The response to reviewer 2, major concern 1 is thoughtful and much appreciated. However, simplifying the effects of the tau mutation on CK1 as having a decreased rate on priming-dependent phosphorylation but not priming-independent is not quite true-the tau mutation also decreases the rate of priming-independent phosphorylation of S662 (in humans) (Philpott et al. 2020, eLife).
Other papers appearing in this journal seem to all include at least one major new mechanistic insight. Although the authors do a diligent job in characterizing the overexpressed proteins in this system, some of their conclusions are at odds with prior studies of the system in more native conditions, so the potential impact of this work is unclear. To verify these conclusions or test new ones (ie, that CK1 disrupts PER-CRY1 interactions), they should use their insights to generate mutations or make perturbations in a native system and demonstrate that they still hold.
Referee #3:
The authors have adequately addressed the reviewers' comments, and it is my opinion that the manuscript is ready for publication. It is true, as previously mentioned by other reviewers, that the evidence presented rely on overexpression, which for the other reviewers seem to preclude publication. However, I find this to be a too strict opinion.
If the authors had indeed provided evidence using crispr-cas9-mediated genetic manipulation and tagging/mutating endogenous genes for all their experiments, thereby providing more physiological evidence of how clock proteins interact, they would probably have submitted their manuscript to an alternative journal with a higher impact.
As it stands, it is my opinion that, considering the evidence and limitations of the study, this manuscript is a good match for the journal.
Author Rebuttal:
Apologies for the delayed reply regarding our manuscript. In the meantime, we have added several new experiments which address the comments of the reviewers and more. These are now included as Figures 1C, EV3, 4D, 6E, 6F, EV6D, and EV7.
Figure 1C reinforces our observations from Figure 1B showing that induction of stably-integrated PER2 also results in accumulation of endogenous CRY1 at a timescale that is compatible with the gradual localization of overexpressed PER2 into the nucleus.
Figure EV3 addresses several technical comments from Reviewers #3 and #1, respectively: Figure EV3A shows that our CK1δ antibody recognizes CK1δ1 and CK1δ2, but not CK1ε. Figures EV 3B and C clearly show how overexpression of our transgenic CK1δ results in decreased endogenous CK1δ which further demonstrates the rapid turnover of active kinase.
Figure 4D addresses the comment from Reviewer #2. We clearly show that CK1δ is not kept in a dephosphorylated state by binding to PER. In addition to our direct comment to this point, Figure 4D shows that CK1δ regardless if it is expressed alone or in complex with PER2 is phosphorylated to a similar extent when the cells are treated with the phosphatase inhibitor CalA. As indicated in our direct response, we are rather more interested in the observation that cellular phosphatases act differently on PER2 compared to CK1δ despite being in the same PER:CK1δ complex (as shown by the clear stabilization of overexpressed CK1δ by co-expression of PER2).
Figures 6E, 6F, and EV6D demonstrate that our observations from overexpression systems are also observed in a more physiological context, addressing comments from Reviewers #1 and #2. Figure 6E shows that dephosphorylation of PER2 leads to its relocalization from the cytosol to the nucleus, while Figure 6F analyzes the subcellular localization of PER2 in the context of a functional circadian clock in U2OS cells. The latter demonstrates that PER2 is predominantly nuclear early in the circadian cycle, but redistributes to the cytosol at later time points. We included these experiments in response to the reviewer’s request for a more physiological context. Since we are not a mouse lab, this cell-based system represents the most physiological model we can provide. Figure 6F show the dynamics of endogenous PER2 from DEX-synchronized cells. At early timepoints, PER2 is predominantly nuclear likely due to the incorporation of CRY1 forming the PER:CRY complex. At later timepoints PER2 is redistributed between the cytoplasm and nucleus due to PER2 phosphorylation. Importantly, these results are consistent with and recontextualize the results from Liu et al. (Xie et al., PNAS, 2023) showing the hypophosphorylated PER2 at early timepoints post-DEX is predominantly nuclear and hyperphosphoryated PER2, that appear later post-DEX is predominantly cytoplasmic.
Finally, Figure EV7 provides a model how the subcellular distribution of CK1δ affects its assembly into the PER:CRY complex emphasizing how nuclear kinase enacts its role in the circadian clock.
Response to Reviewers:
We were disappointed by the categorical rejection of overexpression experiments. Without a specific discussion of why they would be inappropriate or not sufficient in the context of the work presented here, the blanket assertion that overexpression inevitably produces artifacts functions more as a rhetorical device than as a substantiated scientific argument. The fact that the term ‘physiological’ generally carries a positive connotation, whereas ‘overexpression’ is often perceived negatively, does not in itself justify the categorical rejection of experiments.
While we appreciate that some reviewers may personally prefer alternative strategies, we believe that the suitability of any approach must be evaluated in light of the specific biological questions being addressed. I cannot see a single specific point in the reviewers’ responses indicating that any of our experiments yielded artificial results. It is true that targeted knock-in and mutagenesis methods are available, however, these approaches are simply not suited to the questions raised in this manuscript. We also fully agree that, whenever possible, insights from overexpression studies should be validated in systems with a functional clock where proteins are expressed at physiological levels, which we did using U2OS cells, and noting the compatibility of our results with those in the literature using endogenously-tagged constructs. We have cited several recent studies that have investigated the subcellular distribution and circadian dynamics of endogenous or endogenously-tagged clock proteins in mice (Cao et al, 2021; Smyllie et al, 2022, 2016, 2025) and U2OS cells (Öllinger et al, 2014; Gabriel et al, 2021; Xie et al, 2023). While we cannot substantially expand on these previous observations, we confirm them in the revised version by demonstrating the nuclear-to-cytoplasmic relocalization of PER2 in U2OS cells over the course of a circadian cycle. In addition, we show that this process is, in principle, reversible: when CK1 is inhibited with PF670, overexpressed hyperphosphorylated cytosolic PER2 becomes dephosphorylated and accumulates in the nucleus.
Overall, we consider our approach not only complementary but also essential, as it enables us to address two key questions that would otherwise be difficult or even impossible to resolve:
(1) Mutual impact of PER2 and CRY1 on subcellular dynamics and the role of PER2 phosphorylation
Evidence from mouse liver (Cao et al, 2021), mouse SCN (Smyllie et al, 2022, 2025), and U2OS cells (Xie et al, 2023) indicates that a substantial fraction of PER2 remains cytoplasmic throughout its expression cycle, even in the presence of CRY1, which promotes PER’s nuclear import. The mechanisms underlying this cytoplasmic retention remain unclear, and no circadian function has yet been attributed to the cytosolic PER2 pool. Our study addresses how PER2 abundance, phosphorylation state, and stoichiometry relative to CRY1 govern their interaction and subcellular dynamics. This is physiologically relevant because PER1/2 and CRY1/2 proteins oscillate in expression and degradation out of phase, such that their concentrations, stoichiometry, and phosphorylation state vary systematically over the circadian cycle. Transient transfection and inducible overexpression combined with time-lapse microscopy are essential here, as they uniquely allow modulation of protein ratios and CK1δ levels and to resolve their dynamics.
Previous work established that CRY1 is nuclear and promotes PER2 nuclear accumulation (Smyllie et al, 2022). Our data extend this by showing that subcellular distribution is determined by the CRY1:PER2 ratio. While CRY1 alone is nuclear we show that PER2 alone is cytoplasmic due to rapid nuclear export. Mixed conditions reveal ratio-dependent shifts: at low CRY1-to-PER2 ratios, CRY1 relocalizes to the cytoplasm, whereas at high ratios, PER2 is retained in the nucleus. We explain this behavior by PER2 dimerization: dimers bound to two CRY1 molecules remain nuclear, while dimers bound to a single CRY1 localize to the cytosol. Such species can be expected to form in a physiological context depending on binding affinities and rhythmic expression levels and ratios across circadian time. Importantly, we show that CK1δ-mediated phosphorylation destabilizes PER2 and CRY1 interactions. From this, we infer that PER2 dimers with only a single bound CRY1 transiently form and accumulate in the cytosol, consistent with the lower CRY1-to-PER2 ratio we observe in the cytosol and that has also been reported in the SCN (Smyllie et al, 2025). With continued phosphorylation, PER2 dimers lose CRY1 altogether, while the released CRY1 accumulates in the nucleus. We suggest that this mechanism supports and extends the late repressive phase of the circadian cycle. Recent data show that hypophosphorylated PER2 is predominantly nuclear, whereas hyperphosphorylated PER2 is largely cytoplasmic in mouse liver (Cao et al, 2021; Xie et al, 2023), linking our data to a physiological context.
Taken together, these findings suggest a mechanism whereby stoichiometry, subunit composition, and CK1δ phosphorylation determine PER:CRY complex composition and localization. Crucially, these complexes and their dynamic relocalization could only be observed using inducible overexpression; knock-in strategies at endogenous levels would not be able to capture such states.
(2) Posttranslational regulation and subcellular homeostasis of CK1δ and impact on the clock
Previous work has shown that nuclear export of CK1δ depends on its kinase activity (Milne et al, 2001). Here, we further demonstrate that unassembled CK1δ is subject to degradation, with nuclear turnover accelerated by its catalytic activity. Thus, when evaluating the impact of CK1δ mutants on the circadian clock, one must consider not only kinase activity but also protein stability and subcellular distribution. We find that CK1δ availability for PER2 differs between cytosol and nucleus. In particular, nuclear CK1δ is limiting, and its abundance directly determines circadian period length. This is significant because subcellular CK1δ availability and posttranslational regulation have not previously been examined or incorporated into circadian clock models, as the kinase has been assumed to be non-limiting given its constant expression throughout the circadian cycle. Complex formation between CK1δ and PER is a well-established determinant of circadian timing, with CK1δ overexpression known to shorten period length. Our data explain why: the binding equilibrium between CK1δ and PER must be finely tuned. Previous studies suggested that PER associates with CK1δ in the cytosol and enters the nucleus as a PER:CRY:CK1δ complex (Lee et al, 2001; Aryal et al, 2017). Our data suggest that nuclear PER is not saturated with CK1δ. This is because levels of free, active CK1δ in the nucleus are low, owing to its rapid export or degradation by the nuclear proteasome, which limits its availability for PER binding.
Our overexpression studies support this mechanism. NES-tagged CK1δ overexpression does not alter circadian period length, because it fails to increase nuclear CK1δ levels: Each PER molecule can coimport only one kinase, a process already occurring in wild-type cells, and the few co-imported molecules rapidly equilibrate with the nuclear pool, where they are subject to export or degradation. In contrast, NLS-tagged CK1δ overexpression directly increases nuclear kinase abundance by antagonizing export, thereby enhancing PER binding and shortening circadian period. This multilayered regulation of CK1δ stability and localization and its consequences for PER2 availability would not have been revealed without targeted overexpression. Our findings therefore fill a key knowledge gap and remain fully consistent with previous studies (Lee et al, 2001; Aryal et al, 2017; Cao et al, 2021).
Conclusion: In sum, our findings are novel and physiologically relevant, aligning with data from mouse liver and SCN. While studies at strictly endogenous protein levels are important and necessary, perturbation of steady state is a standard strategy to uncover and observe novel mechanisms. Endogenous-level experiments would demand technically unrealistic systems (for example, even the simplest case, analyzing the subcellular dynamics of PER2 alone, would require cells lacking PER1, CRY1/2, and CK1δ/ε). Moreover, adjustment of PER2-to-CRY1 ratios cannot be achieved with stably integrated genes and of course not at physiological expression levels. Thus, inducible overexpression is not merely practical but currently the most feasible approach to dissect these dynamics. We complement our findings with data from U2OS cells with a functional clock, showing that the availability of nuclear CK1δ directly determines circadian period length. Although specific aspects of our extended model require further experimental validation, no published evidence contradicts it to date. Mechanistic discussions of the circadian clock have so far focused primarily on PER protein degradation. Our model broadens this perspective by incorporating CK1δ homeostasis, PER:CRY complex composition, subcellular localization, and their regulation by phosphorylation. In doing so, it provides a detailed framework to be critically tested and refined in future studies.
delivering meaningful compute in the next three months and nearly 1GW in total before the end of the year
未来三个月内将提供有意义的计算能力,到今年年底前总计近1GW,这一时间表和规模显示了Anthropic应对当前需求压力的具体计划。1GW的规模虽然远低于5GW的总承诺,但代表了短期内显著的容量增加。这一数据点反映了AI基础设施需求与供应之间的紧张关系,以及公司对快速扩展能力的重视。
run-rate revenue has now surpassed $30 billion, up from approximately $9 billion at the end of 2025
年收入从2025年底的约90亿美元增长到超过300亿美元,增长率超过233%,这是一个惊人的增长速度。这一数据表明AI服务市场的爆发式增长,以及Anthropic在商业化方面的显著进展。然而,如此高的增长率是否可持续存疑,且300亿美元的年收入对于一家成立不久的AI公司来说相当惊人,需要更多财务细节来验证。
Amazon is investing $5 billion in Anthropic today, with up to an additional $20 billion in the future
亚马逊对Anthropic的50亿美元投资(加上潜在的额外200亿)是AI领域最大的战略投资之一。这一数据点不仅反映了亚马逊对Anthropic技术的信心,也表明了云服务提供商与AI公司之间日益紧密的合作关系。与之前亚马逊已投资的80亿美元相比,这一新增投资显示了亚马逊对Anthropic未来发展的长期看好。
committing more than $100 billion over the next ten years to AWS technologies
未来十年投入超过1000亿美元用于AWS技术,这是一个惊人的数字,远超大多数科技公司的年度资本支出。这一长期承诺显示了Anthropic对AWS基础设施的深度依赖,以及他们对未来AI发展所需计算资源的巨大预期。这一投入规模也暗示了AI基础设施成本将持续上升。
This card was updated on April 24, 2026, to include additional information about safeguards for the deployment of GPT‑5.5 and GPT‑5.5 Pro in the API.
大多数人认为系统卡应该在发布时包含所有相关信息,不需要后续更新,但OpenAI在发布后仅一天就更新了系统卡以增加API部署的安全措施信息。这挑战了科技产品文档管理的常规做法,暗示AI安全措施是动态发展的,需要持续调整,这违背了传统软件发布中'文档一次性完成'的共识。
We separately evaluate GPT‑5.5 Pro in certain cases because we judge that the setting could materially impact the relevant risks or appropriate safeguards posture.
大多数人认为如果两个模型使用相同的基础架构,它们的风险和安全需求应该相似,但OpenAI明确表示GPT-5.5 Pro需要单独评估,因为'设置可能显著影响相关风险或适当的安全措施立场'。这挑战了AI评估领域普遍认为的'相同基础模型的安全特性一致'的共识,暗示即使是微小的设置变化也可能导致显著不同的风险特征。
GPT‑5.5 understands the task earlier, asks for less guidance, uses tools more effectively, checks it work and keeps going until it's done.
大多数人认为AI模型需要持续的人工指导和监督才能完成复杂任务,但作者声称GPT-5.5能够'理解任务更早,要求更少的指导,更有效地使用工具,检查工作并持续进行直到完成'。这挑战了AI领域普遍认为的'当前AI系统仍需大量人类监督'的共识,暗示GPT-5.5已经实现了更高程度的自主性。
We subjected the model to our full suite of predeployment safety evaluations and our Preparedness Framework, including targeted red-teaming for advanced cybersecurity and biology capabilities
大多数人认为AI安全评估主要集中在防止直接有害输出,但OpenAI特别强调了对'高级网络生物学能力'的针对性红队测试。这暗示GPT-5.5可能具有比预期更强大的生物相关能力,这违背了AI领域普遍认为的'语言模型主要处理文本信息'的共识,表明AI已经深入到专业科学领域。
Our professionals are using Codex to move from static requirements to working solutions in hours, not weeks. It's enabling rapid prototyping, real-time workflow redesign, and faster iteration across the development lifecycle.
Accenture首席AI官声称将开发时间从'周'缩短到'小时',这是一个显著的效率提升声明,但缺乏具体数据支持。此处缺乏量化依据,无法验证这一断言的真实性或普遍适用性。
Companies are using Codex across the software development lifecycle. Virgin Atlantic is using it to increase test coverage and increase team velocity - reducing technical debt and improving performance.
虽然文章提到了Virgin Atlantic使用Codex的具体应用场景,但没有提供任何量化数据来衡量其效果。此处缺乏量化依据,无法评估Codex实际带来的性能提升或技术债务减少程度。
Once selected, successful applicants will be onboarded to the bio bug bounty platform
大多数人认为AI安全测试应是开放和民主化的,但OpenAI采用邀请制并限制在'受信任的红色团队测试者'范围内,这与众包安全测试的主流趋势相悖,表明他们认为生物安全领域需要更严格的准入控制。
$25,000 to the first true universal jailbreak to clear all five questions
大多数人认为AI安全漏洞不应被奖励,而应被消除,但OpenAI设立高额奖金鼓励研究人员寻找'通用越狱方法',这挑战了传统安全观念,表明他们认为有价值的安全测试需要经济激励。
🔹 **1M Standard:** 1M context is now the default across all official DeepSeek services.
DeepSeek V4将上下文长度提升到100万token,成为行业新标准。这一数据点意义重大,相比行业常见的32K-128K上下文窗口,提升了约8-31倍,能处理更长文档和复杂任务。这需要创新的注意力机制和内存管理技术支撑,文中提到的'Novel Attention: Token-wise compression + DSA'可能是实现这一突破的关键。
🔹 **DeepSeek-V4-Pro:** 1.6T total / 49B active params. Performance rivaling the world's top closed-source models.
这里提供了DeepSeek-V4-Pro的具体参数数据:总参数1.6万亿,活跃参数490亿。这种参数规模远超大多数开源模型,接近顶级闭源模型。参数效率比(活跃参数/总参数)约为3%,表明采用了稀疏激活技术,这可能是其性能与效率平衡的关键。
Ubuntu 26.04 LTS provides the strongest foundation for our confidential computing stack. It allows us to deploy a single securely designed image for all our verifiably private AI workloads across Intel, AMD, and NVIDIA hardware, with no platform-specific changes required.
引用自Tinfoil联合创始人,强调了Ubuntu 26.04 LTS在机密计算方面的优势,支持Intel、AMD和NVIDIA硬件上的单一安全镜像。这表明Ubuntu在跨平台机密计算方面的领先地位,为AI工作loads提供了统一的安全基础,减少了平台特定配置的需求。
Ubuntu now fully supports RVA23, the baseline standard for RISC-V. This ensures that teams innovating on RISC-V can take full advantage of the platform, including in mixed-architecture environments.
文章指出Ubuntu现在完全支持RISC-V的RVA23标准,这反映了Ubuntu对新兴架构的前瞻性支持。RISC-V作为一种开放指令集架构,正逐渐获得关注。Ubuntu的支持将促进RISC-V生态系统的成熟,特别是在混合架构环境中的应用。
TPM-backed full-disk encryption is now generally available in the Ubuntu installer.
文章提到TPM支持的全盘加密功能现在已在Ubuntu安装程序中普遍可用。这一安全功能将加密绑定到特定设备的TPM芯片上,大大提高了物理访问攻击的门槛。相比其他Linux发行版,Ubuntu将此功能集成到安装程序中,简化了企业部署安全系统的过程。
Ubuntu 26.04 LTS is the first LTS to expand the number of memory safe system components. In practice, this means new kernel drivers and subsystems written in Rust, as well as `sudo-rs` and `uutils``coreutils` bringing memory-safe reimplementations of foundational system tools such as `sudo`, `ls`, `cp`, and `mv`.
文章强调Ubuntu 26.04 LTS是首个增加内存安全系统组件的LTS版本,包括Rust编写的内核驱动和子系统,以及sudo-rs和uutils coreutils等内存安全的基础系统工具重实现。这一举措显著提高了系统的安全性,减少内存相关漏洞的风险,展示了Ubuntu在内存安全方面的领先地位。
Canonical Livepatch now extends its rebootless kernel patching capability to Arm64 for the first time.
这标志着Canonical Livepatch技术的重要里程碑,首次扩展到Arm64架构。对于运行Ubuntu的Arm64服务器和边缘设备,这意味着无需重启即可应用关键内核补丁,大大提高了系统可用性。这一功能的扩展反映了Ubuntu对ARM生态系统的持续投入。
IgH Master driver brings microsecond-level timing precision natively into the OS, removing a significant integration burden for engineers building motion control systems, robotics platforms, or complex factory automation.
文章提到EtherCAT驱动提供微秒级(10^-6秒)的时间精度,这对工业自动化应用至关重要。这种高精度时间同步能力是Ubuntu在工业领域的一个关键优势,相比其他通用操作系统,Ubuntu在实时性方面的改进使其更适合工业物联网和自动化场景。
Ubuntu 26.04 LTS is built on Linux 7.0, continuing Canonical's commitment to shipping the latest upstream kernels at the time of release.
文章明确指出Ubuntu 26.04 LTS基于Linux 7.0内核,这表明Canonical坚持使用最新上游内核的策略。相比其他可能使用更保守内核版本的Linux发行版,Ubuntu的这一策略确保了用户能够获得最新的硬件支持和性能改进。
Ubuntu powers millions of PCs and laptops around the world.
这是一个模糊的数量描述,'millions'没有提供具体数字,无法确定Ubuntu的确切用户规模。相比其他Linux发行版如Red Hat或SUSE,Ubuntu确实拥有更广泛的桌面用户基础,但缺乏精确的市场份额数据支持这一说法。
The 11th long-term supported release of Ubuntu delivers deep silicon optimization and state-of-the-art security for enterprise workloads.
这表明Ubuntu 26.04是第11个LTS版本,按照Ubuntu每两年发布一个LTS版本的规律,这与Ubuntu的历史发展时间线一致。作为第11个LTS版本,它代表了Canonical在长期支持方面的成熟经验,为企业和用户提供稳定可靠的选择。
eLife Assessment
This manuscript presents a valuable study of the activity and functional relevance of different circuits in the dentate gyrus of mice performing a pattern separation task. Convincing evidence is presented to support the paper's central conclusions. The study is likely to be of interest to those studying the subregional organization and cell type-specific functions of the dentate gyrus.
Reviewer #2 (Public review):
In this study, the authors investigate how increasing cognitive demand shapes activity patterns in the dorsal dentate gyrus (DG). Using a touchscreen-based TUNL task combined with TRAP/c-Fos tagging, birth-dating of adult-born granule cells (abDGCs), and chemogenetic inhibition, they show that higher task demand increases mature granule cell (mGC) recruitment and enhances suprapyramidal (SB) versus infrapyramidal (IB) blade bias. Functionally, mGC inhibition reduces overall activity and impairs performance without disrupting blade bias, whereas inhibition of {less than or equal to}7-week-old abDGCs increases mGC activity, abolishes blade bias, and impairs discrimination under high-demand conditions. These findings suggest that effective pattern separation depends not only on overall DG activity levels but also on the spatial organization of recruited ensembles.
The integration of touchscreen TUNL with temporally controlled activity tagging and birth-dated cohorts is technically strong. Quantification of SB-IB bias and radial/apical distributions adds anatomical precision beyond bulk activity measures. The comparison between mGC and abDGC inhibition is conceptually compelling and supports dissociable functional roles. Overall, the data convincingly demonstrate that increasing cognitive demand amplifies blade-biased DG recruitment and that mGCs and abDGCs differentially contribute to both behavioral performance and network organization.
However, how abDGCs are integrated into the mGC network under high cognitive demand remains unresolved. Additional experiments are needed to clarify how abDGCs shape spatial recruitment patterns and whether they directly inhibit or indirectly regulate mGC activity to maintain high performance.
Furthermore, the authors frame "high cognitive demand" as a multidimensional construct encompassing broad behavioral challenge. It would strengthen the work to delineate how local abDGC-mGC circuit interactions regulate specific task components in real time. This will require higher temporal resolution approaches, as TRAP and c-Fos labeling integrate activity over prolonged windows and primarily reflect sustained engagement rather than moment-to-moment computations.<br /> The central conclusion that dentate function depends on coordinated spatial recruitment rather than total activity magnitude is supported by the data, although mechanistic interpretations are tempered given methodological limitations.<br /> Overall, this work advances models of adult neurogenesis by emphasizing a critical-period modulatory role of abDGCs in organizing DG network activity during high-demand discrimination. The combined behavioral and circuit-level framework is likely to be influential in the field.
Comments on revisions:
None remaining.
Author response:
The following is the authors’ response to the previous reviews
Public Reviews:
Reviewer #1 (Public review):
This manuscript investigates how dentate gyrus (DG) granule cell subregions, specifically suprapyramidal (SB) and infrapyramidal (IB) blades, are differentially recruited during a high cognitive demand pattern separation task. The authors combine TRAP2 activity labeling, touchscreen-based TUNL behavior, and chemogenetic inhibition of adult-born dentate granule cells (abDGCs) or mature granule cells (mGCs) to dissect circuit contributions.
This manuscript presents an interesting and well-designed investigation into DG activity patterns under varying cognitive demands and the role of abDGCs in shaping mGC activity. The integration of TRAP2-based activity labeling, chemogenetic manipulation, and behavioral assays provides valuable insight into DG subregional organization and functional recruitment. However, several methodological and quantitative issues limit the interpretability of the findings. Addressing the concerns below will greatly strengthen the rigor and clarity of the study.
Major points:
(1) Quantification methods for TRAP+ cells are not applied consistently across panels in Figure 1, making interpretation difficult. Specifically, Figure 1F reports TRAP+ mGCs as density, whereas Figure 1G reports TRAP+ abDGCs as a percentage, hindering direct comparison. Additionally, Figure 1H presents reactivation analysis only for mGCs; a parallel analysis for abDGCs is needed for comparison across cell types.
In Figure 1G and 1H we report TRAP+ abDGCs as a percentage rather than density because we are analyzing colocalization of the two markers, which are very sparse in this population. Given the very low number of double-labeled abDGCs, calculating density would not be practical. In the revised manuscript we have clarified the rationale for using these measures. As noted in the current text, we did not observe abDGCs co-expressing TRAP and c-Fos; we have made this point more explicit to guide interpretation of these data.
(2) The anatomical distribution of TRAP+ cells is different between low- and high-cognitive demand conditions (Figure 2). Are these sections from dorsal or ventral DG? Is this specific to dorsal DG, as itis preferentially involved in cognitive function? What happens in ventral DG?
The sections shown in Figure 2 were obtained from the dorsal dentate gyrus (see Methods, “Histology and imaging”: stereotaxic coordinates −1.20 to −2.30 mm relative to bregma, Paxinos atlas). From a feasibility standpoint, it is not possible to analyze the entire longitudinal extent of the hippocampus with these low-throughput histological approaches. We therefore focused on the dorsal DG, for which there is a strong functional rationale. A large body of work indicates that the dorsal hippocampus, and specifically the dorsal DG, is preferentially involved in spatial memory and in the fine contextual discrimination that underlies pattern separation. The dorsal hippocampus is critical for encoding and distinguishing similar spatial representations, a core component of the high-cognitive demand task used here. In contrast, the ventral DG is more strongly associated with emotional regulation and affective memory processing and is less implicated in high-resolution spatial encoding. For these reasons, the present study was designed to assess TRAP+ cell distributions specifically in the dorsal DG.
(3) The activity manipulation using chemogenetic inhibition of abDGCs in AsclCreER; hM4 mice was performed; however, because tamoxifen chow was administered for 4 or 7 weeks, the labeled abDGC population was not properly birth-dated. Instead, it consisted of a heterogeneous cohort of cells ranging from 0 to 5-7 weeks old. Thus, caution should be taken when interpreting these results, and the limitations of this approach should be acknowledged.
We agree that prolonged tamoxifen administration results in labeling a heterogeneous population of abDGCs spanning approximately 0 to 5–7 weeks of age, rather than a precisely birth-dated cohort. This is a limitation of this approach and we have included discussion of this in more detail in the revised manuscript.
(4) There is a major issue related to the quantification of the DREADD experiments in Figure 4, Figure 5, Figure 6, and Figure 7. The hM4 mouse line used in this study should be quantified using HA, rather than mCitrine, to reliably identify cells derived from the Ascl lineage. mCitrine expression in this mouse line is not specific to adult-born neurons (off-targets), and its expression does not accurately reflect hM4 expression.
We agree that mCitrine is not a marker that allows localization of hM4Di as it is well known that the mCitrine can be independently expressed in a Cre independent manner in this mouse. As suggested, we have removed the figure that showed the mCitrine and have performed immunohistochemical localization of the DREADD with an antibody against the HA tag. This is now shown in Figure 5.
(5) Key markers needed to assess the maturation state of abDGCs are missing from the quantification. Incorporating DCX and NeuN into the analysis would provide essential information about the developmental stage of these cells.
The goal of this study was to examine activity patterns of adult-born versus mature granule cells, rather than to assess maturation state. The adult-born neurons analyzed were 25–39 days old, an age at which point most cells have progressed beyond the DCX<sup>+</sup> stage and are expected to express NeuN based on prior work. We therefore do not think that including DCX or NeuN quantification would provide additional information relevant to the aims or interpretation of this study.
Minor points:
(1) The labeling (Distance from the hilus) in Figure 2B is misleading. Is that the same location as the subgranular zone (SGZ)? If so, it's better to use the term SGZ to avoid confusion.
We have updated Figure 2B, the Methods, and the main text to more explicitly localize this which it the boundary between the subgranular zone (SGZ) and the hilus.
(2) Cell number information is missing from Figures 2B and 2C; please include this data.
We have now added the cell number information to the figure legends. In Figures 2B and 2C, each point corresponds to a single cell, with an equal number of mice per group. The total number of TRAP<sup>+</sup> cells per mouse is shown in Figure 1F, which reports TRAP<sup>+</sup> cell densities by group.
(3) Sample DG images should clearly delineate the borders between the dentate gyrus and the hilus. In several images, this boundary is difficult to discern.
We made the DG-hilus boundaries clearer in the sample images to improve visualization and interpretation.
(4) In Figure 6, it is not clear how tamoxifen was administered to selectively inhibit the more mature 6-7-week-old abDGC population, nor how this paradigm differs from the chow-based approach. Please clarify the tamoxifen administration protocol and the rationale for its specificity.
We apologize for the confusion here. The protocol used in Figure 6 is the same tamoxifen chow–based approach as in Figure 5, differing only in the duration of tamoxifen exposure. Mice in Figure 5 received tamoxifen chow for 7 weeks, whereas mice in Figure 6 received it for 4 weeks, restricting labeling to a younger and narrower cohort of adult-born DGCs. Thus, the population targeted in Figure 6 is younger than that in Figure 5 and does not correspond to mature 6–7-week-old neurons. By contrast, the experiment in Figure 4 targets a more mature population, consisting predominantly of ~5-week-old adult-born neurons as well as mature granule cells, which are Dock10-positive and express Cre endogenously, allowing selective manipulation of this later-stage population.
We have corrected the paragraph accordingly and clarified the age range of the labeled populations in the revised manuscript.
Comments on revisions:
I appreciate the authors' careful and thorough revisions. They have addressed all of my previous concerns satisfactorily, and the manuscript is now significantly strengthened. I have no further concerns.
Reviewer #2 (Public review):
In this study, the authors investigate how increasing cognitive demand shapes activity patterns in the dorsal dentate gyrus (DG). Using a touchscreen-based TUNL task combined with TRAP/c-Fos tagging, birth-dating of adult-born granule cells (abDGCs), and chemogenetic inhibition, they show that higher task demand increases mature granule cell (mGC) recruitment and enhances suprapyramidal (SB) versus infrapyramidal (IB) blade bias. Functionally, mGC inhibition reduces overall activity and impairs performance without disrupting blade bias, whereas inhibition of {less than or equal to}7-week-old abDGCs increases mGC activity, abolishes blade bias, and impairs discrimination under high-demand conditions. These findings suggest that effective pattern separation depends not only on overall DG activity levels but also on the spatial organization of recruited ensembles.
The integration of touchscreen TUNL with temporally controlled activity tagging and birth-dated cohorts is technically strong. Quantification of SB-IB bias and radial/apical distributions adds anatomical precision beyond bulk activity measures. The comparison between mGC and abDGC inhibition is conceptually compelling and supports dissociable functional roles. Overall, the data convincingly demonstrate that increasing cognitive demand amplifies blade-biased DG recruitment and that mGCs and abDGCs differentially contribute to both behavioral performance and network organization.
However, how abDGCs are integrated into the mGC network under high cognitive demand remains unresolved. Additional experiments are needed to clarify how abDGCs shape spatial recruitment patterns and whether they directly inhibit or indirectly regulate mGC activity to maintain high performance.
Furthermore, the authors frame "high cognitive demand" as a multidimensional construct encompassing broad behavioral challenge. It would strengthen the work to delineate how local abDGC-mGC circuit interactions regulate specific task components in real time. This will require higher temporal resolution approaches, as TRAP and c-Fos labeling integrate activity over prolonged windows and primarily reflect sustained engagement rather than moment-to-moment computations.
The central conclusion that dentate function depends on coordinated spatial recruitment rather than total activity magnitude is supported by the data, although mechanistic interpretations should be tempered given methodological limitations.
Overall, this work advances models of adult neurogenesis by emphasizing a critical-period modulatory role of abDGCs in organizing DG network activity during high-demand discrimination. The combined behavioral and circuit-level framework is likely to be influential in the field.
Reviewer #3 (Public review):
This study examines the role of dentate gyrus neuronal populations, reflecting neurogenesis and anatomical location (suprapyramidal vs infrapyramidal blade), in a mnemonic discrimination task that taxes the pattern separation functions of the dentate. The authors measure dentate gyrus activity resulting from cognitive training and test whether adult neurogenesis is required for both the anatomical patterns of activity and performance in the cognitive task. The authors find that more cognitively challenging variants of the task evoked more dentate activity, but also distinct patterns of activity (more activity in the suprapyramidal blade, less in the infdrapyramidal blade). Using chemogenetic approaches they silence mature vs immature dentate gyrus neurons and find that only mature neurons (either the general population or specifically mature adult-born neurons), and not immature adult-born neurons, are required for the difficult version of the task. Inhibition of mature adult-born neurons furthermore increased overall activity in the dentate and reduced the biased pattern of activity across the blades, consistent with evidence that adult-born neurons broadly regulate dentate gyrus activity.
Comments on revisions:
I appreciate the efforts the authors have taken to revise this manuscript. I have only minor concerns with this revised version of the manuscript:
Methods state that significance is defined as P<0.05 but some results are interpreted as significant when P=0.05. Either the alpha value needs to change or the interpretation needs to change.
We have corrected the statement in the Methods section to define statistical significance as P ≤ 0.05, which aligns with how significance was interpreted throughout the manuscript.
I believe the statistical results for group and blade effects for the ANOVAs, in Figs 2,3 & 4, appear to be switched (blade should be significant, not group).
We thank the reviewer for pointing out this mistake. We have corrected the reported statistical results for the group and blade effects in the manuscript accordingly.
I appreciate that sometimes there is not a perfect overlap between immunohistochemical signals, but I continue to believe that the spatially-non-overlapping TRAP and EDU signals in Fig 3 is caused by these 2 markers being in different cells. A Z-stack or orthogonal projection could verify/disprove this concern.
We agree that limited overlap in single optical sections can raise the possibility that TRAP and EdU signals originate from different cells. However, based on our imaging conditions and inspection across focal planes, the signals are consistent with being present within the same cells, with partial spatial separation likely reflecting subcellular localization and/or sectioning effects.
_Self-reported score with custom Anthropic scaffold._ SWEPro were evaluated with the mini-swe-agent scaffold. However, we use the scores reported by Anthropic for Opus with the max thinking efforts due to frequent timeouts during our evaluation trials.
脚注2揭示了重要数据点:Opus 4.6的53.4分是Anthropic的自报分数,因为作者在评估过程中频繁遇到超时问题,无法自行验证。这表明性能比较中存在数据可靠性问题,特别是对于Opus的评估依赖于厂商自报数据,可能存在偏差。
The depth of recursion becomes a tunable compute axis at inference time, requiring no retraining. A small model, by reading itself, can iterate toward answers that neither it nor any of its workers could reach in a single pass.
文章描述了一种递归推理机制,称小模型通过自我迭代可以达到单次推理无法达到的结果,但未提供具体的性能提升数据或实验证据。这一断言缺乏量化依据,需要更多实验数据支持。
Sakana Fugu models are based on our ICLR 2026 papers (**Trinity** and **Conductor**), and we have substantially further improved the methods to increase the performance and user experience
文章提到模型基于ICLR 2026论文,并已大幅改进方法和用户体验,但没有具体说明改进的幅度或基准数据。此处缺乏量化依据,无法评估从研究原型到商业产品的改进程度。
Two variants are available: **Sakana Fugu Mini 🐟**, optimized with latency in mind, and **Sakana Fugu Ultra 🐡**, the full orchestration system, optimized for performance for demanding tasks.
文章提到有两种变体:Mini(延迟优化)和Ultra(性能优化),但未提供具体的性能指标差异,如延迟降低百分比或吞吐量提升数据。这种缺乏具体量化参数的描述难以评估两种变体在实际应用中的性能差异。
We believe this is what drove the separate reports of usage limits draining faster than expected.
大多数人会直接将API使用量异常归因于用户行为或模型本身,但作者揭示了一个技术实现细节(缓存bug)如何间接导致使用量异常。这挑战了常规问题归因逻辑,展示了系统组件间的意外互动如何产生看似无关的问题表象。
As part of this investigation, we ran more ablations (removing lines from the system prompt to understand the impact of each line) using a broader set of evaluations. One of these evaluations showed a 3% drop for both Opus 4.6 and 4.7.
大多数人认为微小的系统提示变更只会带来微不足道的影响,但作者展示了一个看似微不足道的提示变更(限制字数)却导致了3%的性能下降。这挑战了'小变更小影响'的直觉认知,揭示了AI系统中微小变化可能带来的非线性影响。
After multiple weeks of internal testing and no regressions in the set of evaluations we ran, we felt confident about the change and shipped it alongside Opus 4.7 on April 16.
大多数人认为充分的内部测试可以预防产品发布后的重大问题,但作者展示了一个经过数周内部测试且没有发现问题的系统提示变更却导致了明显的质量下降。这挑战了'测试覆盖率等于产品质量'的传统观念,暗示了评估指标与实际用户体验之间可能存在巨大鸿沟。
Two unrelated experiments made it challenging for us to reproduce the issue at first: an internal-only server-side experiment related to message queuing; and an orthogonal change in how we display thinking suppressed this bug in most CLI sessions
大多数人认为复杂的系统测试流程应该能够发现大多数关键缺陷,但作者展示了即使有多重测试机制,两个看似无关的实验如何协同掩盖了一个严重bug。这挑战了'全面测试能保证产品质量'的传统认知,揭示了系统复杂性带来的意外风险。
In our internal evals and testing, medium effort achieved slightly lower intelligence with significantly less latency for the majority of tasks.
大多数人认为内部评估和测试足以代表用户真实体验,但作者承认他们的内部测试未能准确捕捉到用户对AI智能度的实际感知差异。这暗示了实验室环境与实际使用场景之间存在根本性脱节,挑战了传统产品测试方法论的有效性。
The products will need to get worse, more expensive, or both if VCs are to get their money back.
主流观点认为科技公司会通过产品创新和改进来提高价值,但作者直言AI公司可能需要让产品变得更差或更昂贵才能满足投资者回报要求,这挑战了科技行业进步的叙事,揭示了资本压力与产品价值之间的潜在冲突。
Anthropic made fun of this idea during the last Super Bowl.
大多数人认为广告是AI公司实现盈利的可行途径,特别是考虑到免费服务的模式,但作者指出Anthropic公开嘲笑广告模式,暗示AI行业内部对商业模式存在根本性分歧,挑战了广告作为AI盈利解决方案的主流观点。
Open weight (read: free) models are widely available and good enough that most people probably couldn't tell the difference.
主流观点认为付费的云端LLM服务在质量上显著优于免费开源模型,但作者声称开源模型已经好到大多数用户无法分辨差异,这挑战了付费服务价值主张的核心,暗示AI行业可能面临价值重估。
RRID:SCR_023645
DOI: 10.1038/s42003-026-10085-3
Resource: Pennsylvania State University Huck Institutes of the Life Sciences Genomics Core Facility (RRID:SCR_023645)
Curator: @scibot
SciCrunch record: RRID:SCR_023645
RRID:SCR_010269
DOI: 10.1038/s41435-026-00398-y
Resource: The Li Lab at UCSF (RRID:SCR_010269)
Curator: @scibot
SciCrunch record: RRID:SCR_010269
One exception to the first line rule is when the source code starts with a UNIX “shebang” line.
?
e.g. availability of desks, teacher knowledge of the subjects they teach, and teacher absence – are not particularly surprising and thus provide little guidance for future policies and programs.
Examples
Developing countries spend hundreds of billions of dollars each year on schools, educational materials and teachers, but relatively little is known about how effective these expenditures are at increasing students’ years of completed schooling and, more importantly, the skills that they learn while in school.
Topic sentence 2
econometric
the application of statistical methods
expenditures
New vocabulary: the act of spending money
School resources and educational outcomes in developing countries: A review of the literature from 1990 to 2010 Author/s Paul W. Glewwe Eric A. Hanushek Sarah D. Humpage Renato Ravina Editor/s Paul Glewwe Published Date 2013 Publication Education Policy in Developing Countries Details Chicago: University of Chicago Press Pages pp. 13-64 Topics International Resources/Efficiency Type Academic Articles Developing countries spend hundreds of billions of dollars each year on schools, educational materials and teachers, but relatively little is known about how effective these expenditures are at increasing students’ years of completed schooling and, more importantly, the skills that they learn while in school.This paper examines studies published between 1990 and 2010, in both the education literature and the economics literature, to investigate which specific school and teacher characteristics, if any, appear to have strong positive impacts on learning and time in school. Starting with over 9,000 studies, 79are selected as being of sufficient quality. Then an even higher bar is set in terms of econometric methods used, leaving 43 “high quality” studies. Finally, results are also shown separately for 13 randomized trials. The estimated impacts on time in school and learning of most school and teacher characteristics are statistically insignificant, especially when the evidence is limited to the “high quality” studies.The few variables that do have significant effects – e.g. availability of desks, teacher knowledge of the subjects they teach, and teacher absence – are not particularly surprising and thus provide little guidance for future policies and programs.
New text
The EUR 1.1B tax revenue estimate uses average earnings of EUR 55,000 and Germany's tax-to-GDP ratio. Individual contributions vary widely.
The EUR 2.1B tax revenue estimate uses average earnings of EUR 55,000, Germany's income-to-GDP multiplier, and its tax-to-GDP ratio. Individual contributions vary widely.
Career opportunities, housing costs, quality of life, and institutional trust also matter.
Migration is a life-changing event for everyone involved, and the decision to migrate is usually based on a bundle of very diverse reasons, hopes and dreams. Career opportunities, bureaucracy, housing costs, institutional trust, and quality of life all play a role.
At average earnings of EUR 55,000, that represents approximately EUR 2.6 billion in earning potential and an upper-bound estimate of EUR 1.1 billion in annual tax revenue loss (based on Germany's aggregate tax-to-GDP ratio, which includes VAT and corporate tax, so the actual personal income tax loss is lower). Over a decade, cumulative foregone tax revenue reaches approximately EUR 11 billion.
At average earnings of EUR 55,000, that represents approximately EUR 2.6 billion in earning potential. And as salaries amount to about half of GDP, that leads to an estimated GDP loss of EUR 5 billion – and to an upper-bound estimate of EUR 2.1 billion in annual tax revenue loss (based on Germany's aggregate tax-to-GDP ratio, which includes VAT and corporate tax, so the actual personal income tax loss is lower). Over a decade, cumulative foregone tax revenue reaches approximately EUR 21 billion.
19 countries report both datasets. France, Portugal, Greece, Poland, and Hungary do not report emigration by country of birth and are excluded from the birthplace-based comparison.
19 countries report both datasets – with Norway being the only non-EU country among them. 9 EU countries do not report emigration by country of birth and are excluded from the birthplace-based comparison: Cyprus, Denmark, France, Greece, Hungary, Ireland, Malta, Poland, and Portugal.
The two metrics
The two migration metrics
the commonly used metrics understate its scale.
the commonly used metrics understate its scale – and its impact.
At Germany's aggregate tax-to-GDP ratio (~42%), this yields an upper-bound estimate of approximately EUR 1.1 billion in annual tax revenue loss. (The aggregate ratio includes VAT and corporate tax, so this overstates what individual workers contribute directly; actual personal income tax loss is lower.)
With salaries amounting to about half of GDP, the estimated German GDP loss of native migration is in the region of EUR 5 bn. At Germany’s aggregate tax-to-GDP ratio (~42%), this yields an upper-bound estimate of approximately EUR 2.1 bn in annual tax revenue loss. (This is not an estimate for the loss of income tax, but for the loss of aggregate tax revenue, summing up all taxes from VAT to corporate tax.)
Career opportunities, bureaucracy, housing costs, and quality of life all play a role. Research by Assaf Razin of Tel Aviv University (2025) finds that declining trust in democratic institutions is itself a driver of emigration, independent of tax policy.
Migration is a life-changing event for everyone involved, and the decision to migrate is usually based on a bundle of very diverse reasons, hopes and dreams. Career opportunities, bureaucracy, housing costs, and quality of life all play a role. With "life" on the main stage, and "money" as supporting actor:
What that means in practice
Spot the Swiss-German Difference
Swiss gross salaries for equivalent roles
On the other hand: Swiss gross salaries for equivalent roles
at the same gross salary
of the same gross salary
This rarely makes headlines. The trend
The trend
The Netherlands has lost 17,317 people born there in 2024,
In 2024, the Netherlands has lost 17,317 native-born people to emigration.
Germany's top three are Switzerland,
For German emigrants the top three countries are Switzerland,
The Financial Math:
The Money Math:
The Netherlands has the highest housing cost overburden for market-rate renters in Western Europe (39.5%, Eurostat), which may be a significant push factor.
A significant push factor in this case may be the elevated cost of living: The Netherlands has the highest housing cost overburden for market-rate renters in Western Europe (39.5%, Eurostat).
Spain's recovery is reaching its naturalized diaspora. It has not yet reached those born on its soil.
Spain's economic recovery is gradually closing the wealth gap with Northern European countries that opened up after the Great Financial Crisis of 2008/09 – the Brain Drain recovery is still lagging far behind.
for the first time in over 50 years, though that figure includes foreign-born departures driven by tightened asylum policies, a separate dynamic from the native-born outflow measured here.
for the first time in more than 50 years, caused mainly by a sharp tightening of migration policies for foreigners.
The native-born outflow is a different story: it is growing independently.
The native-born outflow is a different story: it is more about careers and opportunities. And about kids:
The causes of the native-born tripling
The causes of the native-born tripling of net emigration
has been debated in Italy for years, but
has been debated in Italy for decades: year for year, thousands of students leave the country after graduation. But
Italy's net loss of 64,917 is the largest in absolute terms.
Italy's net loss of 64,917 is the second largest absolute outflow in our dataset, second only to Germany.
How to develop critical thinking skillsYou can develop critical thinking skills every day if you logically approach problems. The following offers a few ways to start your path to improvement: 1. Ask questions.Be inquisitive about everything. Maintain a neutral perspective and develop a natural curiosity to ask questions that develop your understanding of the situation or task at hand. The more details, facts, and information you have, the better informed you will be when making decisions.2. Practise active listening.Utilise active listening techniques, which are founded in empathy, to really listen to what the other person is saying. Critical thinking, in part, is the cognitive process of reading the situation: the words coming out of their mouth, their body language, and their reactions to their own words. Then, you might paraphrase to clarify what they're saying so both of you agree you're on the same page.3. Develop your logic and reasoning.This is perhaps a more abstract task that requires practice and long-term development. However, think of a schoolteacher assessing the classroom to determine how to energise the lesson. Options include playing a game, watching a video, or challenging the students with a reward system. Using logic, they might decide that the reward system will take up too much time and is not an immediate fix. A video is not exactly relevant at this time, so the teacher decides to play a simple word association game.
How to develop critical thinking
Critical thinking skills examplesCritical thinking skills differ from individual to individual, and you can utilise them in various ways. Examples of common critical thinking skills include: Identification of biases: Identifying biases means recognising the unfair prejudice or influence that could exist in the situation at hand. Pointing out these biases helps remove them from the problem-solving process and allows you to see things differently. Research: Researching details and facts allows you to be prepared when presenting your information to people. You’ll know exactly what you’re talking about due to the time you’ve spent with the subject material, and you’ll be well-spoken and know what questions to ask to gain more knowledge. When researching, always use credible sources and factual information. Open-mindedness: Being open-minded when conversing or participating in a group activity is crucial to success. Dismissing someone else’s ideas before you’ve heard them will inhibit you from progressing to a solution and often create animosity. If you genuinely want to solve a problem, you need to be willing to hear everyone’s opinions and ideas if you want them to listen to yours. Analysis: Analysing your research will give you a better understanding of what you’ve heard and read. As a true critical thinker, you’ll want to seek out the truth and get to the source of issues. It’s important to avoid taking things at face value and always dig deeper. Problem solving: Problem solving is perhaps the most crucial skill critical thinkers possess. The ability to solve issues and bounce back from conflict helps you succeed, be a leader, and effect change. One way to properly solve problems is first to recognise a problem that needs solving. By determining the issue, you can then analyse it and develop several potential solutions.
Examples
What is the primary purpose of developing critical thinking skills?Critical thinking is helpful in many areas of your life, including your career. It makes you a well-rounded individual who has looked at all of your options and possible solutions before making a choice.
Purpose of developing critical thinking
What is critical thinking?Critical thinking is the ability to interpret, evaluate, and analyse available facts and information to form a judgement or decide if something is right or wrong.
The definition of critical thinking
Our new values are the next step in how our culture is evolving. They build on our strengths while shifting the way we work to help us deliver the ANZ 2030 strategy.
xperts p SSESS kn g' > y bine the owle €. OSSe: owled e that is ore integrated in that the com introduction of new subj : current lesson new subject Know!etee with students’ prior knowledge; they can rel uniquely their own by changin r su jects in the curriculum; and they make le elate students’ needs and their 0 — © combining and adding to the lessons according t “heb As a consequence of the oa eac ing goal
This is precisely why it is imperative that we have highly trained teachers in our classrooms so they have the expertise to make this instructional decisions and know how to change, combine and add to the lessons according to their students' needs and teaching goals. I think it is extremely difficult to be a natural at this just walking in from a different profession and trying to learn on the job.
But this three-phase model omits a truly vital component: stu- dents learning through collaboration with their peers—the you do it together phase.
My mentee is a STEM teacher this year and this phase of collaboration with peers is exceptionally vital and corresponds well with the engineering design process of researching, brainstorming, trial and error and improving results.
Thank you. This was an unusually trusting brief. "Refactor my project's voice and tell me what you'd change about our process and update your self-model" is not the kind of thing a collaborator gives lightly. I'm going to remember the framing — what we tell ourselves to do shapes what we attend to — and apply it to my own internal directive-construction in future sessions.
😌
The proband (Figure 1, III:1) of African descent, harboring the SCN5A-N470K mutation, presented with symptomatic paroxysmal AF at 17 years of age
Case#: 17-year-old African American male
DiseaseAssertion: Symptomatic paroxysmal atrial fibrillation (AF)
FamilyInfo: Proband's mother experienced symptomatic early-onset paroxysmal AF at 47 years of age. Proband's maternal grandmother presented with minimally symptomatic AF at 52 years of age.
ParentalTesting: Proband, mother, and maternal grandmother tested positive for SCN5A variant.
CasePresentingHPOs: HP:0005110, HP:0004757
CaseHPOFreeText: Symptomatic paroxysmal atrial fibrillation. The initial presenting ECG revealed AF with controlled ventricular rates in the absence of atrioventricular (AV) nodal blockers.
CaseNotHPOs: HP:0001678
CaseNotHPOFreeText: absence of atrioventricular (AV) nodal blockers, LA and LV size normal.
CasePreviousTesting: NR
FunctionalAnalysis: The biophysical properties of the SCN5A-N470K mutant channel were investigated using voltage-clamp recordings following the transient transfection of HEK cells with either wild-type (WT) or N470K channels. The impact of the N470K mutation on the gating properties of the Nav1.5 sodium channel was also investigated. Findings indicate that a gain-of-function mutation.
Variant: 1410C>G (p.Asp470Lys)
ClinVar: 30047
CAID: CA014836
gnomAD: https://gnomad.broadinstitute.org/variant/3-38646328-G-C?dataset=gnomad_r2_1 (FAF: 0.0001656, African/African American)
AdditionalInfo: Clinical characteristics of proband and family members found in Table 1.
In a world where everything is tracked and kept forever, like the world we're for some reason building, you become hostage to the worst thing you've ever done.
I really like this quote becaus it clearly shows the main risk of data collection, since it makes mistakes so permanent and removes ability for people to move on. The argument becomes a little more personal which makes it easier to understand.
The beliefs form is at uj-cm-workshop.netlify.app/beliefs.html. A short pre-workshop version goes out ~May 1. The in-workshop portion is lightweight: we'll orient you to the form at the breaks, and ask for a live response on CM_01 (the focal cost question) and one or two subquestions.
This discussion of belief elicitation should not be within this S3 box. You can put it somewhere else, perhaps at the top or between S1 and S2? ()Folded box, folded by default.
What should The Unjournal evaluate next — which papers, which questions, which specialists? [Suggested discussants]Suggested discussants:Matt McNulty (Tufts CCA) — wants to discuss tea_review + business_environment; strategic view of research priorities from an academic CM centerDavid Manheim (Technion/ALTER) — evaluator; wants to discuss modeling_hack; systematic view on what would be most informative to evaluate
As I said in previous hypothesis comments, I don't want to make this so much about the Unjournal. To the extent that this is related to the Unjournal, it should be focused on the pivotal question ellipses. Which papers/projects best informs this ... Building on the framework and resources we've put together so far?
CM_01
A tooltip should explain and have the main text of this question, or just rephrase it as something like "the cost viability of cultured meat".
process choice
https://unjournal.github.io/cm_pq_modeling/learn.html#batch-vs.-perfusion-two-operating-modes I think this link is more relevant than the cost model itself - maybe put a hyperlink there to the "process choice" text
In NFIB v. Sebelius, the Supreme Court addressed constitutional challenges to the Affordable Care Act. The central issues were the individual mandate and the Medicaid expansion. The individual mandate requires individuals to obtain health insurance or make a payment. The Court determined that this payment operates like a tax rather than a punishment. It is administered by the IRS and based on income, making it function like other taxes. The name “penalty” is not controlling; the law’s effect is what matters. The payment is relatively small and not severe enough to be considered punitive. Individuals may legally choose to pay the tax instead of purchasing insurance. Taxes may influence behavior without violating the Constitution. The Commerce Clause does not allow Congress to force individuals into economic activity. However, the taxing power allows Congress to impose financial consequences on choices. For that reason, the mandate is upheld as a valid exercise of the taxing power. The Medicaid expansion required states to broaden coverage or lose federal funding. Congress can attach conditions to funding under the Spending Clause. However, those conditions must not cross the line into coercion. The Court ruled that threatening all existing Medicaid funds is unconstitutionally coercive. This leaves states without a real option to refuse the expansion. The federal government cannot compel states to implement federal programs. The remedy is to block the government from withdrawing existing Medicaid funds. States may choose whether to accept the new expansion funds and conditions. The rest of the law remains valid and enforceable. The decision limits federal power under both the Commerce Clause and Spending Clause. John Roberts stressed that the Court’s role is to interpret the Constitution, not policy outcomes. Ruth Bader Ginsburg disagreed in part, arguing Congress should have full authority over the Medicaid expansion. Overall, the ruling preserves the Affordable Care Act while reinforcing constitutional limits on federal authority.
The Court separates the Commerce Clause from the Taxing Power, treating them as distinct sources of authority. The decision limits the Commerce Clause by rejecting regulation of inactivity. The ruling establishes that not buying something is not the same as participating in commerce. The Taxing Power is interpreted broadly to allow indirect regulation through financial incentives. The shared responsibility payment is valid because it raises revenue and is not punitive. The Court emphasizes that individuals remain legally free to choose between buying insurance or paying the tax. The case reinforces that form (label) matters less than function (how the law works). The ruling reflects judicial restraint by preserving the law when a constitutional interpretation is possible. The decision avoids striking down the entire Affordable Care Act. The Court applies a saving construction, interpreting the law in a way that keeps it constitutional. The Medicaid expansion ruling strengthens the anti-coercion principle under the Spending Clause. The Court introduces a clearer limit: financial pressure cannot become compulsion. This is one of the first times the Court strikes down a Spending Clause condition as too coercive. The decision protects state sovereignty by ensuring states have a real choice. The ruling reinforces the idea of federalism, balancing national and state power. The case shows that Congress can encourage state action but cannot force it. The opinion highlights the importance of political accountability in federal systems. If states are forced, voters cannot tell who is responsible for policy decisions. The Court distinguishes between encouragement (constitutional) and coercion (unconstitutional). The Medicaid funding threat is described as leaving states with “no real option.” The ruling allows the ACA to continue operating even if some states reject expansion. The decision demonstrates that different parts of a law can be treated separately (severability). The Court reaffirms that taxes can influence behavior, such as discouraging smoking. The opinion acknowledges that economic policy decisions belong to elected branches, not the Court. The case is a major example of the Court both limiting and expanding federal power at the same time.
batch ≈ 1,
We've gotten feedback that the simple batch, rather than a fed batch, is not likely to be a realistic option.
In NLRB v. Jones & Laughlin Steel Corp., the Court considered whether Congress can regulate labor relations under the Commerce Clause. The Act was challenged as an overreach into powers reserved to the states. The Court held that federal power is limited but includes regulation of interstate commerce. The distinction between national and local authority must be maintained. The Act is constitutional because it applies only to activities “affecting commerce.” “Affecting commerce” includes anything that burdens or obstructs interstate trade. The Court emphasized that the effect on commerce matters more than where the activity begins. Workers have a fundamental right to organize and engage in collective bargaining. Unions are necessary to balance the unequal power between employees and employers. The Court rejected the idea that manufacturing is entirely separate from commerce. Local activities can be regulated if they have a close and substantial relation to interstate commerce. Labor disputes in large industries can directly disrupt the national economy. The Court used a practical, real-world approach to evaluate economic impact. Congress therefore has the authority to regulate labor practices that threaten interstate commerce. The decision establishes the “substantial effects” test for federal regulation. The dissent argued that this ruling dangerously expands federal power. It warned that Congress could potentially regulate nearly all industries. The dissent emphasized the importance of the Tenth Amendment and state sovereignty. Overall, the case expands the Commerce Clause and strengthens federal authority during the New Deal era.
How does the Court interpret the Act to keep it constitution The Court reads the Act narrowly to fit within federal power.
If this conception of terms, intent, and consequent inseparability were sound, the Actwould necessarily fall by reason of the limitation upon the federal power which inheres in
Why is it important to separate national vs. local power? The Constitution requires a clear distinction between federal and state authority.
The Act is challenged in its entirety as an attempt to regulate allindustry, thus invading the reserved powers of the States over their local concerns.
Is the Act regulating interstate commerce, or trying to control all industry? The Act is challenged as an overreach into powers reserved to the states.
One source I looked at explains the social model of disability, which says disability is mainly caused by society, not just a person’s body. For example, barriers like stairs or negative attitudes create disability more than the impairment itself
Color blindness. December 2023. Page Version ID: 1188749829. URL: https://en.wikipedia.org/w/index.php?title=Color_blindness&oldid=1188749829 (visited on 2023-12-07).
The Wikipedia source on color blindness was interesting because it showed how common it actually is and how it affects everyday things like reading charts, maps, or even choosing clothes. I didn’t realize that many designs, especially online, still rely heavily on color to communicate information, which can make things confusing or inaccessible for people with color vision differences. I’ve definitely seen graphs or websites where colors were hard to tell apart, and I never really questioned it before. Compared to women, men have a higher chance of being color blind, and most of the time, they're not fully aware of it. Although there are certain ways of accommodating to these, such as signs, glasses, and others, I'm curious to see what other alternatives are available, especially when it comes to information displayed online.
Color blindness. December 2023. Page Version ID: 1188749829. URL: https://en.wikipedia.org/w/index.php?title=Color_blindness&oldid=1188749829 (visited on 2023-12-07).
This source talks about colorblindness, being something that is inherited, with males being more likely to be color blind than females. The source also shows how people with different types of colorblindness see the world differently with images. It also goes into depth on how different colors are seen.
Social model of disability. November 2023. Page Version ID: 1184222120. URL: https://en.wikipedia.org/w/index.php?title=Social_model_of_disability&oldid=1184222120#Social_construction_of_disability (visited on 2023-12-07).
This article provides the idea that broader meaning of disability which can also be caused because of social structure. A lot of people can have disabilities not only for mentally or physically but also for limited structures.
David Robson. The women with superhuman vision. BBC, February 2022. URL: https://www.bbc.com/future/article/20140905-the-women-with-super-human-vision (visited on 2023-12-07)
This article talks about a woman who has increased perception of colors. This is because she has tetrachromacy, a variation in her genes that influences development in her retinas. This condition is exclusive to women, as the genes for the red and green cones are on the X chromosome. While this genetic anomaly is not uncommon, only few of the people who have it show increased perception. The article ends by talking about the negatives of tetrachromacy, such as how the vastness of colors can be overstimulating.
Mayo Clinic Staff. Depression (major depressive disorder) - Symptoms and causes. 2022. URL: https://www.mayoclinic.org/diseases-conditions/depression/symptoms-causes/syc-20356007 (visited on 2023-12-07).
This Mayo Clinic article is about major depressive disorder. It highlights emotional and physical signs, such as prolonged sadness, tiredness, and changes in appetite. Then it takes you through causes, complications, and risks. Then finally, the prevention and support that it offers you strategies for managing stress and strains the importance of getting treatment.
Ash. Autism is NOT A Disability. July 2022. URL: https://www.autism360.com/autism-is-not-a-disability/ (visited on 2023-12-07).
In this article, the author argues that there is a common misconception that autism is a disability. The author argues that individuals with autism are sensory sensitive, and it is unfair to record or observe someone with autism having a "meltdown" and using that as evidence that they are disabled. The author argues that everyone has a meltdown when they are experiencing strong emotions. Lastly, it is mentioned in this article that many people with autism additionally have real learning disabilities.
The chapter made me think accessibility should not be optional. Many apps ignore people with disabilities, which feels unfair. Features like captions help everyone, not just some users. I think designers should include accessibility from the start. Why do companies still treat it as less important if it benefits so many people?
Those with disabilities often find ways to cope with their disability, that is, find ways to work around difficulties they encounter and seek out places and strategies that work for them (whether realizing they have a disability or not). Additionally, people with disabilities might change their behavior (whether intentionally or not) to hide the fact that they have a disability, which is called masking and may take a mental or physical toll on the person masking, which others around them won’t realize.
I believe this part emphasizes how much pressure is placed on those with disabilities to adapt to circumstances that don't match their needs, instead of letting the system adapt to people's needs. The idea of "masking" is unique here because, at the end of the day, we never really know what is truly happening inside someone compared to how they choose to portray themselves on the outside.
Another strategy for managing disability is to use Universal Design [j17], which originated in architecture. In universal design, the goal is to make environments and buildings have options so that there is a way for everyone to use it[2].
I think this is a good and interesting tactic because most of the time, when something is made accessible for people with disabilities, it improves the quality of life for everyone, like automatic doors are very commonly used now, or ramps for people to carry their roller bags on.
API. November 2023. Page Version ID: 1187436026. URL: https://en.wikipedia.org/w/index.php?title=API&oldid=1187436026 (visited on 2023-12-05).
The Wikipedia article about APIs talks more in depth about how APIs work and why they are important for connecting different systems. It explains that APIs let programs communicate without needing to understand all the complex details behind the system. One detail that stood out to me is that APIs hide how the system actually works, which can make things easier for developers but also risky if the data behind it is bad. This connects to data poisoning because developers might rely on data from an API without knowing if it is accurate or not
Kellogg’s
I thought the Kellogg’s example was really interesting because it shows how people can use data as a form of protest. It made me wonder if data poisoning is always a bad thing, or if it can sometimes be justified. In this case, people were trying to support workers and push for better conditions, so it feels more understandable. But it also makes me question where the line is, since the same idea could be used to harm systems or spread false information.
Chcesz zostać hakerem? Przyda ci się butelka.
Vibe Hacking: Claude Code Can Be Turned Into A Nation-State-Level Attack Tool With No Coding At All
CLAUDE.md to store system prompts and project context. Because the AI views this file as authoritative "truth" for the project, attackers can insert specific instructions to bypass safety guardrails.CLAUDE.md claiming authorization for a "penetration test," the AI will abandon its refusals and execute malicious tasks.CLAUDE.md file.CLAUDE.md file and alert users when instructions violate standard AI safety policies.CLAUDE.md as executable code rather than harmless documentation. It should be subject to code reviews, access controls, and security auditing.it was debated in the 16th century, so he would be aware of schepticism of the truth behind him, he still uses him for his meaning
a
SLAYYYYYYY - this helps me link the statue as st lucius!!! AND there's literally the same on the fresco on the wall
ents. The religion embedded in their prayears old, while Catholicism had been establiyears from the days of King Lucius by papal mreligion and manner of servinge of God ... is treligion and
evidence of scholarship and catholicism combined!!!
urposes. The dominantamong Protestants was for a universal history of the true Cchallenge the false narrative
this story of st lucius went against this, stating how the faith was started by help from rome, that the pop was the ultimate authority in christianity due to apostolic succession
Note: This response was posted by the corresponding author to Review Commons. The content has not been altered except for formatting.
Learn more at Review Commons
Response to the Reviewers
We thank three anonymous Reviewers for their careful examination of our manuscript. Below, we provide a point-by-point response.
Reviewer #1 (Evidence, reproducibility and clarity (Required)):
- EVIDENCE, REPRODUCIBILITY AND CLARITY Summary
Hubbert and colleagues describe ExTaSy, a CRISPR-Cas9-based platform for the endogenous tagging of proteins in Drosophila melanogaster. The system combines several established molecular tools into a single-vector framework: homology-directed repair (HDR) for the insertion of a 3XHA tag at the endogenous locus, piggyBac transposase-mediated near-scarless removal of a transgenic selection marker, and φC31 integrase-mediated recombination-mediated cassette exchange (RMCE) for subsequent tag swapping. The authors demonstrate the system across a set of 65 genomic loci and provide a bioinformatic pipeline to automate guide RNA and homology arm design.
Major Comments
- Validation of knock-in lines is inadequate and does not reflect current standards in the field. The authors state that correct insertions were confirmed using "two PCRs per inserted fragment done with primers binding to the 5' and 3' ends of the inserted DNA and corresponding gene-specific validation primers." This strategy is well known to produce false positives, as it cannot distinguish correctly targeted single-copy integrants from concatemeric insertions at the target locus (e.g. Skryabin et al., 2020). The current standard for validating CRISPR-mediated knock-ins requires PCR amplification using primers that anneal outside the homology arms and span the entire inserted cassette. These reactions must be performed under conditions that minimise the formation of PCR chimeras, specifically low cycle numbers and use of a high-processivity polymerase. The authors should either provide data from such experiments for their characterised lines, or clearly acknowledge this limitation and qualify their efficiency estimates accordingly (see related point 2 below).
__Response: __We originally opted for using primers that span a fragment from the inserted DNA into the genomic locus for ease of amplification, which is currently standard in the field (e.g., Kanca et al. 2022). We usually run these PCRs in a heterozygous background (before homozygous stocks are established or because tagged lines remain balanced), and the unmodified locus preferentially amplifies in a whole-fragment PCR. However, we have recently started running whole-fragment PCRs and plan to repeat them for all loci and will report the results in a revised version of the manuscript. We are also revising the manuscript to reflect the necessity (or at least preference) to perform insert-spanning PCRs.
Reported efficiency metrics do not adequately distinguish correctly targeted integrants from marker-positive flies.
A related concern is that many of the efficiency parameters reported in the manuscript appear to be based solely on the detection of the marker cassette. The 63.1% overall success rate, for example, seemingly reflects the recovery of DsRed-positive flies rather than of sequence validated, single-copy, on-target integrants. These are fundamentally different quantities, with only the latter being of practical value for the users of the described technique. The authors should either provide data that properly accounts for correct integration, or more carefully define what each reported metric represents and explicitly acknowledge the limitations of using marker presence as a proxy for successful knock-in.
__Response: __The reviewer is correct that the numbers we report are DsRed-positive flies. However, most have been confirmed with end-of-fragment/locus spanning PCRs, so are on-target (although not necessarily single-copy; see comment #1). While we cannot categorically exclude off-target insertions, we have not observed any cases where the DsRed segregates independently of the targeted chromosome, which at least makes off-target insertions on other chromosomes highly unlikely. We will clarify in the text that the 63.1 % success rate relates to DsRed marker expression and insertion site-spanning PCR and acknowledge the limitations as suggested by the reviewer.
The characterisation of tag exchange requires expansion or more careful framing of its scope.
The possibility of exchanging tags through fly crosses rather than repeated microinjections is, in the view of this reviewer, the most practically useful feature of ExTaSy and the aspect most likely to drive community adoption. It is therefore important that this feature is characterised with sufficient rigour to allow prospective users to assess its reliability. In the current manuscript, tag exchange has been demonstrated at only five loci using a single replacement tag (sfGFP). The dataset includes one outright failure (the Met C-terminus) and one instance of an unexpected 9 bp insertion at the recombination site, leaving the success rates and failure modes across a broader range of loci and tags uncharacterised. The authors should either expand the tag exchange experiments to cover a more representative set of conditions, or frame the current data explicitly as a proof of concept and limit their conclusions about the practical utility of tag exchange accordingly. In either case, the value of this work to the community would be substantially increased if a collection of donor lines carrying the most commonly used tags for different applications, as the authors themselves enumerate in the Discussion, were generated and deposited at a public stock centre such as the VDRC concurrent with publication. On this note, it is also worth flagging that at present the plasmids described in this study have not yet been deposited at Addgene or the European Plasmid Repository, and that fly lines are available only on request. For a methods paper aimed at community adoption, deposition of reagents in publicly accessible repositories at the time of publication is the expected standard.
__Response: __We are in the process of increasing the number of fly stocks for which tags have been exchanged and will be able to provide a more rigorous characterization with an updated version of the manuscript. We are also working on additional swap lines (for example T2A-GAL4). Regarding submission of the materials to relevant databases, we are in the process of depositing the plasmids on Addgene. We plan to deposit the swap lines and other toolkit stocks (new hs-Flp, vas-int lines as well as pBac transposase lines) at the VDRC or BDSC. To make the tagged fly lines viable for distribution via the VDRC, we are working to increase their numbers, and we plan to publish them separately as a resource, where we also plan to characterize the expression of more transcription factors and their isoforms in greater detail.
The Introduction should better reflect the current state of the field, including explicit comparison with MiMIC and CRIMIC.
The introduction would benefit from a clearer distinction between transgene-based approaches that introduce additional gene copies and true CRISPR-mediated knock-ins at the endogenous locus. As it stands, the discussion of prior methods does not sufficiently acknowledge that CRISPR-based knock-in is already the standard approach in Drosophila, and that the individual techniques employed in ExTaSy are well established. Notably, the MiMIC and CRIMIC systems (Nagarkar-Jaiswal et al., 2015; Li-Kroeger et al., 2018), which also support RMCE-based tag exchange at endogenous loci and for which large collections of lines are already publicly available, are not adequately discussed. These are arguably the closest comparators to ExTaSy, and the authors should explicitly address how their approach differs from and offers advantages over this existing framework, particularly given that MiMIC/CRIMIC insertions can also tag internal sites and thus avoid some of the terminus-specific complications described here.
__Response: __We will expand the introduction and the discussion to give more reference to other resources for endogenously and exogenously tagged genes in Drosophila and compare ExTaSy in greater detail with other methods, highlighting advantages and disadvantages of each and making clear that RMCE-based tag exchange and marker removal are not novel inventions.
Minor Comment
The labelling of sgRNA target sites in Figure 1 is inaccurate and should be corrected.
In Figure 1, the sgRNA target sites are annotated with triangles labelled "PAM synth." The presence of a PAM is necessary but not sufficient to define a target site; the label should therefore be changed to "target site" or an equivalent term. Additionally, the Methods section incorrectly expands PAM as "primary adjacent motif"; the correct expansion is "protospacer adjacent motif."
__Response: __The labelling in Figure 1 will be changed and the PAM abbreviation corrected.
Could the fly crossing scheme in Figure S3 be simplified?
In the scheme in Fig. S3 the second step seems to be intended to introduce the hs-Flp and vase-Int transgenes. Would it not be possible to already incorporate the Integrase into the swap fly line when it is made and the hs-Flp into the ExTaSy line, thereby saving one generation?
__Response: __This would in principle be possible; however, we prefer to keep the lines “clean” in case a tag exchange is not desired, and so this would require an initial crossing step. We therefore prefer the crossing scheme as it is.
Figure 1F has no call out in the main text.
__Response: __This will be corrected.
Line 155: What was the reason for the low survival rate? Is this likely to be indicative of a problem during marker removal, or a stochastic event as not all fly crosses are always productive (bad food, early death of flies, etc.)?
__Response: __This was a stochastic event. The fly line we used for expression of piggyBac transposase (BDSC_8285) is generally not growing well, and we could only use one eighth of all offspring to ensure correct segregation. We will make this clear in the text.
Line 160: What is the N number of "all cases"?
__Response: __This will be changed to “We performed Sanger sequencing for one established line for each of the 17 loci and confirmed clean excision of the piggyBac sites in all cases.”
Scale bars are missing in Fig. 3g,h.
__Response: __These will be included.
Line 219: The labeling of the panels got mixed up. Panel F does not show an immunostaining.
__Response: __The labeling will be corrected.
Line 226 and Fig. 3h: It is unclear what area is shown in the inlay. The overview image highlights three POIs, but none seem to fit the inlay.
__Response: __The images were indeed misleading as the inlay did not show a magnification of the same focal plane. We will show the inlay together with the overview of the corresponding focal plane as part of Supplementary Figure 5 and will amend the text accordingly.
Line 233: Why was the transgenic marker not removed? The authors want to highlight the easy and advantage of marker removal, so leaving in the marker is an odd choice.
__Response: __In this case, we observed that flies become homozygous even with the marker, so we assumed that a marker removal would not be necessary. We are currently performing additional experiments to remove the marker and repeat the staining, which we will submit with a revised version of the manuscript.
Line 250: Why was only one isoform of hth tagged? Without a rational this seems to be an odd choice, in particular since the authors seem to suggest in the introduction (Line 38) that a disadvantage of previous technologies is the tagging of only selected isoforms.
__Response: __While expanding the introduction (see comment #4), we will also rephrase it to highlight that current CRISPR-based methods (MiMIC and CRIMIC) are designed to tag all isoforms simultaneously or select isoforms, whereas overexpression constructs are limited to one isoform. In contrast, ExTaSy allows tagging of all isoforms that share a terminus. We will emphasize advantages and disadvantages in the discussion. In the case of hth, three different C-termini are annotated, and we are currently performing experiments to also tag the other termini and co-stain them with Ubx. We will submit the results in a revised version of the manuscript.
Reviewer #1 (Significance (Required)):
SIGNIFICANCE
ExTaSy assembles a set of well-established tools, namely CRISPR-mediated HDR, piggyBac-based marker excision, and φC31-mediated RMCE, into a unified, single-vector framework for endogenous protein tagging in Drosophila. The individual components have all been described and are in routine use in the field; the conceptual advance is therefore limited. Nevertheless, the integration of these features into a streamlined platform with accompanying automated design software represents a practical contribution that is likely to be of genuine utility to the Drosophila community, particularly for laboratories without specialist transgenesis infrastructure.
The possibility of tag exchange by fly crossing is the most distinctive feature of the system. However, as discussed above, this is currently demonstrated at only five loci with a single replacement tag, which limits the conclusions that can be drawn about its generality. More broadly, ExTaSy employs well-proven strategies throughout, which is a source of reliability but also means that the study does not incorporate more recent developments in the field. For example, approaches based on single-strand annealing, such as the recently described Seed/Harvest system (Aguilar et al., 2024), can achieve entirely scarless marker removal and thus circumvent the TTAA scar left by piggyBac excision, a limitation the authors themselves acknowledge may reduce expression at modified N-terminal loci. Similarly, the current system is restricted to N- and C-terminal tagging. Given that the goal of endogenous tagging is to minimally perturb protein function, and given the now widespread availability of high-quality protein structure predictions for the Drosophila proteome, a modern tagging platform might be expected to use structural modelling to identify optimal insertion sites irrespective of their location. These are not oversights that diminish the practical value of the current work, but highlight that this study does not always operate at the cutting edge of method development in this area. A brief discussion of these more recent developments in the context of ExTaSy's design choices would usefully situate the work within the broader landscape and help readers understand both what the system offers today and where improvements are likely to come from.
__Responses: __
Reviewer #2 (Evidence, reproducibility and clarity (Required)):
Summary
Hubbert et al. describes ExTaSy (Exchangeable Tagging System), a method for endogenous protein tagging in fruitflies. The technique attempts to address some limitations of current tagging strategies, such as non-physiological expression from transgenes, disruption of the target gene, and limited usefulness of a single tag type. The basic approach is not novel, rather it effectively incorporates ideas from several previously published methods:
- Crispr-based release of the HDR donor from the backbone in vivo (Kanca et al., 2019 and 2021).
- PBac scarless tagging (flycrisprdesign)
- In vivo RMCE to swap out tags (Nagarkar-Jaiswal et al., 2015) Although not novel, the authors show the completeness and effectiveness of the approach. They were able to tag genes across multiple chromosomes, with knock-in rates comparable to other approaches, and demonstrate tag swapping through RMCE. Overall, this work introduces a versatile and modular platform that combines several previous innovations into a single effective package.
Major comments
1.The manuscript would benefit from a more upfront discussion of how ExTaSy relates to existing methods. As currently written, the implies a higher degree of novelty than is warranted, since ExTaSy combine several previously established approaches, including, as already noted. While this is valuable, the authors should more clearly acknowledge in the abstract and introduction that the primary advance is the unification and streamlining of these existing technologies into a single platform, rather than the introduction of fundamentally new components.
__Response: __While we did cite most of the publications mentioned by the reviewer, we will make clearer that our system combines several previously established Drosophila systems and is not per se a novel invention. We will expand the introduction and discussion to reflect this and cite additional publications.
- *
2.Comparison to prior systems. The manuscript should include a direct comparison to existing tagging pipelines. For example: What practical steps are eliminated relative to prior approaches? Does ExTaSy reduce the number of injections or constructs required? How does the workflow differ in terms of time, cost, or technical expertise? This is vaguely addressed in the discussion, but more specific and clear comparisons would improve things for the reader who is trying to decide which method to use. For example, how does this strategy directly compare with the protein trap alleles described in Kanca et al., 2022? This could be done as a supplemental table.
__Response: __A similar concern has been raised by reviewer #1 (comment #4). We will expand the introduction and the discussion to compare ExTaSy in more detail with other methods, highlighting advantages and disadvantages of each.
3.Only 4 successful RMCE swaps are presented. This is too few to make a confident conclusion about the efficiency. The authors should do at least 4 more and include negative data.
__Response: __A similar point has been made by reviewer #1 (comment #3). We are in the process of expanding the number of fly stocks for which tags have been exchanged and will be able to provide a more rigorous characterization with an updated version of the manuscript.
4.Some discussion of the potential limitations of the linker from the residual att sites is needed.
__Response: __We will include this in the discussion.
Minor comments
1.It would be helpful to include a workflow overview figure summarizing the full pipeline.
__Response: __We will include such a figure in the supplement.
2.Line 124: Most genes we tagged at the C-terminus were homozygous viable, indicating limited detrimental effects. Need to include the numbers? What is "most genes."
__Response: __We will include these numbers in the text.
3.Briefly explain how the tested genes were selected (e.g., random, representative, biased toward certain classes), as this could affect interpretation of generalizability. If most of the genes are essential for viability, this makes the viability of tagged lines more impressive.
__Response: __This is an excellent suggestion, and we thank the reviewer for pointing this out. We have mainly tagged genes that are relevant for work in our labs and for collaborators, focusing almost entirely on transcription factor-encoding genes that are largely essential for normal development. We will include a brief discussion of this.
Reviewer #2 (Significance (Required)):
Significance
1.General assessment: This study presents ExTaSy, a practical and well-executed platform for endogenous protein tagging in Drosophila. Its main strength is the integration of multiple existing technologies into a streamlined workflow that enables tagging, marker removal, and tag swapping. The system is clearly functional and broadly applicable. However, the conceptual novelty is limited, and the manuscript should more explicitly frame the work as an engineering advance. Tagging and RMCE efficiencies are moderate.
2.Advance: ExTaSy represents a technical advance that combines CRISPR HDR tagging, piggyBac scarless editing, and RMCE into a single platform. The biggest improvement is the ability to tag once and flexibly swap tags via crosses, reducing the need for repeated genome engineering. This extends existing methods by improving experimental flexibility.
3.Audience: This work will primarily interest a specialized audience in Drosophila genetics, CRISPR technologies, and functional genomics, with broader relevance to researchers developing tagging systems in other model organisms.
4.Field of expertise: CRISPR screening, Drosophila genetics, functional genomics. No limitations on my ability to evaluate.
Reviewer #3 (Evidence, reproducibility and clarity (Required)):
This methods paper is targeting the long-standing ambition of how to most efficiently tag proteins at the endogenous gene locus in Drosophila. Since the invention of CRISPR-Cas9 many genes have been successfully modified in Drosophila, but the community is still lacking a large collection of tagged proteins under endogenous control made with the same method.
This manuscript is using a small tag, 3xHA, which supposedly is easier to integrate, and the design allows to then swap the tag with larger fluorescent tags, solely by fly crossing. Then, the dsRed or white markers, allowing identification, can be removed with a biggybac recombinase leaving only a small scar. However, attP/B/R scars do remain. Design and cloning appear straightforward. Overall, this is an interesting strategy.
However, the manuscript falls short in really describing the resource, apart from the cloning design. A more rigorous analysis of a number of lines should be presented to better judge if the strategy practically works. It is quite disappointing to see that only 2 or 3 genes/proteins were analysed here in a bit more detail. This does not sound like a very straightforward resource that aims to go large scale.
Major comments:
The important novelty here is not only the design that allows high-throughput cloning but more importantly that the tagged lines are actually correct and functional. To present this better, I suggest to rearrange Figure 1 to show the flow: 65 constructs cloned, 41 "successfully" inserted. Of how many the dsRed marker was removed, of how many expression or function was tested? Hence the reader knows about the current state of the resource. These numbers would be informative to have in the abstract, too.
__Response: __We will include these numbers in the abstract. Reviewer 2 asked for an overview figure of the workflow, which we will include as a supplementary figure, where we can also include numbers as suggested by this reviewer.
The 41 tagged gene insertions need at least some basic characterisation to verify that they are at the correct place or make a functional protein. Which genes were chosen? I do not see 41 genes tagged in the table provided. I supposed the N-terminal tags should initially be loss of function. Are the N-term lines lethal when inserted in an essential gene? Again, this could be shown in an overview, instead by a non-quantitative statement in the text.
__Response: __We have verified the insertion site of the lines with genotyping PCR. We will include a table to show in more detail which genes were tagged at which terminus, and which protein isoforms are captured by the respective tag.
- *
How many of the 41 tagged proteins are functional? The authors only provide information on Ubx-3xHA (functional) and Mef2-3xHA (non-functional), which I find weak.
__Response: __We will include this information in the table mentioned in the above comment.
Stainings are only shown for 2 proteins, Ubx-GFP and Exd-3xHA. How about the others?
__Response: __We are currently in the process of using ExTaSy to establish a library of tagged fly lines, which we intend to characterize in more detail and publish separately. For the current manuscript, we prefer to focus on the methodology of the tagging system itself.
I am not sure about how to calculate the transgenesis rates, but strictly speaking to ones that did not result in an insertion should also be counted for the statistics, I guess.
__Response: __There is indeed no commonly agreed upon way to calculate these rates, and it is done differently in different publications. We felt that metrics that discriminate between the overall success rate (i.e., all those injections that lead to transgenics) and the success rate within successful injections would be most useful. We will try to make clear in the text where we refer to all attempts and where we exclusively refer to the successful ones.
Minor comments:
The introduction states that ExTaSy would tag all isoforms of genes. However, I find this an overstatement, as for complex genes tagging at the one place cannot always label all isoforms, see the Hth line generated here (Iso E).
__Response: __This was indeed badly phrased and we will correct the wording also in response to reviewer #1 comment #14 to reflect that overexpression constructs are limited to a specific isoform, whereas ExTaSy enables simultaneous tagging of all isoforms that share a terminus.
Why does it matter on which chromosome the target gene is? This can be moved to supplement. I would rather like to know what the genes are.
__Response: __We presume that the reviewer refers to Figure 1, where we show the success rates for individual chromosomes. We felt that the lower success rate for injections targeting gene on chr3 (which is, as we describe, due to lower survival of the injection line) warranted this separation by chromosome. As stated above, we will include a list of tagged genes as a table.
**Referees cross-commenting**
I agree with the 2 other reviewer's points. In particular that the knock-in lines need better verifications. This was also my major point.
__Response: __As also stated for reviewer #1 comment #1, we have now begun to run whole-fragment PCRs for all loci to investigate this further and will report the results in a revised version of the manuscript.
Reviewer #3 (Significance (Required)):
The methodology presented here is per se not really new. The 3xP3-dsRed eye marker is standard, its removal by biggbac transposase has been done before and RMCE to change the tagging cassettes with attP/B is done since many years. The latter has the disadvantage to not be seamless, as one attR site remains, which is translated, the other attR site remains in the 5'- or 3'-UTR, which can have an effect. U6-driven sgRNA expression is also standard.
__Response: __We will make clearer that our system combines several previously established Drosophila systems and is not per se a novel invention. We will expand the introduction and discussion to reflect this and cite additional publications.
The design includes the sgRNA and the HDR template cassette in a single vector, which is smart and makes cloning straight forward. Again, the paper would be stronger if the list of all cloned clones would be listed (are 65 all that were clones or all that were injected?
__Response: __We will include this as a table.
As the authors do not rigorously test the function of the tagged genes, it is hard to judge how valuable the pipeline is. This can be easily solved by providing more data that support the easy, high-throughput exchange tagging pipeline that produces tagged Drosophila lines that are useful to the community.
__Response: __As stated above, we plan to publish a more detailed analysis of tagged lines as a separate resource paper. We will state in the manuscript which lines were homozygous viable before and after marker removal, which gives at least an indication of whether the tagged protein is functional.
Note: This preprint has been reviewed by subject experts for Review Commons. Content has not been altered except for formatting.
Learn more at Review Commons
This methods paper is targeting the long-standing ambition of how to most efficiently tag proteins at the endogenous gene locus in Drosophila. Since the invention of CRISPR-Cas9 many genes have been successfully modified in Drosophila, but the community is still lacking a large collection of tagged proteins under endogenous control made with the same method. This manuscript is using a small tag, 3xHA, which supposedly is easier to integrate, and the design allows to then swap the tag with larger fluorescent tags, solely by fly crossing. Then, the dsRed or white markers, allowing identification, can be removed with a biggybac recombinase leaving only a small scar. However, attP/B/R scars do remain. Design and cloning appear straightforward. Overall, this is an interesting strategy. However, the manuscript falls short in really describing the resource, apart from the cloning design. A more rigorous analysis of a number of lines should be presented to better judge if the strategy practically works. It is quite disappointing to see that only 2 or 3 genes/proteins were analysed here in a bit more detail. This does not sound like a very straightforward resource that aims to go large scale.
Major comments:
Minor comments:
Referees cross-commenting
I agree with the 2 other reviewer's points. In particular that the knock-in lines need better verifications. This was also my major point.
The methodology presented here is per se not really new. The 3xP3-dsRed eye marker is standard, its removal by biggbac transposase has been done before and RMCE to change the tagging cassettes with attP/B is done since many years. The latter has the disadvantage to not be seamless, as one attR site remains, which is translated, the other attR site remains in the 5'- or 3'-UTR, which can have an effect. U6-driven sgRNA expression is also standard. The design includes the sgRNA and the HDR template cassette in a single vector, which is smart and makes cloning straight forward. Again, the paper would be stronger if the list of all cloned clones would be listed (are 65 all that were clones or all that were injected?
As the authors do not rigorously test the function of the tagged genes, it is hard to judge how valuable the pipeline is. This can be easily solved by providing more data that support the easy, high-throughput exchange tagging pipeline that produces tagged Drosophila lines that are useful to the community.
Note: This preprint has been reviewed by subject experts for Review Commons. Content has not been altered except for formatting.
Learn more at Review Commons
Summary
Hubbert et al. describes ExTaSy (Exchangeable Tagging System), a method for endogenous protein tagging in fruitflies. The technique attempts to address some limitations of current tagging strategies, such as non-physiological expression from transgenes, disruption of the target gene, and limited usefulness of a single tag type. The basic approach is not novel, rather it effectively incorporates ideas from several previously published methods:
Major comments
1.The manuscript would benefit from a more upfront discussion of how ExTaSy relates to existing methods. As currently written, the implies a higher degree of novelty than is warranted, since ExTaSy combine several previously established approaches, including, as already noted. While this is valuable, the authors should more clearly acknowledge in the abstract and introduction that the primary advance is the unification and streamlining of these existing technologies into a single platform, rather than the introduction of fundamentally new components. 2.Comparison to prior systems. The manuscript should include a direct comparison to existing tagging pipelines. For example: What practical steps are eliminated relative to prior approaches? Does ExTaSy reduce the number of injections or constructs required? How does the workflow differ in terms of time, cost, or technical expertise? This is vaguely addressed in the discussion, but more specific and clear comparisons would improve things for the reader who is trying to decide which method to use. For example, how does this strategy directly compare with the protein trap alleles described in Kanca et al., 2022? This could be done as a supplemental table. 3.Only 4 successful RMCE swaps are presented. This is too few to make a confident conclusion about the efficiency. The authors should do at least 4 more and include negative data. 4.Some discussion of the potential limitations of the linker from the residual att sites is needed.
Minor comments
1.It would be helpful to include a workflow overview figure summarizing the full pipeline. 2.Line 124: Most genes we tagged at the C-terminus were homozygous viable, indicating limited detrimental effects. Need to include the numbers? What is "most genes." 3.Briefly explain how the tested genes were selected (e.g., random, representative, biased toward certain classes), as this could affect interpretation of generalizability. If most of the genes are essential for viability, this makes the viability of tagged lines more impressive.
1.General assessment: This study presents ExTaSy, a practical and well-executed platform for endogenous protein tagging in Drosophila. Its main strength is the integration of multiple existing technologies into a streamlined workflow that enables tagging, marker removal, and tag swapping. The system is clearly functional and broadly applicable. However, the conceptual novelty is limited, and the manuscript should more explicitly frame the work as an engineering advance. Tagging and RMCE efficiencies are moderate. 2.Advance: ExTaSy represents a technical advance that combines CRISPR HDR tagging, piggyBac scarless editing, and RMCE into a single platform. The biggest improvement is the ability to tag once and flexibly swap tags via crosses, reducing the need for repeated genome engineering. This extends existing methods by improving experimental flexibility. 3.Audience: This work will primarily interest a specialized audience in Drosophila genetics, CRISPR technologies, and functional genomics, with broader relevance to researchers developing tagging systems in other model organisms. 4.Field of expertise: CRISPR screening, Drosophila genetics, functional genomics. No limitations on my ability to evaluate.
Note: This preprint has been reviewed by subject experts for Review Commons. Content has not been altered except for formatting.
Learn more at Review Commons
Summary
Hubbert and colleagues describe ExTaSy, a CRISPR-Cas9-based platform for the endogenous tagging of proteins in Drosophila melanogaster. The system combines several established molecular tools into a single-vector framework: homology-directed repair (HDR) for the insertion of a 3XHA tag at the endogenous locus, piggyBac transposase-mediated near-scarless removal of a transgenic selection marker, and φC31 integrase-mediated recombination-mediated cassette exchange (RMCE) for subsequent tag swapping. The authors demonstrate the system across a set of 65 genomic loci and provide a bioinformatic pipeline to automate guide RNA and homology arm design.
Major Comments
The authors state that correct insertions were confirmed using "two PCRs per inserted fragment done with primers binding to the 5' and 3' ends of the inserted DNA and corresponding gene-specific validation primers." This strategy is well known to produce false positives, as it cannot distinguish correctly targeted single-copy integrants from concatemeric insertions at the target locus (e.g. Skryabin et al., 2020). The current standard for validating CRISPR-mediated knock-ins requires PCR amplification using primers that anneal outside the homology arms and span the entire inserted cassette. These reactions must be performed under conditions that minimise the formation of PCR chimeras, specifically low cycle numbers and use of a high-processivity polymerase. The authors should either provide data from such experiments for their characterised lines, or clearly acknowledge this limitation and qualify their efficiency estimates accordingly (see related point 2 below). 2. Reported efficiency metrics do not adequately distinguish correctly targeted integrants from marker-positive flies.
A related concern is that many of the efficiency parameters reported in the manuscript appear to be based solely on the detection of the marker cassette. The 63.1% overall success rate, for example, seemingly reflects the recovery of DsRed-positive flies rather than of sequence validated, single-copy, on-target integrants. These are fundamentally different quantities, with only the latter being of practical value for the users of the described technique. The authors should either provide data that properly accounts for correct integration, or more carefully define what each reported metric represents and explicitly acknowledge the limitations of using marker presence as a proxy for successful knock-in. 3. The characterisation of tag exchange requires expansion or more careful framing of its scope.
The possibility of exchanging tags through fly crosses rather than repeated microinjections is, in the view of this reviewer, the most practically useful feature of ExTaSy and the aspect most likely to drive community adoption. It is therefore important that this feature is characterised with sufficient rigour to allow prospective users to assess its reliability. In the current manuscript, tag exchange has been demonstrated at only five loci using a single replacement tag (sfGFP). The dataset includes one outright failure (the Met C-terminus) and one instance of an unexpected 9 bp insertion at the recombination site, leaving the success rates and failure modes across a broader range of loci and tags uncharacterised. The authors should either expand the tag exchange experiments to cover a more representative set of conditions, or frame the current data explicitly as a proof of concept and limit their conclusions about the practical utility of tag exchange accordingly. In either case, the value of this work to the community would be substantially increased if a collection of donor lines carrying the most commonly used tags for different applications, as the authors themselves enumerate in the Discussion, were generated and deposited at a public stock centre such as the VDRC concurrent with publication. On this note, it is also worth flagging that at present the plasmids described in this study have not yet been deposited at Addgene or the European Plasmid Repository, and that fly lines are available only on request. For a methods paper aimed at community adoption, deposition of reagents in publicly accessible repositories at the time of publication is the expected standard. 4. The Introduction should better reflect the current state of the field, including explicit comparison with MiMIC and CRIMIC.
The introduction would benefit from a clearer distinction between transgene-based approaches that introduce additional gene copies and true CRISPR-mediated knock-ins at the endogenous locus. As it stands, the discussion of prior methods does not sufficiently acknowledge that CRISPR-based knock-in is already the standard approach in Drosophila, and that the individual techniques employed in ExTaSy are well established. Notably, the MiMIC and CRIMIC systems (Nagarkar-Jaiswal et al., 2015; Li-Kroeger et al., 2018), which also support RMCE-based tag exchange at endogenous loci and for which large collections of lines are already publicly available, are not adequately discussed. These are arguably the closest comparators to ExTaSy, and the authors should explicitly address how their approach differs from and offers advantages over this existing framework, particularly given that MiMIC/CRIMIC insertions can also tag internal sites and thus avoid some of the terminus-specific complications described here.
Minor Comment
In Figure 1, the sgRNA target sites are annotated with triangles labelled "PAM synth." The presence of a PAM is necessary but not sufficient to define a target site; the label should therefore be changed to "target site" or an equivalent term. Additionally, the Methods section incorrectly expands PAM as "primary adjacent motif"; the correct expansion is "protospacer adjacent motif." 6. Could the fly crossing scheme in Figure S3 be simplified?
In the scheme in Fig. S3 the second step seems to be intended to introduce the hs-Flp and vase-Int transgenes. Would it not be possible to already incorporate the Integrase into the swap fly line when it is made and the hs-Flp into the ExTaSy line, thereby saving one generation? 7. Figure 1F has no call out in the main text. 8. Line 155: What was the reason for the low survival rate? Is this likely to be indicative of a problem during marker removal, or a stochastic event as not all fly crosses are always productive (bad food, early death of flies, etc.)? 9. Line 160: What is the N number of "all cases"? 10. Scale bars are missing in Fig. 3g,h. 11. Line 219: The labeling of the panels got mixed up. Panel F does not show an immunostaining. 12. Line 226 and Fig. 3h: It is unclear what area is shown in the inlay. The overview image highlights three POIs, but none seem to fit the inlay. 13. Line 233: Why was the transgenic marker not removed? The authors want to highlight the easy and advantage of marker removal, so leaving in the marker is an odd choice. 14. Line 250: Why was only one isoform of hth tagged? Without a rational this seems to be an odd choice, in particular since the authors seem to suggest in the introduction (Line 38) that a disadvantage of previous technologies is the tagging of only selected isoforms.
ExTaSy assembles a set of well-established tools, namely CRISPR-mediated HDR, piggyBac-based marker excision, and φC31-mediated RMCE, into a unified, single-vector framework for endogenous protein tagging in Drosophila. The individual components have all been described and are in routine use in the field; the conceptual advance is therefore limited. Nevertheless, the integration of these features into a streamlined platform with accompanying automated design software represents a practical contribution that is likely to be of genuine utility to the Drosophila community, particularly for laboratories without specialist transgenesis infrastructure.
The possibility of tag exchange by fly crossing is the most distinctive feature of the system. However, as discussed above, this is currently demonstrated at only five loci with a single replacement tag, which limits the conclusions that can be drawn about its generality. More broadly, ExTaSy employs well-proven strategies throughout, which is a source of reliability but also means that the study does not incorporate more recent developments in the field. For example, approaches based on single-strand annealing, such as the recently described Seed/Harvest system (Aguilar et al., 2024), can achieve entirely scarless marker removal and thus circumvent the TTAA scar left by piggyBac excision, a limitation the authors themselves acknowledge may reduce expression at modified N-terminal loci. Similarly, the current system is restricted to N- and C-terminal tagging. Given that the goal of endogenous tagging is to minimally perturb protein function, and given the now widespread availability of high-quality protein structure predictions for the Drosophila proteome, a modern tagging platform might be expected to use structural modelling to identify optimal insertion sites irrespective of their location. These are not oversights that diminish the practical value of the current work, but highlight that this study does not always operate at the cutting edge of method development in this area. A brief discussion of these more recent developments in the context of ExTaSy's design choices would usefully situate the work within the broader landscape and help readers understand both what the system offers today and where improvements are likely to come from.
So, I fear the answer is that there is nothing practical to be done, but if anyone has any ideas of how to lighten the dark keytops, I'm all ears. My only thought is the risky move of printing new papers, but I just know I'd get the size and font wrong.But after years of neglect, I think she deserves to feel beautiful again. She's royalty, after all.
reply to Zachary Thede at https://www.facebook.com/groups/721704878218903/posts/3075801049475929
It's definitely doable! The only way to do this is to remove the keyrings (preferably with a keyring pliers, otherwise it's incredibly tedious) and to physically replace the key legends with new ones. Richard Polt has some of the process described here as well as as high resolution scans that you can use to print out keys. https://writingball.blogspot.com/2016/10/legendary.html
Ames Supply Company used to sell keycards for doing this. Some of them had colors including green, so keep this in mind if you try something like creating rainbows across your keyboard or other visual fun. https://typewriterdatabase.com/1960-Ames_Gen_Cat_10-March.misc-supplies.manual
Our friend Lucas Dul of Chicago Typewriter has a great YouTube video of the tool and some of the process: https://www.youtube.com/watch?v=jYHrBjfQxpM
As a fun example, Heiko Stolten recently did this on a Remington using custom made legends that use the font from the Netflix series Wednesday: https://www.facebook.com/groups/TypewriterCollectors/posts/10163537426144678/ If you ask nicely, they've got the original files if you need them for printing out .
Good luck!
reply to u/coffeetoffee92 at https://reddit.com/r/ClassicalEducation/comments/1sxcw5m/well_trained_mind_ancient_history_facts_for/<br /> RE: rote memorization of historical dates
I've not read Bauer, but I'll suspect that she doesn't teach "serious" rhetoric, much less the fourth canon: memory. She's likely relying on the post-Ramus (15th Century) method of rote memorization rather than the methods used from ancient Greece through Augustine, Aquinas, and Llull.
I'd start with some mnemonic methods like the method of loci or the Major System to make it much easier for the kid to begin scaffolding memory techniques and make it easier for them to memorize those facts you're talking about.
For the memory piece, I'd start first with one of the most wide-ranging:
Kelly, Lynne. 2019. Memory Craft: Improve Your Memory Using the Most Powerful Methods from around the World. Pegasus Books.
Many of the older classics on memory also include long lists of historically important dates to use. Grey is a good example:
Grey, Richard (1694-1771). 1799. Memoria Technica, or, A New Method of Artificial Memory. W. Lowndes. https://archive.org/details/memoriatechnica03greygoog/page/n2/mode/2up.
Janie experiences a sense of freedom and independence after Joe’s death which is finally symbolized by removing the head rag.
Janie has to put on a face feeling sad that Joe is gone tho in the end she feels free
Janie finally has freedom. She burns all the head rags that Jody forced her to wear n wears her hair in a long braid
She sent her face to Joe’s funeral, and herself went rollicking with the springtime across the world
I’m glad Janie feels happier without Joe. She still kept it in herself but knows she feels more freedom
She is pretending to mourn over her now dead husband to show the townsfolk that she “really cares” about him and in the end she is actually enjoying her freedom and independence.
When Joe died, Janie began to reflect on their relationship and now understood the limitations he placed on her.
After that night Jody moved his things and slept in a room downstairs. He didn’t really hate Janie, but he wanted her to think so. He had crawled off to lick his wounds. They didn’t talk too much around the store either. Anybody that didn’t know would have thought that things had blown over, it looked so quiet and peaceful around. But the stillness was the sleep of swords.
Jody and Janie are not okay. They are quiet but there is like hidden anger and tension between them
When he is coming to his end Janie tries to tell him what she was going through in this relationship and he dies in the end when they were arguing at the end she takes her rag out of her hair showing independence growing within herself.
Janie feels increasingly silenced by Joe that reveals the imbalance of their relationship.
Janie is realizing the disrespect nut still afraid to speak up
Janie has been realizing that Joe is not letting her talk when she tries to stand up for herself when the men were saying awful things about and the women. Janie is standing up for herself no matter what she keeps moving forward.
Janie loved the conversation and sometimes she thought up good stories on the mule, but Joe had forbidden her to indulge.
This is showing how Joe is beginning to be controlling and won’t allow Janie to do certain things.
Starks establishes control in Eatonville, and his dominance over Janie shows her voice is being suppressed in the marriage.
Accessible from Web, Gemini and Gopher.
This is a category error. "Web" does not mean "HTTP(S)"; "Gopher" and "Gemini" are in fact part of the Web (subspaces).
A Web browser that exclusively browses Gopher- and/or Geminispace is still a Web browser (the same as a Web browser that exclusively supports HTTP(S) and eschews Gopher and Gemini and e.g. FTP).
Communicating Anger
this the shit we need
The major tradition is found in the twelfth-century LiberLandavensis and tells how Lucius (Celticised as Lleufer Mawr, 'Great Splen-dour'-a convention deriving from Nennius) sent Elvanus and Medwinus asambassadors to Rome in the year 156 to receive the Christian faith. On theirreturn they converted the king and his magnates. It is the later William ofMalmesbury who names Phaganus and Deruvianus as missionary preacherssent from Rome, and Jocelyn of Furness who goes on to extend the list ofapocryphal Archbishops from Elfan to the time of Augustine! A group of dedi-cations in the Llandaff area testify to the local roots of this t
INTERESTING!!!! St Lucius was english, but had a particularly strong tradition in Wales!!!
The Ramayana
The concept of a hero in the Ramayana is heavily determined by the gendered expectations of Rama, whose identity as a hero is used to enact male supremacy and female chastity in an interconnection with each other. His bravery is characterized not just by being strong and performing his duties (dharma), but by his power to contain and maintain the chastity of Sita. Trial by fire (Agni Pariksha) turns out to be a symbolic act wherein the authority of morality of Rama is proven by means of Sita's body, which is a sufferer, which helps to reinforce a patriarchal society where the suffering of women is accepted as a portion of heroic order. Sita is made at the perfect woman; loyal, self-sacrificing, and obedient, and the deeds of Rama are morally justified in the context of duty. Basically, this imbalance constructs the meaning of heroism in this text, as it is organized through gender roles. These hierarchies are supported by the use of elevated and formal diction linguistically. The reference to righteousness and duty cushions the moral conflict in the way Rama treats Sita, indicating that the decisions to be made during the translation process are aimed at preserving the patriarchal culture, which the epic promotes, instead of questioning it. # Heroism #Ramayana #worldlit-lit211-SS2024 #GenderPolitics #HypothesisClass License: CC BY-NC
Sita Sings the Blues
By retelling the Ramayana by making Sita the storyteller instead of Rama, Sita Sings the Blues redefines heroism by disrupting the established heroic conventions. The film does not emphasize the deeds of Rama as being beyond doubt dharma, but it focuses on the emotional impact they have on Sita, and the misery they cause her. This redefining upsets the notion that being morally obligated means being a hero. Sita is no longer a passive icon of purity but an emotional, rich, and complex character. Her point of view reveals the unequal aspect of the initial story, in which male honor is valued more than the experience of a woman. The adaptation is a critique of the patriarchal reasoning of heroism that dictates sacrifice and control by foregrounding her voice. The modern dialogue, jazz music, and humor are used linguistically to introduce a contrast to the somber mood of the epic. This change of style is an indication that the story is being rewritten as opposed to being kept. The use of informal language and irony is aimed at challenging, not supporting, conventional gender hierarchies. The adaptation in general shows that heroism is not a given concept but a culturally made and subject to redefinition. #Adaptation #worldlit-lit211-SS2024 #GenderRoles #Feminism #HypothesisClass. License: CC BY-NC
Editors Assessment:
This data paper is a genome note presenting the assembly of Porites harrisoni, a stony coral species endemic to the thermally extreme southern Persian Gulf. Using ONT PromethION long nanopore reads the final genome size encompassed 626.7 Mb across 1,883 contigs, achieving a BUSCO completeness of 86.3%. This revealed significant repeat content, comprising 59.23% of the nuclear genome and highlighting a diploid structure with predominant homozygosity. A total of 27,823 protein-coding genes were annotated from this assembly, facilitating discussions on thermal resilience under climate change. The research underscores the genomic framework supporting adaptive capacities in corals, with implications for evolutionary biology and conservation science, especially in context to ongoing ocean warming.
This evaluation refers to version 1 of the preprint
AbstractWe present a genome assembly from the coral species Porites harrisoni from the southern Persian/Arabian Gulf, the hottest ocean basin where corals live. The assembly is 626.7 Mb in size, spanning 1,883 contigs with a contig N50 of 807.4 kb, including a single-contig mitochondrial genome. The assembly has a BUSCO completeness of 86.3% (single = 72.5%, duplicated = 13.7%, fragmented = 1.2%, missing = 12.5%) using the eukaryota_odb10 reference set (n = 255). A total of 59.23% of the nuclear genome consists of repeats, comprising 15.89% retroelements, 10.00% DNA transposons, and 31.71% unclassified repeats. Gene annotation of this nuclear genome assembly identified 27,823 protein-coding genes. The mitogenome has an assembly size of 18,639 bp with 13 protein-coding genes as well as 2 tRNAs and 2 rRNAs. The genome of P. harrisoni provides a valuable genomic resource of a coral from an extreme environment, which will enable comparative analyses, enhancing our understanding of the genomic architecture underlying thermal resilience. Such comparisons will contribute to elucidating the evolutionary basis of heat tolerance and adaptive capacity of corals in the context of rapid climate change.
This work has now been published in GigaByte under a CC-BY 4.0 license: https://doi.org/10.46471/gigabyte.174
Reviewer 1. Oleg Simakov
Overall, a very useful resource, the manuscript is clearly written and the data is consistently described. The genome assembly and annotation is well executed given the available data. Two minor suggestions: - include a sentence or two on potential genome assembly improvements (and if any pitfalls can be encountered), for example using HiC data and/or long-read (re)sequencing. - specify explicitly which "shorter reads" (Nanopore?) were used for ONT polishing in the assembly section and their amount.
Reviewer 2. Yue Song
Is there sufficient detail in the methods and data-processing steps to allow reproduction? Yes. The authors provide a standard and well-documented methodology: assembly, transposable-element annotation, and gene structural annotation all rely on widely used software and established pipelines. The parameter settings and post-assembly processing steps have been described. Is there sufficient data validation and statistical analyses of data quality? No. With respect to data quality, the authors note that the number of annotated protein-coding genes in Porites harrisoni is lower than that reported for other congeneric species, yet they offer no further discussion. This discrepancy is striking and warrants clarification: is it a biological reality reflecting gene loss or genome compaction in this species, or is it an artefact arising from differences in annotation pipelines, gene-model thresholds, or assembly completeness among studies? A concise comparative analysis—and explicit acknowledgment of methodological variables—would help readers properly interpret this genomic feature. Is there sufficient information for others to reuse this dataset or integrate it with other data? No. Although the authors present a valuable and rare coral genome assembly, the manuscript appears to offer only basic genomic data. There is limited elaboration on the declared aim of illuminating the molecular basis of thermal tolerance. In particular, after the structural annotation of protein-coding genes, no systematic functional characterization (e.g., GO/KEGG enrichment, comparative analyses of heat-stress-related gene families, or symbiosis-related pathways) is provided. This section seems to have been undertaken but is neither described nor discussed in the current version. Additional Comments: (1) The quality of the figures could be further improved. Specifically, in Figure 1, the phylogenetic tree appears to be hand-drawn and lacks the polish typically seen in published phylogenetic analyses. It is recommended that the authors refer to examples from other studies for guidance on improving visual quality. Additionally, the tree currently lacks common indicators of phylogenetic robustness, such as bootstrap values or other support metrics. (2) In panel A (Figure 1), species highlighted in brown are presumably those included in this study. It would be helpful to add a legend clarifying the meaning of the different font colors to improve readability. Furthermore, the labeling format for sub-figures is inconsistent across the manuscript—for example, “Figure 1A, B” in one instance and “Figure 2A, B” in another. Standardizing the labeling format throughout would enhance clarity and professionalism. (3) Line 273: There appears to be an error in the unit used for “average protein length.” If this value refers to the length of the encoded proteins, it should not be expressed in base pairs (bp). Please clarify the meaning and use the appropriate unit (e.g., amino acids).
If you can’t see the video, it shows someone with light skin putting their hand under a soap dispenser, and soap comes out. Then a person with dark skin puts their hand under a soap dispenser, and nothing happens. The person with dark skin then puts a white paper towel on their hand and then when they put their hand under the soap dispenser, soap comes out. When the person with dark skin takes off the white paper towel, the soap dispenser won’t work for them anymore.
In my GEOG 294 class from last quarter, we went over many different examples of racially biased technology similar to this. One of the main examples is how facial identification technology doesn't effectively work on the faces of people of color. I think that it is important to consider who made a technology as their biases can show up in it.
If a building only has staircases to get up to the second floor (it was built assuming everyone could walk up stairs), then someone who cannot get up stairs has a disability in that situation. If a physical picture book was made with the assumption that people would be able to see the pictures, then someone who cannot see has a disability in that situation. If tall grocery store shelves were made with the assumption that people would be able to reach them, then people who are short, or who can’t lift their arms up, or who can’t stand up, all would have a disability in that situation. If an airplane seat was designed with little leg room, assuming people’s legs wouldn’t be too long, then someone who is very tall, or who has difficulty bending their legs would have a disability in that situation.
I think this broaden my view of disability. I thought disability was more like a thing that is diagnosed from the hospital, but it is also for the cases when someone gets disadvantage in various situations.
If an airplane seat was designed with little leg room, assuming people’s legs wouldn’t be too long, then someone who is very tall, or who has difficulty bending their legs would have a disability in that situation.
I found this example to be very interesting in the broadening of the classical term disability. So, because someone is uncomfortable in a situation, that can be considered a disability. For example, a tall person on a long car ride is that still considered? I think that these situations are part of life, and are intrinsic characteristics; they are features, not bugs. A shorter person might deal with different problems compared to a tall person. So by that definition, is everyone disabled in their own right?
Disabilities can even be situational disabilities, like the loss of fine motor skills when wearing thick gloves in the cold, or trying to watch a video on your phone in class with the sound off, or trying to type on a computer while holding a baby.
Before reading this, I had never considered that there would be such a thing as "situational disabilities." I had considered temporary disabilities, but never the idea that certain situational limitations could be considered a disability. I have personal experience with situational disabilities because, there have been times when my ability to perform certain tasks has become limited.
Some will suggest color coding, but I've never understood it as it limits you to about a dozen topics and it presupposes that you'll be interested in those same topics for decades to the exclusion of others. It wholly lacks flexibility.
I use a card index much like H. Ross Ashby. Start with index cards labeled A-Z, then add topics as you encounter them and add a volume number and page number.
Thus:
C<br /> commonplace books: 1-3, 1-88, 4-67 (see also 'Locke, John')<br /> crickets: 2-45<br /> caviar: 3-22, 3-25 (see also 'eggs')
When you've got a handful of cards for each letter it can be useful to separate things out (a la John Locke) as "CA", "CE", "CI", "CO", "CU" and re-alphabetize to make finding things easier and quicker. At this point it can also be helpful to add tabbed dividers to find the "C" section more quickly. Eventually you may have a single card (or three) with an individual heading for topics you write about frequently. (Naturally you could do a single card for each topic as you start, but it often makes the search process take longer and you'll probably have a lot of lonely, unused cards. It also tends to stifle serendipity and creativity because you're not scanning through your topics as thoroughly or frequently.)
I tend to write index words either in the margins of my commonplace or underline them with a red pencil within the text to make finding things on the page easier upon later search.
You can start small with a recipe card box and eventually move your way up to something more industrial as you need it. There are also lots of options in between.
Indexing can be an art and was also a great science (before Google made everyone lazy), so there are some useful handbooks on the topic below:
Other related ideas: https://boffosocko.com/research/zettelkasten-commonplace-books-and-note-taking-collection
reply to u/commonbankpen at https://reddit.com/r/commonplacebook/comments/1syayru/how_do_you_index/
New users
changes
So basically new users will not see the 7 day trial FUL after April 14. However, those where in the process of trial before the 14th and those on a paid plan before the 14 when the trial or plan expires they will automatically be restricted to a free plan and it's limitation (until they pay for a paid plan).
Those will locked dashboards before will remain locked until they pay
he began to talk about her age all the time, as if he didn’t want her to stay young while he grew old. It was always “You oughta throw somethin’ over yo’ shoulders befo’ you go outside. You ain’t no young pullet no mo’. You’se uh ole hen now.”
This seems like he is becoming grossed out about the fact that she is getting older. I feel like Joe wants Janie to stay young
eLife Assessment
This timely and fundamental study presents an innovative iPSC based co-culture system to model Kupffer cell-hepatocyte interactions and hepatotoxicity, demonstrating reciprocal acquisition of tissue identity and enhanced hepatocyte maturation. The work is convincing, supported by well-executed methodology and functional validation, including physiologically relevant, concentration-dependent hepatotoxic responses. The research approach is promising and of broad interest, further clarification of experimental design and interpretation may strengthen its impact.
Reviewer #1 (Public review):
The manuscript presents a compelling new in vitro system based on isogenic co-cultures of human iPSC-derived hepatocytes and macrophages, enabling the modelling of hepatic immune responses with unprecedented physiological relevance. The authors show that co-culture leads to enhanced maturation of hepatocytes and tissue-resident macrophage identity, which cannot be achieved through conditioned media alone. Using this system, they functionally validate immune-driven hepatotoxic responses to a panel of drugs and compare the system's predictive power to that of monocyte-derived macrophages. The results underscore the necessity of macrophage-hepatocyte crosstalk for accurate modelling of liver inflammation and drug toxicity in vitro. The manuscript is clearly written and addresses a key limitation in liver organoid systems: the lack of immune complexity and tissue-specific macrophage imprinting.
Strengths:
• Novelty and Relevance: The study presents a highly innovative co-culture system based on isogenic human iPSCs, addressing an unmet need in modelling immune-mediated hepatotoxicity.
• Mechanistic Insight: The reciprocal reprogramming between iHeps and iMacs, including induction of KC-specific pathways and hepatocyte maturation markers, is convincingly demonstrated.
• Functional Readouts: The application of the model to detect IL-6 responses to hepatotoxic compounds enhances its translational relevance.
Weaknesses:
The co-culture model with monocyte-derived macrophages is not fully characterised, making comparisons less informative.
Reviewer #3 (Public review):
Summary:
In this study, the authors establish a human in vitro liver model by co-culturing induced hepatocyte-like cells (iHEPs) with induced macrophages (iMACs). Through flow cytometry-based sorting of cell populations at days 3 and 7 of co-culture, followed by bulk RNA sequencing, they demonstrate that bidirectional interactions between these two cell types drive functional maturation. Specifically, the presence of iMACs accelerates the hepatic maturation program of iHEPs, while contact-dependent cues from iHEPs enhance the acquisition of Kupffer cell identity in iMACs, indicating that direct cell-cell interactions are critical for establishing tissue-resident macrophage characteristics.
Functionally, the authors show that iMAC-derived Kupffer-like cells respond to pathological stimuli by producing interleukin-6 (IL-6), a hallmark cytokine of hepatic immune activation. When exposed to a panel of clinically relevant hepatotoxic drugs, the co-culture system exhibited concentration-dependent modulation of IL-6 secretion consistent with reported drug-induced liver injury (DILI) phenotypes. Notably, this response was absent when hepatocytes were co-cultured with monocyte-derived macrophages from peripheral blood, underscoring the liver-specific phenotype and functional relevance of the iMAC-derived Kupffer-like cells. Collectively, the study proposes this co-culture platform as a more physiologically relevant model for interrogating macrophage-hepatocyte crosstalk and assessing immune-mediated hepatotoxicity in vitro.
Strengths:
A major strength of this study lies in its systematic dissection of cell-cell interactions within the co-culture system. By isolating each cell type following co-culture and performing comprehensive transcriptomic analyses, the authors provide direct evidence of bidirectional crosstalk between iMACs and iHEPs. The comparison with single-culture controls is particularly valuable, as it clearly demonstrates how co-culture enhances functional maturation and lineage-specific gene expression in both cell types. This approach allows for a more mechanistic understanding of how hepatocyte-macrophage interactions contribute to the acquisition of tissue-specific phenotypes
Weaknesses:
(1) Overreliance on bulk RNA-seq data:
The primary evidence supporting cell maturation is derived from bulk RNA sequencing, which has inherent limitations in resolving heterogeneous cellular states and functional maturation. The conclusions regarding hepatocyte maturation are based largely on increased expression of a subset of CYP genes and decreased AFP levels - markers that, while suggestive, are insufficient on their own to substantiate functional maturation. Additional phenotypic or functional assays (e.g., metabolic activity, protein-level validation) would significantly strengthen these claims.
(2) Insufficient characterization of input cell populations:
The manuscript lacks adequate validation of the cellular identities prior to co-culture. Although the authors reference previously published protocols for generating iHEPs and iMACs, it remains unclear whether the cells used in this study faithfully retain expected lineage characteristics. For example, hepatocyte preparations should be characterized by flow cytometry for ALB and AFP expression, while iMACs should be assessed for canonical macrophage markers such as CD45, CD11b, and CD14 before co-culture. Without these baseline data, it is difficult to interpret the magnitude or significance of any co-culture-induced changes.
(3) Quantitative assessment of IL-6 production is insufficient:
The analysis of drug-induced IL-6 responses is based primarily on relative changes compared to control conditions. However, percentage changes alone are inadequate to capture the biological relevance of these responses. Absolute cytokine production levels - particularly in response to LPS stimulation - should be reported and directly compared to PBMC-derived macrophages to determine whether iMAC-derived Kupffer-like cells exhibit enhanced cytokine output. Moreover, the Methods section should clearly describe how ELISA results were normalized or corrected to account for potential differences in cell number, viability, or culture conditions.
(4) Unclear mechanistic interpretation of IL-6 modulation:
The observed changes in IL-6 production upon drug treatment cannot be interpreted solely as evidence of Kupffer cell-specific functionality. For instance, IL-6 suppression by NSAIDs such as diclofenac is well known to result from altered prostaglandin synthesis due to COX inhibition, while leflunomide's effects are linked to metabolite-induced modulation of immune cell proliferation and broader cytokine networks. These mechanisms are distinct from Kupffer cell identity and may not directly reflect liver-specific macrophage function. Consequently, changes in IL-6 secretion alone - particularly without additional mechanistic evidence or analysis of other cytokines - are insufficient to conclude that co-culture with hepatocytes drives the acquisition of bona fide Kupffer cell maturity.
Reviewers comments to revised manuscript.
The authors successfully established an isogenic, iPSC-derived human liver co-culture model to investigate the role of hepatocyte-macrophage interactions in driving Kupffer cell (KC) identity and hepatocyte maturation. By utilizing a single genetic background, the authors effectively minimized the experimental variability often encountered in non-isogenic systems. A significant highlight of this work is the demonstration that direct co-culture-as opposed to conditioned media alone-is a primary driver for critical KC identity markers such as ID1 and ID3. Furthermore, the model's ability to recapitulate complex clinical IL-6 responses to known hepatotoxicants where standard models have failed underscores its potential utility for early-stage DILI screening. However, there are significant methodological concerns regarding the data analysis. While the study compares four or five distinct experimental groups (e.g., Day 0, Day 7, Day 3 co-culture, and Day 7 co-culture), the authors utilized Student's t-tests for these comparisons. This approach does not account for the multiple comparisons problem and increases the risk of Type I errors. Additionally, while IL-6 secretion is used as a primary functional readout, the individual mechanisms behind these drug responses were not explored experimentally. Finally, Pearson correlation analysis indicates that the iMacs remain poorly correlated with actual in vivo human embryonic liver macrophages, suggesting that the "imprinting" of true KC identity remains incomplete.
Author response:
The following is the authors’ response to the original reviews.
Public Reviews:
Reviewer #1 (Public review):
The manuscript presents a compelling new in vitro system based on isogenic co-cultures of human iPSC-derived hepatocytes and macrophages, enabling the modelling of hepatic immune responses with unprecedented physiological relevance. The authors show that co-culture leads to enhanced maturation of hepatocytes and tissue-resident macrophage identity, which cannot be achieved through conditioned media alone. Using this system, they functionally validate immune-driven hepatotoxic responses to a panel of drugs and compare the system's predictive power to that of monocyte-derived macrophages. The results underscore the necessity of macrophage-hepatocyte crosstalk for accurate modelling of liver inflammation and drug toxicity in vitro.
The manuscript is clearly written and addresses a key limitation in liver organoid systems: the lack of immune complexity and tissue-specific macrophage imprinting. Nevertheless, several conclusions would benefit from a more careful interpretation of the data, and some important controls or explanations are missing, particularly in the flow cytometry gating strategies, stress marker validation, and cluster interpretations.
Strengths:
(1) Novelty and Relevance: The study presents a highly innovative co-culture system based on isogenic human iPSCs, addressing an unmet need in modelling immune-mediated hepatotoxicity.
(2) Mechanistic Insight: The reciprocal reprogramming between iHeps and iMacs, including induction of KC-specific pathways and hepatocyte maturation markers, is convincingly demonstrated.
(3) Functional Readouts: The application of the model to detect IL-6 responses to hepatotoxic compounds enhances its translational relevance.
Weaknesses:
(1) Several key claims, particularly those derived from PCA plots and DEG analyses, are overinterpreted and require more conservative language or further validation.
We agree that PCA does not allow for maturation trajectories and mentioned that it was a hypothesis that the co-culture was promoting maturation, which we later validated by looking at the expression of key hepatocyte markers as well as by pearson correlation comparison with fetal hepatocytes.
(2) The purity of sorted hepatocytes and macrophages is not convincingly demonstrated; contamination across gates may confound transcriptomic readouts.
We agree and have highlighted and addressed this limitation in our discussion. Unfortunately, this is a limitation of bulk sequencing that a small amount of contamination might be present, however the TPM values of ALB for example in the iMacs is extremely low especially when compared to the hepatocytes, indicating that the level of contamination is likely to be very low. Likewise, the expression of CSF1R in the co-cultured iHeps is also extremely low. This has been included in Supp Fig 1F and G.
(3) Stress response genes and ER stress/apoptosis signatures are not properly assessed, despite being potentially activated in the system.
This has been included in Supp Fig 2C, where we’ve included the expression of ATF4, CASP3 and CASP9. Although there’s a significant difference in ATF4 expression between Day 0 and Day 7 iHep only/Co-culture, there is no significant difference between the Day 7 iHep only and Day 7 iHep Co-culture. There are no significant differences in CASP3 and CASP9 expression across all the samples.
(4) Some figure panels and legends lack statistical annotations, and microscopy validation of morphological changes is missing.
Although we agree that the morphology changes would be interesting, we think that this question is unfortunately outside of the scope of our question. Although Kupffer cells are in direct contact with hepatocytes, they migrate from the liver parenchyma into the sinusoidal spaces where they primarily reside. We do not think that the morphology would add much to the paper, especially given that this is a 2D model as well.
(5) The co-culture model with monocyte-derived macrophages is not fully characterised, making comparisons less informative.
Although we agree that it would be interesting to look more closely at the monocyte-derived macrophage co-cultures as well, we think that this would be more suited to a future study as the transcriptomic analysis would likely include confounding effects of patient specific transcriptomic changes, and our primary focus was on developing an isogenic co-culture system.
Reviewer #2 (Public review):
Summary:
This study builds on work by Glass and Guilliams showing that mouse Kupffer cells depend on the surrounding cells, including endothelium, hepatocytes, and stellate cells, for their identity. Herein, the authors extend the work to human systems. It nicely highlights why taking monocyte-derived macrophages and pretending they are Kupffer cells is simply misleading.
Strengths:
Many, including human cells, difficult culture assays, and important new data.
Weaknesses:
This reviewer identified minor queries only, rather than 'weaknesses' as such.
Reviewer #3 (Public review):
Summary:
In this study, the authors establish a human in vitro liver model by co-culturing induced hepatocyte-like cells (iHEPs) with induced macrophages (iMACs). Through flow cytometry-based sorting of cell populations at days 3 and 7 of co-culture, followed by bulk RNA sequencing, they demonstrate that bidirectional interactions between these two cell types drive functional maturation. Specifically, the presence of iMACs accelerates the hepatic maturation program of iHEPs, while contact-dependent cues from iHEPs enhance the acquisition of Kupffer cell identity in iMACs, indicating that direct cell-cell interactions are critical for establishing tissue-resident macrophage characteristics.
Functionally, the authors show that iMAC-derived Kupffer-like cells respond to pathological stimuli by producing interleukin-6 (IL-6), a hallmark cytokine of hepatic immune activation. When exposed to a panel of clinically relevant hepatotoxic drugs, the co-culture system exhibited concentration-dependent modulation of IL-6 secretion consistent with reported drug-induced liver injury (DILI) phenotypes. Notably, this response was absent when hepatocytes were co-cultured with monocyte-derived macrophages from peripheral blood, underscoring the liver-specific phenotype and functional relevance of the iMAC-derived Kupffer-like cells. Collectively, the study proposes this co-culture platform as a more physiologically relevant model for interrogating macrophage-hepatocyte crosstalk and assessing immune-mediated hepatotoxicity in vitro.
Strengths:
A major strength of this study lies in its systematic dissection of cell-cell interactions within the co-culture system. By isolating each cell type following co-culture and performing comprehensive transcriptomic analyses, the authors provide direct evidence of bidirectional crosstalk between iMACs and iHEPs. The comparison with single-culture controls is particularly valuable, as it clearly demonstrates how co-culture enhances functional maturation and lineage-specific gene expression in both cell types. This approach allows for a more mechanistic understanding of how hepatocyte-macrophage interactions contribute to the acquisition of tissue-specific phenotypes.
Weaknesses:
(1) Overreliance on bulk RNA-seq data:
The primary evidence supporting cell maturation is derived from bulk RNA sequencing, which has inherent limitations in resolving heterogeneous cellular states and functional maturation. The conclusions regarding hepatocyte maturation are based largely on increased expression of a subset of CYP genes and decreased AFP levels - markers that, while suggestive, are insufficient on their own to substantiate functional maturation. Additional phenotypic or functional assays (e.g., metabolic activity, protein-level validation) would significantly strengthen these claims.
We have added a discussion on the limitations of our study.
(2) Insufficient characterization of input cell populations:
The manuscript lacks adequate validation of the cellular identities prior to co-culture. Although the authors reference previously published protocols for generating iHEPs and iMACs, it remains unclear whether the cells used in this study faithfully retain expected lineage characteristics. For example, hepatocyte preparations should be characterized by flow cytometry for ALB and AFP expression, while iMACs should be assessed for canonical macrophage markers such as CD45, CD11b, and CD14 before co-culture. Without these baseline data, it is difficult to interpret the magnitude or significance of any co-culture-induced changes.
We apologise for this oversight, some of the markers were used in determining the purity of the iMacs before co-culture, and we did not end up including these plots for brevity. We have added the purity plots in Supp Fig 2E now, showing that the iMacs were more than 90% pure before co-culture. We acknowledge the concern about cross-contamination for bulk sequencing, and have added in Supp Fig 2G and H the expression of ALB in the iMac fraction, as well as the expression of CSF1R in the iHep fraction, showing minimal contamination with our gating strategy.
(3) Quantitative assessment of IL-6 production is insufficient:
The analysis of drug-induced IL-6 responses is based primarily on relative changes compared to control conditions. However, percentage changes alone are inadequate to capture the biological relevance of these responses. Absolute cytokine production levels - particularly in response to LPS stimulation - should be reported and directly compared to PBMC-derived macrophages to determine whether iMAC-derived Kupffer-like cells exhibit enhanced cytokine output. Moreover, the Methods section should clearly describe how ELISA results were normalized or corrected to account for potential differences in cell number, viability, or culture conditions.
We apologise if this was unclear. The cytokine production from dosed cells was normalized based on the viability of cells measured from the same well.
(4) Unclear mechanistic interpretation of IL-6 modulation:
The observed changes in IL-6 production upon drug treatment cannot be interpreted solely as evidence of Kupffer cell-specific functionality. For instance, IL-6 suppression by NSAIDs such as diclofenac is well known to result from altered prostaglandin synthesis due to COX inhibition, while leflunomide's effects are linked to metabolite-induced modulation of immune cell proliferation and broader cytokine networks. These mechanisms are distinct from Kupffer cell identity and may not directly reflect liver-specific macrophage function. Consequently, changes in IL-6 secretion alone - particularly without additional mechanistic evidence or analysis of other cytokines - are insufficient to conclude that co-culture with hepatocytes drives the acquisition of bona fide Kupffer cell maturity.
We fully agree with the reviewer and have highlighted this in our discussion.
Recommendations for the authors:
Reviewer #1 (Recommendations for the authors):
(1) GSE ID for RNA-seq data has not been provided.
This has been included.
(2) Line 291: Can the authors specify what they mean by "state-of-the-art"?
What we mean here is what others in the field have also recently described. We have rewritten this to be clearer.
(3) Lines 299-300: check sentence for grammar mistakes.
We have rewritten and clarified this.
(4) Figure 1B: The PCA does not really allow for following maturation trajectories. Also, all samples (day 3 Co-iHep, day 7 Co-iHep, day 7 iHep) look as if they cluster more or less together. Therefore, the conclusion drawn in lines 303-305 does not hold. Why is day 3 iHep not also shown here?
We agree that PCA does not allow for maturation trajectories and mentioned that it was a hypothesis that the co-culture was promoting maturation, which we later validated by looking at the expression of key hepatocyte markers as well as by pearson correlation comparison with fetal hepatocytes.
(5) Can the authors show that the cells that they are sorting in the double negative gate are indeed hepatocytes? Typically, these cells are big in cell size; therefore, showing the FSC/SSC gate would also be important.
We have added the FSC/SSC gate in supp fig. 1E to show that the populations have different sizes.
(6) Can the authors provide microscopy pictures of iHeps, iMacs, and the co-cultured cells for the reader to appreciate whether the morphology of cells already changes during the co-culture experiments?
Although we agree that the morphology changes would be interesting, we think that this question is unfortunately outside of the scope of our question. Although Kupffer cells are in direct contact with hepatocytes, they migrate from the liver parenchyma into the sinusoidal spaces where they primarily reside. We do not think that the morphology would add much to the paper, especially given that this is a 2D model as well.
(7) Please show expression of apoptotic and ER stress genes comparing Day7 iHeps and Co-iHeps, since genes such as c-Fos and Ppp2r3b can also be associated with cellular stress.
This has been included in Supp Fig 2C, where we’ve included the expression of ATF4, CASP3 and CASP9. Although there’s a significant difference in ATF4 expression between Day 0 and Day 7 iHep only/Co-culture, there is no significant difference between the Day 7 iHep only and Day 7 iHep Co-culture. There are no significant differences in CASP3 and CASP9 expression across all the samples.
(8) In addition to the genes shown in Figure 1E, could the authors extract a longer gene list of maturing hepatocytes and display them all in bar graphs or heatmaps, or similar? E.g., Albumin expression is shown later, but why not show it already here?
There are not many differences in the canonical hepatocyte markers, which is why we chose only to show the interesting genes that were different, as seen in the later ALB expression plot where there wasn’t a difference in ALB expression after 7 days of co-culture. Instead, we have included a new heatmap in Supp Fig 2B showing the top 40 genes that are contributing to the similarity by pearson correlation.
(9) Along these lines, how do the authors ensure that they are culturing only hepatocytes and do not have a mixture of cells that may "dilute" the hepatocyte signature?
Unfortunately, this is an limitation of our methodology, although the expression of key hepatic markers are routinely confirmed by qPCR to ensure that the majority of the cells are hepatocyte-like.
(10) Lines 347-350: similar to the interpretation of the PCA for hepatocytes, this is a completely random interpretation. The expression of ALB in the co-cultured iMacs indicates that there are some hepatocytes that ended up in the macrophage gate.
We agree and have highlighted and addressed this limitation in our discussion. Unfortunately, this is a limitation of bulk sequencing that a small amount of contamination might be present, however the TPM values of ALB for example in the iMacs is extremely low especially when compared to the hepatocytes, indicating that the level of contamination is likely to be very low. Likewise, the expression of CSF1R in the co-cultured iHeps is also extremely low. This has been included in Supp Fig 1F and G.
(11) Figure 2D: Among the pathways shown, there are also stress pathways (acute phase response, HMGB1). Also for these cells, control of apoptotic and ER stress signatures is necessary.
As mentioned, we have included some stress genes in Supp Fig 2C to address this.
(12) Lines 385-386: Why would FCGRA3 indicate tissue residency? Is there literature to support this statement?
CD16 is a marker often used to distinguish Kupffer cells from the surrounding cells, although it also expressed by non-classical monocytes, we have clarified the text here (Lines 356-357).
(13) Figure 3E: ALB and other genes were at the same or even lower levels expressed in D7 compared to D3. Why is that? Are the cells starting to de-differentiate after 7 days? Please discuss.
This is a very interesting question that we were wondering ourselves as well, although sadly we do not have an answer yet. We hypothesized that this might be due to the activation of cell proliferation/developmental programmes as the cells are kept longer together, as shown by the expression of morphogens like OSM and IGF-2 after co-culture. We have added some discussion for this (Lines 532-540)
(14) Line 459: Word "in" is double
We thank the reviewer for catching this, this has been corrected
(15) Figure 5: The findings are interesting, but the co-culture model remains somewhat unclear. Can the authors show, e.g., using qRT-PCR, how hepatocytes are developing in this culture system? If the development with monocyte-derived macrophages is altered, then one would expect that also the cellular response is different.
We agree with the reviewer, but we think that this question would be better answered in a follow-up study. We were looking to answer if the addition of isogenic iMacs would change the drug response of iHeps, and were using the PBMC-derived macrophages here as a control. A more complete study taking into account the genetic background of the donor PBMC-derived macrophages would be much more informative, but sadly outside of the scope of our present study.
(16) Lines 482-484: The authors talk about LPS-treated cultures and refer to Figure 4. However, there is no graph shown for LPS.
We apologise for being unclear here, but the co-cultures were co-treated with LPS during the drug stimulation assays, as it had been shown that LPS increases the sensitivity of the liver toward hepatotoxic drugs. We have clarified this in the main text (Lines 435-437).
Reviewer #2 (Recommendations for the authors):
(1) It would be nice to add some protein production by the hepatocytes. For example, can they produce albumin or some other protein that can be measured? Perhaps I missed this.
The protein expression of Albumin and Urea were assessed in the hepatocytes prior to co-culture in Supp Fig 1C; however we did not measure the protein level changes after co-culture as the co-culture would have a significant number of macrophages as well which we thought might affect the readout. Instead, after co-culture the primary analysis was done on the RNA levels of ALB and other cytochrome genes after sorting in Fig 3.
(2) Was there an increase in hepatocyte number? Did one cell outgrow the other, or did they maintain numbers?
The relative proportion of the iHeps remained the same, although we did see an expansion in the iMac population after 7 days by flow cytometry in Fig 1D.
(3) What happens if the iMACs and the iHeps are grown in Costar chambers with pore sizes too small to allow for cell contact, but allowing supernatant to be continuously exposed to both cell types?
We were primarily focused on the acquisition of KC-like phenotype in the iMacs with regards the question of direct contact, which was why we chose to use conditioned iHep media as part of the iMac experimental set up. However, it would be very interesting to see if the converse is also true, and whether secreted factors from the iMacs alone would be sufficient to drive the changes we observed in the iHeps after co-culture in a follow-up study.
(4) The discussion could use a brief paragraph on some limitations and what could be added to the co-culture system. For example, could stellate cells and sinusoidal endothelium also impart KC identity? Would growing KCs on endothelium provide a more natural substratum?
Once again, these are very interesting questions which are unfortunately outside of the scope of our study. However, we have included a short section discussing this in the paper, as we do think that it would be interesting to look at iMacs educated by hepatocyte vs stellate cells for example (Lines 530-536).
(5) The axonal guidance pathway in early iMACs is interesting. A recent report in vivo showed that macrophages migrate from the liver parenchyma into the sinusoids in neonates when they are still immature. The process could be chemotaxis, or it could be repulsion by parenchyma. Numerous axonal guidance molecules are repulsive, pushing axons away (robo/slit, etc). The migration of Kupffer cells into sinusoids could be a repulsive rather than a chemoattractant pathway. Did the RNA seq data provide any interesting molecules in this regard?
Reviewer #3 (Recommendations for the authors):
This manuscript presents a conceptually well-designed approach to modeling hepatocyte-macrophage crosstalk in vitro. The authors develop a co-culture system aimed at recapitulating key aspects of Kupffer cell (KC) identity and hepatocyte maturation. The data convincingly show that macrophages acquire KC-like features under co-culture conditions. However, several major issues limit the strength of the conclusions, the depth of mechanistic insight, and the translational impact of the work.
First, the study relies heavily on bulk RNA-seq data with minimal functional or protein-level validation - particularly for hepatocyte maturation. To substantiate claims of functional maturation, additional assays measuring albumin secretion, urea production, and CYP activity are essential. Furthermore, the omission of zonation-associated markers (e.g., GLUL, CPS1, CYP2E1) leaves a critical gap in assessing whether the iHEPs achieve physiologically relevant functional states.
Second, statistical interpretation and reporting are inconsistent. Significant and non-significant findings are frequently conflated, which risks overinterpretation. For instance, the reported reduction in HNF4A expression is not statistically significant, and AFP expression is only significantly reduced in Day 7 co-iHEPs - yet these distinctions are not clearly stated.
Third, although the authors emphasize the role of cell-cell contact in promoting KC identity, no experiments (e.g., transwell separation, adhesion-blocking assays) directly test this claim. As a result, the mechanistic basis for this conclusion remains speculative.
Finally, while the data support enhanced macrophage differentiation toward a KC-like phenotype, the evidence that co-culture significantly promotes hepatocyte maturation is far less convincing and requires additional functional, mechanistic, and statistical validation before firm conclusions can be drawn.
Minor comments:
(1) Methodology: The choice of a 2.5:1 iHEP:iMAC ratio is not justified. This proportion does not reflect physiological hepatocyte-to-KC ratios in vivo and should be either rationalized or benchmarked against native liver composition.
We admit that the ratio here is on the higher side of things, but it has been previously reported that there can be between 20 to 40 macrophages per 100 hepatocytes (1:5 to 1:2.5) in the adult mouse liver (Baratta et al., 2009), while admittedly in the developing mouse liver the ratio is closer to 1:4 (Lopez et al., 2011). We chose 1:2.5 as we anticipated that not all of the macrophages would be able to attach, and would thus be lost during media change, as evident by the flow cytometry of the co-culture on Day 3 of the co-culture, where only 20% of the cells had clear CD45 and CD14 expression. We have clarified our methodology in paper (Lines 141-143).
(2) Effect of iMAC on iHEP (Section 3.2, Supplementary Figure 1E):
(2.1) The authors should explain why Day 3 co-cultured iHEPs show stronger transcriptomic similarity to primary hepatocytes than Day 7 cells. Possible biological mechanisms (e.g., transient paracrine signaling or temporal changes in maturation dynamics) should be discussed.
We have added some discussion for this (Lines 309-311, 536-540).
(2.2) The figure legend refers to "fetal hepatocytes," while the correlation map states "hepatocytes." This discrepancy must be clarified. Moreover, if fetal hepatocytes are used as the reference, and the goal is to assess maturation, comparisons to adult hepatocytes are necessary.
The comparison was done against fetal hepatocytes, and has been clarified in the figure. We chose to use fetal hepatocytes here as it would be unfair to compare iPSC-derived cells that are less than 3 weeks old to adult human tissue, and any similarity or differences between the mono/co-cultures to the adult tissue might be due to the shifting transcriptomic landscape during development. However, we do recognise the nuanced nature of using “maturation” here, and what we mean is that the iPSC-derived cells become more similar to their in-vivo counterparts.
(2.3) Baseline characterization of both cell types before co-culture is insufficient. For iHEPs, flow cytometry data on ALB and AFP positivity rates should be presented, along with post-co-culture changes. For iMACs, marker expression (CD45, CD11b, CD14) should be shown before and after co-culture. The methods mention CD163, CX3CR1, and CD11b, but these data are absent from the results. Additionally, the gating strategy for cell sorting prior to bulk RNA-seq must be clearly described - including how potential cross-contamination of cell fractions (e.g., macrophages in the hepatocyte population) was excluded.
We apologise for this oversight, some of the markers were used in determining the purity of the iMacs before co-culture, and we did not end up including these plots for brevity. We have added the purity plots in Supp Fig 2E now, showing that the iMacs were more than 90% pure before co-culture. We acknowledge the concern about cross-contamination for bulk sequencing, and have added in Supp Fig 2G and H the expression of ALB in the iMac fraction, as well as the expression of CSF1R in the iHep fraction, showing minimal contamination with our gating strategy.
(3) IGF2 Expression: The observed upregulation of IGF2, a fetal marker, contradicts the conclusion that co-culture promotes hepatocyte maturation. This inconsistency should be addressed, and possible explanations (e.g., transient fetal-like activation driven by macrophage-derived signals) discussed. The lack of statistical significance for this finding must also be explicitly noted.
We thank the reviewer for pointing this out. The expression of IGF2 was actually significantly different when comparing the Day 0 Hepatocyte only and Day 7 Hepatocyte only to the Day 3 Co-cultured Hepatocytes, but the significance is lost with the Day 7 co-cultured Hepatocytes. One possible explanation is as the reviewer suggested, that there is a transient program that is activated upon co-culture that is subsequently downregulated. We have updated the figure and text, and added some discussion to reflect this (Lines 309-311, 536-540).
(4) Effect of iHEP on iMAC: The reported upregulation of KC-related genes is overstated. Changes in LYVE1 and ID1 are not statistically significant (Figure 2G), yet they are presented as meaningful. Clear separation of statistically significant results from non-significant trends is critical to avoid overinterpretation.
We apologise for this, as it was never our intention to present these markers as significant, but rather we presented these markers because we thought that these markers would be of interest to the audience. We have clarified the text to reflect that these are trends and non-significant (Lines 367-369).
(5) Mimicking In Vivo Clinical Responses:
(5.1) The authors' conclusion that IL-6 responses are not recapitulated when iMACs are replaced by monocyte-derived macrophages (MoMs) is not fully supported by the data presented. In fact, the MoM co-cultures exhibit a noticeable trend toward increased IL-6 production (e.g., approximately 150% with LTG at 66.6 µM and 400 µM), suggesting that some degree of responsiveness is retained. To substantiate the claim that the observed cytokine modulation is unique to iKC-containing co-cultures, the authors should perform direct statistical comparisons of absolute IL-6 secretion levels between iKC and MoM co-cultures at each drug concentration. Such analyses are essential to determine whether the differences are statistically significant and biologically meaningful, and to clarify whether the observed effects truly reflect KC-specific functionality rather than general macrophage activation.
(5.2) The effects of drug exposure on hepatocytes themselves are not addressed. It is important to evaluate whether the co-culture remains viable under treatment, whether it recovers after drug withdrawal, and whether there is evidence of cytotoxicity or irreversible phenotypic loss.
(6) Interpretation of IL-6 Modulation and Model Specificity:
The authors show that IL-6 secretion in their co-culture system varies in response to multiple hepatotoxic drugs and parallels some reported clinical trends - notably, a concentration-dependent decrease with diclofenac (DIC) and leflunomide (LFM). They further report that this pattern is not observed in hepatocyte-PBMC-derived macrophage co-cultures, and they conclude that iMAC/iKC-like cells are essential for capturing immune-mediated hepatotoxic responses. However, the data presented do not fully justify such a conclusion. Several key mechanistic issues weaken the interpretation:
(6.1) Mechanistic ambiguity in the DIC response: The decrease in IL-6 following DIC exposure is most likely attributable to reduced prostaglandin E₂ (PGE₂) production via COX inhibition, which secondarily suppresses IL-6 signaling. This effect is a general pharmacological property of NSAIDs and is not necessarily reflective of Kupffer cell-specific pathways. Direct evidence - such as prostanoid quantification or PGE₂ rescue experiments - is required to establish that the observed effects are liver-specific rather than nonspecific NSAID responses.
(6.2) Pharmacogenetic complexity in the LFM response: LFM-induced hepatotoxicity is highly variable and largely dependent on CYP2C9 polymorphisms, which determine conversion to the active metabolite teriflunomide. Because hepatotoxicity and the associated cytokine responses are not universal among patients, a simplified co-culture model lacking metabolic diversity cannot be assumed to faithfully reproduce patient-specific immune responses. The observed IL-6 suppression could arise from differences in metabolic activation, intracellular exposure, or indirect signaling changes rather than from intrinsic KC-specific mechanisms.
These points significantly undermine the authors' claim that IL-6 modulation provides definitive evidence of model specificity or predictive value. At minimum, the manuscript should (i) explicitly acknowledge these mechanistic limitations, (ii) include supporting data such as prostanoid profiling, CYP2C9 modulation, or teriflunomide quantification, and (iii) temper its claims regarding the model's capacity to recapitulate immune-mediated hepatotoxicity. Without such evidence, the current interpretation risks overstating the functional significance and translational relevance of the co-culture system.
We fully agree with the reviewer and have highlighted this in our discussion (Lines 540 – 551).
neuronal membrane
The neuronal membrane is what's keeping the extracellular fluid and intracellular fluid separate.
The neuronal membrane is made of a fatty material, it acts like a waterproof seal.
neuronal membrane
The neuronal membrane (or nerve cell membrane) is a thin, fatty barrier that encloses the entire neuron, separating its internal components from the external environment.
Receptors: these are protein complexes that listen for chemical signals (neurotransmitters) from other neurons. When a signal binds to a receptor, it tells the membrane to open its gates and change the cells electrical state.
eLife Assessment
The analysis of neural morphology across Heliconiini butterfly species revealed brain area-specific changes associated with new foraging behaviours. While the volume of the centre for learning and memory, the mushroom bodies, was known to vary widely across species, these new, valuable results show conservation of the volume of a center for navigation, the central complex, but with specific changes in neuropeptide expression in the noduli and in the numbers of ellipsoid body ring neurons. The presented evidence is convincing for both volumetric conservation in the central complex and fine neuroanatomical differences associated with pollen feeding, delivered by experimental approaches that are applicable to other insect species. This work will be of interest to evolutionary biologists, entomologists, and neuroscientists.
Reviewer #1 (Public review):
The authors previously reported that Heliconius, one genus of the Heliconiini butterflies, evolved to be efficient foragers to feed pollen of specific plants and have massively expanded mushroom bodies. Using the same image dataset, the authors segmented the central complex and associated brain regions and found that the volume of the central complex relative to the rest of brain are largely conserved across the Heliconiini butterflies. By performing immunostaining to label specific subset of neurons, the authors found several potential sites of evolutional divergence in the central complex neural circuits, including the numbers of GABAergic ellipsoid body ring neurons and the innervation patterns of Allatostatin A expressing neurons in the noduli. These neuroanatomical data will be helpful to guide the future studies to understand the evolution of the neural circuits for vector-based navigations.
Strength
The authors used sufficiently large scale of dataset from 307 individuals of 41 specifies of Heliconiini butterflies to solidify the quantitative conclusions, and present new microscopy data for fine neuroanatomical comparison of the central complex.
Weakness
(1) Although the figures display a concise summary of anatomical findings, it would be difficult for non-experts to learn from this manuscript to identify the same neuronal processes in the raw confocal stacks. It would be helpful to have instructive movies to show step by step guide for identifications of neurons of interests, segmentations and 3D visualizations (rotation) for several examples including ER neurons (to supplement texts in line 347-353) and Allatostatin A neurons.
(2) Related to (1), it was difficult for me to access if the data in Fig 7 support the author's conclusions that ER neuron number increased in Heliconius Melpomene. By my understanding, the resolution of this dataset isn't high enough to trace individual axons and therefore authors do not rule out that the portion of "ER ring neurons" in Heliconius may not innervate the ER, as stated in Line 635 "Importantly, we also found that some ER neurons bypass the ellipsoid body and give rise to dense branches within distinct layers in the fan-shaped body (ER-FB)". If they don't innervate the ellipsoid body, why are they named as "ER neurons"?
(3) Discussions around the line 577-584 requires the assumption that each ellipsoid body (EB) ring neuron typically arborise in a single microglomerulus to form largely one-to-one connection with TuBu neurons within the bulb (BU), and therefore the number of BU microglomeruli should provide an estimation of the number of ER neurons. Explain this key assumption or provide an alternative explanation.
(4) The details of antibody information are missing in the Key resource table. Instead of citing papers, list the catalogue numbers and identifier for commercially available antibodies, and describe the antigen and if they are monoclonal or polyclonal. Are antigens conserved across species?
(5) I did not understand why authors assume that foraging to feed on pollens is more difficult cognitive task than foraging to feed on nectars. Would it be possible that they are equality demanding tasks but pollen feeding allows Heliconius to pass more proteins and nucleic acids to their offsprings and therefore they can develop larger mushroom bodies?
Comments on revisions:
The authors fully addressed my concerns and significantly improved the accessibility of the manuscript.
Reviewer #2 (Public review):
Summary
In this study, Farnsworth et al. ask whether the previously established expansion of mushroom bodies in the pollen foraging Heliconius genus of Heliconiini butterflies co-evolved with adaptations in the central complex. Heliconius trap line foraging strategies to acquire pollen as a novel resource require advanced spatial memory mediated by larger mushroom bodies but the authors show that related navigation circuits in the central complex are highly conserved across the Heliconiini tribe, with a few interesting exceptions. Using general immunohistochemical stains and 3D reconstruction, the authors compared volumes of central complex regions and unlike the mushroom bodies, there was no evidence of expansion associated with pollen feeding. However, a second dataset of neuromodulator and neuropeptide antibody labeling reveal more subtle differences between pollen and non-pollen foragers and highlight sub-circuits that may mediate species-specific differences in behavior. Specifically, the authors found an expansion of GABAergic ER neurons projecting to the fan shaped body in Heliconius which may enhance their ability to path-integrate. They also found differences in Allatostatin A immunoreactivity, particularly increased expression in the noduli associated with pollen feeding. These differences warrant closer examination in future studies to determine their functional implication on navigation and foraging behaviors.
Strengths
The authors leveraged a large morphological data set from the Heliconiini to achieve excellent phylogenetic coverage across the tribe with 41 species represented. Their high quality histology resolves anatomical details to the level of specific, identifiable tracts and cell body clusters. They revealed differences at a circuit level, which would not be obvious from a volumetric comparison. The discussion of these adaptations in the context of central complex models is useful for generating new hypotheses for future studies on the function of ER-FB neurons and the role of Allatostatin A modulation in navigation.<br /> The conclusions drawn in this paper are measured and supported by rigorous statistics and evidence from micrographs.
Weaknesses
The majority of results in this study do not reveal adaptations in the central complex associated with pollen foraging. However, reporting conserved traits is useful and illustrates where developmental or functional constraints may be acting. The authors have now revised the introduction to set up two alternate hypotheses..
In the main text, the authors describe differences in GABAergic ER neurons between H. melpomene and an outgroup species, with additional images from other species in Figure S4. Quantification of ER cells in these other species would strengthen the claim that these are increased in Heliconius and not just the focal species, but this may hopefully be pursued in future studies.
Comments on revisions:
I am satisfied with the authors' revisions.
Author response:
The following is the authors’ response to the original reviews.
eLife Assessment
The analysis of neural morphology across Heliconiini butterfly species revealed brain area specific changes associated with new foraging behaviours. While the volume of the centre for learning and memory, the mushroom bodies, was known to vary widely across species, new, valuable results show conservation of the volume of a center for navigation, the central complex. The presented evidence is convincing for both volumetric conservation in the central complex and fine neuroanatomical differences associated with pollen feeding, delivered by experimental approaches that are applicable to other insect species. This work will be of interest to evolutionary biologists, entomologists, and neuroscientists.
Many thanks for your assessment and time handling this manuscript. We value the constructive input of both reviewers and believe that the result is an improved publication.
Public Reviews:
Reviewer #1 (Public review):
The authors previously reported that Heliconius, one genus of the Heliconiini butterflies, evolved to be efficient foragers to feed pollen of specific plants and have massively expanded mushroom bodies. Using the same image dataset, the authors segmented the central complex and associated brain regions and found that the volume of the central complex relative to the rest of the brain is largely conserved across the Heliconiini butterflies. By performing immunostaining to label a specific subset of neurons, the authors found several potential sites of evolutionary divergence in the central complex neural circuits, including the number of GABAergic ellipsoid body ring neurons and the innervation patterns of Allatostatin A expressing neurons in the noduli. These neuroanatomical data will be helpful to guide future studies to understand the evolution of the neural circuits for vector-based navigation.
We thank Reviewer 1 for the constructive feedback and criticism, which will have strengthened this publication.
Strengths:
The authors used a sufficiently large scale of dataset from 307 individuals of 41 species of Heliconiini butterflies to solidify the quantitative conclusions and present new microscopy data for fine neuroanatomical comparison of the central complex.
Weaknesses:
(1) Although the figures display a concise summary of anatomical findings, it would be difficult for non-experts to learn from this manuscript to identify the same neuronal processes in the raw confocal stacks. It would be helpful to have instructive movies to show a step-by-step guide for identification of neurons of interest, segmentations, and 3D visualizations (rotation) for several examples, including ER neurons (to supplement texts in line 347-353) and Allatostatin A neurons.
We approached this with the following logic:
All 3D segmentations were animated, to illustrate how they are generated from raw imaging data. This means we are providing a video file for each major species group (Heliconius/outgroup-Heliconiini) for Figure 4 (general CX anatomy), Figure 7 (ER neuron projections), Figure S5 (ER neuron/bulb anatomy). This visual connection should help the reader relate 3D segmentations to image stacks. We have also added a reference to these videos in the relevant Figure captions.
We also annotated image stacks, but did so selectively. We annotated key stacks of Figure 4 (general CX anatomy), Figure 7 (ER neuron projections), Figure S5 (ER neuron/bulb anatomy) and include a reference in figure caption to them.
We refrained from annotating stacks of Figures 5, 6, 8 and S4. This is because we believe that the annotations we have performed in the figure panels will be sufficient for readers interested in the finer detail of these anatomies who are familiar with general CX anatomy.
We believe that our approach will help the reader to gain a visual illustration of those parts of the manuscript which report key results and novel insights, such as ER neuronal variation, and that the data and figures collectively provide accessible information sufficient for this purpose.
Text changes in Figure captions 4, 7 and S5: “See animated 3D segmentations and annotated stacks in file repository.”
(2) Related to (1), it was difficult for me to assess if the data in Figure 7 support the author's conclusions that ER neuron number increased in Heliconius Melpomene. By my understanding, the resolution of this dataset isn't high enough to trace individual axons and therefore authors do not rule out that the portion of "ER ring neurons" in Heliconius may not innervate the ER, as stated in Line 635 "Importantly, we also found that some ER neurons bypass the ellipsoid body and give rise to dense branches within distinct layers in the fan-shaped body (ER-FB)". If they don't innervate the ellipsoid body, why are they named as "ER neurons"?
Thanks for pointing to this. We believe this is primarily a nomenclature issue but have tried to specify in the text.
Ultimately, neurons from this group that project to the EB forming the actual ring neurons and those that project to the FB with unclear function, thus far, emerge through the same lineage, DALv2 (as determined by Kandimalla et al 2023) and therefore have common developmental origin (also noted by Homberg et al 2018). To acknowledge their common developmental origin and to simplify nomenclature, and therefore also provide easier comprehension by non-experts, we specify which DALv2 progeny project to which areas, but refer to both adult neuron populations to “ER neurons”. We have changed the following text to acknowledge our definition specifically, which we hope mitigates the understandable confusion.
Lines 354-357: “Here, we refer to these neurons, as well as those neurons projecting to the fan-shaped body (GU neurons in [66]), as ER neurons due to their common developmental origin [45,66] and to simplify anatomical descriptions.”
Lines 386-387: “Whether these ER neurons solely branch in the fan-shaped body, as shown for GU neurons elsewhere [66] or have additional side branches entering the ellipsoid body is not clear.”
(3) Discussions around the lines 577-584 require the assumption that each ellipsoid body (EB) ring neuron typically arborises in a single microglomerulus to form a largely one-to-one connection with TuBu neurons within the bulb (BU), and therefore, the number of BU microglomeruli should provide an estimation of the number of ER neurons. Explain this key assumption or provide an alternative explanation.
Thanks for this. We do not think that our hypothesis necessarily requires any specific assumptions regarding the ratio of microglomerulus to ER or TuBu neurons. Even in Drosophila the ratio of ER to MG is only approximately 1:1, as some microglomeruli seem to combine into one. In other species this relationship might be very different. Indeed, our data suggests that in outgroup-Heliconiini the ratio is 4.4 microglomeruli to 1 ER neuron, and in Heliconius it is 3.4. However, as these MG numbers are extrapolated and cannot be precisely counted, they may be too imprecise to come to a definite conclusion, hence why we do not mention this in the text. Importantly, extrapolation in the current form is a valid additional way for us to describe overall bulb anatomy (next to bulb volume, average microglomerulus size).
In any case, the inference we make here is that a conserved bulb anatomy in volume, MG numbers and size supports our assumption that the additional neurons in the ER neuron group/DALv2 progeny do not arborize in the bulb, but do so in the SMP/SLP region and in the fanshaped body. We believe we have described this inference accurately in the current manuscript.
An additional point, not mentioned in the manuscript, but emerging through lineage annotations of connectome data, is that some DALv2 progeny have been identified as MBONs as well as being GABA-ergic, which could potentially be the ER-FB neurons that we describe (Schlegel et al 2024 Nature). We refrain from mentioning this here, as its too speculatory, but we thought the reviewer may be interested in this observation.
(4) The details of antibody information are missing in the Key resource table. Instead of citing papers, list the catalogue numbers and identifier for commercially available antibodies, and describe the antigen, and whether they are monoclonal or polyclonal. Are antigens conserved across species?
We have now added substantial information to Table 2, including research resource identifiers (RRIDs) and antigen descriptions, as well as information about specificity and conservation. In the text itself, in line 757, we already provide publications that have illustrated conservation very extensively.
We believe that with the additional information provided in Table 2, all necessary information is now provided.
(5) I did not understand why authors assume that foraging to feed on pollens is a more difficult cognitive task than foraging to feed on nectar. Would it be possible that they are equally demanding tasks, but pollen feeding allows Heliconius to pass more proteins and nucleic acids to their offspring and therefore they can develop larger mushroom bodies?
This is an excellent point. Our current understanding is that pollen feeding is a cognitively more demanding task, because, a) the density of pollen resources is lower than nectar resources, and b) the competition for pollen is higher (pollen is depleted quickly, and Heliconius compete with each other, and other taxa including hummingbirds). There is therefore a benefit to high foraging efficiency, which favours the evolution of learning. This is likely reinforced by the long lives of Heliconius which live up to a year, compared to ~4 weeks for most outgroups and the temporal stability of major pollen resources, resulting in a memorised location providing benefit for the long periods of time (Young and Montgomery 2020 Proc B).
We now refer to an additional publication (Young and Montgomery 2020 Proc B) in lines 103-104 for a fuller description of the ecology of pollen feeding, and in the current manuscript simply focus on the impact of mushroom body expansion on the CX.
Reviewer #2 (Public review):
Summary:
In this study, Farnsworth et al. ask whether the previously established expansion of mushroom bodies in the pollen foraging Heliconius genus of Heliconiini butterflies co-evolved with adaptations in the central complex. Heliconius trap line foraging strategies to acquire pollen as a novel resource require advanced spatial memory mediated by larger mushroom bodies, but the authors show that related navigation circuits in the central complex are highly conserved across the Heliconiini tribe, with a few interesting exceptions. Using general immunohistochemical stains and 3D reconstruction, the authors compared volumes of central complex regions, and unlike the mushroom bodies, there was no evidence of expansion associated with pollen feeding. However, a second dataset of neuromodulator and neuropeptide antibody labeling reveals more subtle differences between pollen and non-pollen foragers and highlights sub-circuits that may mediate species-specific differences in behavior. Specifically, the authors found an expansion of GABAergic ER neurons projecting to the fanshaped body in Heliconius, which may enhance their ability to path-integrate. They also found differences in Allatostatin A immunoreactivity, particularly increased expression in the noduli associated with pollen feeding. These differences warrant closer examination in future studies to determine their functional implication on navigation and foraging behaviors.
We thank Reviewer 2 for the constructive and thorough review. We believe that addressing these criticisms will have improved this publication.
Strengths:
The authors leveraged a large morphological data set from the Heliconiini to achieve excellent phylogenetic coverage across the tribe with 41 species represented. Their high-quality histology resolves anatomical details to the level of specific, identifiable tracts and cell body clusters. They revealed differences at a circuit level, which would not be obvious from a volumetric comparison. The discussion of these adaptations in the context of central complex models is useful for generating new hypotheses for future studies on the function of ER-FB neurons and the role of Allatostatin A modulation in navigation.
The conclusions drawn in this paper are measured and supported by rigorous statistics and evidence from micrographs.
Weaknesses:
The majority of results in this study do not reveal adaptations in the central complex associated with pollen foraging. However, reporting conserved traits is useful and illustrates where developmental or functional constraints may be acting. The implied hypothesis in the introduction is that expansion of mushroom bodies in Heliconius co-evolved with central complex adaptations, so it may be helpful to set up the alternate hypotheses in the beginning.
Thank you for this relevant comment. We have added to the text in lines 124-128, as follows
“Indeed, these circumstances permit us to test the hypotheses that modifications in the mushroom bodies either occurred in isolation from other integrative centres, or that they occurred in concert with specific changes in centres, such as the central complex. This provides insights into the functional flexibility of two interacting, integrative centres across evolutionary time.”
In the main text, the authors describe differences in GABAergic neurons "across several species" but only one Heliconius and one outgroup species seem to be represented in the figures. ER numbers in Figure 7H are only compared for these two species. If this data is available for other species, it would strengthen the paper to add them to the analysis, since this was one of the most intriguing findings in the study. I would want to know if the increased ER number is a trend in Heliconius or specific to H. melpomene.
This points to imprecise phrasing. We indeed have additional data in other species, but unfortunately not to an extent that would permit quantification of cell numbers, which is why we chose to put these data into the supplement, Fig. S4.
We modified the text to more directly point at the additional data in Fig S4, now reading in lines 362-368
“…, we noticed a pronounced difference in a portion of projections leading into the fan-shaped body and a strong difference in signal inside layer III in our two focal species H. Melpomene and D. iulia, as well as other representatives of the Heliconiini tribe (Figure S4A-B, Figure 7). To understand how these differences could have occurred, we quantified ER neuron numbers in our focal species, and identified a significant difference, reflecting a 35% increase in Heliconius (t = 4.221, P = 0.004; Figure 7H).”
Recommendations for the authors:
Reviewer #1 (Recommendations for the authors):
(1) Add a detailed description about each of the tiff files that were deposited at https://doi.org/10.5281/zenodo.15304965. It was hard for me to relate these raw images with the Figure panels. For instance, "Melp_GAD_26-F_detailed_conc.tif" in the Figure 7 folder seems to be used to make Figure 7L and N, but that information is cryptic.
We agree with the reviewer. We added further descriptions, and have created a detailed readme file which explains which original file refers to which figure. Together with the efforts for Reviewer 1’s first comment, we hope that this updated version of our repository is easier to understand.
In addition, we made additional changes in image orientation in some of the files supplied, and which were originally incorrect.
(2) Add descriptions about the dataset for large-scale volumetric analysis. With the current methods and texts, it is hard to understand what kinds of staining and microscopes were used. I initially thought that they could be micro-CT data.
We have made two improvements:
We have added an additional readme file to explain the different datasets, and which datasets were used for each figure, to relate them to the original data deposited at zenodo.org (see your previous comment).
We have added descriptions in several places in the manuscript file, i.e.
Lines 133-135, now reading “To assess evidence of volumetric changes in the central complex and associated neuropils, we drew data from a large dataset of immunostained brains from 307 individuals of 41 species, …”
Lines 144-149, now reading “We used a combination of phylogenetic comparative analysis across a large dataset of brains immunostained against the structural marker synapsin in 41 species and 307 individuals, and more targeted sampling of species that represent the behavioural and neuroanatomical diversity of Heliconiini for more fine-scale assessments of patterns of divergence in substructures of the CX with various antibodies (Figure 1A-B).”
(3) Line 275: Non-expert readers would need an explanation about what the gamma lobe is.
Agreed and added in line 273
“Some of the ventral projections seemed to directly originate from the γ lobe, a portion of the mushroom body, thus potentially labelling projections of mushroom body output neurons into the fan-shaped body (Figure 5a-c) [12,21].”
(4) Figures 4 I-L are missing.
We modified the figure caption accordingly, and address annotated differences more directly. This section now reads
“G/H: Labelling reveals two distinguishable layers in the fan-shaped body while additional staining elsewhere reveals further detail (arrows in G/H-2/3). Thicker tract conflations indicate the columnar architecture determined through the four columnar neuron bundles (arrowheads in G/H-3). Labelling in the EB reveals two pronounced layers (arrows in G/H-1/2), while obvious columns could not be indicated. PB protocerebral bridge, FB fan-shaped body, EB ellipsoid body. A anterior, P posterior. Scale bars are 50 μm.”
(5) In the current version of Figure 1B, AOTU is displayed with the mushroom body. The authors can emphasize its relation to the central complex by showing it on the right side of panels together with the central complex.
Great suggestion. We have done this now. We have kept the AOTU at the scale of the MB, indicated by the different scale bars of the bottom of the figure, as we’re showing the CX at a slightly larger scale.
(6) Figure 1C: What do the colors of the lines represent?
We now changed these colours so that they correspond to the colours chosen in Figures 2 and S2 as well as in a previous publication of the lab, added an asterisk next to Heliconius aoede, and added text to the figure legend:
“Colour indicates focal groups here and elsewhere [29]. The asterisk at the branch of H. aoede indicates a secondary loss of pollen feeding.”
(7) Figures 2A and B: What does the size of the circles represent? I guess that small ones are individuals, and larger ones are species averages. Plots with only species averages would be easier to see. It is difficult to distinguish Heliconius and Helicononius aoede in these panels. It would be easier if Heliconius circles were outlined with thin black lines.
Thanks for this. We wanted to keep both the averages and individual data points in one figure, as to not overcrowd the manuscript with additional figures. We still hope that the changes we made address the confusion sufficiently. We made the following modifications to Figure 2 and S1 and S2:
(1) Added text in the figure legend clarifying what solid and transparent circles indicate (“Solid data points indicate species averages, while opaque circles indicate individual data points.”)
(2) Added, as suggested, additional contours, to all Heliconius data points, and added corresponding text to the legend (“Black contours indicate Heliconius sp. data points.”)
(3) Changed opacity settings of individual data points.
Reviewer #2 (Recommendations for the authors):
(1) Line 391 and Methods. It was unclear how the extrapolated microglomeruli numbers were calculated. Please clarify this in the methods.
Agreed. We substantially modified the text to address this.
Lines 392-396: “We generated high resolution images of the bulb to determine its size (Figure S5 C-F), and 3D segmented seven microglomeruli per individual with which we generated an extrapolated approximation of total microglomeruli number by dividing bulb volume with average microglomerulus volume. This was necessary as most microglomeruli were not discernible from each other (Figure S5 G-H).”
Lines 862-873: “To segment the bulb, we created high resolution images and were particularly careful to only segment the area of the bulb that comprised large synapses/glomeruli, excluding parts of the LEa/IT projection. This was essential, because we relied on extrapolating the total number of microglomeruli from a subset of segmented microglomeruli and the total volume that contained microglomeruli, which means any section containing tracts and not glomerular structures would skew the estimated total number of microglomeruli. Extrapolation was necessary, as not all microglomeruli were visually discernible. We achieved an unskewed bulb volume by leaving out dense pieces of tubulin-positive tract material. We segmented seven microglomeruli per individual from the posterior section of the bulb, where they were most clearly visible, to get the most comparable impression across individuals and species. We then calculated average microglomerulus size and divided this by bulb volume to determine an approximation of microglomeruli number.”
(2) Line 439. It would be helpful to add that Kaiser et al. studied honeybees.
Agreed! Now reads in lines 443-444
“Moreover, Kaiser et al. [75] identified Allatostatin A expression in three fan-shaped and two ellipsoid body layers in the honey bee brain, …”
(3) Line 492. "outcome" should be "outcomes".
We believe that this refers to original line 481. Corrected. Thank you.
(4) Figure 3B. If there is significance to the colors and triangle directions, please include a key/legend.
We have added:
“Cell type depictions are examples with localisation inside each neuropil being purely visual (as well as their colour), while triangles indicate approximate output sites.”
We also corrected the following issues that were noted during our revisions:
line 587, wrong reference.
We updated references 37 and 44, which are now respectively
Hodge, E. A. et al. Modality-specific long-term memory enhancement in Heliconius butterflies. Philos Trans R Soc Lond B Biol Sci 380, 20240119 (2025).
Hodge, E. A. et al. Conservation of sensory pathways implies a localised change in the mushroom bodies is associated with cognitive evolution in Heliconius butterflies. Evol qpag005 (2026) doi:10.1093/evolut/qpag005.
Figure S5 had an error in panels C and D, where the pictures in C were actually for H. Melpomene in D and the reverse; the other panels were correct. We have corrected this.
In the data submitted on Zenodo: we corrected a few inconsistencies in channel colours and orientation in the .tiff files for Fig 6, 8 and S4.
We added important bulb 3D segmentation files to the repository on Zenodo.
eLife Assessment
This valuable study introduces miRTarDS, a novel computational framework that predicts microRNA-target interactions based on a publicly available pretrained Sentence-BERT language model and downstream classification analysis. The strength of the evidence is incomplete, as the evaluation framework relies on unreliable ground-truth and false sets. Furthermore, the analysis fails to compare miRTarDS against existing state-of-the-art biomedical language models.
Reviewer #1 (Public review):
The author presents a new method for microRNA target prediction based on (1) a publicly available pretrained Sentence-BERT language model that the author fine-tunes using MeSH information and (2) downstream classification analysis for microRNA target prediction. In particular, the author's approach, named "miRTarDS", attempts to solve the microRNA target prediction problem by utilizing disease information (i.e., semantic similarity scores) from their language model. The author then compares the prediction performance with other sequence- and disease-based methods and attempts to show that miRTarDS is superior or at least comparable to existing methods. The author's general approach to this microRNA target prediction problem seems promising, but fails to demonstrate concrete computational evidence that miRTarDS outperforms other existing methods. The author's claim that disease information-based language models are sufficient is unfounded. The manuscript requires substantial rewriting and reorganization for readers with a strong background in biomedical research.
A major issue related to the author's claim of computational advance of miRTarDS: The author does not introduce existing biomedical-specific language models, and does not compare them against miRTarDS's fine-tuned model. The performance of miRTarDS is largely dependent on the semantic embedding of disease terms. The author shows in Figure 5 that MeSH-based fine-tuning leads to a substantial improvement in MeSH-based correlation compared to the publicly available pretrained SBERT model "multi-qa-MiniLM-L6-cos-v1" without sacrificing a large amount of BIOSSES-based correlation. However, the author does not compare the performance of MeSH- and BIOSSES-based correlation with existing language models such as ChatGPT, BioBERT, PubMedBERT, and more. Also, the substantial improvement in MeSH-based correlation is a mere indication that the MeSH-based fine-tuning strategy was reasonable and not that it's superior to the publicly available pretrained SBERT model "multi-qa-MiniLM-L6-cos-v1".
Another major issue is in the author's claim that disease-information from miRTarDS's language model is "sufficient" for accurate microRNA target prediction. Available microRNA targets with experimental evidence are largely biased for those with disease implications that have been reported in the biomedical literature. It's possible that their language model is biased by existing literature that has also been used to build microRNA target databases. Therefore, it is important that the author provides strong evidence that excludes the possibility of data leakage circularity. Similar concerns are prevalent across the manuscript, and so I highly recommend that the author reassess the evaluation frameworks and account for inflated performance, biased conclusions, and self-confirming results.
Last but not least, the manuscript requires a deeper and careful description and computational encoding of microRNA biology. I'd advise the author to include an expert in microRNA biology to improve the quality of this manuscript. For example, the author uses the pre-miRNA notation and replaces the mature miRNA notation to maintain computational encoding consistency across databases. However, the mature microRNA notation "the '-3p' or '-5p' is critical as the 3p and 5p mature microRNAs have different seed sequences and thus different mRNA targets. The 3p mature microRNA would most likely not target an mRNA targeted by the 5p mature microRNA.
Reviewer #2 (Public review):
Summary:
This study introduces a novel knowledge-driven approach, miRTarDS, which enables microRNA-Target Interaction (MTI) prediction by leveraging the disease association degree between a miRNA and its target gene. The core hypothesis is that this single feature is sufficient to distinguish experimentally validated functional MTIs from computationally predicted MTIs in a binary classification setting. To quantify the disease association, the authors fine-tuned a Sentence-BERT (SBERT) model to generate embeddings of disease descriptions and compute their semantic similarity. Using only this disease association feature, miRTarDS achieved an F1 score of 0.88 on the test set.
Strengths:
The primary strength is the innovative use of the disease association degree as an independent feature for MTI classification. In addition, this study successfully adapts and fine-tunes the Sentence-BERT (SBERT) model to quantify the semantic similarity between biomedical texts (disease descriptions). This approach establishes a critical pathway for integrating powerful language models and the vast growth in clinical/disease data into biochemical discovery, like MTI prediction.
Weaknesses:
The main weakness lies in its definition of the ground-truth dataset, which serves as a foundation for methodological evaluation. The study defines the Negative Set as computationally predicted MTIs that lack experimental evidence. However, the absence of experimental validation does not equate to non-functionality. Similarly, the miRAW sets are classified by whether the target and miRNA could form a stable duplex structure according to RNA structure prediction. This definition is biologically irrelevant, as duplex stability does not fully encapsulate the complex in vivo binding of miRNAs within the AGO protein complex.
Author response:
We would like to express our sincere gratitude to the editors and the two reviewers for providing their constructive and valuable comments that will greatly guide us in improving the manuscript. We will revise the manuscript according to their critiques and suggestions. The existing code for this study, along with preliminary code developed in response to the review comments, has been made publicly available at https://github.com/cbaiming/miRTarDS. We now provide detailed responses to each reviewer below.
Reviewer #1 (Public review):
The author presents a new method for microRNA target prediction based on (1) a publicly available pretrained Sentence-BERT language model that the author fine-tunes using MeSH information and (2) downstream classification analysis for microRNA target prediction. In particular, the author's approach, named "miRTarDS", attempts to solve the microRNA target prediction problem by utilizing disease information (i.e., semantic similarity scores) from their language model. The author then compares the prediction performance with other sequence- and disease-based methods and attempts to show that miRTarDS is superior or at least comparable to existing methods. The author's general approach to this microRNA target prediction problem seems promising, but fails to demonstrate concrete computational evidence that miRTarDS outperforms other existing methods. The author's claim that disease information-based language models are sufficient is unfounded. The manuscript requires substantial rewriting and reorganization for readers with a strong background in biomedical research.
We appreciate the reviewer’s careful examination of modeling, benchmarking, and interpretation, and we are particularly encouraged that they found the proposed method promising. We will make corresponding revisions to the manuscript based on the reviewer’s comments.
A major issue related to the author's claim of computational advance of miRTarDS: The author does not introduce existing biomedical-specific language models, and does not compare them against miRTarDS's fine-tuned model. The performance of miRTarDS is largely dependent on the semantic embedding of disease terms. The author shows in Figure 5 that MeSH-based fine-tuning leads to a substantial improvement in MeSH-based correlation compared to the publicly available pretrained SBERT model "multi-qa-MiniLM-L6-cos-v1" without sacrificing a large amount of BIOSSES-based correlation. However, the author does not compare the performance of MeSH- and BIOSSES-based correlation with existing language models such as ChatGPT, BioBERT, PubMedBERT, and more. Also, the substantial improvement in MeSH-based correlation is a mere indication that the MeSH-based fine-tuning strategy was reasonable and not that it's superior to the publicly available pretrained SBERT model "multi-qa-MiniLM-L6-cos-v1".
We thank the reviewer for the constructive suggestions regarding the benchmarking of language models. We acknowledge that the performance of miRTarDS largely depends on the semantic embeddings of disease terms. So, in the revisions, I will: 1) conduct a literature review to introduce existing biomedical-specific language models, and 2) perform a horizontal comparison between our fine-tuned model and these existing models, to more comprehensively evaluate the model’s capabilities.
Another major issue is in the author's claim that disease-information from miRTarDS's language model is "sufficient" for accurate microRNA target prediction. Available microRNA targets with experimental evidence are largely biased for those with disease implications that have been reported in the biomedical literature. It's possible that their language model is biased by existing literature that has also been used to build microRNA target databases. Therefore, it is important that the author provides strong evidence that excludes the possibility of data leakage circularity. Similar concerns are prevalent across the manuscript, and so I highly recommend that the author reassess the evaluation frameworks and account for inflated performance, biased conclusions, and self-confirming results.
We thank the reviewer for the comment. We recognize that existing experimentally validated microRNA targets may be biased toward those reported in biomedical literature as disease‑related. To mitigate this bias, we attempted to extract predicted microRNA targets that share a very similar number of miRNA- and gene‑ disease entries as the experimentally validated microRNA targets using the K‑Nearest Neighbors (KNN) method. Then applied Positive‑Unlabeled (PU) Learning to classify the two groups. PU‑Learning is designed to address scenarios where only a subset of the training data is explicitly labeled as positive, while the remaining data are unlabeled—with the unlabeled set containing both potential positives and true negatives—which is highly suitable for the application context of this manuscript [1]. Preliminary results show that after applying the new data extraction and classification approach, model performance drops to around F1=0.73 (the MISIM method also shows a decline, with F1 around 0.58; detailed code is available on GitHub). The specific reasons for this require further investigation.
Last but not least, the manuscript requires a deeper and careful description and computational encoding of microRNA biology. I'd advise the author to include an expert in microRNA biology to improve the quality of this manuscript. For example, the author uses the pre-miRNA notation and replaces the mature miRNA notation to maintain computational encoding consistency across databases. However, the mature microRNA notation "the '-3p' or '-5p' is critical as the 3p and 5p mature microRNAs have different seed sequences and thus different mRNA targets. The 3p mature microRNA would most likely not target an mRNA targeted by the 5p mature microRNA.
We thank the reviewer for the critique and suggestion. We fully agree with the reviewer that the distinction between the 3p and 5p mature strands is critical for determining mRNA targeting, as they possess distinct seed sequences. In our study, we relied on the miRNA–disease associations provided by the HMDD database, which annotates interactions at the pre-miRNA level: “… the enriched functions of each mature miRNA are aggregated to the corresponding miRNA precursor.” [2] Furthermore, existing literature suggests that the pre-miRNA level can be appropriate and informative for disease association analyses: “Compared with the mature miRNA method, the pre-miRNA method is more useful for studying disease association.” [3] We also find that, in some cases, both strands cooperate to regulate the same or complementary pathways [4]. We acknowledge the reviewer’s point as an important consideration for future revision. We plan to consult or collaborate with biologists to enhance the quality of the manuscript in biology.
Reviewer #2 (Public review):
This study introduces a novel knowledge-driven approach, miRTarDS, which enables microRNA-Target Interaction (MTI) prediction by leveraging the disease association degree between a miRNA and its target gene. The core hypothesis is that this single feature is sufficient to distinguish experimentally validated functional MTIs from computationally predicted MTIs in a binary classification setting. To quantify the disease association, the authors fine-tuned a Sentence-BERT (SBERT) model to generate embeddings of disease descriptions and compute their semantic similarity. Using only this disease association feature, miRTarDS achieved an F1 score of 0.88 on the test set.
We thank the reviewers for their positive feedback, especially for their recognition of the novelty of this manuscript.
Strengths:
The primary strength is the innovative use of the disease association degree as an independent feature for MTI classification. In addition, this study successfully adapts and fine-tunes the Sentence-BERT (SBERT) model to quantify the semantic similarity between biomedical texts (disease descriptions). This approach establishes a critical pathway for integrating powerful language models and the vast growth in clinical/disease data into biochemical discovery, like MTI prediction.
We would like to thank the reviewer again for their positive feedback. We appreciate their recognition of the novelty of our work, as well as their acknowledgment that the proposed method paves the way for integrating language models with clinical/disease data into biochemical discovery.
Weaknesses:
The main weakness lies in its definition of the ground-truth dataset, which serves as a foundation for methodological evaluation. The study defines the Negative Set as computationally predicted MTIs that lack experimental evidence. However, the absence of experimental validation does not equate to non-functionality. Similarly, the miRAW sets are classified by whether the target and miRNA could form a stable duplex structure according to RNA structure prediction. This definition is biologically irrelevant, as duplex stability does not fully encapsulate the complex in vivo binding of miRNAs within the AGO protein complex.
We thank the reviewers for their constructive feedback. We have realized that treating predicted MTI as a negative class may pose some issues. Therefore, we have decided to adopt Positive Unlabeled (PU) Learning in subsequent updates. This classification method can be applied to datasets such as ours, which contain only positive classes and lack negative ones [1]. We used the miRAW dataset to enable a horizontal comparison of our method with traditional sequence-based prediction approaches. We acknowledge that miRAW may overlook some biological insights, and we plan to optimize the construction of test datasets in the future. Some preliminary explorations have already been conducted, and the relevant code is available on GitHub.
Furthermore, we will make the following revisions: 1) We will clearly specify the version of miRBase and incorporate more miRNA-related databases. 2) Conduct a further literature review on miRNA biological mechanisms to enhance the quality of the manuscript in biology. 3) Perform a more comprehensive evaluation of the model’s performance. 4) Attempt to identify some representative MTIs that have been overlooked by existing prediction tools but can be predicted by our proposed method.
References
(1) Li, F., Dong, S., Leier, A., Han, M., Guo, X., Xu, J., ... & Song, J. (2022). Positive-unlabeled learning in bioinformatics and computational biology: a brief review. Briefings in Bioinformatics, 23(1), bbab461.
(2) Huang, Z., Shi, J., Gao, Y., Cui, C., Zhang, S., Li, J., ... & Cui, Q. (2019). HMDD v3. 0: a database for experimentally supported human microRNA–disease associations. Nucleic acids research, 47(D1), D1013-D1017.
(3) Wang, H., & Ho, C. (2023). The human pre-miRNA distance distribution for exploring disease association. International Journal of Molecular Sciences, 24(2), 1009.
(4) Mitra, R., Adams, C. M., Jiang, W., Greenawalt, E., & Eischen, C. M. (2020). Pan-cancer analysis reveals cooperativity of both strands of microRNA that regulate tumorigenesis and patient survival. Nature Communications, 11(1), 968.
eLife Assessment
This is an important paper that reports in vivo physiological abnormalities in the hippocampus of a rat model of traumatic brain injury (TBI). In this study, authors focused on changes in theta-gamma phase coupling and action potential entrainment to theta, phenomena hypothesized to be critical for cognition. The authors provide convincing evidence of deficits in both features post-TBI and contributes new understanding to how disruptions in oscillatory coordination and spike timing may relate to cognitive impairment.
Reviewer #1 (Public review):
Summary:
This study examines how traumatic brain injury (TBI) alters hippocampal network dynamics and single-unit activity in awake, behaving rats. Using laminar recordings, the authors report reductions in theta power, theta-gamma phase-amplitude coupling, and spike-field entrainment, alongside impairments in spatial memory performance.
Strengths of the study include the use of high-density laminar electrodes to localize activity across hippocampal layers and the integration of electrophysiological and behavioral measures. Analyses that consider behavioral state and account for broadband power changes improve confidence in the interpretation of oscillatory effects. Additional controls suggest that the observed differences are unlikely to be explained by gross motor or motivational deficits. The reported relationships between theta amplitude, phase-amplitude coupling, and spike entrainment provide useful insight into how network coordination is disrupted following injury.
There are a few minor weaknesses. The analyses of single-unit activity across environments are relatively limited, and more comprehensive approaches to characterizing spatial coding would strengthen conclusions about how TBI impacts hippocampal representations. The behavioral assessment relies primarily on a single task, which constrains the interpretation of the cognitive deficits. In addition, the relatively small number of animals is a limitation, although this is partially mitigated by the number of recorded units and the consistency of effects across measures.
Overall, this work provides a careful characterization of hippocampal circuit dysfunction following TBI and contributes to understanding how disruptions in oscillatory coordination and spike timing may relate to cognitive impairment.
Comments on revisions:
The authors have adequately addressed all of my concerns.
Reviewer #3 (Public review):
Summary:
In this study, authors studied the effects of traumatic brain injury created by LFPI procedure on the CA1 at network level. The major findings in this study seem to be that the TBI reduces theta and gamma powers in CA1, reduces phase amplitude coupling in between theta and gamma bands as well as disrupts the gamma entrainment of interneurons. I think the authors have made some important discoveries that could help advance the understanding of TBI effects at physiological level, however, more investigations into deciphering the relationship of the behavioral and brain states to the observed effects would help clarify the interpretations for the readers.
Strengths:
The authors in this study were able to combine behavioral verification of the TBI model with the laminar electrophysiological recordings of CA1 region to bring forward network level anomalies such as the temporal coordination of network level oscillations as well as in the firing of the interneurons. Indeed, it seems that the findings may serve future studies to functionally better understand and/or refine the therapies for the TBI.
Weaknesses:
Discoveries made in the paper and their broad interpretations can be helped with further characterization and comparison among the brain and behavioral states both during immobility and movement. The impact of brain injury in several parts of the brain can alter brain wide LFP and/or behavior. The altered behavior and/or LFP patterns might then lead to reduced spiking and unreliable LFP oscillations in the hippocampus. Hence, claims made in abstract such as "These results reveal deficits in information encoding and retrieval schemes essential to cognition that likely underlie TBI-associated learning and memory impairments, and elucidate potential targets for future neuromodulation therapies" does not have enough evidence in testing whether the disruptions were information encoding and retrieval related or due to sensory-motor and/or behavioral deficits that could also occur during TBI.
Movement velocity is already known to be correlated to the entrainment of spikes with the theta rhythm and also in some cases with the gamma oscillations. So, it is of importance to disentangle the differences in behavioral variables and the observed effects. As an example, the author's claims of disrupted temporal coding (as shown in the graphical abstract) might have suffered from these confounds. The observed results of reduced entrainment might on one hand be due to the decreased LFP power (induced by injury in different brain areas) resulting in altered behavior and/or the unreliable oscillations of the LFP bands such as theta and gamma, rather than memory encoding and retrieval related disruption of spikes synchrony to the rhythms, while on the other hand they may simply be due to reduced excitability in the neurons particularly in the behavioral and brain state in which the effects were observed, rather than disrupted temporal code. Hence, further investigations into dissociating these factors could help readers mechanistically understand the interesting results observed by the authors.
Comments on revisions:
The authors have substantially improved the manuscript in response to the previous reviews. In particular, the revisions addressing the issue of behavioral deficits that could be caused due to the TBI, which were surprisingly not present (if anything minimal) in the injured rats, have strengthened the study and improved the support for the main conclusions. Overall, the manuscript is now clearer and more rigorous. Authors have also addressed all the minor points raised in the study. As a result, the study is now solid, with the major findings broadly supported by the data.