BDSC:84480
DOI: 10.1038/s42003-025-09323-x
Resource: RRID:BDSC_84480
Curator: @nmaralla
SciCrunch record: RRID:BDSC_84480
BDSC:84480
DOI: 10.1038/s42003-025-09323-x
Resource: RRID:BDSC_84480
Curator: @nmaralla
SciCrunch record: RRID:BDSC_84480
BDSC:84479
DOI: 10.1038/s42003-025-09323-x
Resource: RRID:BDSC_84479
Curator: @nmaralla
SciCrunch record: RRID:BDSC_84479
BDSC:84478
DOI: 10.1038/s42003-025-09323-x
Resource: RRID:BDSC_84478
Curator: @nmaralla
SciCrunch record: RRID:BDSC_84478
BDSC:84477
DOI: 10.1038/s42003-025-09323-x
Resource: RRID:BDSC_84477
Curator: @nmaralla
SciCrunch record: RRID:BDSC_84477
BDSC:84476
DOI: 10.1038/s42003-025-09323-x
Resource: RRID:BDSC_84476
Curator: @nmaralla
SciCrunch record: RRID:BDSC_84476
BDSC:84475
DOI: 10.1038/s42003-025-09323-x
Resource: RRID:BDSC_84475
Curator: @nmaralla
SciCrunch record: RRID:BDSC_84475
BDSC:84474
DOI: 10.1038/s42003-025-09323-x
Resource: RRID:BDSC_84474
Curator: @nmaralla
SciCrunch record: RRID:BDSC_84474
BDSC:84473
DOI: 10.1038/s42003-025-09323-x
Resource: RRID:BDSC_84473
Curator: @nmaralla
SciCrunch record: RRID:BDSC_84473
BDSC:84472
DOI: 10.1038/s42003-025-09323-x
Resource: RRID:BDSC_84472
Curator: @nmaralla
SciCrunch record: RRID:BDSC_84472
BDSC:84471
DOI: 10.1038/s42003-025-09323-x
Resource: RRID:BDSC_84471
Curator: @nmaralla
SciCrunch record: RRID:BDSC_84471
BDSC:84470
DOI: 10.1038/s42003-025-09323-x
Resource: RRID:BDSC_84470
Curator: @nmaralla
SciCrunch record: RRID:BDSC_84470
BDSC:84468
DOI: 10.1038/s42003-025-09323-x
Resource: RRID:BDSC_84468
Curator: @nmaralla
SciCrunch record: RRID:BDSC_84468
BDSC:84466
DOI: 10.1038/s42003-025-09323-x
Resource: RRID:BDSC_84466
Curator: @nmaralla
SciCrunch record: RRID:BDSC_84466
BDSC:84465
DOI: 10.1038/s42003-025-09323-x
Resource: RRID:BDSC_84465
Curator: @nmaralla
SciCrunch record: RRID:BDSC_84465
BDSC:84463
DOI: 10.1038/s42003-025-09323-x
Resource: RRID:BDSC_84463
Curator: @nmaralla
SciCrunch record: RRID:BDSC_84463
BDSC:84462
DOI: 10.1038/s42003-025-09323-x
Resource: RRID:BDSC_84462
Curator: @nmaralla
SciCrunch record: RRID:BDSC_84462
BDSC:84461
DOI: 10.1038/s42003-025-09323-x
Resource: RRID:BDSC_84461
Curator: @nmaralla
SciCrunch record: RRID:BDSC_84461
BDSC:84459
DOI: 10.1038/s42003-025-09323-x
Resource: RRID:BDSC_84459
Curator: @nmaralla
SciCrunch record: RRID:BDSC_84459
BDSC:84457
DOI: 10.1038/s42003-025-09323-x
Resource: RRID:BDSC_84457
Curator: @nmaralla
SciCrunch record: RRID:BDSC_84457
BDSC:84455
DOI: 10.1038/s42003-025-09323-x
Resource: RRID:BDSC_84455
Curator: @nmaralla
SciCrunch record: RRID:BDSC_84455
BDSC:84454
DOI: 10.1038/s42003-025-09323-x
Resource: RRID:BDSC_84454
Curator: @nmaralla
SciCrunch record: RRID:BDSC_84454
BDSC:84452
DOI: 10.1038/s42003-025-09323-x
Resource: RRID:BDSC_84452
Curator: @nmaralla
SciCrunch record: RRID:BDSC_84452
BDSC:84449
DOI: 10.1038/s42003-025-09323-x
Resource: RRID:BDSC_84449
Curator: @nmaralla
SciCrunch record: RRID:BDSC_84449
BDSC:84447
DOI: 10.1038/s42003-025-09323-x
Resource: RRID:BDSC_84447
Curator: @nmaralla
SciCrunch record: RRID:BDSC_84447
BDSC:84446
DOI: 10.1038/s42003-025-09323-x
Resource: RRID:BDSC_84446
Curator: @nmaralla
SciCrunch record: RRID:BDSC_84446
BDSC:84444
DOI: 10.1038/s42003-025-09323-x
Resource: RRID:BDSC_84444
Curator: @nmaralla
SciCrunch record: RRID:BDSC_84444
BDSC:84443
DOI: 10.1038/s42003-025-09323-x
Resource: RRID:BDSC_84443
Curator: @nmaralla
SciCrunch record: RRID:BDSC_84443
BDSC:80574
DOI: 10.1038/s42003-025-09323-x
Resource: RRID:BDSC_80574
Curator: @nmaralla
SciCrunch record: RRID:BDSC_80574
BDSC:78060
DOI: 10.1038/s42003-025-09323-x
Resource: RRID:BDSC_78060
Curator: @nmaralla
SciCrunch record: RRID:BDSC_78060
BDSC:77721
DOI: 10.1038/s42003-025-09323-x
Resource: RRID:BDSC_77721
Curator: @nmaralla
SciCrunch record: RRID:BDSC_77721
BDSC:7405
DOI: 10.1038/s42003-025-09323-x
Resource: RRID:BDSC_7405
Curator: @nmaralla
SciCrunch record: RRID:BDSC_7405
BDSC:64721
DOI: 10.1038/s42003-025-09323-x
Resource: RRID:BDSC_64721
Curator: @nmaralla
SciCrunch record: RRID:BDSC_64721
BDSC:59603
DOI: 10.1038/s42003-025-09323-x
Resource: RRID:BDSC_59603
Curator: @nmaralla
SciCrunch record: RRID:BDSC_59603
BDSC:59432
DOI: 10.1038/s42003-025-09323-x
Resource: RRID:BDSC_59432
Curator: @nmaralla
SciCrunch record: RRID:BDSC_59432
BDSC:59208
DOI: 10.1038/s42003-025-09323-x
Resource: RRID:BDSC_59208
Curator: @nmaralla
SciCrunch record: RRID:BDSC_59208
BDSC:55728
DOI: 10.1038/s42003-025-09323-x
Resource: RRID:BDSC_55728
Curator: @nmaralla
SciCrunch record: RRID:BDSC_55728
BDSC:55727
DOI: 10.1038/s42003-025-09323-x
Resource: RRID:BDSC_55727
Curator: @nmaralla
SciCrunch record: RRID:BDSC_55727
BDSC:55562
DOI: 10.1038/s42003-025-09323-x
Resource: RRID:BDSC_55562
Curator: @nmaralla
SciCrunch record: RRID:BDSC_55562
BDSC:55544
DOI: 10.1038/s42003-025-09323-x
Resource: RRID:BDSC_55544
Curator: @nmaralla
SciCrunch record: RRID:BDSC_55544
BDSC:55518
DOI: 10.1038/s42003-025-09323-x
Resource: RRID:BDSC_55518
Curator: @nmaralla
SciCrunch record: RRID:BDSC_55518
BDSC:53802
DOI: 10.1038/s42003-025-09323-x
Resource: RRID:BDSC_53802
Curator: @nmaralla
SciCrunch record: RRID:BDSC_53802
BDSC:53467
DOI: 10.1038/s42003-025-09323-x
Resource: RRID:BDSC_53467
Curator: @nmaralla
SciCrunch record: RRID:BDSC_53467
BDSC:43509
DOI: 10.1038/s42003-025-09323-x
Resource: RRID:BDSC_43509
Curator: @nmaralla
SciCrunch record: RRID:BDSC_43509
BDSC:40669
DOI: 10.1038/s42003-025-09323-x
Resource: RRID:BDSC_40669
Curator: @nmaralla
SciCrunch record: RRID:BDSC_40669
BDSC:38174
DOI: 10.1038/s42003-025-09323-x
Resource: RRID:BDSC_38174
Curator: @nmaralla
SciCrunch record: RRID:BDSC_38174
BDSC:37264
DOI: 10.1038/s42003-025-09323-x
Resource: RRID:BDSC_37264
Curator: @nmaralla
SciCrunch record: RRID:BDSC_37264
BDSC:36290
DOI: 10.1038/s42003-025-09323-x
Resource: RRID:BDSC_36290
Curator: @nmaralla
SciCrunch record: RRID:BDSC_36290
BDSC:35974
DOI: 10.1038/s42003-025-09323-x
Resource: RRID:BDSC_35974
Curator: @nmaralla
SciCrunch record: RRID:BDSC_35974
BDSC:33832
DOI: 10.1038/s42003-025-09323-x
Resource: RRID:BDSC_33832
Curator: @nmaralla
SciCrunch record: RRID:BDSC_33832
BDSC:33160
DOI: 10.1038/s42003-025-09323-x
Resource: RRID:BDSC_33160
Curator: @nmaralla
SciCrunch record: RRID:BDSC_33160
BDSC:33079
DOI: 10.1038/s42003-025-09323-x
Resource: RRID:BDSC_33079
Curator: @nmaralla
SciCrunch record: RRID:BDSC_33079
BDSC:32197
DOI: 10.1038/s42003-025-09323-x
Resource: RRID:BDSC_32197
Curator: @nmaralla
SciCrunch record: RRID:BDSC_32197
BDSC:26080
DOI: 10.1038/s42003-025-09323-x
Resource: RRID:BDSC_26080
Curator: @nmaralla
SciCrunch record: RRID:BDSC_26080
BDSC:25872
DOI: 10.1038/s42003-025-09323-x
Resource: RRID:BDSC_25872
Curator: @nmaralla
SciCrunch record: RRID:BDSC_25872
BDSC:25756
DOI: 10.1038/s42003-025-09323-x
Resource: RRID:BDSC_25756
Curator: @nmaralla
SciCrunch record: RRID:BDSC_25756
BDSC:25706
DOI: 10.1038/s42003-025-09323-x
Resource: RRID:BDSC_25706
Curator: @nmaralla
SciCrunch record: RRID:BDSC_25706
BDSC:24651
DOI: 10.1038/s42003-025-09323-x
Resource: RRID:BDSC_24651
Curator: @nmaralla
SciCrunch record: RRID:BDSC_24651
BDSC:21396
DOI: 10.1038/s42003-025-09323-x
Resource: RRID:BDSC_21396
Curator: @nmaralla
SciCrunch record: RRID:BDSC_21396
BDSC:18840
DOI: 10.1038/s42003-025-09323-x
Resource: RRID:BDSC_18840
Curator: @nmaralla
SciCrunch record: RRID:BDSC_18840
BDSC:18116
DOI: 10.1038/s42003-025-09323-x
Resource: RRID:BDSC_18116
Curator: @nmaralla
SciCrunch record: RRID:BDSC_18116
BDSC:1767
DOI: 10.1038/s42003-025-09323-x
Resource: RRID:BDSC_1767
Curator: @nmaralla
SciCrunch record: RRID:BDSC_1767
BDSC:17582
DOI: 10.1038/s42003-025-09323-x
Resource: RRID:BDSC_17582
Curator: @nmaralla
SciCrunch record: RRID:BDSC_17582
DGRC:113244
DOI: 10.1038/s42003-025-09323-x
Resource: RRID:Addgene_113244
Curator: @nmaralla
SciCrunch record: RRID:Addgene_113244
DGRC:113244
DOI: 10.1038/s42003-025-09323-x
Resource: RRID:Addgene_113244
Curator: @nmaralla
SciCrunch record: RRID:Addgene_113244
MGI_2182488
DOI: 10.1038/s41586-026-10102-9
Resource: RRID:IMSR_JAX:000664
Curator: @nmaralla
SciCrunch record: RRID:IMSR_JAX:000664
RRID:IMSR_JAX
DOI: 10.1038/s41467-026-70754-z
Resource: RRID:IMSR_JAX:013044
Curator: @evieth
SciCrunch record: RRID:IMSR_JAX:013044
BDSC:83720
DOI: 10.1038/s41467-026-70074-2
Resource: RRID:BDSC_83720
Curator: @maulamb
SciCrunch record: RRID:BDSC_83720
BDSC:25681
DOI: 10.1038/s41467-026-70074-2
Resource: RRID:BDSC_25681
Curator: @maulamb
SciCrunch record: RRID:BDSC_25681
RRID:AB_142165
DOI: 10.1038/s41467-026-68662-3
Resource: RRID:AB_143165
Curator: @nmaralla
SciCrunch record: RRID:AB_143165
Jackson Laboratory Cat_JAX
DOI: 10.1016/j.stem.2026.04.012
Resource: RRID:IMSR_JAX:005557
Curator: @nmaralla
SciCrunch record: RRID:IMSR_JAX:005557
RRID:_AB_493460
DOI: 10.1016/j.isci.2026.114738
Resource: RRID:AB_493460
Curator: @nmaralla
SciCrunch record: RRID:AB_493460
RRID:AB_16262278
DOI: 10.1016/j.isci.2026.114738
Resource: RRID:AB_1626278
Curator: @nmaralla
SciCrunch record: RRID:AB_1626278
RRID:AB_3735054
DOI: 10.1016/j.cmet.2026.01.008
Resource: RRID:AB_3735054
Curator: @nmaralla
SciCrunch record: RRID:AB_3735054
RRID:AB_3734921
DOI: 10.1016/j.cmet.2026.01.008
Resource: RRID:AB_3734921
Curator: @nmaralla
SciCrunch record: RRID:AB_3734921
RRID:AB_2074882
DOI: 10.1007/s11010-026-05491-4
Resource: RRID:AB_2074882
Curator: @nmaralla
SciCrunch record: RRID:AB_2074882
RRID:AB_10597232
DOI: 10.1007/s11010-026-05491-4
Resource: RRID:AB_10597232
Curator: @nmaralla
SciCrunch record: RRID:AB_10597232
RRID:SCR_02
DOI: 10.1007/s00395-026-01182-9
Resource: RRID:SCR_021068
Curator: @dhovakimyan1
SciCrunch record: RRID:SCR_021068
RRID:SCR_016955
DOI: 10.1002/advs.202509340
Resource: RRID:SCR_016955
Curator: @nmaralla
SciCrunch record: RRID:SCR_016955
RRID:CVCL_0003
DOI: 10.1002/advs.202509340
Resource: RRID:CVCL_0003
Curator: @nmaralla
SciCrunch record: RRID:CVCL_0003
RRID:AB_3099585
DOI: 10.1002/advs.202509340
Resource: RRID:AB_3099585
Curator: @nmaralla
SciCrunch record: RRID:AB_3099585
RRID:AB_303023
DOI: 10.1002/advs.202509340
Resource: RRID:AB_303023
Curator: @nmaralla
SciCrunch record: RRID:AB_303023
RRID:AB_2884975
DOI: 10.1002/advs.202509340
Resource: RRID:AB_2884975
Curator: @nmaralla
SciCrunch record: RRID:AB_2884975
RRID:AB_2750883
DOI: 10.1002/advs.202509340
Resource: RRID:AB_2750883
Curator: @nmaralla
SciCrunch record: RRID:AB_2750883
RRID:AB_2722503
DOI: 10.1002/advs.202509340
Resource: RRID:AB_2722503
Curator: @nmaralla
SciCrunch record: RRID:AB_2722503
Author response:
eLife Assessment
This valuable study reports that the ALDH-abundant cells display stem cell properties and may play a key role in the endometrial epithelial development in the mouse. The data supporting the main conclusion are solid, although further improvements are needed to strengthen the conclusions. This work will be of great interest to reproductive biologists and biomedical researchers working on women's reproductive health.
We thank the reviewers and editor for their critical reading and assessment of our manuscript. We carefully considered each of the points raised by the reviewers. In this document and in the edited manuscript and figures, we have carefully addressed each of the comments and requested modifications. In light of these changes, we expect that you will find that the manuscript has improved.
We indicate our responses to the reviewers below in blue font and highlight the changes in the manuscript using the line numbers corresponding to the tracked version of the revised document.
Public Reviews:
Reviewer #1 (Public review):
The manuscript by Tang et al. characterizes the expression dynamics and functional roles of aldehyde dehydrogenase 1 activity in uterine physiology. Using a combination of in vivo lineage tracing and cell ablation coupled with organoid culture, the authors propose that Aldh1a1 lineage-marked cells contribute to uterine gland development and epithelial regeneration. The descriptive data will be of interest to reproductive biologists and clinicians and will build on established hypotheses in the field. The manuscript is well written and scientifically sound; however, several experimental limitations and interpretation caveats should be addressed.
We thank the reviewer for their comments and expert assessment of our paper.
(1) The methods surrounding the passage number and duration of culture following sorting prior to transcriptomic profiling should be clarified in the figure legends. Related to this, the representative images in Figures 1D and 1E do not appear consistent with the quantification presented in Figures 1F-H and should be reconciled.
Thanks for this comment. We have now clarified this in the Figure 1 legend as follows,
Lines 1026-1029: “Organoid formation assay performed immediately after luminal epithelial cell isolation and by plating equal numbers of viable ALDH<sup>LO</sup> (D) and ALDH<sup>HI</sup> (E) epithelial cells. ALDH<sup>LO</sup> and ALDH<sup>HI</sup> organoids were cultured for two weeks and passaged once prior to the organoid formation assays and transcriptomic analyses.”
Regarding the second comment, we recognize that the images we showed may not have been the most representative of our quantification. As such, we replaced them with the organoid images below so that they better reflect the quantification outlined in Figure 1F-H.
(2) The conclusion that ALDH1A1+ cells are enriched in populations with stem cell characteristics relies primarily on transcriptomic analysis. Protein-level co-localization should be performed to strengthen this claim.
We thank the reviewer for this comment. Unfortunately, the antibodies for many of these stem cell markers (such as LGR5, AXIN2, and SUSD2) are not well-suited for immunostaining. Others that have been proposed in human and are amenable to immunostaining are not suitable markers for mouse endometrial stem cells (such as CDH2). We hope that by showing that ALDH1A1 is expressed in patterns that are similar to the previously published stem cell markers LGR5 and AXIN2 (i.e., throughout the epithelium in the developing uterus and subsequently enriched in the tips of the endometrial glands of adult mice), along with transcriptomic studies, we can demonstrate its utility as a marker for mouse endometrial stem cells.
(3) The overlap of 19 genes between the data set here and AXIN2 HI data is presented as evidence of shared stemness identity, but no statistical assessment of this overlap is provided. A hypergeometric test should be performed to determine whether this overlap is greater than expected by chance.
Thank you for this suggestion. We have performed a hypergeometric test and determined that the reported shared genes between the two datasets are greater than is expected by chance. We have updated the results section to state the following:
Lines 133-141: "We determined that the overlap between ALDH<sup>HI</sup> and Axin2<sup>+</sup> stemness marker genes was significantly greater than expected by chance for both upregulated (21/346 genes, 1.81-fold enrichment, p = 0.0067) and downregulated (19/674 genes, 1.67-fold enrichment, p = 0.021) gene sets (hypergeometric test, universe = 23,182 genes)."
(4) The impact of tamoxifen injection on Aldh1a1 expression should be characterized in the neonatal uterus, as tamoxifen itself has known estrogenic activity that could confound interpretation of the lineage tracing results at early postnatal timepoints.
Although we took measures to control for this possibility by using multiple time-points and models to trace the impact of Aldh1a1<sup>+</sup> cells in development and adulthood, we recognize the importance of this comment and acknowledge that this is a limitation in the design of our study. We have included the following text to the Discussion acknowledging this point:
Lines 434-442: “Given the well-documented impacts of tamoxifen for lineage tracing studies, it is imperative to use doses of tamoxifen that will minimize estrogenic impacts and result in off-target effects (Rios et al., 2016). This often requires administration at doses that will achieve maximal recombination of the desired gene, while ensuring that the potential deleterious impacts of tamoxifen are minimized (Chen et al., 2023; Pimeisl et al., 2013). The cre/ERT2 tamoxifen inducible model is widely used to study uterine biology where it serves as a useful tool to interrogate the spatiotemporal impact of key genes, either through inactivation or for lineage tracing. Despite its widely documented utility across many tissue types and developmental timepoints, the use of tamoxifen and its impacts on the endometrium remain a limitation of our study, which we tried to address by implementing multiple timepoints, doses, and orthogonal assays in our experimental design.”
(4b) Related to this, while low-dose tamoxifen is shown to label individual cells within 24 hours of injection, the translation dynamics of the label following Cre-mediated recombination can require up to 72 hours. The presence of only a few labeled clones at PND8 but multiple separate clones per cross-section at later timepoints warrants discussion and may reflect labeling kinetics rather than clonal expansion.
The reviewer raises an important point. We agree that the 72hr-translation kinetics of the cre-mediated recombination is a legitimate consideration for interpreting our data and we have added the text below to the Discussion section acknowledging this point.
We have addressed this by adding the following text to the discussion:
Lines 418-423: We hypothesized that the singly labeled cells observed from one day tracing experiments expanded in a clonal fashion during the various timepoints we measured. We note that the translation kinetics of the labeled cells following cre-mediated recombination may contribute to the limited labeling observed at PND8/PND15 and there is a potential for delayed labeling of cells between 24 and 72 hours of tamoxifen administration. However, the continuous increase in labeled cells at the subsequent timepoints favors our interpretation of clonal expansion as the primary explanation.
(5) It would strengthen the in vivo ablation data to validate the degree of cell death following diphtheria toxin treatment directly. It is possible that a general decrease in cell number rather than specific loss of a stem cell population is responsible for the observed reduction in gland number and FOXA2 expression (Tongtong et al 2017).
We agree that this is an important control to incorporate into our experimental design. To rule out this possibility, we performed immunohistochemistry of cleaved caspase 3 in the uterine tissues of DTR<sup>flox/flox</sup> and DTR<sup>flox/flox</sup>;Aldh1a1<sup>cre/ERT2</sup> mice 4 days after administration of diphtheria toxin. The results indicate similar levels of cleaved caspase 3 detection in both genotypes, suggesting that the decrease in FOXA2+ cells is not due to non-specific cell death, but rather the result of ALDH1A1<sup>+</sup> cells. These data and the following text have been added to the manuscript:
Lines 321-325: “We determined that the decreased in FOXA2<sup>+</sup> cells in the experimental mice was not the result of non-specific DT-mediated cell death, as similar levels of cleaved caspase 3-positive cells were detected in the DT-treated control ROSA26<sup>DTR/DTR</sup> and ROSA26<sup>DTR/DTR</sup>;Aldh1a1<sup>cre/ERT2/+</sup> mice 4 days post-diphtheria toxin administration (Figure S3G-H’).”
(6) The lineage tracing data in the postpartum endometrium demonstrate that Aldh1a1-marked cells are present during regeneration, but it remains unclear whether these cells are preferentially activated or expanded in response to tissue injury. Coupling these studies with diphtheria toxin-mediated ablation during active regeneration would more directly test the proposed regenerative role of this population.
This is a great point and one that we would be very interested in pursuing as follow-up studies in our future work. Regretfully, due to the long generation time and experimental procedures associated with these proposed studies, we are not able to include these experiments in the current manuscript. Thus, we have changed our wording and conclusions throughout the manuscript to be less definitive in terms of the role of Aldh1a1 in regeneration, since this will be the focus of future studies
The contribution of stromal Aldh1a1 lineage-positive cells is underexplored in the discussion, given the lineage tracing data showing stromal labeling across multiple timepoints and its potential relevance to mesenchymal-to-epithelial transition.
Thank you for the suggestion. We have now expanded this section in the Discussion to include the following:
Lines 497-505: We also found ALDH1A1<sup>+</sup> stromal cells were more prevalent when tracing began in adult mice. Other studies have shown that mesenchymal cells contribute to endometrial regeneration in the postpartum phase or after induced menses through a process of MET (Cousins et al., 2014; Kirkwood et al., 2022; Li et al., 2025). Similarly, lineage tracing studies have shown that MET is an active process and contributes to epithelial cell regeneration in the post-partum phase (Huang et al., 2012; Patterson et al., 2013). Although this is an area of active investigation in the field, with some contradicting reports, it is plausible to hypothesize that endometrial tissue has the capacity to undergo wound-healing and regeneration via several mechanisms (Ang et al., 2023; Ghosh et al., 2020). The process of MET in wound healing is widely documented in other organs, such as the kidney, liver and lung, where MET is associated with depletion of the resident epithelial cell pool (Bi et al., 2012; Niayesh-Mehr et al., 2024; Zeisberg et al., 2005).
Finally, the word 'control' may overstate the functional evidence presented. 'Contribute' may be more accurate given the partial and context-dependent nature of the phenotypes observed.
We agree with the reviewer’s point that control may overstate the evidence that we provide in the manuscript. To reflect this, we have edited the manuscript title and text to address this suggestion.
Reviewer #2 (Public review):
Tang et al. investigated the contribution of Aldh1a1+ cells, as putative stem/progenitor cells, to endometrial development, maintenance during the estrous cycle, and postpartum repair in mouse models. They employed in vitro organoid formation and in vivo lineage tracing models coupled with RNA-seq to test the stem-ness of Aldh1a1+ cells. They found that mouse endometrial cells with high ALDH activity (using the ALDEFLUOR assay) formed more and larger organoids and were enriched for stem/progenitor cell gene signatures. Similar results were shown using endometrial cells from a human patient sample. Epithelial ALDH1A1 expression was shown to be hormonally regulated, becoming more restricted to the glands, a putative epithelial stem cell niche, under estrogen stimulation. Using lineage-tracing initiated postnatally/prepubertally, Aldh1a1+ epithelial cells were shown to expand, contributing to both the luminal and glandular epithelium into adulthood, whereas adult initiation of labeling showed expansion of stromal Aldh1a1+ cells but not epithelial. Postnatal ablation of single-labeled Aldh1a1+ epithelial cells resulted in impaired gland development. Lastly, Aldh1a1-lineage traced cells (adult labeled) were present during postpartum endometrial repair as were epithelial/mesenchymal transitional cells.
This study addresses an important area of research in the field of endometrial stem/progenitor cell biology. The authors are commended for their use of multiple complementary methods, including lineage tracing, DTR-mediated cell ablation, organoid assays, and RNA-seq in mouse and human models to assess the stem-like nature of Aldh1a1+ cells. The data support the stem/progenitor phenotype of Aldh1a1+ epithelial cells during endometrial development; however, there are noted discrepancies between organoid formation assays and lineage tracing experiments regarding the stemness of Aldh1a1+ epithelial cells in adults. Specifically, organoids were generated from adult cells and demonstrated in vitro stem cell activity; however, in vivo lineage-tracing of adult cells either during the estrous cycle or postpartum repair does not show expansion of Aldh1a1+ cells, suggesting they do not have stem/progenitor activity. Additionally, the stem-ness of epithelial vs stromal Aldh1a1+ cells is confounded in the study because epithelial cells were not purified for organoid experiments, epithelial cells were not exclusively lineage-traced as stromal cells were also labeled, and mesenchymal-epithelial transition was suggested to occur during postpartum repair. The following specific comments are presented to detail these concerns:
We thank the reviewer for their critical reading of our manuscript and constructive comments.
(1) The statement in the brief summary, "...critical for lifelong endometrial regeneration," is not supported by the data provided.
We have edited the brief summary to exclude this statement, it now reads as follows:
Lines 4-5: “We uncover ALDH1A1<sup>+</sup> cells as a group of hormone sensitive stem cells contributing to endometrial development and regeneration.”
(2) AlDH1A1 is not restricted to the endometrial epithelium, and epithelial cells were not purified by flow cytometry for experiments in Figure 1. Figure 2 clearly shows the presence of mesenchymal cells, even using the described method for enriching for epithelial cells. Therefore, contaminating mesenchymal cells with high ALDH activity may confound the experimental results in Figure 1, either through promoting epithelial cell growth or through MET. The authors should provide clear evidence of epithelial purity in organoid experiments or that mesenchymal cells are not contained in the ALDHhi population. These comments also apply to the human organoid experiments in Figure 7.
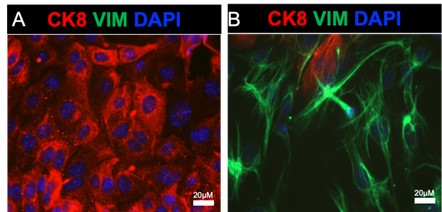
We thank the reviewer for raising this important point. Our group has been using the enzymatic method to routinely separate epithelial from stromal cell populations from the mouse uterus (see references dating back to 2015, PMID 26721398, 28324064, 34099644). In these experiments we typically obtain >98% purity in the epithelial and stromal cell compartments, respectively. We can directly observe this purity in the immunofluorescence images shown below, where mouse endometrial epithelial cells and stromal cells were enzymatically separated and immunostained with E-cadherin and vimentin antibodies to detect epithelial and mesenchymal cells in both cell preparations. The images show very few contaminating epithelial and stromal cells in either cell preparation. We have observed similar results when preparing epithelial and stromal cell preparation from the human endometrium, where the epithelial cell organoids display high purity with ~100% epithelial cell expression when we perform immunostaining.
Author response image 1.
Purity of mouse endometrial epithelial cells obtained via enzymatic and mechanical dissociation. A-B) Shows the epithelial (A) and stromal (B) cells plated on glass coverslips and immunostained with an epithelial cell marker (cytokeratin 8, red), a stromal cell marker (vimentin, green), and DAPI.
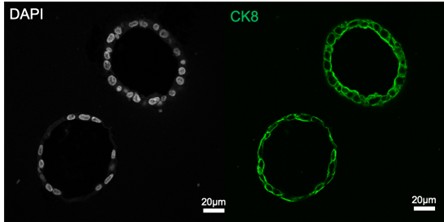
Author response image 2.
Human endometrial epithelial organoids were fixed and immunostained with cytokeratin 8 (green) and DAPI. The images are typical for our epithelial cell cultures and demonstrate that all epithelial cells are CK8-positive.
(3) Lines 186-187: Susd2 was increased in EpSC clusters, yet this is a mesenchymal stem/progenitor marker in humans. The authors should discuss the implications of this.
We thank the reviewer for highlighting this. We have now included the following in our Discussion to address this point:
Lines 528-533: Clustering with this population of EpSCs were Susd2<sup>+</sup> cells, which are well-characterized mesenchymal progenitors that are enriched in the perivascular regions of the human endometrium (Darzi et al., 2016; Khanmohammadi et al., 2021). The presence of Susd2<sup>+</sup> cells, while unexpected in an epithelial stem cell niche, could indicate the presence of a transitional mesenchymal or perivascular cell that is differentiating into epithelium. Evidence for both mesenchymal and Nestin2<sup>+</sup> pericytes have been recently described in the mouse endometrial epithelium (Kirkwood et al., 2022; Li et al., 2025).
(4) In Figure 5, RFP+ epithelial cells should be quantified as in previous figures to substantiate the statement in lines 279-280, "At PPD5, the proportion of RFP+ epithelial cells had expanded relative to PPD1 and PPD3 (Figure 5E-E')." Especially because in the low mag images (C-E), RFP+ epithelial cells appear to be most abundant at PPD1 and decrease at PPD3 and PPD5, suggesting that they may not be involved in endometrial regeneration/repair (contradicting the interpretation in line 285). Further, if there is in fact a decrease over postpartum repair, then regeneration should be removed from the title of the manuscript. RFP+ stromal cells should also be quantified.
We appreciate this reviewer’s comment and agree that as stated, the conclusion is not fully supported by the data. To address this comment, we have edited the results so that they clearly indicate the results and remove any ambiguity:
As requested, we quantified the number of RFP+ stromal and epithelial cells during the postpartum phase and noted that RFP+ cells were prominent in the stromal compartment of the endometrium. While RFP+ epithelial were also observed during these timepoints, they were less abundant than RFP+ stromal cells. Because the number of RFP+ cells did not significantly change over the postpartum phases in neither the stromal nor epithelial compartment, we have modified our conclusion to state that ALDH1A1+ cells are transiently detected in the regenerating endometrium.
Results:
Lines 286-295: “By analyzing the uterine tissues near the placental detachment site, we observed that RFP positive cells were prominent in the endometrial stromal cells that were adjacent to the luminal epithelium (Figure 5C-C’, green arrows). RFP<sup>+</sup> cells were also observed in the stromal cells near the placental detachment sites at PPD1 and PPD3 (Figure 5D’-E’, red & blue arrows) and in limited luminal epithelial cells (Figure 5D”,E”). Quantification of RFP<sup>+</sup> cells throughout these postpartum phases indicated that stromal cells had more frequent ALDH1A1<sup>+</sup> stromal cells (360 ± 103, PPD1, n=3; 217 ± 107, PPD3, n=3; 254 ± 32, PPD5, n=4) than ALDH1A1<sup>+</sup> epithelial cells in the regenerating endometrium (65 ± 65, PPD1, n=3; 20 ± 10, PPD3, n=3; 114.25 ± 39, PPD5, n=4) (Figure S4).”
Discussion:
Lines 513-521: “We also noted that a majority of ALDH1A1<sup>+</sup> cells were localized to the active areas of endometrial regeneration near the placental detachment sites at PPD1 with a pronounced expression in the sub-epithelial stromal cells. As regeneration progressed, we continued to observe ALDH1A1<sup>+</sup> cells in the stromal compartment within the placental detachment sites at PPD3 and PPD5, with a progressive, but not statistically significant, increase in ALDH1A1<sup>+</sup> epithelial cells. Collectively, our data demonstrate that ALDH1A1<sup>+</sup> lineage cells participate in the restoration of endometrial architecture and functional compartments in the postpartum phase, even if their direct contribution is transient. Future detailed and mechanistic studies will be necessary to fully characterize their role in this process and their long-term consequence in postpartum regeneration.”
(5) For Figure 7F, it should be clearly stated in the main text that the results are from one patient sample and the data presented are experimental replicates, so as not to be confused with biological replicates (the same for Supplementary Figure S4). Were B and G in Figure 7 also from one patient?
Thanks for pointing this out. We have edited the figure legends in the main text and supplemental figures to indicate this.
Lines 337-338: “…main figures show representative results from one patient sample performed in technical replicates, with additional patient samples included in the supplement…”
(6) Lines 425-427: "Ovariectomized mice treated with 90-day E2 pellets, on the other hand, showed a complete restriction of ALDH1A1 to the glandular crypts." In Figure 2 S' ALDH1A1+ cells are visible in the LE (the staining is lighter than in the GE but looks real), contradicting this statement.
This is an important distinction. We have now edited this part of the manuscript to state:
Lines 459-462: “Ovariectomized mice treated with 90-day E2 pellets, on the other hand, showed enriched ALDH1A1 in the glandular crypts with weak luminal epithelial staining, while the ovariectomized controls had strong ALDH1A1 expression throughout the luminal and glandular epithelium.”
(7) Lines 466-467: "In cycling mice, we found sporadic cells that expressed both stromal and epithelial markers in the ALDHA1+ cells." These data are not presented.
We apologize for the confusion, this sentence has been removed from the discussion.
(8) These data support the role of Aldh1a1+ cells in endometrial epithelial development, but conclusions about their role in repair/regeneration should be tempered as the data are much weaker here.
We thank the reviewer for their overall assessment. To address this point, we have thoroughly edited the appropriate areas to temper the conclusions and ensure that they are strongly supported by our data. We have also edited the manuscript’s title to reflect this.
Reviewer #3 (Public review):
Summary:
Tan et al demonstrated the importance of ALDH-high cells in the epithelial development in the mouse endometrium, and these cells displayed properties of stem cells.
We thank the reviewer for their assessment of our manuscript.
Strengths:
The findings are solid, supported and validated through a combination of technical methods. I appreciated this combined use of mouse and human endometrial cells to strengthen the findings. Genomic results from a single-cell sequencing dataset were informative as they depicted the different stages of the estrus cycle during the regeneration process. Verification with immunostainings with various markers made it convincing for readers to visualize the cell's location, progression, and status at different timepoints. Utilizing human endometrial cells further demonstrated that the phenomenon observed in mice can be translated to humans.
This work will greatly advance the understanding of endometrial regeneration for reproductive biologists.
We thank the reviewer for their expert assessment and positive comments regarding our manuscript.
Weaknesses:
No major weaknesses were identified by this reviewer.
Reference
Ang, C.J., Skokan, T.D., and McKinley, K.L. (2023). Mechanisms of Regeneration and Fibrosis in the Endometrium. Annu Rev Cell Dev Biol 39, 197-221.
Bi, W.R., Jin, C.X., Xu, G.T., and Yang, C.Q. (2012). Bone morphogenetic protein-7 regulates Snail signaling in carbon tetrachloride-induced fibrosis in the rat liver. Exp Ther Med 4, 1022-1026.
Chen, M.Y., Zhao, F.L., Chu, W.L., Bai, M.R., and Zhang, D.M. (2023). A review of tamoxifen administration regimen optimization for Cre/loxp system in mouse bone study. Biomed Pharmacother 165, 115045. Cousins, F.L., Murray, A., Esnal, A., Gibson, D.A., Critchley, H.O., and Saunders, P.T. (2014). Evidence from a mouse model that epithelial cell migration and mesenchymal-epithelial transition contribute to rapid restoration of uterine tissue integrity during menstruation. PLoS One 9, e86378.
Cousins, F.L., Pandoy, R., Jin, S., and Gargett, C.E. (2021). The Elusive Endometrial Epithelial Stem/Progenitor Cells. Front Cell Dev Biol 9, 640319.
Darzi, S., Werkmeister, J.A., Deane, J.A., and Gargett, C.E. (2016). Identification and Characterization of Human Endometrial Mesenchymal Stem/Stromal Cells and Their Potential for Cellular Therapy. Stem Cells Transl Med 5, 1127-1132.
Ghosh, A., Syed, S.M., Kumar, M., Carpenter, T.J., Teixeira, J.M., Houairia, N., Negi, S., and Tanwar, P.S. (2020). In Vivo Cell Fate Tracing Provides No Evidence for Mesenchymal to Epithelial Transition in Adult Fallopian Tube and Uterus. Cell Rep 31, 107631.
Huang, C.C., Orvis, G.D., Wang, Y., and Behringer, R.R. (2012). Stromal-to-epithelial transition during postpartum endometrial regeneration. PLoS One 7, e44285.
Khanmohammadi, M., Mukherjee, S., Darzi, S., Paul, K., Werkmeister, J.A., Cousins, F.L., and Gargett, C.E. (2021). Identification and characterisation of maternal perivascular SUSD2(+) placental mesenchymal stem/stromal cells. Cell Tissue Res 385, 803-815.
Kirkwood, P.M., Gibson, D.A., Shaw, I., Dobie, R., Kelepouri, O., Henderson, N.C., and Saunders, P.T.K. (2022). Single-cell RNA sequencing and lineage tracing confirm mesenchyme to epithelial transformation (MET) contributes to repair of the endometrium at menstruation. Elife 11.
Li, S.Y., Whiteside, S., Li, B., Sun, X., and DeFalco, T. (2025). Mesenchymal-to-epithelial transition of perivascular cells contributes to endometrial re-epithelialization. Nat Commun 16, 10174.
Niayesh-Mehr, R., Kalantar, M., Bontempi, G., Montaldo, C., Ebrahimi, S., Allameh, A., Babaei, G., Seif, F., and Strippoli, R. (2024). The role of epithelial-mesenchymal transition in pulmonary fibrosis: lessons from idiopathic pulmonary fibrosis and COVID-19. Cell Commun Signal 22, 542.
Patterson, A.L., Zhang, L., Arango, N.A., Teixeira, J., and Pru, J.K. (2013). Mesenchymal-to-epithelial transition contributes to endometrial regeneration following natural and artificial decidualization. Stem Cells Dev 22, 964-974.
Pimeisl, I.M., Tanriver, Y., Daza, R.A., Vauti, F., Hevner, R.F., Arnold, H.H., and Arnold, S.J. (2013). Generation and characterization of a tamoxifen-inducible Eomes(CreER) mouse line. Genesis 51, 725-733.
Rios, A.C., Fu, N.Y., Cursons, J., Lindeman, G.J., and Visvader, J.E. (2016). The complexities and caveats of lineage tracing in the mammary gland. Breast Cancer Res 18, 116.
Seishima, R., Leung, C., Yada, S., Murad, K.B.A., Tan, L.T., Hajamohideen, A., Tan, S.H., Itoh, H., Murakami, K., Ishida, Y., et al. (2019). Neonatal Wnt-dependent Lgr5 positive stem cells are essential for uterine gland development. Nat Commun 10, 5378.
Zeisberg, M., Shah, A.A., and Kalluri, R. (2005). Bone morphogenic protein-7 induces mesenchymal to epithelial transition in adult renal fibroblasts and facilitates regeneration of injured kidney. J Biol Chem 280, 8094-8100.
Note: This response was posted by the corresponding author to Review Commons. The content has not been altered except for formatting.
Learn more at Review Commons
We sincerely appreciate the constructive and insightful comments on our manuscript.
Both reviewers raised important concerns regarding our use of the term lysosome-related organelle. We fully acknowledge this criticism and will revise the terminology throughout the manuscript with greater care, referring to these structures as Rab32/Rab38-positive vacuoles where appropriate, and discussing their possible relationship to lysosome-related organelles in the Discussion.
We believe that the remaining comments can be adequately addressed through additional experiments, including CLEM and three-dimensional reconstruction analyses. We therefore submit this revision plan and hope that it will be viewed favorably.
Note: This preprint has been reviewed by subject experts for Review Commons. Content has not been altered except for formatting.
Learn more at Review Commons
Summary:
This manuscript employs overexpression and knockdown experiments in an immortalized hepatocyte cell line to probe roles for RAB32 and RAB38 in lipid metabolism by lysosomes or lysosome-related organelles (LROs). Using these approaches, the authors show that both RAB32 and RAB38 colocalize with LAMP1 on late endosomes/ lysosomes, that the appearance of enlarged, round lysosomal structures that they refer to as LROs scales with both RAB32 and RAB38 expression, and they provide some evidence to suggest that material from lipid droplets (LD) are taken up into these large rounded compartments in a manner that requires RAB32 or RAB38. Additional experiments are interpreted to suggest that macroautophagy is not required for this uptake but that PtdIns3-kinase, PtdIns5-kinase, and ESCRT complexes are required. Analyses of Rab32/Rab38 knockout mice shows an accumulation of white fat, and in liver an accumulation of what the author interpret to be lipofuscin. The authors conclude that lipid droplets are consumed by LROs in an autophagy-independent manner.
Major Comments:
While the topic of the paper is interesting, the conclusions of the paper are not supported by the data shown. No evidence is presented in this paper that the structures analyzed are actual LROs rather than lysosomes, other than their content of RAB32 and RAB38 - which are not limited in expression to LROs. The fact that lipid accumulates in the white fat and not the livers of double knockout mice and that hepatocytes express very little RAB32 and no RAB38 renders the model cell system studied here artifactual; the paper should start with the in vivo analysis and then progress with an appropriate cell type using a line that mimics the behaviour of the endogenous cells. Moreover, the only experiments documenting partial overlap of lipid droplet (LD) material - interpreted as uptake of LDs - into these structures is in cells that massively overexpress LAMP1-mRFP, RAB32, and/or RAB38; in untransduced cells, only a handful of LAMP1-containing structures are enlarged and there is no evidence that they overlap with LD material. Moreover, the only evidence that colocalization is independent of autophagy is that it is blocked by overexpression of a single dominant-negative autophagy component, ATG4B. Finally, the data quantification throughout the paper lacks sufficient power to support the conclusions. Thus, the none of the major conclusions from this paper are well supported, and the physiological significance of the observations for liver function is not at all clear. Altogether, the authors present an interesting idea for which the data are unconvincing.
Below are detailed concerns throughout the paper.
i. Please explain why there was a reason to look at the involvement of Rab32/38 in hepatic lipid metabolism.
ii. It seems rather unlikely that microautophagy can result in the engulfment of an entire lipid droplet in toto; is it more sensible to think of this as a means to transfer the contents of LDs, perhaps piece by piece, into lysosomes? 2. Introduction:
i. There is a vast literature on the roles of Rab32 and/or Rab38 in the biogenesis of other LROs besides melanosomes, including platelet granules, lamellar bodies in lung epithelial type II cells, and various non-vertebrate structures that should be cited.
ii. The authors fail to cite the first papers describing roles of Rab32 or Rab38 in bacterial killing by macrophages (Spano et al 2012, PMID: 23162001 and several additional papers from the Galan/ Spano groups), and papers ascribing roles for Rab32 in mitophagy and perhaps other mitochondrial functions, including ER:mitochondrial contacts, prior to the authors' 2025 paper (various papers).
iii. There have been quite a few papers addressing Rab32/38 effectors in pigment cells (see papers from the Di Pietro group) and other cell types (see Rab32 in mitochondria papers).These facts and at least some of the papers should be cited in the Introduction to better reflect the depth of understanding - and some of the confusion - surrounding Rab32 and Rab38 function.
iv. Reference to the definition of LROs should also be cited.
Results: 3. In all experiments where quantification was done, the number of structures or cells analyzed is listed but not the number of experiments. Were these experiments repeated at least three times, and are the values and statistics calculated from the experiment to experiment variation? If not, the statistical values are inaccurate. In all, the number of structures or cells analyzed appears to be quite small. 4.Figure 1.
i. How did the authors validate the specificity of the anti-Rab32 and anti-Rab38 antibodies used in Figure 1 and elsewhere? Data should be shown with individual knockdowns. Additionally, the overlap with LAMP1 seems too good to be true (it looks 100% and with similar labeling intensities in all cases) - were controls done to ensure lack of cross-reactivity of the secondary antibodies?
ii. If anti-Rab32 and -Rab38 actually labeled all LAMP1-positive compartments, it seems likely that these are classical late endosomes/ lysosomes and not lysosome-related organelles. Rab32 is expressed by many cell types that do not harbor traditional LROs and may have more ubiquitous functions. The larger ring-like structures mentioned in the text only appear when Rab32 or Rab38 are overexpressed as GFP fusion proteins (compare Fig. 1A and B with 1C-F, and note that the scale bars are the same) and fail to overlap with smaller structures only when LAMP1-mRFP is overexpressed (compare Fig. 1A and B with S1A); these structures likely represent earlier endosomal intermediates illuminated by LAMP1 overexpression. The authors need to reconsider their interpretation of these data in light of these overexpression artifacts.
iii. In Fig. 1C-F and Fig. S1, were cells transfected or infected with recombinant lentiviruses? This should be indicated in the figure legend. 5. Figure 2. In Fig. 2E-G, cells depleted of Rab32 and/or Rab38 should be compared to cells transduced with a control shRNA, such as a non-coding shRNA, and not to untransduced cells. The quantification of these data "per field" is quite concerning, given that a field could have very different numbers of cells. The data should be normalized to cell number or cell area. 6. Figure 3.
i. It should be noted in the text that the Lipi- dyes fluoresce in high hydrophobic environments, and thus would indicate a cluster of lipid tails within a lysosome and not just an entire LD. Interpreting these spots as LD under lipase inhibitory conditions is a stretch.
ii. The evidence that the Lipi-Blue labeled structures are actually inside of the lysosomal structures is not convincing. Three-D reconstructions would need to be done to be more convincing of this. 7. Suppl. Fig. S2. In panel A, there is no obvious difference in intensity of p62 under any of the conditions, and this reviewer does not see any LC3-II in the gel- only LC3-I with a very slight smear underneath that may or may not be specific. The interpretation that autophagy is increased at higher confluency is thus not well founded. In panel B, I see weak labeling of the interior of the giant Rab38-GFP-containing compartments for LC3-mRFP, as if the mRFP was in the process of degradation. How this correlates with the biochemistry in panel A is unclear. 8. Fig. 4 and Suppl. Fig. S3.
i. All of the graphs in Fig. S3 require appropriate statistical analyses.
ii. The interpretation of the size of the structures in the double DKD sample is complicated by their accumulation in the perinuclear area, which is very dense. If all samples look like the one in Fig. 3A, then it is not possible to measure their size by this technique and that sample should remain unanalyzed. It is misleading to refer to these as large when they appear to be clusters of small puncta.
iii. The label on the image itself in Fig. 3C should indicate Lysotracker, not "LRO". This is misleading.
iv. The same concern raised above that it is not clear whether the Lipi-Blue labeled structures are present within the lysosomal structures is true here. Indeed, in the unstransfected control, many of the LD structures appear to be present adjacent to (on one side of) the Lysotracker-labeled structures, as is also apparent in the shRab32 and shRab38 cells; those where they appear to be inside might simply be above them in these non-super-resolution images. This is a great example of how it is necessary to do 3D reconstructions to fully determine whether the Lipi-Blue structures are engulfed by or adjacent to lysosomes.
v. Note, the LC3 flux experiment and identification of LC3-II and -I is correct in S4D, unlike the experiment in S2A. 9. Fig. 5. The data in Figure 5A are incorrectly interpreted. PtdIns3P or PtdIns(3,5)P2 are present only on the cytoplasmic leaflet of endosomes and lysosomes; if those membranes were to be internalized, the phosphate would be removed. Thus, the presence of signal on the inside of the lysosomal structures does not indicate the presence of PtdIns3P or PtdIns(3,5)P2; it represents likely free mCherry, or perhaps the full conjugate with 2XFYVE, that has been engulfed by the lysosome and is no longer bound to its ligand. The observation that the mCherry signal accumulates near the Lipi-Blue signal in orlistat-treated cells thus cannot be interpreted as an interaction of the phosphoinositide with the LD or its content phospholipids or acyl chains. The disappearance of a punctate 2XFYVE signal is expected upon treatment with a PI3kinase inhibitor since it eliminates the ligand, and the failure of Lipi-Blue to accumulate in lysosomes of inhibitor-treated cells could reflect just about any defect in endolysosomal maturation since PtdIns3P is required for the early to late endosome transition as well as for several aspects of late endosome and lysosome biology. All this experiment shows is that uptake of Lipi-Blue labeled structures into lysosomes requires endolysosomal maturation. The same goes for the shVps4 experiments in Fig. 5B, which are also less convincing of any phenotype, and Fig. S5.
Because the conclusions are not supported by the data shown and because the authors exploit an immortalized cell type that does not mimic the behavior of the endogenous cells, the significance of the work as presented is very low. If the conclusions were justified, the advance could potentially be conceptual in showing that RAB32 and RAB38 redundantly functionalize lysosomes in some cell types to metabolize lipids through a mechanism distinct from macroautophagy. Such an advance would be of broad interest to investigators interested in the functions of lysosomes and lysosome-related organelles, as well as membrane trafficking machinery. However, the authors are unfortunately a long way from such an advance.
My expertise is in the biogenesis of LROs, and I am considered a leading expert in the field. In my opinion, the authors require a functional readout unique to LROs to define the compartments shown as LROs. Otherwise, they might consider altering their language, abandon the LRO designation, and focus on mechanisms of fatty acid uptake promoted by RAB32 and/or RAB38 in appropriate cell types. Unfortunately, their own data show that the cell type used here is not such an appropriate cell type.
Note: This preprint has been reviewed by subject experts for Review Commons. Content has not been altered except for formatting.
Learn more at Review Commons
This study investigates the roles of Rab32 and Rab38 in hepatic lipid droplet metabolism. The authors propose that Rab32/38-positive lysosome-related organelles (LROs) mediate lipid droplet degradation through a mechanism independent of conventional macroautophagy. While the study addresses an interesting question, several conceptual and technical issues need to be addressed before the conclusions can be fully supported.
Major Concerns
1.The authors primarily define the Rab32/38-positive ring-like structures as "lysosome-related organelles (LROs)" based on their morphological characteristics and co-localization with LAMP1. However, this classification lacks biochemical validation. Would it be more appropriate to include a Lyso-IP assay to provide additional supporting evidence? 2.In hepatocytes, what is the operational definition of LROs? Beyond being "larger in size," how are these structures functionally distinguished from conventional lysosomes? If Rab32/38 defines LRO identity, why does GFP-Rab32/38 not co-localize with all LAMP1-positive structures (Figure S1A)? 3.In Figure 2A, the dextran pulse-chase experiment shows fluid-phase uptake into large vacuoles; however, dextran can enter any endocytic compartment after prolonged chase periods. What evidence supports that these structures are bona fide LROs rather than enlarged late endosomes or lysosomes resulting from long-term culture? What determines why only certain lysosomes become Rab32/38-positive? This heterogeneity is not explained. Does it imply that pre-existing lysosomes convert into LROs, or that LROs are newly formed under high-density stress? The developmental trajectory of these structures has not been explored. 4.The authors propose a microautophagy mechanism based on the "invagination-like" structures observed by light microscopy (Figure 3A). However, the resolution of light microscopy is insufficient to distinguish true membrane invaginations from lipid droplets that are closely apposed to, or partially wrapped by, the outer membrane of LROs in three-dimensional space. Would a CLEM experiment be necessary to confirm that lipid droplets are indeed located within the lumen of LROs, rather than in deep invaginations that remain connected to the cytosol? In addition, multilamellar membrane structures were observed after Bafilomycin A1 treatment (Figure 3A). Have these structures been validated by electron microscopy, or could they simply represent complex membrane infoldings within swollen lysosomes? The conclusions drawn from light microscopy alone appear somewhat insufficient. 5.The authors use ATG4B C74A overexpression to claim macroautophagy independence. However, while this mutant blocks LC3 lipidation, the study still lacks genetic evidence, such as ATG knockouts. In Figure S2B, the authors state that the "majority" of Rab38-positive LRO-associated lipid droplets are LC3-negative, but no quantitative data are provided. 6.The manuscript does not clearly distinguish the functions of Rab32 and Rab38. Although the authors describe these proteins as paralogs with overlapping roles, multiple data points indicate that they have differential effects on lipid droplet (LD) metabolism. Notably, Rab38-but not Rab32-significantly affects LD delivery to acidic compartments, exerts a stronger influence on LRO size, and responds more robustly to VPS4B perturbation. These observations suggest that Rab32 and Rab38 regulate distinct steps of LD metabolism rather than functioning redundantly. However, the manuscript does not clearly highlight these functional differences and lacks mechanistic validation. 7.Figure 5A shows that the PI3P probe (2×FYVE) forms ring-like structures inside or near the LRO membrane. However, LROs themselves are Rab5-negative (Figures 1C-E), and PI3P is typically generated by Vps34 on early endosomes. Where do these PI3P signals originate? Are they transported from other organelles, or is there a local PI3P-generating mechanism on the LRO membrane? If the latter, which kinase is responsible, and is Vps34 recruited to the LRO membrane? This issue is not discussed. If PI3P is indeed locally generated on LROs, it could represent a key feature distinguishing LROs from classical lysosomes.
Minor Concerns
1.The double-knockout mice exhibit obesity and fatty liver; however, Rab32 and Rab38 are expressed in multiple tissues. A whole-body knockout model cannot distinguish whether these effects are hepatocyte-autonomous or arise from contributions by adipose tissue or macrophages, emphasizing the need for liver-specific knockout animals or cell models. Serum TAG levels were unchanged, and the authors speculate that VLDL secretion may be impaired, but this was not directly tested. Furthermore, the authors do not address the observed sex-specific effects, which appear to be male-specific. 2.The concentration of Orlistat used is relatively high (50-200 μM) and may cause non-specific effects. Have dose-response experiments been performed, or have other LAL inhibitors (e.g., Lalistat) been tested? 3.LysoTracker reflects acidity rather than lysosome identity, and reduced acidification in DKD cells may affect co-localization analysis.
Assessment of Significance Overall Assessment
Strengths:
Conceptual novelty: Introduces lysosome-related organelles (LROs) into hepatic lipid metabolism, expanding the functional repertoire of Rab32/38 beyond pigment cells and macrophages.
Mechanistic exploration: Links LD uptake to PI3P/PI(3,5)P2 signaling and VPS4B, providing molecular handles for future studies.
In vivo validation: DKO mice show age-dependent obesity and HFD sensitivity, establishing physiological relevance.
Weaknesses:
Rab32 vs. Rab38 functions remain blurred: Data suggest differential roles (Rab38 in LD delivery, Rab32 in LD size regulation), but authors default to "redundancy" narrative.
Microautophagy evidence incomplete: Relies on light microscopy; EM/CLEM needed to confirm true internalization.
Model relevance unclear: High-confluence AML12 vacuoles lack clear physiological correlate in healthy liver.
Audience
Primary:
Lysosome biologists
Autophagy researchers
Lipid metabolism researchers
Secondary:
Cell biologists
Metabolic disease researchers
Geneticists
Now published in Molecular Therapy. https://www.sciencedirect.com/science/article/pii/S1525001626003096?via%3Dihub
Since the decoder is causal (i.e., the attention of a token only depends on its preceeding tokens)
终于有人明确解释了 causal 的意思
Nowfinally accepted and published in Celll and Molecular Life Science
Meana, C., San-José, G., Balboa, M.A. et al. Spatial regulation of Lck activation at the CD8 immune synapse revealed by a FRET-Based biosensor. Cell. Mol. Life Sci. (2026). https://doi.org/10.1007/s00018-026-06209-x
https://link.springer.com/article/10.1007/s00018-026-06209-x#Abs1
or
yo wassup
standard conditions or non-standard conditions
standard: 1.0M concentration, 1 atmospheric pressure, 298.15 Kelvin temperature.
non: (not) standard: change in concentration.
Drawing Set
basta group of drawings na issued on the project
Drawing Markup (Personal vs Published)
if minamark up mo yung drawings, nasa private siya by default, magpupublic lang yun if iseset mo sa public
Drawing Discipline
automatically prefilled na siya depending on what drawing it is
Distribution Group
list ng lahat ng email recipients
Custom Reports
ikaw mismo ang magccreate from scratch
Canned Report
ready-made na
Action Required By (ARB)
it indicates na may action na dapat kang gawin if sayo na-assign yun sa procore
One of the Bahaman boys stopped by Tea Cake’s house in a car and hollered. Tea Cake came out throwin’ laughter over his shoulder into the house.
The text describes an interaction where boys in a car call out to Tea, cake, who responds by coming out laughing
a hurricane hits the town that Jeanie tea cake lived in they try to escape on a boat later on Jeannie gets attacked on a cow by a dog
looks identical to https://www.amazon.com/Technical-Gears-Axles-Parts-Pieces/dp/B0D21L8HG1/ except for 1 part that I only saw in the other
Sites de rencontres : le fantasme de l'amour idéal
L'auteur veut-il montrer que les profils rêvés d'homme/femme idéal(e) altèrent les rencontres amoureuses ? Les rencontres sont biaisées parce que les personnes ont en tête une multitude de critères. Si elles n'en avaient pas, seraient-elles plus ouvertes à la rencontre ?
Julien, 48 ans
Uniquement des témoignages de 40 et + Forcément la vision des sites de rencontres d'une génération à une autre ne sera pas la même L'argumentation est biaisée, une population 20/25 aurait certainement donné un point de vue différent sur ces sites
Je ne suis pourtant pas difficile… Il doit avoir le même niveau de vie que moi, être dans ma tranche d’âge, me faire rire et montrer quand même un peu de prestance. Je n’ai aucun critère physique : brun, blond, tout me va. Mais il faut tout de même qu’il soit plus grand que moi, un mètre quatre-vingts au minimum. »
Elle dit ne pas être difficile, mais il y a tout de même une panoplie de critères. Elle a déjà son "homme rêvé" en tête, et ne laissera pas la place à la rencontre fortuite
Pour Alain Héril, sexothérapeute et psychanalyste, auteur, notamment, de Femme épanouie
Forme de publicité pour son bouquin, ce qui pose question de la neutralité de l'article
Si nous rapportons toutes ces histoires d’amour aux chiffres des unions effectives nouées en ligne,
Comment peut il avoir trouvé ces chiffres ? Il n'indique pas la source, ni les données précises Comment peut il exister des chiffres des "unions effectives nouées en ligne" ?
You’ve probably been warned not to cite Wikipedia as a source for your assignments, right? There are good reasons for that, and even the Wikipedia community acknowledges that Wikipedia is not a reliable source, especially for academic use. However, it can be a very helpful starting point, as long as you keep a few points in mind:
I use wikipedia by visiting at their citation , most of the times wikipedia citation are scholarly articles and research papers.
I notice the structural fact: in a world short on H100/H200/GB200 inventory, "rival" was a thinner concept than the public framing suggested. Compute is fungible. The lab with the GPUs sells the GPUs. That sentence describes 2026 more accurately than any narrative about ideological alignment between AI labs.
🙏
The world had ended three years ago.
Backstory delivered as a flat fact. No Voice — no perspective shaping how this lands. We're told, not shown.
eLife Assessment
This study introduces the "Training Village," a valuable system for which solid evidence shows that it enables group-housed rodents to autonomously learn complex tasks while preserving natural social interactions. The platform is flexible, allowing animals to learn multiple tasks sequentially and supporting applications in continual learning. This approach is likely to be of broad interest to behavioral researchers using rodent models in systems and cognitive neuroscience.
Reviewer #1 (Public review):
Summary:
The authors introduce the Training Village (TV), an open-source and modular system that allows group-housed rodents to live in enriched home cages while individually accessing a single shared operant box for automated cognitive training. The paper reported the animals' activity both in the operant box and in the home cages, which is novel.
Strengths:
A major strength of the work is that it moves beyond a proof-of-concept and demonstrates sustained box usage, long-term trial accumulation, and compatibility with different task designs.
(1) The platform provided a technical contribution in rodent cognitive neuroscience: obtaining large amounts of behavioral data from complex tasks while reducing experimenter intervention and preserving social housing.
(2) The authors demonstrate that the system can sustain prolonged task engagement (up to 12 months), maintain efficient use of a single operant box.
(3) The manuscript opens interesting opportunities for studying behavior outside standard session-based training. Because animals self-initiate training while remaining in a group-housed setting, the platform has the potential to illuminate relationships among motivation, spontaneous activity, and task engagement that are hard to access in conventional paradigms.
Weaknesses:
(1) One area that would benefit from further clarification is the manuscript's core advance relative to prior automated group-housed training systems, particularly Mouse Academy (Qiao et al., 2018). The authors listed some advantages in the Discussion section; however, those were some minor engineering improvements, and what is more interesting is the scientific question or results that can be asked or obtained from this study. The current study clearly presents a functional and carefully documented platform, but it would help the reader if the authors more explicitly distinguished the present system from earlier related approaches, both in terms of system design and in terms of experimental validation.
(2) At the system level, several of the claimed advantages could be supported more directly with quantitative data. For example, if the double-detection corridor and alarm system are important distinguishing features, it would be valuable to report measures such as detection accuracy, missed detections, co-entry failures, alarm frequency, and the degree of manual intervention required in practice. Similarly, the welfare-related arguments are plausible and important, but would be strengthened by more direct evidence, such as longitudinal body weight data, water intake, or comparison with group-housed no-task controls.
(3) At the experimental level, the manuscript would also benefit from a more detailed characterization of training performance. Although three behavioral paradigms are presented, the data currently shown provide a stronger demonstration of feasibility than of training optimization. For a study focused on automated cognitive training, it would be critical to include more information on learning speed, progression across stages, success and failure rates, and variability across animals. Along the same lines, the comparison with manual training is a useful addition, but a broader benchmark including learning curves, time to criterion, and between-animal variability would make the practical value of the system easier to assess.
(4) The authors claimed that they conducted 3 complex cognitive tasks (3AFC, 2AFC, 2AB) in their setup. However, those 3 tasks are quite basic for rodents and have been demonstrated in many studies, especially comparing tasks implemented in Yu et al., eLife 2025. Therefore, lowering this 'complex' statement is necessary.
(5) The authors claimed that they have successfully implemented the so-called hybrid mode, but it is only briefly described and not supported by citations or data. Since this may be one of the most broadly applicable use cases of the platform, a more detailed explanation of how the system can be integrated with recording workflows would strengthen the manuscript.
(6) The manuscript highlights the opportunity to relate task behavior to home-cage activity and to study individualized behavioral patterns. To better support these aspects, it would be helpful to include more subject-level analyses, rather than relying predominantly on population averages, or alternatively to discuss in more concrete terms which features of the dataset may be especially informative for studying individuality. More generally, the manuscript would benefit from clarifying whether different parameter settings within this group-housed framework may be better suited for maximizing training efficiency versus preserving more naturalistic or socially modulated behavior, and what the implications of these choices may be for interpretation.
(7) In Table S1, 'Touch screen' is task-specific and is not necessarily a metric. 'Testing outside home cage' is also not necessarily an advantage (please clarify if it is). Many other systems implemented different levels of 'Alarm system', which is not reflected in the table.
(8) Table S3 shows important data that help the reader to evaluate the paper's work, thus is deserved to move to the main text.
Reviewer #2 (Public review):
Summary:
The Training Village (TV) is an innovative autonomous system for rodent training. By integrating an operant box with a group-housed home-cage environment, this platform enables animals to learn operant behaviors while preserving their social context and interactions, which is an aspect often overlooked in the field. The flexibility and modularity of the TV system allow training across multiple cognitive tasks in a continual learning framework. Furthermore, its remote accessibility and affordability make it a compelling tool for the broader neuroscience community.
Comments:
(1) Social Hierarchy and Access Competition
Previous studies on rodent social hierarchy (e.g., PMID: 21960531) have demonstrated clear dominance structures within group-housed animals. Based on this, one might expect dominant animal(s) to occupy more sessions and trials than subordinate animals by preferentially accessing the operant box. Therefore, it is somewhat surprising to observe a relatively uniform distribution of operant box occupancy across animals (Figure 2a, 2i). As a control, it would strengthen the manuscript to include an independent assessment of social hierarchy (e.g., tube test, barber assay, or similar behavioral metrics) to quantitatively characterize dominance relationships within the cohort. Correlating these rankings with chamber occupancy and trial frequency would significantly strengthen the validation of the system's equity.
(2) Behavioral Saving Effects in Continual Learning
The authors demonstrate that the TV platform allows for the sequential learning of multiple cognitive tasks (Figure S3e). This provides an excellent opportunity to examine a continual learning paradigm. A key hallmark of successful continual learning is the "behavior savings effect", where re-learning a previously acquired task occurs faster than initial learning. For example, if animals are trained sequentially on task A (e.g., 2AFC), then task B (e.g., 2AB), and subsequently re-trained on task A, do they exhibit accelerated re-learning? Including such an analysis would significantly strengthen the claim regarding continual learning capabilities.
(3) Robustness of Multi-Animal Attempt Detection
In the TV platform, only one animal can access the operant box at a time under group-housed conditions. This setup inherently introduces the possibility of "multi-animal attempts", as shown in Figure 2j-k and Figure S2c. While the authors address this using pixel-based classification, additional quantitative validation would improve confidence in this approach. For instance, presenting the distribution of pixel counts for single-animal versus multi-animal events would be informative. Moreover, given variability in body size across animals, a fixed pixel threshold may not be sufficient. It would be helpful to include analyses of classification performance (e.g., Type I and Type II error rates) across different animal pairings within the same cohort.
(4) Protocol Flexibility and Implementation
It would be helpful to clarify how behavioral task protocols are switched within the TV system. Specifically, are task changes applied globally to all animals sharing the operant box, or can they be assigned individually? Additionally, are task sequences pre-programmed prior to the experiment, or can they be modified dynamically during ongoing experiments?
(5) Presentation and Readability
To improve readability, the Discussion section could be streamlined, as it is currently somewhat lengthy and descriptive.
Reviewer #3 (Public review):
Summary:
The Training Village (TV) is an open-source automated platform for continuous training and testing of group-housed mice and rats in cognitive tasks. Animals live in enriched multi-compartment home cages and access a single operant box individually through a sorting corridor controlled by RFID identification and real-time video analysis. A Raspberry Pi 5 runs the entire system, manages an adaptive training algorithm, monitors animal welfare, and allows remote supervision via a graphical interface and Telegram alarm system. The system is validated across 12 groups totaling 121 animals, three cognitive paradigms of varying complexity, and experiments lasting up to 12 months.
Strengths:
(1) The open-source implementation is probably the paper's strongest point. The authors provide not just code but 3D-printable designs, a full bill of materials with costs (~5500€ total), assembly instructions, and a dedicated website. The estimated build time of 2-7 days is credible. In the current landscape of methods papers, this level of documentation is the minimum necessary to allow other laboratories to actually adopt and propagate the system - and the authors deliver it fully. The compatibility with two operant box designs, three cognitively distinct tasks, and two species - demonstrated empirically rather than merely claimed - makes the modularity argument credible and distinguishes the TV from systems designed around a single paradigm. Finally, the combination of automatic weighing at each exit, temperature and humidity tracking, and a granular Telegram alarm system (Table S2) represents a meaningful practical contribution. For a system operating 24/7 without daily human supervision, this level of welfare monitoring is a necessity, and it seems well implemented here.
(2) With 121 animals across 12 groups, three distinct cognitive paradigms, two species, and longitudinal data spanning up to 12 months, the validation effort is substantial. The authors acknowledge the limitations of their comparisons - notably that the TV vs. manual training comparison is not a controlled experiment. The rat dataset is limited in scope, but the authors at least demonstrate that the system can be adapted to a second species, which is a useful proof of concept. The demonstration that task engagement increases progressively over 12 months (Fig. 3g) is a novel observation at this temporal scale, with practical implications for the design of long-term experiments.
(3) The demonstration that operant box usage is distributed nearly uniformly across animals (Gini < 0.15 in all groups) is carefully demonstrated and addresses a question that any laboratory considering this type of system will legitimately ask, e.g., whether dominant individuals monopolize access at the expense of subordinates. This has been shown before in comparable systems, but remains a necessary validation for each new implementation. The control condition removing temporal constraints (Figure S4) adds useful mechanistic insight into the role of the refractory interval. However, the interpretation of this result deserves more nuance than the authors provide - see Weaknesses.
Weaknesses:
(1) The TV is more than an automation tool; its architecture makes the most sense if one intends to study how spontaneous home cage behavior relates to individual cognitive performance, and the introduction and discussion explicitly frame this as a key application. Yet the analysis delivers only group-level descriptive results, and the cognitive data are presented almost exclusively as group averages. The individual-level questions that the system is uniquely positioned to address (do stable home cage behavioral profiles emerge across animals, do animals learn at the same rate and using the same strategies, and do these dimensions correlate with each other ) are never asked. This is particularly relevant given that enriched social environments are precisely the conditions under which stable inter-individual differences tend to emerge spontaneously, even among genetically identical animals (Freund et al., 2013, Science), and that comparable systems have already linked such profiles to cognitive and neurochemical phenotypes (Torquet et al., 2018, Nature Communications). The TV clearly has the data to begin exploring this - doing so would substantially strengthen the paper's scientific contribution beyond its methodological value.
(2) Sustained daytime operant box usage in nocturnal animals deserves more discussion: Box occupancy during the light phase remains around 75% - only modestly below the ~85% seen at night (Fig. S5a-b). The authors conclude this reflects "sustained engagement with the task throughout the circadian cycle," but other explanations are not considered: residual thirst driving animals to seek sucrose water during the day, and the refractory interval mechanically redistributing sessions into the light phase? A more explicit discussion of the consequences of 24/7 unsupervised testing for data quality (daytime sessions may yield noisier behavioral data?) would be useful.
(3) The finding that all animals access the operant box in roughly equal proportions (Gini < 0.15) is practically important and carefully demonstrated. However, the authors' interpretation that animals self-organize in an egalitarian manner despite known social hierarchies deserves a note of caution. The system design itself constrains monopolization: the refractory interval imposes the same waiting time on all animals regardless of social rank, and session duration determines how often the box becomes available. The no-constraint control (Figure S4) partially addresses this but was run on already-trained animals, limiting its interpretive value. The key practical message, that all animals can access the task regularly under the proposed design, is well supported. Whether this reflects genuine social tolerance or is primarily a consequence of system constraints is a subtler question that the current data cannot fully resolve.
(4) The rat cohort consists of a single group of 6 female Long-Evans rats, yet species comparisons are drawn across multiple dimensions (daily sessions, task engagement, performance...). Observed differences could reflect group size, sex, strain, reward calibration, or simple individual variability rather than species differences. These results should be presented for what they are: a useful proof of concept showing the system works with a second species, not a basis for comparative conclusions.
eLife Assessment
This study provides a valuable contribution to our understanding of the neural basis of perceptual decision-making by jointly modeling behavioral outcomes and EEG signals in a contrast comparison task. The methods and analyses are solid, systematically comparing standard models assuming continuous evidence accumulation with models that track evidence without temporal integration (extrema detection). The authors show that behavior and neural signals are equally consistent with both alternatives, highlighting limitations in current modeling approaches and questioning the generality of evidence accumulation mechanisms.
Reviewer #1 (Public review):
Summary:
This paper examines whether humans use protracted temporal integration in a noise-free, deferred-response contrast discrimination task, using a covert evidence-duration manipulation combined with EEG (SSVEP, CPP, Mu/Beta). The key finding is that evidence for protracted sampling is behaviorally and neurally supported, but even joint CPP + behaviour fitting cannot fully discriminate a standard integration (DDM) model from a novel "extremum-flagging" non-integration model. The paper is transparent about this outcome.
Strengths:
This is a well-conducted and well-written study that makes a genuine contribution to the perceptual decision-making literature by introducing a clean experimental design for probing temporal integration without participants adapting their strategy and demonstrating for the first time that a non-integration model (extremum-flagging) can replicate CPP waveform dynamics that have long been considered hallmarks of evidence accumulation. The transparent treatment of equivocal modelling outcomes is commendable.
Weaknesses:
My main concerns relate to statistical power, the under-specification of the and the extremum-flagging mechanism. Addressing these would greatly strengthen the paper.
(1) The sample of 16 participants (15, after the exclusion of one participant) is described as "close to similar EEG studies" with no formal power analysis. Given that the paper's core claim rests on subtle quantitative differences between two model classes - differences that are, by the authors' own admission, not sufficient to declare a winner - even a modest increase in sample size might yield a more decisive outcome. At a minimum, the authors should report a sensitivity analysis or post-hoc power calculation to indicate what effect sizes the current N could reliably detect, particularly for the rmANOVA comparisons and the neural constraint fitting.
(2) The Extremum-flagging model is the paper's most novel contribution, yet its physiological basis is underspecified. The model posits that each decision-terminating bound-crossing triggers a stereotyped, half-sine-shaped centroparietal signal, but no neural circuit or computational mechanism is proposed for how the brain could detect the first bound-crossing event in a non-accumulating evidence stream or generate a temporally precise, fixed-amplitude signal in response. Possible connections to P3b theories of context updating and response facilitation are acknowledged, but these are vague functional descriptions rather than mechanistic accounts. I think the discussion should engage more directly with potential neural substrates that could generate this flagging signal, and whether these are consistent with the known generators of the CPP/P3b. Without this, the extremum-flagging model risks being viewed as a mathematical convenience rather than a biologically plausible alternative.
(3) The Integration model at the preferred neural weighting estimates a high-to-low contrast drift rate ratio of 8.7, whereas the empirical Mu/Beta lateralization slopes suggest a ratio of approximately 3.5. The authors attribute this discrepancy to the nonlinear contrast response function of early visual cortex and the salience of the high-contrast evidence onset, but these explanations are speculative. These outcomes are arguably the most quantitatively damaging result for the integration model, so they deserve more than a brief discussion. I would recommend that the authors (a) estimate what range of contrast response nonlinearities would be required to close this gap, (b) test whether an alternative drift rate parameterization (e.g., scaling drift rates directly by SSVEP amplitude rather than contrast) reduces the discrepancy, or (c) be more explicit about treating this as a point against the Integration account.
(4) The sensitivity analysis over neural constraint weightings (w = 0.1 to 1000) is thoughtful, but the paper ultimately acknowledges that the preferred weighting is w=10, chosen because it achieves "a good fit to CPP dynamics without substantively sacrificing behavioral fit" - a qualitative criterion. No principled statistical framework is used to select the optimal weighting or to compare models at a given weighting. A Bayesian model comparison could provide a more formal framework for combining behavioral and neural fit components, and would allow a clearer statement about the relative posterior probability of each model.
Reviewer #2 (Public review):
Summary:
The manuscript by Hajimohammadi, Mohr, O'Connell and Kelly is intended to demonstrate that participants integrate evidence over time to make a decision, even in a noise-free, static decision context. This is validated by the observation that (1) participant accuracy improves with increased exposure to the stimulus; and (2) there is a correlation between participant accuracy and a neural index of evidence accumulation, as measured by centro-parietal positivity (CPP).
Strengths:
(1) Joint modelling of accuracy and CPP dynamics is a significant achievement, as behaviour alone often cannot distinguish between competing theories of decision-making. In the case of protracted sampling in particular, the absence of reaction times (RT) due to the delayed nature of the response makes this method highly appealing.
(2) The experimental manipulations and the method used to extract the different neural indices are well chosen, enabling the mapping of putative cognitive processes such as evidence accumulation and motor preparation onto the recorded EEG with clarity.
(3) The in-depth discussion of the results clearly articulates those reported by the authors and in previous works.
Weaknesses:
(1) One main issue to support the interpretation of the authors toward the need for protracted sampling is the timing of the evidence. By design, participants believe that the signal is present for 1.6 seconds (reinforced by the fact that easy trials were displayed for 1.6 seconds). However, the difference in stimuli is turned off either 1.4, 1.2, 0.8 or 0 seconds before the cue to respond. While this makes sense in the context of the authors' question, it also raises the possibility that participants will focus on the last samples before answering. Even if participants apply equal weighting, this still favours them delaying evidence accumulation until they are sufficiently certain that the evidence should be present (e.g. participants might start accumulating after the stimulus has disappeared in the 0.2 condition). I do not see an easy way to test these alternative explanations outside of running a study in which the evidence is always offset before the go cue.
(2) Regarding the behavioural models, are these identifiable based on accuracy data alone? This should be addressed using a parameter recovery study, in which a set of parameters is used to generate data, and the same fitting routine used for the real data is used to estimate the parameters. This would enable us to determine what can be inferred from the model comparison presented. This is not a serious problem for the manuscript, as it specifically aims to go beyond behaviour. It is, however, worth noting that such a parameter recovery addition could be used to demonstrate the need for a joint modelling framework to answer the question of protracted sampling on delayed response times (RT).
Minor comments:
(1) I would advise authors to fix the D1 parameter and use it as a scaling parameter across all models. Currently, as I understand it, the models are scale-free, meaning the same fit is achieved by multiplying all parameters by two, for example. This makes the fit more complex (bounds on parameter values are required) and means that the models are less comparable in terms of their estimates. Perhaps I'm missing something, but I would have thought that fixing D1 (the common parameter across all models) would solve these issues.
(2) Why is the snapshot model so bad despite being a good model in Stine et al 2020? Can the authors speculate in the discussion?
(3) The meaning of the flag width is unclear. Figure 4 provides the reader with an intuitive understanding of the model that the authors have in mind. However, the tables in the appendices report values between 0.2 and 0.9. I understand that these values represent the width of the half-sine in seconds. This suggests that the actual estimated values for these flag events are much broader than those displayed in Figure 4. While this is probably fine for most models, it can be problematic for the extremum-flagging model, as it means that the rise to the peak takes between 0.1 and 0.45 seconds. While strictly speaking, this is still a 'flag' model, such a slow rise to the peak, given the usual expectation of evidence accumulation, would place this model closer to a smooth integration model than to a boundary-crossing flagging mechanism.
(4) In the modelling section, it is not clear overall (i.e. for G² and R²) how the participant dimension is taken into account. Are these individually fitted models, and if so, how are the secondary statistics generated from the individual estimates? Or were these fitted over all participants?
(5) On page 7, in the last sentence of the first paragraph of the section titled 'Decision-Related Neural Signals', the authors state that 'this stable contrast-difference encoding suggests that a constant (i.e. non-adapting) drift rate is a reasonable simplifying model assumption'. However, I am not sure how this is true given that SSVEP quantifies encoding, yet the drift rate can vary due to non-sensory aspects (e.g. attention).
(6) The mu/beta lateralisation does indeed favor the integration model more, but in terms of boundary estimation and starting-point analyses, both models are pretty far apart. Providing an interpretation of this observation, e.g. regarding alternative linking functions for mu/beta, would add to the manuscript.
Reviewer #3 (Public review):
Summary:
The authors aim to compare proposal models of perceptual decision making using a joint modeling approach, where they fit models to both behavioral outcomes as well as CPP. Most notably, they compare a standard evidence accumulation model with models that track the evidence without integrating it over time (extrema detection). The authors report that the joint CPP-behavioral data do not discriminate between two of their proposals.
Strengths:
This is an interesting finding that reinforces the idea that what we believe to see based on aggregation over trials may not be what happens on every single trial. The models are creative, and the simulations are convincing, relating the models to multiple neural markers of decision formation. These include the CPP but also mu/beta power spectra.
Weaknesses:
The paper makes some strong points, and the work seems generally well-executed. The weaknesses that I identified are twofold:
(1) Embedding in the literature/exposition of the main argument.
The focus in the introduction is on the noise-free nature of the stimulus and the prolonged presentation time. However, after reading the paper, I felt these were mostly experimental design choices that enable comparison of the different models using the CPP. Perhaps my misreading of the goals of the paper stems from two other observations:
a) The fact that the stimulus is noise-free does not entail that perception is noise-free. Thus, the argument that using a noise-free stimulus precludes the necessity of temporal integration seems not completely valid. Of course, one could argue that noise is limited in this case, but that makes a noise-free stimulus more of a design choice.
b) The focus on prolonged stimulus presentation, but at the same time the contrast with expanded judgement, did not make sense to me. Perhaps, as a non-native speaker, I am misreading the subtle difference between "protracted sampling" and "longer sampling", but again, the longer duration seems mostly a design choice.
More could be said about the optimality of the extrema detection methods. In particular, decades of work (centuries?) have shown that evidence integration is an optimal decision-making procedure: For example, the Sequential Probability Ratio Test is Bayes-optimal wrt mean RT (Wald, 1946); evidence accumulation together with collapsing threshold serves to maximize rewards in repeated choices (e.g., Bogacz et al., PsychRev, 2006; Boehm et al. APP, 2020). Given all this work, why would the brain have evolved to adopt a different mechanism? I realize that the paper is not about optimal decision making, but some discussion of this point seems warranted.
(2) Modeling choices.
The authors introduce a parameter, sampT, that represents uncertainty in the sampling onset time. It was not clear to me whether this parameter represented an offset of all trials, or a distribution (probably the latter). I wonder how exactly this parameter was integrated into the models, and in particular, if and how it interacts with the starting-point parameters. My intuition is that on a single-trial, IF early sampling occurs, you can model that with either a negative sampT and z at 0, or with sampT at 0 but a shift in z. This would suggest trade-offs between these parameters, making them hard to estimate independently. Since the paper does not depend on the identification of parameter estimates, this may not be a huge problem, but nevertheless it is good to explore the consequences.
The way the Bounded Integration model (BIntg) is formulated seems very close to the EZ-diffusion model (Wagenmakers et al., PBR, 2007). This model states that the proportion of correct responses Pc = 1/(1+exp(-B*D/s^2), with B and D the bound and drift rate parameters, respectively. However, filling in the numbers for the high contrast condition from Table 2, and assuming that s=2 (because the model description states that dt=2, with s undefined), I get a Pc of 80% for the 1.6H condition. This seems substantially less than what Figure 2 suggests.
On some occasions, it is unclear to me what modeling choices are being made:
a) It seems as if the models are fit on accuracy data alone (before introducing the neural data). This seems suboptimal given that the authors do report differences in RT.
b) Are the models fit on all data combined, or on the data of individual participants? Fitting individual participant data is preferred, as combined or aggregated data may be distorted by individual differences.
c) The authors seem to suggest that the diffusion coefficient s is estimated (in the section "Integration models"). Most likely, however, this is set to a fixed value. Obviously, it matters for the model comparison using AIC whether this parameter was freely estimated or not.
Not really a weakness, but I wondered about the effect of stimulus duration on RT. In particular, what hypothesis (or post hoc explanation) do the authors have for these RT effects? I could think of at least three hypotheses that are consistent with the behavioral data:
a) H1: The shorter the evidence duration, the more likely participants are to require a double-check before response execution, reflecting their uncertainty about their decision.<br /> b) H2: There is a collapsing threshold that initiates at stimulus offset, leading to quicker responses on trials where there is more evidence.<br /> c) H3: motor preparation is correlated with the evidence signal, which leads to faster responses on trials with more evidence.
Scholarly sources are generally found in different, more specialized databases. Google scholar is one example, as is the San Francisco State University Library’s OneSearch, along with a host of other databases that are available through the library.
Agreed that google scholar is a good source to find credible sources.
A useful way to think about your working thesis is by thinking about your “public motive” for researching. Miller and Jurecic (2015) introduce this idea in terms of the intersection of your personal curiosity, interest, and experience with the public goals of your research
I agree that that a working thesis should a general inquiry about a public issue.
Kohn advocates for an education system that cultivates children’s authentic curiosity at a young age. By starting the inquiry process early in a child’s education, or in the First Year of college for that matter (which is considerably later, but important nonetheless), students come to see learning not as reading, memorizing, and providing the correct answe
Kohn suggests that curoristy at young age empowers childerns education.
eLife Assessment
This fundamental work significantly advances our understanding of the circuit-level implementation of predictive processing by elucidating the functional influence between putative prediction error neurons in layer 2/3 and putative internal representation neurons in layer 5. The evidence demonstrating that neither the hierarchical nor the non-hierarchical variant of predictive processing fully accounts for the presented data is convincing. Moving forward, this line of work would benefit from explicitly comparing different theories, thereby clearly articulating the points raised in this paper.
Reviewer #1 (Public review):
Vasilevskaya and Keller test different models of cortical function through the lens of predictive processing, a powerful framework for the brain to learn and predict the statistics of the world via generative internal models. The authors use a clever combination of behavioral perturbations in closed-loop and open-loop visuomotor virtual reality assays, a paradigm the Keller lab pioneered and used effectively in the past decade, in conjunction with two-photon imaging of neuronal calcium responses and targeted optogenetic perturbations of activity. They specifically put to test proposed hierarchical vs. non-hierarchical circuit implementations of predictive processing by analyzing the logic of inter-lamina interactions (superficial vs. deep; L2/3 vs. L5/6).
The authors conclude that both versions of predictive processing architectures they analyze are likely invalid, and instead formulate an alternative novel model of cortical function based on a recently developed machine learning algorithm for self-supervised learning (joint embeddings of predictive architectures, JEPA) and its further refinements. JEPA borrows elements from predictive processing, engaging two encoder networks and training the output of one network to predict the output of the other. In their new model of cortical computations, prediction error neurons in L2/3 compare the deep layers (L5/6) activity, which is taken as a teaching signal, to a local, L2/3 prediction of this latent representation.
Specifically, the authors build on their previous work and reports from other groups that different sets of L2/3 neurons compute positive prediction errors (fire when sensory stimuli appear unexpectedly with respect to the movements of the animal; e.g., grating onsets in the absence of locomotion) and respectively negative prediction errors (fire when sensory stimuli are absent, while the brain expected them to be present; e.g. mice locomote but visual flow is suddenly halted - visuomotor mismatches). These L2/3 positive and negative prediction error neurons exchange messages with neurons in the deeper cortical layers that, the authors propose, build an internal representation (R) of the sensory stimuli given the animals' movements.
In the hierarchical model, internal representation neurons (R) are supposed to act as a teaching signal for both types of prediction error neurons; the output of the positive prediction error neurons is assumed to suppress activity of R such that the error between the teaching signal and the prediction is minimized; similarly, in the non-hierarchical version, R serves as a prediction for the prediction error neurons, and in turn it receives excitatory drive from the positive prediction error neurons and negative input from the negative prediction error neurons.
The authors find that the functional impact of L5 neurons on L2/3 neurons is not compatible with the non-hierarchical architecture they and other groups proposed, but rather in accordance with the hierarchical model. At the same time, the functional impact of L2/3 neurons (positive vs. negative prediction error neurons) on L5 neurons (internal representation) appears not compatible with the hierarchical model, but rather in accordance with the non-hierarchical implementation.
They further hypothesize that L2/3 prediction error neurons don't use sensory input, but rather the L5 activity as a teaching signal, and test it using perturbations (halts) of optogenetic stimulation of L5 neurons coupled with locomotion (Figure 7).
All in all, the question is topical, and the new model addresses a decades-long quest to develop a unifying model of cortical function. The findings reported here transform our understanding of cortical computations, opening new, exciting avenues for future investigation. The experimental design and execution are rigorous; the arguments are clearly laid out (in spite of ample potential for confusion given the numerous loops and sign flips). These include a discussion of why the non-hierarchical model proposed by the same group does not hold, as well as potential caveats in interpreting the results and novel testable proposed experiments emerging from the JEPA-like model.
I have several questions about the interpretations of some of the claims and suggestions for potential additional experiments and analyses.
(1) Some of the pieces of the puzzle remain to be identified and demonstrated: the existence of internal representation neurons in L2/3 and ascertaining that the L5/6 neurons analyzed function indeed as internal representation neurons. The authors find that stimulation of L2/3 positive prediction error neurons enhances activity of L5 neurons...If L5 neurons hold a latent representation that serves as a teaching signal for L2/3 neurons (as the authors posit), wouldn't one expect that the input they receive from the positive prediction neurons be suppressive, such that the error is further minimized?
(2) Do the authors envision any specific differences between the representations of the two encoder networks posited to exist in L2/3 and L5 in the JEPA-like implementation? Are they synchronous/offset in their temporal representations, or any other features?
(3) Where is the prediction coming from onto L2/3 neurons? Is it emerging locally in L2/3 from the putative internal representation neurons, or is it long-range - as work from the authors previously proposed? Or a mix of both?
(4) What is the role of the indiscriminate L4 input that appears to enhance activity of both positive and negative prediction error neurons in L2/3?
(5) Does Figure 7D change in a meaningful manner if the authors plot the correlation between optomotor mismatch response and visuomotor mismatch response specifically for the negative prediction error neurons in L2/3 (Adamts-2) rather than for all L2/3 cells sampled?
(6) Do the optomotor mismatch responses in L2/3 neurons depend on how long the closed-loop coupling of optogenetic stimulation of Tlx3 L5 neurons and locomotion speed has been in place for?
Reviewer #2 (Public review):
This manuscript reveals the functional connectivity of two different classes of cortical neurons that respond in opposite ways to mismatches between sensory and top-down inputs. These data are very valuable because different theories of information processing in the cortex make different predictions on the patterns of connectivity of these neurons. Therefore, these data strongly constrain possible theories of cortical processing.
General comments:
(1) The methods of statistical testing are insufficiently described. I did not understand the description in lines 1105-1119. The authors should provide sufficient details so the reader can reproduce their analyses. For example, it may be helpful to provide specific details of the testing procedure for one of the comparisons (e.g. the first comparison in Table S1).
(2) The authors should clarify how the problem of multiple comparisons was addressed for comparisons performed in multiple moments of time, where significance is indicated by a black bar (e.g. in Figure 2F).
(3) It would be helpful to add a figure in the Discussion summarising the functional connectivity suggested by all experiments.
(4) Throughout the manuscript, the authors use the term "teaching signals", but I am unclear what they mean by it: after reading the definition in lines 45-46, I thought that they corresponded to values (as they are compared to sensory signals). Later (428-430), the text suggests that they correspond to error neurons. But then lines 605-607 say it is not an error signal. The authors should define teaching signals very precisely or remove this term.
Reviewer #3 (Public review):
Vasilevskaya and Keller set out to experimentally distinguish between two variants of predictive processing: a hierarchical and a non-hierarchical variant. The hierarchical variant assumes a hierarchical organization in which internal representation neurons (believed to be a subset of layer 5 excitatory neurons) serve as a source of a teaching signal for local prediction error neurons as well as for the next higher level of the hierarchy, while simultaneously providing prediction signals to the preceding lower level. In contrast, the non-hierarchical variant posits that these layer 5 internal representation neurons provide local predictions to layer 2/3 prediction error neurons.
The interaction between internal representation neurons and prediction error neurons differs fundamentally between the two variants. In the hierarchical variant, internal representation neurons excite positive prediction error neurons and inhibit negative prediction error neurons, while at the same time being inhibited by positive prediction error neurons and excited by negative prediction error neurons. In the non-hierarchical variant, this pattern of connectivity is reversed.
This work is very exciting, timely, and carefully executed. The authors functionally, and later molecularly, identify layer 2/3 prediction error neurons in V1 and probe their interactions with genetically defined neuron types in cortical layers 5 and 6 using optogenetics. They demonstrate that the functional influence of putative prediction error neurons in layer 2/3 onto layer 5 is incompatible with the hierarchical variant, whereas the influence of layer 5 onto putative prediction error neurons in layer 2/3 is incompatible with the non-hierarchical variant. They then test an alternative hypothesis, in which layer 2/3 responses resemble prediction errors with respect to perturbations of artificial layer 5 activity patterns. To investigate this, they designed an experiment in which optogenetic activation of L5 IT neurons was closed-loop coupled to the mouse's locomotion speed in the absence of visual feedback, allowing them to probe the causal influence of L5 activity on layer 2/3 responses.
Finally, the authors hypothesize that their data are more consistent with a joint embedding predictive architecture (JEPA) and outline experimentally testable predictions arising from this framework.
While the work is overall convincing and significantly advances our understanding of the circuit-level implementation of predictive processing, there are a few weaknesses that should be addressed or discussed:
(1) The authors define putative positive prediction error neurons as the 15% of neurons most responsive to grating onset and putative negative prediction error neurons as the 15% most responsive to visuomotor mismatch. While this selection would be expected to overlap with negative and positive prediction error neurons, the criterion is not sufficiently stringent (independent of the exact percentage chosen). In particular, classification of a neuron as a prediction error neuron should ideally be accompanied by evidence that it does not exhibit a significant increase in activity when the prediction matches the sensory input or teaching signal.
(2) The authors "speculate that the prediction error responses in layer 2/3 may not be computed with respect to sensory input, but with respect to layer 5 activity as a teaching signal." However, it is unclear how this perspective differs from earlier statements in the manuscript. In the Introduction, the authors note that "these signals, typically referred to as sensory signals, we will refer to as teaching signals," and later describe the hierarchical variant as one "in which internal representation neurons act as a source of the teaching signal." Given this framing, it is difficult to identify what is conceptually novel in the updated view. Is the key distinction that layer 2/3 neurons are now proposed to generate predictions in an internal representation space rather than in sensory input space, as briefly suggested in the Discussion? Or are the authors introducing a distinction between an external (sensory) and an internal (cortical) teaching signal? If so, this distinction should be made explicit. Clarifying this point would considerably strengthen the manuscript.
(3) The authors propose that "L2/3 neurons predict L5 activity, hence making predictions in the internal representation space rather than the input space," and further suggest that, since both deep and superficial cortical layers receive thalamic input, the cortex may function like a JEPA. This idea appears closely related to the model introduced by Nejad et al. (2025), which effectively implements a JEPA-like architecture: L5 activity serves as a target against which L2/3 predictions are compared in a self-supervised manner, with both L5 and L2/3 (via L4) receiving thalamic input. It would be helpful for the authors to clarify how their framework differs from that model, and to specify the key conceptual or mechanistic distinctions between the present proposal and the approach described by Nejad et al..
"It from Bit" thesis is not a thought experiment. The compute that produces the next token is a physical artifact whose location, power source, and thermal envelope are subject to active engineering choice
Claudossus
If we can better understand the potential for threats to be exacerbated by AI systems, society can more easily become resilient to this changed threat landscape.
大多数人认为AI威胁主要是技术问题,需要技术解决方案。但作者暗示社会适应和韧性建设可能同样重要,甚至更重要。这挑战了纯技术解决AI安全问题的主流观点,强调了社会适应的必要性。
Are there transparency regimes and tools that can enable a broad set of people, not just frontier AI companies, to easily study real-world AI usage?
大多数人认为AI研究和监测需要专业知识和资源,但作者提出可能存在透明度机制让普通人也能研究AI使用情况。这一观点挑战了AI研究必须由精英机构垄断的认知,暗示AI监测可能变得更加民主化。
When does access to agents able to negotiate on your behalf improve market efficiency and equitable outcomes? When does it not?
大多数人认为AI代理谈判者总是会改善市场效率和公平性,但作者质疑这一假设,暗示AI代理可能并不总是带来积极结果。这挑战了技术进步必然带来更好结果的乐观观点,暗示我们需要更细致地理解AI对市场的影响。
If an intelligence explosion was upon us, what intervention points would facilitate slowing or otherwise changing the rate of the explosion? Assuming humans can intervene, which entities should wield this capacity—governments? Companies?
大多数人认为AI发展速度是不可阻挡的,技术进步只会加速。但作者提出可能存在干预点来减缓AI爆炸式增长,甚至质疑政府或公司是否应该拥有这种控制权。这挑战了技术发展的不可阻挡性假设,暗示人类可能对超级智能发展有更多控制力。
When AI is applied in more conventional domains, like increasing integration into command and control systems, does it benefit the attacker? More generally, how will AI change the character of human conflict?
大多数人认为AI防御系统会增强人类安全,但作者提出AI可能从根本上改变攻防平衡,甚至在传统领域使攻击者获得优势。这一观点挑战了技术进步通常增强防御能力的传统认知,暗示AI可能使冲突更加危险和不可预测。
If AI substantially reduces the centrality of paid work in human life, what conditions will allow people to reallocate their time and effort toward other sources of meaning, and what can we learn from historical or contemporary populations where work has been scarce or optional?
大多数人认为工作是人类身份和意义的核心,但作者质疑这一基本假设,暗示AI可能使工作变得非必要,这挑战了现代社会对工作的核心价值认知。作者暗示我们需要重新思考人类在没有工作的情况下如何找到意义,这与主流经济和社会观念相悖。
What else can you shovel?
Where is the library?
what he called cronyism and corruption
他所称的任人唯亲和腐败
nd we have the time frame to do it
而且从时间安排上看,我们有条件把这些工作做完。
real
真实存在
concrete
混凝土
facade
外墙表面
corroded steel beams
腐蚀的钢梁
water damage
受潮损坏
bowels of the Kennedy Center
肯尼迪中心内部深处
that's the case
情况确实如此
dire need of repair
急需维修
Nursemaid’s Suite
PC INFO: Dust and cobwebs shroud an elegantly appointed bedroom and an adjoining nursery . Double doors set with panes of stained glass pull open to reveal a balcony overlooking the front of the house. Standing near the open door to the nursery is the gostly form of a woman. She raises a finger to her lips as if to shhh you.
DM INFO: Should the PC's decode to enter the nursery or speak in normal voices after being warned the Specter Attacks.
It demonstrated incredible generalization. Without any retraining, TRINITY transferred zero-shot to four unseen tasks
作者强调其系统无需重新训练即可零样本泛化到新任务,这与当前AI模型通常需要针对特定任务进行微调的主流实践形成鲜明对比,提出了一个反直觉的泛化能力观点。
This foundational research is part of the core engine powering our multi-agent product: Sakana Fugu
作者将他们的多智能体产品描述为'核心引擎',暗示其重要性超过了单一模型方法,这挑战了当前市场上大多数AI产品基于单一大模型的架构设计理念。
We believe the future of AI isn't just about scaling monolithic models, but engineering collaborative, diverse AI ecosystems that can adapt and combine their strengths.
作者直接挑战了当前AI行业的发展方向,认为未来不在于扩大单一模型,而在于构建协作的多样化AI生态系统,这与主流AI发展理念形成鲜明对比。
TRINITY transferred zero-shot to four unseen tasks (AIME, BigCodeBench, MT-Bench, and GPQA). On average, the evolved coordinator surpassed every individual constituent model in its pool, including GPT-5, Gemini 2.5-Pro, and Claude-4-Sonnet.
作者声称一个仅20K参数的协调者能够超越GPT-5等顶级大模型,这一结论与行业对模型规模与能力关系的普遍认知相悖,提出了一个极具挑战性的反直觉观点。
We found that evolution is uniquely suited to optimize this tight, high-dimensional coordination problem where traditional gradient-based methods fail.
大多数人认为进化算法在AI领域已经过时,但作者提出进化算法是解决高维协调问题的唯一有效方法,挑战了当前深度学习领域对梯度优化方法的依赖。
Imitation learning (Supervised Fine-Tuning) was ruled out because generating multi-turn labels is prohibitively expensive.
作者否定了模仿学习作为协调者训练方法的可行性,这与许多AI研究中偏好监督学习的常规做法相悖,提出了一个反直觉的观点。
Traditional Reinforcement Learning (REINFORCE) failed because the gradients had a low signal-to-noise ratio due to binary rewards and weak parameter coupling.
大多数人认为强化学习是解决复杂协调问题的理想方法,但作者明确指出传统RL方法在此类问题上完全失败,挑战了RL在AI协调中的主流应用。
The coordinator relies on the hidden states of a compact language model and a small routing head. In total, it has fewer than 20K learnable parameters.
作者提出了一种极简的协调者架构,仅使用不到20K可学习参数,这与当前AI模型追求数十亿甚至数万亿参数的主流趋势形成鲜明对比,挑战了'更大总是更好'的行业共识。
While model merging offers a way to combine different skills, it is often impractical due to mismatched neural architectures and the closed-source nature of top-performing models.
大多数人认为模型合并是整合不同AI模型能力的可行方法,但作者明确指出这种方法在实践中存在根本性限制,挑战了行业对模型合并解决方案的普遍信任。
In nature, complex problems are rarely solved by a single monolithic entity, but rather by the coordinated efforts of specialized individuals working together.
作者将自然界生态系统作为类比,暗示AI发展应该遵循生物多样性的原则,而非当前行业普遍追求的单一大型模型。这与主流AI发展方向形成鲜明对比,提出了一个反直觉的生物学视角。
What if instead of building one giant AI, we evolved a coordinator to orchestrate a diverse team of specialized AIs?
大多数人认为AI发展的方向是构建越来越大的单一模型,但作者提出了一种反直觉的观点:通过进化一个协调者来管理多个专业化AI可能更有效。这挑战了当前AI行业普遍追求模型规模扩大的共识。
For them, the lack of physical caregiving for their own parents isoffset by their great efforts to provide financial support, often seen as a token of their‘filial heart’. Sending money home, in their eyes, is a way to ‘fulfil the filial heart’
I made this assumption on page 137! Physically being there may be difficult but filial piety is being fulfilled through monetary means.
They also reject the reduction of care recipients tomere data points under standardized practices.
I think this is a good way to set a tone of industrialization of filial piety. For larger companies, their affect is not emotional but rather seemingly transactional and reductive.
Their resistance stems from a refusalto be seen merely as functionaries; instead, they strived to be recognized as moralindividuals offering genuine care.
Wanted to highlight this quote.
amilies love our videosbecause they can see real progress. You care about the person, not just the “deaddata”.
This suggests that filial piety is not a detached cultural obligation but rather a emotionally driven action. It furthers the author(s) argument that filial piety's affect and action can be separated and nuanced.
Chinese equivalent to apps such as whatsapp.
However, the ‘warm’ knowledge that reflects the‘filial heart’ is not systematically recorded, as its qualitative nature defies standardquantification.
Wanted to highlight this line.
patience and communication, customizing approaches based onindividual personalities and hobbies
This person-centered approach is very common in the American health system when caring for patients with cognitive disabilities in older age.
a process that involves manuallydocumenting data on paper before uploading it to digital platforms.
I wonder why it's necessary for careworkers to document manually. In the United States, our healthcare systems are heavily reliant on online consolidated charts to promote continuity of care. The systems here offer features such as drop down menus, plan of care suggestions and instantaneous lab requests.
risks of exploitation and control that can arise from such pseudo-kinship bonds
Just wanted to highlight this point.
where Xia’s ‘filial heart’, usually an asset, was penalized for not aligning with establishedstandards.
Provides us with an example of how filial heart is a complex concept that is actively being tried to push into a set of actions by the care industry. They can boast filial heart but also weaponize it against their workers, who are expected to have filial heart in the first place.
it also obscures thestructural exploitation at play within the caregiving industry
It's common for industries to exploit their workers everywhere under the guise that the worker is overachieving or good at their job. It's really sad to see larger companies take advantage of their employees like this.
f not all explicitlyacknowledge the disparity between their personal and professional obligations.
In a way, they may still be participating in filial piety if they are sending money back to their families.
which implies work with ‘physical, social or moral taint’(Ashforth & Kreiner 1999: 414). In eldercare, ‘dirty work’ refers to work characterizedby the negativity associated with the engagement of caring for those who may havebodily dysfunctions and discharges
It is interesting to me that a filial job can be seen as "dirty work." I wonder if this is due to classism? Do the people who are hiring caregivers because of busy lives consider themselves to be better than these workers?
in-depth interviews with care workers, longer-term observation during my weekly visitsto one of the care institutions, as well as accompanying care workers on home servicevisits to households
Notes research methods.
Technical privacy policy documents
How do technical privacy policy documents ensure that a business communicates its data collection, storage and sharing practices??
Image Credit
This image is also found in the Library of Congress and that link doesn't seem to have the requirement to provide it is in the public domain. Not sure if that matters. https://www.loc.gov/pictures/resource/pga.03686/
Is this image cited correctly?
Did
This photo here is a new photo from Texas Legislature online website. Is this cited correctly?
by systemic racial inequities in access to quality and trusted health care
trusted health care providers one lack specific to. how to conduct research to encompass this?
Black
more research needed
what holes in knowledge come up here compared to white straight women and white straight lesbian women?
ex with women underestimate their risk of contracting sexually transmitted infections, and their health care providers also need more education in this area.
BOTH PROVIDERS AND PACIENTS EXPIRENCE LACK OF KNOWLEDGE AORUND SAFE SEX
PROVIDER AND PACIENT
The Lived Experiences of Lesbian-Identified Black Women Navigating Sexual and Reproductive Health Care: A Scoping Review
regaining autonomy in SRH from the healthcare system black lesbian black striaght white striaght white lesbian
The Lived Experiences of Lesbian-Identified Black Women Navigating Sexual and Reproductive Health Care: A Scoping Review
how is gender socially constructed?
How is this apparent in the receival and returns of woman SRH in healthcare How is it apparent in SRH of black lesbians by healthcare
The Lived Experiences of Lesbian-Identified Black Women Navigating Sexual and Reproductive Health Care: A Scoping Review
straight black women's experience in the healthcare system comparing it against lesbian black women +++identify the needs and experience of black lesbian identifying sexual reproductive health.
The Lived Experiences of Lesbian-Identified Black Women Navigating Sexual and Reproductive Health Care: A Scoping Review
We are looking at the sexual reproductive healthcare needs of lesbians in America.
Heteronormative systems of oppression healthcare Racialized systems of oppression, and
how these determine health care return/ outcome of black lesbians (SHR)
An alto recorder, a tenor recorder and a bass recorder." (The recorder that kids play in school is actually the soprano version.)
There are different types of recorders! I believe soprano is the most affordable!
"It was very often played in consorts,"
They recorder was often played in consorts!
The Framework does not tell users what the right or most ethical thing to do is. While applying the Framework, the user is still the one who has to make a judgment call.
There is no one formula for acting ethically. You have to use your own personal judgment as well. That can be the hardest part!
Nonetheless, each one gives us important insights in the process of deciding what is ethical in a particular circumstance.
It is important to talk about how one ethical lens is not enough to think ethically. Each one has its benefits/downsides. It is vital to use a combination of them to live ethically.
A ruthless individualism, expressed primarily through a market mentality, has invaded every sphere of our lives, undermining those institutions, such as the family or the university, that have traditionally functioned as foci of collective purposes, history, and culture.
People being so laser-focused on their own personal success/gain has caused inequality because there is a lack of focus on others.
There are times, however, when our willingness to consider both the good of the individual and the good of the community leaves us in a dilemma, and we are forced to choose between competing moral claims.
I think this is important to annotate because it is tough to decide whether you are more important than the greater good. We want to be fair and help everyone, but does it cause you the individual to fall behind because the focus on the help is towards the group.
The benefits that a common good provides are, as we noted, available to everyone, including those who choose not to do their part to maintain the common good.
The free rider problem is very interesting to me because I feel there are a lot of people in the world that take advantage of being able to cling onto the people actually doing the work and reaping the benefits, without actually contributing themselves.
"Individuals should be treated the same, unless they differ in ways that are relevant to the situation in which they are involved."
This makes a ton of sense to me, especially with the example that follows the text I highlighted. Everyone should be treated the same unless they are different in ways that actually contribute to the lack of fairness. You can't simply treat someone differently if their differences have nothing to do with what you are doing at the time
Kant expressed this idea in a moral principle: humanity must always be treated as an end, not merely as a means.
We touched on this earlier in class. People are not used to only benefit yourself. Harming others to put yourself above them is not morally correct. It is a bit different than utilitarianism because in utilitarianism, there is some "harming" of others for the greater good of the majority.
una critica de esta TICCAD no esta en espaañol por lo cual la tengo que estar draduciendo
**estas son muy importantes porque son laboratorios extremos del universo .Tienen gravedad y densidad muy altas, una cucharada pesa mas que toda la humanidad .Estudiarlas nos ayudan a entender la física ,la materia y como se mueren las estrellas **
utilitarianism cannot be the sole principle guiding our decisions
Looking at outcomes can help overall, but if the system driving the outcome is not completely correct, people still suffer.
His motto, a familiar one now, was "the greatest good for the greatest number."
I feel this is the core principle of utilitarianism. It also makes a ton of sense. You want to make the best decisions for the largest number of people to leave the most people happy. It is interesting though because I feel this principle can leave out minority groups when it comes to decision making for the greater good.
When Louis-Philippe became king in 1830, his regime embraced laissez-faire policies, increased the money supply, and expanded credit and investment. He also extended the franchise to wealthy bankers, financiers, industrialists and some other property owners. Financialisation was rampant, money appeared to determine social status, and French society itself began to be understood as a market
Wonder what author has in mind about increasing money supply? Less requirement to back by specie?
Para la realización del primer reporte de reproducibilidad en el márgen del curso electivo de Ciencia Social Abierta,
BIEN