He was the boss
10,000 Matching Annotations
- May 2026
-
pressbooks.library.torontomu.ca pressbooks.library.torontomu.ca
-
-
He hits her to show he is in control
-
Us is wid yuh, Tea Cake. You know dat already. Dat Turner woman is real smart, accordin’ tuh her notions. Reckon she done heard ’bout dat money yo’ wife got in de bank and she’s bound tuh rope her intuh her family one way or another.”
Mrs. Turner knows about Tea Cake’s wife’s money and will cleverly manipulate her into her family to get it
-
great deal of the old crowd were back. But there were lots of new ones too. Some of these men made passes at Janie, and women who didn’t know took out after Tea Cake. Didn’t take them long to be put right, however. Still and all, jealousies arose now and then on both sides. When Mrs. Turner’s brother came and she brought him over to be introduced, Tea Cake had a brainstorm. Before the week was over he had whipped Janie. Not because her behavior justified his jealousy, but it relieved that awful fear inside him. Being able to whip her reassured him in possession. No brutal beating at all. He just slapped her around a bit to show he was boss. Everybody talked about it next day in the fields. It aroused a sort of envy in both men and women. The way he petted and pampered her as if those two or three face slaps had nearly killed her made the women see visions and the helpless way she hung on him made men dream dreams.
Tea cake hit Janie because he had felt jealous and he had wanted to feel in control.
-
-
pressbooks.library.torontomu.ca pressbooks.library.torontomu.ca
-
They came to the store and ostentatiously looked over whatever she was doing and went back to report to him at the house.
The town is weird they like to spy for an abusive loser.
-
-
www.biorxiv.org www.biorxiv.org
-
eLife Assessment
This study presents a valuable finding on the mutational landscape and expression profile of ZNF molecules in 23 Kenyan women with breast cancer. The evidence supporting the claims of the authors is solid, although inclusion of a larger number of patient samples, more statistical details and sufficient comparison with existing large-scale datasets would have strengthened the study. The work will be of interest to medical biologists working in the field of breast cancer.
-
Reviewer #1 (Public review):
Summary:
This manuscript investigates mutations and expression patterns of zinc finger proteins in Kenyan breast cancer patients. Whole-exome sequencing and RNA-seq were performed on 23 breast cancer samples alongside matched normal tissues.
Strengths:
Whole-exome sequencing and RNA-seq were performed on 23 breast cancer samples alongside matched normal tissues in Kenyan breast cancer patients. The authors identified mutations in ZNF217, ZNF703, and ZNF750.
Weaknesses:
(1) Research scope:
The results primarily focus on mutations in ZNF217, ZNF703, and ZNF750, with limited correlation analyses between mutations and gene expression. The rationale for focusing only on these genes is unclear. Given the availability of large breast cancer cohorts such as TCGA and METABRIC, the authors should compare their mutation profiles with these datasets. Beyond European and U.S. cohorts, sequencing data from multiple countries, including a recent Nigerian breast cancer study (doi: 10.1038/s41467-021-27079-w), should also be considered. Since whole-exome sequencing was performed, it is unclear why only four genes were highlighted, and why comparisons to previous literature were not included.
(2) Language and Style Issues
There are many typos and clear errors in the main text (e.g. (ref)).
Additionally, several statements read unnaturally. For example:
"Investigators uncovered 170 mutations ..." should instead be phrased as "We identified 170 mutations ...."
"The research team ..." should be rephrased as "Our team ...."
(3) Methods and Data Analysis Details
The methods section is vague, with general descriptions rather than specific details of data processing and analysis. The authors should provide:
(a) Parameters used for trimming, mapping, and variant calling (rather than referencing another paper such as Tang et al. 2023).
(b) Statistical methods for somatic mutation/SNP detection.
(c) Details of RNA purification and RNA-seq library preparation.
Without these details, the reproducibility of the study is limited.
(4) Data Reporting
This study has the potential to provide a valuable resource for the field. However, data-sharing plans are unclear. The authors should:
a) Deposit sequencing data in a public repository.
b) Provide supplementary tables listing all detected mutations and all differentially expressed genes (DEGs).
c) Clarify whether raw or adjusted p-values were used for DEG analysis.
d) Perform DEG analyses stratified by breast cancer subtypes, since differential expression was observed by HER2 status, and some zinc finger proteins are known to be enriched in luminal subtypes.
(5) Mutation Analysis
Visualizations of mutation distribution across protein domains would greatly strengthen interpretation. Comparing mutation distribution and frequency with published datasets would also contextualize the findings.
Comments on revisions:
The revised manuscript hasn't addressed any of these concerns. Careful proofreading is recommended, even if the authors do not intend to make further modifications to the manuscript.
-
Reviewer #2 (Public review):
Summary:
This work integrated the mutational landscape and expression profile of ZNF molecules in 23 Kenyan women with breast cancer.
Strengths:
The mutation landscape of ZNF217, ZNF703, and ZNF750 were comprehensively studied and correlate with tumor stage and HER2 status to highlight the clinical significance.
Weaknesses:
The current cohort size is relatively small to reach significant findings, and targeted exploration on ZNF family without emphasizing the reason or clinical significance hinders the overall significance of the entire work.
-
Reviewer #3 (Public review):
Summary:
This revised study analyzes the somatic mutational profiles and transcriptomic expression of three zinc-finger genes (ZNF217, ZNF703, ZNF750) in 23 Kenyan women with breast cancer, using whole-exome sequencing and RNA-sequencing of paired tumor-normal tissues. A total of 358 somatic mutations were detected, and all three genes were significantly upregulated in tumors compared to normal tissues (ZNF217 showing the most prominent difference). Higher expression was observed in HER2-positive tumors, though mutation burden for each gene did not correlate significantly with HER2 status or cancer stage. The findings provide preliminary evidence for the idenfication of diagnostic/prognostic biomarkers or therapeutic targets in sub-Saharan African populations.
Strengths:
The study's key strengths lie in its focus on an underrepresented Kenyan cohort, addressing a critical gap in sub-Saharan African breast cancer genomic research. It integrates DNA-level mutation analysis with RNA-level expression data, leveraging standardized bioinformatics pipelines (e.g., Mutect2 for variant calling, DESeq2 for differential expression) and rigorous quality control to deliver detailed insights into mutation types, functional impacts, and amino acid changes. Additionally, it explores gene expression patterns across different cancer stages and HER2 status subgroups, generating targeted hypotheses for future validation and enhancing the reliability of its findings.
Weaknesses:
The author has enhanced the descriptive depth of the study by adding details on mutations, expression subgroup analyses, and functional annotations but has not addressed the core weaknesses of small cohort size and lack of functional validation. While the revised version is more comprehensive in cataloging molecular alterations, it remains confined to descriptive analysis, with no substantial improvement in the reliability or generalizability of its conclusions.
-
Author response:
I have updated the manuscript by correcting errors.
-
-
pressbooks.library.torontomu.ca pressbooks.library.torontomu.caChapter 1824
-
A hurricane hit Everglades and Janie almost gets attacked by a dog but tea cake stepped in and took the risk for Janie.
-
The hurricane is real and the animals sense it
-
Some rabbits scurried through the quarters going east. Some possums slunk by and their route was definite. One or two at a time, then more. By the time the people left the fields the procession was constant. Snakes, rattlesnakes began to cross the quarters. The men killed a few, but they could not be missed from the crawling horde.
The animals can sense that the hurricane is real.
-
Janie began to fuss around his face where the dog had bitten him but he said it didn’t amount to anything. “He’d uh raised hell though if he had uh grabbed me uh inch higher and bit me in mah eye. Yuh can’t buy eyes in de store, yuh know.” He flopped to the edge of the fill as if the storm wasn’t going on at all. “Lemme rest awhile, then us got tuh make it on intuh town somehow.”
After the dog bit him she started to help him out for he doesn’t get an affected but he was already in so much pain
-
Chapter 18 shows how tea cake still cars about Janie by protecting her from the dog while stuck in the hurricane
-
In chapter 18, a huge hurricane hits the Everglades. At first Tea Cake does not think the storm is dangerous, but it becomes deadly. Janie and Tea Cake try to escape the flooding waters, and during the escape, Tea Cake saves Janie from a rabid dog but also gets bitten in the process.
-
A house down, here and there,
The wind was blowing so hard it was knocking down houses.
-
see.” “Yeah man. You and Janie wanta go? Ah wouldn’t give nobody else uh chawnce at uh seat till Ah found out if you all had anyway tuh go.”
The small animals leave and more and more signs show that a hurricane might actually be true
-
Through the screaming wind they heard things crashing and things hurtling and dashing with unbelievable velocit
The storm is a very huge storm and it’s intensifying everyone second
-
A massive hurricane hits Everglades, Janie and Tea Cake stay until they get flooded in their area. They are riding a cow and a mean dog tries to bite Janie but Tea Cake kills the dog but he got bit on the cheekbone.
-
Everybody was walking the fill. Hurrying, dragging, falling, crying, calling out names hopefully and hopelessly.
This hurricane really damaged all the peoples homes and families creating chaos everywhere.
-
They don’t leave and try to ride out the hurricane and she still protects and cares for teacake as they ride out the storm
-
Some rabbits scurried through the quarters going east. Some possums slunk by and their route was definite. One or two at a time, then more. By the time the people left the fields the procession was constant. Snakes, rattlesnakes began to cross the quarters. The men killed a few, but they could not be missed from the crawling horde
The small animals leave and more and more signs show that a hurricane might actually be true
-
Motorboat is too easy going so he’ll most likely die in the hurricane
-
He wanted to plunge in after her but dreaded the water, somehow. Tea Cake rose out of the water at the cow’s rump and seized the dog by the neck. But he was a powerful dog and Tea Cake was over-tired. So he didn’t kill the dog with one stroke as he had intended. But the dog couldn’t free himself either. They fought and somehow he managed to bite Tea Cake high up on his cheek-bone once.
The dog most likely had rabies. Now that Tea Cake got bitten, he probably won’t make it.
-
A hurricane hits the Everglades and Janie and tea cake don’t evacuate. A guy named motorboat stays with them and they try to escape. A dog bites tea cake on the face and they escape.
-
The hurricane scene in Chapter 18 is terrifying not just because of the storm itself, but because of how nature exposes human illusions. Janie and Tea Cake realize too late that the Everglades were never truly theirs the lake, the muck, the ‘safety’ of the bean field all belonged to the elements. Zora Neale Hurston shows that love and hard work can’t tame a world that refuses to recognize human boundaries. What haunts me most is the contrast: the white people fleeing in trucks while the Black workers are left to ‘take care of themselves nature’s fury undoing social hierarchies, but also revealing who was always considered expendable.
-
There is a hurricane and tea cakes and Janie are unprepared for the storm
-
How people ignored all the warning signs about the hurricane because they believed everything would be fine, and it also shows how strong Janie and Tea Cake’s relationship was during all the chaos
-
Through the screaming wind they heard things crashing and things hurtling and dashing with unbelievable velocity
The storm is getting very bad, they should have left when everyone else was leaving for safety
-
A big burst of thunder and lightning that trampled over the roof of the house. So Tea Cake and Motor stopped playing.
They chose to ignore the warning signs and stay behind instead of leaving somewhere safe.
-
They were headed towards the Palm Beach road and kept moving steadily. About an hour later another party appeared and went the same way. Then another just before sundown. This time she asked where they were all going and at last one of the men answered her
People begin to leave Everglades due to warning signs
-
Through the screaming wind they heard things crashing and things hurtling and dashing with unbelievable velocity.
During a hurricane
-
The hurricane comes and tea cake and Janie running and finding shelter
-
-
pressbooks.library.torontomu.ca pressbooks.library.torontomu.ca
-
The poeple think she’s either. A cheater or think she moving on from man to man
-
-
-
A Treatise Concerning the Principles of Human Knowledge<br /> by [[LibriVox]]<br /> accessed on 2026-05-07T09:38:57
-
-
librivox.org librivox.org
-
A Treatise Concerning the Principles of Human Knowledge (Version 2)<br /> by [[LibriVox]]<br /> accessed on 2026-05-07T09:41:21
-
-
pressbooks.library.torontomu.ca pressbooks.library.torontomu.ca
-
She feels like she can trust tea cake and maybe he’s the real one.
-
-
-
Different Conditions
It would appear this section is about colorblindness, and nothing else. So could you just say that in the title instead of "Different Conditions". To differentiate this topic from #3, perhaps you can rename #3 to 'Choosing Colors for Contrast" and tip #4 "Choosing Colorblind Friendly Colors"
-
Figure 3: Contrast Checker in WebAIIM
These figures should be vertically aligned, either at the top or middle. Our IWP Tips and Tricks guide has a section on using Drupal utility classes to vertically align content using the CKEditor Bootstrap Grid (Robert or I can help).
-
eight shape
Nice link. EightShapes is the name of a company (now defunct) and should be spelled accordingly with no space.
-
this wonderful blog
Which wonderful blog? Do you mean the blog post in the following sentence? If so could these sentences be combined?
-
the accessibility guidelines
"The accessibility guidelines" suggests there is only one set of standards. This will be harder to interpret as time moves on. You could either make it general by dropping the word "the", or specify WCAG 2.1 if that's what you're referring to.
-
through
delete the extra space before this word
-
Choice of basemaps
This section is really short and doesn't say anything about the connection between basemaps and accessibility. Isn't there a recommendation to use one of the high contrast base maps?
-
extension
Is the extension for ArcGIS Pro or ArcGIS Online. Can you provide a hyperlink?
-
Map Viewer for accessibility
The basemaps shown in Figure 13 look like the standard set of basemaps, but the caption suggests these have been approved for accessibility. Is that accurate?
-
This
To improve the logic of this section, consider adding a sentence along the lines of "Static maps can be more effective than interactive maps in directing the viewer's attention and conveying a message, especially when combined with accompanying text."
-
Adding narration with static map images
This is a little unclear. Do you mean adding narration to static map images? Or are you trying to stay that static map images operate as narration?
Also, should the user add the narration to the static image using something like Photoshop (in which case it will be 'burned in' and not accessible to screen readers). Or does the Story Maps editor have the ability to overlay text onto a static PNG file?
-
Accessibility tab
Wouldn't it be better to show them what's on the accessibility tab of the Image options?
-
state as decorative
What does tis mean? That you set the alt text to the word "decorcative"?
-
on all the images
This is repetitive, consider deleting
-
there are also tools
This tip has much less text than all the others, seems unablanced. To contextualize why you're providing links to these two websites, would you want to say a sentence about color blindness as it relates to the WCAG standards, and how it differs from the contrast standards?
-
-
www.datapulseresearch.com www.datapulseresearch.com
-
The AI Disclosure Gap
Alternative titles: "The Vanishing Ad Label" or "From Advertorial to AI Answer" I think I like the first one better
-
all three fall within a 3-percentage-point range.
is the the correct way to spell "3-percentage-point"?
-
entirely invisible in the AI response.
is it visible in the AI Response? OR visible for the AI?
-
Blended rates across all URLs. Individual URLs may carry markers in multiple layers.
It's a question not about the the text but the chart. does it mean 78.7% of the cited pages had no commercial markers? Even if they were needed or just because it was no commercial content?
-
“Beste Haartransplantation Klinik Türkei”
can't see the images for google AI and perplexity
-
“Welche Lohnabrechnungssoftware ist aktuell empfehlenswert?”
I couldn't see the Perplexity or Google AI picture
-
four commercial markers: Anzeige, Werbung, Advertorial meta tag, and “Verantwortlich für den Inhalt”.
Is it just me or are there only two of them visible on the picture?
-
The cited unternehmen.chip.de page
this seems to be a typo, change to: The cited chip.de page
-
The problem: when AI systems
change to: The problem is, when AI systems
-
The two markets tell different stories.
I think "markets" is not exactly the right word here, rather "cases" or "countries"
-
comparison prompts across 120 categories.
what kind of categories? Maybe it needs bit more information so the reader gets a better picture of what has been done
-
-
pressbooks.library.torontomu.ca pressbooks.library.torontomu.ca
-
They work together and progress the relationship
-
-
dl.acm.org dl.acm.org
-
The software for language implementations that we areconsidering for use by universities is grouped depending onwhether it requires1. only a browser, e.g., Explorer, Firefox, Safari2. a platform and language(s), e.g., a CLIimplementation and C# or F#3. an integrated development environment (IDE), e.g.,Visual Studio or Eclipse
-
-
-
The ardent masses who joined the Communards in battle were seldom industrial workers (Paris in the 1870s had relatively few factories), but more often small shopkeepers, café proprietors, shoemakers, students and self-employed craftsmen of every trade. In other words the petty bourgeoisie, which together with industrial workers constituted the People, the fabled dragon which had carried French revolutions since 1789.
Modern implication here.
-
-
larsfaye.com larsfaye.com
-
LLMs accelerate the wrong part
【洞察】「LLM 加速了错误的部分」——这句话点破了 AI 编程工具的根本问题:它们加速了代码的「生成」(原本不是瓶颈),却无法加速代码的「理解、审查和维护」(真正的瓶颈)。与 a16z 报告的「10-20x 生产力提升」数据对照:生产力的提升是真实的,但被提升的维度是否是最应该被提升的维度,是一个完全不同的问题。
-
the more you rely on AI to write code, the less you're able to oversee what the AI writes
✉️【洞察·监督悖论】这是本周关于 AI 编程最深刻的一句话:越依赖 AI,越失去监督 AI 的能力。这是一个隐性的技能退化循环,与肌肉萎缩类似——不用则废。与 Uncle Bob「传统编程已终结」的乐观叙事正面交锋:如果开发者失去了理解代码的能力,他们还能做什么来保证 AI 生成代码的质量?
-
-
www.anthropic.com www.anthropic.com
-
Anthropic, Blackstone, Hellman & Friedman, and Goldman Sachs announced the formation of a new AI services company
🤝【洞察】Anthropic 联手 Blackstone + Goldman Sachs——这不是技术合作,而是资本结构的战略重组。Blackstone 管理 1 万亿美元资产,Goldman Sachs 是企业关系的顶级入口。Anthropic 用金融资本弥补了自己最大的短板:企业级销售网络。与 OpenAI「The Deployment Company」同周发布,两家公司的企业服务战争在同一时间点打响,这是 AI 行业从「技术竞争」转向「渠道竞争」的历史时刻。
-
-
-
The next generation of benchmarks needs to be harder, more realistic, and less gameable
【洞察】「更难、更真实、更不可刷题」——这三条标准本质上是在要求 benchmark 向「真实工作」靠拢,而非向「考试题」收敛。但这恰恰引出了一个悖论:越真实的 benchmark,越难自动化评分,越贵(METR 每题 8000 美元),越慢发布。AI 评测体系正在面临「评测速度 vs 评测质量」的根本性权衡。
-
-
-
GPT-5.5 Instant is now the default model in ChatGPT
【洞察】成为「默认模型」是比任何 benchmark 都更重要的事件:数亿普通用户的日常 AI 体验将在毫无感知的情况下全面换代。这是 OpenAI 最强大的竞争护城河——不是技术领先,而是「默认入口」的控制权。所有竞争对手即便技术上追平,也无法改变用户已习惯 ChatGPT 的事实。
-
-
-
In the view of one judge, brokerage merely shifted unions from love and affection to the ‘still honest domain of self-interested transactions’.
Great line
-
-
drive.google.com drive.google.com
-
The writer introduces their argument by explaining the historical context behind the war in Gaza.
-
Balfour Declaration- called for the safeguarding of civil and religious rights for the Palestinian Arabs.
-
In 1967 when Israel occupied Gaza they started to absorb the Gaza government and put it under full Israeli control.
-
The conclusion argues that Gaza’s current situation is part of a long historical pattern of external control.
-
Britain was of the first to try to help Gaza settle a strong working government.
-
The crusader period made Gaza more vulnerable because there where split between the division of two different religions.
-
Gaza was a crossover between two countries which led to a struggle in gaining an independence. This lead to complications further down the road.
-
The article talks about how Gaza has been controlled and shaped by their government instead of them being able to fully govern Gaza themselves. JYLENE C
I think this was helpful and does a good job explaining how Gaza geography and history shaped the political instability - JYLENE C
-
The writer does a good job of giving creditable background that moves the writing along.
-
They claim the war in Gaza was caused by a three-millennia pattern where outside powers exploit the strategic location of Gaza.
-
The author explains that learning the history of Gaza is important for understanding what’s happening in the present.
-
The section about the Crusaders, Ottomans, and Islamic rulers demonstrates how Gaza repeatedly became a battleground between larger power.
-
The author argues that Gaza’s current crisis cannot be understood only through modern events because its instability has existed for thousands of years.
-
Leading up to this point the writer has done a good job of giving background to the topic.
-
-
drive.google.com drive.google.com
-
What I found interesting was how the essay repeats the idea that Gaza was ruled for its strategic value rather than for its people. So how do you think this pattern affected Gaza’s ability to grow independent political organizations over time?
-
From when the essay was published, they got the prediction right about how this will become a bigger topic, expanding to other nations and how they will handle this crisis.
-
This conclusion includes the "stakes" portion of what should be needed. It connects to todays wars going on, focusing on how if we ignore this problem change will not happen easily.
-
This transition is great, allowing the reader to feel the impact of what was before being destroyed.
-
I really like how the author goes through different periods to establish their argument. Although in some cases it may not be reliable to do so, this argument adds up, being coherent with each other body paragraph.
-
Before diving into the main argument, the author makes sure to establish a foundation for the audience, allowing them to be more integrated with the topic.
-
Instead of using direct quotes from peer-reviewed articles, the author takes the information, rewording it to the audience in a more understandable level.
-
Starting from the introduction, the author establishes their argument with confidence, knowing there is plenty of evidence throughout the entire essay to support their defense.
-
-
Local file Local file
-
New homes, sold before they're built — vs. ~10% in the US. Bu
Rework on the sentence. Then make the Buyer point as the next line
-
Portals
It's not aparent the point of AI learning .
2 points have to be covered :
- 100+ data points per property
- AI learns from buyer conversations
To give better experience & advise after each conversation
-
e what the builder's CP wouldn't."
Can we add 2 summary of buyer conversation , then move it above the table of traction quantitative.
-
e fee wh
In the heading called that , this makes unbaised
-
Adjacent revenue: home loan referral, legal & DD, interiors. Transparent, opt-in, never gated on advice.
Make the last part of sentence , more easily understandable
-
UYERS The home buyer has changed.
Say Home Buyer Persona has evolved or something
-
PRECEDENT — INDIA
Add the line saying Discovery Solved vs Decision Making Unsolved to separate & make it visually scanable.
In the the line show different categories (explicitly)
-
Can't afford 30 mins on a maybe buyer.
Can we add calls made per day to close 2 sales per month to show the problem better
-
Buyers see limited inventory, not the market.
A human can only hold limited info , still lack many data points about properties.
-
₹1000/lead,
Call out it's one of the highest lead cost across the market
-
The math doesn't let them advise.
The heading can be the same as the above 3 points
-
show competitors.
Change the wording to other projects not associated with them. Not scalable so lack knowledge about them.
-
So buyers DIY their research. And still get it wrong !
Should we move this down to increase the size of buying phone example. So that people read the whole content.
-
Buying a ₹50K phone? Influencers, reviews, & comparisons. Investing ₹1 lakh? SEBI-registered advisor to guide you.
Should we increase the font size ? to make people read it ?
-
3 viral Reddit threads on specific new builder projects covered by national press in 2025 alone.
Can we make this more readable ? by increasing the font size a little by 0.5 etc.
-
What buyers are promised ≠ what they get
Check the data point on remorse after purchase
-
-
www.biorxiv.org www.biorxiv.org
-
eLife Assessment
This valuable study characterises the activity of motor units from two of the three anatomical subdivisions ("heads") of the triceps muscle while mice walked on a treadmill at various speeds. Altogether, this is the most thorough characterisation of motor unit activity in walking mice to date, providing convincing evidence for probabilistic recruitment of motor units that differed between the two heads.
-
Reviewer #1 (Public review):
[Editors' note: this version has been assessed by the Reviewing Editor without further input from the original reviewers. The authors have addressed the comments raised in the previous round of review.]
Summary:
Here, the authors have addressed the recruitment and firing patterns of motor units (MUs) from the long and lateral heads of triceps in the mouse. They used their newly developed Myomatrix arrays to record from these muscles during treadmill locomotion at different speeds, and they used template-based spike sorting (Kilosort) to extract units. Between MUs from the two heads, the authors observe differences in their firing rates, recruitment probability, phase of activation within the locomotor cycle and interspike interval patterning. Examining different walking speeds, the authors find increases in both recruitment probability and firing rates as speed increases. The authors also observed differences in the relation between recruitment and the angle of elbow extension between motor units from each head. These differences indicate meaningful variation between motor units within and across motor pools, and may reflect the somewhat distinct joint actions of the two heads of triceps.
Strengths:
The extraction of MU spike timing for many individual units is an exciting new method that has great promise for exposing the fine detail in muscle activation and its control by the motor system. In particular, the methods developed by the authors for this purpose seem to be the only way to reliably resolve single MUs in the mouse, as the methods used previously in humans and in monkeys (e.g. Marshall et al. Nature Neuroscience, 2022) do not seem readily adaptable for use in rodents.
The paper provides a number of interesting observations. There are signs of interesting differences in MU activation profiles for individual muscles here, consistent with those shown by Marshall et al. It is also nice to see fine scale differences in the activation of different muscle heads, which could relate to their partially distinct functions. The mouse offers greater opportunities for understanding the control of these distinct functions, compared to the other organisms in which functional differences between heads have previously been described.
The Discussion is very thorough, providing a very nice recounting of a great deal of relevant previous results.
-
Reviewer #2 (Public review):
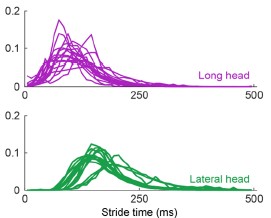
The present study, led by Thomas and collaborators, aims to characterise the firing activity of individual motor units in mice during locomotion. To achieve this, the team implanted small arrays of eight electrodes into two heads of the triceps and performed spike sorting using a custom implementation of Kilosort. Concurrently, they tracked the positions of the shoulder, elbow, and wrist using a single camera and a markerless motion capture algorithm (DeepLabCut). Repeated one-minute recordings were conducted in six mice across five speeds, ranging from 10 to 27.5 cm-1.
From these data, the authors demonstrate that:
- Their recording method and adapted spike-sorting algorithm enable robust decoding of motor unit activity during rapid movements.
- Identified motor units tend to be recruited during a subset of strides, with recruitment probability increasing with speed.
- Motor units within individual heads of the triceps likely receive common synaptic inputs that correlate their activity, whereas motor units from different heads exhibit distinct behaviour.
The authors conclude that these differences arise from the distinct functional roles of the muscles and the task constraints (i.e., speed).
Strengths:
- The novel combination of electrode arrays for recording intramuscular electromyographic signals from a larger muscle volume, paired with an advanced spike-sorting pipeline capable of identifying motor unit populations.
- The robustness of motor unit decoding during fast movements.
Weaknesses:
- The data do not clearly indicate which motor units were sampled from each pool, leaving uncertainty as to whether the sample is biased towards high-threshold motor units or representative of the entire pool.
- The results largely confirm the classic physiological framework of motor unit recruitment and rate coding, offering limited new insights into motor unit physiology.
Comments on previous version:
I would like to thank the authors for their thorough and insightful revisions. I am particularly pleased with the inclusion of the new analyses demonstrating the robustness of motor unit decoding, as well as the improved transparency regarding spike-sorting yield for each muscle and animal. Additionally, the new analyses illustrating that recruitment within muscle heads is consistent with the presence of common synaptic inputs and orderly recruitment significantly strengthen the manuscript.
-
Reviewer #3 (Public review):
Summary:
Using the approach of Myomatrix recording, the authors report that 1) motor units are recruited differently in the two types of muscles and 2) individual units are probabilistically recruited during the locomotion strides, whereas the population bulk EMG has a more reliable representation of the muscle. Third, the recruitment of units was proportional to walking speed.
Strengths:
The new technique provides a unique dataset, and the data analysis is convincing and well-executed.
Weaknesses:
After the revision, I no longer see any apparent weaknesses in the study.
-
Author response:
The following is the authors’ response to the previous reviews
Public Reviews:
Reviewer #1 (Public review):
Summary:
Here, the authors have addressed the recruitment and firing patterns of motor units (MUs) from the long and lateral heads of the triceps in the mouse. They used their newly developed Myomatrix arrays to record from these muscles during treadmill locomotion at different speeds, and they used template-based spike sorting (Kilosort) to extract units. Between MUs from the two heads, the authors observed differences in their firing rates, recruitment probability, phase of activation within the locomotor cycle, and interspike interval patterning. Examining different walking speeds, the authors find increases in both recruitment probability and firing rates as speed increases. The authors also observed differences in the relation between recruitment and the angle of elbow extension between motor units from each head. These differences indicate meaningful variation between motor units within and across motor pools and may reflect the somewhat distinct joint actions of the two heads of triceps.
Strengths:
The extraction of MU spike timing for many individual units is an exciting new method that has great promise for exposing the fine detail in muscle activation and its control by the motor system. In particular, the methods developed by the authors for this purpose seem to be the only way to reliably resolve single MUs in the mouse, as the methods used previously in humans and in monkeys (e.g. Marshall et al. Nature Neuroscience, 2022) do not seem readily adaptable for use in rodents.
The paper provides a number of interesting observations. There are signs of interesting differences in MU activation profiles for individual muscles here, consistent with those shown by Marshall et al. It is also nice to see fine-scale differences in the activation of different muscle heads, which could relate to their partially distinct functions. The mouse offers greater opportunities for understanding the control of these distinct functions, compared to the other organisms in which functional differences between heads have previously been described.
The Discussion is very thorough, providing a very nice recounting of a great deal of relevant previous results.
We thank the Reviewer for these comments.
Weaknesses:
The findings are limited to one pair of muscle heads. While an important initial finding, the lack of confirmation from analysis of other muscles acting at other joints leaves the general relevance of these findings unclear.
The Reviewer raises a fair point. While outside the scope of this paper, future studies should certainly address a wider range of muscles to better characterize motor unit firing patterns across different sets of effectors with varying anatomical locations. Still, the importance of results from the triceps long and lateral heads should not be understated as this paper, to our knowledge, is the first to capture the difference in firing patterns of motor units across any set of muscles in the locomoting mouse.
While differences between muscle heads with somewhat distinct functions are interesting and relevant to joint control, differences between MUs for individual muscles, like those in Marshall et al., are more striking because they cannot be attributed potentially to differences in each head's function. The present manuscript does show some signs of differences for MUs within individual heads: in Figure 2C, we see what looks like two clusters of motor units within the long head in terms of their recruitment probability. However, a statistical basis for the existence of two distinct subpopulations is not provided, and no subsequent analysis is done to explore the potential for differences among MUs for individual heads.
We agree with the Reviewer and have revised the manuscript to better examine potential subpopulations of units within each muscle as presented in Figure 2C. We performed Hartigan’s dip test on motor units within each muscle to test for multimodal distributions. For both muscles, p > 0.05, so we can not reject the null hypothesis that the units in each muscle come from a multimodal distribution. However, Hartigan’s test and similar statistical methods have poor statistical power for the small sample sizes (n=17 and 16 for long and lateral heads, respectively) considered here, so the failure to achieve statistical significance might reflect either the absence of a true difference or a lack of statistical resolution.
Still, the limited sample size warrants further data collection and analysis since the varying properties across motor units may lead to different activation patterns. Given these results, we have edited the text as follows:
“A subset of units, primarily in the long head, were recruited in under 50% of the total strides and with lower spike counts (Figure 2C). This distribution of recruitment probabilities might reflect a functionally different subpopulation of units. However, the distribution of recruitment probabilities were not found to be significantly multimodal (p>0.05 in both cases, Hartigan’s dip test; Hartigan, 1985). However, Hartigan’s test and similar statistical methods have poor statistical power for the small sample sizes (n=17 and 16 for long and lateral heads, respectively) considered here, so the failure to achieve statistical significance might reflect either the absence of a true difference or a lack of statistical resolution.”
The statistical foundation for some claims is lacking. In addition, the description of key statistical analysis in the Methods is too brief and very hard to understand. This leaves several claims hard to validate.
We thank the Reviewer for these comments and have clarified the text related to key statistical analyses throughout the manuscript, as described in our other responses below.
Reviewer #2 (Public review):
The present study, led by Thomas and collaborators, aims to describe the firing activity of individual motor units in mice during locomotion. To achieve this, they implanted small arrays of eight electrodes in two heads of the triceps and performed spike sorting using a custom implementation of Kilosort. Simultaneously, they tracked the positions of the shoulder, elbow, and wrist using a single camera and a markerless motion capture algorithm (DeepLabCut). Repeated one-minute recordings were conducted in six mice at five different speeds, ranging from 10 to 27.5 cm·s⁻¹.
From these data, the authors reported that:
(1) a significant portion of the identified motor units was not consistently recruited across strides,
(2) motor units identified from the lateral head of the triceps tended to be recruited later than those from the long head,
(3) the number of spikes per stride and peak firing rates were correlated in both muscles, and
(4) the probability of motor unit recruitment and firing rates increased with walking speed.
The authors conclude that these differences can be attributed to the distinct functions of the muscles and the constraints of the task (i.e., speed).
Strengths:
The combination of novel electrode arrays to record intramuscular electromyographic signals from a larger muscle volume with an advanced spike sorting pipeline capable of identifying populations of motor units.
We thank the Reviewer for this comment.
Weaknesses:
(1) There is a lack of information on the number of identified motor units per muscle and per animal.
The Reviewer is correct that this information was not explicitly provided in the prior submission. We have therefore added Table 1 that quantifies the number of motor units per muscle and per animal.
(2) All identified motor units are pooled in the analyses, whereas per-animal analyses would have been valuable, as motor units within an individual likely receive common synaptic inputs. Such analyses would fully leverage the potential of identifying populations of motor units.
Please see our answer to the following point, where we address questions (2) and (3) together.
(3) The current data do not allow for determining which motor units were sampled from each pool. It remains unclear whether the sample is biased toward high-threshold motor units or representative of the full pool.
We thank the Reviewer for these comments. To clarify how motor unit responses were distributed across animals and muscle targets, we updated or added the following figures:
Figure 2C
Figure 4–figure supplement 1
Figure 5–figure supplement 2
Figure 6–figure supplement 2
These provide a more complete look at the range of activity within each motor pool, suggesting that we do measure from units with different activation thresholds within the same motor pool, rather than this variation being due to cross-animal differences. For example, Figure 2C illustrates that motor units from the same muscle and animal show a wide variety of recruitment probabilities. However, the limited number of motor units recorded from each individual animal does not allow a statistically rigorous test for examining cross-animal differences.
(4) The behavioural analysis of the animals relies solely on kinematics (2D estimates of elbow angle and stride timing). Without ground reaction forces or shoulder angle data, drawing functional conclusions from the results is challenging.
The Reviewer is correct that we did not measure muscular force generation or ground reaction forces in the present study. Although outside the scope of this study, future work might employ buckle force transducers as used in larger animals (Biewener et al., 1988; Karabulut et al., 2020) to examine the complex interplay between neural commands, passive biomechanics, and the complex force-generating properties of muscle tissue.
Major comments:
(1) Spike sorting
The conclusions of the study rely on the accuracy and robustness of the spike sorting algorithm during a highly dynamic task. Although the pipeline was presented in a previous publication (Chung et al., 2023, eLife), a proper validation of the algorithm for identifying motor unit spikes is still lacking. This is particularly important in the present study, as the experimental conditions involve significant dynamic changes. Under such conditions, muscle geometry is altered due to variations in both fibre pennation angles and lengths.
This issue differs from electrode drift, and it is unclear whether the original implementation of Kilosort includes functions to address it. Could the authors provide more details on the various steps of their pipeline, the strategies they employed to ensure consistent tracking of motor unit action potentials despite potential changes in action potential waveforms, and the methods used for manual inspection of the spike sorting algorithm's output?
This is an excellent point and we agree that the dynamic behavior used in this investigation creates potential new challenges for spike sorting. In our analysis, Kilosort 2.5 provides key advantages in comparing unit waveforms across multiple channels and in detecting overlapping spikes. We modified this version of Kilosort to construct unit waveform templates using only the channels within the same muscle (Chung et al., 2023), as clarified in the revised Methods section (see “Electromyography (EMG)”):
“A total of 33 units were identified across all animals. Each unit’s isolation was verified by confirming that no more than 2% of inter-spike intervals violated a 1 ms refractory limit. Additionally, we manually reviewed cross-correlograms to ensure that each waveform was only reported as a single motor unit.”
The Reviewer is correct that our ability to precisely measure a unit’s activity based on its waveform will depend on the relationship between the embedded electrode and the muscle geometry, which alters over the course of the stride. As a follow-up to the original text, we have included new analyses to characterize the waveform activity throughout the experiment and stride (also in Methods):
“We further validated spike sorting by quantifying the stability of each unit’s waveform across time (Figure 1–figure supplement 1). First, we calculated the median waveform of each unit across every trial to capture long-term stability of motor unit waveforms. Additionally, we calculated the median waveform through the stride binned in 50 ms increments using spiking from a single trial. This second metric captures the stability of our spike sorting during the rapid changes in joint angles that occur during the burst of an individual motor unit. In doing so, we calculated each motor unit’s waveforms from the single channel in which that unit’s amplitude was largest and did not attempt to remove overlapping spikes from other units before measuring the median waveform from the data. We then calculated the correlation between a unit’s waveform over either trials or bins in which at least 30 spikes were present. The high correlation of a unit waveform over time, despite potential changes in the electrodes’ position relative to muscle geometry over the dynamic task, provides additional confidence in both the stability of our EMG recordings and the accuracy of our spike sorting.”
We have included a supplementary to Figure 1 to highlight the effectiveness of our spike sorting.
(2) Yield of the spike sorting pipeline and analyses per animal/muscle
A total of 33 motor units were identified from two heads of the triceps in six mice (17 from the long head and 16 from the lateral head). However, precise information on the yield per muscle per animal is not provided. This information is crucial to support the novelty of the study, as the authors claim in the introduction that their electrode arrays enable the identification of populations of motor units. Beyond reporting the number of identified motor units, another way to demonstrate the effectiveness of the spike sorting algorithm would be to compare the recorded EMG signals with the residual signal obtained after subtracting the action potentials of the identified motor units, using a signal-to-residual ratio.
Furthermore, motor units identified from the same muscle and the same animal are likely not independent due to common synaptic inputs. This dependence should be accounted for in the statistical analyses when comparing changes in motor unit properties across speeds and between muscles.
We thank the Reviewer for this comment. Regarding motor unit yield, as described above the newly-added Table 1 displays the yield from each animal and muscle.
Regarding spike sorting, while signal-to-residual is often an excellent metric, it is not ideal for our high-resolution EMG signals since isolated single motor units are typically superimposed on a “bulk” background consisting of the low-amplitude waveforms of other motor units. Because these smaller units typically cannot be sorted, it is challenging to estimate the “true” residual after subtracting (only) the largest motor unit, since subtracting each sorted unit’s waveform typically has a very small effect on the RMS of the total EMG signal. To further address concerns regarding spike sorting quality, we added Figure 1–figure supplement 1 that demonstrates motor units’ consistency over the experiment, highlighting that the waveform maintains its shape within each stride despite muscle/limb dynamics and other possible sources of electrical noise or artifact.
Finally, the Reviewer is correct that individual motor units in the same muscle are very likely to receive common synaptic inputs. These common inputs may reflect in sparse motor units being recruited in overlapping rather than different strides. Indeed, in the following text added to the Results, we identified that motor units are recruited with higher probability when additional units are recruited.
“Probabilistic recruitment is correlated across motor units
Our results show that the recruitment of individual motor units is probabilistic even within a single speed quartile (Figure 5A-C) and predicts body movements (Figure 6), raising the question of whether the recruitment of individual motor units are correlated or independent. Correlated recruitment might reflect shared input onto the population of motor units innervating the muscle (De Luca, 1985; De Luca & Erim, 1994; Farina et al., 2014). For example, two motor units, each with low recruitment probabilities, may still fire during the same set of strides. To assess the independence of motor unit recruitment across the recorded population, we compared each unit’s empirical recruitment probability across all strides to its conditional recruitment probability during strides in which another motor unit from the same muscle was recruited (Figure 7). Doing this for all motor unit pairs revealed that motor units in both muscles were biased towards greater recruitment when additional units were active (p<0.001, Wilcoxon signed-rank tests for both the lateral and long heads of triceps). This finding suggests that probabilistic recruitment reflects common synaptic inputs that covary together across locomotor strides.”
(3) Representativeness of the sample of identified motor units
However, to draw such conclusions, the authors should exclusively compare motor units from the same pool and systematically track violations of the recruitment order. Alternatively, they could demonstrate that the motor units that are intermittently active across strides correspond to the smallest motor units, based on the assumption that these units should always be recruited due to their low activation thresholds.
One way to estimate the size of motor units identified within the same muscle would be to compare the amplitude of their action potentials, assuming that all motor units are relatively close to the electrodes (given the selectivity of the recordings) and that motoneurons innervating more muscle fibres generate larger motor unit action potentials.
We thank the Reviewer for this comment. Below, we provide more detailed analyses of the relationships between motor unit spike amplitude and the recruitment probability as well as latency (relative to stride onset) of activation.
We generated Author response image 1 to illustrate the relationship between the amplitude of motor units and their firing properties. As suspected, units with larger-amplitude waveforms fired with lower probability and produced their first spikes later in the stride. If we were comfortable assuming that larger spike amplitudes mean higher-force units, then this would be consistent with a key prediction of the size principle (i.e. that higher-force units are recruited later). However, we are hesitant to base any conclusions on this assumption or emphasize this point with a main-text figure, since EMG signal amplitude may also vary due to the physical properties of the electrode and distance from muscle fibers. Thus it is possible that a large motor unit may have a smaller waveform amplitude relative to the rest of the motor pool.
Author response image 1.
Relation between motor unit amplitude and (A) recruitment probability and (B) mean first spike time within the stride. Colored lines indicate the outcome of linear regression analyses.
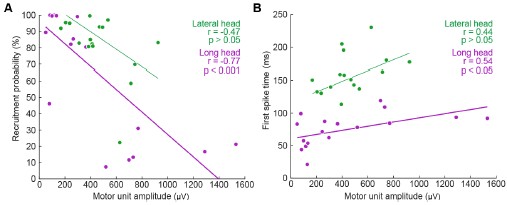
Currently, the data seem to support the idea that motor units that are alternately recruited across strides have recruitment thresholds close to the level of activation or force produced during slow walking. The fact that recruitment probability monotonically increases with speed suggests that the force required to propel the mouse forward exceeds the recruitment threshold of these "large" motor units. This pattern would primarily reflect spatial recruitment following the size principle rather than flexible motor unit control.
We thank the Reviewer for this comment. We agree with this interpretation, particularly in relation to the references suggested in later comments, and have added the following text to the Discussion to better reflect this argument:
“To investigate the neuromuscular control of locomotor speed, we quantified speed-dependent changes in both motor unit recruitment and firing rate. We found that the majority of units were recruited more often and with larger firing rates at faster speeds (Figure 5, Figure5–figure supplement 1). This result may reflect speed-dependent differences in the common input received by populations of motor neurons with varying spiking thresholds (Henneman et al., 1965). In the case of mouse locomotion, faster speeds might reflect a larger common input, increasing the recruitment probability as more neurons, particularly those that are larger and generate more force, exceed threshold for action potentials (Farina et al., 2014).”
(4) Analysis of recruitment and firing rates
The authors currently report active duration and peak firing rates based on spike trains convolved with a Gaussian kernel. Why not report the peak of the instantaneous firing rates estimated from the inverse of the inter-spike interval? This approach appears to be more aligned with previous studies conducted to describe motor unit behaviour during fast movements (e.g., Desmedt & Godaux, 1977, J Physiol; Van Cutsem et al., 1998, J Physiol; Del Vecchio et al., 2019, J Physiol).
We thank the Reviewer for this comment. In the revised Discussion (see ‘Firing rates in mouse locomotion compared to other species’) we reference several examples of previous studies that quantified spike patterns based on the instantaneous firing rate. We chose to report the peak of the smoothed firing rate because that quantification includes strides with zero spikes or only one spike, which occur regularly in our dataset (and for which ISI rate measures, which require two spikes to define an instantaneous firing rate, cannot be computed). Regardless, in the revised Figure 4B, we present an analysis that uses inter-spike intervals as suggested, which yielded similar ranges of firing rates as the primary analysis.
(5) Additional analyses of behaviour
The authors currently analyse motor unit recruitment in relation to elbow angle. It would be valuable to include a similar analysis using the angular velocity observed during each stride, re broadly, comparing stride-by-stride changes in firing rates with changes in elbow angular velocity would further strengthen the final analyses presented in the results section.
We thank the Reviewer for this comment. To address this, we have modified Figure 6 and the associated Supplemental Figures, to show relationships in unit activation with both the range of elbow extension and the range of elbow velocity for each stride. These new Supplemental Figures show that the trends shown in main text Figure 6C and 6E (which show data from all speed quartiles on the same axes) are also apparent in both the slower and faster quartiles individually, although single-quartile statistical tests (with smaller sample size than the main analysis) not reach statistical significance in all cases.
Reviewer #3 (Public review):
Summary:
Using the approach of Myomatrix recording, the authors report that:
(1) Motor units are recruited differently in the two types of muscles.
(2) Individual units are probabilistically recruited during the locomotion strides, whereas the population bulk EMG has a more reliable representation of the muscle.
(3) The recruitment of units was proportional to walking speed.
Strengths:
The new technique provides a unique data set, and the data analysis is convincing and well-performed.
We thank the Reviewer for the comment.
Weaknesses:
The implications of "probabilistical recruitment" should be explored, addressed, and analyzed further.
Comments:
One of the study's main findings (perhaps the main finding) is that the motor units are "probabilistically" recruited. The authors do not define what they mean by probabilistically recruited, nor do they present an alternative scenario to such recruitment or discuss why this would be interesting or surprising. However, on page 4, they do indicate that the recruitment of units from both muscles was only active in a subset of strides, i.e., they are not reliably active in every step.
If probabilistic means irregular spiking, this is not new. Variability in spiking has been seen numerous times, for instance in human biceps brachii motor units during isometric contractions (Pascoe, Enoka, Exp physiology 2014) and elsewhere. Perhaps the distinction the authors are seeking is between fluctuation-driven and mean-driven spiking of motor units as previously identified in spinal motor networks (see Petersen and Berg, eLife 2016, and Berg, Frontiers 2017). Here, it was shown that a prominent regime of irregular spiking is present during rhythmic motor activity, which also manifests as a positive skewness in the spike count distribution (i.e., log-normal).
We thank the Reviewer for this comment and have clarified several passages in response. The Reviewer is of course correct that irregular motor unit spiking has been described previously and may reflect motor neurons’ operating in a high-sensitivity (fluctuation-driven) regime. We now cite these papers in the Discussion (see ‘Firing rates in mouse locomotion compared to other species’). Additionally, the revision clarifies that “probabilistically” - as defined in our paper - refers only to the empirical observation that a motor unit spikes during only a subset of strides, either when all locomotor speeds are considered together (Figure 2) or separately (Figure 5A-C):
“Motor units in both muscles exhibited this pattern of probabilistic recruitment (defined as a unit’s firing on only a fraction of strides), but with differing distributions of firing properties across the long and lateral heads (Figure 2).”
“Our findings (Figure 4) highlight that even with the relatively high firing rates observed in mice, there are still significant changes in firing rate and recruitment probability across the spikes within bursts (Figure 4B) and across locomotor speeds (Figure 5F). Future studies should more carefully examine how these rapidly changing spiking patterns derive from both the statistics of synaptic inputs and intrinsic properties of motor neurons (Manuel & Heckman, 2011; Petersen & Berg, 2016; Berg, 2017).”
Recommendations for the authors:
Reviewer #1 (Recommendations for the authors):
As mentioned above, there are several issues with the statistics that need to be corrected to properly support the claims made in the paper.
The authors compare the fractions of MUs that show significant variation across locomotor speeds in their firing rate and recruitment probability. However, it is not statistically founded to compare the results of separate statistical tests based on different kinds of measurements and thus have unconstrained differences in statistical power. The comparison of the fractional changes in firing rates and recruitment across speeds that follow is helpful, though in truth, by contemporary standards, one would like to see error bars on these estimates. These could be generated using bootstrapping.
The Reviewer is correct, and we have revised the manuscript to better clarify which quantities should or should not be compared, including the following passage (see “Motor unit mechanisms of speed control” in Results):
“Speed-dependent increases in peak firing rate were therefore also present in our dataset, although in a smaller fraction of motor units (22/33) than changes in recruitment probability (31/33). Furthermore, the mean (± SE) magnitude of speed-dependent increases was smaller for spike rates (mean rate<sub>fast</sub>/rate<sub>slow</sub> of 111% ± 20% across all motor units) than for recruitment probabilities (mean p(recruitment)<sub>fast</sub>/p(recruitment)<sub>slow</sub> of 179% ± 3% across all motor units). While fractional changes in rate and recruitment probability are not readily comparable given their different upper limits, these findings could suggest that while both recruitment and peak rate change across speed quartiles, increased recruitment probability may play a larger role in driving changes in locomotor speed.”
The description in the Methods of the tests for variation in firing rates and recruitment probability across speeds are extremely hard to understand - after reading many times, it is still not clear what was done, or why the method used was chosen. In the main text, the authors quote p-values and then state "bootstrap confidence intervals," which is not a statistical test that yields a p-value. While there are mathematical relationships between confidence intervals and statistical tests such that a one-to-one correspondence between them can exist, the descriptions provided fall short of specifying how they are related in the present instance. For this reason, and those described in what follows, it is not clear what the p-values represent.
Next, the authors refer to fitting a model ("a Poisson distribution") to the data to estimate firing rate and recruitment probability, that the model results agree with their actual data, and that they then bootstrapped from the model estimates to get confidence intervals and compute p-values. Why do this? Why not just do something much simpler, like use the actual spike counts, and resample from those? I understand that it is hard to distinguish between no recruitment and just no spikes given some low Poisson firing rate, but how does that challenge the ability to test if the firing rates or the number of spiking MUs changes significantly across speeds? I can come up with some reasons why I think the authors might have decided to do this, but reasoning like this really should be made explicit.
In addition, the authors would provide an unambiguous description of the model, perhaps using an equation and a description of how it was fit. For the bootstrapping, a clear description of how the resampling was done should be included. The focus on peak firing rate instead of mean (or median) firing rate should also be justified. Since peaks are noisier, I would expect the statistical power to be lower compared to using the mean or median.
We thank the Reviewer for the comments and have revised and expanded our discussion of the statistical tests employed. We expanded and clarified our description of these techniques in the updated Methods section:
“Joint model of rate and recruitment
We modeled the recruitment probability and firing rate based on empirical data to best characterize firing statistics within the stride. Particularly, this allowed for multiple solutions to explain why a motor unit would not spike within a stride. From the empirical data alone, strides with zero spikes would have been assumed to have no recruitment of a unit. However, to create a model of motor unit activity that includes both recruitment and rate, it must be possible that a recruited unit can have a firing rate of zero. To quantify the firing statistics that best represent all spiking and non-spiking patterns, we modeled recruitment probability and peak firing rate along the following piecewise function:
Eq. 1:

Eq. 2:
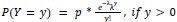
where y denotes the observed peak firing rate on a given stride (determined by convolving motor unit spike times with a Gaussian kernel as described above), p denotes the probability of recruitment, and λ denotes the expected peak firing rate from a Poisson distribution of outcomes. Thus, an inactive unit on a given stride may be the result of either non-recruitment or recruitment with a stochastically zero firing rate. The above equations were fit by minimizing the negative log-likelihood of the parameters given the data.”
“Permutation test for joint model of rate and recruitment and type 2 regression slopes
To quantify differences in firing patterns across walking speeds, we subdivided each mouse’s total set of strides into speed quartiles and calculated rate (𝜆, Eq. 1 and 2, Fig. 5A-C) and recruitment probability terms (p, Eq. 1 and 2, Fig. 5D-F) for each unit in each speed quartile. Here we calculated the difference in both the rate and recruitment terms across the fastest and slowest speed quartiles (p<sub>fast</sub>-p<sub>slow</sub> and 𝜆<sub>fast</sub>-𝜆<sub>slow</sub>). To test whether these model parameters were significantly different depending on locomotor speed, we developed a null model combining strides from both the fastest and slowest speed quartiles. After pooling strides from both quartiles, we randomly distributed the pooled set of strides into two groups with sample sizes equal to the original slow and fast quartiles. We then calculated the null model parameters for each new group and found the difference between like terms. To estimate the distribution of possible differences, we bootstrapped this result using 1000 random redistributions of the pooled set of strides. Following the permutation test, the 95% confidence interval of this final distribution reflects the null hypothesis of no difference between groups. Thus, the null hypothesis can be rejected if the true difference in rate or recruitment terms exceeds this confidence interval.
We followed a similar procedure to quantify cross-muscle differences in the relationship between firing parameters. For each muscle, we estimated the slope across firing parameters for each motor unit using type 2 regression. In this case, the true difference was the difference in slopes between muscles. To test the null hypothesis that there was no difference in slopes, the null model reflected the pooled set of units from both muscles. Again, slopes were calculated for 1000 random resamplings of this pooled data to estimate the 95% confidence interval.”
The argument for delayed activation of the lateral head is interesting, but I am not comfortable saying the nervous system creates a delay just based on observations of the mean time of the first spike, given the potential for differential variability in spike timing across muscles and MUs. One way to make a strong case for a delay would be to show aggregate PSTHs for all the spikes from all the MUs for each of the two heads. That would distinguish between a true delay and more gradual or variable activation between the heads.
This is a good point and we agree that the claim made about the nervous system is too strong given the results. Even with Author response image 2 that the Reviewer suggested, there is still not enough evidence to isolate the role of the nervous system in the muscles’ activation.
Author response image 2.
Aggregate peristimulus time histogram (PSTH) for all motor unit spike times in the long head (top) and lateral head (bottom) within the stride.
In the ideal case, we would have more simultaneous recordings from both muscles to make a more direct claim on the delay. Still, within the current scope of the paper, to correct this and better describe the difference in timing of muscle activity, we edited the text to the following:
“These findings demonstrate that despite the synergistic (extensor) function of the long and lateral heads of the triceps at the elbow, the motor pool for the long head becomes active roughly 100 ms before the motor pool supplying the lateral head during locomotion (Figure 3C).”
The results from Marshall et al. 2022 suggest that the recruitment of some MUs is not just related to muscle force, but also the frequency of force variation - some of their MUs appear to be recruited only at certain frequencies. Figure 5C could have shown signs of this, but it does not appear to. We do not really know the force or its frequency of variation in the measurements here. I wonder whether there is additional analysis that could address whether frequency-dependent recruitment is present. It may not be addressable with the current data set, but this could be a fruitful direction to explore in the future with MU recordings from mice.
We agree that this would be a fruitful direction to explore, however the Reviewer is correct that this is not easily addressable with the dataset. As the Reviewer points out, stride frequency increases with increased speed, potentially offering the opportunity to examine how motor unit activity varies with the frequency, phase, and amplitude of locomotor movements. However, given our lack of force data (either joint torques or ground reaction forces), dissociating the frequency/phase/amplitude of skeletal kinematics from the frequency/phase/amplitude of muscle force. Marshall et al. (2022) mitigated these issues by using an isometric force-production task (Marshall et al., 2022). Therefore, while we agree that it would be a major contribution to extend such investigations to whole-body movements like locomotion, given the complexities described above we believe this is a project for the future, and beyond the scope of the present study.
Minor:
Page 5: "Units often displayed no recruitment in a greater proportion of strides than for any particular spike count when recruited (Figures 2A, B)," - I had to read this several times to understand it. I suggest rephrasing for clarity.
We have changed the text to read:
“Units demonstrated a variety of firing patterns, with some units producing 0 spikes more frequently than any non-zero spike count (Figure 2A, B),...”
Figure 3 legend: "Mean phase ({plus minus} SE) of motor unit burst duration across all strides.": It is unclear what this means - durations are not usually described as having a phase. Do we mean the onset phase?
We have changed the text to read:
“Mean phase ± SE of motor unit burst activity within each stride”
Page 9: "suggesting that the recruitment of individual motor units in the lateral and long heads might have significant (and opposite) effects on elbow angle in strides of similar speed (see Discussion)." I wouldn't say "opposite" here - that makes it sound like the authors are calling the long head a flexor. The authors should rephrase or clarify the sense in which they are opposite.
This is a fair point and we agree we should not describe the muscles as ‘opposite’ when both muscles are extensors. We have removed the phrase ‘and opposite’ from the text.
Page 11: "in these two muscles across in other quadrupedal species" - typo.
We have corrected this error.
Page 16: This reviewer cannot decipher after repeated attempts what the first two sentences of the last paragraph mean. - “Future studies might also use perturbations of muscle activity to dissociate the causal properties of each motor unit’s activity from the complex correlation structure of locomotion. Despite the strong correlations observed between motor unit recruitment and limb kinematics (Fig. 6, Supplemental Fig. 3), these results might reflect covariations of both factors with locomotor speed rather than the causal properties of the recorded motor unit.”
For better clarity, we have changed the text to read:
“Although strong correlations were observed between motor unit recruitment and limb kinematics during locomotion (Figure 6, Figure 6–figure supplement 1), it remains unclear whether such correlations actually reflect the causal contributions that those units make to limb movement. To resolve this ambiguity, future studies could use electrical or optical perturbations of muscle contraction levels (Kim et al., 2024; Lu et al., 2024; Srivastava et al., 2015, 2017) to test directly how motor unit firing patterns shape locomotor movements.The short-latency effects of patterned motor unit stimulation (Srivastava et al., 2017) could then reveal the sensitivity of behavior to changes in muscle spiking and the extent to which the same behaviors can be performed with many different motor commands.”
Reviewer #2 (Recommendations for the authors):
Minor comments:
Introduction:
(1) "Although studies in primates, cats, and zebrafish have shown that both the number of active motor units and motor unit firing rates increase at faster locomotor speeds (Grimby, 1984; Hoffer et al., 1981, 1987; Marshall et al., 2022; Menelaou & McLean, 2012)." I would remove Marshall et al. (2022) as their monkeys performed pulling tasks with the upper limb. You can alternatively remove locomotor from the sentence and replace it with contraction speed.
Thank you for the comment. While we intended to reference this specific paper to highlight the rhythmic activity in muscles, we agree that this deviates from ‘locomotion’ as it is referenced in the other cited papers which study body movement. We have followed the Reviewer’s suggestion to remove the citation to Marshall et al.
(2) "The capability and need for faster force generation during dynamic behavior could implicate motor unit recruitment as a primary mechanism for modulating force output in mice."
The authors could add citations to this sentence, of works that showed that recruitment speed is the main determinant of the rate of force development (see for example Dideriksen et al. (2020) J Neurophysiol; J. L. Dideriksen, A. Del Vecchio, D. Farina, Neural and muscular determinants of maximal rate of force development. J Neurophysiol 123, 149-157 (2020)).
Thank you for pointing out this important reference. We have included this as a citation as recommended.
Results:
(3) "Electrode arrays (32-electrode Myomatrix array model RF-4x8-BHS-5) were implanted in the triceps brachii (note that Figure 1D shows the EMG signal from only one of the 16 bipolar recording channels), and the resulting data were used to identify the spike times of individual motor units (Figure 1E) as described previously (Chung et al., 2023)."
This sentence can be misleading for the reader as the array used by the researchers has 4 threads of 8 electrodes. Would it be possible to specify the number of electrodes implanted per head of interest? I assume 8 per head in most mice (or 4 bipolar channels), even if that's not specifically written in the manuscript.
Thank you for the suggestion. As described above, we have added Table 1, which includes all array locations, and we edited the statement referenced in the comment as follows:
“Electrode arrays (32-electrode Myomatrix array model RF-4x8-BHS-5) were implanted in forelimb muscles (note that Figure 1D shows the EMG signal from only one of the 16 bipolar recording channels), and the resulting data were used to identify the spike times of individual motor units in the triceps brachii long and lateral heads (Table 1, Figure 1E) as described previously (Chung et al., 2023).“
(4) "These findings demonstrate that despite the overlapping biomechanical functions of the long and lateral heads of the triceps, the nervous system creates a consistent, approximately 100 ms delay (Figure 3C) between the activation of the two muscles' motor neuron pools. This timing difference suggests distinct patterns of synaptic input onto motor neurons innervating the lateral and long heads."
Both muscles don't have fully overlapping biomechanical functions, as one of them also acts on the shoulder joint. Please be more specific in this sentence, saying that both muscles are synergistic at the elbow level rather than "have overlapping biomechanical functions".
We agree with the above reasoning and that our manuscript should be clearer on this point. We edited the above text in accordance with the Reviewer suggestion as follows:
"These findings demonstrate that despite the synergistic (extensor) function of the long and lateral heads of the triceps at the elbow, …”
(5) "Together with the differences in burst timing shown in Figure 3B, these results again suggest that the motor pools for the lateral and long heads of the triceps receive distinct patterns of synaptic input, although differences in the intrinsic physiological properties of motor neurons innervating the two muscles might also play an important role."
It is difficult to draw such an affirmative conclusion on the synaptic inputs from the data presented by the authors. The differences in firing rates may solely arise from other factors than distinct synaptic inputs, such as the different intrinsic properties of the motoneurons or the reception of distinct neuromodulatory inputs.
To better explain our findings, we adjusted the above text in the Results (see “Motor unit firing patterns in the long and lateral heads of the triceps”):
“Together with the differences in burst timing shown in Figure 3B, these results again suggest that the motor pools for the lateral and long heads of the triceps receive distinct patterns of synaptic input, although differences in the intrinsic physiological properties of motor neurons innervating the two muscles might also play an important role.”
We also included the following distinction in the Discussion (see “Differences in motor unit activity patterns across two elbow extensors”) to address the other plausible mechanisms mentioned.
“The large differences in burst timing and spike patterning across the muscle heads suggest that the motor pools for each muscle receive distinct inputs. However, differences in the intrinsic physiological properties of motor units and neuromodulatory inputs across motor pools might also make substantial contributions to the structure of motor unit spike patterns (Martínez-Silva et al., 2018; Miles & Sillar, 2011).”
(6) "We next examined whether the probabilistic recruitment of individual motor units in the triceps and elbow extensor muscle predicted stride-by-stride variations in elbow angle kinematics."
I'm not sure that the wording is appropriate here. The analysis does not predict elbow angle variations from parameters extracted from the spiking activity. It rather compares the average elbow angle between two conditions (motor unit active or not active).
We thank the Reviewer for this comment and agree that the wording could be improved here to better reflect our analysis. To lower the strength of our claim, we replaced usage of the word
‘predict’ with ‘correlates’ in the above text and throughout the paper when discussing this result.
Methods:
(7) "Using the four threads on the customizable Myomatrix array (RF-4x8-BHS-5), we implanted a combination of muscles in each mouse, sometimes using multiple threads within the same muscle. [...] Some mice also had threads simultaneously implanted in their ipsilateral or contralateral biceps brachii although no data from the biceps is presented in this study."
A precise description of the localisation of the array (muscles and the number of arrays per muscle) for each animal would be appreciated.
(8) "A total of 33 units were identified and manually verified across all animals." A precise description of the number of motor units concurrently identified per muscle and per animal would be appreciated. Moreover, please add details on the manual inspection. Does it involve the manual selection of missing spikes? What are the criteria for considering an identified motor unit as valid?
As discussed earlier, we added Table 1 to the main text to provide the details mentioned in the above comments.
Regarding spike sorting, given the very large number of spikes recorded, we did not rely on manual adjusting mislabeled spikes. Instead, as described in the revised Methods section, we verified unit isolation by ensuring units had >98% of spikes outside of 1ms of each other. Moreover, as described above we have added new analyses (Figure 1–figure supplement 1) confirming the stability of motor unit waveforms across both the duration of individual recording sessions (roughly 30 minutes) and across the rapid changes in limb position within individual stride cycles (roughly 250 msec).
Reviewer #3 (Recommendations for the authors):
Figure 2 (and supplement) show spike count distributions with strong positive skewness, which is in accordance with the prediction of a fluctuation-driven regime. I suggest plotting these on a logarithmic x-axis (in addition to the linear axis), which should reveal a bell-shaped distribution, maybe even Gaussian, in a majority of the units.
We thank the Reviewer for the suggestion. We present the requested analysis (Author response image 3), which shows bell-shaped distributions for some (but not all) distributions. However, we believe that investigating why some replotted distributions are Gaussian and others are not falls beyond the scope of this paper, and likely requires a larger dataset than the one we were able to obtain.
Author response image 3.
Spike count distributions for each motor unit on a logarithmic x-axis.
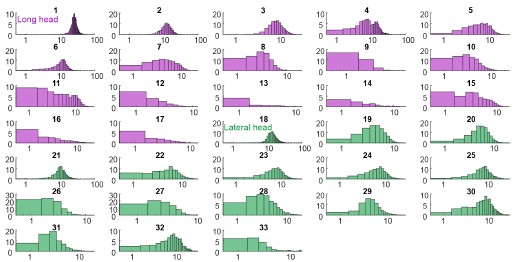
Why not more data? I tried to get an overview of how much data was collected.
Supplemental Figure 1 has all the isolated units, which amounts to 38 (are the colors the two muscle types?). Given there are 16 leads in each myomatrix, in two muscles, of six mice, this seems like a low yield. Could the authors comment on the reasons for this low yield?
Regarding motor unit yield, even with multiple electrodes per muscle and a robust sorting algorithm, we often isolated only a few units per muscle. This yield likely reflects two factors. First, because of the highly dynamic nature of locomotion and high levels of muscle contraction, isolating individual spikes reliably across different locomotor speeds is inherently challenging, regardless of the algorithm being employed. Second, because the results of spike-train analyses can be highly sensitive to sorting errors, we have only included the motor units that we can sort with the highest possible confidence across thousands of strides.
Minor:
Figure captions especially Figure 6: The text is excessively long. Can the text be shortened?
We thank the Reviewer for this comment. Generally, we seek to include a description of the methods and results within the figure captions, but we concede that we can condense the information in some cases. In a number of cases, we have moved some of the descriptive text from the caption to the Methods section.
References
Berg, R. W. (2017). Neuronal Population Activity in Spinal Motor Circuits: Greater Than the Sum of Its Parts. Frontiers in Neural Circuits, 11. https://doi.org/10.3389/fncir.2017.00103
Biewener, A. A., Blickhan, R., Perry, A. K., Heglund, N. C., & Taylor, C. R. (1988). Muscle Forces During Locomotion in Kangaroo Rats: Force Platform and Tendon Buckle Measurements Compared. Journal of Experimental Biology, 137(1), 191–205. https://doi.org/10.1242/jeb.137.1.191
Chung, B., Zia, M., Thomas, K. A., Michaels, J. A., Jacob, A., Pack, A., Williams, M. J., Nagapudi, K., Teng, L. H., Arrambide, E., Ouellette, L., Oey, N., Gibbs, R., Anschutz, P., Lu, J., Wu, Y., Kashefi, M., Oya, T., Kersten, R., … Sober, S. J. (2023). Myomatrix arrays for high-definition muscle recording. eLife, 12, RP88551. https://doi.org/10.7554/eLife.88551
De Luca, C. J. (1985). Control properties of motor units. Journal of Experimental Biology, 115(1), 125–136. https://doi.org/10.1242/jeb.115.1.125
De Luca, C. J., & Erim, Z. (1994). Common drive of motor units in regulation of muscle force. Trends in Neurosciences, 17(7), 299–305. https://doi.org/10.1016/0166-2236(94)90064-7
Farina, D., Negro, F., & Dideriksen, J. L. (2014). The effective neural drive to muscles is the common synaptic input to motor neurons. The Journal of Physiology, 592(16), 3427–3441. https://doi.org/10.1113/jphysiol.2014.273581
Hartigan, P. M. (1985). Algorithm AS 217: Computation of the Dip Statistic to Test for Unimodality. Applied Statistics, 34(3), 320. https://doi.org/10.2307/2347485
Henneman, E., Somjen, G., & Carpenter, D. O. (1965). FUNCTIONAL SIGNIFICANCE OF CELL SIZE IN SPINAL MOTONEURONS. Journal of Neurophysiology, 28(3), 560–580. https://doi.org/10.1152/jn.1965.28.3.560
Karabulut, D., Dogru, S. C., Lin, Y.-C., Pandy, M. G., Herzog, W., & Arslan, Y. Z. (2020). Direct Validation of Model-Predicted Muscle Forces in the Cat Hindlimb During Locomotion. Journal of Biomechanical Engineering, 142(5), 051014. https://doi.org/10.1115/1.4045660
Kim, J. J., Wyche, I. S., Olson, W., Lu, J., Bakir, M. S., Sober, S. J., & O’Connor, D. H. (2024). Myo-optogenetics: Optogenetic stimulation and electrical recording in skeletal muscles. https://doi.org/10.1101/2024.06.21.600113
Lu, J., Zia, M., Baig, D. A., Yan, G., Kim, J. J., Nagapudi, K., Anschutz, P., Oh, S., O’Connor, D., Sober, S. J., & Bakir, M. S. (2024). Opto-Myomatrix: μLED integrated microelectrode arrays for optogenetic activation and electrical recording in muscle tissue. https://doi.org/10.1101/2024.07.01.601601
Manuel, M., & Heckman, C. J. (2011). Adult mouse motor units develop almost all of their force in the subprimary range: A new all-or-none strategy for force recruitment? Journal of Neuroscience, 31(42), 15188–15194. https://doi.org/10.1523/JNEUROSCI.2893-11.2011
Marshall, N. J., Glaser, J. I., Trautmann, E. M., Amematsro, E. A., Perkins, S. M., Shadlen, M. N., Abbott, L. F., Cunningham, J. P., & Churchland, M. M. (2022). Flexible neural control of motor units. Nature Neuroscience, 25(11), 1492–1504. https://doi.org/10.1038/s41593-022-01165-8
Martínez-Silva, M. de L., Imhoff-Manuel, R. D., Sharma, A., Heckman, C. J., Shneider, N. A., Roselli, F., Zytnicki, D., & Manuel, M. (2018). Hypoexcitability precedes denervation in the large fast-contracting motor units in two unrelated mouse models of ALS. eLife, 7(2007), 1–26. https://doi.org/10.7554/eLife.30955
Miles, G. B., & Sillar, K. T. (2011). Neuromodulation of Vertebrate Locomotor Control Networks. Physiology, 26(6), 393–411. https://doi.org/10.1152/physiol.00013.2011
Petersen, P. C., & Berg, R. W. (2016). Lognormal firing rate distribution reveals prominent fluctuation–driven regime in spinal motor networks. eLife, 5. https://doi.org/10.7554/elife.18805
Srivastava, K. H., Elemans, C. P. H., & Sober, S. J. (2015). Multifunctional and Context-Dependent Control of Vocal Acoustics by Individual Muscles. The Journal of Neuroscience, 35(42), 14183–14194. https://doi.org/10.1523/JNEUROSCI.3610-14.2015
Srivastava, K. H., Holmes, C. M., Vellema, M., Pack, A. R., Elemans, C. P. H., Nemenman, I., & Sober, S. J. (2017). Motor control by precisely timed spike patterns. Proceedings of the National Academy of Sciences of the United States of America, 114(5), 1171–1176. https://doi.org/10.1073/pnas.1611734114
-
-
www.medrxiv.org www.medrxiv.org
-
The authors refer to the device as a Raman-spectrophotometer but the technical details of the device provided in the methods section and in the discussion seem to suggest that the device rather uses some other type of optical measurement principle. Could the authors please cite the source of the information that this device is a Raman-spectrophotometer and that the following statements in the article accurately characterize this specific device:
- "to send out light using a tungsten diode and an ultraviolet (UV) source, which then detected the corresponding parameters."
- "This spectrometer measures 20 minerals and micronutrients as well as 14 toxic heavy metals."
- "Its working principle is based on each element reflecting or absorbing light at a certain wavelength. The higher the sample concentration, the more the light is absorbed. The device uses emissions of characteristic frequencies of the specific elements tested [13,14]."
-
I would like to thank the authors for the thorough evaluation of the Cell-/SO-Check device. I believe that this work is very important as it will help other researchers assess the suitability of the device for their own work. However, I believe that not all of the conclusions drawn by the authors are supported by the data shown.
The authors state that no linear relationship between spectrophotometer zinc and serum zinc was found (r = 0.03, p-value = 0.800) and that the spectrophotometer method failed to perform better than chance at identifying individuals with zinc deficiency (ROC-AUC = 0.547). Nevertheless, the authors come to the conclusion that "The Cell-/SO-Check device may be used to rank children in population-based studies in SSA according to their zinc status, [...].". This conclusion seems to be based on two arguments: The first argument is that, according to the authors, the difference between spectrophotometer zinc and serum zinc appears to be consistent, so that it may be possible to correct for the bias. The second argument is a high specificity of 90.91% of the spectrophotometer method when distinguishing between individuals with and without zinc deficiency.
With regard to the first argument, the authors explain:
"Nevertheless, the P-value for the paired samples t-test of both zinc and ferritin was significant (>0.05), suggesting that the bias albeit present, was consistent. This does not necessarily stipulate that the spectrometer and laboratory methods are incomparable. It could be a matter of calibration discrepancies. In fact, according to Bland & Altman, consistent bias can be adjusted for by subtracting the mean difference of the ferritin or zinc measurements by the spectrometer and the laboratory method from the measurement by the spectrometer method [23]."
It is not clear to me what is meant by "paired samples t-test" as I did not find such a test described in the methods section. I'm assuming that this paragraph refers to the simple linear regression of the paired differences on the mean of the paired measurements, so that a significant p-value (< 0.05) in this context likely indicates that a trend is present in the data shown in Fig. 3a. However, to my understanding, the trend seen in Fig. 3a is not at all an indication of consistency of the bias, but merely a result of the fact that the variance of the serum zinc data is much higher than the variance of the data measured using spectrophotometry. The higher variance of the serum zinc data causes the mean of the paired measurements to be mostly controlled by serum zinc, meaning that a low mean of the paired measurements is likely associated with low serum zinc. If serum zinc is low, there is a larger chance that the corresponding spectrophotometer zinc concentration will exceed this value, even if the spectrophotometer data was simply random numbers drawn from a normal distribution with constant mean and standard deviation. The pattern observed would therefore be expected even for random data.
In order for the discrepancy between spectrophotometer zinc and serum zinc to be correctable, there would still need to be a correlation between spectrophotometer zinc and serum zinc. A significant linear correlation was not found as shown by the Pearson correlation coefficient of 0.03 and the respective p-value of 0.8. Visual inspection of the data shown in the scatter plot in Fig. 2a also does not indicate that any other type of relationship between serum zinc and spectrophotometer zinc is present. The data therefore does not seem to support the authors' argument that correction of a presumed consistent bias could make this method suitable for determining zinc status of children in a population-based study.
The second argument presented by the authors in support of the conclusion is that a high specificity of 90.91% with a corresponding sensitivity of 33.3% was found when distinguishing between individuals with and without zinc deficiency. I might be missing something but to me it seems that the given specificity and sensitivity are in contradiction to the numbers shown in Tab. 2. According to Tab. 2, of the 72 study participants, 6 individuals were identified as zinc-deficient by a serum zinc concentration < 7.7 micromol/L (the gold standard the spectrophotometer method is tested against) whereas 17 individuals were identified as zinc-deficient by spectrophotometry. If the sensitivity was 33.3%, that means that 2 of the 17 individuals flagged as zinc-deficient by spectrophotometry were "correctly" classified as zinc-deficient. This means that 15 individuals were "incorrectly" classified as zinc deficient and only 51 participants of the 66 individuals without zinc deficiency were "correctly" classified as not zinc deficient. This would result in a specificity of 77% which is very close to what would be expected by chance and consistent with the ROC-AUC very close to 0.5.
Did the authors use a different cutoff value to calculate sensitivity and specificity than the one used in Tab. 2, possibly the "optimal" cutoff value determined from the ROC-plot? Even if a specific cutoff value can be found that would yield these results, it seems that this is very likely due to chance considering the ROC-AUC close to 0.5 and the same cutoff value is therefore unlikely to perform as well in future studies. Could the authors please clarify what cutoff values were used for detecting zinc deficiency using spectrophotometry for the data in Tab. 2 and for the stated specificity of 90.91% and sensitivity of 33.3%?
In summary, even though I understand the author's point that a measuring device used in a population-based study does not have to fulfill the same requirements as a device intended for clinical use, the data shown in this article seems to be consistent with the interpretation that the spectrophotometer data does not contain any information about the zinc status of the study participants and is therefore not suitable for measuring zinc status in the population investigated, not even for the purpose of a population-based study.
-
-
www.biorxiv.org www.biorxiv.org
-
eLife Assessment
The authors use single molecule imaging and in vivo loop-capture genomic approaches to investigate estrogen mediated enhancer-target gene activation in human cancer cells. These potentially important results suggest that ER-alpha can, in a temporal delay, activate a non-target gene TFF3, which is in proximity to the main target gene TFF1, even though the estrogen responsive enhancer does not loop with the TFF3 promoter. To explain these results, the authors invoke a transcriptional condensate model. The claim of a temporal delay and effects of the target gene transcription on the non-target gene expression are supported by solid evidence but there is no direct evidence of the role of a condensate in mediating this effect. The reviewers appreciate that the authors have done a lot of work to strengthen the study. This work will be of interest to those studying transcriptional gene regulation and hormone-aggravated cancers.
-
Reviewer #1 (Public review):
Summary:
The manuscript by Bohra et al. describes the indirect effects of ligand-dependent gene activation on neighboring non-target genes. The authors utilized single-molecule RNA-FISH (targeting both mature and intronic regions), 4C-seq, and enhancer deletions to demonstrate that the non-enhancer-targeted gene TFF3, located in the same TAD as the target gene TFF1, alters its expression when TFF1 expression declines at the end of the estrogen signaling peak. Since the enhancer does not loop with TFF3, the authors conclude that mechanisms other than estrogen receptor or enhancer-driven induction are responsible for TFF3 expression. Moreover, ERα intensity correlations show that both high and low levels of ERα are unfavorable for TFF1 expression. The ERa level correlations are further supported by overexpression of GFP-ERa. The authors conclude that transcriptional machinery used by TFF1 for its acute activation can negatively impact the TFF3 at peak of signaling but once, the condensate dissolves, TFF3 benefits from it for its low expression.
Strengths:
The findings are indeed intriguing. The authors have maintained appropriate experimental controls, and their conclusions are well-supported by the data.
Weaknesses:
There are some major and minor concerns that related to approach, data presentation and discussion. But the authors have greatly improved the manuscript during the revision work.
Comments on latest version:
The authors have done a lot of work for the revision. The manuscript has been greatly improved.
-
Reviewer #3 (Public review):
Summary:
In this manuscript Bohra et al. measure the effects of estrogen responsive gene expression upon induction on nearby target genes using a TAD containing the genes TFF1 and TFF3 as a model. The authors propose that there is a sort competition for transcriptional machinery between TFF1 (estrogen responsive) and TFF3 (not responsive) such that when TFF1 is activated and machinery is recruited, TFF3 is activated after a time delay. The authors attribute this time delay to transcriptional machinery that was being sequestered at TFF1 becomes available to the proximal TFF3 locus. The authors demonstrate that this activation is not dependent on contact with the TFF1 enhancer through deletion, instead they conclude that it is dependent on a phase-separated condensate which can sequester transcriptional machinery. Although the manuscript reports an interesting observation that there is a dose dependence and time delay on the expression of TFF1 relative to TFF3, there is much room for improvement in the analysis and reporting of the data. Most importantly there is no direct test of condensate formation at the locus in the context of this study: i.e. dissolution upon the enhancer deletion, decay in a temporal manner, and dependence of TFF1 expression on condensate formation. Using 1,6' hexanediol to draw conclusion on this matter is not adequate to draw conclusions on the effect of condensates on a specific genes activity given current knowledge on its non-specificity and multitude of indirect effects. Thus, in my opinion the major claim that this effect of a time delayed expression of TFF3 being dependent on condensates in not supported by the current data.
Strengths:
The depends of TFF1 expression on a single enhancer and the temporal delay in TFF3 is a very interesting finding.
The non-linear dependence of TFF1 and TTF3 expression on ER concentration is very interesting with potentially broader implications.
The combined use of smFISH, enhancer deletion, and 4C to build a coherent model is a good approach.
Weaknesses:
There is no direct observation of a condensate at the TFF1 and TFF3 locus and how this condensate changes over time after E2 treatment, upon enhancer deletion, whether transcriptional machinery is indeed concentrated within it, and other claims on condensate function and formation made in the manuscript. The use of 1,6' HD is not appropriate to test this idea given how broadly it acts.
Comments on latest version:
I don't think the response to Reviewer 2's comment on LLPS condensates on TFF1 are adequate and given this point is essential to the claims of the manuscript they must be addressed. Namely, the data from Saravavanan, 2020 actually suggest that condensate formation at the locus is not very predictive and barely enriched over random spots. The claims in the manuscript on the dependence of the condensate being responsible for sequestering transcriptional machinery are quite strong and the crux of the current model. To continue to make this claim (which I don't think is necessary since there are other possible models) the authors must test if the condensate at his locus (1) shows time dependent behavior, (2) is not present or weakened at the locus in cells that show high TFF3 expression, (3) is indeed enriched for transcriptional machinery when TFF1 peaks. The use of 1,6 hexanediol is not appropriate as pointed out by reviewer 2 and is no longer considered as an appropriate experiment by many as the whole notion of LLPS forming nuclear condensates is now under question. Such condensates can form through a variety of mechanisms as reviewed for example by Mittaj and Pappu (A conceptual framework for understanding phase separation and addressing open questions and challenges, Molecular Cell, 2022). Furthermore, given the distance between TFF1 and TFF3 it is hard to imagine that if a condensate that concentrates machinery in a non-stoichiometric manner was forming how it would not boost expression on both genes and be just specific to one. There must be another mechanism in my opinion.
I would recommend the authors remove this aspect of their manuscript/model and simply report their interesting findings that are actually supported by data: The temporal delay of TFF3 expression, the dependence on ER concentration, and the enhancer dependence.
-
Author response:
The following is the authors’ response to the current reviews.
We are pleased that Reviewer 3 appreciated our findings and found the temporal lag between the expression of TFF1 and TFF3 during signaling particularly interesting. The reviewer also advised us not to overemphasize that this lag arises from phase separation of ERα at the TFF1 locus, as the use of 1,6-hexanediol alone is not sufficient to conclusively establish whether ERα condensates undergo liquid–liquid phase separation. We agree with this assessment and have revised the manuscript accordingly. Specifically, we have modified the title to remove reference to phase separation and have updated the text throughout the manuscript to avoid claiming that the observed condensates are a result of phase separation. The revised title is: “Ligand-dependent Enhancer Activation Indirectly Modulates Non-target Promoters in a Chromatin Domain.”
With these changes, we are proceeding with the Version of Record using revised version of the manuscript.
———
The following is the authors’ response to the original reviews.
Reviewer #1:
Summary:
The manuscript by Bohra et al. describes the indirect effects of ligand-dependent gene activation on neighboring non-target genes. The authors utilized single-molecule RNA-FISH (targeting both mature and intronic regions), 4C-seq, and enhancer deletions to demonstrate that the non-enhancer-targeted gene TFF3, located in the same TAD as the target gene TFF1, alters its expression when TFF1 expression declines at the end of the estrogen signaling peak. Since the enhancer does not loop with TFF3, the authors conclude that mechanisms other than estrogen receptor or enhancer-driven induction are responsible for TFF3 expression. Moreover, ERα intensity correlations show that both high and low levels of ERα are unfavorable for TFF1 expression. The ERa level correlations are further supported by overexpression of GFP-ERa. The authors conclude that transcriptional machinery used by TFF1 for its acute activation can negatively impact the TFF3 at peak of signaling but once, the condensate dissolves, TFF3 benefits from it for its low expression.
Strengths:
The findings are indeed intriguing. The authors have maintained appropriate experimental controls, and their conclusions are well-supported by the data.
Weaknesses:
There are some major and minor concerns that related to approach, data presentation and discussion. But I think they can be fixed with more efforts.
We thank the reviewer for their positive comments on the paper. We have addressed all their specific recommendations below.
The deletion of enhancer reveals the absolute reliance of TFF1 on its enhancers for its expression. Authors should elaborate more on this as this is an important finding.
We thank the reviewer for the comment. We have now added a more detailed discussion on the requirement of enhancer for TFF1 expression in the revised manuscript (line 368-385).
In Fig. 1, TFF3 expression is shown to be induced upon E2 signaling through qRT-PCR, while smFISH does not display a similar pattern. The authors attribute this discrepancy to the overall low expression of TFF3. In my opinion, this argument could be further supported by relevant literature, if available. Additionally, does GRO-seq data reveal any changes in TFF3 expression following estrogen stimulation? The GRO-seq track shown in Fig.1 should be adjusted to TFF3 expression to appreciate its expression changes.
We have now included a browser shot image of TFF3 region showing GRO-Seq signal at E2 time course (Fig. S1C). We observed an increased transcription towards the 3’ end of TFF3 gene body at 3h. The increased transcription at 3h, corroborates with smFISH data. The relative changes of TFF3 expression measured by qRT-PCR and smFISH for intronic transcripts are somewhat different, we speculate that such biased measurements that are dependent on PCR amplifications could be more for genes that express at low levels and smFISH using intronic probes may be a more sensitive assay to detect such changes.
Since the mutually exclusive relationship between TFF1 and TFF3 is based on snap shots in fixed cells, can authors comment on whether the same cell that expresses TFF1 at 1h, expresses TFF3 at 3h? Perhaps, the calculations taking total number of cells that express these genes at 1 and 3h would be useful.
Like pointed out by the reviewer, since these are fixed cells, we cannot comment on the fate of the same cell at two time points. To further address this limitation, future work could employ cells with endogenous tags for TFF1 and TFF3 and utilize live cell imaging techniques. In a fixed cell assay, as the reviewer suggests, it can be investigated whether a similar fraction shows high TFF3 expression at 3h, as the fraction that shows high TFF1 expression at 1 h. To quantify the fractions as suggested by the reviewer, we plotted the fraction of cells showing high TFF1 and TFF3 expression at 1h and 3h. We identify truly high expressing cells by taking mean and one standard deviation (for single cell level data) at E2-1hr as the threshold for TFF1 (80 and above transcript counts) and mean and one standard deviation (for single cell level data) at E2-3hr as the threshold for TFF3 (36 and above transcript counts). The fraction with high TFF1 expression at 1h (12.06 ± 2.1) is indeed comparable to that with high TFF3 expression at 3h (12.50 ± 2.0) (Fig. 2C and Author response image 1). We should note that if the transcript counts were normally distributed, a predetermined fraction would be expected to be above these thresholds and comparable fractions can arise just from underlying statistics. But in our experiments, this is unlikely to be the case given the many outliers that affect both the mean and the standard deviation, and the lack of normality and high dispersion in single cell distributions. Of course, despite the fractions being comparable, we cannot be certain if it is the same set of cells that go from high expression of TFF1 to high expression of TFF3, but definitely that is a possibility. We thank the reviewer for pointing out this comparison.
Author response image 1.
The graph represents the percent of cells that show high expression for TFF1 and TFF3 at 1h and 3h post E2 signaling. The threshold was collected by pooling in absolute RNA counts from 650 analyzed cells (as in Fig. 2C). The mean and standard deviation over single cell data were calculated. Mean plus one standard deviation was used to set the threshold for identifying high expressing cells. For TFF1, as it maximally expresses at 1h the threshold used was 80. For TFF3, as it maximally expresses at 3h the threshold used was 36. Fraction of cells expressing above 80 and 36 for TFF1 and TFF3 respectively were calculated from three different repeats. Mean of means and standard deviations from the three experiments are plotted here.

Authors conclude that TFF3 is not directly regulated by enhancer or estrogen receptor. Does ERa bind on TFF3 promoter?
The ERa ChIP-seq performed at 1h and 3h of signaling suggests that TFF3 promoter is not bound by ERa as shown in supplementary Fig. 1B and S1B. However, one peak upstream to TFF1 promoter is visible and that is lost at 3h.
Minor comments:
Reviewer’s comment -The figures would benefit from resizing of panels. There is very little space between the panels.
We have now resized the figures in the revised manuscript.
The discussion section could include an extrapolation on the relationship between ERα concentration and transcriptional regulation. Given that ERα levels have been shown to play a critical role in breast cancer, exploring how varying concentrations of ERα affect gene expression, including the differential regulation of target and non-target genes, would provide valuable insights into the broader implications of this study.
This is a very important point that was missing from the manuscript. We have included this in the discussion in the revised manuscript (line 426-430).
Reviewer #2:
Summary:
In this manuscript by Bohra et al., the authors use the well-established estrogen response in MCF7 cells to interrogate the role of genome architecture, enhancers, and estrogen receptor concentration in transcriptional regulation. They propose there is competition between the genes TFF1 and TFF3 which is mediated by transcriptional condensates. This reviewer does not find these claims persuasive as presented. Moreover, the results are not placed in the context of current knowledge.
Strengths:
High level of ERalpha expression seems to diminish the transcriptional response. Thus, the results in Fig. 4 have potential insight into ER-mediated transcription. Yet, this observation is not pursued in great depth however, for example with mutagenesis of ERalpha. However, this phenomenon - which falls under the general description of non monotonic dose response - is treated at great depth in the literature (i.e. PMID: 22419778). For example, the result the authors describe in Fig. 4 has been reported and in fact mathematically modeled in PMID 23134774. One possible avenue for improving this paper would be to dig into this result at the single-cell level using deletion mutants of ERalpha or by perturbing co-activators.
We thank the reviewer for pointing us to the relevant literature on our observation which will enhance the manuscript. We have discussed these findings in relations to ours in the discussion section (Line 400-413). We thank the reviewer for insight on non-monotonic behavior.
Weaknesses:
There are concerns with the sm-RNA FISH experiments. It is highly unusual to see so much intronic signal away from the site of transcription (Fig. 2) (PMID: 27932455, 30554876), which suggests to me the authors are carrying out incorrect thresholding or have a substantial amount of labelling background. The Cote paper cited in the manuscript is likewise inconsistent with their findings and is cited in a misleading manner: they see splicing within a very small region away from the site of transcription.
We thank the reviewer for this comment, and apologize if they feel we misrepresented the argument from Cote et al. This has now been rectified in the manuscript. However, we do not agree that the intronic signals away from the site of transcription are an artefact. First, the images presented here are just representative 2D projections of 3D Z-stacks; whereas the full 3D stack is used for spot counting using a widely-used algorithm that reports spot counts that are constant over wide range of thresholds (Raj et al., 2008). The veracity of automated counts was first verified initially by comparison to manual counts. Even for the 2D representations the extragenic intronic signals show up at similar thresholds to the transcription sites.
The signal is not non-specific arising from background labeling, explained by following reasons:
• To further support the time-course smFISH data and its interpretation without depending on the dispersed intronic signal, we have analyzed the number of alleles firing/site of transcription at a given time in a cell under the three conditions. We counted the sites of transcription in a given cell and calculated the percentage of cells showing 1,2,3,4 or >4 sites. We see that the percent of cells showing a single site of transcription for TFF1 is very high in uninduced cells and this decreases at 1h. At 1h, the cells showing 2, 3 and 4 sites of transcription increase which again goes down at 3h (Author response image 2A). This agrees with the interpretation made from mean intronic counts away from the site of transcription. Similarly, for TFF3, the number of cells showing 2,3 and 4 sites of transcription increase slightly at 3hr compared to uninduced and 1hr (Author response image 2B). We can also see that several cells have no alleles firing at a given time as has been quantified in the graphs on right showing total fraction of cells with zero versus non-zero alleles firing (Author response image 2A-B). A non-specific signal would be present in all cells.
• There is literature on post-transcriptional splicing of RNA beyond our work, which suggests that intronic signal can be found at relatively large distances away from the site of transcription. Waks et al. showed that some fraction of unspliced RNA could be observed up to 6-10 microns away from the site of transcription suggesting that there can be a delay between transcription and (alternative) splicing (Waks et al., 2011). Pannuclear disperse intronic signals can arise as there can be more than one allele firing at a time in different nuclear locations. The spread of intronic transcripts in our images is also limited in cells in which only 1 allele is firing at E2-1 hour (Author response image 2C) or uninduced cells (Author response image 2D). Furthermore, Cote et al. discuss that “Of note, we see that increased transcription level correlates with intron dispersal, suggesting that the percentage of splicing occurring away from the transcription site is regulated by transcription level for at least some introns. This may explain why we observe posttranscriptional splicing of all genes we measured, as all were highly expressed.” This is in line with our interpretation that intron signal dispersal can occur in case of posttranscriptional splicing (Coté et al., 2023). Additionally, other studies have suggested that transcripts in cells do not necessarily undergo co-transcriptional splicing which leads us to conclude that intronic signal can be found farther away from the site of transcription. Coulon et al. showed that splicing can occur after transcript release from the site and suggested that no strict checkpoint exists to ensure intron removal before release which results in splicing and release being kinetically uncoupled from each other (Coulon et al., 2014). Similarly, using live-cell imaging, it was shown that splicing is not always coupled with transcription, and this could depend on the nature and structural features of transcript (such as blockage of polypyrimidine tract which results in delayed recognition) (Vargas et al., 2011). Drexler et al. showed that as opposed to drosophila transcripts that are shorter, in mammalian cells, splicing of the terminal intron can occur post-transcriptionally (Drexler et al., 2020). Using RNA polymerase II ChIP-Seq time course data from ERα activation in the MCF-7 cells, Honkela et al. showed that large number of genes can show significant delays between the completion of transcription and mRNA production (Honkela et al., 2015). This was attributed to faster transcription of shorter genes which results in splicing delays suggesting rapid completion of transcription on shorter genes can lead to splicing-associated delays (Honkela et al., 2015). More recently, comparisons of nascent and mature RNA levels suggested a time lapse between transcription and splicing for the genes that are early responders during signaling (Zambrano et al., 2020). The presence of significant numbers of TFF1 nascent RNA in the nucleus in our data corroborates with above observations.
• Uniform intensities across many transcripts suggests these are true signal arising from RNA molecules which would not be the case for non-specific, background signal (Author response image 2E).
• Splicing occurs in the nucleus and intron containing pre-transcripts should be nuclear localized. Thus, intronic signals should remain localized to the nucleus unlike the mature mRNA which translocate to the cytoplasm after processing and thus exonic signals can be found both in the nucleus and the cytoplasm. In keeping with this, we observe no signal in the cytoplasm for the intronic probes and it remains localized within the nucleus as expected and can be seen in Author response image 2F, while exonic signals are observed in both compartments. This suggests to us that the signal is coming from true pre-transcripts. There is no reason for non-specific background labelling to remain restricted to the nucleus.
• We observe that the mean intronic label counts for both the genes TFF1 and TFF3 increases upon E2-induction compared to uninduced condition (Fig. 2B). Similarly, the mean intronic count for both genes reduce drastically in the TFF1-enhancer deleted cells (Fig. 3C, D). This change in the number of intronic signal specifically on induction and enhancer deletion suggests that the signal is not an artefact and arises from true nascent transcripts that are sensitive to stimulus or enhancer deletion.
• We expect colocalization of intronic signal with exonic signals in the nucleus, while there can be exonic signals that do not colocalize with intronic, representing more mature mRNA. Indeed, we observe a clear colocalization between the intronic and exonic signals in the nucleus, while exonic signals can occur independent of intronic both in the nucleus and the cytoplasm. This clearly demonstrates that the intronic signals in our experiments are specific and not simply background labelling (Author response image 2G).
These studies and the arguments above lead us to conclude that the presence of intronic transcripts in the nucleus, away from the site of transcription is not an artefact. We hope the reviewer will agree with us. These analyses have now been included in the manuscript as Supplementary Figure 6 and have been added in the manuscript at line numbers 106-111, 201204, 215-217 and line 231-235. We thank the reviewer for raising this important point.
Author response image 2.
Dynamic induction and RNA localization of TFF1 and TFF3 transcription across cell populations using smRNA FISH A. Bar graph depicting the percentage of cells with 1,2,3,4, or greater than 4 sites of transcription for TFF1 (left) is shown. The graph shows the mean of means from different repeats of the experiment, and error bars denote SEM (n>200, N=3). Only the cells with at least one allele firing were counted and cells with no alleles were not included in this. The graph on right shows the number of cells with zero or non-zero number of alleles firing. B. Bar graph depicting the percentage of cells with 1,2,3,4 or greater than 4 sites of transcription for TFF3 (left) is shown. The graph shows the mean of means from different repeats of the experiment, and error bars denote SEM (n>200, N=3). Only the cells with at least one allele firing were counted and cells with no alleles were not included in this. The graph in the middle shows the number of cells with 2,3,4 or greater than 4 sites of transcription for TFF3.The graph on the right shows the number of cells with zero or non-zero number of alleles firing. C. Images from single molecule RNA FISH experiment showing transcripts for InTFF1 in cells induced for 1 hour with E2. The image shows that when a single allele of TFF1 is firing, the transcripts show a more spatially restricted localisation. The scale bar is 5 microns. D. Images from single molecule RNA FISH experiment showing transcripts for InTFF1 in uninduced cells. The image shows that when a single allele of TFF1 is firing and transcription is low, the transcripts show a more spatially restricted localisation. The scale bar is 5 microns. E. Line profile through several transcripts in the nucleus show uniform and similar intensities indicating that these are true signals. F. 60X Representative images from a single molecule RNA FISH experiment showing transcripts for InTFF1 and ExTFF1 (top) and InTFF3 and ExTFF3 (bottom). The image shows that there is no intronic signal in the cytoplasm, while exonic signals can be found both in the nucleus and the cytoplasm. The scale bar is 5 microns. G. 60X Representative images from single molecule RNA FISH experiment showing transcripts for InTFF1 and ExTFF1. The image shows that all intronic signals are colocalized with exonic signals, but all exonic signals are expectedly not colocalized with intronic signals, representing more mature mRNA. The scale bar is 5 microns.

One substantial way to improve the manuscript is to take a careful look at previous single cell analysis of the estrogen response, which in some cases has been done on the exact same genes (PMID: 29476006, 35081348, 30554876, 31930333). In some of these cases, the authors reach different conclusions than those presented in the present manuscript. Likewise, there have been more than a few studies that have characterized these enhancers (the first one I know of is: PMID 18728018). Also, Oh et al. 2021 (cited in the manuscript) did show an interaction between TFF1e and TFF3, which seems to contradict the conclusion from Fig. 3. In summary, the results of this paper are not in dialogue with the field, which is a major shortcoming.
We thank the reviewer for pointing out these important studies. The studies from Prof. Larson group are particularly very insightful (Rodriguez et al., 2019). We have now included this in the discussion (line 106-111 and line 420-424) where we suggest the differences and similarities between our, Larson’s group and also Mancini’s group (Patange et al., 2022; Stossi et al., 2020).
The 4C-Seq data from the manuscript Oh et al. 2021 is exactly consistent with our observation from Fig 3 as they also observed little to no interaction between TFF1e and TFF3p in WT cells, only upon TFF1p deletion, did the TFF1e become engaged with the TFF3p. In agreement with this, we also observe little to no interaction between TFF1e and TFF3p in WT cells (Fig.3A). This is also consistent with our competition model for resources between these two genes. Oh et al. shows interaction between TFF1e and TFF3 when the TFF1 promoter is deleted showing that when the primary promoter is not available the enhancer is retargeted to the next available gene (Oh et al., 2021). It does not show that in WT or at any time point of E2 signalling does TFF1e and TFF3 interact.
In the opinion of this reviewer, there are few - if any - experiments to interrogate the existence of LLPS for diffraction-limited spots such as those associated with transcription. This difficulty is a general problem with the field and not specific to the present manuscript. For example, transient binding will also appear as a dynamic 'spot' in the nucleus, independently of any higher-order interactions. As for Fig. 5, I don't think treating cells with 1,6 hexanediol is any longer considered a credible experiment. For example, there are profound effects on chromatin independent of changes in LLPS (PMID: 33536240).
We are cognizant of and appreciate the limitations pointed out by the reviewer. We and others have previously shown that ERa forms condensates on TFF1 chromatin region using ImmunoFISH assay (Saravanan et al., 2020). The data below shows the relative mean ERα intensity on TFF1 FISH spots and random regions clearly showing an appearance of the condensate at the TFF1 site. Further, the deletion of TFF1e causes the reduction in size of this condensate. Thus, we expect that these ERα condensates are characterized by higher-order interactions and become disrupted on treatment with 1,6-hexanediol. These condensates are the size of below micron as mentioned by the reviewer, but most TF condensates are of the similar sizes. We agree with the reviewer that 1,6- hexanediol treatment is a brute-force experiment with several irreversible changes to the chromatin. Although we have tried to use it at a low concentration for a short period of time and it has been used in several papers (Chen et al., 2023; Gamliel et al., 2022). The opposite pattern of TFF1 vs. TFF3 expression upon 1,6- hexanediol treatment suggests that there is specificity. Further, to perturb condensates, mutants of ERa can be used (N-terminus IDR truncations) however, the transcriptional response of these mutants is also altered due to perturbed recruitment of coactivators that recognize Nterminus of ER, restricting the distinction between ERa functions and condensate formation.
References:
Chen, L., Zhang, Z., Han, Q., Maity, B. K., Rodrigues, L., Zboril, E., Adhikari, R., Ko, S.-H., Li, X., Yoshida, S. R., Xue, P., Smith, E., Xu, K., Wang, Q., Huang, T. H.-M., Chong, S., & Liu, Z. (2023). Hormone-induced enhancer assembly requires an optimal level of hormone receptor multivalent interactions. Molecular Cell, 83(19), 3438-3456.e12. https://doi.org/10.1016/j.molcel.2023.08.027
Coté, A., O’Farrell, A., Dardani, I., Dunagin, M., Coté, C., Wan, Y., Bayatpour, S., Drexler, H. L., Alexander, K. A., Chen, F., Wassie, A. T., Patel, R., Pham, K., Boyden, E. S., Berger, S., Phillips-Cremins, J., Churchman, L. S., & Raj, A. (2023). Post-transcriptional splicing can occur in a slow-moving zone around the gene. eLife, 12. https://doi.org/10.7554/eLife.91357.2
Coulon, A., Ferguson, M. L., de Turris, V., Palangat, M., Chow, C. C., & Larson, D. R. (2014). Kinetic competition during the transcription cycle results in stochastic RNA processing. eLife, 3, e03939. https://doi.org/10.7554/eLife.03939
Drexler, H. L., Choquet, K., & Churchman, L. S. (2020). Splicing Kinetics and Coordination Revealed by Direct Nascent RNA Sequencing through Nanopores. Molecular Cell, 77(5), 985-998.e8. https://doi.org/10.1016/j.molcel.2019.11.017
Gamliel, A., Meluzzi, D., Oh, S., Jiang, N., Destici, E., Rosenfeld, M. G., & Nair, S. J. (2022). Long-distance association of topological boundaries through nuclear condensates. Proceedings of the National Academy of Sciences of the United States of America, 119(32), e2206216119. https://doi.org/10.1073/pnas.2206216119
Honkela, A., Peltonen, J., Topa, H., Charapitsa, I., Matarese, F., Grote, K., Stunnenberg, H. G., Reid, G., Lawrence, N. D., & Rattray, M. (2015). Genome-wide modeling of transcription kinetics reveals patterns of RNA production delays. Proceedings of the National Academy of Sciences of the United States of America, 112(42), 13115. https://doi.org/10.1073/pnas.1420404112
Oh, S., Shao, J., Mitra, J., Xiong, F., D’Antonio, M., Wang, R., Garcia-Bassets, I., Ma, Q., Zhu, X., Lee, J.-H., Nair, S. J., Yang, F., Ohgi, K., Frazer, K. A., Zhang, Z. D., Li, W., & Rosenfeld, M. G. (2021). Enhancer release and retargeting activates disease-susceptibility genes. Nature, 595(7869), Article 7869. https://doi.org/10.1038/s41586-021-03577-1
Patange, S., Ball, D. A., Wan, Y., Karpova, T. S., Girvan, M., Levens, D., & Larson, D. R. (2022). MYC amplifies gene expression through global changes in transcription factor dynamics. Cell Reports, 38(4). https://doi.org/10.1016/j.celrep.2021.110292
Raj, A., van den Bogaard, P., Rifkin, S. A., van Oudenaarden, A., & Tyagi, S. (2008). Imaging individual mRNA molecules using multiple singly labeled probes. Nature Methods, 5(10), Article 10. https://doi.org/10.1038/nmeth.1253
Rodriguez, J., Ren, G., Day, C. R., Zhao, K., Chow, C. C., & Larson, D. R. (2019). Intrinsic Dynamics of a Human Gene Reveal the Basis of Expression Heterogeneity. Cell, 176(1–2), 213-226.e18. https://doi.org/10.1016/j.cell.2018.11.026
Saravanan, B., Soota, D., Islam, Z., Majumdar, S., Mann, R., Meel, S., Farooq, U., Walavalkar, K., Gayen, S., Singh, A. K., Hannenhalli, S., & Notani, D. (2020). Ligand dependent gene regulation by transient ERα clustered enhancers. PLOS Genetics, 16(1), e1008516. https://doi.org/10.1371/journal.pgen.1008516
Stossi, F., Dandekar, R. D., Mancini, M. G., Gu, G., Fuqua, S. A. W., Nardone, A., De Angelis, C., Fu, X., Schiff, R., Bedford, M. T., Xu, W., Johansson, H. E., Stephan, C. C., & Mancini, M. A. (2020). Estrogeninduced transcription at individual alleles is independent of receptor level and active conformation but can be modulated by coactivators activity. Nucleic Acids Research, 48(4), 1800. https://doi.org/10.1093/nar/gkz1172
Vargas, D. Y., Shah, K., Batish, M., Levandoski, M., Sinha, S., Marras, S. A. E., Schedl, P., & Tyagi, S. (2011). Single-Molecule Imaging of Transcriptionally Coupled and Uncoupled Splicing. Cell, 147(5), 1054–1065. https://doi.org/10.1016/j.cell.2011.10.024
Waks, Z., Klein, A. M., & Silver, P. A. (2011). Cell-to-cell variability of alternative RNA splicing. Molecular Systems Biology, 7(1), 506. https://doi.org/10.1038/msb.2011.32
Zambrano, S., Loffreda, A., Carelli, E., Stefanelli, G., Colombo, F., Bertrand, E., Tacchetti, C., Agresti, A., Bianchi, M. E., Molina, N., & Mazza, D. (2020). First Responders Shape a Prompt and Sharp NF-κB-Mediated Transcriptional Response to TNF-α. iScience, 23(9), 101529. https://doi.org/10.1016/j.isci.2020.101529
-
-
-
The path to betterment is now severed from state insti-tutions and depends on making oneself increasinglyproductive in a competitive market.
This passage suggests that betterment is imagined through self-productivity in the market rather than through state institutions. However, it does not automatically follow from this that the US dollar becomes the solution. I wonder what additional symbolic or moral work is needed for dollarization to appear as the natural answer.
-
Thus, youth’s criticism of the economy is based onthe idea of the Argentine peso as a failed currency: withspiraling inflation, it became impossible to save in thenational currency (
The phrase “failed currency” seems important here. I wonder whether the authors are using it to describe young people’s everyday experience of inflation, or whether it also carries a political implication: that the peso is beyond repair and that dollarization becomes thinkable as the only solution.
-
hree decades
I wonder how the authors maintain continuity in the category of “youth” across three decades of research. Since the youth studied thirty years ago are no longer young, is “youth” being treated here as a stable analytical category, or as historically changing cohorts?
-
We also aim to interrogate the process of individu-alization that these subjects go through
I find something strange in the quietness of this process: a radical political and economic shift appears almost ordinary in everyday life.
-
-
www.biorxiv.org www.biorxiv.org
-
eLife Assessment
This important study provides a detailed characterization of individual sarcomeres' contractility and of their synchrony in spontaneously beating cardiomyocytes derived from human induced pluripotent stem cells. The combination of high-resolution tracking, statistical analysis and mesoscopic modeling leads to compelling evidence that sarcomeres operate as dynamically unstable units, leading to stochastic heterogeneities in their contraction-elongation cycles depending on substrate stiffness. The work will be relevant to scientists interested in muscle biophysics, nonlinear dynamics and synchronization phenomena in biological systems.
-
Reviewer #1 (Public review):
Summary:
In this manuscript, the authors present comprehensive experimental observations and a theoretical framework to explain the heterogeneous behaviour of sarcomeres in cardiomyocytes. They show that a stochastic component exists in their contractile activity, which may act as a feedback mechanism regulating physiological function.
Strengths:
Experiments and data analysis are robust and valid. The rigorous statistical analysis and unbiased methods enable the authors to draw well-supported conclusions that go beyond the existing literature. Their outcomes inform about cellular activity at the individual level and the authors explain how the transient dynamics of single sarcomeres are governed by a force-velocity relationship and lead to the complex contractile patterns. The similarity of the results to the study cited in [24] demonstrates the validity of the in vitro setup for answering these questions and the feasibility of such in-vitro systems to extend our knowledge of out-of-equilibrium dynamics in cardiac cells.
Very interesting the suggestion that the interplay between intrinsic fluctuations and the dynamic instability are part of a feedback mechanism for maintaining structural and functional homeostasis.
The addition of the theoretical model and the new text of the manuscript improves the clarity of the study.
-
Reviewer #2 (Public review):
Summary:
Sarcomeres, the contractile units of skeletal and cardiac muscle, contract in a concerted fashion to power myofibril and thus muscle fiber contraction.
Muscle fiber contraction depends on the stiffness of the elastic substrate of the cell, yet it is not known how this dependence emerges from the collective dynamics of sarcomeres. Here, the authors analyze contraction time series of individual sarcomeres using live imaging of fluorescently labeled cardiomyocytes cultured on elastic substrates of different stiffness. They find that a reduced collective contractility of muscle fibers on unphysiologically stiff substrates is partially explained by a lack of synchronization in the contraction of individual sarcomeres.
This lack of synchronization is at least partially stochastic, consistent with the notion of a tug-of-war between sarcomeres on stiff sarcomeres. A particular irregularity of sarcomere contraction cycles is 'popping', the extension of sarcomers beyond their rest length. The statistics of 'popping' suggest that this is a purely random process.
Strengths:
This study thus marks an important shift of perspective from whole-cell analysis towards an understanding the collective dynamics of coupled, stochastic sarcomeres.
-
Reviewer #3 (Public review):
The manuscript of Haertter and coworkers studied the variation of the length of a single sarcomere and the response of microfibrils made by sarcomeres of cardiomyocytes on soft gel substrates of varying stiffness.
The measurements at the level of a single sarcomere are an important new result of this manuscript. They are done by combining the labeling of the sarcomeres z line using genetic manipulation and a sophisticated tracking program using machine learning. This single sarcomere analysis shows strong heterogeneities of the sarcomeres that can show fast oscillations not synchronized with the average behavior of the cell and what the authors call popping eveents which are large amplitude oscillations. Another important result is the fact that cardiomyocyte contractility decreases with the substrate stiffness, although the properties of single sarcomeres do not seem to depend on substrate stiffness.
The authors suggest that the cardiomyocyte cell behavior is dominated by sarcomere heterogeneity. They show that the heterogeneity between sarcomere is stochastic and that the contribution of static heterogeneity (such as composition differences between sarcomeres) is small.
Strengths:
All the results are, to my knowledge, new and original. The authors also made a theoretical model where each sarcomere is described by a Langevin equation based on a non-linear coupling between force and velocity of the sarcomeres. This model accounts well for the experimental results including the observation of what the authors call popping events.
-
Author response:
The following is the authors’ response to the original reviews.
eLife Assessment
This study provides a valuable characterization of individual sarcomere's contractility and synchrony in spontaneously beating cardiomyocytes as a function of substrate stiffness. The authors, however, provide an incomplete explanation for the observed heterogeneous and stochastic dynamics, so that the work remains mainly descriptive. The work will be of interest to scientists working on muscle biophysics, nonlinear dynamics, and synchronization phenomena in biological systems.
We appreciate the reviewer’s insightful comments. A detailed explanation of the described phenomena in the form of a theoretical model and simulations was not included in our manuscript, because we believed it would be most impactful to present a detailed quantitative statistical description of the experiments in one manuscript and then introduce the model, which we already had in preparation, in a separate manuscript to avoid diluting the overall message.
However, following the reviewers’ advice, we have now included a comprehensive model into the revised manuscript. This model qualitatively and quantitatively explains the experimentally observed phenomena and introduces a novel class of coupled relaxation oscillators based on a non-monotonic force-velocity relationship of individual sarcomeres. We believe that this addition significantly strengthens the manuscript.
Public Reviews:
Reviewer #1 (Public Review):
Summary:
In this manuscript, the authors experimentally demonstrated the heterogeneous behavior of sarcomeres in cardiomyocytes and that a stochastic component exists in their contractile activity, which cancels out at the level of myofibrils.
Strengths:
The experiments and data analysis are robust and valid. With very good statistics and unbiased methods, they show cellular activity at the individual level and highlight the heterogeneity between biological networks. The similarity of the results to the study cited in [24] demonstrates the validity of the in vitro setup for answering these questions and the feasibility of such in-vitro systems to extend our knowledge of physiology.
Weaknesses:
Compared to the current literature ([24]), the study does not show a high degree of innovation. It mainly confirms what has been established in the past. The authors complemented the published experiments by developing an in vitro setup with stem cells and by changing the stiffness of the substrate to simulate pathological conditions. However, the experiments they performed do not allow them to explain more than the study in [24], and the conclusions of their study are based on interpretation and speculation about the possible mechanism underlying the observations.
We thank the reviewer for contextualizing our work with the literature. We appreciate the comparison to the study by Kobirumaki-Shimozawa et al. which we cite prominently. They observed stochastically varying beating patterns of individual sarcomeres on a beat-to-beat basis. They propose that this arises from a "titin-based mechanism" operating stochastically, which they interpret as being fundamentally linked to sarcomere-length-dependent effects. This interpretation differs from our model. We feel that the inclusion of our comprehensive model in the revised manuscript will emphasize the significance and novelty of our findings. Our work proposes a distinct alternative mechanistic explanation for the observed stochasticity, grounded in the force-velocity relationship and intrinsic stochasticity, and presents additional novel dynamic phenomena (such as popping and high-frequency oscillations) not reported in the literature yet. We outline the key advancements of our study below:
(1) Physiologically Relevant Human Model System: Our study utilizes human induced pluripotent stem cell-derived cardiomyocytes (hiPSC-CMs). Using a human cell model provides direct relevance for understanding human cardiac physiology and pathophysiology, overcoming limitations inherent in translating findings from rodent models. The hiPSC-CMs exhibit key physiological differences from the mouse ventricular myocytes observed in [24], most notably beating at a significantly lower frequency (~1 Hz or 60 bpm) compared to mice (~5-8 Hz or 300-500 bpm). This difference in timescale is critical as it allowed us to resolve complex intra-beat dynamics that may be different and also harder to observe in mouse cardiomyocytes.
(2) Advanced Experimental Methodology and Resolution: We developed a novel assay incorporating our SarcAsM algorithm for high-throughput tracking and analysis of individual sarcomere dynamics. This approach gave us spatial resolution better than 20 nm at significantly higher sampling rates than previous studies, including Kobirumaki-Shimozawa et al. Furthermore, our high-throughput in vitro approach made it possible to analyze vastly larger datasets than, e.g., the study by Kobirumaki-Shimozawa et al. (which reports observations from fewer than 20 myofibrils, encompassing less than 200 sarcomeres in total). While we recognize that in-vivo tissue studies present unique experimental challenges, the substantially greater statistical power of our study is crucial for reliably characterizing the complex, stochastic dynamics we report. The enhanced resolution and statistical robustness are not merely incremental; they enable the detailed identification and analysis of heterogeneous behaviors that were previously inaccessible or could not be characterized with the same level of confidence.
(3) Novel Observed Phenomena: Our high-resolution data reveals specific dynamic behaviors, such as sarcomere "popping" and high-frequency oscillations during contraction, which, to our knowledge, have not been previously reported or characterized in cardiomyocytes. The resolution limitations and the high beating frequency in mouse models may not have permitted the observation of these subtle, but potentially important phenomena.
(4) Distinct Mechanistic Explanation and Model: Kobirumaki-Shimozawa et al. propose a qualitative model where sarcomere motion variability primarily arises from length-dependent activation. This view is essentially a static one, based on a long history of isometric skeletal muscle experiments, where time-dependent forces are not relevant. We argue that in highly dynamic cardiomyocytes this may not be the most useful approach. While we acknowledge length dependence can play a role, our integrated experimental-theoretical work proposes a different primary mechanism. Our model demonstrates that the observed stochastic heterogeneity and beat-to-beat variations, including the oscillatory motion and popping, can be quantitatively explained by dynamic instabilities arising from a non-monotonic force-velocity relationship of individual sarcomeres in conjunction with intrinsic sarcomere-level stochastic fluctuations. The model emphasizes the active, transient nature of force generation rather than solely assuming length dependence. Our model provides an alternative explanation for the observed dynamics, and a quantitative, mechanism-based understanding.
Reviewer #2 (Public Review):
Summary:
Sarcomeres, the contractile units of skeletal and cardiac muscle, contract in a concerted fashion to power myofibril and thus muscle fiber contraction.
Muscle fiber contraction depends on the stiffness of the elastic substrate of the cell, yet it is not known how this dependence emerges from the collective dynamics of sarcomeres. Here, the authors analyze the contraction time series of individual sarcomeres using live imaging of fluorescently labeled cardiomyocytes cultured on elastic substrates of different stiffness. They find that reduced collective contractility of muscle fibers on unphysiologically stiff substrates is partially explained by a lack of synchronization in the contraction of individual sarcomeres.
This lack of synchronization is at least partially stochastic, consistent with the notion of a tug-of-war between sarcomeres on stiff sarcomeres. A particular irregularity of sarcomere contraction cycles is 'popping', the extension of sarcomeres beyond their rest length. The statistics of 'popping' suggest that this is a purely random process.
Strengths:
This study thus marks an important shift of perspective from whole-cell analysis towards an understanding of the collective dynamics of coupled, stochastic sarcomeres.
Weaknesses:
Further insight into mechanisms could be provided by additional analyses and/or comparisons to mathematical models.
We thank the reviewer for the feedback. We have enhanced the manuscript by a comprehensive dynamic model, that we also contrast with previously proposed models.
Reviewer #3 (Public Review):
Summary:
The manuscript of Haertter and coworkers studied the variation of length of a single sarcomere and the response of microfibrils made by sarcomeres of cardiomyocytes on soft gel substrates of varying stiffnesses.
The measurements at the level of a single sarcomere are an important new result of this manuscript. They are done by combining the labeling of the sarcomeres z line using genetic manipulation and a sophisticated tracking program using machine learning. This single sarcomere analysis shows strong heterogeneities of the sarcomeres that can show fast oscillations not synchronized with the average behavior of the cell and what the authors call popping events which are large amplitude oscillations. Another important result is the fact that cardiomyocyte contractility decreases with the substrate stiffness although the properties of single sarcomeres do not seem to depend on substrate stiffness.
The authors suggest that the cardiomyocyte cell behavior is dominated by sarcomere heterogeneity. They show that the heterogeneity between sarcomeres is stochastic and that the contribution of static heterogeneity (such as composition differences between sarcomeres) is small.
Strengths:
All the results are to my knowledge new and original and deserve attention.
Weaknesses:
However, I find the manuscript a bit frustrating because the authors only give very qualitative explanations of the phenomena that they observe. They mention that popping could be explained by a nonlinear force-velocity relation of the sarcomere leading to a rapid detachment of all motors. However, they do not explicitly provide a theoretical description. How would the popping depend on the parameters and in particular on the substrate stiffness? Would the popping statistics be affected by the stiffness? It is also not clear to me how the dependence on the soft gel stiffness of the cardiomyocyte cell can be explained by the stochasticity of the sarcomere properties. Can any of the results found by the authors be explained by existing theories of cardiomyocytes? The only one I know is that of Safran and coworkers.
I also found the paper very difficult to read. The authors should perhaps reorganize the structure of the presentation in order to highlight what the new and important results are.
We are grateful for this detailed and critical feedback. The observed phenomena (stochastic heterogeneity, popping, high-frequency oscillatory motion) can indeed be explained by a nonmonotonic force-velocity relation along with stochastic fluctuations of individual sarcomeres. At the time of initial submission of this manuscript, we already had a theoretical model in preparation, which both qualitatively and quantitatively explains the observed phenomena. As a result, we included certain interpretations preemptively, which caused some lack of clarity in the absence of the full model. We have now added the model to this manuscript, providing a mechanistic interpretation of our findings. The model is different from prior models in that it emphasizes time-dependent forces, typically disregarded in models built to understand isometric skeletal muscle experiments.
We have shortened, streamlined and restructured our manuscript to improve the readability and accessibility of our study.
Recommendations for the authors:
There is a consensus among reviewers that the link between the stiffness dependence of the observed stochastic dynamics and the proposed tug-of-war mechanism is unclear. More quantitative support and discussion is required, possibly using theoretical modeling.
We are grateful for the insightful and comprehensive feedback by both editor and reviewers. As suggested, we have now added a comprehensive model explaining the observed phenomena and presenting a new conceptual view on cardiac muscle dynamics.
Reviewer #1 (Recommendations For The Authors):
The authors addressed an interesting question related to the dynamics of cardiac cells and their multiscale dynamics. They did a good job in terms of experimental design and data analysis. However, I fear that they do not contribute enough new information to the topic.
The authors should refer to the study in [24] and explain better the difference between these two studies. Although the different approaches are quite obvious, it is not clear to me what additional insights they add to the problem. They conducted their experiments with different stiffnesses. However, the conclusions they draw from the study are based on speculation (e.g. about the behavior of myosin heads in relation to shortening and relaxation), while their data mainly confirm previous studies. They need to address more explicitly the novelty of their study.
Novelty and Comparison with Previous Studies: We understand the concern about distinguishing our contribution from prior work, specifically Kobirumaki-Shimozawa et al., 2021.
As detailed in our public response, these are the key advances:
Use of a medically relevant human iPSC-CM model vs. mouse cardiomyocytes.
Superior spatial and temporal resolution via our SarcAsM algorithm, revealing novel phenomena like popping and high-frequency oscillations not previously reported.
Significantly greater statistical power due to our high-throughput in vitro assay.
We added a distinct mechanistic explanation based on the dynamic force-velocity relationship and sarcomere-level stochasticity, contrasting with the static, deterministic titin/length-dependence focus of previous studies.
Interpretation and Speculation: We acknowledge that without the explicit model, some interpretations in the initial submission appeared speculative. As noted in our public response, we had already started to develop a theoretical model explaining our observations at the time of submission, targeting a second follow-up publication. Including interpretations based on this unpublished model prematurely clearly caused confusion. We now include the full model in the revised manuscript.
Integration of the Theoretical Model: We have now fully integrated the model into the revised manuscript. The model explicitly demonstrates how the non-monotonic force-velocity relationship of individual sarcomeres leads to dynamic instabilities around a critical force threshold. This instability along with stochasticity drives a 'tug-of-war' between coupled sarcomeres, generating complex emergent behaviors.
Mechanistic Explanation Beyond Length-Dependence: Our model quantitatively reproduces all key experimental findings (stochastic heterogeneity, popping, oscillations) without relying on length-dependent activation effects. This strongly supports our conclusion that the active, transient dynamics of individual sarcomeres governed by the force-velocity relationship are fundamental drivers of these complex contractile patterns. We believe this provides a significant conceptual advance, highlighting a potentially underappreciated aspect of sarcomere dynamics. Previous models focused mostly on length-dependence, historically based on skeletal muscle fiber experiments that were often done under static, isometric conditions. We feel that the new model represents a substantial paradigm shift in understanding highly dynamic muscles such as heart muscle.
We are confident that the inclusion of the model addresses the majority of the reviewer's concerns.
Additional comments:
The authors write of a tug-of-war competition between the sarcomeres, and I'm not sure what they mean by that. I would spend more words explaining this point, especially because it seems to be an important point to describe their results. Similarly, they talked about an all-or-nothing phenomenon when they described the elongation of sarcomeres. What do they mean by this?
We have revised the manuscript where clarification was needed and now define the terms mentioned more explicitly.
(1) "Tug-of-War": We used this term metaphorically to describe the mechanical competition between linearly coupled sarcomeres within a myofibril, especially when contracting against rigid external boundary conditions. While it is not a perfect analogy, the metaphor intuitively captures the inherent instability of this interaction: similar to how a team in a real tug-of-war might suddenly yield when one person tires and the rest of team gets overloaded, rather than steadily losing ground, the dynamic instability arising from the non-monotonic force-velocity relationship (detailed in our model, lines 300ff) can cause individual sarcomeres to abruptly change state (e.g., shorten or rapidly lengthen) while under tension from their neighbors. We have removed the term from the title and now use it more sparingly within the manuscript to better reflect its role as an illustrative analogy.
(2) "All-or-Nothing" Elongation (Popping): The term "popping" describes our experimental observation of sudden, rapid, and extensive elongation of individual sarcomeres. This typically occurs late in the contraction cycle during early relaxation, when overall force may be declining, but individual sarcomeres can still experience significant tension from their neighbors. We described this specific type of rapid elongation in the original manuscript as an "all-or-nothing" phenomenon because, typically, sarcomeres in these events yield rapidly and strongly overshoot their resting length without recovering in a given activation cycle. The speed of popping events is substantially higher than the speed of coordinated gradual shortening observed during systoles that is driven by bound myosin heads. This observation strongly suggests an instability-driven, avalanche-like unbinding of myosin heads from the actin filaments during these events.
We agree that the term "all-or-nothing" is not precise, and we have removed it, as it is not essential for describing the observed "popping" dynamics.
The authors claim that the popping frequency increases as a function of stiffness. However, Figure 4E does not really seem to be a common practice in terms of statistical significance. A better description could help to remove this doubt.
We clarified the presentation of popping frequency data and its statistical interpretation.
(1) Popping Frequency vs. Substrate Stiffness (previously Figure 4D, now Figure 3G):
We first corrected that the dependence of popping frequency on substrate stiffness was presented in Figure 4D, not 4E. In the revised, shortened manuscript it can be now found in Fig. 3G. Due to the large number of observations (N) in our dataset, the slight upward trend in popping frequency with increasing substrate stiffness shown in Figure 4D does reach statistical significance using standard tests. For details see Figure captions.
(2) Popping Frequency vs. Sarcomere Resting Length (previously Figure 4E, now Figure 3H):
Figure 4E addresses the relationship between popping frequency and the individual sarcomere's resting length. To generate this plot, we binned sarcomeres based on their measured resting length (in intervals of 0.02 µm) and calculated the mean popping frequency within each bin across all conditions. We have now clarified this in the figure caption.
(3) Interpretation of Length Dependence:
While Figure 3H clearly shows that longer sarcomeres are more prone to popping, we argue this is likely a modulating factor rather than the sole underlying cause. Two key observations support this interpretation:
Even very short sarcomeres (e.g., < 1.65 µm resting length) exhibit a non-zero popping frequency (around 5-10%), indicating that popping is not exclusive to long sarcomeres.
The distribution of resting lengths, now added to the graph, is narrower than the wide range (1.6-2.0 µm) plotted in Figure 3H. Popping still occurs stochastically within a myofibril of sarcomere with relatively similar resting lengths.
Therefore, while length clearly influences the probability of popping, the phenomenon itself appears to be fundamentally stochastic, occurring across a range of lengths. This is consistent with our model in which dynamic instabilities (driven by the non-linear force-velocity relationship) and stochastic fluctuations are the primary triggers, while length affects probability of occurrence.
Changes in Manuscript:
We have revised the text associated with Figures 3G and 3H to clarify the distinction between stiffness and length dependence.
We have added a statement in the Methods section and figure legends (e.g., Legend for Fig 3) explaining our approach to statistical analysis and interpretation for large datasets where standard p-values may be less informative.
We believe these clarifications directly address the reviewer's concerns about the data presentation and interpretation in Figure 3.
Reviewer #2 (Recommendations For The Authors):
This is an interesting study, which however could and should be extended, see below. The current manuscript contains much less information than its length suggests; its figures contain partially redundant data.
Taking into account this critical feedback, we have restructured, streamlined and shortened the manuscript to improve readability and accessibility.
(1) How regular are the cellular contraction cycles?
Have the authors computed a coefficient of variation of cycle durations?
Does this regularity depend on substrate stiffness?
We have substantially improved the detection accuracy of contraction intervals compared to our initial submission (details see SarcAsM, https://www.biorxiv.org/content/10.1101/2025.04.29.650605v1). We calculated the beating rate variability (defined as the standard deviation of cycle durations), and found a low variability of on average less than 0.05 s across the tested conditions. The distribution of this variability is positively skewed, with the majority of values clustering near zero. We have added new panels showing these results to Fig. S2B.
(2) Which experiments could the authors perform to identify the origin of the apparent 3-Hz oscillations?
Would these oscillations persist even if the cardiomyocytes would not beat?
We now address these questions in the revised manuscript.
(1) Active Nature: The ~3 Hz oscillations are clearly linked to active contraction. They are absent in quiescent, non-beating cardiomyocytes observed under identical conditions, confirming that they are not passive fluctuations or baseline cellular tremors.
(2) Signal Fidelity: We are confident these are genuine physiological events, not artifacts. Our high temporal resolution (~15 ms frame time) and tracking accuracy (< 20 nm) allow reliable detection because events are well above system noise. This is now explained in the revised manuscript.
(3) Can the authors augment their study by modeling?
For example, could the experimental data be fitted by a Kuramoto-type model of the form d phi_i / dt = eps*sin( Omega - phi_i ) + lambda*sin( phi_i - phi_i+1 ) + xi_i, combining phase-locking of sarcomere oscillations with phase phi_i to intracellular calcium oscillations with phase Omega, and anti-phase synchronization between neighboring sarcomeres, as well as noise xi?
If yes, how would the coupling strength depend on subtrate stiffness?
We now added a model. While a Kuramoto-type phase model is powerful for studying synchronization, we determined that a more mechanistic approach was required. Crucially, sarcomeres are mechanically coupled in series within a myofibril, and this direct physical linkage is not well-represented by the abstract, phase-based coupling of a Kuramoto model.
Instead, our model comprises serially coupled sarcomeres, each governed by an underdamped Langevin equation. This framework allowed us to infer the force-velocity relation without any prior assumptions directly from our experimental data, revealing a critical non-monotonic characteristic. As we now emphasize in the revised manuscript, this behavior is mathematically equivalent to a Van-der-Pol relaxation oscillator, which reflects the instability-driven nature of the system.
Furthermore, and in line with the reviewer's suggestion, our model incorporates a stochastic noise term which we found essential for reproducing the observed phenomena. Without this noise term, the characteristic sarcomere dynamics do not emerge (Fig. 5).
(4) What is the maximally extended length of titin, and how does this length correspond to the maximal length of popping sarcomeres?
The force-extension curves of titin have been measured in single-molecule experiments (and the packing density of titin is known) - can the authors use this information to infer the forces acting inside sarcomeres?
We thank the reviewer for this thoughtful question. While sarcomere length during popping can be measured, inferring the corresponding intra-sarcomeric force is not straightforward in a living, contracting cardiomyocyte. The relationship between extension and force is complex and dynamic, involving multiple molecular components.
Our data show elongations up to 0.5 μm during popping events. While this magnitude is plausibly within the extensibility range of titin and other mechanically relevant components (Caporizzo & Prosser, 2021; Loescher & Linke, 2023), directly inferring force from this observation is challenging. In such a multi-component system with both active and passive elements, total force comprises several factors that cannot be disentangled from a simple length measurement alone. First, the system is dominated by active, velocity-dependent force generation of cross-bridges, which our model shows is non-monotonic. Second, titin exhibits a restoring force that is strongly strain-rate dependent (Rief et al., 1997), critical during rapid elongation. Third, viscous drag forces within the sarcomere are also highly strain-rate dependent, contributing significantly during rapid length changes. Fourth, other structural elements such as microtubules and intermediate filaments contribute to viscoelastic properties, particularly at high strains (Caporizzo & Prosser, 2021). This complex interplay makes it impossible to map a given sarcomere length to a unique force value using single-molecule titin data alone.
(5) I urge the authors to make their raw data openly available.
We agree on the importance of data availability. While the complete raw imaging dataset is several hundred gigabytes and thus impractical to deposit, we have uploaded a comprehensive dataset to Zenodo to ensure full reproducibility. This repository includes a representative subset of raw imaging data (50 cells per condition), with corresponding sarcomere motion data provided in a readable JSON format. Crucially, the deposition also contains the complete aggregated data underlying all figures and statistical analyses presented in the manuscript. All provided data can be programmatically accessed and analyzed using our `SarcAsM` Python API. The data can be accessed at: https://doi.org/10.5281/zenodo.17564384.
Minor
(1) How did the authors determine the start and end of contraction cycles when analyzing their data?
The start and end points of each contraction cycle were identified using ContractionNet, a custom convolutional neural network we developed for this purpose. This method, used for all analyses in the revised manuscript, detects contraction intervals with high accuracy directly from sarcomere dynamics time-series data and significantly outperforms the threshold-based approach used previously. The complete methodology, algorithm description, and validation of ContractionNet are detailed in our companion paper on the SarcAsM analysis software
(www.biorxiv.org/content/10.1101/2025.04.29.650605v1, see Fig. S6).
(2) What are the measurement errors in determining Delta_SL?
The measurement error for the Z-band trajectories is approximately 17 nm. This high tracking accuracy is achieved with our deep-learning-based Z-band segmentation approach, which employs a 3D convolutional neural network (3D U-Net) to leverage both spatial and temporal context for robust Z-band segmentation in noisy, high-speed recordings. A full description of this validation is available in our SarcAsM companion paper (see Figure S3 therein).
(3) Does popping occur while other sarcomeres are still contracting?
This is an important point. Yes, popping frequently occurs while other sarcomeres within the same myofibril are still actively shortening. This simultaneity is clearly visualized in the newly added Movie M1, which displays a phase-space plot (velocity vs. length change relative to rest) for all tracked sarcomeres over time. In this visualization, popping events appear as trajectories moving into the top-right quadrant (rapid elongation), while concurrently, other sarcomeres are represented by points in the left quadrants (negative velocity), indicating ongoing shortening. We have included Movie M1 as supplementary material.
(4) The authors argue that their data on popping sarcomeres is consistent with homogeneous popping probabilities.
(5) Can the authors assess in simulations how dispersed the popping probabilities of individual sarcomeres could be before they would notice a statistically significant difference to the homogeneous case?
This question touches on a key challenge in analyzing these complex dynamics. A direct statistical test of popping probability for each individual sarcomere is not feasible, as the number of events per sarcomere over our observation time is too low for robust single-unit analysis. Consequently, our approach relies on testing the cumulative distributions of inter-event spatial distances and temporal gaps across all sarcomeres within a given region (LOI).
In nearly half of the analyzed LOIs, these cumulative distributions were statistically indistinguishable (p > 0.05) from the geometric distribution expected for a single, homogeneous stochastic process. This provides strong support for our primary conclusion that popping is fundamentally a random phenomenon.
For the cases that deviate from the homogeneous model, we argue that this does not refute the underlying stochasticity of the events. Instead, we propose this is the expected statistical signature of pooling data from a population of sarcomeres that have slight, intrinsic variations in their individual popping probabilities due to factors like resting length or structural integrity. Even if each sarcomere's popping is a locally random event, a cumulative test performed on a population with varied baseline probabilities is expected to detect a deviation from a simple, homogeneous model.
Regarding the requested simulation study: While we agree this would be methodologically informative, the sensitivity to detect probability dispersion depends on multiple interacting factors (number of sarcomeres per LOI, observation time, event rates, and the assumed form of heterogeneity). Any single simulation scenario would therefore be highly model-dependent and of limited generality. Rather than introducing additional assumptions, we base our conclusions on the observed agreement with the homogeneous model in approximately half of LOIs and the correlation of deviations with measurable properties (Fig. 4E). A comprehensive statistical analysis would constitute a substantial methodological study beyond the scope of this mechanistically focused manuscript.
(6) Can the authors measure sarcomere rest length and check if this rest length is correlated with the popping probability of individual sarcomeres?
Yes, we performed this analysis. As shown in Figure 3H (previously Fig. 4E), we found a positive correlation between sarcomere resting length and popping frequency, confirming that longer sarcomeres have a higher probability of popping.
Importantly, however, the popping probability remains non-zero even for shorter sarcomeres. As detailed in our response to Reviewer #1 regarding this figure, we interpret resting length as a significant modulating factor that influences popping probability, rather than the sole determinant of the phenomenon.
(7) Several mathematical models of sarcomere contraction exist (e.g., crossbridge models).
(8) Could the authors perform computer simulations of several such stochastic sarcomere models coupled in series?
Alternatively, could the authors discuss this?
As I understand, references 16-18 model myofibril contraction assuming static variability of sarcomeres, but do not account for stochasticity in the contractility of individual sarcomeres.
We thank the reviewer for this excellent suggestion. We have performed such simulations, and the theoretical model is a central component of our revised manuscript (new Figures 4 and 5; manuscript lines 316ff).
As the reviewer points out, previous models (e.g., refs 12 and 14 in our manuscript) have often relied on predefined static variability between sarcomeres to explain heterogeneous behavior. Our work takes a fundamentally different approach. We model the myofibril as a chain of serially coupled sarcomeres, where the dynamics of each unit are governed by an underdamped Langevin equation. This formulation inherently incorporates stochasticity and describes the interplay between a non-monotonic, velocity-dependent active force, a length-dependent passive force, and the mechanical coupling to its neighbors.
Crucially, the model parameters were not assumed, but were instead inferred by fitting the model directly to our experimental data using a gradient-free optimization algorithm. This data-driven stochastic model was sufficient to quantitatively reproduce key observed phenomena, including high-frequency oscillations and popping events. Our central finding is that these complex behaviors emerge naturally from the coupled system, driven by the non-monotonic force-velocity relationship and intrinsic stochastic fluctuations. This demonstrates that predefined static heterogeneity is not required to explain the observed dynamics.
(9) The manuscript could be shortened (e.g., lines 52-56 in the introduction provide little extra value).
We have significantly revised the entire manuscript to improve clarity and readability. We have removed sentences in the introduction as suggested and substantially restructured major sections. One of the main reasons for this was the integration of our theoretical model, which was originally prepared as a separate manuscript. This required us to completely reframe the introduction and reorganize the figures and results.
We are confident that these extensive changes have resulted in a stronger, more concise and impactful paper that now integrates our experimental findings with a theoretical model.
(10) Figure 2 is overloaded with data. Several panels could be moved to the SM without compromising the key message.
Introducing the notation in panels Figures 2A-C does not seem ideal to me; maybe add a cartoon?
We agree that the Fig. 2 was dense. We have redesigned panels A-F to improve clarity and better guide the reader. We now use a consistent color-coding scheme to link the extrema in the phase portraits (A-C) to the corresponding distributions of individual sarcomeres (E-G). We have also revised the accompanying text to make the figure's logic more transparent.
We have considered moving panels A-C to the supplementary materials. However, we believe their placement in the main text is crucial for two reasons:
(1) Revealing Core Dynamics: The length-velocity phase portrait is the first visualization that reveals the underlying near-oscillatory dynamics of individual sarcomeres. This was not an assumed behavior but a critical experimental observation that directly motivated our entire theoretical modeling effort. We now also provide animated versions of these plots (Movies X-Y) to further illustrate these complex dynamics.
(2) Enabling Model-Experiment Comparison: A phase portrait is a standard tool for comparing experimental data with theoretical models. Retaining it in the main text allows us to directly compare data and model in our new Figures 4 and 5, providing a clear validation of our model.
(11) Similarly, Figures 4F, G, and H seem dispensable to me.
(I also wonder how clear the analogy of a coin flip is if a biased coin with probabilities p and 1-p needs to be used.)
We agree that the previous Figure 4F, which served a purely illustrative purpose, was dispensable and have removed it. The "coin flip" analogy was potentially confusing and we have removed it.
As part of a broader restructuring of the manuscript, the quantitative analyses from the original Figures 4G and 4H are now presented as Figures 3I and 3J. They provide important supporting evidence for the stochastic nature of the resulting popping events. We believe retaining this quantitative analysis is valuable, and we hope that by streamlining the figure and removing the analogy, we have addressed the reviewer's concerns.
(12) Equation (1) is unnecessarily complicated. The same holds for Equation (2).
It might make sense to separate definitions for serial and mutual correlations.
(This would also simplify the axes labels in Figure 3C.)
(13) The notation used in Equation (1) is not fully clear.
I assume t denotes a unit-less time index and T is the unit-less duration of a contraction cycle, measured in multiples of a fixed time interval?
Regarding comments (12) and (13):
We thank the reviewer for these helpful suggestions. In response to comment (12), we have separated the definitions for the mutual (r<sub>m</sub>) and serial (r<sub>s</sub>) correlation coefficients, presenting them as distinct calculations rather than as special cases of a single, more complex formula. This makes their definitions more direct and explicit. The calculation for the serial correlation coefficient has also been streamlined into a concise inline definition.
In response to comment (13), we have clarified the notation in Equation (1). In the manuscript text (lines 208f), we now explicitly state that 𝑡 represents the discrete, unitless time index (i.e., the frame number) within a time-series, and 𝑇 is the total number of frames (i.e., the total duration in frames) of a given contraction cycle.
While Equation (1) itself is the standard definition for the uncentered correlation coefficient and cannot be algebraically simplified, we have added text to specify this and justify its use. This metric (equivalent to cosine similarity) is appropriate for our analysis as it assesses the similarity in the shape of motion patterns, independent of their mean values.
Finally, to further streamline the paper, we have removed the velocity correlation analysis and the corresponding parts of Figure 3.
(14) The authors should make clear in all figures what is experiment and what is simulation.
We have now clarified the nature of each graph in the figure captions.
(15) The caption of Figure 3C could be simplified.
We have simplified all figure captions.
(16) I found Figure 3A hard to understand.
We concluded that Figure 3A was confusing and did not add essential information to the manuscript. We have removed it entirely.
Reviewer #3 (Recommendations For The Authors):
In conclusion, l think that the manuscript would gain a lot if some more precise and more quantitative interpretation of the results were given. This might require a collaboration with theorists.
We have integrated a novel theoretical framework into the revised manuscript (new Figures 4 and 5; manuscript lines 300ff as described above.
This new section introduces a data-driven, stochastic dynamical model that simulates the myofibril as a chain of serially coupled sarcomeres. Each sarcomere's motion is governed by an underdamped Langevin equation, a formulation that inherently accounts for stochasticity. Crucially, our model incorporates a non-monotonic force-velocity relationship inferred directly from our experimental data, rather than relying on predefined static variability between sarcomeres a key distinction from previous theoretical work.
This integrated model successfully and quantitatively reproduces all major experimental phenomena described in the paper, including high-frequency oscillations and stochastic "popping" events. It demonstrates that these complex behaviors emerge naturally as dynamic instabilities from the coupled system. This addition elevates the manuscript from a descriptive study to one that provides a predictive, mechanism-driven framework for understanding sarcomere dynamics.
-
-
-
eLife Assessment
This is a theoretical analysis that gives compelling evidence that length control of bundles of actin filaments undergoing assembly and disassembly emerges even in the absence of a length control mechanism at the individual filament level. Furthermore, the length distribution should exhibit a variance that grows quadratically with the average bundle length. The experimental data are compatible with these fundamental theoretical findings, but further investigations are necessary to make the work conclusive concerning the validity of the inferences for filamentous actin structures in cells.
-
Reviewer #1 (Public review):
Actin filaments and their kinetics have been the subject of extensive research, with several models for filament length control already existing in the literature. The work by Rosario et al. focuses instead on bundle length dynamics and how their fluctuations can inform us on the underlying kinetics. Surprisingly, the authors show that irrespective of the details, typical "balance point" models for filament kinetics give the wrong scaling of bundle length variance with mean length compared to experiments. Instead, the authors show that if one considers a bundle made of several individual filaments, length control for the bundle naturally emerges even in the absence of such a mechanism at the individual filament level. Furthermore, the authors show that the fluctuations of the bundle length display the same scaling with respect to the average as experimental measurements from different systems. This work constitutes a simple yet nuanced and powerful theoretical result that challenges our current understanding of actin filament kinetics and helps relate accessible experimental measurements such as actin bundle length fluctuations to their underlying kinetics. Finally, I found the manuscript to be very well written, with a particularly clear structure and development, which made it very accessible.
Comments on revisions:
I maintain my original favorable assessment of this manuscript.
I thank the authors for considering my comments and for their thoughtful replies. It would have been helpful to see some of the comments reflected in the text and discussion. I leave this to the authors.
I appreciate that the authors replaced the figures with higher-resolution versions, but I maintain my assessment that the graphical and aesthetic quality of the figures, especially the size of the legends (which are often tiny and difficult to read), labels, colors, etc., could be improved. Again, I leave this to the authors.
-
Reviewer #2 (Public review):
The authors present a theoretical study of the length dynamics of bundles of actin filaments. They first show that a "balance point model" in which the bundle is described as an effective polymer. The corresponding assembly and disassembly rates can depend on bundle length. This model generates a steady-state bundle-length distribution with a variance that is proportional to the average bundle length. Numerical simulations confirm this analytic result. The authors then present an analysis of previously published length distributions of actin bundles in various contexts and argue that these distributions have variances that depend quadratically with the average length. They then consider a bundle of N independent filaments that each grow in an unregulated way. Defining the bundle length to be that of the longest filament, the resulting length distribution has a variance that does scale quadratically with the average bundle length.
The manuscript is very well written, and the computations are nicely presented. The work gives fundamental insights into the length distribution of filamentous actin structures. The universal dependence of the variance on the mean length is of particular interest. It will be interesting to see in the future how many universality classes there are, and which features of a growth process determine to which class it belongs.
Comments on revisions:
I thank the authors for their detailed and thorough answers to the points that had been raised. I have no further recommendations.
-
Author response:
The following is the authors’ response to the original reviews.
eLife Assessment
This is a theoretical analysis that gives compelling evidence that length control of bundles of actin filaments undergoing assembly and disassembly emerges even in the absence of a length control mechanism at the individual filament level. Furthermore, the length distribution should exhibit a variance that grows quadratically with the average bundle length. The experimental data are compatible with these fundamental theoretical findings, but further investigations are necessary to make the work conclusive concerning the validity of the inferences for filamentous actin structures in cells.
We think this is an excellent assessment of the article. We suggest adding a sentence after the first one: “The distribution of bundle lengths is not Gaussian but Gumbel, since the bundle length is the length of the longest filament in the bundle.”
Public Reviews:
Reviewer #1 (Public Review):
Actin filaments and their kinetics have been the subject of extensive research, with several models for filament length control already existing in the literature. The work by Rosario et al. focuses instead on bundle length dynamics and how their fluctuations can inform us of the underlying kinetics. Surprisingly, the authors show that irrespective of the details, typical "balance point" models for filament kinetics give the wrong scaling of bundle length variance with mean length compared to experiments. Instead, the authors show that if one considers a bundle made of several individual filaments, length control for the bundle naturally emerges even in the absence of such a mechanism at the individual filament level. Furthermore, the authors show that the fluctuations of the bundle length display the same scaling with respect to the average as experimental measurements from different systems. This work constitutes a simple yet nuanced and powerful theoretical result that challenges our current understanding of actin filament kinetics and helps relate accessible experimental measurements such as actin bundle length fluctuations to their underlying kinetics. Finally, I found the manuscript to be very well written, with a particularly clear structure and development which made it very accessible.
We are grateful to Reviewer #1 for this very favorable assessment.
Reviewer #2 (Public Review):
Summary:
The authors present a theoretical study of the length dynamics of bundles of actin filaments. They first show a "balance point model" in which the bundle is described as an effective polymer. The corresponding assembly and disassembly rates can depend on bundle length. This model generates a steady-state bundle-length distribution with a variance that is proportional to the average bundle length. Numerical simulations confirm this analytic result. The authors then present an analysis of previously published length distributions of actin bundles in various contexts and argue that these distributions have variances that depend quadratically with the average length. They then consider a bundle of N-independent filaments that each grow in an unregulated way. Defining the bundle length to be that of the longest filament, the resulting length distribution has a variance that scales quadratically with the average bundle length.
Strengths:
The manuscript is very well written, and the computations are nicely presented. The work gives fundamental insights into the length distribution of filamentous actin structures. The universal dependence of the variance on the mean length is of particular interest. It will be interesting to see in the future, how many universality classes there are, and which features of a growth process determine to which class it belongs.
Weaknesses:
(1) You present the data in Fig. 3 as arguments against the balance point model. Although I agree that the data is compatible with your description of a bundle of filaments, I think that the range of mean lengths you can explore is too limited to conclusively argue against the balance point model. In most cases, your data extend over half an order of magnitude only. Could you provide a measure to quantify how much your model of independent filaments fits better than the balance point model?
Indeed, we agree that the experimental data we present, each on their own, provide inconclusive evidence of the scaling predicted by our model. However, in aggregate, as presented in Fig. 3E, the data make for compelling evidence of scaling of the variance with the average length squared, as quantified by the power-law fit. Also, we think that Fig. 3E argues strongly against the Balance Point Model, because the data do not conform with simple linear scaling (indicated by the dashed line in Fig. 3E). Regardless, we agree with the referee that better data is needed to make a more convincing case, and we see this paper as a call to arms to collect such data in the future. The published data we used (other than our own data from experiments on yeast actin cables) is from experiments that were not designed with this question in mind, i.e., how do length fluctuations scale with the mean?
(2) Concerning your bundled-filament model, why do you consider the polymerizing ends to be all aligned? Similarly to the opposite end, fluctuations should be present. Furthermore, it is not clear to me, where the presence of crosslinking proteins enters your description. Finally, linked to my first remark on this model, why is the longest filament determining the length of the bundle in all the biological examples you cite? I am thinking in particular about the actin cables in yeast.
In the case of the yeast actin cables (which grow from the bud neck into the mother cell), we know that the formins that polymerize the actin filaments are spatially aligned at the bud neck. In the cases of stereocilia and microvilli, again the polymerizing ends of the actin filaments are well-aligned at the growing tips of these bundled actin structures, as indicated by classic EM studies from Lew Tilney and others. The alignment of polymerizing actin filament ends is more difficult to assess at the leading edge of lamellipodia, because of undulating shape of the polymerization (membrane) surface. In fact, this could be the reason why data from the lamellipodia experiments deviate from the line in Fig. 3E, in contrast to the data from the other three structures (this is discussed in some detail in the Supplement). Regarding the actin crosslinkers, the only role they play in our model is keeping the filaments connected in the bundle. As far as the question of why the longest filament in the actin cable is the one that specifies the length of the cable, this is addressed in more detail in our McInally et al., 2024 (PNAS) paper, where we measured cable length by segmenting the fluorescence signal of the cable. Therefore, the filaments in the bundle that extend the furthest define the reported length. Also, given the function of the cables for transporting vesicles, the furthest reach of the filaments in the bundle defines the area from which the vesicles are collected.
Recommendations for the authors:
Reviewer #1 (Recommendations For The Authors):
An important result of the model proposed by the authors is that the relationship between bundle mean length and variance should also inform the number of filaments in the bundle (Equation 13). In the SI the authors thus predict from fitting experimental results that bundles should be made of around 173 filaments, which is larger than most values proposed in the literature (and quoted in this work), except for stereocilia. Can the authors comment on this?
This is an interesting point that we have been thinking about. Indeed, the model does relate the number of filaments to the variance of the length, but this dependence is logarithmic and therefore insensitive to changes in the number of filaments. Consequently, the number 173 comes with very large error bars and should be thought of more like a few hundred filaments in terms of the precision with which we can extract this number from data. We make this point more clearly in the revised SI, where we now say that based on the data the best we can do is say that the number of filaments is between 80 and 400.
Along the same lines, in their derivation of Equations 12 and 13 (a key result of the manuscript) the authors make some approximations that are only valid for large N (number of filaments in the bundle). Is this approximation valid for actin cables or filopodia, estimated to comprise only around 10 filaments?
Indeed, even for N=10 filaments the approximate formulas have errors that are well below what can be measured. We consider the details of the approximation in deriving Equations 12 and 13 from the exact distribution (Equation 11) in the Supplemental section “Distribution of bundle lengths when individual filament lengths are exponentially distributed”. For example, the exact result involves the harmonic number which for N=10 is 2.88, while the approximate formula ln(N) + gamma we use yields 2.92, a fractional error that is < 2%.
A key assumption of the model is that the bundle length corresponds to the maximum individual filament length inside the bundle. Couldn't bundles comprise several filaments one after another, head-to-tail? What do the authors expect then?
Excellent point. Indeed, this is precisely the geometry of the yeast actin cable. In our previously published McInally et al., 2024 (PNAS) paper we worked out the math in that case and found that the main result about the variance holds. In this paper we presented a simpler, model that retains the same features of the one presented in the PNAS paper to better accentuate the origins of the scaling of the variance with the mean length, which is simply the result of bundling and identifying the length of the bundle with the length of the longest filament (or, more precisely, furthest extending filament) in the bundle.
The model also allows us to relate the bundle length fluctuations and average to the individual filament characteristic length (Equations 12 and 13 again). Can the authors comment on the values of 〈l〉 they would obtain for experimental data?
It is hard to give a precise number, as we would need to know also the number of filaments in the bundle, and for that we would need better electron microscopy data (which has proven difficult for the field to obtain). Still with typical numbers in the 10s to 100s the expected average filament lengths are roughly, ln(10) – ln(100), or 2-5 times smaller than the average bundle length.
I find the Methods section a bit underwhelming. In particular, can the authors give more details on their treatment of experimental data? Bootstrapping sampling is mentioned but there is no information on the size of the original data sets, which could affect the validity of such a method.
Thanks for the criticism. We have added details regarding the sizes of the data sets used in the analysis in the Methods section.
Along the same lines, is the graph in Figure 1E the result of a simulation like the ones the authors used to obtain their result or is it just a schematic? If the first, I would suggest replacing it with an actual simulated length trajectory. In general, I think this work would benefit from more detailed explanations and examples of how stochastic trajectories were computed and analysed.
This is also a good point. We still prefer to keep the schematic in this figure since our goal here is to define the question before we commence with computations and data analysis. The stochastic trajectories were generated using the standard Gillespi algorithm and the statistics of length were gathered once the dynamics of length reach steady state. We explain this in the Methods section and give more details in the Supplement.
Finally, while I find the writing in this manuscript to be excellent, I think the figures require some work. The schematics and drawings, which are very low resolution, the font size for the axes, and the choice of colours all make it more cumbersome than necessary to understand what is being shown.
Thank you for pointing this out. We have made better versions of the figures.
Reviewer #2 (Recommendations For The Authors):
"In this case, the length distribution of the bundle derived from extreme value statistics, leads to a peaked non-Gaussian distribution, even when filaments within the bundle are unregulated and exponentially distributed."
You mention "extreme value statistics" only once, in the introduction. I would suggest that you come back to this notion and explain how your results connect to extreme value statistics or delete it from the manuscript.
Good point. We added a sentence to draw the reader’s attention to the fact that our result is an extreme value distribution (Equation 11 is the Gumbel distribution) used in statistics of extreme events.
This is a follow-up of one of my major points of criticism: Fig. 3A: why do you fit (if I understand correctly) the blue and orange data points with the same power law? For (A-- D) The data extend over less than an order of magnitude. Why is a power law fit appropriate? Can you quantify how much better your fits are compared to a linear dependence? Bundling the data of all structures yields a common matter curve (with the exception of filopodia). This is quite remarkable, I think, and merits some more discussion than currently given in the manuscript.
Good point. We should have been more clear. In Figures 3A-D we show individual data sets for the different bundle structures and compare the prediction of the Balance Point Model (dashed line) to the data. We also do a fit to a power law to show that the data is consistent with the Bundle model. This comparison is made much more clear in Figure 3E.
Fig 1B, right does not show the addition and removal of subunits - Fig. 1C does. Panel C is not explained in the caption. The second appearance of (D) in the caption could be omitted.
Good points. We fixed these issues in the new version of the Figure and caption.
"For individual actin filaments (...)" I found this and the following paragraph slightly confusing at first reading: as long as you write about single filaments, do you have annealing in mind, where two filaments merge and form a longer filament? In case you consider a bundle, do you consider a filament that is cross-linked to other filaments and thereby added to the bundle? Similarly for removing filament segments (severing or unbundling)? Probably, my confusion is a consequence of you seemingly using filament to describe bundles as well as single actin filaments.
Sorry for the confusion. We tried to be consistent throughout the text and use “filament” to denote a single actin filament and “bundle” a collection of parallel filaments crosslinked together. The assembly and disassembly dynamics of the filaments in the bundle are only relevant to the extent that they affect the length distribution of individual filaments. The main result is largely independent of that (as demonstrated in the Supplement by considering different single filament distributions) once we decide that the length of the bundle is given by the length of the longest filament in the bundle. This is the point of extreme value statistics where a universal, Gumbel distribution for the length of the longest filament in the bundle arises independent of the length distribution of a single filament (this result is akin to the Central Limit Theorem which predicts a Gaussian distribution of the mean of a large number of random numbers irrespective of the distribution they’re drawn from.)
In Figure 4D, the variance of the filopodia lengths" Probably Figure 3D?
Yes. Thank you. We fixed this.
"The filopodia data seemingly has the same slope (...) but with variances higher than what is measured for other actin structures." This finding does not contradict the main statement of a nonlinear scaling of the variance with the mean length, right? I therefore find this discussion slightly peripheral and also confusing. Also, what is the reason to assume that EM might get the actual length of filopodia wrong by a factor of 2 to 3?
The issue with filopodia is that the way the lengths are measured is by the extent to which the structure as a whole protrudes from the cell. This leaves unresolved the lengths of the actual filaments in the structure, and we suspect that they are longer as they extend into the cytoplasm. This would contribute to the shift off the common curve in the direction that is observed (larger variance associated with smaller average length). We have no way to justify that this would lead to a 2-3 factor other than that would be enough to collapse the data onto the common curve. Clearly more careful experiments are needed to resolve the issue. We added some clarifying remarks to this effect into the discussion.
Eq.(14) What is Z?
Thanks for pointing out this omission. Z = L/<L> and we have added that in the formula where Z appears.
LIST OF CHANGES
Here we summarize the changes we made to the manuscript and the Supplementary material in response to the reviewers.
(1) Fixed typo: Figure 1 legend had two parts labelled D which has been changed into a D and a C. The explanation of panel C has been added.
(2) Fixed typo: The incorrect call to Figure 4D is now corrected to Figure 3D.
(3) In the Supplementary material we made more precise our estimate of the number of filaments. The wording “From this we can estimate the number of filaments. We find, with a confidence interval of…” we have changed to “From this we can estimate the number of filaments to be between 80 and 400 which compares favourably to the typical number of filaments in the different actin structures that were analyzed.”
(3) In the Methods section we added the number of measured filament lengths in the different data sets used in the analysis.
(4) We made better (higher resolution) versions of all the Figures.
-
-
www.biorxiv.org www.biorxiv.org
-
eLife Assessment
This valuable study explores changes in the Drosophila microbiome in response to environmental temperature over more than ten years. The evidence showing that temperature leads to diversification of bacterial clades is solid, but additional information would help clarify how subspecies competition impacts microbiome composition and the host. The work will interest researchers working with microbiomes, microbial ecology, and evolutionary biology.
-
Reviewer #1 (Public review):
Summary:
The factors that create and maintain diversity in host-associated microbiomes remain poorly understood. A better understanding of these factors will help in the efforts to leverage the adaptive potential of the microbiome to help solve pressing problems in health and agriculture.
Experimental evolution provides a promising path forward as we can track the causes and consequences in the emergence of novel variants, but experimental evolution remains underutilized in host-microbiome interactions. Here, Gracia-Alvira utilizes a long-term experimental evolution study in Drosophila simulans under hot and cold temperature regimes to identify strain-level variation in an important fly bacterium, Lactiplantibacillus plantarum. They identify three strains of L. plantarum, which are most prevalent in their respective three temperature regimes, suggesting that these are locally adapted bacteria. Then, using a combination of genomics, in vitro, and in vivo, Gracia-Alvira et al attempt to understand the factors that led to the differentiation of the hot and cold L. plantarum and their impacts on the fly host.
Strengths:
This is an excellent use of experimental evolution to track the emergence of novelty in the microbiome. The genomic analyses are all solid and appropriate for the data sets. It is especially striking that the comparisons with the other, independent experimental evolution studies in different labs (and across continents between Portugal and South Africa) show a consistent response to temperature. Many have disregarded the microbiome as it is something that is too sensitive to seemingly innocuous variables (particularly in the fly microbiome), such that we cannot find generalities. However, this finding highlights the potential for experimental evolution to uncover these dynamics. The question of how strains emerge and are maintained is timely and is one of the key open questions in host-microbiome evolution currently.
Weaknesses:
(1) The framing in the title and throughout the discussion about "subspecies competition" does not match the data that was collected. The subspecies competition requires actually tracking the competitive outcomes between the hot, cold, and unevolved L. plantarum. In the in vivo work, I can see that mixes of the strains were made, but they did not track whether the cold strain outcompeted the hot strain in vivo under cold conditions, for example. While Figure 4 is suggestive that there is ongoing competition in the hot temperature regime, this is not necessarily shown in the cold, which is dominated by the C clade. It could also be that the bacteria cannot survive in the flies at the different temperatures. The growth curve assays hint that the bacteria can grow, but the plate reader couldn't actually maintain the 18 {degree sign}C temperature (line 455). So all of this evidence is very indirect and insufficient to say that strain competition is driving these patterns.
(2) The in vivo results are interesting in that there appears to be a fitness cost of clade C, but the explanation is underdeveloped. I say under-developed because in Figure 4, the cold L. plantarum remains much higher throughout adaptation to the hot temperature regime than the hot L. plantarum in the cold regime. The hot L. plantarum is low abundance throughout the cold regime. I felt like this observation was not explained, but it seems relevant to understanding the strain dynamics.
I will also note that this is not the first time that L. plantarum or other Lactobacillus have been shown to exert fitness costs to Drosophila. Gould, PNAS, 2018, shows that both Lactobacillus plantarum and Lactobacillus brevis in mono-association have lower fitness (measured through Leslie matrix projections using lifespan and fecundity) than axenic flies. Many studies of wild Drosophila fail to find Lactobacillus, or it is low abundance (e.g., Chandler, PLoS Genetics, 2014; Wang, Environmental Microbiology Reports, 2018; Henry & Ayroles, Molecular Ecology, 2022; Gale, AEM, 2025). This might help provide useful context for the in vivo results.
(3) The data in Figure 4 are compelling to focus on the L. plantarum variants. However, I can see from the methods that the competitive mapping included only other strains of Wolbachia. It is not clear how other members of the microbiome changed in response to the temperature regimes. As I note in point #2, given that Lactobacillus is often rare, it is not clear what the rest of the microbiome looks like over the course of adaptation. Indeed, it seems like Mazzucco & Schlotterer, PRSB, 2021 did a broader analysis of the microbiome and found that Acetobacter is by far the most common bacterium (I think this data is also part of the data shown here?). Expanding on why or why not in this context is important and will improve this study, particularly if the focus is on connecting these evolutionary dynamics to ecological competition to explain the emergence of strain diversity.
-
Reviewer #2 (Public review):
Summary:
In this manuscript, Gracia-Alvira et al. investigated how environmental temperature affects competition among members of the microbiome, with a focus on intraspecific diversity, using the Drosophila model.
Notably, the authors identified three clades of Lactiplantibacillus plantarum from a natural population of Drosophila simulans collected in Florida. They tracked the dynamics of these three bacterial clades under two temperature conditions over the course of more than ten years. Using comparative genomics and phylogeny, they showed that these three bacterial clades likely adapted to their host independently in a temperature-specific manner. Further, by combining in vitro culture and in vivo mono-association assays, they demonstrated the functional divergence of these three bacterial clades phenotypically, including their growth dynamics and effects on host fitness. Lastly, they performed pathway analysis and speculated on key genomic variance supporting such functional divergence.
Strengths:
The laboratory evolutionary experiment in response to cold or hot environmental temperature is impressive, given its more than ten years of experimental time period. This collection of achieved microbiome samples paired with the fly host data can be a valuable resource for the field.
Weaknesses:
The laboratory evolutionary experiment can be limited due to its artificial experimental setup. For example, wild flies rely on a more diverse set of food sources and are constantly exposed to new bacterial inoculations, whereas under laboratory conditions, flies live in a more restricted ecosystem. In addition, environmental temperatures differ among different locations, but they also involve seasonal changes within the same region. This manuscript can be strengthened with further discussions that elaborate on these limitations.
Moreover, the extent of host effects involved in these experiments remains ambiguous, because it is unclear whether these Lactiplantibacillus plantarum mostly reside within fly guts or on Drosophila medium. The laboratory evolutionary experiment possibly favored better colonizers on Drosophila medium under either cold or hot temperatures, which subsequently can saturate fly guts. As fully dissociating these variables can be experimentally tedious, the authors may want to comment more on these aspects in the discussion. Or they may want to consider some measurements. For example, measuring the growth rate of these bacteria on Drosophila medium under different temperatures, in addition to the current MRS culture experiments, or measuring the portion of the Lactiplantibacillus on Drosophila medium versus these stably colonizing fly guts.
-
Reviewer #3 (Public review):
Summary:
The study presents an analysis of 297 pangenomes derived from 20 populations of Drosophila simulans, at 19 time points for fast-reproducing individuals in a hot environment, or at 10 time points for slow-reproducing individuals in a cold environment, over a period of more than 10 years. The authors select a particular microbial component of the pangenomes and study the dynamics of Lactiplantibacillus plantarum strains in two environments. They discover that the revealed operational taxonomic units could be divided into three phylogenetic clades, which have their own genomic and genetic features, different adaptive capabilities that depend on the environment, and have a distinct impact on the fitness of the host.
Strengths:
The authors prove that bacterial microbiome components are sensitive to the environment and could rapidly (years) be fixed in eukaryotic populations. This study establishes a tractable model that potentially enables the study of variability of the physiological influence of distinct strains of an important commensal species, Lactiplantibacillus plantarum, on the Drsosophila host. It is clearly shown that this single species consists of several phylogenetically and functionally diverse strains. The authors did not limit their interest to their own model, but rather they have integrated a comparative approach by analysing phylogenetic relationships among 92 described L.plantarum strains.
Overall, the study is novel and delivers important discoveries of a longitudinal, well-replicated experiment, generating a substantial amount of genomic data. It highlights an important dimension of research that environmental selection operates at the subspecies level.
Weaknesses:
Even though the authors show only one particular example by conducting their longitudinal experiment, they honestly acknowledge failures important for interpretation of the biological significance of the results (gnotobiotic mono-association experiments was done with D.melanogaster, but not D. simulans) and therefore they state limitations of their conclusions (weaker effects in the non-axenic flies are due to the presence of other taxa or to higher-order interactions with other members of the microbiome). These interactions could significantly affect bacterial growth, metabolism, and physiological influence on the host.
The authors exploit the results of their experiment to speculate about a wide range of evolutionary phenomena, like within-species competition, ecological adaptation and evolution of the host, fitness advantage of bacteria to the host, the benefits of parasitism or mutualism, the domestication of the microbiome, etc. At the end, they conclude that their study "highlights that even subspecies diversity plays a key role in adaptation to environmental temperature". However, the potential mechanisms of such adaptation are barely discussed, so that the focus of the study shifts from the temperature-induced changes in microbial population structures toward metabolism-related adaptations of clade representatives that enable them to diversify their carbon and nitrogen sources. The role of the temperature factor remains elusive.
In addition to that, the paper has a clearly minimalistic experimental approach to address functional properties of the revealed L.plantarum strains, so that their own fitness, or their relationship with the Drosophila host, is characterised superficially. Therefore, the authors' discourse can be speculative rather than factual (especially when the authors use the expression "likely" to share their guesses in the "Results" section). Nevertheless, these minor drawbacks do not underscore the novelty of the discovered phenotypes and the importance of their further investigation.
-
Author response:
Public Reviews:
Reviewer #1 (Public review):
Summary:
The factors that create and maintain diversity in host-associated microbiomes remain poorly understood. A better understanding of these factors will help in the efforts to leverage the adaptive potential of the microbiome to help solve pressing problems in health and agriculture.
Experimental evolution provides a promising path forward as we can track the causes and consequences in the emergence of novel variants, but experimental evolution remains underutilized in host-microbiome interactions. Here, Gracia-Alvira utilizes a long-term experimental evolution study in Drosophila simulans under hot and cold temperature regimes to identify strain-level variation in an important fly bacterium, Lactiplantibacillus plantarum. They identify three strains of L. plantarum, which are most prevalent in their respective three temperature regimes, suggesting that these are locally adapted bacteria. Then, using a combination of genomics, in vitro, and in vivo, Gracia-Alvira et al attempt to understand the factors that led to the differentiation of the hot and cold L. plantarum and their impacts on the fly host.
Strengths:
This is an excellent use of experimental evolution to track the emergence of novelty in the microbiome. The genomic analyses are all solid and appropriate for the data sets. It is especially striking that the comparisons with the other, independent experimental evolution studies in different labs (and across continents between Portugal and South Africa) show a consistent response to temperature. Many have disregarded the microbiome as it is something that is too sensitive to seemingly innocuous variables (particularly in the fly microbiome), such that we cannot find generalities. However, this finding highlights the potential for experimental evolution to uncover these dynamics. The question of how strains emerge and are maintained is timely and is one of the key open questions in host-microbiome evolution currently.
Weaknesses:
(1) The framing in the title and throughout the discussion about "subspecies competition" does not match the data that was collected. The subspecies competition requires actually tracking the competitive outcomes between the hot, cold, and unevolved L. plantarum. In the in vivo work, I can see that mixes of the strains were made, but they did not track whether the cold strain outcompeted the hot strain in vivo under cold conditions, for example.
We thank the reviewer for the honest concern and take this opportunity to defend our claim of "subspecies competition used across the manuscript. As the reviewer states, subspecies competition requires tracking the competitive outcomes between the three clades, and this is what we did by sampling and sequencing across ten years of experimental evolution (Figures 4 and S3). For this reason, we point that the subspecies competition assessment comes from the direct observation of changes in relative abundance across the time series, and not from the follow-up experiments in vivo or in vitro.
While Figure 4 is suggestive that there is ongoing competition in the hot temperature regime, this is not necessarily shown in the cold, which is dominated by the C clade. It could also be that the bacteria cannot survive in the flies at the different temperatures. The growth curve assays hint that the bacteria can grow, but the plate reader couldn't actually maintain the 18 {degree sign}C temperature (line 455). So all of this evidence is very indirect and insufficient to say that strain competition is driving these patterns.
We thank the reviewer for the alternative hypothesis that could explain the observed subspecies dynamic. We rule out that dominance of clade C in the cold occurs because the other two clades cannot grow in this regime based on three pieces of evidence:
(1) In the time series, clades H and U decrease, but never disappear (Figures 4 and S3), even showing some peaks of abundance in specific replicate populations (Figure S3).
(2) We isolated individuals belonging to clade H in the cold-evolved populations, as shown in figure 2. This is a direct evidence that clade H prevails in the cold-evolved populations, although in low abundance.
(3) We did grow the three taxa in fly food petri dishes incubated at both temperature regimes, observing growth in all cases.
We will include the food growth experiment in the revised manuscript as further supporting evidence for growth in both regimes.
(2) The in vivo results are interesting in that there appears to be a fitness cost of clade C, but the explanation is underdeveloped. I say under-developed because in Figure 4, the cold L. plantarum remains much higher throughout adaptation to the hot temperature regime than the hot L. plantarum in the cold regime. The hot L. plantarum is low abundance throughout the cold regime. I felt like this observation was not explained, but it seems relevant to understanding the strain dynamics.
We acknowledge that a strong fitness cost of clade C is observed in axenic D. melanogaster. In the native host, D. simulans, with reduced microbiome, we observed delayed development that could even be an advantage depending on the situation, as pointed out by reviewer 3 in the recommendations.
Even if we assume that flies colonized with clade C are less fit in the experimental evolution, another caveat is whether the flies can actively select for the L. plantarum clade. Under this assumption, a clade that imposes a fitness cost to the fly (clade C) should be selected against over time because the flies colonized by this clade will have less offspring, or develop later than the rest. Alternatively, as the microbiome is shared among all the individuals in the population, the host might not be able to “purge” the pernicious clade, and L. plantarum dynamics might be controlled solely by the relative fitness between clades in the given experimental treatment. We will discuss this hypothesis in the revision as a way to explain the relationship between the abundance of each clade and the effect on the host.
I will also note that this is not the first time that L. plantarum or other Lactobacillus have been shown to exert fitness costs to Drosophila. Gould, PNAS, 2018, shows that both Lactobacillus plantarum and Lactobacillus brevis in mono-association have lower fitness (measured through Leslie matrix projections using lifespan and fecundity) than axenic flies. Many studies of wild Drosophila fail to find Lactobacillus, or it is low abundance (e.g., Chandler, PLoS Genetics, 2014; Wang, Environmental Microbiology Reports, 2018; Henry & Ayroles, Molecular Ecology, 2022; Gale, AEM, 2025). This might help provide useful context for the in vivo results.
We thank the reviewer for the references. These observations will be compared to our phenotypic results and discussed in the revised version of the manuscript.
(3) The data in Figure 4 are compelling to focus on the L. plantarum variants. However, I can see from the methods that the competitive mapping included only other strains of Wolbachia.
We appreciate the thorough reading of the methods by the reviewer. The competitive mapping comprised two steps: first we discarded the reads that mapped to Drosophila, Wolbachia and additional potential contaminants from sequencing facitilies (human, dog...). This step leaves the reads originated from whole the external microbiome of the flies, including L. plantarum. The second competitive mapping step recruits the reads that map any clade of L. plantarum.
It is not clear how other members of the microbiome changed in response to the temperature regimes. As I note in point #2, given that Lactobacillus is often rare, it is not clear what the rest of the microbiome looks like over the course of adaptation. Indeed, it seems like Mazzucco & Schlotterer, PRSB, 2021 did a broader analysis of the microbiome and found that Acetobacter is by far the most common bacterium (I think this data is also part of the data shown here?). Expanding on why or why not in this context is important and will improve this study, particularly if the focus is on connecting these evolutionary dynamics to ecological competition to explain the emergence of strain diversity.
We acknowledge that the rest of the Drosophila microbiome is not addressed in this study, as we wanted to focus the storyline around the intraspecific dynamics found in L. plantarum. We consider that a complete characterization of the whole Drosophila microbiome would unnecessarily elongate the paper and thus we treat it as a constant biotic factor.
We must point out that our dataset is not the one reported by Mazzucco & Schlötterer, which was done in D. melanogaster, rather than D. simulans. Nevertheless, both experiments share the same infrastructure, temperature regimes and fly maintenance.
We will include a list of taxa that were isolated from the populations, as well as to report L. plantarum prevalence and abundance across the experiment in order to provide context of the microbiome, beyond L. plantarum, to the readership.
Reviewer #2 (Public review):
Summary:
In this manuscript, Gracia-Alvira et al. investigated how environmental temperature affects competition among members of the microbiome, with a focus on intraspecific diversity, using the Drosophila model. Notably, the authors identified three clades of Lactiplantibacillus plantarum from a natural population of Drosophila simulans collected in Florida. They tracked the dynamics of these three bacterial clades under two temperature conditions over the course of more than ten years. Using comparative genomics and phylogeny, they showed that these three bacterial clades likely adapted to their host independently in a temperature-specific manner. Further, by combining in vitro culture and in vivo mono-association assays, they demonstrated the functional divergence of these three bacterial clades phenotypically, including their growth dynamics and effects on host fitness. Lastly, they performed pathway analysis and speculated on key genomic variance supporting such functional divergence.
Strengths:
The laboratory evolutionary experiment in response to cold or hot environmental temperature is impressive, given its more than ten years of experimental time period. This collection of achieved microbiome samples paired with the fly host data can be a valuable resource for the field.
Weaknesses:
The laboratory evolutionary experiment can be limited due to its artificial experimental setup. For example, wild flies rely on a more diverse set of food sources and are constantly exposed to new bacterial inoculations, whereas under laboratory conditions, flies live in a more restricted ecosystem. In addition, environmental temperatures differ among different locations, but they also involve seasonal changes within the same region. This manuscript can be strengthened with further discussions that elaborate on these limitations.
As the reviewer has correctly noted, our experimental setting is not exempt from limitations. Lab-reared flies are fed with a defined standard diet. Furthermore, although the system is not completely close to bacterial migration, this is limited as replicate populations are not allowed to mix during the maintenance of the flies. For this reason, we consider our laboratory setting as a compromise between observing wild populations, which undergo all biotic and abiotic stresses but cannot be manipulated, and evolving the bacteria in absence of the host, or in gnobiotic hosts, in which biotic interactions are not fully considered. We will extend on this in the new version of the manuscript.
Moreover, the extent of host effects involved in these experiments remains ambiguous, because it is unclear whether these Lactiplantibacillus plantarum mostly reside within fly guts or on Drosophila medium. The laboratory evolutionary experiment possibly favored better colonizers on Drosophila medium under either cold or hot temperatures, which subsequently can saturate fly guts. As fully dissociating these variables can be experimentally tedious, the authors may want to comment more on these aspects in the discussion. Or they may want to consider some measurements. For example, measuring the growth rate of these bacteria on Drosophila medium under different temperatures, in addition to the current MRS culture experiments, or measuring the portion of the Lactiplantibacillus on Drosophila medium versus these stably colonizing fly guts.
The reviewer's point was briefly addressed in the Results chapter: "Phenotypic differences in liquid culture".
Reviewer #3 (Public review):
Summary:
The study presents an analysis of 297 pangenomes derived from 20 populations of Drosophila simulans, at 19 time points for fast-reproducing individuals in a hot environment, or at 10 time points for slow-reproducing individuals in a cold environment, over a period of more than 10 years. The authors select a particular microbial component of the pangenomes and study the dynamics of Lactiplantibacillus plantarum strains in two environments. They discover that the revealed operational taxonomic units could be divided into three phylogenetic clades, which have their own genomic and genetic features, different adaptive capabilities that depend on the environment, and have a distinct impact on the fitness of the host.
Strengths:
The authors prove that bacterial microbiome components are sensitive to the environment and could rapidly (years) be fixed in eukaryotic populations. This study establishes a tractable model that potentially enables the study of variability of the physiological influence of distinct strains of an important commensal species, Lactiplantibacillus plantarum, on the Drsosophila host. It is clearly shown that this single species consists of several phylogenetically and functionally diverse strains. The authors did not limit their interest to their own model, but rather they have integrated a comparative approach by analysing phylogenetic relationships among 92 described L.plantarum strains.
Overall, the study is novel and delivers important discoveries of a longitudinal, well-replicated experiment, generating a substantial amount of genomic data. It highlights an important dimension of research that environmental selection operates at the subspecies level.
Weaknesses:
Even though the authors show only one particular example by conducting their longitudinal experiment, they honestly acknowledge failures important for interpretation of the biological significance of the results (gnotobiotic mono-association experiments was done with D.melanogaster, but not D. simulans) and therefore they state limitations of their conclusions (weaker effects in the non-axenic flies are due to the presence of other taxa or to higher-order interactions with other members of the microbiome). These interactions could significantly affect bacterial growth, metabolism, and physiological influence on the host.
We agree with the reviewer in that the use gnobiotic animals is a limitation, as by "tuning" the flies' microbiome we are modifying the interactions between members, which can potentially change the phenotypic outcome. Nevertheless, we use it as a complementary approach, rather than the only inference in our study.
The authors exploit the results of their experiment to speculate about a wide range of evolutionary phenomena, like within-species competition, ecological adaptation and evolution of the host, fitness advantage of bacteria to the host, the benefits of parasitism or mutualism, the domestication of the microbiome, etc. At the end, they conclude that their study "highlights that even subspecies diversity plays a key role in adaptation to environmental temperature". However, the potential mechanisms of such adaptation are barely discussed, so that the focus of the study shifts from the temperature-induced changes in microbial population structures toward metabolism-related adaptations of clade representatives that enable them to diversify their carbon and nitrogen sources. The role of the temperature factor remains elusive.
We acknowledge that our study does not fully resolve the mechanism by which a different clade ends up dominating each temperature regime. The MRS liquid experiment was an attempt to answer whether differences in optimal growth temperature could explain the temperature-specific abundance of the two clades. Our experiments showed, however, thatthis was not the case. Beyond this point, it is hard to disentangle the role of the temperature, as it could also act indirectly on the bacteria, for example, through the host or the food.
A second observation in our time series was that a third clade, U, was unfit in both regimes despite starting the experiment in high abundance. For this reason we also studied what made this clade less fit. Based on our analyses, we propose that the decrease of clade U was driven by the shift to a laboratory diet, shared by all experimental populations.
In addition to that, the paper has a clearly minimalistic experimental approach to address functional properties of the revealed L.plantarum strains, so that their own fitness, or their relationship with the Drosophila host, is characterised superficially. Therefore, the authors' discourse can be speculative rather than factual (especially when the authors use the expression "likely" to share their guesses in the "Results" section). Nevertheless, these minor drawbacks do not underscore the novelty of the discovered phenotypes and the importance of their further investigation.
We consider the reviewer's concern and will tone down the phrasing when reporting our findings in the revised version of the manuscript.
-
-
www.biorxiv.org www.biorxiv.org
-
eLife Assessment
This important work demonstrates the role of physically linking the core and CTD kinase modules of TFIIH via separate domains of subunit Tfb3 in confining RNA Polymerase II Serine 5 CTD phosphorylation to promoter regions of transcribed genes in budding yeast. The main findings, resulting from analyses of viable Tfb3 mutants in which the linkage between TFIIH core and kinase modules has been severed, are supported by solid evidence from in vitro and in vivo experiments. The new findings raise the intriguing possibility that the Tfb3-mediated connection between core and kinase modules of TFIIH is an evolutionary addition to an ancestral state of physically unconnected enzymes.
-
Reviewer #1 (Public review):
Giordano et al. demonstrate that yeast cells expressing separated N- and C-terminal regions of Tfb3 are viable and grow well. Using this creative and powerful tool, the authors effectively uncouple CTD Ser5 phosphorylation at promoters and assess its impact on transcription. This strategy is complementary to previous approaches, such as Kin28 depletion or the use of CDK7 inhibitors. The results are largely consistent with earlier studies, reinforcing the importance of the Tfb3 linkage in mediating CTD Ser5 phosphorylation at promoters and subsequent transcription.
Notably, the authors also observe effects attributable to the Tfb3 linker itself, beyond its role as a simple physical connection between the N- and C-terminal domains. These findings provide functional insight into the Tfb3 linker, which had previously been observed in structural studies but lacked clear functional relevance. Overall, I am very positive about the publication of this manuscript and offer a few minor comments below that may help to further strengthen the study.
Page 4 PIC structures show the linker emerging from the N-terminal domain as a long alpha-helix running along the interface between the two ATPase subunits, followed by a turn and a short stretch of helix just N-terminal to a disordered region that connects to the C-terminal region (see schematic in Fig. 1A).
The linker helix was only observed in the poised PIC (Abril-Garrido et al., 2023), not other fully-engaged PIC structures.
Page 8 Recent structures (reviewed in (Yu et al., 2023)) show that the Kinase Module would block interactions between the Core Module and other NER factors. Therefore, TFIIH either enters into the NER complex as free Core Module, or the Kinase Module must dissociate soon after.
To my knowledge, this is still controversial in the NER field. I note the potential function on the kinase module is likely attributed to the N-terminal region of Tfb3 through its binding to Rad3. Because the yeast strains used in Fig. 6 retain the N-terminal region of Tfb3, the UV sensitivity assay presented here is unlikely to directly address the contribution of the kinase module to NER.
Page 11. Notably, release of the Tfb3 Linker contact also results in the long alpha-helix becoming disordered (Abril-Garrido et al., 2023), which could allow the kinase access to a far larger radius of area. This flexibility could help the kinase reach both proximal and distal repeats within the CTD, which can theoretically extend quite far from the RNApII body.
Although the kinase module was resolved at low resolution in all PIC-Mediator structures, these structural studies consistently reveal the same overall positioning of the kinase module on Mediator, indicating that its localization is constrained rather than variable. This observation suggests that the linker region may help position the kinase module at this specific site, likely through direct interactions with the PIC or Mediator. This idea is further supported by numerous cross-links between the linker region and Mediator (Robinson et al., 2016).
Comments on revisions:
Revised ms clarified all my points, including those I previously misunderstood.
-
Reviewer #2 (Public review):
Summary:
This work advances our understanding of how TFIIH coordinates DNA melting and CTD phosphorylation during transcription initiation. The finding that untethered kinase activity becomes "unfocused," phosphorylating the CTD at ser5 throughout the coding sequence rather than being promoter-restricted, suggests that the TFIIH Core-Kinase linkage not only targets the kinase to promoters but also constrains its activity in a spatial and temporal manner.
Strengths:
The experiments presented are straightforward and the model for coupling initiation and CTD phosphorylation and for evolution of these linked processes are interesting and novel. The results have important implications for the regulation of initiation and CTD phosphorylation.
Comments on revisions:
The revised version with revisions to figures, text and new data has addressed all of our prior comments.
-
Reviewer #3 (Public review):
Summary:
Eukaryotic gene transcription requires a large assemblage of protein complexes that govern the molecular events required for RNA Polymerase II to produce mRNAs. One of these complexes, TFIIH, comprises two modules, one of which promotes DNA unwinding at promoters, while the other contains a kinase (Kin28 in yeast) that phosphorylates the repeated motif at the C-terminal domain (CTD) of the largest subunit of Pol II. Kin28 phosphorylation of Ser5 in the YSPTSPS motif of the CTD is normally highly localized at promoter regions, and marks the beginning of a cycle of phosphorylation events and accompanying protein association with the CTD during the transition from initiation to elongation.
The two modules of TFIIH are linked by Tfb3. Tfb3 consists of two globular regions, an N-terminal domain that contacts the Core module of TFIIH and a C-terminal domain that contacts the kinase module, connected by a linker. In this paper, Giordano et al. test the role of Tfb3 as a connector between the two modules of TFIIH in yeast. They show that while no or very slow growth occurs if only the C-terminal or N-terminal region of Tfb3 is present, near normal growth is observed when the two unlinked regions are expressed. Consistent with this result, the separate domains are shown to interact with the two distinct TFIIH modules. ChIP experiments show that the Core module of TFIIH maintains its localization at gene promoters when the Tfb3 domains are separated, while localization of the kinase module, and of Ser5 phosphorylation on the CTD of Pol II, is disrupted. Finally, the authors examine the effect of separating the Tfb3 domains on another function of TFIIH, namely nucleotide excision repair, and find little or no effect when only the N-terminal region of Tfb3 or the two unlinked domains are present.
Strengths:
Experiments involving expression of Tfb3 domains in yeast are well-controlled and the data regarding viability, interaction of the separate Tfb3 domains with TFIIH modules, genome-wide localization of the TFIIH modules and of phosphorylated Ser5 CTDs, and of effects on NER, are convincing. The experiments are consistent with current models of TFIIH structure and function and support a model in which Tfb3 tethers the kinase module of TFIIH close to initiation sites to prevent its promiscuous action on elongating Pol II.
Weaknesses:
The work is limited in scope and does not provide major insights into the mechanism of transcription. The main addition to current models of transcription is that tethering of Kin28 to Tfb3 may limit kinase action from occurring downstream from the initiation site.
The first described experiment, which purports to show that three kinases cannot function in place of Kin28 when tethered (by fusion) to Tfb3 is missing the crucial control of showing that Kin28 can support viability in the same context. This result also does not connect with the rest of the manuscript, although the experiment apparently motivated the subsequent studies reported here.
Finally, the authors present the interesting and reasonable speculation that the TFIIH complex and connecting Tfb3 found in mammals and yeast may have evolved from an earlier state in which the two TFIIH subdomains were present as unconnected, distinct enzymes. It will be interesting to have this idea tested more thoroughly as more molecular evolutionary data becomes available.
Comments on revisions:
For the most part, the authors have satisfactorily addressed my previous critique. In particular, they have added to their discussion of evolutionary implications, and performed an experiment casting doubt on the assertion of a dominant negative effect, and as a consequence removed this claim from the manuscript. I also pointed out that the fusion experiments that lead off the Results section are missing the crucial control of including a Tfb3-Kin28 fusion. The authors have elected not to perform this control experiment, pointing out that even this control would be imperfect in some respects, and agreeing that this experiment is somewhat disconnected from the rest of the paper. The reason for including it, in spite of its somewhat tangential nature, is that it provides something of a rationale for the experiments that follow. I don't so much mind their retaining the experiment, as the absence of this control (and indeed, the results) does not so much impact the later results. However, I think if it is to be included, this shortcoming should be explicitly recognized, especially as a service to younger scientists who could benefit from an exposition that includes a thorough consideration of potential control experiments.
-
Author response:
The following is the authors’ response to the original reviews.
Public Reviews:
Reviewer #1 (Public review):
Giordano et al. demonstrate that yeast cells expressing separated N- and C-terminal regions of Tfb3 are viable and grow well. Using this creative and powerful tool, the authors effectively uncouple CTD Ser5 phosphorylation at promoters and assess its impact on transcription. This strategy is complementary to previous approaches, such as Kin28 depletion or the use of CDK7 inhibitors. The results are largely consistent with earlier studies, reinforcing the importance of the Tfb3 linkage in mediating CTD Ser5 phosphorylation at promoters and subsequent transcription.
Notably, the authors also observe effects attributable to the Tfb3 linker itself, beyond its role as a simple physical connection between the N- and C-terminal domains. These findings provide functional insight into the Tfb3 linker, which had previously been observed in structural studies but lacked clear functional relevance. Overall, I am very positive about this manuscript and offer a few minor comments below that may help to further strengthen the study.
We appreciate the reviewer’s positive assessment of our work and suggestions for improvement.
(1) Page 4
PIC structures show the linker emerging from the N-terminal domain as a long alpha-helix running along the interface between the two ATPase subunits, followed by a turn and a short stretch of helix just N-terminal to a disordered region that connects to the C-terminal region (see schematic in Figure 1A).
The linker helix was only observed in the poised PIC (Abril-Garrido et al., 2023), not in other fully-engaged PIC structures.
Thanks for clarifying. We note that some structures of TFIIH alone also see the long helix. Accordingly, we modified this section to read:
“In many TFIIH and PIC structures the linker is not visible, presumably due to flexibility. However, when it is seen (Abril-Garrido et al., 2023; Greber et al., 2019), the linker emerges from the N-terminal domain as a long alpha-helix running along the interface between the two ATPase subunits…”
(2) Page 8
Recent structures (reviewed in (Yu et al., 2023)) show that the Kinase Module would block interactions between the Core Module and other NER factors. Therefore, TFIIH either enters into the NER complex as the free Core Module, or the Kinase Module must dissociate soon after.
To my knowledge, this is still controversial in the NER field. I note the potential function of the kinase module is likely attributed to the N-terminal region of Tfb3 through its binding to Rad3.
We are not experts on NER, but in reviews of the field this appears to be a widely held assumption. A 2008 paper from the Egly lab (Coin et al., DOI 10.1016/j.molcel.2008.04.024) is usually cited, which shows that the interaction between XPD (metazoan Rad3) and XPA is likely incompatible with XPD-MAT1 interaction. In addition to the Yu 2023 review, we now also cite a more recent publication that more extensively reviews the models for core TFIIH interactions (van Sluis et al, 2025). We looked at the multiple recently published structures of various TCR-NER and GG-NER intermediate complexes, and none of them show the CAK module or even the Tfb3/Mat1 N-term, even though those proteins were typically included during assembly. We also consulted with our colleagues Johannes Walter and Lucas Farnung, who are studying various TC-NER intermediates biochemically and structurally. Although the CAK module is included in their assembly reactions, it is not visible in their cryoEM structures. They tell me that the presence of CAK would be compatible with early TC-NER intermediates, but is predicted to overlap with later interactions of XPD with the TC-NER factor STK19 (see Mevissen et al., Cell 2024). To be conservative, we modified the sentence to say “Recent structures … suggest” rather than “show”.
Because the yeast strains used in Figure 6 retain the N-terminal region of Tfb3, the UV sensitivity assay presented here is unlikely to directly address the contribution of the kinase module to NER.
We agree that our experiment only shows that the connection between Tfb3 N- and C-term domains is not necessary for NER. The individual domains might still be able to function independently. Accordingly, we changed the heading of that section from “Disconnected core TFIIH does not cause an NER defect” to “Split Tfb3 does not cause an NER defect.” This more closely matches the figure legend title.
(3) Page 11
Notably, release of the Tfb3 Linker contact also results in the long alpha-helix becoming disordered (Abril-Garrido et al., 2023), which could allow the kinase access to a far larger radius of area. This flexibility could help the kinase reach both proximal and distal repeats within the CTD, which can theoretically extend quite far from the RNApII body.
Although the kinase module was resolved at low resolution in all PIC-Mediator structures, these structural studies consistently reveal the same overall positioning of the kinase module on Mediator, indicating that its localization is constrained rather than variable. This observation suggests that the linker region may help position the kinase module at this specific site, likely through direct interactions with the PIC or Mediator. This idea is further supported by numerous cross-links between the linker region and Mediator (Robinson et al., 2016).
That is true. But please note that this sentence was meant to describe movement of the kinase module AFTER release from Mediator (see previous sentence). Re-reading the passage, we realized the confusion is because we propose multiple possible pathways in that paragraph. In the first half, we suggest the capture of the kinase module by Mediator might trigger the conformation changes in the linker. In the second half (where it says “Alternatively….”) we suggest the Mediator-CAK interaction could instead come first, and the release of this contact could free the CAK module to move around. We have modified the paragraph to make it clear these are two different distinct models.
Reviewer #2 (Public review):
Summary:
This work advances our understanding of how TFIIH coordinates DNA melting and CTD phosphorylation during transcription initiation. The finding that untethered kinase activity becomes "unfocused," phosphorylating the CTD at ser5 throughout the coding sequence rather than being promoter-restricted, suggests that the TFIIH Core-Kinase linkage not only targets the kinase to promoters but also constrains its activity in a spatial and temporal manner.
Strengths:
The experiments presented are straightforward, and the models for coupling initiation and CTD phosphorylation and for the evolution of these linked processes are interesting and novel. The results have important implications for the regulation of initiation and CTD phosphorylation.
Weaknesses:
Additional data that should be easily obtainable and analysis of existing data would enable an additional test of the models presented and extract additional mechanistic insights.
We thank the reviewer for the positive assessment and address their specific suggestions below.
Reviewer #3 (Public review):
Summary:
Eukaryotic gene transcription requires a large assemblage of protein complexes that govern the molecular events required for RNA Polymerase II to produce mRNAs. One of these complexes, TFIIH, comprises two modules, one of which promotes DNA unwinding at promoters, while the other contains a kinase (Kin28 in yeast) that phosphorylates the repeated motif at the C-terminal domain (CTD) of the largest subunit of Pol II. Kin28 phosphorylation of Ser5 in the YSPTSPS motif of the CTD is normally highly localized at promoter regions, and marks the beginning of a cycle of phosphorylation events and accompanying protein association with the CTD during the transition from initiation to elongation.
The two modules of TFIIH are linked by Tfb3. Tfb3 consists of two globular regions, an N-terminal domain that contacts the Core module of TFIIH and a C-terminal domain that contacts the kinase module, connected by a linker. In this paper, Giordano et al. test the role of Tfb3 as a connector between the two modules of TFIIH in yeast. They show that while no or very slow growth occurs if only the C-terminal or N-terminal region of Tfb3 is present, near normal growth is observed when the two unlinked regions are expressed. Consistent with this result, the separate domains are shown to interact with the two distinct TFIIH modules. ChIP experiments show that the Core module of TFIIH maintains its localization at gene promoters when the Tfb3 domains are separated, while localization of the kinase module and of Ser5 phosphorylation on the CTD of Pol II is disrupted. Finally, the authors examine the effect of separating the Tfb3 domains on another function of TFIIH, namely nucleotide excision repair, and find little or no effect when only the N-terminal region of Tfb3 or the two unlinked domains are present.
Strengths:
Experiments involving expression of Tfb3 domains in yeast are well-controlled, and the data regarding viability, interaction of the separate Tfb3 domains with TFIIH modules, genome-wide localization of the TFIIH modules and of phosphorylated Ser5 CTDs, and of effects on NER, are convincing. The experiments are consistent with current models of TFIIH structure and function and support a model in which Tfb3 tethers the kinase module of TFIIH close to initiation sites to prevent its promiscuous action on elongating Pol II.
We appreciate that the reviewer finds that our main conclusions are convincing.
Weaknesses:
(1) The work is limited in scope and does not provide any major insights into the mechanism of transcription. One indication of this limitation is that in the Discussion, published structural and functional results on transcription are used to support the interpretations of the results here more than current results inform previous models or findings.
The story we present here is pretty simple, so in that sense we agree it is limited. However, we believe the findings do have mechanistic implications. That the Tfb3/Mat1 tether not only targets kinase activity to the 5’ end, but also somehow limits it from acting downstream seems significant. As for the Discussion, in our papers we always attempt to tie in our results and models with as much of the relevant published literature as possible. We believe this is more interesting, useful, and convincing than simply summarizing the Results section.
(2) The first described experiment, which purports to show that three kinases cannot function in place of Kin28 when tethered (by fusion) to Tfb3, is missing the crucial control of showing that Kin28 can support viability in the same context. This result also does not connect with the rest of the manuscript.
Our original motivation for the experiment in Figure 1 was to develop a system where we could plug different kinases into the CTD-proximal position. This didn’t work, so it is true that this negative result is somewhat unconnected to the rest of the paper. We choose to include it because it produced the unexpected observation that the Tfb3 C-term domain was not essential for viability, contradicting an earlier report. As for the suggested control of fusing Kin28, please see our reply to the editor’s comments below.
(3) Finally, the authors present the interesting and reasonable speculation that the TFIIH complex and connecting Tfb3 found in mammals and yeast may have evolved from an earlier state in which the two TFIIH subdomains were present as unconnected, distinct enzymes. This idea is supported by a single example from the literature (T. brucei). A more thorough evolutionary analysis could have tested this idea more rigorously.
Please see our full reply to Point 5 in the editor’s comments. In short, T. brucei was the only primitive eukaryote for which h we found an actual biochemical analysis of TFIIH. However, we now cite some papers reporting protein sequence comparisons for organisms not having a consensus CTD, which lend further support to our idea of fusion of a CDK to TFIIH co-evolved with the CTD during very early in eukaryotic evolution.
Recommendations for the authors:
Reviewing Editor Comments:
Suggestions for Improvement:
(1) Analyze existing Pol II ChIP-seq data to determine whether reduced TSS-proximal vs. gene-body occupancy observed with the split Tfb3 alleles reflects initiation defects, and whether different gene classes (high vs. low expression, stress-induced genes) show differential effects of splitting Tfb3.
Thanks for the suggestion. The new analysis is included as Supplemental Figure S6. Several factors indicate an initiation defect rather than an elongation defect (either elongation processivity or elongation rate). First, the shape of the RNApII occupancy trace is flat in all mutants, arguing against a processivity defect, which would have led to a downward slope due to RNApII progressively dropping off from the gene. Because this effect is best seen on long genes (more than 2kb), we generated metagene profiles on long, well-expressed genes only, which led to the same conclusion (see Sup Fig 6A). Second, the mutants lead to decreased RNApII occupancy, arguing against a strong decrease in elongation rate, which -if anything- would have led to an increase in RNApII during early transcription. While we cannot completely exclude the possibility of a mild decrease in elongation rate, such an effect doesn’t fit the patterns we observe. The overall decrease of RNApII occupancy is rather a strong indication of a decrease in early steps (PIC assembly or initiation).
As requested, we looked at potential differences between gene classes two ways. First, we generated RNApII metagenes on RNApII occupancy quintiles (Q1-Q5). As shown in Sup Fig 6B, RNApII occupancy is similarly decreased in all mutants for all quintiles, demonstrating that the effect of Tfb3 splitting on transcription is not linked to expression level. Second, we generated RNApII occupancy metagenes for TFIID-regulated genes and coactivator redundant (CR) genes. This classification from the Hahn lab (doi:10.7554/eLife.50109) is very similar to the one developed by the Pugh lab (doi:10.1016/s1097-2765(04)00087-5). TFIID-regulated genes are enriched for housekeeping genes and are typically devoid of a TATA box, while the CR genes tend to be highly regulated and to contain a TATA box. As shown in Sup Fig 6C, the effect of the Tfb3 split mutants is similar on both gene classes.
(2) Determine whether Kin28 abundance in whole cell extracts is reduced by splitting Tfb3, as a factor in reducing its occupancies at gene promoters.
We actually did test for Kin28 and Ccl1 levels in the extracts when we did the IP experiment shown in Fig 3. We ran the extracts next to the precipitated factors. Unfortunately, as can be seen on the bottom blot, our antibodies were not strong enough to detect either Kin28 or Ccl1 in extracts, even with WT Tfb3. Although we don’t include this inconclusive result in the final paper, we show it in Author response image 1 (note that extracts are labeled as “IgG input”).
Author response image 1.
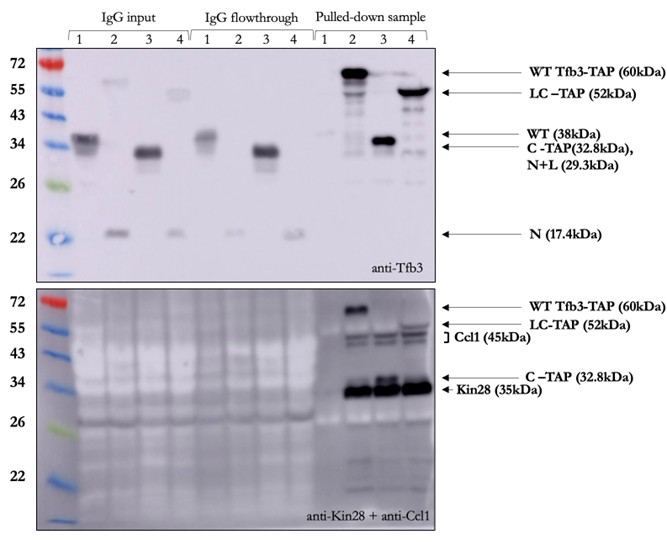
(3) Include the key positive control construct of replacing the C-term of Tfb3 with Kin28 in the experiments of Figure 1.
We elected not to do this experiment for several reasons. As reviewer 3 points out, this kinase fusion experiment turned out to be somewhat disconnected from the rest of the paper. Even though it didn’t work, we included it in the paper because the results led us to the realization that the Tfb3 C-term was actually not fully essential for viability as reported, which in turn led us to the idea of splitting Tfb3. Structural studies (https://doi.org/10.1126/sciadv.abd4420, https://doi.org/10.1073/pnas.2009627117, https://doi.org/10.7554/eLife.44771) show that, in addition to providing linkage to the core module, the C-term of Tfb3 induces a conformation change in Kin28/Cdk7 necessary for full kinase activity (which is likely why the strains without C-term are just barely viable). If we were to pursue why the fusions didn’t work, we could tether Kin28 directly to the Tfb3 linker (and may try this in the future), but then would need to also express the C-term separately for its activating function. Even then, this would be an imperfect control for the fusion experiments in Figure 1. Because were trying to best mimic Kin28 being tethered via the accessory subunit Tfb3/Mat1, in the Figure 1 experiment we did not directly attach the kinases to Tfb3. For Ctk1/Cdk12, we fused the Tfb3 linker to the Ctk3 accessory subunit (analogous to Tfb3), and for Bur1/Cdk9, we fused to the cyclin subunit Bur2 (there is no known third subunit in this complex). The one exception was Mpk1, which has no partner subunits and is not a CDK. There are many reasons why this high-risk protein fusion experiment may not have worked, but we feel it’s not that useful to pursue it in this paper.
(4) Provide direct evidence for the claimed dominant negative effect of the N-term-Linker construct by extending results in Figure 2C to compare growth of WT TFB3 cells expressing this construct vs. vector alone.
We thank the reviewers for this suggestion. We tested this by transforming high copy plasmids expressing the different Tfb3 truncations into cells expressing the WT Tfb3. We did not see a clear dominant negative effect (some colonies were small, but many looked normal). Accordingly, in the absence of a reproducible effect, we removed this claim from the paper. In Fig 2C, the WT plasmid was transformed into cells already expressing the truncation on a high copy plasmid (the opposite order of our new experiment). It’s possible that phenotypes vary depending on which plasmid was there first (2 micron plasmids have variable copy number and can compete with each other for replication and passage during cell division). In any case, in the face of ambiguous results we no longer claim a dominant negative effect of the N-term-Linker protein. This was a minor side-point of the paper and does not affect any of our other conclusions.
(5) Expand the evolutionary analysis to provide evidence beyond the case of T. brucei that the Tfb3-mediated connection between core and kinase modules is an evolutionary addition to the ancestral state.
We note that the two papers we cited for the lack of a CAK module in T. brucei reached that conclusion based on purification of its TFIIH complex. We were unable to find similar biochemical studies in other primitive eukaryotes. Another way to expand the evolutionary comparison would be through sequence homology searches. We attempted to do this using various tools available at NCBI and EMBL. These show that Tfb3/Mat1 is found extensively throughout eukaryotes. Unfortunately, because the NTD of Tfb3 is a RING domain, homology searches in primitive eukaryotes yield a number of weak matches in the zinc binding motif, but no way of knowing if any of these are related to TFIIH. Similarly, searches with Cdk7/Kin28 or Cyclin H/Ccl1 pulls up all CDKs and cyclins, with roughly equal statistical similarity to the yeast kinase/cyclin. Someone with more experience with evolutionary analysis would likely have better luck, but our efforts were inconclusive. However, we did find two papers from Guo and Stiller (2004 and 2005) that analyzed genome sequences available at the time and reached the conclusion that both concensus CTD and the CAK module are absent in the evolutionary branch of primitive eukaryotes that contains T. brucei and Giardia lamblia. We also found papers identifying a putative Mat1/Tfb3 in Plasmodium falciparum, although this protein was not yet shown to be associated with TFIIH. We now cite these papers in the discussion of our evolutionary hypothesis.
(6) Include Western blot analysis of the Tfb3 chimeras and truncations analyzed in Figures 1-2 to determine if poor expression contributes to any of the poor-growth phenotypes.
The western blot of the Tfb3 fusions used in Figure 1 is shown in Sup Fig 1. The Tfb3 truncations are shown in the Input panel of Fig 3A (although some of these are TAP fusions, the growth phenotypes did not change with TAP-tagging). In general, all the fusions and truncations are detectable but possibly reduced relative to WT Tfb3. Note that the anti-Tfb3 antibody is a polyclonal made against recombinant Tfb3, and we don’t know that the reactive epitopes are distributed equally throughout the protein, so it’s difficult to be confident about relative quantitation with partial Tfb3 proteins.
(7) Provide direct evidence that the N-terminal Tfb3 segment interacts exclusively with the core TFIIH module and not Kin28, analogous to the opposite results shown in Figure 3B and 4A-B for the C-terminal domain.
This could be interesting, but we elected not do this experiment due to time and manpower limitations. Since the N-term is unambiguously essential for viability, we can assume it retains at least some interactions with core TFIIH (unless the N-term has some other essential function that hasn’t been discovered).
(8) Confirm that the Ser5P phosphorylation levels given by the different Tfb3-TAP immune complexes are all much higher than the background level observed with control complexes prepared with extracts expressing WT, untagged Tfb3.
We should have done this control in Sup Fig 2B, especially since we did pull down the beads from the untagged strain as shown in panel A. We haven’t seen appreciable kinase activity when we’ve done this control in the past, so we feel confident the signals seen are not background. Therefore, we elected not to repeat this experiment.
(9) Conduct an in vitro reconstitution comparing the activity of free kinase module and intact TFIIH on elongating RNA polymerase II in directing promoter-localized vs. downstream Ser5P accumulation.
This would be a nice experiment, but would require a substantial amount of work that is beyond our resources at the time.
(10) Revise the text to better emphasize any novel mechanistic insights afforded by the work and address all other minor comments/criticisms.
Done, as addressed in all the other comment replies.
Reviewer #2 (Recommendations for the authors):
(1) The authors suggest that their results support model 3, in which intact TFIIH restrains kinase activity outside the PIC. Directly testing this model would be a significant addition and would strengthen the proposed mechanism. An in vitro reconstitution comparing the activity of the free kinase module and intact TFIIH on elongating RNA polymerase II (or, at a minimum, purified Pol II) would directly test the mechanism underlying downstream Ser5P accumulation.
Sup Fig 2 addresses this point to some extent, since we the TAP pull-down of full-length Tfb3 precipitates at least some intact TFIIH, whereas the split C-term TAP constructs do not (as shown in Fig 4). However, this is not a very quantitative assay and we agree with the reviewer that a careful reconstitution, especially in the context of real transcription, would be far better. Unfortunately, this is currently beyond our capabilities. However, in the Discussion we do cite some published data arguing that association of the core TFIIH does have some inhibitory effect on the kinase module. First, in our 2002 MCB paper (Keogh et al., see Fig 7) using a GST-CTD kinase assay, we found that free kinase module (called TFIIK there) was strongly active even with a non-phosphorylatable mutation in the activating T-loop. In contrast, the same mutation inactivated CTD kinase activity in the intact TFIIH. Similarly, the Taatjes lab (Rimel et al., Genes Dev. 2020) found that free CAK was active on multiple substrates that were not phosphorylated by the full TFIIH complex.
(2) Experiments from Carl Wu's laboratory (Nguyen et al., 2021) showed that there is a significant amount of apparently free Kin28 as well as free TFIIH in cells. Please reference and comment on this when discussing the model, suggesting that TFIIH is mostly sequestered at promoters.
Good point. We added this to the discussion where we discuss the arguments against a sequestering model.
(3) The existing ChIP-seq data could be analyzed more thoroughly to extract additional mechanistic insights. Specifically: (i) quantify TSS-proximal vs. gene body Pol II to determine if reduced occupancy reflects initiation defects (ii) analyze whether gene classes (high vs. low expression, stress-induced genes) show differential effects.
Thanks for the suggestion. We did this and show the results as a new Supplemental Figure 6. No differences were found. Please see our response to the Editor’s comment #1 for a fuller description.
(4) The complete loss of Kin28 ChIP signal in mutant strains (Figure 5B) could reflect kinase mislocalization or reduced protein abundance. Figure 3B examines TAP-purified material but does not address total cellular protein levels. Examining whole-cell extracts for Kin28 and Ccl1 in all strains would strengthen the interpretation of the ChIP results.
As described in our response to Point 2 in the Editor’s comments section, we did do this control. Unfortunately, the Kin28 and Ccl1 antibodies were not strong enough to detect these proteins in extracts before precipitation.
Reviewer #3 (Recommendations for the authors):
(1) The experiment of Figure 1 should be repeated with a Tfb3-Kin28 positive control or dropped from the manuscript.
This could be an interesting experiment, but please see our response to Editor comment #3 for why we decided to keep the figure as is.
(2) Figure 2C legend doesn't mention linker C-term low copy construct.
Thanks for catching that error. It is now fixed.
(3) The claim that the N-term linker has a dominant negative effect (Figure 2C) requires direct comparison (growth on the same plate) of TFB3+ cells with and without expression of the N-term linker.
As detailed in the response to the Editor’s comment #4, we did this test. The results did not support a dominant negative phenotype, so we removed this claim. Thanks for helping us avoid a mistake.
(4) Page 7, "Supplementary Fig. S4A, B, promoters in green boxes" should read "Supplementary Fig. S5A, B, promoters in green boxes".
Thanks for catching that error. It is now fixed.
(5) Readers might be concerned that the ChIP-seq signal observed in Figure 5 and S5 could reflect an artifactual signal over highly transcribed regions. The different distributions of Rpb1, Ser5p, and Ser2p argue against this. This might be worth mentioning in the text.
Thanks for raising this issue. “Hyper-ChIPpable” genes can be a problem in metagene analysis. We now include the analysis suggested by Reviewer 2 where we separately look at genes with different transcription frequencies. Seeing the same relative patterns regardless of expression level makes us confident that the results are not artifactual.
(6) p. 12, "the Tfb3 the linker"; "In contrast, The N-term linker"; "suggest" should be "suggests"
We appreciate the reviewer’s careful reading of the manuscript and have corrected these typos.
-
-
insight.jci.org insight.jci.org
-
The Jackson Laboratory (stock 002726
DOI: 10.1172/jci.insight.197475
Resource: (IMSR Cat# JAX_002726,RRID:IMSR_JAX:002726)
Curator: @areedewitt04
SciCrunch record: RRID:IMSR_JAX:002726
Tags
Annotators
URL
-
-
pmc.ncbi.nlm.nih.gov pmc.ncbi.nlm.nih.gov
-
The Canton‐S stock and lines from the DGRP were purchased from the Bloomington Drosophila Stock Center
DOI: 10.1111/acel.14292
Resource: Bloomington Drosophila Stock Center (RRID:SCR_006457)
Curator: @maulamb
SciCrunch record: RRID:SCR_006457
Tags
Annotators
URL
-
-
www.sciencedirect.com www.sciencedirect.com
-
The Jackson LaboratoryStock No: 027894
DOI: 10.1016/j.neuron.2026.04.027
Resource: (IMSR Cat# JAX_027894,RRID:IMSR_JAX:027894)
Curator: @nmaralla
SciCrunch record: RRID:IMSR_JAX:027894
-
-
www.biorxiv.org www.biorxiv.org
-
RRID:SCR_022209
DOI: 10.64898/2026.04.28.721525
Resource: Harvard Medical School Microscopy Resources On the North Quad Core Facility (RRID:SCR_022209)
Curator: @scibot
SciCrunch record: RRID:SCR_022209
-
-
escher-docs.vercel.app escher-docs.vercel.app
-
2c. Enable the profile:Select the profile → click Enable → click Test Access
We don't have any option to test the access at profile level
-
-
www.medrxiv.org www.medrxiv.org
-
R0:
Reviewer #1:
the authors have done appreciable work in collecting data on the health care issues wrt to Rabies prevention in Tanzania. I have the following observations. Some more statistics ie tables etc may be added to the article to justify the results and discussion. The tables should then be discussed in detail with conclusion pointing out the steps needed to be taken to improve the prevalent chaos in their health care system. costs per patient could be estimated inclusive of loss of wages etc. this will further improve the impact of the article. I couldnt open the supplementary GITHUB site for more results as it seemed to be a paid site.
Reviewer #2:
REVIEW of the article "Access to Rabies Post-Exposure Prophylaxis in Tanzania: A Mixed-Methods and Theoretically Informed Study to Inform Policy and Practice"
This article is a comprehensive study addressing a critical global public health issue: access to rabies post-exposure prophylaxis (PEP) in Tanzania. The study adheres strictly to scientific research principles and is highly relevant, clearly structured, and methodologically rigorous. The use of mixed methods (quantitative analysis of large-scale data from the Integrated Bite Case Management (IBCM) platform and qualitative analysis of healthcare worker communications) within a theoretical model of access to healthcare is a key strength of the study, allowing us not only to document the facts but also to understand the mechanisms and context of barriers. This article makes a significant contribution to both the academic understanding of health systems issues in low- and middle-income countries and to intervention planning, particularly in light of the launch of funding for PEP programs by GAVI (the Vaccine Alliance).
The relevance of this study is undeniable. Rabies remains a deadly, yet 100% preventable, disease that claims tens of thousands of lives annually, primarily among the poorest rural populations in Africa and Asia. The announcement of the "Zero by 30" goal and GAVI's decision to support the procurement of rabies vaccines create a historic window of opportunity. At this moment, field-based evidence is crucial, demonstrating that the mere availability of vaccines in a country is insufficient. This study brings this issue to the forefront by systematically identifying a cascade of interconnected barriers.
The scientific novelty lies in the following:
Application and development of the theoretical model. The authors not only utilize Penchansky and Thomas's classic model (five dimensions of access), but also empirically substantiate and add a sixth dimension—"Appropriateness." This crucial conceptual addition highlights provider competence as a separate, critical access factor, as clearly demonstrated by data on the inappropriate use of RIG or tetanus toxoid.
Depth and Richness of Data. The combination of data on over 10,000 patients with an analysis of real-life healthcare worker conversations and concerns (>3,000 messages) provides a unique, comprehensive picture of the situation. This allows us to move beyond dry statistics ("5% experienced interruptions") to understanding the human tragedies and professional dilemmas behind these figures.
Documenting Emerging Threats. The study documents the emergence of a new, dangerous practice—the use of rabies immunoglobulin (RIG, Equirab) as a substitute for vaccination, which has resulted in fatalities. This is a crucial observation for surveillance systems and regulatory agencies.
The study's methodological framework is exemplary for public health research.
Design: Mixed methods are entirely justified for studying the complex phenomenon of access. The quantitative component objectively captures the scale of the problem (distances, completion rates, interruptions), while the qualitative component reveals the causes, context, and subjective experiences.
Theoretical Framework: The use of a structured conceptual framework (expanded healthcare access framework) lends systematicity to the analysis, prevents fragmented findings, and allows for the classification of barriers into clear categories, which is useful for developing targeted interventions.
Triangulation: The authors consciously employ triangulation, systematically comparing findings from quantitative and qualitative data. This enhances the validity and reliability of the results, allowing for identification of areas where the data complement or corroborate each other.
Ethics: The study has all necessary ethical approvals, and the process for obtaining informed consent from participants (healthcare workers) is described.
Despite its undeniable strengths, the study has a number of limitations, some of which the authors honestly and thoroughly describe in the relevant section. This enhances the credibility of the study.
The absence of a patient voice. This is the main methodological limitation, noted by the authors themselves. The study brilliantly analyzes the system from the service provider's perspective, but the "measure" of acceptability—that is, how much patients trust the service, how comfortable they are, and whether the services meet their cultural expectations—remains unexplored. This is an important gap, as cultural beliefs and stigma can be a significant barrier.
Sample bias. The data only cover those who reached official medical facilities included in the KUSU. The most vulnerable groups—those who immediately turned to traditional healers—didn't have the means to even pay for the first visit.
Reviewer #3:
The authors employed a mixed-methods approach, integrating quantitative data from the Integrated Bite Case Management platform with qualitative data from hotline calls and peer-support chats among health and veterinary workers, to identify barriers and facilitators affecting bite victims’ access to post-exposure prophylaxis across four regions of Tanzania. This work addresses a critical and timely public health issue, as inadequate knowledge of post-bite treatment and constraints in access to rabies biologics remain major contributors to preventable rabies deaths in dog-endemic regions, including Tanzania. I have just one major concern with the manuscript in its current version. While the authors correctly explain early in the Introduction (line 69 and Fig. 2) that post-exposure prophylaxis (PEP) comprises of immediate wound washing, a series of rabies vaccinations, and administration of rabies immunoglobulin (RIG) for previously unvaccinated patients with severe (Category III) exposures, this framework is not consistently or adequately reflected in the subsequent analysis and interpretation. Specifically, across four of the five dimensions of the expanded healthcare access framework, the discussion focuses exclusively on rabies vaccines, with little to no consideration of rabies immunoglobulin (RIG). For patients with severe (Category III) exposures, RIG is arguably the most critical component of PEP, and its omission substantially weakens the analysis. Issues related to availability, accessibility, and affordability should explicitly address RIG, as barriers to RIG access often differ from—and are more severe than—those associated with vaccines. Without clearly incorporating RIG into these dimensions, the manuscript provides an incomplete assessment of the factors influencing access to life-saving PEP. I understand the challenges surrounding RIG access, particularly as the authors allude to in line 363, where they note that the purchase of RIG had not previously been seen in Tanzania. Given this context, the implications of RIG unavailability should be discussed explicitly and in greater depth in the Discussion section. Doing so would help clarify how historical absence, procurement barriers, cost, cold-chain requirements, and limited clinician familiarity contribute to ongoing and future challenges in delivering complete PEP. A clearer, more focused discussion of RIG would strengthen the manuscript by providing a more realistic and policy-relevant assessment of barriers to comprehensive rabies prevention in Tanzania.
Academic Editor:
I would like to sincerely apologise for the delay you have incurred with your submission. It has been exceptionally difficult to secure reviewers to evaluate your study. We have now received three completed reviews; the comments are available below. The reviewers have raised significant scientific concerns about the study that need to be addressed in a revision.
R1:
Reviewer #1:
good article
Reviewer #2:
This article's conclusions and table discuss the need to decentralize PEP services to priority facilities.
I suggest the authors provide more specific criteria or models. For example: "In each ward with a population greater than X and/or located more than Y km from an existing PEP site, at least one medical facility (dispensary or health center) should be designated for rabies storage and vaccination. The selection of these facilities should be based on accessibility to the public (24/7) and the availability of trained personnel." This transforms a general recommendation into a measurable standard.
Reviewer #3:
Thank you for addressing reviewer comments from the previous round.
R2:
Reviewer #1:
All comments have been addressed.
-
-
www.medrxiv.org www.medrxiv.org
-
R0:
Reviewer #1:
This paper examines factors associated with Shigella-attributed diarrhea among children aged 6–35 months in Malawi, including a novel assessment of seasonal effect modification. The analyses are technically rigorous and appropriately applied to the observational dataset, and the findings provide valuable evidence to guide targeted interventions, including the forthcoming Shigella vaccine rollout. I recommend publication pending a few minor revisions noted below.
• The introduction explicitly situates the burden of Shigella in an economic context, but are there any other lenses, perhaps more human-centric, through which we can think about the implications of this burden? • Please include references for the categorization methods of diarrhea severity and WASH in the “Predictor Variables” section of the Methods. • How did you approach producing age group bins for this study? Was it data driven or decided a priori based on some contextual motivation? • Please add a statement justifying Poisson regression as the chosen analytic method. • Given that some samples were tested by culture, some by qPCR, and some by both it would be beneficial to add more clarification in the methods about the different testing procedures and results classification. For the samples tested by both methods, what happened if one result was positive and the other negative? In the discussion you state “Notably, 43% of qPCR-positive cases were also culture-positive, supporting the clinical relevance of the qPCR-detected cases”, however only 43% overlap between the two methods actually seems quite low – can you point to any other studies that have looked at this? • I believe when using generalized estimating equations (GEE) to account for clustering it is standard to report the number of clusters and distribution of cluster size. • These analyses rely on an assumption of missing data at random/completely at random, however the complete case analysis conducted excludes 32% of children with missing vaccination data. Please elaborate on this missingness in the limitations beyond reduction in sample size to include the potential bias introduced if the data is not in fact missing randomly. Alternatively, it may be worthwhile to consider inclusion of the observations with unknown vaccination status as a third category – which may still have relevant interpretation given the reality of often not knowing children’s vaccination status when designing interventions. • Was there any consideration of prior antibiotic use among patients reporting to the clinic with diarrhea? Please elaborate how this may or may not influence these results (perhaps in the limitations). • Please standardize spelling of “enrollment” throughout the manuscript (sometimes one vs two ls). • In Table 1 the Wasting “None” group percentage needs a decimal instead of a comma.
Reviewer #2:
The findings are interesting but it need through revision considering the following critical points. • Clearly mention the inclusion and exclusion criteria for selection of patients in the current study? • What was the limitation of the study? • Shigella were isolated and identified using culturing. What was the specie distribution of Shigella? • Mention the duration of the study (months/years) in the abstract. • Briefly describe how the culture and qPCR were used for detection of Shigella. Is Shigella DNA directly detected in fecal sample or it is detected from culture? • Define the criteria of Household drinking water source categorization: Improved, Unimproved?? • The abbreviations used in the tables should be defined in the table’s foot note.
Academic Editor:
Two reviewers have evaluated your manuscript and provided their comments below. In particular, please provide more detail in the methods section on the microbiological methods for Shigella detection and add information on any missing critical variables e.g. in the table footnotes. In addition and given the high missingness for vaccination status, conducting a sensitivity analysis for the multivariable models while excluding vaccination would aid with the interpretation of the study findings.
-
-
www.medrxiv.org www.medrxiv.org
-
R0:
Reviewer #1: This study is very interesting, and there are still few publications that link medicines quality with treatment outcomes. However, there are some comments to improve the information and discussion in the paper.
The comments are as follows: * Line 33: of antimicrobials in low- and middle-income countries SF. What does countries SF mean?
-
Line 91 Graph: we reanalyzed data from seven clinical trials of ofloxacin as a treatment for typhoid: Is this clinical trial data from the same country as the population/API distribution included in the model? It's described as being from Vietnam, but one API distribution is from Bangladesh.
-
Line 129: probability to investigate....... There is no dot after probability.
-
How did you measured or calculated for treatment outcomes from Bangladesh in the model? It's known that its API is substandard (less than 60%). LINE 199, while the clinical trial used for modeling is from Vietnam.
-
Line 246: When %API followed the ciprofloxacin distribution (mean <100% %; Fig 3B) Why does Fig 3B use SF Cipro survey distribution data as the API estimate when it actually uses clinical trial data from OFLO? -> This is discussed in the limitations section.
-
Line277- 278: insufficient doses does not mean that the medicines is substandard or falsified. How to explain the correlation with research titles related to the impact of substandard or counterfeit drugs?
-
Line 297: The potential risks of SF fluoroquinolones are also likely to have increased over time as the fluoroquinolone MIC of S. Typhi increases. Why does the potential of fluoroquinolones to act as SF increase as the fluoroquinolone MIC of S. Typhi increases? Can you explain this further?
-
Line 337 Our framework for quantifying the impact of SF antimicrobials demonstrates that the population-level impacts of SF antimicrobials on typhoid outcomes may be heightened when the MIC of S. Typhi is high and the SF antimicrobials have low %API.
So, the thought process is this: SF medicine for antibiotics is assessed based on the %API results. Disease severity is assessed by the MIC. The assumption is that when the %API is outside the normal range, it is insufficient to kill the bacteria, thus prolonging the patient's symptoms. For typhoid, there are two drugs: Cipro and Oflo. The SF survey results only show one study for Oflo, while there are seven studies for Cipro. Clinical trials were conducted only for Oflo, with seven studies.
Question: • Why is the SF Cipro survey discussed if it only uses clinical trial data for OFLO? -> This is discussed in the limitations section. • Is there any data on the relationship between %API and outcome, or the relationship between %API and the effect on MIC? If not, how is the impact of %API on MIC and clinical trial outcome calculated? Is it by estimating the %API to be a lower or higher dose? • The distribution of SF Meds Survey results is used to estimate the relative risk of outcome according to Step 3 in Figure 1. Estimate the population-level relative risk of outcome due to medicines with incorrect %API, but is the probability (in addition to the distribution range) of the SF drug %API based on that distribution considered in the estimate/weighting when calculating the relative risk?
-
Finding step 3: we estimated a 4.1h (90% CrI: 0.75–8.7) reduction in fever clearance time for non-susceptible infections with an MIC of 1 mg/L (line 243) -> This is only for the target dose of 52 mg/kg
-
Finding step 3: we estimated an 11h (90% CrI: 1.9–25) increase in fever clearance time for an MIC of 1 mg/L (line 246) -> This is only for the target dose of 52 mg/kg
Reviewer #2: 1. Analysis assumes that all antimicrobials administered in the clinical trials contained 100% API. Given that this assumption underpins the entire modeling framework, how do you justify its validity, and can you provide quantitative sensitivity analyses to demonstrate how violations of this assumption would affect your conclusions? 2. The clinical data are restricted to Vietnam (1992–2001). How can the findings be considered applicable to current global health contexts, particularly in sub-Saharan Africa, where antimicrobial resistance patterns and treatment practices differ substantially? 3. The medicine quality dataset appears sparse, heterogeneous, and geographically uneven. How do you address potential selection bias and lack of representativeness, and what is the impact of these limitations on the robustness of your estimates? 4. Given that ciprofloxacin data are used as a proxy for ofloxacin due to limited availability, how do you justify this substitution pharmacologically and epidemiologically, and have you assessed the uncertainty introduced by this assumption? 5. The manuscript lacks sufficient detail on model diagnostics (e.g., convergence metrics, posterior predictive checks). Can you provide comprehensive diagnostic results to demonstrate that the Bayesian models are well-calibrated and robust? 6. Approximately 5.9% of observations were excluded due to missing MIC values. How might this exclusion bias your findings, and have you explored imputation methods or sensitivity analyses to assess the impact? 7. The reconstruction of the administered dose based on tablet rounding assumptions introduces potential measurement error. How have you quantified and accounted for this uncertainty in your models? 8. Some results rely on extrapolation beyond observed dose ranges. How do you ensure that these extrapolations are methodologically valid and not driving key conclusions, particularly in low-dose scenarios? 9. The underlying individual-level clinical data are not fully publicly available, which may not comply with PLOS data-sharing requirements. How do you plan to ensure full reproducibility of results, and can the data be deposited in a controlled-access repository? 10. The reported effects on fever clearance time are relatively modest in absolute terms. Could you better justify the clinical and public health significance of these findings and clarify how they meaningfully inform policy or intervention strategies?
-
-
-
github.com github.com
-
A Plan represents developed intent — what you've decided to do about a Finding (or several). A Plan is bound to one or more Findings A Plan captures inputs and assumptions ("we're applying this only in us-east-1", "we'll use the standard remediation Playbook") A Plan evolves through revisions as you refine it A Plan is not an execution — it's the intent. The execution happens via the Bundle materialized from the Plan
test_comment
-
-
chrisglass.com chrisglass.com
-
I try my best to stick to the grocery list but this was a really good deal for strawberries. I did that thing mixing 1 part white vinegar and 3 parts water, soak for 10 minutes and dry thoroughly to extend their freshness.
Tip for preserving freshness of strawberries: Soak in 1 part white vinegar, 3 parts water, for 10 minutes.
-
-
docdrop.org docdrop.org
-
Rebuilding mindset begins with helping students notice their own progress. e Reframing mistakes as information is an essential part of having a posi- tive academic mindset.
This is something that we need to do every day in the classroom. We need to help students change their mindset and little by little believe in themselves as we show that we believe in them.
-
When teachers frame student differences as deficits rather than as assets, a microaggression is ignited for the student. Too often, teachers who are not working to become culturally responsive misinterpret cul- tural differences as deficits, dysfunctions, or disadvantages in students, leading the teacher to react negatively toward the student rather than respond positively
We need to be aware and think before act and say something that can be hurtful to our students. These attitudes have an impact on our students learning.
-
s warm demanders, our job is to get students to recognize that put- ting forth the effort is worth the work. We do this by helping each student cultivate an academic mindset.
This is important to do with our students. They need to know that we believe in them and that we are holding them accountable.
-
-
elifesciences.org elifesciences.org
-
We assayed the RNA expression levels of the genes encoding the sodium channel modulator neurotoxin Nv1
Would similar RNA levels be found in animals like platypus.
-
Some animals produce a mixture of toxins, commonly known as venom, to protect themselves from predators and catch prey.
If this experiment were ever expanded upon, would venomous species in Australia be perfect to use? There are many poisonous and venomous species on the continent. Specifically, the male platypus.
-
-
www.medrxiv.org www.medrxiv.org
-
eLife Assessment
This manuscript addresses an important question in clinical neuroscience: the use of the theta/beta ratio as a biomarker of attention deficit hyperactivity disorder (ADHD). The study takes an exceptional "multiverse" analysis approach to show that aperiodic activity differences between healthy controls and people with ADHD are driving the apparent theta/beta ratio differences. From a neuroscientific perspective, this is a critical finding because it has a major impact on guiding research on the diagnosis and treatment of ADHD.
-
Reviewer #1 (Public review):
Summary:
The authors address whether theta/beta ratio /TBR) can be used as a clinical biomarker for ADHD.
Strengths:
The data were acquired independently from 2 separate datasets, and there are sufficient subjects for adequate statistical power. The authors applied up-to-date EEG data preprocessing, state-of-the-art feature extraction, and statistical analyses, using a multiverse approach. By testing and comparing all meaningful approaches, defined a priori in the previous meta-analysis, the author convincingly demonstrates that TBR cannot be used as a clinical biomarker, and previous positive results can be explained by interactions between different factors (alpha peak frequency, aperiodic component, age).
Weaknesses:
There are no apparent issues with data, separate datasets, large sample sizes, and state-of-the-art data analysis.
-
Reviewer #2 (Public review):
Summary:
This manuscript examines whether the theta-beta ratio as derived from EEG data relates to ADHD diagnoses. To do so, it performs a multiverse analysis across a large number of analytical choices, applied to a large EEG dataset, and corroborated in an additional validation set. The results overall show that the TBR is not a reliable indicator of ADHD diagnosis. In discussing the patterns of results across analytical choices, the authors also demonstrate some key points about what appears to be driving the ratio measures, noting that significant results appear to be driven by choices regarding aperiodic-correction and the use of individualized alpha frequencies, suggesting TBR measures can be affected by these features rather than reflecting theta and/or beta activity.
Strengths:
This manuscript addresses a clearly posed and important question in the literature, addressing a longstanding discussion on the relationship between TBR and ADHD, and uses a large dataset and an expansive analysis approach to provide a definitive answer. The strengths of the approach allow for a clear answer, providing a notable contribution to the field.
Weaknesses:
I find no notable weaknesses in the current manuscript nor any major issues that I think challenge the key findings of this manuscript.
-
Reviewer #3 (Public review):
Summary:
In this manuscript, Strzelczyk, Vetsch, and Langer tackle an incredibly important question in clinical neuroscience: the use of the theta/beta ratio as a biomarker of attention deficit hyperactivity disorder (ADHD). The theta/beta ratio is argued to be so reliable as an ADHD biomarker that, in the United States, the Food and Drug Administration has approved its use as a biomarker for ADHD diagnosis. However, there is mounting evidence that the theta/beta ratio is likely not really measuring the relative power between two oscillations - the theta rhythm and the beta rhythm - but rather reflects differences in a singular, non-oscillatory aperiodic process. In this very convincing study, Strzelczyk and colleagues take a "multiverse" analysis approach to show that aperiodic activity differences between healthy controls and people with ADHD are driving the apparent theta/beta ratio differences. While in a vacuum, where a measure is a measure and if it's related to a diagnosis it's still useful no matter what, this distinction might not seem important, from a neuroscientific perspective this is a critical distinction, because the ratio between two oscillations has fundamentally very different underlying physiological mechanisms than aperiodic differences, and this framing has a major impact on guiding research on the diagnosis and treatment of ADHD.
Strengths:
While smaller studies and analyses have already hinted at similar results as shown here, the current study's multiverse analysis approach is comprehensive, convincing, and very well done. The large sample size of 1,499 participants is very impressive, as is the use of an independent validation sample of 381 participants.
Overall, the technical and statistical aspects are very well done: the multiverse approach, the validation set, the resampling methods, and even the shiny apps. The authors should be applauded for being so thorough and making their data and analyses publicly accessible.
Weaknesses:
To be clear, I see no breaking weaknesses in the theoretical foundations, methods, statistical analyses, or interpretations. All of my recommendations below are for the sake of clarity, which I believe is especially important because this is such an important paper that many people should read.
Comments:
(1) Some figures are mislabeled. For example, Supplementary Figure 1 says (C) are scalp topographies, but those are (A), while (C) shows power spectra, but it's unclear what (C) is. I assume it's only the aperiodic part of the spectrum (oscillations removed)? But it would be better to plot on a log-log scale if so.
In fact, I recommend showing all spectra on a log-log scale.
(2) Supplementary Figure 6 is also mislabeled, saying (A) shows age (it does not) and so on.
(3) In Supplementary Figure 7, is (B) the aperiodic-removed spectrum? The authors are very inconsistent with what they're showing in these spectral plots, and not actually explaining what they're showing: raw spectra, semi-logged or not, aperiodic-removed or oscillations-removed, etc.
(4) For the HBN data, it is said that, "electrode impedances were kept below 40 kΩ, lower than EGI's standard recommendation of 50 (Net Station Acquisition Technical Manual)." For the validation data: "... electrode impedances were maintained below 5 kΩ." These are big impedance threshold differences. Of course, these recommendations differ by recording system, the use of active electrodes, and so on. But such differences can certainly influence signal-to-noise. The fact that the results are so consistent between them is a strength that perhaps should be explicitly called out.
(5) The authors cite a lot of foundational / related work here, such as Finley et al, but they should also cite several other highly relevant ones:
- Saad et al., "Is the Theta/Beta EEG Marker for ADHD Inherently Flawed?", J Atten Disord, 2015
- Donoghue, Dominguez, Voytek, "Electrophysiological frequency band ratio measures conflate periodic and aperiodic neural activity", eNeuro, 2020
- Karalunas et al., "Electroencephalogram aperiodic power spectral slope can be reliably measured and predicts ADHD risk in early development", Develop Psychobiol, 2022
- Donoghue, "A systematic review of aperiodic neural activity in clinical investigations", Eur J Neurosci 2025
-
-
www.reddit.com www.reddit.com
-
The standard collection of Berkeley's work is the nine volume The Works of George Berkeley, Bishop of Cloyne edited by Jessup and Luce, and the standard collection of Hume's work is the eight volume Clarendon Hume Edition Series under Beauchamp, Norton, and Stewart as general editors. For the Berkeley, your professor probably has in mind the collection Philosophical Works; Including the Works on Vision edited by Ayers. For the Hume, the Selby-Bigge/Nidditch editions were standard until recently and remain widely used. For the Kant, the standard edition is The Cambridge Edition of the Works of Immanuel Kant series which is under the general editorship of Guyer and Wood but which includes work by other translators as well. And the Pluhar translation of Kant's Critique of Pure Reason, which was the previous standard, remains widely used.
via u/wokeupabug at https://www.reddit.com/r/askphilosophy/comments/1i9c0ni/the_definitive_edition_of_george_berkeleys_work/
-
-
www.biorxiv.org www.biorxiv.org
-
eLife Assessment
This valuable study presents a comprehensive comparison of human and macaque monkey behavior across a range of visual perceptual phenomena. The use of a unified oddball visual search paradigm enables direct cross-species comparison while minimizing task-related confounds. It provides solid evidence that visual perception is largely similar between these two species, with some interesting exceptions. These insights into qualitative and quantitative differences between species are relevant for evaluating macaques as a model organism for understanding human vision.
-
Reviewer #1 (Public review):
Summary:
The authors set out to conduct a behavioral comparison of macaque and human vision across a wide range of visual properties. Such a comparison is critical for evaluating the use of macaques as a model system for understanding human vision and the underlying neural mechanisms. This goal represents a unique endeavour since prior studies have typically focused on only highly specific tasks. While the authors found consistent coarse representational structure for objects, evidence for Weber's Law and amodal completion, there was divergence for mirror image confusion and the use of global or local image properties.
Strengths:
There are three major strengths of the study. First, the authors employed a behavioral paradigm (oddball search) that allowed them to test multiple perceptual phenomena without having to train the macaques on the specific type of stimuli tested. Second, humans and macaques could be tested in an identical manner. Third, the authors tested a range of different visual properties and phenomena, allowing a broader comparison between species.
There are also some weaknesses to the study (described below), but that doesn't change the fact that the authors have demonstrated and validated a novel approach for systematic and comprehensive comparisons of vision across species.
Weaknesses:
The weaknesses of the study arise in part because of the breadth of the work. In cases where there are divergences between the two species, it would be helpful to know what might account for such divergence, to have more depth. Is it really a species difference, or could there be a different account? For example, does the difference in mirror image confusion arise because the stimuli were objects that would have been highly familiar to the humans but not the macaques? Further, the authors often used small sets of stimuli (e.g. 8 objects only in the test of object similarity; a small set of highly specific occlusion stimuli), and how well the findings will generalize beyond those stimuli is unclear.
The authors discuss the implications of training macaques to perform specific tasks on specific stimuli in comparing across species. While I agree that extensive training in monkeys could change perception, it is important to also consider that humans have been extensively trained through the types of visual tasks we conduct throughout our lives, so I'm not sure it is universally true that the best comparison is between humans and untrained monkeys. But this just consideration just highlights the general problem of comparing across species.
-
Reviewer #2 (Public review):
Summary:
The macaque monkey is often considered as the animal model of choice to study the neural correlates of visual perception, due to the close similarities to humans in terms of anatomy, physiology and behaviour (Van Essen and Dierker, 2007; DiCarlo et al., 2012; Roelfsema and Treue, 2014; Picaud et al., 2019; Van Essen et al., 2019; Hesse and Tsao, 2020). Quite some studies have been performed to compare the behaviour of macaque monkeys and humans on visual perception tasks. However, it remains difficult to compare the results of these studies as the methods that are used differ significantly between these studies. Furthermore, behavioural studies of macaque monkeys often involve extensive training as the tasks were relatively hard, making it difficult to compare the results with humans, who generally require very little training. The authors present a set of experiments to compare visual perception between macaque monkeys and humans, using the exact same behavioral task that is easy to learn and therefore requires very little training. As expected, they overall find that the two species behave similarly. However, they find a number of interesting exceptions.
Strengths:
A major strength of the current study is the relatively large number of tasks that were tested in the same subjects. This is made possible by using the oddball visual search task, which macaque monkeys can learn very quickly. This means that few trials are sufficient to obtain a significant difference between conditions, minimizing learning effects. Although this type of task has been used in previous studies (Sablé-Meyer et al., 2021), the current manuscript makes better use of the advantages and explains them more explicitly.
In addition, the study finds a number of interesting differences between macaque monkeys and humans. In particular, while humans can dissociate horizontally mirrored images better than vertically mirrored images, monkeys show no difference between these two conditions (Experiment 4). Also, while humans dissociate images better based on the global shape of a stimulus, monkeys dissociate images better based on local elements of a stimulus (Experiments 5 and 6). Although these findings are largely a replication of previous results, they have not yet been studied together with other tasks within the same individual subjects, and the low number of trials avoids any learning effects.
Weaknesses:
A weakness of the study is that while the objects that were used can be considered to be familiar to humans, they are not familiar to macaque monkeys.
In Experiment 4, humans can be expected to have 3D representations of familiar objects such as a Roman helmet or an office chair. Humans can therefore be expected to have view-invariant representations of these objects, predominantly for rotations around the vertical axis of the object (as movements are most common in the horizontal plane). This can explain why only humans confuse objects more often when mirrored vertically than when mirrored horizontally.
Similarly, in Experiment 5, humans can be expected to be familiar with abstract geometric shapes such as squares and circles, while monkeys likely are not. This could explain why monkeys find it hard to recognize these geometric shapes in the global shape of the stimuli, even when thin grey lines are drawn to connect the local elements that constitute the global shape (Experiment 6). Instead, the combination of local shapes can be expected to form a texture that might be more easily recognized by the monkeys.
More generally, as proposed by Fagot et al, it might well be that monkeys tend to conceive stimuli as a combination of low-level visual features, instead of as references to objects in the outside world, as humans have learned to do (Fagot et al., 2010). This line of critique would be relevant to take into account.
Another weakness could be that only three monkeys are tested, while 24 human subjects are tested. According to some theoretical work, a finding in 3 animals is not sufficient to make a claim about an animal species (Fries and Maris, 2022). However, it seems that the results are largely consistent between the different monkeys. Moreover, the results generally agree with the results from previous literature.
The conclusions by the authors are therefore largely supported by the results. Some results could be strengthened by additional experiments, or at least a more extensive discussion of the potential weaknesses.<br /> The potential impact of the paper is significant, as a start of a comprehensive comparison of visual perception between humans and macaque monkeys, which can inspire other labs to contribute to. This comparison can also be extended to other animal species (e.g. crows and rodents), as well as to different types of artificial neural networks (Leibo et al., 2018).
-
Reviewer #3 (Public review):
Summary:
In this study, Cherian and colleagues compare visual perception between humans and monkeys using a common oddball visual search task across a battery of perceptual phenomena. By keeping the task constant and varying only the stimulus sets, the authors aim to isolate perceptual similarities and differences between species. Across six experiments, they report that monkeys and humans share similarities in coarse object representations, Weber's law, and amodal completion, but differ in mirror confusion and global/local processing.
Strengths:
A major strength of the study is the unified experimental framework. The authors designed the experiments such that the task procedures are identical across conditions and species, differing only in the images shown. This is a significant methodological advantage, as it minimizes task-related confounds that often complicate cross-species and cross-experiment comparisons. As a result, observed similarities and differences can be more directly attributed to perceptual processes rather than differences in training or task demands. This allows for a more comprehensive evaluation of visual perception than is typical in the literature, where individual studies often focus on a single effect with specialized training. The data are carefully collected, and the analyses are systematic and appropriate for the questions posed.
Weaknesses:
Despite its strengths, the study is largely descriptive and provides limited mechanistic or theoretical explanation for the observed similarities and differences. While the authors document several convergences and divergences between humans and monkeys, there is relatively little discussion of why these patterns arise or how they relate to existing theories of visual processing. As a result, it is difficult to assess the broader implications or generalizability of the findings beyond the specific task and stimuli used.
Relatedly, the rationale for selecting the particular set of perceptual phenomena is not fully developed. Some tasks appear motivated by prior work comparing humans and deep neural networks, but it is unclear whether this set constitutes a representative or theoretically grounded sampling of visual perception. Without a clearer justification, it is difficult to interpret the absence or presence of specific effects (e.g., mirror confusion or global advantage) as reflecting fundamental species similarities/differences.
-
-
www.biorxiv.org www.biorxiv.org
-
eLife Assessment
This valuable study examined the geometry of visual object representations across hierarchically organized stages of the mouse visual cortex. The use of large-scale training and recording techniques provides solid evidence for changes along the hierarchy that may contribute to invariant object recognition. These findings, particularly if they could be supported by further analyses and clarifications to rule out alternative explanations, including influences of low-level features on behavior and neural activity, help establish the potential usefulness of the mouse to understand the neural basis of object recognition.
-
Reviewer #1 (Public review):
Summary:
This paper describes a complex series of studies that measure and explain object recognition in mice. The authors demonstrate that mice are capable of solving an object recognition task, that object identity is decodable in different regions of cortex, and the decodability, to some extent, can be captured by extant theory on object manifolds in deep neural networks. The authors further add some correlational analysis of the time courses of object discriminability to bolster their claim of an object processing hierarchy in the mouse cortex.
The behavioral and neural data described in this paper are likely to be of interest to the general neuroscience community. That said, I have some issues with the analyses, modeling, and image dataset that I'll detail below.
Strengths:
(1) The behavioral work is incredibly cool. Getting mice to solve this task is a real achievement and opens up new avenues for mice as a model for complex visual tasks.
(2) Similarly, the neural recordings are astounding in their scale.
(3) This could be the most complete demonstration of a primate-analogous object processing network in the mouse.
Weaknesses:
No new weaknesses were noted by this reviewer.
-
Reviewer #2 (Public review):
Summary:
The paper argues that mice are capable of some view-invariant object recognition and that some of their visual areas (especially LM, LI, and AL) carry linearly-decodable signals that could, in principle, help in this process. Further, it argues that the population code in those areas makes linear decodability easier in two ways (fewer dimensions and a smaller radius).
Strengths:
It is very useful to see the performance of the mice in this difficult task, and to compare it to the performance of neurons in the mouse visual system. It is also useful to see analyses of the neural code that seek to understand how the code in some visual areas may be particularly suited to decoding object identity.
Weaknesses:
Though the paper has improved from the previous submission, there are still some open questions, especially about whether some lower-level properties of the neurons (such as receptive field location) might explain the differences between visual areas. This and other concerns are outlined below.
(1) Do the signals from the visual areas outperform or underperform the mice? It is hard to tell, because for mice we get numbers in percent correct (Figure 1e, based on 2 alternatives), whereas for visual areas we get numbers in bits (Figure 2c, where it is not clear whether there are 2 or 4 alternatives). This makes it very hard to compare the two. The authors should provide a statement or figure where readers can compare the two. Also, if the behavioral data are obtained with 2AFC, why not run the analyses as 2AFC too?
(2) Differences in discriminability across objects (Figure 1f). Are these differences also seen for the model based on the difference of Gaussians? (The authors should add those predictions to the plot.) If so, this could further point to possible low-level explanations. It is already quite interesting that the difference of Gaussians model predicts ~58% accuracy, which is not far from the ~65% accuracy of the mice.
(3) Similarly, in a later figure about decoding visual cortical activity, the authors should show a similar breakdown by object. Are certain objects more decodable than others?
(4) Number of neurons. It is wonderful to see so many neurons (489182, i.e., an average of ~15k per mouse). But might the same neurons have been recorded multiple times? Has a tool like ROICat or similar been run to exclude this? If not, that is ok, but the authors should add a sentence in Results to indicate that these are not unique neurons (some neurons may be duplicates or triplicates).
(5) Retinotopy: "within the same ∼20o area of visual space". This is a useful analysis, but which 20 deg area was considered? Was it the one in front of the mice? This would be surprising, because some of the regions do not cover that area (Zhuang et al, eLife 2017). Was a different area chosen? What are its coordinates in azimuth and elevation? And how does it compare to the region where the stimulus was shown during imaging? The Methods do not explain where the stimulus was placed (only that it was in front of the left eye). This information should be added. Also, the screen covered ~120 deg of visual space (63 cm monitor placed 15 cm away), so the emphasis on a 20 deg area is not clear. The authors should provide a figure showing coverage of the screen by each visual area and the position of the stimuli presented during imaging.
(6) If during imaging the stimuli were presented slightly above the horizontal meridian, then a possible explanation for the superiority of LM, AL, and LI is that their receptive fields tend to be in the upper visual field, whereas the rest of the higher visual areas tend to have receptive fields in the lower visual field (Zhuang et al, eLife 2017).
(7) Dimensionality: "number of directions in which this variability is spread". Unless I missed the explanation, the Methods don't provide any information on how the dimensionality is computed. Is it done with cross-validation? If not, noise can be interpreted as having high dimension. There are methods to estimate dimensionality with cross-validation, thus excluding the contribution of noise (e.g., Stringer et al 2019). The authors should confirm that this was done with cross-validation and provide information in the Methods.
(8) Temporal dynamics: "evidence for temporal integration during a trial". Are there really dynamics in the visual responses that last on the scale of seconds? This would be remarkable. Image recognition is usually thought to be done in 100 ms. The long scales presented here are more likely associated with behavioral responses or state responses, or similar. Might there be different brain state correlates in the different cases? For instance, pupil dilation might be different.
(9) Methods: "to ensure animals were in an attentive state (eyes clear and open)". This sounds peculiar. Did the mice ever close their eyes? If so, that's a discovery. Mice keep their eyes open at all times, even when they are sleeping. So, using eye closure for online detection of "inattentive states" does not seem to make sense. (Also, and this is a minor point: why stop a scan when the animal is "inattentive"? Wouldn't one want to acquire the associated data for comparison? Is the point to save disk space?). This whole set of statements is a bit concerning.
-
-
-
This means building a classroom culture that cele-brates the opportunity to get feedback and reframes errors. as information.
It is important to create a culture in the classroom where feedback is an important part of learning. This is the way to be better.
-
Find a way to organize the classroom schedule so that you can have perio ic conferences or check-ins with students.
I think that this is the difficult part. It has been difficult to get to all of them and have the conversation about their goals in a set amount of time.
-
The pact is a formal agreement between teacher and student to work on a learning goal and a relational covenant between them.
I have been able to set some reading goals wit some of my students and this has worked. They feel responsible for their own learning and they want to be successful.
-
The student with this limited outlook believes effort is useless. He begins to cover up, hide, or act out because he believes failure on an assignment or task might expose him as "dumb" to his peers, leaving him vulnerable to teasing and being ostracized.
This has happened at my school with some students. As they grow, they are more aware of skills and feel behind. They start to close up.
-
Their awareness of their own lack of academic proficiency leads to a lack of confidence as learners. Unfortunately, many culturally and linguistically diverse stu-dents start to believe these skill gaps are evidence of their own innate intellectual deficits. They internalize the negative verbal and nonverbal messages adults at school send to them in the form of low expectations, unchallenging remedial content, and an overemphasis on compliant behavior
This is really sad and I have seen it happen again and again.
-
Based on your finding·s~-:iii_~n.,tj[!f..,'!_fl.!~al~~!!lt ou can make to build trust with your focal student. Think about one small change you would like to make that you believe would shift the nature \
Important to have in mind.
-
Share a new skill or process you are learning-not the finished product but the less-than-perfect beginning and middle parts. '-----• Share your interests with the whole class and then find fellow fans among individual students with whom you share an interest in the ~ same sports teams, movies, or hobb
I have tried some of these strategies. They are valuable.
-
Trust, therefore, frees up the brain for other activities such as crea-tivity, learning, and higher order thinking.
It is important for our students to trust us so they can learn and feel valued. We need to be careful not to make our students feel threatened.
-
ealized that culturally responsive relationships aren't just something nice to have. They are critical. The only way to get students to open up to us is to show we authentically care about who they are, what they have to say, and how they feel
We need to show our students that we genuinely care.
-
-
docdrop.org docdrop.org
-
The strategy is based on neuroscience findings that tell us that if we are able to put as little as 10 seconds in-between the time we get trig-gered and our reaction, we can preempt an amygdala hijack and avoid responding negatively. The following box gives an overview of the S.O.D.A. strategy.
A strategy that I want to incorporate in my practice.
-
For a culturally responsive teacher who is working to empower dependent learners who may be resistant out of fear, this prac-tice is critical
We are models in the classroom. We need to model how to have self control and how to react in different situations.
-
The culturally responsive teacher's ability to manage her emotions is paramount because she is the "emotional thermostat" of the classroom and can influence students' mood and productivity.
Something we need to have in mind daily.
-
As a result, teachers' deficit-oriented attributions of student performance influence their instructional decision making, resulting in giving students less opportunity for engaging curricula, interesting tasks, and culturally congruent ways of learning.
We have the power to support our students, to give them what they really need valuing them and what they know.
-
A critical first step for teachers is to under-stand how their own cultural values shape their expectations in the classroom-from how they expect children to behave socially,
This is the first step. This is a practice we need to follow actively. we need to understand our culture and biases first to be able to understand others and be aware.
-
This means we each must do the "inside-out" work ~ •:-. . t required: de.~~loping t!!e right mindset, eng!lg!ng,_p. self-reflecti~:~~king , ;;;· ~ our implicit bia~~,,_P.racticj_n,&,.§~}~~,1!:..<?.!i.?HaJ.i!.::Y:¥.'.~~~~S.1• c!. !!.clh..q\qLqg an )" ~~-·~ i~_§tan.ce,.rngg.1;dio..g,tb.,~)wp~c;(gL2J!!..~~rn~Y-9~-°-,~~s.tud~1;_
I agree. We need to examine our biases and how this impacts our students.
-
To empower depen-dent learners and help them become independent learners, the brain needs to be challenged and stretched beyond its comfort zone ~i cognitive routines and strategy.
Sometimes we forget this.
-
-
rai.onlinelibrary.wiley.com rai.onlinelibrary.wiley.com
-
fewer familyresources as a daughter
Example of the patriarchal culture?
-
Yanzi, a care worker in her late fifties, explains: ‘As they say, “one will neverfully appreciate the great kindness of their parents until they raise children themselves”
I think this is a really good quote to support the idea that older eldercare workers are objectively better.
-
aged 40 to 60. This preference isdriven not only by their presumed increased caregiving experience and resilience, butalso by the belief that, as both parents of adult children and children of elderly parents,they embody a stronger sense of ‘filial heart’.
I wonder if this is due to generational beliefs. Is it because Chinese culture believes that filial piety is more engrained/valued/practiced in older generations?
-
a key indicator of competence ineldercare
A western point of view of competence in eldercare would likely be related to productivity or effectiveness meanwhile the Chinese point of view of competence holds a more emotional value.
-
For many elder people, including elder migrant workers, who wouldpreviously have been the ‘information have-less’ (Qiu 2009), the smartphone is theirfirst-ever personal internet access to leapfrog into the digital age.
I used to work in a assisted living facility and I often had to help the residents with technology issues. I think the digitalization can also cause the elderly to be more vulnerable. I remember specifically I had to show a resident how to identify text based scams.
-
In 2019,China had approximately 290.77 million migrant workers
Highlights the overall population of the study.
-
Since 2001, the Chinese government has encouraged the development of commercialnursing homes for the elderly nationwide
Exemplifies the adaptation of a country driven by culture. The encouragement of this development was driven by the filial piety culture all through out the country. The country feels an obligation to take care of their elderly population.
-
The monthly fee at theelderly centre where the fieldwork took place (approximately £700-£1,200) exceededthe average monthly pension of retirees. However, most residents received additionalfinancial support from their adult children.
Demonstrates filial piety through monetary means.
-
rapidly ageing society; the decline of extended family; massive domesticmigration; and the boom of the digital in almost all the fields of urban China.
Author(s) note four different outside influences on caregiving in China to set their study into context.
-
two elderly care institutions: one in the citycentre and the other in a suburban area with an affiliated hospital.
Notes the sample of the study.
-
the intertwined relationship between care andcontrol in commodified care provokes ethical reflections among migrant care workers,
The situation sets up a question for migrant workers. Though they are being paid, there's still complex motivations and feelings towards the action of caregiving itself.
-
While the concept of filial piety emphasizes care labour alongside respectand obedience to elders (Lee & Mjelde-Mossey 2004), in practice, there is considerableroom for negotiation between action and affect – an aspect this article’s ethnographyseeks to illuminate.
The main point of this article. Filial piety based caregiving vs other perspectives motivating caregiving.
-