Entonces, qué es lo que los conoce
Aquí ya hay una pregunta metafísica.
Entonces, qué es lo que los conoce
Aquí ya hay una pregunta metafísica.
Esencialmente,este proceso se mueve de lo externo a lo interno, de lo tosco a lo sutil;se mueve desde un énfasis en el cuerpo a un énfasis en la mente, de unacondición de actividad a una de quietud.
Búsqueda de quietud, pero sobre todo de armonia. Sámsa y nirvana son lo mismo - Doctrina de la vacuidad.
Debilitan la sensación de insatisfacción permitiéndole ala mente un solo objeto, y usando la atención plena para mantener elobjeto en su lugar.
Restringir el acceso a la consciencia a un solo punto. Utilizar ese punto como referencia.
La mente está siempre hambrienta y buscando algo para satisfacersu apetito.
La consciencia siempre está ocupada por las cosas.
La consciencia es como un espejo: reflejo/reflejante.
Estará contenta de permanecerdentro e ir en profundidad hasta que comprenda las cosas claramente.
La disposición ayuda a fijar la experiencia de conocer en la respiración y luego en contenidos que destinen mayor sabiduría.
En meditación samādhi (de tranquilidad)podemos hacer la experiencia de esa separación, viendo citta como laque conoce y el cuerpo como el que está siendo conocido.
No en sentido dual, puesto que la meditación no trabaja con conceptos.
La costumbre
Moral - Costumbre.
Implica Carácter.
muy frecuentemente pueden dar la tendencia a cittahacia una cierta dirección
Disponen a Citta.
Uno de los problemas que tenemos es que todos tendemos a pen-sar que las cosas están fijadas adentro.
La vida anímica es móvil, siempre está cambiate.
Heidegger - La vida es disposición afectiva, temple anímico.
ira puede prevalecer y cambiarel nivel de base de citta
Las acciones o tendencias de la vida práctica pueden forjar la base de citta.
Si pode-mos alcanzar alguna comprensión de nuestro propio nivel, podemoscomprender mejor dónde residen nuestras faltas, y qué podemos hacerpara corregirlas.
Visión moral de la vida para alcanzar la virtud.
El examen de la vida - Sócrates.
esto lo llamamos “la base de citta”, que significael nivel de citta.
¿Qué tanto hemos comprendido o reconocido la citta primordial?
El kamma que determina el siguiente nacimiento va a dictar en-tonces el nivel de citta en ese plano de la existencia.
La doctrina de la reencarnación. Simbólica de la moral religiosa ante el dhamma y el kamma.
Pero no es para nada una enti-dad, así como la vastedad del espacio tampoco es una entidad. Cittaes simplemente una realidad que sabe
Citta como realidad conocedora, acto de conocer, de estar sabido.
Las intenciones se encuentran en la persona, no en lacomputadora
El cuerpo y la mente no son impuros o malos por naturaleza, sino por el modo en que una persona las usa para sus propios fines. Ya sea para bien o para mal.
Pero a fin de liberar citta de las kilesas, tene-mos que disponer de ambos, el cuerpo y la mente, como mecanismosnecesarios para ver las kilesas en acción.
La única forma de ver el error o las impurezas es sobre el campo mismo de la acción.
Hay que reconocerlas actuando.
El cuer-po y la mente simplemente siguen, llevando a cabo los dictados de cit-ta
Citta ordena la acción y guia la vida de acuerdo con sus agregados mentales.
Al final, cittacosecha las consecuencias de estas acciones, que es la razón de quehaya tanto dolor y sufrimiento
La citta superficial crea el Kamma.
P. Ricoeur - finifud y culpabilidad. Nuestra falibilidad tiene mucho que ver con la finitud de nuestro conocimiento. El ser humano es labil.
pero las kilesas son tendenciosas,de modo que aprovechan la fuerza de la citta para propósitos dañinos.
Son tendencias, a medida que está formadas por las disposiciones mentales, la percepción y la consciencia individuada.
Podemos decir que citta es la esencia enuna persona, todo lo demás es periférico
Citta, es lo que define a una persona por su modo de ser-obrar-actuar.
Pero más aun, Citta es la esencia de una persona porque hay más que solo consciencia de sí en ella.
Aunque su alcance es inconmensurable, es paranosotros un misterio, una cantidad desconocida
La Citta primordial, siendo previa y anterior a la consciencia personal es inconmensurable.
a conciencia es superflua porque elverdadero conocimiento está siempre presente en la citta
La consciencia está fundada sobre los datos recibidos a posteriori de tomar carne, pero no logra avistar su propia donación aun. Está ciega todavía.
La conciencia es necesaria también para experimentar la dualidadde objeto y sujeto
La consciencia se ancla entonces a un pensamiento dual.
La conciencia esnecesaria para que citta, penetrada por la ignorancia, se relacione conotras cosas, y de este modo refuerce su propia existencia personal.
Forja su realidad a partir de la relación: física, conceptual, cultural.
La ignorancia fundamental, o avijjā,
La ignorancia fundamental como aquella que trae como consecuencia una vida superficial o basada en la ilusión.
Podríamos llamar a esto que se mueve enla superficie una citta superficial
Como olas en la superficie de un océano. Lo móvil.
No podemospercibir la esencia conocedora, porque el conocedor y el conocimientoson lo mismo.
Co-incidencia entre el conocedor y el conocimiento.
El conocimiento es acto puro.
no representaun objeto material.
Se trata de algo diferente a la materia.
La mente incorpora facultades mentales de sensación,memoria, pensamiento y conciencia, y habitualmente se la consideracomo aquello que piensa y recuerda.
La mayor parte de los sentidos internos. Ademas de las sensaciones que experimentan los órganos periféricos.
La malinterpretación disfrazada deconocimiento nunca lleva a la verdad.
Se equivoca el sentido.
Si pode-mos ver esto claramente
Despejar el sentido y la consciencia de las cosas.
De hecho, son meramentecondiciones cambiantes que nunca permanecen
Surgen y cesan: la impermanencia.
•••• Vacuidad.
Kruba Ajaans
Maestros y monjes budistas de la tradición tailandesa del bosque.
Kruba= monje de alto rango por su experiencia, se les considera autoridad mística. Ajaans= palabra del sánscrito que traduce "Maestro" o "Guía".
Énfasis en la meditación profunda.
la verdadera naturaleza de citta no puede serexpresada en palabras o conceptos.
La naturaleza de dicho fenómeno excede a los conceptos.
los estados dela mente existen en conjunción con el conocimiento de ellos
estados fluctuantes de la mente,
Lo móvil, contingente. (lo que surge y cesa)
STUDI ZERO – TEATRE SANS eScola d'Arts escèNiqueS Select LanguageAfrikaansAlbanianAmharicArabicArmenianAzerbaijaniBasqueBelarusianBengaliBosnianBulgarianCatalanCebuanoChichewaChinese (Simplified)Chinese (Traditional)CorsicanCroatianCzechDanishDutchEnglishEsperantoEstonianFilipinoFinnishFrenchFrisianGalicianGeorgianGermanGreekGujaratiHaitian CreoleHausaHawaiianHebrewHindiHmongHungarianIcelandicIgboIndonesianIrishItalianJapaneseJavaneseKannadaKazakhKhmerKoreanKurdish (Kurmanji)KyrgyzLaoLatinLatvianLithuanianLuxembourgishMacedonianMalagasyMalayMalayalamMalteseMaoriMarathiMongolianMyanmar (Burmese)NepaliNorwegianPashtoPersianPolishPortuguesePunjabiRomanianRussianSamoanScottish GaelicSerbianSesothoShonaSindhiSinhalaSlovakSlovenianSomaliSpanishSundaneseSwahiliSwedishTajikTamilTeluguThaiTurkishUkrainianUrduUzbekVietnameseWelshXhosaYiddishYorubaZuluSeleccionar idiomaespañolAbjasioAchenésAcholiAfarAfrikáansAimaraAlbanésAlemánAluramháricoárabeArmenioAsamésAvadhiAvarAzeríBalinésBaluchiBambaraBaouléBaskirBatak karoBatak SimalungunBatak tobaBembaBengalíBetawiBhoyapuríBielorrusoBikolBirmanoBosnioBretónBúlgaroBuriatoCamboyanocanarésCantonésCebuanoChamorroChechenoChecoChichewaChilubaChino (simplificado)Chino (tradicional)Chino hakkaChuvasioCingalésCoreanoCorsoCriollo haitianoCriollo mauricianoCriollo seychellenseCroataDanésDaríDinkaDiulaDivehiDogriDzongkhaEslovacoEslovenoEsperantoEstonioeuskeraEwéFeroésFilipinofinlandésFiyianoFonFrancésFrancés (Canadá)frisioFriulanoFulaniGaGaélico escocésGalésGallegoGeorgianogriegoguaraníGujaratiHausaHawaianohebreoHiligaynonHindiHmongHúngaroHunsrikIbanigboIlocanoIndonesioinglésInuktut (latino)Inuktut (silabario)IrlandésIslandésitalianoJaponésJavanésJingpoKalaallisutKanurikazajoKhasiKigaKikongoKinyarwandakirguísKirundiKitubaKokborokKomiKonkaníKrioKurdo (kurmanyi)Kurdo (sorani)LaoLatgalianolatínletónLigurLimburguéslingalaLituanoLombardoLugandaLuoLuxemburguésMacedonioMadurésMaithiliMakassarMalayalamMalayoMalayo (jawi)MalgachemaltésMamManésMaorímaratíMarí de las praderasMarshalésMarwariMaya yucatecoMeiteilon (manipuri)MinangkabauMizoMongolN'KoNáhuatl (Huasteca oriental)NdauNdebele meridionalNdombeneerlandésNepalbhasa (newarí)nepalíNoruegoNuerOccitanoOriyaOromoOséticoPampangoPangasinánPanyabí (gurmukhi)Panyabí (shahmukhi)PapiamentopastúnPatois jamaiquinoPersaPolacoPortugués (Brasil)Portugués (Portugal)QuechuaQuekchíRomaníRumanoRusoSamareñoSami septentrionalSamoanoSangoSánscritoSantalí (latino)Santalí (ol chiki)SepediSerbioSesotoSetsuanaShanShonaSicilianoSilesioSindhisomalísuajiliSuaziSuecoSundanésSusuTahitianotailandésTamashek (tifinag)TamazighttamilTártaroTártaro de Crimea (cirílico)Tártaro de Crimea (latino)tayikoTeluguTetunTibetanoTigrinyaTivTok pisinTonganoTrukésTsongaTuluTumbukaturcoturkmenoTuvinianoTwiUcranianoUdmurtoUigururduuzbecoVendaVénetoVietnamitaWólofXhosaYakutoyidisYorubaZapotecoZulúCon la tecnología de Traductor de Google Buscar: Barra lateral Menú
super guay
h. For example, they view individual variation as negative or unaccept-able, that is, one form or the other must be incorrect. Variation, however,reflects appropriate style and register shifts and produces innovation inour standards over time. So the very aspect of spoken la
Everything changes overtime, even language. This is why enforcing a rigid "spoken standard" is unrealistic
Figure 1.
I did not find a mention of the "Matching NA" note in fig 1A. I believe this relates to the need to match the NA of the collector lens to the NA of the objective but it would be good to clarify that. Is it also preferable that the NA of the optical fiber matches that of the collector lens?
vidéo
"e" sans accent, car on parle de la balise "video".
Addgene_33337
DOI: 10.1158/1541-7786.MCR-24-0652
Resource: RRID:Addgene_33337
Curator: @scibot
SciCrunch record: RRID:Addgene_33337
RRID:SCR_005109
DOI: 10.1158/1535-7163.MCT-24-0704
Resource: Strelka (RRID:SCR_005109)
Curator: @scibot
SciCrunch record: RRID:SCR_005109
RRID:AB_3073988
DOI: 10.1111/bph.70277
Resource: (Biodragon Cat# BF03008, RRID:AB_3073988)
Curator: @scibot
SciCrunch record: RRID:AB_3073988
Addgene_12251
DOI: 10.1101/2025.11.29.691251
Resource: RRID:Addgene_12251
Curator: @scibot
SciCrunch record: RRID:Addgene_12251
RRID:AB_2313606
DOI: 10.1093/narcan/zcaf045
Resource: (Vector Laboratories Cat# BA-1000, RRID:AB_2313606)
Curator: @scibot
SciCrunch record: RRID:AB_2313606
RRID:AB_2
DOI: 10.1002/advs.202510811
Resource: None
Curator: @evieth
SciCrunch record: RRID:AB_2576522
Synthèse du Webinaire : Utiliser Canva pour les Actions Associatives
Ce document de synthèse résume les points clés et les enseignements du webinaire "Apprendre à utiliser Canva pour vos actions associatives", organisé par Solidatech.
La session, animée par des expertes de Canva, visait à doter les associations des connaissances nécessaires pour utiliser efficacement la plateforme Canva dans leurs communications, avec un focus particulier sur la création d'affiches pour le recrutement de bénévoles.
Les principaux points à retenir sont les suivants :
1. Canva Solidaire : L'information la plus cruciale pour les associations est l'existence de "Canva Solidaire", une offre qui donne un accès gratuit et complet à Canva Pro pour les associations loi 1901 éligibles, permettant d'intégrer jusqu'à 10 membres d'équipe.
2. Principes de Conception Graphique : Une bonne conception d'affiche repose sur cinq piliers fondamentaux : la hiérarchisation de l'information, le branding (identité visuelle), la visibilité (impact visuel), la lisibilité (confort de lecture) et la composition (équilibre des éléments).
3. Fonctionnalités Clés : La plateforme Canva est un outil tout-en-un puissant et intuitif. Les fonctionnalités essentielles présentées incluent l'utilisation de modèles (templates), la personnalisation via le "Kit d'Identité Visuelle" (marque), la manipulation des calques, et la déclinaison rapide des créations pour différents formats (réseaux sociaux, impression).
4. Intelligence Artificielle (IA) : Canva intègre des outils d'IA accessibles ("Studio Magique") qui permettent de réaliser des tâches complexes simplement, comme la suppression ou la génération d'arrière-plans, la capture de texte sur une image aplatie, et même la génération de code HTML pour des formulaires.
5. Ressources et Formation : Les participants ont été encouragés à explorer la Canva Design School, une section de la plateforme offrant des cours et tutoriels gratuits.
De plus, pour trouver des modèles spécifiquement créés par des graphistes français, il est conseillé d'utiliser le mot-clé de recherche "FR association".
En conclusion, le webinaire a positionné Canva comme un allié stratégique pour les associations, leur permettant de professionnaliser leur communication visuelle avec des ressources limitées, tout en favorisant la collaboration et l'efficacité.
--------------------------------------------------------------------------------
Le webinaire a été organisé par Solidatech pour accompagner les associations dans leur transformation numérique. L'événement a accueilli deux intervenantes expertes de la communauté Canva pour présenter la plateforme et ses applications concrètes pour le secteur associatif.
• Organisateur : Solidatech, représenté par Camille.
• Intervenantes Canva :
◦ Anne-Gaël : Community Manager de la communauté des "Créators" (graphistes créant les modèles pour la bibliothèque Canva) et des "Édus Créateurs" (enseignants créant du contenu pédagogique). ◦ Alisée : Directrice artistique, Brand Consultante et ambassadrice Canva, spécialisée dans l'accompagnement des porteurs de projet et des associations.
• Thème Principal : Utiliser Canva pour créer des supports de communication, spécifiquement des affiches de recrutement de bénévoles, en lien avec la Journée Internationale des Bénévoles.
Solidatech
Solidatech est une coopérative d'utilité sociale et environnementale dont la mission est d'aider les associations à renforcer leur impact grâce au numérique. L'organisation accompagne plus de 45 000 associations. Son action repose sur deux piliers :
1. Réaliser des économies :
◦ Logiciels : Identification de solutions gratuites ou obtention de remises sur des logiciels payants. ◦ Matériel : Fourniture de matériel reconditionné (par leur coopérative d'insertion Les Ateliers du Bocage) et de matériel neuf (en partenariat avec Dell).
2. Monter en compétence sur le numérique :
◦ Formation : Organisme de formation certifié proposant des formations sur les enjeux du numérique et sur des outils spécifiques. ◦ Diagnostic : Outil de diagnostic numérique gratuit pour évaluer la maturité numérique d'une association. ◦ Ressources : Mise à disposition de contenus gratuits (articles, newsletters, webinaires).
Canva
Canva est une entreprise australienne fondée en 2013 par Mélanie Perkins avec la mission de "donner au monde le pouvoir de créer" (Empower the world to design). L'objectif est de démocratiser le design en rendant la création visuelle simple et accessible à tous, notamment grâce à un système de glisser-déposer.
Indicateur Clé
Chiffre
Présence mondiale
190 pays
Employés
Plus de 5 000
Utilisateurs actifs mensuels
260 millions
Revenu annualisé
3,5 milliards de dollars
Créations depuis 2013
40 milliards
Créations par seconde
Plus de 400
Utilisateurs (étudiants/enseignants)
Plus de 100 millions
Organisations à but non lucratif
Plus d'un million
Les valeurs de Canva incluent le fait d'être une "bonne personne", de simplifier la complexité, de viser l'excellence et d'œuvrer pour le bien commun.
Une partie importante de la présentation a été consacrée à Canva Solidaire, l'offre dédiée au secteur associatif.
• Principe : Canva Solidaire est l'équivalent de Canva Pro, mais offert gratuitement aux organisations éligibles.
• Avantages : Accès à toutes les fonctionnalités de Canva Pro, y compris plus de modèles, de photos, d'éléments, le Kit d'Identité Visuelle, la planification de contenu, et la possibilité d'intégrer jusqu'à 10 personnes gratuitement dans l'équipe.
• Éligibilité : L'offre s'adresse principalement aux associations loi 1901. Sont exclues les administrations publiques, les organisations éducatives (qui ont leur propre programme gratuit), et les clubs sportifs professionnels, entre autres.
• Procédure d'inscription :
1. Se rendre sur la page dédiée de Canva Solidaire.
2. Cliquer sur "Demander un compte Canva Solidaire".
3. S'inscrire ou se connecter avec un compte Canva existant.
4. Rechercher le nom de son association. Dans la plupart des cas, Canva la reconnaît via son numéro de déclaration en préfecture et valide le compte automatiquement.
5. Si l'association n'est pas trouvée, il est nécessaire de joindre des documents justificatifs (déclaration en préfecture, statuts de l'association).
6. Le support Canva confirme ensuite l'accès par e-mail.
Alisée a présenté une cartographie des fonctionnalités principales de l'interface Canva pour familiariser les utilisateurs, même débutants.
• Page d'accueil : Présente des raccourcis vers différents formats (présentations, réseaux sociaux, vidéos) et des menus pour accéder aux modèles, aux projets existants et à la planification.
• Modèles (Templates) : Le point de départ recommandé pour les débutants. Il s'agit d'une vaste bibliothèque de créations réalisées par les "Créators".
Astuce : Pour trouver des formats spécifiquement français (ex: marque-page), il est conseillé d'ajouter une astérisque (*) à la recherche.
• Menu de gauche (dans l'éditeur) :
◦ Design/Modèles : Pour rechercher et appliquer un nouveau modèle.
◦ Éléments : Contient les formes, illustrations, photos, vidéos, et audios.
◦ Marque : Section cruciale où l'association peut configurer son identité visuelle (logos, couleurs, polices). Une fois configuré, ce kit peut être appliqué en un clic à n'importe quel design pour garantir la cohérence.
◦ Importer : Pour ajouter ses propres fichiers (images, logos, vidéos).
◦ Texte, Projets, Applications : Autres outils de création et d'organisation.
• Sauvegarde automatique : Canva enregistre les créations en temps réel, évitant ainsi toute perte de travail en cas de problème technique.
Pour créer une affiche percutante, Alisée a détaillé cinq principes de design essentiels :
1. La Hiérarchisation : Organiser les informations de la plus importante à la moins importante.
Le titre doit attirer l'œil en premier, suivi des informations clés (date, lieu), puis des détails secondaires. L'œil humain "hiérarchise avant de comprendre".
2. Le Branding : Utiliser de manière cohérente les éléments de l'identité visuelle de l'association (couleurs, logo, polices, style d'illustration).
Cela permet une reconnaissance immédiate et renforce le professionnalisme. Par exemple, utiliser du vert pour une association écologique.
3. La Visibilité : S'assurer que l'affiche est visible et attire l'attention.
Cela passe par le choix des polices, la présence claire du logo, et l'intégration d'un appel à l'action ("Call to Action") clair et engageant (ex : "Rejoignez-nous !", "Devenez bénévole").
4. La Lisibilité : Garantir que le message est facile et agréable à lire. Il faut prêter attention au contraste des couleurs, à la taille des polices (éviter les polices fantaisistes pour les paragraphes longs), à l'espacement entre les lignes (interlignage) et aux marges. Le regard a tendance à balayer une page en "Z".
5. La Composition : L'agencement global des éléments sur la page.
Il faut travailler avec les alignements, les marges, les espaces négatifs (le "vide") pour créer un équilibre visuel et guider le regard du spectateur, assurant une bonne compréhension du message.
Le webinaire a présenté quelques outils d'IA intégrés dans le Studio Magique de Canva, conçus pour simplifier des tâches complexes.
• Génération d'arrière-plan : Possibilité de sélectionner une photo, de supprimer l'arrière-plan existant et d'en générer un nouveau à partir d'une simple description textuelle (prompt).
Par exemple, transformer une photo de bénévoles sur une plage en une scène dans la nature.
• Capture de texte : Cet outil permet de "détecter" le texte sur une image aplatie (comme un PDF ou un JPEG) et de le rendre entièrement modifiable.
C'est très utile pour mettre à jour une ancienne affiche dont on n'a plus le fichier source.
• Génération de code : Une fonctionnalité plus avancée a été montrée, où l'IA de Canva a généré le code HTML pour un formulaire de contact destiné au recrutement de bénévoles.
Ce code peut ensuite être intégré sur un site web ou dans un document.
Un enjeu majeur pour les associations est d'adapter leurs visuels pour différents canaux (flyer, publication Instagram, bannière web, etc.).
Deux méthodes ont été présentées :
1. Méthode 1 (Multi-formats dans un seul document) :
◦ Dans un design existant (ex: une affiche A4), on peut ajouter une nouvelle "page" et lui assigner un type de format différent (ex: publication Instagram, vidéo, présentation).
◦ Cela permet de conserver tous les éléments de base et de les réorganiser manuellement pour chaque format au sein d'un seul et même projet.
2. Méthode 2 (Fonction "Redimensionner" - Canva Pro) :
◦ Cette fonction permet de dupliquer automatiquement un design dans un ou plusieurs autres formats.
◦ L'utilisateur sélectionne les nouveaux formats désirés (ex: Story Instagram, Bannière Facebook).
◦ Canva crée de nouvelles versions du design aux bonnes dimensions, en tentant d'adapter les éléments.
Des ajustements manuels sont souvent nécessaires.
◦ Conseil d'experte : Il est crucial d'utiliser l'option "Copier et redimensionner" plutôt que "Redimensionner ce design" pour conserver le fichier original intact.
Pour permettre aux associations d'aller plus loin, les intervenantes ont partagé deux ressources clés :
• Trouver des modèles français : En utilisant le code de recherche FR association dans la barre de recherche de modèles, les utilisateurs peuvent accéder à une sélection de templates créés spécifiquement par la communauté des "Créators" français pour les besoins du secteur associatif.
• Canva Design School : Accessible directement depuis le menu de la plateforme, c'est une "école de design" gratuite intégrée.
Elle propose des cours, des leçons vidéos en français, et des activités pratiques pour maîtriser des outils spécifiques (vidéo, IA, etc.) et se perfectionner en design graphique.
La fin du webinaire a permis de clarifier plusieurs points importants :
• Droit d'utilisation des images : Toutes les images de la bibliothèque Canva sont libres de droit pour une utilisation dans des créations.
Il est possible de vendre des produits (t-shirts, tasses) avec un design créé sur Canva, à condition qu'il s'agisse d'une composition originale (texte, autres éléments ajoutés) et non d'une simple image de la bibliothèque apposée sur le produit.
• Nombre de polices : Pour une affiche, il est recommandé d'utiliser deux à trois polices (typos) maximum pour garantir la clarté et l'harmonie visuelle.
• Newsletters : Canva permet de créer le design d'une newsletter, mais n'est pas un outil d'envoi d'e-mails.
Le design doit être exporté (par exemple en lien HTML) pour être intégré dans un outil de mailing dédié (ex: Mailchimp).
• Confidentialité : Les créations réalisées sur un compte Canva sont privées et ne sont pas ajoutées à la bibliothèque publique de modèles.
• Langue de l'IA : Les outils d'IA de Canva comprennent et fonctionnent parfaitement avec des instructions en français.
ir
pour montrer que cette suspision envers les états-Unis étaient systématique et dépeint les états-Unis comme le principal adversaire de la Chine
际力量
tao guang yang hui est une stratégique que la Chine a mis sur pieds étant donnée sa perception de l'équilibre des puissances internationales
u Sud-Est. Les États-Unis ont vendu à la Chine des armes, notamment « du matériel d'a
collaboration proche ; Beijing achète les armes des États-Unis
cClassTrib
serve para determinar qual imposto cobrar e a aliquota. Opçoes: cClassTrib Significado / uso 000001 Tributação integral normal — sem benefício ou isenção especial. Metafiscal
000002 Tributação integral para “exploração de via” (tarifas, pedágios etc.). Metafiscal
620001 Tributação monofásica sobre combustíveis — regime específico. mm2025.intercode.net.br +1
620002 Variante da tributação monofásica com retenção sobre combustíveis. mm2025.intercode.net.br +1
620004 Monofásica para mistura de combustíveis com percentuais especiais. mm2025.intercode.net.br +1
200013 Redução de alíquota ou benefício fiscal (por exemplo, cesta básica de alimentos). Contadores +2 Portal CPA +2
Lei Complementar 214/2025
deixa o imposto mais simples da empresa entender, mas em cotra partida a pessoa so aproveita o imposto da parte agregada.
Note: This preprint has been reviewed by subject experts for Review Commons. Content has not been altered except for formatting.
Learn more at Review Commons
In this manuscript the authors evaluate the role of Microtubule Associated Protein 7 (MAP7) in postnatal Sertoli cell development. The authors build two novel transgenic mouse lines (Map7-eGFP, Map7 knockout) which will be useful tools to the community. The transgenic mouse lines are used in paired advanced sequencing experiments and advanced imaging experiments to determine how Sertoli cell MAP7 is involved in the first wave of spermatogenesis. The authors identify MAP7 as an important regulator of Sertoli cell polarity and junction formation with loss of MAP7 disrupting intracellular microtubule and F-actin arrangement and Sertoli cell morphology. These structural issues impact the first wave of spermatogenesis causing a meiotic delay that limits round spermatid numbers. The authors also identify possible binding partners for MAP7, key among those MYH9.
The authors did a great job building a complex multi-modal project that addressed the question of MAP7 function from many angles. The is an excellent balance of using many advanced methods while still keeping the project narrowed, to use only tools to address the real questions. The lack of quality testing on the germ cells outside of TUNEL is disappointing, but the Conclusion section implies that this sort of work is being done currently so the omission in this manuscript is acceptable. However, there is an issue with the imaging portion of the work on MYH9. The conclusions from the MYH9 data is currently overstated, super-resolution imaging of Map7 knockouts with microtubule and F-actin stains, and imaging that uses MYH9 with either Map7-eGFP or anti-MAP7 are also needed to both support the MAP7-MYH9 interaction normally and lack of interaction with failure of MYH9 to localize to microtubules and F-actin in knockouts. Since a Leica SP8 was used for the imaging, using either Leica LIGHTNING or just higher magnification will likely be the easiest solution.
This manuscript is nicely organized with almost all of the results spelled out very clearly and almost always paired with figures that make compelling and convincing support for the conclusions. There are minor revision suggestions for improving the manuscript listed below. These include synching up Figure and Supplemental Figure reference mismatches. There are also many minor, but important, details that need to be added to the Methods section including many catalog numbers and some references.
Referee cross-commenting
I generally agree with Reviewer 1 and specifically concur related to adding details about fertility assessment of the Map7 Knockout line, and enhancing the SEM imaging.
There are mouse lines, and datasets that will be useful resources to the field. This work also advances our understanding of a period in Sertoli cell development that is critical to fertility but very understudied.
Note: This preprint has been reviewed by subject experts for Review Commons. Content has not been altered except for formatting.
Learn more at Review Commons
Summary:
A previous study by Komada et al. demonstrated that MAP7 is expressed in both Sertoli and germ cells, and that Map7 gene-trap mutant mice display disrupted microtubule bundle formation in Sertoli cells, accompanied by defects in spermatid manchettes and germ cell loss. In the current study, Kikuchi et al. investigated the role of MAP7 in the formation of the Sertoli cell apical domain during the first wave of spermatogenesis. They generated a GFP-tagged MAP7 mouse line and demonstrated that the endogenous MAP7 protein localizes to the apical microtubules in Sertoli cells and to the manchette microtubules in step 9-11 spermatids. They also generated a new Map7 knockout (KO) mouse line in a genetic background distinct from the one used in the previous study. Focusing on stages before the emergence of step 9-11 spermatids, the authors aimed to isolate defects caused by the function of MAP7 in Sertoli cells. They report that loss of MAP7 impairs Sertoli cell polarity and apical domain formation, accompanied by the microtubule remodeling defect. Using the GFP-tagged MAP7 line, they performed immunoprecipitation-mass spectrometry and identified several MAP7-interacting proteins in the testis, including MYH9. They further observed that MAP7 deletion alters the distribution of MYH9. Single-cell RNA sequencing revealed that the loss of MAP7 in Sertoli cells resulted in slight transcriptomic shifts but had no significant impact on their functional differentiation. Single-cell RNA sequencing analysis also showed delayed meiotic progression in the MAP7-deficient testis. Overall, while the study provides some interesting discoveries of early Sertoli cell defects in MAP7-deficient testes, some conclusions are premature and not fully supported by the presented data. The mechanistic investigations remain limited in depth.
Major comments:
Minor comments:
Referee cross-commenting
I concur with Reviewer 2 that the Map7-eGFP mouse model is a valuable tool for the research community. I also agree that performing MAP7-MYH9 double immunofluorescence staining to demonstrate their colocalization would further strengthen the authors' conclusions regarding their interaction. My overall assessment of the manuscript remains unchanged: the study represents an incremental advance that extends previous findings on MAP7 function but provides limited new mechanistic insight.
This study investigates the role of the microtubule-associated protein MAP7 in Sertoli cell polarity and apical domain formation during early stages of spermatogenesis. Using GFP-tagged and MAP7 knockout mouse models, the authors show that MAP7 localizes to apical microtubules and is required for Sertoli cell cytoskeletal organization and germ cell development. While the study identifies early Sertoli cell defects and candidate MAP7-interacting proteins, the mechanistic insights remain limited, and several conclusions require stronger experimental support. Overall, the discovery represents an incremental advance that extends prior findings on MAP7 function, providing additional but modest insights into the role of MAP7 in cytoskeletal regulation in male reproduction.
la table
Manque "balise" entre les deux.
ces
Les cases de qui ? Du tableau, donc "ses" à la place de "ces". En tout cas, j'ai l'impression que c'est plus "ses" que "ces".
The average concentration of E. coli at any sampling time after correction for blank and related clearance rates are shown for every batch in Fig. 1a and b (test 1) and Fig. 2a and b (test 2). Initial concentrations of 7.3×10⁶ bacterial cells/ml (test 1) and 2.3×10⁷ bacterial cells/ml (test 2) were found.
The study began with very high concentrations of E. coli, measuring 7.3×10⁶ cells/mL and 2.3×10⁷ cells/mL. How quickly were the sponges able to reduce these bacterial levels over time?
Author response:
The following is the authors’ response to the original reviews.
Reviewer #1 (Public Review):
Faiz et al. investigate small molecule-driven direct lineage reprogramming of mouse postnatal mouse astrocytes to oligodendrocyte lineage cells (OLCs). They use a combination of in vitro, in vivo, and computational approaches to confirm lineage conversion and to examine the key underlying transcription factors and signaling pathways. Lentiviral delivery of transcription factors previously reported to be essential in OLC fate determination-Sox10, Olig2, and Nkx2.2-to astrocytes allows for lineage tracing. They found that these transcription factors are sufficient in reprogramming astrocytes to iOLCs, but that the OLCs range in maturity level depending on which factor they are transfected with. They followed up with scRNA-seq analysis of transfected and control cultures 14DPT, confirming that TF-induced astrocytes take on canonical OLC gene signatures. By performing astrocyte lineage fate mapping, they further confirmed that TF-induced astrocytes give rise to iOLCs. Finally, they examined the distinct genetic drivers of this fate conversion using scRNA-seq and deep learning models of Sox10- astrocytes at multiple time points throughout the reprogramming. These findings are certainly relevant to diseases characterized by the perturbation of OLC maturation and/or myelination, such as Multiple Sclerosis and Alzheimer's Disease. Their application of such a wide array of experimental approaches gives more weight to their findings and allows for the identification of additional genetic drivers of astrocyte to iOLC conversion that could be explored in future studies. Overall, I find this manuscript thoughtfully constructed and only have a few questions to be addressed.
(1) The authors suggest that Sox10- and Olig2- transduced astrocytes result in distinct subpopulations iOLCs. Considering it was discussed in the introduction that these TFs cyclically regulate one another throughout differentiation, could they speculate as to why such varying iOLCs resulted from the induction of these two TFs?
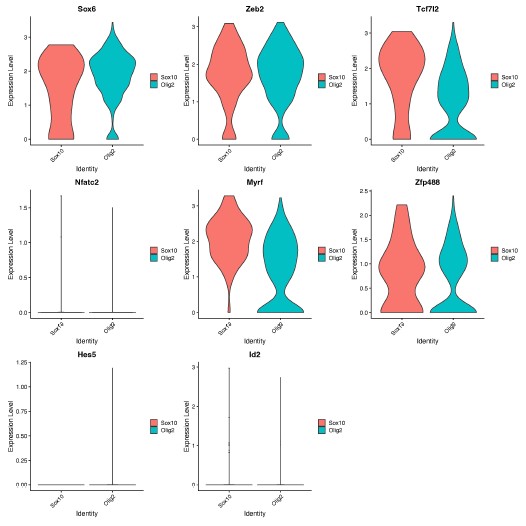
We thank the Reviewer for the opportunity to speculate. We hypothesize that Sox10 and Olig2 may induce different OLCs as a result of differential activation of downstream genes within the gene regulatory network, which are important for OPC, committed OLC and mature OL identity [1]. In support of this, we found different expression levels of genes involved in downstream OLC specification networks [1], including Sox6, Tcfl2 and Myrf, at D14 (Author response image 1), following further analysis of our RNA-seq data.
Author response image 1.
Expression of OLC regulatory network genes in Sox10- and Olig2- cultures. Violin plots show gene expression levels (log-normalized) of downstream OLC regulatory genes (Sox6, Zeb2, Tcf7l2, Myrf, Zfp488, Nfatc2, Hes5, Id2) between Sox10 and Olig2 treated OLCs at 14 days post transduction. Analysis was performed on oligodendrocyte progenitor and mature oligodendrocyte clusters (from Manuscript Figure 1D, clusters 3 and 8).
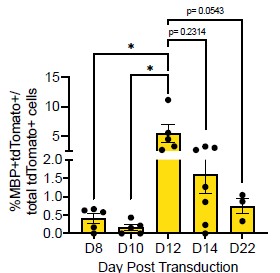
(2) In Figure 1B it appears that the Sox10- MBP+ tdTomato+ cells decreases from D12 to D14. Does this make sense considering MBP is a marker of more mature OLCs?
Thank you for this comment. To address this, we compared the number of MBP+tdTomato+ Sox10 cells across reprogramming timepoints. We saw no difference between the number of MBP+tdTomato+ OLs at D12 and D14 (Author response image 2, p = 0.2314). However, we do see a [nonsignificant] decrease in MBP+tdTomato+ Sox10 cells from D12 to D22 (Manuscript Supplementary Figure 3B, Author response image 2, p= 0.0543), which suggests that culture conditions are not optimal for longer-term cell survival [2], [3], [4].
Author response image 2.
Comparison of Sox10- induced MBP+tdTomato+ iOLCs over time. Quantification of MBP<sup>+</sup>tdTomato<sup>+</sup> iOLs in Sox10 cultures at D8 (n=5), D10 (n=5), D12 (n=5), D14 (n=7) and D22 (n=3) post transduction. Data are presented as mean ± SEM, each data point represents one individual cell culture experiment, Brown-Forsythe and Welch ANOVA on transformed percentages with Dunnett’s T3 multiple comparisons test (*= p<0.05).
(3) Previous studies have shown that MBP expression and myelination in vitro occurs at the earliest around 4-6 weeks of culturing. When assessing whether further maturation would increase MBP positivity, authors only cultured cells up to 22 DPT and saw no significant increase. Has a lengthier culture timeline been attempted?
We agree with the Reviewer that previous studies of pluripotent stem cell derived (hESCs or iPSCs) have shown MBP+ OLCs in vitro around 4-6 weeks [5], [6], [7]. However, studies of neural stem cells [8] or fibroblasts [9] conversion show OLC appearance after 7 and 24 days, respectively, demonstrating that OLCs can be generated in vitro within 1-3 weeks of plating. Moreover, as noted above in response to #2, we see fewer MBP+ cells at 22DPT, suggesting that extended time in culture may require additional factors for support. Therefore, we did not attempt longer timepoints.
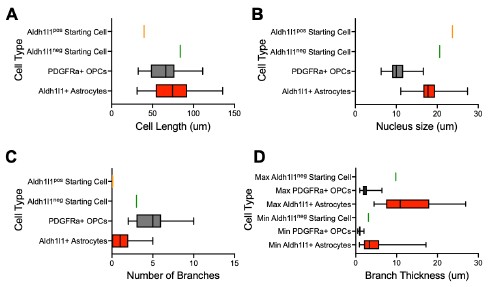
(4) Figure S4D is described as "examples of tdTomatonegzsGreen+OLCmarker+ cells that arose from a tdTomatoneg cell with an astrocyte morphology." The zsGreen+ tdTomato- cell is not convincingly of "astrocyte morphology"; it could be a bipolar OLC. To strengthen the conclusions and remove this subjectivity, more extensive characterizations of astrocyte versus OLC morphology in the introduction or results are warranted. This would make this observation more convincing since there is clearly an overlap in the characteristics of these cell types.
We thank the reviewer for this excellent suggestion. To assess astrocyte morphology, we measured the cell size, nucleus size, number of branches and branch thickness of 70 Aldh1l1+tdTomato+ astrocytes in tamoxifen-labelled Aldh1l1-CreERT2;Ai14 cultures (new Supplemental Table 1). To assess OPC morphology, we performed IHC for PDGFRa in iOLC cultures and measured the same parameters in 70 PDGFRa+ OPCs (new Supplemental Table 1). We found that astrocytes were characterized by larger branch thickness, cell length and nucleus size, while OPCs showed a larger number of branches (new Supplemental Figure 1, and Author response image 3 below). Based on this framework, the AAV9-GFAP::zsGreen<sup>pos</sup>Aldh1l1-tdTomato<sup>neg</sup> and AAV9-GFAP::zsGreen<sup>pos</sup>Aldh1l1-tdTomato<sup>pos</sup>starting cells tracked fall within the bounds of ‘astrocytes’. We have revised the manuscript to include this more rigorous characterization (Line 119-124, Page 4; Line 307-312, Page 9; Line 323-326, Page 9). We also demonstrate (below) that the GFAP::zsGreen<sup>pos</sup> Aldh1l1-tdTomato<sup>pos</sup> and GFAP::zsGreen<sup>pos</sup>Aldh1l1-tdTomato<sup>neg</sup> starting cell depicted in Figure 2G and Supplemental Figure 5D is consistent with astrocyte morphology (Author response image 3).
Author response image 3.
Morphological characterization of astrocytes, oligodendrocyte lineage cells, and starting cells. Quantification of the (A) cell length, (B) nucleus size, (C) number of branches, and (D) branch thickness iAldh1l1+tdTomato+ and PDGFRα+ OPCs (n= 70 per cell type, data are presented as mean ± SEM). Orange line indicates parameter value for GFAP::zsGreen<sup>pos</sup>Aldh1l1-tdTomato<sup>pos</sup> starting cell in Figure 2G. Green line indicates parameter value for GFAP::zsGreen<sup>pos</sup> Aldh1l1-tdTomato<sup>neg</sup> starting cell in Supplemental Figure 5D.
Reviewer #2 (Public Review):
The study by Bajohr investigates the important question of whether astrocytes can generate oligodendrocytes by direct lineage conversion (DLR). The authors ectopically express three transcription factors - Sox10, Olig2 and Nkx6.2 - in cultured postnatal mouse astrocytes and use a combination of Aldh1|1-astrocyte fate mapping and live cell imaging to demonstrate that Sox10 converts astrocytes to MBP+ oligodendrocytes, whereas Olig2 expression converts astrocytes to PDFRalpha+ oligodendrocyte progenitor cells. Nkx6.2 does not induce lineage conversion. The authors use single-cell RNAseq over 14 days post-transduction to uncover molecular signatures of newly generated iOLs.
The potential to convert astrocytes to oligodendrocytes has been previously analyzed and demonstrated. Despite the extensive molecular characterization of the direct astrocyteoligodendrocyte lineage conversion, the paper by Bajohr et al. does not represent significant progress. The entire study is performed in cultured cells, and it is not demonstrated whether this lineage conversion can be induced in astrocytes in vivo, particularly at which developmental stage (postnatal, adult?) and in which brain region. The authors also state that generating oligodendrocytes from astrocytes could be relevant for oligodendrocyte regeneration and myelin repair, but they don't demonstrate that lineage conversion can be induced under pathological conditions, particularly after white matter demyelination. Specific issues are outlined below.
We thank the reviewer for this summary. We agree that there are a handful of reports of astrocytelike cells to OLC conversion [10], [11]. However, our study is the first study to confirm bonafide astrocyte to OLC conversion, which is important given the recent controversy in the field of in vivo astrocyte to neuron reprogramming [12]. In addition, the extensive characterization of the molecular timeline of reprogramming, highlights that although conversion of astrocytes is possible by ectopic expression of any of the three factors, the subtypes of astrocytes converted and maturity of OLCs produced may vary depending on the choice of TF delivered. Our findings will inform future in vivo studies of iOLC generation that aim to understand the impact of brain region, age, pathology, and sex, which are especially important given the diversity of astrocyte responses to disease [13], [14], [15].
(1) The authors perform an extensive characterization of Sox10-mediated DLR by scRNAseq and demonstrate a clear trajectory of lineage conversion from astrocytes to terminally differentiated MBP+ iOLCs. A similar type of analysis should be performed after Olig2 transduction, to determine whether transcriptomics of olig2 conversion overlaps with any phase of sox10 conversion.
We thank the Reviewer for this excellent comment. We chose to include an in-depth analysis of Sox10 in the manuscript, as Sox10-transduced cultures showed a higher percentage of mature iOLCs compared to Olig2 in our studies. We have added this specific rationale to the manuscript (Line 329-330-Page 9).
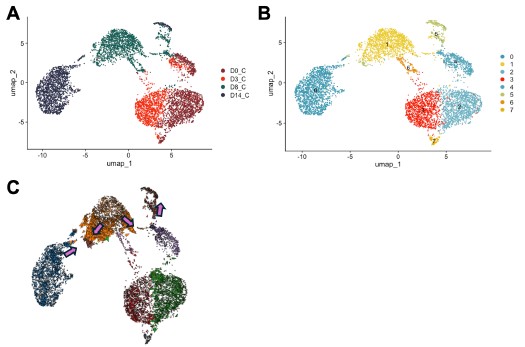
Nonetheless, we also agree that understanding the underpinnings of Olig2-mediated conversion is important. Therefore, we used Cell Oracle [16] to understand the regulation of cell identity by Olig2. in silico overexpression of Olig2 in our control time course dataset (D0, D3, D8 and D14) showed cell movement from cluster 1, characterized by astrocyte genes [Mmd2[17], Entpd2[18], H2-D1[19]], towards cluster 5, characterized by OPC genes [Pdgfra[20], Myt1[21]] validating astrocyte to OLC conversion by Olig2 (Author response image 4).
We hypothesize that reprogramming via Sox10 and Olig2 take different conversion paths to oligodendrocytes for the following reasons.
(1) Differential astrocyte gene expression at D14 when cells are exposed to Sox10 and Olig2 (Manuscript Figure 1D-E [Sox10 characterized by Lcn2[19], C3[19]; Olig2 characterized by Slc6a11[22], Slc1a2[23]].
(2) Differential expression of key OLC gene regulatory network genes at D14 between cells treated with Sox10 and Olig2 (Author response image 1).
Author response image 4.
in silico modeling of Olig2 reprogramming (A) UMAP clustering of Cre control treated cells from 0, 3, 8, and 14 days post transduction (DPT). (B) UMAP clustering from (A) overlayed with timepoint and treatment group. (C) Cell Oracle modeling of predicted cell trajectories following Olig2 knock in (KI), overlaid onto UMAP plot. Arrows indicate cell movement prediction with Olig2 KI perturbation.
(2) A complete immunohistochemical characterization of the cultures should be performed at different time points after Sox10 and Olig2 transduction to confirm OL lineage cell phenotypes.
We performed a complete immunohistochemical characterization of Ai14 cultures transduced with GFAP::Sox10-Cre and GFAP::Olig2-Cre. This system allows permanent labelling and therefore, enabled the tracking of transduced cells through the process or DLR, which we believe is the most appropriate way to characterize iOLC conversion efficiencies. We then confirmed the conversion of Aldh1l1+ astrocytes in Aldh1l1-CreERT2;Ai14 cultures transduced with GFAP::Sox10-zsGreen and GFAP::Olig2-zsGreen. In this system, GFAP drives the expression of zsGreen, and therefore, may not faithfully track all cells and lead to an underestimate of the numbers of converted cells. For example, iOLCs from Aldh1l1<sup>neg</sup> astrocytes or iOLCs that have lost zsGreen expression following conversion. Therefore we use this system only to confirm astrocyte origin.
Nonetheless, we appreciate this comment and recognize that there may be differences in conversion efficiencies when analyzing Aldh1l1+ astrocytes versus all transduced cells. Therefore, we have softened the language in the manuscript (see below) regarding Olig2 and Sox10 generating different OLC phenotypes and now claim iOLC generation from both Sox10 and Olig2. We thank the Reviewer for this comment, and believe it has strengthened the discussion.
Line 240, Page 7
Line 261-263, Page 8
Line 304-307, Page 8/9
Line 413-414, Page 11
References
(1) E. Sock and M. Wegner, “Using the lineage determinants Olig2 and Sox10 to explore transcriptional regulation of oligodendrocyte development,” Dev Neurobiol, vol. 81, no. 7, pp. 892–901, Oct. 2021, doi: 10.1002/dneu.22849.
(2) B. A. Barres, M. D. Jacobson, R. Schmid, M. Sendtner, and M. C. Raff, “Does oligodendrocyte survival depend on axons?,” Current Biology, vol. 3, no. 8, pp. 489–497, Aug. 1993, doi: 10.1016/0960-9822(93)90039-Q.
(3) A.-N. Cho et al., “Aligned Brain Extracellular Matrix Promotes Differentiation and Myelination of Human-Induced Pluripotent Stem Cell-Derived Oligodendrocytes,” ACS Appl. Mater. Interfaces, vol. 11, no. 17, pp. 15344–15353, May 2019, doi: 10.1021/acsami.9b03242.
(4) E. G. Hughes and M. E. Stockton, “Premyelinating Oligodendrocytes: Mechanisms Underlying Cell Survival and Integration,” Front. Cell Dev. Biol., vol. 9, Jul. 2021, doi: 10.3389/fcell.2021.714169.
(5) M. Ehrlich et al., “Rapid and efficient generation of oligodendrocytes from human induced pluripotent stem cells using transcription factors,” Proc Natl Acad Sci U S A, vol. 114, no. 11, pp. E2243–E2252, Mar. 2017, doi: 10.1073/pnas.1614412114.
(6) Y. Liu, P. Jiang, and W. Deng, “OLIG gene targeting in human pluripotent stem cells for motor neuron and oligodendrocyte differentiation,” Nat Protoc, vol. 6, no. 5, pp. 640–655, May 2011, doi: 10.1038/nprot.2011.310.
(7) S. A. Goldman and N. J. Kuypers, “How to make an oligodendrocyte,” Development, vol. 142, no. 23, pp. 3983–3995, Dec. 2015, doi: 10.1242/dev.126409.
(8) M. Faiz, N. Sachewsky, S. Gascón, K. W. A. Bang, C. M. Morshead, and A. Nagy, “Adult Neural Stem Cells from the Subventricular Zone Give Rise to Reactive Astrocytes in the Cortex after Stroke,” Cell Stem Cell, vol. 17, no. 5, pp. 624–634, Nov. 2015, doi:10.1016/j.stem.2015.08.002.
(9) F. J. Najm et al., “Transcription factor–mediated reprogramming of fibroblasts to expandable, myelinogenic oligodendrocyte progenitor cells,” Nat Biotechnol, vol. 31, no. 5, pp. 426–433, May 2013, doi: 10.1038/nbt.2561.
(10) A. Mokhtarzadeh Khanghahi, L. Satarian, W. Deng, H. Baharvand, and M. Javan, “In vivo conversion of astrocytes into oligodendrocyte lineage cells with transcription factor Sox10; Promise for myelin repair in multiple sclerosis,” PLoS One, vol. 13, no. 9, p. e0203785, Sep. 2018, doi: 10.1371/journal.pone.0203785.
(11) S. Farhangi, S. Dehghan, M. Totonchi, and M. Javan, “In vivo conversion of astrocytes to oligodendrocyte lineage cells in adult mice demyelinated brains by Sox2,” Mult Scler Relat Disord, vol. 28, pp. 263–272, Feb. 2019, doi: 10.1016/j.msard.2018.12.041.
(12) L.-L. Wang, C. Serrano, X. Zhong, S. Ma, Y. Zou, and C.-L. Zhang, “Revisiting astrocyte to neuron conversion with lineage tracing in vivo,” Cell, vol. 184, no. 21, pp. 5465-5481.e16, Oct. 2021, doi: 10.1016/j.cell.2021.09.005.
(13) I Matias, J. Morgado, and F. C. A. Gomes, “Astrocyte Heterogeneity: Impact to Brain Aging and Disease,” Front. Aging Neurosci., vol. 11, Mar. 2019, doi: 10.3389/fnagi.2019.00059.
(14) N. Habib et al., “Disease-associated astrocytes in Alzheimer’s disease and aging,” Nat Neurosci, vol. 23, no. 6, pp. 701–706, Jun. 2020, doi: 10.1038/s41593-020-0624-8.
(15) M. A. Wheeler et al., “MAFG-driven astrocytes promote CNS inflammation,” Nature, vol. 578, no. 7796, pp. 593–599, Feb. 2020, doi: 10.1038/s41586-020-1999-0.
(16) K. Kamimoto, B. Stringa, C. M. Hoffmann, K. Jindal, L. Solnica-Krezel, and S. A. Morris, “Dissecting cell identity via network inference and in silico gene perturbation,” Nature, vol. 614, no. 7949, pp. 742–751, Feb. 2023, doi: 10.1038/s41586-022-05688-9.
(17) P. Kang et al., “Sox9 and NFIA coordinate a transcriptional regulatory cascade during the initiation of gliogenesis,” Neuron, vol. 74, no. 1, pp. 79–94, Apr. 2012, doi:10.1016/j.neuron.2012.01.024.
(18) K. Saito et al., “Microglia sense astrocyte dysfunction and prevent disease progression in an Alexander disease model,” Brain, vol. 147, no. 2, pp. 698–716, Nov. 2023, doi:10.1093/brain/awad358.
(19) S. A. Liddelow et al., “Neurotoxic reactive astrocytes are induced by activated microglia,” Nature, vol. 541, no. 7638, pp. 481–487, Jan. 2017, doi: 10.1038/nature21029.
(20) Q. Zhu et al., “Genetic evidence that Nkx2.2 and Pdgfra are major determinants of the timing of oligodendrocyte differentiation in the developing CNS,” Development, vol. 141, no. 3, pp. 548–555, Feb. 2014, doi: 10.1242/dev.095323.
(21) J. A. Nielsen, J. A. Berndt, L. D. Hudson, and R. C. Armstrong, “Myelin transcription factor 1 (Myt1) modulates the proliferation and differentiation of oligodendrocyte lineage cells,” Mol Cell Neurosci, vol. 25, no. 1, pp. 111–123, Jan. 2004, doi:10.1016/j.mcn.2003.10.001.
(22) J. Liu, X. Feng, Y. Wang, X. Xia, and J. C. Zheng, “Astrocytes: GABAceptive and GABAergic Cells in the Brain,” Front. Cell. Neurosci., vol. 16, Jun. 2022, doi:10.3389/fncel.2022.892497.
(23) A. Sharma et al., “Divergent roles of astrocytic versus neuronal EAAT2 deficiency on cognition and overlap with aging and Alzheimer’s molecular signatures,” Proceedings of the National Academy of Sciences, vol. 116, no. 43, pp. 21800–21811, Oct. 2019, doi:10.1073/pnas.1903566116
Author response:
The following is the authors’ response to the original reviews.
Reviewer #1 (Public review):
(1)How is this simplified model representative of what is observed biologically? A bump model does not naturally produce oscillations. How would the dynamics of a rhythm generator interact with this simplistic model?
Bump models naturally produce sequential activity, and can be engineered to repeat this sequential activity periodically (Zhang, 1996; Samsonovich and McNaughton, 1997; Murray and Escola, 2017). This is the basis for the oscillatory behavior in the model presented here. As we describe in our paper, such a model is consistent with numerous neurobiological observations about cell-type-specific connectivity patterns. The reviewer is, however, correct to point out that our model does not incorporate other key neurobiological features--in particular, intracellular dynamical properties--that have been shown to play important roles in rhythm generation. Our aim in this work is to establish a circuit-level mechanism for rhythm generation, complementary to classical models that rely on intracellular dynamics for rhythm generation. Whether and how these mechanisms work together is something that we plan to explore in future work, and we have added a sentence to the Discussion to this effect.
(2) Would this theoretical construct survive being expressed in a biophysical model? It seems that it should, but even a simple biological model with the basic patterns of connectivity shown here would greatly increase confidence in the biological plausibility of the theory.
We thank the reviewer for pointing out this way to strengthen our paper. We implemented the connectivity developed in the rate models in a spiking neuron model which used EI-balanced Poisson noise as input drive. We found that we could reproduce all the main results of our analysis. In particular, with a realistic number of neurons, we observed swimming activity characterized by (i) left-right alternation, (ii) rostal-caudal propagation, and (iii) variable speed control with constant phase lag. The spiking model demonstrates that the connectivity-motif based mechanisms for rhythmogenesis that we propose are robust in a biophysical setting.
We included these results in the updated manuscript in a new Results subsection titled “Robustness in a biophysical model.”
(3) How stable is this model in its output patterns? Is it robust to noise? Does noise, in fact, smooth out the abrupt transitions in frequency in the middle range?
The newly added spiking model implementation of the network demonstrates that the core mechanisms of our models are robust to noise, since the connectivity is randomly chosen and the input drive is Poisson noise.
To test the effect of noise as it is parametrically varied, we also added noise directly to the rate models in the form of white noise input to each unit. Namely, the rate model was adapted to obey the stochastic differential equation
\[
\tau_i \frac{dr_i(t)}{dt} = -r_i(t) + \left[ \sum_j W_{ij} r_j(t - \Delta_{ij}) + D_i + \sigma\xi_t \right]_+
\]
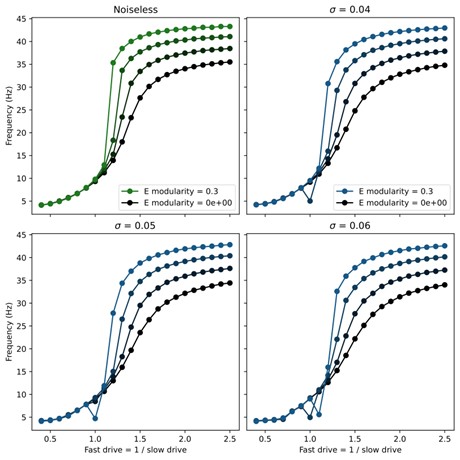
Here $\xi_t$ is a standard Gaussian white noise and $\sigma$ sets the strength of the noise. We found that the swimming patterns were robust at all frequencies up to $\sigma = 0.05$. Above this level, coherent oscillations started to break down for some swim frequencies. To investigate whether the noise smoothed out abrupt transitions, we swept through different values of noise and modularity of excitatory connections. The results showed very minor improvement in controllability (see figure below), but this was not significant enough to include in the manuscript.
Author response image 1.
(4) All figure captions are inadequate. They should have enough information for the reader to understand the figure and the point that was meant to be conveyed. For example, Figure 1 does not explain what the red dot is, what is black, what is white, or what the gradations of gray are. Or even if this is a representative connectivity of one node, or if this shows all the connections? The authors should not leave the reader guessing.
All figure captions have been updated to enhance clarity and address these concerns.
Reviewer #2 (Public review):
(1) Figure 1A, if I interpret Figure 1B correctly, should there not be long descending projections as well that don't seem to be illustrated?
Thank you for highlighting this potential point of confusion. The diagram in question was only intended to be a rough schematic of the types of connections present in the model. We have added additional descending connections as requested
(2)Page 5, It would be good to define what is meant by slow and fast here, as this definition changes with age in zebrafish (what developmental age)?
We have updated the manuscript to include the sentence: “These values were chosen to coincide with observed ranges from larval zebrafish.” with appropriate citation.
Reviewer #3 (Public review):
(1) The authors describe a single unit as a neuron, be it excitatory or inhibitory, and the output of the simulation is the firing rate of these neurons. Experimentally and in other modeling studies, motor neurons are incorporated in the model, and the output of the network is based on motor neuron firing rate, not the interneurons themselves. Why did the authors choose to build the model this way?
We chose to leave out the motor neurons from our models for a few reasons. While motor neurons read out the rhythmic activity generated by the interneurons and may provide some feedback, they are not required for rhythmogenesis. In fact, interneuron activity (especially in the excitatory V2a neurons (Agha et al., 2024)) is highly correlated with the ventral root bursts within the same segment. This suggests that motor neurons are primarily a local readout of the rhythmic activity of interneurons; therefore, the rhythmic swimming activity can be deduced directly from the interneurons themselves.
Moreover, there is a lack of experimental observation of the connectivity between all the cell types considered in our model and motor neurons. Hence, it was unclear how we should include them in the model. To address this, we are currently developing a data-driven approach that will determine the proper connectivity between the motor neurons and the interneurons, including intrasegmental connections.
(2) In the single population model (Figure 1), the authors use ipsilateral inhibitory connections that are long-range in an ascending direction. Experimentally, these connections have been shown to be local, while long-range ipsilateral connections have been shown to be descending. What were the reasons the authors chose this connectivity? Do the authors think local ascending inhibitions contribute to rostrocaudal propagation, and how?
The long-range ascending ipsilateral inhibitory connections arises from a limitation of our modeling framework. The V1 neurons that provide these connections have been shown experimentally to fire later than other neurons (especially descending V2a neurons) within the same hemisegment (Jay et al., J Neurosci, 2023); however, our model can only produce synchronized local activity. Hence, we replace local phase offsets with spatial offsets to produce correctly structured recurrent phasic inputs. We are currently investigating a data-driven method for determining intrasegmental connectivity which should be able to produce the local phase offset and address this concern; however, this is beyond the scope of the current paper.
(3) In the two-population model, the authors show independent control of frequency and rhythm, as has been reported experimentally. However, in these previous experimental studies, frequency and amplitude are regulated by different neurons, suggesting different networks dedicated to frequency and amplitude control. However, in the current model, the same population with the same connections can contribute to frequency or amplitude depending on relative tonic drive. Can the authors please address these differences either by changes in the model or by adding to the Discussion?
Our prior experimental results that suggested a separation of frequency and amplitude control circuits focus on motor neuron recruitment, instead of interneuron activity (Jay et al., J Neurosci 2023; Menelaou and McLean, Nat Commun 2019). To avoid potential confusion about amplitudes of interneurons vs. of motor neurons, we have removed the results from Figure 3 about control of amplitude in the 2-population model, instead focusing this figure on the control of frequency via speed-module recruitment. For the same reason, we have removed the panel showing the effects of targeted ablations on interneuron amplitudes in Figure 7. We have kept the result about amplitude control in our Supplemental Figure S2 for the 8-population model, but we try to make it clear in the text that any relationship between interneuron amplitude and motor neuron amplitude would depend on how motor neurons are modeled, which we do not pursue in this work.
(4) It would be helpful to add a paragraph in the Discussion on how these results could be applicable to other model systems beyond zebrafish. Cell intrinsic rhythmogenesis is a popular concept in the field, and these results show an interesting and novel alternative. It would help to know if there is any experimental evidence suggesting such network-based propagation in other systems, invertebrates, or vertebrates.
We have expanded a paragraph in the Discussion to address these questions. In particular, we highlight how a recent study of mouse locomotor circuits produced a model with similar key features (Komi et al., 2024). These authors made direct use of experimentally determined connectivity structure and cell-type distributions, which informed a model that produced purely network-based rhythmogenesis. We also point out that inhibition-dominated connectivity has been used for understanding oscillatory behavior in neural circuits outside the context of motor control (Zhang, 1996; Samsonovich and McNaughton, 1997; Murray and Escola, 2017). Finally, we address a study that used the cell-type specific connectivity within the C. Elegans locomotor circuit as the architecture for an artificial motor control system and found that the resulting system could more efficiently learn motor control tasks than general machine learning architectures (Bhattasali et al. 2022). Like our model, the Komi et al. and Bhattasali et al. models generate rhythm via structured connectivity motifs rather than via intracellular dynamical properties, suggesting that these may be a key mechanism underlying locomotion across species.
Reviewer #1 (Recommendations for the authors):
(1) Express this modeling construct in a simple biophysical model.
See the new Results subsection titled “Robustness in a biophysical model.”
(2) Please cite the classic models of Kopell, Ermentrout, Williams, Sigvardt etc., especially where you say "classic models".
We have added relevant citations including the mentioned authors.
(3) "Rhythmogenesis remain incompletely understood" changed to "Rhythmogenesis remains incompletely understood".
We chose not to make this change since the ‘remain’ refers to the plural ‘core mechanisms’ not the singular ‘rhythmogenesis’.
Reviewer #3 (Recommendations for the authors):
(1) The figures are well made; however, it would help to add more details to the figure legends. For example, what neuron's firing rate is shown in Figure 1C? What is the red dot in 1B? Figures 3E,F,G: what is being plotted? Mean and SD? Blue dot in Figure 5C?
All figure captions have been updated to enhance clarity and address these concerns.
(2) A, B text missing in Figure 7.
We have revised this figure and its caption; please see our response to Comment 3 above.
(3) It would be nice to see the tonic drive pattern that is fed to the model for each case, along with the different firing rates in the figures. It would help understand how the tonic drive is changed to rhythmic activity.
The tonic drive in the rate models is implemented as a constant excitatory input that is uniform across all units within the same speed-population. There is no patterning in time or location to this drive.
References
(1) Moneeza A Agha, Sandeep Kishore, and David L McLean. Cell-type-specific origins of locomotor rhythmicity at different speeds in larval zebrafish. eLife, July 2024
(2) Nikhil Bhattasali, Anthony M Zador, and Tatiana Engel. Neural circuit architectural priors for embodied control. In S. Koyejo, S. Mohamed, A. Agarwal, D. Belgrave, K. Cho, and A. Oh, editors, Advances in Neural Information Processing Systems, volume 35, pages 12744–12759. Curran Associates, Inc., 2022.
(3) Salif Komi, August Winther, Grace A. Houser, Roar Jakob Sørensen, Silas Dalum Larsen, Madelaine C. Adamssom Bonfils, Guanghui Li, and Rune W. Berg. Spatial and network principles behind neural generation of locomotion. bioRxiv, 2024
(4) James M Murray and G Sean Escola. Learning multiple variable-speed sequences in striatum via cortical tutoring. eLife, 6:e26084, May 2017.
(5) Alexei Samsonovich and Bruce L McNaughton. Path integration and cognitive mapping in a continuous attractor neural network model. Journal of Neuroscience, 17(15):5900–5920, 1997.
(6) K Zhang. Representation of spatial orientation by the intrinsic dynamics of the head-direction cell ensemble: a theory. Journal of Neuroscience, 16(6):2112–2126, 1996.
Ser libre para el republicanismo tiene que ver con la capacidad para ser dueños y amos de nuestras propias vidas en sentido pleno. Esta idea de libertad dentro del marco del pensamiento republicano está ligada a otros conceptos que son fundamentales, como el de la virtud cívica. Ser virtuosos dentro de una república implica el deber de involucrarse en los asuntos públicos y, por tanto, en el gobierno de la comunidad política (en distinto grado).
Podívejte se na další modely nůžkových stanů
Další řady nůžkových stanů + order: Optima, Pro, Pro-Led
Ovlivňuje počet barev na grafice cenu nůžkového stanu? Ne, v případě sublimačního tisku je cena potisku plachty neměnná bez ohledu na počet použitých barev.
Ovlivňuje design potisku cenu? Ne, v ceně hraje roli pouze rozsah potisku. Počet barev nebo náročnost designu už do ceny nijak nepromlouvá.
Dostáváte 3letou záruku na konstrukci stanů Octa Go a 10letý pozáruční servis.
Poskytujeme záruku 3 roky na konstrukci + náhradní díly skladem.
Jsou k dispozici náhradní díly pro stany Octa Go? Ano, od zakoupení stanu máte 10 let možnost zakoupit náhradní díly pro model Octa Go. Kromě přístupu k dílům získáváte také 10letý pozáruční servis.
Co když budu potřebovat náhradní díl? Všechny náhradní díly vč. opláštění držíme skladem, kromě toho držíme záruční i pozáruční servis. Nabízíme také posezónní repase u nás na výrobě.
Je náš stan Octa Go odolný vůči nepříznivému počasí? Stany Octa Go si skvěle osvědčují v náročných povětrnostních podmínkách. Vydrží vítr o rychlosti až 50 km/h a jejich konstrukce je odolná vůči korozi. Tkanina si zachovává intenzivní barvy, volitelně je k dispozici verze s dodatečnou ochranou proti slunečnímu záření (UV).
Je stan Octa GO odolný vůči nepříznivému počasí? Jednoznačně ANO! Hliníkovou konstrukci neohrožuje rez, opláštění je dvojitě impregnované a má podlepené švy, je tedy zcela nepromokavé. Správně ukotvený stan odolá rychlosti větru až do 50 km/h.
Co obdržím v sadě při koupi stanu Octa Go? V sadě k stanům Octa Go s potiskem obdržíte: odolnou a odolnou vůči poryvům větru, 100% hliníkovou konstrukci ve vybraném rozměru a z vybrané série, nepromokavou, odolnou plachtu stanu, odolný potisk, který odpovídá grafickému návrhu, ocelové kolíky pro ukotvení nohou, ocelové, otočné kolíky s nastavitelnými napínacími pásky, transportní obaly.
Co je součástí sady stanu Octa Go? - celohliníková konstrukce - nepromokavé opláštění - potisk nejvyšší kvality - kotvící set do měkkého podkladu - kotvící popruhy s kolíky - přepravní obaly Vše v závislosti na rozsahu Vaší objednávky.
Osmihranný profil nohy Zajišťuje stabilitu konstrukce, díky čemuž se stan nekýve a dobře obstojí i v náročných povětrnostních podmínkách. Garantuje dlouhou životnost celé konstrukce. Průřez profilu v modelu Octa Go je ⌀ 43 mm.
Osmihranný profil stanové nohy Jediný svého druhu na CZ a SK trhu! Garantuje odolnost a dlouhou životnost konstrukce. Průřez profilu je 43 mm a tloušťka stěny 2 mm.
Nůžkové stany Octa Go jsou ideálním řešením jako mobilní prodejní místa, informační stánky a na venkovní akce. Jsou lehké na přepravu a odolné vůči poryvům větru. Přístup k náhradním dílům po dobu 10 let od zakoupení zaručuje jejich spolehlivé používání po dlouhou dobu.
delete
Odolná konstrukce odolná vůči nepříznivému počasí
pls replace it by a suitable pictogram (e.g. clock) + text 60 sekund na postavení stanu
Pozáruční servis 10letý pozáruční servis a přístup k náhradním dílům
3letá záruka na konstrukci a náhradní díly skladem
Nůžkové stany Octa Go poskytují bezpečné a pevné zastřešení pro malé prostory Nůžkové stany ze série Octa Go jsou lehké, a přitom odolné a odolávají silným poryvům větru. Nejmenší model má rozměry 1,5 x 1,5 m, díky čemuž můžete využívat profesionální řešení i při omezeném prostoru pro akce.
Nůžkové stany Octa GO pro jakoukoliv akci Ačkoliv jde o základní řadu našich stanů, rozhodně se nejedná o kompromisní řešení. Celohliníková konstrukce bez praskajících plastových / kaučukových spojek dostupná od rozměru 1,5x1,5 do 3x6 m. Možnost libovolného potisku opláštění!
RRID:SCR_024202
DOI: 10.1038/s44320-025-00160-y
Resource: python-bx (RRID:SCR_024202)
Curator: @scibot
SciCrunch record: RRID:SCR_024202
Author response:
We thank the reviewers and editors for the careful evaluation of our manuscript. Below, we provide a first refutation of some of the concerns expressed by reviewers.
Both reviewer 1 &3 underscore the importance of controlling for genetic backgrounds. This is actually an issue only for a limited part of the study and this criticism should not apply to major findings of this study, with some exceptions, as detailed below.
It is important to note that we have identified ourselves several of the mutant lines we have been using. For instance, key and MyD88 mutant alleles have been identified in the Exelixis transposon insertion collection that we have screened in collaboration with this firm (e.g., [3, 4, 5]). This resource has been generated in a isogenized w [A5001] strain[6], which we are using as matched control for these mutants (Figs 1B,D). Of note, while they share a common genetic background, the phenotypes of key and MyD88 are opposite in terms of sensitivity to OMV challenge. The imd<sup>shadok</sup> null allele had been identified during our chemical mutagenesis screen with EMS in a yw cn bw background [5, 7, 8, 9], which was used as a control (FigS1A).
With respect to Hayan (Fig. 2C, Fig. S2C) and eater (Fig. S2A-B) mutants[10, 11, 12], we find a similarly strong phenotype with two independent mutants in distinct genetic backgrounds (actually three for Hayan, as we have not included in our original manuscript the Hayan<sup>SK3</sup>allele generated in the Lemaitre laboratory in which OMVs displayed also impaired virulence). We have shown that the Hayan mutants do display the expected phenotype in terms of PPO cleavage (Fig. S2D). Please, also note that in Fig. S2C the two mutant alleles are tested in the same experiment: even though there is some variation between the w<sup>1118</sup> and the w[A5001] strains, the two mutants behave in a remarkably similar manner. As regards the role of the cellular response, we note that we obtained results similar to those obtained with eater mutants using genetic ablation of hemocytes (Fig. 2A) or by saturating the phagocytosis apparatus (Fig. 2B), a confirmation by two totally-independent approaches.
Of note, the observed eater and Hayan phenotypes are strong and not relatively small and thus unlikely to be due to the genetic background.
The PPO mutants have been isogenized in the w<sup>1118</sup> by the lab of Bruno Lemaitre[13, 14] and are also validated biochemically in Fig. S2D. These mutants have been extensively tested in the Lemaitre laboratory[13, 14, 15].
With respect to RNAi silencing driven ubiquitously or in specific tissues using the UAS-Gal4 system, we have mostly used transgenes from the Trip collection and have used as a control the mCherry RNAi provided by this resource[16]. As the RNAi transgenes have been generated in the same genetic background, it follows that independently of the driver used, the genetic background used in mCherry and genes-of-interest (Duox, Nox, Jafrac2) silenced flies is controlled for (Fig. 3D,E).
For UAS-Gal4-mediated overexpression of fly superoxide dismutase genes, we have used SOD1 and SOD2 transgenes that have both been generated by the same laboratory (Phillips laboratory, University of Guelph) presumably in the same genetic background. Using two distinct drivers we find a strongly enhanced susceptibility phenotype when using UAS-SOD2 but not UAS-SOD1 transgenes (Fig. 3F, Fig. 4E). Importantly, the former is associated with mitochondria whereas the other is expressed in the endoplasmic reticulum: we independently confirm this phenotype using the mitoTempo mitochondrial ROS inhibitor.
We shall thus address the criticism with NOS mutants, where genetic background control is indeed critical and for the UAS-kay RNAi line using a Trip line and its associated mCherry RNAi control transgene.
With respect to the Toll pathway mutants, we agree that some of the variability of the phenotypes may be due to the genetic background, especially as regards tube and pelle. The SPE and grass mutants have been retrieved in a screen performed by the group of Jean-Marc Reichhart in our Research Unit. They thus have been generated in the same genetic background, yet grass displays a mildly decreased virulence of injected OMVs whereas SPE mutants display an opposite phenotype (compare Fig. S1E to S1I; the survival experiment shave been performed in the same set of experiments and have been separated for clarity). We do not intend to analyze further the mutants of the Toll pathway as our data suggest that the canonical Toll pathway, likely activated through psh (Fig. S1F) appears to be activated to detectable levels too late by comparison with the time course of OMV pathogenicity. In our opinion, the contribution of the Toll pathway in the host defense against OMV pathogenicity is minor, albeit we acknowledge that some of the findings, especially with SPE are puzzling.
With respect to the IMD pathway, we shall test also PGRP-LC and Relish mutants, as suggested by reviewers 2&3.
Reviewer 2 query: “It is unclear how many Serratia marcescens cells a 69 nL injection of 0.1 ng/nL OMVs corresponds to.”
OMVs were purified from 600 mL of SmDb11 cultures grown to an average OD<sub>600</sub> of 2.0. Based on a cell density of 0.8 × 10<sup>8</sup> cells/mL per OD unit, this corresponds to approximately 9.6 × 10<sup>10</sup> total bacterial cells.
Each OMV preparation was concentrated into a final volume of 400 µL, resulting in a concentration factor of ~1500× relative to the original culture. Therefore, an injection dose of 69 nL of OMVs is equivalent to 0.1 mL of the starting bacterial culture, which corresponds to:
0.2 OD units
Approximately 1.6 × 10<sup>7</sup> bacterial cells
It is likely that such high concentrations occur only toward the end of the infection, if OMVs are produced at the same rate in the host and in vitro.
With respect to other Reviewer 2 queries, we shall give a try at labeling OMVs with the FM4-64 lipophilic dye and examining whether they are taken up by hemocytes. However, an issue may arise with potentially high background, which has been encountered in cell culture. Of note, OMVs are known to attack cultured human THP1 cells, a monocyte cell line [17].Of note, determining whether OMVs are taken up by hemocytes may only be a starting point to understand how they promote the pathogenicity of OMVs. This question constitutes the topic of a full study that we are currently unable to undertake.
We shall also test whether we can document phospho-JNK expression in neural tissues.
Finally, we shall also confirm the data obtained with two elav-Gal4 drivers (including an inducible one) with the nsyb-Gal4 driver line.
References
(1) Xu R, et al. The Toll pathway mediates Drosophila resilience to Aspergillus mycotoxins through specific Bomanins. EMBO Rep 24, e56036 (2023).
(2) Huang J, et al. A Toll pathway effector protects Drosophila specifically from distinct toxins secreted by a fungus or a bacterium. Proc Natl Acad Sci U S A 120, e2205140120 (2023).
(3) Gobert V, et al. Dual Activation of the Drosophila Toll Pathway by Two Pattern Recognition Receptors. Science 302, 2126-2130 (2003).
(4) Gottar M, et al. Dual Detection of Fungal Infections in Drosophila via Recognition of Glucans and Sensing of Virulence Factors. Cell 127, 1425-1437 (2006).
(5) Gottar M, et al. The Drosophila immune response against Gram-negative bacteria is mediated by a peptidoglycan recognition protein. Nature 416, 640-644 (2002).
(6) Thibault ST, et al. A complementary transposon tool kit for Drosophila melanogaster using P and piggyBac. Nat Genet 36, 283-287 (2004).
(7) Rutschmann S, Jung AC, Hetru C, Reichhart J-M, Hoffmann JA, Ferrandon D. The Rel protein DIF mediates the antifungal, but not the antibacterial, response in Drosophila. Immunity 12, 569-580 (2000).
(8) Rutschmann S, Jung AC, Rui Z, Silverman N, Hoffmann JA, Ferrandon D. Role of Drosophila IKKg in a Toll-independent antibacterial immune response. Nat Immunology 1, 342-347 (2000).
(9) Jung A, Criqui M-C, Rutschmann S, Hoffmann J-A, Ferrandon D. A microfluorometer assay to measure the expression of ß-galactosidase and GFP reporter genes in single Drosophila flies. Biotechniques 30, 594- 601 (2001).
(10) Nam HJ, Jang IH, You H, Lee KA, Lee WJ. Genetic evidence of a redox-dependent systemic wound response via Hayan protease-phenoloxidase system in Drosophila. Embo J 31, 1253-1265 (2012).
(11) Kocks C, et al. Eater, a transmembrane protein mediating phagocytosis of bacterial pathogens in Drosophila. Cell 123, 335-346 (2005).
(12) Bretscher AJ, et al. The Nimrod transmembrane receptor Eater is required for hemocyte attachment to the sessile compartment in Drosophila melanogaster. Biology open 4, 355-363 (2015).
(13) Binggeli O, Neyen C, Poidevin M, Lemaitre B. Prophenoloxidase activation is required for survival to microbial infections in Drosophila. PLoS Pathog 10, e1004067 (2014).
(14) Dudzic JP, Kondo S, Ueda R, Bergman CM, Lemaitre B. Drosophila innate immunity: regional and functional specialization of prophenoloxidases. BMC Biol 13, 81 (2015).
(15) Dudzic JP, Hanson MA, Iatsenko I, Kondo S, Lemaitre B. More Than Black or White: Melanization and Toll Share Regulatory Serine Proteases in Drosophila. Cell reports 27, 1050-1061 e1053 (2019).
(16) Perkins LA, et al. The Transgenic RNAi Project at Harvard Medical School: Resources and Validation. Genetics 201, 843-852 (2015).
(17) Goman A, et al. Uncovering a new family of conserved virulence factors that promote the production of host-damaging outer membrane vesicles in gram-negative bacteria. J Extracell Vesicles 14, e270032 (2025).
Kde využiji kopulový stan Dome? Kopulový stan Dome nachází uplatnění všude tam, kde jsou důležité vzhled, funkčnost a vnímání značky jako prémiové. Zákazníci se rozhodují pro tento typ stanu nejen kvůli jeho jedinečnému designu, ale také proto, že přispívá k budování image značky z vyšší třídy. Skvěle se hodí jako expozice pro značku, která chce vyniknout mezi standardními řešeními. Může také sloužit jako místo setkání na veletrzích, kde jeho estetika podporuje profesionální image. Kromě toho kopulový stan Dome představuje efektní pozadí pro umělecké akce, premiéry a prezentace, které mají účastníkům dlouho zůstat v paměti. Je také ideálním řešením jako expozice na veletrzích, jejichž cílovou skupinou jsou zákazníci hledající produkty prémiové třídy. Výrobce kopulových stanů Vytváříme prostory, které přitahují pohledy a formují zážitky. Naše kopulové stany nejsou jen konstrukce, ale architektura emocí, místo setkání, expozice a odpočinku. Pro značky, které chtějí být zapamatovány. Pro akce, které mají zůstat v paměti dlouho po jejich skončení. Pro zákazníky, kteří očekávají více než standardní řešení. Každý stan vzniká v naší vlastní výrobní hale v Polsku, pod dohledem týmu, který zná každý detail konstrukce. To nám dává plnou kontrolu. Od prvního návrhu, přes výběr materiálů, až po precizní dokončení. Máte netradiční nápad? Potřebujete verzi “po svém”? Řekněte nám o tom. Přizpůsobíme projekt vaší vizi. Vytvořte prémiový stánek s kopulovým stanem Kopulový stan přitáhne pozornost svým moderním designem a výjimečným tvarem. Zajišťuje stabilní a funkční konstrukci, která se osvědčí i při nepříznivém počasí. Naši zákazníci si tento stan nejčastěji vybírají, když chtějí vytvářet image prémiové značky. Celkový dojem doplní reklamní vlajky, které výrazně zvyšují viditelnost stánku z velké vzdálenosti a vytvářejí dynamický propagační prvek, který přitahuje pohledy.
it´s already written several times above, is it necessary?
Je rozložení kopulového stanu těžké? I když rozložení kopulového stanu trvá 30-40 minut, nenech se tím zmást. Montáž není těžká a návod ti v tom pomůže. Můžeš také využít návod na YouTube.
Je montáž stanu Dome náročná? Fyzicky vůbec, na stavbu si vyčleňte cca 30 min. Využít můžete také náš video návod. +link
Je v sadě taška a kotvící set? Ano, v sadě najdete tašku a kotvící set pro stan k upevnění na zem.
Je v sadě přepravní obal a kotvení? Ano, vše je součástí kompletního stanu.
Lze stan Dome postavit na beton? Nafukovací stan můžete rozložit na betonu po použití volitelného setu s pískovými závažími.
Jde stan Dome postavit na betonu? Ano, za použití pískového závaží k jeho zabezpečení.
Osvětlení LED Připevňuje se přímo na konstrukci stanu. Osvětlení je k dispozici v provedeních s 1, 2 a 4 lampami.
use previous correction
Osvětlení LED Připevňuje se přímo na konstrukci stanu. Osvětlení je k dispozici v provedeních s 1, 2 a 4 lampami.
LED osvětlení Připevňuje se přímo na konstrukci, dostupné v provedení s 1, 2 a 4 LED zdroji.
Vynikněte a překvapte své zákazníky kopulovým stanem s vlastním potiskem Stan kopulový je rámová konstrukce, která nevyžaduje pumpu ani připojení k elektřině. Díky velké výšce umožňuje prezentaci větších elementů než klasické stany. Přesně přizpůsobený potah umožňuje jasné a nezdeformované zobrazení grafiky, což je důležité zejména u velkých reklamních potisků. Na přání může být materiál opatřen nehořlavou úpravou, která omezuje šíření ohně a splňuje normy PN-EN ISO 6940 a 6941.
Stan pro zvláštní příležitosti Hliníková konstrukce ve tvaru kopule a přesně padnoucí opláštění garantuje unikátní vzhled tohoto stanu. Jeho hlavní výhodou je ničím nerušený vysoký prostor pod střechou, kam můžete umístit nábytek, roll-up banner, televizi apod. Opláštění dostupné i ve variantě se sníženou hořlavostí dokážeme potisknout libovolným designem!
Odolná proti oděru grafika Umístěná na velké reklamní ploše stanu Dome. Vaše grafika se neodře.
Oděru odolný potisk Prochází až do struktury samotného vlákna, při odření látky tak potisk zůstává viditelný.
Jaká vylepšení má kopulový stan?
Klíčové vlastnosti stanu Dome
Podívejte se, jak vypadá kopulový stan Dome na akcích
Naše stany DOME v akci
Funkční kopulový stan s velkým reklamním prostorem Unikátní tvar umožňuje maximální využití plochy pro prezentaci grafických materiálů jak na stěnách, tak uvnitř kopule. Konstrukce umožňuje rychlou montáž bez potřeby použití dalších nástrojů nebo napájení. Velká plocha potahu poskytuje plnou svobodu v návrhu. Grafika může být přizpůsobena prostorovému uspořádání, bez deformací a přeskalování. To je řešení, které spojuje ochrannou funkci s nosičem vizuální komunikace značky.
Stan Dome +change the headline in the video as well Unikátní kopulový tvar umožňuje maximální využití zastřešeného prostoru. Konstrukce se snadno montuje bez použití jakéhokoliv nářadí! (next paragraph)Velká plocha opláštění je ideální pro přípravu atraktivního designu potisku, který realizujeme moderní metodou digitální sublimace.
Kompletní pozáruční servis a dostupnost náhradních dílů investice na léta, a ne produkt na “tři použití”.
Náhradní díly skladem vč. opláštění, pozáruční servis.
Osvětlení LED pro Jehlan Připevňuje se přímo na konstrukci. Dostupné v 1-, 2- a 4-halogenové verzi. Bílé světlo. Napájecí kabel o délce 5 m.
use previous correction
Hvězdový stan od MITKO, tedy plná bezpečnost To, co skutečně odlišuje hvězdový stan od MITKO, je bezpečnost konstrukce. Stany Jehlan jsou navrženy pro použití v náročných venkovních podmínkách. Jejich hliníkové stožáry o průměru až 76 mm jsou pevnou oporou, která v kombinaci s velkými ocelovými základy zajišťuje stabilitu celé konstrukce. Při správném ukotvení stan odolává poryvům větru o rychlosti až 100 km/h, což z něj činí nejbezpečnější volbu pro venkovní akce bez ohledu na počasí. Není to jen efektní prvek programu, ale také promyšlená investice do komfortu a klidu organizátorů. Potvrzením kvality je 2letá záruka a 10letý pozáruční servis, díky kterému máte jistotu, že i po letech můžete počítat s technickou podporou a dostupností náhradních dílů. Navíc v MITKO můžete počítat s bezplatným grafickým návrhem a plnou podporou obchodníka v každé fázi procesu, od prvního dotazu po realizaci. To je záruka, že vše proběhne hladce a hotový stan bude přizpůsoben jak vašim potřebám, tak vizuální identitě značky. Hvězdový stan – efektní prostor, který je vidět zdaleka Pokud chcete být dobře viditelní a mít solidní pracovní prostor uvnitř, volba je jednoduchá – hvězdový stan od MITKO. Unikátní konstrukce s centrálním stožárem a rozložitými rameny přitahuje pozornost, ale stejně důležité je, že poskytuje až 227 m² zastřešení bez bočních podpěr. V praxi to znamená místo na lehátka, pódium, lavice – a stále spoustu volnosti. Skvěle se hodí na rozsáhlé plochy, náměstí a všude tam, kde záleží na prvním dojmu. Hvězdový stan, který pracuje pro vaše branding S hvězdovým stanem od MITKO se snadno odlišíte. Můžete na něj natisknout velké logo nebo grafiku – díky výšce přes 4 metry budou viditelné i z dálky. Umístěte vedle reklamní vlajky, které ještě lépe přitáhnou pozornost a pomohou návštěvníkům najít váš stánek. Chcete, aby se zastavili na déle? Přidejte lehátka s vlastním potiskem a reklamní slunečníky – celé to bude vypadat souvisle a profesionálně, bez nutnosti shánět prvky z různých zdrojů. Flexibilita konstrukce hvězdového stanu (Jehlan) – vybíráte verzi, která se hodí k události Nemusíte hádat, zda se hvězdový stan osvědčí na vaší akci. V MITKO nabízíme tři konfigurace Jehlana Base: s 1, 2 nebo 3 stožáry. Díky tomu si vybíráte konstrukci přesně podle potřeb události – od menších realizací po velké venkovní akce. Nejčastěji vybíraná verze s jedním stožárem je kompromisem mezi silným vizuálním efektem a efektivním provozem. Montáž trvá od 30 do 45 minut a vyžaduje pouze 2–3 osoby, v závislosti na velikosti stanu. V případě potřeby můžete konstrukci rozšířit o boční stěny, vstupní předsíňku nebo bezpečnostní sadu (kolíky, šňůry, kladivo) – všechny prvky jsou připraveny k okamžitému použití. Hvězdový stan bez zprostředkovatelů Místo řetězce subdodavatelů – jedno místo, plná kontrola. Každý hvězdový stan MITKO vzniká v Polsku. Sami jej šijeme, testujeme a odesíláme přímo k vám. Máte konkrétní termín? Realizujeme ho bez problémů – nic nemusí cestovat přes půl Evropy. Neobvyklé požadavky, např. stěny s oknem? U nás je to standard, nikoli „volitelná verze za 6 týdnů“. Pokud je potřeba úprava – nenarazíte na infolinku, ale mluvíte s lidmi, kteří tento stan skutečně vytvářejí.
it´s already written several times above, is it necessary?
Podívejte se na naše realizace
is this part necessary, when we have above "Naše stany Jehlan v akci"?
Jak se starat o stan hvězdu, aby sloužil co nejdéle? Je třeba dbát na čistotu stanu, pravidelně ho čistit a sušit před uskladněním, aby se předešlo vzniku plísní a poškození materiálu. Snažte se stan skladovat na suchém místě.
Jak se o stan Jehlan starat, aby sloužil co nejdéle? Základem je jeho důkladné očištění před každým uskladněním, aby nedošlo ke vzniku plísně na opláštění, která jej může poškodit. Skladujte na suchém místě.
Je montáž stanu hvězda složitá? Kromě mnoha prvků není stan hvězda Jehlan těžký na rozkládání! Podívejte se na instruktážní video.
Je montáž Jehlanu složitá? Není, podívejte se na instruktážní video. +link
Potřebuji najmout více lidí na montáž? Ne. K rozložení stanu hvězda Jehlan stačí dvě osoby.
Kolik lidí je potřeba na montáž? K pohodlné a rychlé stavbě stačí 2 osoby.
Je nějaká záruka na stany hvězdy? Ano, dostáváte 2 roky záruky na konstrukci stanu hvězdy Jehlan.
Jakou na Jehlan poskytujete záruku? Na konstrukci poskytujeme záruku 2 roky, na opláštění a příslušenství 1 rok.
Přístroj na vytažení kotev Ocelová páka se solidním základem a držadlem pro vytažení kotev ze země. Rozměry pro přepravu: 76×20×8 cm, hmotnost cca 3,9 kg.
Přípravek pro vytažení kotev Ocelová páka s pevnou základnou a držadlem. Rozměry pro přepravu: 76×20×8 cm, hmotnost cca 3,9 kg.
Osvětlení LED pro Jehlan Připevňuje se přímo na konstrukci. Dostupné v 1-, 2- a 4-halogenové verzi. Bílé světlo. Napájecí kabel o délce 5 m.
LED osvětlení Připevňuje se přímo na stožár, dostupné v provedení s 1, 2 a 4 LED zdroji. Napájecí kabel 5 m.
Vzorník pro nastavení konstrukce zajišťuje přesné rozmístění prvků – bez chyb a oprav. Díky tomu stan vždy stojí dokonale napnutý a vypadá profesionálně.
Přípravek pro rozměření stavby zajišťuje přesné a rychlé umístění kotevních prvků konstrukce i opláštění. Stavbu tak zvládnete na 1. pokus!
Podívejte se na fotografie hvězdového stanu Jehlan
Naše stany Jehlan v akci
Trvanlivost hvězdového stanu od MITKO Potah hvězdového stanu od MITKO je vyroben z materiálu odolného vůči dešti a intenzivnímu slunečnímu záření. Tkanina si zachovává technické vlastnosti i při několika dnech používání za proměnlivých povětrnostních podmínek. Konstrukce stanu umožňuje jeho rozložení na několik dní bez nutnosti demontáže. Materiál se neprohýbá a zůstává napnutý. Stan si zachovává estetiku i po dlouhém čase používání. V případě poškození jednotlivých konstrukčních prvků nebo potahu zajišťujeme náhradní díly po dobu minimálně 10 let.
Odolnost stanu Jehlan Silné hliníkové stožáry o průměru 76 mm a nepromokavé opláštění dělají ze stanů Jehlan spolehlivou volbu pro větší akce. Stavba trvá řádově 30 min a při odpovídajícím kotvení odolá Jehlan rychlosti větru až do 100 km/h! (next paragraph)Přidejte možnost libovolného potisku a máte ideální řešení i pro déle trvající akce. V případě poškození držíme náhradní díly skladem a jejich výměnu zvládnete zcela sami! Případně můžeme stan po sezóně prohlédnout a repasovat na naší výrobě.
PausePlay% buffered00:0001:03Exit fullscreenEnter fullscreen Play Stan Jehlan nabízí velkou plochu zastřešení – dostatečnou pro umístění pódia, odpočinkové zóny nebo místa pro hosty. Konstrukce se opírá o centrální stožár a ocelový základ, což zajišťuje stabilitu i při několika dnech používání. Stan se osvědčí jak během jednodenních akcí, tak na událostech trvajících několik nebo dokonce několik dní. Po skončení akce jej lze složit a přepravit ve vlastním automobilu – délka nejdelších prvků se vejde do standardního zavazadlového prostoru kombi.
DELETE
Možnost plné grafické personalizace stan se stává nosičem značky a přitahuje pozornost na akcích.
Libovolný grafický design potisku Vás odliší od ostatních stanů.
cette apparence-là !).
Hello World
Es también una estrategiaretórica y un método político para el que yo pido más respeto dentro del feminismosocialista.
La ironía es un recurso estilístico importante porque no presenta la información como una verdad absoluta, sino que muestra como un discurso puede ser contradictorio y ambiguo en aquello que desconoce. Además, sirve de unión entre comunidades marginales y desafía las normas establecidas.
No existenada en el hecho de ser ‘mujer’ que una de manera natural a las mujeres. No existeincluso el estado de ’ser’ mujer, que, en sí mismo, es una categoría enormementecompleja construida dentro de contestados discursos científicosexuales y de otrasprácticas sociales
La autora revela que el propio concepto de "mujer" es problemático, ya que la experiencia femenina se construye en base a diferentes factores como son la raza, la clase social o la sexualidad. Por tanto, un feminismo inclusivo debería recoger todas las realidades sociales, basándose en políticas de afinidad y coaliciones donde no sea necesario identificarse con un problema, pero sí ser consciente de ello y aliarse para luchar contra él.
Reliability of TCP-IP
FLUSSO CORRETTO DI COME FUNZIONA UNA RICHIESTA WEB 1. Trovi il computer remoto → IP
Il browser scopre l’IP del server (es. di google.com). Questo dice quale macchina contattare.
Il tuo computer apre una connessione TCP verso quell’IP.
TCP fa queste cose:
stabilisce la connessione,
spezza i dati in pacchetti,
garantisce che arrivino in ordine,
richiede ritrasmissioni se qualcosa si perde.
TCP è quindi il trasportatore affidabile dei dati.
Per parlare HTTP, il browser contatta la porta 80 (o 443).
IP = dov’è il computer
Porta = quale applicazione dentro quel computer
Il tuo computer usa anche lui una porta, ma una porta alta e temporanea (es. 51234). Serve per distinguere quella connessione da altre.
A questo punto TCP è solo il tubo che trasporta i dati. Dentro quel tubo ci metti un messaggio HTTP, tipo:
GET /index.html HTTP/1.1 Host: www.google.com
HTTP è il linguaggio della richiesta.
Il server ha un programma (Apache, Nginx, ecc.) che:
ascolta su porta 80,
riceve la richiesta HTTP,
la interpreta,
manda una risposta HTTP dentro la stessa connessione TCP.
Il tutto ritorna al tuo browser.
RIASSUNTO IN UNA FRASE PERFETTA
IP ti porta al computer giusto, TCP ti fornisce un canale affidabile, la porta ti collega all’applicazione giusta, HTTP è il linguaggio della richiesta e della risposta
BIBLIOGRAPHIE [1] BAVELIER D., GREEN CS., DYE MWG. — Children, wired-for better and for worse. Neuron, 2010, 67 (5), 692-701. [2] CHAN PA., RABINOWITZ T. — A cross-sectional analysis of videogames and attention deficit hyperactivity disorder symptoms in adolescents. Ann. Gen. Psychiatry, 2006, 5, 16. [3] GENTILE DA., CHOO H., LIAU A., SIM T., LI D., FUNG D., KHOO A. — Pathological videogame use among youths : a two year longitudinal study. Pediatrics, 2011, 127 (2).
Bases réflexives sur laquelle s'est appuyer la séance
Séance du 6 mars 2012
date de la séance
L’Académie nationale de médecine recommande — une sensibilisation plus forte des parents, premiers éducateurs et exemples en la matière, portant sur le contrôle des jeux et du temps qui leur est consacré ; — une meilleure information des médecins sur le risque addictif des jeux d’argent en ligne et leurs conséquences néfastes ; — une modification des messages publicitaires afin que la promotion de ces jeux ne soit pas « ciblée » directement sur l’univers des adolescents (sport, musique, mode…) ; — une vrai politique d’information, de prévention et de soins face à cette nouvelle toxicomanie sans drogue à laquelle sont exposés en priorité les adolescents et qui doit dépasser la simple mention, en bas d’une publicité, des dangers potentiels des jeux d’argent en ligne.
recommandations émise par l'académie de médecine afin endiguer ce problème de santé publique
Considérant qu’il faut distinguer les comportements des enfants de ceux des adultes vis-à-vis des jeux sur écran dans la mesure, notamment, où les jeux d’argent sont en principe interdits aux mineurs et où les comportements à l’adolescence ne peuvent pas laisser préjuger de leur évolution à l’âge adulte ; Considérant que nous ne disposons pas des données nécessaires à une évaluation scientifique validée ;
Mise en garde évitant toute extrapolation
une prévalence des jeux d’argent en ligne de 7,24 %, dont 34 % de joueurs en ligne dépendants avec une corrélation à la consommation d’alcool et de tabac.
résultat d'une étude scientifique démontrant la prévalence addictif
Ces manifestations doivent inciter à une évaluation systématique de la part des médecins auprès des familles après avoir posé au moins deux questions : • de quel équipement l’enfant dispose-t-il dans sa chambre ? • combien de temps passe-t-il chaque jour devant un écran ?
évaluation médicale
Il convient de traiter séparément la problématique de l’enfant et de l’adolescent de celle de l’adulte, sachant que nous ne disposons pas de données sur la continuité/discontinuité de ces comportements à travers les différents âges de la vie.
Approche différentes selon stade de developpement
L’accès à ces jeux suscite des craintes du fait du risque de pratique excessive. Certains utilisent même le terme d’addiction, définie comme la perte de contrôle et la poursuite du comportement malgré ses conséquences négatives Cette définition très large a l’avantage de regrouper les consommations pathologiques de substances psychoactives (drogues, tabac, alcool) et les addictions comportementales (« addictions sans drogue ») où le comportement à visée hédonique (jeux pathologiques, achats compulsifs etc.) remplace la consommation du produit. Ces « nouvelles addictions », fait de société, impliquant des populations de tous âges, constituent un problème de santé publique
Argument Pour : Symptomes et qualification du trouble
Les technologies modernes (ordinateurs, tablettes, consoles, téléphones ….) mettent à la disposition de chacun de nouveaux modes de jeux: essentiellement jeux vidéo chez l’enfant et l’adolescent, auxquels s’ajoutent chez l’adulte les jeux d’argent en ligne.
Problématique
De la pratique excessive des jeux sur écrans aux addictions
Titre du document donnant le thème du communiqué
Pour l'image, mettre uniquement la photo et pas le texte qui n'est pas très lisible et fait doublon
ns la rec
ceci est un commentaire
eLife Assessment
Cryptovaranoides, a Late Triassic animal (some 230 Ma old), was originally described as a possibly anguimorph squamate, i.e., more closely related to snakes and some extant lizards than to other extant lizards, making Squamata much older than previously thought and providing a new calibration date inside it. Following a rebuttal and a defense, this fourth important contribution to the debate makes a convincing argument that Cryptovaranoides is not a squamate. Further comparisons to potentially closely related animals such as early lepidosauromorphs would greatly benefit this study, and parts of the text require clarification.
Reviewer #1 (Public review):
In the Late Triassic (around 230 Ma ago), southern Wales and adjacent parts of England were a karst landscape. The caves and crevices accumulated remains of small vertebrates. These fossil-rich fissure fills are being exposed in limestone quarrying. In 2022 (reference 13 of the article), a partial articulated skeleton and numerous isolated bones from one fissure fill were named Cryptovaranoides microlanius and described as the oldest known squamate - the oldest known animal, by some 50 Ma, that is more closely related to snakes and some extant lizards than to other extant lizards. This would have considerable consequences for our understanding of the evolution of squamates and their closest relatives, especially for its speed and absolute timing, and was supported in the same paper by phylogenetic analyses based on different datasets.
In 2023, the present authors published a rebuttal (ref. 18) to the 2022 paper, challenging anatomical interpretations and the irreproducible referral of some of the isolated bones to Cryptovaranoides. Modifying the datasets accordingly, they found Cryptovaranoides outside Squamata and presented evidence that it is far outside. In 2024 (ref. 19), the original authors defended most of their original interpretation and presented some new data, some of it from newly referred isolated bones. The present article discusses anatomical features and the referral of isolated bones in more detail, documents some clear misinterpretations, argues against the widespread but not justifiable practice of referring isolated bones to the same species as long as there is merely no known evidence to the contrary, further argues against comparing newly recognized fossils to lists of diagnostic characters from the literature as opposed to performing phylogenetic analyses and interpreting the results, and finds Cryptovaranoides outside Squamata again.
Although a few of the character discussions can probably still be improved, I see no sign that the discussion is going in circles or otherwise becoming unproductive. I can even imagine that the present contribution will end it.
Author response:
The following is the authors’ response to the original reviews.
Reviewer #1 (Public review):
In the Late Triassic and Early Jurassic (around 230 to 180 Ma ago), southern Wales and adjacent parts of England were a karst landscape. The caves and crevices accumulated remains of small vertebrates. These fossil-rich fissure fills are being exposed in limestone quarrying. In 2022 (reference 13 of the article), a partial articulated skeleton and numerous isolated bones from one fissure fill of end-Triassic age (just over 200 Ma) were named Cryptovaranoides microlanius and described as the oldest known squamate - the oldest known animal, by some 20 to 30 Ma, that is more closely related to snakes and some extant lizards than to other extant lizards. This would have considerable consequences for our understanding of the evolution of squamates and their closest relatives, especially for their speed and absolute timing, and was supported in the same paper by phylogenetic analyses based on different datasets.
In 2023, the present authors published a rebuttal (reference 18) to the 2022 paper, challenging anatomical interpretations and the irreproducible referral of some of the isolated bones to Cryptovaranoides. Modifying the datasets accordingly, they found Cryptovaranoides outside Squamata and presented evidence that it is far outside. In 2024 (reference 19), the original authors defended most of their original interpretation and presented some new data, some of it from newly referred isolated bones. The present article discusses anatomical features and the referral of isolated bones in more detail, documents some clear misinterpretations, argues against the widespread but not justifiable practice of referring isolated bones to the same species as long as there is merely no known evidence to the contrary, further argues against comparing newly recognized fossils to lists of diagnostic characters from the literature as opposed to performing phylogenetic analyses and interpreting the results, and finds Cryptovaranoides outside Squamata again.
Although a few of the character discussions and the discussion of at least one of the isolated bones can probably still be improved (and two characters are addressed twice), I see no sign that the discussion is going in circles or otherwise becoming unproductive. I can even imagine that the present contribution will end it.
We appreciate the positive response from reviewer 1!
Reviewer #2 (Public review):
Congratulations on this thorough manuscript on the phylogenetic affinities of Cryptovaranoides.
Thank you.
Recent interpretations of this taxon, and perhaps some others, have greatly changed the field's understanding of reptile origins- for better and (likely) for worse.
We agree, and note that while it is possible for challenges to be worse than the original interpretations, both the original and subsequent challenges are essential aspects of what make science, science.
This manuscript offers a careful review of the features used to place Cryptovaranoides within Squamata and adequately demonstrates that this interpretation is misguided, and therefore reconciles morphological and molecular data, which is an important contribution to the field of paleontology. The presence of any crown squamate in the Permian or Triassic should be met with skepticism, the same sort of skepticism provided in this manuscript.
We agree and add that every testable hypothesis requires skepticism and testing.
I have outlined some comments addressing some weaknesses that I believe will further elevate the scientific quality of the work. A brief, fresh read‑through to refine a few phrases, particularly where the discussion references Whiteside et al. could also give the paper an even more collegial tone.
We have followed Reviewer 2’s recommendations closely (see below) and have justified in our responses if we do not fully follow a particular recommendation.
This manuscript can be largely improved by additional discussion and figures, where applicable. When I first read this manuscript, I was a bit surprised at how little discussion there was concerning both non-lepidosauromorph lepidosaurs as well as stem-reptiles more broadly. This paper makes it extremely clear that Cryptovaranoides is not a squamate, but would greatly benefit in explaining why many of the characters either suggested by former studies to be squamate in nature or were optimized as such in phylogenetic analyses are rather widespread plesiomorphies present in crownward sauropsids such as millerettids, younginids, or tangasaurids. I suggest citing this work where applicable and building some of the discussion for a greatly improved manuscript. In sum:
(1) The discussion of stem-reptiles should be improved. Nearly all of the supposed squamate features in Cryptovaranoides are present in various stem-reptile groups. I've noted a few, but this would be a fairly quick addition to this work. If this manuscript incorporates this advice, I believe arguments regarding the affinities of Cryptovaranoides (at least within Squamata) will be finished, and this manuscript will be better off for it.
(2) I was also surprised at how little discussion there was here of putative stem-squamates or lepidosauromorphs more broadly. A few targeted comparisons could really benefit the manuscript. It is currently unclear as to why Cryptovaranoides could not be a stem-lepidosaur, although I know that the lepidosaur total-group in these manuscripts lacks character sampling due to their scarcity.
We are responding to (1) and (2) together. We agree with the Reviewer that a thorough comparison of Cryptovaranoides to non-lepidosaurian reptiles is critical. This is precisely what we did in our previous study: Brownstein et al. (2023)— see main text and supplementary information therein. As addressed therein, there is a substantial convergence between early lepidosaurs and some groups of archosauromorphs (our inferred position for Cryptovaranoides). Many of those points are not addressed in detail here in order to avoid redundancy and are simply referenced back to Brownstein et al. (2023). Secondly, stem reptiles (i.e., non-lepidosauromorphs and non-archosauromorphs), such as suggested above (millerettids, younginids, or tangasaurids), are substantially more distantly related to Cryptovaranoides (following any of the published hypotheses). As such, they share fewer traits (either symplesiomorphies or homoplasies), and so, in our opinion, we would risk directing losing the squamate-focus of our study.
We thus respectfully decline to engage the full scope of the problem in this contribution, but do note that this level of detailed work would make for an excellent student dissertation research program.
(3) This manuscript can be improved by additional figures, such as the slice data of the humerus. The poor quality of the scan data for Cryptovaranoides is stated during this paper several times, yet the scan data is often used as evidence for the presence or absence of often minute features without discussion, leaving doubts as to what condition is true. Otherwise, several sections can be rephrased to acknowledge uncertainty, and probably change some character scorings to '?' in other studies.
We strongly agree with the reviewer. Unfortunately, the original publication (Whiteside et al., 2021) did not make available the raw CT scan data to make this possible. As noted below in the Responses to Recommendations Section, we only have access to the mesh files for each segmented element. While one of us has observed the specimens personally, we have not had the opportunity to CT scan the specimens ourselves.
Reviewer #3 (Public review):
Summary:
The study provides an interesting contribution to our understanding of Cryptovaranoides relationships, which is a matter of intensive debate among researchers. My main concerns are in regard to the wording of some statements, but generally, the discussion and data are well prepared. I would recommend moderate revisions.
Strengths:
(1) Detailed analysis of the discussed characters.
(2) Illustrations of some comparative materials.
Thank you for noting the strengths inherent to our study.
Weaknesses:
Some parts of the manuscript require clarification and rewording.
One of the main points of criticism of Whiteside et al. is using characters for phylogenetic considerations that are not included in the phylogenetic analyses therein. The authors call it a "non-trivial substantive methodological flaw" (page 19, line 531). I would step down from such a statement for the reasons listed below:
(1) Comparative anatomy is not about making phylogenetic analyses. Comparative anatomy is about comparing different taxa in search of characters that are unique and characters that are shared between taxa. This creates an opportunity to assess the level of similarity between the taxa and create preliminary hypotheses about homology. Therefore, comparative anatomy can provide some phylogenetic inferences.
That does not mean that tests of congruence are not needed. Such comparisons are the first step that allows creating phylogenetic matrices for analysis, which is the next step of phylogenetic inference. That does not mean that all the papers with new morphological comparisons should end with a new or expanded phylogenetic matrix. Instead, such papers serve as a rationale for future papers that focus on building phylogenetic matrices.
We agree completely. We would also add that not every study presenting comparative anatomical work need be concluded with a phylogenetic analysis.
Our criticism of Whiteside et al. (2022) and (2024) is that these studies provided many unsubstantiated claims of having recovered synapomorphies between Cryptovaranoides and crown squamates without actually having done so through the standard empirical means (i.e., phylogenetic analysis and ancestral state reconstruction). Both Whiteside et al. (2022) and (2024) indicate characters presented as ‘shared with squamates’ along with 10 characters presented as synapomorphies (10). However, their actual phylogenetically recovered synapomorphies were few in number (only 3) and these were not discussed.
Furthermore, Whiteside et al. (2022) and (2024) comparative anatomy was restricted to comparing †Cryptovaranoides to crown squamates., based on the assumption that †Cryptovaranoides was a crown squamate and thus only needed to be compared to crown squamates.
In conclusion, we respectfully, we maintain such efforts are “non-trivial substantive methodological flaw(s)”.
(2) Phylogenetic matrices are never complete, both in terms of morphological disparity and taxonomic diversity. I don't know if it is even possible to have a complete one, but at least we can say that we are far from that. Criticising a work that did not include all the possibly relevant characters in the phylogenetic analysis is simply unfair. The authors should know that creating/expanding a phylogenetic matrix is a never-ending work, beyond the scope of any paper presenting a new fossil.
Respectfully, we did not criticize previous studies for including an incomplete phylogeny. Instead, we criticized the methodology behind the homology statements made in Whiteside et al. (2022) and Whiteside et al. (2024).
(3) Each additional taxon has the possibility of inducing a rethinking of characters. That includes new characters, new character states, character state reordering, etc. As I said above, it is usually beyond the scope of a paper with a new fossil to accommodate that into the phylogenetic matrix, as it requires not only scoring the newly described taxon but also many that are already scored. Since the digitalization of fossils is still rare, it requires a lot of collection visits that are costly in terms of time.
We agree on all points, but we are unsure of what the Reviewer is asking us to do relative to this study.
(4) If I were to search for a true flaw in the Whiteside et al. paper, I would check if there is a confirmation bias. The mentioned paper should not only search for characters that support Cryptovaranoides affinities with Anguimorpha but also characters that deny that. I am not sure if Whiteside et al. did such an exercise. Anyway, the test of congruence would not solve this issue because by adding only characters that support one hypothesis, we are biasing the results of such a test.
We would refer the Reviewer to their section (1) on comparative anatomy. As we and the Reviewer have pointed out, Whiteside et al. did not perform comparative anatomical statements outside of crown Squamata in their original study. More specifically, Whiteside et al. (2022, Fig. 8) presented a phylogeny where Cryptovaranoides formed a clade with Xenosaurus within the crown of Anguimorpha or what they termed “Anguiformes”, and made comparisons to the anatomies of the legless anguids, Pseudopus and Ophisaurus. Whiteside et al. (2024), abandoned “Anguiformes”, maintained comparisons to Pseudopus and emphasized affinities with Anguimorpha (but almost all of their phylogenies as published, they do not recover a monophyletic Angumimorpha unless amphisbaenians and snakes are considered to be anguimorphans. Thus, we agree that confirmation bias was inherent in their studies.
To sum up, there is nothing wrong with proposing some hypotheses about character homology between different taxa that can be tested in future papers that will include a test of congruence. Lack of such a test makes the whole argumentation weaker in Whiteside et al., but not unacceptable, as the manuscript might suggest. My advice is to step down from such strong statements like "methodological flaw" and "empirical problems" and replace them with "limitations", which I think better describes the situation.
We agree with the first sentence in this paragraph – there is nothing wrong with proposing character homologies between different taxa based on comparative anatomical studies. However, that is not what Whiteside et al. (2022) and (2024) did. Instead, they claimed that an ad hoc comparison of Cryptovaranoides to crown Squamata confirmed that Cryptovaranoides is in fact a crown squamate and likely a member of Anguimorpha. Their study did not recognize limitations, but rather, concluded that their new taxon pushed the age of crown Squamata into the Triassic.
As noted by Reviewer 2, such a claim, and the ‘data’ upon which it is based, should be treated with skepticism. We have elected to apply strong skepticism and stringent tests of falsification to our critique.
Reviewer #1 (Recommendations for the authors):
(1) Lines 596-598 promise the following: "we provide a long[-]form review of these and other features in Cryptovaranoides that compare favorably with non-squamate reptiles in Supplementary Material." You have kindly informed me that all this material has been moved into the main text; please amend this passage.
This has been deleted.
(2) Comments on science
41: I would rather say "an additional role".
This has been edited accordingly.
43: Reconstructing the tree entirely from extant organisms and adding fossils later is how Hennig imagined it, because he was an entomologist, and fossil insects are, on average,e extremely rare and usually very incomplete (showing a body outline and/or wing venation and little or nothing else). He was wrong, indeed wrong-headed. As a historical matter, phylogenetic hypotheses were routinely built on fossils by the mid-1860s, pretty much as soon as the paleontologists had finished reading On the Origin of Species, and this practice has never declined, let alone been interrupted. As a theoretical matter, including as many extinct taxa as possible in a phylogenetic analysis is desirable because it breaks up long branches (as most recently and dramatically shown by Mongiardino Koch & Parry 2020), and while some methods and some kinds of data are less susceptible to long-branch attraction and long-branch repulsion than others, none are immune; and while missing data (on average more common in fossils) can actively mislead parametric methods, this is not the case with parsimony, and even in Bayesian inference the problem is characters with missing data, not taxa with missing data. Some of you have, moreover, published tip-dated phylogenetic analyses. As a practical matter, molecular data are almost never available from fossils, so it is, of course, true that analyses which only use molecular data can almost never include fossils; but in the very rare exceptions, there is no reason to treat fossil evidence as an afterthought.
We agree and have changed “have become” to “is.”
49-50, 59: The ages of individual fissure fills can be determined by biostratigraphy; as far as I understand, all specimens ever referred to Cryptovaranoides [13, 19] come from a single fill that is "Rhaetian, probably late Rhaetian (equivalent of Cotham Member, Lilstock Formation)" [13: pp. 2, 15].
We appreciate this comment; the recent literature, however, suggests that variable ages are implied by the biostratigraphy at the English Fissure Fills, so we have chosen to keep this as is. Also note that several isolated bones were not recovered with the holotype but were discussed by Whiteside et al. (2024). The provenance of these bones was not clearly discussed in that paper.
59-60: Why "putative"? Just to express your disagreement? I would do that in a less misleading way, for example: "and found this taxon as a crown-group squamate (squamate hereafter) in their phylogenetic analyses." - plural because [19] presented four different analyses of two matrices just in the main paper.
We have removed this word.
121-124: The entepicondylar foramen is homologous all the way down the tree to Eusthenopteron and beyond. It has been lost a quite small number of times. The ectepicondylar foramen - i.e., the "supinator" (brachioradialis) process growing distally to meet the ectepicondyle, fusing with it and thereby enclosing the foramen - goes a bit beyond Neodiapsida and also occurs in a few other amniote clades (...as well as, funnily enough, Eusthenopteron in later ontogeny, but that's independent).
We agree. However, the important note here is that the features on the humerus of Cryptovaranoides are not comparable (differ in location and morphology) to the ent- and ectepondylar foramina in other reptiles, as we discuss at length. As such, we have kept this sentence as is.
153: Yes, but you [18] mistakenly wrote "strong anterior emargination of the maxillary nasal process, which is [...] a hallmark feature of archosauromorphs" in the main text (p. 14) - and you make the same mistake again here in lines 200-206! Also, the fact [19: Figure 2a-c] remains that Cryptovaranoides did not have an antorbital fenestra, let alone an antorbital fossa surrounding it (a fossa without a fenestra only occurs in some cases of secondary loss of the fenestra, e.g., in certain ornithischian dinosaurs). Unsurprisingly, therefore, Cryptovaranoides also does not have an orbital-as-opposed-to-nasal process on its maxilla [19: Figure 2a-c].
Line 243-249 (in original manuscript) deal with the emargination of maxillary nasal process (but this does not imply a full antorbital fenestra). We explicitly state that this feature alone "has limited utility" for supporting archosauromorph affinity.
158-173: The problem here is not that the capitellum is not preserved; from amniotes and "microsaurs" to lissamphibians and temnospondyls, capitella ossify late, and larger capitella attach to proportionately larger concave surfaces, so there is nothing wrong with "the cavity in which it sat clearly indicates a substantial condyle in life". Instead, the problem is a lack of quantification (...as has also been the case in the use of the exact same character in the debate on the origin of lissamphibians); your following sentence (lines 173-175) stands. The rest of the paragraph should be drastically shortened.
We appreciate this comment. We note that the ontogenetic variation of this feature is in part the issue with the interpretation provided by Whiteside et al. (2024). The issue is the lack of consistency on the morphology of the capitellum in that study. We are unclear on what the reviewer means by ‘quantification,’ as the character in question is binary.
250-252: It's not going to matter here, but in any different phylogenetic context, "sphenoid" would be confusing given the sphenethmoid, orbitosphenoid, pleurosphenoid, and laterosphenoid. I actually recommend "parabasisphenoid" as used in the literature on early amniotes (fusion of the dermal parasphenoid and the endochondral basisphenoid is standard for amniotes).
We have added "(=parabasisphenoid)" on first use but retain use of sphenoid because in the squamate and archosauromorph literature, sphenoid (or basisphenoid) is used more frequently.
314-315: Vomerine teeth are, of course, standard for sarcopterygians. Practically all extant amphibians have a vomerine toothrow, for example. A shagreen of denticles on the vomer is not as widespread but still reaches into the Devonian (Tulerpeton).
We agree, but vomerine teeth are rare in lepidosaurs and archosaurs and occur only in very recent clades e.g. anguids and one stem scincoid. Their presence in amphibians is not directly relevant to the phylogenetic placement of Cryptovaranoides among reptiles.
372: Fusion was not scored as present in [13], but as unknown (as "partial" uncertainty between states 0 and 1 [19:8]), and seemingly all three options were explored in [19].
We politely disagree with the reviewer; state 1 is scored in Whiteside et al. (2024).
377-383: Together with the partially fused NHMUK PV R37378 [13: Figure 4B, C; 19: 8], this is actually an argument that Cryptovaranoides is outside but close to Unidentata. The components of the astragalus fuse so early in extant amniotes that there is just a single ossification center in the already fused cartilage, but there are Carboniferous and Permian examples of astragali with sutures in the expected places; all of the animals in question (Diadectes, Hylonomus, captorhinids) seem to be close to but outside Amniota. (And yet, the astragalus has come undone in chamaeleons, indicating the components have not been lost.) - Also, if NHMUK PV R37378 doesn't belong to a squamate close to Unidentata, what does it belong to? Except in toothless beaks, premaxillary fusion is really rare; only molgin newts come to mind (and age, tooth size, and tooth number of NHMUK PV R37378 are wholly incompatible with a salamandrid).
The relevance of the astragalus is to the current discussion is unclear as we do not mention this element in our manuscript. We discuss the fusion in the premaxillae in response to previous comment.
471-474: That thing is concave. (The photo is good enough that you can enlarge it to 800% before it becomes too pixelated.) It could be a foramen filled with matrix; it does not look like a grain sticking to the outside of the bone. Also, spell out that you're talking about "suc.fo" in Figure 3j.
We are also a bit confused about this comment, as we state:
“Finally, we note here that Whiteside et al. [19] appear to have labeled a small piece of matrix attached to a coracoid that they refer to †C. microlanius as the supracoroacoid [sic] foramen in their figure 3, although this labeling is inferred because only “suc, supracoroacoid [sic]” is present in their figure 3 caption.” (L. 519-522, P. 17). We cannot verify that this structure is concave, as so we keep this text as is.
476-489: [19] conceded in their section 4.1 (pp. 11-12) that the atlas pleurocentrum, though fused to the dorsal surface of the axis intercentrum as usual for amniotes and diadectomorphs, was not fused to the axis pleurocentrum.
This is correct, as we note in the MS. The issue is whether these elements are clearly identifiable.
506-510: [19:12] did identify what they considered a possible ulnar patella, illustrated it (Figure 4d), scored it as unknown, and devoted the entire section 4.4 to it.<br /> 512-523: What I find most striking is that Whiteside et al., having just discovered a new taxon, feel so certain that this is the last one and any further material from that fissure must be referable to one of the species now known from there.
We agree with these points and believe we have devoted adequate text to addressing them. Note that the reviewer does not recommend any revisions to these sections.
553: Not that it matters, but I'm surprised you didn't use TNT 1.6; it came out in 2023 and is free like all earlier versions.
We have kept this as is following the reviewer comment, and because we were interested in replicating the analyses in the previous publications that have contributed to the debate about the identity of this taxon. For the present simple analyses both versions should perform identically, as the search algorithms for discrete characters are identical across these versions.
562: Is "01" a typo, or do you mean "0 or 1"? In that case, rather write "0/1" or "{01}".
This has been corrected to {01}
(3) Comments on nomenclature and terminology
55, 56: Delete both "...".
This has been corrected.
100: "ent- and ectepicondylar"
For clarity, we have kept the full words.
107-108: I understand that "high" is proximal and "low" is distal, but what is "the distal surface" if it is not the articular surface in the elbow joint?
This has been corrected.
120: "stem pan-lepidosaurs, and stem pan-squamates"; Lepidosauria and Squamata are crown groups that don't contain their stems
This has been corrected.
122, 123: Italics for Claudiosaurus and Delorhynchus.
This has been corrected.
130: Insert a space before "Tianyusaurus" (it's there in the original), and I recommend de-italicizing the two genus names to keep the contrast (as you did in line 162).
This has been corrected.
130, 131: Replace both "..." by "[...]", though you can just delete the second one.
This has been corrected.
174: Not a capitulum, but a grammatically even smaller (double diminutive) capitellum.
This has been corrected.
209, 224, Table 1: Both teams have consistently been doing this wrong. It's "recessus scalae tympani". The scala tympani ("ladder/staircase of the [ear]drum") isn't the recess, it's what the recess is for; therefore, the recess is named "recess of the scala tympani", and because there was no word for "of" in Classical Latin ("de" meant "off" and "about"), the genitive case was the only option. (For the same reason, the term contains "tympani", the genitive of "tympanum".)
This has been corrected.
415-425: This is a terminological nightmare. Ribs can have (and I'm not sure this is exhaustive): a) two separate processes (capitulum, tuberculum) that each bear an articulating facet, and a notch in between; b) the same, but with a non-articulating web of bone connecting the processes; c) a single uninterrupted elongate (even angled) articulating facet that articulates with the sutured or fused dia- and parapophysis; d) a single round articulating facet. Certainly, a) is bicapitate and d) is unicapitate, but for b) and c) all bets are off as to how any particular researcher is going to call them. This is a known source of chaos in phylogenetic analyses. I recommend writing a sentence or three on how the terms "unicapitate" & "bicapitate" lack fixed meanings and have caused confusion throughout tetrapod phylogenetics, and that the condition seen in Cryptovaranoides is nonetheless identical to that in archosauromorphs.
This has been added: “This confusion in part stems from the lack of a fixed meaning for uni- and bicapitate rib heads; in any case, †C. microlanius possesses a condition identical to archosauromorphs as we have shown.” (L.475-477, P.16).
439-440: Other than in archosaurs, some squamates and Mesosaurus, in which sauropsids are dorsal intercentra absent?
We are unclear about the relevance of the question to this section. The issue at hand is that some squamate lineages possess dorsal intercentra, so the absence of dorsal intercentra cannot be considered a squamate synapomorphy without the optimization of this feature along a phylogeny (which was not accomplished by Whiteside et al.).
458: prezygapophyses.
This has been corrected.
516: "[...]".
This has been corrected.
566: synapomorphies.
This has been corrected.
587: Macrocnemus.
This has been corrected.
585: I strongly recommend either taking off and nuking the name Reptilia from orbit (like Pisces) or using it the way it is defined in Phylonyms, namely as the crown group (a subset of Neodiapsida). Either would mean replacing "neodiapsid reptiles" with "neodiapsids".
This has been corrected to “neodiapsids.”
625: Replace "inclusive clades" by "included clades", "component clades", "subclades", or "parts," for example.
This has been kept as is because “inclusive clades” is common terminology and is used extensively in, for example, the PhyloCode.
659: Please update.
References are updated.
Fig. 8: Typo in Puercosuchus.
This has been corrected.
(4) Comments on style and spelling
You inconsistently use the past and the present tense to describe [13, 19], sometimes both in the same sentence (e.g., lines 323 vs. 325). I recommend speaking of published papers in the past tense to avoid ascribing past views and acts to people in their present state.
This has been corrected to be more consistent throughout the manuscript.
48: Remove the second comma.
This has been corrected.
91: Replace "[13] and WEA24" by "[13, 19]".
This has been corrected.
100: Commas on both sides of "in fact" or on neither
This has been corrected.
117: I recommend "the interpretation in [19]". I have nothing against the abbreviation "WEA24", but you haven't defined it, and it seems like a remnant of incomplete editing. - That said, eLife does not impose a format on such things. If you prefer, you can just bring citation by author & year back; in that case, this kind of abbreviation would make perfect sense (though it should still be explicitly defined).<br /> 129, 145: Likewise.
We have modified this [13] and [19] where necessary.
192-198: Surely this should be made part of the paragraph in lines 158-175, which has the exact same headline?
This has been corrected.
200-206: Surely this should be made part of the paragraph in lines 148-156, which has the exact same headline?
These sections deal with different issues pertaining to the analyses of Whiteside et al. (2024) and so we have kept to organization as is.
214: Delete "that".
This has been deleted.
312: "Vomer" isn't an adjective; I'd write "main vomer body" or "vomer's main body" or "main body of the vomer".
This has been corrected.
350: "figured"
This has been corrected.
400: Rather, "rearticulated" or "worked to rearticulate"? - And why "several"? Just write "two". "Several" implies larger numbers.
These issues have been corrected.
448, 500: As which? As what kind of feature? I'm aware that "as such" is fairly widely used for "therefore", but it still confuses me every time, and I have to suspect I'm not the only one. I recommend "therefore" or "for this reason" if that is what you mean.
“As such” has been deleted.
452: Adobe Reader doesn't let me check, but I think you have two spaces after "of".
This has been corrected.
514, 539, 546, 552, 588, Fig. 3, 5, 6, Table 1: "WEA24" strikes again.
This has been corrected.
515: Remove the parentheses.
This has been corrected.
531: Insert a space after the period.
This has been corrected.
532: Remove both commas and the second "that".
This has been corrected.
538: Remove the comma.
This has been kept as is because changing it would render the sentence grammatically incorrect.
545: "[...]" or, better, nothing.
This has been corrected.
547: Spaces on both sides of the dash or on neither (as in line 553).
This has been corrected.
552: Rather, "conducted a parsimony analysis".
This has been corrected.
556: Space after "[19]".
This has been corrected.
560: Comma after "narrow".
This has been corrected.
600: Comma after "above" to match the one in the preceding line - there's an insertion in the sentence that must be flanked by commas on both sides.
This has been corrected.
603: Compound adjectives like "alpha-taxonomic" need a hyphen to avoid tripping readers up.
This has been corrected.
612: Similarly, "ancestral-state reconstruction" needs one to make immediately clear it isn't a state reconstruction that is ancestral but a reconstruction of ancestral states.
This has been corrected.
613: If you want to keep this comma, you need to match it with another after "Cryptovaranoides" in line 611.
We have kept this as is, because removing this comma would render the sentence grammatically incorrect.
615: Likewise, you need a comma after "and" because "except for a few features" is an insertion. The other comma is actually optional; it depends on how much emphasis you want to place on what comes after it.
this has been added.
622: Comma after "[48, 49]".
this has been added.
672: Missing italics and two missing spaces.
This has been corrected.
678, 680-681, 693, 700-701, 734, 742, 747, 788, 797, 799, 803, 808, 810-811, 814, 817, 820, 823, 828, 841, 843: Missing italics.
This has been corrected.
683, 689: These are book chapters. Cite them accordingly.
This has been corrected.
737: Missing DOI.
No DOI is available.
793: Missing Bolosaurus major; and I'd rather cite it as "2024" than "in press", and "online early" instead of "n/a".
This has been corrected.
835: Hoffstetter, RJ?
This has been corrected.
836: Is there something missing?
This has been corrected.
839: This is the same reference as number 20 (lines 683-684), and it is miscited in a different way...!
This has been corrected.
Reviewer #2 (Recommendations for the authors):
(1) There is a brief mention of a phylogenetic analysis being re-run, but it is unclear if any modifications (changes in scoring) based on the very observations were made. Please state this explicitly.
This is explained from lines 600-622, P.20-21, in the section “Apomorphic characters not empirically obtained.” "In order to check the characters listed by Whiteside et al. [19] (p.19) as “two diagnostic characters” and “eight synapomorphies” in support of a squamate identity for †Cryptovaranoides, we conducted a parsimony analysis of the revised version of the dataset [32] provided by Whiteside et al. [19] in TNT v 1.5 [91]. We used Whiteside et al.’s [19] own data version"
(2) Line 20: There is almost no discussion of non‑lepidosaur lepidosauromorphs. I suggest including this, as the archosauromorph‑like features reported in Cryptovaranoides appear rather plastic. Furthermore, diagnostic features of Archosauromorpha in other datasets (e.g., Ezcurra 2016 or the works of Spiekman) are notably absent (and unsampled) in Cryptovaranoides. Expanding this comparison would greatly strengthen the manuscript.
The brief discussion (although not absent) of non-lepidosaur lepidosauromorphs is largely a function of the poor fossil record of this grade. But where necessary, we do discuss these taxa. Also see our previous study (Brownstein et al. 2023) for an extensive discussion of characters relevant to archosauromorphs.
(3) Line 38: I suggest removing "Archosauromorpha" from the keywords. The authors make a compelling case that Cryptovaranoides is not a squamate, yet they do not fully test its placement within Archosauromorpha (as they acknowledge). Perhaps use "Reptilia" instead?
We have removed this keyword.
(4) Line 99: The authors' points here are well made and largely valid. The presence of the ent‑ and ectepicondylar foramina is indeed an amniote plesiomorphy and cannot confirm a squamate identity. Their absence, however, can be informative - although it is unclear whether the CT scans of the humerus are of sufficient resolution, and Figure 4 of Brownstein et al. looks hastily reconstructed (perhaps owing to limited resolution). Moreover, the foramina illustrated by Whiteside do resemble those of other reptiles, albeit possibly over‑prepared and exaggerated.
The issue with the noted figure is indeed due to poor resolution from the scans. Although we agree with the reviewer, we hesitate to talk about absence in this taxon being phylogenetically informative given the confounding influence of ontogeny.
(5) I encourage the authors to provide slice data to support the claim that the foramina are absent (which could certainly be correct!); otherwise, the assertion remains unsubstantiated.
We only have access to the mesh files of segmented bones, not the raw (reconstructed slice) data.
(6) PLEASE NOTE - because the specimen is juvenile, the apparent absence of the ectepicondylar foramen is equivocal: the supinator process develops through ontogeny and encloses this foramen (see Buffa et al. 2025 on Thadeosaurus, for example).
See above.
(7) Line 122: Italicize 'Delorhynchus'
This has been corrected.
(8) Lines 131‑132: I'd suggest deleting the final sentence; it feels a little condescending, and your argument is already persuasive.
This has been corrected.
(9) Line 129: Please note that owenettid "parareptiles" also lack this process, as do several other stem‑saurians. Its absence is therefore not diagnostic of Squamata.<br /> Also: Such plasticity is common outside the crown. Milleropsis and Younginidae develop this process during ontogeny, even though a lower temporal bar never fully forms.
We appreciate this point. See discussion later in the manuscript.
(11) Line 172: Consider adding ontogeny alongside taphonomy and preservation. A juvenile would likely have a poorly developed radial condyle, if any. Acknowledging this possibility will add some needed nuance.
This sentence has been modified, but we have not added in discussion of ontogeny here because it is not immediately relevant to refuting the argument about inference of the presence of this feature when it is not preserved.
(12) Line 177: The "septomaxilla" in Whiteside et al. (2024, Figure 1C) resembles the contralateral premaxilla in dorsal view, with the maxillary process on the left and the palatal (or vomerine) process on the right (the dorsal process appears eroded). The foramen looks like a prepalatal foramen, common to many stem and crown reptiles. Consequently, scoring the septomaxilla as absent may be premature; this bone often ossifies late. In my experience with stem‑reptile aggregations, only one of several articulated individuals may ossify this element.
We agree that presence of a late-ossifying septomaxilla cannot be ruled out, but our point remains (and in agreement with Referee) that scoring the septomaxilla as present based on the amorphous fragments is premature.
(13) Line 200: Tomography data should be shown before citing it. The posterior margin of the maxilla appears rather straight, and the maxilla itself is tall for an archosauromorph. It would be more convincing to score this feature as present only after illustrating the relevant slices - and, as you note, the trait is widespread among non‑archosauromorphs.
See above and Brownstein et al. (2023).
(14) Line 208: Well argued: how could Whiteside et al. confidently assign a disarticulated element? Their "vagus" foramen actually resembles a standard hypoglossal foramen - identical to that seen in many stem reptiles, which often have one large and one small opening.
Thank you!
(15) Line 248: Again, please illustrate this region. One cannot argue for absence without showing the slice data. Note that millerettids and procolophonians - contemporaneous with Cryptovaranoides - possess an enclosed vidian canal, so the feature is broadly distributed.
See above.
(16) Line 258: The choanal fossa is intriguing: originally created for squamate matrices, yet present (to varying degrees) in nearly every reptile I have examined. It is strongly developed in millerettids (see Jenkins et al. 2025 on Milleropsis and Milleretta) and younginids, much like in squamates - Tiago appropriately scores it as present. Thus, it may be more of a "Neodiapsida + millerettids" character. In any case, the feature likely forms an ordered cline rather than a simple binary state.
We agree and look forward to future study of this feature.
(17) Line 283: Bolosaurids are not diapsids and, per Simões, myself, and others, "Diapsida" is probably invalid, at least how it is used here. Better to say "neodiapsids" for choristoderes and "stem‑reptiles" or "sauropsids" for bolosaurids. Jenkins et al.'s placement is largely a function of misidentifying the bolosaurid stapes as the opisthotic.
We are not entirely clear on this point since bolosaurids are not mentioned in this section.
(18) Line 298: Here, you note that the CT scans are rather coarse, which makes some earlier statements about absence/presence less certain (e.g., humeral foramina). It may strengthen the paper to make fewer definitive claims where resolution limits interpretation.
We appreciate this point. However, in the case of the humeral foramina the coarseness of the scans is one reason why we question Whiteside et al. scoring of the presence of these features.
(19) Line 314: Multiple rows of vomerine teeth are standard for amniotes; lepidosauromorphs such as Paliguana and Megachirella also exhibit them (though they may not have been segmented in the latter's description). Only a few groups (e.g., varanopids, some millerettids) have a single medial row.
We appreciate this point and have added in those citations into the following added sentence: “Multiple rows of vomerine teeth are common in reptiles outside of Squamata [76]; the presence of only one row is restricted to a handful of clades, including millerettids [77,78], †Tanystropheus [49], and some [79], but not all [71,80] choristoderes.” (L. 360-363, P. 12).
(20) Line 317: This is likely a reptile plesiomorphy - present in all millerettids (e.g., Milleropsis and Milleretta per Jenkins et al.). Citing these examples would clarify that it is not uniquely squamate. Could it be secondarily lost in archosauromorphs?
We appreciate this point and have cited Jenkins et al. here. It is out of the scope of this discussion to discuss the polarity of this feature relative to Archosauromorpha.
(21) Line 336: Unfortunately, a distinct quadratojugal facet is usually absent in Neodiapsids and millerettids; where present, the quadratojugal is reduced and simply overlaps the quadrate.
We appreciate this point but feel that reviewing the distribution of this feature across all reptiles is not relevant to the text noted.
(22) Line 357: Pterygoid‑quadrate overlap is likely a tetrapod plesiomorphy. Whiteside et al. do not define its functional or phylogenetic significance, and the overlap length is highly variable even among sister taxa.
We agree, but in any case this feature is impossible to assess in Cryptovaranoides.
(23) Line 365: Another well‑written section - clear and persuasive.
Thank you!
(24) Line 385: The cephalic condyle is widespread among neodiapsids, so it is not uniquely squamate.
We agree.
(25) Character 391: Note that the frontal underlapping the parietal is widespread, appearing in both millerettids and neodiapsids such as Youngina.
We appreciate this point, but the point here deals with the fact that this feature is not observable in the holotype of Cryptovaranoides.
(26) Line 415: The "anterior process" is actually common among crown reptiles, including sauropterygians, so it cannot by itself place Cryptovaranoides within Archosauromorpha.
We agree but also note that we do not claim this feature unambiguously unites Cryptovaranoides with Archosauromorpha.
(28) Line 460: Yes - Whiteside et al. appear to have relabeled the standard amniote coracoid foramen. Excellent discussion.
Thank you!
(29) Line 496: While mirroring Whiteside's structure, discussing this mandibular character earlier, before the postcrania, might aid readability.
We have chosen to keep this structure as is.
(30) Lines 486-588: This section oversimplifies the quadrate articulation.
We are unclear how this is an oversimplification.
(31) Both Prolacerta and Macrocnemus possess a cephalic condyle and some mobility (though less than many squamates). In Prolacerta (Miedema et al. 2020, Figure 4), the squamosal posteroventral process loosely overlaps the quadrate head.
We assume this comment refers to the section "Peg-in-notch articulation of quadrate head"; we appreciate clarification that this feature occurs in variable extent outside squamates, but this does not affect our statement that the material of Cryptovaranoides is too poorly preserved to confirm its presence.
(32) Where is this process in Cryptovaranoides? It is not evident in Whiteside's segmentation of the slender squamosal - please illustrate.
We are unclear as to which section this comment refers.
(33) Additionally, the quadrate "conch" of Cryptovaranoides is well developed, bearing lateral and medial tympanic crests; the lateral crest is absent in the cited archosauromorphs.
We note that no vertebrate has a medial tympanic crest (it is always laterally placed for the tympanic membrane, when present). If this is what the reviewer refers to, this is a feature commonly found across all tetrapods bearing a tympanum attached to the quadrate (e.g., most reptiles), and so it is not very relevant phylogenetically. Regarding its presence in Cryptovaranoides, the lateral margin of the quadrate is broken (Brownstein et al., 2023), so it cannot be determined. This incomplete preservation also makes an interpretation of a quadrate conch very hard to determine. But as currently preserved, there is no evidence whatsoever for this feature.
(34) Line 591: The cervical vertebrae of Cryptovaranoides are not archosauromorph‑like. Archosauromorph cervicals are elongate, parallelogram‑shaped, and carry long cervical ribs-none of which apply here. As the manuscript lacks a phylogenetic analysis, including these features seems unnecessary. Should they be added to other datasets, I suspect Cryptovaranoides would align along the lepidosaur stem (though that remains to be tested).
We politely disagree. The reviewer here mentions that the cervical vertebrae of archosauromorphs are generally shaped differently from those in Cryptovaranoides. The description provided (“elongate, parallelogram‑shaped, and carry long cervical ribs-none”) is basically limited to protorosaurians (e.g., tanystropheids, Macrocnemus) and early archosauriforms. We note that archosauromorph cervicals are notoriously variable in shape, especially in the crown, but also among early archosauromorphs. Further, the cervical ribs, are notoriously similar among early archosauromorphs (including protorosaurians) and Cryptovaranoides, as discussed and illustrated in Brownstein et al., 2023 (Figs. 2 and 3), especially concerning the presence of the anterior process.
Further, we do include a phylogenetic analysis of the matrix provided in Whiteside et al. (2024) as noted in our results section. In any case, we direct the reviewer to our previous study (Brownstein et al., 2023), in which we conduct phylogenetic analyses that included characters relevant to this note.
Reviewer #3 (Recommendations for the authors):
(1) The authors should use specimen numbers all over the text because we are talking about multiple individuals, and the authors contest the previous affinity of some of them. For example, on page 16, line 447, they mention an isolated vertebra but without any number. The specimen can be identified in the referenced article, but it would be much easier for the reader if the number were also provided here
Agreed and added.
(2) Abstract: "Our team questioned this identification and instead suggested Cryptovaranoides had unclear affinities to living reptiles."
That is very imprecise. The team suggested that it could be an archosauromorph or an indeterminate neodiapsid. Please change accordingly.
We politely disagree. We stated in our 2023 study that whereas our phylogenetic analyses place this taxon in Archosauromorpha, it remains unclear where it would belong within the latter. This is compatible with “unclear affinities to living reptiles”.
(3) Page 7, line 172: "Taphonomy and poor preservation cannot be used to infer the presence of an anatomical feature that is absent." Unfortunate wording. Taphonomy always has to be used to infer the presence or absence of anatomical features. Sometimes the feature is not preserved, but it leaves imprints/chemical traces or other taphonomic indicators that it was present in the organism. Please remove or rewrite the sentence.
We agree and have modified the sentence to read: “Taphonomy and poor preservation cannot be used alone to justify the inference that an anatomical feature was present when it is not preserved and there is no evidence of postmortem damage. In a situation when the absence of a feature is potentially ascribable to preservation, its presence should be considered ambiguous.” (L. 141-145, P.5).
(4) Page 4, line 91, please explain "WEA24" here, though it is unclear why this abbreviation is used instead of citation in the manuscript.
This has been corrected to Whiteside et al. [19].
(5) Page 6, line 144: "Together, these observations suggest that the presence of a jugal posterior process was incorrectly scored in the datasets used by WEA24 (type (ii) error)." That sentence is unclear. Why did the authors use "suggest"? Does it mean that they did not have access to the original data matrix to check it? If so, it should be clearly stated at the beginning of the manuscript.
See earlier; this has been modified and “suggest” has been removed.
(6) Page 7, line 174: "Finally, even in the case of the isolated humerus with a preserved capitulum, the condyle illustrated by Whiteside et al. [19] is fairly small compared to even the earliest known pan-squamates, such as Megachirella wachtleri (Figure 4)." Figure 4 does not show any humeri. Please correct.
The reference to figure 4 has been removed.
(7) Page 8, line 195-198: "This is not the condition specified in either of the morphological character sets that they cite [18,38], the presence of a distinct condyle that is expanded and is by their own description not homologous to the condition in other squamates." This is a bit unclear. Could the authors explain it a little bit further? How is the condition that is specified in the referred papers different compared to the Whiteside et al. description?
We appreciate this comment and have broken this sentence up into three sentences to clarify what we mean:
“The projection of the radial condyle above the adjacent region of the distal anterior extremity is not the condition specified in either of the morphological character sets that Whiteside et al. [19] cite [18,32]. The condition specified in those studies is the presence of a distinct condyle that is expanded. The feature described in Whiteside et al. [19] does not correspond to the character scored in the phylogenetic datasets.” (L.220-225, P.8).
(8) Page 16, line 446: "they observed in isolated vertebrae that they again refer to C. microlanius without justification". That is not true. The referred paper explains the attribution of these vertebrae to Cryptovaranoides (see section 5.3 therein). The authors do not have to agree with that justification, but they cannot claim that no justification was made. Please correct it here and throughout the text.
We have modified this sentence but note that the justification in Whiteside et al. (2024) lacked rigor. Whiteside et al. (2024) state: “Brownstein et al. [5] contested the affinities of three vertebrae, cervical vertebra NHMUK PV R37276, dorsal vertebra NHMUK PV R37277 and sacral vertebra NHMUK PV R37275. While all three are amphicoelous and not notochordal, the first two can be directly compared to the holotype. Cervical vertebra NHMUK PV R37276 is of the same form as the holotype CV3 with matching neural spine, ventral keel (=crest) and the posterior lateral ridges or lamina (figure 3c,d) shown by Brownstein et al. [5, fig. 1a]. The difference is that NHMUK PV R37276 has a fused neural arch to the pleurocentrum and a synapophysis rather than separate diapophysis and parapophysis of the juvenile holotype (figure 3c). Neurocentral fusion of the neural arch and centrum can occur late in modern squamates, ‘up to 82% of the species maximum size’ [28].
The dorsal surface of dorsal vertebra NHMUK PV R37277 (figure 3e) can be matched to the mid-dorsal vertebra in the †Cryptovaranoides holotype (figure 4d, dor.ve) and has the same morphology of wide, dorsally and outwardly directed, prezygapophyses, downwardly directed postzygapophyses and similar neural spine. It is also of similar proportions to the holotype when viewed dorsally (figures 3e and 4d), both being about 1.2 times longer anteroposteriorly than they are wide, measured across the posterior margin. The image in figure 4d demonstrates that the posterior vertebrae are part of the same spinal column as the truncated proximal region but the spinal column between the two parts is missing, probably lost in quarrying or fossil collection.”
This justification is based on pointing out the presence of supposed shared features between these isolated vertebrae and those in the holotype of Cryptovaranoides, even though none of these features are diagnostic for that taxon. We have changed the sentence in our manuscript to read:
“Whiteside et al. [19] concur with Brownstein et al. [18] that the diapophyses and parapophyses are unfused in the anterior dorsals of the holotype of †Cryptovaranoides microlanius, and restate that fusion of these structures is based on the condition they observed in isolated vertebrae that they refer to †C. microlanius based on general morphological similarity and without reference to diagnostic characters of †C. microlanius” (L. 502-507, P. 17).
(9) Figure 2. The figure caption lacks some explanations. Please provide information about affinity (e.g., squamate/gekkotan), ag,e and locality of the taxa presented. Are these left or right palatines? The second one seems to be incomplete, and maybe it is worth replacing it with something else?
The figure caption has been modified:
“Figure 2. Comparison of palatine morphologies. Blue shading indicates choanal fossa. Top image of †Cryptovaranoides referred left palatine is from Whiteside et al. [19]. Middle is the left palatine of †Helioscopos dickersonae (Squamata: Pan-Gekkota) from the Late Jurassic Morrison Formation [62]. Bottom is the right palatine of †Eoscincus ornatus (Squamata: Pan-Scincoidea) from the Late Jurassic Morrison Formation [31].”
(10) Figure 8. The abbreviations are not explained in the figure caption.
These have been added.
y1 M(vas-Cas9)ZH-2A w1118/FM7c
DOI: 10.3390/ijms22116066
Resource: Bloomington Drosophila Stock Center (RRID:SCR_006457)
Curator: @bdscstockkeepers
SciCrunch record: RRID:SCR_006457
UAS-Sema-1a RNAi
DOI: 10.3389/fendo.2021.600251
Resource: Bloomington Drosophila Stock Center (RRID:SCR_006457)
Curator: @bdscstockkeepers
SciCrunch record: RRID:SCR_006457
UAS-Sema-1a
DOI: 10.3389/fendo.2021.600251
Resource: Bloomington Drosophila Stock Center (RRID:SCR_006457)
Curator: @bdscstockkeepers
SciCrunch record: RRID:SCR_006457
S1 Table.
DOI: 10.1371/journal.pbio.3003423
Resource: None
Curator: @Apiekniewska
SciCrunch record: RRID:WB-STRAIN:WBStrain00040927
RRID:SCR_017945
DOI: 10.1016/j.jbc.2025.110997
Resource: Northwestern University Proteomics Core Facility (RRID:SCR_017945)
Curator: @scibot
SciCrunch record: RRID:SCR_017945
AB_466193
DOI: 10.1016/j.isci.2025.114332
Resource: (Thermo Fisher Scientific Cat# 12-7311-82, RRID:AB_466193)
Curator: @scibot
SciCrunch record: RRID:AB_466193
RRID:AB_2716736
DOI: 10.1016/j.crmeth.2025.101247
Resource: (Heintz Lab; Rockefeller University Cat# Htz-GFP-19F7, RRID:AB_2716736)
Curator: @scibot
SciCrunch record: RRID:AB_2716736
RRID:SCR_002798
DOI: 10.1016/j.clnesp.2025.11.002
Resource: GraphPad Prism (RRID:SCR_002798)
Curator: @scibot
SciCrunch record: RRID:SCR_002798
RRID:IMSR_JAX:007909
DOI: 10.1016/j.chom.2025.11.008
Resource: RRID:IMSR_JAX:007909
Curator: @scibot
SciCrunch record: RRID:IMSR_JAX:007909
RRID:AB_2535792
DOI: 10.1016/j.chom.2025.11.008
Resource: (Thermo Fisher Scientific Cat# A-21206 (also A21206), RRID:AB_2535792)
Curator: @scibot
SciCrunch record: RRID:AB_2535792
RRID:AB_2651134
DOI: 10.1016/j.chom.2025.11.008
Resource: (BD Biosciences Cat# 564279, RRID:AB_2651134)
Curator: @scibot
SciCrunch record: RRID:AB_2651134
Joint Public Review:
Summary
Non-alcoholic fatty liver disease (NAFLD) is a widespread metabolic disease associated with obesity. Endoplasmic reticulum and calcium dysregulation are hallmarks of NAFLD. Here, the authors explore whether the secreted liver protein transthyretin (TTR), which has been previously shown to modulate calcium signaling in the context of insulin resistance, could also impact NAFLD. The study is motivated by a small cohort of NASH patients who show elevated TTR levels. The authors then overexpress TTR in two mouse obesogenic models, which leads to elevated liver lipid deposition. In contrast, liver-specific TTR knockdown improves some liver lipid levels, reduces inflammation markers, and improves glucose tolerance, overall improving the NAFLD markers. These phenotypic findings are overall convincing and largely consistent in two different diet models.
Because of TTR's connection to calcium regulation, the authors then assess whether the knockdown affects ER stress and impacts SERCA2 expression. However, the direct mechanistic evidence supporting the central claim that TTR physically interacts with and inhibits the SERCA2 calcium pump is preliminary and requires further validation. Whether the broader effects on lipid accumulation, inflammation markers, and glucose tolerance are mechanistically connected remains to be determined.
Strengths
The premise of the study is built on prior work from the authors identifying a link between increased transthyretin secretion and the development of insulin resistance, a related obesity condition. The in vivo studies are comprehensive, using human NASH samples, two distinct diet-induced mouse models (HFD and GAN), and in vitro hepatocyte models. The phenotypic data showing that TTR knockdown alleviates steatosis, inflammation, and insulin resistance are robust and convincing across these systems.
Weaknesses
The mechanistic studies in Figures 6-9 are incomplete. There are several issues encompassing experimental design, rigor, and interpretation that, if properly addressed, would make the study much stronger.
(1) Exogenous TTR that is endocytosed by cells is unlikely to ever find itself inside the lumen of the ER. Conversely, endogenous TTR that is produced in cells and that has not yet been secreted is almost certain to have an ER lumenal localization (as in Figures 7B and 9A, and where an apparent colocalization with SERCA is likely to be incidental). In a model where TTR, acting as a hepatokine, has inhibitory effects on SERCA, these would almost certainly be realized from the cytosolic side of the ER membrane-a region inaccessible to lumenal endogenous TTR. It is possible that the overexpression and knockdown of endogenous TTR have the effects seen due to its secretion and uptake (that is, cell-non-autonomous effects), but this possibility was not directly tested through Transwell or similar assays. Given the identity of TTR as a secretory pathway client protein, the only localization data for TTR that are unexpected are those suggesting an ER localization of exogenously added TTR (Figure 7A), but this localization seems to involve only a minor population of TTR, is hindered by a technical issue with cell permeabilization (see below), and lacks orthogonal approaches to convincingly demonstrate meaningful localization of exogenous TTR at the ER membrane.
(2) The experimental logic in Figure 8 is problematic. The authors use Thapsigargin (Tg), a potent and specific SERCA inhibitor, to probe SERCA function. However, since both Tg and TTR are proposed to inhibit SERCA2, the design lacks a critical control to demonstrate that TTR's effects are indeed mediated through SERCA2. SERCA2 activity should, in principle, be fully and irreversibly inhibited by Tg treatment, especially using such a high concentration (5 µM). If TTR's effect on calcium flux is exclusively through SERCA2, then SERCA2 impairment by TTR should have no additional effect in the presence of Tg, as Tg would already be maximally inhibiting the pump. The current data (Figures 8G-H) showing an effect of TTR-KD even with Tg present is difficult to interpret and may suggest off-target or compensatory mechanisms.
(3) The coIP data in Figure 9 need to be better controlled, including by overexpression of FLAG- and MYC-tagged irrelevant proteins, ideally also localized to the ER. The coIP of overexpressed TTR with endogenous SERCA in Figure 9D, in addition to requiring a more rigorous control, is itself of relatively low quality, with the appearance of a possible gel/blotting artifact.
(4) The ER stress markers in Figure 6 are not convincing. Molecular weight markers and positive controls (for example, livers from animals injected with tunicamycin) are missing. In addition, the species of ATF6 that is purportedly being detected (cleaved or full-length) is not indicated, and this protein is also notoriously difficult to detect with convincing specificity in mouse tissues. As well, CHOP protein is usually not detectable in control normal diet mouse livers, raising questions of whether the band identified as CHOP is, in fact, CHOP. These issues, along with the observation that ER stress-regulated RNAs are not altered (Figure S5), raise the question of whether ER stress is involved at all. Likewise, the quantification of SERCA2 levels from Figure 6 requires more rigor. For all blots, it isn't clear that analyzing only 3 or 4 of the animals provides adequate and unbiased power to detect differences; in addition, in Figure 6C, at least the SERCA2 exposure (assuming SERCA2 is being specifically detected; see above) is well beyond the linear range of quantification.
In addition, the following important issues were raised:
(5) n=4 for overexpression might not provide adequate statistical power.
(6) The error for human NASH samples and controls in Figure 1A is surprisingly small. Larger gene expression data sets from NASH cohorts exist and should be used to test the finding in a larger population.
(7) For experiments involving two independent variables (e.g., diet and TTR manipulation, as in Figures 2, 3, 4, 5), a Two-way ANOVA must be used instead of One-way ANOVA or t-tests. Also, the ND-TTR-KD group is missing - these data are an essential control to show the specificity of the knockdown and its effects in a non-diseased state.
(8) Figure 7A: The co-localization signal between TTR-Alexa488 and the ER marker is not strong or convincing, which could be due to the inappropriate immunofluorescence protocol used, of permeabilization prior to fixation. The standard and recommended order is fixation first (to preserve cellular architecture), followed by permeabilization.
Note: This preprint has been reviewed by subject experts for Review Commons. Content has not been altered except for formatting.
Learn more at Review Commons
The work of Binagui-Casas, Granes and colleagues, investigates in a rigorous way the origin and potential of murine NMPs. The authors first validated a dual reporter system, which monitors Sox2 and Tbxt expression. Next, they identified the location in the embryo and the sequence of gene activation (Sox2 first, then Tbxt) leading to NMPs specification. Importantly, the in vitro model faithfully mimics the in vivo ontogeny of NMPs. Among Sox2+ NMCs, the authors observed different levels of Tbxt, which they proposed mark different stages of mesoderm maturation, with high Tbxt corresponding to more mature mesodermal state. Through sorting and replating of different populations, the authors convincingly showed that Sox2+/Tbxt-low cells are still bipotent, while Sox2+/Tbxt-high are committed towards the mesoderm lineage. Using a gastruloid model, the authors then showed that Tbxt expression correlates with axis elongation, as both are reduced upon inhibition of either WNT or NOTCH Finally, single-cell sorting followed by differentiation in FGF/CHIR and high throughput microscopy confirmed that double Sox2/Tbxt positive cells behave as NMPs and that high levels of Tbxt predispose cells towards mesoderm differentiation. These conclusions were further supported by mathematical modelling. The manuscript is easy to read, and figures are very clear. I have only minor suggestions, as I find the manuscript quite solid and complete.
Minor points:
Referees cross-commenting
I agree with Reviewer #2 comment about "Further validation of the generated derivatives" by staining for additional markers.
I also made a comment related to GFP stability, as Reviewer #2 did (i.e. The low versus high TBXT cells may reflect early versus late TBXT expressing cells ).
Overall, the manuscript uses an elegant approach and address an important question about NMPs behaviour. The results presented are an important advance in knowledge of NMP biology. I am confident that both stem cell and developmental biologist would be interested in this manuscript. I am an expert of pluripotency, signaling and models of early mammalian development.
Reviewer #2 (Public review):
Summary
The study investigated whether memory retrieval followed soon by extinction training results in a short-term memory deficit when tested - with a reinstatement test that results in recovery from extinction - soon after extinction training. Experiment 1 documents this phenomenon using a between-subjects design. Experiment 2 used a within-subject control and sees that the effect is also observed in a control condition. In addition, it also revealed that if testing is conducted 6 hours after extinction, there is not effect of retrieval prior to extinction as there is recovery from extinction independently of retrieval prior to extinction. A third Group also revealed that retrieval followed by extinction attenuates reinstatement when the test is conducted 24 hours later, consistent with previous literature. Finally, Experiment 3 used continuous theta-burst stimulation of the dorsolateral prefrontal cortex and assessed whether inhibition of that region (vs a control region) reversed the short-term effect revealed in Experiments 1 and 2. The results of control groups in Experiment 3 replicated the previous findings (short-term effect), and the experimental group revealed that these can be reversed by inhibition of the dorsolateral prefrontal cortex.
Strengths
The work is performed using standard procedures (fear conditioning and continuous theta-burst stimulation) and there is some justification of the sample sizes. The results replicate previous findings - some of which have been difficult to replicate and this needs to be acknowledged - and suggest that the effect can also be observed in a short-term reinstatement test.
The study establishes links between the memory reconsolidation and retrieval-induced forgetting (or memory suppression) literatures. The explanations that have been developed for these are distinct and the current results integrate these, by revealing that the DLPFC activity involved in retrieval-extinction short-term effect. There is thus some novelty in the present results, but numerous questions remain unaddressed.
Weakness
The fear acquisition data is converted to a differential fear SCR and this is what is analysed (early vs late). However, the figure shows the raw SCR values for CS+ and CS- and therefore it is unclear whether acquisition was successful (despite there being an "early" vs "late" effect - no descriptives are provided).
In Experiment 1 (Test results) it is unclear whether the main conclusion stems from a comparison of the test data relative to the last extinction trial ("we defined the fear recovery index as the SCR difference between the first test trial and the last extinction trial for a specific CS") or the difference relative to the CS- ("differential fear recovery index between CS+ and CS-"). It would help the reader assess the data if Fig 1e presents all the indexes (both CS+ and CS-). In addition, there is one sentence which I could not understand "there is no statistical difference between the differential fear recovery indexes between CS+ in the reminder and no reminder groups (P=0.048)". The p value suggests that there is a difference, yet it is not clear what is being compared here. Critically, any index taken as a difference relative to the CS- can indicate recovery of fear to the CS+ or absence of discrimination relative to the CS-, so ideally the authors would want to directly compare responses to the CS+ in the reminder and no-reminder groups. In the absence of such comparison, little can be concluded, in particular if SCR CS- data is different between groups. The latter issue is particularly relevant in Experiment 2, in which the CS- seems to vary between groups during the test and this can obscure the interpretation of the result.
In experiment 1, the findings suggest that there is a benefit of retrieval followed by extinction in a short-term reinstatement test. In Experiment 2, the same effect is observed to a cue which did not undergo retrieval before extinction (CS2+), a result that is interpreted as resulting from cue-independence, rather than a failure to replicate in a within-subjects design the observations of Experiment 1 (between-subjects). Although retrieval-induced forgetting is cue-independent (the effect on items that are supressed [Rp-] can be observed with an independent probe), it is not clear that the current findings are similar, and thus that the strong parallels made are not warranted. Here, both cues have been extinguished and therefore been equally exposed during the critical stage.
The findings in Experiment 2 suggest that the amnesia reported in experiment 1 is transient, in that no effect is observed when the test is delayed by 6 hours. The phenomena whereby reactivated memories transition to extinguished memories as a function of the amount of exposure (or number of trials) is completely different from the phenomena observed here. In the former, the manipulation has to do with the number of trials (or total amount of time) that the cues are exposed. In the current Experiment 2, the authors did not manipulate the number of trials but instead the retention interval between extinction and test. The finding reported here is closer to a "Kamin effect", that is the forgetting of learned information which is observed with intervals of intermediate length (Baum, 1968). Because the Kamin effect has been inferred to result from retrieval failure, it is unclear how this can be explained here. There needs to be much more clarity on the explanations to substantiate the conclusions.
There are many results (Ryan et al., 2015) that challenge the framework that the authors base their predictions on (consolidation and reconsolidation theory), therefore these need to be acknowledged. These studies showed that memory can be expressed in the absence of the biological machinery thought to be needed for memory performance. The authors should be careful about statements such as "eliminate fear memores" for which there is little evidence.
The parallels between the current findings and the memory suppression literature are speculated in the general discussion, and there is the conclusion that "the retrieval-extinction procedure might facilitate a spontaneous memory suppression process". Because one of the basic tenets of the memory suppression literature is that it reflects an "active suppression" process, there is no reason to believe that in the current paradigm the same phenomenon is in place, but instead it is "automatic". In other words, the conclusions make strong parallels with the memory suppression (and cognitive control) literature, yet the phenomena that they observed is thought to be passive (or spontaneous/automatic). Ultimately, it is unclear why 10 mins between the reminder and extinction learning will "automatically" supress fear memories. Further down in the discussion it is argued that "For example, in the well-known retrieval-induced forgetting (RIF) phenomenon, the recall of a stored memory can impair the retention of related long-term memory and this forgetting effect emerges as early as 20 minutes after the retrieval procedure, suggesting memory suppression or inhibition can occur in a more spontaneous and automatic manner". I did not follow with the time delay between manipulation and test (20 mins) would speak about whether the process is controlled or automatic. In addition, the links with the "latent cause" theoretical framework are weak if any. There is little reason to believe that one extinction trial, separated by 10 mins from the rest of extinction trials, may lead participants to learn that extinction and acquisition have been generated by the same latent cause.
Among the many conclusions, one is that the current study uncovers the "mechanism" underlying the short-term effects of retrieval-extinction. There is little in the current report that uncovers the mechanism, even in the most psychological sense of the mechanism, so this needs to be clarified. The same applies to the use of "adaptive".
Whilst I could access the data in the OFS site, I could not make sense of the Matlab files as there is no signposting indicating what data is being shown in the files. Thus, as it stands, there is no way of independently replicating the analyses reported.<br /> The supplemental material shows figures with all participants, but only some statistical analyses are provided, and sometimes these are different from those reported in the main manuscript. For example, the test data in Experiment 1 is analysed with a two-way ANOVA with main effects of group (reminder vs no-reminder) and time (last trial of extinction vs first trial of test) in the main report. The analyses with all participants in the sup mat used a mixed two-way ANOVA with group (reminder vs no reminder) and CS (CS+ vs CS-). This makes it difficult to assess the robustness of the results when including all participants. In addition, in the supplementary materials there are no figures and analyses for Experiment 3.
One of the overarching conclusions is that the "mechanisms" underlying reconsolidation (long term) and memory suppression (short term) phenomena are distinct, but memory suppression phenomena can also be observed after a 7-day retention interval (Storm et al., 2012), which then questions the conclusions achieved by the current study.
References:
Baum, M. (1968). Reversal learning of an avoidance response and the Kamin effect. Journal of Comparative and Physiological Psychology, 66(2), 495.<br /> Chalkia, A., Schroyens, N., Leng, L., Vanhasbroeck, N., Zenses, A. K., Van Oudenhove, L., & Beckers, T. (2020). No persistent attenuation of fear memories in humans: A registered replication of the reactivation-extinction effect. Cortex, 129, 496-509.<br /> Ryan, T. J., Roy, D. S., Pignatelli, M., Arons, A., & Tonegawa, S. (2015). Engram cells retain memory under retrograde amnesia. Science, 348(6238), 1007-1013.<br /> Storm, B. C., Bjork, E. L., & Bjork, R. A. (2012). On the durability of retrieval-induced forgetting. Journal of Cognitive Psychology, 24(5), 617-629.
Comments on revisions:
Thanks to the authors for trying to address my concerns.
(1 and 2) My point about evidence for learning relates to the fact that in none of the experiments an increase in SCR to the CSs+ is observed during training (in Experiment 1 CS+/CS- differences are even present from the outset), instead what happens is that participants learn to discriminate between the CS+ and CS- and decrease their SCR responding to the safe CS-. This begs the question as to what is being learned, given that the assumption is that the retrieval-extinction treatment is concerned with the excitatory memory (CS+) rather than the CS+/CS- discrimination. For example, Figures 6A and 6B have short/Long term amnesia in the right axes, but it is unclear from the data what memory is being targeted. In Figure 6C, the right panels depicting Suppression and Reconsolidation mechanisms suggest that it is the CS+ memory that is being targeted. Because the dependent measure (differential SCR) captures how well the discrimination was learned (this point relates to point 2 which the authors now acknowledge that there are differences between groups in responding to the CS-), then I struggle to see how the data supports these CS+ conclusions. The fact that influential papers have used this dependent measure (i.e., differential SCR) does not undermine the point that differences between groups at test are driven by differences in responding to the CS-.
(3, 4 and 5) The authors have qualified some of the statements, yet I fail to see some of these parallels. Much of the discussion is speculative and ultimately left for future research to address.
(6) I can now make more sense of the publicly available data, although the files would benefit from an additional column that distinguishes between participants that were included in the final analyses (passed the multiple criteria = 1) and those who did not (did not pass the criteria = 0). Otherwise, anyone who wants to replicate these analyses needs to decipher the multiple inclusion criteria and apply it to the dataset.
Author response:
The following is the authors’ response to the previous reviews
Reviewer #1 (Public review):
Introduction & Theory
(1) It is difficult to appreciate why the first trial of extinction in a standard protocol does NOT produce the retrieval-extinction effect. This applies to the present study as well as others that have purported to show a retrieval-extinction effect. The importance of this point comes through at several places in the paper. E.g., the two groups in Study 1 experienced a different interval between the first and second CS extinction trials; and the results varied with this interval: a longer interval (10 min) ultimately resulted in less reinstatement of fear than a shorter interval. Even if the different pattern of results in these two groups was shown/known to imply two different processes, there is nothing in the present study that addresses what those processes might be. That is, while the authors talk about mechanisms of memory updating, there is little in the present study that permits any clear statement about mechanisms of memory. The references to a "short-term memory update" process do not help the reader to understand what is happening in the protocol.
We agree with the reviewer that whether and how the retrieval-extinction paradigm works is still under debate. Our results provide another line of evidence that such a paradigm is effective in producing long term fear amnesia. The focus of the current manuscript is to demonstrate that the retrieval-extinction paradigm can also facilitate a short-term fear memory deficit measured by SCR. Our TMS study provided some preliminary evidence in terms of the brain mechanisms involved in the causal relationship between the dorsolateral prefrontal cortex (dlPFC) activity and the short-term fear amnesia and showed that both the retrieval interval and the intact dlPFC activity were necessary for the short-term fear memory deficit and accordingly were referred to as the “mechanism” for memory update. We acknowledge that the term “mechanism” might have different connotations for different researchers. We now more explicitly clarify what we mean by “mechanisms” in the manuscript (line 99) as follows:
“In theory, different cognitive mechanisms underlying specific fear memory deficits, therefore, can be inferred based on the difference between memory deficits.”
In reply to this point, the authors cite evidence to suggest that "an isolated presentation of the CS+ seems to be important in preventing the return of fear expression." They then note the following: "It has also been suggested that only when the old memory and new experience (through extinction) can be inferred to have been generated from the same underlying latent cause, the old memory can be successfully modified (Gershman et al., 2017). On the other hand, if the new experiences are believed to be generated by a different latent cause, then the old memory is less likely to be subject to modification. Therefore, the way the 1stand 2ndCS are temporally organized (retrieval-extinction or standard extinction) might affect how the latent cause is inferred and lead to different levels of fear expression from a theoretical perspective." This merely begs the question: why might an isolated presentation of the CS+ result in the subsequent extinction experiences being allocated to the same memory state as the initial conditioning experiences? This is not yet addressed in any way.
As in our previous response, this manuscript is not about investigating the cognitive mechanism why and how an isolated presentation of the CS+ would suppress fear expression in the long term. As the reviewer is aware, and as we have addressed in our previous response letters, both the positive and negative evidence abounds as to whether the retrieval-extinction paradigm can successfully suppress the long-term fear expression. Previous research depicted mechanisms instigated by the single CS+ retrieval at the molecular, cellular, and systems levels, as well as through cognitive processes in humans. In the current manuscript, we simply set out to test that in addition to the long-term fear amnesia, whether the retrieval-extinction paradigm can also affect subjects’ short-term fear memory.
(2) The discussion of memory suppression is potentially interesting but, in its present form, raises more questions than it answers. That is, memory suppression is invoked to explain a particular pattern of results but I, as the reader, have no sense of why a fear memory would be better suppressed shortly after the retrieval-extinction protocol compared to the standard extinction protocol; and why this suppression is NOT specific to the cue that had been subjected to the retrieval-extinction protocol.
Memory suppression is the hypothesis we proposed that might be able to explain the results we obtained in the experiments. We discussed the possibility of memory suppression and listed the reasons why such a mechanism might be at work. As we mentioned in the manuscript, our findings are consistent with the memory suppression mechanism on at least two aspects: 1) cue-independence and 2) thought-control ability dependence. We agree that the questions raised by the reviewer are interesting but to answer these questions would require a series of further experiments to disentangle all the various variables and conceptual questions about the purpose of a phenomenon, which we are afraid is out of the scope of the current manuscript. We refer the reviewer to the discussion section where memory suppression might be the potential mechanism for the short-term amnesia we observed (lines 562-569) as follows:
“Previous studies indicate that a suppression mechanism can be characterized by three distinct features: first, the memory suppression effect tends to emerge early, usually 10-30 mins after memory suppression practice and can be transient (MacLeod and Macrae, 2001; Saunders and MacLeod, 2002); second, the memory suppression practice seems to directly act upon the unwanted memory itself (Levy and Anderson, 2002), such that the presentation of other cues originally associated with the unwanted memory also fails in memory recall (cue-independence); third, the magnitude of memory suppression effects is associated with individual difference in control abilities over intrusive thoughts (Küpper et al., 2014).”
(3) Relatedly, how does the retrieval-induced forgetting (which is referred to at various points throughout the paper) relate to the retrieval-extinction effect? The appeal to retrieval-induced forgetting as an apparent justification for aspects of the present study reinforces points 2 and 3 above. It is not uninteresting but lacks clarification/elaboration and, therefore, its relevance appears superficial at best.
We brought the topic of retrieval-induced forgetting (RIF) to stress the point that memory suppression can be unconscious. In a standard RIF paradigm, unlike the think/no-think paradigm, subjects are not explicitly told to suppress the non-target memories. However, to successfully retrieve the target memory, the cognitive system actively inhibits the non-target memories, effectively implementing a memory suppression mechanism (though unconsciously). Therefore, it is possible our results might be explained by the memory suppression framework. We elaborated this point in the discussion section (lines 578-584):
“In our experiments, subjects were not explicitly instructed to suppress their fear expression, yet the retrieval-extinction training significantly decreased short-term fear expression. These results are consistent with the short-term amnesia induced with the more explicit suppression intervention (Anderson et al., 1994; Kindt and Soeter, 2018; Speer et al., 2021; Wang et al., 2021; Wells and Davies, 1994). It is worth noting that although consciously repelling unwanted memory is a standard approach in memory suppression paradigm, it is possible that the engagement of the suppression mechanism can be unconscious.”
(4) I am glad that the authors have acknowledged the papers by Chalkia, van Oudenhove & Beckers (2020) and Chalkia et al (2020), which failed to replicate the effects of retrieval-extinction reported by Schiller et al in Reference 6. The authors have inserted the following text in the revised manuscript: "It should be noted that while our long-term amnesia results were consistent with the fear memory reconsolidation literature, there were also studies that failed to observe fear prevention (Chalkia, Schroyens, et al., 2020; Chalkia, Van Oudenhove, et al., 2020; Schroyens et al., 2023). Although the memory reconsolidation framework provides a viable explanation for the long-term amnesia, more evidence is required to validate the presence of reconsolidation, especially at the neurobiological level (Elsey et al., 2018). While it is beyond the scope of the current study to discuss the discrepancies between these studies, one possibility to reconcile these results concerns the procedure for the retrieval-extinction training. It has been shown that the eligibility for old memory to be updated is contingent on whether the old memory and new observations can be inferred to have been generated by the same latent cause (Gershman et al., 2017; Gershman and Niv, 2012). For example, prevention of the return of fear memory can be achieved through gradual extinction paradigm, which is thought to reduce the size of prediction errors to inhibit the formation of new latent causes (Gershman, Jones, et al., 2013). Therefore, the effectiveness of the retrieval-extinction paradigm might depend on the reliability of such paradigm in inferring the same underlying latent cause." Firstly, if it is beyond the scope of the present study to discuss the discrepancies between the present and past results, it is surely beyond the scope of the study to make any sort of reference to clinical implications!!!
As we have clearly stated in our manuscript that this paper was not about discussing why some literature was or was not able to replicate the retrieval-extinction results originally reported by Schiller et al. 2010. Instead, we aimed to report a novel short-term fear amnesia through the retrieval-extinction paradigm, above and beyond the long-term amnesia reported before. Speculating about clinical implications of these finding is unrelated to the long-term, amnesia debate in the reconsolidation world. We now refer the reader to several perspectives and reviews that have proposed ways to resolve these discrepancies as follows (lines 642-673).
Secondly, it is perfectly fine to state that "the effectiveness of the retrieval-extinction paradigm might depend on the reliability of such paradigm in inferring the same underlying latent cause..." This is not uninteresting, but it also isn't saying much. Minimally, I would expect some statement about factors that are likely to determine whether one is or isn't likely to see a retrieval-extinction effect, grounded in terms of this theory.
Again, as we have responded many times, we simply do not know why some studies were able to suppress the fear expression using the retrieval-extinction paradigm and other studies weren’t. This is still an unresolved issue that the field is actively engaging with, and we now refer the reader to several papers dealing with this issue. However, this is NOT the focus of our manuscript. Having a healthy debate does not mean that every study using the retrieval-extinction paradigm must address the long-standing question of why the retrieval-extinction paradigm is effective (at least in some studies).
Clarifications, Elaborations, Edits
(5) Some parts of the paper are not easy to follow. Here are a few examples (though there are others):
(a) In the abstract, the authors ask "whether memory retrieval facilitates update mechanisms other than memory reconsolidation"... but it is never made clear how memory retrieval could or should "facilitate" a memory update mechanism.
We meant to state that the retrieval-extinction paradigm might have effects on fear memory, above and beyond the purported memory reconsolidation effect. Sentence modified (lines 25-26) as follows:
“Memory reactivation renders consolidated memory fragile and thereby opens the window for memory updates, such as memory reconsolidation.”
(b) The authors state the following: "Furthermore, memory reactivation also triggers fear memory reconsolidation and produces cue specific amnesia at a longer and separable timescale (Study 2, N = 79 adults)." Importantly, in study 2, the retrieval-extinction protocol produced a cue-specific disruption in responding when testing occurred 24 hours after the end of extinction. This result is interesting but cannot be easily inferred from the statement that begins "Furthermore..." That is, the results should be described in terms of the combined effects of retrieval and extinction, not in terms of memory reactivation alone; and the statement about memory reconsolidation is unnecessary. One can simply state that the retrieval-extinction protocol produced a cue-specific disruption in responding when testing occurred 24 hours after the end of extinction.
The sentence the reviewer referred to was in our original manuscript submission but had since been modified based on the reviewer’s comments from last round of revision. Please see the abstract (lines 30-35) of our revised manuscript from last round of revision:
“Furthermore, across different timescales, the memory retrieval-extinction paradigm triggers distinct types of fear amnesia in terms of cue-specificity and cognitive control dependence, suggesting that the short-term fear amnesia might be caused by different mechanisms from the cue-specific amnesia at a longer and separable timescale (Study 2, N = 79 adults).”
(c) The authors also state that: "The temporal scale and cue-specificity results of the short-term fear amnesia are clearly dissociable from the amnesia related to memory reconsolidation, and suggest that memory retrieval and extinction training trigger distinct underlying memory update mechanisms." ***The pattern of results when testing occurred just minutes after the retrieval-extinction protocol was different to that obtained when testing occurred 24 hours after the protocol. Describing this in terms of temporal scale is unnecessary; and suggesting that memory retrieval and extinction trigger different memory update mechanisms is not obviously warranted. The results of interest are due to the combined effects of retrieval+extinction and there is no sense in which different memory update mechanisms should be identified with the different pattern of results obtained when testing occurred either 30 min or 24 hours after the retrieval-extinction protocol (at least, not the specific pattern of results obtained here).
Again, we are afraid that the reviewer referred to the abstract in the original manuscript submission, instead of the revised abstract we submitted in the last round. Please see lines 37-39 of the revised abstract where the sentence was already modified (or the abstract from last round of revision).
The facts that the 30min, 6hr and 24hr test results are different in terms of their cue-specificity and thought-control ability dependence are, to us, an important discovery in terms of delineating different cognitive processes at work following the retrieval-extinction paradigm. We want to emphasize that the fear memories after going through the retrieval-extinction paradigm showed interesting temporal dynamics in terms of their magnitudes, cue-specificity and thought-control ability dependence.
(d) The authors state that: "We hypothesize that the labile state triggered by the memory retrieval may facilitate different memory update mechanisms following extinction training, and these mechanisms can be further disentangled through the lens of temporal dynamics and cue-specificities." *** The first part of the sentence is confusing around usage of the term "facilitate"; and the second part of the sentence that references a "lens of temporal dynamics and cue-specificities" is mysterious. Indeed, as all rats received the same retrieval-extinction exposures in Study 2, it is not clear how or why any differences between the groups are attributed to "different memory update mechanisms following extinction"
The term “facilitate” was used to highlight the fact that the short-term fear amnesia effect is also memory retrieval dependent, as study 1 demonstrated. The novelty of the short-term fear memory deficit can be distinguished from the long-term memory effect via cue-specificity and thought-control ability dependence. Sentence has been modified (lines 97-101) as follows:
“We hypothesize that the labile state triggered by the memory retrieval may facilitate different memory deficits following extinction training, and these deficits can be further disentangled through the lens of temporal dynamics and cue-specificities. In theory, different cognitive mechanisms underlying specific fear memory deficits, therefore, can be inferred based on the difference between memory deficits.”
Data
(6A) The eight participants who were discontinued after Day 1 in Study 1 were all from the no reminder group. The authors should clarify how participants were allocated to the two groups in this experiment so that the reader can better understand why the distribution of non-responders was non-random (as it appears to be).
(6B) Similarly, in study 2, of the 37 participants that were discontinued after Day 2, 19 were from Group 30 min and 5 were from Group 6 hours. The authors should comment on how likely these numbers are to have been by chance alone. I presume that they reflect something about the way that participants were allocated to groups: e.g., the different groups of participants in studies 1 and 2 could have been run at quite different times (as opposed to concurrently). If this was done, why was it done? I can't see why the study should have been conducted in this fashion - this is for myriad reasons, including the authors' concerns re SCRs and their seasonal variations.
As we responded in the previous response letters (as well as in the revised the manuscript), subjects were excluded because their SCR did not reach the threshold of 0.02 S when electric shock was applied. Subjects were assigned to different treatments daily (eg. Day 1 for the reminder group and Day 2 for no-reminder group) to avoid potential confusion in switching protocols to different subjects within the same day. We suspect that the non-responders might be related to the body thermal conditions caused by the lack of central heating for specific dates. Please note that the discontinued subjects (non-responders) were let go immediately after the failure to detect their SCR (< 0.02 S) on Day 1 and never invited back on Day 2, so it’s possible that the discontinued subjects were all from certain dates on which the body thermal conditions were not ideal for SCR collection. Despite the number of excluded subjects, we verified the short-term fear amnesia effect in three separate studies, which to us should serve as strong evidence in terms of the validity of the effect.
(6C) In study 2, why is responding to the CS- so high on the first test trial in Group 30 min? Is the change in responding to the CS- from the last extinction trial to the first test trial different across the three groups in this study? Inspection of the figure suggests that it is higher in Group 30 min relative to Groups 6 hours and 24 hours. If this is confirmed by the analysis, it has implications for the fear recovery index which is partly based on responses to the CS-. If not for differences in the CS- responses, Groups 30 min and 6 hours are otherwise identical. That is, the claim of differential recovery to the CS1 and CS2 across time may simply an artefact of the way that the recovery index was calculated. This is unfortunate but also an important feature of the data given the way in which the fear recovery index was calculated.
We have provided detailed analysis to this question in our previous response letter, and we are posting our previous response there:
Following the reviewer’s comments, we went back and calculated the mean SCR difference of CS- between the first test trial and the last extinction trial for all three studies (see Author response image 1 below). In study 1, there was no difference in the mean CS- SCR (between the first test trial and last extinction trial) between the reminder and no-reminder groups (Kruskal-Wallis test  , though both groups showed significant fear recovery even in the CS- condition (Wilcoxon signed rank test, reminder: P = 0.0043, no-reminder: P = 0.0037). Next, we examined the mean SCR for CS- for the 30min, 6h and 24h groups in study 2 and found that there was indeed a group difference (one-way ANOVA,F<sub>2.76</sub> = 5.3462, P = 0.0067, panel b), suggesting that the CS- related SCR was influenced by the test time (30min, 6h or 24h). We also tested the CS- related SCR for the 4 groups in study 3 (where test was conducted 1 hour after the retrieval-extinction training) and found that across TMS stimulation types (PFC vs. VER) and reminder types (reminder vs. no-reminder) the ANOVA analysis did not yield main effect of TMS stimulation type (F<sub>1.71</sub> = 0.322, P = 0.572) nor main effect of reminder type (F<sub>1.71</sub> = 0.0499, P = 0.824, panel c). We added the R-VER group results in study 3 (see panel c) to panel b and plotted the CS- SCR difference across 4 different test time points and found that CS- SCR decreased as the test-extinction delay increased (Jonckheere-Terpstra test, P = 0.00028). These results suggest a natural “forgetting” tendency for CS- related SCR and highlight the importance of having the CS- as a control condition to which the CS+ related SCR was compared with.
Author response image 1.
(6D) The 6 hour group was clearly tested at a different time of day compared to the 30 min and 24 hour groups. This could have influenced the SCRs in this group and, thereby, contributed to the pattern of results obtained.
Again, we answered this question in our previous response. Please see the following for our previous response:
For the 30min and 24h groups, the test phase can be arranged in the morning, in the afternoon or at night. However, for the 6h group, the test phase was inevitably in the afternoon or at night since we wanted to exclude the potential influence of night sleep on the expression of fear memory (see Author response table 1 below). If we restricted the test time in the afternoon or at night for all three groups, then the timing of their extinction training was not matched.
Author response table 1.
Nevertheless, we also went back and examined the data for the subjects only tested in the afternoon or at nights in the 30min and 24h groups to match with the 6h group where all the subjects were tested either in the afternoon or at night. According to the table above, we have 17 subjects for the 30min group (9+8),18 subjects for the 24h group (9 + 9) and 26 subjects for the 6h group (12 + 14). As Author response image 2 shows, the SCR patterns in the fear acquisition, extinction and test phases were similar to the results presented in the original figure.
Author response image 2.
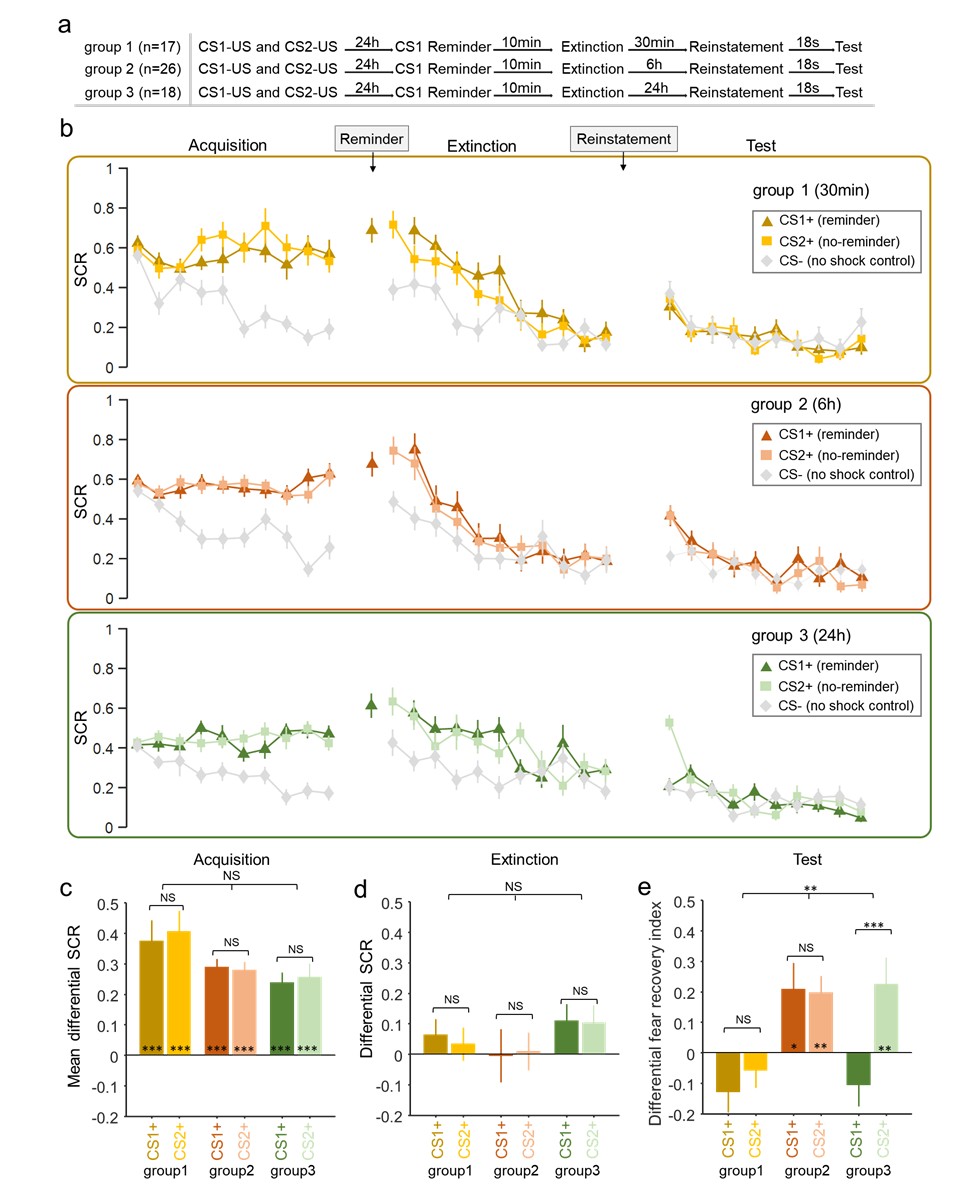
(6E) The authors find different patterns of responses to CS1 and CS2 when they were tested 30 min after extinction versus 24 h after extinction. On this basis, they infer distinct memory update mechanisms. However, I still can't quite see why the different patterns of responses at these two time points after extinction need to be taken to infer different memory update mechanisms. That is, the different patterns of responses at the two time points could be indicative of the same "memory update mechanism" in the sense that the retrieval-extinction procedure induces a short-term memory suppression that serves as the basis for the longer-term memory suppression (i.e., the reconsolidation effect). My pushback on this point is based on the notion of what constitutes a memory update mechanism; and is motivated by what I take to be a rather loose use of language/terminology in the reconsolidation literature and this paper specifically (for examples, see the title of the paper and line 2 of the abstract).
As we mentioned previously, the term “mechanism” might have different connotations for different researchers. We aim to report a novel memory deficit following the retrieval-extinction paradigm, which differed significantly from the purported reconsolidation related long-term fear amnesia in terms of its timescale, cue-specificity and thought-control ability. Further TMS study confirmed that the intact dlPFC function is necessary for the short-term memory deficit. It’s based on these results we proposed that the short-term fear amnesia might be related to a different cognitive “mechanism”. As mentioned above, we now clarify what we mean by “mechanism” in the abstract and introduction (lines 31-34, 97-101).
Reviewer #2 (Public review):
The fear acquisition data is converted to a differential fear SCR and this is what is analysed (early vs late). However, the figure shows the raw SCR values for CS+ and CS- and therefore it is unclear whether acquisition was successful (despite there being an "early" vs "late" effect - no descriptives are provided).
(1) There are still no descriptive statistics to substantiate learning in Experiment 1.
We answered this question in our previous response letter. We are sorry that the definition of “early” and “late” trials was scattered in the manuscript. For example, we wrote “the late phase of acquisition (last 5 trials)” (Line 375-376) in the results section. Since there were 10 trials in total for the acquisition stage, we define the first 5 trials and the last 5 trials as “early” and “late” phases of the acquisition stage and explicitly added them into the first occasion “early” and “late” terms appeared (lines 316-318).
In the results section, we did test whether the acquisition was successful in our previous manuscript (Line 316-325):
“To assess fear acquisition across groups (Figure 1B and C), we conducted a mixed two-way ANOVA of group (reminder vs. no-reminder) x time (early vs. late part of the acquisition; first 5 and last 5 trials, correspondingly) on the differential fear SCR. Our results showed a significant main effect of time (early vs. late; F<sub>1,55</sub> \= 6.545, P \= 0.013, η<sup>2</sup> \= 0.106), suggesting successful fear acquisition in both groups. There was no main effect of group (reminder vs. no-reminder) or the group x time interaction (group: F<sub>1,55</sub> \= 0.057, P \= 0.813, η<sup>2</sup> \= 0.001; interaction: F<sub>1,55</sub> \= 0.066, P \= 0.798, η<sup>2</sup> \= 0.001), indicating similar levels of fear acquisition between two groups. Post-hoc t-tests confirmed that the fear responses to the CS+ were significantly higher than that of CS- during the late part of acquisition phase in both groups (reminder group: t<sub>29</sub> \= 6.642, P < 0.001; no-reminder group: t<sub>26</sub> = 8.522, P < 0.001; Figure 1C). Importantly, the levels of acquisition were equivalent in both groups (early acquisition: t<sub>55</sub> \= -0.063, P \= 0.950; late acquisition: t<sub>55</sub> \= -0.318, P \= 0.751; Figure 1C).”
In Experiment 1 (Test results) it is unclear whether the main conclusion stems from a comparison of the test data relative to the last extinction trial ("we defined the fear recovery index as the SCR difference between the first test trial and the last extinction trial for a specific CS") or the difference relative to the CS- ("differential fear recovery index between CS+ and CS-"). It would help the reader assess the data if Fig 1e presents all the indexes (both CS+ and CS-). In addition, there is one sentence which I could not understand "there is no statistical difference between the differential fear recovery indexes between CS+ in the reminder and no reminder groups (P=0.048)". The p value suggests that there is a difference, yet it is not clear what is being compared here. Critically, any index taken as a difference relative to the CS- can indicate recovery of fear to the CS+ or absence of discrimination relative to the CS-, so ideally the authors would want to directly compare responses to the CS+ in the reminder and no-reminder groups. In the absence of such comparison, little can be concluded, in particular if SCR CS- data is different between groups. The latter issue is particularly relevant in Experiment 2, in which the CS- seems to vary between groups during the test and this can obscure the interpretation of the result.
(2) In the revised analyses, the authors now show that CS- changes in different groups (for example, Experiment 2) so this means that there is little to conclude from the differential scores because these depend on CS-. It is unclear whether the effects arise from CS+ performance or the differential which is subject to CS- variations.
There was a typo in the “P = 0.048” sentence and we have corrected it in our last response letter. Also in the previous response letter, we specifically addressed how the fear recovery index was defined (also in the revised manuscript).
In most of the fear conditioning studies, CS- trials were included as the baseline control. In turn, most of the analyses conducted also involved comparisons between different groups. Directly comparing CS+ trials across groups (or conditions) is rare. In our study 2, we showed that the CS- response decreased as a function of testing delays (30min, 1hr, 6hr and 24hr). Ideally, it would be nice to show that the CS- across groups/conditions did not change. However, even in those circumstances, comparisons are still based on the differential CS response (CS+ minus CS-), that is, the difference of difference. It is also important to note that difference score is important as CS+ alone or across conditions is difficult to interpret, especially in humans, due to noise, signal fluctuations, and irrelevant stimulus features; therefore trials-wise reference is essential to assess the CS+ in the context of a reference stimulus in each trial (after all, the baselines are different). We are listing a few influential papers in the field that the CS- responses were not particularly equivalent across groups/conditions and argue that this is a routine procedure (Kindt & Soeter 2018 Figs. 2-3; Sevenster et al., 2013 Fig. 3; Liu et al., 2014 Fig. 1; Raio et al., 2017 Fig. 2).
In experiment 1, the findings suggest that there is a benefit of retrieval followed by extinction in a short-term reinstatement test. In Experiment 2, the same effect is observed to a cue which did not undergo retrieval before extinction (CS2+), a result that is interpreted as resulting from cue-independence, rather than a failure to replicate in a within-subjects design the observations of Experiment 1 (between-subjects). Although retrieval-induced forgetting is cue-independent (the effect on items that are suppressed [Rp-] can be observed with an independent probe), it is not clear that the current findings are similar, and thus that the strong parallels made are not warranted. Here, both cues have been extinguished and therefore been equally exposed during the critical stage.
(3) The notion that suppression is automatic is speculative at best
We have responded the same question in our previous revision. Please note that our results from study 1 (the comparison between reminder and no-reminder groups) was not set up to test the cue-independence hypothesis for the short-term amnesia with only one CS+. Results from both study 2 (30min condition) and study 3 confirmed the cue-independence hypothesis and therefore we believe interpreting results from study 2 as “a failure to replicate in a within-subject design of the observations of Experiment 1” is not the case.
We agree that the proposal of automatic or unconscious memory suppression is speculative and that’s why we mentioned it in the discussion. The timescale, cue-specificity and the thought-control ability dependence of the short-term fear amnesia identified in our studies was reminiscent of the memory suppression effects reported in the previous literature. However, memory suppression typically adopted a conscious “suppression” treatment (such as the think/no-think paradigm), which was absent in the current study. However, the retrieval-induced forgetting (RIF), which is also considered a memory suppression paradigm via inhibitory control, does not require conscious effort to suppress any particular thought. Based on these results and extant literature, we raised the possibility of memory suppression as a potential mechanism. We make clear in the discussion that the suppression hypothesis and connections with RIF will require further evidence (lines 615-616):
“future research will be needed to investigate whether the short-term effect we observed is specifically related to associative memory or the spontaneous nature of suppression as in RIF (Figure 6C).”
(4) It still struggle with the parallels between these findings and the "limbo" literature. Here you manipulated the retention interval, whereas in the cited studies the number of extinction (exposure) was varied. These are two completely different phenomena.
We borrowed the “limbo” term to stress the transitioning from short-term to long-term memory deficits (the 6hr test group). Merlo et al. (2014) found that memory reconsolidation and extinction were dissociable processes depending on the extent of memory retrieval. They argued that there was a “limbo” transitional state, where neither the reconsolidation nor the extinction process was engaged. Our results suggest that at the test delay of 6hr, neither the short-term nor the long-term effect was present, signaling a “transitional” state after which the short-term memory deficit wanes and the long-term deficit starts to take over. We make this idea more explicit as follows (lines 622-626):
“These works identified important “boundary conditions” of memory retrieval in affecting the retention of the maladaptive emotional memories. In our study, however, we showed that even within a boundary condition previously thought to elicit memory reconsolidation, mnemonic processes other than reconsolidation could also be at work, and these processes jointly shape the persistence of fear memory.”
(5) My point about the data problematic for the reconsolidation (and consolidation) frameworks is that they observed memory in the absence of the brain substrates that are needed for memory to be observed. The answer did not address this. I do not understand how the latent cause model can explain this, if the only difference is the first ITI. Wouldn't participants fail to integrate extinction with acquisition with a longer ITI?
We take the sentence “they observed memory in the absence of the brain substrates that are needed for memory to be observed” as referring to the long-term memory deficit in our study. As we responded before, the aim of this manuscript was not about investigating the brain substrates involved in memory reconsolidation (or consolidation). Using a memory retrieval-extinction paradigm, we discovered a novel short-term memory effect, which differed from the purported reconsolidation effect in terms of timescale, cue-specificity and thought-control ability dependence. We further showed that both memory retrieval and intact dlPFC functions were necessary to observe the short-term memory deficit effect. Therefore, we conclude that the brain mechanism involved in such an effect should be different from the one related to the purported reconsolidation effect. We make this idea more explicit as follows (lines 546-547):
“Therefore, findings of the short-term fear amnesia suggest that the reconsolidation framework falls short to accommodate this more immediate effect (Figure 6A and B).”
Whilst I could access the data in the OFS site, I could not make sense of the Matlab files as there is no signposting indicating what data is being shown in the files. Thus, as it stands, there is no way of independently replicating the analyses reported.
(6) The materials in the OSF site are the same as before, they haven't been updated.
Last time we thought the main issue was the OSF site not being publicly accessible and thus made it open to all visitors. We have added descriptive file to explain the variables to help visitors to replicate the analyses we took.
(7) Concerning supplementary materials, the robustness tests are intended to prove that you 1) can get the same results by varying the statistical models or 2) you can get the same results when you include all participants. Here authors have done both so this does not help. Also, in the rebuttal letter, they stated "Please note we did not include non-learners in these analyses " which contradicts what is stated in the figure captions "(learners + non learners)"
In the supplementary materials, we did the analyses of varying the statistical models and including both learners and non-learners separately, instead of both. In fact, in the supplementary material Figs. 1 & 2, we included all the participants and performed similar analysis as in the main text and found similar results (learners + non-learners). Also, in the text of the supplementary material, we used a different statistical analysis method to only learners (analyzing subjects reported in the main text using a different method) and achieved similar results. We believe this is exactly what the reviewer suggested us to do. Also there seems to be a misunderstanding for the "Please note we did not include non-learners in these analyses" sentence in the rebuttal letter. As the reviewer can see, the full sentence read “Please note we did not include non-learners in these analyses (the texts of the supplementary materials)”. We meant to express that the Figures and texts in the supplementary material reflect two approaches: 1) Figures depicting re-analysis with all the included subjects (learners + non learners); 2) Text describing different analysis with learners. We added clarifications to emphasize these approaches in the supplementary materials.
(8) Finally, the literature suggesting that reconsolidation interference "eliminates" a memory is not substantiated by data nor in line with current theorising, so I invite a revision of these strong claims.
We agree and have toned down the strong claims.
Overall, I conclude that the revised manuscript did not address my main concerns.
In both rounds of responses, we tried our best to address the reviewer’s concerns. We hope that the clarifications in this letter and revisions in the text address the remaining concerns. Thank you for your feedback.
Reference:
Kindt, M. and Soeter, M. 2018. Pharmacologically induced amnesia for learned fear is time and sleep dependent. Nat Commun, 9, 1316.
Liu, J., Zhao, L., Xue, Y., Shi, J., Suo, L., Luo, Y., Chai, B., Yang, C., Fang, Q., Zhang, Y., Bao, Y., Pickens, C. L. and Lu, L. 2014. An unconditioned stimulus retrieval extinction procedure to prevent the return of fear memory. Biol Psychiatry, 76, 895-901.
Raio, C. M., Hartley, C. A., Orederu, T. A., Li, J. and Phelps, E. A. 2017. Stress attenuates the flexible updating of aversive value. Proc Natl Acad Sci U S A, 114, 11241-11246.
Sevenster, D., Beckers, T., & Kindt, M. 2013. Prediction error governs pharmacologically induced amnesia for learned fear. Science (New York, N.Y.), 339(6121), 830–833.
https://neptunesociety.com/obituaries/west-covina-ca/william-dickey-12555618
William Sherman Dickey<br /> September 6, 1939 – October 11, 2025
William Sherman Dickey, age 86, of Claremont, California passed away on Saturday, October 11, 2025. William was born in Al Hambra CA.
Cross reference: https://www.facebook.com/groups/CCRunningMeetupGroup/posts/3118685201645058/
Stan MITKO = vystupte z davu na každé akci Stany Mitko vám dávají jistotu, že vaše značka vynikne. Možnost plné personalizace potisku umožňuje přizpůsobit stan 3x3 vizuální identitě vaší firmy, což účinně přitahuje: pozornost a buduje profesionální image. Velká reklamní plocha vám poskytuje dodatečný prostor pro propagaci, která okamžitě upoutá pohled potenciálních zákazníků. Kdo by sí nepřál více zájemců u svého stánku?
Se stanem MITKO vystoupíte z davu Celohliníková konstrukce bez praskajících plastových / kaučukových spojek a u vybraných modelů odolnost vůči větru až do 100 km/h dělá z našich stanů bezkonkurenční sázku na spolehlivost a klid na Vaši akci!
Nůžkový stan 3x3 MITKO – stan pro každou událost Nůžkový stan 3x3 je osvědčenou volbou pro každého, kdo si. cení rychlé a bezproblémové montáže. Díky odolné hliníkové konstrukci zaručují nůžkové stany Mitko dlouhou. životnost a mimořádně snadné rozkládání. Zákazníci oceňují naše stany pro jejich univerzálnost, schopnost přizpůsobit se různým povětrnostním podmínkám, ale: především pro dlouhodobou dostupnost náhradních dílů – díky tomu jsou nenahraditelnou volbou pro venkovní akce na mnoho let dopředu.
Nůžkový stan MITKO 3x3 m pro každou událost Rozměr 3x3 m je opravdovým bestsellerem mezi nůžkovými stany. Vyniká svojí lehkou a odolnou hliníkovou konstrukcí, snadným transportem a stavbou do 60 s! Opláštění dokážeme potisknout libovolným designem!
Podívejte se na další, nejčastěji vybírané velikosti
Další nejžádanější velikosti
Technické údaje (závislé na řadě konstrukce)
can you put here segment "Dostupné řady konstrukce" from https://test2025.mitkoforevents.cz/nuzkove-stany/ ?
Náš tým vám nejprve pomůže vybrat ideální řešení a následně připraví návrh, který co nejvěrněji vystihne vaši představu.
Nepotřebujete svého grafika, stačí Vám jasná představa o designu a logo v křivkách. Nabídka se nevztahuje na kreativní návrhy a obsahuje 1x návrh + 1x korekturu.
Poraďte se s naším obchodním zástupcem
use the banner "Zeptejte se nás na cokoliv"
Jediný osmihran na trhu
Jediný osmihranný profil na CZ/SK trhu
Kontaktujte nás, a my vám pomůžeme s výběrem a poradíme! Potřebujete pomoc event managera při výběru vybavení? Nebo se chcete dozvědět více o stanu? Kontaktujte náš tým expertů, kteří odpoví na každou vaši otázku. Spojte se s námi
same banner "Nejste si čímkoliv jistí..." as on previous pages
Výhody nůžkových stanů K hlavním výhodám nůžkových párty stanů patří především. jednoduchá manipulace při skládání a rozkládání, pevná a zároveň lehká hlinková konstrukce, elegantní a odolná plachta, která může zároveň sloužit jako reklamní plocha. Nůžkové stany se používají jako prodejní nebo prezentační stánky, místa pro obchodní setkání, informační body apod. – vše podle potřeb a kreatnvity provozovatele. Dobře navržený potisk promění stan v plně funkční reklamní nosič.
Výhody nůžkových stanů Hlavní výhodou je snadný transport libovolným os. autem a stavba v řádu 60 s! Na opláštění dokážeme natisknout libovolný design.
Váží 16 kg a jsou montovány na noze stanu. Pro lepší stabilizaci mohou být závaží stohována (postavena na sebe).
Váha 16 kg, uchycení na patku stanové nohy, možnost stohování na sebe.
Torba transportová Comfort II Vyrobena z vyztužené tkaniny. Zapínání na zip. Dokonale chrání střechu a konstrukci během přepravy. Má prostorné kapsy na stěny.
Přepravní obal Comfort 2 Vyrobený z odolné látky, zapíná na zip, celý stan vč. bočnic v jednom obalu!
Polyester Nehořlavý polyester 275 g/m2 Polyester s PVC zátěrem o gramáži 330 g/m² K výrobě používáme tkaniny odolné proti roztržení a mechanickému poškození. Potah si můžete objednat v barvě podle vzorníku 20 základních a pokud o potisk nemáte zájem, máme na výběr z následujících standardních barev.
Polyester 240 g/m2 K výrobě opláštění používáme pouze látky odolné vůči odření a roztržení. Vybírat můžete z následujících standardních barev a to bez příplatku za jednotlivé barvy!
Polyester 275 g/m2 se sníženou hořlavostí Požaduje po Vás pořadatel akce opláštění se sníženou hořlavostí? Zvolte tuto variantu opláštění splňující přísné evropské normy EN ISO 6940, 6941 a DIN 4102-B1.
Polyester s PVC zátěrem 330 g/m2 Jednostranný PVC zátěr garantuje snadnou údržbu a především absolutní vodotěsnost opláštění.
Certifikované barvy OEKO-TEX® Standard 100 Potisk na našich nůžkových stanech je téměř nezničitelný, velmi odolný vůči oděru a UV záření. Používáme pouze ověřené barvy splňující požadavky OEKO-TEX® Standard 100. Tiskové technologie jsou bezpečné pro vaše zdraví a neobsahují toxické látky.
this part is OK
Nejlepší trvanlivost a odolnost vůči UV záření Díky výrobě na místě jsme schopni připravit tvůj produkt vždy včas – bez dlouhého čekání na objednávku. Využíváme služeb prověřených a důvěryhodných kurýrů, což zajišťuje bezpečné a včasné dodání přímo k tobě.
UV odolnost potisku Sublimační potisk dosahuje 6. stupně UV odolnosti a DTF potisk dokonce nejvyššího 8. stupně (Blue Wool Scale).
Poraďte se s naším obchodním zástupcem
same banner "Zeptejte se nás na cokoliv" from the party-stany page
Author response:
The following is the authors’ response to the original reviews
Public Reviews:
Reviewer #1 (Public review):
Summary:
Silbaugh, Koster, and Hansel investigated how the cerebellar climbing fiber (CF) signals influence neuronal activity and plasticity in mouse primary somatosensory (S1) cortex. They found that optogenetic activation of CFs in the cerebellum modulates responses of cortical neurons to whisker stimulation in a cell-type-specific manner and suppresses potentiation of layer 2/3 pyramidal neurons induced by repeated whisker stimulation. This suppression of plasticity by CF activation is mediated through modulation of VIP- and SST-positive interneurons. Using transsynaptic tracing and chemogenetic approaches, the authors identified a pathway from the cerebellum through the zona incerta and the thalamic posterior medial (POm) nucleus to the S1 cortex, which underlies this functional modulation.
Strengths:
This study employed a combination of modern neuroscientific techniques, including two-photon imaging, opto- and chemo-genetic approaches, and transsynaptic tracing. The experiments were thoroughly conducted, and the results were clearly and systematically described. The interplay between the cerebellum and other brain regions - and its functional implications - is one of the major topics in this field. This study provides solid evidence for an instructive role of the cerebellum in experience-dependent plasticity in the S1 cortex.
Weaknesses:
There may be some methodological limitations, and the physiological relevance of the CFinduced plasticity modulation in the S1 cortex remains unclear. In particular, it has not been elucidated how CF activity influences the firing patterns of downstream neurons along the pathway to the S1 cortex during stimulation.
Our study addresses the important question of whether CF signaling can influence the activity and plasticity of neurons outside the olivocerebellar system, and further identifies the mechanism through which this indeed occurs. We provide a detailed description of the involvement of specific neuron subtypes and how they are modulated by climbing fiber activation to impact S1 plasticity. We also identify at least one critical pathway from the cerebellar output to the S1 circuit. It is indeed correct that we did not investigate how the specific firing patterns of all of these downstream neurons are affected, or the natural behaviors in which this mechanism is involved. Now that it is established that CF signaling can impact activity and plasticity outside the olivocerebellar system -- and even in the primary somatosensory cortex -- these questions will be important to further investigate in future studies.
(1) Optogenetic stimulation may have activated a large population of CFs synchronously, potentially leading to strong suppression followed by massive activation in numerous cerebellar nuclear (CN) neurons. Given that there is no quantitative estimation of the stimulated area or number of activated CFs, observed effects are difficult to interpret directly. The authors should at least provide the basic stimulation parameters (coordinates of stim location, power density, spot size, estimated number of Purkinje cells included, etc.).
As discussed in the paper, we indeed expect that synchronous CF activation is needed to allow for an effect on S1 circuits under natural or optogenetic activation conditions. The basic optogenetic stimulation parameters (also stated in the methods) are as follows: 470 nm LED; Ø200 µm core, 0.39 NA rotary joint patch cable; absolute power output of 2.5 mW; spot size at the surface of the cortex 0.6 mm; estimated power density 8 mW/mm2. A serious estimate of the number of Purkinje cells that are activated is difficult to provide, in particular as ‘activation’ would refer to climbing fiber inputs, not Purkinje cells directly.
(2) There are CF collaterals directly innervating CN (PMID:10982464). Therefore, antidromic spikes induced by optogenetic stimulation may directly activate CN neurons. On the other hand, a previous study reported that CN neurons exhibit only weak responses to CF collateral inputs (PMID: 27047344). The authors should discuss these possibilities and the potential influence of CF collaterals on the interpretation of the results.
A direct activation of CN neurons by antidromic spikes in CF collaterals cannot be ruled out. However, we believe that this effect will not be substantial. The activation of the multi-synaptic pathway that we describe in this study is more likely to require a strong nudge as resulting from synchronized Purkinje cell input and subsequent rebound activation in CN neurons (PMID: 22198670), rather than small-amplitude input provided by CF collaterals (PMID: 27047344). A requirement for CF/PC synchronization would also set a threshold for activation of this suppressive pathway.
(3) The rationale behind the plasticity induction protocol for RWS+CF (50 ms light pulses at 1 Hz during 5 min of RWS, with a 45 ms delay relative to the onset of whisker stimulation) is unclear.
a) The authors state that 1 Hz was chosen to match the spontaneous CF firing rate (line 107); however, they also introduced a delay to mimic the CF response to whisker stimulation (line 108). This is confusing, and requires further clarification, specifically, whether the protocol was designed to reproduce spontaneous or sensory-evoked CF activity.
This protocol was designed to mimic sensory-evoked CF activity as reported in Bosman et al (J. Physiol. 588, 2010; PMID: 20724365).
b) Was the timing of delivering light pulses constant or random? Given the stochastic nature of CF firing, randomly timed light pulses with an average rate of 1Hz would be more physiologically relevant. At the very least, the authors should provide a clear explanation of how the stimulation timing was implemented.
Light pulses were delivered at a constant 1 Hz. Our goal was to isolate synchrony as the variable distinguishing sensory-evoked from spontaneous CF activity; additionally varying stochasticity, rate, or amplitude would have confounded this. Future studies could explore how these additional parameters shape S1 responses.
(4) CF activation modulates inhibitory interneurons in the S1 cortex (Figure 2): responses of interneurons in S1 to whisker stimulation were enhanced upon CF coactivation (Figure 2C), and these neurons were predominantly SST- and PV-positive interneurons (Figure 2H, I). In contrast, VIP-positive neurons were suppressed only in the late time window of 650-850 ms (Figure 2G). If the authors' hypothesis-that the activity of VIP neurons regulates SST- and PVneuron activity during RWS+CF-is correct, then the activity of SST- and PV-neurons should also be increased during this late time window. The authors should clarify whether such temporal dynamics were observed or could be inferred from their data.
Yes, we see a significant activity increase in PV neurons in this late time window (see updates to Data S2). Activity was also increased in SST neurons, though this did not reach statistical significance (Data S2). One reason might be that – given the small effect size overall – such an effect would only be seen in paired recordings. Chemogenetic activity modulation in VIP neurons, which provides a more crude test, shows, however, that SST- and PV-positive interneurons are indeed regulated via inhibition from VIP-positive interneurons (Fig. 5).
(5) Transsynaptic tracing from CN nicely identified zona incerta (ZI) neurons and their axon terminals in both POm and S1 (Figure 6 and Figure S7).
a) Which part of the CN (medial, interposed, or lateral) is involved in this pathway is unclear.
We used a dual-injection transsynaptic tracing approach to specifically label the outputs of ZI neurons that receive input from the deep cerebellar nuclei. The anterograde viral vector injected into the CN is unlabeled (no fluorophore) and therefore, it is not possible to reliably assess the extent of viral spread in those experiments as performed. However, we have previously performed similar injections into the deep cerebellar nuclei and post hoc histology suggest all three nuclei will have at least some viral expression (Koster and Sherman, 2024). Due to size and injection location, we will mostly have reached the lateral (dentate) nuclei, but cannot exclude partial transsynaptic tracing from the interposed and medial nuclei.
b) Were the electrophysiological properties of these ZI neurons consistent with those of PV neurons?
Although most recorded cells demonstrated electrophysiological properties consistent with PV+ interneurons in other brain regions (i.e. fast spiking, narrow spike width, non-adapting; see Tremblay et al., 2016), interneuron subtypes in the ZI have been incompletely characterized, with SST+ cells showing similar features to those typically associated with PV+ cells (if interested, compare Fig. 4 in DOI: 10.1126/sciadv.abf6709 vs. Fig. S10 in https://doi.org/10.1016/j.neuron.2020.04.027). Therefore, we did not attempt to delineate cell identity based on these characteristics.
c) There appears to be a considerable number of axons of these ZI neurons projecting to the S1 cortex (Figure S7C). Would it be possible to estimate the relative density of axons projecting to the POm versus those projecting to S1? In addition, the authors should discuss the potential functional role of this direct pathway from the ZI to the S1 cortex.
An absolute quantification is difficult to provide based on the images that we obtained. However, any crude estimate would indicate the relative density of projections to POm is higher than the density of projections to S1 (this is apparent from the images themselves). While the anatomical and functional connections from POm to S1 have been described in detail (Audette et al., 2018), this is not the case for the direct projections to ZI. A direct ZI to S1 projection would potentially involve a different recruitment of neurons in the S1 circuit. Any discussion on the specific consequences of the activation of this direct pathway would be purely speculative.
Reviewer #2 (Public review):
Summary:
The authors examined long-distance influence of climbing fiber (CF) signaling in the somatosensory cortex by manipulating whiskers through stimulation. Also, they examined CF signaling using two-photon imaging and mapped projections from the cerebellum to the somatosensory cortex using transsynaptic tracing. As a final manipulation, they used chemogenetics to perturb parvalbumin-positive neurons in the zona incerta and recorded from climbing fibers.
Strengths:
There are several strengths to this paper. The recordings were carefully performed, and AAVs used were selective and specific for the cell types and pathways being analyzed. In addition, the authors used multiple approaches that support climbing fiber pathways to distal regions of the brain. This work will impact the field and describes nice methods to target difficult-to-reach brain regions, such as the inferior olive.
Weaknesses:
There are some details in the methods that could be explained further. The discussion was very short and could connect the findings in a broader way.
In the revised manuscript, we provide more methodological details, as requested. We provided as simple as possible explanations in the discussion, so as not to bias further investigations into this novel phenomenon. In particular, we avoid an extended discussion of the gating effect of CF activity on S1 plasticity. While this is the effect on plasticity specifically observed here, we believe that the consequences of CF signaling on S1 activity may entirely depend on the contexts in which CF signals are naturally recruited, the ongoing activity of other brain regions, and behavioral state. Our key finding is that such modulation of neocortical plasticity can occur. How CF signaling controls plasticity of the neocortex in all contexts remains unknown, but needs to be thoughtfully tested in the future.
Reviewer #3 (Public review):
Summary:
The authors developed an interesting novel paradigm to probe the effects of cerebellar climbing fiber activation on short-term adaptation of somatosensory neocortical activity during repetitive whisker stimulation. Normally, RWS potentiated whisker responses in pyramidal cells and weakly suppressed them in interneurons, lasting for at least 1h. Crusii Optogenetic climbing fiber activation during RWS reduced or inverted these adaptive changes. This effect was generally mimicked or blocked with chemogenetic SST or VIP activation/suppression as predicted based on their "sign" in the circuit.
Strengths:
The central finding about CF modulation of S1 response adaptation is interesting, important, and convincing, and provides a jumping-off point for the field to start to think carefully about cerebellar modulation of neocortical plasticity.
Weaknesses:
The SST and VIP results appeared slightly weaker statistically, but I do not personally think this detracts from the importance of the initial finding (if there are multiple underlying mechanisms, modulating one may reproduce only a fraction of the effect size). I found the suggestion that zona incerta may be responsible for the cerebellar effects on S1 to be a more speculative result (it is not so easy with existing technology to effectively modulate this type of polysynaptic pathway), but this may be an interesting topic for the authors to follow up on in more detail in the future.
Our interpretation of the anatomical and physiological findings is that a pathway via the ZI is indeed critical for the observed effects. This pathway also represents perhaps the most direct pathway (i.e. least number of synapses connecting the cerebellar nuclei to S1). However, several other direct and indirect pathways are plausible as well and we expect distinct activation requirements and consequences for neurons in the S1 circuit. These are indeed interesting topics for future investigation.
Recommendations for the authors:
Reviewer #1 (Recommendations for the authors):
(1) Line 77: "CF transients" is not a standard or widely recognized term. Please use a more precise expression, such as "CF-induced calcium transients."
We now avoid the use of the term “CF transients” and replaced it with “CF-induced calcium transients.”
(2) Titer of AAVs injected should be provided.
AAV titers have been included in an additional data table (Data S9).
(3) Several citations to the figures are incorrect (for example, "Supplementary Data 2a (Line 398)" does not exist).
We apologize for the mistakes in this version of the article. Incorrect citations to the figures have been corrected.
(4) Line 627-628: "The tip of the patch cable was centered over Crus II in all optogenetic stimulation experiments." The stereotaxic coordinate of the tip position should be provided.
The stereotaxic coordinate of the tip position has been provided in the methods.
(5) Line 629: "Blue light pulses were delivered with a 470 nm Fiber-Coupled LED (Thorlabs catalog: M470F3)." The size of the light stim and estimated power density (W/mm^2) at the surface of the cortex should be provided.
The spot size and estimated power density at the surface of the cortex has been provided in the methods.
(6) Line 702-706: References for DCZ should be cited.
We now cited Nagai et al, Nat. Neurosci. 23 (2020) as the original reference.
(7) Two-photon image processing (Line 807-809): The rationale for normalizing ∆F/F traces to a pre-stimulus baseline is unclear because ∆F/F is, by definition, already normalized to baseline fluorescence: (Ft-F0)/F0. The authors should clarify why this additional normalization step was necessary and how it affected the interpretation of the data.
A single baseline fluorescence value (F₀) was computed for each neuron across the entire recording session, which lasted ~120-minutes. However, some S1 neurons exhibit fluctuations in baseline fluorescence over time—often related to locomotive activity or spontaneous network oscillations—which can obscure stimulus-evoked changes. To isolate fluorescence changes specifically attributable to whisker stimulation, we normalized each ∆F/F trace to the prestimulus baseline for that trial. This additional normalization allowed us to quantify potentiation or depression of sensory responses themselves, independently of spontaneous oscillations or locomotion-related changes in the ongoing neural activity.
Reviewer #2 (Recommendations for the authors):
(1) Did the climbing fiber stimulation for Figure 1 result in any changes to motor activity? Can you make any additional comments on other behaviors that were observed during these manipulations?
Acute CF stimulation did not cause any changes in locomotive or whisking activity. The CF stimulation also did not influence the overall level of locomotion or whisking during plasticity induction.
(2) Figure 3B and F- it is very difficult to see the SST+ neurons. Can this be enhanced?
We linearly adjusted the brightness and contrast for the bottom images in Figure 3B and F to improve visualization of SST+ neurons. Note the expression of both hM3D(Gq) and hM4D(Gi) in SST+ neurons is sparse, which was necessary to avoid off-target effects.
(3) Can you be more specific about the subregions of cerebellar nuclei and cell types that are targeted in the tracing studies? Discussions of the cerebellar nuclei subregions are missing and would be interesting, as others have shown discrete pathways between cerebellar nuclei subregions and long-distance projections.
See our response to comment 5a from Reviewer 1 (copied again here): we used a dual-injection transsynaptic tracing approach to specifically label the outputs of ZI neurons that receive input from the deep cerebellar nuclei. The anterograde viral vector injected into the CN is unlabeled (no fluorophone) and therefore, it is not possible to reliably assess the extent of viral spread in those experiments as performed. However, we have previously performed similar injections into the deep cerebellar nuclei and post hoc histology suggest all three nuclei will have at least some viral expression (Koster and Sherman, 2024). Due to size and injection location, we will mostly have reached the lateral (dentate) nuclei, but cannot exclude partial transsynaptic tracing from the interposed and medial nuclei.
It would indeed be interesting to further investigate the effect of CFs residing in different cerebellar lobules, which preferentially target different cerebellar nuclei, on targets of these nuclei.
(4) Did you see any connection to the ventral tegmental area? Can you comment on whether dopamine pathways are influenced by CF and in your manipulations?
We did not specifically look at these pathways and thus are not able to comment on this.
(5) These are intensive surgeries, do you think glia could have influenced any results?
This was not tested and seems unlikely, but we cannot exclude such possibility.
(6) It is unclear in the methods how long animals were recorded for in each experiment. Can you add more detail?
Additional detail was added to the methods. Recordings for all experimental configurations did not last more than 120 minutes in total. All data were analyzed across identical time windows for each experiment.
(7) In the methods it was mentioned that recording length can differ between animals. Can this influence the results, and if so, how was that controlled for?
There was a variance in recording length within experimental groups, but no systematic difference between groups.
(8) I do not see any mention of animal sex throughout this manuscript. If animals were mixed groups, were sex differences considered? Would it be expected that CF activity would be different in male and female mice?
As mentioned in the Methods (Animals), mice of either sex were used. No sex-dependent differences were observed.
(9) Transsynaptic tracing results of the zona incerta are very interesting. The zona incerta is highly understudied, but has been linked to feeding, locomotion, arousal, and novelty seeking. Do you think this pathway would explain some of the behavioral results found through other studies of cerebellar lobule perturbations? Some discussion of how this brain region would be important as a cerebellar connection in animal behavior would be interesting.
Since the multi-synaptic pathway from the cerebellum to S1 involves several brain regions with their own inputs and modulatory influences, it seems plausible to assume that behaviors controlled by these regions or affecting signaling pathways that regulate them would show some level of interaction. Our study does not address these interactions, but this will be an interesting question to be addressed in future work.
Reviewer #3 (Recommendations for the authors):
General comments on the data presentation:
I'm not a huge fan of taking areas under curves ('AUC' throughout the study) when the integral of the quantity has no physical meaning - 'normalizing' the AUC (1I,L etc) is even stranger, because of course if you instead normalize the AUC by the # of data points, you literally just get the mean (which is probably what should be used instead).
Indeed, AUC is equal to the average response in the time window used, multiplied by the window duration (thus, AUC is directly proportional to the mean). We choose to report AUC, a descriptive statistic, rather than the mean within this window. In 1I and L, we normalize the AUC across animals, essentially removing the variability across animals in the ‘Pre’ condition for visualization. Note the significance of these comparisons are consistent whether or not we normalize to the ‘Pre’ condition (non-normalized RWS data in I shows a significant increase in PN activity, p = 0.0068, signrank test; non-normalized RWS+CF data in I shows a significant decrease in PN activity, p = 0.0135, paired t-test; non-normalized RWS data in L shows a significant decrease in IN activity, p <0.001, paired t-test; non-normalized RWS+CF data in L shows no significant change in IN activity, p = 0.7789, paired t-test).
I think unadorned bar charts are generally excluded from most journals now. Consider replacing these with something that shows the raw datapoints if not too many, or the distribution across points.
We have replaced bar charts with box plots and violin plots. We have avoided plotting individual data points due to the quantity of points.
In various places, the statistics produce various questionable outcomes that will draw unwanted reader scrutiny. Many of the examples below involve tiny differences in means with overlapping error bars that are "significant" or a few cases of nonoverlapping error bars that are "not significant." I think replacing the bar charts may help to resolve things here if we can see the whole distribution or the raw data points. As importantly, I think a big problem is that the statistical tests all seem to be nonparametric (they are ambiguously described in Table S3 as "Wilcoxon," which should be clarified, since there is an unpaired Wilcoxon test [rank sum] and a paired Wilcoxon test [sign rank]), and thus based on differences in the *median* whereas the bar charts are based on the *mean* (and SEM rather than MAD or IQR or other medianappropriate measure of spread). This should be fixed (either change the test or change the plots), which will hopefully allay many of the items below.
We thank the reviewer for this important point. As mentioned in the Statistics and quantification section, Wilcoxon signed rank tests were used for non-normal data. We have replaced the bar charts with box plots which show the IQR and median, which indeed allays may of the items below.
Here are some specific points on the statistics presentation:
(1) 1G, the test says that following RWS+CF, the decrease in PN response is not significant. In 1I, the same data, but now over time, shows a highly significant decrease. This probably means that either the first test should be reconsidered (was this a paired comparison, which would "build in" the normalization subsequently used automatically?) or the second test should be reconsidered. It's especially strange because the n value in G, if based on cells, would seem to be ~50-times higher than that in I if based on mice.
In Figure 1G, the analysis tests whether individual pyramidal neurons significantly changed their responses before vs. after RWS+CF stimulation. This is a paired comparison at the single-cell level, and here indicates that the average per-neuron response did not reliably decrease after RWS+CF when comparing each cell’s pre- and post-values directly. In contrast, Figure 1I examines the same dataset analyzed across time bins using a two-way ANOVA, which tests for effects of time, group (RWS vs. RWS+CF), and their interaction. The analysis showed a significant group effect (p < 0.001), indicating that the overall level of activity across all time points differed between RWS and RWS+CF conditions. The difference in significance between these two analyses arises because the first test (Fig. 1G) assesses within-neuron changes (paired), whereas the second test (Fig. 1I) assesses overall population-level differences between groups over time (independent groups). Thus, the tests address related but distinct questions—one about per-cell response changes, the other about how activity differs across experimental conditions.
(2) 1J RWS+CF then shows a much smaller difference with overlapping error bars than the ns difference with nonoverlapping errors in 1G, but J gets three asterisks (same n-values).
Bar graphs have been replaced with box plots.
(3) 1K, it is very unclear what is under the asterisk could possibly be significant here, since the black and white dots overlap and trade places multiple times.
See response to point 1. A significant group effect will exist if the aggregate difference across all time bins exceeds within-group variability. The asterisk therefore reflects a statistically significant main group effect (RWS versus RWS+CF) rather than differences at any single time point. Note, however, the very small effect size here.
(4) 2B, 2G, 2H, 2I, 3G, 3H, 5C etc, again, significance with overlapping error bars, see suggestions above.
Bar graphs have been replaced with box plots.
(5) Time windows: e.g., L149-153 / 2B - this section reads weirdly. I think it would be less offputting to show a time-varying significance, if you want to make this point (there are various approaches to this floating around), or a decay rate, or something else.
Here, we wanted to understand the overall direction of influence of CFs on VIP activity. We find that CFs exert a suppressive effect on VIP activity, which is statistically significant in this later time window. The specific effect of CF modulation on the activity of S1 neurons across multiple time points will be described in more detail in future investigations.
(6) 4G, 6I, these asterisks again seem impossible (as currently presented).
Bar graphs have been replaced with box plots.
The writing is in generally ok shape, but needs tightening/clarifying:
(1) L45 "mechanistic capacity" not clear.
We have simplified this term to “capacity.” We use the term here to express that the central question we pose is whether CF signals are able to impact S1 circuits. We demonstrate CF signals indeed influence S1 circuits and further describe the mechanism through which this occurs, but we do not yet know all of the natural conditions in which this may occur. We feel that “capacity” describes the question we pose -- and our findings -- very well.
(2) L48-58 there's a lot of material here, not clear how much is essential to the present study.
We would like to give an overview of the literature on instructive CF signaling within the cerebellum. Here, we feel it is important to describe how CFs supervise learning in the cerebellum via coincident activation of parallel fiber inputs and CF inputs. Our results demonstrate CFs have the capacity to supervise learning in the neocortex in a similar manner, as coincident CF activation with sensory input modulates plasticity of S1 neurons.
(3) L59 "has the capacity to" maybe just "can".
This has been adopted. We agree that “can” is a more straightforward way of saying “has the capacity to” here. In this sentence, “can” and “has the capacity to” both mean a general ability to do something, without explicit knowledge about the conditions of use.
(4) L61-62 some of this is circular "observation that CF regulates plasticity in S1..has consequences for plasticity in S1".
We now changed this to read “…consequences for input processing in S1.”
(5) L91 "already existing whisker input" although I get it, strictly speaking, not clear what this means.
This sentence has been reworded for clarity.
(6) L94 "this form of plasticity" what form?
Edited to read “sensory-evoked plasticity.”
(7) L119 should say "to test the".
This has been corrected.
(8) L120 should say "well-suited to measure receptive fields".
We agree; this wording has been adopted.
(9) L130 should say "optical imaging demonstrated that receptive field".
This has been adopted.
(10) L138, the disclaimer is helpful, but wouldn't it be less confusing to just pick a different set of terms? Response potentiation etc.
Perhaps, but we want to stress that components of LTP and LTD (traditionally tested using electrophysiological methods to specifically measure synaptic gain changes) can be optically measured as long as it is specified what is recorded.
(11) L140, this whole section is not very clear. What was the experiment? What was done and how?
The text in this section has been updated.
(12) L154, 156, 158, 160, 960, what is a "basic response"? Is this supposed to contrast with RWS? If so, I would just say "we measured the response to whisker stimulation without first performing RWS, and compared this to the whisker stimulation with simultaneous CF activation."
What we meant by “basic response” was the acute response of S1 neurons to a single 100 ms air puff. Here, we indeed measured the acute responses of S1 neurons to whisker stimulation (100 ms air puff) and compared them to whisker stimulation with simultaneous CF activation (100 ms air puff with a 50 ms light pulse; the light pulse was delayed 45 ms with respect to the air puff). This paragraph has been reworded for clarity.
(13) L156 "comprised of a majority" unclear. You mean most of the nonspecific IN group is either PV or SST?
Yes, that was meant here. This paragraph has been reworded for clarity.
(14) L165 tense. "are activated" "we tested" prob should be "were activated."
This sentence was reworded.
(15) L173 Not requesting additional experiments, but demonstrating that the effect is mimicked by directly activating SST or suppressing VIP questions the specificity of CF activation per se, versus presumably many other pathways upstream of the same mechanisms, which might be worth acknowledging in the text.
We indeed observe that directly activating SST or suppressing VIP neurons in S1 is sufficient to mediate the effect of CF activation on S1 pyramidal neurons, implicating SST and VIP neurons as the local effectors of CF signaling. In the text, we wrote “...the notion of sufficiency does not exclude potential effects of plasticity processes elsewhere that might well modulate effector activation in this context and others not yet tested.” Here, we mean that CFs are certainly not the only modulators of the inhibitory network in S1. One example we highlight in the discussion is that projections from M1 are known to modulate this disinhibitory VIP-to-SST-to-PN microcircuit in S1. We conclude from our chemogenetic manipulation experiments that CFs ultimately have the capacity to modulate S1 interneurons, which must occur indirectly (either through the thalamus or “upstream” regions as this reviewer points out). The fact that many other brain regions may also modulate the interneuron network in S1 -- or be modulated by CF activity themselves -- only expands the capacity of CFs to exert a variety of effects on S1 neurons in different contexts.
(16) L247 "induced ChR2" awkward.
We changed this to read “we expressed ChR2.”
(17) 6C, what are the three colors supposed to represent?
We apologize for the missing labels in this version of the manuscript. Figure 6C and the figure legend have been updated.
, e
@laconis est-il possible de supprimer la virgule avant "et" ?
C'est une oxford comma fautive en français
HTML 4.0 (1997)
nasce come DTD SGML (primi anni '90), dopo HTML 5.0 si stacca da SGML (2008, dopo nascita XML nel 98).
Descriptive markup
descrive il ruolo e la struttura logica di un documento, anziché la sua presentazione visiva.
In the literature, there is broad agreement on the minimal definitions of self-efficacy proposed initially by Bandura (1982); however, different approaches emerge that emphasize specific elements of the construct. On the one hand, some studies focus on task self-efficacy, understood as the perceived capabilities required to achieve a certain level of performance when mastering an activity. On the other hand, there are works oriented toward regulatory self-efficacy, which is more concerned with how confidence supports resilience in the face of potential barriers around the social context of individuals. While capability-focused studies emphasize the magnitude of the task—that is, its degree of difficulty or complexity—and the linear progression toward mastery, more attitudinal approaches highlight persistence and resistance when confronting the adversities present in the environment where the activity takes place (Marlatt et al., 1995; Schwarzer & Renner, 2000; Williams & Rhodes, 2016).
Reordenar el párrafo: Por un lado, (desarrollar toda la idea: capability centered). Mientras que por otro, (attitudinal approaches).
Although ICILS and PISA differ in the intentions of measuring digital self-efficacy, if one examines the meaning of the items in depth, they are similar, raising suspicions about their different measurement strategies. In a world of high technological complexity, it is difficult to work with uniform constructs that do not recognize different dimensions of self-efficacy, so these differences are more than technical: they affect how countries governments interpret digital readiness and how gender disparities are identified. As constructs of different studies tend to not be comparable, a lot of information that is relevant for understanding the social determinants of technologies is loosed.
Reformular en torno a la comparabilidad como eje central.
In turn, the literature consistently reports that students with low expectations of specialized self-efficacy sometimes score higher on standardized tests of digital skills
No es así, mayor spec DSE = menor cil; la general si tiene una relación al menos en ICILS. Al respecto Campos y Scherer
The problem is that recent definitions of Digital Competence are no longer framed within a bidimensional approach to self-efficacy with technologies.
Creo que como está escrito se entiende que el marco de competencias se encuadra en la autoeficacia bidimensional, cuando es al revés. Quizás se podría plantear la frase al contrario: The problem is that the bidimensional aproach to self-efficacy is no longer suitable with recent definitions of Digital competence
we aim to clarify whether differences in DSE are consistent across contexts or instead a product of how assessments operationalize the construct.
Me hace ruido la segunda afirmación. No tenemos una hipótesis sobre el efecto de la operacionalización de los constructos. El fallo de la invarianza puede deberse a muchas cosas (diferencias culturales, fallos de aplicación, errores de medición, países muy disímiles con el resto), y creo que esto plantea algo binario (o es consistente o está mal operacionalizado).
RRID:AB_2313606
DOI: 10.1210/endocr/bqaf161
Resource: (Vector Laboratories Cat# BA-1000, RRID:AB_2313606)
Curator: @scibot
SciCrunch record: RRID:AB_2313606
RRID:AB_940866
DOI: 10.1158/1078-0432.CCR-25-2201
Resource: (Abcam Cat# ab59192, RRID:AB_940866)
Curator: @scibot
SciCrunch record: RRID:AB_940866
RRID:AB_2893291
DOI: 10.1016/j.molcel.2025.04.012
Resource: (Santa Cruz Biotechnology Cat# sc-515173, RRID:AB_2893291)
Curator: @scibot
SciCrunch record: RRID:AB_2893291
The ability for consumersto choose from a range of past garments in vintage stores,as opposed to just styles dictated by the fashion industry,allows them to express their personal identity and individ-ual style
Det singulære og unikke - det har en stor værdi for forbrugeren at vide at andre forbrugere ikke bare kan gå ud og anskaffe sig præcist det samme
21.6. Bibliography# [u1] Plato. Phaedrus: Translated by Benjamin Jowett. January 2013. Page Version ID: 1189255462. [u2] Luddite. December 2023. Page Version ID: 1189255462. URL: https://en.wikipedia.org/w/index.php?title=Luddite&oldid=1189255462 (visited on 2023-12-10). [u3] Ted Chiang. Will A.I. Become the New McKinsey? The New Yorker, May 2023. URL: https://www.newyorker.com/science/annals-of-artificial-intelligence/will-ai-become-the-new-mckinsey (visited on 2023-12-10). [u4] xkcd comics. The Pace of Modern Life. June 2013. URL: https://xkcd.com/1227/ (visited on 2023-12-10). [u5] xkcd comics. 1227: The Pace of Modern Life - explain xkcd. June 2013. URL: https://www.explainxkcd.com/wiki/index.php/1227:_The_Pace_of_Modern_Life (visited on 2023-12-10). [u6] Steven Spielberg. Jurassic Park. June 1993. URL: https://www.imdb.com/title/tt0107290/. [u7] Alex Blechman [@AlexBlechman]. Sci-Fi Author: In my book I invented the Torment Nexus as a cautionary tale Tech Company: At long last, we have created the Torment Nexus from classic sci-fi novel Don't Create The Torment Nexus. November 2021. URL: https://twitter.com/AlexBlechman/status/1457842724128833538 (visited on 2023-12-10). [u8] Silicon Valley. April 2014. URL: https://www.imdb.com/title/tt2575988/. [u9] Eli Whitney. December 2023. Page Version ID: 1189351897. URL: https://en.wikipedia.org/w/index.php?title=Eli_Whitney&oldid=1189351897 (visited on 2023-12-10). [u10] Alfred Nobel. December 2023. Page Version ID: 1189282550. URL: https://en.wikipedia.org/w/index.php?title=Alfred_Nobel&oldid=1189282550 (visited on 2023-12-10). [u11] Einstein and the Manhattan Project. URL: https://www.amnh.org/exhibitions/einstein/peace-and-war/the-manhattan-project (visited on 2023-12-10). [u12] Steve Krenzel [@stevekrenzel]. With Twitter's change in ownership last week, I'm probably in the clear to talk about the most unethical thing I was asked to build while working at Twitter. 🧵. November 2022. URL: https://twitter.com/stevekrenzel/status/1589700721121058817 (visited on 2023-12-10). [u13] Britney Nguyen. Ex-Twitter engineer says he quit years ago after refusing to help sell identifiable user data, worries Elon Musk will 'do far worse things with data'. November 2022. URL: https://www.businessinsider.com/former-twitter-engineer-worried-how-elon-musk-treat-user-data-2022-11 (visited on 2023-12-10). [u14] Alphabet Workers Union-Communications Workers of America Local 9009. Our People: Workers are coming together to build power across Alphabet. URL: https://www.alphabetworkersunion.org/our-people (visited on 2023-12-10). [u15] Jason Parham. A People’s History of Black Twitter, Part I. Wired, July 2021. URL: https://www.wired.com/story/black-twitter-oral-history-part-i-coming-together/ (visited on 2023-12-10). [u16] Jason Parham. There Is No Replacement for Black Twitter. Wired, November 2022. URL: https://www.wired.com/story/black-twitter-elon-musk/ (visited on 2023-12-10). [u17] Catherine Buni. Media, company, behemoth: What, exactly, is Facebook? November 2016. URL: https://www.theverge.com/2016/11/16/13655102/facebook-journalism-ethics-media-company-algorithm-tax (visited on 2023-12-10). [u18] Rafi Letzter. A teenager on TikTok disrupted thousands of scientific studies with a single video. September 2021. URL: https://www.theverge.com/2021/9/24/22688278/tiktok-science-study-survey-prolific (visited on 2023-12-10). [u19] Catherine D'Ignazio and Lauren F. Klein. Data Feminism. Strong Ideas. MIT Libraries Experimental Collections Fund, Cambridge, 1 edition, 2020. ISBN 978-0-262-04400-4. URL: https://direct.mit.edu/books/oa-monograph/4660/Data-Feminism, doi:10.7551/mitpress/11805.001.0001. [u20] Janet Abbate. Recoding Gender: Women's Changing Participation in Computing. MIT Press, Cambridge, UNITED STATES, 2012. ISBN 978-0-262-30546-4. URL: http://ebookcentral.proquest.com/lib/washington/detail.action?docID=3339524 (visited on 2023-12-10). [u21] Mar Hicks. Programmed Inequality: How Britain Discarded Women Technologists and Lost Its Edge in Computing. MIT Press, Cambridge, UNITED STATES, 2017. ISBN 978-0-262-34294-0. URL: http://ebookcentral.proquest.com/lib/washington/detail.action?docID=6246618 (visited on 2023-12-10). [u22] Charlton D. McIlwain. Black software: the internet and racial justice, from the AfroNet to Black Lives Matter. 2020. URL: https://orbiscascade-washington.primo.exlibrisgroup.com/permalink/01ALLIANCE_UW/8iqusu/alma99162262159401452. [u23] Simone Browne. Dark Matters: On the Surveillance of Blackness. Duke University Press, September 2015. ISBN 978-0-8223-7530-2. URL: https://orbiscascade-washington.primo.exlibrisgroup.com/permalink/01ALLIANCE_UW/8iqusu/alma99161921055701452 (visited on 2023-12-10), doi:10.1215/9780822375302. [u24] Safiya Umoja Noble. Algorithms of Oppression: How Search Engines Reinforce Racism. New York University Press, New York, UNITED STATES, 2018. ISBN 978-1-4798-3364-1. URL: https://orbiscascade-washington.primo.exlibrisgroup.com/permalink/01ALLIANCE_UW/8iqusu/alma99162068349301452 (visited on 2023-12-10). [u25] Shalini Kantayya. Coded Bias. November 2020. URL: https://www.netflix.com/title/81328723 (visited on 2023-12-10). [u26] Tarleton Gillespie. Custodians of the Internet: Platforms, Content Moderation, and the Hidden Decisions That Shape Social Media. Yale University Press, New Haven, UNITED STATES, 2018. ISBN 978-0-300-23502-9. URL: https://orbiscascade-washington.primo.exlibrisgroup.com/permalink/01ALLIANCE_UW/8iqusu/alma99162362661601452 (visited on 2023-12-10). [u27] Sarah T. Roberts. Behind the screen: content moderation in the shadows of social media. 2019. URL: https://orbiscascade-washington.primo.exlibrisgroup.com/permalink/01ALLIANCE_UW/8iqusu/alma99162217744201452. [u28] Jean Burgess, Alice Marwick, and Thomas Poell. The SAGE Handbook of Social Media. SAGE Publications, 55 City Road, London, 2018. URL: https://orbiscascade-washington.primo.exlibrisgroup.com/permalink/01ALLIANCE_UW/8iqusu/alma99162105658401452 (visited on 2023-12-10), doi:10.4135/9781473984066. [u29] Yuri Takhteyev. Coding Places: Software Practice in a South American City. The MIT Press, September 2012. ISBN 978-0-262-30559-4. URL: https://orbiscascade-washington.primo.exlibrisgroup.com/permalink/01ALLIANCE_UW/8iqusu/alma99161981926801452 (visited on 2023-12-10), doi:10.7551/mitpress/9109.001.0001. [u30] Virginia Eubanks. Automating inequality: how high-tech tools profile, police, and punish the poor. 2018. URL: https://orbiscascade-washington.primo.exlibrisgroup.com/permalink/01ALLIANCE_UW/8iqusu/alma99162064355601452. [u31] Mary L. Gray and Siddharth Suri. Ghost Work: How to Stop Silicon Valley from Building a New Global Underclass. Houghton Mifflin Harcourt Publishing Company, Boston, United States, 2019. ISBN 978-1-328-56628-7. URL: https://orbiscascade-washington.primo.exlibrisgroup.com/permalink/01ALLIANCE_UW/8iqusu/alma99162207131801452 (visited on 2023-12-10). [u32] Shoshana Zuboff. The age of surveillance capitalism: the fight for a human future at the new frontier of power. 2019. URL: https://orbiscascade-washington.primo.exlibrisgroup.com/permalink/01ALLIANCE_UW/8iqusu/alma99162177355601452. [u33] Cathy O'Neil. Weapons of math destruction: how big data increases inequality and threatens democracy. 2016. URL: https://orbiscascade-washington.primo.exlibrisgroup.com/permalink/01ALLIANCE_UW/8iqusu/alma99161951137601452. [u34] Sasha Costanza-Chock. Design justice: community-led practices to build the worlds we need. Information policy series. The MIT Press, Cambridge, Massachesetts, 2020. ISBN 978-0-262-35686-2. URL: https://orbiscascade-washington.primo.exlibrisgroup.com/permalink/01ALLIANCE_UW/8iqusu/alma99162363060401452. [u35] Thomas S. Mullaney, Benjamin Peters, Mar Hicks, and Kavita Philip. Your computer is on fire. The MIT Press, Cambridge, Massachusetts, 2021. ISBN 978-0-262-36077-7. URL: https://orbiscascade-washington.primo.exlibrisgroup.com/permalink/01ALLIANCE_UW/8iqusu/alma99162423945901452, doi:10.7551/mitpress/10993.001.0001. [u36] Sara Wachter-Boettcher. Technically wrong: sexist apps, biased algorithms, and other threats of toxic tech. October 2018. URL: https://orbiscascade-washington.primo.exlibrisgroup.com/permalink/01ALLIANCE_UW/8iqusu/alma99329653362401451. [u37] Saunders, Joe and Carl Fox, editors. Media Ethics, Free Speech, and the Requirements of Democracy. Routledge, New York, December 2018. ISBN 978-0-203-70244-4. URL: https://www.taylorfrancis.com/books/edit/10.4324/9780203702444/media-ethics-free-speech-requirements-democracy-carl-fox-joe-saunders, doi:10.4324/9780203702444. [u38] Ruha Benjamin. Viral Justice: How We Grow the World We Want. Princeton University Press, October 2022. ISBN 978-0-691-22288-2. URL: https://press.princeton.edu/books/hardcover/9780691222882/viral-justice (visited on 2023-12-10). [u39] Meta for Developers. 2023. URL: https://developers.facebook.com/ (visited on 2023-12-10). [u40] API Reference — Facebook SDK for Python 4.0.0-pre documentation. 2015. URL: https://facebook-sdk.readthedocs.io/en/latest/api.html (visited on 2023-12-10). [u41] TikTok for Developers. 2023. URL: https://developers.tiktok.com/ (visited on 2023-12-10). [u42] Getting started with Official Account Developer Mode. January 2013. URL: https://developers.weixin.qq.com/doc/offiaccount/en/Getting_Started/Getting_Started_Guide.html (visited on 2023-12-10).
After checking out Coded Bias, I was honestly surprised how much everyday technology relies on algorithms that were never tested on diverse groups of people. The documentary shows how facial recognition failed on darker-skinned women, which made me think about how “neutral” tech isn’t neutral at all. What really got me is how the developers didn’t seem to think about these consequences until people called them out. It connects perfectly to the chapter’s theme that innovation often ignores ethics until harm already happens. It also made me wonder how many other systems we use every day have hidden biases we just haven’t noticed yet.
☑️The most up to date version will be the canonical version that will point to the latest version using IPNS
all versions thus will be available via links
My to do list is on the annotation margins
use hypothesis search to see a reverse chronological listing of todo tasks
This annotation is at the top of that list when this annotation was made
Origo Folder for my hyperpost Peergos Account
No Groan Zome
but
Not just Converge but UpVerge in an autopoietic emregent upward spiral
Beyond all expectations
Imagined a whole new way what that leads to is beyond prior imaginings
: Incursão em Pista Mensal
Entrar dentro da padronização de gráficos do relatório. Adicionar inclusive variação e se ficar "too much" retirar depois de analisado o resultado.
Figura 3.25: KPI 18 - Nivelamento Limite Durante o Cruzeiro
01 - Retirar as casas decimais; 02 - Label da coluna na vertical; 03 - Inserir mais um ano para comparação; 04 - Alterar o título do eixo y (Altitude ao invés de nível); 05 - Harmonizar com gráficos de rotas.
Figura 3.11: KPI 15 - Variabilidade do Tempo de Voo
Alterar a escala da variabilidade de tempo de voo (10 minutos);
Inserir mais um ano de comparação. Enfatizar a condição dos dados radar CAT62 se houver discrepância entre os dados
3.2 EFICIÊNCIA
Alterar os gráficos de variação % para diferença em minutos da KPA EFICIÊNCIA.
Rotas Monitoradas no KPI 15 em 2025
01 - Leonardo irá acrescentar a coluna tempo médio de voo na API; 02 - Padronizar o nome da tabela;
Dispersão entre KPI 01 - Pontualidade de Partida e KPI 14 - Pontualidade de Chegada por Regional
Alterar o ponto de corte do eixo X e Y. Diminuir a fonte da legenda, para ficar em uma linha.
Dispersão entre KPI 01 - Pontualidade de Partida e KPI 14 - Pontualidade de Chegada
Alterar o ponto de corte do eixo X e Y. Diminuir a fonte da legenda, para ficar padronizar com o gráfico do regional.
79,6% - SBPS - Porto Seguro; 79,5% - SBUL - Uberlândia; 79,2% - SBJV - Joinville; 79,2% - SBFN - Fernando de Noronha; 78,0% - SBGR - Guarulhos; 77,4% - SBSP - Congonhas; 75,9% - SBRP - Ribeirão Preto; 75,3% - SBEG - Eduardo Gomes; 75,1% - SBPV - Porto Velho; 74,0% - SBJR - Jacarepaguá; e 68,4% - SBGL - Galeão. (Devido ao fato do aeroporto ter o sistema APRON CONTROL, a fonte de dados utilizada nesse relatório pode conter falta de precisão para este indicador).
Gerar tabela para os aeroportos que ficaram abaixo da meta de 80%. Usar os dados do gráfico acima.
69,3% - SBBE - Belém; 69,1% - SBJV- Joinville; 68,7%- SBMG -Maringá ; 68,6% - SBVT - Vitória; 68,1% - SBCY - Cuiabá; 68,0% - SBFL - Florianópolis ; 67,6% - SBRB - Rio Branco; 67,2% - SBTE - Teresina; 67,1%- SBCF - Confins; 67,0% - SBPV - Porto Velho; 66,5% - SBCT - Curitiba; 66,4% - SBPS - Porto Seguro; 65,6% - SBRJ - Santos Dumont; 64,0%- SBPA - Porto Alegre; 63,8% - SBJR - Jacarepaguá; 63,3% - SBSV - Salvador; 63,0% - SBSP - Congonhas; 62,0%- SBRP - Ribeirão Preto ; 61,4% - SBGL - Galeão; 61,4% - SBBR - Brasília; 61,2% - SBKP - Campinas; 60,5% - SBEG - Eduardo Gomes; 59,2% - SBDN -Presidente Prudente; e 57,2% - SBGR - Guarulhos.
Gerar tabela para os aeroportos que ficaram abaixo da meta por regional. Usar a base de dados do gráfico acima
Le droit des enfants à une justice adaptée : Synthèse du rapport 2025 du Défenseur des droits
Le rapport 2025 du Défenseur des droits, intitulé « Le droit des enfants à une justice adaptée », dresse un état des lieux critique de la justice pénale des mineurs en France. S'appuyant sur une vaste consultation de plus de 1 600 jeunes, le rapport réaffirme le principe fondamental selon lequel un enfant n'est pas un adulte, ce qui justifie une justice spécialisée, dont la primauté doit être éducative plutôt que répressive.
Les conclusions clés sont les suivantes :
• Un principe fondamental menacé :
La spécificité de la justice des mineurs, fondée sur l'atténuation de la responsabilité pénale et la recherche du relèvement éducatif, est fragilisée par des discours publics et des réformes législatives prônant un durcissement des sanctions, au mépris de l'intérêt supérieur de l'enfant et des engagements internationaux de la France.
• La délinquance, symptôme de vulnérabilités :
Loin d'être un phénomène isolé, la délinquance juvénile est intrinsèquement liée à des facteurs de vulnérabilité multiples : 55 % des mineurs délinquants sont suivis par la protection de l’enfance, souvent après avoir été victimes de maltraitances.
La pauvreté, l'échec scolaire, les troubles de santé mentale et l'exposition à la violence sont des déterminants majeurs.
• Un parcours pénal parsemé de défaillances :
De l'interpellation à l'incarcération, le rapport met en évidence des manquements systémiques au respect des droits des enfants.
Les contrôles d'identité discriminatoires, les violences lors des interpellations, les conditions de garde à vue inadaptées et les atteintes à la dignité en détention nourrissent une profonde défiance des jeunes envers les institutions.
• Une réponse judiciaire sous-dotée et incohérente :
Malgré les efforts des professionnels, le système souffre d'un manque criant de moyens.
Les mesures éducatives ne sont pas toujours mises en œuvre faute de personnel, et les conditions d'incarcération, qui devrait être l'ultime recours, compromettent gravement les chances de réinsertion en raison d'un accès insuffisant à l'éducation, aux soins et aux activités.
• La parole des jeunes, un appel à une justice plus humaine :
La consultation révèle une méconnaissance généralisée des droits et une perception négative de la justice chez les jeunes qui y ont été confrontés.
Ils appellent à une justice plus juste, compréhensible, préventive et bienveillante, qui prenne en compte leur vécu et leur offre une véritable seconde chance.
En conclusion, le rapport alerte sur le risque d'une justice qui, en privilégiant une approche exclusivement répressive, reproduirait l'exclusion qu'elle entend combattre.
Il formule 25 recommandations visant à sanctuariser les principes d'une justice adaptée, à renforcer la prévention en luttant contre les vulnérabilités, et à garantir le respect des droits des enfants à chaque étape de leur parcours pénal.
--------------------------------------------------------------------------------
Le rapport rappelle que la nécessité d'une justice pénale distincte pour les mineurs repose sur des principes juridiques, constitutionnels et scientifiques solides, bien que régulièrement remis en cause dans le débat public.
Le discernement, c'est-à-dire la capacité à comprendre et vouloir son acte, se développe progressivement.
Les neurosciences confirment que le cortex préfrontal, responsable du raisonnement et de la régulation des émotions, n'atteint sa pleine maturité qu'autour de 24-25 ans.
Les adolescents sont donc physiologiquement plus sujets à l'impulsivité, à l'influence du groupe et à une mauvaise évaluation des conséquences de leurs actes.
« On n’est pas assez mature, on n’a pas conscience de nos actes. » - Jeune consulté
Le Code de la justice pénale des mineurs (CJPM) de 2021 a instauré une présomption simple de non-discernement pour les enfants de moins de 13 ans.
Le Défenseur des droits estime cette mesure insuffisante et recommande d'inscrire dans la loi un principe de non-responsabilité pénale absolue en deçà de cet âge (Recommandation 1).
La justice des mineurs en France, héritière de l'ordonnance du 2 février 1945, repose sur des principes à valeur constitutionnelle :
• L'atténuation de la responsabilité pénale en fonction de l'âge.
• La primauté de l'éducatif sur le répressif, visant le « relèvement éducatif et moral » de l'enfant.
• La spécialisation des juridictions (juge des enfants, tribunal pour enfants) et des professionnels.
Ces principes sont conformes aux engagements internationaux de la France, notamment la Convention internationale des droits de l’enfant (CIDE).
Le rapport s'inquiète des récentes tentatives de les éroder, comme la loi du 23 juin 2025 qui visait initialement à instaurer une comparution immédiate pour les mineurs de plus de 16 ans, une mesure largement censurée par le Conseil constitutionnel.
La consultation nationale « J’ai des droits, entends-moi ! » révèle une fracture profonde :
• Les jeunes n'ayant jamais eu affaire à la justice ont une perception plutôt positive de son rôle protecteur.
• Ceux qui y ont été confrontés décrivent une expérience marquée par le déficit d'information, le sentiment de ne pas être écoutés et des pratiques discriminatoires, notamment pour les jeunes issus de quartiers prioritaires ou perçus comme d'origine étrangère.
« Dans la justice, y a une injustice : quand c’est des Blancs ou des Arabes c’est différent, ce n’est pas le même traitement. » - Jeune consulté
Globalement, les jeunes aspirent à une justice « compréhensible, éducative, préventive, cadrante mais bienveillante, accompagnante », qui répare et offre une seconde chance.
« Une justice adaptée, ce n’est pas seulement juger, c’est aider les jeunes dans leur souffrance. (...) Nous enfermer (...) n’est probablement pas la meilleure solution. Nous voulons être éduqués et obtenir une seconde chance. » - Lettre collective de mineurs incarcérés
Le rapport insiste sur le fait que la lutte contre la délinquance juvénile passe avant tout par un investissement massif dans la prévention et la protection des enfants contre les facteurs de vulnérabilité.
La délinquance est souvent la conséquence de parcours de vie marqués par des ruptures et des fragilités.
Données et Constats du Rapport
Situation familiale et sociale
55 % des mineurs délinquants sont suivis par la protection de l’enfance. 46 % de ceux en Centre Éducatif Fermé (CEF) ont un père absent.
La précarité socio-économique est citée par les jeunes comme la première cause du passage à l'acte.
Rupture scolaire
Le risque de délinquance est multiplié par huit en cas d'absentéisme scolaire. 72 % des jeunes suivis par la PJJ à Marseille sont ou ont été déscolarisés.
Santé mentale et handicap
90 % des jeunes en CEF présentent au moins un trouble psychiatrique. Le manque de structures de soins et d'accompagnement adapté aggrave leur fragilité.
Exposition à la violence
L'exposition à la violence (familiale, scolaire, numérique, sexuelle) favorise la reproduction des comportements violents. Le rapport note une augmentation de 77 % des mineurs mis en cause pour violences sexuelles entre 2017 et 2024.
Exploitation par des réseaux
Des mineurs, notamment les non-accompagnés (MNA), sont victimes de traite des êtres humains à des fins de délinquance forcée (trafic de stupéfiants, prostitution). Ils sont souvent traités comme des auteurs et non comme des victimes.
Pour contrer ces facteurs, le rapport préconise de renforcer plusieurs dispositifs.
• La prévention spécialisée : Les "éducateurs de rue" qui vont à la rencontre des jeunes en marge jouent un rôle capital. Cependant, ce secteur souffre d'un déploiement inégal sur le territoire et d'une pénurie de professionnels.
• Le soutien à la parentalité : Le rapport privilégie un accompagnement des familles en difficulté plutôt qu'une approche purement punitive, s'interrogeant sur l'efficacité des sanctions financières contre des parents souvent déjà précaires.
• La protection de l’enfance : L'articulation entre l'Aide Sociale à l'Enfance (ASE) et la Protection Judiciaire de la Jeunesse (PJJ) est jugée indispensable mais défaillante, entravant une prise en charge globale des jeunes.
Le rapport détaille, étape par étape, comment les droits spécifiques des mineurs sont mis à mal tout au long de la procédure pénale.
1. Premier Contact : Contrôles d'Identité et Interpellations
• Contrôles d'identité : Le rapport dénonce l'existence de pratiques discriminatoires, s'appuyant sur ses propres enquêtes qui montrent que les jeunes hommes perçus comme noirs ou arabes ont 12 fois plus de risques de subir un contrôle "poussé".
Ces pratiques, reconnues par la justice française (Cour de cassation, Conseil d'État) et européenne (CEDH), nourrissent un sentiment d'injustice et de défiance.
• Interpellations : Les témoignages de jeunes font état d'un usage disproportionné de la force, d'humiliations et de propos racistes, transformant l'interpellation en une expérience traumatisante.
« Ils cherchent à provoquer les jeunes lors des contrôles, pour que cela dérape et qu’ils puissent les embarquer. » - Jeune consulté
Bien que le CJPM prévoie des garanties fortes (droit à un avocat sans dérogation, enregistrement audiovisuel, information des parents), leur application est défaillante.
• Auditions : Des mineurs sont interrogés sans notification de leurs droits ou dans des conditions inadaptées.
• Garde à vue : Décrite comme une expérience traumatisante, avec des conditions matérielles souvent médiocres, un manque d'information et un isolement anxiogène. La situation des mineurs en situation de handicap est particulièrement préoccupante.
La réforme du CJPM a permis de réduire les délais de jugement (de 23 à 9,4 mois en moyenne), mais a engendré de nouvelles difficultés.
• Mise à l'épreuve éducative : Cette période entre l'audience de culpabilité et celle de sanction n'est souvent pas effective faute de moyens, vidant la réforme de son sens.
• Recours à l'audience unique : Prévue comme une exception, cette procédure qui statue en une seule fois sur la culpabilité et la sanction tend à se généraliser, au détriment de l'évaluation éducative.
• Compréhension : Les jeunes se plaignent d'un langage judiciaire inaccessible et du sentiment de ne pas être écoutés par les magistrats.
L'incarcération des mineurs, possible dès 13 ans, doit rester exceptionnelle. Le rapport alerte sur ses conséquences dramatiques.
• "Choc carcéral" et suicides : L'enfermement est un traumatisme majeur. Cinq adolescents se sont suicidés en détention entre octobre 2023 et août 2024.
• Conditions de détention :
◦ Éducation : L'accès à la scolarité est très insuffisant (bien en deçà des 12 à 20 heures hebdomadaires prévues) et entravé par les contraintes sécuritaires.
◦ Santé : La continuité des soins, notamment psychiatriques, est rompue.
◦ Coordination : La collaboration entre l'Administration Pénitentiaire (AP) et la PJJ est difficile, avec des logiques parfois contradictoires (sécurité vs. éducatif).
◦ Dignité : Les jeunes dénoncent la qualité et la quantité de la nourriture, le coût élevé des communications avec la famille, et des pratiques de fouilles intégrales jugées humiliantes et abusives.
« Mettre ensemble plusieurs jeunes “perturbateurs”, ça ne fait que rassembler des idées de perturbations encore plus grandes. » - Jeune incarcéré
La réinsertion n'est pas une simple étape post-sanction, mais un processus qui doit être engagé dès le début du parcours pénal.
• Préparer la sortie : Les fins de placement ou de détention sont des moments à haut risque de récidive.
Le rapport souligne le besoin crucial d'anticiper ces transitions en coordonnant l'action de tous les acteurs (PJJ, ASE, éducation, etc.).
• Le droit à l'oubli : L'effacement des condamnations du casier judiciaire est essentiel pour permettre aux jeunes de se reconstruire sans être stigmatisés.
Ce droit reste largement méconnu des principaux intéressés.
Les jeunes eux-mêmes insistent sur l'importance de l'accompagnement, du soutien à leurs projets et de la possibilité de rencontrer des pairs au parcours de réinsertion réussi, qui incarnent une source d'espoir.
« Nous devons avoir la possibilité de nous racheter sans être stigmatisés à vie. » - Jeune consulté
Parmi les 25 recommandations du rapport, plusieurs se distinguent par leur portée structurelle.
• Principes fondamentaux :
◦ Recommandation 1 : Inscrire dans la loi le principe de non-responsabilité pénale des mineurs de moins de 13 ans, sans exception.
◦ Recommandation 4 : Créer un code de l’enfance pour unifier et clarifier l'ensemble des dispositions civiles et pénales.
• Prévention :
◦ Recommandation 5 : Renforcer les moyens alloués à la prévention du décrochage scolaire (plus de psychologues, d'assistants sociaux, etc.).
◦ Recommandation 9 : Remettre la prévention spécialisée au cœur des politiques publiques avec un financement sécurisé et renforcé.
• Parcours Pénal :
◦ Recommandation 12 : Assurer la traçabilité des contrôles d’identité pour lutter contre les discriminations.
◦ Recommandation 18 : Rendre la justice compréhensible pour les enfants en formant les professionnels à l'usage d'un langage simple et clair.
• Détention et Réinsertion :
◦ Recommandation 21 : Garantir l'effectivité de l'accès à l'éducation, à la santé et au maintien des liens familiaux en détention.
◦ Recommandation 24 : Anticiper systématiquement la fin d’un placement ou d’une incarcération pour favoriser la réinsertion.
◦ Recommandation 25 : Rendre systématique l'information des mineurs sur les procédures d’effacement du casier judiciaire pour rendre effectif le droit à l’oubli.
Proposition pour une Réforme des Temps de l'Enfant : Synthèse Stratégique du Rapport de la Convention Citoyenne
La réforme de l'organisation des temps de l'enfant est devenue un impératif national.
Le modèle actuel, fragmenté et inadapté aux besoins fondamentaux de développement, de santé et d'apprentissage de millions d'enfants, fragilise notre cohésion sociale et hypothèque notre avenir collectif.
L'épuisement des élèves, la croissance des inégalités et la pression constante exercée sur les familles ne sont plus des signaux faibles, mais les symptômes d'une crise systémique qui appelle une action politique courageuse et structurée.
Comme le soulignait la lettre de saisine du Premier ministre, le système actuel est une superposition de « temps familial, temps scolaire et temps périscolaire » qui ne sont pas « pensés de façon articulée et globale ».
Face à cette fragmentation, la Convention Citoyenne sur les temps de l'enfant a été mandatée pour produire une vision d'ensemble cohérente, capable de réaligner les politiques publiques sur l'intérêt supérieur de l'enfant.
Cette démarche démocratique est inédite.
En confiant cette réflexion à 133 citoyennes et citoyens tirés au sort, qui ont délibéré pendant 21 jours, les pouvoirs publics ont permis l'émergence d'une parole authentique, libre de tout clivage politique et de tout intérêt corporatiste.
La légitimité des recommandations qui en émanent est donc particulièrement forte, car elle est le fruit d'un travail collectif, informé et représentatif de la diversité de la société française.
La présente note de synthèse a pour objectif de présenter de manière stratégique les conclusions de ce travail exceptionnel.
Elle exposera d'abord le diagnostic alarmant posé par la Convention, puis la vision directrice qui a guidé ses travaux, avant de détailler les axes de réforme concrets et les conditions impératives à leur succès.
La compréhension fine du diagnostic est en effet le fondement de la nécessité d'agir.
Les propositions de la Convention ne sont pas des opinions isolées ; elles reposent sur une analyse rigoureuse et partagée des dysfonctionnements profonds du système actuel.
Ce diagnostic met en lumière une crise systémique où les problèmes ne sont pas seulement additionnels mais s'aggravent mutuellement, créant un cercle vicieux qui pénalise en premier lieu les plus vulnérables.
Cinq constats centraux forment le socle de cette analyse.
• Une organisation subie : Les temps de l'enfant sont dictés par les contraintes des adultes et des institutions (horaires de travail, transports, logistique) et non par les besoins physiologiques, psychologiques et cognitifs de l'enfant.
• Des rythmes contre-productifs : Le rythme scolaire est en profond décalage avec les rythmes biologiques des enfants, ce qui nuit à leur concentration, altère leurs apprentissages et génère un déficit de sommeil chronique pour 20 à 30 % d'entre eux.
• Une pression constante : La densité des programmes scolaires, la place omniprésente des évaluations et la compétition génèrent anxiété et stress, dans une société qui valorise excessivement la performance et la productivité.
• L'érosion du temps libre : Le temps libre, essentiel au développement, se raréfie et se trouve dominé par une surexposition aux écrans, qui atteint près de 4h48 par jour en moyenne chez les 11-14 ans, avec des conséquences majeures sur la santé et les apprentissages.
• Un sous-investissement chronique : Le manque de moyens financiers et humains fragilise l'ensemble de la chaîne éducative et sociale, mettant en tension les professionnels (enseignants, animateurs, AESH) et dégradant la qualité de l'accompagnement.
Ces constats sont aggravés par quatre enjeux transversaux qui démontrent que les problèmes de rythme ont des conséquences sociales profondes : la montée des violences et du harcèlement, le manque d'inclusion des enfants à besoins spécifiques, la dégradation de la santé physique et mentale, et surtout l'aggravation des inégalités.
Sur ce dernier point, le rapport rappelle une réalité accablante : l'école française reste l'une des plus inégalitaires de l'OCDE, où l'origine sociale détermine encore massivement la réussite scolaire, comme en témoigne le fait que 71 % des enfants issus de familles modestes ne sont pas inscrits dans un club ou une association.
Face à ce diagnostic sévère et multidimensionnel, la Convention a stratégiquement refusé la voie des ajustements marginaux pour élaborer une vision d'avenir cohérente et désirable.
La Convention a correctement compris que la correction de défaillances systémiques exige une vision alternative convaincante, et non des solutions de fortune.
Pour être efficace, une réforme ne peut être un simple ajustement technique ; elle doit être portée par un projet global et humaniste, qui repositionne l'enfant de simple sujet des politiques publiques à leur finalité centrale.
La vision de la Convention s'articule autour de trois piliers fondamentaux.
Un socle commun élargi pour apprendre autrement
Ce pilier est une réponse directe au diagnostic d'un système qui génère une « pression constante » en survalorisant un ensemble restreint de compétences académiques.
La Convention propose de valoriser à égalité les apprentissages théoriques, concentrés le matin lorsque l'attention est maximale, et les apprentissages pratiques, artistiques, culturels et sportifs, développés l'après-midi.
Cette approche, qui intègre des ateliers de vie quotidienne concrets (bricolage, cuisine, couture, gestion du budget), vise à reconnaître toutes les formes d'intelligence, à redonner du sens et du plaisir aux apprentissages et à permettre à chaque enfant de se réaliser.
Une gouvernance équilibrée Pour s'attaquer aux « inégalités croissantes » identifiées dans le diagnostic, la Convention préconise un modèle de gouvernance à deux niveaux.
Un pilotage national fort doit fixer un cap clair, garantir le cadre commun et assurer l'égalité des chances sur tout le territoire.
Parallèlement, une mise en œuvre locale autonome doit permettre à chaque territoire d'adapter les politiques à ses spécificités, de mobiliser ses ressources propres (associations, acteurs culturels, environnement naturel) et de construire un projet éducatif pertinent et partagé, qui ne soit pas un mandat uniforme.
Des temps de vie de qualité
En réponse à « l'érosion du temps libre » et à la pression exercée sur les familles, ce pilier vise à redonner aux enfants du « temps libre vraiment libre », essentiel à leur développement personnel et à leur créativité, notamment en allégeant la charge des devoirs. Simultanément, la Convention appelle à soutenir une parentalité accompagnée, qui permette aux parents de retrouver du temps et de la sérénité dans leur relation avec leurs enfants, libérée de la surcharge logistique et de l'anxiété liées au système actuel.
C'est sur la base de cette vision que la Convention a structuré ses 20 propositions d'action, conçues comme un ensemble cohérent et interdépendant pour une transformation systémique.
Cette section constitue le cœur opérationnel de la proposition.
Les 20 recommandations adoptées par la Convention ne sont pas une simple liste de mesures, mais s'articulent logiquement en trois axes d'intervention complémentaires.
Ensemble, ils visent une transformation systémique de l'organisation des temps de l'enfant et de l'écosystème qui l'entoure.
Cet axe regroupe les propositions (1 à 11) qui ciblent stratégiquement les causes profondes de la fatigue et du stress identifiées dans le diagnostic.
En réalignant les rythmes de vie sur les besoins biologiques et psychologiques des enfants, il vise à transformer l'école d'une source de pression en un environnement structuré pour un développement sain.
La journée scolaire repensée Cette refonte de la journée scolaire s'attaque directement au décalage chronobiologique et à la fatigue chronique mis en évidence dans le diagnostic. Les mesures clés incluent :
• Le début des cours à 9h au collège et au lycée (Prop. 2) pour s'adapter au rythme de sommeil des adolescents.
• La réduction des cours à 45 minutes effectives dans le secondaire (Prop. 4) pour maintenir une attention optimale.
• Une pause déjeuner d'au moins 1h30 (Prop. 6 & 7), garantissant un temps de repas serein et un vrai temps de liberté.
• La réalisation des devoirs essentiellement à l'école (Prop. 8) pour alléger la charge de travail à la maison et réduire les inégalités.
La semaine et l'année rééquilibrées Pour garantir régularité et repos, conformément aux recommandations des chronobiologistes, la Convention propose :
• Le passage à la semaine de 5 jours pour tous les niveaux, du lundi au vendredi (Prop. 9), pour lisser les apprentissages.
• L'adoption d'un rythme annuel stable de 7 semaines de cours suivies de 2 semaines de vacances (Prop. 11), ce qui implique une réorganisation des zones de vacances.
Cet axe se concentre sur les propositions (12 à 17) visant à construire un environnement éducatif cohérent et des espaces de vie adaptés aux nouvelles ambitions pédagogiques, répondant ainsi au diagnostic d'un système fragmenté et d'infrastructures inadaptées.
Une gouvernance unifiée et déconcentrée La Convention propose une refonte de la gouvernance à double niveau : un Ministère de l'Enfance puissant au niveau national (Prop. 12) pour corriger les inégalités systémiques identifiées dans le diagnostic, et des Projets Éducatifs de Territoire (PEdT) "nouvelle génération" obligatoires (Prop. 13) pour garantir une mise en œuvre adaptée au contexte local et non un mandat uniforme.
Des espaces de vie adaptés La vision inclut la transformation des établissements en "campus des jeunes" via un plan bâtimentaire sur 20-30 ans (Prop. 14), avec des espaces flexibles, modulaires et ouverts sur l'extérieur (Prop. 15 & 16).
Cette ambition vise à créer des environnements de bien-être adaptés aux nouvelles pédagogies et au changement climatique.
Une mobilité facilitée et sécurisée Le "plan de mobilité jeunes" (Prop. 17) s'attaque directement à l'une des "contraintes des adultes" identifiées dans le diagnostic.
Il vise à limiter les temps de trajet à 45 minutes maximum et à promouvoir activement les mobilités douces, réduisant ainsi une source majeure de fatigue et de stress.
Cet axe répond aux défis modernes de l'éducation et de la vie familiale (Propositions 18 à 20), en s'attaquant directement aux nouvelles sources de pression et à l'érosion du temps libre diagnostiquées.
Encadrer l'usage des écrans Face à l'omniprésence du numérique, une double approche est proposée.
Elle consiste d'une part à informer, sensibiliser et accompagner les enfants et les parents (Prop. 18), et d'autre part à appliquer et renforcer la législation en vigueur (Prop. 19), notamment l'interdiction effective des réseaux sociaux avant 15 ans et le paramétrage par défaut des téléphones pour protéger les enfants.
Soutenir la parentalité Pour mieux concilier vie familiale et professionnelle et alléger la pression sur les familles, il est proposé de renforcer le cadre légal des aides à la parentalité (Prop. 20), reconnaissant le rôle essentiel des parents et leur besoin de soutien pour se libérer de la surcharge logistique et de l'anxiété.
Cependant, la Convention identifie lucidement que ces réformes ambitieuses sont conditionnées par un ensemble de prérequis structurels non négociables, qui doivent être abordés avec la même détermination.
La Convention a lucidement identifié que les réformes proposées, aussi pertinentes soient-elles, ne pourront porter leurs fruits sans la mise en place de leviers structurels indispensables.
Ces prérequis transforment la vision en un plan d'action réaliste pour les pouvoirs publics, en conditionnant le succès à des engagements clairs.
• Investissement et Stabilité : Il est impératif de rompre avec le sous-investissement chronique.
Cela exige un investissement financier pérenne et conséquent, sanctuarisé par une loi de programmation pluriannuelle.
De plus, il est crucial de « penser le temps long » pour garantir la stabilité des politiques éducatives et échapper aux cycles politiques courts qui paralysent les réformes de fond.
• Valorisation du Capital Humain : Aucune réforme ne réussira sans les professionnels qui la mettent en œuvre.
Il est donc impératif de réduire significativement les effectifs des classes et d'engager une revalorisation globale de l'ensemble des métiers de l'éducation (enseignants, animateurs, AESH, etc.), incluant les salaires, la formation continue et la reconnaissance de leur statut.
• Modernisation Pédagogique : Le changement de rythme doit s'accompagner d'une évolution des contenus.
Il est nécessaire de repenser les programmes scolaires pour les alléger et les aligner sur la nouvelle structure de la journée.
De plus, il faut garantir que les enfants, les jeunes et les professionnels soient systématiquement inclus dans les processus de décision qui les concernent.
• Adaptation des Infrastructures : Les conditions matérielles sont un prérequis au bien-être.
La réussite de la réforme dépend directement de l'adaptation du bâti scolaire (rénovation, végétalisation, modularité) et de la réduction effective des temps de trajet, qui ne sont pas des objectifs secondaires mais des conditions fondamentales à l'épanouissement des enfants.
La mise en œuvre de ces propositions, conditionnée par ces prérequis, constitue un projet de société ambitieux qui appelle une volonté politique sans faille.
La proposition de la Convention Citoyenne sur les temps de l'enfant suit une logique implacable : un diagnostic sévère sur l'état de notre système éducatif et social appelle une vision ambitieuse pour l'avenir de nos enfants.
Cette vision est traduite en un ensemble de réformes concrètes et interdépendantes, dont les conditions de succès sont clairement identifiées.
Nous disposons désormais d'une feuille de route cohérente, légitime et porteuse d'espoir.
Comme l'affirment avec force les citoyennes et citoyens dans leur manifeste, l'heure n'est plus aux constats mais à l'action :
Notre rapport ne doit pas être un rapport de plus, nous serons vigilants sur les suites données à notre travail. Nous attendons maintenant de nos décideurs politiques qu’ils prennent leurs responsabilités.
La mise en œuvre de ces réformes ne doit pas être perçue comme une dépense, mais comme l'investissement le plus stratégique pour l'avenir de la Nation.
Il s'agit de former des citoyens épanouis, en meilleure santé physique et mentale, capables de s'adapter aux défis de demain.
Il s'agit de réduire les fractures sociales et territoriales à la racine, en offrant à chaque enfant, où qu'il vive, les mêmes chances de se réaliser pleinement.
Il appartient désormais aux décideurs politiques de se montrer à la hauteur de cette ambition et de cet impératif démocratique.
Note: This response was posted by the corresponding author to Review Commons. The content has not been altered except for formatting.
Learn more at Review Commons
Manuscript number: RC-2025-03174
Corresponding author(s): Cristina, Tocchini and Susan, Mango
We thank the reviewers for their thoughtful and constructive comments. We were pleased that the reviewers found our study “rigorous”, “well presented”, “technically strong”, and “novel”. We are also grateful for their recognition that our work identifies a function for a HOT region in gene regulation and provides new insights into the role of the uHOT in controlling dlg-1 expression.
Point-by-point description of the revisions
We have addressed the reviewers’ concerns by clarifying and refining the text, particularly regarding the intron 1 results, improving the quantitation and statistical analyses, and making adjustments and additions to text and figures.
Specific responses to each point are provided below in blue.
Reviewer #1
In my view, their conclusions regarding the intronic HOT region are speculative and unconvincing. See below for main criticisms.*
We agree, and have made changes throughout the manuscript to make this point clearer. Specifically, we contextualize the role of intron 1 as a putative enhancer in reporter assays, but not in endogenous, physiological conditions. Some examples are:
Abstract: “(…) In contrast, the intronic region displays weak enhancer-like activity when tested in transcriptional reporter assays but is dispensable in transcriptional control when studied at the endogenous locus. Our findings reveal how HOT regions contribute to gene regulation during animal development and illustrate how regulatory potential identified in isolated contexts can be selectively deployed or buffered within the native genomic architecture.”
Background: “(…) The HOT region in the first intron possesses weak transcriptional capabilities that are restricted to epidermal cells as observed in transcriptional reporters, but seem to not be employed in physiological contexts.” As it will become clear reading this updated version of the manuscript, we cannot exclude at present a functional role during non-physiological conditions (e.g., stress)
Results and discussion: “(…) This is in contrast with what the reporter experiments showed, where intron 1 alone was permissive for transcription and slightly enhanced the FL transgene expression levels (Figure 1F,G and S4). (…)”
Other changes can be found highlighted in yellow in the manuscript.
We thank the reviewer for raising this concern. To avoid overstating our conclusions, we now frame the potential interaction between the two studied HOT regions strictly in the context of previously published ARC-C data (Huang et al., 2022). We clarify in the revised text that these interactions have been observed in earlier work during larval stages (Huang et al., 2022), but remain to be validated during embryogenesis, and we present them solely as contextual information rather than as a central conclusion.
In Results and discussion section we wrote: “(…) Although the presence of a fountain at this locus remains to be confirmed during embryogenesis, Accessible Region Conformation Capture (ARC-C), a method that maps chromatin contacts anchored at accessible regulatory elements, showed that the putative HOT region interacts with other DNA sequences, including the first intron of dlg-1 (1). (…)”
* The authors claim that not all the phenotypic effects seen from deleting the uHOT region are specific to the dlg-1 gene. This is an interesting model, but the authors show essentially no data to support this or any explanation of what other gene might be regulated.*
We appreciate the reviewer’s comment and have revised the manuscript to ensure that the possibility of additional regulatory effects from the uHOT region is presented as a hypothesis rather than a claim. Our study was designed to investigate HOT-region–based transcriptional regulation rather than chromatin interactions, and we now make this scope more explicit in the text. The revised discussion highlights that, although ARC-C data suggest the uHOT region may contact other loci, the idea that these interactions contribute to the observed phenotypes remains speculative and will require dedicated future work.
In Results and discussion section we wrote: “(…) Because, as previously shown, the upstream HOT region exhibits chromatin interactions with other genomic loci (1), its depletion might affect gene expression of beyond dlg-1 alone. An intriguing hypothesis is that these phenotypes do not arise only from the reduction in dlg-1 mRNA and DLG-1 protein levels, but also from synergistic, partial loss-of-function phenotypes involving other genes (24). (…)”
* Finally, some of the hypotheses in the text could be more accurately framed by the authors. They claim HOT regions are often considered non-functional (lines 189-191). Also, they claim that correct expression levels and patterning is usually regulation by elements within a few hundred basepairs of the CDS (lines 78-80). These claims are not generally accepted in the field, despite a relatively compact genome. Notably, both claims were tested and disproven by Chen et al (2014), Genome Research, where the authors specifically showed strong transcriptional activity from 10 out of 10 HOT regions located up to 4.7 kb upstream of their nearest gene. Chen et al. 2014 is cited by Tocchini et al. and it is, therefore, surprisingly inconsistent with the claims in this manuscript.*
We thank the reviewer for this comment and have revised the text to clarify our intended meaning and avoid framing discussion points as absolute claims. We changed “often” to “frequently” in both sentences so that they better reflect general trends rather than universal rules.
The revised text now reads: “Controversially, C. elegans sequences that dictate correct expression levels and patterning are frequently located within a few hundred base-pairs (bp) (maximum around 1,000–1,500 bp) from a gene’s CDS (3,13–15),”;
And: “HOT regions in C. elegans, as well as other systems, have been predominantly associated with promoters and were frequently considered non-functional or simply reflective of accessible chromatin (25).”
Regarding the comparison to Chen et al., 2014, we note that their reporters did not include a reference baseline for “strong” transcriptional activity, and only five of the ten tested HOT regions were located more than 1.5 kb from the nearest TSS. Therefore, our phrasing is consistent with their findings while describing general trends observed in the C. elegans genome rather than absolute rules. We have also ensured that these sentences are presented as discussion points rather than definitive claims. We hope these revisions make the framing and context clearer to the reader. The fluorescence expression from the intronic HOT region is not visible by eye and the quantification shows very little expression, suggestive of background fluorescence. Although the authors show statistical significance in Figure 1G, I would argue this is possibly based on inappropriate comparisons and/or a wrong choice statistical test. The fluorescence levels should be compared to a non-transgenic animal and/or to a transgenic animal with the tested region shuffled but in an equivalent
We understand the reviewer’s concern regarding the low fluorescence levels observed for the intronic HOT reporter. To address this, we have now included a Figure S4 with higher-exposure versions of the embryos shown in Figure 1. These panels confirm that the nuclear signal is genuine: embryos without a functional transcriptional transgene do not display any comparable fluorescence, aside from the characteristic cytoplasmic granules associated with embryonic autofluorescence. Similar reference images have also been added to Figure S3 to clarify the appearance of autofluorescence under the same imaging conditions.
Regarding the quantitation analyses, as suggested by the reviewers, we now consistently quantify fluorescence by calculating the mean intensity for each embryo (biological replicates) and performing statistical analyses on these values. This approach ensures that the statistical tests are applied to independent biological measurements.
* I would suggest the authors remove their claims about the intronic enhancer and the interaction between the two regions. And I would suggest softening the claims about the uHOT regulation of another putatitive gene.*
We have revised the manuscript to avoid definitive claims regarding the presence of an interaction between the two studied HOT regions. These points are now presented strictly as hypotheses within the discussion, suggested by previously published ARC-C data rather than by our own experimental evidence. Likewise, we have softened our statements regarding the possibility that the uHOT region may regulate additional gene(s). This idea is now framed as a speculative model that will require dedicated future studies, rather than as a conclusion of the present work. Quotes can be found in the previous points (#3 and #4) raised by Reviewer 1.
* The authors would need to demonstrate several things to support their current claims. The major experiments necessary are:*
In general, the minimal Δpes-10 promoter is specifically designed to have negligible basal transcriptional activity on its own, and this property has been extensively validated in previous studies (reference included in the revised manuscript).
* It is not very clear why the authors did not test intron 1 within the H2B of the transgene and just the minimal promoter in front of the transgene, but only in the context of the full-length promoter. The authors show a minor difference in expression levels for the full-length (FL) and full-length with intron 1 (FL-INT1) but show a large statistical differnce. The authors use an inappropriate statistical test (T-test) for this experiment and treat many datapoints from the same embryo as independent, which is clearly not the case. Even minor differences in staging, transgene silencing in early development, or variability would potentially bias their data collection.*
We thank the reviewer for this comment. Our goal was to assess the potential contribution of intron 1 in two complementary contexts: (i) on its own, upstream of a minimal promoter, to test whether it can in principle support transcription, and (ii) within the full-length promoter construct, which more closely reflects the endogenous configuration. For this reason, we did not generate an additional construct placing intron 1 within the H2B reporter driven only by the minimal promoter, as we considered this redundant with the information provided by the existing INT1 and FL-INT1 reporters.
Regarding the statistical analysis, we agree that treating multiple measurements from the same embryo as independent is not appropriate. In the revised manuscript, we now use the mean fluorescence intensity per embryo as a single biological replicate and perform all statistical tests on these independent values. This approach avoids pseudo-replication and ensures that the analysis is robust to variability in staging or transgene behavior. The conclusions remain the same.
* The authors claim, based on ARC-C data previously published by their lab (Huang et al. 2022) that the dlg-1 HOT region interacts with "other" genomic regions. This is potentially interesting but the evidence for this should be included in the manuscript itself, perhaps by re-analyzing data from the 2022 manuscript?*
We thank the reviewer for this suggestion. The chromatin-interaction data referred to in the manuscript originate from the work of Huang et al., 2022, published by the Ahringer lab. As these ARC-C datasets are already publicly available and thoroughly analyzed in the original publication, we felt that reproducing them in our manuscript was not necessary for supporting the limited contextual point we make. Our intent is simply to note that previous work reported contacts between the uHOT region and additional loci. To address the reviewer’s concern, we have revised the manuscript to make clear that we are referencing previously published ARC-C observations and that we do not present these interactions as new findings from our study.
For example, in Results and discussion section we wrote: “(…) Because, as previously shown, the upstream HOT region exhibits chromatin interactions with other genomic loci (1), its depletion might affect gene expression beyond dlg-1 alone. An intriguing hypothesis is that these phenotypes do not arise only from the reduction in dlg-1 mRNA and DLG-1 protein levels, but also from a synergistic, partial loss-of-function phenotypes involving other genes (24). (…)”
* The fluorescence quantification is difficult to interpret from the attached data file (Table S1). For the invidividual values, it is unclear how many indpendent experiments (different embryos) were conducted. The authors should clarify if every data value is from an independent embryo or if they used several values from the same embryo. If they did use several values from the same embryo, how did they do this? Did they take very cell? Or did they focus on specific cells? How did they ensure embryo staging?*
We thank the reviewer for pointing this out. To clarify the quantification procedure, we have expanded the description in the Methods section (“Live imaging: microscopy, quantitation, and analysis”). The revised text now specifies that each data point represents the normalized fluorescence value obtained from three nuclei (or five junctions, depending on the construct), all taken from the same anatomical positions across embryos. Two independent biological replicates were performed for each experiment, with each embryo contributing a single averaged value.
As noted in the figure legends, the specific nuclei used for quantification are indicated in each panel (with dashed outlines), and a reference nucleus marked with an asterisk allows unambiguous identification of the same positions across all conditions. We are happy to further refine this description if additional clarification is needed.
* The authors also do not describe how they validated single-copy insertions (partial transgene deletions in integrants are not infrequent and they only appear to use a single insertion for each strain). This should be described and or added as a caveat if no validation was performed.*
The authors also do not describe any validation for the CRISPR alleles, either deletions or insertion of the synthetic intron into dlg-1. How were accurate gene edits verified.
We thank the reviewer for highlighting the importance of validating the genetic constructs. We have now clarified this more explicitly in the revised Methods section and in Table S1. All single-copy transgene insertions and all CRISPR-generated alleles were verified by genotyping and Sanger sequencing to confirm correct integration and the absence of unintended rearrangements.
I am not convinced the statistical analysis of the fluorescence data is correct. Unless the authors show that every datapoint in the fluorescence quantification is independent, then I would argue they vastly overestimate the statistical significance. Even small differences are shown to have "***" levels of significance, which does not appear empirically plausible.
We thank the reviewer for highlighting this point. To ensure that each data point represents an independent measurement, we now calculate the mean fluorescence per embryo (from three nuclei or five junctions) and use these per-embryo means as biological replicates for statistical testing. Two independent experiments were performed for each condition. Statistical differences were evaluated using a one-tailed t-test on the per-embryo means, as indicated in the revised Methods section.
After this adjustment, the differences remain statistically significant, although less extreme than in the initial analysis (now p * *
This study is so closely related to the Chen et al study, that I believe this study should be discussed in more detail to put the data into context.
We thank the reviewer for this suggestion. While we refer to Chen et al., 2014 as a relevant prior study for context, we believe that our work addresses distinct questions and experimental approaches. Specifically, our study focuses on HOT region-based transcriptional regulation in the dlg-1 locus and its functional dissection in vivo, which is conceptually and methodologically different from the scope of Chen et al., 2014 where the author tested the functionality of HOT region-containing promoters in the context of single-copy integrated transcriptional reporters. We hope this is clearer to the reader in the revised manuscript.
* Add H2B to the mNG in Figure 1 in order to understand where the first intron was inserted.*
We thank the reviewer for this suggestion. A schematic representation of the transgene is already provided above the corresponding images to indicate the location of the first intron.
For additional clarity, we have now added the following sentence in the main text: “In the other, intron 1 was inserted in the FL transgene within the H2B coding sequence (at position 25 from the ATG), preserving the canonical splice junctions with AG at the end of the first exon and a G at the beginning of the second exon, so that it acted as a bona fide intron (FL-INT1) (Figure 1F).”
This should help readers understand the placement of the intron without requiring modifications to the figure itself.__ __
Reviewer #2
1) The authors suggest that the region upstream of the dlg-1 gene is a HOT region. Although they highlight that other broad studies pick up this region as a HOT region, it would be good that the authors dive into the HOT identity of the region and characterize it, as it is a major part of their study. In addition to multiple TFs binding to the site, there are different criteria by which a region would be considered a HOT region. E.g. is there increased signal on this region in the IgG ChIP-seq tracks? Is the area CpG dense?
We thank the reviewer for this suggestion. In the manuscript and Figure S1, we show several features of HOT regions, including transcription factor binding and chromatin marks. To further characterize the dlg-1 uHOT region, we have added the following sentence to the text: “The conserved region is positioned approximately four Kb from the CDS of dlg-1 in a CpG-dense sequence (2), and is overlapping and bordered by chromatin marks typically found in enhancers (5,16).”
This addition provides additional evidence supporting the identity of the region as a HOT region, complementing the features already presented.
* 2) When describing the HOT region, they refer to Pol II binding as 'confirming its role as a promoter': non-promoter regions can also have Pol II binding, especially enhancers. Having binding of Pol II does not confirm its role as promoter. On the contrary, seeing the K27ac and K4me1 would point towards it being an enhancer.*
The sentence has been revised to clarify the interpretation of Pol II binding: “This HOT site also contains RNA Pol II peaks during embryogenesis (Figure S1C), supporting its role as a promoter or enhancer (9).” This wording avoids overinterpreting Pol II binding alone, while acknowledging that the HOT region may have both promoter and enhancer characteristics.
We would like to note that the relevant chromatin marks (H3K27ac and H3K4me1), which are indicative of enhancer activity, are described in the text: “(…) Specifically, it is enriched in acetylated lysine 27 (H3K27ac) and mono- and di-methylated lysine 4 of histone H3 (H3K4me1/2), and depleted from tri-methylated lysine 4 of histone H3 (H3K4me3) (Figure S1D) (5,16). (…)”
These changes clarify that the HOT region may have enhancer characteristics and avoid overinterpreting the Pol II signal.
* 3) In S1B, the authors show TF binding tracks. They also have a diagram of the region subsets (HOT1-4) that were later tested. What is their criteria for dividing the HOT region into those fragments? From looking at Fig S1, the 'proper' HOT region (ie. Where protein binding occurs) seems to be divided into two (one chunk as part of HOT3 and one chunk as part of HOT4). Can the authors comment on the effects of this division?*
To clarify the criteria for dividing the HOT region into subregions, we have added the following sentence to the main text: “The subregions were chosen taking into account (i) enrichment of putative TF binding sites (uHOT1 for PHA-4, uHOT2 for YAP-1 and NHR-25, uHOT3 for ELT-3, and uHOT4 for PHA-4 and others (e.g., ELT-1 and ELT-3)), (ii) Pol II binding peaks, and (iii) histone modification peaks (Fig. S1C,D).”
This description explains the rationale behind the division and clarifies why the HOT region was split into these four fragments for functional testing.
* 4) For the reporter experiments, the first experiments carry the histone H2B sequence and the second set of experiments (where the HOT region is dissected) carry a minimal promoter Δ*pes-10 (MINp). The results could be affected by the addition of these sequences. Is there a reason for this difference? Can the authors please justify it?
The difference in reporter design reflects the distinct goals of the two sets of experiments. The H2B sequence, coupled to mNG, is used as a coding sequence throughout the first part of the study (reporter analysis). This is commonly used to (i) concentrate the fluorescence signal (mNG) into nuclei (H2B) and (ii) be able to identify specific cells more accurately for quantitation reasons (intensity and consistency). The Δpes-10 promoter is instead used to analyze whether specific sequences possess enhancer potential: this promoter alone possesses the sequences that can allow transcription only in the presence of transcription factors that bind to the studied sequence placed upstream it.
To clarify this distinction in the manuscript, we have added the following sentence: “(…) Each region was paired with the minimal promoter Δpes-10 (MINp) (Figure 1D) and generated four transcriptional reporters. Δpes-10 is commonly used to generate transcriptional reporter aimed at assessing candidate regulatory enhancer sequences (20). The minimal promoter drives expression only when transcription factors bind to the tested upstream sequence and test enhancer activity. (…)”
5) Regarding the H2B sequence: ' 137: first intron [...] inserted in the FL transgene within the H2B sequence, acting as an actual intron (FL-INT1)': how was the location of the insertion chosen? Does it disrupt H2B? can it be that the H2B sequence contributed to dampening down the expression of mNG and disrupting it makes it stronger? It would be important to run the first experiments with minimal promoters and not with the H2B sequence.
The location of the intron insertion within the H2B coding sequence was chosen to preserve proper splicing and avoid disrupting H2B protein. We added the following sentence to clarify this point: “(…) In the other, the intron was inserted in the FL transgene within the H2B coding sequence (at position 25 from the ATG), preserving the canonical splice junctions with AG at the end of the first exon and a G at the beginning of the second exon, so that it acted as a bona fide intron (FL-INT1) (Figure 1F). (…)”
* 6) Have the authors explored the features of the sequences underlying the different HOT subregions? (e.g. running a motif enrichment analysis)? Is there anything special about HOT3 that could make it a functional region? It would be good to compare uHOT3 vs the others that do not drive the correct pattern. Since it's a HOT region, it may not have a special feature, but it is important to look into it.*
We thank the reviewer for this suggestion. To clarify the rationale for dividing the HOT region into four subregions, we have added the following sentence to the main text: “(…) The subregions were chosen taking into account (i) enrichment of putative TF binding sites (uHOT1 for PHA-4, uHOT2 for YAP-1 and NHR-25, uHOT3 for ELT-3, and uHOT4 for PHA-4 and others (e.g., ELT-1 and ELT-3)), (ii) Pol II binding peaks, and (iii) histone modification peaks (Fig. S1C,D). (…)”
While uHOT3 does not appear to possess unique sequence features beyond these general HOT-region characteristics, this approach allowed us to systematically test which fragments contribute to transcriptional activity and patterning.
7) For comparisons, the authors run t-tests. Is the data parametric? Otherwise, it would be more suitable to use a non-parametric test.
To ensure that each data point represents an independent biological replicate, we now calculate the mean fluorescence intensity per embryo and perform statistical tests on these per-embryo means. The data meet the assumptions of parametric tests, and we use a one-tailed t-test as indicated in the Methods.
* 1) The authors work with C. elegans embryos at comma stage, according to the methods section. It would be good if the authors mentioned it in the main text so that the reader is informed.*
Thanks for this suggestion. We added this sentence in the main text: “(…) Live imaging and quantitation analyses on embryos at the comma stage (used throughout the study for consistency purposes) showed (…)”.
* 2) 'Notably, the upstream HOT region is located more than four kilo-bases (Kb) away the CDS, and the one in the first intron contains enhancer sites, too.': what do they mean by 'enhance sites, too'. Is the region known as a functional enhancer? If so, could you please provide the reference?*
Here the clarification from the revised text: “(…) Notably, the upstream HOT region is located more than four kilo-bases (Kb) away the CDS, and the one in the first intron does not only contain two TSS but also three enhancer sites (8). (…)”
* 3) 'We hypothesized the upstream HOT region is the main driver of dlg-1 transcriptional regulation.': this sentence needs more reasoning. What led to this hypothesis? Is it the fact of seeing multiple TFs binding there? The chromatin marks?*
The reasoning behind the hypothesis is described in the preceding paragraph, and to make this connection clearer, we have revised the sentence to begin with: “Considering all of this information, we hypothesized the upstream HOT region is the main driver of dlg-1 transcriptional regulation. (…)”.
This change explicitly links the hypothesis to the observed TF binding and chromatin marks described above.
* 4) The labels of S1B are too wide, as if they have stretched the image. Could the authors please correct this?*
Yes, we agree with Reviewer 2. We corrected this.
* 5) This sentence does not flow with the rest of the text '84 - cohesins have been shown to organize the DNA in a way that active enhancers make contacts in the 3D space forming "fountains" detectable in Hi-C data (17,18).': is there a reason to explain this? I would remove it if not, as it can confuse the reader.*
We thank the reviewer for this comment. We agree that the sentence could potentially interrupt the flow; however, it is important for introducing the concept of “fountains” in 3D genome organization, which is necessary to understand the subsequent statement: “(…) Although the presence of a fountain at this locus remains to be confirmed during embryogenesis, Accessible Region Conformation Capture (ARC-C), a method that maps chromatin contacts anchored at accessible regulatory elements, showed that the putative HOT region interacts with other DNA sequences, including the first intron of dlg-1 (1). (…)”.
Therefore, we have retained this sentence to provide the necessary background for readers.
* 6) The authors mentioned that 'ARC-C data showed the putative HOT region interacts with other DNA sequences, including the first intron of dlg': have the authors analysed the data from the previous paper? A figure with the relevant data could illustrate this interaction so that the reader knows which specific region has been shown to interact with which. This would also bring clarity as to why they chose intron1 for additional experiments.*
We thank the reviewer for this suggestion. We have examined the relevant ARC-C data from the previous publication (Huang et al., 2022). However, as these results are already published, we do not feel it is necessary to reproduce them in our manuscript. The mentioning of these interactions is intended only to introduce the concept for discussion and to provide context for why intron 1 was considered in subsequent experiments
* 7) 'two deletion sequences spanning from the beginning (uHOT) or the end (Short) of the HOT region until the dlg-1 CDS': From the diagrams of the figure, I understand that uHOT has the distal region deleted, and the short HOT has the distal and the upstream regions deleted. Is this correct? Could you clarify this in the text? E.g. 'we designed two reporters - one containing the sequence starting at the HOT region and ending at the dlg-1 CDS, and the other without the HOT region, but rather starting downstream of it until the dlg-1 CDS'.*
To clarify the design of the reporters, we have revised the text as follows: “(…) To test this idea, we generated three single-copy, integrated transcriptional reporters carrying a histone H2B sequence fused to an mNeon-Green (mNG) fluorescent protein sequence under the transcriptional control of the following dlg-1 upstream regions: (i) a full-length sequence (“FL” = Distal + uHOT + Proximal sequences), (ii) one spanning from the beginning of the HOT region to the dlg-1 CDS (“uHOT” = uHOT + Proximal sequences), and (iii) one starting at the end of the HOT region and ending at the dlg-1 CDS (“Short” = Proximal sequence) (Figure 1A-C). (…)”
This description clarifies which parts of the upstream region are included in each reporter and matches the schematics in Figure 1.
* 8) 'Specifically, it spanned from bp 5,475,070 to 5,475,709 on chromosome X and removed HOT2 and HOT2 sequences' - this is unclear to me. What sequences are removed? HOT2 and 3?*
Thanks for spotting this typo. It has now been corrected.
* 9) 'ARC-C' is not introduced. Please spell out what this is. Accessible Region Conformation Capture (ARC-C). It would be helpful to include a sentence of what it is, as it will not be known by many readers.*
You are right, we changed into: “(…) Although the presence of a fountain at this locus remains to be confirmed during embryogenesis, Accessible Region Conformation Capture (ARC-C), a method that maps chromatin contacts anchored at accessible regulatory elements, showed that the putative HOT region interacts with other DNA sequences, including the first intron of dlg-1 (1). (...)”
* 10) Fig 1 B, diagram on the right: the H2B sequence is missing. I see that is indicated in the legend as part of mNG but this can be misleading. Could the authors add it to the diagram for clarification?*
Yes, you are right. We added this in the figure.__ __
Reviewer #3
The authors' claims are generally supported by the data, thoug the last sentence of the abstract was a bit overstated. They state that they "reveal the function of HOT regions in animals development...."; it would be more accurate to state that they linked the role of an upstream HOT region to dlg-1 regulation, and their findings hint that this element could have additional regulatory functions. The authors can either temper their conclusions or try RNA-seq experiments to find additional genes that are misregulated by the delta-uHOT deletion allele. [OPTIONAL]. Another [OPTIONAL] experiment that would strengthen the claims is to perform RNAi knockdown or DLG-1 protein depletion and link that to phenotype to show that the dlg-1 mRNA and DLG-1 protein changes seen in the uHOT mutant do not explain the lethality observed.
We thank the reviewer for this comment. We have studied HOT region function in the context of a model organism, C. elegans; therefore, we believe that describing our findings as revealing a function of HOT regions in animal development is accurate. The sentence aims at noting that these observations may provide broader insights into HOT region regulation. We changed the last sentence of the abstract into: “(…) Our findings reveal how HOT regions contribute to gene regulation during animal development and illustrate how regulatory potential identified in isolated contexts can be selectively deployed or buffered within the native genomic architecture. (…)”.
We note that RNA-seq is beyond the scope of this study; our discussion of potential effects on other genes is intended only as a hypothesis for future work. RNAi of dlg-1 has been previously reported and is cited in the manuscript, providing context for the phenotypes observed and discussed.
* When printed out I cannot read what the tracks are in Fig S1. Adding larger text to indicate what those tracks are is necessary.* Yes, you are right. We changed this in the figure.
*
Line 79. I would change the word "usually" to "frequently" in the discussion about regulatory element position. While promoters ranging from a few hundred to 2000 basepairs are frequently used, there are numerous examples where important enhancers can be further away.*
Corrected.
* Line 93-95. The description of the reporters was very confusing. When referring to the deletion sequences it sounds like that is what is missing rather than what is included. Rather, if I understand correctly the uHOT is the sequence from the start of the uHOT to the CDS and Short starts at the end of uHOT (omitting it). Adding the promoter fragments to the figure would improve clarity.*
To clarify the design of the reporters, we have revised the text as follows: “(…) To test this idea, we generated three single-copy, integrated transcriptional reporters carrying a histone H2B sequence fused to an mNeon-Green (mNG) fluorescent protein sequence under the transcriptional control of the following dlg-1 upstream regions: (i) a full-length sequence (“FL” = Distal + uHOT + Proximal sequences), (ii) one spanning from the beginning of the HOT region to the dlg-1 CDS (“uHOT” = uHOT + Proximal sequences), and (iii) one starting at the end of the HOT region and ending at the dlg-1 CDS (“Short” = Proximal sequence) (Figure 1A-C). (…)”
This description clarifies which parts of the upstream region are included in each reporter and matches the schematics in Figure 1.
* Line 108. Re-work the phrase "increase majorly". Majorly increase would be better.*
We thank the reviewer for this suggestion. The verb is used here as an infinitive (“to increase majorly”), and in standard English the infinitive is usually not split. Therefore, we have kept the phrasing as it currently appears in the manuscript.
* Line 153-154. The deletion indicates that HOT2 and HOT2 were removed. Was one supposed to be HOT3?*
Thanks for spotting this typo. It has now been corrected.
* In the figure legends the number of animals scored and the number of biological repeats is missing.*
Added.
* Figure 1 title in the legend. Should read "main driver" not "man driver".*
Thanks for spotting this typo. It has now been corrected.
* The references need to be gone through carefully and cleaned up. There are numerous gene and species names that are not italicized. There are also extra elements added by the reference manager such as [Internet].*
Thanks for pointing it out. We used Zotero and the requested formatting from the journal of our choice. We will discuss with their team how to go through this issue.
Note: This response was posted by the corresponding author to Review Commons. The content has not been altered except for formatting.
Learn more at Review Commons
__Reviewer #1 (Evidence, reproducibility and clarity (Required)): __
This study explores chromatin organization around trans-splicing acceptor sites (TASs) in the trypanosomatid parasites Trypanosoma cruzi, T. brucei and Leishmania major. By systematically re-analyzing MNase-seq and MNase-ChIP-seq datasets, the authors conclude that TASs are protected by an MNase-sensitive complex that is, at least in part, histone-based, and that single-copy and multi-copy genes display differential chromatin accessibility. Altogether, the data suggest a common chromatin landscape at TASs and imply that chromatin may modulate transcript maturation, adding a new regulatory layer to an unusual gene-expression system.
I value integrative studies of this kind and appreciate the careful, consistent data analysis the authors implemented to extract novel insights. That said, several aspects require clarification or revision before the conclusions can be robustly supported. My main concerns are listed below, organized by topic/result section.
TAS prediction * Why were TAS predictions derived only from insect-stage RNA-seq data? Restricting TAS calls to one life stage risks biasing predictions toward transcripts that are highly expressed in that stage and may reduce annotation accuracy for lowly expressed or stage-specific genes. Please justify this choice and, if possible, evaluate TAS robustness using additional transcriptomes or explicitly state the limitation.
TAS predictions derived only from insect-stage RNA-seq data because in a previous study it was shown that there are no significant differences between stages in the 5'UTR procesing in T. cruzi life stages (https://doi.org/10.3389/fgene.2020.00166) We are not testing an additional transcriptome here, because the robustness of the software was already probed in the original article were UTRme was described (Radio S, 2018 doi:10.3389/fgene.2018.00671).
Results - "There is a distinctive average nucleosome arrangement at the TASs in TriTryps": * You state that "In the case of L. major the samples are less digested." However, Supplementary Fig. S1 suggests that replicate 1 of L. major is less digested than the T. brucei samples, while replicate 2 of L. major looks similarly digested. Please clarify which replicates you reference and correct the statement if needed.
The reviewer has a good point. We made our statement based on the value of the maximum peak of the sequenced DNA molecules, which in general is a good indicative of the extension of the digestion achieved by the sample (Cole H, NAR, 2011).
As the reviewer correctly points, we should have also considered the length of the DNA molecules in each percentile. However, in this case both, T. brucei's and L major's samples were gel purified before sequencing and it is hard to know exactly what fragments were left behind in each case. Therefore, it is better not to over conclude on that regard.
We have now comment on this in the main manuscript, and we have clarified in the figure legends which data set we used in each case in the figure legends and in Table S1.
* It appears you plot one replicate in Fig. 1b and the other in Suppl. Fig. S2. Please indicate explicitly which replicate is in each plot. For T. brucei, the NDR upstream of the TAS is clearer in Suppl. Fig. S2 while the TAS protection is less prominent; based on your digestion argument, this should correspond to the more-digested replicate. Please confirm.
The replicates used for the construction of each figure are explicitly indicated in Table S1. Although we have detailed in the table the original publication, the project and accession number for each data set, the reviewer is correct that in this case it was still not completely clear to which length distribution heatmap was each sample associated with. To avoid this confusion, we have now added the accession number for each data set to the figure legends and also clarified in Table S1. Regarding the reviewer's comment on the correspondence between the observed TAS protection and the extent of samples digestion, he/she is correct that for a more digested sample we would expect a clearer NDR. In this case, the difference in the extent of digestion between these two samples is minor, as observed the length of the main peak in the length distribution histogram for sequenced DNA molecules is the same. These two samples GSM5363006, represented in Fig1 b, and GSM5363007, represented in S2, belong to the same original paper (Maree et al 2017), and both were gel purified before sequencing. Therefore, any difference between them could not only be the result of a minor difference in the digestion level achieved in each experiment but could be also biased by the fragments included or not during gel purification. Therefore, I would not over conclude about TAS protection from this comparison. We have now included a brief comment on this, in the figure discussion
* The protected region around the TAS appears centered on the TAS in T. brucei but upstream in L. major. This is an interesting difference. If it is technical (different digestion or TAS prediction offset), explain why; if likely biological, discuss possible mechanisms and implications.
We appreciate the reviewer suggestion. We cannot assure if it is due to technical or biological reasons, but there is evidence that L. major 's genome has a different dinucleotide content and it might have an impact on nucleosome assembly. We have now added a comment about this observation in the final discussion of the manuscript.
Additionally, we analyzed DRIP-seq data for L. major, recently published doi: 10.1038/s41467-025-56785-y, and we observed that the R-loop footprint co-localized with the MNase-protected region upstream of the TAS (new S5 Fig), suggesting that the shift is not related to the MNase-seq technique.
Results - "An MNase sensitive complex occupies the TASs in T. brucei": * The definition of "MNase activity" and the ordering of samples into Low/Intermediate/High digestion are unclear. Did you infer digestion levels from fragment distributions rather than from controlled experimental timepoints? In Suppl. Fig. S3a it is not obvious how "Low digestion" was defined; that sample's fragment distribution appears intermediate. Please provide objective metrics (e.g., median fragment length, fraction 120-180 bp) used to classify digestion levels.
As the reviewer suggests, the ideal experiment would be to perform a time course of MNase reaction with all the samples in parallel, or to work with a fixed time point adding increasing amounts of MNase. However, even when making controlled experimental timepoints, you need to check the length distribution histogram of sequenced DNA molecules to be sure which level of digestion you have achieved.
In this particular case, we used public available data sets to make this analysis. We made an arbitrary definition of low, intermediate and high level of digestion, not as an absolute level of digestion, but as a comparative output among the tested samples. We based our definition on the comparison of __the main peak in length distribution heatmaps because this parameter is the best metric to estimate the level of digestion of a given sample. It represents the percentage of the total DNA sequenced that contains the predominant length in the sample tested. __Hence, we considered:
low digestion: when the main peak is longer than the expected protection for a nucleosome (longer than 150 bp). We expect this sample to contain additional longer bands that correspond to less digested material.
intermediate digestion, when the main peak is the expected for the nucleosome core-protection (˜146-150bp).
high digestion, when the main peak is shorter than that (shorter than 146 bp). This case, is normally accompanied by a bigger dispersion in fragment sizes.
To do this analysis, we chose samples that render different MNase protection of the TAS when plotting all the sequenced DNA molecules relative to this point and we used this protection as a predictor of the extent of sample digestion (Figure 2). To corroborate our hypothesis, that the degree of TAS protection was indeed related to the extent of the MNase digestion of a given sample, we looked at the length distribution histogram of the sequenced DNA molecules in each case. It is the best measurement of the extent of the digestion achieved, especially, when sequencing the whole sample without any gel purification and representing all the reads in the analysis as we did. The only caveat is with the sample called "intermediate digestion 1" that belongs to the original work of Mareé 2017, since only this data set was gel purified. To avoid this problem, we decided to remove this data from figures 2 and S3. In summary, the 3 remaining samples comes from the same lab, and belong to the same publication (Mareé 2022). These sample are the inputs of native MNase ChIp-seq, obtain the same way, totally comparable among each other.
* Several fragment distributions show a sharp cutoff at ~100-125 bp. Was this due to gel purification or bioinformatic filtering? State this clearly in Methods. If gel purification occurred, that can explain why some datasets preserve the MNase-sensitive region.
The sharp cutoff is neither due to gel purification or bioinformatic filtering, it is just due to the length of the paired-end read used in each case. In earlier works the most common was to sequence only 50bp, with the improvement of technologies it went up to 75,100 or 125 bp. We have now clarified in Table S1 the length of the paired-reads used in each case when possible.
* Please reconcile cases where samples labeled as more-digested contain a larger proportion of >200 bp fragments than supposedly less-digested samples; this ordering affects the inference that digestion level determines the loss/preservation of TAS protection. Based on the distributions I see, "Intermediate digestion 1" appears most consistent with an expected MNase curve - please confirm and correct the manuscript accordingly.
As explained above, it's a common observation in MNase digestion of chromatin that more extensive digestion can still result in a broad range of fragment sizes, including some longer fragments. This seemingly counter-intuitive result is primarily due to the non-uniform accessibility of chromatin and the sequence preference of the MNase enzyme, which has a preference for AT reach sequences.
The rationale of this is as follows: when you digest chromatin with MNase and the objective is to map nucleosomes genome-wide, the ideal situation would be to get the whole material contained in the mononucleosome band. Given that MNase is less efficient to digest protected DNA but, if the reaction proceeds further, it always ends up destroying part of it, the result is always far from perfect. The better situation we can get, is to obtain samples were ˜80% of the material is contained in the mononucloesome band. __And here comes the main point: __even in the best scenario, you always get some additional longer bands, such as those for di or tri nucleosomes. If you keep digesting, you will get less than 80 % in the nucleosome band and, those remaining DNA fragments that use to contain di and tri nucleosomes start getting digested as well, originating a bigger dispersion in fragments sizes. How do we explain persistence of Long Fragments? The longest fragments (di-, tri-nucleosomes) that persist in a highly digested sample are the ones that were originally most highly protected by proteins or higher-order structure, or by containing a poor AT sequence content, making their linker DNA extremely resistant to initial cleavage. Once the majority of the genome is fragmented, these few resistant longer fragments become a more visible component of the remaining population, contributing to a broader size dispersion. Hence, you end up observing a bigger dispersion in length distributions in the final material. Bottom line, it is not a good practice to work with under or over digested samples. Our main point, is to emphasize that especially when comparing samples, it important to compare those with comparable levels of digestion. Otherwise, a different sampling of the genome will be represented in the remaining sequenced DNA.
Results - "The MNase sensitive complexes protecting the TASs in T. brucei and T. cruzi are at least partly composed of histones": * The evidence that histones are part of the MNase-sensitive complex relies on H3 MNase-ChIP signal in subnucleosomal fragment bins. This seems to conflict with the observation (Fig. 1) that fragments protecting TASs are often nucleosome-sized. Please reconcile these points: are H3 signals confined to subnucleosomal fragments flanking the TAS while the TAS itself is depleted of H3? Provide plots that compare MNase-seq and H3 ChIP signals stratified by consistent fragment-size bins to clarify this.
What we learned from other eukaryotic organisms that were deeply studied, such as yeast, is that NDRs are normally generated at regulatory points in the genome. In this sense, yeast tRNA genes have a complex with a bootprint smaller than a nucleosome formed by TFIIIC-TFIIB (Nagarajavel, doi: 10.1093/nar/gkt611). On the other hand, many promotor regions have an MNase-sensitive complex with a nucleosome-size footprint, but it does not contain histones (Chereji, et al 2017, doi:10.1016/j.molcel.2016.12.009). The reviewer is right that from Figure 1 and S2 we could observe that the footprint of whatever occupies the TAS region, especially in T. brucei, is nucleosome-size. However, it only shows the size, but it doesn't prove the nature of its components. Nevertheless, those are only MNase-seq data sets. Since it does not include a precipitation with specific antibodies, we cannot confirm the protecting complex is made up by histones. In parallel, a complementary study by Wedel 2017, from Siegel's lab, shows that using a properly digested sample and further immunoprecipitating with a-H3 antibody, the TAS is not protected by nucleosomes at least not when analyzing nucleosome size-DNA molecules. Besides, Briggs et. al 2018 (doi: 10.1093/nar/gky928) showed that at least at intergenic regions H3 occupancy goes down while R-loops accumulation increases. We have now added a new figure 4 replotting R-loops and MNase-ChIP-seq for H3 relative to our predicted TAS showing this anti-correlation and how it partly correlates with MNase protection as well. As a control we show that Rpb9 trends resembles H3 as Siegel's lab have shown in Wedel 2018. Moreover, we analyzed redate from a recently published paper (doi: 10.1038/s41467-025-56785-y) added a new supplemental figure 5 showing that a similar correlation between MNase protection and R-loop footprint occurs in L. major (S5 Fig).
* Please indicate which datasets are used for each panel in Suppl. Fig. S4 (e.g., Wedel et al., Maree et al.), and avoid calling data from different labs "replicates" unless they are true replicates.
In most of our analysis we used real replicated experiments. Such is the case MNase-seq data used in Figure 1, with the corresponding replicate experiments used in Figure S2; T. cruzi MNase-ChIP-seq data used in Figure 3b and 4a with the respective replicate used in Figures S4 and S5 (now S6 in the revised manuscript). The only case in which we used experiments coming from two different laboratories, is in the case of MNase-ChIP-seq for H3 from T. brucei. Unfortunately, there are only two public data sets coming each of them from different laboratories. The samples used in Fig 3 (from Siegel's lab) whether the IP from H3 represented in S4 and S5 (S6 n the updated version) comes from another lab (Patterton's). To be more rigorous, we now call them data 1 and 2 when comparing these particular case.
The reviewer is right that in this particular case one is native chromatin (Pattertons') while the other one is crosslinked (Siegel's). We have now clarified it in the main text that unfortunately we do not count on a replicate but even under both condition the result remains the same, and this is compatible with my own experience, were crosslinking does not affect the global nucleosome patterns (compared nucleosome organization from crosslinked chromatin MNAse-seq inputs Chereji, Mol Cell, 2017 doi: 10.1016/j.molcel.2016.12.009 and native MNase-seq from Ocampo, NAR, 2016 doi: 10.1093/nar/gkw068).
* Several datasets show a sharp lower bound on fragment size in the subnucleosomal range (e.g., ~80-100 bp). Is this a filtering artifact or a gel-size selection? Clarify in Methods and, if this is an artifact, consider replotting after removing the cutoff.
We have only filtered adapter dimmer or overrepresented sequences when needed. In Figures 2 and S3 we represented all the sequenced reads. In other figures when we sort fragments sizes in silico, such as nucleosome range, dinucleosome or subnucleosome size, we make a note in the figure legends. What the reviewer points is related to the length of the sequence DNA fragment in each experiment. As we explained above, the older data-sets were performed with 50 bp paired-end reads, the newer ones are 75, 100 or 125bp. This is information is now clarified in Table S1.
__Results - "The TASs of single and multi-copy genes are differentially protected by nucleosomes": __
__ __* Please include T. brucei RNA-seq data in Suppl. Fig. S5b as you did for T. cruzi.
We have shown chromatin organization for T. brucei in previous S5b to illustrate that there is a similar trend. Unfortunately, we did not get a robust list of multi-copy genes for T. brucei as we did get for T. cruzi, therefore we do not want to over conclude showing the RNA-seq for these subsets of genes. The limitation is related to the fact that UTRme restrict the search and is extremely strict when calling sites at repetitive regions. Additionally, attending to the request of one reviewer we have now changed the UTR predictions for T. brucei using a different RNA-seq data set from Lister 427(detail in method section). Given that with the new predictions it was even harder to obtain the list of multicopy genes for T. brucei, we decided to remove that figure in the updated version of the manuscript.
* Discuss how low or absent expression of multigene families affects TAS annotation (which relies on RNA-seq) and whether annotation inaccuracies could bias the observed chromatin differences.
The mapping of occurrence and annotations that belong to repetitive regions has great complexity. UTRme is specially designed to avoid overcalling those sites. In other words, there is a chance that we could be underestimating the number of predicted TASs at multi-copy genes. Regarding the impact on chromatin analysis, we cannot rule out that it might have an impact, but the observation favors our conclusion, since even when some TASs at multi-copy genes can remain elusive, we observe more nucleosome density at those places.
* The statement that multi-copy genes show an "oscillation" between AT and GC dinucleotides is not clearly supported: the multi-copy average appears noisier and is based on fewer loci. Please tone down this claim or provide statistical support that the pattern is periodic rather than noisy.
We have fixed this now in the preliminary revised version
* How were multi-copy genes defined in T. brucei? Include the classification method in Methods.
This classification was done the same way it was explained for T. cruzi. However, decided to remove the supplemental figure that included this sorting.
Genomes and annotations: * If transcriptomic data for the Y strain was used for T. cruzi, please explain why a Y strain genome was not used (e.g., Wang et al. 2021 GCA_015033655.1), or justify the choice. For T. brucei, consider the more recent Lister 427 assembly (Tb427_2018) from TriTrypDB. Use strain-matched genomes and transcriptomes when possible, or discuss limitations.
The most appropriate way to analyze high throughput data, is to aline it to the same genome were the experiments were conducted. This was clearly illustrated in a previous publication from our group were we explained how should be analyzed data from the hybrid CL Brener strain. A common practice in the past was to use only Esmeraldo-like genome for simplicity, but this resulted in output artifacts. Therefore, we aligned it to CL Brener genome, and then focused the main analysis on the Esmeraldo haplotype (Beati Plos ONE, 2023). Ideally, we should have counted on transcriptomic data for the same strain (CL Brener or Esmeraldo). Since this was not the case at that moment, we used data from Y strain that belongs to the same DTU with Esmeraldo.
In the case of T. brucei, when we started our analysis and the software code for UTRme was written, the previous version of the genome was available. Upon 2018 version came up, we checked chromatin parameters and observed that it did not change the main observations. Therefore, we continue working with our previous setups.
Reproducibility and broader integration: * Please share the full analysis pipeline (ideally on GitHub/Zenodo) so the results are reproducible from raw reads to plots.
We are preparing a full pipeline in GitHub. We will make it available before manuscript full revision
* As an optional but helpful expansion, consider including additional datasets (other life stages, BSF MNase-seq, ATAC-seq, DRIP-seq) where available to strengthen comparative claims.
We are now including a new figure 4 and a supplemental figure 5 including DRIP-seq and Rp9 ChIP-seq for T. brucei (revised Fig 4) and DRIP-seq for L. major (S5 Fig). Additionally, we added FAIRE-seq data to previous Fig 4 now Fig 5 (revised Fig 5C).
We are analyzing ATAC-seq data for T. brucei.
Regarding BSF MNase-seq, the original article by Mareé 2017 claims that there is not significant difference for average chromatin organization between the two life forms; therefore, is not worth including that analysis.
Optional analyses that would strengthen the study: * Stratify single-copy genes by expression (high / medium / low) and examine average nucleosome occupancy at TASs for each group; a correlation between expression and NDR depth would strengthen the functional link to maturation.
We have now included a panel in suplemental figure 5 (now revised S6), showing the concordance for chromatin organization of stratified genes by RNA-seq levels relative to TAS.
__Minor / editorial comments: __ * In the Introduction, the sentence "transcription is initiated from dispersed promoters and in general they coincide with divergent strand switch regions" should be qualified: such initiation sites also include single transcription start regions.
We have clarified this in the preliminary revised version
* Define the dotted line in length distribution plots (if it is not the median, please clarify) and consider placing it at 147 bp across plots to ease comparison.
The dotted line is just to indicate where the maximum peak is located. It is now clarified in figure legends.
* In Suppl. Fig. 4b "Replicate2" the x-axis ticks are misaligned with labels - please fix.
We have now fixed the figure. Thanks for noticing this mistake.
* Typo in the Introduction: "remodellingremodeling" → "remodeling
Thanks for noticing this mistake, it is fixed in the current version of the manuscript
**Referee cross-commenting** Comment 1: I think Reviewer #2 and Reviewer #3 missed that they authors of this manuscript do cite and consider the results from Wedel at al. 2017. They even re-analysed their data (e.g. Figure 3a). I second Reviewer #2 comment indicating that the inclusion of a schematic figure to help readers visualize and better understand the findings would be an important addition.
Comment 2: I agree with Reviewer #3 that the use of different MNase digestion procedures in the different datasets have to be considered. On the other hand, I don't think there is a problem with figure 1 showing an MNase-protected TAS for T. brucei as it is based on MNase-seq data and reproduces the reported results (Maree et al. 2017). What the Siegel lab did in Wedel et al. 2017 was MNase-ChIPseq of H3 showing nucleosome depletion at TAS, but both results are not necessary contradictory: There could still be something else (which does not contain H3) sitting on the TAS protecting it from MNase digestion.
Reviewer #1 (Significance (Required)):
This study provides a systematic comparative analysis of chromatin landscapes at trans-splicing acceptor sites (TASs) in trypanosomatids, an area that has been relatively underexplored. By re-analyzing and harmonizing existing MNase-seq and MNase-ChIP-seq datasets, the authors highlight conserved and divergent features of nucleosome occupancy around TASs and propose that chromatin contributes to the fidelity of transcript maturation. The significance lies in three aspects: 1. Conceptual advance: It broadens our understanding of gene regulation in organisms where transcription initiation is unusual and largely constitutive, suggesting that chromatin can still modulate post-transcriptional processes such as trans-splicing. 2. Integrative perspective: Bringing together data from T. cruzi, T. brucei and L. major provides a comparative framework that may inspire further mechanistic studies across kinetoplastids. 3. Hypothesis generation: The findings open testable avenues about the role of chromatin in coordinating transcript maturation, the contribution of DNA sequence composition, and potential interactions with R-loops or RNA-binding proteins. Researchers in parasitology, chromatin biology, and RNA processing will find it a useful resource and a stimulus for targeted experimental follow-up.
My expertise is in gene regulation in eukaryotic parasites, with a focus on bioinformatic analysis of high-throughput sequencing data
__Reviewer #2 (Evidence, reproducibility and clarity (Required)): __
Siri et al. perform a comparative analysis using publicly available MNase-seq data from three trypanosomatids (T. brucei, T. cruzi, and Leishmania), showing that a similar chromatin profile is observed at TAS (trans-splicing acceptor site) regions. The original studies had already demonstrated that the nucleosome profile at TAS differs from the rest of the genome; however, this work fills an important gap in the literature by providing the most reliable cross-species comparison of nucleosome profiles among the tritryps. To achieve this, the authors applied the same computational analysis pipeline and carefully evaluated MNase digestion levels, which are known to influence nucleosome profiling outcomes.
In my view, the main conclusion is that the profiles are indeed similar-even when comparing T. brucei and T. cruzi. This was not clear in previous studies (and even appeared contradictory, reporting nucleosome depletion versus enrichment) largely due to differences in chromatin digestion across these organisms. The manuscript could be improved with some clarifications and adjustments:
- The authors state from the beginning that available MNase data indicate altered nucleosome occupancy around the TAS. However, they could also emphasize that the conclusions across the different trypanosomatids are inconsistent and even contradictory: NDR in T. cruzi versus protection-in different locations-in T. brucei and Leishmania.
We start our manuscript by referring to the first MNase-seq data sets publicly available for each TriTryp and we point that one of the main observations, in each of them, is the occurrence of a change in nucleosome density or occupancy at intergenic regions. In T. cruzi, in a previous publication from our group, we stablished that this intergenic drop in nucleosome density occurs near the trans-splicing acceptor site. In this work, we extend our study to the other members of TriTryps: T. brucei and L. major.
In T. brucei the papers from Patterton's lab and Siegel's lab came out almost simultaneously in 2017. Hence, they do not comment on each other's work. The first one claims the presence of a well-positioned nucleosome at the TAS by using MNase-seq, while the second one, shows an NDR at the TAS by using MNase-ChIP-seq. However, we do not think they are contradictory, or they have inconsistency. We brought them together along the manuscript because we think these works can provide complementary information.
On one hand, we infer data from Pattertons lab is slightly less digested than the sample from Siegel's lab. Therefore, we discuss that this moderate digestion must be the reason why they managed to detect an MNase protecting complex sitting at the TAS (Figure 1). On the other hand, Sigel's lab includes an additional step by performing MNase-ChIP-seq, showing that when analyzing nucleosome size fragments, histones are not detected at the TAS. Here, we go further in this analysis on figure 3, showing that only when looking at subnucleosome-size fragments, we can detect histone H3. And this is also true for T. cruzi.
By integrating every analysis in this work and the previous ones, we propose that TASs are protected by an MNase-sensitive complex (proved in Figure 2). This complex most likely is only partly formed by histones, since only when analyzing sub-nucleosomes size DNA molecules we can detect histone H3 (Figure 3). To be sure that the complex is not entirely made up by histones, future studies should perform an MNse-ChIP-seq with less digested samples. However, it was previously shown that R-loops are enriched at those intergenic NDRs (Briggs, 2018 doi: 10.1093/nar/gky928) and that R-loops have plenty of interacting proteins (Girasol, 2023 10.1093/nar/gkad836). Therefore, most likely, this MNase-sensitive complexed have a hybrid nature made up by H3 and some other regulatory molecules, possibly involved in trans-splicing. We have now added a new figure 4 showing R-loop co-localization with the NDR.
Regarding the comparison between different organisms, after explaining the sensitivity to MNase of the TAS protecting complex, we discuss that when comparing equally digested samples T. cruzi and T. brucei display a similar chromatin landscape with a mild NDR at the TAS (See T. cruzi represented in Figure 1 compared to T. brucei represented in Intermediate digestion 2 in Figure 2, intermediate digestion in the revised manuscript). Unfortunately, we cannot make a good comparison with L. major, since we do not count on a similar level of digestion. However, by analyzing a recently published DRIP-seq data-set for L. major we show that R-loop signal co localize with MNase-protection in a similar way (new S5 Fig).
Another point that requires clarification concerns what the authors mean in the introduction and discussion when they write that trypanosomes have "...poorly organized chromatin with nucleosomes that are not strikingly positioned or phased." On the other hand, they also cite evidence of organization: "...well-positioned nucleosome at the spliced-out region.. in Leishmania (ref 34)"; "...a well-positioned nucleosome at the TASs for internal genes (ref37)"; "...a nucleosome depletion was observed upstream of every gene (ref 35)." Aren't these examples of organized chromatin with at least a few phased nucleosomes? In addition, in ref 37, figure 4 shows at least two (possibly three to four) nucleosomes that appear phased. In my opinion, the authors should first define more precisely what they mean by "poorly organized chromatin" and clarify that this interpretation does not contradict the findings highlighted in the cited literature.
For a better understanding of nucleosome positioning and phasing I recommend the review: Clark 2010 doi:10.1080/073911010010524945, Figure 4. Briefly, in a cell population there are different alternative positions that a given nucleosome can adopt. However, some are more favorable. When talking about favorable positions, we refer to the coordinates in the genome that are most likely covered by a nucleosome and are predominant in the cell population. Additionally, nucleosomes could be phased or not. This refers not only the position in the genome, but to the distance relative to a given point. In yeast, or in highly transcribed genes of more complex eukaryotes, nucleosomes are regularly spaced and phased relative to the transcription start site (TSS) or to the +1 nucleosome (Ocampo, NAR, 2016, doi:10.1093/nar/gkw068). In trypanosomes, nucleosomes have some regular distribution when making a browser inspection but, given that they are not properly phased with respect to any point, it is almost impossible to make a spacing estimation from paired-end data. This is also consistent with a chromatin that is transcribed in an almost constitutive manner.
As the reviewer mention, we do site evidence of organization. We think the original observations are correct, but we do not fully agree with some of the original statements. In this manuscript our aim is to take the best we learned from their original works and to make a constructive contribution adding to the original discussions. In this regard, in trypanosomes there are some conserved patterns in the chromatin landscape, but their nucleosomes are far from being well-positioned or phased. For a better understanding, compare the variations observed in the y axis when representing av. nucleosome occupancy in yeast with those observed in trypanosomes and you will see that the troughs and peaks are much more prominent in yeast than the ones observed in any TryTryp member.
Following the reviewer's suggestion we have now clarified this in the main text.
The paper would also benefit from the inclusion of a schematic figure to help readers visualize and better understand the findings. What is the biological impact of having nucleosomes, di-nucleosomes, or sub-nucleosomes at TAS? This is not obvious to readers outside the chromatin field. For example, the following statement is not intuitive: "We observed that, when analyzing nucleosome-size (120-180 bp) DNA molecules or longer fragments (180-300 bp), the TASs of either T. cruzi or T. brucei are mostly nucleosome-depleted. However, when representing fragments smaller than a nucleosome-size (50-120 bp) some histone protection is unmasked (Fig. 3 and Fig. S4). This observation suggests that the MNase sensitive complex sitting at the TASs is at least partly composed of histones." Please clarify.
We appreciate the reviewer's suggestion to make a schematic figure. We have now added a new Figure 6.
Regarding the biological impact of having mono, di or subnucleosome fragments, it is important to unveil the fragment size of the protected DNA to infer the nature of the protecting complex. In the case of tRNA genes in yeast, at pol III promoters they found footprints smaller than a nucleosome size that ended up being TFIIB-TFIIC (Nagarajavel, doi: 10.1093/nar/gkt611). Therefore, detecting something smaller than a nucleosome might suggest the binding of trans-acting factors different than histones or involving histones in a mixed complex. These mixed complexes are also observed, and that is the case of the centromeric nucleosome which has a very peculiar composition (Ocampo and Clark, Cells Reports, 2015). On the other hand, if instead we detect bigger fragments, it could be indicative of the presence of bigger protecting molecules or that those regions are part of higher order chromatin organization still inaccessible for MNase linker digestions.
Here we show on 2Dplots, that complex or components protecting the TAS have nucleosome size, but we cannot assure they are entirely made up by histones, since, only when looking at subnucleosome-size fragments, we are able to detect histone H3. We have now added part of this explanation to the discussion.
By integrating every analysis in this work and the previous ones, we propose that the TAS is protected by an MNase-sensitive complex (Figure 2). This complex most likely is only partly formed by histones, since only when analyzing sub-nucleosomes size DNA molecules we can detect histone H3 (Figure 3). As explained above, to be sure that the complex is not entirely made up by histones, future studies should perform an MNse-ChIP-seq with less digested samples. However, it was previously shown that R-loops are enriched at those intergenic NDRs (Briggs 2018) and that R-loops have plenty of interacting proteins (Girasol, 2023). Therefore, most likely, this MNase-sensitive complexed have a hybrid nature made up by H3 and some other regulatory molecules. We have now added a new figure 4 showing R-loop partial co-localization with MNase protection.
Some references are missing or incorrect:
we will make a thorough revision
"In trypanosomes, there are no canonical promoter regions." - please check Cordon-Obras et al. (Navarro's group). Thank you for the appropiate suggestion.
Thank you for the appropriate suggestion. We have now added this reference
Please, cite the study by Wedel et al. (Siegel's group), which also performed MNase-seq analysis in T. brucei.
We understand that reviewer number 2# missed that we cited this reference and that we did used the raw data from the manuscript of Wedel et. al 2017 form Siegel's group. We used the MNase-ChIP-seq data set of histone H3 in our analysis for Figures 3, S4 and S6 (in the revised version), also detailed in table S1. To be even more explicit, we have now included the accession number of each data set in the figure legends.
Figure-specific comments: Fig. S3: Why does the number of larger fragments increase with greater MNase digestion? Shouldn't the opposite be expected?
This a good observation. As we also explained to reviewer#1:
It's a common observation in MNase digestion of chromatin that more extensive digestion can still result in a broad range of fragment sizes, including some longer fragments. This seemingly counter-intuitive result is primarily due to the non-uniform accessibility of chromatin and the sequence preference of the MNase enzyme.
The rationale of this is as follows: when you digest chromatin with MNase and the objective is to map nucleosomes genome-wide, the ideal situation would get the whole material contained in the mononucleosome band. Given that MNase is less efficient to digest protected DNA but, if the reaction proceeds further, it always ends up destroying part of it, the result is always far from perfect. The better situation we can get, is to obtain samples were ˜80% of the material is contained in the mononucloesome band. __And here comes the main point: __even in the best scenario, you always have some additional longer bands, such as those for di or tri nucleosomes. If you keep digesting, you will get less than 80 % in the nucleosome band and, those remaining DNA fragments that use to contain di and tri nucleosomes start getting digested as well originating a bigger dispersion in fragments sizes. How do we explain persistence of Long Fragments? The longest fragments (di-, tri-nucleosomes) that persist in a highly digested sample are the ones that were originally most highly protected by proteins or higher-order structure, making their linker DNA extremely resistant to initial cleavage. Once most of the genome is fragmented, these few resistant longer fragments become a more visible component of the remaining population, contributing to a broader size dispersion. Hence, there you end up having a bigger dispersion in length distributions in the final material. Bottom line, it is not a good practice to work with under or overdirected samples. Our main point is to emphasize that especially when comparing samples, it important to compare those with comparable levels of digestion. Otherwise, a different sampling of the genome will be represented in the remaining sequenced DNA.
Minor points:
There are several typos throughout the manuscript.
Thanks for the observation. We will check carefully.
Methods: "Dinucelotide frecuency calculation."
We will add a code in GitHub
Reviewer #2 (Significance (Required)):
In my view, the main conclusion is that the profiles are indeed similar-even when comparing T. brucei and T. cruzi. This was not clear in previous studies (and even appeared contradictory, reporting nucleosome depletion versus enrichment) largely due to differences in chromatin digestion across these organisms. Audience: basic science and specialized readers.
Expertise: epigenetics and gene expression in trypanosomatids.
__Reviewer #3 (Evidence, reproducibility and clarity (Required)): __
The authors analysed publicly accessible MNase-seq data in TriTryps parasites, focusing on the chromatin structure around trans-splicing acceptor sites (TASs), which are vital for processing gene transcripts. They describe a mild nucleosome depletion at the TAS of T. cruzi and L. major, whereas a histone-containing complex protects the TASs of T. brucei. In the subsequent analysis of T. brucei, they suggest that a Mnase-sensitive complex is localised at the TASs. For single-copy versus multi-copy genes, the authors show different di-nucleotide patterns and chromatin structures. Accordingly, they propose this difference could be a novel mechanism to ensure the accuracy of trans-splicing in these parasites.
Before providing an in- depth review of the manuscript, I note that some missing information would have helped in assessing the study more thoroughly; however, in the light of the available information, I provide the following comments for consideration.
The numbering of the figures, including the figure legends, is missing in the PDF file. This is essential for assessing the provided information.
We apologized for not including the figure numbers in the main text, although they are located in the right place when called in the text. The omission was unwillingly made when figure legends were moved to the bottom of the main text. This is now fixed in the updated version of the manuscript.
The publicly available Mnase- seq data are manyfold, with multiple datasets available for T. cruzi, for example. It is unclear from the manuscript which dataset was used for which figure. This must be clarified.
This was detailed in Table S1. We have now replaced the table by an improved version, and we have also included the accession number of each data set used in the figure legends.
Why do the authors start in figure 1 with the description of an MNase- protected TAS for T.brucei, given that it has been clearly shown by the Siegel lab that there is a nucleosome depletion similar to other parasites?
We did not want to ignore the paper from Patterton's lab because it was the first one to map nucleosomes genome-wide in T. brucei and the main finding of that paper claimed the existence of a well-positioned nucleosome at intergenic regions, what we though constitutes a point worth to be discussed. While Patterton's work use MNase-seq from gel-purified samples and provides replicated experiments sequenced in really good depth; Siegel's lab uses MNase-ChIP-seq of histone H3 but performs only one experiment and its input was not sequenced. So, each work has its own caveats and provides different information that together contributes to make a more comprehensive study. We think that bringing up both data sets to the discussion, as we have done in Figures 1 and 3, helps us and the community working in the field to enrich the discussion.
If the authors re- analyse the data, they should compare their pipeline to those used in the other studies, highlighting differences and potential improvements.
We are working on this point. We will provide a more detail description in the final revision.
Since many figures resemble those in already published studies, there seems little reason to repeat and compare without a detailed comparison of the pipelines and their differences.
Following the reviewer advice, we are now working on highlighting the main differences that justify analyzing the data the way we did and will be added in the finally revised method section.
At a first glance, some of the figures might look similar when looking at the original manuscripts comparing with ours. However, with a careful and detailed reading of our manuscripts you can notice that we have added several analyses that allow to unveil information that was not disclosed before.
First, we perform a systematic comparison analyzing every data set the same way from beginning to end, being the main difference with previous studies the thorough and precise prediction of TAS for the three organisms. Second, we represent the average chromatin organization relative to those predicted TASs for TriTryps and discuss their global patterns. Third, by representing the average chromatin into heatmaps, we show for the very first time, that those average nucleosome landscape are not just an average, they keep a similar organization in most of the genome. These was not done in any of the previous manuscripts except for our own (Beati, PLOS One 2023). Additionally, we introduce the discussion of how the extension of MNase reaction can affect the output of these experiments and we show 2D-plots and length distribution heatmaps to discuss this point (a point completely ignored in all the chromatin literature for trypanosomes). Furthermore, we made a far-reaching analysis by considering the contributions of each publish work even when addressed by different techniques. Finally, we discuss our findings in the context of a topic of current interest in the field, such as TriTryp's genome compartmentalization.
Several previous Mnase- seq analysis studies addressing chromatin accessibility emphasized the importance of using varying degrees of chromatin digestion, from low to high digestion (30496478, 38959309, 27151365).
The reviewer is correct, and this point is exactly what we intended to illustrate in figure number 2. We appreciate he/she suggests these references that we are now citing in the final discussion. Just to clarify, using varying degrees of chromatin digestion is useful to make conclusions about a given organism but when comparing samples, strains, histone marks, etc. It is extremely important to do it upon selection of similar digested samples.
No information on the extent of DNA hydrolysis is provided in the original Mnase- seq studies. This key information can not be inferred from the length distribution of the sequenced reads.
The reviewer is correct that "No information on the extent of DNA hydrolysis is provided in the original Mnase-seq studies" and this is another reason why our analysis is so important to be published and discussed by the scientific community working in trypanosomes. We disagree with the reviewer in the second statement, since the level of digestion of a sequenced sample is actually tested by representing the length distribution of the total DNA sequenced. It is true that before sequencing you can, and should, check the level of digestion of the purified samples in an agarose gel and/or in a bioanalyzer. It could be also tested after library preparation, but before sequencing, expecting to observe the samples sizes incremented in size by the addition of the library adapters. But, the final test of success when working with MNase digested samples is to analyze length of DNA molecules by representing the histograms with length distribution of the sequenced DNA molecules. Remarkably, on occasions different samples might look very similar when run in a gel, but they render different length distribution histograms and this is because the nucleosome core could be intact but they might have suffered a differential trimming of the linker DNA associated to it or even be chewed inside (see Cole Hope 2011, section 5.2, doi: 10.1016/B978-0-12-391938-0.00006-9, for a detailed explanation).
As the input material are selected, in part gel- purified mono- nucleosomal DNA bands. Furthermore the datasets are not directly comparable, as some use native MNase, while others employ MNase after crosslinking; some involve short digestion times at 37 {degree sign} C, while others involve longer digestion at lower temperatures. Combining these datasets to support the idea of an MNase- sensitive complex at the TAS of T. brucei therefore may not be appropriate, and additional experiments using consistent methodologies would strengthen the study's conclusions.
In my opinion, describing an MNase- sensitive complex based solely on these data is not feasible. It requires specifically designed experiments using a consistent method and well- defined MNase digestion kinetics.
As the reviewer suggests, the ideal experiment would be to perform a time course of MNase reaction with all the samples in parallel, or to work with a fix time point adding increasing amounts of MNase. However, the information obtained from the detail analysis of the length distribution histogram of sequenced DNA molecules the best test of the real outcome. In fact, those samples with different digestion levels were probably not generated on purpose.
The only data sets that were gel purified are those from Mareé 2017 (Patterton's lab), used in Figures 1, S1 and S2 and those from L. major shown in Fig 1. It was a common practice during those years, then we learned that is not necessary to gel purify, since we can sort fragment sizes later in silico when needed.
As we explained to reviewer #1, to avoid this conflict, we decided to remove this data from figures 2 and S3. In summary, the 3 remaining samples comes from the same lab, and belong to the same publication (Mareé 2022). These sample are the inputs of native MNase ChIp-seq, obtain the same way, totally comparable among each other.
Reviewer #3 (Significance (Required)):
Due to the lack of controlled MNase digestion, use of heterogeneous datasets, and absence of benchmarking against previous studies, the conclusions regarding MNase-sensitive complexes and their functional significance remain speculative. With standardized MNase digestion and clearly annotated datasets, this study could provide a valuable contribution to understanding chromatin regulation in TriTryps parasites.
As we have explained in the previous point our conclusions are valid since we do not compare in any figure samples coming from different treatments. The only exception to this comment could be in figure 3 when talking about MNase-ChIP-seq. We have now added a clear and explicit comment in the section and the discussion that despite having subtle differences in experimental procedures we arrive to the same results. This is the case for T. cruzi IP, run from crosslinked chromatin, compared to T. brucei's IP, run from native chromatin.
Along the years it was observed in the chromatin field that nucleosomes are so tightly bound to DNA that crosslinking is not necessary. However, it is still a common practice specially when performing IPs. In our own hands, we did not observe any difference at the global level neither in T. cruzi (unpublished) nor in my previous work with yeast (compared nucleosome organization from crosslinked chromatin MNAse-seq inputs Chereji, Mol Cell, 2017 doi:10.1016/j.molcel.2016.12.009 and native MNase-seq from Ocampo, NAR, 2016 doi: 10.1093/nar/gkw068).
Note: This preprint has been reviewed by subject experts for Review Commons. Content has not been altered except for formatting.
Learn more at Review Commons
This study explores chromatin organization around trans-splicing acceptor sites (TASs) in the trypanosomatid parasites Trypanosoma cruzi, T. brucei and Leishmania major. By systematically re-analyzing MNase-seq and MNase-ChIP-seq datasets, the authors conclude that TASs are protected by an MNase-sensitive complex that is, at least in part, histone-based, and that single-copy and multi-copy genes display differential chromatin accessibility. Altogether, the data suggest a common chromatin landscape at TASs and imply that chromatin may modulate transcript maturation, adding a new regulatory layer to an unusual gene-expression system.
I value integrative studies of this kind and appreciate the careful, consistent data analysis the authors implemented to extract novel insights. That said, several aspects require clarification or revision before the conclusions can be robustly supported. My main concerns are listed below, organized by topic/result section.
TAS prediction:
Results
Results
Genomes and annotations:
Reproducibility and broader integration:
Minor / editorial comments:
Referee cross-commenting
Comment 1: I think Reviewer #2 and Reviewer #3 missed that they authors of this manuscript do cite and consider the results from Wedel at al. 2017. They even re-analysed their data (e.g. Figure 3a). I second Reviewer #2 comment indicating that the inclusion of a schematic figure to help readers visualize and better understand the findings would be an important addition.
Comment 2: I agree with Reviewer #3 that the use of different MNase digestion procedures in the different datasets have to be considered. On the other hand, I don't think there is a problem with figure 1 showing an MNase-protected TAS for T. brucei as it is based on MNase-seq data and reproduces the reported results (Maree et al. 2017). What the Siegel lab did in Wedel et al. 2017 was MNase-ChIPseq of H3 showing nucleosome depletion at TAS, but both results are not necessary contradictory: There could still be something else (which does not contain H3) sitting on the TAS protecting it from MNase digestion.
This study provides a systematic comparative analysis of chromatin landscapes at trans-splicing acceptor sites (TASs) in trypanosomatids, an area that has been relatively underexplored. By re-analyzing and harmonizing existing MNase-seq and MNase-ChIP-seq datasets, the authors highlight conserved and divergent features of nucleosome occupancy around TASs and propose that chromatin contributes to the fidelity of transcript maturation.
The significance lies in three aspects:
My expertise is in gene regulation in eukaryotic parasites, with a focus on bioinformatic analysis of high-throughput sequencing data
Tabela 2.5: Projetos no SISCEAB
Mudar o nome da tabela e colocar a referência do SIRUS.
Figura 2.27: Critérios de teto e visibilidade
Copiar o código HTML da página da redemet.
Figura 2.26: Percentual de ATCO com NP Operacional (4 ou acima)
01 - Inserir o gráfico de variação; 02 - Inserir a legenda; 03 - Inserir mais um ano de comparação; 04 - Inserir o título do eixo y; 05 - Alterar no nome da figura.
Reviewer #2 (Public review):
This is an interesting study that shows that mRNA acetylation at synapses is dynamically regulated at synapses by spatial memory in the mouse hippocampus. The dynamic changes of ac4C-mRNAs regulated by memory were validated by methods including ac4C dot-blot and liquid 13 chromatography-tandem mass spectrometry (LC-MS/MS).
Here are some comments for consideration by readers and authors:
(1) It is known that synaptosomes are contaminated with glial tissue. In the study, the authors also show that NAT0 is expressed in glia. So the candidate mRNAs identified by acRIP-seq might also be mixed with glial mRNAs. Are the GO BP terms shown in Figure 3A specifically chosen, or unbiasedly listed for all top ones?
(2) Where does NAT10-mediated mRNA acetylation take place within cells generally? Is there evidence that NAT10 can catalyze mRNA acetylation in the cytoplasm?
(3) "The NAT10 proteins were significantly reduced in the cytoplasm (S2 fraction) but increased in the PSD fraction at day 6 after memory (Figures 5J and 5K)." The authors argue that the translocation of NAT10 from soma to synapses accounts for these changes. The increase of NAT10 protein in the PSD fraction can be understood. However, it is quite surprising that the NAT10 proteins were significantly reduced in the cytoplasm (S2 fraction), considering the amount of NAT10 in soma is much more abundant in synapses. The small increase in synaptic NAT10 might not be enough to cause a decrease in soma NAT10 protein level.
(4) It is difficult to separate the effect on mRNA acetylation and protein mRNA acetylation when doing the loss of function of NAT10.
Author response:
Reviewer #1:
Comment 1: The authors use a confusing timeline for their behavioral experiments, i.e., day 1 is the first day of training in the MWM, and day 6 is the probe trial, but in reality, day 6 is the first day after the last training day. So this is really day 1 post-training, and day 20 is 14 days post-training.
We thank this reviewer for pointing out the issue of the behavioral timeline. We will revise the behavioral timeline as suggested by this reviewer. Days 1–5 will be labeled as “Training phase day 1–5”. Day 6 will be labeled as the “Day 1 post-training” and Day 20 will be labeled as the “Day 14 post-training”.
Comment 2: The authors inaccurately use memory as a term. During the training period in the MWM, the animals are learning, while memory is only probed on day 6 (after learning). Thus, day 6 reflects memory consolidation processes after learning has taken place.
We will revise the manuscript to distinguish between "learning" and "memory." We will refer to the performance during the 5-day training period as "spatial learning" and restrict the term "memory" to the probe tests on Day 6, which reflect memory processes after learning has taken place.
Comment 3: The NAT10 cKO mice are useful... but all the experiments used AAV-CRE injections in the dorsal hippocampus that showed somewhat modest decreases... For these experiments, it would be better to cross the NAT10 floxed animals to CRE lines where a better knockdown of NAT10 can be achieved, with less variability.
We want to clarify the reason for using AAV-Cre injection rather than Cre lines. Indeed, we attempted to generate Nat10 conditional knockouts by crossing Nat10<sup>flox/flox</sup> mice with several CNS-specific Cre lines. Crossing with Nestin-Cre and Emx1-Cre resulted in embryonic and premature lethality, respectively, consistent with the essential housekeeping function of NAT10 during neurodevelopment. We are currently using the Camk2α-Cre line which starts to express Cre after postnatal 3 weeks specifically in hippocampal pyramidal neurons (Tsien et al., 1996).
Comment 4: Because knockdown is only modest (~50%), it is not clear if the remaining ac4c on mRNAs is due to remaining NAT10 protein or due to an alternative writer (as the authors pose).
Our results suggest the existence of alternative writers. As shown in Figure 6D, we identified a population of "NAT10-independent" MISA mRNAs (present in MISA but not downregulated in NASA). Remarkably, these mRNAs possess a consensus motif (RGGGCACTAACY) that is fundamentally different from the canonical NAT10 motif (AGCAGCTG). This distinct motif usage suggests that the residual ac4C signals are not merely due to incomplete knockdown of NAT10, but reflect the activity of other, as-yet-unidentified ac4C writers. Nonetheless, we think that generation of a Nat10 knockout line with completely loss of NAT10 proteins is useful to address this reviewer’s concern.
Reviewer #2:
Comment 1: It is known that synaptosomes are contaminated with glial tissue... So the candidate mRNAs identified by acRIP-seq might also be mixed with glial mRNAs. Are the GO BP terms shown in Figure 3A specifically chosen, or unbiasedly listed for all top ones?
It is true that some ac4C-mRNAs identified by acRIP-seq from the synaptosomes are highly expressed in astrocyte, such as Aldh1l1, ApoE, Sox9 and Aqp4 (Table S3, Fig. S6H). In agreement, we found that NAT10 was also expressed in astrocyte in addition to neurons. We will show representative image for the expression of NAT10-Cre in astrocytes in the revised MS. The BP items shown in Fig. 3A were chosen from top 30 and highly related with synaptic plasticity and memory. We will show the full list of significant BP items for MISA in the revised MS.
Comment 2: Where does NAT10-mediated mRNA acetylation take place within cells generally? Is there evidence that NAT10 can catalyze mRNA acetylation in the cytoplasm?
The previous studies from non-neuronal cells showed that NAT10 can catalyze mRNA acetylation in the cytoplasm and enhance translational efficiency (Arango et al., 2018; Arango et al., 2022). In this study, we showed that mRNA acetylation occurred both in the homogenates and synapses (see ac4C-mRNA lists in Table S2 and S3). However, spatial memory upregulated mRNA acetylation mainly in the synapses rather than in the homogenates (Fig. 2 and Fig. S2).
Comment 3: "The NAT10 proteins were significantly reduced in the cytoplasm (S2 fraction) but increased in the PSD fraction..." The small increase in synaptic NAT10 might not be enough to cause a decrease in soma NAT10 protein level.
We showed that the NAT10 protein levels were increased by one-fold in the PSD fraction, but were reduced by about 50% in the cytoplasm after memory formation (Fig. 5J and K). The protein levels of NAT10 in the homogenates and nucleus were not altered after memory formation (Fig. 5F and I). Due to these facts, we hypothesized that NAT10 proteins may have a relocation from cytoplasm to synapses after memory formation, which was also supported by the immunofluorescent results from cultured neurons (Fig. S4). However, we agree with this reviewer that drawing such a conclusion may require the time-lapse imaging of NAT10 protein trafficking in living animals, which is technically challenging at this moment.
Comment 4: It is difficult to separate the effect on mRNA acetylation and protein mRNA acetylation when doing the loss of function of NAT10.
This is a good point. We agree with this reviewer that NAT10 may acetylate both mRNA and proteins. We examined the acetylation levels of -tubulin and histone H3, two substrate proteins of NAT10 in the hippocampus of Nat10 cKO mice. As shown in Fig S5C, E, and F, the acetylation levels of -tubulin and histone H3 remained unchanged in the Nat10 cKO mice, likely due to the compensation by other protein acetyltransferases. In contrast, mRNA ac4C levels were significantly decreased in the Nat10 cKO mice (Figure S5G–H). These results suggest that the memory deficits seen in Nat10 cKO mice may be largely due to the impaired mRNA acetylation. Nonetheless, we believe that developing a new technology which enables selective erasure of mRNA acetylation would be helpful to address the function of mRNA. We discussed these points in the MS (line 585-592).
References
Arango, D., Sturgill, D., Alhusaini, N., Dillman, A. A., Sweet, T. J., Hanson, G., Hosogane, M., Sinclair, W. R., Nanan, K. K., & Mandler, M. D. (2018). Acetylation of cytidine in mRNA promotes translation efficiency. Cell, 175(7), 1872-1886. e1824.
Arango, D., Sturgill, D., Yang, R., Kanai, T., Bauer, P., Roy, J., Wang, Z., Hosogane, M., Schiffers, S., & Oberdoerffer, S. (2022). Direct epitranscriptomic regulation of mammalian translation initiation through N4-acetylcytidine. Molecular cell, 82(15), 2797-2814. e2711.
Tsien, J. Z., Chen, D. F., Gerber, D., Tom, C., Mercer, E. H., Anderson, D. J., Mayford, M., Kandel, E. R., & Tonegawa, S. (1996). Subregion-and cell type–restricted gene knockout in mouse brain. Cell, 87(7), 1317-1326.
La différence entre les images informatives et décoratives
Redondance ?
Doporučené příslušenství k party stanům Samotný party stan je skvělým základem, ale okolní vybavení tvoří kompletní zážitek pro účastníky. Proto doporučujeme investovat do příslušenství, které zvýší funkčnost i vizuální efekt. Reklamní vlajky jsou nepřehlédnutelným prvkem identity – viditelné z dálky, lehké, mobilní a odolné vůči náročným podmínkám. Skvěle se hodí k vchodům, jako směrovky. nebo orientační body, a lze je snadno upevnit i na nůžkové stany. Lehátka v relaxační zóně pak nejsou jen detailem, ale jasným signálem, že vám záleží na pohodlí hostů.
Eventové příslušenství Nákupem samotného stanu to zdaleka nekončí- nezapomeňte na vhodné kotvení, osvětlení, odolné přepravní obaly atd. Doporučujeme dokoupit také reklamní vlajky, sedací vaky, lehátka a další položky, které zajistí vyšší atraktivitu Vaší prezentace.
Výrobce eventových stanů s potiskem Vyrábíme eventové stany s potiskem, které nejen chrání před sluncem a deštěm, ale zároveň posilují rozpoznatelnost vaší značky. Nabízíme plnou personalizaci – od. konstrukce, přes barvy, až po individuální branding. Díky trvanlivým a mechanicky odolným materiálům se každý stan stává funkčním nosičem reklamy. Viditelným z dálky, čelným a konzisteniním s vaší vizuální identitou. Každý projekt řešíme individuálně s důrazem na 10, co chcete ukázat světu.
Přímý výrobce včetně potisku Celý výrobní proces realizujeme ve své režii a to vč. potisku! Nemusíte tak řešit nákup materiálu u jednoho dodavatele, potisk u druhého atd. U nás vše vyřešíte komfortně a rychle na jednom místě!
Druhy eventových stanů Výběr eventového stanu není jen otázkou estetiky. Je to rozhodnutí, které ovlivňuje komfort, bezpečnost a odolnost stanu proti rozmarům počasí. Různé konstrukce splňují různé potřeby – od veletrhů až po velkoformátové akce. Nůžkový stan je synonymem pro minimum montáže a maximum funkčnosti. Hodí se tam, kde je klíčová flexibilita, rychlé rozložení a účinná reklama, Lehká skládací konstrukce se snadno přepravuje a některé velikosti se vejdou i do osobního auta typu kombi. Party stan typu hvězda byl navržen pro akce, kde rozhoduje první dojem a velká zastřešená plocha. Centrální stožár a paprskovitě rozložené ramena vytvářejí otevřený prostor, který spojuje funkčnost s výrazným stylem, Kopulový stan je řešením pro firmy, které chtějí vytvořit menší, ale kreativní, zapamatovatelný a vůči počasí odolný prostor. Mnoho našich zákazníků volí kopuli, aby budovali image prémiové značky.
Typ reklamního stanu Nepodceňte výběr nejvhodnějšího stanu- jiný typ se hodí na jednodenní prezentaci a jiný na týdenní festival.
Nůžkový stan představuje rychlost, mobilitu a efektivitu. Převezete ho v osobním autě a rozložíte za 60 s! S atraktivním designem potisku bude i toto léty osvědčené řešení lákat pozornost.
Párty stan Jehlan je určený pro větší akce, kde potřebujete poskytnou zázemí většímu množství lidí. Přesto Vám jeho stavba nezabere více než 30 min.
Nafukovací stan pak představuje vrchol komfortu- žádná stavba, pouze vybalit, nafouknout a používat!
Stan Dome je pak vhodný pro realizace, kde pod střechou stanu potřebujete umístit další nosiče reklamy, např. roll-up bannery, TV apod.
Poraďte se s naším obchodním zástupcem Náš tým vám nejprve pomůže vybrat správné řešení a následně připraví návrh, který plně odrazí vaši představu. Kontaktujte nás
Zeptejte se nás na cokoliv! Náš obchodní tým i zákaznický servis s Vámi ochotně probere jakýkoliv detail zakázky.
Kontaktujte nás, a my vám pomůžeme s výběrem a poradíme! Potřebujete pomoc event managera při výběru vybavení? Nebo se chcete dozvědět více o stanu? Kontaktujte náš tým expertů, kteří odpoví na každou vaši otázku. Spojte se s námi
Use the same "contact banner" as on the home page: "Nejste si čímkoliv jistí…"
Byly by produkty Mitko vhodným nákupem? Všechny produkty Mitko jsme připravili s maximální péčí o každý detail. Výrobky vyrábíme v Polsku, nespoléháme na dovoz z Číny, což se odráží v kvalitním a odolném produktu, který vám bude sloužit mnoho let, a investované peníze budou skvělou investicí na dlouhou dobu. Instituce – i ty největší – se k nám často vracejí s opakovanými objednávkami.
Jak je to s kvalitou potisku? Tiskneme nejmodernější metodou digitální sublimace, která zajišťuje věrné podání barev, ostrý tisk a UV odolnost barev. U nás tedy nečekejte nevýrazné barvy a rozpité okraje!
Bude cena slunečníku vyšší při větším množství grafik a tisku? Ne. Cena reklamního slunečníku zahrnuje 100% sublimačního tisku na jeho potahu. Množství grafiky umístěné na slunečníku ani místo jejího umístění nemají vliv na cenu.
Je cena potisku závislá na designu? NE, samotný design ani počet barev nehraje z pohledu ceny roli! Důležitý je rozsah potisku, tedy např. potisk střechy, volánů, bočnic apod.
Bude cena reklamních překážek vyšší s větším množstvím grafiky a tisku? Ne. Cena reklamních plotů zahrnuje 100% sublimačního tisku na jejich potahu. Množství grafiky umístěné na plotech ani místo jejího umístění nemají vliv na cenu.
DELETE
Ano, reklamní pufy lze personalizovat. Tak! Reklamní pufy a pufy sako můžete libovolně personalizovat! Umístíme na ně vaši grafiku nebo logo.
DELETE
Dodání včas Díky výrobě na místě jsme schopni připravit tvůj produkt vždy včas – bez dlouhého čekání na objednávku. Využíváme služeb prověřených a důvěryhodných kurýrů, což zajišťuje bezpečné a včasné dodání přímo k tobě.
Rychlé dodání Díky vlastní výrobě máme plně pod kontrolou celý dodací proces. Vaší akci tak nic nebrání ve včasné realizaci!
Stabilní stany, lehká konstrukce Používáme speciálně vybrané a nejvyšší kvality tkaniny, které pečlivě kontrolujeme před výrobou. Materiál je vodotěsný a odolný vůči roztržení, a navíc může být nehořlavý (podle normy DIN 4102-B1). Nemusíš se obávat příliš snadného poškození materiálu! Tkaniny jsou odolné vůči UV záření (podle normy DIN 16525 a škály “vlněné”).
Stabilní konstrukce Tam, kde ostatní drží své stany, aby neuletěly, se Vy můžete v klidu soustředit na důležitější věci. Odolnost našich vybraných stanů je až do 100 km/h rychlosti větru!
Kontaktujte nás, a my vám pomůžeme s výběrem a poradíme! Potřebujete pomoc event manažera při výběru vybavení? Nebo se chcete dozvědět více o stanu? Kontaktujte náš tým odborníků, kteří odpoví na každou vaši otá
Nejste si čímkoliv jistí? Kontaktujte nás a probereme detaily! K dispozici je Vám celý obchodní tým vč. zákaznického servisu. Všichni sedíme v Brně, žádné zahraniční objednávky!
Bezpečně, rychle a přesně připravíme vaši objednávku
Profesionální a rychlé zpracování Vaší objednávky
VÝROBA: Po objednávce a schválení designu spouštíme výrobu, do které vstupují pouze bezvadné materiály. :: Naše produkty splňují evropské normy :: Expresní výroba do 5 dnů :: Zákaznický servis na telefonu i e-mailu
DOPRAVA: Před odesláním kontrolujeme všechny součásti Vaší objednávky a využíváme pouze osvědčené dopravce. :: Sledování zásilky :: Doručení po celé Evropě :: Zákaznický servis
SERVIS: Díky zaměření výroby na 100% kvalitu je životnost našich výrobků mnohdy více než 15 let, např. u hliníkových nůžkových stanů. Pokud dojde k jakémukoliv poškození, kontaktujte nás pro dodání náhradního dílu. :: Doručení dílu do 5 dnů :: Možnost posezónní repase :: Snadná výměna svépomocí
36 + let na trhu více než tři desetiletí zkušeností, rozvoje a poznávání vašich potřeb
11+ let na CZ / SK trhu během kterých jsme získali důvěru tisíců zákazníků