The Whistleblowers
McKenna, Brian. “The Agony of Flint: Poisoned Water, Racism and the Specter of Neoliberal Fascism.” Anthropology Now 10, no. 3 (2018): 45–58. https://doi.org/10.1080/19428200.2018.1591053.
The Whistleblowers
McKenna, Brian. “The Agony of Flint: Poisoned Water, Racism and the Specter of Neoliberal Fascism.” Anthropology Now 10, no. 3 (2018): 45–58. https://doi.org/10.1080/19428200.2018.1591053.
Ranging from:
Fennell, Catherine. “Are We All Flint?” Limn, no. 7 (July 2016): 21–21.
Lauren Collee. The Great Offline. Real Life, December 2021. URL: https://reallifemag.com/the-great-offline/ (visited on 2023-12-08).
I totally agree with her in this article. I think that the digital and real worlds are too interconnected now that it isn't possible to have a clean break between the two. She talks about how the real world and nature are overglamorized, by calling it pure and unihabited eden. This is a historical perspective that I honestly think is true. We live off the earth, and we rely on the ecosystems that it has in place to create a competitive advantage for humans. Now I believe we are fighting agaist our selves, and not survival. Which means we have turned into digital warfare.
Anya Kamenetz. Selfies, Filters, and Snapchat Dysmorphia: How Photo-Editing Harms Body Image. Psychology Today, February 2020. URL: https://www.psychologytoday.com/us/articles/202002/selfies-filters-and-snapchat-dysmorphia-how-photo-editing-harms-body-image (visited on 2023-12-08).
Kamenetz’s “Snapchat dysmorphia” – when individuals opt for cosmetic surgery so as to resemble their filtered self-portraits – illustrates how the harms identified by the CIDER analysis can be demonstrated. Users are seeing a manipulated version of what they may believe is an improved version of themselves because of the way in which the filters were built. At no point during the design process does this premise get questioned. Likewise, there is no even distribution of the costs associated with the premises (i.e., those who already have body-image issues or suffer from depression will experience the negative consequences far greater than others). This relates closely to the chapter’s assertion that increasing accessibility to a tool known to produce harm is a morally wrongful action.
Anya Kamenetz. Facebook's own data is not as conclusive as you think about teens and mental health. NPR, October 2021. URL: https://www.npr.org/2021/10/06/1043138622/facebook-instagram-teens-mental-health (visited on 2023-12-08).
In this article they explain that the research on teen's mental health on facebook and instagram are not as accurate since they are self reported and teen's already have an impression that social media can be harmful. They also explain the mixed feelings of social media because studies show that social media is harmful but there are also studies that show that social media is beneficial.
Rhitu Chatterjee. The new 988 mental health hotline is live. Here's what to know. NPR, July 2022. URL: https://www.npr.org/sections/health-shots/2022/07/15/1111316589/988-suicide-hotline-number (visited on 2023-12-08).
This article breaks down what the new 988 number actually does and why it matters beyond “just another hotline.” It shows how 988 is supposed to fix a big problem with mental health crises going through 911, where people often end up in chaotic ERs or in dangerous encounters with police instead of getting real support. What I found most useful is how it connects the simple idea of a 3 digit number to the huge amount of work behind the scenes: building up local and backup call centers, funding more staff, and creating mobile crisis teams so someone can actually show up and help in person.
Terry Gross. Director Bo Burnham On Growing Up With Anxiety — And An Audience. NPR, July 2018. URL: https://www.npr.org/2018/07/18/630069876/director-bo-burnham-on-growing-up-with-anxiety-and-an-audience (visited on 2023-12-08).
This article discussed director Bo Burnham's own issues growing up with anxiety and how they influenced him to make the film "Eighth Grade". Burnham explains that though he did not notice his anxiety in middle school, when the film takes place, it started to affect him starting in his sophomore year. He describes the feeling of pressure to perform because of his popularity gained from YouTube. He then realized that teen girls around the ages of 13-14 related to his feelings, which inspired him to create the film.
Jen Tribbet. Social Media Has Become A Place To Talk About Mental Illness. But Is That Helpful? NPR, November 2019. URL
This short podcast talks about sharing mental health issues on the internet, and poses questions how memes about mental health can trivialize it, and how posting about mental health can affect your opportunities down the line. It also talks about how you can find support from peers when you post online. One thing I think the story fails to include is the comments you are inviting when you post about your personal mental health online. While you can find support for mental health online, your peers are not professionals, and many are not kind. When you post about your personal mental health online, you invite all sorts of comments, including ones that are hurtful and might make things worse. I personally feel like social media, while it could be helpful for finding support in different communities, shouldn't be used as a reliable outlet for your struggles. People should go to their friends, families, and therapists, and find support in real life first and foremost.
Amanda Baughan. Make Peace with Social Media. Medium, May 2022. URL: https://amandabaughan.medium.com/make-peace-with-social-media-113877582006 (visited on 2023-12-08).
I can't really say that I really like this article- especially item 1, which basically states that one shouldn't blame oneself for their social media addiction because larger, systemics forces are the ones truly driving it. Granted, the part about the systemic forces is absolutely true, but that doesn't mean one should abandon all personal responsibility from the equation. As someone who probably uses too much social media, and is actively trying to reduce their yield, I don't think I would've made progress if I didn't feel bad about myself at least a bit. Of course, one shouldn't overdo and think they're a defective person for not being able to "detox" immediately (again, there were systemic forces working against you) but you shouldn't fall into idea that it isn't, at least, partially one's own fault and therefore within one's personal control.
“If [social media] was just bad, I’d just tell all the kids to throw their phone in the ocean, and it’d be really easy. The problem is it - we are hyper-connected, and we’re lonely. We’re overstimulated, and we’re numb. We’re expressing our self, and we’re objectifying ourselves. So I think it just sort of widens and deepens the experiences of what kids are going through. But in regards to social anxiety, social anxiety - there’s a part of social anxiety I think that feels like you’re a little bit disassociated from yourself. And it’s sort of like you’re in a situation, but you’re also floating above yourself, watching yourself in that situation, judging it. And social media literally is that. You know, it forces kids to not just live their experience but be nostalgic for their experience while they’re living it, watch people watch them, watch people watch them watch them. My sort of impulse is like when the 13 year olds of today grow up to be social scientists, I’ll be very curious to hear what they have to say about it. But until then, it just feels like we just need to gather the data.
I agree with this. I do believe that social media is making people more antisocial and causing more social anxiety to the people who are really on it. Like using it as their many source of friendship, I think is bad. I think you need to have friends in real life that you can interact with face to face. What he describes in the later part of the quote seems to me like depersonalization and not social anxiety, though. I haved dealt with some form of depersonalization, and it isn't fun at all.
Researchers at Facebook decided to try to measure how their recommendation algorithm was influencing people’s mental health. So they changed their recommendation algorithm to show some people more negative posts and some people more positive posts. They found that people who were given more negative posts tended to post more negatively themselves. Now, this experiment was done without informing users that they were part of an experiment, and when people found out that they might be part of a secret mood manipulation experiment, they were upset [m5]
This passage is powerful because it shows how social media algorithms can influence people’s emotions and behavior without them even realizing it. The example of Facebook’s experiment raises important ethical concerns about privacy, consent, and manipulation online. It also makes readers think more critically about how technology affects mental health and daily interactions.
And social media literally is that. You know, it forces kids to not just live their experience but be nostalgic for their experience while they’re living it, watch people watch them, watch people watch them watch them.
I like this because it connects social anxiety to the mechanics of feeds and likes. You’re not just doing something, but you’re also pre-imagining how it will look online and how people will react. That constant “watching yourself being watched” seems like it could intensify anxiety and make it harder to just be present.
For as long as we keep dumping our hopes into the conceptual pit of “the offline world,” those hopes will cease to exist as forces that might generate change in the worlds we actually live in together.
If they're saying that social media detoxes don't work, then what does? I personally feel like I am less connected to others when I am on social media because when I am with other people in real life I am on my phone more, and connecting with others who are in my life less. I think it's pretty disagreeable to say that being on social media means connection and not being on social media means isolation because I think the opposite is true considering that doomscrolling could take up the majority of someone's day.
eLife Assessment
This study shows that Znhit1, a regulator of chromatin and of the histone variant H2A.Z, is required for progression through meiotic prophase. It is an important observation that describes the role of epigenetics and gene expression during meiosis. The analysis is based on complementary approaches at the cytological, single-cell, and genomic levels that provide solid evidence for the role of Znhit1 in the control of gene expression and in the loading of H2A.Z in mouse spermatocytes.
Reviewer #1 (Public review):
Summary:
Sun et al. generated germline-specific cKO mice for the Znhit1 gene and examined its effect on male meiosis. The authors found that the loss of Znhit1 affects the transcriptional activation of pachytene. Znhit1 is a subunit of the SRCAP chromatin remodeling complex and a depositor of H2AZ, and in cKO spermatocytes, H2AZ is not deposited into the gene region. The authors claim that this is why the PGA was not activated. These findings provide important insights into the mechanisms of transcriptional regulation during the meiotic prophase.
Strengths:
The authors used samples from their original mouse model, analyzing both the epigenome and the transcriptome in detail using diverse NGS analyses to gain new insights into PGA. The quality of the results appeared excellent.
Comments on revisions:
Sun et al. have responded to each comment with great care and sincerity, and substantial improvements are evident.
In particular, the addition of scRNA-seq data from P35 samples appears to play an important role in supporting the authors' claims.
However, there is still room for improvement in the reanalysis of the data and in the Discussion section.
From the data perspective, for example, the authors state in line 347 of the revised manuscript that "We found that Znhit1-deficient spermatocytes phenocopied abnormal meiotic phenotypes observed in A-MYB mutants." However, the corresponding descriptions in the main text and figure legends are not sufficiently detailed, and therefore do not fully support or substantiate this interpretation. Incorporating a statistical comparison between DEGs in Znhit1-sKO and A-myb KO would likely strengthen this point.
Regarding the overall structure of the Discussion, the connections among delayed DSB repair, MSCI, and PGA regulation via H2A.Z remain somewhat descriptive and difficult to follow. This may reflect a lack of direct evidence linking these processes; however, a more logically structured and clearly articulated Discussion would improve clarity.
Reviewer #2 (Public review):
Summary:
The study demonstrates that Znhit1 regulates male meiosis, with deletion causing pachytene failure associated with defective expression of pachytene genes and subtle effects on X-Y pairing and DSB repair. The authors attribute this phenotype to the defective incorporation of the Znhit1 target H2A.Z into chromatin.
Strengths:
The paper and the figures are well presented and the narrative is clear. Evidence that the conditional deletion strategy removes Znhit1 is strong, with multiple orthogonal approaches used. Most of the meiotic phenotyping is well performed, and the omics analysis clearly identifies a dramatic effect on the meiotic gene expression program. The link to H2A.Z and A-MYB adds a mechanistic angle to the study.
Comments on revisions:
In the revision, the authors have addressed most of my comments. The only incomplete one is comment 1, where I asked them to define the stage of germ cell arrest by histology. I requested this because the stage of arrest they identified is so unique. They didn't do it, and instead used the scRNAseq to show a depletion at the late pachytene stage onwards. I guess it supports their main findings, but it's a bit disappointing.
Author response:
The following is the authors’ response to the original reviews.
Reviewer #1 (Public Review):
Summary:
Sun et al. generated germline-specific cKO mice for the Znhit1 gene and examined its effect on male meiosis. The authors found that the loss of Znhit1 affects the transcriptional activation of pachytene. Znhit1 is a subunit of the SRCAP chromatin remodeling complex and a depositor of H2AZ, and in cKO spermatocytes, H2AZ is not deposited into the gene region. The authors claim that this is why the PGA was not activated. These findings provide important insights into the mechanisms of transcriptional regulation during the meiotic prophase.
Strengths:
The authors used samples from their original mouse model, analyzing both the epigenome and the transcriptome in detail using diverse NGS analyses to gain new insights into PGA. The quality of the results appeared excellent.
Weaknesses:
Overall, the data is inconsistent with the authors' claims and does not support their final conclusions. In addition, the sample used may not be the most suitable for the analysis, but a more suitable sample would dramatically improve the overall quality of the paper.
Thank you for your comprehensive summary of our study and your thoughtful insights into its strengths and weaknesses. We greatly appreciate this valuable feedback, which helps us further improve our work. Below, we provide a detailed response addressing each of the points you raised.
Reviewer #1 (Recommendations For The Authors):
Major revisions:
Surprisingly, many genes were upregulated in the scRNA-seq results. How many XY genes are included? Discuss why many genes are up-regulated in Fig. 5E whereas bulk RNA-seq showed only 70 genes were down-regulated. Since apoptosis-related factors are up-regulated in Fig5E, could these up-regulated genes be due to the high content of the transcriptome of dead cells? As you know, cell death starts, but randomly and violently disrupts the transcriptome, so we think it is not desirable to analyze the transcriptome with dead cells in the mix. Describe this point appropriately in the text or generate new data without dead cells.
We sincerely appreciate the reviewer’s critical points. Below, we address each point sequentially:
(1) To address the question about XY-linked genes, we utilized scRNA-seq data to identify differentially expressed sex chromosome genes in spermatocytes at different stages. Our analysis revealed an aberrant activation of XY-linked genes relative to controls. Specifically, 120 XY-linked genes were aberrantly activated in zygotenestage spermatocytes, and 119 XY-linked genes showed aberrant activation in pachytene-stage spermatocytes (revised Fig. 4F). This observation directly indicates that Znhit1 knockout impairs Meiotic Sex Chromosome Inactivation (MSCI), a finding that aligns with our prior characterization of XY chromosome synapsis defects in Znhit1-deficient spermatocytes.
(2) Two key reasons explain the discrepancy between scRNA-seq and bulk RNA-seq results:
First, scRNA-seq employs a more permissive threshold for identifying DEGs (log2 fold change [log2FC] = 0.25), thereby enhancing sensitivity to subtle expression changes and enabling the detection of more upregulated genes. In contrast, bulk RNAseq uses a stricter threshold (log2FC = 1), which filters out these subtly upregulated transcripts, resulting in fewer DEGs overall.
Second, scRNA-seq can capture cell subset-specific differential expression. In contrast, bulk RNA-seq averages signals across mixed cells, masking such subsetspecific expression changes.
These clarifications have been included in the Data Analysis section of the revised manuscript.
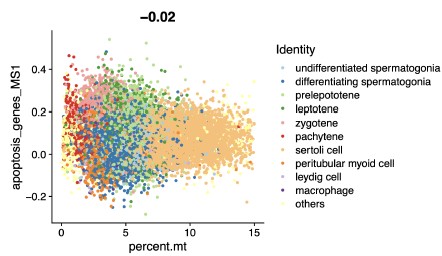
(3) We fully agree with the reviewer’s concern that dead cells could confound transcriptomic analyses. Before downstream analysis, we excluded non-viable cells via stringent QC: cells with mitochondrial RNA (mtRNA) content exceeding 15% were removed, as high mtRNA content is a well-established marker of cell death or compromised viability. To further validate that upregulated genes were not driven by dead cell contamination, we analyzed the correlation between the expression of apoptosis-related genes and mtRNA fractions in our data. This analysis revealed no significant correlation (Pearson correlation coefficient, r = -0.02; please see Author response image 1). These results collectively rule out dead cell transcriptome contamination as the primary cause of the observed gene upregulation.
Author response image 1.
Scatter Chart showing the Pearson correlation between apoptosisrelated genes and mitochondrial RNA fractions in scRNA-seq data.
Line 280-286: The data in Figures 7I and J are confusing: as shown by KAS-seq, it is natural that ssDNA is not formed in the promoter region in Znhit1-cKO sample because transcription does not proceed, but why is ssDNA formed in the enhancer region in the first place in control and then lost in Znhit1-cKO sample? Generally, it is said that in the enhancer region, including the super-enhancer region, doublestranded DNA is not dissociated, thus not forming ssDNA. Discuss why the loss of ssDNA in the enhancer region affects transcription with appropriate citations. Also, show whether genes downstream of the missing ssDNA in the promoter region have abnormal transcriptional activity, along with the RNA-seq data. Furthermore, in the region shown in Figure 7I, why the chromatin is even more open, as shown by ATACseq in Znhit1-cKO. Discuss whether this is related to transcriptional progression or aberrant substitution with H2A. If the function of ZNHIT1 is to replace H2A with H2AZ for PGA, it is not necessary to show the H2A level in Znhit1-cKO.
We appreciate the reviewer’s constructive comments.
(1) ssDNA dynamics in enhancer regions: Emerging evidence demonstrates that active enhancers undergo transient DNA unwinding to form ssDNA, a process critical for transcriptional regulation by transcribing enhancer RNAs (eRNA). KAS‑seq is sufficiently sensitive to detect ssDNA in enhancer regions (Kim et al., 2010; Wu et al., 2020). It has been shown that H2A.Z (deposited by the ZNHIT1-SRCAP complex) is required for maintaining enhancer accessibility and dynamic unwinding (Sporrij et al., 2023). In this study, we found that Znhit1 deletion and defective H2A.Z incorporation impaired enhancer ssDNA formation, indicating that ZNHIT-H2A.Z plays an important role in the activity of both promoter and enhancer.
(2) Impact of ssDNA loss on transcription: To address how missing ssDNA affects transcriptional activity, we further analyzed changes in KAS‑seq signals following Znhit1 knockout. Overall, KAS‑seq signals were significantly reduced upon Znhit1 depletion, confirming that Znhit1 is essential for ssDNA formation. Further examination of KAS‑seq signals at promoters of downregulated genes also revealed reduced signals (revised manuscript, Fig. S8). In contrast, KAS-seq signals of upregulated genes remained relatively low and showed no changes in both the control and knockout groups, and their upregulation probably results from indirect regulation. These results underscore the importance of ZNHIT1-mediated chromatin states in regulating ssDNA formation and gene expression.
(3) Aberrant chromatin openness in Znhit1-cKO (ATAC-seq): The increased chromatin accessibility detected by ATAC-seq likely represents a disorganized, nonfunctional state rather than productive transcriptional openness. H2A.Z normally constrains chromatin dynamics to facilitate ordered transcriptional regulation (Cole et al., 2021); its absence in Znhit1-cKO leads to higher ATAC-seq signals, suggesting that this aberrant openness fails to support proper assembly of the transcriptional machinery.
Minor revisions:
Line 106. The text says that they looked for chromatin factors, but the legend says that they looked for epigenetic factors. The text must be consistent.
We have corrected it in the revised manuscript (line 801).
Line 107. Although it is stated that the transcriptional data published here were used, it appears from the cited references that they are scRNA-seq data. A clear explanation is required in the text or legend.
We have revised this data as scRNA-seq data (line 107).
Line 141-143: Using TUNEL analysis in Figure 4F, the authors show that Znhit1cKO testis cells contain many dead cells. Describe the type or stage of the apoptotic cells.
We appreciate the reviewer’s suggestion. Specifically, we performed TUNEL staining on testes isolated from P14 mice, a critical time point for pachytene development (revised Fig. 2D). We tested this by showing that apoptosis-related genes were significantly upregulated in pachytene-stage spermatocytes in scRNA-seq data (revised Fig. 4D). To further validate this observation, we performed scRNA-seq from P35 testis samples. The results revealed a significant reduction in late pachytene-stage spermatocytes in Znhit1-cKO samples (revised Fig. 2F), consistent with apoptotic loss of pachytene cells. Collectively, these data confirm that Znhit1 knockout impairs pachytene-stage spermatocyte development.
The authors claimed that the loss of Znhit1 lowers the transcription of a group of genes involved in homologous recombination, including Rnf212, causing a delay in homologous recombination; however, if the process of homologous recombination is delayed, homologous chromosome pairing and synapsis are affected unless DSB repair is completed. Provide a satisfactory explanation for the fact that DNA damage remains on autosomes despite complete synapsis, as shown in Figure 3C, which is likely not solely due to delayed homologous recombination.
Thank you for this insightful comment. We fully agree that persistent autosomal DNA damage cannot be explained solely by delayed homologous recombination. To resolve this question, we further analyzed autosomal synapsis through SYCP1 and SYCP3 staining. While autosomal synapsis appeared morphologically complete, we identified subtle but significant synapsis defects in autosomal terminal regions (revised Fig. 3A). This suggests that Znhit1 knockout also results in autosomal synapsis defects. We speculate that these synapsis defects are associated with the unresolved autosomal DNA damage we observed.
Lines 150-163. With regard to XY unpairing in Znhit1-cKO pachytene spermatocytes, there is insufficient discussion as to whether this is due to transcriptional aberrations.
Thank you for highlighting the need to link transcriptional aberrations to XY unpairing in Znhit1-cKO pachytene spermatocytes. To address this, we analyzed sex chromosome transcription using scRNA-seq data. Relative to controls, 120 XYlinked genes were aberrantly activated at zygotene, and 119 were upregulated at pachytene in Znhit1-cKO spermatocytes (revised Fig. 4F), directly demonstrating Znhit1 knockout disrupts Meiotic Sex Chromosome Inactivation (MSCI). Given that intact MSCI is required to stabilize XY synapsis in pachytene spermatocytes, we conclude that the observed XY unpairing is likely a direct consequence of these sex chromosome transcriptional abnormalities. We add this information to the revised manuscript (lines 221-226).
Line 187-194. Analysis of the scRNA-seq data is shown in Figure 4, but it lists several genes as stage-specific markers, some of which do not have well-understood meiotic functions. Please cite a reference paper that provides sufficient evidence to qualify this stage.
In response to this comment, we have refined the presentation of marker genes used for cell annotation (revised Fig. S4B). We have incorporated relevant references supporting their utility as stage-specific markers for the meiotic stages (line 187).
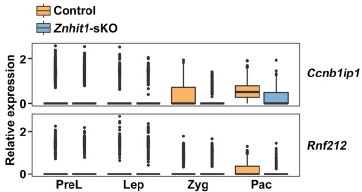
Line 225-233: If Znhit1 is important for H2AZ deposition and regulates PGA through it, how does it regulate HR-related genes that are expressed earlier through H2AZ deposition during the pachytene stage? For example, Rnf212 is not specifically expressed during the pachytene stage but is one of the targets of MEIOSIN, so it is expressed at an earlier stage.
Thank you for this insightful comment. We fully acknowledge the reviewer’s key observation that HR-related genes such as Rnf212 are MEIOSIN targets that initiate transcription at earlier meiotic stages, before the pachytene stage. Our stage-resolved scRNA-seq data further showed that the expression of Ccnb1ip1 and Rnf212 was significantly upregulated from zygotene to pachytene, following their initial transcriptional onset. We next showed that the loss of H2A.Z deposition induced by Znhit1 deletion specifically impaired this pachytene-specific secondary transcriptional activation, rather than the early MEIOSIN-driven expression onset (please see Author response image 2).
Author response image 2.
Plots showing the expression level of indicated genes in scRNAseq data.
Line 245-251: As shown in Figure 6E, more than 14,000 genes have H2AZ peaks. In contrast, only approximately 60% of the genes downregulated by Znhit1-cKO appeared to be directly affected by H2AZ. Are the remaining 40% of genes regulated in a different way that is not mediated by H2AZ? Also, only a few percent of the genes with H2AZ peaks are affected, but why are only genes with A-MYB involvement affected, as shown in Figure 7?
Thank you for these insightful and constructive comments. For the ~40% of downregulated genes not directly linked to H2A.Z, they were likely regulated through indirect mechanisms. H2A.Z deposition mediated by ZNHIT1 may influence upstream transcriptional regulators (e.g., transcription factors or coactivators), whose dysregulation in turn affects these genes.
The selective effect of H2A.Z loss on A-MYB target genes is explained by the strict context-dependent function of H2A.Z, which requires stage-specific partner transcription factors to exert its regulatory activity. During the zygotene-to-pachytene transition, A-MYB acts as the master regulator of pachytene gene activation and forms a functional collaborative complex with H2A.Z to drive target gene transcription. Disrupted H2A.Z deposition upon Znhit1 deletion specifically impairs the activity of this A-MYB-H2A.Z complex, leading to selective downregulation of A-MYB targets. Other H2A.Z peak-associated genes may rely on alternative cofactors and compensatory mechanisms.
Line 245-256: Figures 6 and F show that the localization of H2AZ is reduced in Znhit1-cKO mice, which means that no substitution with H2A occurs. If so, show it in the data because the localization of H2A should be increased compared to that in the control.
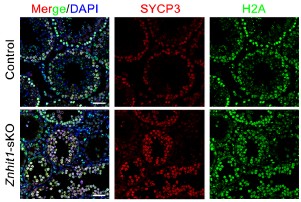
To clarify the status of H2A, we have now detected immunofluorescent staining against H2A. While H2A.Z deposition was clearly impaired following Znhit1 deletion, the global level of H2A did not change significantly (Author response image 3). We speculate that this observed absence of a compensatory increase in H2A is likely due to the intrinsically low abundance of the histone variant H2A.Z relative to canonical histone H2A under physiological conditions.
Author response image 3.
Immunostaining of SYCP3 and H2A in spermatocyte testis sections of control and Znhit1-sKO mice, Scale bar, 40 μm.
Reviewer #2 (Public Review):
Summary:
The study demonstrates that Znhit1 regulates male meiosis, with deletion causing pachytene failure associated with defective expression of pachytene genes and subtle effects on X-Y pairing and DSB repair. The authors attribute this phenotype to the defective incorporation of the Znhit1 target H2A.Z into chromatin.
Strengths:
The paper and the figures are well presented and the narrative is clear. Evidence that the conditional deletion strategy removes Znhit1 is strong, with multiple orthogonal approaches used. Most of the meiotic phenotyping is well performed, and the omics analysis clearly identifies a dramatic effect on the meiotic gene expression program. The link to H2A.Z and A-MYB adds a mechanistic angle to the study.
Weaknesses:
(1) Current literature demonstrates that meiotic mutants arrest at one of two stages: midpachytene (stage IV of the seminiferous cycle) or metaphase I (stage XII of the seminiferous cycle). This study documents that in the Znhit1 KO the midpachytene marker H1t appears normally, but that cells arrest before diplotene. If this is true, then arrest must occur during late pachytene, which based on my knowledge has never been documented for a meiotic KO. To resolve this, the authors should present stronger histological substaging evidence to support their claim.
Thank you for this insightful and constructive comment. To achieve highresolution tracking of cell lineage progression, we performed scRNA-seq analysis using P35 testes in this revised manuscript. scRNA-seq data showed that germ cells normally progressed through all meiotic stages and successfully gave rise to spermatids in control groups. By contrast, in the Znhit1 knockout group, late pachytene spermatocytes decreased significantly, and only very few subsequent germ cell types were observable (revised Fig. 2F, G). In scRNA-seq data, although very few diplotene spermatocytes and meiotic metaphase I cells were detectable, these cells still appeared abnormal, as evidenced by their extremely low Pou5f2 expression. We have revised our description of the meiotic arrest stage in the manuscript.
(2) The authors overlooked the possible effects of Znhit1 deletion on MSCI. Defective MSCI is a well-established cause of pachytene arrest. Actually, the fact that they see X-Y pairing failure should alert them even more strongly to this possibility because MSCI failure is often associated with defective X-Y pairing. This could be easily addressed by examination of their RNAseq data.
To address the concern that Znhit1 deletion may impact Meiotic Sex Chromosome Inactivation (MSCI), we analyzed XY-linked gene expression using scRNA-seq data from spermatocytes at distinct stages. Our analysis revealed aberrant activation of XY-linked genes in Znhit1-CKO spermatocytes relative to controls. Specifically, 120 XY-linked genes were activated at zygotene, and 119 XY-linked genes were upregulated at pachytene (revised Fig. 4F). This observation directly demonstrates that Znhit1-CKO impairs MSCI, which aligns with our prior characterization of defective X-Y chromosome synapsis in Znhit1-deficient spermatocytes. To explicitly resolve this concern, we have integrated these MSCIfocused RNA-seq analyses into the revised Results section (lines 221-226).
(3) The recombination assays need attention.
In the text the authors state that they studied RPA2 and DMC1, but the figures show RPA2 and RAD51.
The RPA counts are not quantitated.
The conclusion that crossover formation fails (based on MLH1 staining) is not justified. This marker does not appear in wt males until late pachytene, so if cells in this mutant are dying before that stage, MLH1 cannot be assessed.
The authors state that gH2AZ persists in the KO, but I'm not convinced that they are comparing equivalent stages in the wt and KO. In Figure 3C, the pachytene cell is late, whereas in the mutant the pachytene cell is early or mid (when residual gH2AX is expected, even in wt males).
Previous work (PMID: 23824539) has shown that antibodies reportedly detecting pATM in the sex body are non-specific. I therefore advise caution with the data shown in Figure 3D.
We appreciate the reviewer’s detailed feedback on our recombination assays and have addressed each concern as follows:
(1) Discrepancy between text and figures (RPA2/DMC1 vs. RPA2/RAD51): We have corrected this in the revised manuscript.
(2) Quantitation of RPA2 foci: We have supplemented quantitative analysis of RPA2 foci (revised Fig. S3).
(3) Conclusion on crossover failure: Single-cell RNA sequencing data from P35 testes definitively confirmed that Znhit1 knockout spermatocytes successfully progressed to the late pachytene stage, ruling out the possibility that our MLH1 staining results are confounded by cell death or arrest before this critical stage. In addition, analysis of transcriptome datasets revealed significant downregulation of important genes required for homologous recombination and crossover formation, including Ccnb1ip1 and Rnf212. Reduced expression of these essential factors may impair the assembly of MLH1 crossover foci. These data demonstrate that ZNHIT1 is essential for proper homologous recombination and crossover formation during male meiosis. We have revised the text to emphasize this context.
(4) γH2AX persistence and stage matching: We have replaced the images with more representative, stage‑matched pachytene spermatocytes from wild‑type and Znhit1‑KO mice (revised Fig. 2C). Furthermore, prompted by the insightful comment from Reviewer 1, we carefully re‑examined autosomal synapsis and identified abnormal synapsis specifically at the terminal regions of autosomes in Znhit1‑deficient spermatocytes (revised Fig. 3A). These data together confirm that ZNHIT1 is essential for DSB repair during male meiotic prophase I.
(5) pATM staining issue: Following the reviewer’s advice, we carefully reviewed the relevant literature (PMID: 23824539) and confirmed that the anti‑pATM antibody may exhibit non‑specific staining on the XY chromosomes. Accordingly, we have removed the pATM staining data presented in Figure 3D from the revised manuscript to ensure the accuracy and rigor of our results.
(4) RNAseq data. The authors show convincingly that Znhit1 activates genes that are normally upregulated at the zyg-pachytene transition. They should repeat the analysis for genes normally upregulated at the prelep- lep and lep-zyg transition to show that this effect is really pachytene-gene specific.
We appreciate this suggestion. To clarify the stage specificity of ZNHIT1’s regulatory role, we analyzed genes upregulated at the prelep-lep and lepzyg transitions. Our results showed that Znhit1 knockout had little impact on the overall expression levels of these genes (as shown in revised Fig. 4B). In contrast, as we previously reported, genes upregulated at the zygotene-pachytene transition were remarkably downregulated in Znhit1-cKO. These findings further confirm the specificity of ZNHIT1 in regulating pachytene gene expression.
(5) I am puzzled that the title and overall gist of the study focuses on H2A.Z, when it is Znhit1 that has been deleted.
We appreciate the reviewer’s observation and have revised the study title as suggested. Specifically, the title is now updated to “ZNHIT1-dependent H2A.Z deposition at meiotic prophase I underlies pachytene gene expression and meiotic progression during male meiosis.”
Reviewer #3 (Public Review):
Summary:
Sun et al. present a manuscript detailing the phenotypic characterization of loss of Znhit1 in male germ cells. Znhit1 is a subunit of the chromatin regulating complex SRCAP that functions to deposit the histone variant H2A.Z. Given that meiosis, and specifically meiotic recombination, occurs in the context of the dynamic condensing of chromosomes, the role of chromatin regulators in general, and histone variants specifically, in mammalian meiosis is an active area of research. Previous work has shown that H2A.Z is found at the locations of recombination in plants, although H2A.Z was previously not found at recombination sites in mammalian meiosis. Here the authors use a conditional approach to ablate Znhit1 in spermatocytes and characterize a block in meiosis in prophase I in the transition from pachytene to diplotene stage.
Strengths:
The authors combine current methods in immunohistochemistry and functional genomics to provide strong evidence of meiotic block upon the loss of Znhit1. They find that loss of Znhit1 leads to reduced incorporation of the histone variant H2A.Z, specifically at promoters and enhancers. Further, RNA sequencing found more genes are down-regulated upon loss of Znhit1 compared to upregulated, suggesting that incorporation of H2A.Z is critical for the expression of genes necessary for successful meiotic progression.
A strength of the manuscript is tying the locations of changes in H2A.Z deposition with binding of the transcription factor A-MYB, providing a mechanism that can potentially combine the changes in chromatin regulation with variable binding of a transcription factor in gene expression in pachytene stage spermatocytes.
Weaknesses:
A weakness in the single-cell RNA experiment using cells from 16-day-old male mice. The authors suggest that the rationale for the experiment was to determine where the Znhit1-sKO mutant showed an arrest in meiosis, and claim that this is the pachytene stage. However, in the 'first wave' of meiosis 16-day-old mice are just beginning to enter pachytene, so cells from later meiotic stages will be largely absent in these tubules. This is clear from the UMAP showing a similar pattern of cell distributions between wild-type and mutant mice. Using older mice would have better demonstrated where the mutant and wild-type mice differ in cell-type composition.
We appreciate the reviewer’s constructive comment. To resolve this issue, we have added new scRNA‑seq data from testes of P35 mice, which harbor a full spectrum of meiotic stages, including late pachytene, diplotene, metaphase I spermatocytes, and post-meiotic spermatids. Compared with wild-type controls, Znhit1-sKO testes exhibited a marked reduction in late pachytene spermatocytes and a near-complete loss of post-pachytene cell types, directly validating the pachytenestage meiotic arrest (revised Fig. 2F, G). All updated analyses have been integrated into the manuscript to strengthen our conclusions.
The authors use the term pachytene genome activation (PGS) in the manuscript to suggest a novel process by which genes are specifically increased in expression in the pachytene stage of meiotic prophase I, without reference to literature that establishes the term. If the authors are putting forward a new concept defined by this term, it would strengthen the manuscript to describe it further and delineate what the genes are that are activated and discuss potential mechanisms.
We appreciate the reviewer’s valuable feedback on our use of the term "pachytene genome activation (PGA)".
To address this, we have revised the text to explicitly frame PGA as a stage-specific transcriptional program observed in our data, defined by the coordinated upregulation of a distinct set of genes during the pachytene stage of meiotic prophase I.
(1) Definition and Gene Set: Using the scRNA-seq dataset, we formally defined PGA as the transcriptional wave characterized by genes with increased expression in pachytene vs. zygotene spermatocytes (n = 1,560 genes). Functional enrichment analysis shows these genes are primarily involved in DNA repair, cilium organization, and spermatid development (Table S3), consistent with the biological process of germ cell development.
(2) Relationship to existing literature: While PGA as a term is not widely established, our data align with prior observations of pachytene-specific transcriptional upregulation (Alexander et al., 2023; Ernst et al., 2019; Turner, 2015). Importantly, Alexander et al reveals that in late meiotic stages, starting from pachynema, chromatin has a ~3-fold increase in transcription. We have added these citations to clearly illustrate the relevant advances in the field (lines 68-71).
(3) Regulation of pachytene-stage gene expression: We further delineate that PGA is regulated by ZNHIT1-dependent H2A.Z deposition. Znhit1 deletion resulted in significant downregulation of 70.1% (1,094 out of 1,560) of these genes. This links PGA to chromatin-based regulation, where ZNHIT1-dependent H2A.Z deposition enables pachytene-specific transcription.
Generally speaking, the authors present solid evidence for a pachytene block in male germ cell development in mice lacking Znhit1 in spermatocytes. The evidence supporting a change in gene expression during pachytene, that more genes are downregulated in the mutant compared to increased expression, and changes in histone modification dynamics and placement of H2A.Z all support a role in alterations in meiotic gene regulation. However, the support that changes in H2A.Z impacting meiotic recombination (as suggested in the manuscript title) is less supported, rather than a general cell arrest in the pachytene stage leading to cell death. The conclusions around the role of Znhit1 influencing meiotic recombination directly could use further justification or mechanistic hypothesis.
We acknowledge the reviewer’s comments. Indeed, existing data support the presence of a pachytene block in spermatocytes of Znhit1-deficient mice, along with aberrant pachytene gene expression and impaired H2A.Z deposition.
In response, we made the following revisions: (1) we adjusted the manuscript title and conclusion to reduce emphasis on a direct H2A.Z-recombination link, and focus instead on ZNHIT1/H2A.Z in pachytene gene regulation and meiotic progression; (2) recombination defects may be indirect consequences of failed pachytene gene regulation, rather than a direct regulatory effect of ZNHIT1 on recombination machinery (lines 314-319).
Reviewer #3 (Recommendations For The Authors):
Quality of the images for meiotic spreads - images have low contrast and are tiny. It is difficult to see the SYCP3 results even when the images are magnified on the computer screen.
We have provided new images with high resolution to ensure a clear visualization of SYCP3 signals.
Line 165 - indicates the results for DMC1, although the figure suggests the results are for RAD51 foci.
We have corrected this mistake.
Line 306 - this manuscript 'confirms' that H2AZ is not found at mammalian recombination sites, a result already in the literature.
We have corrected this mistake (lines 309-312).
Reviewing Editor Comments:
Major points and revisions highlighted by the reviewers:
(1) Meiotic prophase in Znhit1KO: The main questions to clarify are the stage and status of progression, the analysis of apoptosis, and the consequences of gene expression on the X and Y. Additional analysis for DSB repair foci, gH2AX is also required. Those analysis are needed to answer to reviewer 2. Even if H2AZ was not detected at recombination hotspots, it may be possible that it plays a role in DSB repair but the level is too low for detection. This should be discussed as H2AZ was shown to be involved in DNA repair.
We sincerely appreciate the reviewing editor’s constructive comments.
(1) Stage and progression of meiotic prophase: We supplement P35 testes for scRNAseq. Results confirmed Znhit1-KO spermatocytes arrest at late pachytene, and postpachytene stages (diplotene, metaphase I) were nearly absent (revised Fig. 2F, G).
(2) Apoptosis analysis: We studied this by demonstrating that apoptosis-related genes were upregulated in pachytene spermatocytes at the single-cell level (revised Fig. 4D). To further validate this finding, we performed scRNA-seq analysis on P35 testis samples. Our results revealed a marked reduction in late pachytene spermatocytes in Znhit1-cKO testes (revised Fig. 2F, G), consistent with apoptotic depletion of pachytene-stage cells. Together, these data confirm that Znhit1 ablation impairs pachytene-stage spermatocyte development.
(3) X/Y gene expression consequences: To address this key point, we performed stage-resolved analysis of XY-linked gene expression using scRNA-seq data from different-stage spermatocytes. Compared with controls, we detected aberrant ectopic activation of XY-linked genes in Znhit1-KO spermatocytes: 120 XY-linked genes were inappropriately activated at zygotene, and 119 remained abnormally upregulated at pachytene (revised Fig. 4F). These results provide direct evidence that Znhit1 deletion impairs Meiotic Sex Chromosome Inactivation (MSCI).
(4) DSB repair issue: We have replaced the images with more representative, stage‑matched pachytene spermatocytes (revised Fig. 3C). The revised images show consistently increased γH2AX signals in Znhit1-KO spermatocytes. Prompted by Reviewer 1’s comment, we identified abnormal synapsis at autosomal terminal regions in mutant cells. Together, these results confirm that ZNHIT1 is essential for DSB repair during male meiotic prophase I.
(5) Potential role of H2A.Z in DSB repair: Though H2A.Z was nearly undetectable at recombination hotspots, we discuss two possibilities: (1) ZNHIT1-H2A.Z depletion dysregulated DSB repair-related genes; (2) Current ChIP-seq sensitivity may miss low-abundance H2A.Z at hotspots, which could support repair via chromatin remodeling. Future high-resolution assays (super-resolution imaging, DSB-targeted ChIP-seq) are proposed to validate this. We agree that recombination defects may be indirect consequences of failed pachytene gene regulation, rather than a direct regulatory effect of ZNHIT1 on recombination machinery.
(2) Gene expression analysis. The first consequence of H2AZ depletion is gene expression downregulation. However, it may be not surprising that some genes are down and others upregulated. There are likely secondary and indirect effects including the upregulation of some genes. The authors should explain and discuss this point such as to answer to questions raised by reviewer 1 and 2.
The primary consequence of H2A.Z depletion in pachytene spermatocytes is indeed widespread downregulation of genes. For the coexistence of upregulated genes, we explain this via three key points.
(1) Technical differences between scRNA-seq and bulk RNA-seq (addressing Reviewer 1): scRNA-seq captures cell-type-specific differentially expressed genes that bulk RNA-seq masks (bulk averages signals across mixed cells, hiding changes in rare subsets). Additionally, scRNA-seq uses a lower log2(fold change) threshold (0.25 vs. 1 in bulk RNA-seq), detecting subtle upregulations missed by bulk analysis.
(2) No dead cell contamination (addressing Reviewer 1): Stringent quality control excluded cells with >15% mitochondrial RNA. Apoptosis-related genes showed no significant correlation with mitochondrial RNA fractions (Pearson correlation coefficient, r = -0.02; please see Author response image 1), ruling out dead cell transcriptome interference.
(3) Secondary/indirect effects (addressing Reviewers 1 & 2): Upregulated genes likely result from indirect regulatory cascades. H2AZ depletion may disrupt upstream transcription factors, leading to compensatory upregulation of their downstream genes or cell stress responses to meiotic arrest. Notably, Znhit1 knockout specifically impacts genes upregulated at the zygotene-pachytene transition, while genes upregulated at preleptotene-leptotene or leptotene-zygotene transitions remain largely unaffected (revised Fig. 4B), confirming the specificity of H2A.Z’s direct regulatory role and framing upregulation as non-targeted indirect effects.
(3) The authors should also test the effect of Znhit1KO on the 1196 genes (up PreL/L) and 1325 (up L/Z) as shown in Figure 5D for the PGA. Also in Figure 5B, there is no evaluation of the statistical significance of the variation, this should be revised. X and Y genes should be analysed. KAS-Seq should be correlated with gene expression analysis, and several points as mentioned in the reviews below should be better explained and discussed.
(1) Effect of Znhit1-KO on PreL/L- and L/Z-upregulated genes: we analyzed the 1196 genes upregulated at the PreL/L transition and 1325 genes upregulated at the L/Z transition. Znhit1 knockout had minimal effect on the expression of these early meiotic gene sets (revised Fig. 4B), whereas genes activated at the zygotene‑pachytene transition were strongly downregulated in Znhit1-KO spermatocytes. These results confirm the specific role of ZNHIT1 in regulating pachytene‑stage gene expression. We have also added a statistical evaluation for the variation shown in Fig. 4B.
(2) X/Y-linked gene analysis: Analysis of stage‑resolved scRNA‑seq revealed aberrant ectopic activation of 120 XY‑linked genes at zygotene and 119 at pachytene in Znhit1-KO spermatocytes (revised Fig. 4F), demonstrating impaired Meiotic Sex Chromosome Inactivation (MSCI).
(3) KAS-seq correlation with gene expression: We analyzed the link between KAS‑seq signals and gene expression, and we found that Znhit1 depletion caused a global reduction in KAS‑seq signals, especially at promoters of downregulated genes (revised Fig. S8). Genes with increased expression showed low KAS‑seq signals in both control and mutant groups, likely reflecting indirect regulation. These results highlight the essential role of ZNHIT1 in transcriptional regulation.
(4) The title should refer to Znhit1, and the effect on meiotic recombination activities may be an indirect consequence of prophase progression arrest, even if some recombination genes are downregulated. This point is important as noted by reviewer 3.
We fully acknowledge Reviewer 3’s key point and have revised the manuscript title to “ZNHIT1-dependent H2A.Z deposition at meiotic prophase I underlies pachytene gene expression and meiotic progression during male meiosis” to reduce emphasis on a direct H2A.Z-recombination link.
Regarding meiotic recombination activities: The downregulation of recombinationrelated genes (e.g., Ccnb1ip1, Rnf212) stems from impaired pachytene-stage transcriptional programs caused by ZNHIT1-dependent H2A.Z deposition defects, which in turn leads to prophase progression arrest. Thus, the observed recombination abnormalities may be a secondary consequence of the meiotic prophase arrest, rather than a direct regulatory effect of ZNHIT1 on recombination machinery. This clarification has been integrated into the Discussion section (lines 314-318).
(5) The recent structural analysis of SRCAP should be cited: Yu et al. Cell Discovery (2024) 10:15 https://doi.org/10.1038/s41421-023-00640-1.
We have cited this reference in this revised manuscript (lines 234-236).
(6) The authors should read and answer the specific revisions asked for by the reviewers.
We have thoroughly read and systematically addressed all specific revisions requested by Reviewers 1, 2, and 3, as detailed in the revised manuscript and supplementary data.
References
Alexander, A.K., Rice, E.J., Lujic, J., Simon, L.E., Tanis, S., Barshad, G., Zhu, L., Lama, J., Cohen, P.E., and Danko, C.G. (2023). A-MYB and BRDT-dependent RNA Polymerase II pause release orchestrates transcriptional regulation in mammalian meiosis. Nature communications 14.
Cole, L., Kurscheid, S., Nekrasov, M., Domaschenz, R., Vera, D.L., Dennis, J.H., and Tremethick, D.J. (2021). Multiple roles of H2A.Z in regulating promoter chromatin architecture in human cells. Nature communications 12, 2524.
Ernst, C., Eling, N., Martinez-Jimenez, C.P., Marioni, J.C., and Odom, D.T. (2019). Staged developmental mapping and X chromosome transcriptional dynamics during mouse spermatogenesis. Nature communications 10, 1251.
Kim, T.K., Hemberg, M., Gray, J.M., Costa, A.M., Bear, D.M., Wu, J., Harmin, D.A., Laptewicz, M., Barbara-Haley, K., Kuersten, S., et al. (2010). Widespread transcription at neuronal activity-regulated enhancers. Nature 465, 182-187.
Sporrij, A., Choudhuri, A., Prasad, M., Muhire, B., Fast, E.M., Manning, M.E., Weiss, J.D., Koh, M., Yang, S., Kingston, R.E., et al. (2023). PGE(2) alters chromatin through H2A.Z-variant enhancer nucleosome modification to promote hematopoietic stem cell fate. Proceedings of the National Academy of Sciences of the United States of America 120, e2220613120.
Turner, J.M. (2015). Meiotic Silencing in Mammals. Annu Rev Genet 49, 395-412. Wu, T., Lyu, R., You, Q., and He, C. (2020). Kethoxal-assisted single-stranded DNA sequencing captures global transcription dynamics and enhancer activity in situ.
Nature methods 17, 515-523.
How can the art object help us to better understand time? How does time help us understand our own selves?
These questions seem more general than your focus, which seems to be: How can Bennett's short story help us understand how Black time shapes conceptions of Black selfhood.
Bennett refuses resolution because the temporal condition she is rendering does not resolve; it accumulates and persists. The reader is left with precarity, itself a condition of Black subjecthood. Jenks may have found closure,
How does Bennett refuse resolution, yet Jenks finds closure. Again, including textual evidence would help make this distinction.
“But the Seine goes on, and Seraigne continues to be happy, and the pain in one's chest grows no easier.”
Good use of quotation. Please insert a page reference.
that arrival
what arrival?
emory in the story functions not as nostalgia but as a mode of self-assembly —that same mode of self-production mentioned earlier— a process by which Jenks gathers the dispersed elements of his experience into something coherent enough to transmit.
This is a fascinating insight that requires textual evidence to be persuasive.
enks never leaves his room, yet he traverses considerable interior terrain, moving through the lives of those he has loved and the landscapes he has carried within him.
Perhaps a quotation showing how he traverses interior terrain could help illustrate this claim.
Jenks’ trajectory enacts precisely this negotiation: a reckoning with what it has meant to have been thrown into the world as this particular person, in this particular body, approaching this particular death. His becoming is inseparable from the historical c
This is very impressive reasoning and sophisticated language. It would be more persuasive if you found evidence from the text to show that Jenks is Black and that racial awareness is evident in the narrative.
That accumulation is, moreover, the very condition of Jenks’ becoming.
Accumulation of what?
Jenks’ temporal disorientation, his resistance to the consolations of either life or death as stable endpoints, marks him as a figure whose experience exceeds the categories available to represent it.
A bit hard to follow. By the time I get to "it," I've lost track of the referent. Can you simplify this sentence?
1920s Paris map overlayed on a satellite image of the city from May 7, 2026.
This is a cool effect, but how does it relate to the argument you're making? Frame your media the way you would quotations, explaining where they come from and how they support your argument.
“becoming,” o
use single quotation marks for a quote within a quote
olence while the
insert comma
Time here is not sequential but stratigraphic
Interesting geographic metaphor. You might want to define the term "stratographic" for those (like me) who aren't familiar with it.
Crucially, these temporalities coexist, accumulate, and resist the forward momentum that linear, progress-oriented conceptions of time demand.
This is so fascinating, and again, I find the photos from Bennett's childhood a bit distracting because not immediately relevant to the argument your making about this story.
“Tokens” insists that the Black subject’s experience of time as fragmented, layered, and resistant to resolution constitutes a distinct mode of being, one that linear, progress-oriented temporality actively forecloses.
excellent! Your prose is often clearer than your expert sources!
integrating it directly into discourses of Black aesthetic time and its conceptions of being.
This phrase dangles, so I'm not sure who's doing the integrating here.
that the hiatus of unrecognizability can spur new thought and new imaginings[...]” (1).
I have trouble understanding the the "hiatus of unrecognizability" (also missing quotation mark here?). Is it when something stops being unrecognizable? Sometimes it's better to put a key idea in your own words than to quote jargon out of context!
A ScrollyTeller of Gwendolyn Bennett's "Tokens" (published 1927).
Illuminating close reading wonderfully prepares me for analysis that follows. You do a great job pointing how prominent the theme of time is, especially at the end, when you offer this quotation: "When I die I want you to give it to her, if it's a thousand years from now…just a token of a time we were in love." And then follow it with the token of the radium clock. So clear, yet I never noticed until you pointed it out!
"Tokens" is scrupulously engaged with time: its immutability, its openness, and the possibility of self-forgiveness and closure within it. I argue that reading "Tokens" alongside theories of Black spatial temporality and aesthetic time allows readers to more fully engage with the nature of Black being at the center of the story. Through what Daphne Lamothe describes as aesthetic time’s capacity to hold an accumulation of Black temporalities—“from the experience and knowledge gleaned from history to the political urgencies of the present and the immediacy of subjective feelings and perceptions” (2)—Bennett situates Barnett outside the linear logic of normative time, and in doing so, generates a more complete and more honest picture of the Black subject.
very sophisticated, perceptive, and theoretically informed thesis.
The story is less interested in linear plot than in the texture of Jenks' consciousness: how a man in extremis makes meaning from the fragments of a life.
excellent! I actually find that your discussion of the story is so engrossing that the photos of Bennett are distracting. Consider taking them out after the initial bio to let us focus on the story. If you want visual interest, consider inserting a relevant and mood-setting quotation from the story, set off as a floating block.
period spent in jail.
not clear who spent time; consider changing to: and his time in jail
is equally as worthy of scholarly study.
why?
This dual experience of belonging and exile paired with creative flourishing and personal precarity
Might be clearer to say "dual experience of belonging and creative flourishing, combined with exile and personal precarity, threads itself..."
a years-long
Should be year-long
eLife Assessment
This potentially useful manuscript addresses the 3D chromatin architecture in monocytes from a few patients with alcohol-associated hepatitis and its relationship to enhanced transcription of innate immune genes. While the concept and methodological approach are interesting in principle, the evidence is incomplete as a result of inadequate sample sizes as well as other substantive analytical concerns.
Reviewer #3 (Public review):
In this manuscript, the authors use HiC to study the 3D genome of CD14+ CD16+ monocytes from the blood of healthy and those from patients with Alcohol-associated Hepatitis.
Overall, the authors perform a cursory analysis of the HiC data and conclude that there are a large number of changes in 3D genome architecture between healthy and AH patient monocytes. They highlight some specific examples that are linked to changes in gene expression. The analysis is of such a preliminary nature that I would usually expect to see the data from all figures in just one or two figures.
In addition, I have a number of concerns regarding the experimental design and the depth of the analyses performed that I think must be addressed.
(1) There is a myriad of literature that describes the existence of cell-type-specific 3D genome architecture. In this manuscript, there is an assumption by the authors that the CD14+ CD16+ monocytes represent the same population from both the healthy and diseased patients. Therefore, the authors conclude that the differences they see in the HiC data are due to disease-related changes in the equivalent cell types. However, I am concerned that the AH patient monocytes may have differentiated due to their environment so that they are in fact akin to a different cell type and the 3D genome changes they describe reflect this. This is supported by published articles, for example: Dhanda et al., Intermediate Monocytes in Acute Alcoholic Hepatitis Are Functionally Activated and Induce IL-17 Expression in CD4+ T Cells. J Immunol (2019) 203 (12): 3190-3198, in which they show an increased frequency of CD14+ CD16+ intermediate monocytes in AH patients that are functionally distinct.
I suggest that if the authors would like to study the specific effects of AH on 3D genome architecture then they should carefully FACsort the equivalent monocyte populations from the healthy and AH patients.
(2) The analysis of the HiC data is quite preliminary. In the 3D genome field, it is usual to report the different scales of genome architecture, for example, compartments, topologically associated domains (TADs) and loops. I think that reporting this information and how it changes in AH patients in the appropriate cell types would be of great interest to the field.
Comments on revisions:
In the revision the authors did not respond to my concerns which I believe still remain valid and compromise the author's conclusions of AH-specific effects on genome architecture.
Author response:
The following is the authors’ response to the original reviews.
Public Reviews:
Reviewer #1 (Public review):
Summary:
The authors investigate the relationship between 3D chromatin architecture and innate immune gene regulation in monocytes from patients with alcohol-associated hepatitis (AH). Using Hi-C technology, they attempt to identify structural changes in the genome that correlate with altered gene expression. Their central claim is that genome restructuring contributes to the hyper-inflammatory phenotype associated with AH.
Strengths:
(1) The manuscript employs Hi-C technology, which, in principle, is a powerful approach for studying genome organization.
(2) The focus on disease-relevant genes, particularly innate immune loci, provides a contextually important angle for understanding AH.
Weaknesses:
(1) Sample Size: The study relies on an exceptionally small cohort (4 AH patients and 4 healthy controls), rendering the results statistically underpowered and highly susceptible to variability.
(2) Hi-C Resolution unpaired to RNA seq: The data are presented at a resolution of 100kb, which is insufficient to uncover meaningful chromatin interactions at the level of individual genes. This data is unpaired.
(3) Functional Validation: The manuscript lacks experiments to directly link changes in chromatin architecture with gene expression or monocyte function, leaving the claims speculative.
(4) Data Integration: The lack of Hi-C with ATAC and RNA-seq data handicaps the analysis and really makes it superficial. In short, it does not convincingly demonstrate a functional relationship.
(5) Confounding Factors: The manuscript neglects critical confounding variables such as comorbidities, medications, and lifestyle factors, which could influence chromatin structure and gene expression independently of AH.
Appraisal of the Aims and Results:
The manuscript sets out to establish a connection between chromatin architecture and AH pathology. However, the study fails to achieve its stated aims due to inadequate methods and insufficient data. The conclusions drawn from the Hi-C analyses alone are poorly supported, and the lack of functional validation undermines the credibility of the proposed mechanisms. Overall, the results do not provide compelling evidence to substantiate the authors' claims.
Impact on the Field and Utility to the Community:
The work, in its current form, is unlikely to have a meaningful impact on the field. The limited scope, methodological shortcomings, and lack of robust data significantly diminish its potential utility. Without addressing these critical gaps, the study does not offer new insights into the role of genome architecture in AH or provide useful methodologies or datasets for the community.
Additional Context:
The manuscript would benefit from a more comprehensive analysis of potential mechanisms underlying the observed changes, including the interplay between chromatin architecture and epigenetic modifications. Furthermore, longitudinal studies or therapeutic interventions could provide insights into the dynamic aspects of genome restructuring in AH. These considerations are entirely absent from the current study.
Conclusion:
The manuscript does not achieve its stated goals and does not present sufficient evidence to support its conclusions. The limitations in sample size, resolution, and experimental rigor severely hinder its contribution to the field. Addressing these fundamental flaws will be essential for the work to be considered a meaningful addition to the literature.
Reviewer #2 (Public review):
Summary:
Dr. Adam Kim and collaborators study the changes in chromatin structure in monocytes obtained from alcohol-associated hepatitis (AH) when compared to healthy controls (HC). Through the usage of high throughput chromatin conformation capture technology (Hi-C), they collected data on contact frequencies between both contiguous and distal DNA windows (100 kB each); mainly within the same chromosome. From the analyses of those data in the two cohorts under analysis, authors describe frequent pairs of regions subject to significant changes in contact frequency across cohorts. Their accumulation onto specific regions of the genome -referred to as hotspots- motivated authors to narrow down their analyses to these disease-associated regions, in many of which, authors claim, a number of key innate immune genes can be found. Ultimately, the authors try to draw a link between the changes observed in chromatin architecture in some of these hotspots and the differential co-expression of the genes lying within those regions, as ascertained in previous single-cell transcriptomic analyses.
Strengths:
The main strength of this paper lies in the generation of Hi-C data from patients, a valuable asset that, as the authors emphasize, offers critical insights into the role of chromatin architecture dysregulation in the pathogenesis of alcohol-associated hepatitis (AH). If confirmed, the reported findings have the potential to highlight an important, yet overlooked, aspect of cellular dysregulation-chromatin conformation changes - not only in AH but potentially in other immune-related conditions with a component of pathological inflammation.
Weaknesses:
In what I regard as the two most important weaknesses of the work, I feel that they are more methodological than conceptual. The first of these issues concerns the perhaps insufficient level of description provided on the definition of some key types of genomic regions, such as topologically associated domains, DNA hotspots, or even DNA loci showing significant changes in contact frequency between AH and HC. In spite of the importance of these concepts in the paper, no operational, explicit description of how are they defined, from a statistical point of view, is provided in the current version of the manuscript.
Without these definitions, some of the claims that authors make in their work become hard to sustain. Some examples are the claim that randomizing samples does not lead to significant differences between cohorts; the claim that most of the changes in contact frequency happen locally; or the claim that most changes do not alter the structure of TADs, but appear either within, or between TADs. In my viewpoint, specific descriptions and implementation of proper tests to check these hypotheses and back up the mentioned specific claims, along with the inclusion of explicit results on these matters, would contribute very significantly to strengthening the overall message of the paper.
The second notable weakness of the study pertains to the characterization of the changes observed around immune genes in relation to genome-wide expectations. Although the authors suggest that certain hotspots contain a high number of immune-related genes, no enrichment analysis is provided to verify whether these regions indeed harbor a higher concentration of such genes compared to other genomic areas. It would be important for readers to be promptly informed if no such enrichment is observed, for in that case, the presence of some immune genes within these hotspots would carry more limited implications.
Additionally, the criteria used to define a hotspot are not clearly outlined, making it difficult to assess whether the changes in contact frequencies around the immune genes highlighted in figures 5-8 are truly more pronounced than what would be expected genome-wide.
Reviewer #3 (Public review):
In this manuscript, the authors use HiC to study the 3D genome of CD14+ CD16+ monocytes from the blood of healthy and those from patients with Alcohol-associated Hepatitis.
Overall, the authors perform a cursory analysis of the HiC data and conclude that there are a large number of changes in 3D genome architecture between healthy and AH patient monocytes. They highlight some specific examples that are linked to changes in gene expression. The analysis is of such a preliminary nature that I would usually expect to see the data from all figures in just one or two figures.
In addition, I have a number of concerns regarding the experimental design and the depth of the analyses performed that I think must be addressed.
(1) There is a myriad of literature that describes the existence of cell type-specific 3D genome architecture. In this manuscript, there is an assumption by the authors that the CD14+ CD16+ monocytes represent the same population from both healthy and diseased patients. Therefore, the authors conclude that the differences they see in the HiC data are due to disease-related changes in the equivalent cell types. However, I am concerned that the AH patient monocytes may have differentiated due to their environment so that they are in fact akin to a different cell type and the 3D genome changes they describe reflect this. This is supported by published articles for example: Dhanda et al., Intermediate Monocytes in Acute Alcoholic Hepatitis Are Functionally Activated and Induce IL-17 Expression in CD4+ T Cells. J Immunol (2019) 203 (12): 3190-3198, in which they show an increased frequency of CD14+ CD16+ intermediate monocytes in AH patients that are functionally distinct.
I suggest that if the authors would like to study the specific effects of AH on 3D genome architecture then they should carefully FACsort the equivalent monocyte populations from the healthy and AH patients.
(2) The analysis of the HiC data is quite preliminary. In the 3D genome field, it is usual to report the different scales of genome architecture, for example, compartments, topologically associated domains (TADs), and loops. I think that reporting this information and how it changes in AH patients in the appropriate cell types would be of great interest to the field.
We thank the reviewers for their careful and thorough examination of our manuscript. We agree with all of their comments regarding the limitations of the study. Many of the criticisms focus on the small sample size of our study (n=4 for healthy controls and disease patients) in both Hi-C and single-cell RNA-seq experiments, and that these experiments are unpaired, or in other words, PBMCs came from different patients for each experiment.
Unfortunately, these experiments are fairly complicated to perform, requiring patient cells and very expensive deep sequencing. We are not currently in a position to be able to easily or cost effectively increase sample size. In the case of Hi-C, we still believe our study to be of value as Hi-C is not a commonly used technique to study disease effects on chromatin, and very few studies have employed a large enough sample size to perform statistical comparisons. Additionally, to analyze the data at a higher resolution would require deeper sequencing, and unfortunately we do not have the resources to sequence these libraries deeper. Regarding the single-cell RNA-seq data, this dataset was generated for an earlier study [1] focusing on gene expression responses to LPS, and we were unable to get PBMCs from exactly the same patients to perform the Hi-C study.
We disagree that our study has limited scientific value. Our study is the first to use Hi-C to show that the 3D genome architecture of primary monocytes is changed in a disease context. The only other study to follow a similar approach performed Hi-C in monocytes from 2 healthy and 2 Systemic lupus erythematosus (SLE) patients, and in their study the data from both patients were combined prior to comparison. No statistics were performed and their conclusion was no differences in genome architecture due to disease. They did find differences between primary monocytes and the THP1 monocytic cell line, but this lacked statistical analysis. Their conclusion was that inflammatory disease may not lead to genome wide changes in architecture. Our study, though a very different disease than SLE, shows statistically significant differences between AH and healthy controls. We believe our study lays the groundwork for how Hi-C can be used to study genome architecture in human disease, and the possible downstream effects.
Confounding Factors: The manuscript neglects critical confounding variables such as comorbidities, medications, and lifestyle factors, which could influence chromatin structure and gene expression independently of AH.
This is an interesting suggestion. This dataset only contains 4 AH patients, which we have included basic clinical data in Supplemental Table 1, including Age, HCA1c, Bilirubin, AST, ALT, Creatinine, Albumin, and MELD score. 3/4 of these patients are severe AH while 1 is moderate (AH2). Despite one patient being moderate, all four AH patients had similar correlations with each other, suggesting these disease specific differences we observed are not indicative of severity. More patient samples are needed to determine if genome architecture changes throughout disease progression. We have added this important discussion to the manuscript (page 12, lines 5-14).
Recommendations for the authors:
Reviewer #2 (Recommendations for the authors):
The criteria used to determine which pairs of regions exhibit significant differences in contact frequency between alcohol-associated hepatitis (AH) and healthy controls (HC) are not disclosed. It would be beneficial for the authors to provide this information, including details such as the number of pairs tested, the nature of the statistical tests conducted, the method of multiple testing correction applied, as well as the significance thresholds used, and the number of loci-pairs below these thresholds for each chromosome. This information would greatly enhance the reader's understanding of the relevance of the reported findings.
Thank you for this comment, though we are not sure we totally understand. All of our statistics were performed using multiHiCcompare [2], where we input all 8 datasets (.hic files from Juicer), then measured statistical differences between defined groups (HC vs AH). For our randomization studies, we randomized the group comparisons, so each group contained a mix of HC and AH.
Second, a formal statistical definition of what constitutes a hotspot would be valuable for clarity.
Thank you for this suggestion. Initially, hotspots were defined as just regions of the genome with a high frequency of very significant differential contacts. We have defined a more formal definition of “hotspot” based on similar criteria. A hotspot is defined by both adjusted p value and frequency of locations. First, we filtered all pair-wise chromosomal interactions by a very, very stringent padj < 0.0000001 to focus on only the most changed coordinates (Supplemental Table 4). Then we looked for regions of the genome with a high frequency of these differential locations. Borders for each hotspot were determined more liberally by looking at the full list of differential spots (padj < 0.05). Then we used code to list genes within each interacting region. We have added these important details to the Methods (page 14, lines 11-14).
Third, a clear definition of the criteria used to identify different topologically associated domains (if these were indeed defined in the data and/or utilized in the analyses) would also be a helpful addition.
Thank you for this suggestion, we did not identify TADs or really utilize TADs in any of these analyses.
Likewise, several statements throughout the paper lack support from specific analyses, although it should be feasible to implement such analyses (or at least present them if they have already been conducted) to substantiate these claims:
If randomizing samples does not result in significant differences between (randomized) cohorts, it would be beneficial to provide insights into the number of loci pairs that exhibit differences in frequency when using both the actual and randomized cohorts.
Thank you for asking this question, as this is an important point. Using multiHiCcompare, if we compare WT (n=4) to AH (n=4), we get the results in the figures and supplementary data but if we randomize Group 1 (WT, WT, AH, AH) vs Group 2 (WT, WT, AH, AH), we get almost 0 significant changes in contact frequency. To show this more robustly, we performed 5 randomized comparisons and found far fewer changes in contact frequency between groups. This shows that these changes in contact frequency caused by disease are not random, but rather due to our real difference in AH. This point has been added to the Results (page 6, lines 15-17), and Methods (page 14, lines 16-21)
If most changes in contact frequency occur locally, it would be useful to visualize the relationship between effect sizes and/or significance levels for the observed differences in frequency in relation to the distance between the involved loci. Additionally, comparing these results to the average baseline contact intensities as a function of distance would be informative. This comparison could help determine whether the distance decay in effect size/significance for the differences between AH and HC is faster or slower than the decay rates for baseline contact frequencies.
This is a good suggestion. In our initial analysis, we made a number of figures relating chromosome positions, distance between loci, and statistics regarding the differential contact frequency. In the initial submission, we only showed Figure 3, which shows the logFC (log fold change) for the differential contact frequency by chromosomal position on both sides. To address this question, we have added a supplemental figure showing logFC as a function of the distance between two loci (new Supplemental Figure 3)
Similarly, the assertion that most changes do not affect the structure of topologically associated domains (TADs) but occur either within or between TADs should be supported by specific testing; otherwise, or else, removed.
Thank you, yes we have adjusted the language in the Discussion
Furthermore, the authors should clarify whether differences in chromatin conformation are more pronounced around immune genes compared to genome-wide expectations. If this is not the case, it would be helpful to quantify the intensity of these differences around the highlighted genes in relation to the rest of the genome. To achieve this, I would suggest the following:
Conduct enrichment analyses on the genes located within the most prominent hotspots to determine whether they are significantly enriched in immune genes (and, or, alternatively, in any other functional category).
Estimate the average absolute fold change in contact frequency within all topologically associated domains (TADs) identified in the study. This would allow for the identification of immune gene-containing TADs highlighted in Figures 5-8, providing readers with a quantitative understanding of how anomalously different these genomic regions are with regards to the magnitude of its alterations in AH, compared to the rest of the genome.
While some of the selected gene clusters appear to co-localize well with topologically associated domains (e.g., Figures 5A, 8A), others seemingly encompass either multiple TADs (Figure 6) or only portions of them (Figure 7). This should be clarified.
Thank you, this is a great suggestion. In order to be as unbiased as possible, we took all genes present in the regions with the highest significant changes in genome (Supplemental Table 4) that we used to identify the hotspots. And you are correct, we do in fact see enrichment of genes involved in innate immune signaling. This has been added to Results (page 7, lines 19-25) and Figure 4.
Finally, there are several minor issues concerning the figures that could be easily addressed to substantially enhance their readability:
Font sizes in most figures should be increased, particularly for some axis labels and tick marks. This issue affects most figures; for instance, in Figure 4, it hinders the reader's ability to interpret the ranges of the data presented.
Thank you, the figures have been adjusted
Figures 5 to 8 (panels A and B) would benefit significantly from a more consistent format. Specifically, the gene cluster boxes should also be included in the right panels, and the gene locations should be displayed on the left in a uniform format across all figures (e.g., formatting Figures 7 and 8 to match the style of Figures 5 and 6).
Figures 5 and 6 have a similar structure to each other because we were focusing on all of the genes in that chromosomal region. Figures 7 and 8 are different because we are focusing on how the region around a certain hotspot of interest changes.
It is also important to note that the genes plotted in Figures 8C and 8D are not the same. Concerning these two panels, it would be valuable to clarify whether the data presented pertains exclusively to monocytes. If so, information regarding the number of cells analyzed and the number of donors from which they were drawn would also be beneficial.
These figures are generated using scRNA-seq data. They represent all of the genes expressed in that region of the genome, in their chromosomal position. If a gene is not expressed in the scRNA-seq data, then it is not shown. I have debated with myself a lot on how to show gene expression in a region of the genome, but I think this is the clearest way to show this; including the genes that have no expression would make it more confusing. But yes, if you compare HC and AH, you see some differences in the list of genes. We have added more clarity to the figure legend for this figure.
References
(1) Kim, A., Bellar, A., McMullen, M. R., Li, X. & Nagy, L. E. Functionally Diverse Inflammatory Responses in Peripheral and Liver Monocytes in Alcohol-Associated Hepatitis. Hepatol Commun 4, 1459-1476 (2020). https://doi.org:10.1002/hep4.1563
(2) Stansfield, J. C., Cresswell, K. G. & Dozmorov, M. G. multiHiCcompare: joint normalization and comparative analysis of complex Hi-C experiments. Bioinformatics 35, 2916-2923 (2019). https://doi.org:10.1093/bioinformatics/btz048
eLife Assessment
This valuable study provides quantitative data and analysis to reveal that variations in Dorsal (Dl ) nuclear dynamics along the Dorso-ventral axis in the early Drosophila embryo are governed by Dl-Cactus nuclear interactions. The solid evidence partially supports a mechanism where nuclear localized Cactus contributes to the fraction of Dl that binds to DNA, but additional work will be necessary to confirm the claims and the biological significance of these findings.
Reviewer #1 (Public review):
Summary:
Al Asafen and colleagues here apply a set of scanning fluorescence correlation spectroscopic approaches (Raster Image Correlation Spectroscopy (RICS), cross-correlation RICS, and pair correlation function spectroscopy) to address the nucleo-cytoplasmic kinetics of the Dorsal (Dl) transcription factor in early Drosophila embryos. The Toll/Dl system has long been appreciated to establish dorsal-ventral polarity of the embryo through Toll-dependent control of Dl nuclear localization, and represents one of a handful of model morphogen gradients produced with high enough precision to yield robust biophysical measurements of general transcription factor activity and function. By measurement of GFP-tagged Dl protein, either in wild-type embryos, or in mutant embryos with low/medium/high levels of Toll signaling, the authors report diffusivity of Dl in nuclear and cytoplasmic compartments, as well as the fraction of mobile and immobile Dl, which can be correlated with DNA binding through cross-correlation RICS. A model is presented where Cactus/IkB is implicated in preventing Dl from binding to DNA.
Strengths:
The study uses raster image correlation spectroscopy approaches to measure biophysical components of the Dl gradient in Drosophila embryos. It convincingly demonstrates a positive correlation between Toll pathway activity and the fraction of bound Dl in the nucleus. RICS methodology has widespread potential applications in cell and developmental biology, and this study will contribute to its adoption.
Weaknesses:
The study seeks to test a hypothesis for how the Toll pathway may limit Dl DNA binding in the nucleus. This experiment, while producing initial support for a role of nuclear Cactus, is confounded by co-expression of wild-type Dl, thus limiting the interpretation of the experimental results.
Reviewer #2 (Public review):
Summary:
In this manuscript, Al Asafen, Clark et al. use fluorescence correlation spectroscopy (FCS) to quantitatively analyze the mobility of Dl along the DV axis of the early Drosophila embryo. Dl is essential for dorsal-ventral (DV) patterning and its gradient initiates the activation of several genes and thereby orchestrates the formation of the Drosophila body plan. While the mechanisms underlying Dl gradient formation have been extensively studied, there are some observations for which there is not yet a mechanistic explanation. For example, the peak of the Dl gradient grows continuously during nuclear cycles 10-14. This is likely due to Cact-dependent Dl diffusion and Dl binding to DNA. But the biophysical parameters governing Dl nuclear dynamics that would support these claims have not been previously measured. In this work, the authors separated GFP-tagged Dl into a mobile and an immobile pools. Interestingly, the fraction of immobile Dl is position-dependent, revealing more binding to DNA in ventral than in dorsal nuclei. This is either due to higher binding affinity in ventral locations (due to Toll-dependent Dl phosphorylation) or to higher Dl-Cact binding in dorsal nuclei that would prevent Dl to bind DNA. Using specific dl alleles, authors support the latter hypothesis.
Strengths:
The manuscript is well written and their conclusions are convincingly supported by their methodology and analysis. As a quantitative study, the biophysical analysis seems rigorous, in general.
Although this is not the first study that employs FSC to investigate the dynamics of a morphogen, it further exemplifies how these quantitative tools can be used to uncover mechanistic aspects of morphogen dynamics during development. In particular, the manuscript reports novel biophysical parameters of Dl dynamics that will be helpful in future hypotheses-driven modeling studies.
Weaknesses:
The main weakness of the manuscript is that the main biological implication of the study, namely that the asymmetry in the fraction of immobile Dl is a result of nuclear Dl-Cact binding which prevents Dl to bind DNA (Figure 5), occurs in a region of the embryo where there is very little Dl anyways (Figure 1A). While it is interesting that a small fraction of immobile Dl significantly increases in dorsal nuclei in mutants expressing a form of Dl with reduced Cact binding it is unclear what is the biological impact of this effect in a location where Dl is nearly absent.
Another weakness of the study, is that experiments are performed in the presence of a wild-type GFP-tagged Dl (unfortunately, the Dl gradient does not form without it; Supplemental Figure 4). This is an unfortunate technical limitation, because it cannot allow to test how important Cact binding is for determining the amount of Dl that could bind DNA in more biologically-relevant locations of the embryo (e.g., in lateral regions).
Overall, I feel that the manuscript exemplify how FSC methods and analysis can be used for the estimation of biophysical parameters and test biological hypothesis, even under very low concentrations (such as Dl in dorsal-most nuclei). However, due to technical limitations, it falls short in offering a real quantitative understanding of their proposed mechanisms. The authors did not report in Figure 5, what happens to the fraction of Dl bound to DNA in lateral regions in the reduced Cact binding and reduced Toll phosphorylation mutants.
Author response:
The following is the authors’ response to the original reviews.
Public Reviews:
Reviewer #1 (Public review):
Summary:
Al Asafen and colleagues apply a set of scanning fluorescence correlation spectroscopic approaches (Raster Image Correlation Spectroscopy (RICS), cross-correlation RICS, and pair-correlation function spectroscopy) to address the nuclear-cytoplasmic kinetics of the Dorsal (Dl) transcription factor in early Drosophila embryos. The Toll/Dl system has long been appreciated to establish dorsal-ventral polarity of the embryo through Tolldependent control of Dl nuclear localization, and provides an example of a morphogen gradient produced with high enough precision to yield robust biophysical measurements of general transcription factor activity and function. By measuring GFP-tagged Dl protein, either in wild-type embryos or in mutant embryos with low/medium/high levels of Toll signaling, the authors report diffusivity of Dl in nuclear and cytoplasmic compartments of the embryo, as well as the fraction of mobile and immobile Dl, which can be correlated with DNA binding through cross-correlation RICS. A model is presented where Cactus/IkB is implicated in preventing Dl from binding to DNA.
Strengths:
The experiments on wild-type GFP-tagged Dorsal are performed well, are mostly reported well, and are interpreted fairly.
Weaknesses:
The discrepancy between experiment and theory as pertains to Michaelis-Menten kinetics is not fully motivated in the text, and could benefit from a more clear presentation. The experiments performed to distinguish between the contribution of Toll-dependent phosphorylation and Cactus interaction models for limiting Dorsal DNA binding are possibly confounded by the presence of wild-type, GFP-tagged Dorsal protein.
Thank you for your thoughtful feedback. Regarding the discrepancy between experiment and theory in relation to Michaelis-Menten kinetics, we recognize that our initial explanation may not have been explicit enough. Our intent was to illustrate that if DNA binding is a saturable process, then while the absolute concentration of Dl bound to DNA will increase with total Dl levels, the fraction of Dl bound to DNA will decrease. We used Michaelis-Menten kinetics only as a familiar example to convey this concept but did not intend to suggest that the system strictly follows Michaelis-Menten behavior. To clarify this point, we removed mention of Michaelis-Menten as an illustrative analogy and stuck specifically with discussing the system as “saturating.” This primarily affected text in the paragraph starting on Line 204, but also Lines 323-325.
Regarding the concern about potential confounding effects due to the presence of wildtype GFP-tagged Dorsal (Dl[wt]-GFP): we understand the importance of addressing this point more directly. Therefore, we have imaged the Dorsal-GFP gradient in embryos expressing the UAS-dl[S280P]-GFP or the UAS-dl[S317A]-GFP constructs in the absence of the BAC-recombineered Dl-GFP construct. In both cases, the dl mutants by themselves were not able to recapitulate enough of the Dl gradient to test our hypotheses. We have added this analysis to Supplemental Figure 4 and mentioned this figure on Lines 333-336 and 354-358. Furthermore, we explicitly mention that it is possible the reason why we failed to reject the null hypothesis in the Toll phosphorylation mutant case may be due to the additional copy of Dl[wt]-GFP (the BAC recombineered construct), with text added to Lines 343-345, 365-369 (Results) and 408-418 (Discussion).
Reviewer #2 (Public review):
Summary:
In this manuscript, Al Asafen, Clark et al., use fluorescence correlation spectroscopy (FCS) to quantitatively analyze the mobility of Dl along the DV axis of the early Drosophila embryo. Dl is essential for dorsal-ventral (DV) patterning and its gradient initiates the activation of several genes and thereby orchestrates the formation of the Drosophila body plan. While the mechanisms underlying the formation of the Dl gradient have been extensively studied by this group and others, there are some observations for which there is not yet a mechanistic explanation. For example, the peak of the Dl gradient grows continuously during nuclear cycles 10-14. This is likely due to Cact-dependent Dl diffusion and Dl binding to DNA. However, the biophysical parameters governing Dl nuclear dynamics that would support these claims have not been previously measured. In this work, the authors provide evidence that GFP-tagged Dl may be separated into a mobile pool and an immobile pool. Interestingly, the fraction of immobile Dl is position-dependent along the DV axis, revealing more binding to DNA in the ventral than in the dorsal nuclei. This is either due to higher binding affinity in ventral locations (due to Toll-dependent Dl phosphorylation) or to higher Dl-Cact binding in dorsal nuclei that would prevent Dl from binding to DNA. Using dl-mutant alleles, the authors support the latter hypothesis.
Strengths:
The manuscript is well written and their conclusions are convincingly supported by their methodology and analysis. As a quantitative study, the biophysical analysis seems rigorous, in general.
Although this is not the first study that employs FSC to investigate the dynamics of a morphogen, it further exemplifies how these quantitative tools can be used to uncover mechanistic aspects of morphogen dynamics during development. In particular, the manuscript reports novel biophysical parameters of Dl dynamics that will be helpful in future hypotheses-driven modeling studies.
Weaknesses:
In my opinion, the main weakness of the manuscript is that the main biological implication of the study, namely that the asymmetry in the fraction of immobile Dl is a result of nuclear Dl-Cact binding which prevents Dl from binding DNA (Figure 5), occurs in a region of the embryo where there is very little Dl anyways (Figure 1A, 5A). While it is interesting that the fraction of immobile Dl increases (just a little, but significantly) in dorsal nuclei in mutants expressing a form of Dl with reduced Cact binding it is unclear what is the biological impact of this effect in a location where Dl is nearly absent. As can be seen in Figure 3F, the fraction of immobile is unaffected in Dl-mutant forms with reduced DNA binding, because it is already very low. It is unlikely that Dl binding to Cact in dorsal nuclei would affect shuttling as well since the fraction is very low anyway.
We thank the reviewer for pointing out the places where we could strengthen our explanations. Here we first address the criticism, also raised by the other reviewer, that the fraction of immobile Dl increases only a small amount (Fig. 5A). [In our reply to the next comment, we address the question of biological implications.] We attempted to explain this small effect size in the manuscript; however, we understand that we could clarify further and, given the fact that eLife has no restraints on space, we added more explanation in the main text.
In essence, even though the effect was statistically significant, the effect size was small because the mutation was “diluted” by the presence of a wildtype Dl protein tagged with GFP. We were willing to deal with this dilution because the alternative was that, according to previous literature, without any wildtype Dl, no Dl gradient would be present in the reduced Toll phosphorylation mutants, and only a very weak Dl gradient (weakened on both ends) would be present in mutants that reduced Cact binding. We were confident that, with our quantitative approaches, we would be able to detect the diluted effect.
However, because both reviewers have criticized this diluted effect, in this resubmission, we have included analysis of GFP-tagged mutants without the presence of wildtype Dl protein. Unfortunately, these embryos lack a discernible Dl gradient and cannot be analyzed in such a way as to test the hypotheses that the mutants were generated for.
Even so, the effect of the Cact-binding mutant was strong enough that we were able to statistically distinguish it from embryos expressing only wildtype Dl-GFP, even with the dilution effect. On the other hand we have also included a caveat that our failure to statistically distinguish Toll phosphorylation mutants from wildtype may be due to the dilution effect. We now also explicitly state the concerns about a lack of a discernible Dl gradient and have included figures of full mutants in the supplement. See also our discussion of Reviewer 1’s similar comment.
While the authors have a very clear understanding of the biology of the Dl gradient, I feel that the manuscript is more written as a 'tools' paper (i.e., to exemplify how FSC methods and analysis can be used for biological discovery). This is ok, but I think that the authors should discuss further what are the biological implications of these findings other than the contribution to uncovering the biophysical parameters.
Here we underscore the biological implications of our discovery that Cact is present in the nucleus on the dorsal side. The reviewer mentioned that Cact in the nucleus on the dorsal side appears to have little overall effect, because this is the location of the embryo where there is very little Dl in the first place, which raises the question of whether this discovery is impactful.
While we previously used the final paragraph of the discussion to touch on the implications of this discovery, we acknowledge that we could have spent more time on the explanation. As such, we have expanded this final paragraph into two paragraphs. In the first of the two, we discuss in more detail the implications specifically of the Dl/Cact interactions in the dorsal-most nuclei, as understood by the results of this paper. In brief, knowing that Dl in the dorsal-most nuclei is bound by Cact results in an updated understanding of the Dl gradient, with increased dynamic range, robustness, and precision (but unknown shape).
In the second of the two paragraphs, we discuss this result in light of our recent work on imaging Cact in live embryos, in which we have shown that Cact is present in all nuclei at roughly uniform levels. Taken together, we suggest that it is possible that Cact is bound to Dl in all nuclei (not just the dorsal-most), which would allow us to estimate the shape of the overall Dl gradient by subtracting off the fluorescence that stems from Dl/Cact complex.
For example, I think that the implications of the rejected hypothesis (i.e., that Tolldependent Dl phosphorylation does not seem to have an impact on Dl binding affinities to DNA) are important and should be further discussed (even if no additional experiments are performed). What is then the role of Dl phosphorylation? Perhaps it could have an impact on patterning robustness in lateral regions. The authors should report in Figure 5 also what happens to the fraction of Dl bound to DNA in lateral regions in the reduced Cact binding and reduced Toll phosphorylation mutants.
We appreciate the reviewer’s suggestion that the rejection of the hypothesis that phosphorylation of Dl by Toll impacts Dl/DNA binding could be expanded upon further. For the role of Dl phosphorylation by Toll: we previously mentioned that this phosphorylation is known to enhance the nuclear import or retention of Dl, and that mutation of serine 317 to an alanine abolishes Toll-mediated phosphorylation of Dl, which results in embryos with no Dl gradient. We had also mentioned that phosphorylation of Dl is not known to affect its DNA binding, which is the hypothesis we sought to test by creating the dl[S317A]-GFP mutants. We did not image any mutants, or the UAS-dl[wt]-GFP control, in the lateral regions, for two reasons. First, this region is easily the smallest of the three regions, in terms of the percentage of the DV axis (see Fig. 1A). Second, because of the dilution effect, we knew the effect size would be small, and as such, we imaged only on the extreme ends of the gradient so that the most clear conclusion could be drawn about the effect that Toll phosphorylation might have on DNA binding of Dl.
The way that position along the DV axis is reported using the nuclear-cytoplasmic-ratio (NCR) in Figures 1-3 is not incorrect, but I wonder if it is the best way of doing it. The reason is that it spreads out a relatively small region of the embryo (the ventral-most locations) and shrinks a relatively large region of the embryo (lateral and dorsal regions), see Figure 1A. Perhaps reporting the NCR in log_2 units would be more appropriate.
We agree that there is some distortion of the relative spatial extents of the Dorsal gradient when NCR is used as an independent variable on a plot. However, we prefer the NCR on the horizontal axis because it is closer the functional variable (Dl concentration, rather than spatial location) for the properties we studied.
Recommendations for the authors:
Reviewer #1 (Recommendations for the authors):
I really enjoyed the first part of this paper and have only minor suggestions for improvement of the presentation. I am confused about the experimental approach for the final figure, distinguishing phosphorylation and cactus-dependent effects. I'll divide my comments between "First Part/General Suggestions", "Last Part", and finish with some minor typo observations.
The gist of the issues with the last part of the paper could boil down to insufficient detail/explanation of the section. The discrepancy with expectation with Michaelis-Menten kinetics is presented in a total of three sentences and is not necessarily obvious to the general readership of eLife. The mutants chosen to distinguish the phosphorylation and cactus mechanisms could be described more (why these? aren't other residues phosphorylated?) and possibly why also having wild-type GFP-Dl in the measurements isn't confounding. Since there is unlimited space in this journal, it may be advisable to use this space to fill out these rationales and ideas.
First part/General Suggestions:
(1) For the RICS data, (Figures 1 and 2) there is a nice correlation between WT NC ratio and the selected low/med/hi Dl activity mutants. More-or-less the median values in, say, Figure 1E-G are reflected in Figure 1H. However, with the ccRICS data (Figure 3), it looks like there is less correspondence between the range of fraction bound estimates in, for instance, "ventral" in Figure 3D and '10b' in Figure 3E. Can the authors comment on this? Should the reader be able to make this kind of comparison, or does something about data collection for the wt/NCR measurements preclude direct comparison of magnitudes with the panel of mutants? (imaging setup, laser power, etc)?
The reviewer is correct that there seems to be a discrepancy in the values of ψ between the wt embryos (ventral side) and the Toll10B embryos. It should be noted that the Toll10B embryos are not “ventral-like” in every way, in part because they have unknown activated Toll levels that might be above or below what is seen at the ventral midline in wildtype embryos, and in part because there is no DV gradient, and thus no shuttling in these embryos that would accumulate total Dorsal on the ventral midline. As such, comparisons between Toll10B embryos and the ventral side of wildtype embryos are not exactly one-toone, and we are more confident in comparing among the mutants in an allelic series. To address this question, we have added a sentence to the end of the second paragraph of the “Dorsal/DNA binding exhibits a spatial gradient” subsection of the Results (Lines 233235).
(2) Materials and methods: Mounting and imaging of Drosophila embryos: the authors cite the "488 nm laser intensity ranged from 0.5% to 3.0%..." The values presented here are not useful for the general reader or an individual looking to replicate these conditions, as emission power produced from such values will vary from instrument to instrument. It is standard in these cases to report an estimated laser power (measured in watts) for each laser line, and a clear description of how such measurements were made (stationary beam, under scanning conditions, with what detector, etc). These measurements are valuable and the authors are strongly encouraged to report such measurements for their setup.
We appreciate the reviewer’s suggestion and understand the importance of providing absolute laser power values for reproducibility. We have now included the laser power (in watts) for the laser lines on both microscopes used in this study. The revised text can be found in the Materials and Methods section, in the Lines 535-536 and 540.
(3) The presentation of the data in Figure 4 is difficult to understand. Are the kymographs (A lower) representing the entire length of the big white arrow in A upper? Or do the dashed lines indicate the x-axis limits of the kymograph? It is difficult to tell from the figure legend, where the dashed lines are described as "areas where Dl-GFP movement is measured out of the nucleus." I believe that the authors can make these measurements and that Figure 4B reflects properties of "movement" of Dl out of the nucleus, but how they get there from these data is not clear to this reader. Perhaps a cartoon explaining the green lines and the orange lines in the kymograph or tightening the legend would help.
We thank the reviewer for their feedback and understand the need for greater clarity in the text of the pCF section and in Figure 4. The widths of the kymographs in the lower panels correspond to the full widths of the images in the upper panels. The pCF measurements were taken at the y-coordinates at the level of the white arrows. The dashed vertical lines connecting the upper and lower panels illustrate two cases of locations along the x-axis of the image where Dl is crossing from inside a nucleus to outside. In the two illustrated cases, these crossings are accompanied by either zero Dl molecules being observed to cross the nuclear barrier (ventral image/kymograph on left) or delayed crossing of Dl molecules (dorsal image/kymograph on right). To address this concern, we have added more detail to the Fig. 4 legend and greatly expanded on a discussion of what pCF does in the text (the second and third paragraph of the section). We have also updated Fig. 4 to align with new explanations from the text: namely, describing the y-axis of the kymographs as Δt (instead of log(time)) and explicitly showing that the pair correlation is for pairs of pixels that are Δx = 6 pixels apart. Further details were also added to the relevant Methods section.
(4) DV position in the wild-type imaging experiments is operationally determined through measurement of the Dorsal NC ratio. This makes sense, but the strategy is buried in the first paragraph of the results, and not discussed in the M & M. For readers unfamiliar with imaging the fly embryo or the nuances of the Dl gradient, perhaps a sentence or two explaining that embryos were oriented randomly along the DV axis, and DV positions of the imaging region were estimated by measuring the Dl NC ratio.
We thank the reviewer for this helpful suggestion. To improve clarity, we have added a description of how DV position was determined to the Materials & Methods section (paragraph starting on Line 520). Specifically, we now state that embryos were randomly oriented along the DV axis and that we used the Dorsal NC ratio of intensity as a proxy for measuring the DV position in imaging experiments. Additionally, we have added a statement to the Results section to ensure that this strategy is more clearly introduced (Lines 143-144). We appreciate this recommendation, as it will help readers unfamiliar with fly embryo imaging better understand our approach.
(5) It would be nice to report the corresponding NC-ratio values for Dl in each of the mutant conditions, perhaps as a supplement to Figure 1. Currently, Figure 1H relies on the (admittedly well-established) properties of the three mutants, but it feels that an additional nice quantitative link in the data can be drawn out here. Do the authors see the strict correlation between the wt and mutant diffusivity measurements at specific NC-ratios?
We are hesitant to try to draw direct comparisons between the mutants and the behavior of the wildtype embryo at the corresponding NCR. This is because, in the context of these uniform mutants, the NCR is determined by a combination of at least three factors that we cannot measure or control for: the unknown strength of Toll signaling, the unknown capacity of Toll signaling (ie, the potential saturation of the cytoplasmic enzymes controlled by Toll signaling), and, most importantly, the lack of a shuttling mechanism that concentrates Dl on the ventral side of the embryo. As such, the NCR does not represent a continuous variable that transforms the behavior of one mutant into another (or from mutants into wt DV coordinates), as it does along the DV axis in wildtype embryo. This is why the mutant studies are presented as boxplots. At best, we were comfortable only in using the uniform mutants as an allelic series to produce gross trends. We have added a brief statement describing the shuttling caveat to the Results section (Lines 173-177).
(6) In the section related to Dl nuclear export, the language used to describe Dl kinetics is ambiguous. The term "movement" is used seemingly as a catch-all for nuclear-importexport as distinguished from diffusion. However, diffusion is also a form of movement. Could this section be reworked to explicitly distinguish nuclear import-export and diffusive movements?
We appreciate the reviewer’s suggestion and agree that the language used to describe Dl kinetics could be more precise. By way of explanation, the pCF analysis calculates the time scale on which Dl can exit the nucleus. pCF only gives a signal if it sees the same Dl molecule twice, at two different locations after some Δt amount of time has passed. Because of this, if a given Dl molecule in a ventral nucleus is being tracked, then that molecule has some probability that it is bound to DNA initially, which means it will take, on average, longer to exit the nucleus than a Dl molecule not initially bound to DNA. Therefore, on the ventral side, the time scale on which Dl exits the nucleus is longer than on the dorsal side (where DNA binding is not happening). This can be true even if the nuclear export rate constants are the same on the ventral side vs the dorsal side. As such, we were careful to choose language that did not imply that we were talking about a nuclear export rate constant. We have added this discussion to the end of the relevant Results section (Lines 308-315).
We have also revised this section to explicitly distinguish between the mobility associated with exiting the nucleus and diffusive movement, while still trying to distinguish between the time scale of exiting the nucleus vs the nuclear export rate. Specifically, we now refer to ‘time scale of nuclear export’ when discussing transport across the nuclear envelope and reserve the term ‘diffusion’ for passive intracellular movement. Furthermore, we have edited a sentence in this section (Lines 291-293) to describe the distinction we are making between the time scale measured by pCF and the time scale commonly associated with nuclear export (that is, the reciprocal of the rate constant). We hope this clarification improves readability and conceptual clarity.
Last Part:
(1) There is an undersold argument centered on Michaelis-Menten kinetics that needs to be explicitly presented, especially since it motivates the final experiments of the paper, which are challenging. In the two sections describing how the data do not adhere to expectations based on Michaelis-Menten Kinetics, the assertion that "the fraction of immoble Dl is expected to decrease with increasing nuclear total Dl concentration" is only intuitively true if the system is saturated. Is the system demonstrably saturated? Another interpretation of this would be that these results demonstrate that the system is likely not saturated. In any case, the authors need to devote some space in the introduction and/or results and/or discussion to fully motivate this point.
We agree that the reviewer has raised an important point: if the system is very far from saturation, then the fraction of immobile Dl is not expected to decrease with increasing nuclear total Dl concentration. But neither would it increase; it would instead stay flat. To correct this mistake, we have edited the sentences in question to acknowledge the farfrom-saturation scenario, saying “at best, [the fraction bound] remain[s] constant” (Line 209). As such, our original point, which is that in no case would the fraction immobile increase [unless something else is going on besides affinity-based binding to DNA], it still valid.
(2) Wouldn't any argument on the basis of Michaelis-Menten need to rely on the assumption that the system is at steady-state? Reeves 2012 concludes that during the times measured here, Dl does not reach a steady state. It would be good, in the context of the point above, for the authors to clarify how this impacts the expectations of saturation and the application of M/M kinetics.
We thank the reviewer for raising this important point. We apologize for not being clear on our points about M/M kinetics and would like to stress again that we are not claiming the system is has M/M kinetics. We appealed to M/M kinetics only as a simple, intuitive example of a saturating system to point out the difference between bound concentration vs bound fraction as functions of total concentration. We did this because previous feedback on our manuscript suggested that the difference between these two variables needed to be made clearer. Because this point seemed controversial with both reviewers, we removed all mention of M/M kinetics and simply refer to the system as “saturating.” For further explanation, see the first paragraph of our response to Reviewer 1’s “weaknesses” in the public review.
(3) It is not clear to me how the inclusion of wild-type, GFP-tagged dorsal in the experimental setup for Figure 5 is not confounding. For the S317 (phospho-) mutant, GFPtagged alleles of both phospho- and wild-type Dl are expressed. The reasoning is that not enough phospho-mutant Dl gets into the nucleus, and this makes it difficult to distinguish the dorsal from the ventral side of the embryo, so in a dl mutant background, there is expression of wt GFP-dl from a BAC, and nos>Gal4 driven expression of a GFP-tagged S317A mutant dl. The measurements show that on the ventral side of the embryo, there is no difference in the fraction of bound Dl. Couldn't this be predominantly binding of wildtype GFP-Dl? How is this interpretable? Wouldn't it be easier to perform these measurements in a Tl 10b background (or to cross in UAS>Tl[10b]) and for the only GFPtagged dl to be S317A? The same goes for the S234 mutant (could be done in the pelle mutant background).
We thank the reviewer for raising the point that the confounding effect of wildtype Dl makes it difficult to interpret the results from the 317A mutant. Under the circumstances of the experimental design, we can best conclude that, if the null hypothesis is incorrect, the effect size was too small to detect with our sample size. As such, we have modified our discussion of the results of this experiment to carefully explain this caveat (rather than confidently saying that Toll phosphorylation has no effect). For further explanation, see the second paragraph of our response to Reviewer 1’s “weaknesses” in the public review, as well as our response to the related question raised by Reviewer 2 in the public review.
Minor issues/typo stuff:
(1) This reviewer notes that the submitted materials contain neither line numbers nor page numbers.
We appreciate the reviewer’s feedback. We have now included line numbers and page numbers in the revised manuscript for easier reference.
(2) First paragraph of results: "We imaged small regions of the embryo..." The parenthetical statement only cites pixel size and directs the reader to the methods. Without the total number of pixels, the pixel size value does not clarify how "small" the imaged region is. Consider including the xy area, pixel dimensions, and pixel size here to assert the smallness of the imaged area.
We have added the requested information.
(3) Second paragraph, Introduction: "Dorsal, one of three (Drosophila) homologs to mammalian NF-kB" (Add Drosophila). Also, aren't these orthologs?
We have made these changes.
(4) Last sentence of last paragraph in the introduction: Kind of a throw-away sentence. Consider revising.
We thank the reviewer for making this point; the sentence was originally constructed to state that our quantitative measurements resulted in a biologically significant discovery. However, because Reviewer 2 also mentioned the question of biological significance, we have changed this final sentence to explicitly mention of what the biological significance is: namely, an understanding of the Dl gradient that has superior dynamic range, spatial range, robustness, and precision.
(5) Where is the median line in the S317A boxplot in Fig 5C?
The median line is at ψ = 0. We have added an explanation of this to the Figure legend.
(6) Materials & Methods: Fly transformation, typo: Drosophila embryos were injected with 0.5 µl of each pUAST construct..." The volume of an entire Drosophila embryo is less than 0.5 µl, please revise the units to reflect the value injected. Most likely an absolute volume unit was stated when rather a concentration of an injection solution, delivered at significantly smaller volumes was intended.
We thank the reviewer for catching this typo. It was intended to indicate a concentration of 0.5 ng/μL, and we have made the appropriate changes.
Reviewer #2 (Recommendations for the authors):
(1) Perhaps this has been described in a prior publication (if this is the case, please simply state this somewhere in the Methods section where Dl-GFP embryos are described), but since Dl-GFP embryos have one copy of endogenous dl and one copy of Dl-GFP, how do potential differences in tagged vs. non-tagged Dl interactions with DNA or Cact affect their findings?
The reviewer brings up a good point, and we acknowledge that any time a protein is tagged with GFP, the behavior of the protein may be affected. We have now explicitly added this caveat to our discussion in a new paragraph on Lines 420-429.
(2) In the Discussion section, the authors argue that a major implication of their findings is the possibility that Cact binds Dl in the nuclei would imply that the true (active) Dl gradient may be unknown unless the unbounded Dl is separated from the Dl/Cact (inactive form). While this is an interesting point, this idea is not supported by the findings of Figure 5B where there is no effect in the fraction of Dl bound to DNA in the reduced Cactus binding mutants. The authors should report what happens in lateral regions in Figure 5 because perhaps there is an effect there (see comment on this in the Public Review).
We thank the reviewer for the insight, as we did not directly discuss the implications of the middle column of Fig. 5B on our hypothesis. Indeed, our hypothesis is not supported by Fig. 5B; it is instead inconclusive (failure to reject H0). This is why we designed the second experiment (Fig. 5C) to test the Cactus hypothesis, because the effect size would be greater on the dorsal side.
Furthermore, as pointed out by both reviewers, the presence of wildtype Dl-GFP in these experiments is confounding. We have discussed this elsewhere in our rebuttal, but briefly, this problem resulted in needing larger effect sizes to detect a statistically significant difference between wt and the mutant populations. This was a necessary evil that we were willing to deal with in order to ensure the Dl gradient could be established so that the dorsal vs ventral sides would be distinguishable. We have added a fuller discussion of these issues to the relevant Results section (Lines 333-336, 343-345, 354-359, 365-369) and also the Discussion section (Lines 412-418), including underscoring the fact that, from a falsification standpoint, the results in Fig. 5B do not allow us to reject either null hypothesis, possibly due to the confounding effect of wildtype Dl. We appreciate the reviewer’s point about this, and believe the changes suggested by the reviewer have improved the manuscript.
On the other hand, we respectfully disagree with the reviewer that investigating either mutant in the lateral regions of the embryo would bear fruit. To the first approximation, it would be the average between the behaviors on the ventral vs. dorsal sides. For the S317A mutant, neither the ventral nor the dorsal side was conclusive in regards to our hypotheses. (Although we admit here that further investigation into why the S317A column in Fig. 5C was statistically different from wildtype, in the opposite direction from the S234P mutant, may be interesting in future work.) For the S234P mutant, the data were more conclusive on the side of the embryo where the effect size was expected to be large enough to detect a difference. In the lateral regions, the expectation would be that the effect size would be intermediate, which would make the interpretation of the results more difficult (i.e., more likely to be inconclusive). In contrast, as Fig. 5C is already conclusive, we are not confident there would be more information gained by imaging the lateral regions.
(3) Is Figure 5A a wild-type embryo? If so, I think that the labels are misleading or unclear. Also, is it the same image as in Figure 1A? If so, I suggest replacing this with a schematic since it does not add any new data.
We have eliminated the labels for the mutants and have added the following comment to the figure 5 legend “Same embryo as in Fig. 1A”.
(4) Also in Figure 5, I suggest using labels to indicate the schematics instead of simply using their location. You could use 5A', 5A' and 5A', for example.
We have made the suggested changes.
(5) The use of some technical labels makes some figures difficult to read. I suggest using more simple labels for mutants in Figure 3F (replace R063C) or Figure 5B, C (replace S234P and S317A).
We have made changes to Fig. 3F, Fig. 5B,C, and the corresponding places in the figure legends. We have labeled R063C as ↓DNA, S317A as ↓Toll, and S234P as ↓Cact.
(6) I suggest reporting p-values consistently. For example, in Figure 4B, they use one or two asterisks to denote p-values less than 0.07 and 0.05, respectively, which is somehow arbitrary and unconventional. Why not report the actual values as in Figure 5C, for example? (By the way, I would report in Figure 5B the actual p-values as well, since a nonsignificant value is also reported in Figure 5C. Also in Figure 5C, report values in the same notation (decimal or scientific), i.e., either put 0.005 as 5x10^-3 or 10^-3 as 0.001).
We have made the suggested changes.
eLife Assessment
This study provides important insights regarding the temporal dynamics of dopamine across sleep/wake transitions in several brain areas. Using multi-site fiber photometry combined with EEG/EMG recordings, the study revealed heterogenous dynamics across both cortical and several subcortical areas. Although the evidence for these observations is solid, evidence for the proposed mechanisms driving DA dynamics is incomplete. Overall, the study may have a substantial impact on several fields working on the neurobiology of DA signaling.
Reviewer #1 (Public review):
Summary:
In this manuscript, Chen, Tu, and Lu focused on how brain-wide dopamine release dynamically changes during sleep/wake state transitions. Using multi-site fiber photometry to monitor DA release, alongside simultaneous EEG and EMG recordings, the authors show distinct DA dynamics during transitions from NREM to WAKE, REM to WAKE, WAKE to NREM, and NREM to REM. Next, they analyze temporal coordination between regions using cross-correlation analysis. Finally, chemogenetic activation of VTA or DRN but not SNc dopamine neurons is shown to promote wakefulness.
Strengths:
The manuscript addresses an interesting question: how brainwide dopamine activity evolves across sleep/wake transitions. The combination of multi-site DA recordings with simultaneous EEG/EMG monitoring is technically sophisticated. The experimental logic is generally clear, and the dataset is rich. The result has several interesting observations.
Weaknesses:
The authors used the GRAB-DA2m sensor to monitor dopamine release. Although DA2m exhibits higher affinity for dopamine compared to NE (around 15-fold difference in EC50 in HEK cell assays), it is still possible that NE contributes to the recorded signals, particularly during sleep/wake transitions when locus coeruleus activity is strongly modulated. Given the widespread and state-dependent dynamics of NE, this potentially needs to be addressed.
Similarly, the chemogenetic experiments rely on CNO to activate hM3Dq-expressing dopamine neurons. However, it is well established that CNO can be converted to clozapine in rodents, and clozapine itself is known to influence sleep/wake. Although the authors included non-hM3Dq-expressing mice as controls, the potential confounding effects of clozapine on sleep regulation remain a concern.
Midbrain dopamine neurons exhibit both tonic and phasic firing patterns. In Figure 1, most reported dopamine transitions appear relatively slow. However, some faster, phasic-like components are observable. For example, in NAc-L during REM-to-WAKE transitions, there are 2 phasic-like decreases between −20 and 0 s. The authors used laser-evoked stimulation experiments in the VTA and DRN and showed that 2 s versus 10 s stimulation produces distinct dopamine kinetics, suggesting that different firing patterns generate distinct DA dynamics. Moreover, the temporal profiles vary not only across regions but also across transitions within the same region. For example, in CeA, the NREM-to-WAKE transition shows a relatively rapid decrease, whereas REM-to-WAKE displays a much slower decline. Similarly, some regions (e.g., NAc-L NREM-to-WAKE, DRN REM-to-WAKE) show faster changes, while others (e.g., mPFC WAKE-to-NREM, VTA NREM-to-WAKE) show slower kinetics. These observations argue against a simple region-specific explanation and instead suggest that distinct firing modes may differentially contribute depending on transition type.
While cross-correlation analysis provides insight into the temporal coordination of DA signals across regions, several limitations should be considered. Sleep/wake transitions are inherently non-stationary events, whereas cross-correlation assumes relatively stable signal properties within the analysis window. This mismatch may bias lag estimates and obscure transient lead-lag relationships. Moreover, the temporal resolution of fiber photometry and the kinetics of genetically encoded DA sensors limit the precision with which timing relationships can be interpreted, particularly for sub-second lags.
In the Introduction, the authors state that they aim to address 'which dopaminergic populations causally drive these patterns.' However, the chemogenetic approach used operates on a relatively slow timescale: CNO-induced activation takes 15-30 minutes to produce effects, and the induced changes are long-lasting. In contrast, the dopamine transitions described in Figure 1 occur on a much faster timescale compared to CNO manipulation. Thus, while chemogenetic activation demonstrates that stimulating VTA or DRN dopamine neurons promotes wakefulness, it does not directly establish that these populations causally drive the rapid transition-related DA dynamics observed in the photometry recordings.
Reviewer #2 (Public review):
In "Brainwide dopamine dynamics across sleep-wake transitions", Chen et al. provide a thorough description of how dopamine dynamics fluctuate across sleep-wake transitions and in transitions between sleep states. To achieve this, the authors used multi-channel fiber photometry and a genetically encoded fluorescent dopamine reporter to simultaneously measure dopamine dynamics in 8 brain regions. They also used EEG measurements to precisely quantify and time transitions between sleep states and wakefulness. Finally, the authors used channelrhodopsin to examine dopamine dynamics following subregion stimulation and chemogenetics to test the causal relationship between activation of distinct dopamine neuron populations and their effects on sleep state.
The conclusions made by the authors in this study are modest and appropriate given the largely observational nature of the principal findings. The use of optogenetics to probe regional dopamine signaling following activation of distinct nuclei is interesting, but not entirely novel and constrained in interpretability. Similarly, the chemogenetics experiment largely confirms previous studies, which the authors correctly cited in the text.
The principal findings of this study are based on strong methodological and analytical methods. Implanting 8 optical fibers in a single mouse, along with EEG/EMG electrodes, is technically challenging, providing valuable, simultaneous measurements of dopamine fluctuations across the brain. This enables the strong correlational and time-locked analyses performed by the authors in Figure 2. What's more, the use of EEG/EMG electrodes provides time-locked descriptions of sleep states, enabling precise comparisons between the dopamine signal and sleep state transitions.
The paper has some weaknesses that the authors could address. The analyses in Figure 1 could be strengthened to show how dopamine changes during transitions between specific sleep states. The injection sites for channelrhodopsin and chemogenetic viruses could be validated to strengthen the interpretation of those results. Also, a stronger justification for the experiments conducted in Figure 3 could be provided, as they seem unrelated to the present study.
Overall, this study has strong descriptive power, convincingly showing how dopamine fluctuates across sleep states. Some of the other aspects of the paper, however, are somewhat limited in novelty and interpretation.
Author response:
Public Reviews:
Reviewer #1 (Public review):
Summary:
In this manuscript, Chen, Tu, and Lu focused on how brain-wide dopamine release dynamically changes during sleep/wake state transitions. Using multi-site fiber photometry to monitor DA release, alongside simultaneous EEG and EMG recordings, the authors show distinct DA dynamics during transitions from NREM to WAKE, REM to WAKE, WAKE to NREM, and NREM to REM. Next, they analyze temporal coordination between regions using cross-correlation analysis. Finally, chemogenetic activation of VTA or DRN but not SNc dopamine neurons is shown to promote wakefulness.
Strengths:
The manuscript addresses an interesting question: how brainwide dopamine activity evolves across sleep/wake transitions. The combination of multi-site DA recordings with simultaneous EEG/EMG monitoring is technically sophisticated. The experimental logic is generally clear, and the dataset is rich. The result has several interesting observations.
Weaknesses:
The authors used the GRAB-DA2m sensor to monitor dopamine release. Although DA2m exhibits higher affinity for dopamine compared to NE (around 15-fold difference in EC50 in HEK cell assays), it is still possible that NE contributes to the recorded signals, particularly during sleep/wake transitions when locus coeruleus activity is strongly modulated. Given the widespread and state-dependent dynamics of NE, this potentially needs to be addressed.
We thank the reviewer for raising this important methodological consideration. While we acknowledge that a minor contribution from norepinephrine (NE) to the DA2m signal cannot be categorically excluded, several convergent lines of evidence give us confidence that the signals we recorded primarily reflect dopamine release.
First, DA2m has substantially lower affinity for NE compared to dopamine. The reported EC<sub>50</sub> for NE is ~1200 nM [1], which is ~15-fold higher than for dopamine. In contrast, extracellular NE levels in the prefrontal cortex are typically in the low nanomolar range (generally <5 nM under basal conditions) [2,3]. Because physiological NE concentrations are orders of magnitude below the sensor’s EC<sub>50</sub> threshold, NE is highly unlikely to drive significant DA2m activation in vivo.
Second, our optogenetic experiments provide direct functional validation. The targeted stimulation of midbrain dopaminergic neurons elicited robust DA2m signal responses across both cortical and subcortical brain areas. This confirms that the sensor reliably captures evoked dopamine release within our specific experimental paradigm.
Finally, the spontaneous DA2m signal dynamics we observed across sleep-wake states functionally diverge from previously reported patterns of cortical NE release [4]. For example, in Figure 1C, our DA2m recordings in the mPFC revealed high activity during wakefulness, alongside pronounced, sharp changes during NREM-to-WAKE transitions. In contrast, prior study [4] show that NE exhibits comparatively mild fluctuations during wakefulness and transitions between NREM. This temporal and kinetic divergence further supports that our recorded signals isolate region-specific dopaminergic dynamics rather than generalized NE arousal activity.
Taken together, these physiological, functional, and kinetic distinctions indicate that while a negligible contribution from NE cannot be entirely ruled out, it is highly unlikely to account for a substantial portion of the DA2m signals observed during sleep-wake transitions in our study.
Similarly, the chemogenetic experiments rely on CNO to activate hM3Dq-expressing dopamine neurons. However, it is well established that CNO can be converted to clozapine in rodents, and clozapine itself is known to influence sleep/wake. Although the authors included non-hM3Dq-expressing mice as controls, the potential confounding effects of clozapine on sleep regulation remain a concern.
We appreciate the reviewer raising this important point regarding the metabolism of CNO. We are aware of the evidence suggesting that CNO can undergo back-metabolism to clozapine in rodents, which could potentially exert independent effects on sleep-wake architecture. To mitigate this concern, we strictly employed several experimental safeguards:
(A) Non-hM3Dq Control Group: As noted by the reviewer, we included a cohort of mice that did not express the hM3Dq receptor but received the same dosage of CNO (1 mg/kg). In these animals, we observed no significant alterations in sleep-wake states compared to saline baseline (Figure S3), suggesting that at this dosage, any clozapine produced was below the threshold for behavioral modulation of sleep.
(B) Dosage Selection: We utilized a relatively low dose of CNO (1 mg/kg), which is widely reported in the literature to minimize the accumulation of clozapine to levels that would interfere with EEG-defined sleep states in rodents [5]. Furthermore, studies have demonstrated that while higher doses of CNO (e.g., 5–10 mg/kg) can produce clozapinelike effects on sleep architecture, lower doses around 1 mg/kg do not yield significant alterations in cortical EEG power distribution or sleep-wake amounts in control animals [6,7].
Midbrain dopamine neurons exhibit both tonic and phasic firing patterns. In Figure 1, most reported dopamine transitions appear relatively slow. However, some faster, phasic-like components are observable. For example, in NAc-L during REM-to-WAKE transitions, there are 2 phasic-like decreases between −20 and 0 s. The authors used laser-evoked stimulation experiments in the VTA and DRN and showed that 2 s versus 10 s stimulation produces distinct dopamine kinetics, suggesting that different firing patterns generate distinct DA dynamics. Moreover, the temporal profiles vary not only across regions but also across transitions within the same region. For example, in CeA, the NREM-to-WAKE transition shows a relatively rapid decrease, whereas REM-to-WAKE displays a much slower decline. Similarly, some regions (e.g., NAc-L NREM-to-WAKE, DRN REM-toWAKE) show faster changes, while others (e.g., mPFC WAKE-to-NREM, VTA NREM-toWAKE) show slower kinetics. These observations argue against a simple region-specific explanation and instead suggest that distinct firing modes may differentially contribute depending on transition type.
We thank the reviewer for this insightful comment. We agree that midbrain dopamine neurons exhibit both tonic and phasic action-potential firing patterns. As summarized by Grace et al., dopamine neurons recorded using in vivo electrophysiology can display a slow, irregular, single-spike “tonic” firing pattern, typically around 2–10 Hz, as well as burst-like “phasic” firing patterns [8].
However, our recordings were performed using GRAB-DA2m fiber photometry. Therefore, our measurements reflect extracellular dopamine dynamics in the recorded target regions rather than the action-potential firing patterns of midbrain dopamine neurons. GRABDA2m has subsecond sensor kinetics and is suitable for detecting extracellular dopamine transients occurring over hundreds of milliseconds to seconds, as well as slower dynamics occurring over seconds to tens of seconds [1], which matches the timescale of the sleep–wake transition-related dynamics observed in previous studies [9,10]. Nevertheless, GRAB-DA2m fiber photometry in our study does not directly resolve dopamine neuron spike timing or distinguish tonic from phasic firing modes. Accordingly, we interpret our signals as extracellular dopamine concentration dynamics rather than as direct measurements of tonic or phasic neuronal firing.
Therefore, the transition-aligned dopamine signals shown in Figure 1 should be interpreted as dopamine dynamics occurring over seconds-to-tens-of-seconds around sleep–wake transitions, rather than as dopamine neuron firing patterns. In addition, these traces represent GRAB-DA2m signals averaged across sessions and mice within a ±30 s window centered on each sleep/wake transition. Thus, they do not necessarily represent individual dopamine transient patterns on single transitions. We also acknowledge the reviewer’s observation that faster phasic-like components are visible in some traces, including the decreases in the NAc-L preceding REM-to-WAKE transitions. Direct electrophysiological recordings of dopamine neuron firing during sleep–wake transitions would be useful in future studies to determine how tonic and phasic firing modes contribute to the observed dopamine dynamics.
In the laser-evoked stimulation experiments shown in Figure 3, we thank the reviewer for the thoughtful interpretation. The results indicate that different stimulation durations can produce distinct dopamine release dynamics in downstream projection regions. Moreover, prolonged optogenetic stimulation was associated with more sustained dopamine responses, suggesting that the temporal profile of extracellular dopamine dynamics depends, at least in part, on the duration and region of dopaminergic input [1]. We also agree with the reviewer that the temporal profiles of the GRAB-DA2m signals vary not only across regions, but also across sleep/wake transitions within the same region. For example, in CeA, the NREM-to-WAKE transition shows a relatively rapid dopamine decrease, whereas the REM-to-WAKE transition displays a slower decline.
Similarly, faster dopamine changes are observed in some region/transition combinations, such as NAc-L during NREM-to-WAKE and DRN during REM-to-WAKE, whereas slower kinetics are observed in others, such as mPFC during WAKE-to-NREM and VTA during NREM-to-WAKE. Together, these effects reflect both region-specific mechanisms and transition-dependent differences in dopaminergic activity.
While cross-correlation analysis provides insight into the temporal coordination of DA signals across regions, several limitations should be considered. Sleep/wake transitions are inherently non-stationary events, whereas cross-correlation assumes relatively stable signal properties within the analysis window. This mismatch may bias lag estimates and obscure transient lead-lag relationships. Moreover, the temporal resolution of fiber photometry and the kinetics of genetically encoded DA sensors limit the precision with which timing relationships can be interpreted, particularly for sub-second lags.
We thank the reviewer for raising these important considerations. The temporal relationships between regional dopamine signals were assessed using cross-covariance analysis. We agree that cross-covariance analysis has limitations when applied to sleep/wake transitions, because these transitions are inherently non-stationary events. Although cross-covariance centers the signals by subtracting their means and is therefore less sensitive to baseline offsets than raw cross-correlation, it still summarizes the lagdependent covariance between two signals over the selected analysis window. Therefore, the inferred lag should be interpreted as a transition-level measure of temporal coordination rather than a precise estimate of instantaneous lead–lag timing.
To minimize the influence of brief or unstable state fluctuations, we only included transitions in which both the preceding and following sleep/wake epochs lasted at least 30 s, and excluded epochs shorter than 30 s [4]. This criterion helped ensure that the analyzed events represented well-defined transitions between sustained behavioral states rather than transient or fragmented episodes. Although dopamine signals may still change dynamically within the transition window, and the temporal resolution of fiber photometry and the kinetics of genetically encoded GRAB-DA2m sensors limit the precision with which fine-scale timing relationships can be interpreted, dopamine signals were relatively stable within each behavioral state, as shown in Fig. 1B and reported previously [1,9,10] Thus, we believe that cross-covariance analysis provides useful information about the temporal coordination of dopamine dynamics across regions.
In the Introduction, the authors state that they aim to address 'which dopaminergic populations causally drive these patterns.' However, the chemogenetic approach used operates on a relatively slow timescale: CNO-induced activation takes 15-30 minutes to produce effects, and the induced changes are long-lasting. In contrast, the dopamine transitions described in Figure 1 occur on a much faster timescale compared to CNO manipulation. Thus, while chemogenetic activation demonstrates that stimulating VTA or DRN dopamine neurons promotes wakefulness, it does not directly establish that these populations causally drive the rapid transition-related DA dynamics observed in the photometry recordings.
We thank the reviewer for this thoughtful comment. We agree that chemogenetic manipulation operates on a much slower timescale than the rapid dopamine transients observed during sleep–wake transitions, and therefore does not directly recapitulate these fast dynamics. In particular, CNO-induced activation unfolds over minutes and produces sustained changes in neuronal activity, whereas the DA signals we report fluctuate on a sub-second to second timescale. Our intention with the chemogenetic experiments was not to mimic the precise temporal profile of endogenous DA signals, but rather to test whether increasing the activity of specific dopaminergic populations is sufficient to influence behavioral state.
In this context, our results show that activation of VTA or DRN dopaminergic neurons robustly promotes wakefulness, supporting a causal role for these populations in sleep– wake regulation at the circuit level. However, we agree that these data do not by themselves establish that these neurons directly generate the rapid transition-related DA dynamics observed in the photometry recordings.
Reviewer #2 (Public review):
In "Brainwide dopamine dynamics across sleep-wake transitions", Chen et al. provide a thorough description of how dopamine dynamics fluctuate across sleep-wake transitions and in transitions between sleep states. To achieve this, the authors used multi-channel fiber photometry and a genetically encoded fluorescent dopamine reporter to simultaneously measure dopamine dynamics in 8 brain regions. They also used EEG measurements to precisely quantify and time transitions between sleep states and wakefulness. Finally, the authors used channelrhodopsin to examine dopamine dynamics following subregion stimulation and chemogenetics to test the causal relationship between activation of distinct dopamine neuron populations and their effects on sleep state.
The conclusions made by the authors in this study are modest and appropriate given the largely observational nature of the principal findings. The use of optogenetics to probe regional dopamine signaling following activation of distinct nuclei is interesting, but not entirely novel and constrained in interpretability. Similarly, the chemogenetics experiment largely confirms previous studies, which the authors correctly cited in the text.
The principal findings of this study are based on strong methodological and analytical methods. Implanting 8 optical fibers in a single mouse, along with EEG/EMG electrodes, is technically challenging, providing valuable, simultaneous measurements of dopamine fluctuations across the brain. This enables the strong correlational and time-locked analyses performed by the authors in Figure 2. What's more, the use of EEG/EMG electrodes provides time-locked descriptions of sleep states, enabling precise comparisons between the dopamine signal and sleep state transitions.
The paper has some weaknesses that the authors could address. The analyses in Figure 1 could be strengthened to show how dopamine changes during transitions between specific sleep states. The injection sites for channelrhodopsin and chemogenetic viruses could be validated to strengthen the interpretation of those results. Also, a stronger justification for the experiments conducted in Figure 3 could be provided, as they seem unrelated to the present study.
Overall, this study has strong descriptive power, convincingly showing how dopamine fluctuates across sleep states. Some of the other aspects of the paper, however, are somewhat limited in novelty and interpretation.
The analyses in Figure 1 could be strengthened to show how dopamine changes during transitions between specific sleep states.
We appreciate the reviewer’s thoughtful suggestion. We agree that the directionality and kinetics of dopamine changes during sleep/wake transitions may provide important information beyond state-level dopamine quantification.
In this study, mice were recorded for 4–5 h during each sleep session. Across the recording period, mice frequently transitioned from NREM to WAKE, WAKE to NREM, NREM to REM, and REM to WAKE. Transitions from WAKE to REM were rarely observed and therefore were not included in the transition analysis. Accordingly, we focused our analysis on the four major transition types: NREM-to-WAKE, WAKE-to-NREM, NREM-toREM, and REM-to-WAKE [4,9,11].
For each transition type, dopamine dynamics were analyzed separately by aligning the zscored GRAB-DA2m signal to the transition onset and averaging across all epochs of the same transition type. To minimize the influence of brief or unstable state fluctuations, we excluded transitions in which either the preceding or following sleep/wake epoch lasted less than 30 s. The resulting transition-triggered dopamine traces were then averaged across sessions and mice for each transition type independently.
Thus, the transition analysis preserves the directionality of state changes rather than pooling all sleep/wake transitions together. Because dopamine signals differ across behavioral states, transitions between neighboring states produce distinct temporal profiles when aligned to the transition point [4,9-11]. For example, REM-to-WAKE transitions may show a rapid increase in dopamine in the mPFC, whereas WAKE-to-NREM or NREM-to-REM transitions may show slower and more modest decreases. These transition - specific kinetics may reflect distinct underlying mechanisms, including changes in dopamine neuron firing or local terminal modulation.
The injection sites for channelrhodopsin and chemogenetic viruses could be validated to strengthen the interpretation of those results.
We agree with the reviewer that precise histological validation is essential for the correct interpretation of our optogenetic and chemogenetic findings.
Regarding the chemogenetic experiments, as noted, we provide examples of virus expression in the VTA, DRN, and SNc in Figure 4. By demonstrating the consistency and restriction of our targeting across the entire cohort (VTA, SNc, and DRN), we confirmed that our observed sleep effects were regionally specific. Our data only included mice with accurate targeting and no substantial virus "leakage" into adjacent nuclei.
We thank the reviewer for this insightful observation regarding the regional dopamine (DA) responses following SNc stimulation. While the SNc is traditionally associated with the dorsal striatum (DLS), several studies have demonstrated that SNc dopaminergic neurons also project to the nucleus accumbens, particularly the lateral shell [12,13]. Furthermore, recent work characterizing the functional heterogeneity of midbrain DA neurons suggests that SNc subpopulations can drive significant DA release in ventral striatal subregions [14]. We appreciate the reviewer’s caution regarding potential off-target effects. While our histological criteria for validation post recordings were stringent, we acknowledge that in any midbrain manipulation, the close anatomical proximity of the VTA and SNc makes it technically challenging to guarantee zero involvement of neighboring VTA neurons. However, by using mice with the most restricted virus expression and fibers targeting, we have minimized this potential confound as much as is technically feasible with current viral and optogenetic methods.
Also, a stronger justification for the experiments conducted in Figure 3 could be provided, as they seem unrelated to the present study.
We thank the reviewer for this comment. The experiments in Figure 3 were designed to systematically map the sources of dopaminergic inputs to key brain regions examined in this study [15], including the mPFC, DLS, NAc, and CeA. Establishing these input–output relationships is important for interpreting the photometry signals observed during sleep– wake transitions.
Specifically, we found that optogenetic activation of VTA dopaminergic neurons elicits DA responses in all four regions, whereas activation of DRN dopaminergic neurons induces responses in the mPFC, DLS, and CeA, and activation of SNc dopaminergic neurons induces responses in the mPFC, NAc, and DLS. These results reveal partially overlapping but distinct projection patterns across dopaminergic populations.
Taken together, these data provide a circuit-level framework suggesting that VTA, SNc, and DRN dopaminergic neurons may contribute differentially and with distinct weights to the DA signals observed in these regions during sleep wake transitions.
Overall, this study has strong descriptive power, convincingly showing how dopamine fluctuates across sleep states. Some of the other aspects of the paper, however, are somewhat limited in novelty and interpretation.
We appreciate the reviewer’s assessment that our study convincingly demonstrates how dopamine fluctuates across sleep states. We agree that the primary contribution of this work is descriptive and foundational. At the same time, we respectfully emphasize that rigorous, comprehensive descriptive studies are essential, particularly when addressing phenomena that have not been systematically characterized. Prior to this work, dopamine dynamics during natural sleep–wake transitions had not been measured simultaneously across multiple brain regions.
Our multi-site photometry approach advances the field in several important ways. Technically, the combination of simultaneous eight-region fiber photometry with EEG/EMG recordings represents a substantial methodological advance, enabling brainwide, network-level analysis of dopamine dynamics during natural state transitions. This approach reveals emergent features—such as temporal coordination and inter-regional lead–lag relationships—that cannot be captured using single-site recordings. Moreover, integrating brain-wide measurements with region-specific manipulations allows circuitlevel insights that would not be accessible from either approach alone.
Conceptually, our findings revealed the region, sleep/wake transition type -specific and bidirectional dopamine dynamics, instead of the prevailing view of dopamine as a uniform arousal signal: dopamine decreases in certain limbic regions, such as the central amygdala and nucleus accumbens lateral shell, during arousal transitions, while increasing in cortical and other striatal regions. These results refine simplified models of dopaminergic regulation of arousal. In addition, our data reveal differential circuit contributions, with the VTA and DRN—but not the SNc—promoting wakefulness, highlighting functional specialization within the dopamine system.
We acknowledge that some aspects of our study, including the optogenetic mapping and chemogenetic experiments, build on established methodologies and in part confirm prior findings. However, these experiments also provide several new insights. First, whereas individual dopamine sources have often been studied in isolation, our systematic comparison across VTA, SNc, and DRN using consistent methods reveals distinct brainwide functional contributions that were not previously established. Second, our optogenetic mapping does not simply recapitulate known projection patterns, but instead uncovers quantitative differences in dopamine release kinetics and magnitude across source–target pairs, which inform the heterogeneity of the transition dynamics. Finally, our findings provide a crucial anatomical and temporal framework for future research on the specific mechanisms driving these dynamics and their precise functional consequences.
References:
(1) Sun, F. et al. Next-generation GRAB sensors for monitoring dopaminergic activity in vivo. Nat Methods 17, 1156-1166, doi:10.1038/s41592-020-00981-9 (2020).
(2) Ihalainen, J. A., Riekkinen, P., Jr. & Feenstra, M. G. Comparison of dopamine and noradrenaline release in mouse prefrontal cortex, striatum and hippocampus using microdialysis. Neurosci Lett 277, 71-74, doi:10.1016/s0304-3940(99)00840-x (1999).
(3) Berridge, C. W. & Abercrombie, E. D. Relationship between locus coeruleus discharge rates and rates of norepinephrine release within neocortex as assessed by in vivo microdialysis. Neuroscience 93, 1263-1270, doi:10.1016/s0306-4522(99)00276-6 (1999).
(4) Silverman, D. et al. Activation of locus coeruleus noradrenergic neurons rapidly drives homeostatic sleep pressure. Sci Adv 11, eadq0651, doi:10.1126/sciadv.adq0651 (2025).
(5) Anaclet, C. et al. The GABAergic parafacial zone is a medullary slow wave sleeppromoting center (vol 17, pg 1217, 2014). Nat Neurosci 17, 1841-1841, doi:DOI 10.1038/nn1214-1841d (2014).
(6) Ma, C. Y. et al. Microglia regulate sleep through calcium-dependent modulation of norepinephrine transmission. Nat Neurosci 27, 249-258, doi:10.1038/s41593-02301548-5 (2024).
(7) Traut, J. et al. Effects of clozapine-N-oxide and compound 21 on sleep in laboratory mice. Elife 12, doi:10.7554/eLife.84740 (2023).
(8) Grace, A. A., Floresco, S. B., Goto, Y. & Lodge, D. J. Regulation of firing of dopaminergic neurons and control of goal-directed behaviors. Trends Neurosci 30, 220-227, doi:10.1016/j.tins.2007.03.003 (2007).
(9) Darmohray, D. et al. Brainstem circuit for sickness-induced sleep. Sci Adv 11, doi:ARTN eady024510.1126/sciadv.ady0245 (2025).
(10) Hasegawa, E. et al. Rapid eye movement sleep is initiated by basolateral amygdala dopamine signaling in mice. Science 375, 994-+, doi:10.1126/science.abl6618 (2022).
(11) Ding, X. et al. Neuroendocrine circuit for sleep-dependent growth hormone release. Cell 188, 4968-4979 e4912, doi:10.1016/j.cell.2025.05.039 (2025).
(12) Poulin, J. F. et al. Mapping projections of molecularly defined dopamine neuron subtypes using intersectional genetic approaches. Nat Neurosci 21, 1260-1271, doi:10.1038/s41593-018-0203-4 (2018).
(13) Lerner, T. N. et al. Intact-Brain Analyses Reveal Distinct Information Carried by SNc Dopamine Subcircuits. Cell 162, 635-647, doi:10.1016/j.cell.2015.07.014 (2015).
(14) Azcorra, M. et al. Unique functional responses differentially map onto genetic subtypes of dopamine neurons. Nat Neurosci 26, 1762-1774, doi:10.1038/s41593023-01401-9 (2023).
(15) Eban-Rothschild, A., Rothschild, G., Giardino, W. J., Jones, J. R. & de Lecea, L. VTA dopaminergic neurons regulate ethologically relevant sleep-wake behaviors. Nat Neurosci 19, 1356-1366, doi:10.1038/nn.4377 (2016).
This is way different from Janie’s past relationships
Some rabbits scurried through the quarters going east. Some possums slunk by and their route was definite. One or two at a time, then more. By the time the people left the fields the procession was constant. Snakes, rattlesnakes began to cross the quarters. The men killed a few, but they could not be missed from the crawling horde. People stayed indoors until daylight. Several times during the night Janie heard the snort of big animals like deer. Once the muted voice of a panther.
Animals know and can sense the hurricane happen and is real
Sita Sings the Blues
Sita Sings the Blues has an interesting mix of ancient and modern views of masculinity, as the source text Ramyana was very heavy in its views of gender roles. Sita is a damsel in distress character without a real voice even, mirroring how Nina Paley felt about her relationship, and she depends on Rama for everything, being made to serve him as his wife. Rama is meant to be an extremely masculine figure, who follows his duties perfectly and deals with hardships flawlessly. By way of his isolation due to exile, it makes him similar to modern heroes such as Spider-Man who is known for working alone. Both are tragic heroes who have been delt bad hands in life, Rama , through his spiteful stepmother and exile, and Spider-Man through his "Parker luck." Their love interests are also used similarly. When Sita is kidnapped, it gives Rama a reason to dominate the king Ravana via combat, to show that he is more of a man. Spider-Man's most infamous love interest, Gwen Stacy is also the victim of kidnapping although for different reasons. In the Spider-Man's case, instead of him proving himself as more of a man than the Green Goblin, fails. It becomes a great shame for the hero for over five decades. Both Gwen Stacy and Sita are victims because of the men they love and are used as weak spots for them. The difference with Spider-Man, that shows change in modern perspective of masculinity is that he not seen as weak for his failures nor is he any less popular. In fact, Spider-Man who was created by Stan Lee and Steve Ditko who was created with the intention of not being a stereotypically masculine superhero is one of the most, if not the most, popular modern heroes. While Rama is valued for being perfect, Spider-Man is valued for being flawed and human.
CC BY
eLife Assessment
The study presents important findings revealing previously unresolved conformational dynamics of the heterodimeric type IV ABC transporter TmrAB using single-molecule FRET. The evidence presented is solid, integrating careful experimental design with computational approaches to uncover states that are typically masked and difficult to detect. The work will be of interest to scientists studying the molecular mechanisms of primary active transport processes.
Reviewer #1 (Public review):
Summary:
Pecak et al have deciphered the conformational dynamics of a heterodimeric model ABC transporter, TmrAB, a functional homolog of the human antigen transporter TAP, using single-molecule Forster resonance energy and fluorophores attached to residues at either nucleotide binding domains or periplasmic gate. The analysis not only differentiated ATP-free and bound states but also enabled the real-time monitoring of protein conformational changes, precisely dissecting transport cycles and resolving transient intermediates. This study is absolutely significant in providing and establishing a general pipeline delineating the conformational dynamics in heterodimeric ABC transporters.
Strengths:
The scientific study is very well documented for experimental design, results, and conclusions supported by the experimental data. The authors have determined the conformational dynamics of TmrAB across different ATP concentrations, including physiological ones, and resolved an outward open state and other conformational states consistent with previous cryoEM and DEER studies.
Weaknesses:
The scientific study needs a bit of in-depth analysis with respect to consistency in Kd and its implications on the mechanism.
Reviewer #2 (Public review):
In their manuscript entitled 'ATP-driven conformational dynamics reveal hidden intermediates in a heterodimeric ABC transporter', Pečak et al. use elegant single-molecule FRET experiments in detergent to investigate the heterodimeric ABC transporter TmrAB. By combining simulations of the transporter's accessible volume with elegant trapping strategies, the authors identify an unresolved outward-facing open state and conclude that it is usually obscured by a rapidly interconverting ATP-bound ensemble. Overall, the study demonstrates that smFRET can resolve the short-lived intermediate states of TmrAB and potentially other ABC transporters that are obscured in ensemble measurements.
It is a very interesting study that highlights the power of combining high-resolution structural information with spectroscopic approaches. I have three major points and a few minor criticisms.
Major points:
(1) The main weakness is that the authors base their conclusions on a very limited set of FRET pairs. While TmrAB has been extensively studied in terms of its structure, the authors should at least acknowledge this limitation more clearly.
(2) Most smFRET distributions were fitted with one, two, or three Gaussians. However, in several cases, additional populations with noticeable amplitudes appear to be present (e.g., Figure 3c at 0.1 mM and 3 mM ATP; Figure 4a, apo; Figure 4c, 0.3 mM R9L). Could the authors clarify why these populations were not included in the analysis?
(3) Figure 3c (3 mM ATP): Is it truly possible to distinguish the two states in this distribution?
Author response:
Public Reviews:
Reviewer #1 (Public review):
Summary:
Pecak et al have deciphered the conformational dynamics of a heterodimeric model ABC transporter, TmrAB, a functional homolog of the human antigen transporter TAP, using single-molecule Forster resonance energy and fluorophores attached to residues at either nucleotide binding domains or periplasmic gate. The analysis not only differentiated ATP-free and bound states but also enabled the real-time monitoring of protein conformational changes, precisely dissecting transport cycles and resolving transient intermediates. This study is absolutely significant in providing and establishing a general pipeline delineating the conformational dynamics in heterodimeric ABC transporters.
We thank the reviewer for this accurate and thoughtful summary of our work and its broader significance. We agree that the combination of single-molecule FRET with orthogonal validation approaches enables mechanistic resolution of conformational states and transitions that are not accessible by ensemble measurements. In particular, this framework allows direct discrimination of ATP-free and ATP-bound conformations, real-time tracking of transport cycle progression, and identification of transient intermediates in the heterodimeric ABC transporter TmrAB. We further agree that these capabilities support a generalizable strategy for dissecting conformation dynamics in related ABC transporters.
Strengths:
The scientific study is very well documented for experimental design, results, and conclusions supported by the experimental data. The authors have determined the conformational dynamics of TmrAB across different ATP concentrations, including physiological ones, and resolved an outward open state and other conformational states consistent with previous cryoEM and DEER studies.
Weaknesses:
The scientific study needs a bit of in-depth analysis with respect to consistency in K<sub>d</sub> and its implications on the mechanism.
The apparent K<sub>d,ATP</sub> values were determined using two complementary approaches that report on different aspects of the system. Ensemble FRET measurements yielded values of 51° ± 38° µM (TmrAB<sup>NBD</sup>), 68° ± 25° µM (TmrAB<sup>PG</sup>), and 95° ± 26° µM (TmrAB<sup>PG_EQ</sup>), which are in good agreement with previously reported biochemical estimates (~100° µM for TmrAB<sup>EQ</sup>) (Stefan et al, 2020). The slightly elevated value observed for the E→Q variant may reflect modest perturbation of nucleotide handling in this slow-turnover background. Notably, the close agreement between labeled and unlabeled variants indicates that fluorophore attachment does not measurably affect ATP binding.
In contrast, smFRET-derived K<sub>d,ATP</sub> values (13° ± 1° µM for TmrAB<sup>NBD</sup> and 2° ± 1° µM for TmrAB<sup>PG</sup>) are systematically lower. This difference likely arises from the difficulty of deconvoluting overlapping FRET populations at sub-K<sub>d,ATP</sub> concentrations, particularly for TmrAB<sup>PG</sup>, where state assignment is less well separated. Despite this quantitative offset, both approaches consistently indicate ATP saturation well below physiological concentrations and therefore support the same mechanistic conclusion that ATP binding drives conformational switching in TmrAB.
Reviewer #2 (Public review):
In their manuscript entitled 'ATP-driven conformational dynamics reveal hidden intermediates in a heterodimeric ABC transporter', Pečak et al. use elegant single-molecule FRET experiments in detergent to investigate the heterodimeric ABC transporter TmrAB. By combining simulations of the transporter's accessible volume with elegant trapping strategies, the authors identify an unresolved outward-facing open state and conclude that it is usually obscured by a rapidly interconverting ATP-bound ensemble. Overall, the study demonstrates that smFRET can resolve the short-lived intermediate states of TmrAB and potentially other ABC transporters that are obscured in ensemble measurements.
It is a very interesting study that highlights the power of combining high-resolution structural information with spectroscopic approaches. I have three major points and a few minor criticisms.
We thank the reviewer for the thoughtful and constructive evaluation of our manuscript and for highlighting the strength of combining structural and single-molecule approaches. We have addressed all major and minor points in detail below and revised the manuscript where appropriate to clarify limitations, justify analysis choices, and improve transparency.
Major points:
(1) The main weakness is that the authors base their conclusions on a very limited set of FRET pairs. While TmrAB has been extensively studied in terms of its structure, the authors should at least acknowledge this limitation more clearly.
We agree that our conclusions are based on a limited number of FRET reporter pairs, and we now explicitly state this limitation in the revised manuscript. The chosen labeling positions were selected to probe two functionally critical regions—the nucleotide-binding domains and the periplasmic gate—based on prior structural and spectroscopic evidence. While this represents sparse sampling of the full conformational space, it is consistent with typical smFRET studies of membrane transporters, where experimental constraints generally limit the number of simultaneously accessible labeling positions (Asher et al, 2021; Asher et al, 2022; Levring et al, 2023; Wang et al, 2020).
Importantly, both independent reporter variants yield consistent ATP-dependent population shifts, supporting the robustness of the observed trends. We further clarify that additional labeling sites could, in principle, resolve finer structural sub-states; however, given the already limited population separation in the current variants, such extensions would likely provide diminishing returns in state resolvability under the present experimental conditions. This trade-off is now explicitly discussed.
(2) Most smFRET distributions were fitted with one, two, or three Gaussians. However, in several cases, additional populations with noticeable amplitudes appear to be present (e.g., Figure 3c at 0.1 mM and 3 mM ATP; Figure 4a, apo; Figure 4c, 0.3 mM R9L). Could the authors clarify why these populations were not included in the analysis?
We thank the reviewer for this careful observation. Low-amplitude subpopulations are occasionally detected in individual histograms; however, they were not included in the quantitative model because they do not meet criteria for reproducibility, amplitude robustness, or structural assignability. Specifically, these features vary between replicates, contribute minimally to total population, and cannot be mapped to structurally or biochemically defined states based on available cryo-EM (Hofmann et al, 2019), DEER/PELDOR (Barth et al, 2018; Barth et al, 2020), or accessible-volume simulations.
Similar minor subpopulations have been reported in smFRET studies and often attributed to photophysical or labeling heterogeneity effects (Asher et al, 2022; Husada et al, 2018). To avoid over-parameterization, we therefore restricted analysis to reproducible, structurally supported states. This rationale is now clarified in the revised manuscript.
(3) Figure 3c (3 mM ATP): Is it truly possible to distinguish the two states in this distribution?
We agree that state separation in the TmrAB<sup>PG</sup> variant is limited (ΔE° = °0.11), and we now explicitly acknowledge this constraint in the manuscript. To improve robustness under these conditions, we used a constrained fitting strategy in which the apo-state distribution was fixed from nucleotide-free measurement, reducing parameter degeneracy during fitting of ATP-bound datasets.
While single-molecule trajectory-based approaches such as Hidden Markov Modeling would be ideal for resolving dynamic interconversion, this was not feasible due to the low fraction of dynamic traces at the available temporal resolution. We therefore rely on population-level analysis, which remains consistent across replicates and reporter variants.
Notably, independent measurements from two reporter positions (TmrAB<sup>NBD</sup> and TmrAB<sup>PG</sup>) yield similar ATP-bound population fractions at saturating ATP concentrations (~77% vs. ~80%), supporting the robustness of the inferred state distribution despite partial overlap.
References
Asher WB, Geggier P, Holsey MD, Gilmore GT, Pati AK, Meszaros J, Terry DS, Mathiasen S, Kaliszewski MJ, McCauley MD, Govindaraju A, Zhou Z, Harikumar KG, Jaqaman K, Miller LJ, Smith AW, Blanchard SC, Javitch JA (2021) Single-molecule FRET imaging of GPCR dimers in living cells. Nat Methods 18: 397–405. doi:10.1038/s41592-021-01081-y
Asher WB, Terry DS, Gregorio GGA, Kahsai AW, Borgia A, Xie B, Modak A, Zhu Y, Jang W, Govindaraju A, Huang LY, Inoue A, Lambert NA, Gurevich VV, Shi L, Lefkowitz RJ, Blanchard SC, Javitch JA (2022) GPCR-mediated beta-arrestin activation deconvoluted with single-molecule precision. Cell 185: 1661–1675 e1616. doi:10.1016/j.cell.2022.03.042
Barth K, Hank S, Spindler PE, Prisner TF, Tampé R, Joseph B (2018) Conformational coupling and trans-inhibition in the human antigen transporter ortholog TmrAB resolved with dipolar EPR spectroscopy. J Am Chem Soc 140: 4527–4533. doi:10.1021/jacs.7b12409
Barth K, Rudolph M, Diederichs T, Prisner TF, Tampé R, Joseph B (2020) Thermodynamic basis for conformational coupling in an ATP-binding cassette exporter. J Phys Chem Lett 11: 7946–7953. doi:10.1021/acs.jpclett.0c01876
Hofmann S, Januliene D, Mehdipour AR, Thomas C, Stefan E, Brüchert S, Kuhn BT, Geertsma ER, Hummer G, Tampé R, Moeller A (2019) Conformation space of a heterodimeric ABC exporter under turnover conditions. Nature 571: 580–583. doi:10.1038/s41586-019-1391-0
Husada F, Bountra K, Tassis K, de Boer M, Romano M, Rebuffat S, Beis K, Cordes T (2018) Conformational dynamics of the ABC transporter McjD seen by single-molecule FRET. EMBO J 37: e100056. doi:10.15252/embj.2018100056
Levring J, Terry DS, Kilic Z, Fitzgerald G, Blanchard SC, Chen J (2023) CFTR function, pathology and pharmacology at single-molecule resolution. Nature 616: 606–614. doi:10.1038/s41586-023-05854-7
Nocker C, Pečak M, Nocker T, Fahim A, Sušac L, Tampé R (2026) Single-molecule dynamics reveal ATP binding alone powers substrate translocation by an ABC transporter. Nat Commun 17 doi:10.1038/s41467-026-70021-1
Nöll A, Thomas C, Herbring V, Zollmann T, Barth K, Mehdipour AR, Tomasiak TM, Bruchert S, Joseph B, Abele R, Olieric V, Wang M, Diederichs K, Hummer G, Stroud RM, Pos KM, Tampé R (2017) Crystal structure and mechanistic basis of a functional homolog of the antigen transporter TAP. Proc Natl Acad Sci U S A 114: E438–E447. doi:10.1073/pnas.1620009114
Stefan E, Hofmann S, Tampé R (2020) A single power stroke by ATP binding drives substrate translocation in a heterodimeric ABC transporter. eLife 9: e55943. doi:10.7554/eLife.55943
Wang L, Johnson ZL, Wasserman MR, Levring J, Chen J, Liu S (2020) Characterization of the kinetic cycle of an ABC transporter by single-molecule and cryo-EM analyses. eLife 9: e56451. doi:10.7554/eLife.56451
Le réchauffement climatique, processus aux conséquences de très longue durée, lui, n’a guère de chances d’être sérieusement traité tant que les esprits seront soumis au réchauffement médiatique qui encourage la haute fréquence et le court terme.
Lien entre accélération médiatique et incapacité collective à penser les problèmes à long terme
The authors mention a single gene, lpp0194, encoding an integrase/excisionase. However, in previous publications, two genes are listed (lpp0193 for the excisionase and lpp1094 for the integrase). Unless I am mistaken, the authors did not mention this lpp0193 gene. How do the authors explain that inactivation of the integrase (lpp0194 gene) leads to a deficiency in the excision of pP36 from the chromosome, even though the excisionase gene (lpp0193) of the ICE has not been modified? Is there really only a single mutation in the entire ICE? Was the entire ICE region sequenced in the mutant to verify the absence of secondary mutations?
Version 3 of this preprint has been peer-reviewed and recommended by Peer Community in Infections.<br /> See the peer reviews and the recommendation.
Maint. Objects
This tab is now called Customizing Activity
Attributes
This tab is now called Customizing Attributes
Switch to the Attributes tab
This tab is now called Customizing Attributes
A simulated sports equity trading platform where users trade team stocks during live NFL and college football seasons with no financial risk but real cash prizes. Currently in component deep-dive phase — vision extracted and reviewed, componen
iubsadbosiadubsda
enjeu bien plus large
peut-être un peu vague ?
Regards croisés sur l’ÉVARS
Ajouter la référence
algoritmo de Dijkstra
pendiente para su referencia
Vebindung
Verbindung
Since she hate black folks so, she don’t need our money in her ol’ eatin’ place. Ah’ll pass de word along.
They won’t be spending their money at her racist restaurant if they don’t like blacks there, and he’ll make sure to let everyone else know.
The season closed and people went away like they had come—in droves. Tea Cake and Janie decided to stay since they wanted to make another season on the muck. There was nothing to do, after they had gathered several bushels of dried beans to save over and sell to the planters in the fall. So Janie began to look around and see people and things she hadn’t noticed during the season.
The day and people was really busy and they all calmed down and cooled off a little after everything was done
Embeddingに変換する
これも
Embeddingしベクトルに変換する
バッチ処理でEmbeddingに変換する
バッチ処理でEmbeddingし、ベクトルに変換する
Janie had robbed him of his illusion of irresistible maleness that all men cherish, which was terrible.
Joe is a control freak due to his anxieties and insecurities. Now, he sees Janie's defiance of him, and the townspeople's ridicule, as an existential threat to his control. This brings his deep-seated fear of losing control back up to the forefront of his mind.
Reviewer #2 (Public review):
Summary:
Chen and colleagues conducted a cross-sectional longitudinal study, administering high-definition transcranial direct stimulation (HD-tDCS) targeting the left DLPFC to examine the effect of HD-tDCS on real-world procrastination behavior. They find that seven sessions of active neuromodulation to the left DLPFC elicited greater modulation of procrastination measures (e.g., task-execution willingness, procrastination rates, task aversiveness, outcome value) relative to sham. They show that HD-tDCS reduces task aversiveness and increases task-execution willingness on real-world tasks as quantified by intensive experience sampling methods, providing causal evidence for the role of DLPFC in modulating contextual features to delaying or completing one's goals.
Strengths:
This is a well-designed protocol with rigorous administration of high-definition transcranial direct current stimulation across multiple sessions. The intensive experience sampling approach which probes and assesses self-relevant task goals is innovative and aims to address an important question regarding the specific role of DLPFC in modulating specific features of chronic procrastination behavior (e.g., task-execution willingness, task aversiveness).
The quantification of task aversiveness through AUC metrics is a clever approach to account for the temporal dynamics of task aversiveness, which is notoriously difficult to quantify.
Weaknesses:
While the findings that neurostimulation reduces procrastination behavior is compelling, there remain several alternative interpretations for these effects. For example, it could be that the task-execution willingness isn't increased per se, but rather that the goal completion becomes more valuable as participants learn from feedback or become more aware of their successful attainment of or failure to complete task goals. It is unclear whether the effects could be driven by improved working memory or attention to the reported tasks (and this limitation is addressed by the authors). In short, it is also difficult to examine the temporal dynamics of how these goals are selected across time.
It is unclear whether the current evidence support long-retention of this neurostimulation intervention. The study includes one 6-month timepoint after the study to examine the long-term retention of the neural stimulation effect. Future studies that evaluate the long-term effects across multiple time points would strengthen the evidence for the robustness of this intervention.
A month later she was dead.
Wow the grandmother wasn’t joking that she was going to die soon after Janie got married.
Madame SosostrisMadame Sosostris The name Madame Sosostris is reminiscent of Sesostris, the Sorceress of Ecbatana, from Aldous Huxley’s novel Crome Yellow, which was published in late 1921 while Eliot was working on The Waste Land. In Huxley’s novel, Sesostris, the Sorceress of Ecbatana is the moniker Mr. Scogan uses when he masquerades as a woman who tells fortunes at a fair. This cross-dressing gender play foreshadows the sexual ambiguity of the Tiresias figure, who appears later in the poem and whom some scholars take as its central consciousness. Madame Sosostris’s clairvoyance, even if she is merely a charlatan seer, further solidifies her connection to Tiresias and to the Cumaean Sibyl in the poem’s epigraph (taken from Petronius’s Satyricon)., famous clairvoyante,
The involvement of the fortune teller reflects the desperation of the modern era. People nowadays have lost faith in traditional religion so they have the urge to turn to a cheap spirituality and superstitions to find answers. It shows how low society now has fallen, like seeking guidance from a woman with so called "wicked pack with cards" instead of true wisdom of religion.
I will show you fear in a handful of dust.
Dust usually symbolises physical death which is commonly known as "ashes to ashes," but in this line, it feels more like the insignificance of the human existence. The "fear" there is not just about dying but it also about the realization that life might not be nothing more than dry, empty dust without any higher spiritual meaning.
Figure 1
GREAT FIGURE!
While there are healthy ways of sharing difficult emotions and experiences (see the next section), when these difficult emotions and experiences are thrown at unsuspecting and unwilling audiences, that is called trauma dumping [m11]. Social media can make trauma dumping easier. For example, with parasocial relationships, you might feel like the celebrity is your friend who wants to hear your trauma. And with context collapse, where audiences are combined, how would you share your trauma with an appropriate audience and not an inappropriate one (e.g., if you re-post something and talk about how it reminds you of your trauma, are you dumping it on the original poster?).
This passage gives an important perspective on how social media can blur the boundaries between healthy emotional sharing and “trauma dumping.” It explains how parasocial relationships and large online audiences can make people overshare personal struggles without considering the impact on others. I think the passage is effective because it encourages people to think more carefully about online communication, empathy, and emotional boundaries.
Vision document extracted from 2-hour workshop
Testing, testing
“That’s what we’ve seen happening in Virginia, where every data center job creates six jobs in the local economy,” Vaquero said. Such figures are contested by economists, who argue they are based on modeling assumptions that overstate real-world impacts and conflates construction jobs with permanent ones.
6:1is HUUUGE.
Eigenvector Metal Etch(LAM 9600)
过于简单,但是经典,可以作为toy case使用,不可作为大case
IIoT 饮料灌装产线数据集(Zenodo 2025
考虑做生产时序建模与质量管理相关的研究
MixedWM38(混合型晶圆 Map)
考虑与WM811K综合使用,产出复合故障诊断论文
CellProfiler pipelines.
Peer Review File for the first revision.
https://figshare.com/articles/online_resource/Cell_profiler_pipelines_and_reviewer_comments/31753408
https://k51qzi5uqu5dj8hkrwg9fd9g4khdcp2mu5koizmx610l7ov49536s8ldbq2nih.ipns.dweb.link/2026/03/26/indy.%F0%9F%8C%90.0/
http://webui.ipfs.io.ipns.localhost:8080/#/files/%F0%9F%92%BB/thinkpad/%F0%9F%A7%8A/me/%F0%9F%93%93
💻/thinkpad/🧊/me/📓/2026/03/26/indy.🌐.0/
WCAG 4.5:1 ratio
Contrast ratio of 4.5:1 means that the foreground text colour should be at least 4.5 times brighter (or darker) than the background.
You can check on: https://webaim.org/resources/contrastchecker/
It had now been replicated in 💻/thinkpad/🧊/me/📓/2026/03/26
http://webui.ipfs.io.ipns.localhost:8080/#/files/%F0%9F%92%BB/thinkpad/%F0%9F%A7%8A/me/%F0%9F%93%93/2026/03/26/indy.%F0%9F%8C%90.0/
hello
/💻/thinkpad/🧊/♖/hyperpost/1/I/📓/2026/03/26/indy.🌐.0
"The power of instruction is seldom of much efficacy except in those happy dispositions where it is almost superfluous.” (Gibbon)
teaching efficacy superflous
n these works the categories of sexuality and gender are stabilized into normative notions of cisheterosexuality
Acknowledges that queer people are not absent from the conversation or research but there is a default to cisheterosexuality as normative.
ittle space is given to the way sex and sexuality shape or are shaped by rhetorical listening or how rhetorical listening shifts the way we think about sex, sexuality, and transgender issues
Addressing the lack of attention to sex, sexuality and gender identity in the original framing rhetorical listening
To do this we can either override our data frame df or create a new data frame by assigning the output with the <- operator.
Remove the first alternative! Interferes with the next exploratory steps!
Apple Pay with iFrames
Not needed in this page at all since we re-direct user to a new Razorpay page

RRID:AB_477010
DOI: 10.1186/s40478-026-02240-y
Resource: (Sigma-Aldrich Cat# G3893, RRID:AB_477010)
Curator: @scibot
SciCrunch record: RRID:AB_477010
RRID:AB_2572311
DOI: 10.1186/s40478-026-02240-y
Resource: (EnCor Biotechnology Cat# MCA-5C10, RRID:AB_2572311)
Curator: @scibot
SciCrunch record: RRID:AB_2572311
RRID:AB_3678889
DOI: 10.1186/s40478-026-02240-y
Resource: RRID:AB_3678889
Curator: @scibot
SciCrunch record: RRID:AB_3678889
RRID:AB_2109953
DOI: 10.1186/s40478-026-02240-y
Resource: (EnCor Biotechnology Cat# CPCA-GFAP, RRID:AB_2109953)
Curator: @scibot
SciCrunch record: RRID:AB_2109953
RRID:AB_2050678
DOI: 10.1186/s40478-026-02240-y
Resource: (Enzo Life Sciences Cat# BML-FG6090-0100, RRID:AB_2050678)
Curator: @scibot
SciCrunch record: RRID:AB_2050678
RRID:AB_3678888
DOI: 10.1186/s40478-026-02240-y
Resource: RRID:AB_3678888
Curator: @scibot
SciCrunch record: RRID:AB_3678888
RRID:AB_3711244
DOI: 10.1186/s40478-026-02240-y
Resource: RRID:AB_3711244
Curator: @scibot
SciCrunch record: RRID:AB_3711244
RRID:AB_10013382
DOI: 10.1186/s40478-026-02240-y
Resource: (Agilent Cat# Z0334, RRID:AB_10013382)
Curator: @scibot
SciCrunch record: RRID:AB_10013382
AB_330248
DOI: 10.1016/j.isci.2026.115716
Resource: (Cell Signaling Technology Cat# 3671, RRID:AB_330248)
Curator: @scibot
SciCrunch record: RRID:AB_330248
AB_2534079
DOI: 10.1016/j.isci.2026.115716
Resource: (Thermo Fisher Scientific Cat# A-11012, RRID:AB_2534079)
Curator: @scibot
SciCrunch record: RRID:AB_2534079
AB_2249358
DOI: 10.1016/j.isci.2026.115716
Resource: (Cell Signaling Technology Cat# 3629, RRID:AB_2249358)
Curator: @scibot
SciCrunch record: RRID:AB_2249358
AB_561053
DOI: 10.1016/j.isci.2026.115716
Resource: (Cell Signaling Technology Cat# 2118, RRID:AB_561053)
Curator: @scibot
SciCrunch record: RRID:AB_561053
AB_2798136
DOI: 10.1016/j.isci.2026.115716
Resource: (Cell Signaling Technology Cat# 13166, RRID:AB_2798136)
Curator: @scibot
SciCrunch record: RRID:AB_2798136
AB_2800199
DOI: 10.1016/j.isci.2026.115716
Resource: (Cell Signaling Technology Cat# 93065, RRID:AB_2800199)
Curator: @scibot
SciCrunch record: RRID:AB_2800199
AB_2534069
DOI: 10.1016/j.isci.2026.115716
Resource: (Thermo Fisher Scientific Cat# A-11001, RRID:AB_2534069)
Curator: @scibot
SciCrunch record: RRID:AB_2534069
AB_10839118
DOI: 10.1016/j.isci.2026.115716
Resource: (Cell Signaling Technology Cat# 2500, RRID:AB_10839118)
Curator: @scibot
SciCrunch record: RRID:AB_10839118
AB_10013641
DOI: 10.1016/j.isci.2026.115716
Resource: (Cell Signaling Technology Cat# 6943, RRID:AB_10013641)
Curator: @scibot
SciCrunch record: RRID:AB_10013641
AB_2174466
DOI: 10.1016/j.isci.2026.115716
Resource: (Cell Signaling Technology Cat# 2541, RRID:AB_2174466)
Curator: @scibot
SciCrunch record: RRID:AB_2174466
AB_2160882
DOI: 10.1016/j.isci.2026.115716
Resource: (Cell Signaling Technology Cat# 3528, RRID:AB_2160882)
Curator: @scibot
SciCrunch record: RRID:AB_2160882
AB_477629
DOI: 10.1016/j.isci.2026.115716
Resource: (Sigma-Aldrich Cat# V9131, RRID:AB_477629)
Curator: @scibot
SciCrunch record: RRID:AB_477629
AB_2291558
DOI: 10.1016/j.isci.2026.115716
Resource: RRID:AB_2291558
Curator: @scibot
SciCrunch record: RRID:AB_2291558
AB_2128060
DOI: 10.1016/j.isci.2026.115716
Resource: (BD Biosciences Cat# 610467, RRID:AB_2128060)
Curator: @scibot
SciCrunch record: RRID:AB_2128060
AB_10891442
DOI: 10.1016/j.isci.2026.115716
Resource: (Cell Signaling Technology Cat# 8556, RRID:AB_10891442)
Curator: @scibot
SciCrunch record: RRID:AB_10891442
RRID:AB_2307391
DOI: 10.1016/j.isci.2026.115716
Resource: (Jackson ImmunoResearch Labs Cat# 111-035-144, RRID:AB_2307391)
Curator: @scibot
SciCrunch record: RRID:AB_2307391
AB_10694415
DOI: 10.1016/j.isci.2026.115716
Resource: (Cell Signaling Technology Cat# 4848, RRID:AB_10694415)
Curator: @scibot
SciCrunch record: RRID:AB_10694415
RRID:AB_2338505
DOI: 10.1016/j.isci.2026.115716
Resource: (Jackson ImmunoResearch Labs Cat# 115-035-068, RRID:AB_2338505)
Curator: @scibot
SciCrunch record: RRID:AB_2338505
AB_3698765
DOI: 10.1016/j.isci.2026.115716
Resource: RRID:AB_3698765
Curator: @scibot
SciCrunch record: RRID:AB_3698765
AB_476749
DOI: 10.1016/j.isci.2026.115716
Resource: (Sigma-Aldrich Cat# A5979, RRID:AB_476749)
Curator: @scibot
SciCrunch record: RRID:AB_476749
The Only 5 Exercises You Need To Get Rid Of Body PainTap to unmute2xThe Only 5 Exercises You Need To Get Rid Of Body PainMove With Katharine 41,046 views 2 months agoSearchCopy linkInfoShoppingIf playback doesn't begin shortly, try restarting your device.Pull up for precise seeking0:20•You're signed outVideos you watch may be added to the TV's watch history and influence TV recommendations. To avoid this, cancel and sign in to YouTube on your computer.CancelConfirmUp nextLiveUpcomingCancelPlay NowI Replaced My Entire Flexibility Routine With These 3 Moves13:50Squat daily to stay young (10 minute routine)14:07HideShareInclude playlistAn error occurred while retrieving sharing information. Please try again later.0:000:30 / 13:51Live•Watch full video••47:51Unlock Your Body: 45-minute Full Body Flexibility Workout for Beginners!EDR Fitness121K • 1y agoLivePlaylist ()Mix (50+)2:53:42Open All 7 Chakras • Cleanse The Aura And Space • Boost Positive EnergyInner Meditation Frequency Music548K • 1d agoLivePlaylist ()Mix (50+)57:03Live Mobility Masterclass with Knees Over Toes GuyStrength Side511K • 8mo agoLivePlaylist ()Mix (50+)Instrumental Worship Guitar : Best Worship Song | Peaceful, Relaxing Instrumental Hymns on GuitarSacred Guitar403 watching • 1mo agoLivePlaylist ()Mix (50+)30:3430 Min. Flexibility Practice | Unlock Your Front Splits | Beginner FriendlyYoga by Carina92 • 11d agoLivePlaylist ()Mix (50+)9:08These 5 Exercises Literally Slow Aging (Science Proves It)Move With Katharine22K • 2mo agoLivePlaylist ()Mix (50+)3:33:00Receives Large Amounts Money Non-stop, Everything Will Come True Today, 777 HzEthereal Calm108K • 1d agoLivePlaylist ()Mix (50+)30:5030 Minute Beginner Mobility Workout | Coached Workout | Follow AlongEDR Fitness174K • 1y agoLivePlaylist ()Mix (50+)18:3915 Minute Runners Flexibility Routine (FOLLOW ALONG)Tom Merrick3.1M • 6y agoLivePlaylist ()Mix (50+)1:21:36Közlekedési aktivistából miniszterjelölt – Seres Samuval őszinténDávid Vitézy and seressamu28K • 23h agoLivePlaylist ()Mix (50+)56:07A NER-lovagok lázadása döntötte be Orbán rendszerét, nem a kórházak állapota? - Schiffer AndrásFekete Rita133K • 2w agoLivePlaylist ()Mix (50+)2:55:55After 5 Minute, You Will Go into a Deep Shamanic Trance and Mind Control | Pineal Gland DMT ReleaseInner Eye Awakening245K • 1d agoLivePlaylist ()Mix (50+)1x The Only 5 Exercises You Need To Get Rid Of Body Pain
remove the TOC on top of the page, move to left nav bar below
Local Loop solves the payment gridlock.
 - dill green
少なくとも哲学者の間では、非アニミズム的宗教の神を定義する属性を持つ存在の存在は実証的に証明できないことが一般的に認められている……神の本質に関するすべての発言は無意味である。
アニミズム擁護?
indy.clip-web.of.documents,bookburners.paradise,internet.archive,digital.vellum,emulate.everything
using inbrowser.link

using dweb.link
https://bafybeibltifg56ikknfje35vf2eul33jzvy2jxopehqse2h2rm2ku5p4ju.ipfs.dweb.link/?filename=IPFS.Alphw.Why.we%3Bmust~YouTube%20Transcript%20Generator%20%EF%BD%9C%20Extract%20%26%20Download%20Video%20Transcripts%20(5_5_2026%203%EF%BC%9A11%EF%BC%9A50%20PM).html
13.6. Design Analysis: Mental Health# We want to provide you, the reader, a chance to explore mental health more. We want you to be considering potential benefits and harms to the mental health of different people (benefits like reducing stress, feeling part of a community, finding purpose, etc. and harms like unnecessary anxiety or depression, opportunities and encouragement of self-bullying, etc.). As you do this you might consider personality differences (such as introverts and extroverts), and neurodiversity [m37], the ways people’s brains work and process information differently (e.g., ADHD, Autism, Dyslexia, Face blindness, depression, anxiety). But be careful generalizing about different neurotypes (such as Autism [m38]), especially if you don’t know them well. Instead try to focus on specific traits (that may or may not be part of a specific group) and the impacts on them (e.g., someone easily distracted by motion might…., or someone sensitive to loud sounds might…, or someone already feeling anxious might…). We will be doing a modified version of the five-step CIDER method [m39] (Critique, Imagine, Design, Expand, Repeat). While the CIDER method normally assumes that making a tool accessible to more people is morally good, if that tool is potentially harmful to people (e.g., give people unnecessary anxiety), then making the tool accessible to more people might be morally bad. So instead of just looking at the assumptions made about people and groups using a social media site, we will be also looking at potential harms to different people and groups using a social media site. So open a social media site on your device. Then do the following (preferably on paper or in a blank computer document):
The emphasis by the author of this chapter to avoid generalization when talking about neurotypes, as well as her encouragement to "look at specific traits," shares some similarities with what Socrates said about writing in his Phaedrus (Socrates was concerned that writing addressed all people and nobody in particular, as a result, writing could never be responsive to the person who was reading). Labels for categories, such as "Autism," or "ADHD," work similarly to how writing works, they reduce a spectrum to a single target audience. As a result, using the CIDER approach to break down design into its various components, while looking at each component separately (i.e., trait-specific), can be seen as asking designers to design dialogically rather than categorically. Rather than asking "what needs do autistic users have?", the question would ask something similar to "how does somebody who has a specific sensitivity to motion experience things?". This chapter makes an epistemological claim (that is, a claim about knowledge) quietly, specifically, the author believes that good design, just as good rhetorical communication should, is dependent upon understanding specifics rather than relying on generalizations.
PEREGRINA.—Después; ahora no puedo. Cuando ese reloj délas nueve tengo que estar despierta. Alguien me está esperando enel paso del Rabión
La Peregrina tiene prisa y una cita que no puede revelar. El reloj y el nombre del lugar crean una atmósfera de misterio que invita a preguntarse quién es realmente este personaje y qué la espera en el Rabión
In what ways have you found social media bad for your mental health and good for your mental health? What responsibility do you think social media platforms have for the mental health of their users? Are there ways social media sites can be designed to be better for the mental health of its users? What are the ways social media companies monitoring of mental health could be beneficial or harmful?
I think that social media has been bad for my mental health when I compare myself to others online, but good for my mental health find I find content that is motivating. I think that although social media platforms can play a part in the mental health of their users, I also think that the content users view/post can play a critical role as well.
In what ways have you found social media bad for your mental health and good for your mental health?
I have noticed that social media can have major effects on my mental health. An example of the bad impact that social media can have is cyberbullying. I know I have experienced people on social media using anonymous accounts to harass me, which can influence my self-esteem. However, one positive impact of social media is its ability to connect people. I feel my mood is boosted when I can easily share funny things or text my friends on social media.
Are there ways social media sites can be designed to be better for the mental health of its users?
I honestly think that the things games do of "You've been online for [insert number] hours; maybe you should take a break" so that users are more self-conscious about the time they spend on social media. I at least think it would work for me, because sometimes, while using social media for a long time, I check the time, realize how much time I've spend on social media, and then I promptly log off.
Interesting data- I have a couple of technical comments/questions. 1. How many cells, and thus EVs, were needed for the lipodomics and proteomics analyses? This information was not included. 2. You compared the B-EV lipodome to the whole cell lipodome and conclude that the B-EV lipodome is most like the plasma membrane. But the whole cell lysate would contain the average of all membranes not just plasma membrane. Can you comment on this?
Apple Pay with iFrames
Make this as a best practices section for higher SR.
It destroys your moral power abroad: it corrupts your politicians at home.
People twist it
, hollow mockery;
This whole paragraph is about how he thinks America is just being a hypocrite
I hear the mournful wail of millions! whose chains, heavy and grievous yesterday, are, to-day, rendered more intolerable by the jubilee shouts that reach them… My subject, then, fellow-citizens, is American slavery.
He states the obvious about what is making him disappointed.
America is false to the past, false to the present, and solemnly binds herself to be false to the future.
America gaslights itself to believe in it does know bad or makes mistakes.
Transformational leaders often embody their vision and believe in it so strongly that they can empower others to do the same.
Maybe a little bit of this style
Servant leadership places the value of the team ahead of the individual. As such, a servant leader is someone who can shed personal agendas and whose main goal is for their team (and the company) to thrive.
Type of leadership style I like
Check out our top deals
Throughout the Rogers, page they put black subheadings to indicate a separate sections of the page. This is good accessibility, because the text is large, bold and readable. Furthermore because of the layout it helps manage the information presented.
Find a store ON Alberta British Columbia Manitoba New Brunswick Newfoundland and Labrador Northwest Territories Nova Scotia Nunavut Ontario Prince Edward Island Quebec Saskatchewan Yukon Français
This annotation is primarily for the French option, which is great if you need it. However the implementation of this tool is quite poor and flawed from my view. The tool is regulated in the top corner and in small text resulting in poor visibility. Furthermore, in terms of languages it is limited only have two options of French and English. Keeping in mind Rogers is a national communication service provider in Canada. The tool should have more language options due to the fact that Canada is a country where citizens speak multiple languages, where English or French may not be a persons first language. Overall if Rogers wants to properly serve the people the tool needs to be more flexible, and visible on the website.
View all mobile offersView all internet offersView all TV & streaming offers
This accessibility feature is using identifiable images to indicate the topic for the page link. For example the laptop icon indicating the internet offers Rogers provided. Furthermore, when you however over the icon it highlights the box and underlines the hyperlink. Reinforcing the idea of the selection of the items to the use. However, one flaw of this feature is the font of the text not being bold enough. Due to the fact, someone who struggles with reading words may struggle the front chosen. Overall looking at the accessibility feature this is an effective tool with potential tweaks for improvements.
Go to slide 1 Go to slide 2 Go to slide 3 Go to slide 4 Go to slide 5 Go
I am highlighting the slideshow feature of what Rogers has to offer. This tool is effective due to the interactivity of the slide web-based element. In terms of the fact the user has the option to scroll throughout using the bubbles or the arrows, Furthermore, the slide has a feature which you can pause it from moving on, Allowing the user to take in information at their own pace or have more accessibility to click on whatever is shown to the user. Overall, an effective tool for showcasing information to a user!
Chat with Anna
This is one of the more common accessibility tools implemented recently throughout different companies. This being, getting a chat bot to help aid you with your inquires. This tool can allow users to sort through pages of information. As well as provide an option for additional support if needed. However, this tool is dependent on the user and the keyword they use. Furthermore, with this change, it has been the replacement for human interaction, In some cases the thing that would aid you the most depending on the issues of the user. Overall would say this is good, but in specific cases.
dentification of an object (or an individual by fingerprints) can be done unequivocally, that is, with complete certainty. We have everyday experience of marks and have ourselves on occasions made such judgements: who muddied the kitchen floor—a small boy (a shoe mark) or a small dog (a paw mark)? Understanding the application of marks to the investigation of crime is an extension of this everyday experience. C6.P3Marks can be visible (patent) or invisible (latent) and require specialist optical, physical, or chemical techniques to visualize them. They can be made in a variety of substances: mud, blood, (page 66)p. 66dust, sweat—referred to as ‘negative’ marks—or by transferring a material to another surface—‘positive’ marks. A shoe stepping into a pool of blood can leave a negative mark in the blood followed by positive marks on the floor walked upon.
Sdvsfvasfv
When meditation is mastered, the mind isunwavering like the flame of a lamp in a windlessplace.
Introspective: This passage stood out to me because it uses a simple image to explain something difficult. I also liked the comparison between the mind and a steady flame cause it emphasizes how peaceful and focused the mind can become through meditation.
Fun time always with the princess
pictures all over. likely scam.
Whenever dharma declines and the purposeof life is forgotten, I manifest myself on earth
Introspective: This passage stood out to me because it presents the Divine as active in the world rather than distant.
Krishna, the mind isrestless, turbulent, powerful, violent; trying tocontrol it is like trying to tame the wind.
Introspective: I feel like I relate to this passage because it feels very realistic.
If a thousand suns were to rise in the heavensat the same time, the blaze of their light wouldresemble the splendor of that supreme spirit.
Theological: This description of Krishna’s cosmic form reflects the power and majesty of the Divine.
Arjuna, I am the taste of pure water and theradiance of the sun and moon.
Theological: This passage reminds me of the Upanishads because the Divine is described as existing throughout all creation. This also reflects the idea that Brahman exists in everything.
There has never been a time whenyou and I and the kings gathered here have notexisted, nor will there be a time when we willcease to exist.
Theological: This passage reflects the Divine as eternal and beyond time.
Those who worship me and meditate onme constantly, without any other thought– I will provide for all their needs.
Psychoanalytic: This passage reflects bhakti-yoga because the focus is on devotion and love toward the Divine.
eLife Assessment
This study provides direct and compelling evidence that lamellipodial protrusions dynamically adjust Arp2/3 complex incorporation in response to mechanical counterforces, while also modulating cellular responsiveness to upstream signals like Rac GTPase. By combining endogenous labeling, live-cell imaging, and optogenetic signaling activation, the work demonstrates how adhesion state and physicochemical perturbations reproducibly alter branched actin organization, offering a fundamental advance over previous works. The findings deliver significant insights that will resonate broadly with cell biologists and biochemists studying actin dynamics and mechanotransduction.
Reviewer #1 (Public review):
Summary:
This is an interesting study describing intensity changes of lamellipodial Arp2/3 complex incorporation dependent on the substratum the cells are spreading on (PLL vs fibronectin), but also on manipulation of either contractility or osmotic pressure or even external mechanical load exerted onto cells, e.g., by increasing medium viscosity. The authors use quite fancy cell systems for their studies, first of all, a CRISPR-engineered fibroblast cell line in which both endogenous loci of the Arp2/3 complex subunit Arpc2 are tagged with mScarlet, but at the same time, conditionally removable using tamoxifen. These lines, optionally also harboring Pxn-GFP and Lifeact-miRFP670, have previously been described by the authors (Chandra et al, 2022, PMID: 34861242). In addition, they use cells allowing local photoactivation of Rac signalling through a Tiam1 activation module combined with Halo-tagged Arpc2, apparently stably co-expressed in tamoxifen-treated Arpc2-KO fibroblasts. These cells may or may not have been published previously.
Overall, the study provides convincing evidence that Arp2/3 complex accumulation in the lamellipodium negatively correlates with its width and perhaps the mechanical load these actin networks are exposed to at the leading edge membrane, shown initially through allowing cells to spread on substrates in which the formation of integrin-based adhesions is poor (PLL) or stimulated (through fibronectin). In the latter case, lamellipodia are comparably narrow, perhaps reasonably well clutched, and thus feel sufficient counter-force at the leading edge membrane to build a dense, Arp2/3-dependent actin network. Albeit interesting and important to show as the authors did, these results are not entirely surprising given the literature published on actin remodeling in cells in conditions similar to those used by the authors (i.e., on PLL). Thus, the results should be better embedded into the context of this previous literature to more precisely reveal which aspects are new and interesting and which ones are more or less intuitive and expected.
However, the authors also show yet another result, which is quite spectacular indeed, revealing dramatic local protrusion of a Rac-dependent lamellipodium on PLL only in the presence of methylcellulose, but not on PLL alone. Although the authors cannot fully explain the mechanisms causing these results, they are thought-provoking and will certainly stimulate future, relevant research on this topic and new insights. Altogether, I think this is an interesting study that can be shared rapidly, given that the authors provide more experimental detail and transparency concerning their used cell model systems. Aside from a few other suggestions for amendments and corrections, I would also recommend citing classical literature that has provided the basis for the interpretation of the results shown here, as specified below.
Specific criticism and comments:
(1) I feel the paper is interesting for actin remodeling and Arp2/3 complex aficionados, but quite difficult to read and to understand in places for non-experts in the field, so I think the text requires more detailed explanation of specific terms, model systems used, and overall correction of either grammatical or semantic errors, or colloquial language.
(2) In general, I think the characterization of Arp2/3 complex incorporation into the lamellipodia of cells spreading on PLL versus FN is interesting, as it has not been done previously in such a systematic fashion to my knowledge. However, I think the authors could emphasize better how this relates to previously established structural features of actin filament networks, published on PLL. So more than 3 decades ago, Hotchin & Hall published clear evidence that starved fibroblasts can only form focal complexes or adhesions downstream of PDGF or LPA-stimulation if seeded on FN, but not on PLL (see Figure 1 in PMID: 8557752). Around the same time, Flinn and Ridley showed this virtual absence of classical, Rac-dependent focal complexes to be accompanied by the formation of beautiful, broad lamellipodia (see Fig. 1A in PMID: 8743960), which only formed in the absence of excess RhoA activity and thus contractility by the way (see also below). A few years later, Small et al summarized all these phenotypes in a comprehensive review and also showed that cells on PLL (similar to the rapidly migrating keratocytes) combined large, flat lamellipodia with tiny, nascent adhesions scattered throughout these structures (see Figure 2 in PMID: 10047522). These authors also noted that the sole inhibitor-mediated reduction of contractility could switch FN-phenotypes with narrow, ruffling lamellipodia and peripheral focal complexes back to a PLL-type phenotype of broad lamellipodia (see Figure 1 in PMID: 10047522). In the following decade then, different labs (Verkhovsky, Bershadsky, Vavylonis, Watanabe et al) showed beautiful phase contrast or fluorescence movies illustrating that the broad lamellipodial phenotype of cells plated on PLL was accompanied by low frequency membrane ruffling and instead a rapid, continuous rearward flow of continuously assembling actin filament networks, partly also directly shown with actin networks labeled with both LifeAct and Arp2/3 complex subunits (see e.g. PMIDs 18800171 and 22500749). In Alexandrova et al, 2008 (PMID 18800171), authors showed that the formation of adhesions in spreading cells triggers the transition from fast to slow flow (which is of course relevant to the current study and conclusions), whereas Ryan et al, 2012 (PMID 22500749) already established the broad incorporation of actin and Arp2/3 complex into the very broad lamellipodia formed on PLL by Xenopus fibroblasts and the rapid flow of both components from distal to proximal lamellipodial regions. None of these seminal studies has been cited, although they are highly relevant for the interpretation and conclusions of the results presented. I would strongly recommend specifically referring to these studies, as this will actually support the conclusions and interpretations drawn.
(3) On the subject of literature, on the second page of the intro, end of 2nd paragraph, the authors describe Rac signaling to Arp2/3 complex through WRC considered essential for Arp2/3-mediated actin assembly at lamellipodial leading edges, but aside from one of their own papers cite none of the seminal studies by Insall, Scita, Stradal, Rottner, Bogdan labs having published seminal aspects on this pathway.
Considering the rapid F-actin flow in lamellipodia, obviously accompanied by admittedly sparse but continuous Arp2/3 complex incorporation, it is not so surprising that the latter will be obligatory here, and also the accumulation of its prominent activator WRC, as well as the branch stabilizer cortactin. Thus, the data described on page 3 of the Results section could also be framed in the context of all this previously published knowledge, providing a more comprehensive and realistic view of the relevance and novelty of the described data.
(4) In the abstract, the authors state in the context of the force-feedback mechanism established in vitro for the formation of Arp2/3 complex-dependent actin networks that "this phenomenon has not been explored through the examination of real-time responses of endogenous actin networks in cells". In my view, this is not correct, as in their prominent Cell paper, the Sixt laboratory has done exactly that (Mueller et al, 2017, PMID: 18800171). Although Mueller et al have not looked at Arp2/3 complex dynamics as far as I recall, they have still connected the extent and hence intensity of actin networks at the leading edges of keratocyte lamellipodia with the forces exerted onto them, including direct experimental manipulation of those forces. Although the study has been cited in an independent context, this point should be made clear, and the corresponding sentence in the abstract should be amended.
(5) One point that struck me a little bit was the authors' detailed description of cell spreading on PLL and the quite strong variability of Arp2/3 incorporation dependent on the timing after spreading (as for instance the very strong and quite narrow Arp2/3 leading edge intensity at 2 hours post-seeding in Figure 3S2D). In the authors' view, they have worked with a very clean system, as they emphasized to even have eliminated the FN-locus in their cells, excluding the secretion of endogenous FN (PMID: 34861242), but how about ECM components potentially present in serum, such as, for instance, vitronectin? Indeed, it looks like the authors have done all experiments in the presence of 10% serum as far as I can see, although most of the classical PLL-experiments mentioned above have been performed with starved cells in the absence of serum. I think it would generate a more complete picture of the phenotypes and results as compared to the literature if the authors performed a subset of the key experiments on PLL without serum. I don't think the starving of cells as such is important and could be counteracted by simply lamellipodia-inducing growth factors adding into the spreading medium, traditionally perhaps PDGF or EGF (dependent on the receptor distribution of those fibroblasts), but the absence of serum would have two advantages: it would not only exclude any potential impact of serum-containing ECM components, but also alleviate the hyperstimulation of the Rho-pathway through LPA-bound BSA, the major serum-protein, which has previously been shown to counteract the "undisturbed" formation of PLL-type lamellipodia (see Figure 1B in Flinn & Ridley, PMID: 8743960).
(6) Regarding the scanning EM-images shown in the Supplement, currently called Figure 3S2A and -B (in the text erroneously termed Figures 3S1A and-B, see above). I am not sure how representative these individual EM-images of the cell plated on PLL are, given the data of rapid rearward flow of actin and Arp2/3 complex subunits, at least at early stages of spreading. Again, the classical literature on PLL-type lamellipodia and, in particular, previously published movies of such lamellipodia suggest broad lamellipodia with few ruffles, and the opposite with cells plated on FN. So in this context, the scanning EM-data shown on both PLL and FN do neither fit the authors' own data very well nor the literature, and I would recommend making sure that the individual cells selected were (i) correctly annotated and (ii) representative of a specific time point of spreading actually fitting the previously described data.
(7) It also surprised me to see that the authors describe the spreading process on PLL to actually be much slower than on FN (see Figure 3S2C - in the text Figure 3S1C). It is tempting to speculate that this might change if plating the cells in serum-free medium, as traditionally, full spreading and lamellipodia formation downstream of PDGF-stimulation (at least in 3T3 fibroblasts) is described to occur in the range of 10-30 minutes at maximum, and not several hours as shown here. This point could also be considered, or at least discussed.
(8) The movies are of very high quality and beautiful to look at, but it would help the reader to get a bit more information in the legends (like the meaning of the time-stamps, which will display elapsed time in minutes:seconds I assume, but this info is missing from the legends as far as I can see. Also, it would help the reader to better mark in the movies when a specific treatment kicks in. For instance, in movie 10, the legend states treatment starts at 10:00 (minutes:seconds?), but it would help very much if the authors could paste the term "blebbistatin" directly into the movie, beginning with the frame of treatment start.
Reviewer #2 (Public review):
The authors work with endogenously labeled Arp2/3 complexes in mouse fibroblast cell lines plated on surfaces coated with fibronectin or poly-L-lysine. They observe increased retrograde flow, but decreased actin and Arp2/3 densities, in the absence of integrin-based adhesions. Interestingly, they further find that an increase in branching density can be achieved in the absence of adhesion by a diverse set of perturbations, including blebbistatin, physical compression under agarose, and methylcellulose-mediated increases in extracellular viscosity. Although all of these conditions are likely to have pleiotropic effects on cell physiology and signaling, one plausible common denominator is that they promote cell spreading and may thereby increase membrane tension.
This study addresses a question of broad interest. The relationship between protrusive actin assembly, resisting forces, and membrane tension has received considerable attention in recent years (for a recent overview, see PMID: 38991476). Earlier work established that branched actin networks can respond to force by increasing network density in vitro (PMID: 26771487; PMID: 35748355), and pioneering work from the Sixt laboratory showed that keratocyte lamellipodia adapt to resisting forces by increasing actin density in cells (PMID: 28867286). Against that background, the manuscript contains novel and insightful observations. At the same time, the current version would be strengthened by a more rigorous mechanistic analysis and by clearer reporting of experimental systems and statistics.
Major points:
(1) Engagement with prior work on membrane tension and protrusion.
The relationship between protrusive actin assembly and membrane tension is a subject of major current interest (PMID: 38991476), and it is unfortunate that the authors do not engage more fully with seminal prior work on this subject. In particular, work from the Weiner laboratory showed that membrane tension can act as an inhibitor of cell protrusion and branched actin assembly, at least in some cell types (PMID: 22265410; PMID: 37311454). In addition, a membrane-tension-sensitive signaling pathway involving PLD2 and mTORC2 has been proposed to mediate this negative feedback (PMID: 27280401). These findings appear, at least at first glance, to contrast with the model advanced here, in which elevated membrane tension is associated with increased branching density. A more explicit discussion of these findings and of the apparent differences between systems would be essential. Testing the relevance of some of the proposed negative-feedback regulators, for example, mTORC2 or PLD2, under at least some conditions expected to increase membrane tension would substantially strengthen the manuscript.
(2) The central assumption regarding membrane tension should be tested directly.
Part of the model put forward by the authors rests on the assumption that most of the perturbations used to promote cell spreading, with the exception of hyperosmotic treatment, also increase membrane tension. This is a testable hypothesis. Multiple mechanical and optical methods have been established for this purpose, including tether pulling, micropipette aspiration, and fluorescent membrane-tension probes. Directly measuring membrane tension under at least a subset of the key perturbations would significantly strengthen the manuscript.
(3) WAVE and cortactin localization should be quantified.
The claim that WAVE and cortactin localization are independent of fibronectin-integrin engagement (Figure 2A-B) deserves to be established quantitatively. I appreciate that some variability is expected because these experiments use exogenous fluorescently tagged constructs, but the current presentation relies too heavily on representative kymographs. Quantitative analysis would make this conclusion more convincing.
(4) The interpretation of the increased-viscosity experiments needs stronger physical justification.
I am aware of the recent high-profile work showing that elevated extracellular viscosity can promote migration (PMID: 36323783), and the present manuscript is clearly supporting this. However, the physical basis for this perturbation is neither well reasoned nor explained clearly enough here. The authors use 0.6% methylcellulose of the 1500 cP grade (the relevant viscosity of the final medium should be stated explicitly btw!). Estimating the added viscosity at 7 cP = 0.007 Pa·s (up from 1 to 8 cP), one can formulate the rough back-of-the-envelope calculation for the added viscous stress:
delta τ = delta η v/h
where τ= viscous stress (Pa = pN/µm²), η = viscosity, v= protrusion speed, h = characteristic shear length scale. For cells protruding at 1 um/min, this resistance will be 0.00001-0.001 Pa. Even if the cells would protrude 100 times faster, the resistance would not exceed one pascal! Hence, the added bulk viscous stress opposing protrusion at this viscosity appears negligible relative to the known force-generating capacity of lamellipodia. This does not invalidate the biological phenotype, but it does suggest that the interpretation should be much more careful.
(5) Cell lines and experimental systems are insufficiently described.
Most biological experiments in this manuscript appear to have been performed in engineered mouse fibroblast lines, but the Methods do not provide sufficient clarity about which specific cell lines were used in which experiments. More concerning, the manuscript refers inconsistently to the base model as both a mouse dermal fibroblast line and MEFs, while the only clearly distinct named line appears to be JR20 fibroblasts used for traction-force microscopy. Along similar lines, the Arp2/3 knockout cells in Figure 2 are not adequately explained in the Results, Methods, or figure legends, regarding how these cells were generated or how the knockout was validated. The authors only later note in the Discussion that these conditional knockouts were described in an earlier paper. In general, the manuscript would benefit from much more explicit reporting of which cell line or derivative was used in each experiment.
(6) Some experiments and quantifications appear to suffer from limited replication.
For example, the optogenetic Rac activation experiment in Figure 2E appears to have been performed possibly only for a single cell per condition, since the raw intensity traces are shown without clear indicators of variability. If that reading is correct, this is below the standard typically expected for mechanistic support and seriously reduces confidence in the strength of this particular conclusion.
(7) Statistical reporting needs clarification.
Although the Methods state that the graphs show 95% confidence intervals, the manuscript does not clearly define the underlying statistical unit for many quantified datasets. In several figures, sample sizes are reported as numbers of cells pooled across only two or three independent experiments, but it is not clear whether the authors performed statistical analyses on pooled single-cell measurements or on experiment-level means. The authors should explicitly state for each quantified panel what n represents, what the error bars denote, which statistical test was used, and whether the analyses were performed on per-cell values or on independent experimental replicates.
(8) The Discussion is rather expansive relative to the amount of experimental evidence presented.
Parts of the Discussion feel more speculative and interpretive than necessary, and the manuscript would be strengthened by focusing the Discussion more tightly on the principal findings, limitations, and immediate implications of the work.
Reviewer #3 (Public review):
Summary:
Butler et al. investigated how different force mechanisms influence Arp2/3-related branched actin networks at the leading edge of lamellipodial protrusions in mouse dermal fibroblasts. In particular, their study aimed at characterizing the specific contribution and interplay between load force and adhesion signaling on the regulation of branched actin networks in live-cell experiments using endogenously one-labeled Arp2/3 subunit. A key finding of their work is that by plating fibroblasts on two different substrates supporting or not integrin engagement, they observe striking differences in branched network architectures that cannot be explained solely by integrin signaling. Instead, several of their results point to mechanical feedback resulting from changes in membrane tension during spreading, regulating the density of branched actin networks. Finally, by modifying the extracellular viscosity, the authors suggest that the stress generated at the actin-membrane interface would play a key role in regulating branched actin density in protrusions.
Major Strengths:
(1) The combination of methods used in this paper (endogenous labeling of Arp2/3, Arp2/3 genetic knockout, optogenetic activation of Rac) provides a unique opportunity to monitor spatial and temporal reorganization of endogenous branched networks generated by Arp2/3 in live cells in response to different biochemical and mechanical manipulations.
(2) The authors provide a deep characterization of the actin-network organization and dynamics observed when plating cells on different substrates, engaging or not integrins (Figure 1 and associated supplementary: intensity and width of the signal in protrusions, retrograde flow, incorporation of actin to the edge, nascent focal adhesions), which serves as a strong basis to build the rest of the paper. They also offer a comprehensive analysis of the different parameters that could explain the lack of dense branched actin network at the leading edge of fibroblasts grown on PLL-coated surfaces (they exclude the contribution of reduced branch nucleation by NPF or insufficient branch stabilization in Figure 2, the insufficient integrin-mediated signaling activating NPF in Figure 2).
(3) After having ruled out the influence of adhesion signaling in the regulation of branched actin-network density at the leading edge of the cells, the authors demonstrate that the enrichment of Arp2/3 at the leading edge is evolving together with cell spreading, suggesting a possible role of membrane tension in the process (Figure 3 and associated supplementary). To prove their point, they tested numerous methods to promote adhesion-independent cell spreading (Figures 4 to 6), while describing well the limitations of each of these techniques. These methods included promoting rapid spreading on PLL-coated substrate using blebbistatin or physical compression under agarose, and finally increasing extracellular viscosity by treating cells with methylcellulose. All of these treatments led to very consistent results upon the increase in membrane tension, supporting the idea of membrane tension controlling the branched actin organization of cells. This conclusion was further supported by an experiment (Figure 4 S1) in which a hyper-osmotic shock was performed, increasing the actin-membrane interface stress while keeping the spreading area of cells, which led to a drastic increase in Arp2/3 density at the protrusions.
(4) By activating Rac optogenetically in cells plated on PLL treated with methylcellulose (Figure 8), the authors observe the formation of robust protrusions enriched in Arp2/3, showing that increased extracellular viscosity can bypass the requirement for ECM proteins to activate protrusion driven by signaling.
Weaknesses:
(1) Although the lamellipodial architecture in cells plated on PLL appears very different from the one developed by cells grown on fibronectin (Figure 1, wider and less homogenous), the branched network is still present, and one may wonder how these differences can affect the functionality of the lamellipodia (for example, by measuring the impact on migration in 2D and 3D systems).
(2) To explain the differences observed in the branched actin networks developed by cells on PLL and FN, the authors envision several hypotheses, among which signaling factors or branched-promoting factors would be decreased in the absence of integrin adhesions. They could have, in addition, assessed actin network dynamics and turnover (we could imagine that competition between Arp2/3- and non-Arp2/3- driven structures could be different in the presence or absence of adhesions, the competition being nicely visible from Figure 2B and 2C, where, in the absence of Arp2/3, cells form prominent filopodia).
(3) All of the methods used to apply physical forces on barbed ends have their own caveats and alter not only membrane tension (but the limitations are discussed in the paper). The paper may have benefited from micropatterning the cells to either reduce or force the spreading of cells in a controlled fashion. In addition, the conclusions on levels of interface stress between plasma-membrane and the barbed-ends of actin lamellipodial networks rely on an estimate of the effect of perturbations rather than on actual measurements of these stress levels.
Likely impact of the work on the field, and the utility of the methods and data to the community:
Although the finding that branched actin networks respond to the application of physical force by increasing their density was already known from previous in vitro studies, this paper offers a detailed and compelling characterization of the reorganization of endogenously labelled branched actin networks upon different mechanical perturbations. In addition to showing the effect of increased extracellular viscosity on promoting branched actin network densification in the absence of ECM, this paper sheds new light on the interplay between signaling and mechanics in regulating protrusion and spreading. While the authors show that both signaling and mechanical feedback are important regulators of branched actin regulation and cell spreading, they demonstrate that optogenetic Rac activation is not sufficient to trigger branch network formation in the absence of sufficient mechanical support. They thus propose that biochemical signaling would act at a different level than mechanics by promoting protrusion persistence and coherence. This work will therefore impact the field of cell biology in offering a new perspective to understand the interplay between mechanical and biochemical feedback in 2D and 3D migration. It may also have broader implications as the formation of branched actin networks under the regulation by mechanical loads has been shown to be involved in other processes such as endocytosis.
When your mind has overcome the confusion ofduality, you will attain the state of holy indifferenceto things you hear and things you have heard
Psychoanalytic: This passage reflects jnana-yoga cause it focuses on wisdom/self-realization.
You have the right to work, but never to thefruit of work.
Psychoanalytic: This specific passage helped me understand karma-yoga as acting without attachment to the results.
eLife Assessment
In this study, Yuan and colleagues perform transcriptomic and epigenomic experiments to study open chromatin regions and transcripts that change upon larval settlement in the sponge Amphimedon. The authors present compelling evidence to show that sponge larvae prepare for receiving an environmental cue (sunset) by extensively modifying their chromatin accessibility in the vicinity of genes that are going to be regulated during metamorphosis. The study represents a fundamental advance in understanding the fine genetic control of larval settlement and has significance beyond the immediate field of sponge larval biology.
Reviewer #1 (Public review):
Summary:
Yuan and colleagues present a thorough study of gene activation before and during metamorphosis in sponge larvae, combining in-depth analyses of staged transcriptomes and chromatin accessibility profiling (ATACseq). Amongst several very interesting findings, the study reveals that the acquisition of settlement competence, which arises in response to decreasing light at sunset, is characterized by changes in chromatin accessibility that anticipate strong transcriptional shifts occurring as metamorphosis starts. Another notable finding is a set of transcription factors amongst the genes strongly up-regulated at the onset of metamorphosis. In addition, larvae exposed to constant light, a condition that stalls metamorphosis, were found to activate metabolic pathways that are not normally expressed in swimming larvae. Together, the findings provide a rare level of understanding into how environmental conditions can promote deployment of alternative developmental programs in planktonic larvae.
Strengths:
This is a very comprehensive, well-documented and rigorous study of a phenomenon of wide interest. It will inspire researchers working on other species to look for similar, environmentally-driven "anticipatory" epigenetic mechanisms. It also provides a wealth of detailed information on genes, notably transcription factors, that are candidates for involvement in regulating specific metamorphosis transitions - and beyond. The data presented here are thus undoubtedly a rich and valuable resource.
Weaknesses:
I see no significant weaknesses; however, the documentation of the data is very compressed, with all the findings contained in 4 multi-panel figures with succinct legends. It is not always straightforward to connect the conclusion statements in the text to the figures. Although the relevant data is available in supplementary files, I would appreciate more help in navigating the data to assess the support for key conclusions, if possible, illustrating each text conclusion explicitly in the main figures.
Reviewer #2 (Public review):
Summary:
It is demonstrated that sponge larvae prepare for receiving the environmental cue (sunset) by extensively modifying their chromatin accessibility in the vicinity of genes that are going to be regulated during metamorphosis, in the absence of large gene expression changes. This program can be offset by modifying the cue (making light constant), leading to a novel molecular state.
Strengths:
This is a top-notch study of a key lifecycle transition in an organism of great phylogenetic importance, involving concurrent gene expression and chromatic accessibility profiling (to the best of my knowledge, this has never been done in non-bilaterians and likely anywhere outside Vertebrata). The result is highly non-trivial. There is also an additional experiment modifying the key environmental cue (constant light), adding additional insight.
Weaknesses:
I have only a couple of suggestions.
(1) Not all new pre-emptively opened OCR regions are associated with genes that are going to be regulated during metamorphosis. Is their association with such genes statistically significant? (Fisher's exact test?)
(2) Re: extended discussion on possible reasons for activation of specific transcription factor families. I feel it is not terribly useful since it is hardly more than guesswork. The authors should consider condensing this part to better emphasize the major (and most unexpected) large-scale regulation patterns.
(3) Re: enrichment analysis based on significant genes (Figure 1H): Even though it is a common practice, there is nuance: as we all know very well, many genes pass a significance threshold not because they are highly differentially regulated (i.e., show large fold-change), but because they are more abundantly expressed overall and so the statistical power for them is greater. A good example is ribosomes - before we realized what was happening, they would show up as enriched in almost every experiment of ours, which was not very useful since their fold-change was quite trivial. I see the authors have ribosome enrichment too, and I suspect there are a few more functional groups that made it because they tend to express highly on average. Ideally, we want to see what is enriched among highly regulated genes, not among abundantly expressed genes. Because of this we moved to compute enrichment based only on fold-change, using the GO_MWU package (https://github.com/z0on/GO_MWU). I suggest authors give it a shot, to see if the enrichment results become more interpretable. GO_MWU is also very powerful to analyze enrichment in WGCNA modules, in case the authors want to try that.
Reviewer #3 (Public review):
Summary:
In their manuscript, Huifang Yan and colleagues perform RNA-seq (CEL-seq) and ATAC-seq experiments to profile the transcriptome and chromatin accessibility of sponge larvae across larval competence, settlement and early postlarval development. Amphimedon, the sponge species that they use, is amenable to lab experiments and can therefore be a convenient model for experimenting with this otherwise difficult to assay ecological parameters and cues. They had previously observed that light conditions (diminished light) at sunset are critical for larvae to enter a pre-settlement stage and prime them for settlement and metamorphosis. In this paper, they report that these conditions induce a gain of accessibility in many genes, including transcription factors, and that altering these conditions by providing continuous light at sunset affects this reprogramming event.
Strengths:
The above is a very interesting observation, one that the authors speculate could have a broader significance and be a theme in many more larvae. I agree with the authors that this is an important finding, and I think that the paper will be interesting for a broad readership. If this is the case, the authors open up a new theme of chromatin regulation, extensively studied in mammalian contexts, but severely understudied in pretty much every other context.
Weaknesses:
I think, however, that their paper often reports the data in a difficult-to-follow way, and that other sorts of analyses would have made the results more accessible for a broad readership. Here, I present some suggestions that the authors might want to take into account to improve their results.
eLife Assessment
This large-scale comparative study of odorant receptor (OR) genes across more than 100 insect species, combining sequence- and structure-based approaches, aims to explore the evolution of this large gene family involved in the detection of odorant signals by olfactory neurons. This useful work uncovers a structural feature unique to the odorant receptor co-receptor Orco that reduces ligand binding affinity. However, the strength of evidence is incomplete: the pipeline for in silico identification of odorant receptor genes lacks validation through comparison with known odorant receptor repertoires from previously studied species, and claims regarding odor response spectra, evolutionary, and ecological interpretations are not fully supported by the analyses.
Reviewer #1 (Public review):
Objectives of the study and impact of the work:
The authors of this article primarily aim to reconstruct the evolutionary history of the insect odorant receptor (OR) family, which is responsible for the detection of odorant signals by olfactory neurons. Due to the lack of phylogenetic signal present in the sequences of this multigene family, which evolves very rapidly, phylogenetic analyses have so far never made it possible to precisely retrace how ORs diversified prior to the appearance of present-day insect orders, and what the drivers of this diversification were. For example, one may suspect that the adaptation of ORs to odors emitted by plants constituted a critical step in insect evolution during the "angiosperm terrestrial revolution," which occurred at the end of the Cretaceous, but nothing currently allows this to be asserted.
There are very nice examples, notably in Drosophilids, derived from comparisons between closely related species and documenting mechanisms of OR adaptation to certain signals. However, what the authors attempt to do in this work is to produce a macroevolutionary analysis at the scale of insects as a whole, based almost exclusively on bioinformatic analyses. To do this, they annotated OR genes in about one hundred insect species and developed pipelines for analyzing sequence similarity, structural similarity, and functional similarity, the latter being estimated through a molecular docking approach. An important feature in the evolution of insect ORs is the emergence of a unique co-receptor, called Orco, which appears to be an OR that has lost the ability to bind odorants. In addition to the large-scale bioinformatic analysis, the authors also aim to explore more specifically the factors that favored the emergence of Orco and the selective advantage conferred by the existence of OR-Orco complexes.
Given the importance of odorant receptors in insect biology and in their adaptation to different environments and lifestyles, retracing their evolutionary history is indeed a major question in evolutionary biology. In principle, this type of work therefore has the potential to become a reference in the field and to provide a basis for significant scientific advances.
Major strengths and weaknesses:
The sampling chosen for collecting OR sequences is very impressive, with more than 100 insect families represented, covering most of the major orders. This sampling appears appropriate for the question being addressed. The analysis pipeline used to collect the sequences makes sense, relying on homology-based annotation tools coupled with a structure-based filter. Nevertheless, one can note aberrant numbers of ORs for certain species (much lower than reality), which indicates that the pipeline probably did not function correctly for all genomes. In the absence of a validation step comparing the results with already known OR repertoires, it is difficult to estimate the overall quality of the data. The authors chose to apply a fairly stringent filter on sequence quality (based on predicted 3D structure), which reduces the number from 14,000 to 9,000. This choice seems logical given the subsequent use of these data, but it inevitably leads to data loss. The fact that some OR genes may be missing and that the total number may not be exact for each species is not prohibitive for studying the evolution of the family at a broad scale; however, it calls into question certain results that rely on this total number, such as the correlation between the number of ORs and genome size, lifestyle, and diet.
From the dataset collected, the authors attempted to categorize ORs in several ways, starting with the reconstruction of sequence similarity networks. The approach is interesting, but in the end, the results do not seem to be sufficiently exploited, and it is not obvious what the advantage of this approach is compared with the "classical" phylogenetic approach, which generally fails to reveal homology relationships between ORs from species belonging to different insect orders. Here again, the majority of the clusters identified are "order-specific," and when this is not the case, the authors did not attempt to exploit the results. For example, clusters SeqC26 or SeqC28, which appear to be shared by many insects, are potentially very interesting. It might have been relevant to combine this similarity-based clustering approach with phylogenetic reconstructions within each shared cluster.
The clustering based on structure also leads to the identification of a majority of "order-specific" clusters, but once again, the clusters shared by several orders are not truly exploited, which does not provide new insight into the evolution of ORs. However, the authors highlight a group of ORs in flies that appear to possess an unusual intracellular region. This is interesting, although it is a result more relevant to OR structure than to their evolution. The function of these ORs in Drosophila melanogaster, if it is known, is not discussed.
The analysis of structural diversity then leads the authors to focus on the Orco co-receptors, which are characterized by modifications of the binding pocket and the emergence of an extracellular loop that could explain the loss of the ability to bind odorant molecules. This part, which relies on in vitro experiments, is interesting and constitutes the most striking result of the study, which could in itself have been the subject of a separate manuscript. However, the molecular dynamics modelling does not add anything in the way it is conducted (5 ns is too short).
The rest of the manuscript is based on the prediction of OR response spectra using molecular docking. The work that has been carried out is extremely substantial, and the objective of linking clusters based on sequence similarity or 3D structural similarity with functional categories is entirely relevant. Nevertheless, I see two major problems with this in silico functional analysis:
(1) The docking score threshold used was chosen thoughtfully, which is very good, and according to the calculation performed, should ensure a true positive rate of more than 20%, which is excellent in such a docking analysis. But in the absence of functional validation, this 20% true positive rate is not sufficient to extrapolate OR function as the authors do in the remainder of the manuscript. The risk of error remains too high to compare in such detail the function of ORs from insects with different lifestyles or diets.
(2) The six functional clusters identified are only slightly different from one another, with similar detection of all chemical families except acids and amines (which was expected, given that these families are a priori detected by IRs rather than ORs). This shows that even though the approach is relevant and deserves to be tested, it cannot be used to establish a link between groups/lineages of ORs and response spectra at the scale of insects as a whole. This is reflected in the final analysis by the fact that there is no visible link between sequence or structural clusters and functional clusters. Given the uncertainty surrounding the docking results, the entire subsequent analysis of the relationship between the Binding Breadth Index and ecological variables is highly questionable.
Finally, the evolutionary analysis proposed to conclude that the work suffers from an incorrect interpretation: ORs of non-holometabolous insects cannot be considered equivalent to those of species that existed before the Permian-Triassic extinction. The fact that a locust or a cockroach has more narrowly tuned ORs than holometabolous insects does not mean that this was also the case for ancestral insects. To advance this type of conclusion, it would be necessary to conduct a phylogenetic analysis and reconstruct ancestral states, which is not the case here.
In summary, despite the large number of analyses performed, the authors do not succeed in achieving the stated objective of reconstructing the evolutionary history of insect ORs, and the results obtained do not sufficiently support the conclusions regarding the links between OR repertoires and environment or lifestyle.
Reviewer #2 (Public review):
The remarkable evolvability of the olfactory system enables animals to rapidly adapt to dynamic and chemically complex environments. Over the past two decades, substantial effort has been devoted to uncovering the evolutionary principles that drive the diversification of odorant receptors (ORs), yielding key insights into the forces shaping their striking variability in both vertebrates and insects. In this manuscript, Zhang and colleagues analyze the OR repertoires of over 100 insect species, leveraging sequence and structural similarity to infer patterns of gene family evolution within this diverse and ecologically important clade. By integrating sequence-based and structure-based comparisons, their study builds on a compelling and recently emerging line of research made possible by the advent of AlphaFold, which has previously clarified the phylogenetic relationship between insect Ors and the gustatory receptor gene family and revealed the unexpectedly deep evolutionary origins of this ancient structural fold.
Applying this approach to a large set of ORs derived from species throughout the insect phylogeny, the authors confirm many previously reported patterns of OR evolution. Unfortunately, the way these results are presented lacks clarity in what is already known from previous work in the field versus what is a novel finding based on the analysis of this dataset.
It is unclear how complete the odorant receptor sets are. I recommend benchmarking the pipeline by comparing its output to a gold standard and a frequently vetted complete OR set, such as that of Robertson and Wanner 2006 or similar.
Using their structural clustering approach, the authors identify a structural feature mostly unique to the OR co-receptor ORco, a beta-sheet in EL2, which they functionally show reduces odorant binding affinity - a key aspect of ORco, which does not bind ligands in the ancestral ligand-binding site. This is a particularly strong part of the manuscript, since the authors support their in silico-derived hypothesis with functional data.
Lastly, in an attempt to assess the relationship between sequence identity and structure on one hand and function on the other, the authors perform an in silico structure prediction and chemical docking analysis. As it stands, this part is on the more speculative side since the docking approach has not been verified with available functional datasets.
eLife Assessment
The study presents useful findings on the behavioral effects of nicotine exposure, suggesting the Drosophila larva as a potential model organism for studying underlying neural circuits. However, the evidence supporting the claims of the authors is incomplete and would benefit from more rigorous analysis and explanations. The study falls short of identifying the neural mechanisms and is therefore of interest to those with an interest in pharmacology and behavior.
Reviewer #1 (Public review):
Summary:
Dancausse et al. investigate behavioral responses to nicotine exposure in Drosophila larvae. They discover that high concentrations of nicotine lead to less movement and twitching, which recover slowly after several hours. Exposure to lower concentrations, however, increases locomotion and leads to hyperactive behavior. The authors also perform pharmacological and genetic manipulations to address the role of dopamine for these behavioral changes. Additionally, they test the role of MB intrinsic neurons by genetic silencing. Both Dopamine and MB manipulations affect responses to nicotine exposure. Finally, they investigate how larvae respond to repeated exposures to nicotine and find that they do not habituate. Additionally, repeated exposure to nicotine leads to a preference towards higher concentrations in a gradient assay.
Strengths:
The authors use rigorous behavioral analysis and discover interesting concentration and experience-dependent effects of nicotine exposure on locomotion in fly larvae, which will be worth investigating in the future to decipher the underlying neural mechanism.
Weaknesses:
As the manuscript currently stands, the results of genetic manipulations are hard to interpret and rather inconclusive. The genetic manipulations have been performed using broadly expressing genetic driver lines, which weakens the conclusions drawn by the authors. Thus, no specific neural populations or brain regions have been discovered, and there is little insight into the underlying neural mechanism.
Based on gradient experiments, the authors suggest that fly larvae could serve as a model organism for addiction. This claim is quite strong, but no control experiments are shown for shorter exposure or a single exposure with a longer resting period before the gradient test. To compare this to addiction-like behaviors, more control experiments should be performed.
The authors should clarify better how experiments were performed in Materials and Methods. Generally, the authors perform novel behavioral analysis, which is not explained in enough detail. The nicotine concentration that has been used for most experiments is this a relevant concentration comparable to other studies? This information would be useful to put into context with other findings.
Reviewer #2 (Public review):
Summary:
CNS function relies on a balance of excitatory and inhibitory activity. Use of addictive stimulants such as nicotine results in a chronic imbalance of these activities, and often this activity acts through dopamine pathways. To address how stimulants cause dysfunctional signaling in the DA neurotransmitter system and how this impacts neural circuit activity and behavior, the authors of this study begin to establish Drosophila larvae as a model for studying nicotine exposure.
They focus on three questions:<br /> (1) In what ways does nicotine-driven hyperactivation modulate behavior?<br /> (2) What roles do neural circuits play in these responses?<br /> (3) What are the mechanisms of drug dependence and addiction-like plasticity?
To this end, the authors use high-resolution behavioral, genetic, and pharmacological methods.
The authors show that exposure to nicotine alters the behavioral repertoire of larval Drosophila, with effects that are long-lasting (hours) and dose-dependent. Most of the study uses a 5-minute exposure to "moderate" levels of nicotine because this dosage produces the greatest potentiation of larval crawling speed. Concomitant with increases in crawling speed, they find alterations in other behavioral parameters-crawl "efficiency" and turn rate are reduced; whereas head swings are faster and more likely to be accepted. They find that reducing the activity of dopaminergic neurons reverses the valence of behavioral change upon exposure to nicotine. For example, crawling speed is decreased upon nicotine exposure in a Ple>Kir2.1 manipulation in comparison to controls. Moreover, they demonstrate that the effect of nicotine on the quantified set of behaviors depends on dopamine signaling. Beyond implicating dopamine signaling, they implicate the mushroom body, and particularly the gamma-neurons, in mediating exposure to nicotine.
The authors further probe how nicotine exposure alters larval behavior. First, they determine what happens to crawling speed with multiple exposures, finding sustained higher crawling speeds relative to controls. Second, as a model for addition-like behavior, they examine larval behavior on a nicotine gradient after repeated nicotine exposure. The data in Figure 7D are particularly compelling, showing that after nicotine exposure, larvae prefer high concentrations of nicotine.
Strengths:
In a concise set of experiments, the authors demonstrate a nicotine-induced behavioral change, its interaction with a neurotransmitter system, and a locus of action within the CNS. Thus, the authors set the stage for the use of Drosophila larvae as a model to better understand addiction-related behaviors.
Weaknesses:
This is a clear advance for the field of larval neurogenetics, but the extent to which it changes the way we think about nicotine exposure more generally is less clear. Nonetheless, the authors clearly achieved the goal they set out to attain.
Reviewer #3 (Public review):
Summary:
Dancausse et al. examine behavioral responses to nicotine administration in larvae. The study first distinguishes between spasms and extreme hyperexcitability elicited at high doses from a hyperactivity state triggered at lower (~1 mM feeding) doses. They then focus on the hyperactivity state and examine if dopaminergic neuron function is involved (via transgenic and pharmacological manipulations). Next, the role of the Mushroom body, a site of integration in the larval brain, is interrogated. In these studies, the authors use multiple approaches to draw complementary conclusions. The last section examines the effect of repeated nicotine exposure and of nicotine preference following repeated exposure. The findings are foundational for future studies looking to use Drosophila larvae as a system to study nicotine addiction.
Strengths:
Overall, I think the study is of broad importance. The neurogenetics community gets valuable insight into how ACh excitation interplays with DA signaling to regulate movement. For the addiction community, the work describes a valuable system to further interrogate genetic and environmental factors potentially driving addiction under well-controlled conditions. The quantitative analysis is generally well done, and the use of multiple experimental strategies to buttress conclusions is commendable.
Weaknesses:
(1) Conceptual point. Insects use ACh as the primary excitatory neurotransmitter, with nAChRs broadly expressed, while vertebrates use Glutamate in this role. (Arguably, nicotine expression in tobacco plants evolved as an insecticide, broadly disrupting the central excitatory neurotransmitter.) In vertebrates, central ACh neurons are relatively sparse - primarily originating from the basal forebrain.
Based on these distinctions, it is important to consider/contrast nicotine-driven hyperexcitation from other methods to produce broad hyperexcitation (e.g., inhibition of GABA, high K+, elevated temperature, etc). Many of these methods to induce hyperexcitability would also modulate DA circuitry.
A discussion of the role of ACh in insect vs. vertebrate brains is necessary to interpret the experimental design and findings with regard to addiction. These points should be addressed in the intro and discussion.
(2) (Figure 1) Relatedly, how do the behaviors elicited in Figure 1B (30 or 60 mM) compare to the convulsions described following electroshock stimulation to induce a seizure? My suspicion is that you're essentially triggering a seizure (or seizures) in these larvae.
(3) (Figure 4) Is a statistical analysis between the CS, Ple>Kir, Ple, and Kir locomotion at baseline done? Presumably, these manipulations would alter the intrinsic activity levels of the larvae?
(4) (General quantitative question) How do the parameters co-vary across individuals following nicotine admin? Crawl speed and peristalsis frequency are analyzed. Turning doesn't seem to be considered. Do individuals that show large increases in velocity also show the largest reductions in turn rate? Are these relations preserved following the DA metabolism and MB function interventions?
(5) (Discussion / general question) Beyond DA, other monoamines are involved in regulating larval locomotion - OA and TA are a clear example from Fox et al. (2006). Could the authors comment on whether they would expect similar findings in other neurotransmitter systems or if these neurotransmitter systems are involved in the ACh -> DA interplay studied here?
(6) (Discussion) Following the establishment of nicotine preference, do larvae exhibit signs of 'withdrawal' or changes in baseline behavior when deprived of nicotine? For example, in Figure 6, does the speed following nic administration ever 'go below' the H2O line?
Author response:
We appreciate the extremely helpful feedback from the reviewers and editors for our manuscript. We are happy that the reviewers have appreciated what we are doing here, performing the initial work that should set the stage with Drosophila larva as a model for hyperactive stimulant response. Every comment is certainly addressable within a reasonably short time period and we look forward to improving our paper in an upcoming revision.
We have some confusion about the “fundamental issue” of using nicotine, as we see the excitation as the fundamental effect we are studying, but we can continue to discuss and clarify this.
We plan to make significant edits to our introduction and background sections to better frame the goals of the work, and will clarify and expand on our methods, and more carefully make any claims about neural mechanisms.
terrace
露台
weeping willow tree
垂柳
giant arch
巨型拱形纪念建筑
underfunded
Ziervogel, G. (2019). Unpacking the Cape Town drought: Lessons learned. WIREs Water, 6(5), e1354. https://doi.org/10.1002/wat2.1354
“Green Apartheid”
Venter, Z. S., Shackleton, C. M., Van Staden, F., Selomane, O., & Masterson, V. A. (2020). Green apartheid: Urban green infrastructure remains unequally distributed across income and race geographies in South Africa. Stockholm Resilience Centre. https://www.stockholmresilience.org/publications/publications/2021-01-07-green-apartheid-urban-green-infrastructure-remains-unequally-distributed-across-income-and-race-geographies-in-south-africa.html
(r^2=32),
Ziervogel, G. (2019). Unpacking the Cape Town drought: Lessons learned. WIREs Water, 6(5), e1354. https://doi.org/10.1002/wat2.1354
survive
McCauley, M. (2019). Water rights: Day Zero. UCLA School of Law. https://law.ucla.edu/sites/default/files/PDFs/Academics/McCauley-Water%20Rights%20and%20Day%20Zero.pdf
He suggests that “government officials—at the national or city level—could have instituted restricted use programs and diversified water storage to mitigate the effects of climate change and who residents should trust to provide guidance during the crisis.” (McCauley 10)
McCauley, M. (2019). Water rights: Day Zero. UCLA School of Law. https://law.ucla.edu/sites/default/files/PDFs/Academics/McCauley-Water%20Rights%20and%20Day%20Zero.pdf
Day Zero
McCauley, M. (2019). Water rights: Day Zero. UCLA School of Law. https://law.ucla.edu/sites/default/files/PDFs/Academics/McCauley-Water%20Rights%20and%20Day%20Zero.pdf
“Day Zero.”
World Energy Council. (2019). Drought in South Africa: Extreme weather conditions (September 2019). https://www.worldenergy.org/assets/downloads/Drought_South_Africa_-Extreme_weather_conditions_SEP2019.pdf
a “logic of enclosure
Venter, Z. S., Shackleton, C. M., Van Staden, F., Selomane, O., & Masterson, V. A. (2020). Green apartheid: Urban green infrastructure remains unequally distributed across income and race geographies in South Africa. Stockholm Resilience Centre. https://www.stockholmresilience.org/publications/publications/2021-01-07-green-apartheid-urban-green-infrastructure-remains-unequally-distributed-across-income-and-race-geographies-in-south-africa.html
with
World Energy Council. (2019). Drought in South Africa: Extreme weather conditions (September 2019). https://www.worldenergy.org/assets/downloads/Drought_South_Africa_-Extreme_weather_conditions_SEP2019.pdf
communities
World Energy Council. (2019). Drought in South Africa: Extreme weather conditions (September 2019). https://www.worldenergy.org/assets/downloads/Drought_South_Africa_-Extreme_weather_conditions_SEP2019.pdf
infrastructure
Macrotrends. (n.d.). South Africa GDP (gross domestic product). https://www.macrotrends.net/global-metrics/countries/zaf/south-africa/gdp-gross-domestic-product
Snowbowl used waste water for expanded snowmaking opperations, aproved by the USFS
U.S. Department of Agriculture, Forest Service. “Record of Decision: Arizona Snowbowl Facilities Improvements Final EIS and Forest Plan Amendment #21.” 2005.
Rodgers and O'Neill
Rodgers, Dennis, and Bruce O’Neill. “Infrastructural Violence: Introduction to the Special Issue.” Ethnography 13, no. 4 (December 2012): 401–412.
"Perverse adaptation"
Dunstan, Adam. “Victims of ‘Adaptation’: Climate Change, Sacred Mountains, and Perverse Resilience.” Journal of Political Ecology 26, no. 1 (2019): 704–719.
Forest Service's review recorded Diné and Hopi opposition, documented the religious and ecological harm
U.S. Department of Agriculture, Forest Service. “Final Environmental Impact Statement for Arizona Snowbowl Facilities Improvements, Volume 2: Response to Comments on the Draft Environmental Impact Statement.” 2005.
Arizona's beneficial-use
Arizona Department of Water Resources. “Surface Water Overview.” Accessed April 13, 2026.

