RRID:AB_2050678
DOI: 10.1186/s40478-026-02240-y
Resource: (Enzo Life Sciences Cat# BML-FG6090-0100, RRID:AB_2050678)
Curator: @scibot
SciCrunch record: RRID:AB_2050678
RRID:AB_2050678
DOI: 10.1186/s40478-026-02240-y
Resource: (Enzo Life Sciences Cat# BML-FG6090-0100, RRID:AB_2050678)
Curator: @scibot
SciCrunch record: RRID:AB_2050678
RRID:AB_3678888
DOI: 10.1186/s40478-026-02240-y
Resource: RRID:AB_3678888
Curator: @scibot
SciCrunch record: RRID:AB_3678888
RRID:AB_3711244
DOI: 10.1186/s40478-026-02240-y
Resource: RRID:AB_3711244
Curator: @scibot
SciCrunch record: RRID:AB_3711244
RRID:AB_10013382
DOI: 10.1186/s40478-026-02240-y
Resource: (Agilent Cat# Z0334, RRID:AB_10013382)
Curator: @scibot
SciCrunch record: RRID:AB_10013382
RRID:SCR_007037
DOI: 10.1016/j.neuroimage.2026.121989
Resource: SPM (RRID:SCR_007037)
Curator: @scibot
SciCrunch record: RRID:SCR_007037
RRID:SCR_002865
DOI: 10.1016/j.neuroimage.2026.121989
Resource: SPSS (RRID:SCR_002865)
Curator: @scibot
SciCrunch record: RRID:SCR_002865
RRID:SCR_024210
DOI: 10.1016/j.neuroimage.2026.121989
Resource: MorePower (RRID:SCR_024210)
Curator: @scibot
SciCrunch record: RRID:SCR_024210
RRID:SCR_001905
DOI: 10.1016/j.neuroimage.2026.121989
Resource: R Project for Statistical Computing (RRID:SCR_001905)
Curator: @scibot
SciCrunch record: RRID:SCR_001905
AB_330248
DOI: 10.1016/j.isci.2026.115716
Resource: (Cell Signaling Technology Cat# 3671, RRID:AB_330248)
Curator: @scibot
SciCrunch record: RRID:AB_330248
AB_2534079
DOI: 10.1016/j.isci.2026.115716
Resource: (Thermo Fisher Scientific Cat# A-11012, RRID:AB_2534079)
Curator: @scibot
SciCrunch record: RRID:AB_2534079
AB_2249358
DOI: 10.1016/j.isci.2026.115716
Resource: (Cell Signaling Technology Cat# 3629, RRID:AB_2249358)
Curator: @scibot
SciCrunch record: RRID:AB_2249358
AB_561053
DOI: 10.1016/j.isci.2026.115716
Resource: (Cell Signaling Technology Cat# 2118, RRID:AB_561053)
Curator: @scibot
SciCrunch record: RRID:AB_561053
AB_2798136
DOI: 10.1016/j.isci.2026.115716
Resource: (Cell Signaling Technology Cat# 13166, RRID:AB_2798136)
Curator: @scibot
SciCrunch record: RRID:AB_2798136
AB_2800199
DOI: 10.1016/j.isci.2026.115716
Resource: (Cell Signaling Technology Cat# 93065, RRID:AB_2800199)
Curator: @scibot
SciCrunch record: RRID:AB_2800199
AB_2534069
DOI: 10.1016/j.isci.2026.115716
Resource: (Thermo Fisher Scientific Cat# A-11001, RRID:AB_2534069)
Curator: @scibot
SciCrunch record: RRID:AB_2534069
AB_10839118
DOI: 10.1016/j.isci.2026.115716
Resource: (Cell Signaling Technology Cat# 2500, RRID:AB_10839118)
Curator: @scibot
SciCrunch record: RRID:AB_10839118
AB_10013641
DOI: 10.1016/j.isci.2026.115716
Resource: (Cell Signaling Technology Cat# 6943, RRID:AB_10013641)
Curator: @scibot
SciCrunch record: RRID:AB_10013641
AB_2174466
DOI: 10.1016/j.isci.2026.115716
Resource: (Cell Signaling Technology Cat# 2541, RRID:AB_2174466)
Curator: @scibot
SciCrunch record: RRID:AB_2174466
AB_2160882
DOI: 10.1016/j.isci.2026.115716
Resource: (Cell Signaling Technology Cat# 3528, RRID:AB_2160882)
Curator: @scibot
SciCrunch record: RRID:AB_2160882
AB_477629
DOI: 10.1016/j.isci.2026.115716
Resource: (Sigma-Aldrich Cat# V9131, RRID:AB_477629)
Curator: @scibot
SciCrunch record: RRID:AB_477629
AB_2291558
DOI: 10.1016/j.isci.2026.115716
Resource: RRID:AB_2291558
Curator: @scibot
SciCrunch record: RRID:AB_2291558
AB_2128060
DOI: 10.1016/j.isci.2026.115716
Resource: (BD Biosciences Cat# 610467, RRID:AB_2128060)
Curator: @scibot
SciCrunch record: RRID:AB_2128060
AB_10891442
DOI: 10.1016/j.isci.2026.115716
Resource: (Cell Signaling Technology Cat# 8556, RRID:AB_10891442)
Curator: @scibot
SciCrunch record: RRID:AB_10891442
RRID:AB_2307391
DOI: 10.1016/j.isci.2026.115716
Resource: (Jackson ImmunoResearch Labs Cat# 111-035-144, RRID:AB_2307391)
Curator: @scibot
SciCrunch record: RRID:AB_2307391
AB_10694415
DOI: 10.1016/j.isci.2026.115716
Resource: (Cell Signaling Technology Cat# 4848, RRID:AB_10694415)
Curator: @scibot
SciCrunch record: RRID:AB_10694415
RRID:AB_2338505
DOI: 10.1016/j.isci.2026.115716
Resource: (Jackson ImmunoResearch Labs Cat# 115-035-068, RRID:AB_2338505)
Curator: @scibot
SciCrunch record: RRID:AB_2338505
AB_3698765
DOI: 10.1016/j.isci.2026.115716
Resource: RRID:AB_3698765
Curator: @scibot
SciCrunch record: RRID:AB_3698765
AB_476749
DOI: 10.1016/j.isci.2026.115716
Resource: (Sigma-Aldrich Cat# A5979, RRID:AB_476749)
Curator: @scibot
SciCrunch record: RRID:AB_476749
RRID:AB_2728768
DOI: 10.1016/j.ejphar.2026.178958
Resource: (Cell Signaling Technology Cat# 13901, RRID:AB_2728768)
Curator: @scibot
SciCrunch record: RRID:AB_2728768
RRID:AB_330337
DOI: 10.1016/j.ejphar.2026.178958
Resource: (Cell Signaling Technology Cat# 3661, RRID:AB_330337)
Curator: @scibot
SciCrunch record: RRID:AB_330337
RRID:AB_2219397
DOI: 10.1016/j.ejphar.2026.178958
Resource: (Cell Signaling Technology Cat# 3676, RRID:AB_2219397)
Curator: @scibot
SciCrunch record: RRID:AB_2219397
RRID:AB_10210643
DOI: 10.1016/j.ejphar.2026.178958
Resource: (MBL International Cat# M126-3, RRID:AB_10210643)
Curator: @scibot
SciCrunch record: RRID:AB_10210643
RRID:CVCL_4388
DOI: 10.1016/j.ejphar.2026.178958
Resource: (ATCC Cat# CRL-4000, RRID:CVCL_4388)
Curator: @scibot
SciCrunch record: RRID:CVCL_4388
RRID:CVCL_0462
DOI: 10.1016/j.ejphar.2026.178958
Resource: (JCRB Cat# IFO50409, RRID:CVCL_0462)
Curator: @scibot
SciCrunch record: RRID:CVCL_0462
RRID:AB_2285392
DOI: 10.1016/j.ejphar.2026.178958
Resource: (Cell Signaling Technology Cat# 9206, RRID:AB_2285392)
Curator: @scibot
SciCrunch record: RRID:AB_2285392
RRID:AB_390722
DOI: 10.1016/j.ejphar.2026.178958
Resource: (Cell Signaling Technology Cat# 2708, RRID:AB_390722)
Curator: @scibot
SciCrunch record: RRID:AB_390722
RRID:AB_907273
DOI: 10.1016/j.ebiom.2026.106290
Resource: (MABTECH Cat# 3420-6-250, RRID:AB_907273)
Curator: @scibot
SciCrunch record: RRID:AB_907273
RRID:CVCL_1915
DOI: 10.1016/j.ebiom.2026.106290
Resource: (IZSLER Cat# BS CL 8, RRID:CVCL_1915)
Curator: @scibot
SciCrunch record: RRID:CVCL_1915
RRID:AB_3712871
DOI: 10.1016/j.ebiom.2026.106290
Resource: RRID:AB_3712871
Curator: @scibot
SciCrunch record: RRID:AB_3712871
form, value, and novelty co-constitute a living cosmos.
novelty indeed
arising from the deep through diligent presistent intention in time
on-dogmatic, non-interventionist process theology
add autopoietic
Agency belongs to the concrete occasions of experience associated with living organisms that prehend both the physical past and relevant unrealized potentials, so that formal and final causes re-enter biology as internal modes of organismic valuation and decision, not externally imposed blueprints.
music to my ears
“eternal objects” name structured possibilities that do not themselves act but are ingressed and selectively realized by organisms.
not eternal objects but mutually arising co-evolving manifestations new living forms out there
organisms mere terminals
mere terminals
It is the other way round
the spirit world is woven/created by individual consciousness
that descended into space time
thin client metaphor
oops
ingress from beyond space-time
beyond space time
spirit world?
by Matt Segall

Platonic research program
Platonic? needs to be flipped back
what is Mind no matter what is matter never Mind
on the Ingression of Novel Form: Toward a New Formal Causality
Im interested in the ougression of novel fourm
intuition is at heart is outtuition
At the chip level, utilisation refers to the share of a GPU’s theoretical compute capacity that is actively performing useful work at any given moment. In tightly optimised benchmark or hyperscale training runs, cluster-level GPU utilisation can reach approximately 90% for extended periods once data pipelines and storage bottlenecks are carefully engineered. However, this figure represents the best-case scenario. Studies of commercial deployments where workloads are more varied and scheduling policies face limitations find that utilisation is considerably lower at 30–70% on average. At the cluster level, utilisation takes on a different meaning, as it describes how much of the installed compute capacity is actively drawing load over time, as opposed to sitting idle or in standby
This is a fairly good characterisation of the utility issue. It means totally different things to different people
Within each AI server, GPUs are linked by ultra-high-bandwidth, short-reach interconnects such as NVLink. Instead of sending data over the standard connection that normally links a GPU to the rest of the server, NVLink creates a direct ‘fast lane’ between GPUs so that they can exchange model data without going through the CPU, as it is the case for the standard connection. 61 This high-speed fabric effectively pools the memory and compute of multiple GPUs inside a rack but also raises local power density, adding extra heat that needs to be removed at rack level
So these are essentially like having lit up network links between cards inside the same server, rather of them relying on the existing links that all the other traffic uses?
At the same time, improvements in power semiconductors, such as gallium-nitride–based converters and very efficient DC-to-DC direct current transformer modules, make each remaining conversion stage waste less energy and heat
Is it gallium nitride here? I assumed it would be silicon carbide, but they do overlap now
が、本記事では概念を優先して単層で示しています
...高速化しています。本記事では概念を優先して単層で示していますが、複数階層のグラフにより、上位層でざっくり当たりをつけて下位層で細かく探すことが可能になり、数百万の検索が数十ステップで近傍を見つけることができます)
みたいな感じではどうでしょうか?
ベクトル同士をエッジでつないだ
「ベクトル同士をエッジでつないだ」というのがピンと来ない気がするので、「ベクトルがに近いものを繋いでいる」とかのほうが伝わりやすいかなとも思ったり、「入口ノードから近いものを辿り、クエリ Q に近づいていく検索が行えます」というような表現でもよいかなと思いました。
les deux tableaux d’entrée
Bcp de mots pøur des évidences
#+CALL ci-dessous appelle
C'est pas exporté
💻/thinkpad/🧊/me/📓/2026/04/25
indy.web.archive-start-all-2025-Oct-25

experiment-use Save Page with Single File
gives a lively copy of a full MemPlex editor page
with all content there on the page along with the very capability used to creat it
question-does i work?
Sure it has an empty localStorage

Login required for public server
rust desk login required

A new Settings → Provide Strategy submenu lets you cut down on what your node announces to the DHT:

IPFS Desktop release v0.49.0
indy.clip-web.of.documents,bookburners.paradise,internet.archive,digital.vellum,emulate.everything
using inbrowser.link

using dweb.link
do.how
use inbrowser.link and dweb.link one after the other
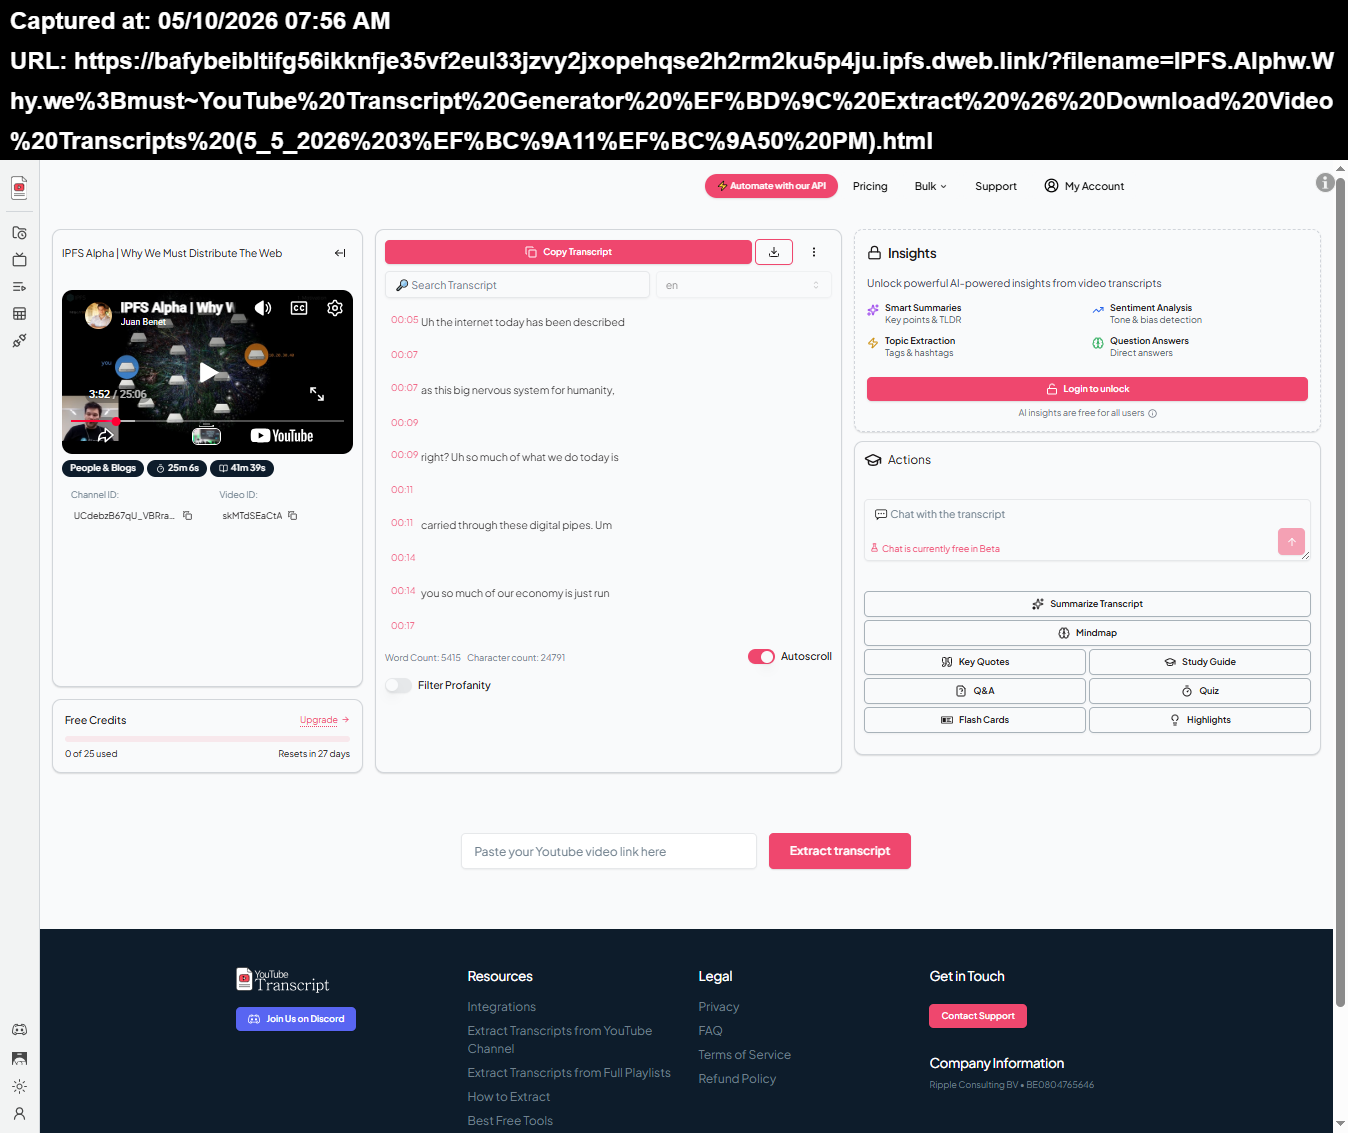
IPFS Alpha | Why We Must Distribute The Web
💻/thinkpad/🧊/me/📓/2026/5/1/0
indy.web.archive-ipfs.alpha.why.we.must-distribute.the.web~Youtube.transcript.generator


8 pointed star
❂
What is an Egregore

How to assign a timestamp to reflect the date & time a file was ...IPFS Forumshttps://discuss.ipfs.tech › how-to-assign-a-timestamp-to-...IPFS Forumshttps://discuss.ipfs.tech › how-to-assign-a-timestamp-to-...24 May 2024 — As such, the IPFS assigns a unique CID to each file uploaded on the network, but does not provide a timestamp for the uploads.Add Time Stamps to files added to the network - IPFS Forums23 Feb 2019Using IPFS for Live Streaming Video? - Help11 Dec 2019More results from discuss.ipfs.tech
/💻/thinkpad/🧊/me/📓/2026/5/1/0
https://bafybeidvaopjdrrr7dhlrlqse2n6e3hvrqe3f4q3oys3fwmhuvatbjnn44.ipfs.dweb.link?filename=How%20to%20assign%20a%20timestamp%20to%20reflect%20the%20date%20%26%20time%20a%20file%20was%20uploaded%20in%20IPFS%EF%BC%9F%20-%20Help%20-%20IPFS%20Forums%20(5_10_2026%207%EF%BC%9A37%EF%BC%9A11%20AM).html
search~google?q=IPFS+video+player+start+at+time+stamp

IPFS Video player
The NPR article made me think more about company responsibility. It says Facebook’s own research found Instagram could harm some teens’ mental health, especially around body image, but the company still publicly defended the platform. That feels unethical because users deserve honesty when a product may affect vulnerable teenagers.
C. L. Lynch. “Autism is a Spectrum” Doesn’t Mean What You Think. NeuroClastic, May 2019. URL: https://neuroclastic.com/its-a-spectrum-doesnt-mean-what-you-think/ (visited on 2023-12-08).
The article discusses how autism is a complex spectrum of overlapping neurological traits like sensory processing, motor control, and social awareness. This "rainbow" of traits means that two autistic individuals can have vastly different strengths and challenges, making some labels towards autistic people misleading and harmful. For instance, a non-speaking person can have profound intellectual depth and social desire, while a talkative person may struggle with basic functions or independent living. In general, the author urges readers to stop making assumptions based on outward behavior and instead recognize the diverse support needs of every autistic individual.
Anya Kamenetz. Selfies, Filters, and Snapchat Dysmorphia: How Photo-Editing Harms Body Image. Psychology Today, February 2020. URL: https://www.psychologytoday.com/us/articles/202002/selfies-filters-and-snapchat-dysmorphia-how-photo-editing-harms-body-image (visited on 2023-12-08).
It's very obvious that there is a huge issue with social media and body image issues. When people go to get cosmetic procedures, however, there's no way to tell the reason why someone is getting the procedure (without being very invasive). This rules out the idea of doctors asking patients to think carefully about their decisions. There's also the fact that many people do in fact feel a lot better after getting procedures done. That then brings the question of whether there should be some way to overlook this process from a mental health standpoint.
One thing I found interesting is that social media itself is not always “bad” for mental health. The chapter separates unhealthy activities from healthier ones, which feels more realistic. I think the problem is not only screen time, but what we do online: compare ourselves, doomscroll, or seek support and connection.
Researchers at Facebook decided to try to measure how their recommendation algorithm was influencing people’s mental health. So they changed their recommendation algorithm to show some people more negative posts and some people more positive posts. They found that people who were given more negative posts tended to post more negatively themselves. Now, this experiment was done without informing users that they were part of an experiment, and when people found out that they might be part of a secret mood manipulation experiment, they were upset [m5].
A few things to note here. First of all, a big company like Facebook having it's own researchers conclude that their app is harming young girls' mental health and still not doing anything about it is insane. They post this research and still fail to make changes for the better of the masses. In addition to that, running experiments as invasive as the ones described here without consent would definitely feel violating and uncomfortable. I am shocked that there isn't any law against this.
Next, Timur planned to invade Ming China. He pulled together an alliance of eastern Mongol tribes, but became ill along the way and died before he reached the Chinese border. The two heirs Timur had designated, his son and grandson, both died before him, so the throne went to a younger grandson, who called off the invasion.
It’s interesting how his death changed history, him not reaching China stopped a massive invasion.
Timur claimed to be both a Mongol in the tradition of the Great Khan, and also the "Sword of Islam". Temur means iron in the Chagatai language (like Genghis' name, Temujin). He was a brilliant strategist and tactician who was never defeated in battle and a great patron of scholars and poets; but is also remembered as one of the most brutal generals in history. When Timur crossed the Indus River with about 100,000 troops in 1398, he sacked the first city he reached, Tulamba, and massacred its inhabitants. As he advanced on Delhi, each of the cities he reached surrendered without a fight.
It’s interesting to me that he is known as a ruthless conqueror but also a great strategist.
The good: The city of Toronto website has a translate feature that helps people who may not speak English access important information. This helps accessibility by making city resources more inclusive for people from different background languages.
2-Many sections on this website uses bullet points and short headings instead of large blocks of texts which is good for people who can not read large paragraphs. This also helps the information easier and help people with learning disabilities. It is a good tool to have.
3- The website has a layout across different pages, which helps people know where to find menus, services, and contact information. This helps base it helps the browser look less confusing for people using technology.
4- The bad thing about this website is that the homepage changes between multiple large images and announcements, which can be distracting for people with attention difficulties. Many content all at once can make it harder for people to focus on the important information. This can be bad for people with ADHD.
5- The last bad one: Some of the announcements use images to communicate information, which can not be good for people who depend on readings. If images are unclear it can be hard for people with disability to fully understand what is happening in the website.
These are all of the good and bad ones :) .
La question de la durabilité écologique
Quelqu'un peut écrire un bout sur sur le coût écologique du stockage des données, de l'utilisation de l'IA, de la construction/ destruction des machines d'imagerie médicale, etc. ?
Rappels et généralités sur le rôle central de l’estimation du sexe ostéologique en anthropologie biologique et en médecine légale. I.e. : “estimer le sexe : pourquoi ?” (Bruzek 1992).
Ajouter qcchose sur l'importance de la fiabilité, notamment en contextes médico-légaux mais pas que… Que signifie un pourcentage de réussite de 60-70% (methodes sur le crâne) lorsque les seules possibilités sont 3 (m/f/na)??? (Fred?)
Ajouter un bout aussi sur les bases biologiques (fonction/forme) qui sous-tendent les méthodes de Jaro et leur absence dans le cas de pas mal d'autres méthodes (celle du crâne est évolutive, non fiable entre populations puisque basée sur des VA non métriques ; les méthodes métriques sur tous les autres os sont fondées ppalement sur la différence de taille tendancielle entre hommes et femmes, non sur la fonction d'accoucher ou pas)
ux technologies avancées
Et surtout : à quoi ça sert si on a déjà des méthodes qui fonctionnent très bien et qui sont biologiquement adéquates ?
plus avancées
Plus avancées en quel sens ? Plus couteuses, plus compliquées et du coup plus fiables ? Est-ce que cette partie ne serait pas l'occas pour parler/ critiquer cette idée (du progrès) ? Je vois que tu le proposes juste en dessous, mais est-ce que la critique peut aussi porter sur cette idée du progrès ?
comparables
elles ne sont pas comparables, pcq non fiables
https://www.facebook.com/groups/TypewriterCollectors/posts/10163593836864678/
If typists were Robots

Resemblance to disaster girl?
Lego Typewriters<br /> by [[Herman Price]]<br /> accessed on 2026-05-09T17:29:08
A fake Lego fake typewriter?<br /> by [[Richard Polt]] on The Typewriter Revolution blog<br /> accessed on 2026-05-09T17:27:34
The ROKR wooden typewriter: a closer look<br /> by [[Richard Polt]] in The Typewriter Revolution blog<br /> accessed on 2026-05-09T17:04:35
Richard Polt reports that the ROKR typewriter can actually be used to type, making it one of the very few currently manufactured typewriters on the planet.
from my experience working on other products, I found that older designs are easier to work with and have a more classic aesthetic.
The entire design process took about a year and a half
Office of the Attorney General State of Florida. n.d. “Price Gouging | My Florida Legal.” Www.myfloridalegal.com. https://www.myfloridalegal.com/consumer-protection/price-gouging.
Lehman, Gary E. 2017. “Price Gouging: Application of Florida’s Deceptive and Unfair Trade Practices Act in the Aftermath of Hurricane Andrew.” NSUWorks. 2017. https://nsuworks.nova.edu/nlr/vol17/iss3/4.
Editing is stochastic and non-saturating, which means two cells from different times or different lineages can end up with the same lineage mark at the same site. How's the editing efficiency?
This paper has a limitation on the labeling window : In vitro window 24hr + In vivo window (E2.5 to harvest time). Cre was activating throughout the developmental time. The molecular clock in PEtracer is a per-cell division clock, not a per-developmental time clock. That means PEtracer requires constant cell-division rate across all cells, stages and lineages — I don't believe it’s possible in real development.
The seeking out of bad news, or trying to get news even though it might be bad, has existed as long as people have kept watch to see if a family member will return home safely. But of course, new mediums can provide more information to sift through and more quickly, such as with the advent of the 24-hour news cycle [m10] in the 1990s, or, now social media.
I didn't know that "Doomscrolling" is a well-defined word rather than just a slang widely used to refer to continuous reel scrolling activity on social media. From my experience, this is clearly a very unhealthy yet addictive activity as it fools users into thinking that they are actually doing something while the fact is that they're just wasting their time. Sometimes doomscrolling helps me explore valuable information, but at the same time it makes my brain go numb after several hours of gluing my eyes to the screen. I completely understand how harmful it is but I have not managed to control myself yet:(
Turns out HTML is the most suitable cross-platform document format for desktop publishing, just like it's always been.
https://www.reddit.com/r/typewriters/comments/1t7ggls/techno_pica_typeface_hermes_3000/
Techno pica typeface on a Hermes 3000 with foundry marks "S" and "TP".

https://www.facebook.com/groups/TypewriterCollectors/posts/10163594865434678/
Green 1958 Olympia SM3 with custom math keyboard:

https://www.facebook.com/groups/705152958470148/posts/1264728369179268/
Custom gothic typeface on a Royal 10 made for supply/hardware settings. Uppercase is primarily fractions and abbreviations including: Dz, Gr, Bx, Bl, lb, In, Ft, Pr, Cs, Pc, Yd, and GL.
Fractions include odd numbers for the halfs, thirds, fourths, sixths, eighths, twelfths, and sixteenths,


discriminatory”
Lindiwe Mazibuko and Others v City of Johannesburg and Others CCT 39/09 (Constitutional Court of South Africa, 2009), 3
Rebel against summarizing what you have already written. You have one paragraph left with your intended audience, so inspire them by making a call to action, relating the topic of your essay to an aspect of the world in which we live, or leaving them with something to contemplate or reflect on.
I think inspiring readers by giving a call to action regarding the topic gives a personal call and shows a sense of conviction of what you really mean.
A common way to organize your ideas is the good ol’ outline. You can use an outline to determine the order in which you will address the topics in your paper and see your ideas from in linear fashion, which will help you see where you need more evidence to support your topic.
Outline is the way to go for me because i think i type faster than creating diagrams in paper.
Since your writing plan is the map of your essay, try to make it detailed enough so a peer would know the topics you will address in your essay and your overall stance on the topics. Including detailed evidence will help you see what support you have and need as you move to carve your path along completing the assignment. You will not get all of the information you need for your Writing Plan from your Discovery Draft, so create as you organize
Having a strong writing plan has made writing easier for me. It make me focused on specific plan and build my essay around it.
Keep in mind the TEA (Topic Sentence, Evidence, and Analysis) Paragraphing Structure to see if you can find those particular bits or get ideas from what you have written that might lead to these components. Mark them on your draft. Below are some things to consider:
Having this format in any sentence with topic sentence , evidence and analysis of my evidence gives a clear picture of my thoughts.
The first step, the biggest one is just getting started by collecting your ideas. How do you know what you will write if you do not know what you think? In this step, read through your notes, review your annotations about texts, examine the assignment by underlining, and make note of the task and expectations of the assignment; this allows you to understand the purpose
I think this class made me write essay in a proper format now since I have started using the structure of generating the idea and researching around it.
"/Applications/Klack.app" "/Applications/CleanShot X.app" "/Applications/MediaMate.app"
"ticktick" "cardhop"
# Utilities "keka" "localsend" "mediamate" "balenaetcher" "yubico-authenticator" "protonvpn" "confectionery"
that is typically not viewed as violence at all”
Rob Nixon, Slow Violence and the Environmentalism of the Poor (Cambridge, MA: Harvard University Press, 2011)
exceptional”
Nikhil Anand, "Municipal Disconnect: On Abject Water and Its Urban Infrastructures," Ethnography 12, no. 4 (2011), 490
women."
Neele Wiltgen Georgi, Sibongile Buthelezi, and Paula Meth, "Gendered Infrastructural Citizenship: Shared Sanitation Facilities in Quarry Road West Informal Settlement, Durban, South Africa," Urban Forum 32, no. 3 (2021): 442
“(Re)Conceptualizing Water Inequality in Delhi, India through a Feminist Political Ecology Framework,
Yaffa Truelove, "(Re)Conceptualizing Water Inequality in Delhi, India through a Feminist Political Ecology Framework," Geoforum 42, no. 2 (2011), 148
outings."
Yaffa Truelove, "(Re)Conceptualizing Water Inequality in Delhi, India through a Feminist Political Ecology Framework”,147
Domestic Workers Across the World,
International Labour Organization, Domestic Workers Across the World: Global and Regional Statistics and the Extent of Legal Protection (Geneva: International Labour Office, 2013),
An updated version of this work has been published in iScience: https://doi.org/10.1016/j.isci.2026.115008
`remoralize the ruling classes’,
lol
its recent taste for extremism’ (examples of which are ‘legalization of drugs regardless of the logic of addiction’ and ‘the rights of biological men who identified as women to enter women’s changing rooms and women’s prisons’)
damn
The book seems, prima facie, to be proposing an interesting thesis – that is, one which, even if not completely true, is at least contentful enough to be enlighteningly false.
Nice line
Hugo PaperMod 主题精装修
将Hugo主题更换为PaperMod并在此基础上有魔改
从理论角度推导 Muon 优化器,介绍其「控制谱范数下的最速下降」的特性
Muon优化器的理论推导,侧重最速下降特性
[[Peter Rukavina p]] and [[Wouter Groeneveld p]] met in Liege, closing an open triangle in our network, w [[Frank Meeuwsen p]] and myself.
Lees het als een overtuigend prototype van een nieuwe manier van maken. En tegelijk gewoon als mijn verhaal. Over wat me al die jaren heeft gedreven, wat al die nieuwsbrieven met elkaar verbindt en waarom ik nog steeds zo veel energie krijg van nieuwe gereedschappen die mensen meer speelruimte geven
Author recognises himself in the output, and suggests seeing the result as a convincing prototype of a new way of making.
Natuurlijk had er nog een stevige eindredactieronde overheen gekund. Sterker nog, normaal gesproken had ik dat vrijwel zeker gedaan. Nog wat aanscherpen. Hier en daar schrappen. Een paar overgangen gladder maken. Sommige zinnen net iets strakker trekken. Maar dit keer heb ik dat bewust niet gedaan. Juist omdat ik wilde laten zien wat er nu al mogelijk is. Ik heb een uitgebreide prompt, een verzameling instructies, gegeven over bedoeling, workflow en output.
Author deliberately did not polish the AI output, to have a better view on what it actually produced from the inputs.
Ik heb met hulp van AI een boek gemaakt op basis van honderden nieuwsbrieven die ik de afgelopen jaren schreef. Iets wat eerder waarschijnlijk een te groot, te duur of te tijdrovend project was geweest, is nu wel maakbaar geworden.
Example of making something from an archive: transform his newsletter archive into a book shape.
De meeste dingen die ik wil maken, kan ik nu ook maken.
this also is true for personal tools
[[Erwin Blom p]] on how AI tools lower the Coasean floor for books.
Voor makers, uitgevers en experts met kennis, verhalen of archieven die te klein, te niche of te actueel leken voor een traditioneel boek.
Books can now be made for knowledge, stories or archives that are too niche or too current (bc half life of info I think, in a dynamic topic) for regular book publishing processes.
De vraag die mij meer bezighoudt is veel praktischer: welke boeken kunnen nu wel gemaakt worden die eerder zouden zijn blijven liggen?
The Coasean floor: what can be made now, that earlier would not have seen the light of day? (while acknowledging the answer to that question is also 'a lot of noise')
vgl: The Nature of the Firm by Ronald Coase 1937 vgl Benkler 2002 who linked Coase w peer production vgl [[Here Comes Everybody by Clay Shirky]] 2008
doi.org/10.34945/F5F010
DOI: 10.64898/2026.03.31.714901
Resource: Open Data Commons for Traumatic Brain Injury (RRID:SCR_021736)
Curator: @bandrow
SciCrunch record: RRID:SCR_021736
RRID:SCR_016251
DOI: 10.64898/2026.01.16.699952
Resource: SciScore (RRID:SCR_016251)
Curator: @bandrow
SciCrunch record: RRID:SCR_016251
RRID:SCR_027328
DOI: 10.64898/2026.01.16.699952
Resource: RRID:SCR_027328
Curator: @bandrow
SciCrunch record: RRID:SCR_027328
RRID:SCR_021736
DOI: 10.64898/2026.01.16.699952
Resource: Open Data Commons for Traumatic Brain Injury (RRID:SCR_021736)
Curator: @bandrow
SciCrunch record: RRID:SCR_021736
RRID:SCR_022252
DOI: 10.64898/2026.01.16.699952
Resource: RRID:SCR_022252
Curator: @bandrow
SciCrunch record: RRID:SCR_022252
RRID:SCR_016762
DOI: 10.64898/2026.01.16.699952
Resource: Social Science Statistics (RRID:SCR_016762)
Curator: @bandrow
SciCrunch record: RRID:SCR_016762
RRID:SCR_026988
DOI: 10.64898/2026.01.16.699952
Resource: RRID:SCR_026988
Curator: @bandrow
SciCrunch record: RRID:SCR_026988
RRID:SCR_008394
DOI: 10.64898/2026.01.16.699952
Resource: Python Programming Language (RRID:SCR_008394)
Curator: @bandrow
SciCrunch record: RRID:SCR_008394
(RRID:SCR_026987
DOI: 10.64898/2026.01.16.699952
Resource: RRID:SCR_026987
Curator: @bandrow
SciCrunch record: RRID:SCR_026987
RRID:SCR_013249
DOI: 10.64898/2026.01.16.699952
Resource: Entrez Utilities (RRID:SCR_013249)
Curator: @bandrow
SciCrunch record: RRID:SCR_013249
RRID:CVCL_1723
DOI: 10.4062/biomolther.2025.159
Resource: (ATCC Cat# CRL-2172, RRID:CVCL_1723)
Curator: @evieth
SciCrunch record: RRID:CVCL_1723
RRID: CVCL_0393
DOI: 10.3389/fphar.2026.1811032
Resource: (ATCC Cat# CRL-2611, RRID:CVCL_0393)
Curator: @evieth
SciCrunch record: RRID:CVCL_0393
RRID: SCR_025982
DOI: 10.3389/fphar.2026.1778355
Resource: Elabscience (RRID:SCR_025982)
Curator: @evieth
SciCrunch record: RRID:SCR_025982
RRID:2762833
DOI: 10.3389/fnins.2026.1806305
Resource: (Thermo Fisher Scientific Cat# A32790, RRID:AB_2762833)
Curator: @evieth
SciCrunch record: RRID:AB_2762833
ODC-TBI DOI: https://doi.org/10.34945/F5D60C
DOI: 10.3389/fneur.2025.1719618
Resource: Open Data Commons for Traumatic Brain Injury (RRID:SCR_021736)
Curator: @bandrow
SciCrunch record: RRID:SCR_021736
BL55151
DOI: 10.3389/fncel.2026.1810118
Resource: RRID:BDSC_55151
Curator: @maulamb
SciCrunch record: RRID:BDSC_55151
BL31603
DOI: 10.3389/fncel.2026.1810118
Resource: RRID:BDSC_31603
Curator: @maulamb
SciCrunch record: RRID:BDSC_31603
CRL-1658
DOI: 10.3389/fncel.2026.1787397
Resource: (RCB Cat# RCB2767, RRID:CVCL_0594)
Curator: @evieth
SciCrunch record: RRID:CVCL_0594
5905
DOI: 10.3389/fimmu.2026.1804605
Resource: RRID:BDSC_5905
Curator: @maulamb
SciCrunch record: RRID:BDSC_5905
Jackson laboratory 000664
DOI: 10.3389/fcell.2026.1793255
Resource: RRID:IMSR_JAX:000664
Curator: @evieth
SciCrunch record: RRID:IMSR_JAX:000664
Jackson laboratory 000654
DOI: 10.3389/fcell.2026.1793255
Resource: (IMSR Cat# JAX_000654,RRID:IMSR_JAX:000654)
Curator: @evieth
SciCrunch record: RRID:IMSR_JAX:000654
RRID:BDSC_28137
DOI: 10.1371/journal.ppat.1014180
Resource: RRID:BDSC_28137
Curator: @evieth
SciCrunch record: RRID:BDSC_28137
RRID:BDSC_83728
DOI: 10.1371/journal.ppat.1014180
Resource: RRID:BDSC_83728
Curator: @evieth
SciCrunch record: RRID:BDSC_83728
RRID:BDSC_28123
DOI: 10.1371/journal.ppat.1014180
Resource: RRID:BDSC_28123
Curator: @evieth
SciCrunch record: RRID:BDSC_28123
RRID:BDSC_28176
DOI: 10.1371/journal.ppat.1014180
Resource: RRID:BDSC_28176
Curator: @evieth
SciCrunch record: RRID:BDSC_28176
RRID:BDSC_25180
DOI: 10.1371/journal.ppat.1014180
Resource: RRID:BDSC_25180
Curator: @evieth
SciCrunch record: RRID:BDSC_25180
RRID:BDSC_28124
DOI: 10.1371/journal.ppat.1014180
Resource: RRID:BDSC_28124
Curator: @evieth
SciCrunch record: RRID:BDSC_28124
RRID:BDSC_28152
DOI: 10.1371/journal.ppat.1014180
Resource: RRID:BDSC_28152
Curator: @evieth
SciCrunch record: RRID:BDSC_28152
RRID:BDSC_55017
DOI: 10.1371/journal.ppat.1014180
Resource: RRID:BDSC_55017
Curator: @evieth
SciCrunch record: RRID:BDSC_55017
RRID:SCR_016673
DOI: 10.1371/journal.pone.0265254
Resource: Open Data Commons for Spinal Cord Injury (RRID:SCR_016673)
Curator: @bandrow
SciCrunch record: RRID: SCR_016673
Bloomington Drosophila Stock Center for their services
DOI: 10.1242/jcs.264327
Resource: Bloomington Drosophila Stock Center (RRID:SCR_006457)
Curator: @maulamb
SciCrunch record: RRID:SCR_006457
BL#5431
DOI: 10.1242/dmm.052139
Resource: RRID:BDSC_5431
Curator: @maulamb
SciCrunch record: RRID:BDSC_5431
RRID:AB_2534104
DOI: 10.1242/dev.205196
Resource: (Thermo Fisher Scientific Cat# A-11057, RRID:AB_2534104)
Curator: @evieth
SciCrunch record: RRID:AB_2534104
RRID:AB_162542
DOI: 10.1242/dev.205196
Resource: (Molecular Probes Cat# A-31571, RRID:AB_162542)
Curator: @evieth
SciCrunch record: RRID:AB_162542
RRID:AB_2536183
DOI: 10.1242/dev.205196
Resource: (Thermo Fisher Scientific Cat# A-31573, RRID:AB_2536183)
Curator: @evieth
SciCrunch record: RRID:AB_2536183
RRID:AB_10678258
DOI: 10.1210/jendso/bvag093
Resource: (Abcam Cat# ab96600, RRID:AB_10678258)
Curator: @evieth
SciCrunch record: RRID:AB_10678258
RRID:AB_10953628
DOI: 10.1210/jendso/bvag093
Resource: (LI-COR Biosciences Cat# 926-68072, RRID:AB_10953628)
Curator: @evieth
SciCrunch record: RRID:AB_10953628
RRID:AB_2242334
DOI: 10.1210/jendso/bvag093
Resource: (Cell Signaling Technology Cat# 3700, RRID:AB_2242334)
Curator: @evieth
SciCrunch record: RRID:AB_2242334
AB_390911
DOI: 10.1186/s13195-026-02032-5
Resource: (Roche Cat# 11667203001, RRID:AB_390911)
Curator: @evieth
SciCrunch record: RRID:AB_390911
AB_3722687
DOI: 10.1186/s13195-026-02032-5
Resource: RRID:AB_3722687
Curator: @evieth
SciCrunch record: RRID:AB_3722687
AB_305808
DOI: 10.1186/s13195-026-02032-5
Resource: (Abcam Cat# ab7260, RRID:AB_305808)
Curator: @evieth
SciCrunch record: RRID:AB_305808
AB_3712775
DOI: 10.1186/s13195-026-02032-5
Resource: RRID:AB_3712775
Curator: @evieth
SciCrunch record: RRID:AB_3712775
AB_11140860
DOI: 10.1186/s13195-026-02032-5
Resource: RRID:AB_11140860
Curator: @evieth
SciCrunch record: RRID:AB_11140860
RRID: CVCL_1511
DOI: 10.1186/s13046-026-03674-x
Resource: (RRID:CVCL_1511)
Curator: @evieth
SciCrunch record: RRID:CVCL_1511
RRID: AB_955447
DOI: 10.1186/s12967-026-07905-9
Resource: (Abcam Cat# ab6721, RRID:AB_955447)
Curator: @evieth
SciCrunch record: RRID:AB_955447
RRID: CVCL_1056
DOI: 10.1186/s12935-026-04277-4
Resource: (RRID:CVCL_1056)
Curator: @evieth
SciCrunch record: RRID:CVCL_1056
odc-tbi.org
DOI: 10.1177/2689288X251377032
Resource: Open Data Commons for Traumatic Brain Injury (RRID:SCR_021736)
Curator: @bandrow
SciCrunch record: RRID:SCR_021736
ODC-SCI:1479. https://doi.org/10.34945/F5D022
DOI: 10.1177/08977151261433823
Resource: Open Data Commons for Spinal Cord Injury (RRID:SCR_016673)
Curator: @bandrow
SciCrunch record: RRID:SCR_016673
https://doi.org/10.34945/F5002B.
DOI: 10.1177/08977151251413263
Resource: Open Data Commons for Traumatic Brain Injury (RRID:SCR_021736)
Curator: @bandrow
SciCrunch record: RRID:SCR_021736
https://odc-tbi.org
DOI: 10.1161/STROKEAHA.125.052056
Resource: Open Data Commons for Traumatic Brain Injury (RRID:SCR_021736)
Curator: @bandrow
SciCrunch record: RRID:SCR_021736
https://odc-sci.org/
DOI: 10.1161/STROKEAHA.125.052056
Resource: Open Data Commons for Spinal Cord Injury (RRID:SCR_016673)
Curator: @bandrow
SciCrunch record: RRID:SCR_016673
RRID:SCR_006442
DOI: 10.1158/1078-0432.CCR-23-3341
Resource: Bioconductor (RRID:SCR_006442)
Curator: @evieth
SciCrunch record: RRID:SCR_006442
RRID: CVCL_0428
DOI: 10.1155/humu/5510306
Resource: (ECACC Cat# 85062806, RRID:CVCL_0428)
Curator: @evieth
SciCrunch record: RRID:CVCL_0428
CVCL-0125
DOI: 10.1136/jitc-2026-014799
Resource: (ATCC Cat# CRL-2539, RRID:CVCL_0125)
Curator: @evieth
SciCrunch record: RRID:CVCL_0125
CVCL-1940
DOI: 10.1136/jitc-2026-014799
Resource: (ATCC Cat# TIB-208, RRID:CVCL_1940)
Curator: @evieth
SciCrunch record: RRID:CVCL_1940
TIB-208
DOI: 10.1136/jitc-2026-014799
Resource: (ATCC Cat# TIB-208, RRID:CVCL_1940)
Curator: @evieth
SciCrunch record: RRID:CVCL_1940
CRL-2755
DOI: 10.1136/jitc-2026-014799
Resource: (ATCC Cat# CRL-2755, RRID:CVCL_1923)
Curator: @evieth
SciCrunch record: RRID:CVCL_1923
CVCL-0179
DOI: 10.1136/jitc-2026-014799
Resource: (RRID:CVCL_0179)
Curator: @evieth
SciCrunch record: RRID:CVCL_0179
HTB-20
DOI: 10.1136/jitc-2026-014799
Resource: (RRID:CVCL_0179)
Curator: @evieth
SciCrunch record: RRID:CVCL_0179
CRL-2539
DOI: 10.1136/jitc-2026-014799
Resource: (ATCC Cat# CRL-2539, RRID:CVCL_0125)
Curator: @evieth
SciCrunch record: RRID:CVCL_0125
RRID: AB_10597265
DOI: 10.1126/sciadv.aea6842
Resource: (MBL International Cat# D271-4, RRID:AB_10597265)
Curator: @evieth
SciCrunch record: RRID:AB_10597265
62124
DOI: 10.1101/2025.01.06.631439
Resource: RRID:BDSC_62124
Curator: @maulamb
SciCrunch record: RRID:BDSC_62124
32197
DOI: 10.1101/2025.01.06.631439
Resource: RRID:BDSC_32197
Curator: @maulamb
SciCrunch record: RRID:BDSC_32197
54982
DOI: 10.1101/2025.01.06.631439
Resource: RRID:BDSC_54982
Curator: @maulamb
SciCrunch record: RRID:BDSC_54982
32198
DOI: 10.1101/2025.01.06.631439
Resource: RRID:BDSC_32198
Curator: @maulamb
SciCrunch record: RRID:BDSC_32198
64349
DOI: 10.1101/2025.01.06.631439
Resource: RRID:BDSC_64349
Curator: @maulamb
SciCrunch record: RRID:BDSC_64349
1112
DOI: 10.1093/genetics/iyag076
Resource: RRID:BDSC_1112
Curator: @maulamb
SciCrunch record: RRID:BDSC_1112
5
DOI: 10.1093/genetics/iyag076
Resource: RRID:BDSC_5
Curator: @maulamb
SciCrunch record: RRID:BDSC_5