uggested checks
and more -- they will have an intellectual role too. And some people could be on both team.
Replicators could also produce a sort of live/hosted multiverse and/or dashboard page.
uggested checks
and more -- they will have an intellectual role too. And some people could be on both team.
Replicators could also produce a sort of live/hosted multiverse and/or dashboard page.
With I4R (informally since 2022): exploring a first small test. Lenka says more next.
can we say this publicly?
A journal c
"Like a journal club". or "~A journal club"
Not
this is too close to the previous text -- add a bit of vertl space
So: a first pass and checklist, not a substitute. We also audit ourselves.
Too strong. It may substitute for at least some of the work. This ties into a much broader series of questions about the capabilities and roles of humans vs AI tool sin research and in society more generally
Critiques: the LLM caught ~80% of agreed issues, plus noise.
update this -- this was too lenient a judge!
management
make this fit on one line
workflow
"Prioritize for impact potential"
Add some small 'feed ins' (pop into image) on AI's role ... (1) on curating and suggesting research, (2) On identifying potential issues with paper, (3) on checking evaluators' reports ('did they miss something in the paper'?)
Our
'evaluation package' not just an evaluation
interval
could this image have hovers for each paper? Maybe add another image from ratings dashboard, e.g., comparing 2 papers by the multidimensional rating?
we should also mention the 'journal tier' rating somewhere
Read it →
slides with images from it?
triage
add the 'rapid version' we're currently using esp for AI econcs research as an alternate path. First step involves the public prioritization page (with AI and human input) https://uj-prioritization-prototype.netlify.app/ . Two Management team members 'strong yes' and 1 week of comment period --> move forward (see our notes on this) ... you don't need to explain in detail though, tooltip details
Example: Water Treatment and Child Mortality, a meta-analysis
make it clear that the tooltips below refer to this paper
The
they also make suggestions for specific things to evaluate and focus on (esp for impact and usefulness), and share some key issues/flags identified by AI fronteir models and agent based systems
eta-analysis
Slides should show content from the evaluation
Example: Water Treatment and Child Mortality, a meta-analysis
hyperlink this.
The manager recruits two paid evaluators: systematic-review and po
tooltip font is too small here
two
usually 2, sometimes more or less
Other open review The Unjournal Who reviews Volunteers, commenters, or journal referees whose reports are published Commissioned, paid experts, matched to each paper Which papers Whatever is submitted or draws attention Prioritised for decision-relevance What you get Prose reports Reports + structured ratings with uncertainty + claim assessment Tied to a journal? Usually part of one journal’s process No: any public paper; authors can still publish anywhere Who it’s for Mainly authors and editors Authors, and research users
use the space better
Open the evaluator form →
opening it is good, but also probably have a follon slide with the other categories, including hte overall and journal tier ones) and some dagta on the actual ratings from the 55+ papers (maybe draw from our data dashboard for htis)
pull out
identify not 'pull out'
robustness
tooltip with a full explanation of this criterion (from the guidelines)
What an evaluator fills in:
this "what an evaluator fills in' is typical AI style. Try to use my writing style more.
Funded by grants:
just say 'Grant funded' (tooltip can give the names)
A credible, citable signal that isn’t tied to any journal’s accept/reject.
Have text on this page come out in chunks. And try to improve the text format (too busy)
No accept/reject. No fees. Reports, ratings and author responses are open and citable.
can you have these chunks/paragraphs come out sequentially on the page?
sent
sent sequentially
things: curation, dissemination, community, a trusted signal. But we already share our work ourselves (working papers, preprints, OSF, SSRN), and the journal decision still governs careers and credibility. The valuable part is the expert judgement, and most of it ends up as a private yes/no that nobody else sees. The cost: papers sent to 3–4 journals in turn, years of delay, and effort spent on placement rather than on making the
too much text. Bullet points/fragments + tooltips and speakers notes are better. (Do this a bit more throughout_)
document
make that gif /moving image a bit larger
1 · Why look beyond journals?
--> Why not "just use journal peer review"?
2026
why is slide 2 blank?
alternating activity
CPGs
link
Issues:
Webinar is "Grow Your Wealth Bootcamp - Encore - November 2026).Webinar link ishttps://webinars.noellerandall.com/a/96WtQKI
eLife Assessment
This important study investigates, from Drosophila to mammals, the role of the Forkhead box O (FoxO) transcription factors in airway epithelial cells' response to stressors including hypoxia, temperature variations, and oxidative stress. The findings are solid and suggest a conserved role of FoxO in maintaining airway homeostasis across species. However, limitations in the specificity and concerns with the loss-of-function experiments, and the correlative nature of some of the results limits their significance. Nonetheless, this study highlights the potential relevance of FoxO in respiratory diseases like asthma and offers insights into potential therapeutic targets for conditions affecting airway health.
Joint Public Review:
This work investigates the evolutionary conservation and functional significance of FoxO transcription factors in the response of airway epithelia to diverse stressors, ranging from hypoxia to temperature fluctuations and oxidative stress. Utilizing a comprehensive approach encompassing Drosophila, murine models, and human samples, the study investigates FoxO's role across species. The authors demonstrate that hypoxia triggers a dFOXO-dependent immune response in Drosophila airways, with subsequent nuclear localization of dFOXO in response to various stressors. Transcriptomic analysis reveals differential regulation of crucial gene categories in respiratory tissues, highlighting FoxO's involvement in metabolic pathways, DNA replication, and stress resistance mechanisms.
The study underscores FoxO's importance in maintaining homeostasis by revealing reduced stress resistance in dFOXO Drosophila mutants, shedding light on its protective role against stressors. In mammalian airway cells, FoxO exhibits nuclear translocation in response to hypoxia, accompanied by upregulation of cytokines with antimicrobial activities. Intriguingly, mouse models of asthma show FoxO downregulation, which is also observed in sputum samples from human asthma patients, implicating FoxO dysregulation in respiratory pathologies.
Overall, the manuscript suggests that FoxO signaling plays a critical role in preserving airway epithelial cell homeostasis under stress conditions, with implications for understanding and potentially treating respiratory diseases like asthma. By providing compelling evidence of FoxO's involvement across species and its correlation with disease states, the study underscores the importance of further exploration into FoxO-mediated mechanisms in respiratory health.
The authors have thoroughly addressed the primary concerns raised by the reviewers, substantially improving the manuscript.
Strengths
(1) This study shows that FoxO transcription factors in Drosophila, mouse, and human airway epithelial cells undergo nuclear translocation in response to stressors including hypoxia, temperature, and oxidative stress. FoxO factors were shown to mediate immune and stress responses to hypoxia and stress in Drosophila airway tissue. Strikingly, reduced FoxO expression was observed in mouse models of asthma and in airway samples from asthma patients. The findings support a model in which FoxO coordinates adaptive epithelial stress responses that maintain airway homeostasis under environmental challenges. Understanding the intricate regulation of FoxO transcription factors provides insights into modulating immune and inflammatory pathways and offers potential avenues for therapeutic interventions against respiratory diseases and other illnesses.
(2) The work employs diverse model systems, including Drosophila, murine models, and human samples, thereby establishing a conserved role for FoxOs in airway epithelium and aiding translational relevance to human health.
(3) The manuscript establishes a strong correlation between FoxO expression levels and respiratory diseases such as asthma. Through analyses of both murine models of asthma and asthmatic human samples, the study demonstrates a consistent reduction in FoxO expression, indicating its potential involvement in the pathogenesis of respiratory disorders. This correlation underscores the clinical relevance of FoxO dysregulation and opens avenues for developing treatments for respiratory conditions like asthma, COPD, and pulmonary fibrosis, addressing significant unmet clinical needs.
(4) The study unveils intriguing mechanistic details regarding FoxO regulation and function. Particularly noteworthy is the observation of distinct regulatory mechanisms governing dFOXO translocation in response to different stressors. The independence of hypoxia-induced dFOXO translocation from JNK signaling adds complexity to our understanding of FoxO-mediated stress responses. Such mechanistic insights deepen our understanding of FoxO biology and pave the way for future investigations into the intricacies of FoxO signaling pathways in airway epithelial cells.
Weaknesses
(1)There is conceptual ambiguity between transcript expression and the regulation of FOXO factors through posttranslational modifications, distinct from expression levels.
(2) The mammalian experiments remain primarily descriptive and do not establish a functional requirement for FOXO in epithelial stress resistance or a causal contribution to asthma. The authors now acknowledge these limitations more clearly, although some Discussion statements still refer to FOXO activity when transcript levels were measured. Further information on validation of the new trachea-specific dfoxo manipulation would strengthen the functional evidence. Some inconsistencies in the immunostaining Methods and Figure 6 labels and legend also require clarification.
Author response:
The following is the authors’ response to the original reviews.
Joint Public Review:
(1) Distinction between FoxO expression and activation
The Public Review noted that the original manuscript did not consistently distinguish FoxO expression levels from activation status.
We agree. We revised the terminology throughout the manuscript to distinguish changes in FoxO abundance from stress-induced nuclear translocation or accumulation. Where the experiments assess subcellular localization, we now describe the result specifically as nuclear translocation or nuclear accumulation rather than inferring increased FoxO expression or transcriptional activity. Broader references to FoxO regulation or signaling are retained only in integrative contexts and do not imply that localization alone establishes transcriptional activation.
(2) Rationale for the selection of stressors
The Public Review requested a clearer rationale for using different environmental stressors across the experimental systems.
We clarified that the stressors were selected to represent major classes of challenges encountered by airway epithelia, including altered oxygen availability, temperature stress, oxidative stress, and chronic airborne exposure. The aim was not to establish identical responses to every stressor in every model, but to test whether FoxO nuclear redistribution represents a recurring epithelial response to diverse environmental challenges. This rationale is now stated more clearly in the revised manuscript.
(3) Use of the term "FoxO signaling"
The Public Review noted that the manuscript frequently referred to "FOXO signaling" although direct signaling readouts were not measured in all experiments.
We agree and have revised the terminology accordingly. In experiments based on imaging, we now refer specifically to FoxO nuclear translocation or nuclear accumulation. We avoid using localization alone as evidence for a complete signaling cascade and have moderated mechanistic language throughout the Results and Discussion.
(4) Reliance on immunostaining and nuclear localization
The Public Review emphasized that nuclear localization provides evidence of stress-responsive FOXO redistribution but, by itself, does not define the underlying regulatory mechanism.
We agree with this limitation and now state it explicitly. The localization experiments are interpreted as evidence of stress-responsive FoxO redistribution, whereas mechanistic conclusions are based primarily on the Drosophila genetic and functional experiments. We also expanded the Limitations section to distinguish localization-based observations from direct functional evidence and to identify biochemical analyses of FoxO regulation as an important direction for future work.
(5) Lack of airway-specific dFoxo loss-of-function experiments
The Public Review identified the use of constitutive dfoxo mutants as a major limitation because these experiments could not distinguish airway epithelial from systemic FoxO functions.
We addressed this point experimentally by generating trachea-specific CRISPR/Cas9 dfoxo loss-of-function animals. Selective disruption of dFoxo in the airway epithelium increased susceptibility to chronic cigarette-smoke exposure, providing direct tissue-specific genetic evidence that airway epithelial dFoxo contributes to adaptation to chronic airborne stress. These data complement the phenotypes observed in constitutive mutants and demonstrate that the cigarette-smoke phenotype cannot be explained solely by systemic FoxO deficiency.
(6) Correlative nature of the mammalian experiments
The Public Review correctly noted that the murine and human data are primarily correlative and do not establish a causal role for FOXO dysregulation in respiratory disease.
We fully agree and have revised the manuscript accordingly. The mammalian experiments are now presented as comparative evidence showing stress-associated FoxO regulation and reduced FOXO abundance in asthma-related samples, without implying that altered FoxO causes asthma or other respiratory disease. Disease-related statements have been moderated throughout, and mammalian loss- and gain-of-function studies are explicitly identified as necessary future experiments.
(7) Uncertain conservation of downstream FOXO-dependent programs
The Public Review questioned whether the downstream FOXO-dependent pathways identified in Drosophila are conserved in mammalian airway epithelia, because comparable mammalian transcriptomic and functional analyses were not performed.
We agree and have substantially revised the comparative framework of the manuscript. Our conclusions are now restricted to the observation that stress-responsive FoxO activation is conserved across the respiratory systems examined. We do not claim conservation of specific downstream transcriptional networks. The Drosophila RNA-seq data are interpreted as defining FoxO-associated adaptive programs within the fly airway, whereas determining the extent to which these programs are conserved, modified, or replaced in mammalian airway epithelia remains an important question for future investigation.
Summary of changes made in response to the Public Review
Collectively, the revisions prompted by the Public Review include: (i) more precise distinction between FOXO abundance, nuclear translocation, and broader signaling; (ii) clarification of the rationale for the environmental stress paradigms; (iii) moderation of mechanistic claims based on localization data; (iv) new trachea-specific CRISPR/Cas9 loss-of-function experiments; (v) explicit separation of mechanistic Drosophila evidence from comparative mammalian observations; (vi) moderation of disease-related causal language; and (vii) a revised evolutionary framework that distinguishes conserved stress-responsive FOXO activation from the unresolved conservation of downstream regulatory programs.
Recommendations for the authors:
General Comments
(1) The manuscript does not demonstrate that specific FoxO-regulated gene networks are conserved between Drosophila and mammalian airway cells; it remains unclear whether the authors intend to claim conservation of downstream FoxO-dependent pathways or only a general conserved role for FoxO in airway stress responses.
We thank the reviewer for raising this important conceptual point, which prompted a fundamental revision of how we frame the cross-species comparison (see Major Revision 2). We agree that the original manuscript did not clarify which of these two claims we intended to make, and that the underlying analysis does not establish conservation of specific downstream FoxO-regulated networks between Drosophila and mammals. The revised manuscript now explicitly limits its claim to the more modest and better-supported conclusion: that stress-responsive FoxO activation itself is evolutionarily conserved across the airway epithelia examined. We no longer imply that the same downstream gene networks are engaged in flies and mammals. Comprehensive transcriptomic analysis was performed only in the genetically tractable Drosophila airway, and we now state explicitly that whether comparable regulatory programs operate in mammalian airway epithelia is an open question for future investigation, rather than a claim supported by the present data.
(2) The functional experiments using constitutive dfoxo mutants do not establish a trachea-specific role for FoxO. Tissue-specific genetic manipulation is required to demonstrate epithelial-autonomous function.
We fully agree that this was the main mechanistic limitation of the original manuscript. To address this, we conducted the requested experiments rather than relying solely on discussion.
As detailed in Major Revision 1, we generated trachea-specific CRISPR/Cas9 dfoxo loss-of-function animals to selectively disrupt FoxO in the airway epithelium while preserving its function elsewhere. These experiments show that epithelial FoxO is directly required for adaptation to chronic airborne stress and confirm that the stress-sensitive phenotypes are not secondary to systemic FoxO deficiency. The new data now serve as the mechanistic foundation of the revised manuscript and are integrated throughout the Abstract, Results, Discussion, and conceptual model.
Specific recommendations
(1) Repeat the experiments in Figures 1 and 4 (ideally also Figure 3) using trachea-specific FoxO knockdown.
We thank the reviewer for this valuable suggestion, which we considered essential to strengthen the manuscript. In response, we generated trachea-specific CRISPR/Cas9-mediated dfoxo loss-of-function animals. These experiments show that selective loss of FoxO in the airway epithelium reproduces the increased susceptibility to chronic airborne stress observed in constitutive mutants. The revised manuscript now relies primarily on these tissue-specific experiments to support the conclusion that FoxO acts within the airway epithelium. Constitutive mutants are included to illustrate physiological effects at the whole-organism level, but are no longer the main mechanistic evidence.
(2) Revise the Abstract because the original wording incorrectly implied trachea-specific FoxO deficiency.
We appreciate this observation and agree that the original wording was inaccurate. The Abstract has been revised to reflect the experimental evidence in the updated manuscript. The new trachea-specific CRISPR/Cas9 experiments now provide direct tissue-specific genetic evidence for an epithelial requirement for FoxO, allowing us to clearly distinguish between the original constitutive mutant analyses and the new tissue-specific loss-of-function data. The revised wording accurately represents the experimental design and avoids overstating the original findings.
(3) The comparison between Drosophila and mammalian airway biology remains circumstantial, and the downstream pathways have not been demonstrated to be conserved.
We appreciate this important conceptual point and have substantially revised the manuscript in response. As detailed in Major Revision 2, we no longer assert conservation of downstream FOXO-dependent transcriptional programs. The revised manuscript now explicitly distinguishes between conserved epithelial FOXO activation and the currently unresolved conservation of downstream regulatory networks. Mechanistic conclusions are limited to the Drosophila model, while the murine and human studies offer comparative evidence for conserved epithelial stress responsiveness. We believe this revised framework more accurately represents both the strengths and limitations of the available data.
(4) The Introduction should better define the knowledge gap and explain how this work advances the field.
We thank the reviewer for this suggestion. The Introduction has been substantially revised to more clearly define the unresolved biological question addressed by this study. Specifically, we now distinguish between the well-established systemic roles of FoxO factors in stress adaptation and the largely unexplored function of FoxO within airway epithelial cells as an interface between the organism and the external environment. We further clarify that the principal advance of this study is not the identification of FoxO as a general stress regulator, but rather the demonstration that airway epithelial FoxO coordinates adaptive responses to chronic environmental stress and that this response exhibits conserved features across evolutionarily distant respiratory systems.
(5) Can the authors perform genetic rescue experiments?
We agree that rescue experiments would provide an additional layer of validation. However, during revision, we prioritized generating trachea-specific CRISPR/Cas9 loss-of-function animals, as these experiments directly addressed the principal mechanistic concern raised by both the reviewers and the editorial assessment. The resulting tissue-specific genetic evidence establishes the epithelial-autonomous requirement for FoxO and therefore provides more direct mechanistic support than would additional rescue experiments using constitutive mutants alone. We now discuss this point explicitly in the revised Discussion and acknowledge that complementary rescue experiments remain valuable for future work.
(6) Did the authors examine the InR/AKT axis?
We appreciate this suggestion. We fully agree that FoxO activity is regulated by multiple upstream signaling pathways, including the conserved InR/AKT pathway. However, the primary objective of this study was to investigate how airway epithelial FoxO integrates diverse environmental stressors, rather than to comprehensively dissect all upstream regulatory mechanisms. Accordingly, we have expanded the Discussion to explicitly acknowledge the established role of InR/AKT signaling in FoxO regulation and to discuss how this pathway may interact with the stress-dependent mechanisms investigated here. We also identify this as an important direction for future mechanistic studies.
(7) The gene numbers do not match the Venn diagrams.
We thank the reviewer for carefully identifying this inconsistency. The transcriptomic analyses and figure annotations were thoroughly re-examined, and the reported gene numbers have been corrected where necessary. The revised figures, corresponding legends, and Results section are now fully consistent.
(8) It is not clear why glutathione metabolism is emphasized.
We appreciate this request for clarification. The Results and Discussion have been revised to better explain the rationale for highlighting glutathione metabolism. Rather than emphasizing individual genes, the revised manuscript now interprets glutathione metabolism as one component of a broader adaptive oxidative stress program coordinated by FoxO. This interpretation is presented within the context of multiple enriched biological processes, rather than as an isolated pathway, providing a more balanced and biologically coherent interpretation of the transcriptomic data.
(9) The transcriptomic conclusions remain unclear.
We agree that the interpretation of the RNA-seq analyses required greater clarity. Accordingly, we substantially reorganized this section of the manuscript, as described in Major Revision 2. Rather than focusing on individual differentially expressed genes, the revised manuscript now emphasizes coordinated adaptive biological processes and clearly distinguishes transcriptional associations from direct mechanistic regulation. This revised presentation more accurately reflects the information that can be inferred from the transcriptomic analyses and strengthens the overall biological interpretation.
(10) The authors showed FOXO nuclear localization and increased expression of cytokines in A549 cells. What was the conclusion?
Thank you for highlighting the need for a clearer conclusion. Our experiments aimed to show that human airway epithelial cells respond to hypoxic stress with FoxO activation and a related transcriptional response, not to establish a direct mechanistic link between FoxO nuclear translocation and cytokine induction. We have revised the Results and Discussion to clearly distinguish these observations from causal inference and now only suggest direct regulation by FoxO where supported by evidence.
(11) The manuscript repeatedly refers to "FoxO signaling", although only nuclear localization was examined.
Thank you for raising this important point. We have revised the manuscript to clearly distinguish FoxO activation, nuclear translocation, and signaling. Where appropriate, we now refer specifically to nuclear accumulation or translocation, while broader references to FoxO signaling are retained only in integrative contexts. These changes improve precision and ensure terminology aligns with the data.
(12) Is there an explanation why only three antimicrobial peptides were induced?
Thank you for this observation. We have expanded the Discussion to clarify that multiple signaling pathways regulate antimicrobial peptides, resulting in stimulus-specific expression profiles. Thus, induction of only a subset of peptides is consistent with the selective hypoxic stress response in the airway epithelium. We now discuss this alongside the complexity of innate immune regulation in Drosophila and provide additional references for context.
(13) The localization of FOXO would be more convincing with nuclear markers. Did the authors examine total FOXO expression?
Thank you for this suggestion. We have revised the manuscript to better describe the experimental procedures for assessing FoxO localization and to clarify the limitations of the imaging approach. We also expanded the Discussion to note that complementary analyses, such as biochemical assessment of FoxO protein levels and phosphorylation status, would provide further mechanistic insight. The revised manuscript now presents nuclear localization as evidence of stress-responsive FoxO redistribution without overinterpretation.
(14) Please clarify the difference between btl-Gal4 and ppk-Gal4 and explain why btl-Gal4 was used.
Thank you for requesting this clarification. The revised Methods and Results now explain the expression patterns and rationale for selecting each GAL4 driver. We have also added references describing these transgenic lines and clarified their suitability for our experiments.
(15) Please clarify the qPCR data shown in Figure 3H/I and the apparent discrepancy in glutathione pathway regulation.
We appreciate this request for clarification. The figure legends, Results, and Discussion have been revised to explain better the rationale for the selected genes and their relationship to the transcriptomic analyses. In addition, we now explicitly discuss that enrichment analyses summarize pathway-level behavior and therefore may include genes that are regulated in opposite directions within the same biological pathway. This clarification improves the interpretation of the glutathione metabolism results and avoids the impression of an internal inconsistency.
(16) Did the different stressors increase FoxO expression in addition to reducing stress resistance?
We thank the reviewer for this important question. Our study was designed primarily to investigate stress-induced changes in FoxO localization and function rather than transcriptional regulation of dfoxo itself. We have therefore clarified throughout the manuscript that the experiments examine activation of pre-existing FoxO protein through stress-dependent nuclear translocation of pre-existing FoxO protein rather than de novo protein synthesis. This distinction is now consistently maintained throughout the revised Results and Discussion.
(17) Western blots for FoxO and phospho-FoxO strengthen Figure 5?
We concur that biochemical analyses of total and phosphorylated FOXO would offer valuable complementary data. However, the primary objective of the current experiments was to investigate stress-dependent changes in subcellular localization. Instead of incorporating additional correlative analyses, we prioritized the tissue-specific genetic experiments requested during peer review. We now explicitly state in the Discussion that future studies integrating biochemical and functional approaches will further elucidate the mechanisms regulating FOXO activation in airway epithelial cells.
(18) A Western blot for FoxO and phospho-FoxO would strengthen Figure 6.
We appreciate this suggestion and agree that these analyses would provide additional mechanistic insight. As noted above, the primary focus of this study is to establish conserved stress-responsive FoxO activation across species, rather than to comprehensively characterize all upstream regulatory events. Accordingly, we have expanded the Discussion to acknowledge this limitation and to identify biochemical characterization of FoxO activation as a key direction for future research.
(19) Please revise the statement describing FOXO3A as the only human longevity gene.
We thank the reviewer for highlighting this imprecise wording. The statement has been revised throughout the manuscript to accurately describe FOXO3 as one of the most consistently replicated human longevity-associated genes, thereby offering a more balanced representation of the current literature.
(20) Ensure consistent FOXO nomenclature.
We appreciate this careful observation. We conducted a comprehensive editorial review and standardized FoxO nomenclature throughout the text, figures, legends, and supplementary materials to ensure consistency with current conventions.
(21) The conclusion regarding hypoxia-induced dFOXO translation is inaccurate because the data demonstrate nuclear translocation of pre-existing protein.
We thank the reviewer for identifying this imprecise wording. We fully agree that our data demonstrate stress-induced nuclear translocation of pre-existing dFoxo protein, rather than de novo protein synthesis. The relevant statements have been corrected throughout the manuscript to consistently refer to nuclear translocation or nuclear accumulation, thereby avoiding any implication of translational regulation.
(22) Please clarify why the selected antimicrobial peptides (AMPs) were analyzed and provide supporting references.
We appreciate this suggestion. The Results and Discussion sections have been expanded to clarify that these antimicrobial peptides were selected because they are well-characterized components of the Drosophila epithelial innate immune response and have been shown to respond to environmental stress and infection. Appropriate references have been added to provide the biological rationale for their inclusion.
(23) Please explain the purpose of the LDH-A enhancer and drosomycin reporters.
We thank the reviewer for this suggestion. Additional information has been incorporated into both the Results and Methods sections to explain the biological rationale for these reporter constructs. We now explicitly describe the pathways monitored by each reporter and clarify their selection for assessing hypoxic and immune-related responses in the airway epithelium.
(24) Replace the term "nuclear translation".
We thank the reviewer for identifying this typographical error. The manuscript has been corrected throughout to refer to nuclear translocation instead of nuclear translation.
(25) Please provide images for all human FOXO isoforms.
We appreciate this suggestion. Representative images for the analyzed FOXO isoforms have been added to the supplementary material, and corresponding references have been included in the main text and figure legends to facilitate interpretation of the localization analyses.
(26) The nuclear localization of hFOXO6 is surprising. Please address antibody specificity.
We thank the reviewer for raising this important point. The Methods and Discussion sections have been expanded to clarify the validation and limitations of the antibody used in these experiments. Additionally, we now explicitly acknowledge that FOXO6 differs from other FOXO family members in its regulation and discuss this observation with greater caution, avoiding mechanistic conclusions beyond the available evidence.
(27) Clarify whether only adult flies respond to hypoxia.
Thank you for requesting clarification. We have revised the relevant section to specify the developmental stage analyzed in each experiment and to avoid suggesting untested developmental differences.
(28) Clarify the wording "Nuclear what dFoxO21/21".
We thank the reviewer for identifying this typographical error. The text has been corrected accordingly.
(29) The conclusion regarding differences between upper and lower airway cells may be overstated.
We agree that our original wording overstated the evidence. We have revised the Results and Discussion to describe these observations more cautiously. The text now states that the experiments demonstrate differential responses in the two airway epithelial cell models examined, without implying broader biological differences.
(30) Reduced FOXO levels in asthma lack mechanistic explanation.
Thank you for this important comment. As discussed in Major Revision 2, we have moderated our interpretation of the asthma data. The revised manuscript presents reduced FOXO expression as a biologically meaningful association, not a causal mechanism. We have also expanded the Discussion to outline potential biological explanations and clearly distinguish hypotheses from experimental evidence.
(31) FOXO1 has been reported to be regulated by FOXO3.
We thank the reviewer for drawing our attention to this interesting aspect of FOXO biology. We have incorporated this point into the Discussion and cite the relevant literature. At the same time, we refrain from drawing mechanistic conclusions because the regulatory relationship was not directly examined in the present study.
(32) The conclusions drawn from Figure 8 may exceed the data.
We agree and have revised the Results and Discussion accordingly. Statements about Figure 8 have been moderated to ensure conclusions are proportional to the evidence and clearly separated from broader hypotheses.
(33) Please provide clearer future perspectives.
We appreciate this suggestion. We have expanded the Discussion to include a detailed discussion of future research directions, highlighting the need for mechanistic analyses of FOXO-dependent regulatory networks, cell-type-specific genetic studies, and comparative investigations of evolutionary conservation.
(34) Please cite additional relevant literature.
We thank the reviewer for these helpful recommendations. The suggested publications have been carefully evaluated and incorporated where appropriate to provide a more comprehensive overview of FoxO biology, airway homeostasis, stress responses, and aging. These additional references strengthen the discussion and better position our findings within the current literature.
Minor Comment
(1) The Discussion is too long and speculative.
We agree. The Discussion has been reorganized, streamlined, and revised. We removed speculative sections and focused on the main mechanistic findings to improve clarity and readability.
(2) The conclusion that the trachea is the organ most affected by hypoxia is an overinterpretation.
Thank you for this observation. We agree that our original wording was too strong. The manuscript now states that the tracheal epithelium is the most sensitive tissue for hypoxia reporter activation under our experimental conditions, which more accurately reflects the data.
(3) Line 165 uses "translation" where "nuclear translocation" was intended.
We thank the reviewer for identifying this wording error. We have corrected the text to specify nuclear translocation, consistent with the mechanism described throughout the manuscript.
(4) The description of the nuclear/cytoplasmic ratio quantification (lines 512-514) is inadequate and may reflect manual, user-biased scoring rather than a rigorous, high-throughput approach.
We agree that the original description lacked sufficient methodological detail. We have expanded the Methods to specify that nuclear regions were identified using DAPI staining as an independent marker, rather than being inferred from the FoxO channel itself, and that approximately 200 nuclei were analyzed per sample. We agree that automated segmentation approaches (e.g., StarDist) would further reduce potential observer bias and increase throughput, and we note this as a direction for future refinement of the quantification pipeline.
(5) The Figure 5 legend states that panel F used "the same type of analysis as in D," but panels D and F show different types of data; it is also unclear what each data point in panel D represents.
We thank the reviewer for pointing out this inconsistency. The figure legend has been revised: the cross-reference in panel F now correctly points to panel E, which shows the comparable cytokine time-course experiment, rather than panel D. We also clarify that each dot in panel D represents the mean value obtained from one biological replicate.
(6) Figure 1 lacks a non-UAS larva control for autofluorescence, and normoxic controls are missing from several panels.
We have no extra-control for autofluorescence and believe that they are not really helpful.
(7) In Figure 6G and H, it is unclear what each data point represents (the same issue raised for Figure 5D).
As for Figure 5D, we have clarified in the figure legend that each data point represents the mean value from a single biological replicate, and we specify the number of replicates analyzed per condition.
(8) Information about the LDH-GAL4 strain, including its expression pattern, should be provided.
We thank the reviewer for this request. We have added a description of the LDH-GAL4 strain to the Methods, including its source and expression pattern.
(9) The statement that dFoxO-GFP remains nuclear for more than an hour after cessation of hypoxia is not supported by data shown in the figures.
We agree that this statement requires direct supporting data or should be qualified as a preliminary observation. We have therefore deleted this sentence.
(10) Line 236 refers to Figure 5D but should refer to Figure 5C.
We thank the reviewer for catching this typographical error. The figure reference has been corrected.
(11) The wording "FoxO system" (line 321) should be revised for clarity.
We agree that this wording should be clarified. We will revise "the FoxO system" in the Discussion to more precisely describe the FoxO signaling pathway in the next revision of the manuscript.
(12) In Figure panel 3F, the label obscures the underlying data.
We thank the reviewer for pointing this out. We have repositioned the label in panel 3F so that it no longer overlaps with the data.
The Map represents the Site. Deliberately neutral: yard, barn, or stable mean different things per country or only the stable building.
testcomment
Wspólny panel i umowa: tak czy nie
wszystko jest we wspolnym panelu
Zdjęcie Echo na biurku, fragment rozmowy Halo, zrzut WIEM
cos jest na drive, a czy masz jak zorganizowac sesje?
Placówki i opinie z nazwiskiem dla każdego produktu
czekam na podpis na umowie marketingowej od jednej placowki na halo, drugi gosc moze robic dzisiaj,
na echo bez problemu znajdziemy
WIEM a EU MDR: jakich słów możemy użyć (z prawnikiem)
pytane
Kontakt: rozmowa czy czat Tidio?
na tidio mielismy 1 interakcje. mimo wszystko najlepiej call, potem mail
Dla kogo: placówki medyczne czy szerzej?
no i właśnie - na ten moment med ale i mocno wet. nie mamy przypadkow zeby ktos chcial poza med ale jakby prawnik przyszedl i powiedzial ze chce to przerobimy. to proste u nas
byl jeszcze broker salonow beauty, chcieli do transkrypcji
Status każdego produktu (dostępne / pilot)
3 aktualnie dostepne :)
Pisownia: WIEM czy Wiem?
nie upieram sie, byleby spojnie
Ease
suche
Jeden panel, jedna umowa, Twoje programy
Integracje: to jest troche problematyczne o tyle, ze np. po ostanim wlamie znanylekarz kazal nam usunac dekalracje integracji z nimi.
Oficjalne wspieramy raptem proassist, z felg integrujemy sie np tak ze klient musi kupic dostep do api i przez to wchodzimy.
Telefony z pytaniem o konkretny system traktujemyy jak krytyczna wskazowke na czym sie skupic, teraz npo mamy otwarte ttematy z mmedica (med) i klinika xp (wet)
Nazwa rejestratorki: Halo?
nie upieram sie - ale klienci lapia to szybko
„Halo” nic nie mówi.
to chyba kluczowe
Intercom
To jest chyba dobry trop, myslimy o problemie, a rozwiazanie prezentujemy jako "oczywisty wybor"
Amigo
Jako etapy fajnie, ale to chyba az za suche
28 wzorców z Mobbin
Po przejrzeniu przykladow wydaje mi sie ze wzorzec to: listuj wszystkie pokrotce, jedno zdanie opisujace, a po kliku detale.
Ciekawostka - jak potem z produktu odsylac z powrotem na strone glowna (delikatnie)
Proton
To w sumie jest spoko - prosto z mostu, co jest co
commentary
is engagement even if it does not amount to participation
not the same thing.
covenant could be annotated
I anted to have more opportinities for dialogue thatan is afforded by using hypothesis annotation, but it is a good start.
I'll share the current proposal for the conenant using the same set up as I used here
very different proposition
from simply building a better comment interface.
indeed
connections can proliferate without obliging everybody to follow them
yes
controlled
make it participant controlled
named dialogue commnities can be formed with their own covenant
in any context individual could enter the conversations ad memebers of named interest groups
That wouldraie the bar of engagement
and
remember contributions take time and attention so it is self limiting
but if we have a mechanism that allow each participant to moderate their own view of any field of conversations
(mutually) than could indeed be self-regulating
open universe of commentary
If the universe of commentary itself is partitioned along multiple dimensions like
time periods at appropriate granularity topic
and qualified by itself being connected to the author and pertinent named interests
and neighbourhoods of each comment is associated with a hypermap of focal interests
Then opennes can be self-regulating/moderating
premature limitation
no options should be blocked
call it omnioptionaility
with strong guarantees for interplayeability
without depending
solely
that dependency may bring convenience and easy and low latency
but it is by construction fragmented and constitute isolated silos
the number of interactions exceeds our capacity to attend to them
That is already the case.
Need to make the interactions we do engage deeper, and readily resumeable and recapitulable,
serchebale
self-organized for scaling synthesis
discoverability
discoverabiity, scaling reach,
is where the old and the new paradigm can complete each other!
Instead of compeeting
another version of YouTube
Youtube, lke the Web itself is Server Centric, Centralized
The paradigm shift towards decentralization is a decent move in the right direction but not enough.
What is needed is to put human beings at the center
let them weave their own networks for themseles, their own benefit
covenant
may make this increasingly possible
Yes to all of that but also
Infrastructure constellations that are People Centered
connect the meanings
That is the most fundamental question
It is not just technology but
Human Language Artifacts and Methodologies
embodied in emergent tools
That is what we are really after
connect our conversations
Network of People and Networks of conversations
all meaningfully interconnected
Hyper Mapped Territories that do resolve to the terriotry as attentions shoifts
collective that continues to think
the dialogue wants to be continuous without needing to be synchronous
and contiguous with all the participants own(ed) Externalization of their Minds
even their disagreements remained present within the Dialogue
in deed
the technology may no longer be the greatest challenge
It still requires to make the impossible inevitable
but agree with the statement
creation of a living commons
very nicely put
architecture of interdependence
I think about it in terms of
virtual Personal first, Open, commons basedVirtual software as a Service infrastructure constellations delivered as an App for personal use and interpersonal colaboration
that is owned and controlled by participants
for the participants
the network effect benefits Autonomous participants not the providers
for
Mutual Learning
Symmathesy
indy.peergos.me/📓/2026/11/indyLab/Dialogue2.0/2026/11/4/summary.html
indy.peergos.me/📓/2026/11/indyLab/Dialogue2.0/2026/11/4/summary.html
de la technologie
corriger : des technologies...
he collective public-solving activity and enactment of key social issues engaged participants in the process of “social dreaming” (Gutiérrez, 2008, p. 157) in which a new form of learning could support a collective imaginary of a more just and hopeful world and a newly imagined educational and sociopolitical future
I have a complicated relationship with Theatre of the Oppressed because- where does theater education end and therapeutic work begins. I understand the authors' argument that embodied explorations of social problems can create opportunities for consequential learning, particularly when connected to historical and academic analysis. But what about the ethical responsibilities of the facilitator when participants are drawing on potentially traumatic personal experiences. If we're designing for equity, shouldn't we also consider how emotional safety, consent, and the facilitator's training factor into that design? I don't necessarily see this as a criticism of the approach, but it is a tension I wrestle with, especially as many people have one session in this technique and then take it out into the world to use it.
That all being said- its interesting to frame as a method of learning rather then "theatre" as a subject being taught. We dont do that enough over in theatre school...
Check3
Ajouter le ®
iSucare
Ajouter le ®
iSucare
Ajouter le ®
iSucare
-A supprimer ces boites il n’existe pas. - Ajouter le ®
Lancets
Lancettes
iSucare
Ajouter le ®
Ajouter le ®
Note: This response was posted by the corresponding author to Review Commons. The content has not been altered except for formatting.
Learn more at Review Commons
This section is optional. Insert here any general statements you wish to make about the goal of the study or about the reviews.
We thank all three reviewers for the detailed and constructive comments and suggestions on our study.
All three reviewers have noted that the findings are of interest to not only the lipid signalling community but also more broadly to cell biologists as well as those interested in cellular mechanisms of disease including cancer biology. Thank you for noting that our work done using robust the robust in vivo fly model, in particular the presence of a single PIP4K and a single Class II PI3K in Drosophila make mechanistic dissection likely.
We thank the reviewers for noting the novelty of our study:
Insert here a point-by-point reply that explains what revisions, additional experimentations and analyses are planned to address the points raised by the referees.
Reviewer #1
Evidence, reproducibility and clarity
Summary: The study by Venugopal et al reports that loss of PIP4K function triggers an increase in endomembrane PI(3,4)P2 in Drosophila salivary gland cells. The authors use a transgenically expressed optical reporter to provide evidence that the rise in PI(3,4)P2 does not depend on the catalytic activity of PIP4K, but is promoted by a regulatory function PIP4K exerts on the class II PI3K family member Pi3K68d. In summary, the study claims 1) that loss of PIP4K function can be rescued by re-expression of PIP4K (WT), but also of a catalytically inactive variant. 2) that this pool of PI(3,4)P2 is most likely not synthesized by class I PI3-kinases. 3) that the rise in intracellular PI(3,4)P2 upon loss of PIP4K activity is abrogated upon concomitant depletion of Pi3K68d, the single class II PI3K orthologue expressed in Drosophila. The molecular mechanisms underlying Pi3K68d activation in absence of PIP4K function remain largely elusive. The authors note a rise in intracellular PI(4)P, which is poorly explained and seems to occur at the expense of plasmalemmal PI(4)P. They suggest that this endomembrane PI(4)P pool is converted to PI(3,4)P2 (by Pi3K68d) and to PI(4,5)P2 (by a PIP5K). PI(4,5)P2 is known to activate PI3KC2 in mammalian cells, and the study provides evidence that similar mechanisms might apply in Drosophila. To date cell biological functions of PIP4Ks remain enigmatic, and there is consensus in the field that they influence phosphoinositide homeostasis through both catalytic and non-catalytic mechanisms. Therefore, the major findings of the study will be of interest to the community of researchers interested in lipid signaling and to cell biologists in general.
I have a number of major issues with this study that are outlined below.
According to Jacob Cohen's standard benchmarks (0.2 is small, 0.5 is medium, and 0.8 is large for effect size), a value of 1.4 as calculated from one of our data is quite substantial. It means the average score of one group is 1.4 standard deviations away from the average score of the other group, which amounts to a considerably huge effect size.
However, we acknowledge that the puncta may not have been clearly visible in the images provided and may have made the intracellular cPHx3 puncta appear less apparent than they are. Taking this point into consideration, we will now revise all the relevant images to zoomed-in views with insets, which allow the punctate signal to be clearly appreciated Thus, while we acknowledge the reviewer’s concern regarding the visual representation and will improve the presentation accordingly, we believe that the robust and reproducible phenotype observed across experiments along with the effect size calculations shown above supports the robustness of the probe-based approach.
Also, we would like to respectfully clarify that “the notable exception of Fig. 4C” is a representation issue. In Figure 4C, the upper panels show Class II PI3K overexpression [4C(b)] and the lower panel shows cPHx3 levels in the corresponding cells [4C(d)] which is pretty much comparable to dPIP4K depleted cells [for instance Fig. 4A (b)]. However, we do acknowledge that the representation might be confusing as pointed out by Reviewer 3 as well. We will change the depiction in the manuscript to avoid confusion.
In salivary gland cells, which are the focus of this study, the TAPP1-3xcPH reporter strongly accumulates in the nucleus, shows no localization to the plasma membrane, and is found on endomembranes only upon genetic or chemical perturbation of the system. Hence, fluorescence images require some adaptation to really visualize the stated effects. More importantly, the localization to the nucleus precludes strong statements regarding localization. I suggest that key aspects of this work be repeated using transgenic lines expressing TAPP1-3xcPH reporters carrying a nuclear export signal.
Response____: We confirm that the cPHx3 probe and its non-binding R211LcPHx3 non-binding variant used in this study incorporates a nuclear export signal as described in Hammond et al (PMID: 30591513).
A nuclear localization is often seen for GFP or mCherry tagged probes [e.g. Figure 4C (a)] for various biomolecules and GFP or mCherry expressed by themselves often accumulate in the nucleus. This is thought to be due to the presence of cationic peptides in these proteins. For example, we and others have also seen this phenomenon with the PH-GRP:: GFP probe used to detect PIP3 by many labs. The nuclear localization often occurs when the ligand that it is to detect is absent or in very low abundance. In that case, once cells are stimulated with insulin, PIP3 levels rise and the probe relocates to the plasma membrane detecting the PIP3 being produced at this location.
We would particularly highlight to the reviewer that the use of cPHx3 probe to detect PI(3,4)P2 is always with comparison to the lipid non-binding variant R2111LcPHx3. Both the probes (binding and non-binding variant) partly localize to the nucleus and therefore the signal from this compartment is not considered as reporting PI(3,4)P2 levels.
Much of this work relates to descriptive experiments on the phenotype with respect to PI(3,4)P2 (and related lipids) elicited by genetic manipulations of PIP4K or Pi3K68d without providing a mechanistic framework as to how the two proteins cooperate in the lipid signaling network. It is entirely unclear how the authors imagine catalytically inactive PIP4K to affect PI(4,5)P2 levels and, thereby, PI(3,4)P2 synthesis. Does this involve the recently discovered crosstalk between PIP4K and PI4P5Ks described by Gerry Hammond's lab (PMID: 42485385)?
Response: Loss of PIP4K has been reported to elevate PI(4,5)P2 levels shown by both our lab (PMID: 31091438) and the Cantley lab (PMID: 31091439) and subsequently by the Hammond lab (PMID: 37534432). This would be a reasonable explanation of how loss of dPIP4K elevates PI(4,5)P2 levels. The mechanism by which this elevated PI(4,5)P2 levels contribute to increased PI(3,4)P2 is the subject of this investigation. Experiments to understand this better have been proposed by us in response to reviewer comments.
It would be of great interest to gain further insight into the identity of the organelles that stain positive for cPHx3. Do they represent endosomes, lysosomes or autophagosomes? Do these objects colocalize with mCherry::PI3K68D (Fig. 4C)? Do they colocalize with mCherry::P4M, or with PH-PLCd::mCherry, a pre-requisite if the authors working model held true?
Response : We thank the reviewer for raising this important point regarding the identity of the cPHx3-positive endo-membranous structures. We agree that determining the subcellular localization of the cPHx3 signal is important. To address this, we will perform colocalization analysis using established organelle and phosphoinositide markers and include this in the revised manuscript.
Compartment / Feature
Marker
· Early endosomes
· Rab5/EEA1
· Late endosomes
· Rab7
· Golgi
· GM130
· Lysosomes
· LTS::mCherry, Cathepsin
· Peroxisomes
· Pmp70 antibody
· PI(4)P-containing membranes
· mCherry-P4M
· PI(4,5)P₂-containing membranes
· PH-PLCd-mCherry
· PI3K68D-positive membranes
· mCherry::PI3K68D
The data shown in Suppl. Fig 4E, F do not make sense to me. According to the legend Fig4E a and c represent cPHx3 WT expressing cells, whereas b and d correspond to the lipid binding-defective mutant. However, the staining patterns between a and c as well as b and d differ quite strikingly, while a looks similar to b and c similar to d. The images also do not reflect the quantifications. I suspect a mix up of labels or else a very heterogenous pattern in different cells that makes interpretations difficult. The authors need to clarify.
Response: We apologize for the confusion caused by the way the images were presented in Supplementary Fig. 4E, F. There is no mix-up of labels, nor does the difference in staining pattern reflect heterogeneous phenotypes between cells.
Specifically for supplementary figure 4E, panel A represents the lipid____-____binding cPHx3 reporter____, __whereas __panel C represents mCherry::Class II PI3K overexpression in the same set of cells____. __Likewise, _panel B_ shows the lipid-binding-defective reporter__ R211L-cPHx3, whereas panel D shows Class II PI3K enzyme overexpression for the corresponding cells____. The similarity in the staining patterns between panels B and D is therefore expected, as both panels correspond to conditions involving mCherry::Class II PI3K overexpression____.
To address this concern, we will restructure Supplementary Fig. 4E, F, with clearer organization and labelling of the respective genotypes.
The authors propose a model according to which PI(4)P and subsequent PI(4,5)P2 synthesis on endomembranes activates Pi3K68d to produce PI(3,4)P2. However, they fail to provide an explanation how PIP4K could regulate PI(4)P and PI(4,5)P2 levels in first place. Previous observations published by other labs might contribute to the discussion on this topic (PMIDs 37534432, 42485385).
Response: Loss of PIP4K has been reported to elevate PI(4,5)P2 levels shown by both our lab (PMID: 31091438) and the Cantley lab (PMID: 31091439) and subsequently by the Hammond lab (PMID: 37534432). This would be a reasonable explanation of how loss of dPIP4K elevates PI(4,5)P2 levels. This has been discussed in the current version but will be elaborated and PMID:42485385 will be added to the reference list.
Minor points:
The study largely relies on the quantification of "PI(3,4)P2 punctae per area". What is the unit of "area"? How would this translate into number of objects per cell?
Response: __We thank the reviewer for asking us this important aspect of quantification used throughout the study. We agree that expressing PI(3,4)P₂ puncta on a per-cell basis can be more intuitive. However, in the Drosophila_ salivary gland_, cells are inherently heterogeneous in size, and this variability is further amplified across the different genetic backgrounds analyzed, including dPIP4K null mutants__. To account for this and enable meaningful comparisons across genotypes, puncta were normalized to cell area rather than expressed per cell. In the case of Drosophila S2R+ cell experiments, since the cell size is uniform, the puncta is indeed quantified as puncta per cell.
The authors introduce PIP4K as a potential PI(3)P-to-PI(3,4)P2-converter. Do PI(3)P levels change upon loss of PIP4K function?
Response: Yes. Direct evidence for elevated PI3P levels in dPIP4K29 cells has been previously obtained. In our published LSA study (PMID: 37316298), whole-larval lipid mass spectrometry measurements demonstrated a significant increase in total PI3P levels in dPIP4K29 animals (as seen here in A). The levels of PI3P could be rescued by reconstituting a transgene for full length/wild-type PIP4K (as seen here in B) but not for kinase dead PIP4K (as seen here in C), suggesting the dependence on kinase activity. This is the reason why we introduce PIP4K as a potential PI(3)P-to-PI(3,4)P2-converter.
Why are plasmalemmal and intracellular PI(4,5)P2 levels determined in different ways? (Compare for instance Figs.5A/B and S5C/D with Fig. 5E/F)? The authors need to explain.
Response: We thank the reviewer for asking us this important question.
The different representations reflect the specific experimental context.
In Fig 5A/B and FigS5C/D what is being counted is the number of puncta with a PI(4,5)P2 probe signal. In Fig. 5E/F, OCRL downregulation resulted in an increase in PI(4,5)P₂ at the plasma membrane, accompanied by an increase in the cytosolic signal. In this case, the cytosolic signal was not used as a normalization factor as it was proportionately increasing.
We agree that this distinction was not adequately explained in the original submitted version of the manuscript. We will clarify this point in the revised manuscript and provide a detailed explanation of the rationale behind the different approaches used for quantification of the plasmalemmal and intracellular PI(4,5)P₂ pools in the methods section.
Significance
The study posits a novel regulatory loop between the still rather enigmatic PIP4K and the class II PI3K-mediated synthesis of the rare signaling lipid PI(3,4)P2. Unraveling such a loop is of interest to the field of lipid signaling but may also impact on our understanding of diseases related to defective lipid signaling and the development of therapeutic strategies to treat rare genetic and common disorders ranging from diabetes to cancer. The apparently small effect sizes and the lack of mechanistic depth provided in this largely descriptive study limit its impact with respect to a general audience and the conceptual advance.
Response: We thank the reviewer for recognizing a novel regulatory loop between the enigmatic lipid kinase PIP4K and the class II PI3K-mediated synthesis of the rare signaling lipid PI(3,4)P2 and the importance of unravelling such a loop in our understanding of diseases and the development of therapeutic strategies.
We respectfully disagree with the assessment that the effect sizes observed in our study are small. The changes in PI(3,4)P₂ detected upon manipulation of dPIP4K are robust and reproducible across independent experiments. Given the relatively low abundance of PI(3,4)P₂ in cells, even a modest change in this lipid can correspond to a huge relative increase in its levels. We have provided quantitative effect-size calculations as a response in comment 1 to reviewer 1 to better illustrate the magnitude of these changes.
We agree, however, with the reviewer that the mechanistic depth of the study can be further strengthened____. In particular, monitor the levels of PI4P and identify the endo-membranous compartment on which PI(3,4)P₂ synthesis by class II PI3K is mediated in this context. We will incorporate these findings into the revised manuscript and expand the discussion of the mechanistic model accordingly.
Reviewer #2 (Evidence, reproducibility and clarity (Required)):
Summary Venugopal and colleagues develop eGFP::cPHx3, a high avidity biosensor for PI(3,4)P₂ based on the tandem PH domain of TAPP1, and use it in Drosophila S2R+ cells and larval salivary gland cells to reveal an endomembranous pool of PI(3,4)P₂, in addition to the previously described plasma membrane pool. Loss of dPIP4K, genetic (dPIP4K²⁹) or by RNAi, strongly increases this endomembranous PI(3,4)P₂, a phenotype rescued by wild type dPIP4K and, unexpectedly, by a catalytically dead version (D271A) as well, arguing for a kinase independent mechanism. Pharmacological inhibition with wortmannin at selective doses and genetic manipulation of Pi3K68D, the sole Drosophila Class II PI3K, implicate Class II PI3K rather than Class I PI3K as the source of this PI(3,4)P₂. The authors propose a model in which dPIP4K loss elevates endomembrane PI(4,5)P₂ and this, in turn, increases PI4P availability for Pi3K68D, although a direct causal link between these steps is not demonstrated.
The probe validation experiments and the epistasis approach excluding Class I PI3K and implicating Class II PI3K are convincing and are supported by converging pharmacological and genetic evidence. The main weakness of the study is that the mechanistic model linking dPIP4K loss to PI(4,5)P₂, PI4P, and Class II PI3K dependent PI(3,4)P₂ production remains correlative, and, as detailed below, some reported phenotypes are difficult to reconcile with the model the authors themselves propose. The methods and fly genetics are described in sufficient detail to be reproducible. The comments below are ordered from essential to optional; estimated time investments are provided for substantial experiments.
Response: We thank the reviewer for the positive assessment of the probe validation experiments and suggestions to strengthen the study.
The central observation in this study is that in dPIP4K loss of function mutants the levels of PI(3,4)P2 are elevated and this elevation does not depend on the catalytic activity of dPIP4K. This rules out PI3P to PI(3,4)P2 conversion by the 4 kinase catalytic activity of PIP4K as the reason for the elevated PI(3,4)P2 levels.
So what then in the source of the elevated endomembrane PI(3,4)P2 ? As the reviewer rightly points out, our converging pharmacological and genetic evidence strongly suggests that the PI(3,4)P2 is likely formed by the action of Class II PI3K rather than plasma membrane Class I PI3K followed by a 5-phosphatase activity. This in turn raises the question of what is the source of PI4P as substrate for Class II PI3K. An obvious source of the PI4P is the dephosphorylation of PI(4,5)P2. This could happen on the endomembrane puncta or the dephosphorylation could happen at the plasma membrane followed by endocytosis.
We agree that the situation could be resolved in the following ways:
We have found (data already in paper) that endomembrane PI4P and PI(4,5)P2 are elevated. Does this arise from the elevated PI(4,5)P2 at the PM in dPIP4K mutants that is endocytosed ?
We will attempt two experiments to address this:
In response to this and the related comments from the other reviewers, we will perform a colocalization screen using appropriate compartment-specific markers to identify the localization of PI(3,4)P₂-positive puncta in dPIP4K-deficient salivary glands. Based on these findings, we will extend the relevant colocalization analyses to PI4P and PI(4,5)P₂ to determine whether their accumulation is also associated with the same specific endomembrane compartments. We will also thoroughly investigate the levels of PI4P in dPIP4K null and OCRL depleted background.
Response: We wish to highlight that Fig 5E,H shows the level of plasma membrane PI(4,5)P2 and not PI4P. However, we agree that directly assessing PI4P levels in the dOCRL RNAi background is necessary to better understand the relationship between PI4P levels and the observed increase in PI(3,4)P₂. We will measure PI4P levels in the dOCRL RNAi background using the previously validated mCherry::P4M probe.
The causal chain from PI4P to Class II PI3K to PI(3,4)P₂ remains correlative, and the kinase independent effect of dPIP4K is established only through the D271A rescue of the PI(3,4)P₂ phenotype. Two experiments would substantiate the model and are considered essential to support the central claims: (i) an epistasis experiment lowering PI4P availability in the dPIP4K²⁹ background, for example by RNAi against a PI4 kinase, to test whether this suppresses the PI(3,4)P₂ phenotype (estimated time: 2-3 months, including new crosses); and (ii) extending the wild type and D271A rescue already performed for PI(3,4)P₂ to the PI4P and PI(4,5)P₂ phenotypes directly, since this is where the model places the primary site of dPIP4K action (estimated time: 1-2 months, using fly stocks that largely already exist in the lab). Expressing a PI4K RNAi in the dPIP4KRNAi background. Double balance dPIP4KRNAi.
Response: We thank the reviewer for this suggestion. We agree that further experiments are needed to strengthen the proposed relationship between PI4P levels and PI(3,4)P₂ accumulation following dPIP4K loss.
We agree that an epistasis experiment to reduce PI4P levels in PIP4K mutants and testing the effect on endomembrane PI(3,4)P2 is important, To this end, we will express PI4K RNAi in the dPIP4K depleted background and assess the resulting PI(3,4)P₂ levels.
We will first extend our existing rescue experiments using wild-type dPIP4K and the catalytically inactive D271A mutant to examine their effects on PI4P and PI(4,5)P₂ levels. This will help determine whether the regulation of PI4P and PI(4,5)P₂ pools is independent of dPIP4K catalytic activity, as suggested by our findings for PI(3,4)P₂.
The manuscript reports two sample sizes throughout, N (biological replicates, glands or larvae) and n (cells), but statistical tests (Mann-Whitney, Kruskal-Wallis, Welch t-test) appear to be performed treating each cell (n) as an independent observation. Because multiple cells are sampled from the same gland, this is a nested or hierarchical data structure, and treating cells as fully independent can underestimate the true variance and inflate the effective sample size. The authors should clarify how non-independence between cells from the same gland was accounted for, and, where raw data allow, consider a reanalysis using gland level averages or a mixed effects model with gland as a random effect (estimated time: 1-2 weeks, as this is a reanalysis of existing data rather than a new experiment).
Response: We thank the reviewer for drawing our attention to this important statistical consideration. This point was raised by reviewer 3 as well. We agree that individual cells sampled from the same gland are not independent biological observations and that treating them as such may underestimate the variance.
We will therefore reanalyse the data using gland-level averages as the unit of analysis, rather than treating individual cells as independent observations. We will revise the statistical tests and sample size reporting throughout the manuscript.
OPTIONAL: all phosphoinositide measurements in this study rely on probe based, semi-quantitative readouts (puncta counts, membrane to cytoplasm intensity ratios) obtained with different probes in separate experiments, which cannot establish whether the proposed changes in PI4P, PI(4,5)P₂, and PI(3,4)P₂ are quantitatively compatible with one another. An orthogonal, probe independent quantification in the key genotypes, for example using a competitive ELISA for PI(3,4)P₂, PI4P, and PI(4,5)P₂ on pooled dissected salivary glands, would substantially strengthen the quantitative basis of the model, though it is not strictly required to support the qualitative claims currently made (estimated time: 2-3 months, including assay optimization for this tissue). Relatedly, the plasma membrane to cytoplasm intensity ratio used throughout the study conflates membrane associated signal and free cytosolic probe; reporting absolute intensities for each compartment separately, at least for the key comparisons, would clarify which compartment drives the reported changes and requires no new experiments.
Response: We thank the reviewer for this constructive suggestion. We agree that an independent biochemical approach would strengthen the quantitative basis of our conclusions. In response to this comment and the related concern raised by Reviewer 3, we will extend our analysis of PI(3,4)P₂ using an independent biochemical assay in S2R+ cells. We will standardize and perform a quantitative measurement of PI(3,4)P₂ using a commercially available mass ELISA kit (Echelon K-3800) to obtain an additional assessment of PI(3,4)P₂ levels.
We will also perform a compartment-specific analysis of the existing imaging data, reporting signal intensities separately for the plasma membrane and cytoplasm in the key genotypes. This analysis will clarify the contribution of each compartment to the observed changes. Having mentioned that, we also believe that intensity unlike number is a relative term. Therefore, reporting a ratio of plasma membrane to cytoplasm is important as it accounts for probe expression differences and the depth of the cell. As questioned by reviewer 1, in Fig. 5E/F, OCRL downregulation resulted in an increase in PI(4,5)P₂ at the plasma membrane, accompanied by an increase in the cytosolic signal. In this sole case, the cytosolic signal was not used as a normalization factor as it was proportionately increasing.
Lines 152-153: starvation is stated not to alter the distribution of eGFP::R211LcPHx3, but the representative images (Fig. 1A, c and d) appear to show redistribution toward the nucleus. Please revise or clarify.
Response: Thank you for pointing this out____. It is a representation issue. We will modify.
Lines 253-255: Hinchliffe et al. (2002) is cited in the text but missing from the reference list.
Response: Thank you. We will add the reference.
Supplementary Fig. 5C, D: the images do not convincingly show the expected cytoplasmic redistribution associated with PI(4,5)P₂ loss after UNC3230; higher quality images or an alternative readout would better support the quantification.
Response: Thank you. We will provide higher quality images.
Fig. 5F: please specify what the x-axis "distance" represents.
Response: The x-axis denotes the length of the ROI. The word distance will be specified or replaced accordingly.
Given the low cellular abundance of PI5P relative to PI(4,5)P₂ (PMID: 30617162), briefly note in the Discussion why a mass action effect of unconverted PI5P is unlikely to explain the magnitude of the phenotype, strengthening the non-catalytic interpretation.
Response: Thank you for this valuable insight. We will incorporate an explanation for this in the manuscript.
Lines 258-259: the reported decrease in plasma membrane PI(4,5)P₂ in dPIP4K RNAi glands (Supplementary Fig. 5B) is stated without any mechanistic interpretation. Please comment on the likely origin of this decrease, and note explicitly whether it is thought to relate to the previously reported elevation of plasma membrane PIP3 in this genotype (Sharma et al., 2019) or to a distinct process.
Response: Thank you. We will provide an explanation in the discussion.
Fig. 6: the schematic is difficult to follow, in particular regarding the location of the different lipid species within the membrane. Please clarify the depiction, for example by more explicitly distinguishing the plasma membrane from the endomembrane compartment and by labelling the topology of each lipid pool shown, so that the proposed model can be readily understood at a glance.
Response: Thank you. We will revise the graphical summary of the paper.
The image analysis pipeline used for puncta quantification (ImageJ 3D object counter or manual counting) does not specify threshold or size-exclusion parameters. Please provide these settings, ideally together with a shared analysis script, to support reproducibility of the puncta counts.
Response: Thank you. We will provide these parameters in detail in the revised manuscript.
**Referees cross-commenting**
I feel that Referee #3 made a serious comment that should be taken into account. Overall, I think that more than 6 months are now the most plausible timeframe for completion.
Reviewer #2 (Significance (Required)):
General assessment
The strongest aspect of this study is the development and thorough validation of eGFP::cPHx3 as a high avidity, specific biosensor for PI(3,4)P₂ in Drosophila, together with the robust genetic toolkit (null mutant, RNAi, wild type and kinase dead rescue constructs) that allows a clean dissection of dPIP4K function in vivo. The finding that a catalytically dead dPIP4K fully rescues the PI(3,4)P₂ phenotype is a genuinely unexpected and potentially important result. The main limitation is that the proposed mechanistic model, in which dPIP4K non-catalytically restrains endomembrane PI(4,5)P₂, which then raises PI4P availability for Class II PI3K, rests on correlative, probe-based imaging data collected in separate experiments, and at least one experiment (dOCRL RNAi) appears difficult to reconcile with the model as stated. Addressing the major comments above, in particular establishing the causal role of PI4P and clarifying the compartmental redistribution of the different lipid species, would substantially strengthen the study.
Response: We thank the reviewers for their thorough assessment of our study and for recognizing its key strengths, particularly the development and validation of eGFP::cPHx3 as a high-avidity biosensor for PI(3,4)P₂ in Drosophila, and the unexpected finding that the kinase-dead dPIP4K construct rescues the PI(3,4)P₂ phenotype. We appreciate the reviewers’ constructive comments regarding the proposed mechanistic model and the need to establish a more direct causal link between PI4P levels and Class II PI3K activity. These comments have helped us identify areas where our findings can be further strengthened.
Advance This study extends the emerging concept of kinase independent, scaffold like functions of PIP4K family members, previously described for mammalian PIP4K2 isoforms in the control of PIP5K activity and insulin signaling (Wang et al., 2019), to a new lipid species, PI(3,4)P₂, and to a new in vivo model system, Drosophila salivary glands. To our knowledge, this is the first description of a genuinely endomembranous, TAPP1 probe-based PI(3,4)P₂ pool in an intact tissue, as opposed to cultured mammalian cells, where a comparable pool was not detected using the same class of probe (Goulden et al., 2019). The implication of Class II PI3K, rather than the canonical Class I PI3K route, as the source of this pool is also a conceptual advance, given that the regulation of Class II PI3K activity in vivo remains comparatively poorly understood. The overall advance is therefore primarily conceptual and functional; the mechanistic advance is more limited at present, since the pathway connecting dPIP4K to PI(4,5)P₂, PI4P, and Class II PI3K is not yet established with direct causal evidence.
Response: We thank the reviewers for recognizing the conceptual significance of our findings, particularly the identification of an endomembrane-associated PI(3,4)P₂ pool in an intact Drosophila tissue and its regulation by Class II PI3K. We are encouraged that the reviewers appreciate how our study extends the understanding of kinase-independent functions of PIP4K family members to a new phosphoinositide pool and an in vivo model system. Given that the regulation of Class II PI3K activity in vivo remains relatively poorly understood, our findings provide a potentially important functional insight into this area of phosphoinositide signalling. We acknowledge that the precise molecular mechanism linking dPIP4K to PI(3,4)P₂ production remains to be strengthened further.
Audience This work will be of primary interest to a specialized audience of basic researchers working on phosphoinositide signaling, membrane lipid biology, and Drosophila genetics. Given the established links between PI(3,4)P₂, Class II PI3K, and PIP4K family members in mammalian growth factor signaling and cancer biology, the findings are also likely to interest a broader cell signaling and cancer biology community, since they may motivate analogous studies of non-catalytic PIP4K function and endomembrane PI(3,4)P₂ pools in mammalian systems.
Field of expertise Phosphoinositide signaling; PI3K biology, including Class I and Class II PI3K; cell signaling in cancer. The Drosophila genetic tools and husbandry aspects of this study, as well as the statistical methodology, were evaluated based on general principles rather than hands on expertise in the Drosophila system.
Reviewer #3 (Evidence, reproducibility and clarity (Required)):
In the manuscript entitled "Phosphatidylinositol 5 phosphate 4 kinase regulates phosphatidylinositol 3,4 bisphosphate levels in vivo," Venugopal and colleagues report a new and unexpected role for PIP4K in the regulation of PI(3,4)P₂ and propose a pathway for the generation of an endomembrane pool of this lipid. The authors report that loss of function of dPIP4K results in an increase in intracellular puncta detected by a high-avidity PI(3,4)P₂ biosensor (eGFP::cPHx3). This result is unexpected because mammalian PIP4K can phosphorylate PI3P to generate PI(3,4)P₂ in vitro, and therefore loss of PIP4K might instead have been predicted to decrease PI(3,4)P₂. Interestingly, the authors find that the effect of PIP4K is independent of its catalytic activity. They further provide evidence implicating Class II PI3K (Pi3K68D) and propose a pathway in which increased endomembrane PI(4,5)P₂ and PI4P ultimately lead to increased Class II PI3K-dependent PI(3,4)P₂ production.
The major strengths of this work are the use of Drosophila genetics, an in vivo salivary gland model, genetic rescue experiments, and genetically encoded phosphoinositide biosensors. In particular, the observation that both wild-type and kinase-dead dPIP4K rescue the phenotype, together with suppression by Pi3K68D RNAi, is intriguing and potentially important.
Response: We thank the reviewers for understanding and valuing the major areas of strength in our study.
However, there are several major concerns regarding both the technical approach and the mechanistic interpretation. Most importantly, the manuscript currently demonstrates regulation of cPHx3-positive endomembrane structures more convincingly than it demonstrates changes in cellular PI(3,4)P₂ levels or the biochemical pathway proposed in Figure 6. Given the unexpected nature of the findings, additional validation and substantial modification of the conclusions are required.
Response: We thank the reviewers for highlighting these concerns. We will work our best to strengthen the current conclusions.
Additional independent validation of the identity of the cPHx3-positive puncta A second, independent PI(3,4)P₂ biosensor would provide important confirmation that the structures observed with cPHx3 indeed represent PI(3,4)P₂-containing membranes. Ideally, simultaneous visualization with two independent probes could establish whether they recognize the same structures. Another complementary approach would be to selectively reduce PI(3,4)P₂ through overexpression or targeted recruitment of an appropriate PI(3,4)P₂ phosphatase. Disappearance of the cPHx3-positive puncta following direct PI(3,4)P₂ depletion would provide strong evidence that these structures are indeed dependent on PI(3,4)P₂. The finding that Pi3K68D depletion reduces the puncta is encouraging, but does not by itself establish their molecular identity.
Response: We agree that in an ideal world, validation of the punctae reported by cPHx3 as reporting PI(3,4)P2 would be valuable. However, at the present time, there is no other meaningful, independent probe for PI(3,4)P2 levels. We feel that work to identify other PI(3,4)P2 binding proteins, generate and characterise an additional probe would be beyond the scope of this study.
The suggestion of using a PI(3,4)P2 phosphatase to validate the punctae is an interesting one. While there are significant technical challenges, we will consider this as an option.
The central PIP4K-loss phenotype should also be examined in S2R+ cells The initial validation of the cPHx3 probe is performed in cultured S2R+ cells, whereas the central finding that PIP4K loss increases PI(3,4)P₂-positive puncta is demonstrated primarily in salivary glands in vivo. The authors should determine whether depletion of PIP4K in S2R+ cells similarly produce cPHx3-positive puncta. Demonstrating the phenotype in cultured cells would connect the two experimental systems and would also facilitate biochemical measurements of PI(3,4)P₂ and further characterization of the structures. We will measure PI(3,4)P2 upon dPIP4K dsRNA in these cells and also try to measure PI(3,4)P2 via MASS ELSIA KIT or Chiral Chromatography.
__Response: __Thank you for this suggestion. We agree that examining the phenotype in cultured S2R+ cells would connect the two experimental systems and would also facilitate biochemical measurements of PI(3,4)P₂. We will perform experiments to deplete dPIP4K in S2R+ cells using dsRNA and examine whether this results in increased cPHx3-positive puncta, as observed in dPIP4K-depleted salivary glands. In parallel, we will measure PI(3,4)P₂ in these cells using an independent biochemical approach, such as a mass ELISA kit.
The identity of the intracellular PI(3,4)P₂-positive structures needs to be established The manuscript repeatedly refers to the puncta as an "endomembranous pool" of PI(3,4)P₂, but the identity of these structures is not adequately established. The authors state that the H₂O₂-induced puncta in S2R+ cells are positive for Rabenosyn-5, but these data are not shown. These experiments should be presented, and the authors should determine whether the cPHx3-positive structures generated following PIP4K loss in salivary glands similarly colocalize with appropriate endosomal or other organelle markers. Importantly, the authors should establish whether the structures observed following PIP4K loss, Pi3K68D overexpression and dOCRL depletion represent the same membrane compartment. This concern is reinforced by the appearance of Figure 4C. Pi3K68D overexpression appears to generate hundreds of small cPHx3-positive puncta, whereas the dPIP4K mutant cells shown throughout the paper generally contain a much smaller number (see Figure 4B as an example). Despite these striking morphological differences, the quantitative analyses suggest relatively similar numbers of puncta per unit area. The authors should explain this apparent discrepancy and provide quantitative analysis of puncta number, size and distribution. Colocalization with established compartment markers would be particularly informative. Ultrastructural approaches could provide additional support if feasible, but are not essential if the structures can be convincingly characterized using established organelle markers.
__Response: __We thank the reviewer for emphasizing the importance of identifying the endomembranous compartments associated with the cPHx3-positive puncta. As asked by reviewer 1 and 2, we will perform a colocalization screen to understand the identity of the intracellular PI(3,4)P₂-positive structures.
Compartment / Feature
Marker
· Early endosomes
Rab5/EEA1
· Late endosomes
Rab7
· Golgi
GM130,
· Lysosomes
LTS::mCherry, Cathepsin
· Peroxisomes
Pmp70 antibody
· Lysosomes
Cathepsin
· PI(4)P-containing membranes
mCherry-P4M
· PI(4,5)P₂-containing membranes
PH-PLCd-mCherry
· PI3K68D-positive membranes
mCherry:: PI3K68D
However, we respectfully disagree with the reviewer that Pi3K68D overexpression appears to generate hundreds of small cPHx3-positive puncta, whereas the dPIP4K mutant cells shown throughout the paper generally contain a much smaller number. In Figure 4C, the upper panels show Class II PI3K overexpression [4C(b)] and the lower panel shows cPHx3 levels in the corresponding cells [4C(d)] which is pretty much comparable to Figure 4A (b). Owing to these reasons, the quantitative analyses suggest relatively similar numbers of puncta per unit area. However, we do acknowledge that the representation might be confusing as pointed out by Reviewer 1 as well. We will change the depiction in the manuscript to avoid confusion.
Altered membrane trafficking provides an alternative explanation for the increased cPHx3-positive puncta A related concern is whether PIP4K deletion actually increases PI(3,4)P₂ synthesis or instead alters membrane/vesicle dynamics such that PI(3,4)P₂-containing membranes become more abundant or more readily detected. This possibility is particularly relevant given the authors' previous demonstration that dPIP4K regulates PI3P, cell size and autophagy. Thus, increased cPHx3-positive puncta could potentially arise secondary to changes in endosomal or autophagic membrane trafficking associated with altered PI3P homeostasis. This alternative explanation further emphasizes the importance of biochemical confirmation that total PI(3,4)P₂ is actually increased following PIP4K loss and of identifying the membrane compartment represented by the puncta.
Response: We thank the reviewer for raising this interesting, alternative explanation. We agree that an increase in cPHx3-positive puncta could potentially reflect changes in membrane accessibility, membrane abundance or identity, competition with endogenous lipid-binding proteins, or changes in vesicle trafficking rather than an increase in total cellular PI(3,4)P₂ alone.
To address this concern, we will perform independent biochemical measurement of PI(3,4)P₂ following dPIP4K loss. In parallel, we will perform the colocalization analyses to establish the identity of the membrane compartments associated with the cPHx3-positive puncta in dPIP4K depleted salivary gland cells. Together, these experiments will help distinguish changes in total PI(3,4)P₂ abundance from changes in the distribution of PI(3,4)P₂-containing membranes.
The proposed PI(4,5)P₂ → PI4P → PI(3,4)P₂ pathway is not established by the current data The authors report elevated endomembrane PI(4,5)P₂ and PI4P reporter signals following PIP4K depletion and use pharmacological inhibition of PIP5K and depletion of dOCRL to argue that elevated PI(4,5)P₂ contributes to PI(3,4)P₂ accumulation. These experiments support a relationship between PI(4,5)P₂ homeostasis and the appearance of cPHx3-positive structures. However, they do not establish the metabolic pathway depicted in Figure 6. In particular, the critical step connecting elevated PI(4,5)P₂ to increased PI4P is unknown. Indeed, the manuscript acknowledges that it remains unclear how PI(4,5)P₂ would be converted to PI4P in this context. This is especially difficult to reconcile with published evidence that PIP4K can negatively regulate PIP5K activity (Wills et al., 2023; DOI: 10.1242/jcs.261494). Increased PIP5K activity following loss of PIP4K could provide a plausible explanation for increased PI(4,5)P₂, but would be expected to consume rather than generate PI4P. Thus, the present experiments support the conclusion that PI(4,5)P₂ homeostasis influences Pi3K68D-dependent PI(3,4)P₂ accumulation, but they do not establish that PI(4,5)P₂ gives rise to PI4P and subsequently PI(3,4)P₂. Either additional experiments are needed to establish this pathway or the model and associated conclusions should be substantially revised.
Response: We agree that our current data support a relationship between non-catalytic function of dPIP4K and Pi3K68D-dependent PI(3,4)P₂ accumulation but do not yet establish the proposed sequential pathway connecting PI(4,5)P₂, PI4P, and PI(3,4)P₂.
We will therefore extend our analysis of PI4P levels in the relevant genetic backgrounds, including dPIP4K-deficient and dOCRL-depleted conditions, to better characterize the relationship between PI(4,5)P2, PI4P levels and PI(3,4)P₂ accumulation. This can include the following experiments:
The PIP4K rescue experiments require additional consideration The rescue of the dPIP4K phenotype by kinase-dead PIP4K is one of the most interesting observations in the manuscript and provides the principal evidence that regulation of the PI(3,4)P₂-positive structures is independent of PIP4K catalytic activity. However, judging from the immunoblots provided, expression of both the wild-type and kinase-dead rescue proteins appears substantially higher than endogenous PIP4K. Because the conclusion of catalytic independence relies heavily on these experiments, the authors should address whether rescue can be obtained at expression levels reasonably comparable to endogenous PIP4K. Very high expression of PIP4K could potentially produce non-physiological effects independent of catalytic activity, including competition with the probe for PI(3,4)P2 binding, sequestration of interacting proteins or changes in membrane organization.
Response: We thank the reviewer for pointing to this important observation. We would like to highlight that the same untagged, full-length wild-type dPIP4K and catalytically inactive D271A constructs have been used in our laboratory to investigate several phenotypes including cell size (PMID: 23530222), endosomal trafficking in photoreceptor cells (PMID: 28507272), PIP₃ levels (PMID: 31091438) and PI3P levels (PMID: 37316298).
Notably, while the effects on cell size and PI3P levels were dependent on dPIP4K catalytic activity, the effects on endosomal trafficking and PIP₃ levels were independent of its catalytic activity. The differential dependence of these phenotypes on catalytic activity suggests that the observed effects are not attributable to protein overexpression alone. We acknowledge, however, that these observations do not completely exclude the possibility that elevated expression may influence the specific PI(3,4)P₂ phenotype examined in the present study. Establishing rescue at near-endogenous expression levels would require the generation of knock in alleles that would take many months to generate with no guarantee of equivalent expression of the kinase dead protein relative to wild type.
Response: We thank the reviewer for highlighting this important statistical consideration. This point was raised by reviewer 2 as well. We will reanalyse the imaging data using gland-level averages as the unit of analysis rather than treating individual cells as independent observations.
We will revise the statistical tests, sample-size reporting, and corresponding figure annotations throughout the manuscript, as appropriate.
The biological significance of PIP4K-dependent regulation of PI(3,4)P₂ remains unclear The manuscript identifies an intriguing relationship among PIP4K, Pi3K68D and cPHx3-positive puncta but does not establish the biological consequence of this pathway. It would considerably strengthen the manuscript if the authors could determine whether suppression of the PI(3,4)P₂ phenotype-for example by Pi3K68D depletion-rescues a known cellular phenotype associated with PIP4K loss, such as altered cell size, signaling, trafficking or autophagy. This would connect the lipid phenotype to a physiological function and substantially increase the biological significance of the study.
Response: We agree that establishing the biological consequences of PIP4K-dependent regulation of PI(3,4)P₂ would significantly strengthen the biological relevance of our findings. In this regard, we have searched for literature evidences for studies showing a Class II PI3K derived PI(3,4)P2 pool and its potential significance.
A recent study reporting a role for a trans-Golgi network-derived PI(3,4)P₂ pool in regulating mitochondrial fusion (PMID:42848893) provides an interesting basis for further investigation. We will examine whether the cPHx3-positive puncta observed in dPIP4K mutants are associated with the TGN and, if supported by our localization studies, explore whether this pool could be linked to mitochondrial dynamics. This would provide a potential route to connect the lipid phenotype to a defined cellular function.
We acknowledge that establishing this connection may require further investigation beyond the scope of the current revision. Nevertheless, we will pursue feasible experiments to clarify the subcellular identity and potential functional significance of the PI(3,4)P₂ pool.
From the representative images, it is difficult to appreciate the penetrance of the cPHx3-positive puncta phenotype in dPIP4K mutant salivary glands. A plot showing the fraction of cells containing no puncta, low numbers of puncta and high numbers of puncta could help convey the distribution of the phenotype. Response: We will change the representative images.
The reference cited for the statement regarding H₂O₂-induced PI(3,4)P₂ accumulation at line 154 should be checked; the cited reference appears inappropriate for this specific statement.
Response: We will modify the cited reference.
Response: Representative images without these overlays will be provided.
. 4. Appropriate references should be provided for the specificity and use of pharmacological inhibitors, including UNC3230.
Response: We will add appropriate references for highlighting the specificity of UNC3230.
Response: The graphical summary will be revised.
Reviewer #3 (Significance (Required)):
Overall assessment The manuscript contains an interesting and unexpected observation suggesting that PIP4K negatively regulates a Pi3K68D-dependent endomembrane pool detected by a PI(3,4)P₂ biosensor through a mechanism that does not require PIP4K catalytic activity. The genetic evidence supporting this relationship is potentially significant.
However, the manuscript currently makes stronger biochemical and mechanistic conclusions than are supported by the data. In particular, the authors need to establish more convincingly that the cPHx3-positive structures indeed represent increased PI(3,4)P₂, characterize the membrane compartment in which this signal accumulates, and either provide additional evidence for the proposed PI(4,5)P₂/PI4P pathway or substantially temper this model. The statistical treatment of nested cellular measurements also requires clarification and potentially reanalysis.
Response: We thank the reviewer for recognizing the interesting and unexpected observation that dPIP4K through a mechanism independent of its catalytic activity negatively regulates a Pi3K68D-dependent endomembrane pool of PI(3,4)P2.
In response to the reviewers’ suggestions, we will undertake additional experiments to establish the identity of the cPHx3-positive structures, characterize their subcellular localization, and investigate the proposed relationship between PI(4,5)P₂, PI4P and PI(3,4)P₂ in depth. Where the available evidence does not conclusively support the proposed mechanism, we will appropriately change our conclusions. We will also reanalyse the quantitative data using gland-level averages to account for the nested structure of cellular measurements.
Not applicable
Please include a point-by-point response explaining why some of the requested data or additional analyses might not be necessary or cannot be provided within the scope of a revision. This can be due to time or resource limitations or in case of disagreement about the necessity of such additional data given the scope of the study. Please leave empty if not applicable.
As such we found the reviewer comments very helpful and made in a constructive spirit. We believe almost all of it can be addressed and we will make out best effort to address all of them, in many cases with experiments. However, bearing timelines and effort in mind we feel two suggestions will be beyond our reasonable ability to carry out:
Note: This preprint has been reviewed by subject experts for Review Commons. Content has not been altered except for formatting.
Learn more at Review Commons
In the manuscript entitled "Phosphatidylinositol 5 phosphate 4 kinase regulates phosphatidylinositol 3,4 bisphosphate levels in vivo," Venugopal and colleagues report a new and unexpected role for PIP4K in the regulation of PI(3,4)P₂ and propose a pathway for the generation of an endomembrane pool of this lipid. The authors report that loss of function of dPIP4K results in an increase in intracellular puncta detected by a high-avidity PI(3,4)P₂ biosensor (eGFP::cPHx3). This result is unexpected because mammalian PIP4K can phosphorylate PI3P to generate PI(3,4)P₂ in vitro, and therefore loss of PIP4K might instead have been predicted to decrease PI(3,4)P₂. Interestingly, the authors find that the effect of PIP4K is independent of its catalytic activity. They further provide evidence implicating Class II PI3K (Pi3K68D) and propose a pathway in which increased endomembrane PI(4,5)P₂ and PI4P ultimately lead to increased Class II PI3K-dependent PI(3,4)P₂ production.
The major strengths of this work are the use of Drosophila genetics, an in vivo salivary gland model, genetic rescue experiments, and genetically encoded phosphoinositide biosensors. In particular, the observation that both wild-type and kinase-dead dPIP4K rescue the phenotype, together with suppression by Pi3K68D RNAi, is intriguing and potentially important.
However, there are several major concerns regarding both the technical approach and the mechanistic interpretation. Most importantly, the manuscript currently demonstrates regulation of cPHx3-positive endomembrane structures more convincingly than it demonstrates changes in cellular PI(3,4)P₂ levels or the biochemical pathway proposed in Figure 6. Given the unexpected nature of the findings, additional validation and substantial modification of the conclusions are required.
Major concerns
Minor comments
Overall assessment
The manuscript contains an interesting and unexpected observation suggesting that PIP4K negatively regulates a Pi3K68D-dependent endomembrane pool detected by a PI(3,4)P₂ biosensor through a mechanism that does not require PIP4K catalytic activity. The genetic evidence supporting this relationship is potentially significant.
However, the manuscript currently makes stronger biochemical and mechanistic conclusions than are supported by the data. In particular, the authors need to establish more convincingly that the cPHx3-positive structures indeed represent increased PI(3,4)P₂, characterize the membrane compartment in which this signal accumulates, and either provide additional evidence for the proposed PI(4,5)P₂/PI4P pathway or substantially temper this model. The statistical treatment of nested cellular measurements also requires clarification and potentially reanalysis.
Note: This preprint has been reviewed by subject experts for Review Commons. Content has not been altered except for formatting.
Learn more at Review Commons
Summary
Venugopal and colleagues develop eGFP::cPHx3, a high avidity biosensor for PI(3,4)P₂ based on the tandem PH domain of TAPP1, and use it in Drosophila S2R+ cells and larval salivary gland cells to reveal an endomembranous pool of PI(3,4)P₂, in addition to the previously described plasma membrane pool. Loss of dPIP4K, genetic (dPIP4K²⁹) or by RNAi, strongly increases this endomembranous PI(3,4)P₂, a phenotype rescued by wild type dPIP4K and, unexpectedly, by a catalytically dead version (D271A) as well, arguing for a kinase independent mechanism. Pharmacological inhibition with wortmannin at selective doses and genetic manipulation of Pi3K68D, the sole Drosophila Class II PI3K, implicate Class II PI3K rather than Class I PI3K as the source of this PI(3,4)P₂. The authors propose a model in which dPIP4K loss elevates endomembrane PI(4,5)P₂ and this, in turn, increases PI4P availability for Pi3K68D, although a direct causal link between these steps is not demonstrated.
Major comments
The probe validation experiments and the epistasis approach excluding Class I PI3K and implicating Class II PI3K are convincing and are supported by converging pharmacological and genetic evidence. The main weakness of the study is that the mechanistic model linking dPIP4K loss to PI(4,5)P₂, PI4P, and Class II PI3K dependent PI(3,4)P₂ production remains correlative, and, as detailed below, some reported phenotypes are difficult to reconcile with the model the authors themselves propose. The methods and fly genetics are described in sufficient detail to be reproducible. The comments below are ordered from essential to optional; estimated time investments are provided for substantial experiments.
Minor comments
Referees cross-commenting
I feel that Referee #3 made a serious comments that should be taken into account. Overall, I think that more than 6 months are now the most plausible timeframe for completion.
General assessment
The strongest aspect of this study is the development and thorough validation of eGFP::cPHx3 as a high avidity, specific biosensor for PI(3,4)P₂ in Drosophila, together with the robust genetic toolkit (null mutant, RNAi, wild type and kinase dead rescue constructs) that allows a clean dissection of dPIP4K function in vivo. The finding that a catalytically dead dPIP4K fully rescues the PI(3,4)P₂ phenotype is a genuinely unexpected and potentially important result. The main limitation is that the proposed mechanistic model, in which dPIP4K non catalytically restrains endomembrane PI(4,5)P₂, which then raises PI4P availability for Class II PI3K, rests on correlative, probe based imaging data collected in separate experiments, and at least one experiment (dOCRL RNAi) appears difficult to reconcile with the model as stated. Addressing the major comments above, in particular establishing the causal role of PI4P and clarifying the compartmental redistribution of the different lipid species, would substantially strengthen the study.
Advance
This study extends the emerging concept of kinase independent, scaffold like functions of PIP4K family members, previously described for mammalian PIP4K2 isoforms in the control of PIP5K activity and insulin signaling (Wang et al., 2019), to a new lipid species, PI(3,4)P₂, and to a new in vivo model system, Drosophila salivary glands. To our knowledge, this is the first description of a genuinely endomembranous, TAPP1 probe based PI(3,4)P₂ pool in an intact tissue, as opposed to cultured mammalian cells, where a comparable pool was not detected using the same class of probe (Goulden et al., 2019). The implication of Class II PI3K, rather than the canonical Class I PI3K route, as the source of this pool is also a conceptual advance, given that the regulation of Class II PI3K activity in vivo remains comparatively poorly understood. The overall advance is therefore primarily conceptual and functional; the mechanistic advance is more limited at present, since the pathway connecting dPIP4K to PI(4,5)P₂, PI4P, and Class II PI3K is not yet established with direct causal evidence.
Audience
This work will be of primary interest to a specialized audience of basic researchers working on phosphoinositide signaling, membrane lipid biology, and Drosophila genetics. Given the established links between PI(3,4)P₂, Class II PI3K, and PIP4K family members in mammalian growth factor signaling and cancer biology, the findings are also likely to interest a broader cell signaling and cancer biology community, since they may motivate analogous studies of non catalytic PIP4K function and endomembrane PI(3,4)P₂ pools in mammalian systems.
Field of expertise
Phosphoinositide signaling; PI3K biology, including Class I and Class II PI3K; cell signaling in cancer. The Drosophila genetic tools and husbandry aspects of this study, as well as the statistical methodology, were evaluated based on general principles rather than hands on expertise in the Drosophila system.
Note: This preprint has been reviewed by subject experts for Review Commons. Content has not been altered except for formatting.
Learn more at Review Commons
Summary:
The study by Venugopal et al reports that loss of PIP4K function triggers an increase in endomembrane PI(3,4)P2 in Drosophila salivary gland cells. The authors use a transgenically expressed optical reporter to provide evidence that the rise in PI(3,4)P2 does not depend on the catalytic activity of PIP4K, but is promoted by a regulatory function PIP4K exerts on the class II PI3K family member Pi3K68d. In summary, the study claims 1) that loss of PIP4K function can be rescued by re-expression of PIP4K (WT), but also of a catalytically inactive variant. 2) that this pool of PI(3,4)P2 is most likely not synthesized by class I PI3-kinases. 3) that the rise in intracellular PI(3,4)P2 upon loss of PIP4K activity is abrogated upon concomitant depletion of Pi3K68d, the single class II PI3K orthologue expressed in Drosophila. The molecular mechanisms underlying Pi3K68d activation in absence of PIP4K function remain largely elusive. The authors note a rise in intracellular PI(4)P, which is poorly explained and seems to occur at the expense of plasmalemmal PI(4)P. They suggest that this endomembrane PI(4)P pool is converted to PI(3,4)P2 (by Pi3K68d) and to PI(4,5)P2 (by a PIP5K). PI(4,5)P2 is known to activate PI3KC2 in mammalian cells, and the study provides evidence that similar mechanisms might apply in Drosophila. To date cell biological functions of PIP4Ks remain enigmatic, and there is consensus in the field that they influence phosphoinositide homeostasis through both catalytic and non-catalytic mechanisms. Therefore, the major findings of the study will be of interest to the community of researchers interested in lipid signaling and to cell biologists in general. I have a number of major issues with this study that are outlined below.
Major points:
Minor points:
The study posits a novel regulatory loop between the still rather enigmatic PIP4K and the class II PI3K-mediated synthesis of the rare signaling lipid PI(3,4)P2. Unraveling such a loop is of interest to the field of lipid signaling but may also impact on our understanding of diseases related to defective lipid signaling and the development of therapeutic strategies to treat rare genetic and common disorders ranging from diabetes to cancer. The apparently small effect sizes and the lack of mechanistic depth provided in this largely descriptive study limit its impact with respect to a general audience and the conceptual advance.
Kart
changer par Karl
Check3
Ajouter le ® sur Check 3
Check
Ajouter le ® sur Check 3
Zone Industrielle El Eulma 19600, Sétif – Algérie
Précéder cet adresse par la mention: Détenteur et exploitant de la DH -Ajouter ensuite: Fabricant (Production, libération): Zone industrielle-Extension- Tranche 20, N°107 Sétif 19000 - Algérie
Check3
Ajouter le ®
Questions fréquemment posées
Les réponses aux questions fréquentes ne correspondent pas aux informations des Laboratoires Salem. Pour les questions les plus fréquemment posées, il est nécessaire de valider et de confirmer les réponses avec la Promotion Médicale.
Check3
Ajouter le ®
Les lancettes
Pour le moment les lancettes ne sont disponibles qu’en format de 25 Lancettes
eLife Assessment
This study presents valuable findings on how retrieval practice protects memory inferences from stress via covert memory reactivation. Via two EEG experiments manipulating stress and retrieval practice, the authors provide solid evidence showing that retrieval practice buffered negative impact of stress on behaviour and neural activities. This work will be of interest to cognitive and affective neuroscientists working on the intersection between memory and stress.
Reviewer #1 (Public review):
Summary:
The authors combine a two-day associative-inference task with EEG in two experiments involving 136 participants. Participants learn overlapping AB and BC pairs and subsequently infer AC relationships after a stress or control procedure. The second experiment adds retrieval practice after learning. Stress-related reductions in inference performance and bridge-category decoding in Experiment 1 are attenuated or reversed in Experiment 2.
The revision provides useful additional analyses and more explicit acknowledgment of the design's limitations. I no longer interpret Figure 4A as evidence of below-chance inference. However, several conclusions in the title, abstract, and Discussion remain stronger than the revised evidence supports.
Strengths:
The study addresses a worthwhile question by combining behavioral measures, an experimentally induced stress manipulation, and temporally resolved EEG. The independent visual localizer and decoding during the pre-choice period provide useful evidence that information related to the absent bridge category is available during inference.
Importantly, the evidence is not limited to a significant stress effect in one experiment and a nonsignificant effect in the other. The manuscript reports direct stress-by-experiment interactions for inference performance, response time, and decoding. The behavioral interaction also remains significant after adjustment for both-correct premise-triad counts. The exploratory mediation analysis, Bayesian comparison, and trial-level model improve the transparency of the evidence and deserve explicit credit.
Weaknesses:
(1) Premise memory strength and inference specific protection remain difficult to separate
The authors now acknowledge that strengthening AB/BC memories may contribute to better AC performance, and the exploratory mediation analysis supports this possibility. This is a useful clarification. However, a residual direct association after adjustment for premise memory does not establish an additional inference-specific mechanism. Premise memory was measured after inference using a coarse 2AFC test, and the mediation concerns the overall association with retrieval practice rather than specifically explaining the stress-by-practice interaction. Similarly, restricting analyses to both-correct trials or adjusting their number cannot equate underlying memory strength. The Discussion should therefore avoid treating the nonsignificant difference between the two control groups as evidence that the benefit transcends strengthened associations or specifically preserves online integration.
(2) The cross-experiment comparison supports an association with attenuation
The new interaction analyses strengthen the evidence that the stress effect differs between experiments. Nevertheless, retrieval practice was introduced in a separate follow-up cohort, so its effect remains confounded with experiment. The authors appropriately acknowledge this limitation; it should also guide the title and broader conclusions. "Associated with attenuation" is better supported than "prevents" or "restores." Likewise, the reported BF01 of 2.77 provides only weak support for no stress effect in Experiment 2 and does not establish equivalent performance. A randomized factorial study would provide a stronger causal test, but the present findings remain informative with appropriately limited claims.
(3) The neural findings support category level information with limited mechanistic specificity
The shift toward "bridge-related category information" is appropriate because the decoder distinguishes faces from buildings. It cannot identify reinstatement of the particular B item linking a given AB-BC pair. The association with inference success is meaningful, but category imagery, retrieval strategy, and item-specific recollection are not dissociated. Nor does this association establish that the decoded activity is necessary for inference or mediates stress-related impairment. Despite the response letter's clarification, the abstract and conclusion still describe rapid bridge-element reactivation as an essential or causal mechanism. Consistent category-level, correlational language would align these passages with the analyses. The claim that retrieval practice prevents the theta reduction is also tentative: the reported within-experiment tests and overall, between-experiment comparison do not directly test a stress-by-practice interaction for theta (Section 3.6).
(4) Retrieval specific and item specific benefits remain unresolved
The lack of a matched restudy or additional-exposure condition limits conclusions about the distinctive contribution of retrieval practice. The authors now acknowledge this appropriately. They also explain that practice responses cannot be reliably scored, so the proposed successful-versus-unsuccessful practice analysis is unavailable. The new participant-and-triad mixed-effects model is a useful robustness check, but its interaction is uncertain (p = .058), and it cannot establish whether protection follows successful retrieval of particular items or a broader change in strategy. These limitations remain unresolved by the new model.
Reviewer #2 (Public review):
Summary:
Guo et al. investigate how acute stress affects memory-based inference and whether retrieval practice protects against these effects. Across two experiments involving 136 participants, the authors report that stress impairs inference performance and alters rapid neural reactivation of bridge-related memories. Retrieval practice appears to preserve both inference performance and the associated neural reactivation.
Strengths:
(1) Two independent experiments strengthen confidence in the behavioral findings.
(2) Time-resolved EEG decoding provides valuable temporal information about bridge-related memory reactivation during inference.
(3) The findings connect a practical learning strategy with behavioral and neural measures of resilience to acute stress.
Weaknesses:
(1) The physiological interpretation requires some clarification. Although the manuscript acknowledges that cortisol was not measured, wording referring to a confirmed cortisol peak remains. The timing reflects an expected physiological response rather than a measured peak, and the available measurements cannot distinguish the respective contributions of glucocorticoid and adrenergic activity.
(2) Significant comparisons in Figures 4 and 6 remain difficult to identify in the supplied revised manuscript. Clear annotations and corresponding legend definitions would improve interpretation.
The authors have acknowledged these concerns in their response, but the corresponding revisions are not fully reflected in the manuscript provided. These remaining issues can be addressed through minor revisions.
Appraisal and Impact
This study provides evidence linking stress-related impairment in memory-based inference to altered rapid reactivation of bridge-related memories. The combination of behavioral experiments and time-resolved EEG offers insight into the processes supporting inference under stress. The finding that retrieval practice can preserve performance and associated neural reactivation is relevant to cognitive neuroscience and applied learning research.
Reviewer #3 (Public review):
Summary:
In this study, Guo and colleagues investigated the effects of stress and retrieval practice on memory inference. In the first experiment, they found that memory inference was significantly worse after induced stress. Conversely, when participants received retrieval practice in the second experiment, they found no significant differences between these conditions. They monitored EEG during the inference phase and applied multivariate decoding analysis to examine evidence of neural reactivation. Complementing the behavioural findings of the first experiment, they found that they were able to decode the stimulus category of the inference item with more fidelity in the no stress condition. Surprisingly, they found the opposite direction when participants had retrieval practice, with stronger evidence of reactivation in the stress condition than in the control condition.
Strengths:
(1) With a basis in strong theoretical frameworks, the authors have carefully designed two studies investigating the effects of stress and memory retrieval on memory inference.
(2) The use multivariate decoding on the inference phase data combined with behavioural data sheds new light on how stress and retrieval may impact the neural signatures of inference processing.
Weaknesses:
(1) In places, some clarifications are needed about their statistical approach. For example, no multiple comparisons corrections have been applied to the follow-up tests even though they should be considered within the same 'family'. Therefore, the results from the uncorrected analyses should be interpreted with caution, but this should not affect the main claims of the paper.
Author response:
The following is the authors’ response to the original reviews.
Public Reviews:
Reviewer #1 (Public review):
(1) Insufficient evidence that retrieval practice specifically protects inference rather than strengthening associative memories
Sorry for the writing led to misunderstanding,we did not aim to argue that retrieval practice protects inference without affecting associative memories. Instead, we found associative memories mediated the effect of retrieval practice on A-C inference. Specifically, we added an exploratory mediation analysis to quantify the extent to which strengthened premise memory accounted for the association between retrieval practice and later A-C inference. Retrieval practice was associated with better AB/BC premise-memory performance (a = 2.13), and premise-memory performance predicted A-C inference after retrieval practice was controlled (b = 0.012). The bootstrapped indirect effect was significant (ab = 0.026, 95% CI [0.005, 0.049]), while the direct effect of retrieval practice remained significant (c' = 0.028, 95% CI [0.002, 0.055]). We have added this analysis to Section 3.2.3, “Retrieval practice enhanced direct memory retrieval but not baseline inference,” in the revised manuscript. Thus, premise memory (i.e., AB/BC memory) partially, but not completely, mediated the association. Because premise memory was assessed after inference with a 2AFC test, we explicitly describe this analysis as exploratory and interpret it cautiously.
(2) Importantly, the direct memory retrieval test used a two-alternative forced-choice (2AFC) format, which inherently allows a substantial proportion of correct responses to arise from guessing. Consequently, trials classified as 'successfully retrieved' may still include weak associative memory traces, making it difficult to conclude that failures in inference reflect deficits in integration rather than incomplete associative learning.
We agree with the reviewer1 that A correct response in a 2AFC test is not equivalent to unequivocal retrieval of a strong associative trace. We therefore replaced wording such as 'recalled' or 'successfully retrieved' with the more precise phrase 'answered correctly' when referring to the AB/BC direct-memory test. We also added this limitation to the Methods(2.2.6 Memory inference phase)and clarified that restricting the analysis to both-correct AB/BC trials reduces, but does not eliminate, uncertainty due to guessing. The revised Discussion notes that future studies should use cued recall, confidence ratings, or continuous measures of premise-memory strength to distinguish incomplete associative learning from a deficit in integration more sensitively.
(3) Apparent below-chance inference performance raises interpretational concerns
Thank you for identifying this ambiguity. We did not present the raw ACC in the figure,therefore, the presented value cannot be compare to 0.33 to get above/below chance conclusion. Figure 4A displayed the primary normalized/conditional inference measure, which relates successful A-C performance to the availability of the directly learned AB/BC premise associations; it is therefore not a raw 3AFC proportion and should not be compared directly with 0.33. We revised the Figure 4 legend to define the plotted measure explicitly and to state that it does not represent raw 3AFC accuracy.
(4) Between-experiment implementation of retrieval practice weakens causal inference
We admit that experiment 2 was conducted as a follow-up experiment after Experiment 1, and the retrieval-practice factor was therefore not randomized within a single fully crossed experiment. Although the two experiments were closely matched in recruitment, participant population, laboratory setting, EEG system, task structure, and experimenter team, cohort-related confounds cannot be excluded. We have accordingly revised causal wording throughout the manuscript, described the cross-experiment interaction as an association, and added this limitation to the Discussion. We also state that a within-experiment 2 x 2 design (Stress x Retrieval Practice) is needed to provide stronger causal evidence.
(5) Lack of an appropriate comparison condition limits the interpretation of retrieval-practice mechanisms
The present study did not include a re-exposure or restudy control condition. Therefore, the current design cannot determine whether the observed effect was specifically attributable to retrieval practice or could also be produced by re-exposure or restudy. We have added this limitation to the Discussion and noted that future studies should include a re-exposure or restudy control condition to clarify the specific contribution of retrieval practice.
(6) Furthermore, it is unclear whether retrieval practice operates at the trial level or the participant level. Retrieval practice could enhance memory representations for specific practiced items, making those trials more resistant to stress, or it could induce a more global change in cognitive strategy or stress resilience across participants. One way to address this issue would be to analyze inference performance separately for trials that were successfully retrieved during the retrieval practice phase versus those that were not
We agree with reviewer1 that additional analyses of retrieval performance during retrieval could help improve. However, in Experiment 2, retrieval practice was implemented using a free-recall procedure. Because participants' responses during this phase were not recorded, retrieval-practice performance could not be reliably coded for individual AB/BC associations. Consequently, the present data do not allow us to compare later A-C inference performance between associations that were successfully versus unsuccessfully retrieved during retrieval practice.
As an indirect robustness check, we fitted a mixed-effects model to trial-level A-C inference accuracy, including fixed effects of stress, retrieval practice, and their interaction, as well as random intercepts for participants and ABC triads. The stress-by-retrieval-practice interaction showed a positive trend consistent with the participant-level analysis, although it did not reach the conventional significance threshold (b = 0.116, SE = 0.061, z = 1.90, p = .058). We have added this analysis to Section 3.2.3, “Retrieval practice enhanced direct memory retrieval but not baseline inference,” in the revised manuscript. Future studies should adopt a standardized retrieval-practice procedure and systematically record retrieval-practice performance for each association. This would allow researchers to determine whether the protective effect of retrieval practice is specific to successfully retrieved trials or reflects a broader participant-level effect.
(7) Interpretation of EEG decoding as bridge-element reactivation may be overstated
Yes, our decoding targeted at category classification, therefore, we cannot sure specific picture (i.e., the bridge-element was reactivated). We revised the terminology throughout the manuscript to use “bridge-related category information” (or equivalent category-level wording) and removed claims that the analysis decoded a specific bridging memory.
Reviewer #2 (Public review):
(1) The authors correctly timed the inference task to begin approximately 20 minutes after the onset of the stressor. While this window aligns with the expected peak of the glucocorticoid (HPA) response, it also represents a period where the rapid adrenergic (SAM) response, confirmed by heart rate elevation, is still highly influential. As the authors acknowledge, because they did not collect saliva samples due to safety protocols, they cannot definitively separate the influence of peak cortisol from the tail-end of the adrenergic surge on the observed memory impairments.
The approximately 20-minute interval was selected on the basis of prior stress-and-retrieval studies and corresponds to the expected window of the delayed HPA response, while the heart-rate data also indicate that autonomic arousal remained relevant. Saliva collection was omitted because the study was conducted under COVID-19 safety protocols, and the present data therefore cannot dissociate glucocorticoid from adrenergic contributions. We revised the manuscript to avoid implying that cortisol was measured or that a cortisol peak was confirmed, and we now state explicitly that future studies should collect hormonal measures, when safe, to separate these mechanisms.
(2) Figures 4 and 6: Without asterisks is really difficult to compare the significant group differences.
Thank you for this suggestion, we added asterisks to Figures 4 and 6. At the same time, statistical significance was already conveyed in the original figures by whether the confidence intervals included zero.
Reviewer #3 (Public review):
(1) There are some key gaps in the reporting of the data. In particular, data is missing on how many trials were included in the inference phase and how many were retrieved in the direct memory task. This is important to know as the main conclusions are based on inference trials proportional to the direct retrieval trials. Considering that the direct retrieval performance differs significantly between the experiments, there could be issues with floor/ceiling effects (in the behaviour) and statistical power (in the EEG results) that confound the comparisons between experiments. Without the data, it is difficult to draw conclusions.
We agree with Reviewer 3 and have added Table S1 to the Supplementary Material. The table reports group-level direct-memory correct counts, the number of triads for which both AB and BC were answered correctly, and conditional A-C accuracy. Importantly, the number of both-correct AB/BC triads did not differ significantly between stress and control groups in either Experiment 1 (t (66) = -1.65, p = .10) or Experiment 2 (t(66) = -0.28, p = .78). Moreover, the cross-experiment stress-by-retrieval-practice interaction remained significant after controlling for both-correct triad count (b = 0.051, SE = 0.024, t = 2.17, p = .031, 95% CI [0.005, 0.098]). We have added this analysis to Section 3.2.2, “Retrieval practice protects direct memory retrieval from stress without affecting premise pairs counts. These additions make the available trial numbers transparent and indicate that the primary behavioral pattern was not explained by unequal numbers of premise-supported trials.
(2) Additionally, one-tailed t-tests have been used in follow-up tests, and, as I understand it, no multiple comparisons corrections have been applied to the post-hoc tests, suggesting that these findings should be interpreted with caution.
The one-tailed follow-up tests were used because the relevant hypotheses were directional a priori. Based on previous findings and our theoretical framework, we specifically predicted that acute stress would impair inference-related performance and neural reactivation, whereas retrieval practice would mitigate these effects. These follow-up tests were therefore planned comparisons used to decompose the significant omnibus effects in the predicted directions, rather than exploratory post-hoc comparisons. For this reason, we considered one-tailed testing appropriate. Similarly, we did not apply an additional multiple-comparison correction to these planned follow-up tests because they were limited in number, theory-driven, and designed to evaluate specific directional predictions rather than to search broadly across multiple possible contrasts. Importantly, our conclusions do not depend on any single follow-up comparison, but on the consistent pattern observed across behavioral inference performance, neural decoding of bridge-related category information, and theta-band activity. We have revised the manuscript to clarify the rationale for these analyses.
(3) In places, the structure is unclear, making the narrative difficult to follow, often making it necessary for the reader to go back and forth between the sections to understand the study and analyses.
We thank Reviewer 3 for this helpful suggestion. We have thoroughly reorganized the manuscript based on the detailed recommendations to improve the overall narrative flow and readability, ensuring that the study and its analyses are easy to follow.
Reviewer #3 (Recommendations for the authors):
(1) There is no mention of why the delay between learning and test is important. The delay may relate to consolidation, but the rationale is unclear.
We added the rationale for the using the 24-hour delay between learning and test to the Introduction. First, separating Day 1 learning/retrieval practice from Day 2 stress induction and testing minimizes direct effects of stress on encoding and aligns the design with prior work on stress-related impairment of delayed retrieval (Kuhlmann et al., 2005; Schönfeld et al., 2014; Smith et al., 2016). Second, the delay allows the longer-term advantage of retrieval practice to emerge; prior work showed that repeated study can be advantageous on an immediate test, whereas retrieval practice produces better retention after longer delays (Roediger and Karpicke, 2006). The interval therefore permits assessment of memory after offline processing, sleep, and natural forgetting. We also state explicitly that consolidation was neither manipulated nor measured here, so the design cannot establish that consolidation caused the stress-buffering effect.
(2) Additionally, it is unclear what happened between Day 1 and Day 2 (did you ask the participants to do anything between the sessions, e.g., refrain from alcohol, sleep at a normal time, if so, was this recorded, etc?).
Participants received no additional task, intervention, or behavioral restrictions between sessions, and alcohol use and sleep schedules were not recorded. They returned to the laboratory approximately 24 hours after Day 1 under otherwise naturalistic conditions. We added this information explicitly to the Experimental Procedure section. We agree that monitoring sleep and substance use would improve control over potential intersession variability in future studies.
(3) Section 2.5 Time-frequency analyses: The rationale for investigating theta power is unclear. Did the authors only investigate theta, or were other frequency bands often associated with memory retrieval also explored (e.g., alpha or beta)? If so, these should be reported. If not, the rationale should be clearer
We clarified that theta was selected a priori because theta oscillations have been linked to associative memory, retrieval, hippocampal-prefrontal communication, and memory integration in associative-inference paradigms (including Backus et al., 2016). The time-frequency analysis therefore focused on theta power (2-8 Hz) rather than conducting an exploratory search across frequency bands. Alpha and beta bands were not analyzed, and this is now stated explicitly in the Methods. In the Discussion, we now relate the theta-band findings to the behavioral and decoding results, noting that acute stress reduced theta power during the later stage of inference, whereas retrieval practice prevented this reduction and enhanced theta activity during the earlier stage of inference.
(4) 2.6.2 Analysis of Memory Inference Performance: There seems to be a disconnect between the hypothesis, which predicts that Experiment 2 conditions will be the same (i.e., confirming the null) and the independent t-test, which would tell you if the alternative can be accepted (rather than if it's a true null). Bayes or Equivalence tests would instead link to the hypothesis
Because a non-significant frequentist t-test cannot directly provide evidence for the null hypothesis, we additionally conducted a Bayesian independent-samples t-test. The analysis yielded BF10 = 0.361 (BF01 = 2.77), providing evidence in support of the null hypothesis that memory inference performance did not differ between the stress and control groups in Experiment 2. We have added this analysis to the Methods and Results.
(5) Line 508: It is not clear where the 207 +/- 50 ms time window came from.
Thank you for identifying this error. The value 207 ms was a typographical mistake and the correct value is 198 ms. We rewrote the procedure in detail 2.6.4 Optimal time window identification and validation). In short, participant-level peak latencies were first identified in the localizer training data; their group mean was 197.46 ms (SD = 245.22 ms), which was rounded to define the primary 198 +/- 50 ms training window. An independent cross-task time-generalization analysis yielded a peak latency of 246.01 ms (SD = 220.08 ms). This did not differ significantly from the localizer-derived latency, t(133) = 1.66, p = .10, supporting use of the fixed 198 +/- 50 ms window. The Methods now describe all three steps and the corrected value consistently.
(6) Section 3.5: It is not quite clear to me why the choice phase is of interest for the decoder. As I understand it, the participants are asked to select the image during this 3-second time window, meaning that they will be moving (artifacts). Therefore, I am unsure what question this analysis is addressing and would recommend clarification
We clarified that our primary theoretical interest was in the pre-choice inference period, during which participants considered and integrated the relevant information before making a response. We were also interested, secondarily, in the choice period to examine whether bridge-related category reactivation persisted into response selection. Thus, the inference period served as our primary neural window of interest, with the choice period providing a complementary analysis.
We agree that button presses create a risk of movement-related contamination. EEG trials were visually inspected, and ICA was used to remove ocular and movement-related components; nevertheless, we now interpret the choice-period findings cautiously.
(7) The title boldly suggests that the restoration of the impairment is due to memory reactivation. Although the evidence hints that this may be the case, there could be many other factors contributing to the results, and the title can be misleading. I would therefore recommend changing the title to suggest a link with memory reactivation.
Thank you for this suggestion. We have revised the title to “Retrieval practice prevents stress-induced inference impairment and preserves rapid bridge-related memory reactivation” to avoid implying a causal role of memory reactivation.
Figure 1A: illustrates the stimuli as words, whereas the stimuli were images. To avoid confusion, I would recommend replacing the words with images (or adding images alongside).
We have replaced the words with images in Figure 1A to accurately reflect the stimuli used in the experiment.
Line 654: I presume the authors meant to say "memory inference phase" instead of "memory reference phase".
Sorry for that. We apologize for this typographical error. We have corrected “memory reference phase” to “memory inference phase.”
Specific comments to the authors are listed below in the order of the manuscript:
For the remaining minor comments, we have made the corresponding revisions throughout the manuscript. To keep the response letter focused on the major scientific issues and avoid an overly lengthy point-by-point description of minor editorial changes, we do not elaborate on each of these changes here. All corresponding revisions can be found in the revised manuscript.
Chombo-Crunch 已成功模拟过一个毛细管实验:CO₂ 酸化流体流过填充方解石颗粒的毛细管(Molins et al., 2014)。
这是验证的实验
化学体系、平衡反应与方解石动力学
化学动力学在这里
eLife Assessment
This valuable work potentially advances our understanding of melody extraction in polyphonic music listening by identifying spontaneous attentional focus in uninstructed listening contexts. However, the evidence supporting the main conclusions is incomplete. The work will be of interest to psychologists and neuroscientists working on music listening, attention, and perception in ecological settings.
Reviewer #1 (Public review):
Summary:
This manuscript investigates the interplay between spontaneous attention and melody formation during polyphonic music listening. The authors use EEG recordings during uninstructed listening to examine how attention bias influences melody processing, employing both behavioural measures and computational modelling with music transformers. The study introduces a very clever pitch-inversion manipulation design to dissociate high-voice superiority from melodic salience and propose a "weighted integration" model where attention dynamically modulates how multiple voices are combined into perceived melody.
Strengths:
(1) The attention bias findings (Figure 2) are compelling and methodologically sound, with convergent evidence from both behavioral and neural measures.
(2) The pitch-inversion manipulation appears to super elegantly dissociate two competing factors (high-voice superiority vs melodic salience), moreover, the authors claim that the chosen music lends itself perfectly to his PolyInv condition. A claim I cannot really evaluate but which would make it even more neat.
(3) Nice linking between hypotheses and operationalisations.
Weaknesses:
My main remaining concerns are about Figure 3, which appears central (e.g. the title) and where the evidence remains, I'm afraid, incomplete.
(1) Statistics. As R3 observed, the stats in Fig 3 are across repetitions and not over subjects -- therefore the p-value does not appear to support population inference, and the key striking interaction in the figure does not appear to be tested? I don't see how the author response addresses this.
(2) Model checks. I asked how correlated the monophonic and polyphonic surprisal values are with each other. The revision reports correlations before and after inversion, which answers a different question. From Figure 3c it appears to be the case that the poly feature adds nothing to classification in PolyOrig, so it is also unclear whether Figure 3 reflects attention or a mis-specified feature.
I also noticed that the statistics in Figure 3 changed (see recommendation)
Reviewer #2 (Public review):
Summary:
The authors sought to understand the drivers of spontaneous attentional bias and melodic expectation generation during listening to short two-part classical pieces. They measured scalp EEG data in a monophonic condition and trained a model to reconstruct the audio envelope from the EEG. They then used this model to probe which of the two voices was best reflected in the neural signal during two polyphonic conditions. In one condition the original piece was presented, in the other the voices were switched in an attempt to distinguish between effects of (a) the pitch range of one voice compared to the other and (b) intrinsic melodic features. They also collected a behavioural measure of attentional bias for a subset of the stimuli in a separate study. Further modelling assessed whether expectations of how the melody would unfold were formed based on an integrated percept of melody across the two voices or based on a single voice. The authors sought to relate the findings to different theories of how musical/auditory scene analysis occurs, based on divided attention, figure-ground perception, and stream integration.
Strengths:
(1) A clever but simple manipulation - transposing the voices such that the higher one became the lower one - allowed an assessment of different factors that might affect the allocation of attention.
(2) State-of-the-art analytic techniques were applied to (a) build a music attention decoder (these are more commonly encountered for speech) (b) relate the neural data to features of the stimulus at the level of acoustics and expectation.
(3) The effects appeared robust across the group, not driven by a handful of participants.
Weaknesses:
(1) Although melody statistics are mentioned throughout, none have been reported. It would be helpful to see the features that lead to "motif attractiveness" quantified, as well as how they differ across lines. The work of David Huron such as at https://dl.acm.org/doi/abs/10.1145/3469013.3469016 provides examples that could be calculated with ease and compared across the two lines: "the tendency for small over large pitch movements, for large leaps to ascend, for musical phrases to fall in pitch, and for phrases to begin with an initial pitch rise". The authors also mention differences in ornamentation. Such comparisons would make more tangible for the reader what does differ across the original "melody" and "support" line. In particular, as the authors themselves note, lines in double-counterpoint pieces can to a degree operate interchangeably. Bach's inventions in particular use a lot of direct repetition (up to octave invariance), which one would expect to minimise differences in the statistics mentioned. If there were differences in the number of note onsets in the "melody" and "support" line, the implications for attentional capture and biasing of TRF estimates need to be considered. references purporting to relate to melodic statistics (11-14 in original numbering) seem rather to relate to high-voice superiority.
(2) Clearer details of how the integration model was implemented will be critical to interpreting the results relating to melodic expectations. It is not obvious how notes with simultaneous onsets were included in the model.
(3) The behavioural and neural measures of attentional bias are time-averaged over a stimulus, but readers may be left with the impression that they were time-resolved, given references to "integration rate" (for example).
Reviewer #3 (Public review):
Summary:
In this paper, Winchester and colleagues investigated melodic perception in natural music listening. They highlight the central role of attentional processes in identifying one particular stream in polyphonic material, and propose to compare several theoretical accounts, namely (1) divided attention, (2) figure-ground separation and (3) stream integration. In parallel, the authors compare the relative strength of exogenous attentional effects (i.e. salience) produced by two common traits of melodies: high-pitch (compared to other voices), and attractive statistics. To ensure the generalisability of their results to real-life listening contexts, they developed a new uninstructed listening paradigm in which participants can freely attend to any part of a musical stimulus.
Major strengths and weaknesses of the methods and results:
(1) Winchester and colleagues capitalized on previous attention decoding techniques and proposed an uninstructed listening paradigm, used here to investigate the spontaneous attentional focus during listening. The EEG decoding results are coherent with the behavioral data, suggesting that the paradigm is robust and relevant.
The authors first evaluate the relative importance of high-pitch and statistics in producing an attentional bias (Fig. 2). Behavioral results show a clear pattern, in which both effects are present with a dominance of the high-pitch one. The only weakness inherent to this protocol, which the authors acknowledge, is that behavioral responses are measured on a second presentation of short samples, which may induce different attentional focus than in the first uninstructed listening.<br /> The EEG analyses then compare the decoding of each melody (the high or low voice, with "richer" or "poorer" statistics) and show a similar pattern. This leaves open a confound factor: the decoder is trained on the monophonic condition, so any difference in how well the four melodies are decoded, prior to any attentional effect, would also be expected in the polyphonic conditions. The authors report in their response that the decoder performs equally well on the four monophonic conditions. This addresses the right question, but it concludes from a non-significant result, and the tests provided are unpaired although the design is within-participant.
This control does not appear in the manuscript, which states (l.128-130) that the decoders are "unbiased with regard to pitch height and voice statistics" without showing the data that would support this. Moreover, to capture attentional biases specifically, the decoding scores in the polyphonic conditions should be compared to the scores in the monophonic conditions, and attention could be expected to increase the decoding of the attended stream or decrease the unattended one.
(2) Winchester and colleagues then evaluate the encoding of melodic surprise and uncertainty (Fig. 3), comparing a monophonic and a polyphonic model (Anticipatory Music Transformer) with a CCA analysis. In Fig. 3 panel C, the statistics are not valid. They are computed across the 250 repetitions of the match-vs-mismatch procedure and not across the 31 participants: every ANOVA is reported as F(1,249). These statistics therefore do not support conclusions at the population level (the variability between participants never enters the error term), and they depend on the number of repetitions, a parameter of the analysis rather than a property of the data. The statistics reported for Figure 3 also differ from those reported for the same, unchanged figure in the previous version, and the change is not documented. The condition * expectations interaction, for instance, is now significant where it was not. The CCA analysis also cannot be reproduced from the public repository (osf.io/bjdh6), which contains no code for the CCA or the match-vs-mismatch classification. The stimuli are absent as well. This is not only a formal issue: the repository defines many alternative feature sets, and the acoustic set named in the code does not correspond to the one described in the Methods, so a reader cannot determine which features produced Figure 3.
Finally, the finding of Fig. 3C is not investigated further: a comparison of the encoding of individual melodies (e.g. AMmono high-voice vs AMmono low-voice, in PolyOrig and PolyInv conditions) is not provided, and no subsequent analysis or experiment accounts for the double dissociation. The result appears more like a starting point for further exploration than a finding that can support theoretical claims.
An appraisal of whether the authors achieved their aims, and whether the results support their conclusions:
(1) Winchester and colleagues aimed at identifying the melodic stream that attracts attention during the listening of natural polyphonic music, and the underlying attentional processes. Their behavioral results confirm that high-pitch and attractive statistics increase melodic salience with a greater effect size of the former. Their interpretation of the CCA results, in terms of stream segregation under high melodic salience and stream integration under weaker attentional biases, seems supported by the data, but the three limitations above (statistics, reproducibility, absence of explanatory analyses) prevent it from being evaluated. The relevance of the Anticipatory Music Transformer as a model of the listeners' expectations, compared with a well-established model such as IDyOM, is not discussed. Of note, the melodic statistics reported in the authors' response show small and mostly non-significant differences between the two voices, which weakens the motif attractiveness account.
(2) Overall, the authors achieved most of the aims presented in the introduction, although they couldn't give a more precise account on the attentional processes at stake. Their interpretations are sound and not overstated.
Impact of the work on the field, and the utility of the methods and data to the community:
The uninstructed listening paradigm introduced in this paper will likely have an impact for psychologists and neuroscientists working on music perception and auditory attention, enabling them to conduct experiments in more ecological settings. While the attentional biases towards melodies with high-pitch and attractive statistics are already known, showing their relative effect is an important step in building precise models of auditory attention. The release of the EEG data and stimulus features in a standardized format is a useful contribution in itself and would be considerably more so with the analysis code and the stimuli. Future work may be necessary to identify the models (markov-chains, deep-learning) and setup (data analysis, stimuli, control variables) that do or do not replicate these results.
Author response:
The following is the authors’ response to the original reviews.
Reviewer #1 (Public review):
Summary:
This manuscript investigates the interplay between spontaneous attention and melody formation during polyphonic music listening. The authors use EEG recordings during uninstructed listening to examine how attention bias influences melody processing, employing both behavioural measures and computational modelling with music transformers. The study introduces a very clever pitch-inversion manipulation design to dissociate high-voice superiority from melodic salience, and proposes a "weighted integration" model where attention dynamically modulates how multiple voices are combined into perceived melody.
Strengths:
(1) The attention bias findings (Figure 2) are compelling and methodologically sound, with convergent evidence from both behavioral and neural measures.
(2) The pitch-inversion manipulation appears to super elegantly dissociate two competing factors (high-voice superiority vs melodic salience), moreover, the authors claim that the chosen music lends itself perfectly to his PolyInv condition. A claim I cannot really evaluate, but which would make it even more neat.
(3) Nice bridge between hypotheses and operationalisations.
Weaknesses:
The results in Figure 3 are very striking, but I have a number of questions before I can consider myself convinced.
(1) Conceptual questions about surprisal analysis:
The pattern of results seems backwards to me. Since the music is inherently polyphonic in PolyOrig, I'd expect the polyphonic model to fit the brain data better - after all, that's what the music actually is. These voices were composed to interact harmonically, so modeling them as independent monophonic streams seems like a misspecification. Why would the brain match this misspecified model better?
Conversely, it would seem to me the pitch inversion in PolyInv disrupts (at least to some extent) the harmonic coherence, so if anywhere, I'd a priori expect that in this condition, listeners would rather be processing streams separately - making the monophonic model fit better there (or less bad), not in PolyOrig. The current pattern is exactly opposite to what seems logical to me.
The reviewer raised an important point that we have further clarified in the text (lines 503-516). We agree that a physiologically valid computational model of polyphonic music processing should match neural signals more closely than a monophonic model for all conditions. However, these transformer models are not built to be physiologically plausible. Their only objective is to minimise the next-event prediction error based on the prior context, which may also be achieved in ways that differ from human brain processing.
Previous studies (Di Liberto et al., eLife, 2020; Marion et al., Journal of Neuroscience, 2021; Kern et al., eLife, 2022), combined with our results on the monophonic condition, makes us confident that the monophonic models are correlated with how our brains process melodies from monophonic streams. Our finding that monophonic models also correlate with neural activity during PolyOrig is quite exciting, and far from obvious. Finding that melodic surprises derived from a polyphonic model work outperform the monophonic model at all is also extremely interesting. In fact, that result suggests that, under certain conditions (in this case, corresponding to a change in attention bias), our brains build melodic surprises by integrating information from multiple streams. Indeed, it is important to thoroughly discuss the motivation, reasoning, and caveats of this result, and we have done our best to augment the manuscript in that regard.
Our rationale was the following: In the PolyOrig condition, there is a strong attention bias, meaning that the melody corresponds primarily to one specific stream, and melodic expectations seem to be built on that stream exclusively (i.e., monophonic model). One caveat here is that our polyphonic model may simply be a “bad” model (i.e., non-physiologically plausible) for PolyOrig. Nonetheless, we find the result extremely promising, as the monophonic model is a good predictor of the EEG signal, and that its classification gain (AM-A) was comparable between PolyOrig and Monophonic condition.
We think that more work is needed to identify a polyphonic model that is closest to brain neural activity. That this question should be investigated using multiple datasets with various stimuli and conditions, and we are doing our best to provide a wider range of data and conditions in our ongoing work (for example, we are currently collecting data with three-stream music).
(2) Missing computational analyses:
If the transformer is properly trained, it should "understand" (i.e., predict/compress) the polyphonic music better, right? Can the authors demonstrate this via perplexity scores, bitsper-byte, or other prediction metrics, comparing how well each model (polyphonic vs monophonic) handles the music in both conditions? Similarly, if PolyInv truly maintains musical integrity as claimed, the polyphonic model should handle it as well as PolyOrig. But if the inversion does disrupt the music, we should see this reflected in degraded prediction scores. These metrics would validate whether the experimental manipulation works as intended. Also, how strongly are the surprisal streams correlated? There are many non-trivial modelling steps that should be reported in more detail.
The revised manuscript includes an assessment of the impact of the inversion on the model predictions. As expected, the inversion alters the ability of the model to predict the next note, producing a statistically significant increase in the surprise (KS test p = 9.7*10<sup>-130</sup>; D = 0.116), entropy (KS test p = 6.9*10<sup>-15</sup>; D = 0.0388), and perplexity (Wilcoxon signed-rank test p = 9.4*10<sup>-6</sup>, r = -0.783) for the polyphonic model. While our manipulation led to a reduced predictive ability of the model, it should be noted that these are very small effects (D<0.2).
Next, we measured the Pearson’s correlations of the expectation values for corresponding notes before and after the inversion of the polyphonic tracks, finding relatively low correlation values for surprise (r = 0.150, p = 7*10<sup>-68</sup>) and entropy (r = 0.106, p = 3*10<sup>-34</sup>).
To test whether the low correlations between the original and inverted expectation streams affected the neural results, we re-ran the CCA analysis used in Figure 3 on the PolyInv condition using expectation features extracted from PolyOrig. This control removes the inversion-induced change in the expectation features. The pattern of results was unchanged, indicating that the main findings are robust to these differences in model-derived expectation values. The revised manuscript includes this new data and a reflection on the implication of these results (lines 348-370; please see the new Figure 3 Supplement 1).
(3) Methodological inconsistencies:
Why are the two main questions (Figures 2 and 3) answered with completely different analytical approaches? The switch from TRF to CCA with match-vs-mismatch classification seems unmotivated. I think it's very important to provide a simpler model comparison - just TRF with acoustic features plus either polyphonic or monophonic surprisal - evaluated on relevant electrodes or the full scalp. This would make the results more comparable and interpretable.
The revised manuscript includes an explanation on that choice (lines 309-315). TRFs are effective when studying selective attention, which has been widely documented in the speech selective attention literature. The TRF also leads to interpretable results (ERP-like), which is preferable. However, when the objective is to assess the neural encoding of a certain property, CCA returns stronger scores as it accounts for all stimulus features and all EEG channels simultaneously. This is preferable in this case, as the EEG signatures of melodic expectation typically have a small magnitude (r~0.005; see Figure 2C in Di Liberto et al., eLife, 2020). Interpretability (i.e., the ability to infer spatial and temporal patterns of the neural response) was also less important on this analysis, as the two models were expected to simply be better or worse representations of the same neural sources. As such, we opted for the method with the highest sensitivity in terms of explained variance (here operationalised as a classification metric - as explored in our previous study on phonotactics, Di Liberto et al., NeuroImage, 2019).
(4) Presentation and methods:
(a) Coming from outside music/music theory, I found the paper somewhat abstract and hard to parse initially. The experimental logic becomes clearer with reflection, but you're doing yourselves a disservice with the jargon-heavy presentation. It would be useful to include example stimuli.
We have added an example sound file, with the corresponding PolyOrig, PolyInv versions (Figure 1 - supplement 1).
With regard to the wording in the manuscript, we agree that it may sound heavy in some parts. Nonetheless, that was an inevitable consequence of avoiding confusion and ambiguity. We are referring, for example, to the PolyInv manipulation, where it was critical to use a consistent wording. For instance, high-pitch stream could be intended as the stream that has the higher pitch in PolyInv, or the stream that had originally the higher pitch in PolyOrig. This was an issue of an early version of the manuscript that was fixed, regrettable making the manuscript heavier to read. We remain open to suggestions and did our best to improve some of our wording in the revised version (especially in the Discussion section).
(b) The methods section is extremely brief - no details whatsoever are provided regarding the modelling: What specific music transformer architecture? Which implementation of this "anticipatory music transformer"? Pre-trained on what corpus - monophonic, polyphonic, Western classical only? What constituted "technical issues" for the 9 excluded participants? What were the channel rejection criteria?
The methods section has been substantially augmented to include all details necessary for replication of our analyses (see lines 578-580, 670-737).
Reviewer #2 (Public review):
Summary:
The authors sought to understand the drivers of spontaneous attentional bias and melodic expectation generation during listening to short two-part classical pieces. They measured scalp EEG data in a monophonic condition and trained a model to reconstruct the audio envelope from the EEG. They then used this model to probe which of the two voices was best reflected in the neural signal during two polyphonic conditions. In one condition, the original piece was presented, in the other, the voices were switched in an attempt to distinguish between effects of (a) the pitch range of one voice compared to the other and (b) intrinsic melodic features. They also collected a behavioural measure of attentional bias for a subset of the stimuli in a separate study. Further modelling assessed whether expectations of how the melody would unfold were formed based on an integrated percept of melody across the two voices, or based on a single voice. The authors sought to relate the findings to different theories of how musical/auditory scene analysis occurs, based on divided attention, figure-ground perception, and stream integration.
Strengths:
(1) A clever but simple manipulation - transposing the voices such that the higher one became the lower one - allowed an assessment of different factors that might affect the allocation of attention.
(2) State-of-the-art analytic techniques were applied to (a) build a music attention decoder (these are more commonly encountered for speech) and (b) relate the neural data to features of the stimulus at the level of acoustics and expectation.
(3) The effects appeared robust across the group, not driven by a handful of participants.
Weaknesses:
(1) A key goal of the work is to establish the relative importance for the listener's attention of a voice's (a) mean pitch in the context of the two voices (high-voice superiority) and (b) intrinsic melodic statistics/motif attractiveness. The rationale of the experimental manipulation is that switching the relative height of the lines allows these to be dissociated by imparting the same high-voice benefit to the new high-voice and the same preferred intrinsic melodic statistics to the new low voice. However, previous work suggests that the high-voice superiority effect is not all-or-nothing. Electrophysiology supported by auditory nerve modelling found it to depend on the degree of voice separation in a non-monotonic way (see https://doi.org/10.1016/j.heares.2013.07.014 at p. 68). Although the authors keep the overall pitch of the lower (and upper) line fixed across conditions, systematically different contour patterns across the voices could give rise to a sub-optimal distribution of separations in the PolyInv versus PolyOrig condition. This could weaken the high-voice superiority effect in PolyInv and explain the pattern of results. One could argue that such contour differences are examples of the "intrinsic melodic statistics" put forward as the effect working in opposition to high-voice superiority, but it is their interaction across voices that matters here.
We thank the reviewer for this thoughtful comment. We agree that high‑voice superiority can vary with between‑stream pitch separation and need not be all‑or‑nothing. To address this, we quantified the separation differences between PolyOrig and PolyInv. Separation was higher in PolyInv (paired t‑test: p = 3.6×10<sup>⁻⁶</sup>). If a larger separation weakened the high-voice superiority effect, this would threaten our interpretation of the result in Figure 2 B, D (where PolyOrig presented a stronger high-voice attention bias than PolyInv). However, pitch separation did not correlate with our EEG attention‑bias index when considering both conditions together (r = 0.005, p = 0.908) or PolyOrig alone (r = -0.101, p = 0.0693). Within PolyInv, the correlation was significant and positive (r = 0.154, p = 0.00561) i.e., greater separation was associated with a stronger, not weaker, high‑voice bias. Thus, the observed results are not explained by a sub‑optimal distribution of separations across conditions. While contour differences could be viewed as part of the “intrinsic melodic statistics,” the cross‑voice interaction via separation does not account for the pattern we report.
(2) Although melody statistics are mentioned throughout, none have been calculated. It would be helpful to see the features that presumably lead to "motif attractiveness" quantified, as well as how they differ across lines. The work of David Huron, such as at https://dl.acm.org/doi/abs/10.1145/3469013.3469016, provides examples that could be calculated with ease and compared across the two lines: "the tendency for small over large pitch movements, for large leaps to ascend, for musical phrases to fall in pitch, and for phrases to begin with an initial pitch rise". The authors also mention differences in ornamentation. Such comparisons would make it more tangible for the reader as to what differs across the original "melody" and "support" line. In particular, as the authors themselves note, lines in double-counterpoint pieces can, to a degree, operate interchangeably. Bach's inventions in particular use a lot of direct repetition (up to octave invariance), which one would expect to minimise differences in the statistics mentioned. The references purporting to relate to melodic statistics (11-14 in original numbering) seem rather to relate to high-voice superiority.
We agree that quantifying “motif attractiveness” will be useful to the readers. We computed four standard melodic-statistics measures (H: high-pitch; L: low-pitch): Pitch Proximity (mean interval size; H < L, p = 0.0747), Leap Ascension ratio (H > L, p = 0.00111), Pitch Declination (H < L, p = 0.73), and Initial Anacrusis (H > L, p = 0.422). We also note that the H line contains ~15.2% more notes than L. Taken together, we conclude that there are small albeit measurable differences between H and L streams that predict behaviour i.e., there was an attention bias toward the H voice (with behavioural and EEG metrics consistent with this interpretation). Indeed, it should be noted that these differences were relatively small, in contrast with the large contrasts that are typical of many contemporary Western pieces. This is consistent with the double-counterpoint repertoire, where lines are intentionally written to be highly interchangeable. Here, modest statistical asymmetries nonetheless track perceptual salience. To facilitate further work, we will release code, per-piece feature tables, and note-count summaries in the repository.
(3) The exact nature of the transposition manipulation is obscured by a confusing Figure 1B, which shows an example in which the transposed line does not keep the same note-to-note interval structure as the original line.
Thank you for pointing that out. We have corrected that panel.
(4) The transformer model is barely described in the main text. Even readers who are familiar with the Hidden Markov Models (e.g., in IDyOM) previously used by some of the authors to model melodic surprise and entropy would benefit from a brief description in the main text at least of how transformer models are different. The Methods section goes a little further but does not mention what the training set was, nor the relative weight given to long- and short-term memory models.
(5) The match-mismatch procedure should be explained in enough detail for readers to at least understand what value represents chance performance and why performance would be measured as an average over participants. Relatedly, there is no description at all of CCA or the match-mismatch procedure in the Methods.
The revised manuscript includes substantial additions to the methodology description, including details on the Transformer model and the match-mismatch procedures (lines 670-716). Please also see our answer to Reviewer 1, Point 4.
(6) Details of how the integration model was implemented will be critical to interpreting the results relating to melodic expectations. It is not clear how "a single melody combining the two streams" was modelled, given that at least some notes presumably overlapped in time.
The revised manuscript includes details on the integration model (see lines 706-716, 722-737).
The AMT treats the polyphonic input as a single event sequence, rather than as two separate streams, where simultaneous notes are encoded as distinct events with the same onset times. Thus, the model generated an expectation value for each note event in that sequence, including notes with identical onset times. For simultaneous notes, these expectation values are not equivalent: the first note at a given onset is evaluated without the other simultaneous note yet having been incorporated into the context, whereas the final note at that same onset is evaluated after the other simultaneous note has been processed. AMT is a pretrained model that was trained using the same representation. To ensure that the integrated expectation feature reflected the full polyphonic context present at that timepoint, we used the expectation value of the last note event at each onset time. By using this merged representation, the model captures the polyphonic context. The revised Methods now makes this explicit.
(7) The authors propose a weighted integration model, referring in the Discussion to dynamics and an integration rate. They do show that in the PolyOrig case, the top stream bias is highest and the monophonic model gives the best prediction, while in the PolyInv case, the top stream bias is weaker and the polyphonic model provides the best prediction. However, that doesn't seem to say anything about the temporal rate of integration, just the degree, which could be fixed over the whole stimulus. Relatedly, the terms "strong attention bias" and "weak attention bias" in Highlight 4 might give the impression of different attention modes for a given listener, or perhaps different types of listeners, but this seems to be shorthand for how attention is allocated for different types of stimuli (namely those that have or have not had their voices reversed).
Our wording was misleading and was improved in this revision (lines 500-516). Our use of “dynamic”, in that sentence, did not refer to temporal integration, but it was referring to the possibility that our integration strategy may adapt to the stimulus (as suggested by the different results in PolyOrig and PolyInv). The revised manuscript includes a clearer wording that we think solves the issue. With regard to temporal dynamics, the reviewer is absolutely correct in that our analyses have not explored the temporal rate of integration. We are currently looking into that with a more tailored experiment involving more varied stimuli, but that will be part of a separate future study.
With regard to strong vs. weak attention bias in Highlight 4, our view is that the attention bias, in fact, leads to different “modes”, as suggested by the result in Figure 3C. Nonetheless, we appreciate that it would be useful to referring more closely to the facts (as opposed to our interpretations). As such, we have reworded Highlight 4.
(8) Another aspect of the presentation relating to temporal dynamics is that in places (e.g., Highlight 1), the authors suggest they are tracking attention dynamically. However, as acknowledged in the Discussion, neither the behavioural nor neural measure of attentional bias are temporally resolved. The measures indicate that on average participants attend more to the higher line (less so when it formed the lower line in the original composition).
The reviewer is correct. Our phrasing was referring to a previous version of the manuscript, as we had attempted time-resolved analyses that, however, showed quite a bit of variability, and were not necessary for the conclusions of the present study. As such, those results were excluded from our submission, as we aim to investigate the temporal dynamics aspect in a future study, including more data and more tailored denoising methodologies. We have revised the wording in the manuscript to solve this issue (please see lines 33, 39-43, 64, 262, 507).
(9) It is not clear whether the sung-back data were analysed (and if not why participants were asked to sing the melody back rather than just listen to the two components and report which they thought was the melody). It is also not stated whether the order in which the high and low voices were played back was randomised. If not, response biases or memory capacity might have affected the behavioural attention data.
We have added our explanation and motivations to the manuscript (lines 598-608).
The procedure was the following: Participants were presented with a short segment of a polyphonic composition; they sung back the melody; they were presented with the two monophonic streams, one after the other; they selected which one they considered the melody.
The numerical results from the last step of this process were analysed, while the “sung back” data was not analysed. The request of singing back before hearing the individual streams was to encourage them to answer the question based on their own melody extraction process, as opposed to perform a post hoc “reasoned” decision (possibly influenced by a presentation bias). Future research should explore whether this approach is more or less effective. Here, behavioural and EEG attention bias results are compatible, which is satisfactory for claims.
Please note that the presentation order of the high and low-pitched melodies played was indeed randomised.
Reviewer #3 (Public review):
Summary:
In this paper, Winchester and colleagues investigated melodic perception in natural music listening. They highlight the central role of attentional processes in identifying one particular stream in polyphonic material, and propose to compare several theoretical accounts, namely (1) divided attention, (2) figure-ground separation, and (3) stream integration. In parallel, the authors compare the relative strength of exogenous attentional effects (i.e., salience) produced by two common traits of melodies: high-pitch (compared to other voices), and attractive statistics. To ensure the generalisability of their results to real-life listening contexts, they developed a new uninstructed listening paradigm in which participants can freely attend to any part of a musical stimulus.
Major strengths and weaknesses of the methods and results:
(1) Winchester and colleagues capitalized on previous attention decoding techniques and proposed an uninstructed listening paradigm. This is an important innovation for the study of music perception in ecological settings, and it is used here to investigate the spontaneous attentional focus during listening. The EEG decoding results obtained are coherent with the behavioral data, suggesting that the paradigm is robust and relevant.
(2) The authors first evaluate the relative importance of high-pitch and statistics in producing an attentional bias (Figure 2). Behavioral results show a clear pattern, in which both effects are present, with a dominance of the high-pitch one. The only weakness inherent to this protocol is that behavioral responses are measured based on a second presentation of short samples, which may induce a different attentional focus than in the first uninstructed listening.
That’s a good point. That is an experimental limitation. Asking participants to repeat the melody during the first presentation (so, providing a task) could have altered the way they processed the music, so we preferred to avoid that. We instead opted for the presentation of a short snippet of each of the polyphonic pieces heard only after the initial uninstructed listening task. In principle, repeating the same identical stream may lead to different attentional patterns, we agree. We think that is less likely in our case, as we only presented very brief snippets from a random portion of each previous segment. We think that this minimises that risk, and the results are in line with that hypothesis. We have added some considerations on that risk. We actually think that the question on repetition, both from attention and melodic processing/surprise perspectives, is a very interesting one that should be investigated in dedicated studies. As such, we have added a suggestion for future work too (line 452-455).
(3) Then, the analyses of EEG data compare the decoding results of each melody (the high or low voice, and with "richer" or "poorer" statistics), and show a similar pattern of results. However, this report leaves open the possibility of a confounding factor. In this analysis, a TRF decoding model is first trained based on the presentation of monophonic samples, and it is later used to decode the envelope of the corresponding melodies in the polyphonic scenario. The fitting scores of the training phase are not reported. If the high-pitch or richer melodies were to produce higher decoding scores during monophonic listening (due to properties of the physiological response, or to perceptual processes), a similar difference could be expected during polyphonic listening. To capture attentional biases specifically, the decoding scores in the polyphonic conditions should be compared to the scores in the monophonic conditions, and attention could be expected to increase the decoding of the attended stream or decrease the unattended one.
We carried out additional analyses to confirm that the model was not biased toward any particular condition. The attention decoding model, which was trained on all monophonic pieces together, was evaluated on each of the four monophonic conditions (main stream high-pitch, support stream low-pitch, main stream low-pitch, support stream high-pitch). No statistically significant differences were detected when comparing the four conditions (Kruskal-Wallis = 0.377), nor when comparing high versus low pitch conditions (unpaired t-test, p= 0.567) and main versus support streams (unpaired t-test, p = 0.377).
(4) Then, Winchester and colleagues investigate the processing of melodic information by evaluating the encoding of melodic surprise and uncertainty (Figure 3). They compare the surprise and uncertainty estimated from a monophonic or a polyphonic model (Anticipatory Music Transformer), and analyse the data with a CCA analysis. The results show a double dissociation, where the processing of melodies with a strong attentional bias (high-pitch, rich statistics) is better approximated with a monophonic model, while a polyphonic model better classifies the other melodies. While this global result is compelling, it remains a preliminary and intriguing finding, and the manuscript does not further investigate it. As it stands, the result appears more like a starting point for further exploration than a definitive finding that can support strong theoretical claims. First, it could be complemented by a comparison of the encoding of individual melodies (e.g., AMmono high-voice vs AMmono low-voice, in PolyOrig and PolyInv conditions) to highlight a more direct correspondence with the previous results (Figure 2) and allow a more precise interpretation. Second, additional analyses or experiments would be needed to unpack this result and provide greater explanatory power. Additionally, the CCA analysis is not described in the method. The statistical testing conducted on this analysis seems to be performed across the 250 repetitions of the evaluation rather than across the 40 participants, which may bias the resulting p-values. Moreover, the choice and working principle of the Anticipatory Music Transformer are not described in the method. Overall, these results seem at first glance solid, but the missing parts of the method do not allow for full evaluation or replication of them.
For the missing methodological details please see our answer to Reviewer 1-Weakness 4, and Reviewer 2-Weakness 5, and the revised manuscript (lines 670-716, 734-737). We agree with the reviewer that our results should be taken as a stepping stone toward a better understanding of polyphonic music, and that additional work is required to draw stronger theoretical claims. We have expanded the future works section of the manuscript to reflect this consideration (lines 446-456, 500-516). The revised manuscript also clarifies that the statistical analyses on the CCA results are tests on the mean across participants, where distributions are derived by repeating the procedure 250 times for each participant (lines 324-326).
An appraisal of whether the authors achieved their aims, and whether the results support their conclusions:
(1) Winchester and colleagues aimed at identifying the melodic stream that attracts attention during the listening of natural polyphonic music, and the underlying attentional processes. Their behavioral results confirm that high-pitched and attractive statistics increase melodic salience with a greater effect size of the former, as stated in the discussion. The TRF analyses of EEG data seem to show a similar pattern, but could also be explained by confounding factors. Next, the authors interpret the CCA results as the results of stream segregation when there is a high melodic salience, and stream integration when there are weaker attentional biases. These interpretations seem to be supported by the data, but unfortunately, no additional analyses or experiments have been conducted to further evaluate this hypothesis. The authors also acknowledge that their results do not show whether stream segregation occurs via divided attention or figure-ground separation. However, the lack of information about the music model used (Anticipatory Music Model) and the way it was set up raises some questions about its relevance and limits as a model of cognition (e.g. Is this transformer a "better" model of the listeners' expectations than the wellestablished IDyOM model, and why?), and about the validity of those results.
(2) Overall, the authors achieved most of the aims presented in the introduction, although they couldn't give a more precise account of the attentional processes at stake. The interpretations are sound and not overstated, with the exception of potential confounding factors that could compromise the conclusions on the neural tracking of salient melodies (EEG results, Figure 2).
Impact of the work on the field, and the utility of the methods and data to the community: The new uninstructed listening paradigm introduced in this paper will likely have an important impact on psychologists and neuroscientists working on music perception and auditory attention, enabling them to conduct experiments in more ecological settings. While the attentional biases towards melodies with high-pitch and attractive statistics are already known, showing their relative effect is an important step in building precise models of auditory attention, and allows future paradigms to explore more fine-grained effects. Finally, the stream segregation and integration shown with this paradigm could be important for researchers working on music perception. Future work may be necessary to identify the models (Markov chains, deep learning) and setup (data analysis, stimuli, control variables) that do or do not replicate these results.
We thank the reviewer for their work on this manuscript!
eLife Assessment
This functional MRI study critically tests the hypothesis that poor face recognition in developmental prosopagnosia in humans is driven by reduced spatial integration and smaller receptive fields in face-selective brain regions. The evidence provided is compelling as it is well-powered, uses state-of-the-art functional brain imaging, eye tracking and computational analyses. The observed lack of difference in population receptive field sizes between face-selective brain regions of individuals with and without prosopagnosia, though a null result, has important implications for the field, and specifically, for theories of face recognition.
Reviewer #1 (Public review):
Summary:
The authors examine the neural correlates of face recognition deficits in individuals with Developmental Prosopagnosia (DP; 'face blindness'). Contrary to theories that poor face recognition is driven by reduced spatial integration (via smaller receptive fields), here the authors find that the properties of receptive fields in face-selective brain regions are the same in typical individuals vs. those with DP. The main analysis technique is population Receptive Field (pRF) mapping, with a wide range of measures considered. The authors report that there are no differences in goodness-of-fit (R2), the properties of the pRFs (neither size, location, nor the gain and exponent of the Compressive Spatial Summation model), nor their coverage of the visual field. The relationship of these properties to the visual field (notably the increase in pRF size with eccentricity) is also similar between the groups. Eye movements do not differ between the groups.
Strengths:
Although this is a null result, the large number of null results gives confidence that there are unlikely to be differences between the two groups. Together, this makes a compelling case that DP is not driven by differences in the spatial selectivity of face-selective brain regions, an important finding that directly informs theories of face recognition. The paper is well written and enjoyable to read, the studies have clearly been carefully conducted with clear justification for design decisions, and analyses are thorough.
Issues raised earlier regarding the localisation of face-selective regions between the two groups have been thoughtfully qualified in the revised manuscript. The use of a fixed-window localisation procedure (whereby large group-level ROIs are used to begin, with the top 20% most selective voxels selected in each individual) is a nice touch, ensuring a matched number of voxels in each ROI across groups, despite the clear differences in selectivity. Other clarifications to the results and discussion have also improved the manuscript.
Weaknesses:
One small issue concerns the relation between this study and prior work in low-level vision. The authors state in the introduction and discussion that there are "few" studies linking pRF properties to performance, citing only one. This ignores the numerous studies that have been conducted in this area - it would be ideal either to qualify these statements or to cite a greater number of these studies. The revised manuscript also includes mention of correlational analyses in the discussion which would be better placed in the results to begin.
Reviewer #2 (Public review):
This is my review of the revised manuscript, which I initially reviewed in 2025. I thank the authors for their thoughtful responses and additional analyses, including the Bayes factor analyses, tSNR checks, analyses relating pRF properties to behavioral performance, and clarification that PPA scene selectivity did not differ significantly between DPs and controls. I also appreciate the discussion acknowledging that intact pRF properties do not necessarily mean intact holistic processing. I have one remaining suggestion to make this distinction clearer, related to the interpretation of spatial integration.
Spatial integration and spatial pooling are well-established terms in the pRF literature. However, spatial integration can refer to several processes in the context of developmental prosopagnosia:
(1) Neural spatial integration: How neural populations combine inputs across visual space, characterized in part by pRF size and spatial summation.
(2) Perceptual spatial integration: How facial features interact to form a holistic representation, assessed using tasks such as composite-face and part-whole tests.
(3) Integration across viewing: How information sampled over successive eye movements contributes to a face representation.
The larger DP sample, consistent results, and Bayesian analyses make a stronger case against the first account that face-recognition difficulties stem from abnormally small pRFs. However, they do not establish that these other aspects of spatial integration are intact. Thus, my remaining concern with "normal spatial integration" in the title & main text is therefore about the semantics of the wording rather than the statistics. I suggest using "preserved population receptive field properties" or "preserved neural spatial integration" throughout the manuscript.
One minor note:. The merged PDF does not appear to reflect the revisions, so I used the article file with highlighted changes for this review. However, I could not find the following passage from the authors' response in neither version.<br /> "However, intact pRF properties do not preclude impairments to holistic processing. Such behavioral deficits could instead arise from abnormalities in broader neural networks due to either altered functional connectivity (Avidan et al., 2014; Lohse et al., 2016; Rosenthal et al., 2017) or structural connectivity (Gomez et al., 2015; Song et al., 2015b)."
Author response:
The following is the authors’ response to the original reviews.
Public Reviews:
Reviewer #1 (Public review):
Summary:
The authors examine the neural correlates of face recognition deficits in individuals with Developmental Prosopagnosia (DP; ’face blindness’). Contrary to theories that poor face recognition is driven by reduced spatial integration (via smaller receptive fields), here the authors find that the properties of receptive fields in face-selective brain regions are the same in typical individuals vs. those with DP. The main analysis technique is population Receptive Field (pRF) mapping, with a wide range of measures considered. The authors report that there are no differences in goodness-of-fit (R2), the properties of the pRFs (neither size, location, nor the gain and exponent of the Compressive Spatial Summation model), nor their coverage of the visual field. The relationship of these properties to the visual field (notably the increase in pRF size with eccentricity) is also similar between the groups. Eye movements do not differ between the groups.
Strengths:
Although this is a null result, the large number of null results gives confidence that there are unlikely to be differences between the two groups. Together, this makes a compelling case that DP is not driven by differences in the spatial selectivity of face-selective brain regions, an important finding that directly informs theories of face recognition. The paper is well written and enjoyable to read, the studies have clearly been carefully conducted with clear justification for design decisions, and the analyses are thorough.
Weaknesses:
One potential issue relates to the localisation of face-selective regions in the two groups. As in most studies of the neural basis of face recognition, localisers are used to find the face-selective Regions of Interest (ROIs) - OFA, mFus, and pFus, with comparison to the scene-selective PPA. To do so, faces are contrasted against other objects to find these regions (or scenes vs. others for the PPA). The one consistent difference that does emerge between groups in the paper is in the selectivity of these regions, which are less selective for faces in DP than in typical individuals (e.g., Figure 1B), as one might expect. 6/20 prosopagnosic individuals are also missing mFus, relative to only 2/20 typical individuals. This, to me, raises the question of whether the two groups are being compared fairly. If the localised regions were smaller and/or displaced in the DPs, this might select only a subset of the neural populations typically involved in face recognition. Perhaps the difference between groups lies outside this region. In other words, it could be that the differences in prosopagnosic face recognition lie in the neurons that are not able to be localised by this approach. The authors consider in the discussion whether their DPs may not have been ’true DPs’, which is convincing (p. 12). The question here is whether the regions selected are truly the’prosopagnosic brain areas’ or whether there is a kind of survivor bias (i.e., the regions selected are normal, but perhaps the difference lies in the nature/extent of the regions. At present, the only consideration given to explain the differences in prosopagnosia is that there may be ’qualitative’ differences between the two (which may be true), but I would give more thought to this.
Thank you for the positive assessment of our study and for raising this important theoretical point regarding ROI definition. We agree that face-selective ROIs in DPs, relative to controls, may be smaller, less selective, or altogether missing when traditional methods of localization with fixed thresholds are used (Furl et al, 2011). For this reason - to circumvent potential survivor bias and ensure ROI voxel counts across participants are equated - we used a method of ROI definition whereby each subject’s individual statistical map from the localizer was intersected with a generously-sized group mask for each ROI and the top 20% most category-selective voxels were retained for the pRF analysis (Norman-Haignere et al., 2013; Jiahui et al., 2018). This means that the raw number of voxels per ROI was equal across all participants with respect to the common group space, thereby ensuring a fair comparison even in cases where one group shows diminished category-selectivity. The details of the ROI definition are provided in the Methods at the end of the manuscript. To ensure readers understand our approach, we have also updated the Results section manuscript to highlight this important methodological step.
“To ensure a fair group comparison because individuals with DP often exhibit category selective responses below typically used thresholds, we adopted the “variable-window” method of ROI definition (Norman-Haignere et al., 2013; Jiahui et al., 2018). In this method, generously-sized group masks for each respective ROI (see Supplementary Figure 11) were intersected with each participant’s individual statistical map and the top 20% most category-selective voxels within the mask were retained for analysis. This method avoids the subjectivity of manually choosing thresholds and ensures that all participants have equally sized ROIs (i.e., identical voxel counts) prior to pRF fittings.”
With regard to the question of whether face-selective ROIs may be displaced in DPs compared to controls, previous work from the senior author’s lab (Jiahui et al., 2018) shows that, despite exhibiting weaker activations, the peak coordinates of significant clusters in DPs occupy very similar locations to those of controls. And, even if there were indeed slight displacements of face-selective ROIs for some subjects, the group-defined masks used in the present analysis were large enough to capture the majority of the top voxels. In the Supplementary Figure 11, we have included a diagram of the group masks used in our study.
The reviewer here also points out that more DPs than controls were missing the mFUS region (6/20 DPs vs 2/20 controls; Figure 1C). However, ‘missing’ in this context was not based on face-selectivity but rather a lack of retinotopic tuning. PRFs were fit to all voxels within each ROI - with all subjects starting out with equal voxel counts - and thereafter, voxels for which the variance explained by the pRF model was below 20% were excluded from subsequent analysis. We decided that any ROI with fewer than 10 voxels remaining after thresholding on the pRF fit should be deemed ‘missing’ since we considered the amount of data insufficient to reliably characterize the region’s retinotopic profile. Left mFUS was just one of six face-selective regions under study. The other five regions, many of which evinced strong fits to the pRF model, were represented comparably in DPs and controls and showed high similarity in the pRF parameters. Furthermore, across most participants, mFUS exhibited a low proportion of retinotopically modulated voxels (defined as voxels with pRF R squared greater than 20%, see Figure 1D). A follow-up analysis showed that the count of voxels surviving pRF R squared thresholding in left mFUS was not significantly correlated with mean pRF size (r(30) = 0.23,t = 1.28,p = 0.21) indicating that slightly more exclusion of DPs in this region is unlikely to have biased the group’s average pRF size.
The discussion considers the differences between the current study and an unpublished preprint (Witthoft et al, 2016), where DPs were found to have smaller pRFs than typical individuals. The discussion presents the argument that the current results are likely more robust, given the use of images within the pRF mapping stimuli here (faces, objects, etc) as opposed to checkerboards in the prior work, and the use of the CSS model here as opposed to a linear Gaussian model previously. This is convincing, but fails to address why there is a lack of difference in the control vs. DP group here. If anything, I would have imagined that the use of faces in mapping stimuli would have promoted differences between the groups (given the apparent difference in selectivity in DPs vs. controls seen here), which adds to the reliability of the present result. Greater consideration of why this should have led to a lack of difference would be ideal. The latter point about pRF models (Gaussian vs. CSS) does seem pertinent, for instance - could the ’qualitative’ difference lead to changes in the shape of these pRFs in prosopagnosia that are better characterised by the CSS model, perhaps? Perhaps more straightforwardly, and related to the above, could differences in the localisation of face-selective regions have driven the difference in prior work compared to here?
We agree that the use of high-level mapping stimuli (including faces) would be expected to add to the reliability of the present results for DPs and could have further emphasized differences between the groups if true differences did, in fact, exist. In the section of the Discussion titled “What factors may have contributed to the different results for the present study and Witthoft et al. (2016)”, we speculate on the extent to which the type of mapping stimuli and various other methodological factors (e.g. stimulus size, aperture design, pRF model) could have explained the divergent findings in our study versus that of Witthoft et al. (2016). In brief, our use of more colorful, naturalistic stimuli targeting higher-level visual areas elicited better model fits than the black and white checkerboard pattern used by Witthoft et al. (2016). The CSS model we used is better suited for higher-level regions and makes fewer assumptions than the linear pRF model. The field of view of our stimulus was smaller but still representative of the visual angle subtended by faces in the real world. Finally, our aperture design and longer run length likely also improved reliability.
Regarding the type of pRF model deployed, our use of a non-linear exponent (versus a linear model as in Witthoft et al. (2016)) is unlikely to explain the similarity we observed between the groups in terms of pRF size. Specifically, the groups did not show substantial differences in the exponent across ROIs, as seen in Figure 1G, so the use of a linear model should, in theory, produce similar outcomes for the two groups. We have explicitly mentioned this in the Discussion as follows:
“Both groups, however, evinced highly similar values for the compressive static nonlinearity parameter across the ROIs studied (Figure 1G). Because this nonlinear exponent parameter did not considerably differ between DPs and controls, the use of a linear model in prior work (Witthoft et al., 2016) is unlikely to explain the massive group differences they reported, as it would be expected to scale pRF estimates similarly for both groups.”
Overall, these methodological improvements, along with our larger sample size, make us confident in our findings. These are our best attempts to make sense of the divergent findings, but it is not possible to come to a definitive explanation. Examples abound of exaggerated or spurious effects from small-scale studies that ultimately fail to replicate in the related field of dyslexia research (Jednorog et al., 2015; Ramus et al., 2018) and neuroimaging research more broadly (Turner et al., 2018; Poldrack et al., 2017). Sometimes there are clear explanations for a lack of replicability (e.g. software bugs, overly flexible preprocessing methods, etc.), but many times the real reason is difficult to determine.
Perhaps more straightforwardly, and related to the above, could differences in the localisation of faceselective regions have driven the difference in prior work compared to here?
The reviewer astutely points out that differences in ROI definition could have played a role in the differences between our work and that of Witthoft et al. (2016). While Witthoft et al. (2016) used a fixed statistical threshold for ROI definition, the authors reported no significant group differences in ROI volume; Nevertheless, it is problematic to confidently establish true equivalence with a sample size of only 7 DPs as they had. If a fixed threshold inadvertently captured slightly different sub-populations of voxels between the groups due to generally weaker face-selectivity among the DPs, it could have heavily skewed the pRF estimates in such a small sample. Our use of the variable-threshold analysis (top 20% of face selective voxels within bounds of a group-defined mask) effectively eliminates this potential spatial sampling artifact.
Finally, the lack of variations in the spatial properties of these brain regions is interesting in light of the theories that spatial integration is a key aspect of effective face recognition. In this context, it is interesting to note the marked drop in R2 values in face-selective regions like mFus relative to earlier cortex. The authors note in some sense that this is related to the larger receptive field size, but is there a broader point here that perhaps the receptive field model (even with Compressive Spatial Summation) is simply a poor fit for the function of these areas? Could it be that these areas are simply not spatial at all? A broader link between the null results presented here and their implications for theories of face recognition would be ideal.
The reviewer highlights an excellent point regarding the marked drop in R squared from the early visual cortex to anterior face-selective regions like mFUS. We believe this drop reflects two converging factors. First, it raises the methodological question of whether there is a more effective pRF stimulus for these more anterior regions. For example, it might be possible to obtain higher and more reliable responses there using single isolated faces (Cf. Kay, Weiner, Grill-Spector, 2015).
Second, we agree that the pRF model might ultimately be an incomplete characterization of the neural function in these higher-level areas. While we would not go so far as to say that these areas are “not spatial at all" (given that they do exhibit reliable visual field coverage), their primary computational role may shift from strict spatial mapping toward position-invariant feature extraction and identity representation. As Reviewer 2 suggests, one possibility is that other brain processes (e.g. functional or structural connectivity between ROIs) may give rise to holistic face processing in ways that are not captured by pRF properties.
Reviewer #1 (Recommendations for the authors):
In addition to the points raised in the public review, please address the following issues:
Related to the question about the localisation of face-selective regions in prosopagnosia (and whether the localised regions differ in the DP vs control analyses), one way to better consider this would be to report the location and size or surface area of the localised regions in typical vs. DP individuals. Perhaps analyses using an averaged or standardised ROI (e.g., averaging control ROIs and applying this to prosopagnosics) would also be of interest to consider how this factor might influence the results.
As above, a greater discussion of potential reasons for the null results of the present study relative to prior work would be ideal, including consideration of differences in localization of the brain regions and predictions for the way the different pRF models (Gaussian vs. CSS) might have created this (lack of) difference, is my suggestion. Greater discussion of the implications of these findings for theories of face recognition more broadly would also be ideal (e.g., whether the drop in R2 values in face-selective regions suggests a general lack of spatial selectivity).
As detailed in our responses to the Public Review above, we completely agree that ROI localization and model choices are critical factors when comparing our results to prior work.
To briefly reiterate: our use of the variable-window analysis explicitly equates ROI sizes across participants, effectively eliminating the spatial sampling artifact that may have arisen had someone used a fixed threshold. We have now explicitly highlighted this methodological strength in both the Methods and Results sections. Furthermore, as shown in Figure 1G, the CSS exponent was highly similar between groups, meaning the model choice alone is unlikely to explain the divergent results (now noted in the Discussion).
Relatedly, one issue with the interpretation of the null results in the present study is in the statement that ’our results provide strong empirical evidence that pRF properties are highly similar between DPs and controls’. This comes back to the old ’absence of evidence is not evidence of absence’ argument, and I would suggest this statement be more carefully worded - there is certainly a consistent lack of differences between the two groups, which allows one to make the argument that properties are likely similar. But I suggest the authors could be more careful in making this statement.
We agree that “the absence of evidence is not evidence of absence”, and we appreciate the push to be more precise in our claims.
To substantiate our claim that pRF properties are indeed similar between the two groups, we have incorporated complementary Bayesian analyses (as also requested by Reviewer 2). As detailed in our response to Reviewer 2 (Point 2) and reported in the new Supplementary Table 6, Bayes Factors using both default and ‘ultrawide’ priors provided consistent, moderate-to-strong evidence explicitly in favor of the null hypothesis across the visual hierarchy. Combined with our frequentist confidence intervals, this allows us to rigorously assert that these spatial properties are highly similar, rather than merely relying on a frequentist failure to reject the null.
Finally, one typo is present at the bottom of p. 14, which should be ’differentially affected DPs and controls’
Thank you for catching this typo - it has been corrected.
Reviewer #2 (Public review):
Summary:
This is a well-conducted and clearly written manuscript addressing the link between population receptive fields (pRFs) and visual behavior. The authors test whether developmental prosopagnosia (DP) involves atypical pRFs in face-selective regions, a hypothesis suggested by prior work with a small DP sample. Using a larger cohort of DPs and controls, robust pRF mapping with appropriate stimuli and CSS modeling, and careful in-scanner eye tracking, the authors report no group differences in pRF properties across the visual processing hierarchy. These results suggest that reduced spatial integration is unlikely to account for holistic face processing deficits in DP.
Strengths
The dataset quality, sample size, and methodological rigor are notable strengths.
Weaknesses
The primary concern is the interpretation of the results.
(1) Relationship between pRFs and spatial integration While atypical pRF properties could contribute to deficits in spatial integration, impairments in holistic processing in DPs are not necessarily caused by pRF abnormalities. The discussion could be strengthened by considering alternative explanations for reduced spatial integration, such as altered structural or functional connectivity in the face network, which has been reported to underlie DP’s difficulties in integrating facial features.
We agree that intact pRF properties do not preclude the existence of holistic processing deficits, and that altered structural or functional connectivity within the broader face network is a plausible alternative mechanism for such deficits. To ensure this distinction is clear to the reader, we have updated the Discussion section to highlight these alternative explanations for holistic processing deficits, citing relevant literature.
“However, intact pRF properties do not preclude impairments to holistic processing. Such behavioral deficits could instead arise from abnormalities in broader neural networks due to either altered functional connectivity (Avidan et al., 2014; Lohse et al., 2016; Rosenthal et al., 2017) or structural connectivity (Gomez et al., 2015; Song et al., 2015b).”
(2) Beyond the null hypothesis testing framework
The title claims "normal spatial integration," yet this conclusion is based on a failure to reject the null hypothesis, which does not justify accepting the alternative hypothesis. To substantiate a claim of "normal," the authors would need to provide analyses quantifying evidence for the absence of effects, e.g., using a Bayesian framework.
To directly address the reviewer’s request to quantify evidence for the absence of an effect, we have added a Bayesian analysis of mean pRF size across all ROIs and hemispheres (Supplementary Table 5).
Using a default Cauchy prior, the Bayes Factors favored the null hypothesis (BF<sub>01</sub> > 1) in 15 out of 16 regions. Only the right OFA showed moderate evidence for the alternative hypothesis. However, upon inspecting this difference, we found that pRFs in the right OFA were actually larger in our DP sample compared to controls (DPs: mean size ± SD = 2.42±0.82; Controls: 1.78±0.75). Because the existing literature explicitly claims that DP is associated with abnormally small pRFs leading to restricted spatial integration (Witthoft et al., 2016; Avidan & Behrmann, 2021), this specific deviation (in the opposite direction) contradicts the alternative hypothesis.
Because Witthoft et al. (2016) reported that pRFs were approximately three times smaller in DPs, we computed Bayes Factors using an ‘ultrawide’ prior (rscale = 1.414 in function ttestBF from the BayesFactor R package). The ‘ultrawide’ prior, therefore, correctly models the huge effect size expected under this alternative hypothesis. Under these conditions, the evidence strongly favored the null hypothesis across the visual hierarchy. Combined with our frequentist confidence intervals, these Bayesian analyses substantiate our claim that DPs do not suffer from the restricted spatial integration previously theorized to underlie the disorder.
(3) Face-specific or broader visual processing
Prior work from the senior author’s lab (Jiahui et al., 2018) reported pronounced reductions in scene selectivity and marginal reductions in body selectivity in DPs, suggesting that visual processing deficits in DPs may extend beyond faces. While the manuscript includes PPA as a high-level control region for scene perception, scene selectivity was not directly reported. The authors could also consider individual differences and potential data-quality confounds (tSNR difference between and within groups, several obvious outliers in the figures, etc). For instance, examining whether reduced tSNR in DPs contributed to lower face selectivity in the DP group in this dataset.
Thank you for raising these methodological checks. We have addressed each point below to ensure the robustness of our findings.
(1) Scene Selectivity in PPA: We have now explicitly reported scene selectivity in PPA in Supplementary Table 5. Unlike prior work (Jiahui et al., 2018), we found no significant reduction in scene selectivity in DPs versus controls in our current sample. This finding suggests that the visual deficits in our DP sample are specific to faces rather than reflecting a more domain-general degradation of high-level visual cortex.
(2) tSNR Between-groups: Independent samples t-tests revealed no significant differences in regional tSNR between DPs and controls across any of the six face-selective regions (all uncorrected, p > 0.085). Bayesian analyses further supported this, with Bayes Factors generally favoring the null hypothesis of equal regional tSNR between groups (bilateral pFUS and mFUS BF<sub>01</sub> range: 3.08 to 3.21; bilateral OFA evidence was inconclusive, BF<sub>01</sub> range: 0.95 to 1.43). There is therefore no evidence that the DP group suffered from systematically worse signal quality.
(3) tSNR Within-groups (Correlation): Finally, to address whether variance in signal quality (tSNR) relates to our selectivity measures, we computed Pearson correlations between individual tSNR and face-selectivity magnitude (percent signal change) across the six face regions. Only the left OFA showed a weak, uncorrected correlation (r = 0.32,p = 0.046), which does not survive correction for multiple comparisons. No other regions approached significance. Crucially, for tSNR to act as a confound explaining the group difference in face selectivity, tSNR itself would need to be systematically lower in the DP group. Because our betweengroups analysis established that DPs and controls have equivalent tSNR, any shared variance between tSNR and percent signal change across the entire sample cannot explain the reduction in face selectivity within the DP group.
(4) Individual Differences and Outliers: Regarding variance and potential outliers in the figures, we intentionally plotted individual data points to provide maximum transparency regarding individual differences. To ensure that extreme values did not unduly influence our group-level conclusions, we utilized Linear Mixed-Effects Models (LMMs) for our primary statistical analyses. LMMs are highly robust to individual variance and non-normality. Furthermore, all data points included in our analyses passed strict, objective quality-assurance thresholds (e.g., stable fixation verified by eye-tracking, and pRF model goodness-of-fit R<sup>2</sup> > 0.20). Because these points represent true, high-quality individual variance rather than noise artifacts, we retained them in our analyses.
(4) Linking pRF properties to behaviour
The manuscript aims to examine the relationship between pRF properties and behavior, but currently reports only one aspect of pRF (size) in relation to a single behavioral measure (CFMT), without full statistical reporting: "We found no significant association between participants’ CFMT scores and mean pRF size in OFA, pFUS, or mFUS." For comprehensive reporting, the authors could examine additional pRF properties (e.g., center, eccentricity, scaling between eccentricity and pRF size, shape of visual field coverage, etc), additional ROIs (early, intermediate, and category-selective areas), and relate them to multiple behavioral measures (e.g., HEVA, PI20, FFT). This would provide a full picture of how pRF characteristics relate to behavioral performance in DP.
We agree that a comprehensive reporting of pRF-to-behavior is worthwhile. In our revised manuscript, we extracted participant-by-participant values for the metrics used in our main group comparisons: mean pRF size, mean pRF eccentricity, visual field coverage area at 95% probability contour, pRF center dispersion, and slope relating pRF size to pRF eccentricity. We then correlated these six metrics across all ROIs and hemispheres with scores from both the Cambridge Face Memory Test (CFMT) and Famous Faces Test (FFT). To control for the large number of exploratory correlations, we applied False Discovery Rate (FDR) correction. As shown in newly included Supplementary Table 5, no pRF metrics reliably correlated with behavioral face recognition ability, further cementing our conclusion that these spatial integration mechanisms are intact and decoupled from the recognition deficit in DP. We have reported these new findings in the main text and pointed readers to Supplementary Table 5 for full statistical reporting.
Reviewer #2 (Recommendations for the authors):
In addition to the points raised in the public review, please address the following issues:
(1) Table 1 & Supplementary Table 4
Caption: "intercept has been mapped to the control group in the left hemisphere".
Main text: "intercept was mapped to the control group in the right hemisphere."
These descriptions are directly contradictory. Please correct them and ensure consistency across the main text, tables, and supplementary materials. Supplementary Table 4.
(2) Supplementary Table 4
The reported results are identical for V2 and V3, which is highly unlikely. Please double-check and correct any copying errors.
The caption indicates significance, but the table shows no asterisks.
(3) Figure 2A
Missing colorbar (color, units, and label).
(1) This caption was correct but there was a typo in the main text. The main text has been updated to correctly state that the intercept in the LMM models was mapped to the control group in the left hemisphere.
(2) The results for V3 had incorrectly been displayed twice. We have corrected the error and updated the table. Also, we have omitted the significance key from the caption since none of the models contain any significant effects.
(3) A colorbar (with color, units, and label) has been added to Figure 2A. Thank you for your keen eye and attention to detail.
eLife Assessment
In contrast to animal cells, mature plant cells contain large watery vacuoles commonly taking up more than 90% of the cell volume. Therefore, mature plant cells provide unique challenges when it comes to cryo-preservation, which has resulted in limited successful examples for structural studies using in situ cryo-electron tomography. This important study describes procedures for high-pressure-freezing, focused ion-beam milling, and cryo-electron tomography imaging of select plant tissue types that can be vitrified successfully. The paper provides solid evidence for the usefulness of these methods for those samples. Some concerns remain about the applicability of the methods to a wider range of plant tissue samples, including for example intact leaves of higher plants, for which vitrification remains difficult.
Reviewer #1 (Public review):
[Editors' note: The reviewers discussed the revision. They agreed that the authors made a good faith effort to thoughtful response to the queries and concerns raised, and this manuscript should be published. Although some concerns about the applicability of the methods for a wider range of plant tissues remain. This has been expressed more clearly in the eLife Assessment above, and the authors may want to consider adding their own cautionary language to the manuscript, for example that they were not successful with intact plant leaves.]
Summary:
This in situ cryo-ET workflow of selected plant structures provides several detailed strategies using plunge-freezing and the HPF waffle method and lift-out for notoriously difficult samples (compared to cell culture, yeast, and algae, which are far more prevalent in the literature).
Strengths:
A very difficult challenge whereby the authors demonstrate successful vitrification of selected plants/structures using waffle and lift-out approaches for cryoET. Because there are relatively few examples of multi-cellular plant cryo-ET in the literature, it is important for the scientific community to be motivated and have demonstrated strategies that it is achievable. This manuscript has a number of very helpful graphics and videos to help guide researchers who would be interested in undertaking that would help shorten the learning curve of admittedly tedious and complex workflows. This is a slow and tedious process, but you have to start somewhere, and I applaud the authors for sharing their experiences with others, and I expect will help other early adopters to come up to speed sooner.
Comments on revised version:
The authors made a good faith effort to thoughtful response to my queries and concerns, and this manuscript should be published. I really appreciate it. I suggest one final amendment, and it can simply be an insertion of a couple sentences. I'm still concerned by the more niche plant sample types being used, admittedly due to limitations in freezing of more mainstream plant species and/or tissues, and leaves in particular. The workflows described in the manuscript definitely could work IF freezing could be adequate. The authors go to lengths describing what makes it a challenge to vitrify, and they comment in rebuttal that they so far have been unsuccessful in intact leaves of higher plants. Yet, they do not explicitly make that statement in the manuscript itself. I want to be sure that a reader doesn't invest much time and money thinking this paper on "Making plant tissue accessible..." is actually not broadly accessible to any plant tissue. As described it is specific or workable in "select" plant tissue types or species due to freezing limitations and/or strategies employed. I am asking to place some simple cautionary guiding language in the discussion or elsewhere.
Reviewer #2 (Public review):
Summary:
Poge et al. present a workflow for studying plant tissue by combining high-pressure freezing, cryo-fluorescence microscopy, FIB milling, and cryo-electron tomography (cryo-ET). They tested various plant tissues, including Physcomitrium patens, Arabidopsis thaliana, and Limonium bicolor. The authors successfully produce thin lamellae suitable for cryo-ET studies. Using sub-tomogram averaging, they determined the Rubisco structure at subnanometer resolution, demonstrating the potential of this workflow for plant tissue studies.
Strengths:
This manuscript is likely the first to systematically apply FIB milling and cryo-ET to plant tissue samples. It provides a detailed methodological description, which is not only valuable for plant tissue studies but also adaptable to a broader range of biological tissue samples. The study compares the plunge freezing method with a high-pressure freezing method, demonstrating that high-pressure freezing can vitrify thick tissues while preserving their native state. Additionally, the authors explore two methods for plant tissue sample preparation, the "waffle" method and in-carrier high-pressure freezing combined with the "lift-out" approach. The "waffle" method is suitable for samples less than 25um, while the in-carrier high-pressure freezing method can process samples up to 100um.
Weaknesses:
The described workflow is very complicated and requires special expertise. The success rate of this workflow is not very high, particularly for high-pressure freezing and life-out technology. Further improvements are needed for automation and increasing throughput.
Comments on revised version:
I am satisfied with the revision and have no more comments.
Reviewer #3 (Public review):
Summary:
The authors aimed to improve cryo-TEM workflows for plant cells. The authors present details on high-pressure-freezing protocols to vitrify, ion-mill, and image certain plant cell types.
Strengths:
Clear step-by-step outline on how to preserve and image cryo samples derived from plants.
Weaknesses:
A general current weakness of cryo-TEM is the problem of vitrifying cells that are embedded in tissues. The vast majority of cells in the plant body are currently not accessible to this technology. This is not a weakness of this specific manuscript but a general problem.
The manuscript is well organized and well written, and the discussion covers practically all questions I had while reading the results section.
Comments on revised version:
As I mentioned in my original review, there will be only a few plant cell types that can be vitrified and there is no solution for this in sight. This means that we will have to rely on "classical" electron microscopy for the foreseeable future for most experiments. Nevertheless, the publication shows great progress and there is a lot we can learn within those limitations.
Author response:
The following is the authors’ response to the original reviews.
Public Reviews:
Reviewer #1 (Public review):
Summary:
This in situ cryo-ET workflow of selected plant structures provides several detailed strategies using plunge-freezing and the HPF waffle method and lift-out for notoriously difficult samples (compared to cell culture, yeast, and algae, which are far more prevalent in the literature).
Strengths:
A very difficult challenge whereby the authors demonstrate successful vitrification of selected plants/structures using waffle and lift-out approaches for cryoET. Because there are relatively few examples of multi-cellular plant cryo-ET in the literature, it is important for the scientific community to be motivated and have demonstrated strategies that it is achievable. This manuscript has a number of very helpful graphics and videos to help guide researchers who would be interested in undertaking that would help shorten the learning curve of admittedly tedious and complex workflows. This is a slow and tedious process, but you have to start somewhere, and I applaud the authors for sharing their experiences with others, and I expect will help other early adopters to come up to speed sooner.
Weaknesses:
While important, the specific specimen and cell-types selected that were successful (perhaps other plant specimen and tissues tried were unsuccessful and thus not reported) in this approach did not demonstrate success to broadly applicable to other much more prevalent and interesting and intensive areas plant biology and plant structures (some mentioned in more detail below).
This manuscript is essentially a protocol paper and in its paragraph form, and even with great graphics, will definitely be difficult to follow and reproduce for a non-expert. Also considering the use of 3 different FIB-SEM platforms and 2 different cryo-FLM platforms, I wonder if a master graphic of the full workflow(s) could be prepared as a supplementary document that walks through the major steps and points to the individual figures at the critical steps to make it more accessible to the broader readership.
We agree that this would help the reader to keep track of the different workflow steps. Therefore, we prepared two additional supplementary figures:
Figure 1 – figure supplement 1: Overview of the critical workflow steps for P. patens protenemata.
Figure 1 – figure supplement 2: Overview of the used lift-out procedures.
Multiple times in the manuscript, important workflow details seemed to point to and be dependent on two "unpublished" manuscripts:
(1) Line 583, 755, 790, 847-848, (Poge et al., will soon be published as a protocol).
(2) Lines 140, 695, 716 (Capitanio et al., will soon be described in a manuscript).
It is not clear if/when these would be publicly available. It may be important to wait until these papers can be included in published form.
Reviewer #2 (Public review):
Summary:
Poge et al. present a workflow for studying plant tissue by combining high-pressure freezing, cryo-fluorescence microscopy, FIB milling, and cryo-electron tomography (cryo-ET). They tested various plant tissues, including Physcomitrium patens, Arabidopsis thaliana, and Limonium bicolor. The authors successfully produce thin lamellae suitable for cryo-ET studies. Using sub-tomogram averaging, they determined the Rubisco structure at subnanometer resolution, demonstrating the potential of this workflow for plant tissue studies.
Strengths:
This manuscript is likely the first to systematically apply FIB milling and cryo-ET to plant tissue samples. It provides a detailed methodological description, which is not only valuable for plant tissue studies but also adaptable to a broader range of biological tissue samples. The study compares the plunge freezing method with a high-pressure freezing method, demonstrating that high-pressure freezing can vitrify thick tissues while preserving their native state. Additionally, the authors explore two methods for plant tissue sample preparation, the "waffle" method and in-carrier high-pressure freezing combined with the "lift-out" approach. The "waffle" method is suitable for samples less than 25um, while the in-carrier high-pressure freezing method can process samples up to 100um.
Weaknesses:
The described workflow is very complicated and requires special expertise. The success rate of this workflow is not very high, particularly for high-pressure freezing and life-out technology. Further improvements are needed for automation and increasing throughput.
We thank the reviewer for the fair and detailed assessment of our manuscript.
Reviewer #3 (Public review):
Summary:
The authors aimed to improve cryo-TEM workflows for plant cells. The authors present details on high-pressure-freezing protocols to vitrify, ion-mill, and image certain plant cell types.
Strengths:
Clear step-by-step outline on how to preserve and image cryo samples derived from plants.
Weaknesses:
A general current weakness of cryo-TEM is the problem of vitrifying cells that are embedded in tissues. The vast majority of cells in the plant body are currently not accessible to this technology. This is not a weakness of this specific manuscript but a general problem.
The manuscript is well organized and well written, and the discussion covers practically all questions I had while reading the results section. I only have a few comments, all of which I consider minor.
We thank the reviewer for the fair and detailed assessment of our manuscript.
Recommendations for the authors:
Reviewer #1 (Recommendations for the authors):
(1) I would like to see more part numbers of reagents and supplies used. They were largely absent.
(2) The authors seem to refer to two other unpublished manuscripts, which have important details for this workflow, and are unavailable at the time of this submission.
In point (1) and (2), the reviewer addresses crucial points. By the time we submit the revised version, the manuscript describing the FIB-view method in more detail is still in preparation. The step-by-step protocol was accepted for publication in Bio-Protocol but cannot yet be cited. We stated this as placeholders for the citations in the text which will be added in the version of record of this manuscript.
Here, we wanted to give the reader an outline of the concepts which are required to image plant tissues with cryo-ET. Therefore, we omitted the full description of chemicals and supplies which will be listed in the step-by-step protocol.
(3) A number of figure legends lack the actual specimen in the figure. Please add.
We thank the reviewer for this comment and added specimen names and tissue type to the caption of Figures 2-4 and the figure supplements.
(4) There are a few mixed orientations and missing figure panel labeling. Sometimes, in the same figure, the reader must compare horizontal and vertical sequences in the same panel. This makes it more difficult to figure out, especially when many panels are unlabeled (one example, Extended Data Figure 6). Every panel in the figure should have a letter. Consider using C1, C2, C3, C4 if they are a related series.
We agree that some of the figures are difficult to understand due to different directions of image sequences. Instead of labeling every image of an image sequence with a unique letter, we decided to frame images which belong to an image sequence. These adjustments were consistently implemented for all main figures, supplementary figures and figures in the supplementary material.
(5) Line 22. Insert "in situ" cryo-ET since cryo-FIB is part of the workflow.
(6) Line 31. Remove redundant second "tissue" in the same sentence.
(7) Line 31-32. Specify for At "seed embryos and Lb "salt glands".
The suggested changes in (5)-(7) were implemented.
(8) Line 53; add. air spaces in leaves. Why do you suggest vacuoles often contain solute "depleted" vacuoles? See: https://doi.org/10.1016/S0065-2296(08)60152-4. It's variable for sure, but I see that as an exception rather than as written, it seems to imply this is more likely than not, which I disagree with. Please modify. The primary driver for poor freezing is the very large vacuole itself and air spaces (at least in leaves).
We changed the first two sentences starting from line 51: The most critical step in cryo-ET is the vitrification. For plant tissues, this process is complicated by the cell size (diameter typically 10 – 100 µm) which is larger than for most yeast, algae or mammalian cells, often contain water-filled vacuoles occupying up to 90 % of their cellular volume and, in the case of leaves, the tissue comprises air-filled spaces.
(9) Lines 66-68. This oversimplification should be modified. Many freeze-substitution protocols include a fixative (typically osmium tetroxide) and 1-5% water in solvent, so technically not dehydrated (at least until resin steps).
This line was changed to “samples are metal-impregnated and dehydrated upon embedding in a resin”.
(10) Lines 66-69. I suggest that more recent papers that actually include resin electron-tomography (and cryo-ET) in plants with HPF data should be cited: https://doi.org/10.1093/jmicro/dfy133. There are plenty of organellar/sub-organellar studies of merit with FS-HPF (albeit I agree, not appropriate for molecular structure). The value and importance of your cryo-ET work are good, but it is very difficult and has limited accessibility. The merits of an in situ cryo-ET of plants paper will have more credibility to plant scientists who do the prior when properly framed. Please adjust accordingly.
(12) I would have at least expected a brief review (yes, it's very limited) of plant-based cryo-EM studies for readers. There is not a lot, but it would add value and demonstrate the work of others who did cryo-ET in photosynthetic organisms that preceded this effort.
Following the suggestions in (10) and (12), we elaborated on certain points in the introduction.
We briefly review pioneering cryo-ET work on plant and algal system in one sentence added in line 64:
“Previous cryo-ET work focused on Protoplasts [24], i.e. isolated cells without cell wall, isolated organelles [25], cyanobacteria [26], red algae [27] and single celled green algae [28,29].” Citing:
(24) Preparing Arabidopsis thaliana root protoplasts for cryo electron tomography., Sanchez Carrillo et al, 2023
(25) Molecular architecture of thylakoid membranes within intact spinach chloroplasts, Wietrzynski et al, 2025
(26) Structure and Function of a Bacterial Gap Junction Analog, Weiss et al, 2019
(27) In situ cryo-ET structure of phycobilisome–photosystem II supercomplex from red alga, Li et al, 2021
(28) Charting the native architecture of Chlamydomonas thylakoid membranes with single-molecule precision, Wietrzynski et al, 2020
(29) Towards community-driven visual proteomics with large-scale cryo-electron tomography of Chlamydomonas reinhardtii, Kelley et al, 2024
To highlight the importance HPF-FS for EM of plant tissues, we now cite the suggested review and added a sentence in line 68 referencing two more reviews for the interested reader :
“Currently, this is the most accessible and reliable approach to image plant tissues by electron microscopy [7,31].”
(7) Electron tomography of plant organelles and the outlook for correlative microscopic approaches, Wang et al, 2019
(31) Electron microscopy for imaging organelles in plants and algae, Weiner et al, 2022
(11) Lines 74-75. While I understand the temptation to use "one-dimensional" and "two-dimensional", the chains are not straight lines, and certainly they are 3D structures. I suggest chains and sheets is sufficient here.
The terms "one-dimensional" and "two-dimensional" were removed.
(13) The Intro is pretty minimalist and ends rather abruptly, only mentioning one plant species used in the study. While it was the primary system used, please include the other plant targets and rationale.... Indeed, the title "Making plant tissue accessible for cryo-electron tomography" felt a bit misleading. I was expecting cells from non-embryonic roots, stem, or leaf tissue,e which would be the dominant targets for most plant scientists. Yes, A. thaliana embryos and salt glands from L. bicolor are useful plant targets, but certainly don't represent typical types of structures and potential for biotic and abiotic stress and developmental studies of multicellular plants. They certainly would be low-hanging fruit, but limited use cases for the workflow.
(14) Please consider a title more appropriate based on the realities/constraints and limitations of what you were able to demonstrate in broadly relevant plant tissues. For example, "Making select plant tissue accessible for cryo-electron tomography" would more accurately reflect the scope of the achieved project, at least what was included in the manuscript.
Regarding (13) and (14), we are aware that most research is done on root tips or leaf epidermis. We had no success with leaves. The air-filled space in the spongy mesophyll is very problematic for HPF and we did not manage to dissect the tissue to fit into HPF carriers without severely damaging the cells. We can imagine that other labs with access to cryo-ET setups similar to ours but more expertise in high-pressure freezing plant tissues may still be successful. On the other hand, we have initial results, indicating that Arabidopsis thaliana root tips can be vitrified using the described methods. Furthermore, we discuss the limitations of the method extensively. Therefore, we think that the title is still appropriate.
We specified the names of the tested tissues in line 78 of the introduction.
(15) Lines 91 and 92. I am a bit surprised that such high concentrations of sucrose (and glycerol) were used as cryo-protectants. This certainly was a hypertonic solution and would have caused plasmolysis and cell collapse (not dehydration as characterized). Good results (or at least freezing quality improvement) in cells equilibrated in much lower concentrations of sucrose (closer to those used in proline). I'm not saying you need to address it in the manuscript, but I am not surprised. Those would not have worked well as tested.
We thank the reviewer for this advice. It may be worth screening more cryo-protectants at various concentrations for plunge freezing. We still think that most plant cells will not vitrify with this method.
(16) The first introduction of cryo "FLM" (Leica solution) was line 62, and "int-FLM" (Delmic solution) without reference to cryo was line 111. Thermo has an integrated system referred to as iFLM. Please consider that it may cause confusion to a novice, and they should probably be differentiated together at first introduction. I assume the use of int-FLM is meant to distinguish from Thermo iFLM.
In order to clarify this and to name the different cryo-FLM modalities already in the introduction, we added a sentence in line 62:
“For correlative light and electron microscopy (CLEM) approach it is possible to use FLMs equipped with cryo-compatible stages (e.g. Leica SP8/Stellaris or Linkam CMS196 stage) or FLMs integrated into the FIB chamber (int-FLM, e.g. Delmic METEOR or Thermo Fisher Scientific iFLM).”
(17) Line 124-128. Figure 1 and the corresponding text. Sure, large/severe crystals in this low-resolution TEM image are visible, but this is insufficient to confirm that much smaller ice crystals (e.g., 5-10nm) that would not be visible from just this data. Please note that other evidence to confirm vitrification would require a closer inspection.
We agree. That is an aspect we do not address. The tilt-series recorded on our HPF samples do not show the large patterns introduced by crystalline ice. Still, the best evidence for full vitrification would be a diffraction pattern without the characteristic diffraction spots of crystalline ice. Unfortunately, we did not record diffraction patterns. And because the pixel size of our raw tilt images is too large, there are no diffraction spots in the power spectra of tilt images even when they clearly contain crystalline ice. After cryo-ET imaging, we discarded the samples. Therefore, we cannot record diffraction patterns for the lamellae shown in this work.
(18) Line 340. I think most cell types have sufficient contrast with certain platforms, such as Hydra Helios5 pFIB or ZEISS CrossBeam. This is likely a limitation of the platform used, Scios, Aquilos, and Aquilos 2 columns and detectors. In the alternative platforms, other cellular features can definitely be resolved and contrasted that are non-membranous. This is why I expect this valuable approach would have benefited this particular work and reduced the dependency and resolution challenges for cryo-FLM, as it was essentially not available/utilized in this workflow. This should be noted accordingly in discussion or elsewhere, as it is a limitation of the platforms used, not the potential for this kind of work in general, as implied.
We present SEM imaging and integrated fluorescence light microscopy as possibilities for targeting. In line 340 where we discuss axial targeting. The point we want to make is that SEM and int-FLM imaging are complementary methods with different limitations. Irrespective of the SEM system, for example liquid-liquid phase-separated compartments may not generate high enough contrast in SEM images but can potentially be labelled with fluorophores and therefore reliably targeted with int-FLMs. During our work for this project we milled lamellae on protonema cell files that were oriented parallel to the surface of the trenches and no cellular material was exposed at the surface of the trench. In this case, SEM block face imaging could not be used for axial targeting and we had to rely on the int-FLM.
(19) Line 621-622 and elsewhere. The fluorescence in the images from the Leica SP8 is of chlorophyll, which would dominate with an emission filter of 500-750nm. Chlorophyll is definitely not "green autofluorescence". It emits above 650nm quite strongly. However, in lines 644-645, using the Delmic platform, the text simply states an "emission wavelength = 525nm". First, while that may be the center point of this filter or the name in the software, the manuscript should include the full spectral bandwidth of this and any other filters reported in that platform. Based on the specific exclusion of chloroplast signals in the images (dark ovoid voids), I fully expect it blocks the chlorophyll signal. Thus, interpretability and relationship would simply show locations of cells, but not exactly match if using cryo-FLM and int-FLM at the same cell location in this use case. I interpret the green fluorescence signal in int-FLM to be most likely vacuole autofluorescence rather than general cytoplasmic autofluorescence. The readers should be informed of the importance of matching emission filters if this is critical for targeting their work and matching an integrated and non-integrated FLM image.
We thank the reviewer for making us aware of this incomplete description. We included the spectral band widths of the emission filters and replaced the term “green-autofluorescence” with “cellular autofluorescence” as a more general term. Furthermore, we added a sentence to the caption of Figure 2 and Figure 2 - figure supplement 1 (previously Extended Data Fig 3):
“Note that the excitation wavelengths and emission filters used for FLM imaging are different from those used for int-FLM imaging. Therefore, the fluorescence signals appear different. Ideally, for most reliable targeting, excitation and emission should be the same for all FLM imaging modalities.”
And to methods section “Lateral targeting and trench milling” the following sentence:
“If both FLM and int-FLM imaging are employed for targeting, the used excitation wavelengths and emission filters should ideally be the same for both imaging modalities. This assures most reliable targeting. That is not the case here. Therefore, the fluorescence signals of FLM and int-FLM images (Figure 2, Figure 2 - figure supplement 1) appear different.”
(20) Please review the paper more closely, a number of typos and grammatical errors were noted.. such as but not limited to:
- Line 319 swift
- Line 725 patterns
- Line 1002 autofluorescence
- Line 1064 Luliia Lermak.
We thank the reviewer for carefully reading our manuscript and uncovering these mistakes. The name “Iuliia Iermak”, however, both starting with capital “i” is spelled correctly. This is the official transliteration of Ukrainian names to Latin alphabet.
Reviewer #2 (Recommendations for the authors):
Minor comments:
(1) The authors tested several cryoprotectants for the plunge freezing method, which were ineffective for thick samples. For high-pressure freezing, they used either 20% (m/v) Ficoll 400 or 40% (m/v) Ficoll 400. Did they test other cryoprotectants, and does the high concentration of Ficoll 400 affect the cells?
We thank the reviewer for the overall positive assessment of our work. In fact, we only used 20% (m/V) Ficoll 400 for high-pressure freezing. The 40% (m/v) Ficoll 400 solution was our stock solution and mixed 1:1 with growth medium. For HPF, we only tested dextrans and in contrast to Ficoll 400 we often observed plasmolysis. This indicates that dextrans put P. patens under osmotic pressure. We did not test, however, what impact a high concentration of Ficoll 400 has on growth, development and physiology of P. Patens or the other tested samples. But we suspect the impact to be minimal because tissue samples were immersed in a Ficoll-containing buffer only for 10-60 s right before freezing.
(2) Page 15, line 277. There is no Figure 6.
(3) Page 27, line 550. Switched off?
(4) Page 50, line 992, 4 ℃?
All typos in (2)-(4) were corrected.
Reviewer #3 (Recommendations for the authors):
(1) I appreciate that the authors highlight some of the drawbacks of their methods in the discussion and mention potential improvements that need to be accomplished to make cryo-TEM a more standard method for plant cell biology. For tissues that are more deeply embedded in the plant body (practically all sub-epidermal layers in higher plants that are not embryonic or meristematic), there is no potential method on the horizon that would allow vitrification. This means that some 99% of the plant body can currently not be vitrified, and this will likely be the major hurdle in the coming years. I find the text line 326 "can still be a major challenge for some samples" an understatement. Most samples will show vitrification problems.
This fact does not reduce the importance of their current study, but a sentence on this would inform non-experts that cryo- and classical TEM will have to run side by side for quite some time. Clarification may help, as reviewers constantly ask for the application of cryo-TEM to investigate samples that currently cannot be vitrified.
We agree with the reviewer that the mentioned sentence is an understatement and changed it into “is still a mayor challenge.” Furthermore, we added a new sentence at the end of the paragraph starting in line 335 “Currently, most fully intact tissues remain only accessible by conventional electron microscopy employing chemical fixation, if the dissection to fit the sample into the small volume of HPF carriers is omitted.” to emphasize that conventional TEM is currently indispensable for many if not most projects.
(2) As the authors correctly mention, the waffle method leads to injury of neighboring cells. Cell-walled plant cells often withstand pressures of 5-10 MPa and more. Squeezing to make them burst will likely lead to a significant pressure wave running through the tissue with potential artifact formation. I was wondering if the authors considered using young cultures where the protonema are just a few cells long and may completely fit into a grid hole?
We specifically needed two-week-old protonemata for a project we are working on with collaborators. Otherwise, this is a great suggestion. Using tissue for HPF that is small enough to fit into the cavities formed by grid bars and support film is the best way to avoid tissue damage.
(3) It would be helpful if the authors would briefly explain why the cryo pictures show open-ended membranes, e.g., in Figure 3, ER in e, Golgi in d, or relatively sharp corners (cristae in e). Are these reconstruction artifacts or potential preparation artifacts (e.g., by the described bending of lamellae or similar due to milling)?
This is an important point to raise. The open-ended Golgi and ER membranes are caused by the missing wedge which is the most prominent but unavoidable imaging artifact in cryo-ET. To clarify this for readers, we added a sentence in line 198:
“The seemingly discontinuous membranes in Fig. 3d, e are caused by the missing wedge, a known imaging artifact in cryo-ET.”. Citing the paper “On geometric artifacts in cryo-electron tomography” by Turoňová et al., 2016.
Regarding the sharp membrane corners of cristae, that is hard to say for certain. It is not the missing wedge in this case. For all our P. Patens preparations, cristae always looked like that which is different from cristae in other organisms we investigated with cryo-ET. It could be a characteristic feature of cristae in P. patens. But it could also be an artifact of the preparation which we can never fully exclude. It is not ion beam damage, however, because it is confined to a few tens of nanometers from the surface of the lamella and cristae have this appearance throughout the whole thickness of the lamella (150 to 350 nm).
(4) Please explain the nature of the dark spots in e.g., Figure 5e.
We marked this ice contamination introduced during transfer between microscopes as we did it in Figure 1 and added the description to the figure caption.
(5) Line 105 "recording the green cellular autofluorescence". The autofluorescence of chlorophyll is actually red. The software seems to render it green. I would suggest deleting "green".
We followed the suggestion and removed “green” on multiple occasions in the methods section.
eLife Assessment
This valuable study examines the macroevolutionary patterns of male-female divergence driven by conflict over mating rate in a lineage of water striders called Pseudovelia, found in China. The authors used a convincing combination of phylogenetic reconstruction, morphological diversification and molecular evolution techniques to assess whether a correlation exists between the divergence of sexually antagonistic traits and species diversification. The study finds widespread conflict across the phylogeny of the clade and presents compelling evidence for the role of incomplete lineage sorting (ILS), introgression, and differential evolutionary rates of male and female antagonistic traits. Overall, the study offers a valuable contribution to our understanding of the link between phylogenetic patterns of ILS and introgression, and male-female phenotypic divergence shaped by conflict over mating interactions.
Reviewer #1 (Public review):
Summary:
This work explores the relationship between sexual conflict and species diversification in a clade of small water striders. They use multiple phylogenetic methods to establish a potential phylogenetic tree and explore incomplete lineage sorting and introgression. They then compare their calibrated species tree with phenotypic measures of many species to try to infer the relationship between species diversity and sexual conflict. They show evidence for both ILS and introgression within the broader clade. They also find evidence that male leg diversity is associated with speciation, potentially due to sexual conflict, and that male genital grasping structures as well as female anti-grasping traits have less evidence for an association with speciation. This paper seems like a generally rigorous and interesting addition to the literature on sexual conflict and speciation, and I believe the conclusions are well supported with only a few minor concerns with methodology.
Strengths:
This paper verifies results using multiple methodologies to ensure robustness to changes in software uses and presents convincing evidence for the hypotheses tested.
Weaknesses:
(1) I think the lack of empirical functional evidence on these traits is still a weakness, despite the authors adding caveats within the text (lines 622-629). I am unsure if these species are readily accessible or reared in the lab, but to do some sort of trial where the male traits are ablated in some way to verify that they are necessary, and also that they incur a fitness loss on females is critical for the interpretations of this paper.
(2) Uncertainty within the phylogeny (Figure 1) also appears to be quite drastic, although I am not an expert in phylogenetic reconstruction. Looking at the uncertainty around each branch point makes drawing any strong relationship in the order of evolutionary changes less convincing, although with revisions the authors now provide appropriate caveats for their inference in some areas of the manuscript.
(3) Lines 463-469: I find it dubious to say 'no significant differences' and then present a p-value of 0.052 and just a few paragraphs later present a p = 0.0178 as significant. These p-values are similar and not necessarily meaningful here. It appears you identified a very weak correlation between traits, that happen to fall on either side of an arbitrary cut-off of 0.05. Whether such a weak relationship with such low confidence is biologically meaningful is more important, which I assume it is not regardless of the p-value. I'd suggest adding confidence intervals rather than p-values.
(4) Lines 561-577: I'm not certain why throughout the manuscript the authors somewhat confidently assert that male traits evolved first, and despite the increased diversity relatively in male traits, could female resistance traits not have evolved first due to the documented costs of superfluous matings, and then a novel selection pressure resulted in a radiation of male coercion traits?
Reviewer #2 (Public review):
Summary:
This study uses comparative phylogenetic methods to examine the evolution of male and female antagonistic traits in a group of small water striders. Water striders have long been a model system for studies into the sexual conflict that arises through anisogamy, the differential investment in gametes by males and females. Here, the authors aimed to reveal the evolutionary rates and trajectories of male grasping and female anti-grasping traits across species of the minute water-strider subgenus Pseudovelia. This was done by combining multiple genomic techniques to generate phylogenies to test trait evolution, quantify rates of evolution, and identify instances of incomplete lineage sorting (a result of rapid diversification) and introgression (the result of interbreeding between genetically different populations/species).
Strengths:
The strengths of this study lie in its comparative macroveolutionary framework, in particular the generation of multiple phylogenetic hypotheses using different methods (mitochondrial genes, USCOs, and SNPs) and contrasting these to glean insights into evolutionary patterns across species. Additionally, the authors compare not only the evolutionary rates of male vs female antagonistic traits and how these may be implicated in diversification, but also address variation between different male antagonistic traits. This reminds us that the overall phenotype of an organism represents an amalgam of characters, whose trajectories are driven by diverse evolutionary pressures and constraints.
Weaknesses:
The main weakness of the study is the lack of underlying experimental evidence to explicitly show the grasping and anti-grasping functions of the various male and female traits, relying instead on studies of similar structures in more distantly related taxa. Without explicitly showing the functional mechanisms and reproductive costs of these traits, the resulting interpretations are wholly speculative. However, I would argue that such macroevolutionary studies are still very useful and provide the groundwork for future studies untangling the relative roles of sexual conflict, cryptic female choice, sperm competition and reproductive interference in trait evolution and ultimately in speciation.
Author response:
The following is the authors’ response to the original reviews.
Public Reviews:
Reviewer #1 (Public review):
Summary:
This work explores the relationship between sexual conflict and species diversification in a clade of small water striders. They use multiple phylogenetic methods to establish a potential phylogenetic tree and explore incomplete lineage sorting and introgression. They then compare their calibrated species tree with phenotypic measures of many species to try to infer the relationship between species diversity and sexual conflict. They show evidence for both ILS and introgression within the broader clade. They also find evidence that male leg diversity is associated with speciation, potentially due to sexual conflict, and that male genital grasping structures as well as female anti-grasping traits have less evidence for an association with speciation. This paper seems like a generally rigorous and interesting addition to the literature on sexual conflict and speciation, and I believe the conclusions are well supported with only a few minor concerns with methodology.
Strengths:
This paper verifies results using multiple methodologies to ensure robustness to changes in software use, and presents convincing evidence for the hypotheses tested.
We thank the reviewer for their valuable and constructive suggestions.
Weaknesses:
(1) Lines 299-304: For the categorization of sexual conflict traits, were categories chosen by a blinded participant or by a researcher who knew the species they were observing? If any of these traits are subtle, this could add bias to the categorisation of traits.
The categorization of morphological traits was performed by researchers who are familiar with the taxonomy and morphology of this taxa. We acknowledge that this may introduce some degree of subjectivity, and raw specimen photographs are available from the corresponding authors upon request.
(2) Lines 325-327: It is unclear to me if you control for phylogenetic relationships in this model. Diversification rate could be lineage-specific regardless of sexual conflict, so it seems like potentially including phylogenetic relationships in a model would control for that. And similarly, lines 331-333, I may be mistaken, but it sounds like you are using lm() to model a binary outcome (presence/absence), but lm() doesn't do logistic regression as far as I know, so it may be better to model this as a logistic regression (controlled for phylogeny) using glm().
In our original analysis, we treated the PCAmix values derived from multiple discrete traits as continuous variables and used the lm () function to test the correlation between these values and net diversification fates (lines 352-357). We agree that a phylogenetic comparative approach would be more appropriate. We plan to re-analyze the data using either glm () or phylogenetic generalized least squares (PGLS) to properly account for phylogenetic relationships. In lines 331-333, we would clarify that this part refers to the HiSSE analysis based on discrete traits, which is independent of the linear regression analysis mentioned above. Nevertheless, we will ensure that both analyses are clearly distinguished and properly described in the revised Methods section. We will update the relevant sections accordingly.
(3) There are a few areas where the reporting of inference or statistics could be improved, and throughout the manuscript there are often mentions of 'significant' without any measure of uncertainty such as confidence intervals (example on lines 449-451). In lines 385-390, because the intervals are so wide, I would suggest saying these clades diverged between X-mya and Y-mya, rather than giving an actual estimate. It seems to me like giving a specific date is a bit overconfident when the authors have such wide intervals. On line 436, I think the authors should report confidence intervals for their 5mya estimate. In lines 455-456, what is this correlation and what are the authors' uncertainties around the estimate?
We will carefully re-examine the entire manuscript and add appropriate measures of uncertainty.
(4) Lines 549-545: When the two possible explanations for this result are reported, it seems like the authors are saying that because they can't think of how to test this possibility, the other possibility is more likely. But I don't think that is an argument against the first possibility.
We agree with the reviewer that two hypotheses are not mutually exclusive. In the revised manuscript, we will rephrase this paragraph to present both possibilities more neutrally.
(5) Lines 591-602: This paragraph confuses me. I thought that much of the introduction and Figure 1 seemed to be putting forth that the terminal segment complexity was a conflict structure that we were interested in. However, here it is stated that it does not strongly influence mating success, so is it necessarily a conflict trait? Is it demonstrated that the leg structures influence mating success?
We have observed mating behaviors in this group and found that ASE function occurs after the male has successfully grasped the female using its legs. However, we acknowledge that our study did not include direct experiments to quantitatively test the effect of ASE complexity on mating success. Therefore, our discussion in this section is indeed somewhat speculative.
Reviewer #2 (Public review):
Summary:
This study uses comparative phylogenetic methods to examine the evolution of male and female antagonistic traits in a group of small water striders. Water striders have long been a model system for studies into the sexual conflict that arises through anisogamy, the differential investment in gametes by males and females. Here, the authors aimed to reveal the evolutionary rates and trajectories of male grasping and female anti-grasping traits across species of the minute water-strider subgenus Pseudovelia. This was done by combining multiple genomic techniques to generate phylogenies to test trait evolution, quantify rates of evolution, and identify instances of incomplete lineage sorting (a result of rapid diversification) and introgression (the result of interbreeding between genetically different populations/species).
Strengths:
The strengths of this study lie in its comparative macroevolutionary framework, in particular the generation of multiple phylogenetic hypotheses using different methods (mitochondrial genes, USCOs, and SNPs), and contrasting these to glean insights into evolutionary patterns across species.
Weaknesses:
The main weakness of the study is the lack of underlying experimental evidence to explicitly show the grasping and anti-grasping functions of the various male and female traits, relying instead on studies of similar structures in more distantly related taxa. Without explicitly showing the functional mechanisms and reproductive costs of these traits, the resulting interpretations are wholly speculative. However, I would argue that such macroevolutionary studies are still very useful, and provide the groundwork for future studies untangling the relative roles of sexual conflict, cryptic female choice, sperm competition and reproductive interference in trait evolution and ultimately in speciation.
We thank the reviewer for their encouraging and constructive comments. We agree that our study lacks direct experimental evidence to explicitly demonstrate the grasping and anti-grasping functions of the various male and female traits in Pseudovelia, and that our interpretations currently rely on comparisons with functional studies in more distantly related taxa. In the revised manuscript, we will explicitly state this limitation and refer to these traits as “putative” grasping or anti-grasping traits throughout the text where appropriate.
Recommendations for the authors:
Reviewing Editor Comments:
Two reviewers and I, all experts in the study of sexual conflict, have assessed the work presented in this manuscript. We find the study well-executed and compelling, but we believe it would benefit from greater rigor in statistical reporting, clearer presentation, and experimental validation of functional traits. Addressing these concerns will strengthen its contributions to sexual conflict and speciation research.
Both reviewers acknowledge the study's rigorous and innovative approach to exploring the relationship between sexual conflict, morphological diversification, and speciation in water striders (Gerromorpha). The paper leverages multiple phylogenetic methods (mitochondrial genes, UCEs, SNPs) to construct a robust species tree while also investigating incomplete lineage sorting (ILS) and introgression. The findings suggest a strong association between male grasping traits and speciation, though the evidence for female anti-grasping traits is less conclusive.
The reviewers provided valuable suggestions for the authors to improve the manuscript. The details are clearly listed by the reviewers, and I believe they provide ample opportunity for the authors to refine their work. These suggestions include:
- Improving the categorization of traits.
- Using logistic regression for binary outcomes.
- Ensuring that statistics are properly supported and that uncertainty is stated where appropriate.
One of the reviewers also rightly points out that the traits have not been functionally tested, and their categorization as sexually antagonistic traits remains uncertain. The authors may want to acknowledge this important aspect and perhaps label those with uncertainty as "putative"
Other recommendations concern clarity and the definitions of acronyms and abbreviations, some of which can be confusing.
Thank you for the comment and for coordinating the review process. We have carefully read the valuable suggestions provided by both reviewers and have addressed each point in a detailed response below. In the revised manuscript, we have added new PGLS regression analyses, strengthened the statistical reporting, and described traits whose sexually antagonistic function has not been experimentally validated as “putative” throughout the text.
Reviewer #1 (Recommendations for the authors):
(1) Line 75 - phrasing confusing, do you mean 'maybe' instead of 'may'?
Thank you for the comment. We agree that the original phrasing was confusing because “may exhibiting” is incorrect. We have revised the sentence to “…with one sex may exhibit delayed or mosaic patterns…”.
(2) Lines 133-140 - This sentence doesn't make sense to me, and it asks the reader to refer to the results, but I feel that if I need to jump forward to the results to understand the summary in the introduction, it is counterproductive for summarizing what was done and what was found.
Thank you for the comment. We have revised it.
(3) Line 143 - Maybe still give a brief summary and then refer to the figure?
Thank you for the comment. We have considered adding a brief summary before referring to Figure 2. However, due to our analytical steps are described in detail in the Materials & Methods section, we prefer to keep the transition concise and use Figure 2 as a direct visual summary of the workflow, without repeating information that is covered elsewhere in the text.
(4) Lines 201/208 - Why did the number of individuals decrease from 201 to 158
Thank you for the comment. All the 201 individuals were used for mitochondrial dataset. However, the full SNP matrix was extremely large, including all individuals would have imposed prohibitively high computational costs. We retained only one or two high-coverage individuals per population. We have now clarified this in the revised Materials & Methods section to avoid confusion.
(5) Line 250 - SC as an initialism for South China is very confusing in a paper that talks about sexual conflict.
Thank you for the comment. We have changed the initialism “SC” into “South China” in our manuscript.
(6) Lines 281-289 - I think you may be spelling the name of some software wrong.
Thank you for the comment. We have revised it.
(7) Lines 374, 386 - I'm unclear why you refer to Figure 1a here.
Thank you for the comment. We have revised it.
(8) I'm having a hard time following all of the initialisms used, and I think it may be beneficial to spell out some of the lesser-used ones
Thank you for the comment. We have revised it.
(9) Are the sexes modelled separately?
Thank you for your comment. Male and female sexual traits were modelled separately in our analysis.
Reviewer #2 (Recommendations for the authors):
Wow, this is an impressive piece of work. Congratulations! I confess my area of expertise is not in genomics, so I cannot provide much useful commentary on your methodology. Instead, I can give some commentary on sexual conflict, as well as some minor edits/ suggestions.
(1) L32: I don't think the term "semi-aquatic bug" is as widely recognised in the evolutionary biology community. I would rephrase as "The Gerromorpha (semi-aquatic bugs), which inhabit..." or "Semi-aquatic bugs (e.g. water striders)...".
Thank you for the comment. We have revised it.
(2) L33: delete "has".
Thank you for the comment. We have revised it.
(3) L91: change "bug" to "bugs".
Thank you for the comment. We have revised it.
(4) L100: You refer to the subgenus "Pseudovelia" - what is the genus? I assume also Pseudovelia, but I think it ought to be mentioned.
Thank you for the comment. We have mentioned it in L101: “a lineage of small water striders belonging to the genus Pseudovelia, subfamily Microveliinae of the family Veliidae”.
(5) L101: Change "compising" to "comprises".
Thank you for the comment. We have revised it.
(6) L116: You note ASE modifications are "widely considered adaptations to improve grasping efficiency". Is this published anywhere, and has this been demonstrated? If so, provide citations. I don't think it has been demonstrated in Pseudovelia.
Thank you for the comment. The function to improve grasping efficiency has not been demonstrated in Pseudovelia. We have revised it.
(7) L117: You say "similar to those observed in other Microveliinae taxa (Maroni et al 2023)." If this is the only evidence you have of the function of the ASE in Pseudovelia, then I think you should expand either here or in the discussion to explicitly describe its role in grasping and opening the proctiger (if that's what you think is happening) and that it comes from that study. Do Pseudovelia have enclosed genitalia as well? If so, you should mention that and perhaps also reference the work of Chang Han and colleagues, who first demonstrated concealed genitalia in Gerrids.
Thank you for the comment. We have revised the sentence to explicitly state that in other Veliidae, male ASE modifications function to open the female proctiger, and we inferred a similar function in Pseudovelia. We also confirm that female Pseudovelia have concealed genitalia, and we have now included a citation to Han et al. (2009) on this point.
(8) L118: You talk about additional male grasping traits - if these haven't been tested you ought to call them "putative" or "likely" grasping traits. It might also be worthwhile to at some point briefly summarise how all limbs and even parts of the abdomen in Gerrids have been shown to function in grasping females during mating. Likewise, I don't believe any of the female anti-grasping features in Pseudovelia (or any other microveliid) have been experimentally shown, such as the elongated tergites and gonocoxal setae. To cover this, you ought to refer to the comparable traits in Gerridae where these roles have been explicitly tested.
Thank you for the comment. We have revised absolute statements with more cautious wording, and added references to comparable female traits in Gerridae.
(9) L138: You say here that ASE modifications are associated with relatively low-intensity conflict. Why do you hypothesize this? I'm not sure how you could a priori say these are the result of low-intensity conflict. Later when you discuss this in the discussion, it might be worth mentioning/expanding on alternative interpretations.
Thank you for the comment. We have revised this hypothesis. We now propose that the absence of highly modified leg structures may have resulted in lower conflict intensity, rather than ASE modifications being associated with low-intensity conflict.
(10) L603: This is what I have suspected - that the further diversification of these traits, which may have initially arisen through conflict, may be driven by reproductive interference rather than by SC.
Thank you for the comment. We agree that the later diversification of ASE may be driven primarily by prezygotic isolation rather than by sexual conflict. In the revised manuscript, we have restructured this section to explicitly separate two sequential process: the initial origin of ASE complexity through sexual conflict, and the subsequent diversification potentially driven by prezygotic isolation.
(11) As a general comment, I think somewhere in the conclusions you should suggest that future studies should explicitly test some of the assumptions made herein - e.g. the functions of the traits, and the potential role of interspecies interactions in driving the diversification of traits.
Thank you for the comment. We have added a paragraph in the Discussion section outlining future works.
(12) L893: Figure 1. I think in the legend it might be good to restate what the clade names are, i.e. EA, MAL, etc.
Thank you for the comment. We have revised it.
(13) L903: Figure 2: "Traits" is misspelt in the bottom left panel.
Thank you for the comment. We have revised it.
(14) L913: Figure 3: Maybe add a line saying coloured bars represent the clades, as identified in Figure 1.
Thank you for the comment. We have revised it.
eLife Assessment
Through a genome-wide screen for functional alternative transcription start sites (TSS) in Arabidopsis, the authors provide evidence for widespread transcription of potential microproteins from previously annotated protein-coding genes. Functional analysis of AtHB2-miP, derived from the C-terminal region of transcription factor AtHB2 and predicted to form non-productive dimers with ATHB2, suggested that this microprotein could affect AtHB2 functions in shade responses, root growth, and iron homeostasis. The work is valuable as a case study of how new microproteins could act to modulate gene regulation in response to environmental change, and the strength of evidence presented is solid. Overall genetic evidence largely supports this model thereby identifying a novel negative feedback loop operating during shade-regulated growth. This paper also suggests a new unsuspected link between ATHB2 function and iron uptake.
Reviewer #2 (Public review):
The authors have addressed some of my concerns and made more transgenic lines to verify the pattern and function of ATHB2-miP produced from the alternative TSS. However, I'm still not convinced by the new data and have questions about their interpretations.
(1) I find it hard to understand the data shown in Figure 5.
a. Figure 5B: It's reasonable that the peptide I was detected exclusively in ATHB2-WT because it was at a position before the alternative TSS. It's hard to evaluate peptide II because it could be included in ATHB2miP depending on the exact position; the authors should clearly label it and clarify. However, I had a hard time understanding why peptides III and IV were detected only in ATHB2-WT and peptide V only in ATHB2-alt-all three peptide regions should be included in both ATHB2-WT and ATHB2-alt proteins. The silent mutation that disrupted the alternative TSS should not change the full-length ATHB2 protein (Figure 5C)! Please share your insights on this strange observation.
b. Figure 5C: Please indicate which ATHB2-WT and ATHB2-alt lines were used in this assay. Please provide a marker for the anti-FLAG immunoblot and indicate protein band sizes in both the Coomassie staining and the anti-FLAG immunoblot. It's unclear to me whether 2 and 3 are two bands-they are too close on the immunoblot to be viewed as two separate bands. It seems to me that both bands 1 and 2 are larger in ATHB2-alt than in ATHB2-WT-is this true, or is it due to a tilted image?
c. Figure 5D: I'm wondering whether both ATHB2-alt lines showed constitutively longer hypocotyl length was caused by higher expression levels of ATHB2 full-length proteins than in ATHB2-WT lines. The authors didn't compare the protein levels in ATHB2-WT and ATHB2-alt lines. Figure 5C was a pulldown assay, in which the total input of immunoprecipitated proteins was normalized, and thus could not tell us whether the ATHB2-alt line had a higher ATHB2 protein level than the ATHB2-WT line.
(2) Regarding my previous comment #4, I understand that the authors may want to study this in the future. However, since the exact position of the alternative TSS has been released in the manuscript, it's not a problem for readers to find the promoter sequences of ATHB2 and ATHB2miP. I suggest that the authors provide a little more analysis of these two promoters because it's natural for readers to ask about the mechanism by which both promoters drive expression specifically in the SAM and hypocotyl. Do they share cis-elements such as WUS-binding sites, ARR-B elements, or AuxRE?
(3) Regarding my previous comment #7, the authors didn't answer part of my question. I wrote, "The authors claimed that ATHB2 acts as a growth repressor in deep shade but a growth promoter in the canopy and proximity shade (Lines 366-368). However, it appears that regardless of the shade conditions, most mutant and transgenic lines were not significantly different from WT (Figure 4C)." No explanations were provided. Based on Kunihiro et al., 2011 (DOI: 10.1093/pcp/pcr076), overexpressing ATHB2 full-length CDS led to constitutively long hypocotyls. If ATHB2-miP inhibits the function of the full-length ATHB2, one would expect that overexpressing ATHB2-miP might inhibit hypocotyl growth. Interestingly, the performance of 35S::miP was opposite to the prediction and showed different responses in the three WL conditions in Figure 4C-35S::miP was significantly longer in the deep-shade WL control (PAR 13 µmol m-2 s-1) but was the same as WT in the canopy and proximity shade WL controls (45 µmol m-2 s-1). Please provide a reasonable explanation. Besides, one issue remains-the authors only provided one transgenic line each for 35S::miP and t-athb2 35S::miP, and the miP protein levels were not shown in these lines.
Reviewer #3 (Public review):
The authors provide an extensively revised version of this manuscript in which they addressed many of the comments. I find their additional work and effort to address the reviewers' suggestions commendable. However, my first concern from the previous round of reviewing remains and I urge the authors to address it.
My concern relates to the shade treatments and the consistency with which they are described. Although the authors added details in the main text, the conditions remain insufficiently defined in the Materials and Methods, in some figure legends and the figures themselves (e.g., Fig. 4).
More importantly, the terms canopy shade and proximity shade are still used incorrectly (in figure 4), please make sure to check this throughout the ms.
In nature, canopy shade combines reduced PAR and reduced R:FR, whereas proximity shade primarily involves a reduction in R:FR without reduced PAR. Here, both treatments have the same PAR (45 μmol m⁻² s⁻¹), while the condition termed proximity shade actually has a lower R:FR (0.06) than the condition termed canopy shade (0.15) (see lines 405-407 of the text), while in natural conditions the R/FR ratio is lower under canopy shade than proximity shade. Thus, these designations are inconsistent with their accepted meaning in the field and are likely to confuse readers, particularly non-specialists.
I therefore recommend replacing them (in the figure itself, the legends and text) with terminology that reflects the actual light conditions used (PAR and R/FR), without giving it a name that is confusing. Alternatively, one could imagine that what the authors call canopy and proximity shade are two proximity shade conditions (because compared to WL of the same PAR) with increasing density of neighbouring plants (leading to a reduction of R/FR).
Whatever the authors decide to do, please change the name of the conditions corresponding to PAR 45 microE R/FR 0.06 and PAR 45 microE R/FR 0.15. As suggested above, the latter could be called neighbour shade (PAR 45 microE R/FR 0.15), which would be consistent with the literature and natural conditions (considering that it is compared to WL PAR 45 microE with a high R/FR). The former could then be "strong neighbour competition shade"? Because R/FR is further reduced to 0.06.
Author response:
The following is the authors’ response to the original reviews.
We would like to express our sincere gratitude for accepting our manuscript for public review. We are encouraged by the generally positive reception of our work and trust that the revisions we have made adequately address the concerns that were raised.
The revised manuscript reflects this work. The complementation experiment, in which a silent mutation at the ATHB2miP start codon produces a constitutive shade-response phenotype despite an unchanged full-length ATHB2 sequence, provides direct genetic evidence for endogenous ATHB2miP function. Immunoprecipitation mass spectrometry from the same complementation lines further demonstrates that the TTG-to-CTC substitution redirects translation to alternative initiation sites, altering the repertoire of ATHB2 proteoforms. Together with the FRET-FLIM, EMSA, and transcriptomics data, we believe the revised manuscript makes a compelling and internally consistent case for the proposed regulatory mechanism.
Reviewer #1 (Public review):
Summary:
The authors report evidence for a microprotein of AtHB2-miP. The authors came across HB2 in a screen for alternative transcription start sites in Arabidopsis in response to white light or a white light followed by a far-red light representative of shade. Out of 337 potential microproteins, authors selected AtHB2. At the beginning of the manuscript, it is investigated that an alternative transcription start site of HB2 gene can be used in response to far-red light. The resulting shorter protein form seems to interact with HB2 protein forms, altering the localization of HB2 in transient expression assays. The functionality of HB2-miP overexpression has been addressed in transgenic Arabidopsis lines using a 35S promoter. The responses and phenotypes were compared with either WT or various types of athb2 mutant lines with disrupted HB2 gene. Such mutants and the 35S promoter-driven AtHB2-miP line showed various types of phenotypes versus each other that can be classified as mild or none, e.g. small effects on root growth, iron homeostasis gene expression, and iron contents.
Strengths:
The authors performed an interesting screen for alternative transcription start sites which resulted in 337 candidates (Figure 1A). Principally, it can be interesting to find that plants may use alternative start sites for HB2 in response to shading light. The authors provide evidence that alternative transcription start sites of HB2 can be present and used in response to FR. The possibility that potentially resulting small protein may have effects under FR light, causing alteration of root growth and physiology, is an interesting idea.
We thank Reviewer 1 for this summary and for the constructive criticisms that helped us improve the manuscript considerably.
Weaknesses:
(1) The transient expression experiments are not conducted with much detail to demonstrate that HB2miP is produced and can interact with the regular protein. The localization of HB2 was found to be linked with condensates, but perhaps not in the presence of HB2miP. Clearly, the lack of quantitative and qualitative analysis hampers a clear assessment of this point.
We have addressed this concern at multiple levels. The revised manuscript includes quantified FRET-FLIM lifetime measurements from multiple nuclei, demonstrating a statistically significant reduction in eGFP-ATHB2 fluorescence lifetime when co-expressed with mCherry-ATHB2miP relative to the mCherry control (Fig. 2C, D). This reduction is diagnostic of direct protein-protein interaction and confirms physical interaction in planta. We have also added electrophoretic mobility shift assays (EMSA) using purified recombinant proteins (Fig. 2E). ATHB2 forms a clear retarded complex with a biotin-labeled ATHB2 binding site (CAATGATTG). Titrating increasing amounts of ATHB2miP progressively abolishes complex formation, directly demonstrating that ATHB2miP sequesters ATHB2 into a non-DNA-binding complex. The majority of nuclei expressing eGFP-ATHB2 show distinct photobody or speckle formation, while nuclei expressing eGFP-ATHB2miP show predominantly diffuse nuclear localization. Co-expression of both proteins results in disruption of the speckle pattern, indicating that heterodimer formation prevents ATHB2 from assembling into higher-order condensates.
(2) The authors unfortunately did not provide the data of the screen to demonstrate which concrete candidates may have microProteins and whether there is enrichment of certain functions. There is no supplemental table accompanying Figure 1A.
We apologize for the oversight. The full list of 377 microProtein candidates, including read counts per condition and functional annotation, is now provided in Supplementary Dataset 1.
(3) One of the major unclear points that is also not addressed in the discussion is that the function of miR is studied in overexpression plants (35S promoter::miP). The effects are only compared to wild type and various lines of HB2 knockouts or knockdowns, partly with fairly uncharacterized phenotypes. It can now not be clearly determined whether the miP effects are due to a regular function of miP or due to overexpression of it. A needed control would be a 35S::AtHB2 line, or better at least two different lines (only a single miP overexpression line investigated). Since it has not been assessed by deletion mutant analysis to determine which protein parts of miP are involved in the protein regulation, it cannot be ruled out that the observed miP effects are not naturally occurring but the result of ectopic expression of a protein. Clearly, the effect of miP would be ideally studied in an environment where the levels can be controlled and the resulting phenotypes and protein levels quantified.
This concern has been addressed by three complementary approaches. First, we included here two independent 35S::ATHB2miP lines, both showing elongated hypocotyls consistent with reduced ATHB2 activity, and two independent 35S::ATHB2 full-length lines, which show the opposite phenotype. This rules out T-DNA insertion artifacts and confirms that the direction of the overexpression effects is specific to the protein being overexpressed.
Author response image 1.
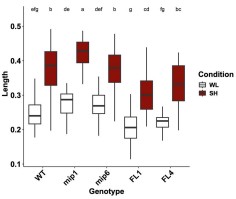
We acknowledge that both overexpression systems are subject to autoregulatory feedback: 35S::ATHB2miP plants sequester ATHB2, thereby relieving its autorepressive loop, which leads to increased endogenous ATHB2 transcription, as confirmed by our RNA-seq data showing elevated reads across ATHB2 exons 1 and 2 in these plants (Fig. S2). Conversely, excess ATHB2 protein in 35S::ATHB2 plants strengthens autorepression of the endogenous locus. We also recognize that overexpressed ATHB2miP can form ATHB2miP: ATHB2miP homodimers, reducing the fraction available to sequester ATHB2. These feedback loops complicate quantitative interpretation but do not alter the qualitative direction of the phenotypes: in both overexpression systems, the data are internally consistent with the proposed model.
Most decisively, the complementation experiment resolves all of these concerns. The ATHB2 WT and ATHB2 alt constructs are driven by the endogenous ATHB2 promoter, produce full-length ATHB2 protein with an identical amino acid sequence, and differ only in the capacity to initiate translation of ATHB2miP from the TTG near-cognate start codon. There is no exogenous overexpression, no homodimerization artifact, and no perturbation of the autoregulatory circuit beyond what ATHB2miP itself normally exerts. Plants carrying ATHB2 alt display constitutively enhanced hypocotyl elongation under both white light and shade. This phenotype cannot be explained by overexpression artifacts or autoregulatory side effects, and directly demonstrates that endogenous ATHB2miP produced from the TTG codon is required to restrain ATHB2 activity in planta. The overexpression data and the complementation data thus converge on the same conclusion through independent and mechanistically distinct approaches.
(4) It is not shown that the microprotein is generated in Arabidopsis in response to shade, e.g. through Western or fluorescence protein detection. The main idea that the authors want to claim has not been addressed in Arabidopsis. There are no localization experiments of HB2 protein data in the presence of miP in Arabidopsis.
We provide three independent lines of evidence supporting in planta production of ATHB2miP. First, ribosome profiling (Ribo-seq) reveals significantly elevated translational activity across the second half of the ATHB2 locus specifically after 45 minutes of shade treatment (see Author response image 2), consistent with preferential translation of the ATHB2miP isoform under shade. This dataset is part of a separate study currently in preparation; however, given its direct relevance to the question of ATHB2miP translation, we include the ATHB2 locus data here.
Author response image 2.
Ribo-seq coverage across the ATHB2 locus. Coverage from seedlings grown under white light is shown in blue, after 45 min of shade in red, and after 90 min of shade in green. Notably, translation appears to increase under shade specifically in the second half of the gene.
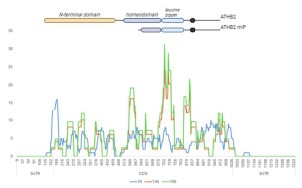
Secondly, the pATHB2miP::GUS reporter drives GUS expression in the shoot apical meristem and hypocotyl, demonstrating that sequences within the ATHB2 gene body are sufficient to promote transcription and translation in these tissues (Fig. 1E, G). Third, the ATHB2 alt complementation lines produce wild-type ATHB2 protein but cannot produce ATHB2miP, and they display constitutively enhanced elongation growth precisely as predicted by the model (Fig. 5D). Fourth, immunoprecipitation mass spectrometry from ATHB2 WT and ATHB2 alt complementation lines reveals distinct sets of ATHB2-related peptides in each genotype, demonstrating that the TTG-to-CTC substitution fundamentally alters ATHB2 proteoform composition (Fig. 5B). Collectively, these data provide robust genetic and biochemical support for endogenous ATHB2miP function even without direct protein visualization.
(5) The plants with altered HB2 forms seem to grow well and the recorded phenotypes are rather minor. Photos are not shown. At some point, the authors discuss that there could be redundancy or that HB2miP might interact with other HB proteins. However, such protein interactions have not been experimentally investigated.
The complementation experiment (ATHB2 alt lines) reveals a strong and reproducible phenotype: exaggerated hypocotyl elongation under both white light and deep shade, exceeding all other genotypes tested. This demonstrates that, when examined in the appropriate genetic context, loss of ATHB2miP has a clear consequence for growth. Regarding interactions with other HD-ZIPII proteins: the Arabidopsis Interactome Initiative (Science, 2011) provides experimental evidence that ATHB2 heterodimerizes with HAT2, HAT3, and HAT14. Since the leucine zipper domain mediates dimerization within the HD-ZIPII class and ATHB2miP retains this domain, heterodimer formation with additional family members is structurally expected. The stronger phenotype of 35S::miP plants relative to t-athb2 single mutants under certain conditions is consistent with this interpretation and is now discussed explicitly in the revised Discussion.
Reviewer #1 (Recommendations for the authors):
The authors unfortunately did not provide the data of the screen. There is no supplemental table accompanying Figure 1A.
The full list of 377 microProtein candidates is now provided in Supplementary Dataset 1. We apologize for not making this available in the original submission.
(1) Title: seems repetitive: "elongation growth and root development"
The title has been shortened to remove redundancy.
(2) Introduction: (a) It seems very long and does not always address the central open questions. There is also previously published work on AtHB protein involvement in relation to growth and iron homeostasis (e.g. Capella et al. 2015). Perhaps the authors will suggest in the discussion a certain model of action. That could be better introduced to understand the importance of the findings. Hence, it would appear necessary to provide the current state of knowledge on AtHB proteins, their functions, and open questions to allow readers to better understand the connection between plant growth and iron homeostasis. This point did not come across in the Discussion, either.
(b) Line 134-135: is this a general definition of microproteins?
(a) The Introduction has been revised for focus and concision. A paragraph on the known functions of HD-ZIPII proteins beyond shade avoidance has been added, including roles in seed germination (Tognacca et al., 2021) and leaf cell proliferation (Carabelli et al., 2018).
(b) We amended the text.
(3a) Line 171ff: Would be helpful to explain the procedure briefly and explain what has been expected, also with respect to the shade experiment.
Shade avoidance is well characterized at the transcriptional level, but whether shade also reshapes the proteome through alternative transcription start site usage had not been explored. We reasoned that shade-induced changes in TSS selection could generate truncated protein isoforms lacking specific functional domains, which could modulate the activity of their full-length counterparts. The 5'PEAT-seq approach enriches for capped transcript 5' ends, allowing genome-wide identification of active TSSs at single-nucleotide resolution and direct comparison between white light and shade conditions. A brief explanation of the rationale has been added to the Results section.
(3b) Line 176ff: Would be helpful to explain how the findings fit with expectations, e.g. in the context of shade experiments.
Among the 377 microProtein candidates, ATHB2 stood out as the only well-characterized shade avoidance regulator, and the alternative protein it encodes retains the leucine zipper domain, suggesting it could interfere with the dimerisation-dependent DNA-binding activity of full-length ATHB2. This combination of biological relevance and a clear mechanistic hypothesis made ATHB2miP the natural choice for functional characterization. This context has been added to the Results.
(3c) Line 190: 377 potential microProteins candidates were identified. However, this finding is not further explained. What kind of microProteins were there? Were enrichment studies conducted and what did they show? How related were proteins to the shade response? Was the approach successful? Finally, only a single candidate was picked and studied. What were the criteria? There is no list of 377 microproteins provided, although this is a result mentioned in Figure 1A.
The full list of candidates with functional annotations is provided in Supplementary Dataset 1. Among the candidates, ATHB2 was selected based on its status as a well-characterized shade avoidance regulator and its structural similarity to the LITTLE ZIPPER microProteins, which regulate HD-ZIPIII factors through the same competitive dimerization mechanism. The rationale for candidate selection has been expanded in the Results section and directed readers to Supplementary Dataset 1.
(3d) Line 220: Would be helpful to explain why this control is chosen, and what aspect of the experiment it should control.
The pATHB2control::GUS construct is identical to pATHB2miP::GUS except that GUS is fused out of frame with the alternative protein sequence. Its lack of signal confirms that the expression observed in pATHB2miP::GUS requires the correct reading frame and cannot be explained by transcriptional read-through or leaky expression from the ATHB2 gene body. This explanation has been added to the Results.
(3e) Line 228: Is this typical for a microprotein regulation?
There is no established precedent for what is "typical" in this context, as genome-wide studies of alternative TSS-derived microProteins remain scarce. Our study is among the first to show systematically that environmental signals can induce alternative TSS usage to produce regulatory microProteins from within existing gene loci, which is itself a novel finding. This point has been made explicit in the text.
(3f) Figure 1A-C: Would be helpful to explain abbreviations.
All abbreviations in Figure 1 have been defined in the figure legend.
(3g) Figure 1A-C: There is no quantification of miP formation in response to FR; hence the data is not yet convincing.
The figure title has been revised to remove the implication that microProtein production has been directly quantified at the protein level. The 5'PEAT-seq data in Figure 1B are inherently quantitative, with read counts at the alternative TSS showing a clear peak at 45 minutes of shade. The pATHB2miP::GUS reporter requires both transcription from the alternative promoter region and translation in the correct reading frame, as demonstrated by the out-of-frame control (Fig. 1F), making it a functional readout of the capacity of this locus to produce protein from the alternative TSS.
(3h) Figure 1E-G: GUS staining should be done with and without the FR treatments used in Figures 1A-C.
All seedlings shown in Figures 1E-G were subjected to deep shade treatment prior to sampling, as now stated explicitly in the figure legend.
(3i) Line 232/233: Would be helpful to explain why the authors expected that.
The LITTLE ZIPPER proteins are short leucine zipper-containing proteins related to the HD-ZIPIII family. They inactivate HD-ZIPIII transcription factors by forming non-productive heterodimers through their shared leucine zipper domain. Since ATHB2miP likewise retains only the leucine zipper of ATHB2 while lacking the homeodomain, we predicted by direct analogy that it would inhibit ATHB2 through the same competitive dimerization mechanism. This reasoning has been made explicit in the text.
(3j) Figure 2: A, The different localization patterns are not quantified. C, The images seem to indicate different localization. Real co-localization and its quantification between ATHB2 and AtHB2miP or AtHB2HD is lacking, especially pointing out in better detail whether there are changes over time of microprotein expression. Explanations of statistics are lacking.
Localization patterns have been quantified and the counts added to Figure 2A. The majority of nuclei expressing eGFP-ATHB2 showed distinct photobody or speckle formation, consistent with ATHB2 homodimerization driving higher-order nuclear condensate assembly. Nuclei expressing eGFP-ATHB2miP showed predominantly diffuse nuclear localization. Co-expression of ATHB2 and ATHB2miP (Fig. 2C) disrupted the speckle pattern, indicating that heterodimers are incompetent to form or maintain condensates. The FRET-FLIM data in Figure 2D provide the most rigorous measure of spatial proximity, demonstrating physical interaction at the nanometer scale. Statistical details are now described in the figure legend.
(3k) Are protein interactions affected by light treatments?
This is a well-framed question. The FRET-FLIM experiments were performed under standard light conditions. Testing whether the interaction strength is light-dependent would require stable transgenic lines expressing both fusion proteins in Arabidopsis, which are beyond the scope of this revision. The genetic complementation data indicate that the functional consequence of the interaction is most pronounced under shade, even if the interaction itself may not be light-regulated. We note this as a direction for future work.
(3l) Line 270: It would be helpful to explain whether it is structurally expected that the different proteins interact.
Yes, interaction is structurally predicted. Both ATHB2 and ATHB2miP contain a leucine zipper domain, a well-characterized coiled-coil dimerization motif. It has been established that the leucine zipper is both necessary and sufficient for dimerization among HD-ZIP proteins (Sessa et al., 1993). Heterodimer formation between ATHB2 and ATHB2miP is therefore a direct structural prediction. This has been stated explicitly in the revised text.
(3m) Line 292ff: The g, e gxe effects have not been studied nor the true effects of miP since the proper genetic effects cannot be compared in the setup. Is the background of 35S::miP wild type? If so, what is the effect of endogenous miP? In any case, a control of 35S::Full-length protein would be important for comparison, since it cannot be ruled out that effects are due to ectopic overexpression rather than miP. The proper controls are needed to not draw any misleading conclusions.
The experimental design compares three genotypes (Col-0, t-athb2, and 35S::ATHB2miP) under three light conditions, allowing identification of genes whose expression depends on genotype, environment, and their interaction. A 35S::ATHB2 full-length line has now been included in the growth assays (see above). Its inclusion in the RNA-seq experiment would require an additional sequencing run beyond the scope of this revision; however, the convergence of the t-athb2 and 35S::ATHB2miP transcriptomes on the same set of differentially expressed genes, achieved through two mechanistically independent perturbations of ATHB2 activity, provides strong evidence that the observed transcriptional changes reflect genuine loss of ATHB2 function rather than overexpression artifacts.
(3n) Line 310: "Having established" must be carefully rephrased. It has not been shown that ectopic miP expression perturbs AtHB2 function.
We respectfully disagree. The convergence of the t-athb2 and 35S::ATHB2miP transcriptomes on the same set of differentially expressed genes, through two mechanistically independent perturbations of ATHB2 activity, demonstrates that ectopic ATHB2miP expression perturbs ATHB2 function. Furthermore, the ATHB2 alt complementation data provide direct genetic evidence that endogenous ATHB2miP restrains ATHB2 activity in planta. The phrase "having established" is therefore accurate in context and has been retained.
(3o) Line 310ff: Would be helpful to explain the outcome of differential expression in response to light treatments. Were the responses expected? How did they compare to the experiment described in Figure 1?
Differential gene expression under increasing shade duration revealed progressive induction of auxin biosynthetic genes and known shade-avoidance targets in wild-type plants, consistent with established shade transcriptomics. In t-athb2 and 35S::ATHB2miP plants, this response was amplified and accompanied by constitutive upregulation of iron homeostasis and root development genes, even in white light. These findings are consistent with ATHB2 acting as a transcriptional repressor of these programs, and with ATHB2miP relieving this repression at the onset of shade. A brief discussion of this interpretation has been added to the Results.
(3p) Figure 3A-C: More information should be added to the figures or the data representation should be improved. What do these expression patterns mean? The relevant information cannot be grasped.
Figure 3 presents the statistical output of the differential expression analysis and cluster analysis. The heatmap in panel A displays expression levels of the 95 genes whose expression shows a significant genotype-by-environment interaction, with the color scale indicating CPM values. Panel B shows the expression trajectories of genes within three selected clusters across genotypes and shade conditions; the y-axis reflects expression change and the x-axis the genotype-condition combinations. The biological interpretation of these patterns is provided in the Results section, where we discuss the gene ontology enrichments associated with each cluster. The complete gene lists for all 17 clusters, including annotations, are provided in Supplementary Dataset 3, which allows readers to examine the data in full detail. Given the number of genes involved, a figure of this type necessarily presents a statistical overview rather than a gene-by-gene interpretation, and we believe the combination of the figure and the accompanying text and supplementary data provides sufficient context for readers to evaluate the findings.
(3q) The tables are not labeled and it is not written what is represented.
Table legends have been added to both tables. Table 1 lists DEGs related to auxin biology and hypocotyl elongation that are upregulated in both 35S::ATHB2miP and t-athb2 plants relative to wild type, with columns for gene identifier, annotation, log2 fold change in 35S::ATHB2miP, and log2 fold change in t-athb2. Table 2 lists the equivalent information for DEGs related to root development.
(3r) Figure 4: Same comment as above in comment l, it is hard to assign effects properly to miP if there is no control on full-length proteins expressed behind the 35S promoter. There should be a clear scheme, depicting which athb2 mutant has which exact genomic structure.
A schematic depicting the genomic structure and predicted protein product of each allele is provided in Figure 4A. Regarding the 35S::ATHB2 full-length control: we include data from two independent 35S::ATHB2 lines in this response letter (see our response to Reviewer 1, point 3), but have not added them to the main figures as we feel the ATHB2 alt complementation experiment addresses this concern more directly and cleanly. In those lines, full-length ATHB2 protein is produced from the endogenous promoter with an identical amino acid sequence, but ATHB2miP cannot be translated. The resulting phenotype is unambiguous and cannot be attributed to overexpression artifacts.
(3s) Line 366ff: Based on which comparisons did authors get to this conclusion? Perhaps it is overstated.
We agree the original statement was overstated. The text has been revised to reflect only what the data support: ATHB2 acts as a growth repressor in deep shade and promotes elongation growth in canopy shade. Under proximity shade, no significant differences in hypocotyl elongation were detected between wild-type and athb2 mutant plants, and this is now stated accordingly.
(3t) Line 372: Do the authors mean really "complemented"?
The reviewer is correct. The 35S::miP construct is not a complementation but an ectopic overexpression in the t-athb2 background. The wording has been changed to "we expressed ATHB2miP in the t-athb2 mutant background."
(3u) Line 405ff: This section should be moved to the Discussion. It is highly speculative and not experimentally addressed.
The speculative passage at lines 405ff has been rewritten.
(3v) Supplementary Figure 2 and line 417: Can you please point out what are the relevant data to look at in Supplementary Figure 2?
We apologize for the confusion. The data referenced at this point in the text are presented in Supplementary Dataset 2, not Supplementary Figure 2. The text has been corrected accordingly.
(3w) Line 445: Why should HB2 be a negative regulator for iron uptake?
The evidence for ATHB2 as a negative regulator of iron uptake comes from two independent loss-of-function contexts: iron levels are elevated in t-athb2 mutants and significantly so in 35S::ATHB2miP plants, where inhibition extends to additional HD-ZIPII family members. The stronger effect in 35S::ATHB2miP suggests that ATHB2 and related HD-ZIPII factors act collectively as repressors of iron uptake gene expression.
(3x) The authors did not show photos of any of the plants. What about shoot growth?
The phenotypes described in this study are quantitative in nature, specifically differences in hypocotyl and root length across multiple genotypes and shade conditions. We believe the quantifications presented in Figures 4 and 6 capture these differences more accurately and informatively than photographs would. Showing representative images for all genotype-condition combinations would add considerable length to the manuscript without providing additional insight beyond what the measurements already convey.
(4a) Line 492: Is the result shown somewhere?
The results are presented in Supplementary Dataset 1. A reference to this dataset has been added to the text at line 492.
(4b) Line 509: Considering that quantitative analysis has not yet been performed, please formulate this carefully.
Quantification has been added to the figure and the statement at line 509 is now supported by the data shown.
(4c) Line 520ff: It is not discussed how to interpret the comparison of HB knockout and miP lines, especially considering that 35S::HB2 is missing.
As described in our response to Reviewer 1 (point 3), the ATHB2 alt complementation experiment addresses this concern more directly than a full-length overexpressor. The distinct phenotype of ATHB2 alt plants, which produce wild-type ATHB2 but no ATHB2miP, provides a clean genetic separation of the two isoforms' functions. This is now discussed in the revised manuscript.
(4d) Line 566/567: "might have stopped growing because of better nutrient supply." Is there any evidence for such assumptions?
This statement appears in the Discussion and is clearly framed as speculative with the use of "might." We consider this appropriate for a discussion section where alternative interpretations are explored, and have retained the wording accordingly.
(4e) Line 572ff: Very far-fetched hypotheses to link immunity, shade, and iron, without showing any precise data on the regulation under such circumstances.
We respectfully disagree that this passage is far-fetched. The connection between shade, iron homeostasis, and immune signaling is grounded in two published findings: shade weakens pathogen defense through hormone homeostasis changes (de Wit et al., 2013), and IRONMAN peptides, which we show are regulated by ATHB2, respond to flagellin perception (Cao et al., 2024). The passage raises this as an open question rather than making a mechanistic claim, which we consider appropriate for a Discussion section. We have therefore retained the text as written.
Reviewer #2 (Public review):
The first portion of the manuscript centered on identifying and confirming the ATHB2 microprotein (ATHB2miP), which constitutes the core message of this study. Overall, I find no issue with the selection criteria employed for identifying alternative microprotein mRNA transcripts. However, I do have some queries that I hope the authors can address for clarity.
We thank Reviewer 2 for the thorough and constructive assessment.
(1) Upon reviewing the supplemental dataset where the authors listed the 377 unique novel miPs, along with those specifically in WL or shade treatments, I sought to comprehend the rationale behind focusing on ATHB2. Have the authors examined the shade response of all 377 potential microprotein candidates? Readers may be intrigued to learn how many of these candidates exhibit induction or repression under shade conditions, and whether such changes correlate positively or negatively with alterations in the full-length TSSs in response to shade. Essentially, I aim to discern the prevalence of microprotein production during shade responses and any shared characteristics among these microprotein transcripts. This inquiry also aims to uncover the existence of a common mechanism regulating microprotein transcription.
Supplementary Dataset 1 provides the full list of 377 microProtein candidates, including read counts, which allows readers to inspect the data themselves. We did not perform a systematic analysis of shade responsiveness across all 377 candidates, nor did we examine correlations between alternative and full-length TSS changes genome-wide. We agree this would be informative and note it as a direction for future work.
ATHB2 was selected from the candidate list on the basis of two criteria. First, the alternative protein it encodes retains a leucine zipper domain and thereby resembles the LITTLE ZIPPER microProteins, which regulate HD-ZIPIII transcription factors through competitive dimerization, providing a clear mechanistic hypothesis. Second, ATHB2 is one of the best-characterized shade avoidance regulators in Arabidopsis, making it possible to evaluate the biological consequences of ATHB2miP production in a well-defined molecular framework.
(2) To confirm that ATHB2miP stems from an independent transcription event, the authors sequenced full-length cDNAs using PacBio IsoSeq. However, I find the information regarding isoseq missing from the manuscript. My assumption is that the full-length cDNAs were reverse transcribed from mRNAs isolated from whole seedlings, where mature mRNAs in the cytoplasm predominate, making it challenging to evaluate whether a specific mRNA undergoes post-transcriptional processing. One approach to confirming ATHB2miP as a product of independent transcription involves examining nascent mRNA produced in the nucleus. The authors may need to isolate nascent mRNAs associated with RNA Polymerase II in the nucleus from seedlings treated with shade for 45 min, and then perform reverse transcription and PacBio Iso-Seq.
We acknowledge this limitation. The full PacBio Iso-Seq dataset has been deposited to GEO. We have avoided placing the main weight of the argument on transcript origin. Instead, we focus on independent functional evidence. The pATHB2miP::GUS reporter demonstrates that the region upstream of the TTG near-cognate start codon within the ATHB2 gene body contains promoter activity sufficient to drive expression in the shoot apical meristem and hypocotyl. The absence of signal in the out-of-frame control (pATHB2control::GUS) confirms that this expression requires translation initiation at the correct reading frame, consistent with the predicted Kozak context of the TTG codon identified by TISpredictor. Together with the ATHB2 alt complementation data, which demonstrate that mutating this TTG codon abolishes the microProtein's regulatory function in vivo, these results establish that the TTG codon serves as a functional translation initiation site regardless of whether the shorter transcript arises from independent transcription or post-transcriptional processing.
(3) The authors noted the identification of two potential start codons, TTG and CTG, in the alternative TSS of ATHB2 using TISpredictor. Yet, it's imperative to identify the actual translation initiation site and the full-length sequence of ATHB2miP. I suggest the authors fuse an epitope tag (e.g., 3xFLAG) to the C-terminus of ATHB2 (utilizing the genomic sequence of ATHB2) and generate transgenic lines to be treated with shade to induce ATHB2miP-3xFLAG production. Affinity purification (anti-FLAG beads) and mass spectrometry can then identify the actual start site of ATHB2miP. This step is crucial, as the current ATHB2miP used may not be the exact sequence, and any observed phenotype could be artifacts arising from these lines.
We carried out exactly this approach. Transgenic lines expressing a C-terminal triple FLAG tag from the genomic ATHB2 locus were generated, subjected to shade treatment, and used for nuclear enrichment, anti-FLAG immunoprecipitation, and mass spectrometry analysis. We detected ATHB2-derived peptides by IP-MS (Fig. 5B), confirming that the FLAG-tagged protein was successfully enriched. However, we did not recover a peptide spanning the ATHB2miP N-terminus that would directly identify the translation initiation site, most likely because ATHB2miP is expressed transiently and at low abundance. We therefore cannot assign the functional start site by mass spectrometry alone. The functional evidence, however, points unambiguously to TTG. The ATHB2 alt construct carries a TTG-to-CTC substitution at this position. Because both codons encode leucine, the full-length ATHB2 protein sequence is unchanged. Yet plants carrying ATHB2 alt display constitutively enhanced hypocotyl elongation under both white light and shade, while ATHB2 WT-complemented plants restore wild-type growth. The only functional difference between these constructs is the capacity to initiate translation from TTG, providing a direct in vivo assignment of this codon as the physiologically relevant start site. Consistent with this, IP-MS revealed distinct peptide profiles between ATHB2 WT and ATHB2 alt plants (peptides I-IV detected exclusively in ATHB2 WT; peptide V exclusively in ATHB2 alt; Fig. 5B), demonstrating that the TTG-to-CTC substitution fundamentally alters which ATHB2 proteoforms are produced. Anti-FLAG immunoblotting detected full-length ATHB2 and ATHB2miP in ATHB2 WT plants; in ATHB2 alt plants, ATHB2miP was replaced by two alternative bands: one slightly larger and one smaller. These findings are consistent with translation initiating from alternative start sites when TTG is mutated (Fig. 5C).
(4) My confusion arose when analyzing the results in Figures 1E - G. The authors didn't specify whether these plants were subjected to shade treatment. What are the sequences within the second intron and third exon excluded from pATHB2control::GUS that promote transcription and translation? Have the authors examined the sequence features? This information is pivotal and related to the above question #1 because it may tell us whether the sequence feature is shared by other miP candidates.
All seedlings shown in Figures 1E-G were subjected to deep shade treatment prior to sampling. This is now clearly stated in the figure legend. The pATHB2miP::GUS construct contains the genomic sequence immediately upstream of the TTG near-cognate start codon, encompassing elements within the second intron and third exon absent from the control construct. The activity of this sequence in the shoot apical meristem and hypocotyl indicates the presence of a functional promoter. Characterization of the specific sequence features responsible is an interesting question we note as a direction for future work.
The latter part of the manuscript focused on the functional characterization of ATHB2miP. The approaches adopted by the authors resemble those used in studying antimorphic (dominant negative) alleles. However, I have several concerns regarding the approaches and conclusions.
(5) Firstly, as mentioned in question #3, the authors did not map the actual translation initiation site of ATHB2miP. Therefore, all constructs involving ATHB2miP, such as eGFP-ATHB2miP, BD-ATHB2miP, and mCherry-ATHB2miP in Figure 2, and 35S::miP in Figures 3-5, may contain extra amino acids in the N-terminus, given that epitope tags were all added to the N-terminus. These additional amino acids could potentially impact the behavior of ATHB2miP and lead to artifacts. Identifying the translation initiation site in ATHB2miP would facilitate the development of tools to disrupt ATHB2miP expression without affecting full-length ATHB2 expression. For instance, if the "CTG" before the leucine zipper domain is confirmed as the translation initiation site, mutating it to another Leu codon (e.g., TTA) could generate transgenic lines using the genomic sequence of ATHB2, including this mutation, to evaluate the impact of losing ATHB2miP on shade responses.
We acknowledge that all constructs used, including the eGFP/mCherry fusions, GAL4 domain fusions, the recombinant GST protein for EMSA, and the 35S::ATHB2miP overexpression line, carry N-terminal additions. To resolve this, we carried out precisely the experiment proposed: a genomic ATHB2 transgene in which the alternative near-cognate start codon TTG was mutated to CTC, a synonymous substitution that preserves the full-length ATHB2 protein sequence while preventing ATHB2miP translation. Plants carrying this construct display strongly enhanced hypocotyl elongation under both white light and deep shade. This genetic result directly maps TTG as the functional initiation site and demonstrates that ATHB2miP production from this codon has measurable physiological consequences in planta, independent of any N-terminal addition artifact.
(6) Another concern pertains to the 35S::miP line utilized in Figures 3-5. The authors only presented results from one 35S::miP line, raising the possibility of T-DNA insertion disrupting an endogenous gene in the transgenic plant genome. It is essential to clarify how many individual T1 plants were generated and how many of them showed the same phenotype as the line used in the manuscript. Additionally, the use of the constitutive CaMV35S promoter could generate artifacts akin to neomorphic mutations. For example, the authors identified Cluster 1 genes that were only induced in 35S::miP, but not in t-athb2 or WT plants (Figure 3B); moreover, they found an overrepresentation of genes involved in root development in this cluster. This observation correlated well with the root phenotype of 35S::miP under the proximity shade (Figure 4D), in which the short-root phenotype was only observed in lines expressing 35S::miP. These data could be artifacts due to the constitutive expression of ATHB2miP in roots but didn't necessarily reflect the natural function of ATHB2miP.
To address the concern about a single overexpression line, we present data from an additional independent 35S::ATHB2miP line earlier in this letter (see our response to Reviewer 1, point 3), alongside two independent 35S::ATHB2 full-length overexpression lines as controls. All 35S::ATHB2miP lines show elongated hypocotyls in white light and shade, consistent with reduced ATHB2 activity. The 35S::ATHB2 full-length lines show the opposite phenotype, confirming that the direction of the effect is specific to the protein being overexpressed and not an insertion artifact. Regarding the concern that constitutive ATHB2miP expression in roots may produce neomorphic effects: we acknowledge that ectopic 35S-driven expression cannot fully replicate the endogenous spatial and temporal pattern of ATHB2miP. The genes in Cluster 1, which are induced exclusively in 35S::miP plants, may partly reflect inhibition of additional HD-ZIPII family members by the overexpressed leucine zipper domain, beyond ATHB2 itself. This interpretation is discussed in the revised manuscript. Critically, however, the ATHB2 alt complementation experiment addresses this concern directly. In these lines, ATHB2miP is absent under the control of the endogenous promoter in the correct spatial context, with no ectopic expression involved. The constitutively enhanced hypocotyl elongation in ATHB2 alt plants relative to ATHB2 WT plants demonstrates that ATHB2miP has a genuine endogenous function that cannot be attributed to 35S overexpression artifacts.
(7) Furthermore, I seek clarification regarding the rationale behind employing different shade conditions, including deep shade, canopy shade, and proximity shade, and the significance of treating plants with these conditions. The results were challenging to interpret, and I have reservations about some statements made. The authors claimed that ATHB2 acts as a growth repressor in deep shade but a growth promoter in the canopy and proximity shade (Lines 366-368). However, it appears that regardless of the shade conditions, most mutant and transgenic lines were not significantly different from WT (Figure 4C). Additionally, the definition of proximity shade in this manuscript (R:FR = 0.06) differs from that in Roig-Villanova & Martinez-Garcia (Front. Plant Sci., 2016; R: FR, 0.5-0.3). Clarity on this disparity would be appreciated.
We employed three shade regimes to capture the spectrum of natural shading encountered by plants. Deep shade (PAR 13 µmol m-2 s-1, R: FR 0.13) simulates dense canopy where both light quantity and quality are strongly reduced. The two intermediate conditions both use PAR 45 µmol m-2 s-1 but differ in R: FR ratio (0.15 and 0.06), simulating conditions of neighboring plant competition where light quantity is less limiting but spectral quality changes. We acknowledge that the terminology "canopy shade" and "proximity shade" as used here does not match the definitions of Roig-Villanova and Martinez-Garcia (2016) and have revised the nomenclature in the manuscript to avoid confusion.
(8) In Figure 5, no statistical analyses were presented in Figure 5C. It remains unclear whether the differences observed are statistically significant. Moreover, the values appear quite similar among all three genotypes. Even if statistically significant, do these minor differences in Fe concentrations significantly impact plant physiology? Additionally, some statements related to Figure 5 do not align with the data presented. For instance, claims about longer hypocotyls in t-athb2, athb2∆, and atbh2∆LZ mutants compared to wild type under shade conditions on high iron media (lines 453-455) were not supported by the data in Figure 5D. Similarly, statements about the differences between mutants (lines 458-460) were not substantiated by the data.
The statistical analysis of the iron concentration data has been redone using a two-way ANOVA with tissue (root vs. shoot) and genotype as factors, followed by Tukey post-hoc comparisons. Statistical group labels are now shown directly on Figure 6C. All statements in the text making claims about genotype differences in hypocotyl or root length under iron conditions have been re-checked against the underlying statistical groupings. Unsupported claims have been corrected or removed.
Reviewer #2 (Recommendations for the authors):
(1) Figure 2A: The domain structure was not explained here, but instead in Figure 4A. Please incorporate that information into Figure 2A.
The domain structure of each ATHB2 variant has been incorporated into Figure 2A.
(2) Figure 3A: The transgenic line 35S::miP was used here but not introduced until Figure 4A.
A brief introductory sentence for the 35S::ATHB2miP (35S::miP) transgenic line has been added to the Results section prior to its first appearance in Figure 3.
(3) Line 283: Does logFC mean log2FC, and should logFC<1 be log2FC<-1?
Yes, logFC refers to log2 fold change. The threshold for downregulated genes should read logFC < −1, and this has been corrected in the revised manuscript.
(4) Figure 3B: Have the authors examined Cluster 16 genes, expressed at low levels only in 35S::miP but not the other two genotypes? Are they also related to root development?
We examined Cluster 16 and found it is enriched for genes involved in responses to light stimuli, not root development.
(5) Line 354-356: Please make sure "-2" and "-1" are in superscripts.
Units have been corrected.
(6) Line 391: "geneotypes" should be "genotypes."
The typo has been corrected.
(7) Line 393: Remove one instance of "all."
The repeated word has been removed.
(8) Figure 5A&B: I suggest the authors combine the data in A and B so readers can easily observe the change in gene expression between WL and shade 45 min.
Thank you for the suggestion. The two heatmaps are presented sequentially in Figure 6A and B. We believe this layout allows clear comparison between white light and shade conditions and have retained the current arrangement.
Reviewer #3 (Public review):
Summary and Strengths:
In this interesting manuscript, the authors identify a large number of alternative transcription start sites (TSS) and focus their functional analysis on an alternative TSS that is expected to produce a micro-protein (miP) encoding the C-terminus of ATHB2 (ATHB2miP). ATHB2miP is expected to comprise the leucine zipper part of ATHB2 and hence interact with the full-length protein through this dimerization motif. Such interactions are shown using yeast two-hybrid and FRET-FLIM assays. ATHB2 is a well-known shade-induced gene that has been implicated in shade-regulated growth responses. The authors then test the potential role for ATHB2miP genetically by comparing several athb2 loss-of-function (LOF) alleles: one does not express either full-length ATHB2 or the short ATHB2miP (t-ATHB2), two CRISPR alleles give rise to frameshift mutations in the full-length transcript but still express a potentially functional short ATHB2miP (athb2deltaLZ and athb2delta). The authors also use plants that over and ectopically express ATHB2miP (35S:miP). Overall, the results are consistent with the hypothesis that ATHB2miP inhibits the function of ATHB2, which constitutes a novel negative feedback loop. Potentially ATHB2miP may also inhibit the activity of other related HD ZIP proteins (based on 35S:miP). The effects of these genetic alterations on shade-regulated hypocotyl growth are relatively modest. Effects on root growth are also investigated and in one intriguing case, the negative feedback model does not appear to explain the data (Figure 4D, effect on lateral roots, because for this phenotype 35S:miP is very different from the lof alleles). The authors also identify a potentially interesting link between shade-regulated hypocotyl growth and iron uptake. A number of text changes and corrections to the figures would be important for clarity. They primarily concern three issues: names of the alleles, names of the studied shade conditions, and statements about significant differences between genotypes. Also, it would be interesting to know whether the effects of ATHB2 on iron uptake are due to local effects of ATHB2. Is ATHB2 expressed in roots?
We thank Reviewer 3 for the thorough reading and for identifying specific inconsistencies.
Weaknesses:
(1) The naming of the different shade conditions is difficult to follow and not consistent with the way most authors in the field call such conditions. Deep shade is ok (low PAR and low R/FR, WL, PAR 13microE, R/FR 0.13). This condition is clearly defined for experiments in Figure 4. However, data in Figure 1 also use Deep shade (line 174) but PAR is not defined there. I suggest that all light conditions are clearly defined in the figure legends and in the M&M (not the case in this ms). Regarding Canopy shade (WL, PAR 45microE, R/FR 0.15) and proximity shade (WL, PAR 45microE, R/FR 0.06), see lines 355-357, this nomenclature is unclear. First proximity shade has a higher R/FR ratio than canopy shade. Second for canopy shade (compared to the WL control) PAR should decrease which is not what is done here. What is called proximity shade and canopy shade are 2 WL conditions with different R/FR ratios, which are compared to WL controls with the same PAR. It would make more sense to call them proximity shade and indicate the different R/FR ratios. Finally, extensive literature from many plant species and numerous labs has shown that hypocotyl elongation increases with R/FR decreasing. In the data shown in Figure 4, it is the opposite. Hypocotyls in Canopy shade (WL, PAR 45microE, R/FR 0.15) are longer than those in proximity shade (WL, PAR 45microE, R/FR 0.06), while with these R/FR ratios the opposite is expected. Could this be a mistake in the text? Please check.
We agree that the terminology was confusing and have revised the nomenclature throughout the manuscript. All light conditions are now clearly defined in both the figure legends and the Materials and Methods section. Deep shade (PAR 13 µmol m-2 s-1, WL+FR; R: FR 0.13 in WL+FR) is consistently defined wherever it appears, including in the context of the 5'PEAT-seq experiment in Figure 1. The two intermediate conditions, which both use PAR 45 µmol m-2 s-1 but differ in R:FR, have been renamed to reflect their R: FR ratio rather than implying a specific natural shading scenario.
(2) In several instances (in particular regarding data from Figures 4 and 5), the authors write that 2 genotypes are significantly different while the statistical analysis of the data does not support such statements. For example lines 392-395, the authors write that in WL the t-DNA mutant, both CRISPR mutants and 35S:miP lines all had significantly lower number of lateral roots than the WT. This is true for the t-DNA mutant (group bc, while the WT is in group a), however, all other genotypes are in group ab, hence not significantly different from the WT. Please carefully check all such statements about significant differences.
We apologize for these inaccuracies. All statistical comparisons have been re-checked against the underlying statistical groupings, and the text has been corrected to reflect only differences supported by pairwise significance. Specifically, the statement about lateral root numbers in white light has been revised to note that only the t-athb2 mutant shows significantly fewer lateral roots than wild type; the CRISPR alleles and 35S::miP lines occupy intermediate groupings and are not significantly different from wild type in that condition.
(3) The naming of the CRISPR mutants is problematic. In particular athb2delta, such a name suggests that the gene is deleted (also suggested by Figure 4A), which is not the case in this CRISPR allele leading to a frameshift early in the coding sequence. This is particularly problematic because in this allele ATHB2miP is still expressed, while based on such a name one would expect that in this mutant both the full-length and the miP are lost. Both CRISPR alleles lead to a frameshift and this should be clarified in Figure 4A and in the text.
We agree that the naming was misleading. We have renamed the two CRISPR alleles throughout the manuscript. The allele carrying a frameshift in the first exon is now referred to as athb2cr2, and the allele carrying a frameshift in the third exon is now referred to as athb2cr1. Figure 4A and the text have been revised accordingly, with a clear description of the frameshift nature of each allele.
(4) Overall hypocotyl growth phenotypes of athb2 lof mutants and 35S::miP are similar and consistent with the model. However, this is not the case for the root phenotype described in 4D. It would be interesting to discuss this.
We thank the reviewer for flagging this apparent discrepancy. It is now explicitly discussed in the revised Discussion. The stronger root phenotype of 35S::miP plants relative to loss-of-function alleles in proximity shade conditions is consistent with ATHB2miP, when overexpressed, inhibiting not only ATHB2 but also other HD-ZIPII family members with which it can form leucine zipper-mediated heterodimers. Published interaction data (Arabidopsis Interactome Mapping Consortium, Science 2011) show that ATHB2 heterodimerizes with HAT2, HAT3, and HAT14. Since ATHB2miP retains the leucine zipper, it could form non-productive heterodimers with these proteins as well. Single athb2 loss-of-function alleles affect only ATHB2, which explains the milder root phenotype relative to 35S::miP. The partial suppression in t-athb2 35S::ATHB2miP is consistent with removing ATHB2 while retaining other HD-ZIPII substrates for ATHB2miP sequestration.
(5) The authors propose a role for ATHB2 in the root, in particular linked to iron uptake. Is this due to a local effect of ATHB2 in the roots? Is ATHB2 expressed in roots? It would be very informative if the authors would show such data, e.g. using the reporter lines used in Figure 1. Are both the FL and the miP expressed in roots?
Based on published expression data, ATHB2 transcript levels in roots are low relative to shoot tissues. The pATHB2::GUS reporter shows strongest expression in the hypocotyl and shoot apical meristem. This is consistent with the effects on iron uptake and root development being at least partly systemic, mediated by shoot-derived signals such as auxin. Steindler et al. (1999) showed that ATHB2-related root phenotypes depend on auxin transport, and He et al. (2020) demonstrated that ATHB2 overexpression reduces expression of PIN auxin efflux carriers and YUCCA biosynthetic enzymes, which would alter auxin distribution throughout the plant. A systemic model is also consistent with the established role of auxin as a long-distance messenger connecting shoot shade perception to root architecture adjustments (van Gelderen et al., 2018). We therefore propose that ATHB2 regulates root development and iron uptake primarily through its activity in the shoot, with downstream consequences for auxin distribution. Formally testing this through tissue-specific complementation is noted as a direction for future work.
(6) From the description regarding 5'PEAT.seq data presented in Figure 1 (see lines 174-177) it is not clear in which light conditions the seedlings were grown. It appears that samples were collected in 3 conditions. WL and after 45 and 90 minutes of low R/FR treatment. However, then the data is discussed collectively. Does the 12398 TSS correspond to what was found in all three conditions together? Are the authors showing shade regulation of TSS? This is clearly the case for ATHB2miP. This needs to be clarified.
We apologize for the lack of clarity. The 12,398 TSSs were identified from all three conditions combined (white light, 45 minutes of supplemental FR, and 90 minutes of supplemental FR). This is now stated explicitly in the Results. The shade condition for the 5'PEAT-seq experiment was deep shade (PAR 13 µmol m-2 s-1), and this is now stated in the figure legend and in the Materials and Methods. Shade-specific regulation of individual alternative TSS candidates, including ATHB2, is described in Supplementary Dataset 1.
(7) The way gene expression of low F/FR effects is done might conflate circadian effects and low R/FR effects because the samples from different light conditions are not collected at the same ZT. This is how I understood the text. If I'm wrong please clarify the text. If I am right, this potential problem should be mentioned in the text.
The reviewer's concern is valid in principle but does not apply to our experimental design. All samples were harvested at the same zeitgeber time (ZT). Plants assigned to the 90-minute shade condition were transferred to supplemental FR 90 minutes before the common harvest time; those assigned to 45-minute shade were transferred 45 minutes before; and control plants remained in white light until the same harvest point. Because all harvests were simultaneous, any differences in gene expression reflect the shade treatment rather than circadian phase. This information has been added to the Materials and Methods section.
(8) Could the authors envisage a way to genetically test the role of ATHB2miP by using an allele that makes the full-length but not the miP? Currently, the authors use lof alleles that either make none of the transcripts (t-DNA) or potentially only the miP (CRISPR alleles). Overall, these alleles do not appear to differ in their phenotypes, suggesting that most of the effect of ATHB2miP is through ATHB2 FL. Having an allele only producing the FL would be nice (but technically I'm not sure how one could do that).
We are pleased to report that we have done exactly this. The ATHB2 alt complementation construct carries a TTG-to-CTC substitution at the alternative near-cognate start codon. Because TTG and CTC both encode leucine, the full-length ATHB2 protein is unchanged in sequence, but translation of ATHB2miP is abolished. Independent homozygous lines carrying ATHB2 alt in the t-athb2 background display constitutively enhanced hypocotyl elongation under both white light and deep shade, while lines carrying the wild-type ATHB2 genomic transgene restore near-wild-type growth. This experiment provides precisely the allele the reviewer proposed and validates the model: endogenous ATHB2miP restrains ATHB2 activity, and its loss leads to exaggerated elongation growth.
Dialogue 2.0 November 4th 2026 – EOLAS MIRROR
I use hypothes.is annotations as a way to "mirror" reflect on the summary
architecture of interdependence
architecture of mutual learning
Symmathesy
شکست
شکست جالب نیست
شکست
شاید همچنان جز گزینه ها باشه
She looks back.
挑了挑眉
You said I won't pass? Then watch me pass.
挑衅地说道
HARPER turns and crosses to the Office Door. Behind her, CELESTE lifts the camel coat off the floor and lays it over her bare thighs.
Harper气冲冲地转身走向办公室的门。
CELESTE says nothing. 塞莱斯特一言不发。
避开学生的眼睛,沉默
Who is he? 他是谁?
哽咽地问道
Her eyes are red.
删掉
It rolls across the floorboards and stops against the Exam Envelope at the foot of the desk leg.
删掉,就说戒指沿着地板滚动
That whole line in the hallway watched me walk through that door. Not one of them saw me walk out.
删掉,改成Harper用手捂住了嘴,朝老师的方向乖巧地点了点头
That's Pierce. If she wakes up now and stops me, she has to report it to him. And I'm expelled.
加上 oh shit,是pierce,
A flush climbs the side of CELESTE's neck and disappears under her shirt collar.
删掉这句
哈珀微微扬起嘴角,将两根手指缓缓滑入体内,先是浅浅地,接着越来越深,再深一些。
改成harper边用嘴边用手
HARPER slips off CELESTE's right shoe
不要脱鞋
HARPER unbuttons CELESTE's slacks and lowers the zipper. She hooks her fingers into the waistband and the underwear beneath it and pulls. The fabric drags down to CELESTE's upper thighs and catches there, half pinned under her.
Harper小心翼翼地解开老师长裤拉链,她用手指轻轻勾住裤腰往下一拉。布料滑落到老师的膝盖上部,卡在那里。露出老师的冷白色肌肤和白色内裤
Last night that face lied to me without blinking.
咬牙切齿的inner monologue
and it turns on CELESTE's finger.
去掉这句
CELESTE reclines in the Office Chair, rolled back from the desk, asleep. Her gold-rimmed glasses sit folded on the desk's edge.
特写: 百叶窗的光一道一道落在Celeste身上。她仰靠在办公椅里,头微微偏向一侧,白衬衫最上面那颗扣子松开了。她的眉眼比在讲台上柔和。睫毛垂着,眼下泛着淡淡的青色,粉嫩嘴唇微张,呼吸又轻又匀。
I already have an F on her midterm. One more failed class and I'm out. I'm getting expelled anyway. So I'm taking you. Right now.
直接改成:I'm getting expelled anyway. So I'm taking you. Right now.
A sealed manila Exam Envelope, stamped MAKEUP EXAM, leans against the desk leg nearest the Office Chair.
删掉这句话
A line of students waiting for office hours runs along the hallway wall outside the Office Door.
这些学生背着书本、抱着书稀稀拉拉地在喧闹的走廊中
HARPER stares at the Oversized Ring. The pen snaps in two in her hand.
Harper死死地盯着那枚戒指,没注意手中的钢笔断成了两截
GIRL 女孩Wait. Is Professor Vaughn engaged?
女孩与身边的同学低声讨论
She lifts out the Gray Hardcover and opens it. Between the pages lies the Handwritten Letter, crumpled once and smoothed flat.
信纸曾经被撕碎过,现在那些碎片已经用胶布小心地粘好,还原出原本的模样,被书熨平。
HARPER (V.O.) 哈珀(画外音)That's twice now. And she still doesn't want me.
inner monologue;并且是受了情伤的语气
HARPER rounds the desk, crosses to the Office Door, and takes the knob.
Harper认命般地绕过办公桌,径直走向办公室门
Pierce told me that himself. And he reports anything between faculty and a student. She'd be expelled immediately. I'd lose my tenure.
删掉这句话
Still think I'm the one shaking, Professor?
Harper凑近老师的耳朵,将温热的呼吸尽数喷在老师敏感的部位,低声说道:
Her face lies. Her body doesn't.
脸上终于扬起玩味的笑容
CELESTE's face doesn't change.
celeste闭上眼睛,终于忍不住欲望呻吟了一声。哪知道这声呻吟对于harper来说简直是春药,harper的手速更快了,终于celeste猛地一颤,睁开眼睛,大腿受不住似的猛地夹住harper的手,将手禁锢住。
CELESTEYou're shaking. 你在发抖。
celeste的脸上仍旧平静无波,
HARPER slaps the paper face down on the desk.
之前加上:学生内心VO:为什么?老师,每次听你上课,都在心底渴望你,可是你那眼神从未注视过我啊
So why are you working so hard to destroy her?
语调略高
HARPER's nails dig into her palm.
学生低头不敢看老师的眼神,怕看到她眼中的失望
Your freshman paper. This is the Harper I know.
老师语重心长地说
CELESTE sets down the red pen. She folds the coat into neat thirds and lays it on the corner of the desk. The Probation Order lies bare again.
她见状停下了手头的动作,站起来将大衣整齐地折了起来
HARPER 哈珀Your coat. I didn't wash it.
傲娇地说
CELESTE sits behind the desk in the Office Chair, glasses on, a red pen in her hand.
celeste坐在书桌后的办公椅上,戴着眼镜,手里握着一支红笔在转,正在低头批阅试卷。
She smooths it on the Lectern, one crease at a time. She slides it between the pages of the Gray Hardcover and closes the cover over it.
将那些信封碎片塞进书本里,然后合上书本
CELESTE walks to the Trash Can, reaches in, and lifts out the crumpled Handwritten Letter.
掏出那些信封碎片
Two hundred students laugh at once.
没有那么多学生,此时是下课后,剩在教室里稀稀拉拉的学生
CELESTE looks down at the Handwritten Letter. She doesn't open it. Two fingers slide it back across the Lectern until it touches HARPER's hand.
celeste眼里的冰冷如遇暖春般消融,但她还是选择偏过头
Sunset pours through the tall windows. Every seat is full.
画面加上字幕介绍:一年前
TYLER 泰勒That's not— Whatever. 那不是——算了。
结巴、尴尬地说
HARPER holds the exam up where CELESTE can see it and crushes it into a ball in one fist. 哈珀把试卷举到塞莱斯特能看到的地方,然后用一只手将它揉成一团。
边挑衅地看着celeste
HARPER 哈珀Wow. You circled it. 哇。你给它画了圈。
好笑地说
CELESTEMidterms. 期中考试。
改成严肃地对全班人说:现在我把期中考试的试卷发下来
BOY 男孩I heard she wanted to sleep with a professor for a grade. 我听说她为了拿分数,想和一位教授上床。GIRL 女孩She's on academic probation. One more failed class and she's out.
两人是低声交头接耳地说,并且幸灾乐祸的语气
That's her. Harper Lane. Last year she confessed to Vaughn in front of the whole class, and Vaughn shut her down.
将Vaughn改成 Celeste
Youngest tenured professor in the department.
全校最年轻最美丽的终身教授
CELESTE stands at the Lectern at the foot of the steps. She wears her hair in a low bun, gold-rimmed glasses, and a camel long coat. She has no notes.
驼色长大衣里面是白衬衫,她把袖子半挽起,双手撑在讲台上,面向整个教室,低沉有力地说道
Samuel A. Tannenbaum
This is Price's key technical witness and very, very poor choice.
Tannenbaum was a complete amateur who famously authenticated a forged Shakespeare signature. Nevertheless, he trumps all other palaeographers in Price's eyes because he says things that are helpful to her cause.
Some Oxfordians, like Nina Green in another of her 'Oxmyths' essays, also cleave for support to this charlatan who rejected Maunde Thompson's analysis and conclusions. Tannenbaum was a self-taught palaeographer, a psychiatrist by profession. Arthur Freeman & Janet Ing Freeman produced an authoritative work on forgery in the 19c¹, described his investigative monographs as 'fringe at best'. Amplifying, they point out that 'Tannenbaum’s eccentric palaeographical claims were not always sceptical, nor restricted to Collier: in 1927 he made the only extended modern attempt to rehabilitate Madden’s unlucky purchase of the ‘Shakespeare’ Montaigne, with its signature ridiculed by Collier himself, discredited by Maunde Thompson, and disowned by the British Museum. Tannenbaum found its genuineness ‘unquestionable." Robert Elrodt when writing in Shakespeare Survey², went further, quoting an Assistant Keeper of The British Museum, W H Kelliher, who said,"Tannenbaum’s arguments offer no serious challenge to Maunde Thompson".
Pollard was attempting to fill the documentary void and put an end to the authorship question.
Pollard was doing no such thing, though in a couple of references he describes the attribution's assured death knell for the SAQ as a serendipitous by product of the research.
Pollard's book can be read in its entirety in a digitised pdf here, in our filelist. http://oxfraud.com/HND-Pollard
The extent of Price's nonsense on the reasons for producing this study will become apparent from just the briefest of glances at The Preface. In fact, since Price so often betrays a lack of knowledge in what Pollard's book contains, it is legitimate to question whether Price has ever read it.
In addition to failing to understand Maunde Thompson's work, its date of publication and its conclusions, there are places where she might have drawn support from Pollard's hesitancy to be unequivocal which she has not discovered.
Nothing she says can be taken at face value as her purpose is to add colour and support to an unsupportable thesis. Every argument is partisan rather than academic.
does not include any literary paper trails; that is, he left behind no hard evidence during his lifetime that could support the statement that his occupation was writing
This is absolute nonsense.
It is the subject of Ms Price's book, Shakespeare's Unorthodox Biography. The methods she uses to support this statement have been pounded to dust by critics (and some academics) and her conclusions have been completely ignored outside the small Oxfordian tent.
Tom Veal's dismantling of Price's earlier work is excellent. http://stromata.tripod.com/id115.htm
Another, less patient review by Professor Alan Nelson here. http://socrates.oxfraud.com/price.html
Finally, on our new site which is based on evidence rather than imagination, we have distilled a prima facie case for Shakespeare's Authorship which no Oxfordian has been able to challenge. In less than 300 words and nine linked pieces of documentary, unimpeachable evidence.
Madison
Not convinced she is real, despite well made web site. Prices highish, travels a lot.
Sarah
Stolen pictures
strain details
DOI: 10.7554/eLife.108246
Resource: RRID:WB-STRAIN:WBStrain00027259
Curator: @Apiekniewska
SciCrunch record: RRID:WB-STRAIN:WBStrain00027259
strain details
DOI: 10.7554/eLife.108246
Resource: RRID:WB-STRAIN:WBStrain00022725
Curator: @Apiekniewska
SciCrunch record: RRID:WB-STRAIN:WBStrain00022725
strain details.
DOI: 10.7554/eLife.108246
Resource: RRID:WB-STRAIN:WBStrain00032071
Curator: @Apiekniewska
SciCrunch record: RRID:WB-STRAIN:WBStrain00032071
strain details
DOI: 10.7554/eLife.108246
Resource: (WB Cat# WBStrain00000001,RRID:WB-STRAIN:WBStrain00000001)
Curator: @Apiekniewska
SciCrunch record: RRID:WB-STRAIN:WBStrain00000001
strain details.
DOI: 10.7554/eLife.108246
Resource: RRID:WB-STRAIN:WBStrain00033219
Curator: @Apiekniewska
SciCrunch record: RRID:WB-STRAIN:WBStrain00033219
strain details.
DOI: 10.7554/eLife.108246
Resource: RRID:WB-STRAIN:WBStrain00022000
Curator: @Apiekniewska
SciCrunch record: RRID:WB-STRAIN:WBStrain00022000
strain details.
DOI: 10.7554/eLife.108246
Resource: RRID:WB-STRAIN:WBStrain00033269
Curator: @Apiekniewska
SciCrunch record: RRID:WB-STRAIN:WBStrain00033269
9
DOI: 10.64898/2026.09.28.755091
Resource: RRID:WB-STRAIN:WBStrain00029361
Curator: @Apiekniewska
SciCrunch record: RRID:WB-STRAIN:WBStrain00029361
9
DOI: 10.64898/2026.09.28.755091
Resource: RRID:WB-STRAIN:WBStrain00005253
Curator: @Apiekniewska
SciCrunch record: RRID:WB-STRAIN:WBStrain00005253
9
DOI: 10.64898/2026.09.28.755091
Resource: RRID:WB-STRAIN:WBStrain00005248
Curator: @Apiekniewska
SciCrunch record: RRID:WB-STRAIN:WBStrain00005248
9
DOI: 10.64898/2026.09.28.755091
Resource: RRID:WB-STRAIN:WBStrain00031126
Curator: @Apiekniewska
SciCrunch record: RRID:WB-STRAIN:WBStrain00031126
9
DOI: 10.64898/2026.09.28.755091
Resource: RRID:WB-STRAIN:WBStrain00030973
Curator: @Apiekniewska
SciCrunch record: RRID:WB-STRAIN:WBStrain00030973
9
DOI: 10.64898/2026.09.28.755091
Resource: RRID:WB-STRAIN:WBStrain00034070
Curator: @Apiekniewska
SciCrunch record: RRID:WB-STRAIN:WBStrain00034070
9
DOI: 10.64898/2026.09.28.755091
Resource: RRID:WB-STRAIN:WBStrain00034069
Curator: @Apiekniewska
SciCrunch record: RRID:WB-STRAIN:WBStrain00034069