we now live in a world in which librarians are taking on all kinds of new roles, both within and outside the library.
This article tells the reader about how the role of librarians have changed and continue to do so with advancements in technology.
we now live in a world in which librarians are taking on all kinds of new roles, both within and outside the library.
This article tells the reader about how the role of librarians have changed and continue to do so with advancements in technology.
"Librarianship is a people profession ... If anyone ever thought they’d become a librarian because they liked books or reading, they would be sorely disappointed if they did not also like people too. Libraries of all kinds are keen to demonstrate their value to as wide an audience as possible, and to open up access to culturally significant resources that they hold"
This part stood out to me because it shows how much the role of librarians has changed. It connects to what I’ve learned in this course about information literacy and the importance of helping people understand information, not just access it. It also changed how I view librarians, showing they are active educators and communicators rather than just people who organize books. This idea is especially important in today’s world where people are surrounded by information and need guidance to evaluate it.
Maria Bagshaw (2003), who identified the following as the ten key characteristics of 21st Century librarions: Openness, friendliness, persistence, flexibility, teaching ability, patience, communication, personal attention, subject knowledge and “love of the game” (pp. 120-121).Necia Parker-Gibson (2003), who indicated that the following qualities would be needed: curiosity, communication skills, abroad education, tolerance for change, tolerance of diversity, flexibility, pragmatism, a willingness to seek out new sources of funding, and a sense of humour (pp. 161-165).John Riddle (2003), who argued that librarians need to adapt business management tools and strategies, in particular the use of “behavioral-based candidate selection” to match staff hiring to the needs of particular positions (pp. 131-133).David Stanley (2003), who sees challenges ahead in the areas of technology and collection development, as well as in the need to reach out to secure funding from outside organizations (pp. 135-138).
This source is useful because it includes ideas from multiple authors and perspectives, which strengthens its credibility. It focuses on skills and trends rather than personal opinion, making it informative and relevant to understanding modern librarianship. The purpose of the article is to explain how the profession is evolving and what skills are needed for success, which aligns well with course concepts.
Interpersonal effectiveness, Effective management, Vision, and Cognitive ability
The article identifies key leadership competencies needed for modern librarians, including interpersonal skills, management ability, vision, and critical thinking. These competencies highlight that librarians must not only manage information but also lead, adapt, and make decisions in a constantly changing environment.
we now live in a world in which librarians are taking on all kinds of new roles
This article explains how the role of librarians is changing due to rapid technological advancements. It shows that librarians now take on many different roles beyond traditional book management. The article focuses on the need for new skills, especially leadership, communication, and adaptability, as libraries continue to evolve in a digital world.
states have drawn districts that made Black voters a majority, to ensure those voters could elect candidates of their choice.
Interesting. Couldn't help but draw analogy to the unsuccessful Poona pact resolution in India for ensuring the same for marginalized caste groups (dalits) in India under Dr. B.R. Ambedkar's leadership.
However, research findings consistently demonstrate that people are impacted by the media messages they consume.
This source is credible because it refers to research findings to support its claims about media influence. Including research strengthens the article's reliability and shows that its arguments are based on evidence rather than opinion. The purpose of the article is to educate readers about media literacy, and it effectively uses research to support why these skills are important.
Moreover, studies have shown that media literacy education can help people better discern the truth of media claims, enabling them to detect "fake news" and make more informed decisions.
This part stood out to me because it connects directly to what I’ve learned in this course about evaluating sources and recognizing misinformation. It made me realize how important it is to question what I see online instead of just accepting it as true. I now feel more aware of how media can influence my thoughts and decisions.
We live in a world saturated with media of all kinds, from newspapers to radio to television to the internet.
The article emphasizes that we are constantly surrounded by media in many forms, including television, the internet, and social media. Because of this, it is important to develop skills that help us understand and evaluate the messages we encounter every day.
Media literacy is the ability to apply critical thinking skills to the messages, signs, and symbols transmitted through mass media. It empowers us to make better choices about what we choose to read, watch, and listen to, and helps us become smarter, more discerning members of society.
This article defines media literacy as the ability to use critical thinking to understand and evaluate media messages. It explains that media literacy helps people make better choices about what they consume and allows them to become more informed and thoughtful members of society.
Authoritarianism in all its forms depends on people acting against their own interests, in this case seeing the abdication of agency and giving up of rights as something positive, as almost a relief. Let the leader decide for you! Let the leader, who is an agent of divine providence, decide your destiny! Getting people to believe this is one of the main functions of personality cults that depict the leader as infallible.
Very similar to how Big Tech provides us with convenience while robbing us of our agencies.
by the 1980s Sklar himself had dramatically transvalued his account of corporate liberalism, which he now celebrated as not only benign but even a kind of unconscious, half-recognized American socialism. In Sklar’s hallucinatory prose, corporate capitalism and its Progressive handmaidens achieved a social movement on a par with ‘the Civil War and its aftermath’, to be celebrated because it ‘pacified agrarian populism, transcended proprietary capitalism and, in the inclusive as well as the exclusive sense, contained socialism’. When Sklar died in 2014, he still called himself a leftist but counted John Yoo as a personal friend; he had cut off contact with Judis, but the latter still offered an obituary of more than 10,000 words in The New Republic.
!
926 (Hunter, 2015.)
Describe some of the bars/clubs/other institutions in the town discussed in Gary Hunter's book, and cite specific pages. Would also be great if you included a picture of one of these (Philly Encyclopedia source has one)
e data itself was sourced from FamilySearch.org, and the shapefiles for both states and countries were provided by NaturalEarthData.com.
move sources to end of section, link to the specific pages that this data came from on those sites
patterns of African American migration during the late 19th and early 20th
referred to as the "Great Migration"
restingly enough, some of the people who recorded it even came from outside the United States. 21 of the total 1,380 surveyed in 1930 had immigrated from outside the country—mostly from Europe—but a single person had come from Australi
Move this observation after you talk about discrimination in the South. Transition with something like: "But Lawnside was not only home to those migrating within the United States. Interestingly, ..."
Virginia
and much further than that! Really the whole South
1930s Census
data from the 1930 Census (not multiple years!)
Interactive Map of La
Remove this heading, transition right into a short paragraph describing the map and how the roads have or haven't changed over time. Acknowledge that roads are based on 1943, since this was earliest available USGS topo map. Also add brief sentence explain how to toggle between layers and use swiper. Mention sources of map here, link to them.
Also, I do like the map, but the symbology is hard to read right now: Make the left-side show the simplified version of the historic town (one with my layers), then have the right side be the present-day map with your color road overlay.
he Roads of Lawnside Over Time
Broaden this beyond the the roads to be about the landscape of Lawnside at the moment of incorporation:
Lawnside Incorporated: Birds-Eye View of the Town
ays in which Lawnside grew over time, using the roads that pop up and disappear as referen
rephrase as something like: "Lawnside was officially incorporated in 1926. This map shows the town's historic roads and houses that date back to this period."
Also, while I like your map, maybe display the version with the layers I made showing historic basemap stripped of modern roads, different symbology for houses/roads
The Town and Its People
Remove, no need to repeat title
Instead, add a sub-heading on early history:
"Before Lawnside: Snow Hill"
and equality.
Maybe cite the Peter Mott House website here
Founded in the 19th century,
"Throughout the 19th century, the community of Snow Hill became..."
As one of the oldest communitie
Is it one of the oldest in the state? Rephrase: "The town, originally known as Snow Hill, dates back to the 18th century and holds a unique place as...
.
I like the license image, but also list out the use terms above this.
milySearch. https://www.familysear
Be more specific, list out the number for the specific set of enumeration sheets/census you looked at, and link to the first page.
ciation of American State Geologists. National Geologic Map Database. https://ngmdb.usgs.gov/ngmdb/ngmdb_home
Did you actually use this source? For the Topo maps you used, you'd actually list the name of the map, then link to USGS TopoView (you might even be able to find how TopoView wants maps cited).
e Encyclopedia of Greater Philadelphia. “Lawnside, New Jersey.” https://philadelphiaencyclopedia.org/locations/lawnside-new-jersey/
For web-based citations, you can actually hyper link on the title instead of listing out the entire URL. Need to do this for every source.
Also needed the author for this page. Here's a formatting example: Jason Romisher. “Lawnside, New Jersey,” The Encyclopedia of Greater Philadelphia. 2019.
The Sources We Used
Just: "Sources and Data"
About The Projec
Place the heading to the left and rename: "Methods" or "Building the Project"
Chapter 14 we see there love blossoming as they choose to run away together to the Everglades. We also see the playful nature that everyone interacts and the live teacake has as he longs for her even when he sees her in the evenings
Building clarity and shared language between and among students, fami- lies, and educators mobilizes commitment and action to develop the com- petencies that allow all students to flourish.
I feel like this is a forever goal of public education to communicate and build this clarity and shared language between students, families and educators. I feel like in our very transient, multi-lingual, Title-1 school environment where students enroll and unenroll every week, it is hard to maintain communication and build classroom & school community but we are always trying our best.
s milestone marked the beginning of its history as a predominantly African American community. Lawnside’s historical significance lies in its representation of the freedom gained by African Americans during the era of slavery.
Need to greatly expand this paragraph specifically about the 100 year old houses. Explain that many homes in the town today date before the town's incorporation, how users can explore these homes (map or gallery), and how you built this data (tax records with link to the site, google maps screenshots and photos taken by Shamele Jordan).
Also add a heading for the gallery below.@
Lawnside, once know
Following formatting on other pages: Maybe add heading ("Mapping Historic Homes of Lawnside") and large italics that says something about houses/purpose of page: "Explore homes in Lawnside that date back before the town's incorporation."
ROGOFF: I hope so. I think he’s the best chance that Argentina’s had in a long time, which is, fair to say, a very low bar. The thing that he’s done that I have not seen before is balancing the budget. If you’re a big borrower and you keep defaulting, a starting point is figuring out how not to have to borrow money, and he’s managed to do that. I don’t know that all his libertarian visions necessarily will come to pass, but he’s provided some stability, bringing inflation down.
Dammit
anie wanted to ask Hezekiah about Tea Cake, but she was afraid he might misunderstand her and think she was interested. In the first place he looked too young for her. Must be around twenty-five and here she was around forty. Then again he didn’t look like he had too much. Maybe he was hanging around to get in with her and strip her of all that she had. Just as well if she never saw him again. He was probably the kind of man who lived with various women but never married. Fact is, she decided to treat him so cold if he ever did foot the place that he’d be sure not to come hanging around there again.
Janie was kinda unsure about tea cake because she was thinking he was too young and maybe not trustworthy so she had decided to be like off with him
Chapter 11 we see the tension grow as the townspeople gossip about there relationship we also see the confusion of love and questioning. though we eventually see the them get together from love in the dating stage
They played away the evening again. Everybody was surprised at Janie playing checkers but they liked it. Three or four stood behind her and coached her moves and generally made merry with her in a restrained way. Finally everybody went home but Tea Cake.
Jaime seems like she is now able to connect to others unlike before.
Chapter 11 is where Janie stops being afraid. She knows people in town are already talking, "He's too young" and "He's after her money" but she chooses Tea Cake anyway. The moonlight scene is so intimate and honest. When he sneaks into her room just to sit and talk, not to take anything from her, she finally trusts him. Her line "Ah ain't never been treated dis way" says everything. For the first time in her life, she's choosing love with her eyes wide open.
“Me scramble ’round tuh git de money tuh take yuh—been workin’ lak uh dawg for two whole weeks—and she come astin’ me if Ah want her tuh go! Puttin’ mahself tuh uh whole heap uh trouble tuh git dis car so you kin go over tuh Winter Park or Orlandah tuh buy de things you might need and dis woman set dere and ast me if Ah want her tuh go!”
Tea Cake worked hart to get enough money to take Janie with him to the Sunday School picnic. He looks like he enjoys doing its of things for Janie to make her happy.
Fact is, she decided to treat him so cold if he ever did foot the place that he’d be sure not to come hanging around there again.
Janie was trying to forget about the feelings she is having for Tea cake by pushing him away and acting cold to him.
All next day in the house and store she thought resisting thoughts about Tea Cake.
She’s unsure about getting with tea cake because of her experience with relationships in the past
Tea Cake fell in beside her and mounted the porch this time. So she offered him a seat and they made a lot of laughter out of nothing.
They are already much closer then what Janie was with joe.
Well, is he—he—is he got uh wife or something lak dat? Not dat it’s any uh mah business.” She held her breath for the answer
Janie is hoping that he is single, because he is such a good man and treats her well, im thinking she wants to marry him because he is the only man she has ever felt happy around
It seems like the town is trying to control Janie’s relationship
He’s just saying anything for the time being, feeling he’s got me so I’ll b’lieve him
She was still scared from her past relationships.
Business was dull all day, because numbers of people had gone to the game. She decided to close early, because it was hardly worth the trouble of keeping open on an afternoon like this. She had set six o’clock as her limit.
This is talking about how it was a pretty slow day and there was no business so that she decided to close early because of the baseball game
Because numbers of people had gone to the game
After years of watching Janie shrink under Jody's control, seeing Tea Cake walk into the store and treat her like a real person is almost startling. He doesn't call her "Mrs. Starks" he calls her "Janie." He doesn't order her around, he teaches her checkers. That game is everything Jody never bothered to teach her, but Tea Cake sits right down and plays with her like an equal. For the first time, Janie laughs freely, and you can feel something waking up inside her.
She looked him over and got little thrills from every one of his good points. Those full, lazy eyes with the lashes curling sharply away like drawn scimitars. The lean, over-padded shoulders and narrow waist. Even nice!
Janie is more excited by Tea Cake and is noticing all his features. Janie is starting to like Tea Cake.
Janie was halfway down the palm-lined walk before she had a thought for her safety
She already feel comfort with tea cake and they had barley meet.
She looked him over and got little thrills from every one of his good points. Those full, lazy eyes with the lashes curling sharply away like drawn scimitars. The lean, over-padded shoulders and narrow waist. Even nice!
She finds him very attractive and is really interested in him
He set it up and began to show her and she found herself glowing inside
Someone is finally treating Janie right, she is getting what she deserves and is finding herself. Janie enjoys tea cake is the only man that she finds comfortable to be around
She handed over the cigarettes and took the money. He broke the pack and thrust one between his full, purple lips.
She handed over the cig to take some money,
Janie was halfway down the palm-lined walk before she had a thought for her safety. Maybe this strange man was up to something! But it was no place to show her fear there in the darkness between the house and the store. He had hold of her arm too. Then in a moment it was gone. Tea Cake wasn’t strange. Seemed as if she had known him all her life
Janie and tea cake end up spending a lot of time together
Chapter 10Janie meets Tea Cake, and for the first time she feels seen, playful, and equal—showing the start of a new, more joyful chapter in her life.
Earlier versions of this model carried a separate
Make it clearer here initially that these micronutrients seems to be only a tiny cost, anyways.
Also you don't need to make the quote "April 2026" change part of the header - perhaps just make that a note or a tooltip. This is too much discussion of our process
All costs in this model are expressed
Expressed in the equations and initial computation that is -- on the dashboard, you can see the adjusted
he CDMO toll is sampled from a lognormal distribution (default p5 = $4/kg, p95 = $40/kg) representing the range of per-kg fees a future food-grade contract manufacturer might charge. See the CDMO mode section below for a full description.
Is it reasonable to think of the CDMO total as being per kilogram? Or is that just the result of other computations? Look for references in discussion about this to verify
Return to: Interactive Cost Model | New to this topic? How Cultured Chicken is Made | Audio Review (MP3) | Workshop (May 2026)
Let's update the audio review with new content
Janie continues to run the store
Like all the other tumbling mud-balls, Janie had tried to show her shine.
This is a analogy showing that like all the other people struggling she had to find away to present herself in a way people would like
They felt that it was not fitting to mention desire to the widow of Joseph Starks.
Many people wanted her romantically but it wasn’t appropriate given the circumstances
Janie isn’t truly sad after Joe’s death—instead, she feels free for the first time and begins discovering who she really is without being controlled.
Save / share this scenario:
The ability to do this should be a bit more prominent and signposted perhaps at the top and the very bottom as well. Ideally there should be a way to save this and then have a page that gives a side-by-side comparison of the results from two scenarios without extra clutter ... This would be particularly useful if it's something that's easy to develop.
For now you can explain (tooltip) how you could do something like this by copying two shareable links and looking them in side-by-side browsers, or saving the results somewhere and feeding it into an LLM to ask it to give a comparative analysis
Cell Density / Media-Use Override Code viewof override_mode_constraints = Inputs.toggle({ label: html`Override process mode constraints <abbr style="cursor:help;text-decoration:underline dotted;font-size:0.85em;color:#888;" title="When ON: process-mode sampling is bypassed and you can specify density and media-use ranges directly. Useful for experts wanting to model specific bioreactor configurations.">(?)</abbr>`, value: urlBool("override_mode_constraints", false) }) Override process mode constraints (?)override_mode_constraints = false Code viewof density_lo = Inputs.range([10, 100], { value: urlNum("density_lo", 30), step: 10, label: "Cell Density Low (g/L)" }) viewof density_hi = Inputs.range([50, 300], { value: urlNum("density_hi", 200), step: 10, label: "Cell Density High (g/L)" }) Cell Density Low (g/L) density_lo = 30 Cell Density High (g/L) density_hi = 200 What is cell density and why does it matter so much? (click to expand) Cell density (g/L at harvest) determines how much meat you get per liter of bioreactor volume. Higher density means less media per kilogram of product, which directly reduces the largest variable cost. Density Media per kg Typical context 10 g/L ~100 L/kg Current lab scale 50 g/L ~20 L/kg Near-term commercial target 200 g/L ~5 L/kg Optimistic TEA projection This is multiplicative. If media costs $1/L, going from 10 to 50 g/L cuts media cost from $100/kg to $20/kg. Going to 200 g/L cuts it to $5/kg. Cell density is arguably the single most important technical parameter for cost reduction. Current state: Most published data shows 10-50 g/L. Some companies claim higher, but these claims are difficult to verify independently. Lever VC’s 2025 report claims 60-90 g/L has been achieved by “second generation” companies. Whether 200 g/L is achievable by 2036 is a genuine open question. What about bioreactor volume / tank size? (click to expand) Bioreactor volume is another major uncertainty that is currently implicit in this model rather than a direct parameter. The model computes total working volume as: total_volume = annual_output / (density × productivity × 365). It then applies a power-law scaling for CAPEX. But individual bioreactor tank size matters for several reasons: Factor Small tanks (2,000-5,000L) Large tanks (20,000-50,000L) Cost per liter Higher Lower (economies of scale) Contamination risk Lower Higher (single failure = large loss) Mixing/O2 transfer Easier Harder at scale Flexibility More modular Less redundancy Industry precedent Pharma standard Requires new engineering Key debate: Some companies (e.g., Vow) claim to have built 20,000L bioreactors for under $1M in 14 weeks using custom food-grade designs. If true, this dramatically changes the CAPEX picture. Humbird’s analysis assumed pharma-grade bioreactors at $50-500/L. Why it’s not a direct slider (yet): Adding individual tank size would require modeling the number of tanks, contamination batch-failure rates, and the trade-off between scale and reliability. This is a planned enhancement. For now, the Plant Capacity and Cell Density parameters together determine total working volume, and the custom reactor ratio (in full view) captures the pharma-vs-food-grade cost difference. Workshop discussion: This is one of the key cruxes for the upcoming CM workshop — what bioreactor scale is realistic, and what does it cost? Advanced: Media-use multiplier (×) What is this — and why can it be below 1? (click to expand) The model computes media volume per kg as (1000 / density) × multiplier. A value of 1 is traditional batch mode (fill reactor once, harvest); >1 is perfusion (multiple media-volume equivalents flow through during the run); <1 represents media recycling, fed-batch with concentrated feeds, or harvest-side cell concentration. The Learn page walks through all three mechanisms. Why the range changed (April 2026): the default p5–p95 was tightened from 1–10× to 0.5–3.0×. The old floor of 1.0 was too restrictive — the GFI 2023 cost-competitive scenarios assume 8–13 L/kg, which at 60–90 g/L density implies a multiplier of roughly 0.5–1.2. A floor of 1.0 mechanically excluded those scenarios no matter how high you pushed density. The new range covers both recycled/fed-batch (<1) and standard perfusion (up to ~3×); values of 5–10× remain plausible for heavily media-intensive processes but are now a stress-test region rather than the default. Show multiplier sliders Code viewof media_turnover_lo = Inputs.range([0.25, 2], { value: urlNum("media_turnover_lo", 0.5), step: 0.05, label: "Media-use multiplier p5 (low end)" }) viewof media_turnover_hi = Inputs.range([1, 10], { value: urlNum("media_turnover_hi", 3.0), step: 0.1, label: "Media-use multiplier p95 (high end)" }) Media-use multiplier p5 (low end) media_turnover_lo = 0.5 Media-use multiplier p95 (high end) media_turnover_hi = 3 Code // URL state writer: serialize every viewof value that DIFFERS FROM ITS // DEFAULT into ?key=val pairs, then debounce-write to the URL via // history.replaceState. Critical invariant: if every slider is at its // default, the URL stays bare (pathname + hash only) — no query string. // This is required so Hypothes.is can find annotations on the canonical // bare URL; a polluted URL breaks annotation lookup for every visitor. // The writer depends on every viewof name below so OJS re-runs it // whenever any input changes. Reads nothing from urlParams. { // Hard-coded defaults must stay in sync with each Inputs.range() / // Inputs.toggle() declaration above and with the reset_adoption button. const defaults = { simpleMode: true, include_blending: false, blending_share: 0.25, filler_cost: 3, include_capex: true, include_fixed_opex: true, include_downstream: false, cdmo_mode: false, cdmo_toll_p5: 4, cdmo_toll_p95: 40, bundled_media: false, bundled_media_p5: 50, bundled_media_p95: 500, plant_capacity: 20, uptime: 0.90, maturity: 0.5, target_year: 2036, p_fedbatch: 0.20, p_perfusion: 0.50, p_continuous: 0.30, override_mode_constraints: false, p_hydro: 0.75, p_recfactors: 0.5, gf_progress: 50, wacc_lo: 8, wacc_hi: 20, asset_life_lo: 8, asset_life_hi: 20, density_lo: 30, density_hi: 200, media_turnover_lo: 0.5, media_turnover_hi: 3.0 }; const state = { simpleMode, include_blending, blending_share, filler_cost, include_capex, include_fixed_opex, include_downstream, cdmo_mode, cdmo_toll_p5, cdmo_toll_p95, bundled_media, bundled_media_p5, bundled_media_p95, plant_capacity, uptime, maturity, target_year, p_fedbatch, p_perfusion, p_continuous, override_mode_constraints, p_hydro, p_recfactors, gf_progress, wacc_lo, wacc_hi, asset_life_lo, asset_life_hi, density_lo, density_hi, media_turnover_lo, media_turnover_hi }; const usp = new URLSearchParams(); let hasDiff = false; for (const [k, v] of Object.entries(state)) { const def = defaults[k]; let matches; if (typeof v === "boolean") matches = (v === def); else if (typeof v === "number") matches = Math.abs(v - def) < 1e-9; else matches = (v === def); if (!matches) { hasDiff = true; if (typeof v === "boolean") usp.set(k, v ? "1" : "0"); else if (typeof v === "number" && Number.isFinite(v)) usp.set(k, String(v)); } } if (window._urlWriteTimer) clearTimeout(window._urlWriteTimer); window._urlWriteTimer = setTimeout(() => { try { const newUrl = hasDiff ? (location.pathname + "?" + usp.toString() + location.hash) : (location.pathname + location.hash); history.replaceState(null, "", newUrl); } catch (e) { console.warn("URL state update failed:", e); } }, 300); return null; } null
This bit at the bottom seems to have generated some sort of error. It says "null"
doption, reactor costs, and financing. High maturity = correlated improvements.
I'm going to link the fuller explanation in the formula and explainers page
→ Open Advanced Model with these settings
I think it's more like "starting with these settings," or "adapting the parameters you've entered here."
How is this cost calculated?
I think we need a bit more explanation here, perhaps even including some unfolded quick points about what kind of model this is, how the uncertainty comes in through simulations, etc., and what we're assuming about correlation or lack thereof between the different elements. We don't want to keep this simple and short but people should have some idea of what exactly they're looking at
Full formula documentation → Model formulas & metrics Code html`<div style="margin-top:1.5rem; padding:0.8rem; background:#f0f8ff; border:1px solid #3498db; border-radius:6px; font-size:0.88em;"> <strong>Want more control?</strong> The <a href="index.html">Advanced Model</a> exposes all parameters: financing (WACC, asset life), plant capacity, cell density, media-use multiplier, CDMO mode, bundled media pricing, and more. <div style="margin-top:0.5rem;"> <a href="${(() => { const cont=Math.max(0,100-p_fedbatch_s-p_perfusion_s); const p=new URLSearchParams({target_year:target_year_s,p_hydro:(p_hydro_s/100).toFixed(2),p_recfactors:(p_recfactors_s/100).toFixed(2),p_fedbatch:(p_fedbatch_s/100).toFixed(2),p_perfusion:(p_perfusion_s/100).toFixed(2),p_continuous:(cont/100).toFixed(2),include_blending:include_blending_s?1:0,blending_share:(blending_share_s/100).toFixed(2)}); return 'index.html?'+p.toString(); })()}" style="font-weight:600;">→ Open Advanced Model with these settings</a> </div> </div>`
I think those formula explanations pertain to the full model. Perhaps it would be better to have this linked directly to a new page or part of the page that just explains this simpler model
Always included
Again, at what rate, and what's the reference for this particular rate? Is it given as a fixed value or a distributional draw?
included
Included, but at what rate/what value? And what's the reference or source for this?
8–20% range Typical food/biotech financing range
Explain this more. Are we drawing this from this particular distribution? Make a note or a tool tip about how the results are generally not particularly sensitive to this parameter, given the explanation you gave before, where the capital costs are really a rather small component in this context.
Parameter Value Why fixed Industry Maturity 0.5 (neutral) At 0.5 the maturity factor has zero net effect on probabilities or financing
This explanation is incomplete or it just doesn't make sense. Can you elaborate, and why is this the baseline you think maturity should matter for something?
Probability Thresholds Code { function card(thresh, prob, label, color, bprob) { const bc = prob > 30 ? color : '#ddd'; const blend = include_blending_s && bprob !== undefined ? `<div style="font-size:0.8em; color:#1a5276; background:#f0f8ff; border-radius:3px; padding:2px 5px; margin-top:4px;"> Blended: <strong>${bprob.toFixed(1)}%</strong> chance < $${thresh}/kg </div>` : ''; return `<div style="border:2px solid ${bc}; padding:0.9rem; border-radius:8px; text-align:center;"> <h5 style="margin:0 0 0.2rem;">P(Pure cells < $${thresh}/kg)</h5> <h2 style="color:${color}; margin:0.2rem 0;">${prob.toFixed(1)}%</h2> <small style="color:#666;">${label}</small> ${blend} </div>`; } const grid = `<div class="grid" style="grid-template-columns:repeat(4,1fr); gap:0.75rem; margin-bottom:1.5rem;"> ${card(10, stats_s.prob_10, 'could approach conventional chicken (~$5-10/kg retail)', '#27ae60', stats_s.bprob_10)} ${card(25, stats_s.prob_25, 'range where premium cultured products may be viable', '#3498db', stats_s.bprob_25)} ${card(50, stats_s.prob_50, 'potential niche/specialty market', '#f39c12', null)} ${card(100, stats_s.prob_100, 'substantially below current lab-scale costs', '#e74c3c', null)} </div>`; const blendRow = include_blending_s ? ` <p style="font-size:0.88em; color:#1a5276; font-weight:500; margin:0.5rem 0 0.3rem;"> Blended product (${stats_s.bs*100|0}% CM + ${((1-stats_s.bs)*100)|0}% filler at $3/kg) — consumer-relevant prices: </p> <div class="grid" style="grid-template-columns:repeat(3,1fr); gap:0.6rem; margin-bottom:1.5rem;"> <div style="border:2px solid ${stats_s.bprob_5>20?'#27ae60':'#ddd'}; padding:0.8rem; border-radius:8px; text-align:center;"> <h5 style="font-size:0.85em; margin:0 0 0.2rem;">P(Blend < $5/kg)</h5> <h2 style="color:#27ae60; margin:0.2rem 0;">${stats_s.bprob_5.toFixed(1)}%</h2> <small>competitive with conventional chicken</small> </div> <div style="border:2px solid ${stats_s.bprob_8>30?'#3498db':'#ddd'}; padding:0.8rem; border-radius:8px; text-align:center;"> <h5 style="font-size:0.85em; margin:0 0 0.2rem;">P(Blend < $8/kg)</h5> <h2 style="color:#3498db; margin:0.2rem 0;">${stats_s.bprob_8.toFixed(1)}%</h2> <small>competitive with premium chicken/beef</small> </div> <div style="border:2px solid ${stats_s.bprob_12>50?'#f39c12':'#ddd'}; padding:0.8rem; border-radius:8px; text-align:center;"> <h5 style="font-size:0.85em; margin:0 0 0.2rem;">P(Blend < $12/kg)</h5> <h2 style="color:#f39c12; margin:0.2rem 0;">${stats_s.bprob_12.toFixed(1)}%</h2> <small>affordable specialty market</small> </div> </div>` : ''; return html([grid + blendRow]); } TypeError: Cannot read properties of null (reading 'toFixed')
The probability thresholds yield this error when you select that you want to show blended product.
TypeError: Cannot read properties of null (reading 'toFixed')
I'm getting "TypeError: Cannot read properties of null (reading 'toFixed')" for the probability thresholds here
Blended Product Code viewof include_blending_s = Inputs.toggle({ label: "Show blended product analysis", value: urlBool_s("include_blending", false) })
A bit more signposting here, please. Tooltip, if it will fit nicely. Maybe move this one to the top. And make it selected by default.
Projected 2036 Cost Distribution:where(.plot-d6a7b5) { --plot-background: white; display: block; height: auto; height: intrinsic; max-width: 100%; } :where(.plot-d6a7b5 text), :where(.plot-d6a7b5 tspan) { white-space: pre; }
Make it easier to expand this or zoom in on it, perhaps making it full screen. However, type tool tips within the graph could also be helpful, to be able to see the lower percentiles better. I'm not seeing the P80 here.
A first look at cultured chicken cost — for exploration and understanding
You can leave this out because the caution below gets at it.
Year
Important. Nothing seems to be changing when I change the projection year! I would think that this model allows for technological change, even if they don't explicitly set the equitment maturity parameter"!
Continuous (auto): 35%
Let them set all three, but still have them automatically add up.
These parameters need a lot more explanation.
I think we can use this space better here. If you're only going to be showing a small set of "results" tables (maybe with others in folding boxes), you could just put these below the results, allowing a more fleshed out and spacious explanation of what the parameters mean, rather than this sidebar.
xposes only the biggest levers on cultured chicken
that's potentially too strong a claim. yes, some of the most important levers are here, but we also focused on the ~'simpler' elements requiring less explanation #implement.
I'd say something like "the simplest model lets you adjust some of the more important levers..."
38.7% chance blended product (25% CM, $3/kg filler) < $10/kg
This is basically also given in the boxes below, but with slightly different thresholds, which is confusing.We only need one or the other, as far as I understand it. Simplify (if this is also the case in the intermediate sluttage advanced model, fix it there too. )
He was lying on his side facing the door like he was expecting somebody or something. A sort of changing look on his face. Weak-looking but sharp-pointed about the eyes. Through the thin counterpane she could see what was left of his belly huddled before him on the bed like some helpless thing seeking shelter.
Jody was very sick and weak but Janie still had a little bit of love for him so she came to check on him
The quiet was deceptive and hid underlying tension and potential conflict.
efore the Civil War, the town served as an important stop on the underground railroad and a place for formerly enslaved individuals to settle down. The town continued to grow and thrive throughout the 19th century and was home to churches, schools, and other Black owned businesses.(Hunter, Gary J. Neighborhoods of Color African American Communities in Southern New Jersey, 1638-2000. 2015
Save this for your historical background in the "town and its people" section." Instead, include a brief paragraph describing the moment of incorporation in 1926 (I left notes about this earlier on a Google Doc Kiona shared with me). Then add a sentence stating what your project is about and how users can explore it.
y.
"back to the 18th century and growing into a center of African American life throughout the 19th century."
and it's change over time.
Don't really show change over time, instead provide a snapshot of the town at the time of its incorporation in 1926.
Lawnside: An Everchanging Town
I think your site title may need to change. Instead of "An Ever changing town," maybe make it "Lawnside, 1926: The Borough at 100."
eLife Assessment
This important study introduces LUNA, a new autofocusing method that achieves nanoscale precision and robustly corrects focus drift during time-lapse microscopy, improving imaging under temperature shifts. The authors exploit this technical advance to investigate the bacterial cold shock response, providing convincing evidence that individual cells continue to grow and divide in a highly coordinated process that cannot be observed in population-level measurements. This work offers a technical and conceptual framework for reconciling discrepancies between bulk and single-cell growth measurements, with broad relevance for cell biology and microbiology.
Reviewer #1 (Public review):
Summary:
The authors present a new autofocusing method, LUNA (Locking Under Nanoscale Accuracy), designed to overcome severe focus drift, a major challenge in long-term time-lapse microscopy. Using this method, they address a fundamental question in bacterial cold shock response: whether cells halt growth and division following an abrupt temperature downshift. Through single-cell analysis, the authors uncover a multi-phase adaptation process with distinct growth deceleration dynamics, and show that bacterial cells adapt to cold shock in a largely uniform manner across the population. Overall, this work provides new insights into the bacterial cold shock response at the single-cell level, extending beyond what can be inferred from population-level measurements.
Strengths:
(1) The LUNA method shows improved performance compared to existing autofocusing systems, achieving nanoscale precision over a large focusing range. Its focusing speed is sufficient for the experiments presented, with potential for further improvement through faster motors and optimized control algorithms, suggesting broad applicability. Theoretical simulations and experimental validation together provide strong support for the method's robustness.
(2) Using LUNA, the authors address a long-standing question in bacterial physiology: whether cells arrest growth and division during the acclimation phase following cold shock. Single-cell analyses across the full course of cold adaptation reveal features that are obscured in bulk-culture studies. Cells continue to grow and divide at reduced rates while maintaining cell size regulation, and exhibit a three-phase adaptation program with distinct growth dynamics. This response appears uniform across the population, with no evidence for bet-hedging. Overall, the experiments are well designed, and the analyses are solid and support the authors' conclusions.
(3) The authors further propose a model describing how population-level optical density (OD) depends on cell dry mass density, volume, and concentration. Following cold shock, cells grow more slowly and exhibit smaller sizes, explaining the apparently unchanged OD. This model provides a valuable conceptual framework for interpreting OD-based growth measurements, a widely used method in microbiology, and will be of broad interest to the field.
Weaknesses:
No major weaknesses identified.
Comments on revisions:
The authors have thoroughly addressed all of my questions. I thank them for their clear clarifications and thoughtful revisions, and I greatly appreciate their efforts in improving the manuscript.
Reviewer #2 (Public review):
Summary:
This study presents LUNA, an autofocus method that compensates for focus drift during rapid temperature changes. Using this approach, the authors show that E. coli cells continue to grow and divide during cold shock, revealing a coordinated, multi-phase adaptation process that could not be deduced from traditional population measurements. They propose a scattering-theory-based model that reconciles the paradox between growth differences of the bacteria at the single-cell level vs population level.
Strengths:
(1) The LUNA approach is pretty creative, turning coma aberration from what is normally a nuisance into an exploit. LUNA enabled long-term single-cell imaging during rapid temperature downshifts.
(2) The authors show that the long-assumed growth arrest during cold shock from population-level measurements is misleading. At the single-cell level, bacteria do not stop growing or dividing but undergo a continuous, three-phase adaptation process. Importantly, this behavior is highly synchronized across the population and not based on bet-hedging.
(3) Finally, the authors propose a model to resolve a long-standing paradox between single-cell vs population behavior: if cells keep growing, why does optical density (OD) of the culture stop increasing? Using light-scattering theory, they show that OD depends not only on cell number but also on cell volume, which decreases after cold shock. As a result, OD can remain flat, or even decrease, despite continued biomass accumulation. This demonstrates that OD is not a reliable proxy for growth under non-steady conditions.
Weaknesses:
(1) While the authors theoretically explain the advantages of LUNA over existing autofocus methods, it is unclear whether practical head-to-head comparisons have been performed, apart from the comparison to Nikon PFS shown in Video S1. As written, the manuscript gives the impression that only LUNA can solve this problem, but such a claim would require more systematic and rigorous benchmarking against alternative approaches.
(2) No mutants/inhibitors used to test and challenge the proposed model.
(3) Cells display a high degree of synchronization, but they are grown in confined microfluidic channels under highly uniform conditions. It is unclear to what extent this synchrony reflects intrinsic biology versus effects imposed by the microfluidic environment.
(4) To further test and generalize the model, it would be informative to also examine bacterial responses at intermediate temperatures rather than focusing primarily on a single cold-shock condition.
Comments on revisions:
The authors have addressed my comments in their response, but have chosen not to incorporate most of them into the manuscript. Readers may refer to the peer review section for further details.
Author response:
The following is the authors’ response to the current reviews.
Public Reviews:
Reviewer #1 (Public review):
Summary:
The authors present a new autofocusing method, LUNA (Locking Under Nanoscale Accuracy), designed to overcome severe focus drift, a major challenge in long-term time-lapse microscopy. Using this method, they address a fundamental question in bacterial cold shock response: whether cells halt growth and division following an abrupt temperature downshift. Through single-cell analysis, the authors uncover a multi-phase adaptation process with distinct growth deceleration dynamics, and show that bacterial cells adapt to cold shock in a largely uniform manner across the population. Overall, this work provides new insights into the bacterial cold shock response at the single-cell level, extending beyond what can be inferred from population-level measurements.
Strengths:
(1) The LUNA method shows improved performance compared to existing autofocusing systems, achieving nanoscale precision over a large focusing range. Its focusing speed is sufficient for the experiments presented, with potential for further improvement through faster motors and optimized control algorithms, suggesting broad applicability. Theoretical simulations and experimental validation together provide strong support for the method's robustness.
(2) Using LUNA, the authors address a long-standing question in bacterial physiology: whether cells arrest growth and division during the acclimation phase following cold shock. Single-cell analyses across the full course of cold adaptation reveal features that are obscured in bulk-culture studies. Cells continue to grow and divide at reduced rates while maintaining cell size regulation, and exhibit a three-phase adaptation program with distinct growth dynamics. This response appears uniform across the population, with no evidence for bet-hedging. Overall, the experiments are well designed, and the analyses are solid and support the authors' conclusions.
(3) The authors further propose a model describing how population-level optical density (OD) depends on cell dry mass density, volume, and concentration. Following cold shock, cells grow more slowly and exhibit smaller sizes, explaining the apparently unchanged OD. This model provides a valuable conceptual framework for interpreting OD-based growth measurements, a widely used method in microbiology, and will be of broad interest to the field.
Weaknesses:
No major weaknesses identified.
Comments on revisions:
The authors have thoroughly addressed all of my questions. I thank them for their clear clarifications and thoughtful revisions, and I greatly appreciate their efforts in improving the manuscript.
We sincerely thank the reviewer’s for the encouraging comments and positive assessment. We greatly appreciate the reviewer’s constructive feedback during the review process, which helped us improve the manuscript.
Reviewer #2 (Public review):
Summary:
This study presents LUNA, an autofocus method that compensates for focus drift during rapid temperature changes. Using this approach, the authors show that E. coli cells continue to grow and divide during cold shock, revealing a coordinated, multi-phase adaptation process that could not be deduced from traditional population measurements. They propose a scattering-theory-based model that reconciles the paradox between growth differences of the bacteria at the single-cell level vs population level.
Strengths:
(1) The LUNA approach is pretty creative, turning coma aberration from what is normally a nuisance into an exploit. LUNA enabled long-term single-cell imaging during rapid temperature downshifts.
(2) The authors show that the long-assumed growth arrest during cold shock from population-level measurements is misleading. At the single-cell level, bacteria do not stop growing or dividing but undergo a continuous, three-phase adaptation process. Importantly, this behavior is highly synchronized across the population and not based on bet-hedging.
(3) Finally, the authors propose a model to resolve a long-standing paradox between single-cell vs population behavior: if cells keep growing, why does optical density (OD) of the culture stop increasing? Using light-scattering theory, they show that OD depends not only on cell number but also on cell volume, which decreases after cold shock. As a result, OD can remain flat, or even decrease, despite continued biomass accumulation. This demonstrates that OD is not a reliable proxy for growth under non-steady conditions.
Weaknesses:
(1) While the authors theoretically explain the advantages of LUNA over existing autofocus methods, it is unclear whether practical head-to-head comparisons have been performed, apart from the comparison to Nikon PFS shown in Video S1. As written, the manuscript gives the impression that only LUNA can solve this problem, but such a claim would require more systematic and rigorous benchmarking against alternative approaches.
(2) No mutants/inhibitors used to test and challenge the proposed model.
(3) Cells display a high degree of synchronization, but they are grown in confined microfluidic channels under highly uniform conditions. It is unclear to what extent this synchrony reflects intrinsic biology versus effects imposed by the microfluidic environment.
(4) To further test and generalize the model, it would be informative to also examine bacterial responses at intermediate temperatures rather than focusing primarily on a single cold-shock condition.
Comments on revisions:
The authors have addressed my comments in their response, but have chosen not to incorporate most of them into the manuscript. Readers may refer to the peer review section for further details.
We thank the reviewer for this additional comments and for the careful suggestions, and we appreciate that the raised points are valuable for a broader discussion of the topic. In the revised manuscript, we have incorporated the comments most directly relevant to the scope and central conclusions of the study, and have clarified these points in the text where appropriate. Specifically, we have clarified several key issues, including the interpretation of the OD lag as a “combined effect,” the performance and application scope of LUNA, the alignment of cell-cycle progression after cold shock, and relevant methodological details.
For the remaining contextual issues, we have kept the detailed discussion in the response to reviewers rather than expanding the manuscript extensively, so as to preserve the focus and readability of the main text. We hope that the revisions now better acknowledge the reviewer’s concerns while maintaining a concise presentation of the central findings.
The following is the authors’ response to the original reviews.
Public Reviews:
Reviewer #1 (Public review):
Summary:
The authors developed a new autofocusing method, LUNA (Locking Under Nanoscale Accuracy), to address severe focus drift-a major challenge in time-lapse microscopy. Using this method, they tackle a fundamental question in bacterial cold shock whether cells halt growth and division following an abrupt temperature downshift. Overall, the experimental design, modeling, and data analysis are solid and well executed. However, several points require clarification or further support to fully substantiate the authors' conclusions.
Strengths:
(1) The LUNA method outperforms existing autofocusing systems with nanoscale precision over a large focusing range. The focusing time is reasonable for the presented experiments, and the authors note potential improvements by using faster motors and optimized control algorithms, suggesting broad applicability. The theoretical simulations and experimental validation provide solid support for the robustness of the method.
(2) Using LUNA, the authors address a long-standing question in bacterial physiology: whether cells arrest growth and division after an abrupt cold shock. Single-cell analyses monitoring the entire course of cold adaptation and steady-state growth reveal features that are obscured in bulk-culture studies: cells continue to grow at reduced rates with smaller cell sizes, resulting in an apparently unchanged population-level OD. The experiments are well designed and analyses are generally solid and largely support the authors' conclusions.
(3) The authors also propose a model describing how population-level OD measurements depend on cell dry mass density, volume, and concentration. This provides a valuable conceptual contribution to the interpretation of OD-based growth measurements, which remain a gold-standard method in microbiology.
We thank the reviewer for acknowledging the strengths of our study.
Weaknesses:
(1) It is unclear whether the author's model explaining the population-level OD during acclimation is broadly applicable. Most analyses focus on a shift from 37˚C to 14˚C, where the model agrees well with experimental data. However, in the 37˚C to 12˚C experiment, OD600 decreases after cold shock (Fig. 5e), and the computed OD does not match the experimental measurements (Fig. S16a). Although the authors attribute this discrepancy to a "complicated interplay," no further explanation is provided, which limits confidence in the model's general applicability.
Thank you for this careful evaluation regarding the model generality. In the experiment with a temperature shift from 37°C to 12°C, the measured OD600 values were 0.243 at 0 hours and 0.242 at 5 hours. In comparison, our model-computed OD600 values were 0.243 at 0 hours and 0.271 at 5 hours. The absolute difference between the measured and computed values at 5 hours is therefore 0.028.
Given the typical experimental variability in OD600 measurements and the limited linear range of the OD-to-biomass approximation (generally considered reliable below ~0.5), this deviation is quantitatively modest. We appreciate your valuable feedback and are happy to provide further clarification if needed.
(2) The manuscript proposes that cell-cycle progression becomes synchronized across the population after cold shock, but the supporting evidence is not fully convincing. If synchronization refers primarily to the uniform reduction in growth rate following cold shock, this could plausibly arise from global translation inhibition affecting all cells. However, the additional claim that "cells encountering a relatively late CSR will accelerate division to maintain synchronization" is not strongly supported by the presented data.
We appreciate your critical reading, which has helped us identify ambiguities in our terminology and strengthen the clarity of our work. Regarding the term “synchronization”, we would like to clarify that it refers to two different scenarios: (i) the synchrony in the timing of growth rate changes after cold shock. The cells initiate the slowdown in growth almost simultaneously, suggesting a highly coordinated, non-stochastic population-level response to cold shock; (ii) the synchrony in division cycle progression.
In the sentence you referenced “cells encountering a relatively late CSR will accelerate divisions to maintain synchronization”, we intended to describe that cells maintain consistent progression of the division cycle after cold shock, meaning that after the same number of elapsed cycles, different cells are at a similar stage in their division timing (Figure 4f, 4g, Figure S14). The term “accelerate” refers to our observation that cells which complete a given cycle later than others tend to have shorter subsequent inter-division intervals, thereby “catching up” to maintain alignment in cycle number across the population. We acknowledge that using “synchronization” in this scenario may be ambiguous, and we will replace it with more precise phrasing “progression of division cycle” to accurately convey this finding.
(3) Several technical terms used in the method development section are not clearly defined and may be unfamiliar to a broad readership, which makes it difficult to fully understand the methodology and evaluate its performance. Examples include depth of focus, focusing precision, focusing time, focusing frequency, and drift threshold value. In addition, the reported average focusing time per location (~0.6 s) lacks sufficient context, limiting the reader's ability to assess its significance relative to existing autofocusing methods.
Thank you for your valuable comments and suggestions. In response, we have added more detailed descriptions in the Methods section of the revised version.
The reviewer noted that the reported average focusing time (~0.6 s) lacks sufficient context, which may limit readers’ ability to assess its significance relative to existing autofocusing methods. We would like to clarify that the core innovation of this work lies in the proposed theoretical framework for autofocusing, which offers advantages over existing methods in terms of focusing precision and range. While focusing time is a practically relevant performance metric, it is primarily presented here as an implementation-dependent parameter rather than a central theoretical contribution of this study. In our experimental setup, an average focusing time of 0.6 s proved sufficient for routine timelapse imaging in microscopy, thereby demonstrating the practical usability of LUNA.
Reviewer #2 (Public review):
Summary:
This study presents LUNA, an autofocus method that compensates for focus drift during rapid temperature changes. Using this approach, the authors show that E. coli cells continue to grow and divide during cold shock, revealing a coordinated, multi-phase adaptation process that could not be deduced from traditional population measurements. They propose a scattering-theory-based model that reconciles the paradox between growth differences of the bacteria at the single-cell level vs population level.
Strengths:
(1) The LUNA approach is pretty creative, turning coma aberration from what is normally a nuisance into an exploit. LUNA enabled long-term single-cell imaging during rapid temperature downshifts.
(2) The authors show that the long-assumed growth arrest during cold shock from population-level measurements is misleading. At the single-cell level, bacteria do not stop growing or dividing but undergo a continuous, three-phase adaptation process. Importantly, this behavior is highly synchronized across the population and not based on bet-hedging.
(3) Finally, the authors propose a model to resolve a long-standing paradox between single-cell vs population behavior: if cells keep growing, why does optical density (OD) of the culture stop increasing? Using light-scattering theory, they show that OD depends not only on cell number but also on cell volume, which decreases after cold shock. As a result, OD can remain flat, or even decrease, despite continued biomass accumulation. This demonstrates that OD is not a reliable proxy for growth under non-steady conditions.
We thank the reviewer for acknowledging the strengths of our study.
Weaknesses:
(1) While the authors theoretically explain the advantages of LUNA over existing autofocus methods, it is unclear whether practical head-to-head comparisons have been performed, apart from the comparison to Nikon PFS shown in Video S1. As written, the manuscript gives the impression that only LUNA can solve this problem, but such a claim would require more systematic and rigorous benchmarking against alternative approaches.
Thank you for your insightful comment regarding the comparison of LUNA with other autofocus methods.
In our study, we primarily compared LUNA with the Nikon PFS system (as shown in Video S1) because Nikon PFS is one of the most widely used commercial autofocus systems in single-cell time-lapse imaging, and its manufacturer provides well-defined performance parameters (e.g., focusing precision within 1/3 depth-of-focus, response time <0.7 s), which facilitates a quantitative comparison. For other commercial systems, such as Olympus ZDC, Zeiss Definite Focus, Leica AFC, and ASI CRISP, the publicly available specifications are often less clearly defined, or are measured under inconsistent conditions, making a direct head-to-head comparison challenging and potentially misleading. Additionally, in our preliminary experiments, we also tested an Olympus microscope and observed severe focus drift during slow cooling processes. From a physical perspective, LUNA is specifically designed to meet the demanding requirements of single-cell experiments, including a wide focusing range and high precision, while existing commercial systems may not physically achieve the combination of range and accuracy needed for such extreme conditions.
(2) No mutants/inhibitors used to test and challenge the proposed model.
We agree that such approaches would provide valuable mechanistic insights and further strengthen the validation of the model presented in this study. In the current work, our primary goal was to introduce LUNA autofocusing method and demonstrate its capability to resolve bacterial cold shock response at the single-cell level with unprecedented precision. As such, we focused on characterizing the wild-type physiological dynamics under cold shock, which already revealed several previously unreported phenomena. We acknowledge that the use of genetic mutants or chemical inhibitors targeting specific cold shock proteins or regulatory pathways would be a logical and powerful next step to dissect the underlying molecular mechanisms and test the causality of the observed growth dynamics. We plan to address this in future work by incorporating such perturbations to further test and refine the model.
(3) Cells display a high degree of synchronization, but they are grown in confined microfluidic channels under highly uniform conditions. It is unclear to what extent this synchrony reflects intrinsic biology versus effects imposed by the microfluidic environment.
The reviewer raises a pertinent question regarding whether the observed high degree of cell synchronization represents an intrinsic biological phenomenon or an artifact induced by the microfluidic environment.
Over the past decade, microfluidic chips, including the specific design used in our work, have become a widely accepted and powerful tool in microbial physiology research. A broad consensus has emerged within the community that the microenvironment within these microchannels does not significantly interfere with or perturb the natural physiological behavior of microorganisms (Dusny, C. & Grünberger, Curr Opin Biotechnol. 63, 26-33 (2020)). This understanding is also supported by the fact that key findings obtained with microfluidic single-cell technologies are reproducible by other methods. For example, the adder model of cell-size homeostasis in E. coli firstly observed in microfluidic chips has been repeatedly validated by different methods (Taheri-Araghi, S. et al. Curr. Biol. 25, 385-391 (2015)). Therefore, while we acknowledge the importance of considering environmental effects, we are confident that the synchronization we report reflects the genuine biological dynamics of E. coli cells.
(4) To further test and generalize the model, it would be informative to also examine bacterial responses at intermediate temperatures rather than focusing primarily on a single cold-shock condition.
We thank the reviewer for this thoughtful suggestion. In designing our experiments, we aimed to study the bacterial cold shock response at the single-cell level. A key feature of this response is that it is typically triggered only when the temperature drops below a certain threshold within a short time duration. We therefore chose to lower the temperature from 37 °C to 14 °C as rapidly as possible. This approach allowed us to leverage the unique capabilities of LUNA while also providing an opportunity to explore this biological process in greater detail.
We agree that investigating bacterial responses across intermediate temperatures would be highly informative for understanding how temperature changes affect cellular physiology. However, this direction addresses a distinct scientific question that lies beyond the scope of the current work. We fully acknowledge its value and do have the intention to explore it in future studies.
Recommendations for the authors:
Reviewer #1 (Recommendations for the authors):
Major points:
(1) To strengthen the generality of the conclusions regarding cold shock response, it would be helpful to include a similar single-cell analysis of growth and division (cell size and concentration) for the 37˚C to 12˚C temperature shift. In this case, the experimental acclimation lasts ~5 hours, whereas the model predicts ~2 hours (Fig. S16a). Examining whether the model still holds or whether additional factors (e.g., further reductions in cell size) contribute to the observed OD decrease would clarify this discrepancy.
We thank the reviewer for this valuable suggestion. Our model for explaining the population-level OD dynamics during acclimation does not depend on single-cell time-lapse microscopy data. Instead, the single-cell inputs used for parameterization were obtained from flow cytometry measurements, which quantify population-wide single-cell distributions. Therefore, the model is not intrinsically restricted to a specific imaging-based experimental setup or to a particular temperature shift.
Most of the quantitative analysis presented in the manuscript focuses on the 37°C to 14°C transition, where the model shows strong agreement with experimental OD measurements. We selected this condition because it provides high-quality, internally consistent datasets at both the single-cell and population levels. However, the modeling framework itself is mechanistic and parameter-based, rather than temperature-specific. In principle, it can be applied to other temperature shifts, provided that the corresponding single-cell growth and state-transition parameters are experimentally determined.
Regarding the temperature shift from 37°C to 12°C, the model demonstrates good agreement with the experimental observation that acclimation lasts approximately 5 hours. The minor deviations in several data points during the acclimation period can be attributed to systematic errors in the measurement of cell concentration and volume, as illustrated in the lower panel of Figure S16a. We are open to extend our analysis to additional temperature shifts in future work to further validate the model’s generality.
(2) Related to weakness #2, it would be helpful for the authors to clarify their definition of "synchronization" and to provide additional explanation or evidence supporting this claim. In particular, further discussion of the data in Fig. 4f, 4g, and S14 could help strengthen the proposed hypothesis.
We thank the reviewer for this constructive suggestion. In previous response (public review weakness #2), we clarified the definition of “synchronization” in the revised manuscript by explicitly distinguishing between two types of synchrony: (i) the synchrony in the timing of growth rate changes after cold shock, and (ii) the synchrony in division cycle progression. For the latter, we now use the more precise term “progression of division cycle” to avoid ambiguity. Furthermore, we have expanded the discussion of the data in Figures 4f, 4g, and S14 to better support the claim that cells actively maintain alignment in cycle progression. We hope these revisions address the reviewer’s concern and strengthen the evidence for our hypothesis.
Minor points:
(1) Line 78: "... and concluded that the OD lag is actually the outcome of the synergy of changes in bacterial concentration and volume, ..." The term synergy usually implies a combined effect greater than the sum of individual effects. Are the changes in bacterial concentration and volume synergistic here?
We agree with your observation that the term "synergy" in scientific contexts typically implies an interaction effect that is greater than the sum of individual effects. In our original phrasing, we intended to convey that the observed OD lag is a result of the combined contributions from both changes in bacterial concentration and changes in cell volume, rather than being dominated by a single factor. We did not mean to imply a super-additive interaction between these two variables.
We acknowledge that the relationship between bacterial concentration and cell volume can be complex and may even exhibit interdependence under certain conditions (e.g., under nutrient limitation at high OD). However, using "synergy" could indeed be misleading. To ensure terminological precision and avoid any potential misinterpretation, we will revise the text in the revised manuscript. We will replace "synergy" with a more neutral and accurate phrase "combined effect".
(2) Figure 2d: Why does the focusing time increase even after temperature stabilizes following the downshift? Does focus drift depend not only on rapid cooling but also on the lower steady-state temperature? Additional explanation would be helpful.
As noted in the Methods section ("Time-lapse imaging of bacteria under CS"), when the temperature was lowered, the objective lens heater was stopped, which caused a slightly longer focusing time. This is because prior to the temperature downshift, the objective heater maintained the objective at a temperature close to that of the sample (37°C), minimizing any thermal gradient between them. After the temperature decrease to 14°C, while the sample chamber was precisely controlled at the target low temperature, the objective lens now without active heating gradually equilibrated to ambient room temperature (approximately 22–25°C). This created a stable temperature mismatch between the relatively warmer objective and the colder sample. Such a temperature gradient can cause minor thermal expansion or contraction of the objective lens barrel, leading to a small but persistent shift in the focal plane. Consequently, the focusing time remained slightly elevated (∼0.6 s) compared to the 37°C condition (∼0.3 s), even after the sample temperature had stabilized. This offset reflects the steady-state thermal disequilibrium between the objective and the sample, rather than a transient cooling effect. We hope this explanation clarifies the reviewer’s concern.
(3) Line 234: "Reanalysis of the protein synthesis dynamics after CS revealed increase in CSPs synthesis (Figure 3e)." A citation is needed here. Additionally, the dataset referenced here was generated using a 37˚C to 10˚C cold shock.
We thank the reviewer for the insightful comments and the careful reading of our manuscript. We have now added the appropriate citation in the main text (Zhang, Y. et al. Molecular Cell 70, 274–286 (2018)). The dataset used in this reanalysis was generated under a 37°C to 10°C cold shock, rather than 12°C, and we have clarified this in the Methods section to avoid any ambiguity.
We would also like to clarify our rationale for using this published dataset in the present context. To our knowledge, no published dataset exists with comparable protein synthesis dynamics specifically at 12°C. Our intention here was to reference a well-characterized cold-shock dataset to support the qualitative point that CSP synthesis increases and ribosome synthesis decreases after cold shock. In cold shock studies, many qualitative conclusions are broadly consistent across low-temperature conditions (e.g., below ~15°C, and in some cases more broadly below ~20°C), including the observation that the ribosomal protein fraction is relatively insensitive to temperature change (Herendeen, S. L. et al. Journal of Bacteriology. 139, 185–194 (1979), Knapp, B. D. & Huang, K. C. Annual Review of Biophysics. 51, 499–526 (2022)). We appreciate the reviewer’s valuable feedback, which has helped us improve the clarity and accuracy of our work.
(4) Figure 3f and 3g: How is growth rate defined here, and why do the elongation rate and growth rate yield different results? My understanding is that, during steady-state growth, cell elongation rate increases as cells progress through a single cell cycle prior to division, whereas G0 cells exhibit reduced elongation rate following cold shock. Is this correct? More explanation is also needed for "linear growth in growth mode" (Line 267).
Thank you for this important comment. In our manuscript, we use:
Elongation rate = dL/dt (the absolute rate of increase in cell length; y-axis in Figure 3f)
Growth rate = (dL/dt)/L (i.e., λ, y-axis in Figure 3g; also referred to in some studies as the instantaneous growth rate)
Because these are different quantities, they do not necessarily follow the same trend across the cell cycle. To clarify the logic behind our “growth mode” classification (also see Willis & Huang, Nat Rev Microbiol 2017):
For a rod-shaped cell growing in length L,
(1) Exponential growth means the elongation rate is proportional to cell size, i.e.,
𝑑𝐿/𝑑𝑡 ∝ 𝐿
or equivalently,
(𝑑𝐿/𝑑𝑡)/𝐿) = constant
(2) Linear growth means the elongation rate is constant throughout the cell cycle, i.e.,
𝑑𝐿/𝑑𝑡 = constant
which implies that
(𝑑𝐿/𝑑𝑡)/𝐿)
decreases as the cell elongates.
Based on these two basic cases, additional growth modes (e.g., super-exponential, sub-exponential, sub-linear) can also be defined, as illustrated in the Author response image 1.
Author response image 1.
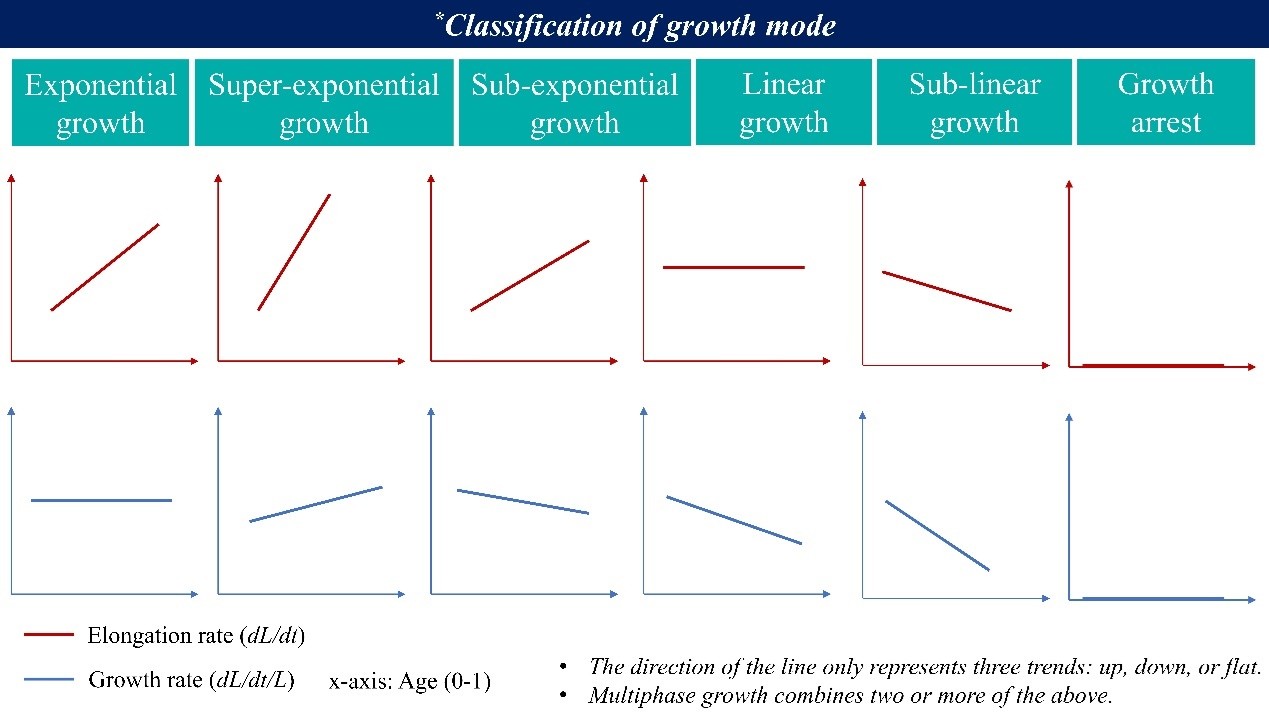
With this definition, our interpretation of Figure 3f and 3g is as follows: before cold shock, cells are consistent with approximately exponential growth (red line in Figure 3g), whereas after cold shock, the G0 cells are better described as undergoing approximately linear growth (yellow line in Figure 3f).
(5) Figure S12: Why are the curves not continuous across GN, G0, G1, and G2?
In this figure, we present two different metrics: elongation rate (𝑑𝐿/𝑑𝑡) in panel (a) and growth rate (𝜆 = (𝑑𝐿/𝑑𝑡)/𝐿) in panel (b). During bacterial division, the cell length approximately halves while the growth rate remains constant under steady-state conditions. As a result, elongation rate, which is proportional to the instantaneous length, also halves at each division event, leading to the observed discontinuities at the time points corresponding to divisions (GN, G0, G1, and G2). In contrast, growth rate is inherently continuous across divisions, as shown in panel (b), although minor apparent discontinuities may appear due to the finite temporal resolution of our measurements. We hope this explanation clarifies the figure.
(6) Figure 4d: X-axis labels are missing.
Thank you for your insightful comment. The six panels share identical axes in Figure 4d. To enhance the visual focus on the data trends across different generations, we intentionally displayed the X-axis label and numerical tick labels only on the first panel. The subsequent panels show only the tick marks without the numerical labels, as their scale is identical to that of the first panel.
(7) Line 285 and Figure 4e: "The changes in λ are highly synchronized in time, with the exact time lag between any pair of ξ not exceeding 2 min ..." What is the definition of time lag?
In our study, the term "time lag" refers to the absolute difference in time at which a large sudden drop of the λ curve occurs between any two pairs of ξ. Essentially, it quantifies how closely the dynamic changes in λ are aligned across different groups. A time lag of zero would indicate perfect synchrony, while a value within 2 minutes implies that the variations in λ for any pair of ξ occur nearly simultaneously.
(8) Figure S14: Why can the elapsed cycles take negative values?
In Figure S14, we plotted the centered values. Specifically, at each time point, we calculated the mean elapsed cycle number across all lineages, and then subtracted this mean from each group’s value. The resulting values are presented in the figure as “Elapsed cycles (zero-centered)”. Thus, negative values are expected and meaningful they represent lineages that are progressing more slowly than the average at that time point. This transformation helps to highlight the relative differences among groups over time, while removing the overall temporal trend (which is already shown in Figure 4g).
(9) Figure 5 legend: Fitting for the acclimation has a R2 of -0.263 (Pearson correlation coefficient -0.00). R^2 should not be negative, and it doesn't agree with the calculated Pearson correlation coefficient.
Thank you for this important observation. Indeed, R<sup>2</sup> should normally fall within the range [0, 1]. This discrepancy arises because the fitting model used differs from the default linear regression, and we did not specify this in the original figure legend. In the revised manuscript, this has been corrected. The explanation why R<sup>2</sup> is negative here is as follows:
The linear fit used is y = a·x (i.e., no-intercept, forced through the origin). This is based on the physical principle that when OD is zero (no bacteria), the total bacterial mass must also be zero. For ordinary linear models with an intercept, R<sup>2</sup> ranges from 0 to 1. However, for no-intercept models, the calculation of total sum of squares (SS<sub>tot</sub>) differs (typically relative to zero rather than the mean of y), and R<sup>2</sup> can become negative if the fit performs worse than the baseline y = 0. Here, R<sup>2</sup> = -0.263 simply indicates that for these specific data points, the origin-constrained linear fit does not outperform the trivial y=0 model. Regarding the Pearson correlation: The near-zero coefficient (-0.00) suggests no significant linear trend between X and Y, which is consistent with the poor fit performance.
(10) Language and typos: The manuscript contains grammatical errors and typos that require careful proofreading (one example: Line 56 "..., and reflection-based approaches ...").
We thank the reviewer for the careful reading and for drawing our attention to the language and typographical issues in the manuscript. In the revised version, we will carefully proofread the entire text and correct any errors and inconsistencies, including the example pointed out in line 56.
Reviewer #2 (Recommendations for the authors):
(1) The LUNA section is extremely technical and advanced for most biologists - it might be useful to include a few sentences in simple language why LUNA helps solve the biology question.
We thank the reviewer for the valuable suggestion. We have now added a concise, plain-language overview at the end of the LUNA section (Performance Analysis of LUNA):
“In brief, LUNA locks the focal plane with nanometer-scale precision over an ultra-large range rapidly, ensuring stable focus during long-term imaging for reliable observation of fine subcellular structures and dynamics.”
(2) The suggestions I included in the weakness section are not mandatory to perform, but will be helpful to at least discuss in the paper.
We thank the reviewer for the thoughtful comment and for acknowledging that the suggestions in the weakness section are not mandatory. We have carefully considered each point raised and have provided detailed responses in the point-by-point reply. While we recognize the potential value of these suggestions for further expanding the study, we respectfully believe that incorporating them into the current manuscript would go beyond the intended scope of this work.
Thanks
Otherwise, great job with the paper!
We are truly grateful to the reviewer for the encouraging feedback and appreciate the time and effort invested in improving our manuscript.
Chapter 13 we see that even though teacake is kind and sweet and looks like the perfect man from her childhood dreams he’s not perfect he is still young and reckless and messes up. We also see the fear that the townspeople have put in Janie’s head of him running away with the money. So a small rift as started to stack open the messy inside of there relationship.
Note: This response was posted by the corresponding author to Review Commons. The content has not been altered except for formatting.
Learn more at Review Commons
__Reviewer #1 (Evidence, reproducibility and clarity (Required)):
__Summary: Overall, this study adds a large amount of data for the scyphozoan Aurelia coerulea by producing several single-cell RNA sequencing libraries that cover the transition from polyp to medusa. The study provides a modern view of cell type diversity and cell-specific transcriptome changes during this period of extreme morphological change in this particular cnidarian lineage, which is understudied. Certain unique cell subtypes, including neural cell subtypes and muscle cell subtypes which are specific to different life stages are discussed in detail providing some new insights.
My overall assessment is that the manuscript has good potential to be impactful, but in its current form it is somewhat clunky and overly complex to read, the figures were too crowded and difficult to comprehend, and the authors did not provide enough context regarding the current state of knowledge and what this study adds to it. In particular, Figure 1 and the section about striated and smooth muscles sharing partial transcriptomic profiles need the most work. The results were presented in the context of the anthozoan Nematostella but this should be broadened further to include other cnidarian single-cell studies, such as those from Hydra and Clytia which are both medusozoans like Aurelia. The writing throughout could be streamlined and simplified to better highlight the major findings as described in the abstract of the paper. Several figures were not well presented or clear and could be improved or decluttered to better communicate and support important results. In addition, some methods were totally missing, and I was unable to access the github repository associated with the paper which should detail all analyses described in the paper. In its current form, reproducibility of analyses would be quite limited. I did greatly appreciate the inclusion of the data on the UCSC Cell Browser, which allows anyone to access the single cell data matrix for visual exploration.
Answer: We thank the reviewer for the overall positive assessment and have tried to address all of the comments that follow.
Major comments: The Introduction section was very short - only three paragraphs. I feel that this section could be expanded to give more context about Aurelia as a research organism, and the current resources available. This includes genomic and transcriptomic resources particularly those focused on the transition between life cycle stages (polyp to medusa). Any other relevant background on cell type diversity or if there is anything known about the molecular profile of specific cell types found in different life stages should also be included here . Do marker genes already exist for some of the important cell types discussed in the manuscript? It would be better to present the current state of knowledge, and context for why this study was done, how it builds upon current knowledge, and what it adds to our current understanding so that the study is properly framed from the beginning.
Answer: Introduction was expanded and also includes explanations to which extant medusa specific cell-types were investigated so far. This additional information is highlighted in blue typeface in the manuscript.
In the Results section, I find the sentence on p. 4, "Further, ~70% of these gene models do not have readily identifiable orthologs and thus represent putative orphan genes" to be rather confusing. What analysis was performed to determine this percentage, and which set of organisms were compared? Doesn't this percentage seem rather high for a cnidarian? Or is this referring to orthologs outside of cnidaria? Please comment further on how this percentage was determined and possible explanations for it being this high. Right now, it just feels tacked on to this paragraph with no context or further explanation which leads to the confusion.
__Answer: __This statement originally referred to a lack of any best-blast-hit nor any protein domain annotation found for the sequence. This number has dropped to only 47% with the most recent mapping tool, which is a value also fairly commonly found in other animal genomes. Nonetheless this statement has been removed from the manuscript.
Figure 1. There are many issues with this figure that encompass how I felt generally about the figures of the paper. The figure should ideally take up the entire width of the page rather than squishing some text next to the figure.
__Answer: __The figures are intended to be a full page, they are also included embedded into the text to facilitate review of the manuscript and the full-resolution figures are included for proper review. In the revised version we have kept this comment in mind to ensure the figures are legible.
Figure 1A: The colors of the different developmental stages from which tissue was samples (e.g. polyp1, polyp2, polyp.clover) do not seem to match between legend and figure. For example, the "polyp.clover" stage is circled in blue in the schematic, but given a green dot in the legend. The "medusa.manubrium" is circled in orange in the schematic, but given a purple dot in the legend. Suggest making the colors match between legend and schematics.
__Answer: __ The colors correspond to the grouped stages and colour palette used for the life cycle stage divisions. This has been considered in the revised figure
Figure 1E: In Panel E, the labels showing that the top graph is "polyp" and the bottom graph is "medusa" are much too small. Increase the font size of the labels. The font size for the GO terms themselves are also too small.
__Answer: __This figure has been removed in the revision; Attention has been paid to font sizes in the revised figures.
Figure 1F: The bulk of this study centers around the single-cell RNA sequencing data and resulting analyses from these data. As such, I would expect the cellular atlas resulting from these data to be similarly highlighted. In Figure 1F, the annotated cell atlas as presented is much too small, making it impossible to even add the labels for the different clusters directly on the UMAP. Suggest increasing the size substantially to at least half of the page width, so that it is possible to do so.
__Answer: __This has been removed in the revision; the full distribution of the identified clusters is now figure 2. We do not include all of the population sub-types on the UMAP in this figure as this is simply a visualization tool and the distribution of the sub-types on that map is not necessarily informative. Rather we include the relative proportions of the sub-types/states in the bar plot, and the relationships between these clusters in the tree.
-There should also be a complimentary figure in the supplement that shows all of the individual clusters, each in different colors and clearly annotated with labels, rather than just showing multiple clusters that were combined into the major cell types. There is an example of this in the Clytia single cell paper (see Chari et al. 2021 Figure 2A vs Fig S9).
__Answer: __A fully coloured UMAP with all cell states is available in the supplement figure S3
-The graph on the right of this panel showing the "Distribution of cell types in time and space" is overly complicated with all of the colors and the meaning is quite lost as it is quite difficult to interpret at this very small size. Suggest removing and possibly showing as a supplemental figure so that it's meaning is easier to assess.
__Answer: __This barplot is now larger and includes both the partitions (major cell populations, as seen in the UMAP) and proportion of individual cell clusters. We feel this is an intuitive way to illustrate the relative distributions of all cell type states across the dataset as a whole and so we keep this in the main figures of the manuscript.
-In addition, striated muscles are marked on the overall UMAP; however, it is not noted until later that the smooth muscles are part of the "outer epidermis" cluster. Suggest altering the legend or the text of the figure itself to show where the smooth muscles are thought to be in the overall UMAP, especially since they are specifically discussed in depth later in the manuscript. Exactly which "part" of the outer epidermis cluster includes the smooth muscle cells?
__Answer: __We have added the smooth muscle cluster in the main figure umap.
Figure 1G: Panel G, for example, is not useful in conveying its point as the text labels are too tiny and the figure is overly complex to be squished into a panel of this figure. Suggest removing and making 1G a supplemental figure by itself or perhaps together with 1C (as they are linked) where it is more legible. The figure legend text for Fig 1G is also confusing as it refers to "scyphozoa" in (C) but there is no "scyphozoa" in 1C, only "medusa".
__Answer: __This is now Figure 1D and E and is given increased space in the figure. We feel the message that the medusa-specific gene set is not restricted to medusa-specific cell types is an important one and so we have kept this in the main figure. We provide a table with all gene annotations in the supplement so that it is accessible to anyone with further interest (DS1.1a and DS1.1b).
Text, p. 6: The explanation for how the clusters were annotated in Fig 1 and Fig 2 is much too vague. The text states, 'We identified 9 broadly defined cell populations, for which we assign identities by assessing up-regulated gene lists (Data S1.3)." What does this mean? How exactly were the up-regulated gene lists assessed? This needs to be clarified further. What genes were used to label these clusters or groups as particular cell types? How does the annotation relate to Supplemental Tables S1.3 and S1.3b? Does the previous literature need to be cited to support these annotations based on specific genes? Suggest doing a better job overall and providing more detail and context explaining how the single cell clusters were annotated.
__Answer: __We have expanded our description of how we assigned identities to the nine principal cell type families as follows:
(pg. 8) The inner epithelia, or gastrodermis, expresses several collagens that are a characteristic of the inner cell layer of anthozoans (39); the outer cell layer houses the ring musculature and is rich in contractile proteins. The striated muscle cluster is also rich in contractile protein and is the only principal cell population absent from the polyp-derived samples (Fig. 2C). The mucin gland expresses mucin-like-proteins, whereas the digestive gland expresses other digestive enzymes, and the neural cluster expresses synapsin and other conserved known neural regulators such as ashA. The cnidocytes express mini-collagens and are enriched in pathways targeting the endoplasmic reticulum (40).
Text, starting on p14: "Striated and smooth muscles share partial transcriptomic profiles." This section is highly confusing and could do with some simplification in both text and figures. - The genes for which expression is shown in Fig. 5, 6 and 7 are not properly introduced or given nearly enough context in the text. For example, the text states, "To investigate the dynamics of muscle formation, we further compared phalloidin staining of muscle fields with in situ hybridization detection of specific cluster marker expression in polyps (Fig. 5), strobila (Fig. 6), and ephyra (Fig.7)." However, it is not until the legend of Figure 7 and also much later in the text (in the Discussion, p23) that it is noted what types of muscles each of the genes used in ISH actually mark ("While a small set of genes are shared across the two muscle phenotypes (e.g. stmyhc1 and mrlc2), others are more specific to either phenotype (eg. stmyhc5 in striated muscle; myophilin-like-2 in smooth muscle) (Fig.8A), which were verified by in situ hybridization (Figs.5,6,7)". This needs to be rewritten and improved for flow and clarity purposes.
Answer: Figure 5,6 and 7 were re-assembled in a different structure according to reviewers suggestion. Specifically, we now present the muscle anatomy together first, followed by molecular validations from the atlas data. Marker genes used for in situ hybridization (ish) were introduced as suggested. Text was re-written according to changes in figures. In general, figures and text were simplified to gain more clarity on the muscle chapter.
- Suggest that the authors show an overall UMAP of smooth and striated muscle (perhaps the smooth muscle subtypes are part of the large 'outer epidermis' cluster; see the comment for Figure 5B above), and then include featureplots that show the expression of each of the genes used in ISH in these clusters. This might make it clearer as to what type of muscle the genes should be highlighting within each developmental stage. It might look something similar to what is shown in Figure 7P (although it is unclear how the featureplots shown in this figure relate to the UMAP shown in Figure 5B). In addition, the featureplots in Figure 7P only show 3 out of the 4 genes used in ISH which is not helpful. Featureplots should be clearly shown for all genes discussed. This is essential to linking the pattern in the single-cell data to the expression data and is the minimum required to provide clear understanding.
Answer: We took this suggestion under consideration when re-compiling the figures. Now the feature plots and the insitu’s are found in the same figure (Figure 6).
- The text reads, "To investigate the dynamics of muscle formation, we further compared phalloidin staining of muscle fields with in situ hybridization detection of specific cluster marker expression in polyps (Fig. 5), strobila (Fig. 6), and ephyra (Fig.7)." However, Figure 6 also contains images of ephyra (Fig6. P-S). Suggest that those panels could be included in Figure 7.
Answer: This text no longer appears in the manuscript. The relevant section now reads as follows (p15:17):
“We assessed the anatomic location of the muscle fields by phalloidin staining in Aurelia polyps, strobilae and ephyrae (Fig.5). Polyps have three distinct smooth muscle fields (Fig. 5A,B-G): the radial muscles of the oral disc (Fig. 5D), the longitudinal tentacle muscles (Fig. 5E), and the longitudinal retractor muscles that run along the body column (Fig. 5F,G (35)). During strobilation, fragments of the polyp retractor muscles are retained in the early ephyra (Fig. 5J (35)). Striated muscles appear coronally around the oral disc, oriented radially along the lappets of early detached ephyra (Fig. 5L-N). At the tips of the lappets, the border of the coronal muscle, and at the base of the manubrium, fibres show a mixed organization of smooth and striated myofibrils (Fig. 5O,P). These findings corroborate previous studies that used light- (26) or electron microscopy (24,25).
We next compared expression patterns expected from our single cell data with the phalloidin-based anatomy of smooth and striated muscles. As expected, several genes were shared between the smooth and striated muscle cluster (Fig.6E), while others were highly specific to either smooth (Fig.6C,D) or striated muscle cluster (Fig.6P; Data S1.11). Different calponin paralogs show distinct expression in the different muscle types (Fig. 7A). For example, calponin1 is specific to the smooth retractor muscle of the polyp and no other subpopulation of the smooth muscle type (Fig. 6A-C). At the strobila stage, expression of calponin1 is still visible in fragmented retractor muscles, consistent with the single cell expression profile (Fig. 6F). By comparison, mrlc2 expression marks the locations of all smooth muscle populations in polyps including tentacle muscles, radial muscles of oral disc and retractor muscles of the body column (Fig. 6D,E).”
- There are parts of this section text where reference to the Figures is complicated and not easy for the reader to follow. I got particularly confused in trying to follow this part of the manuscript. For example, a sentence on p15 reads, "mrlc2 and stmyhc1 reads are detected in both muscle types (Fig. 7pFig. 5M, Fig 6C,E,G-P, Fig. 7J-L,N-P), and ISH indicates that the expression is localised to the fields of striated muscles in ephyrae (Fig.7J,K,N), as well as the smooth muscle populations in polyps including longitudinal tentacle muscles, radial muscles of oral disc and retractor muscles of the body column (Fig. 5M, Fig.6H,I,L,M), and the muscles of the manubrium in the meta-ephyra (Fig. 7L,O)." It is quite difficult to keep jumping between Figures and panels to look at this. A better organization of the Figures and much clearer text that doesn't jump around could go a long way to making it easier to follow.
Answer: __ We thank reviewer 1 for the suggested changes. We feel that recombining the results from previous versions of the figures helped to improve the clarity in this section. Single cell data was updated to include an UMAP of the muscle subset and gene expression plots highlighting the differential expression in either smooth- striated or both muscle types corresponding to the in situ hybridization (ish) gene expression profile. The figure (__Fig. 6) is now arranged in a way that allows the reader to easily follow the results for the spatial validation of both muscle types since ish for all life stages is shown in one panel together with the muscle subset UMAP and gene expression plots. Additionally, the two muscle clusters are now labelled also in (Fig. 2A) to provide a better understanding for the reader where muscle clusters are located in the UMAP of the full object.
The text reads now: (Fig. 6, figure caption): (Q) feature plots of all marker genes on the muscle specific subset (R) reference UMAP of whole dataset (left) subset (right) (S) Distribution plot of muscle types across the different Aurelia life stages (left) and medusa tissues (right).
Discussion -The authors do try to put their results into context with the two Aurelia genome papers (Gold et al. 2018, and Khalturin et al. 2019) and two additional bulk transcriptome studies (Fuchs et al. 2014, Brekhman et al. 2015), but not until the first part of the Discussion. In principle, this would be fine. However, in practice, their discussion of these studies is somewhat vague and generalized and did not really provide a clear review or analysis of how adding in cell-type specific data is helping our understanding. The argument about how their results fit with previous findings was confusing and unclear. They start by discussing "genome usage" but then switch to talking about cell type diversity across life stages. The connections between "genome usage", "gene representation", and cell types was not easy to follow. Suggest rewriting this section to clearly discuss the findings in this manuscript in the context of previous studies with straightforward and precise language.
-In the discussion about the neural subtypes, comparisons are only made to Nematostella where there are also two major neural classes. It would be even better to include discussion of single-cell data related to neurons in other cnidarians, such as Hydra, where there is detailed discussion of neuron subtypes in both a published manuscript (Siebert et al. 2019, Science) and a preprint (Primack et al. 2023, biorxiv) and Clytia (Chari et al. 2021, Science Advances). I do see that Clytia and Podocoryna are mentioned in the next section of the Discussion, specifically related to the Otx gene.
Answer: We thank the reviewer for this oversight. We have incorporated comparative observations from the published Hydra dataset in this regard.
Pg 21 “ This contrasts with the distribution of n1 and n2 class neurons in the freshwater hydozoan polyp Hydra vulgaris, of which only three of the fifteen sub-types are of the ins-positive n1 type (“ec2”, “en2”, and “en3”: Fig. S8D; (58)). Similarly in the Clytia medusa only one of the three neuron groups (neuron cells “A” (16) have INSM reads and thus could be considered type 1 neurons as defined here.”
-The section about muscle subtypes in the Discussion would need to be rewritten in accordance to changes suggested above for the Results for this section.
Answer: Discussion was rewritten according to the changes made in the results section like suggested by reviewer1.
Materials and Methods -In the section "Comparison with Nematostella" the authors discuss running OMA to generate the set of identified 1:1 orthologs but never go on to mention how many orthologs were identified. Please report this number so it is clear whether this is a small or large subset of the total analyzed. In a recent study of the Hydra AEP strain (Cazet et al. 2023 Genome Research), a similar analysis was done between Hydra and Clytia and they found 5979 genes with 1:1 orthologs between the two species. There should also be a supplemental datasheet that provides a list of these orthologs (See Supplemental Data S17 provided in Cazet et al. 2023 as an example). I am curious to know how many 1:1 orthologs were found between Aurelia and Nematostella. I would expect there to be a smaller overall number than between Hydra and Clytia due to the larger phylogenetic distance between these two taxa. I also strongly suggest that the Cazet et al. 2023 paper should be referenced, as it was the first time an attempt to compare single-cell datasets between two cnidarian species was done. The current manuscript took an alternative approach to comparing Aurelia to Nematostella, so it would be good to acknowledge this and justify the methods used in this manuscript compared to those used in Cazet et al. 2023.
Answer: We recognize our oversight in not properly referencing the previous study comparing two cnidarian species and have integrated this reference now, and include the requested information regarding our OMA analysis as follows:.
In total 4311 1:1 gene orthologs between the two species were identified (Data S2.). A similar comparison using OrthoFinder (90) between Hydra and Clytia, both members of the Hydrozoa clade, found 5979 1:1 orthologs (66). OMA was preferred in this study over other available orthology databases because it outputs a high-confidence predicted 1:1 gene orthology list that can be used directly to combine multi-species data.
-There are missing descriptions of methods throughout the paper. One example is in the section about Transcription Factor families that are over or underrepresented amongst upregulated genes compared to their distribution in the genome - I could not find any description of the methods used to identify these Transcription Factor families in the dataset of Aurelia upregulated genes. How were these families chosen? How were they identified in this dataset?
Answer: Transcription factors were identified and classified using the Animal Transcription Factor Database version 4. (https://guolab.wchscu.cn/AnimalTFDB4/#/). This information has been added to the manuscript methods.
-I noticed in the Data and materials availability statement and a few other places in the manuscript, a github repository was mentioned: https://github.com/technau/AureliaAtlas. I tried to access this repository to review what was included, but unfortunately it is not accessible. I found seven repositories within github.com/technau but the AureliaAtlas was not one of them. This repository should include all scripts to generate all figures and other analyses in the paper and should be made available to reviewers to better understand exactly how all analyses were completed. A good example of how this could be done is found in the repository related to Cazet et al. 2023 (https://github.com/cejuliano/brown_hydra_genomes), which is very comprehensive and easy to follow. -When I looked through a similar repository https://github.com/technau/CellReports2022/ from the Steger et al. 2022 Cell Reports Nematostella single-cell paper from this same group, I find it to be rather disappointing. They apparently included all code to generate all figures in a single R file that is not easy to follow and not well commented. If this is the same strategy used for this manuscript, I feel that a much stronger effort could be made to make the analyses of this Aurelia manuscript transparent by producing a github that is more like that of https://github.com/cejuliano/brown_hydra_genomes from the Cazet et al. 2023 paper which organizes each type of analysis in a different github subfolder and within each subfolder they include very detailed information and comments explaining each step of each analysis. Doing this would go a long way to making the analyses in this manuscript more transparent and easier to follow and would certainly put some of my concerns to rest.
__Answer: __We thank the reviewer for pointing this out. We have ensured that the github page is publicly accessible. We have provided all of the necessary R scripts to generate the analysis and figures. The structure is improved over the Steger paper; separate scripts are provided for each step, including importing and processing the raw data for the Seurat workflow, data processing to assess the life cycle and first clustering, analyses of each subset, and finally calling results from the previous scripts to generate all figures contained in the manuscript.
Minor comments:
Figures: Figure 2A: In the legend it says "Colour code as in (B) and (C)" but it's really referencing the colors in Figure 1A, correct? It is confusing to have to look back to Figure 1A to understand the colors here.
__Answer: __The original figures 1 and 2 have been modified and combined into a single figure in this version.
Figure 2D: Typo in the word "proteins" in the title of this panel.
__Answer: __This word no longer appears in the revised figures.
Figure 3F: The placement of the tree and the two featureplots for myc3 in Nematostella and Aurelia is confusing. Suggest moving the featureplot for Aurelia myc3 so that it is beside Nematostella (to the right of the tree) or move the featureplot for Nematostella myc3 so that it is beside the Aurelia featureplot (to the left of the tree).
__Answer: __We thank the reviewer for this suggestion and have edited this figure accordingly by moving the myc3 expression plots alongside all of the others.
Figure 4B: The description of this panel reads, "Distribution-histogram across all samples, medusa-specific cell clusters are highlighted with black outline.", however as a reader, the black outline is not very clear. Suggest making it bolder. In addition, this black outline is a little confusing - it should mark the medusa-specific cell clusters; however, the black outline appears in cell clusters in strobila and ephyra?
__Answer: __ The black outline is now increased in width for clarity. Medusa-specific cell types are defined by their absence from the polyp samples because already in the strobila stage medusa-specific tissues are being generated and thus these transcriptomic profiles begin to appear. We added a clause in the figure legend to clarify this, as well as within the main text when medusa-specific cell states are first defined.
Pg.8: “ In total we find 12 cell type states that are not represented (<br /> Figure 5B: It is unclear from where this reference UMAP was derived. Does it come from the overall UMAP, showing the 'outer epidermis' cluster only, with the putative smooth muscle cells in red? Or is it the 'outer epidermis' cluster plus the striated muscle cluster? Suggest making this clearer (see below for larger edits to this section of the manuscript).
Answer: This has been addressed. Figure 6R now includes both the full dataset inset, as well as the muscle-only subset and is consistent with the rest of the manuscript in this regard.
Figure 5K/L/M: It is unclear which parts of the polyp in K is used for the images shown in L or M. Both come from the large red box, but it is unclear from which part L and M were made. In addition, the subtraction of the background from the image (to make it look white) is distracting and makes the image itself look artificial.
Answer: New brightfield images were included to give a better understanding of the region of interest. The images in which the background was subtracted were replaced with the original pictures and contrast was enhanced to brighten the background.
Figure 6C, G-S: - Not sure what the blue boxes around these panels are meant to highlight? - Also not sure what the image in the left of panel C is. Perhaps an oral view of the strobila? The legend or panel itself should mention this. - Again, subtraction of the background from the image (to make it look white) in panels C, D and E is distracting and makes the image itself look artificial.
Answer: The figure was redone and the boxes are not present anymore.
Figure 6J, M, N, O: - For someone not accustomed to looking at images of strobilating polyps, it is unclear what part and what orientation these images are taken of. Suggest including some of these details in the figure legend at least. Fig 6O actually looks like an ephyra, but is annotated as an "advanced strobila"?
Answer: Figure was re-done (fig.6) with appropriate schematics next to the images.
Figure 7H: - Not sure what the white lines in this panel are meant to indicate?
__Answer: __The white lines were removed.
Results: p5 - In this sentence, "Because these four pouches look like a cloverleaf from above, we call this stage the "clover-polyp", suggest changing "clover-polyp" to match the Figure 1A (where it is written as polyp.clover), or change the text in the Figure to match the text in the manuscript.
__Answer: __ We made sure to match this in the revised figure.
p8 - In this sentence, "the bZIP protein family are over-represented as terminal cell type markers, while the number of zinc-finger proteins of the N2C2 class are under-represented", the "N2C2" class the authors refer to is not clear. Is there a typo here? In the figure to which this sentence refers (Figure 2D), the proteins referenced are "zf-H2C2" or "zf-C2H2".
__Answer: __This no longer appears in the current manuscript.
p9 - Typo - should be "medusozoans" rather than "medusazoans".
__Answer: __This has been corrected.
p11+ - Section titled, "Aurelia neural complement reveals two neural classes with similarities to anthozoan neurons" - I found the classification of N1 and N2 to be confusing, since initially they are described as neural clusters, however N1 in particular is shown to consist of primarily secretory, non-neural cell types. For example, when looking at Figure 4A and B, it is evident that N1 contains only a relatively small number of neural cell-types (in shades of orange), while most of the cells are other secretory, but non-neural cell types (in shades of brown). Not sure if the authors should alter the title to reflect this? For example, instead of 'neural' classes, they could be called 'neuro-secretory' or 'mixed neural and secretory classes'?
__Answer: __We appreciate the confusion and have adjusted the heading accordingly. However we choose to maintain the designation as N1 and N2 class to reflect the distinction between insulinoma-positive and pou4-positive major Cnidarian neuroglandular sub-types present as defined in our earlier Nematostella work (Steger et al., 2018). We also include a comment in the discussion regarding the support for this distinction in other published Cnidarian dataset as follows.
”This contrasts with the distribution of n1 and n2 class neurons in the freshwater hydozoan polyp Hydra vulgaris, of which only three of the fifteen sub-types are of the ins-positive n1 type (“ec2”, “en2”, and “en3”: Fig. S8D;(58)).”
p11 - Text reads, "Class 1 neurons in the medusa are also most prevalent within the gastrodermis and manubrium, and includes one subtype that first appears in the strobila and is found in all medusa tissue samples ("n1.3.medusa"; lower black box Fig. 4F).", however there is no "lower black box" in Figure 4F apparent.
__Answer: __Re-evaluation of the detectable cell states after updating the mapping tool, which addresses issues associated with an overabundance of isoforms, results in the dissolution of this putative medusa-specific cell state. This profile is also found within the polyp and so the second half of this sentence has been removed.
p13 - The text reads, "We find that class 2 neurons all express elevated levels of specific alpha- and beta- tubulins (TBA1-like3 and TBB-like-1; Fig. 4D).". Make the capitalization of your gene names (TBA1-like3, etc) consistent between text and figure throughout (in Fig. 4D the gene names are lower case).
__Answer: __We have taken care to be consistent throughout the manuscript.
p14 - In the first paragraph of this page, Fig. 4C is referenced twice, however both times the referencing sentence does not match this panel (most likely the authors meant to reference 4E, F or G).
__Answer: __This has been corrected.
p14 - The final sentence of this upper paragraph, "Specific tubulin-paralog expression within the class n2 neurons suggest that this is the portion of the nervous system labelled by the β-Tubulin antibody." is confusing. Do you mean that the b-tubulin antibody is most likely labelling the product of the tbb-like-1 gene that is shown in the featureplot in Fig 4D? Suggest rewriting this sentence for clarity.
__Answer: __This sentence has been re-written as follows: “Specific tubulin-paralog expression within the class n2 neurons suggests that these two genes are translated into proteins recognised by this commercial β-Tubulin antibody. Furthermore, this antibody labelling suggests that the MNN is composed of N2 class neurons.” pg 14
p14 - on this page and others in the manuscript, there are instances of the word "Aurelia" not being italicized.
__Answer: __This has been corrected.
p14 - In this sentence, "In the sea anemone Nematostella, anemone-specific gene duplications of members of the PaTH (Paraxis, Twist Hand-related) bHLH family of protein coding genes was driving the diversification of muscle cell types (29)." the "was driving" part of the sentence is grammatically clunky. Suggest rewording slightly. (e.g. "...protein coding genes drive the diversification of muscle cell type").
__Answer: __We changed this to ‘drove’.
-Myophilin-like2 in the text of the manuscript is written as myofilin-like2 in the figure panels (e.g. Fig 5L, Fig. 6D). Make consistent between text and figures.
Answer: We changed all references to myophilin to calponin, which is the better known name of the vertebrate ortholog.
p15 - on this page and several instances thereafter, "in situ" is not italicized as it should be.
__Answer: __This has been corrected
p19 - In the line, "Taken all together these data suggest that the contractile apparatus in the Scyphozoa, using here Aurelia as a proxy, is similar to the bilaterian smooth muscle contractile complex (Fig. 8C)." this should really reference Fig. 8 B-C
__Answer: __This has been corrected according to the newest figure.
Reviewer #1 (Significance (Required)):
General assessment:
I believe this manuscript adds a significant amount of useful data and provides some novel insights into scyphozoan cell types across an important life history transition from polyp to medusa in Aurelia. Adding the dataset to the USCS Cell Browser is a strength. I think there is the potential to make this an impactful paper but in its current form, it is pretty messy, and not clearly presented, and lacks some transparency. The greatest weaknesses lie in not framing the work adequately or putting it into enough context with previous work and also not relating it to other medusozoans; in the Figures which are overly crowded, and confusing rather than being clear and supporting the results; and in the lack of explanation for some methods like how cell clusters were annotated, how transcription factor families were determined; and the lack of access to the github data repository, which raises questions of reproducibility. It will take a good amount of restructuring figures and reframing to make the study clear and impactful and the methods and analyses reproducible.
Advance: If the weaknesses are addressed adequately, this study does contribute new insights in the area of further understanding changes across an important scyphozoan life cycle transition in terms of diversity of cell types and their cell-type transcriptomes, opening up further questions which can now be addressed.
Audience: The broader cnidarian community will be interested in this study. People studying cell type evolution and cell type novelty across the tree of life will also be interested. Anyone looking for examples of how to use modern approaches to understanding life cycle changes in animals will be interested.
My expertise is in cnidarian cellular and molecular biology and evolution including working with model cnidarian research organisms and employing techniques and approaches similar to those used in this study.
We thank this reviewer for their detailed comments and suggestions, and feel the manuscript is much improved in its current form. We hope that we have satisfied all concerns raised here.
__Reviewer #2 (Evidence, reproducibility and clarity (Required)):
__This paper is well-written and serves as a valuable resource not only for the cnidarian community but also for researchers studying more broadly cell type identity and evolution. A key cell type enabling the transition from polyp to free-swimming medusa is the cnidarian striated muscle, which has only been morphologically identified in medusozoan jellyfish. While this study does not include functional analyses, it lays the foundation for the Aurelia research community to leverage single-cell atlas data for future investigations.
Key experiments supporting the paper's main conclusions are missing :
•At the beginning of the Results section, the authors mention identifying a previously undescribed developmental stage, which they name "clover-polyp" However, they do not later discuss whether this newly identified stage has a distinct gene expression signature. This point should be addressed in the paper or removed.
__Answer: __We do not find any specific transcriptomic signature specific to this stage. We keep this designation as a morphological indicator of a strobilation-competent polyp, but have re-worded our introduction of this term as follows:
“The first external sign of strobilation is the expansion of the body column into four pouches that are filled with multiple folds of inner cell layer epithelia (Fig. 1A), and resembles a cloverleaf from above; we call this stage the “clover-polyp”.”
•A key reference is missing in the following sentences :
"The anthozoan Nematostella vectensis has two principal neural sub-families that have been described that correspond to those with insulinoma expression (n1) and those with pou4 expression (n2) (13,14)."
"The class n1 family also includes putatively non-neural secretory cell types ("s"), which are enriched in genes associated with digestion and extracellular matrix production (Data S1.10). These data suggest a close relationship between neurons and gland cells, like what has been suggested in other cnidarians (13,27)."
"Thus, similar to that described for the anthozoan Nematostella vectensis (13,14), Class 1 neurons and related secretory cells comprise the predominant type of neuroglandular cells in the polyp stage. Further, these are the primary neuroglandular cells within the gastrodermis of the medusa."
The first functional analysis of NvInsm1+ expressing neurons and secretory cells in Nematostella vectensis was conducted in this study (Tournière, O. et al., 2022), making it essential to cite this work.
__Answer: __We appreciate the reviewer for drawing this oversight to our attention. This has been corrected in the revised manuscript.
To validate the neuronal component of this single-cell data, it is essential to confirm the N1 and N2 populations and demonstrate that they do not overlap. I recommend performing in situ hybridization or antibody staining for Insm1+ and Pou4+ cells (or any other suitable markers for these populations) to show that they are expressed in distinct cells/region in Aurelia.
__Answer: __We appreciate the reviewers comment, however, there are unfortunately no specific antibodies available for Insm1 or Pou4, or any other n1/n2 specific neuronal marker protein. Moreover, we find in situ hybridization in this system to be very challenging except for highly expressed structural genes. Neurons are particularly difficult, because they are very small cells embedded between many other cell types. We attempted to validate distribution of different neuron populations with colorimetric in situ hybridization, FISH as well as HCR (hybridization chain reaction). However, we were not successful in labelling individual neuron bodies and visualising their cytoplasmic RNA content to distinguish individual cells and therefore individual neuron types. Regardless, to validate at least neuronal cell types, we were able to correlate pan-neuronal tbb-like expression with b-Tubulin antibody staining and of RFamide antibody staining with specific neuronal subpopulations.
•What is labelled in yellow in Figure 5C? The legend should be updated.
Answer: Figure 5C does not exist in the current version of the manuscript.
•Figure 5i, j, and k, are not clear, the paper would benefit with bright field pictures.
__Answer: __Images were replaced and some bright field photos are incorporated into both new figures.
•Each figure should connect specific gene expression at a given stage with the corresponding single-cell expression data in a dot plot. For instance, in Figure 6, myofillin-like 2, mhc1, and mhc2 should be accompanied by their respective single-cell expression data at this stage in a dot plot.
Answer: done!
The authors repeatedly refer to the polyp as asexual and the medusa as sexual; however, they do not mention any gonadal cluster nor discuss its absence from their single-cell data.
__Answer: __We have added the following sentence to the current manuscript to account for this: “Despite its larger size, this animal was still reproductively immature and so no gonadal tissues were collected.”
•The authors include EdU experiments in Figure S2 but discuss them only briefly in the text. If these experiments provide new insights, they should be elaborated on; otherwise, they could be removed from the manuscript.
__Answer: __We have removed these data from the manuscript.
As this paper is primarily a resource for the cnidarian community, ensuring easy access is crucial for enabling species comparisons. I recommend making the data openly available through a single-cell portal, as done in Juliano et al. (2019).
__Answer: __We have already released these data on the UCSC cellbrowser platform, as was stated in the manuscript. These data have been updated to reflect the current status of the analyses and is publicly available at www.jellyfish-atlas.cells.ucsc.edu
Reviewer #2 (Significance (Required)): This well-written paper is a valuable resource for the cnidarian community. A key cell type driving the transition from polyp to free-swimming medusa is the cnidarian striated muscle, which has only been morphologically identified in medusozoan jellyfish. While the study lacks functional analyses, further biological validations, such as in situ hybridizations, are needed to confirm the single-cell data. Nevertheless, it lays a strong foundation for the Aurelia research community to utilize single-cell atlas data in future studies. To maximize its impact, the authors should ensure the data is easily accessible to the broader scientific community.
We thank this reviewer for their recognition of the importance of this work. We have ensured that the data are available for download through the UCSC cell browser, and all scripts used in the data analysis are available on our github page. We additionally included our new gene models that are associated with the single cell data on the companion UCSC genome browser website, which now hosts the NCBI genome assembly with our gene models.
Reviewer #3 (Evidence, reproducibility and clarity (Required)):
The manuscript by Link and collaborators presents a well-executed and thorough analysis (statistically significant) of cell types and developmental trajectories in Aurelia coerulea, a cnidarian with a medusa stage. While previous cnidarian cell atlases have focused on embryo-to-polyp development, this study uniquely incorporates adult medusa-stage cells, providing novel insights into cnidarian biology.
The authors successfully identify a broad range of cell types and precursors in both polyp and medusa stages. By comparing transcriptional profiles, they demonstrate the presence of new cell types, such as neurons, in the medusa. Notably, they provide compelling evidence for the coexistence of both striated and smooth muscle within cnidarians-a topic they have explored in previous work. Their morphological analysis further suggests that striated and smooth muscle forms can exist within single cells, which is particularly intriguing. Overall, the results are convincing.
A major strength of this study is the extensive number of cells analyzed and the rigorous classification of cell identities based on transcriptional profiles. Unlike many single-cell studies, the authors complement their findings with morphological, immunochemical, and in situ data, strengthening their conclusions. Conducting such an analysis without a fully annotated genome presents a significant challenge, yet the authors navigate this limitation effectively.
One relative limitation, common to many single-cell studies, is the lack of detailed spatial information on the identified subtypes. While the authors have made efforts in this direction, a higher-resolution atlas that pinpoints these subtypes within the body would enhance the impact of the study. The absence of transgenic tools with cell-type-specific enhancers makes this difficult, but it remains a valuable avenue for future research. Despite this, the study's novelty and quality-particularly its inclusion of medusa-stage data-make it a strong candidate for publication in any journal associated with Review Commons.
Minor Comments: • The term "terminal cell type markers" may not be the most appropriate for transcription factors that regulate state or specification. A more precise term, such as "state or specification transcriptional regulators," might be preferable.
__Answer: __This term does not appear in the revised manuscript.
The suggestion that cell-type specification is not governed by a random collection of TFs seems self-evident. If not TFs, what alternative regulatory mechanisms (e.g., post-transcriptional regulation, small RNAs) are being implied?
__Answer: __In the revised manuscript we have removed focus on the TFs.
The rationale behind the observation that "'early' cells separate along three principal trajectories (cnido.1, cnido.2, and cnido.3m), then converge upon a second mature transcriptomic phenotype" could be more clearly explained.
__Answer: __This is a phenomenon that is now well established for cnidarians from the perspective of single cell transcriptomics (Chari et al, 2021: Clytia; Steger et al, 2022, Cole et al 2024, Plessier and Marlow 2026: Nematostella; Cazet et al 2023: Hydra). This phenomena is also described here in terms of the sequence of transcription factors that are activated sequentially in both Aurelia and Nematostella. We have modified the introductory text to better place these observations in context as follows:
Recently we reported that within the sea anemone Nematostella vectensis, specification of the distinct cnidocyte types is marked by a diverging transcriptomic profile corresponding to the formation of the different capsule types, which then undergo a molecular switch demarcated by up-regulation of GFI1B and converge upon a secondary neural-like expression profile (11). Notably, we find a similar forked trajectory within the cnidocyte population of Aurelia. (Fig. 3A). A cluster of SoxC expressing ‘early’ cells separate along two principal trajectories (cnido.1, cnido.2), which then converge upon a second mature transcriptomic phenotype upon activation of jun/fos (Fig. 3E).
The illustrations of the nervous system in the ephyra and rhopalia are intriguing but lack spatial context for different neuronal populations beyond the positioning of class 2 neurons ("alpha- and beta-tubulin cells").
Answer: We added a better introduction to gain more understanding of the different neuron populations in contrast to various findings of related publications. The text now reads:
This rhopalia nervous system develops during polyp-medusa metamorphosis and is composed of specialized light- (pigment cup) and gravity- sensing (lithocyte/statocyst) cells, segregated into individual compartments with different developmental origins (12). Rhopalia development involves the gene expression of otx1, pit1 and brn3 in the pigment-cup (10),.... p4/5
Further, we used findings from previous studies to add a more elaborate description to our results and we finally discuss it, for example:
The ins-negative populations in both species express pou4 orthologs, also called brn3 (10), that is expressed also within the cnidocyte lineages and thus further supports claims of a close relationship between cnidocytes and insulinoma-negative/pou4-positive n2 neurons (13,14,52). p22
Muscle characterization is well-supported by phalloidin staining and gene markers, but is there a specific marker for smooth muscle? Myophilin-like-2 is mentioned, but is it definitive?
Answer: Yes, there are many, as tabulated in supplemental Data S1.11. For example myophilin-like-2 [calponin] is a specific marker for smooth muscle cells and this is demonstrated via in situ hybridization in fig.6.
The finding that ~40% of genes distinguishing smooth and striated muscle lack homologs in other animals is striking. It may be worth investigating their expression patterns via in situ hybridization, particularly for those that differentiate muscle types. The fact that these genes are of unknown affinity does not mean they are uninformative.
__Answer: __There are a variety of reasons that lead to a lack of orthology information amongst the gene models, including fragmented gene models, inclusion of unidentified lncRNAs, amongst others. However, due to this ambiguity and the lack of identification of these rationals we have removed this observation from the current manuscript. In fact, with the updated mapping tool and current gene annotations this number has fallen to only ~28% of the identified muscle-specific gene models, from a total ~38.7% unannotated gene models in the entire transcriptome. This is similar to other cells types in the dataset (between ~20%-35%), and also similar to the number of unannotated genes in the sea anemone Nematostella vectensis (36.5% overall)
The incompleteness of Aurelia genomes is acknowledged as a limitation. However, since the San Diego strain genome appears to be the most complete, is there a reason it was not used in this study? Was it not possible to recover the same strain?
__Answer: __We have a standing culture in the lab that was used for these collections. While we considered generating a genomic assembly for this laboratory strain, we have concluded that this is not an effective use of resources at this time. We have now updated the reference for mapping however, from a re-analysis of the available Aurelia coerulea isolate AC-2021 genome (NCBI: GCA_039566865.1) annotated with the Gnomon 9.0 automated annotation pipeline, and supplemented with our in-house transcriptome to recover ~5000 additional gene model coordinates on the genome. These are available now via the UCSC genome browser website.
We further thank this reviewer for the overall positive assessment of our work, and hope that the revised version further strengthens the data analysis and contribution to the community as a whole.
__ **Referees cross-commenting**__
Referees, I generally agree with their assessments. Below, I outline my main concerns and suggestions for improvement.
Figures and Data Presentation
I concur with Referee 1 that the figures are overcrowded, making it difficult to interpret individual panels. The excessive number of panels within a single figure creates unnecessary complexity. Some of these could be moved to the supplementary materials to improve readability. It seems that the authors aim to present every possible data analysis, but this is not necessary within the main text. As Referee 1 also noted, the key findings should be clearly visible, allowing the reader to follow the story without getting lost in excessive detail.
__Answer: __We have re-structured most of the figures with this in mind and hope that we have achieved better clarity. Many of the data analyses in the previous versions have been removed if not directly related to the observations highlighted in the current version.
Additionally, the annotation of clusters remains unclear, a concern also raised by other referees. The manuscript would benefit from a more explicit description of how these clusters were assigned.
__Answer: __We have expanded our description of how we assigned identities to the nine principal cell type families as follows:
(pg. 8) The inner epithelia, or gastrodermis, expresses several collagens that is a characteristic of the inner cell layer of anthozoans (39); the outer cell layer houses the ring musculature and is rich in contractile proteins. The striated muscle cluster is also rich in contractile protein and is the only principal cell population absent from the polyp-derived samples (Fig. 2C). The mucin gland expresses mucins, whereas the digestive gland expresses other digestive enzymes, whereas the neural cluster expresses synapsin and other conserved known neural regulators such as ashA. The cnidocytes express mini-collagens and are enriched in pathways targeting the endoplasmic reticulum (40).
Writing and Discussion
While I do not have major concerns with the writing, I suggest expanding the discussion, particularly regarding the relationship between muscle cell types and the diversification of paralogs. If the figures are streamlined, the text can also be made more concise, avoiding exhaustive references to every individual data point.
Clarifications on the Muscle Section
Several aspects of the muscle analysis require clarification: • The differences between muscle cell types are based on a set of differentially expressed genes, 40% of which (in each set) are of unknown affinities. However, it is surprising that the regulatory genes shared between both muscle profiles are expressed in bilaterian smooth muscles. The manuscript does not address whether bilaterian striated muscles share regulatory genes with the Aurelia striated muscle set. This comparison would be valuable.
Answer: __With the latest mapping tool the percentage of muscle-specific genes of unknown affinities has dropped to ~28% and we no longer highlight this observation in the manuscript. Regarding the regulatory genes shared with smooth muscles of bilaterians, we feel this may be a misunderstanding. In Fig. 7 we clarify that these are __structural proteins regulating the contraction of the muscle (e.g. Myosin light chain kinase and calponin). With respect to the developmental regulators, e.g. muscle cell type determining transcription factors, we list several in Data S1.3b, S1.4b. A broader phylogenetic and also functional analysis of these transcription factors in different jellyfish species is the focus of another collaborative study and therefore we do not include an in depth discussion of this topic in the current manuscript.__ __
The high proportion of unknown genes is concerning. Is this due to issues with the transcriptome assembly, or is it a consequence of insufficient comparative analyses? The statement that "Mapping to this final transcriptome increased confidently mapped genes to 60%" raises questions-does this mean that 40% of differentially expressed genes remain unmapped? This point should be clarified.
__Answer: __With the latest mapping tool, we now recover a confident alignment for ~80% of the sequences (See supplementary data S2.1). With the previous tool this value was only 60%, which means that 40% of the sequence data could not be used at all to generate the expression matrix. This is a different feature of the data analysis than the identity of the gene models. However, the statement mentioned here no longer appears in the current version of the manuscript.
Given the large number of differentially expressed genes with unknown function, could the authors perform in situ hybridization assays on a subset of these genes? This could provide insights into their spatial expression patterns and potential functional relevance.
Answer: This is an intriguing suggestion, however, given that in situ hybridization for medium and low expressed genes are extremely difficult in this organism, we feel that this is beyond the scope of this study.
Both muscle types appear to rely on a similar contractile apparatus but exhibit differential usage of paralogs. This finding is intriguing but is not sufficiently discussed. Are other cell types associated with the differential use of paralogs? Expanding this discussion would add depth to the manuscript.
Answer: We thank the reviewer for this insightful comment. Indeed, there is circumstantial evidence that differential usage of paralogs is also found among other cell types, e.g. neurons. We indeed discuss the example of a few other genes, e.g. ATOH-like transcription factors and myc. However, the diversity of neuronal populations is very large, which makes the picture quite complex. We are currently working on a phylogenetic framework of cell type families and also between species to address this point, but this requires more theoretical and methodological work. In this paper, we therefore restricted the analyses to the structural proteins of the two types of muscles, which facilitates the assignment of paralogs to either muscle. We point out that this is reminiscent of the differential expression of paralogs in the fast and slow contracting muscle cell types in Nematostella, suggesting that such a subfunctionalization may generally drive also the physiological diversification of muscle cell types in cnidarians (and of animals in general). Future work is aiming to address this on a broader scale, as suggested by the reviewer.
Neuronal Subtypes
I reiterate my previous comment regarding neuronal types: • The enrichment of neural subtypes in the medusa stage is an interesting, albeit expected, finding. However, the manuscript lacks details regarding their specific spatial distribution within the body. Providing this information would enhance the biological relevance of the findings.
Answer: in situ hybridization for neurons is a challenge in all cnidarians, because the small neurons with very thin neurites are embedded and intermingled between many other cell types. In Aurelia, this has proven to be particularly difficult. At the very best, one might see small cell bodies stained, however, it fails to visualize neurites. We also tried HCR (hybridization chain reaction) in combination with antibody staining (b-Tubulin) to get to single cell resolution. However, the results were not conclusive and we therefore refrain from showing them in the paper. As an alternative we connected the findings of previous studies (Nakanishi et al., 2009, 2010) in terms of certain types of neurons located in different compartments of the rhopalia and corresponding marker genes with our single cell data (introduction/discussion). We acknowledge that more work needs to be done, best by generating specific antibodies against neuronal antigens. However, this is beyond the scope of this paper.
References
I also agree with Referee 2 that some statements require further substantiation with appropriate references. Strengthening these points with supporting literature would improve the rigor of the manuscript.
Answer: We added appropriate references at all places indicated, as detailed above.
Final Remarks
Overall, while the study presents interesting findings, the manuscript would benefit from a clearer organization of figures, a more explicit explanation of muscle and neural subtype findings, and a deeper discussion on the significance of unknown genes and paralog usage. Addressing these concerns will enhance the clarity and impact of the paper.
Reviewer #3 (Significance (Required)):
Overall, this is a significant and well-supported study that advances our understanding of cnidarian cell diversity and muscle evolution. By examining how cell types change across the polyp and medusa stages, this study provides valuable insights not only into cnidarian development but also into broader evolutionary questions regarding the emergence of new body plans and tissue types. As a developmental biologist specializing in invertebrates, I find the results of this work particularly remarkable. It provides valuable insights into the developmental processes occurring in pre-bilaterian animals, shedding light on how cell types emerge and diversify in early-diverging metazoans
Answer: We thank reviewer 3 for this positive evaluation.
__Reviewer #4 (Evidence, reproducibility and clarity (Required)):
__Link et al. have studied cell type diversity in the scyphozoan Aurelia coerulea. More specifically, they compared several stages in the animal's life cycle using single-cell RNA-seq. Many members of the cnidarian clade Medusuzoa (scyphozoans included) have a metagenetic lifecycle that includes a sessile, clonally reproducing polyp and a free swimming, sexually reproducing medusa (jellyfish). The two phases are fundamentally different in their functional morphology, but the cellular basis of this difference has been unknown. The authors generated single cell RNA-seq libraries from eight life-cycle stages of the animal to include polyps, and medusae. Their main finding is that different cell types underlie polyp-medusa transition in this animal. Although expected intuitively, this finding has never been demonstrated experimentally. Moreover, a recent study on a colonial hydrozoan (Salamanca-Diaz et al. 2025) has shown that colony parts, as opposed to different life stages, use largely the same cellular components. Therefore, the current study is of broad interest to developmental and evolutionary biologists. Overall, the experiments and data analyses have been performed to a high standard, the figures are of good quality, and the manuscript is well written. Below are a few minor points to be addressed.
The Aurelia strain used in the study is somewhat ambiguous (suggested to be A. coerulea). The authors' statements on pp. 24, 25 are somewhat confusing--they first say they got over 90% alignment to the San Diego strain genome assembly but then state (in the 'Transcriptome mapping' section) that they got only 40% of their reads aligned, forcing them to use Trinity de novo transcriptome assembly. Please clarify.
__Answer: __Alignment to the genome is different from assignment of the alignment to a gene model. Ambiguous alignment cannot be assigned, and missing gene models would not have an assignment. However, we have switched the mapping tool used for this dataset for one that fits both genome sequence alignment AND gene model assignment better than the previously available choices. We now have ~80% of all sequences unambiguously aligned to the genome.
7--the authors state that some transcription factor families are over/underrepresented as terminal type marker. How do they know which cells are terminally differentiated.
__Answer: __We have removed our focus on transcription factor families in this work and recognize that the definition of a terminally differentiated cell state from single cell transcriptomics has not been clearly defined.
The homeobox gene Tlx has been reported to be associated with medusa development, being absent in taxa without medusae (Travert et al. 2023). Is it expressed in the Aurelia medusa (I couldn't find it in the data), and if so, where?
__Answer: __This is indeed a good point that we were also interested in. However, Tlx is detected ONLY in the ephyra libraries and at very low levels which is why we chose to avoid discussing it as the low detection prevents accurate reporting of the expression and could reflect rather a mapping problem for this gene (mis-annotated 3’ end). As information for this reviewer, the gene model shows some spurious reads specifically in a few neuron subtypes, and outside the ephyra is lowly detected ONLY in the medusa library for medusa neuron n.7 (n2.7m).
I do not quite understand the authors' arguments for independent striated muscle evolution in cnidarians and bilaterians. Key striated muscle genes (e.g., titin) are present in hydrozoan and anthozoan genomes; furthermore, the expression patterns of Otx is not indicative because its function in medusozoans is unknown. What are the arguments against an alternative scenario in which striated muscles evolved before the cnidarian-bilaterian split, but lost in anthozoans?
Answer: This is indeed a complex question, which requires a more thorough and targeted comparative analysis. We note that a BLAST hit for Titin can be misleading due to the many domain repeats of this Titin, which are also found in other proteins. To be more prudent, we removed this part from the manuscript. This will be subject of a future, thorough study.
27, the link https://github.com/technau/AureliaAtlas is broken.
__Answer: __We appreciate this comment and have ensured that the github archive is publicly available with all relevant scripts associated with all versions of the BioRxiV record.
p. 24 (limitations of the study section), the authors refer to "cosmopolitan species"; they probably mean "genus".
__Answer: __We changed to “taxon” and dropped cosmopolitan.
p. 24-25 on two occasions in the M&M sections, the authors put the abbreviation first and the initials in brackets (ASW and BSA).
__Answer: __This has been corrected.
"Metagenic" should be "metagenetic"
__Answer: __This has been corrected.
Reviewer #4 (Significance (Required)):
The study is of broad interest to developmental and evolutionary biologists. It addresses an important question, not dealt with directly in previous studies.
Answer: We thank reviewer 4 for this positive and encouraging assessment.
Note: This preprint has been reviewed by subject experts for Review Commons. Content has not been altered except for formatting.
Learn more at Review Commons
Link et al. have studied cell type diversity in the scyphozoan Aurelia coerulea. More specifically, they compared several stages in the animal's life cycle using single-cell RNA-seq. Many members of the cnidarian clade Medusuzoa (scyphozoans included) have a metagenetic lifecycle that includes a sessile, clonally reproducing polyp and a free swimming, sexually reproducing medusa (jellyfish). The two phases are fundamentally different in their functional morphology, but the cellular basis of this difference has been unknown. The authors generated single cell RNA-seq libraries from eight life-cycle stages of the animal to include polyps, and medusae. Their main finding is that different cell types underlie polyp-medusa transition in this animal. Although expected intuitively, this finding has never been demonstrated experimentally. Moreover, a recent study on a colonial hydrozoan (Salamanca-Diaz et al. 2025) has shown that colony parts, as opposed to different life stages, use largely the same cellular components. Therefore, the current study is of broad interest to developmental and evolutionary biologists. Overall, the experiments and data analyses have been performed to a high standard, the figures are of good quality, and the manuscript is well written. Below are a few minor points to be addressed.
The Aurelia strain used in the study is somewhat ambiguous (suggested to be A. coerulea). The authors' statements on pp. 24, 25 are somewhat confusing--they first say they got over 90% alignment to the San Diego strain genome assembly but then state (in the 'Transcriptome mapping' section) that they got only 40% of their reads aligned, forcing them to use Trinity de novo transcriptome assembly. Please clarify.
p. 7--the authors state that some transcription factor families are over/underrepresented as terminal type marker. How do they know which cells are terminally differentiated.
The homeobox gene Tlx has been reported to be associated with medusa development, being absent in taxa without medusae (Travert et al. 2023). Is it expressed in the Aurelia medusa (I couldn't find it in the data), and if so, where?
I do not quite understand the authors' arguments for independent striated muscle evolution in cnidarians and bilaterians. Key striated muscle genes (e.g., titin) are present in hydrozoan and anthozoan genomes; furthermore, the expression patterns of Otx is not indicative because its function in medusozoans is unknown. What are the arguments against an alternative scenario in which striated muscles evolved before the cnidarian-bilaterian split, but lost in anthozoans?
p. 27, the link https://github.com/technau/AureliaAtlas is broken.
p. 24 (limitations of the study section), the authors refer to "cosmopolitan species"; they probably mean "genus".
p. 24-25 on two occasions in the M&M sections, the authors put the abbreviation first and the initials in brackets (ASW and BSA).
"Metagenic" should be "metagenetic"
The study is of broad interest to developmental and evolutionary biologists. It addresses an important quastion, not dealt with directly in previous studies.
Note: This preprint has been reviewed by subject experts for Review Commons. Content has not been altered except for formatting.
Learn more at Review Commons
The manuscript by Link and collaborators presents a well-executed and thorough analysis (statistically significant) of cell types and developmental trajectories in Aurelia coerulea, a cnidarian with a medusa stage. While previous cnidarian cell atlases have focused on embryo-to-polyp development, this study uniquely incorporates adult medusa-stage cells, providing novel insights into cnidarian biology.
The authors successfully identify a broad range of cell types and precursors in both polyp and medusa stages. By comparing transcriptional profiles, they demonstrate the presence of new cell types, such as neurons, in the medusa. Notably, they provide compelling evidence for the coexistence of both striated and smooth muscle within cnidarians-a topic they have explored in previous work. Their morphological analysis further suggests that striated and smooth muscle forms can exist within single cells, which is particularly intriguing. Overall, the results are convincing.
A major strength of this study is the extensive number of cells analyzed and the rigorous classification of cell identities based on transcriptional profiles. Unlike many single-cell studies, the authors complement their findings with morphological, immunochemical, and in situ data, strengthening their conclusions. Conducting such an analysis without a fully annotated genome presents a significant challenge, yet the authors navigate this limitation effectively.
One relative limitation, common to many single-cell studies, is the lack of detailed spatial information on the identified subtypes. While the authors have made efforts in this direction, a higher-resolution atlas that pinpoints these subtypes within the body would enhance the impact of the study. The absence of transgenic tools with cell-type-specific enhancers makes this difficult, but it remains a valuable avenue for future research.
Despite this, the study's novelty and quality-particularly its inclusion of medusa-stage data-make it a strong candidate for publication in any journal associated with Review Commons.
Minor Comments:
Referees cross-commenting
Referees, I generally agree with their assessments. Below, I outline my main concerns and suggestions for improvement.
Figures and Data Presentation
I concur with Referee 1 that the figures are overcrowded, making it difficult to interpret individual panels. The excessive number of panels within a single figure creates unnecessary complexity. Some of these could be moved to the supplementary materials to improve readability. It seems that the authors aim to present every possible data analysis, but this is not necessary within the main text. As Referee 1 also noted, the key findings should be clearly visible, allowing the reader to follow the story without getting lost in excessive detail.
Additionally, the annotation of clusters remains unclear, a concern also raised by other referees. The manuscript would benefit from a more explicit description of how these clusters were assigned.
Writing and Discussion
While I do not have major concerns with the writing, I suggest expanding the discussion, particularly regarding the relationship between muscle cell types and the diversification of paralogs. If the figures are streamlined, the text can also be made more concise, avoiding exhaustive references to every individual data point.
Clarifications on the Muscle Section
Several aspects of the muscle analysis require clarification:
Neuronal Subtypes
I reiterate my previous comment regarding neuronal types:
References
I also agree with Referee 2 that some statements require further substantiation with appropriate references. Strengthening these points with supporting literature would improve the rigor of the manuscript.
Final Remarks
Overall, while the study presents interesting findings, the manuscript would benefit from a clearer organization of figures, a more explicit explanation of muscle and neural subtype findings, and a deeper discussion on the significance of unknown genes and paralog usage. Addressing these concerns will enhance the clarity and impact of the paper.
Overall, this is a significant and well-supported study that advances our understanding of cnidarian cell diversity and muscle evolution.
By examining how cell types change across the polyp and medusa stages, this study provides valuable insights not only into cnidarian development but also into broader evolutionary questions regarding the emergence of new body plans and tissue types.
As a developmental biologist specializing in invertebrates, I find the results of this work particularly remarkable. It provides valuable insights into the developmental processes occurring in pre-bilaterian animals, shedding light on how cell types emerge and diversify in early-diverging metazoans
Note: This preprint has been reviewed by subject experts for Review Commons. Content has not been altered except for formatting.
Learn more at Review Commons
This paper is well-written and serves as a valuable resource not only for the cnidarian community but also for researchers studying more broadly cell type identity and evolution. A key cell type enabling the transition from polyp to free-swimming medusa is the cnidarian striated muscle, which has only been morphologically identified in medusozoan jellyfish. While this study does not include functional analyses, it lays the foundation for the Aurelia research community to leverage single-cell atlas data for future investigations.
Key experiments supporting the paper's main conclusions are missing :
"The anthozoan Nematostella vectensis has two principal neural sub-families that have been described that correspond to those with insulinoma expression (n1) and those with pou4 expression (n2) (13,14)."
"The class n1 family also includes putatively non-neural secretory cell types ("s"), which are enriched in genes associated with digestion and extracellular matrix production (Data S1.10). These data suggest a close relationship between neurons and gland cells, like what has been suggested in other cnidarians (13,27)."
"Thus, similar to that described for the anthozoan Nematostella vectensis (13,14), Class 1 neurons and related secretory cells comprise the predominant type of neuroglandular cells in the polyp stage. Further, these are the primary neuroglandular cells within the gastrodermis of the medusa."
The first functional analysis of NvInsm1+ expressing neurons and secretory cells in Nematostella vectensis was conducted in this study (Tournière, O. et al., 2022), making it essential to cite this work. - To validate the neuronal component of this single-cell data, it is essential to confirm the N1 and N2 populations and demonstrate that they do not overlap. I recommend performing in situ hybridization or antibody staining for Insm1+ and Pou4+ cells (or any other suitable markers for these populations) to show that they are expressed in distinct cells/region in Aurelia. - What is labelled in yellow in Figure 5C? The legend should be updated. - Figure 5i, j, and k, are not clear, the paper would benefit with bright field pictures. - Each figure should connect specific gene expression at a given stage with the corresponding single-cell expression data in a dot plot. For instance, in Figure 6, myofillin-like 2, mhc1, and mhc2 should be accompanied by their respective single-cell expression data at this stage in a dot plot. - The authors repeatedly refer to the polyp as asexual and the medusa as sexual; however, they do not mention any gonadal cluster nor discuss its absence from their single-cell data. - The authors include EdU experiments in Figure S2 but discuss them only briefly in the text. If these experiments provide new insights, they should be elaborated on; otherwise, they could be removed from the manuscript. - As this paper is primarily a resource for the cnidarian community, ensuring easy access is crucial for enabling species comparisons. I recommend making the data openly available through a single-cell portal, as done in Juliano et al. (2019).
This well-written paper is a valuable resource for the cnidarian community. A key cell type driving the transition from polyp to free-swimming medusa is the cnidarian striated muscle, which has only been morphologically identified in medusozoan jellyfish. While the study lacks functional analyses, further biological validations, such as in situ hybridizations, are needed to confirm the single-cell data. Nevertheless, it lays a strong foundation for the Aurelia research community to utilize single-cell atlas data in future studies. To maximize its impact, the authors should ensure the data is easily accessible to the broader scientific community.
Note: This preprint has been reviewed by subject experts for Review Commons. Content has not been altered except for formatting.
Learn more at Review Commons
Summary: Overall, this study adds a large amount of data for the scyphozoan Aurelia coerulea by producing several single-cell RNA sequencing libraries that cover the transition from polyp to medusa. The study provides a modern view of cell type diversity and cell-specific transcriptome changes during this period of extreme morphological change in this particular cnidarian lineage, which is understudied. Certain unique cell subtypes, including neural cell subtypes and muscle cell subtypes which are specific to different life stages are discussed in detail providing some new insights.
My overall assessment is that the manuscript has good potential to be impactful, but in its current form it is somewhat clunky and overly complex to read, the figures were too crowded and difficult to comprehend, and the authors did not provide enough context regarding the current state of knowledge and what this study adds to it. In particular, Figure 1 and the section about striated and smooth muscles sharing partial transcriptomic profiles need the most work. The results were presented in the context of the anthozoan Nematostella but this should be broadened further to include other cnidarian single-cell studies, such as those from Hydra and Clytia which are both medusozoans like Aurelia. The writing throughout could be streamlined and simplified to better highlight the major findings as described in the abstract of the paper. Several figures were not well presented or clear and could be improved or decluttered to better communicate and support important results. In addition, some methods were totally missing, and I was unable to access the github repository associated with the paper which should detail all analyses described in the paper. In its current form, reproducibility of analyses would be quite limited. I did greatly appreciate the inclusion of the data on the UCSC Cell Browser, which allows anyone to access the single cell data matrix for visual exploration.
Major comments:
The Introduction section was very short - only three paragraphs. I feel that this section could be expanded to give more context about Aurelia as a research organism, and the current resources available. This includes genomic and transcriptomic resources particularly those focused on the transition between life cycle stages (polyp to medusa). Any other relevant background on cell type diversity or if there is anything known about the molecular profile of specific cell types found in different life stages should also be included here. Do marker genes already exist for some of the important cell types discussed in the manuscript? It would be better to present the current state of knowledge, and context for why this study was done, how it builds upon current knowledge, and what it adds to our current understanding so that the study is properly framed from the beginning.
In the Results section, I find the sentence on p. 4, "Further, ~70% of these gene models do not have readily identifiable orthologs and thus represent putative orphan genes" to be rather confusing. What analysis was performed to determine this percentage, and which set of organisms were compared? Doesn't this percentage seem rather high for a cnidarian? Or is this referring to orthologs outside of cnidaria? Please comment further on how this percentage was determined and possible explanations for it being this high. Right now, it just feels tacked on to this paragraph with no context or further explanation which leads to the confusion.
Figure 1. There are many issues with this figure that encompass how I felt generally about the figures of the paper. The figure should ideally take up the entire width of the page rather than squishing some text next to the figure.
Figure 1A: The colors of the different developmental stages from which tissue was samples (e.g. polyp1, polyp2, polyp.clover) do not seem to match between legend and figure. For example, the "polyp.clover" stage is circled in blue in the schematic, but given a green dot in the legend. The "medusa.manubrium" is circled in orange in the schematic, but given a purple dot in the legend. Suggest making the colors match between legend and schematics.
Figure 1E: In Panel E, the labels showing that the top graph is "polyp" and the bottom graph is "medusa" are much too small. Increase the font size of the labels. The font size for the GO terms themselves are also too small.
Figure 1F: The bulk of this study centers around the single-cell RNA sequencing data and resulting analyses from these data. As such, I would expect the cellular atlas resulting from these data to be similarly highlighted. In Figure 1F, the annotated cell atlas as presented is much too small, making it impossible to even add the labels for the different clusters directly on the UMAP. Suggest increasing the size substantially to at least half of the page width, so that it is possible to do so.
Figure 1G: Panel G, for example, is not useful in conveying its point as the text labels are too tiny and the figure is overly complex to be squished into a panel of this figure. Suggest removing and making 1G a supplemental figure by itself or perhaps together with 1C (as they are linked) where it is more legible. The figure legend text for Fig 1G is also confusing as it refers to "scyphozoa" in (C) but there is no "scyphozoa" in 1C, only "medusa".
Text, p. 6: The explanation for how the clusters were annotated in Fig 1 and Fig 2 is much too vague. The text states, 'We identified 9 broadly defined cell populations, for which we assign identities by assessing up-regulated gene lists (Data S1.3)." What does this mean? How exactly were the up-regulated gene lists assessed? This needs to be clarified further. What genes were used to label these clusters or groups as particular cell types? How does the annotation relate to Supplemental Tables S1.3 and S1.3b? Does the previous literature need to be cited to support these annotations based on specific genes? Suggest doing a better job overall and providing more detail and context explaining how the single cell clusters were annotated.
Text, starting on p14: "Striated and smooth muscles share partial transcriptomic profiles." This section is highly confusing and could do with some simplification in both text and figures.
Discussion
Materials and Methods
Minor comments:
Figures:
Figure 2A: In the legend it says "Colour code as in (B) and (C)" but it's really referencing the colors in Figure 1A, correct? It is confusing to have to look back to Figure 1A to understand the colors here.
Figure 2D: Typo in the word "proteins" in the title of this panel.
Figure 3F: The placement of the tree and the two featureplots for myc3 in Nematostella and Aurelia is confusing. Suggest moving the featureplot for Aurelia myc3 so that it is beside Nematostella (to the right of the tree) or move the featureplot for Nematostella myc3 so that it is beside the Aurelia featureplot (to the left of the tree).
Figure 4B: The description of this panel reads, "Distribution-histogram across all samples, medusa-specific cell clusters are highlighted with black outline.", however as a reader, the black outline is not very clear. Suggest making it bolder. In addition, this black outline is a little confusing - it should mark the medusa-specific cell clusters; however, the black outline appears in cell clusters in strobila and ephyra?
Figure 5B: It is unclear from where this reference UMAP was derived. Does it come from the overall UMAP, showing the 'outer epidermis' cluster only, with the putative smooth muscle cells in red? Or is it the 'outer epidermis' cluster plus the striated muscle cluster? Suggest making this clearer (see below for larger edits to this section of the manuscript).
Figure 5K/L/M: It is unclear which parts of the polyp in K is used for the images shown in L or M. Both come from the large red box, but it is unclear from which part L and M were made. In addition, the subtraction of the background from the image (to make it look white) is distracting and makes the image itself look artificial.
Figure 6C, G-S:
Figure 6J, M, N, O:
Figure 7H:
Results:
p5 - In this sentence, "Because these four pouches look like a cloverleaf from above, we call this stage the "clover-polyp", suggest changing "clover-polyp" to match the Figure 1A (where it is written as polyp.clover), or change the text in the Figure to match the text in the manuscript.
p8 - In this sentence, "the bZIP protein family are over-represented as terminal cell type markers, while the number of zinc-finger proteins of the N2C2 class are under-represented", the "N2C2" class the authors refer to is not clear. Is there a typo here? In the figure to which this sentence refers (Figure 2D), the proteins referenced are "zf-H2C2" or "zf-C2H2".
p9 - Typo - should be "medusozoans" rather than "medusazoans".
p11+ - Section titled, "Aurelia neural complement reveals two neural classes with similarities to anthozoan neurons"
p11 - Text reads, "Class 1 neurons in the medusa are also most prevalent within the gastrodermis and manubrium, and includes one subtype that first appears in the strobila and is found in all medusa tissue samples ("n1.3.medusa"; lower black box Fig. 4F).", however there is no "lower black box" in Figure 4F apparent.
p13 - The text reads, "We find that class 2 neurons all express elevated levels of specific alpha- and beta- tubulins (TBA1-like3 and TBB-like-1; Fig. 4D).". Make the capitalization of your gene names (TBA1-like3, etc) consistent between text and figure throughout (in Fig. 4D the gene names are lower case).
p14 - In the first paragraph of this page, Fig. 4C is referenced twice, however both times the referencing sentence does not match this panel (most likely the authors meant to reference 4E, F or G).
p14 - The final sentence of this upper paragraph, "Specific tubulin-paralog expression within the class n2 neurons suggest that this is the portion of the nervous system labelled by the β-Tubulin antibody." is confusing. Do you mean that the b-tubulin antibody is most likely labelling the product of the tbb-like-1 gene that is shown in the featureplot in Fig 4D? Suggest rewriting this sentence for clarity.
p14 - on this page and others in the manuscript, there are instances of the word "Aurelia" not being italicized.
p14 - In this sentence, "In the sea anemone Nematostella, anemone-specific gene duplications of members of the PaTH (Paraxis, Twist Hand-related) bHLH family of protein coding genes was driving the diversification of muscle cell types (29)." the "was driving" part of the sentence is grammatically clunky. Suggest rewording slightly. (e.g. "...protein coding genes drive the diversification of muscle cell type").
-Myophilin-like2 in the text of the manuscript is written as myofilin-like2 in the figure panels (e.g. Fig 5L, Fig. 6D). Make consistent between text and figures.
p15 - on this page and several instances thereafter, "in situ" is not italicized as it should be.
p19 - In the line, "Taken all together these data suggest that the contractile apparatus in the Scyphozoa, using here Aurelia as a proxy, is similar to the bilaterian smooth muscle contractile complex (Fig. 8C)." this should really reference Fig. 8 B-C
General assessment:
I believe this manuscript adds a significant amount of useful data and provides some novel insights into scyphozoan cell types across an important life history transition from polyp to medusa in Aurelia. Adding the dataset to the USCS Cell Browser is a strength. I think there is the potential to make this an impactful paper but in its current form, it is pretty messy, and not clearly presented, and lacks some transparency. The greatest weaknesses lie in not framing the work adequately or putting it into enough context with previous work and also not relating it to other medusozoans; in the Figures which are overly crowded, and confusing rather than being clear and supporting the results; and in the lack of explanation for some methods like how cell clusters were annotated, how transcription factor families were determined; and the lack of access to the github data repository, which raises questions of reproducibility. It will take a good amount of restructuring figures and reframing to make the study clear and impactful and the methods and analyses reproducible.
Advance: If the weaknesses are addressed adequately, this study does contribute new insights in the area of further understanding changes across an important scyphozoan life cycle transition in terms of diversity of cell types and their cell-type transcriptomes, opening up further questions which can now be addressed.
Audience: The broader cnidarian community will be interested in this study. People studying cell type evolution and cell type novelty across the tree of life will also be interested. Anyone looking for examples of how to use modern approaches to understanding life cycle changes in animals will be interested.
My expertise is in cnidarian cellular and molecular biology and evolution including working with model cnidarian research organisms and employing techniques and approaches similar to those used in this study.
Chapter 12 though the gossip is spreading and the rumors are damming Janie and teacake stay true to there love. But we also see this new type of confidence that she exerts we see that she is willing to follow a daring plan for love and that she has grown since the beginning of just listening to her nanny and marrying who she wants and running away for necessity we now see her true lay follow her childhood dream of love even if that means leaving her home.
CemA.diagnosesthecurrentinstitutionalclimateofsoftmoralalignment,whereartgesturestowardpoliticswithoutthedifficultyofbeingpolitical,andproposesstrategicempathyasapotentialpathout.
I can't help but feel like the core thesis of this paper is "Liberal centrism is bad ...because they're doing it wrong."
or the use of anyone anywhere at no cost and with almost no restrictions whatsoever. You may copy it, give it away or re-use it under the terms of the P
test
urces Catts, Wade P. Summary of Archaeological Field Investigations, 2022–2025: Red Bank Battlefield Park (28GL84/28GL493), Gloucester County, New Jersey. Newark, DE: South River Heritage Consulting, 2026. Banner Photo by Buddy Secor - ht
I know you have more sources than this! Include the 2017 report, any other sites you link to, and list out your maps (already listed on maps page).
a compiled on behalf of the Red Bank Battlefield Park Special Thanks to Dr. Jen Janofsky and Wade Catts Group Members: Amber Bertino Myllena Correia Brian Murphy Jr. Carmella St. Hillaire Nick Torres
Move this info into its own "Credits" or "Who Contributed to this Project?" section, place above sources. Include note on use permissions (i.e. Creative Commons license, see metadata guide).
many historical artifacts found on the s
"artifacts found through archaeological investigation"
his website seeks to compare Fort Mercer and the Red Bank Battlefi
Provide heading - "What is this Project" or something similar, model it on your homepage and find another image online of the modern park to include
Simplified view: Less pivotal parameters (plant capacity, uptime, financing costs, media-use multiplier) are set to reasonable defaults. In our sensitivity analysis, these contribute less than 10% of the variance in cost estimates. Switch off to adjust all parameters. Code // Reactive style block to hide/show full-mode-only and cdmo-only inputs html`<style> .full-mode-only { display: ${simpleMode ? 'none' : 'block'}; } .cdmo-only { display: ${cdmo_mode ? 'block' : 'none'}; } .override-mode-only { display: ${override_mode_constraints ? 'block' : 'none'}; } .separable-only { display: ${bundled_media ? 'none' : 'block'}; } .bundled-only { display: ${bundled_media ? 'block' : 'none'}; } .blending-only { display: ${include_blending ? 'block' : 'none'}; } </style>` .full-mode-only { display: none; } .cdmo-only { display: none; } .override-mode-only { display: none; } .separable-only { display: block; } .bundled-only { display: none; } .blending-only { display: none; }
even the 'nonsimplified view' should have some baseline capital cost, w a reasonable default ... and does it enter into the tornado table?
This map shows the estimated location and appearance of Fort Mercer alongside topographic features of Red Bank. Fort Mercer was an earthwork fort with a ditch and abatis, but no earthen wall on the side facing the Delaware River. The fort was originally constructed much larger than able t
This page is in great shape. Just look at my comments on the "Maps of Red Bank" page and try to mirror the same formatting here in terms of font/page layout.
Mapping Red Bank Battlefield
Rename page "Historical Maps of Red Bank"? make sure it is clear that this page is about the historical maps themselves.
The follo
I'd add a heading here for "Gallery of historical maps," include your brief explanation that these same maps are those used in the map, this is a place for the user to browse them in more detail.
Plan von dem Angriff aufs Fort bein Red Bank by Jaeger Captain Johann Ewald (1777) Plan zum dem Aufstieg zum Fort Redbank am 22. Oktober 1777 unter Colonel de Donop und der Angriff der Briten von Fort Mifflin oder Mud-Island am 15. November 1777 by JH Wolff (1778) Map for the Defense of the Delaware by Monsieur Major Jean Louis Ambroise de Genton, Chevalier de Villefranche (1779) Plan of Fort Mercer, at Red Bank, N.J. by John Barber and Henry Howe, surveyor T. and E. Saunders (1842) Plat of the Abandoned Red Bank Military Reservation in Gloucester Co., New Jersey by Arthur Kidder (1905) Overall Developement Plan, Red Bank Battlefield Historical Park by Colangele (1983) Plan of the U.S. Property at Red Bank by US Army Corps of Engineers (1872)
Move this source list to your sources list on the about page. The gallery below is sufficient to list out the maps you include, just make sure each of those items includes the full citations listed here.
A common theme among the earlier maps is the variety in which they depict the fort. While it retains a similar shape throughout, the fort is shown at different sizes and the maps were made for different purposes. The maps by Capt. Johann Ewald (1777) and JH Wolff (1778) are much more concerned with the action of the battle, whereas the one made by Monsieur Major Jean Louis Ambroise de Genton (1779) retains greater spatial accuracy with its inclusion of the surrounding landscape, property lines, roads, and riverbank. The variation in the riverbank across the maps is also a striking detail, with the earlier maps placing the fort on an embankment that juts out further into the Delaware River. The 1872 survey map created by the US Army Corps of Engineers was used as the main reference map due to its accuracy in relation to the time period created, which was 95 years after the battle, and due to its clear depiction of the fort ditch with one-foot contour lines. The other historical maps were then georeferenced by aligning their illustrations of the fort with the ditch contours on the 1872 map.
This is all really good, but play with the formatting. Perhaps divide paragraph here and un-bold below part. Try to maintain consistent formatting across pages.
This map sh
"The below interactive map..."
Cell Density (g/L)
This is very much determined by which process we are using. It's not that you can adjust the cell density on its own. -- should it/can it switch to being the sensitivity to 'process choice'
Which parameters have the most impact on the final cost? Each bar shows the dollar swing in mean unit cost between simulations where the parameter is in its top 10% versus its bottom 10%. Larger bars = bigger levers on cost. Code { const uc = results.unit_cost; // Deduplicated parameter list. // Removed vs. previous version (see explainer below for details): // • L/kg (volume) — deterministic function of density × media-use multiplier // • Uses Hydrolysates — regime-switch subsumed into Media $/L // • Has Cheap GFs — regime-switch subsumed into GF Price / GF Quantity const params = [ {name: "Cell Density (g/L)", data: results.density_samples, kind: "primitive"}, {name: "Media-use multiplier (×)", data: results.media_turnover_samples, kind: "primitive"}, {name: "Media $/L (incl. hydrolysate regime)", data: results.media_cost_L_samples, kind: "mixture"}, {name: "GF Price ($/g, incl. regime)", data: results.price_recf_samples, kind: "mixture"}, {name: "GF Quantity (g/kg, incl. regime)", data: results.g_recf_samples, kind: "mixture"}, {name: "Industry Maturity (latent — see note)", data: results.maturity_samples, kind: "latent"}, {name: "Plant Capacity (kTA)", data: results.plant_kta_samples, kind: "primitive"}, {name: "Utilization Rate", data: results.uptime_samples, kind: "primitive"} ]; const swings = params.map(p => ({ name: p.name, kind: p.kind, swing: conditionalSwing(p.data, uc, 0.10) })); const sorted = swings .map(s => ({...s, absSwing: Math.abs(s.swing)})) .sort((a, b) => b.absSwing - a.absSwing); const maxAbs = Math.max(...sorted.map(s => s.absSwing), 1); const pad = maxAbs * 0.30; const tornadoPlot = Plot.plot({ width: 900, height: 440, marginLeft: 290, marginRight: 100, x: { label: "Δ mean unit cost ($/kg): top 10% − bottom 10% of parameter", domain: [-maxAbs - pad, maxAbs + pad], grid: true, labelOffset: 40, tickFormat: d => (d >= 0 ? "+$" : "−$") + Math.abs(d).toFixed(0) }, y: { label: null, tickFormat: d => d, tickSize: 0 }, color: { domain: ["Increases cost", "Decreases cost"], range: ["#e74c3c", "#27ae60"] }, style: { fontSize: "13px" }, marks: [ Plot.barX(sorted, { y: "name", x: "swing", fill: d => d.swing > 0 ? "Increases cost" : "Decreases cost", sort: {y: "-x", reduce: d => Math.abs(d)} }), Plot.ruleX([0], {stroke: "black", strokeWidth: 1}), Plot.text(sorted, { y: "name", x: d => d.swing > 0 ? d.swing + maxAbs * 0.025 : d.swing - maxAbs * 0.025, text: d => (d.swing > 0 ? "+$" : "−$") + Math.abs(d.swing).toFixed(1) + "/kg", textAnchor: d => d.swing > 0 ? "start" : "end", fontSize: 12, fontWeight: 500 }) ] }); return html`<div style="font-size: 1em;"> <div style="font-weight: normal; font-size: 1.05em; margin-bottom: 0.5rem; color: #333;">Parameter Sensitivity: Dollar Swing in Mean Unit Cost</div> ${tornadoPlot} </div>`; }
Make it clearer, explain better that this is about parameters not just the cost inputs.
Component Distributions
make the table collapsed by default with a strong signpost to be able to see it
Where does the cost come from? This chart shows the average contribution of each cost component across all simulations. The largest bars are the cost drivers to focus on — these are where technological progress or parameter uncertainty has the most impact. Code { const mediaLabel = bundled_media ? "Complete Media (incl. GFs)" : "Media (incl. basal micros)"; const allComponents = [ {name: mediaLabel, value: mean(results.cost_media), color: "#27ae60"}, {name: "Growth Factors", value: mean(results.cost_recf), color: "#9b59b6"}, {name: "Other VOC", value: mean(results.cost_other_var), color: "#7f8c8d"}, {name: "CAPEX (annualized)", value: mean(results.cost_capex), color: "#e74c3c"}, {name: "Plant overhead OPEX", value: mean(results.cost_fixed), color: "#f39c12"}, {name: "CDMO Toll", value: mean(results.cost_cdmo_toll), color: "#e67e22"}, {name: "Downstream", value: mean(results.cost_downstream), color: "#1abc9c"} ]; // Filter out zero-value components (e.g., downstream when not included) const components = allComponents.filter(c => c.value > 0.001).sort((a, b) => b.value - a.value); const total = components.reduce((s, c) => s + c.value, 0); const chartContainer = document.createElement("div"); chartContainer.style.position = "relative"; // Expand/collapse button const expandBtn = document.createElement("button"); expandBtn.textContent = "Expand Chart"; expandBtn.style.cssText = "padding: 0.3rem 0.7rem; font-size: 0.8rem; cursor: pointer; border: 1px solid #ccc; border-radius: 4px; background: #f8f9fa; margin-bottom: 0.5rem;"; let expanded = false; expandBtn.onclick = () => { expanded = !expanded; expandBtn.textContent = expanded ? "Collapse Chart" : "Expand Chart"; chartEl.replaceWith(makeChart(expanded)); chartEl = chartContainer.querySelector(".cost-breakdown-plot"); }; chartContainer.appendChild(expandBtn); function makeChart(large) { const w = large ? 1200 : 1000; const h = large ? 700 : 580; const fontSize = large ? 14 : 13; const p = Plot.plot({ width: w, height: h, marginLeft: 200, marginRight: 140, x: { label: "Average Cost ($/kg)", grid: true }, y: { label: null }, marks: [ Plot.barX(components, { y: "name", x: "value", fill: "color", sort: {y: "-x"} }), Plot.text(components, { y: "name", x: d => d.value + 0.5, text: d => `$${d.value.toFixed(2)} (${(d.value/total*100).toFixed(0)}%)`, textAnchor: "start", fontSize: fontSize }) ], title: `Cost Breakdown by Component (Total: $${Math.round(total)}/kg)` }); p.classList.add("cost-breakdown-plot"); return p; } let chartEl = makeChart(false); chartContainer.appendChild(chartEl); return chartContainer; } Expand Chart
collapse/expand not doing much here
eLife Assessment
The authors proposed two hypotheses: first, that methamphetamine induces neuroinflammation, and second, that it alters neuronal stem cell differentiation. These are valuable hypotheses, and the authors provided in vivo observations of the methamphetamine response in mice. However, concerns about data interpretation, and the current evidence is incomplete, requiring further experimental validation.
Reviewer #1 (Public review):
Summary:
The manuscript, titled Hippocampal Single-Cell RNA Atlas of Chronic Methamphetamine Abuse-Induced Cognitive Decline in Mice, focuses on single-cell RNA sequencing (scRNA-seq) analysis following chronic methamphetamine (METH) treatment in mice. The authors propose two hypotheses: (1) METH induces neuroinflammation involving T and NKT cells, and (2) METH alters neuronal stem cell differentiation.
Strengths:
The authors provide a substantial dataset with numerous replicates, offering valuable resources to the research community.
Weaknesses:
Concerns remain regarding the interpretation of the data and the appropriateness of the statistical analyses.
Although the authors provided detailed responses to the reviewer's concerns, I am still concerned that several key issues have not yet been fully addressed in the revised manuscript.
First, in Figure 5, the authors state that neural stem cells (NSCs) preferentially differentiate into astrocytes rather than neuroblasts following METH treatment. However, based on the presented trajectories, it is difficult to visually confirm differences in the relative proportions of astrocyte versus neuroblast differentiation between the control and METH-treated conditions. The current figures do not provide a quantitative or clearly interpretable comparison of lineage allocation that would support this conclusion.
Moreover, in Figures 5C and 5F, the inferred pseudotime trajectories differ both the starting cell populations and the intermediate and terminal cell identities. As a result, the trajectories are not directly comparable between the control and METH conditions. Under these circumstances, it is inappropriate to interpret gene expression changes as occurring along equivalent differentiation paths, and the current analysis does not convincingly support the stated conclusions regarding altered NSC differentiation.
If the authors intend to claim differential gene expression associated with altered differentiation trajectories, the analysis should at minimum present the expression of the same set of genes (e.g., Bsg, Ccl4, Fos, Sox11, Flt1, Hspb1, Igfbp7, and Tmsb10) plotted along a matched trajectory (for example, NSC-to-astrocyte or NSC-to-neuroblast lineages) in both control and METH-treated samples, so that readers can directly compare expression dynamics across conditions.
In addition, several statements throughout the manuscript describing changes in cell-type proportions are not supported by corresponding statistical analyses. For example, in Figure 2C (around line 430), the authors report changes in cell proportions of ~0.1% or 2-3%. Without appropriate statistical testing, it is unclear whether such marginal differences are biologically meaningful or reproducible. The authors should either provide statistical testing (e.g., sample-level proportion analysis with p-values or confidence intervals) or revise the text to describe these findings as descriptive rather than significant changes.
Finally, the reported decrease in astrocyte proportion following METH exposure (from 6.6% to 5.5%), together with the lack of reported changes in neuroblast proportions, appears inconsistent with the trajectory-based conclusion that NSCs preferentially differentiate into astrocytes in METH-treated mice. This apparent discrepancy should be clarified or the conclusions appropriately tempered.
Author response:
The following is the authors’ response to the original reviews.
Public Reviews:
Reviewer #1 (Public review):
(1) Concerns persist regarding the interpretation of data and the validation of experiments. First, the presence of T cells, NKT cells, and neutrophils in both the control and METH-treated hippocampi suggests that blood contamination rather than immune cell infiltration is the cause. Since the authors claim that METH disrupts the blood-brain barrier, increasing the infiltration of these immune cells, identifying the source of these immune cells is critical.
We sincerely appreciate the valuable suggestions you have provided. Your professional perspective impresses us. Based on your suggestion, we conducted a systematic review and in-depth analysis of the experimental process.
As you have pointed out, we believe that the T cells, NK cells and neutrophils detected in the single-cell sequencing of the mouse hippocampus may have a blood-derived origin. However, this does not mean that the presence of these cell types in the control group is abnormal, because in many literature, these cells can also be found in the hippocampus of control mice. Nevertheless, clarifying the origin and location of these cells will help to further strengthen the persuasiveness of the research hypothesis. Although there is currently no systematic discussion on the role of such cells in the field of methamphetamine neurotoxicity research, we believe that the relevant findings still have certain reference value for subsequent research in this field.
Our response is based on the following description:
(1) Insufficient perfusion during the extraction of the hippocampus may lead to a certain degree of blood contamination.
Given that the single-cell sequencing technique employed in this study can detect all the mRNA of the entire cell, in order to ensure that the cells are in the optimal physiological state and to minimize the stress response caused by the experimental operation on the cells, we perfused the anesthetized mice with cold PBS for approximately 3 min (this has been supplemented in the Materials and methods Line165-166), and completed the rapid dissection and collection of the mouse hippocampus on the ice surface within 2 min, and immediately placed it in an appropriate amount of tissue preservation solution for storage. The time of tissue perfusion might be insufficient or the perfusion volume might not be adequate, resulting in the incomplete expulsion of all the blood. Subsequently, the decomposition operations of the tissue samples were all carried out in the preservation solution or PBS buffer, which to some extent reduced the potential interference of blood components on the experimental results. Additionally, T cells, NKT cells and neutrophils in the capillary perivascular spaces of the hippocampal tissue might still remain and be successfully captured, and were reflected in the final sequencing data.
(2) The presence of T cells, NKT cells, and neutrophils in the brain tissue of normal mice has been supported by existing literature. Moreover, several studies have specifically described the localization of these immune cell types within the brain parenchyma.
Contemporary studies have completely changed the view of brain immunity from envisioning the brain as isolated and inaccessible to peripheral immune cells to an organ in close physical and functional communication with the immune system for its maintenance, function, and repair. Circulating immune cells reside in special niches in the brain’s borders, the choroid plexus, meninges, and perivascular spaces, from which they patrol and sense the brain in a remote manner [1].
A large-scale mouse brain cell atlas study also reported that approximately 8% of non-neuronal cells are immune cells, including microglia, boundary-associated macrophages, lymphocytes, dendritic cells, and monocytes [2].
Hang Yao et al. demonstrated through flow cytometry that neutrophils were present in the hippocampal tissues of both healthy control mice and depressed mice (Fig.2 H) [3]. Wei Su et al. identified through single-cell sequencing that dendritic cells, neutrophils, macrophages, T cells, and NKT cells were present in the brain tissues of non-transgenic (Non-Tg) control mice (Fig.1a-b), and the localization of these cells was explicitly characterized as brain parenchyma in the study [4]. Tomomi M Yoshida et al. discovered through immunohistochemistry (IHC) and single-cell sequencing techniques that there were a certain number of CD3+ and CD4+ T cells in the hippocampus and other regions of the brain, and they observed that these cells were located outside the blood vessels. (Fig.1a-c, g) [5].
(3) Both the analysis of immune cells within blood vessels and those in the brain parenchyma contribute to elucidating the immune effects in the hippocampal microenvironment under chronic METH exposure, as well as their interactions with other cell types. At present, the understanding of the neurotoxicity of methylphenidate and the immune system is still limited to the central resident immune cells, such as microglia, astrocytes and oligodendrocytes [6]. Adaptive immune cells and myeloid cells recruited from the circulation have also been implicated in brain development, function, and aging. Their depletion during developmental stages can disrupt critical neural processes, including glial cell maturation, neuronal activity, and myelinogenesis. However, the precise developmental stage at which lymphocyte infiltration into the central nervous system occurs remains to be elucidated [7].
Our data results indicate that during chronic METH abuse, T cells are more active and participate in the regulation of cytokines through complement signaling. At the same time, the frequency of cell communication between endothelial cells and epithelial cells is increased. Moreover, microglia upregulated the processes of cell chemotaxis and migration, as well as the communication with immune cells such as T cells, and to some extent, this also suggests an enhanced infiltration of T cells. However, we also recognize that the current conclusions regarding immune cell infiltration based on sequencing data and literature reports lack the support of experimental data. Currently, we are conducting morphological analysis using the same batch of brain tissue samples to further validate the relevant findings.
Immune fluorescence staining and flow cytometry can be utilized to further determine the locations of these immune cells in the hippocampus. The classical pathways through which peripheral immune cells enter the brain mainly include the BBB and the choroid plexus. In June 2025, Kim N. Green et al. published a study in Neuron, further revealing that during the developmental stage and in cases of inflammatory diseases, immune cells can also infiltrate the brain parenchyma through a newly identified channel - the medial ventricle, thereby further confirming that these cells have the ability to migrate to the central nervous system under specific physiological or pathological conditions [8].
(1) Castellani G, Croese T, Peralta Ramos JM, Schwartz M. Transforming the understanding of brain immunity. Science. 2023 Apr 7;380(6640):eabo7649. doi: 10.1126/science.abo7649.
(2) Zhang M, Pan X, Jung W, Halpern AR, Eichhorn SW, Lei Z, Cohen L, Smith KA, Tasic B, Yao Z, Zeng H, Zhuang X. Molecularly defined and spatially resolved cell atlas of the whole mouse brain. Nature. 2023 Dec;624(7991):343-354. doi: 10.1038/s41586-023-06808-9.
(3) Yao H, Jiang SY, Jiao YY, Zhou ZY, Zhu Z, Wang C, Zhang KZ, Ma TF, Hu G, Du RH, Lu M. Astrocyte-derived CCL5-mediated CCR5+ neutrophil infiltration drives depression pathogenesis. Sci Adv. 2025 May 23;11(21):eadt6632. doi: 10.1126/sciadv.adt6632.
(4) Su W, Saravia J, Risch I, Rankin S, Guy C, Chapman NM, Shi H, Sun Y, Kc A, Li W, Huang H, Lim SA, Hu H, Wang Y, Liu D, Jiao Y, Chen PC, Soliman H, Yan KK, Zhang J, Vogel P, Liu X, Serrano GE, Beach TG, Yu J, Peng J, Chi H. CXCR6 orchestrates brain CD8+ T cell residency and limits mouse Alzheimer's disease pathology. Nat Immunol. 2023 Oct;24(10):1735-1747. doi: 10.1038/s41590-023-01604-z.
(5) Yoshida TM, Nguyen M, Zhang L, Lu BY, Zhu B, Murray KN, Mineur YS, Zhang C, Xu D, Lin E, Luchsinger J, Bhatta S, Waizman DA, Coden ME, Ma Y, Israni-Winger K, Russo A, Wang H, Song W, Al Souz J, Zhao H, Craft JE, Picciotto MR, Grutzendler J, Distasio M, Palm NW, Hafler DA, Wang A. The subfornical organ is a nucleus for gut-derived T cells that regulate behaviour. Nature. 2025 Jul;643(8071):499-508. doi: 10.1038/s41586-025-09050-7.
(6) Shi S, Sun Y, Zan G, Zhao M. The interaction between central and peripheral immune systems in methamphetamine use disorder: current status and future directions. J Neuroinflammation. 2025 Feb 15;22(1):40. doi: 10.1186/s12974-025-03372-z.
(7) Castellani G, Croese T, Peralta Ramos JM, Schwartz M. Transforming the understanding of brain immunity. Science. 2023 Apr 7;380(6640):eabo7649. doi: 10.1126/science.abo7649.
(8) Hohsfield LA, Kim SJ, Barahona RA, Henningfield CM, Mansour K, Vallejo KD, Tsourmas KI, Kwang NE, Ghorbanian Y, Angulo JAA, Gao P, Pachow C, Inlay MA, Walsh CM, Xu X, Lane TE, Green KN. Identification of the velum interpositum as a meningeal-CNS route for myeloid cell trafficking into the brain. Neuron. 2025 May 28:S0896-6273(25)00351-4. doi: 10.1016/j.neuron.2025.05.004.
(2) Secondly, the pseudotime analysis, which suggests altered neural stem cell (NSC) differentiation, is not conclusively supported by the current data and requires further validation.
We sincerely appreciate your valuable feedback, which we find highly relevant and constructive. It is important to acknowledge that the sequencing data presented in our study currently lacks experimental validation. Nevertheless, considering that existing research on the effects of METH on neural stem cell differentiation predominantly emphasizes observational phenomena and remains limited in terms of in vivo experimental evidence and mechanistic investigations, we aim to contribute our analytical findings as a reference for further scholarly exploration in this field.
Our study utilized pseudotime analysis (powered by Monocle2) to reconstruct an "imaginary timeline" (pseudo-time) based on intercellular gene expression similarities, thereby modeling the dynamic state transitions of cells during continuous biological processes. Drawing upon single-cell RNA sequencing data captured as "snapshots" from hippocampal astrocytes, neural stem cells, and neuroblasts in mice four weeks after METH exposure, we applied computational algorithms to integrate the originally discrete cellular states into a continuous pseudo-time trajectory. This approach was employed to elucidate the differentiation stages of these cell populations, identify potential branching points in their developmental pathways, and uncover the key regulatory genes driving the differentiation process. Pseudotime analysis, as a computational approach grounded in mathematical modeling, yields inferences that are contingent upon the underlying assumptions of the algorithms employed. Consequently, experimental validation through methodologies such as time-series sampling and lineage tracing is essential to substantiate the derived biological interpretations. In light of the insufficiency of such empirical verification to date, our conclusions concerning alterations in the dynamic behavior of neural stem cell differentiation remain preliminary and require further experimental support.
In Figures 5C and 5F, we present the expression profiles of the four genes exhibiting the most statistically significant differences across the differentiation trajectory. In Figures 5B and 5E, we conducted GO and KEGG functional enrichment analyses on the genes that showed significant differential expression at different differentiation stages. While no studies within the current METH research domain have reported on the potential effects of these genes on neural stem cell differentiation, emerging evidence from related fields provides preliminary insights into their functional roles. For instance, the Flt1 gene (also known as VEGFR1), referred to as the vascular endothelial growth factor receptor, has been demonstrated to play a critical role in the conversion of Müller glial cells into neurons within the zebrafish retina [1], serves as a critical regulator in promoting definitive neural stem cell survival [2]. Furthermore, it substantiates the intricate interconnection between neurons, neural stem cells, and vascular cells, as identified in our cell communication analysis. Hsp1b gene plays a significant role in ferroptosis and autophagy processes of nerve cells[3, 4], and may be closely related to the self-renewal ability of neural stem cell, while METH may impair neural stem cell function by disrupting autophagy, leading to reduced self-renewal capacity and altered differentiation potential [5]. In METH group, Sox11 has been shown to play a critical role in early differentiation and neuronal growth, both during perinatal development and in adult neurogenesis [6] Fos gene plays a critical regulatory role in the differentiation of neural stem cells into neurons and in modulating neuronal functional activities [7]; Alterations in Ccl5 expression levels may indicate astrocyte-mediated inflammatory responses, which could represent one of the underlying mechanisms through which METH promotes the differentiation of neural stem cells into astrocytes.
Thank you very much for your thoughtful questions and valuable suggestions. These suggestions have helped us gain a deeper understanding of the areas where we can improve, and have guided us toward more meaningful directions for future research.
(1) Mitra S, Devi S, Lee MS, Jui J, Sahu A, Goldman D. Vegf signaling between Müller glia and vascular endothelial cells is regulated by immune cells and stimulates retina regeneration. Proc Natl Acad Sci U S A. 2022 Dec 13;119(50):e2211690119. doi: 10.1073/pnas.2211690119.
(2) Wada T, Haigh JJ, Ema M, Hitoshi S, Chaddah R, Rossant J, Nagy A, van der Kooy D. Vascular endothelial growth factor directly inhibits primitive neural stem cell survival but promotes definitive neural stem cell survival. J Neurosci. 2006 Jun 21;26(25):6803-12. doi: 10.1523/JNEUROSCI.0526-06.2006.
(3) Meng J, Fang J, Bao Y, Chen H, Hu X, Wang Z, Li M, Cheng Q, Dong Y, Yang X, Zou Y, Zhao D, Tang J, Zhang W, Chen C. The biphasic role of Hspb1 on ferroptotic cell death in Parkinson's disease. Theranostics. 2024 Aug 1;14(12):4643-4666. doi: 10.7150/thno.98457.
(4) Sisto A, van Wermeskerken T, Pancher M, Gatto P, Asselbergh B, Assunção Carreira ÁS, De Winter V, Adami V, Provenzani A, Timmerman V. Autophagy induction by piplartine ameliorates axonal degeneration caused by mutant HSPB1 and HSPB8 in Charcot-Marie-Tooth type 2 neuropathies. Autophagy. 2025 May;21(5):1116-1143. doi: 10.1080/15548627.2024.2439649.
(5) Gu C, Wang Z, Luo W, Ling H, Cui X, Deng T, Li K, Huang W, Xie Q, Tao B, Qi X, Peng X, Ding J, Qiu P. Impaired olfactory bulb neurogenesis mediated by Notch1 contributes to olfactory dysfunction in mice chronically exposed to methamphetamine. Cell Biol Toxicol. 2025 Feb 20;41(1):46. doi: 10.1007/s10565-025-10004-y.
(6) Rasetto NB, Giacomini D, Berardino AA, Waichman TV, Beckel MS, Di Bella DJ, Brown J, Davies-Sala MG, Gerhardinger C, Lie DC, Arlotta P, Chernomoretz A, Schinder AF. Transcriptional dynamics orchestrating the development and integration of neurons born in the adult hippocampus. Sci Adv. 2024 Jul 19;10(29):eadp6039. doi: 10.1126/sciadv.adp6039.
(7) Pagin M, Pernebrink M, Pitasi M, Malighetti F, Ngan CY, Ottolenghi S, Pavesi G, Cantù C, Nicolis SK. FOS Rescues Neuronal Differentiation of Sox2-Deleted Neural Stem Cells by Genome-Wide Regulation of Common SOX2 and AP1(FOS-JUN) Target Genes. Cells. 2021 Jul 12;10(7):1757. doi: 10.3390/cells10071757.
Reviewer #2 (Public review):
(1) Despite this potential novelty, the study has numerous weaknesses. Notably, single-cell RNA sequencing was unable to capture an adequate number of neuronal populations. Neurons accounted for only approximately 0.6% of the total nuclei, representing a significant underrepresentation compared to their actual physiological proportion. Given that the behavioral effects of METH are likely mediated by neuronal dysfunction, readers would reasonably expect to see transcriptional changes in neurons. The authors should explain why they were unable to capture a sufficient number of neurons and justify how this incomplete dataset can still provide meaningful scientific insights for researchers studying METH-induced hippocampal damage and behavioral alterations.
Thank you sincerely for bringing this important issue to our attention.
Firstly, this represents an unavoidable technical bottleneck. The single-cell sequencing (scRNA-seq) we perform involves the detection of mRNA at the whole-cell level, a process that necessitates cells with high structural integrity, robust viability, and minimal exposure to external stimuli. During the preparation of single-cell suspensions, mature neurons due to their highly differentiated state, morphological rigidity, and excessively long axons often fail to maintain structural integrity. These cells typically undergo death during the dissociation process, lose viability, and are subsequently excluded prior to sequencing. To retain a substantial amount of neuron-related data, an alternative technique single-cell nuclear sequencing (snRNA-seq) should be employed. This method does not necessitate cell viability and focuses exclusively on the nuclei of individual cells, thereby capturing mRNA information solely from the nuclear compartment. Consequently, mRNA data originating from the cytoplasm and organelles will not be represented.
Secondly, numerous studies have shown that the neurological damage caused by chronic exposure to methamphetamine exhibits a high degree of similarity in clinical manifestations and pathogenesis to neurodegenerative diseases (such as Alzheimer's disease, Parkinson's disease, etc.) [1-4].
We fully acknowledge the central role of neurons in cognitive functions and the pathogenesis of cognitive disorders. However, despite decades of neuron-centric research that has yielded significant advancements, major challenges remain in elucidating disease origins, identifying early pathological events, and developing effective therapeutic strategies. For example, current models fail to adequately explain early disease events. Many pathological hallmarks of cognitive disorders such as amyloid plaques, neurofibrillary tangles, and α-synuclein aggregation emerge in the extracellular space long before overt neuronal loss or dysfunction occurs, and are increasingly recognized to be initiated or modulated by non-neuronal cells, including astrocytes and microglia [5]. Furthermore, the critical contribution of the neural microenvironment is often overlooked. Neuronal function and survival are highly dependent on this microenvironment, which is predominantly established and maintained by non-neuronal cell types such as astrocytes, oligodendrocytes, microglia, vascular endothelial cells, pericytes, and interstitial cells and matrix [6-10]. Additionally, systemic factors such as metabolic dysregulation, peripheral inflammation, and vascular pathology are closely associated with cognitive disorders. These factors often initially impact non-neuronal cells, particularly those forming the blood-brain barrier (e.g., endothelial cells) or mediating immune responses (e.g., microglia), before exerting downstream effects on neurons [11,12]. Finally, current therapeutic approaches for neuron face significant limitations, highlighting an urgent need for novel intervention strategies.
During the development of neurodegenerative chronic diseases, although the structural or functional abnormalities of neurons are the direct factors leading to clinical symptoms (such as cognitive decline), this process is often regulated by various auxiliary cell types such as glial cells, immune cells, and stromal cells, and constitutes a complex pathological mechanism network. It is worth noting that the chronic and persistent progression of the disease usually results from the failure of these auxiliary cells to effectively provide support and nutrition to neurons, and even in some pathological states, they transform into effector cells that promote neuronal damage [13,14]. In recent years, a growing number of evidence has demonstrated that glial cells, immune cells, and stromal cells exert critical regulatory functions in the pathogenesis of neurodegenerative diseases. These cell types not only contribute to the maintenance of neural microenvironmental homeostasis during the early stages of disease progression but also display substantial functional heterogeneity in modulating inflammatory responses, synaptic plasticity, the repair of neuronal injury, linking genetic risks with environmental factors and the pathogenic mechanism of pathological protein propagation [15-19]. These research results indicate that they have the potential to become key therapeutic targets in clinical interventions: 1. compared to neurons themselves, they are more susceptible to being targeted by drugs or biological agents (such as antibodies), and have higher accessibility; 2. Non-neuronal cells (especially glial cells) exhibit high plasticity and reactivity during the course of diseases, providing an opportunity window for intervening in their functional states (such as inhibiting harmful activation and promoting protective functions); 3. they can serve as early intervention targets before irreversible damage occurs to neurons, helping to prevent or delay the progression of the disease;4. intervention methods targeting these targets are diverse, including immunomodulation, anti-inflammatory, vascular protection, and metabolic regulation strategies, which are usually more feasible in practical applications than directly protecting the fragile neurons.
Early pharmacological studies have extensively characterized the neurotoxic effects of METH, including the induction of autophagy, apoptosis, oxidative stress, endoplasmic reticulum stress, and dopaminergic neurotoxicity [20]. However, therapeutic options and pharmacological interventions for METH abuse remain limited [21]. In recent years, increasing attention has been directed toward the impact of METH on non-neuronal cells. Research into mechanisms such as neuroinflammatory responses, blood-brain barrier disruption, and immune modulation is progressively contributing to a more comprehensive understanding of METH-induced neural injury [22-24]. Moreover, METH is a substance that induces widespread damage across multiple organ systems and diverse cell types throughout the body. Beyond its effects on neurons, various cell types exhibit distinct responses to METH exposure, which differ significantly depending on the duration of exposure. Our research dataset encompasses high-quality whole-cell mRNA sequencing data from multiple cell types within the hippocampus of mice subjected to chronic METH exposure, offering substantial data support and a robust foundation for in-depth investigation into the pathological mechanisms underlying METH-induced neurodamage.
Thirdly, the selection of scRNA-seq was guided by our experimental objectives and prior research experience. Our earlier investigations have primarily centered on astrocytes, endothelial cells, and microglia. This single-cell sequencing study is intended to enhance our understanding of these neural support cells, comprehensively explore their underlying mechanisms and cellular interactions, and ultimately provide a solid foundation and reference for future research. However, our experience and infrastructure in the field of neuronal research remain relatively limited. To ensure the generation of high-quality data and to systematically advance the experimental objectives, we have prioritized the analysis of the neural microenvironment as the central focus of this study.
Fourthly, the hippocampal region is a brain area with highly specialized and collaborative characteristics, which can be further divided into the ventral hippocampus, the dorsal hippocampus, and multiple subregions such as DG, CA1, CA2, and CA3. The neurons in these subregions exhibit strong heterogeneity, and the experimental methods we currently adopt are still unable to precisely distinguish the neurons in these different regions, which may to some extent affect the accuracy of data interpretation. To address the impact of neuronal heterogeneity, we believe that single-cell spatial transcriptomics technology can be adopted for in-depth research. However, due to the high cost of this technology, it is currently difficult to apply it in our research group.
(1) Lappin JM. Rare but relevant: Methamphetamine and Parkinson's disease. Addiction. 2025 Apr;120(4):797-800. doi: 10.1111/add.16695. Epub 2024 Oct 22. PMID: 39434702.
(2) Lappin JM, Darke S. Methamphetamine and heightened risk for early-onset stroke and Parkinson's disease: A review. Exp Neurol. 2021 Sep;343:113793. doi: 10.1016/j.expneurol.2021.113793. Epub 2021 Jun 21. PMID: 34166684.
(3) Shukla M, Vincent B. The multi-faceted impact of methamphetamine on Alzheimer's disease: From a triggering role to a possible therapeutic use. Ageing Res Rev. 2020 Jul;60:101062. doi: 10.1016/j.arr.2020.101062.
(4) Shrestha P, Katila N, Lee S, Seo JH, Jeong JH, Yook S. Methamphetamine induced neurotoxic diseases, molecular mechanism, and current treatment strategies. Biomed Pharmacother. 2022 Oct;154:113591. doi: 10.1016/j.biopha.2022.113591.
(5) Gabitto MI, et al.. Integrated multimodal cell atlas of Alzheimer's disease. Nat Neurosci. 2024 Dec;27(12):2366-2383. doi: 10.1038/s41593-024-01774-5.
(6) Stogsdill JA, Harwell CC, Goldman SA. Astrocytes as master modulators of neural networks: Synaptic functions and disease-associated dysfunction of astrocytes. Ann N Y Acad Sci. 2023 Jul;1525(1):41-60. doi: 10.1111/nyas.15004.
(7) Terreros-Roncal J, et al.. Impact of neurodegenerative diseases on human adult hippocampal neurogenesis. Science. 2021 Nov 26;374(6571):1106-1113. doi: 10.1126/science.abl5163.
(8) Zhu K, Fu Y, Zhao Y, Niu B, Lu H. Perineuronal nets: Role in normal brain physiology and aging, and pathology of various diseases. Ageing Res Rev. 2025 Jun;108:102756. doi: 10.1016/j.arr.2025.102756.
(9) Depp C, Doman JL, Hingerl M, Xia J, Stevens B. Microglia transcriptional states and their functional significance: Context drives diversity. Immunity. 2025 May 13;58(5):1052-1067. doi: 10.1016/j.immuni.2025.04.009.
(10) Sweeney MD, Zhao Z, Montagne A, Nelson AR, Zlokovic BV. Blood-Brain Barrier: From Physiology to Disease and Back. Physiol Rev. 2019 Jan 1;99(1):21-78. doi: 10.1152/physrev.00050.2017.
(11) Nation DA, et al.. Blood-brain barrier breakdown is an early biomarker of human cognitive dysfunction. Nat Med. 2019 Feb;25(2):270-276. doi: 10.1038/s41591-018-0297-y.
(12) Montagne A, Zhao Z, Zlokovic BV. Alzheimer's disease: A matter of blood-brain barrier dysfunction? J Exp Med. 2017 Nov 6;214(11):3151-3169. doi: 10.1084/jem.20171406. Epub 2017 Oct 23.
(13) Huang Q, Wang Y, Chen S, Liang F. Glycometabolic Reprogramming of Microglia in Neurodegenerative Diseases: Insights from Neuroinflammation. Aging Dis. 2024 May 7;15(3):1155-1175. doi: 10.14336/AD.2023.0807.
(14) Shi FD, Yong VW. Neuroinflammation across neurological diseases. Science. 2025 Jun 19;388(6753):eadx0043. doi: 10.1126/science.adx0043.
(15) Xu X, Mei B, Yang Y, Li J, Weng J, Yang Y, Zhu Q, Zhang H, Liu X. Astrocytes Lingering at a Crossroads: Neuroprotection and Neurodegeneration in Neurocognitive Dysfunction. Int J Biol Sci. 2025 Apr 28;21(7):3122-3143. doi: 10.7150/ijbs.109315.
(16) Bedolla A, et al.. Adult microglial TGFβ1 is required for microglia homeostasis via an autocrine mechanism to maintain cognitive function in mice. Nat Commun. 2024 Jun 21;15(1):5306. doi: 10.1038/s41467-024-49596-0.
(17) Castellani G, Croese T, Peralta Ramos JM, Schwartz M. Transforming the understanding of brain immunity. Science. 2023 Apr 7;380(6640):eabo7649. doi: 10.1126/science.abo7649.
(18) Chen YH, Jin SY, Yang JM, Gao TM. The Memory Orchestra: Contribution of Astrocytes. Neurosci Bull. 2023 Mar;39(3):409-424. doi: 10.1007/s12264-023-01024-x.
(19) Deng Q, Wu C, Parker E, Liu TC, Duan R, Yang L. Microglia and Astrocytes in Alzheimer's Disease: Significance and Summary of Recent Advances. Aging Dis. 2024 Aug 1;15(4):1537-1564. doi: 10.14336/AD.2023.0907.
(20) Jayanthi S, Daiwile AP, Cadet JL. Neurotoxicity of methamphetamine: Main effects and mechanisms. Exp Neurol. 2021 Oct;344:113795. doi: 10.1016/j.expneurol.2021.113795.
(21) Paulus MP, Stewart JL. Neurobiology, Clinical Presentation, and Treatment of Methamphetamine Use Disorder: A Review. JAMA Psychiatry. 2020 Sep 1;77(9):959-966. doi: 10.1001/jamapsychiatry.2020.0246.
(22) Shi S, Sun Y, Zan G, Zhao M. The interaction between central and peripheral immune systems in methamphetamine use disorder: current status and future directions. J Neuroinflammation. 2025 Feb 15;22(1):40. doi: 10.1186/s12974-025-03372-z.
(23) Pang L, Wang Y. Overview of blood-brain barrier dysfunction in methamphetamine abuse. Biomed Pharmacother. 2023 May;161:114478. doi: 10.1016/j.biopha.2023.114478.
(24) Shaerzadeh F, Streit WJ, Heysieattalab S, Khoshbouei H. Methamphetamine neurotoxicity, microglia, and neuroinflammation. J Neuroinflammation. 2018 Dec 12;15(1):341. doi: 10.1186/s12974-018-1385-0.
(2) Another significant weakness of this study is the lack of a cohesive hypothesis or overarching conclusion regarding how METH impacts neural populations. The authors provide a largely descriptive account of transcriptional alterations across various cell types, but the manuscript lacks clear, biologically meaningful conclusions. This descriptive approach makes it difficult for readers to identify the key findings or take-home messages. To improve clarity and impact, the authors should focus on developing and presenting a few plausible hypotheses or mechanistic scenarios regarding METH-induced neurotoxicity, grounded in their scRNA-seq data. Including schematic figures to illustrate these hypotheses would also help readers better understand and interpret the study.
We sincerely appreciate your valuable comments on our article. As you pointed out, the current research lacks experimental verification to further support our conclusions. To enhance the clarity and readability of the mechanism explanation, we have added several hypothetical diagrams (such as Figures.7, 8, and 9) in the discussion section to present the biological mechanisms reflected by the data more intuitively. Additionally, relevant verification work is underway, such as marking specific cell types with marker proteins. Author response image 1 shows some of our preliminary experimental results that have not been published yet, and their trends are consistent with the conclusions of this article. However, since the complete verification still requires a certain period of time, to ensure the rigor of the data, these results have not been included in the current manuscript for the time being. Finally, we would like to thank you again for your constructive suggestions.
Author response image 1.
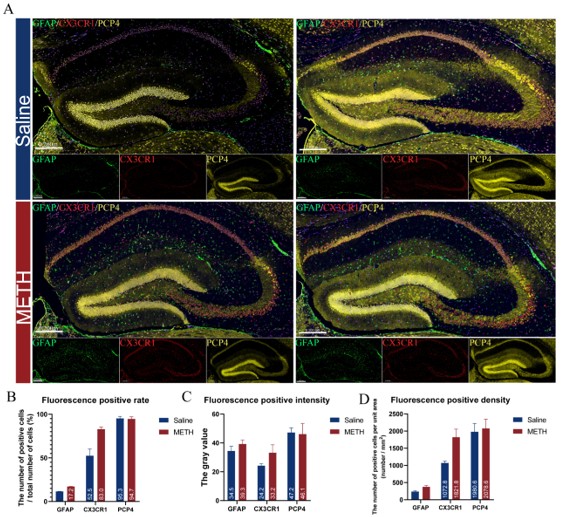
(3) The final major weakness of this study is its poor readability. It appears that the authors did not adequately proofread the manuscript, as there are numerous typographical errors (e.g., line 333: trisulting; line 756: essencial), unsupported scientific claims lacking citations (e.g., lines 485, 503, 749-753), and grammatically incorrect sentences (e.g., lines 470-472, 540-543, 749-753). In addition, many paragraphs are unorganized and overly descriptive, which further hinders clarity. Some figures are also problematic - too small in size and overcrowded with text in fonts that are difficult to read. It is recommended that the authors carry out quality control. There are too many typographical and grammatical errors to list individually; the authors should carefully review and revise the entire manuscript to address all of these issues.
We truly appreciate your thoughtful feedback and sincerely apologize for any inconvenience experienced by you and other readers.
The text of this research manuscript was manually entered, which unfortunately resulted in some spelling and grammatical errors. In response, we have carefully revised the entire manuscript using word processing tools in the second version. Meanwhile, we have restructured and organized some lengthy paragraphs to enhance the clarity and readability of the content.
Regarding the issue you raised about certain viewpoints lacking citation support, we have added the necessary references to those sections and reviewed the entire text to ensure all scientific claims are properly supported.
As for the image clarity, we made sure the submitted images met the 600dpi resolution requirement. However, we acknowledge that there were clarity issues in the final published version. We have since re-adjusted and re-uploaded the images to improve their quality.
We are committed to continuously improving the manuscript and enhancing the overall quality of our academic presentation. Thank you sincerely for your kind attention to our work, your careful review, and the valuable suggestions you provided.
Reviewer #3 (Public review):
(1) While the bioinformatics analyses are extensive, the study is primarily descriptive at the molecular level. The absence of experimental validation, such as targeted mRNA/protein quantification and gene knockdown/overexpression to confirm the causal relationship between these identified genes and METH-induced cognitive deficits, is a notable limitation.
We sincerely appreciate your valuable comments and suggestions. Indeed, there are still certain limitations in our manuscript in some aspects. It may not be able to systematically answer specific questions, and it is also difficult to fully clarify the functional roles of certain genes or specific cell types through experimental evidence.
Although our manuscript still has certain limitations, we believe that the publication of this research is expected to provide new perspectives and theoretical support for the in-depth exploration of METH toxicity damage-related fields, thereby promoting the progress of research in this direction:
(1) At present, the single-cell sequencing datasets on chronic damage caused by METH are still relatively limited, especially in terms of studies at the whole-cell level. Our dataset is expected to fill the research gap in this field to some extent, providing reference and support for subsequent related research.
(2) During the sampling process of the sequencing experiment, we ensured high cell viability and sequencing quality. The experiment exhibited good reproducibility (each group consisted of 10 mice, and 2 mice from each group were selected to mix their hippocampal tissues into one sample), and the obtained data had high credibility.
(3) The effects of METH have a wide distribution pattern across various organs and tissues. Through single-cell sequencing data, the common and differential expression patterns of related genes under different conditions can be systematically analyzed, which is helpful for future targeted knockout studies of these genes and provides a predictive basis for the evaluation of intervention measures, thereby enabling precise regulation of gene functions.
(4) This is conducive to the orderly implementation of our subsequent research plans. Our subsequent research plan can be further developed based on a specific aspect of this study. We are indeed planning to do exactly that. During our earlier research on astrocytes, we discovered that astrocytes have two phenotypes (protective and inflammatory) in neuroinflammation. Given that astrocytes in the hippocampus show great variability depending on their location, the cells they come into contact with, and the stimuli they receive, we aim to investigate the changes in the function of astrocyte subpopulations in chronic METH-induced cognitive impairment. We focused on the role of the cAMP signaling pathway in the transformation of astrocyte phenotypes and attempted to link changes in astrocyte energy metabolism to their inflammatory phenotype. In addition, we found that endothelial cells can be easily distinguished into many subpopulations, which are related to their specific functions in immune responses, material transport, vascular growth regulation, energy metabolism, and other processes. We believe that single-cell technology can help us find the key mechanisms and intervention targets of chronic METH abuse-induced damage with greater precision.
(2) While the discussion extensively covers the functional implications of specific molecular pathways and cell types, it would greatly benefit from a comparison of these findings with existing RNA sequencing data from other METH models in hippocampal tissue.
We are very grateful for your professional suggestions, which have been of great help in improving the quality of our manuscript. We agree that comparing our findings with existing RNA sequencing data from other METH models in hippocampal tissue would strengthen the discussion. In response to your suggestion, we have actively reviewed relevant literature and databases, and attempted to request the database administrators and original authors for the download and use of the relevant data. However, as data integration still requires some time, we may not be able to conduct a detailed analysis of the data in this revised version. We can only discuss the conclusions of some authors.
Palsamy Periyasamy et al. published a scRNA sequencing (live-cell) study on chronic METH exposure almost at the same time as us. They also adopted a similar gradual incremental 4-week METH exposure model and conducted sequencing analysis on glial cells in the cerebral cortex of mice [1]. The changes they observed in the circadian rhythm, adherens junctions, Rap1 signaling pathway, and cAMP signaling pathway (Disscusion, Lines 892-897) in the cortical astrocytes were also similar in the astrocytes of the hippocampal region that we studied. Similarly, in oligodendrocytes, we observed an upregulation trend of key genes regulating the circadian rhythm, such as Per2, Per3, and Nr1d1 (Disscusion, Lines 916-939). This result is consistent with their research findings. Non etheless, we believe that the changes in oligodendrocytes in terms of metabolic regulation and axonal function homeostasis are more significant.
Pingming Qiu et al. further confirmed the correlation between the NF-κB signaling pathway in hippocampal astrocytes under METH action and neuroinflammation, neuroinjury, and learning and memory impairments in mice by integrating the GEO dataset [2]. This conclusion is also consistent with the sequencing results and analysis conclusions we obtained (Results, Lines 473-476).
In terms of the neuro-immune system disorder caused by chronic METH exposure, our research findings are consistent with those of Biao Wang et al [3]. We both observed that METH exposure may involve the participation of related immune cells (such as T cells, monocytes) and may be related to the regulation of the innate immune response and the homeostasis of myeloid cells, etc. Through the identification and analysis of cell subtypes, we further revealed that these signals may be closely related to the interaction between microglia and other immune cells mediated by MHC molecules (Disscusion, Lines 870-894).
Currently, the research results related to METH are still scattered and lack systematicness. There are differences among the research models, and there are relatively few studies on chronic exposure and in vivo experiments. Sequencing data sets with strong correlations are also scarce. We hope that this dataset can comprehensively and elaborately depict the molecular map of the hippocampus of mice after chronic METH exposure (although due to technical limitations, mature neurons die during dissociation, thus making it impossible to obtain the relevant data). In addition, we also hope to integrate the single-cell sequencing data and spatial transcriptome data of the hippocampus of mice after chronic METH exposure, providing a reliable data foundation and theoretical support for subsequent research in this field.
Finally, we would like to express our sincere gratitude for your valuable suggestions and support. Although we still need some time to further refine the manuscript based on your opinions, we sincerely hope that more readers will provide us with constructive feedback to promote the continuous improvement and deepening of this research.
(1) Oladapo A, Deshetty UM, Callen S, Buch S, Periyasamy P. Single-Cell RNA-Seq Uncovers Robust Glial Cell Transcriptional Changes in Methamphetamine-Administered Mice. Int J Mol Sci. 2025 Jan 14;26(2):649. doi: 10.3390/ijms26020649.
(2) Li K, Ling H, Wang X, Xie Q, Gu C, Luo W, Qiu P. The role of NF-κB signaling pathway in reactive astrocytes among neurodegeneration after methamphetamine exposure by integrated bioinformatics. Prog Neuropsychopharmacol Biol Psychiatry. 2024 Feb 8;129:110909. doi: 10.1016/j.pnpbp.2023.110909.
(3) Wu L, Liu X, Jiang Q, Li M, Liang M, Wang S, Wang R, Su L, Ni T, Dong N, Zhu L, Guan F, Zhu J, Zhang W, Wu M, Chen Y, Chen T, Wang B. Methamphetamine-induced impairment of memory and fleeting neuroinflammation: Profiling mRNA changes in mouse hippocampus following short-term and long-term exposure. Neuropharmacology. 2024 Dec 15;261:110175. doi: 10.1016/j.neuropharm.2024.110175.
(3) The conclusion that "prolonged METH use may progressively impair cognitive function" may not be uniformly supported by the behavioral data: Figures 1C and F (discrimination and preference indexes) exhibited that the 4-week test further declined in the METH group compared to the 2-week. In contrast, Figure 1E and H present a contradictory pattern.
Thank you very much for pointing this out. Your observation is very detailed and constructive. Regarding the conclusion "prolonged use of METH may progressively impair cognitive function", our main basis is the discrimination index and preference index shown in Figures 1C and 1F. These two indicators are usually calculated based on the total exploration time of new and old objects by mice. They are widely adopted as important references for cognitive function assessment in many relevant literature [1-3], thus providing strong support for our conclusion. The exploration frequency data we provided can, on the one hand, reflect the curiosity of mice towards new things, and on the other hand, can be calculated as the average time of each exploration by "total exploration time / exploration frequency", thereby evaluating their learning interest and the degree of their focus during exploration. We believe this is also of certain significance for reflecting the effect of METH on learning. As for the fact that there is no statistically significant difference in the exploration frequency of new and old objects in the 4-week-old mice in Figure 1H, we are also regretful about this. This might be due to the fact that our tests allow mice to freely explore in a stress-free environment, and there are significant differences among individual mice within the group. However, the mean values still show certain differences between the two groups. Compared to the mice at 2 weeks, the mice at 4 weeks have undergone a NOR test once and may have formed memories, which were retained in the subsequent assessment after four weeks. Moreover, we believe that injecting normal saline to the control group mice for a long time may affect their emotional state, because they cannot obtain the same pleasure as that brought by METH from the injection behavior.
(1) Riva M, Moriceau S, Morabito A, Dossi E, Sanchez-Bellot C, Azzam P, Navas-Olive A, Gal B, Dori F, Cid E, Ledonne F, David S, Trovero F, Bartolomucci M, Coppola E, Rebola N, Depaulis A, Rouach N, de la Prida LM, Oury F, Pierani A. Aberrant survival of hippocampal Cajal-Retzius cells leads to memory deficits, gamma rhythmopathies and susceptibility to seizures in adult mice. Nat Commun. 2023 Mar 18;14(1):1531. doi: 10.1038/s41467-023-37249-7.
(2) Lu Y, Chen X, Liu X, Shi Y, Wei Z, Feng L, Jiang Q, Ye W, Sasaki T, Fukunaga K, Ji Y, Han F, Lu YM. Endothelial TFEB signaling-mediated autophagic disturbance initiates microglial activation and cognitive dysfunction. Autophagy. 2023 Jun;19(6):1803-1820. doi: 10.1080/15548627.2022.2162244.
(3) Arroyo-García LE, Tendilla-Beltrán H, Vázquez-Roque RA, Jurado-Tapia EE, Díaz A, Aguilar-Alonso P, Brambila E, Monjaraz E, De La Cruz F, Rodríguez-Moreno A, Flores G. Amphetamine sensitization alters hippocampal neuronal morphology and memory and learning behaviors. Mol Psychiatry. 2021 Sep;26(9):4784-4794. doi: 10.1038/s41380-020-0809-2.
Why it matters: If production costs for pure cells reach ~$10/kg, even 100% cultured products could compete with conventional chicken. At $25-50/kg, hybrid products with moderate cell inclusion rates may still reach price parity. If costs remain >$100/kg, even hybrid products face significant price premiums. These thresholds inform whether animal welfare interventions should prioritize supporting this industry. Code html`<div class="grid" style="grid-template-columns: repeat(3, 1fr); gap: 1rem; margin-bottom: 2rem;"> <div class="card" style="background: linear-gradient(135deg, #3498db, #2980b9); color: white; padding: 1.5rem; border-radius: 8px;"> <h4 style="margin: 0; opacity: 0.9;">Median Pure Cell Mass Cost (p50)</h4> <h2 style="margin: 0.5rem 0;">$${Math.round(stats.p50)}/kg</h2> <small>$/kg pure cell mass (wet weight) — half of simulations above, half below</small> </div> <div class="card" style="background: linear-gradient(135deg, #27ae60, #1e8449); color: white; padding: 1.5rem; border-radius: 8px;"> <h4 style="margin: 0; opacity: 0.9;">Optimistic (p5)</h4> <h2 style="margin: 0.5rem 0;">$${Math.round(stats.p5)}/kg</h2> <small>Only 5% of simulations cheaper</small> </div> <div class="card" style="background: linear-gradient(135deg, #e74c3c, #c0392b); color: white; padding: 1.5rem; border-radius: 8px;"> <h4 style="margin: 0; opacity: 0.9;">Pessimistic (p95)</h4> <h2 style="margin: 0.5rem 0;">$${Math.round(stats.p95)}/kg</h2> <small>95% of simulations cheaper</small> </div> </div> ${include_blending ? html`<div style="background: #eaf7ea; border-left: 4px solid #27ae60; padding: 0.8rem 1rem; margin-top: 0.5rem; font-size: 0.9em;"> <strong>Blended product estimate (${Math.round(blending_share * 100)}% CM, ${Math.round((1-blending_share)*100)}% filler at $${filler_cost}/kg):</strong> Median <strong>$${stats.blended_p50.toFixed(1)}/kg</strong> · 90% CI: $${stats.blended_p5.toFixed(1)} – $${stats.blended_p95.toFixed(1)}/kg </div>` : html`<div style="background: #fef9e7; border-left: 4px solid #f39c12; padding: 0.8rem 1rem; margin-top: 0.5rem; font-size: 0.9em;"> <strong>Hybrid product estimate:</strong> At a CM inclusion rate of ~25% with plant-based filler at ~$3/kg, the blended ingredient cost would be approximately <strong>$${(stats.p50 * 0.25 + 3 * 0.75).toFixed(1)}/kg</strong> (median). Enable "Show blended product cost" in the sidebar to adjust these assumptions. </div>`} </div>`
use tooltips for more for parts of this explanation to save some space
Results Summary Code html`<div style="background: #f8f9fa; padding: 1rem 1.25rem; border-left: 4px solid #3498db; margin-bottom: 1.5rem; font-size: 0.95em; line-height: 1.6;"> <strong>What these numbers represent:</strong> Simulated <strong>production cost per kilogram of pure cultured chicken cells</strong> (<span title="Wet weight = the mass of cells as harvested from the bioreactor, including water content (~70-80%). This is the standard output basis used in most TEAs (Humbird 2021, Pasitka 2024). It does NOT include downstream processing into structured products, blending with plant-based ingredients, or retail margins. For comparison: Humbird reports $37/kg wet cell mass; Pasitka reports $13.75/kg wet cell mass (large perfusion). The widely-cited ~$6/lb Pasitka figure is for a 50/50 hybrid product, not pure cell mass. See our TEA Comparison page for details." style="text-decoration: underline dotted; cursor: help;">wet weight, unprocessed ⓘ</span>) in <strong>${target_year}</strong>, based on ${stats.n.toLocaleString()} Monte Carlo simulations. This is the cost to produce cell mass in a bioreactor — not the cost of a consumer product, and not retail price. <a href="compare.html" style="font-size: 0.9em;">[Compare to published TEAs →]</a> <br><br> <strong><span title="UPSIDE Foods' chicken cutlet is a blend of cultured chicken cells and plant-based ingredients. SuperMeat's chicken burger used ~30% cultured cells. The GFI State of the Industry 2024 report notes that 'hybrid products combining cultivated and plant-based ingredients are the most likely near-term path to market.' Eat Just/GOOD Meat's Singapore-approved product uses cultured chicken in a plant-protein matrix.">Pure cells vs. consumer products:</span></strong> Most cultivated meat products on the market or in development are <em>hybrid products</em> — blending a fraction of cultured cells with plant-based or mycoprotein ingredients. A product with (say) 20% cultured cells and 80% plant-based filler at $3/kg would have a blended ingredient cost far below the pure-cell cost shown here. The "price parity with conventional meat" threshold may therefore be achievable at higher per-kg cell costs than these numbers suggest. <br><br> <strong>Why it matters:</strong> If production costs for pure cells reach <strong>~$10/kg</strong>, even 100% cultured products could compete with conventional chicken. At <strong>$25-50/kg</strong>, hybrid products with moderate cell inclusion rates may still reach price parity. If costs remain <strong>>$100/kg</strong>, even hybrid products face significant price premiums. These thresholds inform whether animal welfare interventions should prioritize supporting this industry. </div>`
Make this 'results summary' more prominent -- it should be at the top
Component Distributions
The tables might be a folding box
Artifacts Sweetheart Pin Patriotic pin was a lapel or dress pin, featuring a gilted hand holding an American flag. The pin was likely related to park visitors during an event at Red Bank. C. Gohl Carriage Plate The plate found at Red Bank is likely associated with visitors' drawn carriages who came to the park, after 1906 when the monument was dedicated.
You'll need to do a few things with this gallery:
1) sort through and include only those objects that date to the colonial/bottle period, and rename this section to reflect that.
2) Add another browse preview block displaying objects from other periods (up to you whether to include before/after battle period in same list, and sort these using Item Sets).
3) Go through each item and, on the "mapping" tab, try your best to place a point at the location of the relevant unit or part of the park it came from (note you won't be able to see the units on the editor, so you'll have to toggle back and forth). After each item is updated, the results will reflect on this map.
4) Play around with the span on the "grid" formatting to get the list to display across the whole screen. You may have to move the map up too.
The following collection of artifacts were found during archelogical digs at Red Bank Battle
Maybe "Redbank Battlefield Park has undergone archaeological excavations that have uncovered a wide range of artifacts relating to all periods of the site's history."
Process Mode Mix Code viewof p_fedbatch = Inputs.range([0, 1], { value: urlNum("p_fedbatch", 0.20), step: 0.05, label: html`Fed-batch weight <abbr style="cursor:help;text-decoration:underline dotted;font-size:0.85em;color:#888;" title="Low density (5–30 g/L), moderate media use (1–2×). Semi-continuous: nutrient-concentrated feeds added periodically. Less efficient than perfusion.">(?)</abbr>` }) viewof p_perfusion = Inputs.range([0, 1], { value: urlNum("p_perfusion", 0.50), step: 0.05, label: html`Perfusion weight <abbr style="cursor:help;text-decoration:underline dotted;font-size:0.85em;color:#888;" title="Medium-high density (30–150 g/L), higher media throughput (1–5×). Continuous media exchange with cell retention. Currently the industry standard for high-density CM production.">(?)</abbr>` }) viewof p_continuous = Inputs.range([0, 1], { value: urlNum("p_continuous", 0.30), step: 0.05, label: html`Continuous weight <abbr style="cursor:help;text-decoration:underline dotted;font-size:0.85em;color:#888;" title="Highest density (50–200 g/L), efficient media use (0.5–3×). Near-steady-state operation; cells grown and harvested continuously with optimized recycling.">(?)</abbr>` })
needs more explanation
Process Mode Mix Code viewof p_fedbatch = Inputs.range([0, 1], { value: urlNum("p_fedbatch", 0.20), step: 0.05, label: html`Fed-batch weight <abbr style="cursor:help;text-decoration:underline dotted;font-size:0.85em;color:#888;" title="Low density (5–30 g/L), moderate media use (1–2×). Semi-continuous: nutrient-concentrated feeds added periodically. Less efficient than perfusion.">(?)</abbr>` }) viewof p_perfusion = Inputs.range([0, 1], { value: urlNum("p_perfusion", 0.50), step: 0.05, label: html`Perfusion weight <abbr style="cursor:help;text-decoration:underline dotted;font-size:0.85em;color:#888;" title="Medium-high density (30–150 g/L), higher media throughput (1–5×). Continuous media exchange with cell retention. Currently the industry standard for high-density CM production.">(?)</abbr>` }) viewof p_continuous = Inputs.range([0, 1], { value: urlNum("p_continuous", 0.30), step: 0.05, label: html`Continuous weight <abbr style="cursor:help;text-decoration:underline dotted;font-size:0.85em;color:#888;" title="Highest density (50–200 g/L), efficient media use (0.5–3×). Near-steady-state operation; cells grown and harvested continuously with optimized recycling.">(?)</abbr>` })
better explanation not only in tooltip
hitall House & Family Background The Whitall House was constructed in 1748 as a Quaker homestead of 400 acres, which belonged to James and Ann Whitall ( Catts, 2026; Gloucester County Parks, n.d.). The Whitall family was members of the Religious Society of Friends (Quakers), a group known for their pacifist beliefs. During the Battle of Red Bank, the home was reportedly
I think that your info on Pre-Contact period and Whitall House should be moved to the top and combined into a "Redbank before the Fort" section. This doesn't need to be long!
Gloucester County Parks, n.d.
When you cite this, link directly to the page (don't list the link, hyperlink it!)
Site Plan of James Whitall House
I'd replace this park map with an image of the house today, plenty available online, just link to source in parantheses
Site After the Batt
Same comment about section headings format
on the Fort. Also displayed is the Delaware River with Mud Island and Fort Mifflin on the Pennsylvannia side
As mentioned, move this image up to use instead of one above
Fort Mifflin Fort Mifflin, located across the Delaware, functioned as part of the river defense system, alongside Fort Mercer (Janofsky, 2025). Together, these forts contributed t
See comment above on combining this section with one above
included Fort Mifflin and underwater obstructions known as chevaux-de-frise, which together limited British access to the river ( Janofsky, 2025).
I like this context, but move up your info on Fort Mifflin to here instead of a separate section. Combine/condense these paragraphs
Plan of Fort Mercer
I'd replace this with the image below that is clearer. Also since I recommend combining sections
ercer & its Role in the Revolutionary War Fort Mercer
Also, use "Heading 2" or "3" formatting for sections, like on Homepage
d been preserved as Red Bank Battlefield Park, which reflects growing efforts to commemorate the history of the battle (Catts, 2026).
Good! Find an image of the site today to place beside? Maybe park map or image of the park sign?
(Catts, 2026)
Don't need to cite after every sentence, can just include citation at end of paragraphs. Can also leave out the comma (e.g. Janofsky 2025; Catts 2026).
Construction of Fort Mercer & its Role in the Revolutionary Wa
Add a "Before the Fort" section? This is where you could briefly mention pre-contact site and the Whitall house.
In the twentieth century, ‘fictitious’ labour decommodification took place through the construction of enterprise and state benefits supposed to cover what economists call contingency risks, those that arise from what one is doing. These were wrongly depicted as labour ‘rights’. They were acquired for specific groups who struggled to secure them, but they were never universal or unconditional.
Belangrijk hier is de frase "never universal or unconditional"
the precariat has an interest in recapturing a progressive vision of ‘freedom from labour’, so establishing a meaningful right to work.
Verbinden aan theorieën van immateriele arbeid
Whereas the proletarian norm was habituation to stable labour, the precariat is being habituated to unstable labour.
Dit is een theorie van de transformatie van de werkende klasse in de imperiale kern. That's it. Dit slaat niet op arbeid in het algemeen op een mondiaal niveau
All labour and communist parties, social democrats and unions subscribed to this agenda, calling for ‘more labour’ and ‘full employment’, by which was meant all men in full-time jobs. Besides being sexist, this neglected all forms of work that were not labour (including repro-ductive work in the home, caring for others, work in the community, and other self-chosen activities). It also erased a vision of freedom from labour that had figured powerfully in radical thinking in previous ages.
Dit is interessant, want hier verwijst Standing naar de differentiatie van arbeid, maar hij diept dit niet uit. Ik kan dit als startpunt nemen
In the globalization era, while the rhetoric of rights gained force and popularity, the reality has been the conversion of more people into denizens, denied certain rights or prevented from obtaining or retaining them. This does not affect only migrants. If Hannah Arendt’s idea of citizenship is ‘the right to have rights’ (Arendt [1951] 1986), today it would be better to think of citizenship as a continuum, with many people having a more limited range of rights than others, without any simple dichotomy of citizen and non-citizen.
Dit is helemaal perfect voor mijn essay!
ver, artifact finds and surveys of the area along with cotemporary maps of the town of National Park and the designs of the fort give us an idea of where it was locat
Your reconstruction is based mostly on the historical maps (not artifacts", perhaps reframe this intro to be about those maps and your reconstruction of the fort outline based on those maps. The provide two links: One to the "Mapping Fort Mercer" page The other to "Historical Maps of Fort Mercer"
Fort?
Add another similar block below introducing and linking to the Archaeology of Redbank. Perhaps find a photo of people digging in the fieldschool?
Also, you can add images using the "Assets" block, doesn't have to be an Item!
the Artifacts here
"Learn about maps of the fort and its reconstruction"
Obstructions were placed in the river (known as chevaus de frise) in order prevent enemy ships from advancing further
Save this for the History part?
Reasoning is now a commodity. LLM inference costs fell ~40× in 18 months. •Voice crossed the conversational threshold. Production voice AI now runs at sub-500ms latency in 11 Indian languages - inside the human turn-taking window. •Agents finish jobs, not just answer questions. Task horizons that AI agents complete unsupervised are doubling every 4 months.
I fell there is lot of text here although it is framed well.
The numbers backing it (data) content can be trimmed and font size can be smaller
1/100th
Is this really true ? math holds good?<br /> What about quality?
Feel it should be something like At 1/100th the cost, 80% quality of best sales agent , infinite scale
It currently is MATLAB®’s most popular non-official free toolbox and app
In 2025, PIVlab became the most cited PIV tool.
eLife Assessment
This important cross-species study tests whether the corpus callosum contains parallel, segregated pathways for ipsilateral and contralateral visual-field information, rather than mixed inputs from the two hemispheres. A major strength is its use of a combination of high-field functional magnetic resonance inaging and Bayesian population receptive field (pRF) modelling in humans with viral tracing in mice to offer complementary evidence for pathway segregation. At present, the evidence supporting the authors' claims is incomplete and would benefit from ruling out potential confounds that could mimic tract segregation in the human white-matter pRF data and the mouse anatomical tracing results, and from sharpening claims about laminar specificity.
Reviewer #1 (Public review):
Summary:
This study combined high-field fMRI with computational modelling (including a Bayesian population receptive field [pRF] model and functional gradient analysis) in humans to demonstrate that the architecture of the corpus callosum (CC) and its interhemispheric connections is organized into parallel ipsilateral and contralateral streams, rather than functioning as a mixed integration of inputs from both hemispheres. The human findings were validated through preclinical experiments in mice using viral axonal tracing, which revealed a non-overlapping laminar arrangement of axons carrying left and right visual field information.
These results suggest that the CC operates as a set of parallel, segregated pathways, with each stream independently conveying information from one side of the visual field. This organization preserves the spatial origin of visual signals within the white matter. Although the overall concept of interhemispheric parallel pathways is not entirely unexpected, this refined understanding of callosal organization provides important scientific and clinical insights in relation to pathway-specific perturbations and in neurological disorders.
Strengths:
The manuscript is well written, the methodology is sound, and the analyses are carefully conducted. I particularly appreciate the effort to integrate functional and structural approaches and to validate the human neuroimaging findings with more sensitive preclinical techniques, such as viral tracing.
Weaknesses:
Several points require clarification to allow a more complete interpretation of the results. In addition, some further analyses are necessary to fully substantiate the claims made in the manuscript. These are detailed below
Comment 1:
BOLD signals in white matter remain a matter of debate, although this is not the central focus of the present study. Nevertheless, it is important to establish whether the underlying data have sufficient tSNR to support robust pRF estimation in white matter. In Figure 1, the EV appears relatively robust; however, it seems that only the best-fitting examples are shown. In contrast, the group-average EV reported in Figure 2, and the individual maps in the Supplementary Information indicate very low EV values, typically below 5%. In conventional fMRI analyses, thresholds of approximately 15-20% EV are often applied to exclude poor fits that may bias pRF parameter estimates. It appears that no such threshold was applied here. Interestingly, in Figure S6, the average EV for dual pRF models appears to be approximately 17%. Do dual and triple pRF models systematically produce higher EV compared to single pRF models? Additionally, Figure 2 suggests the presence of baseline activation that is captured by the model. Could this be related to a delayed or altered hemodynamic response function (HRF) in white matter? Clarification would be helpful. To better assess the robustness of the reported findings, the authors should provide quantitative measures of tSNR within the white matter tracts where the pRF model was fitted. Furthermore, a plot showing the average BOLD signal during visual stimulation versus baseline in those tracts would greatly strengthen confidence in the signal quality.
Although the reported linear relationship between pRF size and eccentricity, as well as the test-retest reliability analyses, suggest the presence of consistent receptive field estimates, these analyses are based on distributions and may lack the sensitivity required to differentiate single, dual, and triple pRF models. Moreover, the pRF estimates within the FMA appear noisy, particularly at the individual level (Figure S4), making it difficult to clearly dissociate information originating from the left and right hemifields.
Comment 2.1:
The Bayesian modelling approach is interesting and robust. However, as I understand it, the authors must specify a priori the number of pRFs to be estimated. This introduces a strong assumption about the expected underlying receptive field structure. An alternative Bayesian approach, such as micro-probing (Carvalho et al., 2020), does not require prior assumptions regarding the number or shape of pRFs. Instead, it estimates receptive field profiles in a more data-driven manner and provides a direct visualization of the pRF structure. Implementing such an approach, or at least comparing it with the current modelling strategy, could yield more reliable and potentially less biased estimates of multiple pRFs, particularly in white matter where signal quality is limited.
Comment 2.2:
Some clarifications regarding the pRF model are needed: in the Methods section, the authors mention the use of a Difference-of-Gaussians (DoG) model. However, it appears from the Results that the analyses were performed using a single-Gaussian model. Additionally, in Section 5.6, the authors state that six different pRF models were tested. Which specific models were included in this comparison? A clear description of each model, along with justification for the final model selection criteria, would help better understand the study
Comment 3:
Throughout the manuscript, the authors repeatedly refer to laminar-specific findings. However, the reported functional resolution of 1.6 mm isotropic is insufficient to reliably resolve cortical layers. Given this limitation, the laminar interpretations appear overstated. For example, in the Discussion section titled "Integrating White Matter with Laminar-Resolved Function", the authors state: "The combination of anatomically segregated white matter pathways with functionally specific cortical laminae presents a powerful synergy for human brain circuit research." Given the spatial resolution of the functional data, how are laminar-specific functional claims justified?
Similarly, the authors suggest that: "It becomes possible to assess not just if the CC is damaged, but precisely which directional pathways are compromised-either the pathways projecting from the lesioned hemisphere, or those projecting to the other, or both." It is unclear to me how the current methodology uniquely enables this level of directional specificity, and whether this was not already feasible using existing structural and diffusion-based approaches. The authors should clarify what is genuinely novel in this study.
Comment 4:
In the Discussion, the authors state: "These findings fundamentally reframe our understanding of interhemispheric communication, moving beyond static connectivity to reveal a dynamic, directionally specific highway where spatial location encodes the origin of information. This framework provides a novel blueprint for decoding directional information flow in the living human brain." Based on the analyses presented, it is unclear how the findings of this study demonstrate dynamic connectivity or true directional specificity. The reported results appear to characterize spatial organization and segregation of callosal pathways, but they do not measure the directionality of information flow, temporal dynamics, or causal directionality between hemispheres. To substantiate claims regarding dynamic or directional communication, additional analyses, such as connective field model (Haak et al.2013), effective connectivity modelling, time-resolved approaches, or perturbation-based methods (neuromodulation) would be required. As currently presented, the findings seem to support structural and functional segregation rather than dynamic or directionally resolved interhemispheric information transfer. The authors should either provide stronger evidence for these claims or moderate them.
Comment 5:
I agree with the authors that pooling of information across hemispheres represents a plausible explanation for the presence of dual pRFs. As discussed in the manuscript, such an effect would be expected to predominantly affect pRFs located near the vertical meridian. However, Figures S6C and S6D do not appear to demonstrate that bilateral pRFs are preferentially located along the vertical meridian.
Reviewer #2 (Public review):
Summary:
The manuscript proposes a "parallel wires" architecture for the visual corpus callosum, suggesting that contralateral and ipsilateral visual streams remain spatially segregated into distinct anatomical channels. The authors use a cross-species approach, combining Bayesian population receptive field (pRF) modeling in humans with dual-color viral tracing in mice. The analysis of the publicly available human fMRI dataset indicates a 92% probability of single-hemifield representation, arguing for functional segregation. The mouse mesoscale tracing data support the idea of anatomical parallel wires by displaying dorso-ventral segregation of callosal axons post-midline crossing.
Strengths:
The primary strength of this study is its cross-species integration. Observing that functional segregation in humans is mirrored by specific anatomical pathways in the mouse provides a convincing, multimodal argument for the "parallel wires" hypothesis. The data is generally well-presented, and the Bayesian modeling of the human data is a robust methodological choice.
Weaknesses:
There are weaknesses in the description, presentation, and methodological details of the mouse tracing data. First, the authors must provide detailed information regarding spectral unmixing, intensity normalization, and threshold-sensitivity analyses. These factors are critical as they directly influence the Dice and Jaccard overlap estimates that underpin the study's primary conclusions. Second, it is unclear which cortical layers have been virally labelled as there is no quantification of the spatial extent of the injection site, and there is ambiguity regarding the dorso-ventral stereotaxic coordinates.
Reviewer #3 (Public review):
Summary:
This manuscript describes a study into the functional organization of the forceps major (FMA). The authors present a Bayesian population receptive field (pRF) analysis of group-averaged HCP fMRI retinotopic mapping data, focusing on voxels within the FMA. This is unconventional because pRF modelling is usually limited to gray matter voxels, where synaptic activity underlying neural computation is the highest. Nevertheless, some previous work suggests that meaningful fMRI signals can also be gleaned from white matter voxels, where the signals are thought to reflect metabolic activity from action potentials that travel along axons. However, these signals are generally much noisier, and possible confounding effects due to partial voluming, draining veins, and different hemodynamics must be carefully ruled out. Based on the Bayesian pRF analysis, the authors claim evidence of segregated contralateral and ipsilateral representations of the visual field in the FMA. Anatomical tract tracing based on HCP diffusion MRI data from seeds identified using the pRF analysis further suggests that these representations are underpinned by separate fiber bundles, which also appear to be consistent with the results of viral tracing in mice. The results of this study could mean an important step forward in understanding transcallosal signaling.
Strengths:
The study treads uncharted territory, leveraging multiple data modalities across species and advanced analytical approaches.
Weaknesses:
The study does not address potential confounds related to BOLD imaging in white matter structures. If the fMRI results can be explained based on neighboring grey matter responses, the evidence that remains is limited to an apparent anatomical segregation of white matter bundles that appear to be present in both mice and humans.
Further details are also missing regarding the Bayesian pRF approach, including the priors used for the pRF model. These are important as they will dominate the estimates when the data are very noisy, and the authors have adopted unconventional, more complex pRF models compared with earlier work employing Bayesian pRF analyses.
It appears that the authors have not applied any statistical thresholding to ensure that only good-quality model fits are entered into subsequent analyses (i.e., the reported probabilities pertain to model comparisons, not goodness of fit). From Figure 2, it appears that the majority of the FMA voxels, barring those adjacent to visual gray matter, do not exhibit more than a few percentage points of explained variance (EV). In fact, a common threshold is >15% EV, but it looks like none of the FMA voxels exceed this threshold.
eLife Assessment
This study presents valuable findings regarding cardiac and autonomic effects of seizures and epilepsy, with relevance to sudden unexpected death in epilepsy (SUDEP). They present solid evidence that genetic deletion of the potassium-chloride co-transporter in hypothalamic corticotropin-releasing hormone (CRH) neurons exacerbates bradycardia and enhances autonomic disturbances in a mouse model of temporal lobe epilepsy. However, the evidence that this deletion produces chronic hyperexcitability of the hypothalamic-pituitary-adrenal axis was incomplete, leaving a mechanistic gap. This work will be of interest to neuroscientists working on epilepsy, the HPA axis, and autonomic control.
Reviewer #1 (Public review):
Summary:
The manuscript entitled "Autonomic reflex plasticity associates with time-dependent SUDEP susceptibility in a murine model with hyperactive stress circuits" by Dr. Saunders and colleagues combined a traditional mouse model of SUDEP, ventral intrahippocampal kainite (vIHKA) injection, with a genetic model of chronic hyperactivity of central corticotropin-releasing hormone (CRH) neurons (Kcc2/Crh) that further increases the risk of SUDEP in the weeks following seizure.
Strengths:
Their results show during spontaneous seizures Kcc2/Crh mice had more pronounced reflex-like ictal bradycardias compared to WT controls that notably occurred prior (~10 sec) to seizure termination and had greater autonomic disturbances compared to WT controls, including a pronounced serotonin-mediated Bezold Jarisch reflex. These results show chronic hyperactivity of central corticotropin-releasing hormone (CRH) neurons (Kcc2/Crh) increased autonomic disturbances and risk of SUDEP in a kainic acid model of epilepsy.
Weaknesses:
This study could be improved with a more thorough assessment of heart rate, blood pressure and breathing during and following the seizures, and in particular the fatal event. It is unclear if the bradycardias were spontaneous or a result of preceding central or obstructive apneas, oxygen desaturations, hypercapnia, arrhythmias, or other possible triggers.
Considerable prior work in the literature suggests SUDEP could be mediated, in some patients, by a burst of parasympathetic activity to the heart. Were the heart rate changes in these animals during seizures inhibited or blocked by atropine or atenolol?<br /> The injection of the 5HT agonist phenylbiguanide into the right jugular is not a selective approach for activating the Bezold Jarisch Reflex (BJR), which is caused by increased activity of intracardiac sensory neurons (generally activated with ischemia or a combination of low preload with high contractility). The results should be interpreted more cautiously, as a response to systemic administration of phenylbiguanide only.
Reviewer #2 (Public review):
Summary:
In this manuscript, the authors set out to evaluate the role of hypothalamic pituitary axis hyperactivity on cardiac and autonomic changes during epileptogenesis and following seizures in a mouse model of temporal lobe epilepsy. Epilepsy is very common. It can frequently result in death from sudden unexpected death in epilepsy, or SUDEP. SUDEP is thought to be at least in part due to seizure-related cardiac and autonomic instability. Increased stress states are well known to be comorbid with epilepsy. This comorbidity is thought to increase the risk of SUDEP. Here, the authors hypothesized that a mouse model of heightened stress in which there is hyperactivity of the CRH neurons in the hypothalamus would demonstrate exaggerated cardiac and autonomic effects of seizures and epilepsy.
Strengths:
For the chronic stress model, they employed the Kcc2/Crh mice that have a genetic deletion of the potassium chloride cotransporter in CRH neurons. They treated these mice and their wild-type littermates with intra-hippocampal kainic acid or saline, as epileptic and sham-treated animals, respectively. The assessed cardiac activity, blood pressure, baroreflex, and the Bezold-Jerisch reflex during epileptogenesis. This, in general, is an interesting study. They make some interesting and potentially important observations regarding heart rate and blood pressure in seizures and epilepsy.
Weaknesses:
Some of the conclusions may be a bit overstated as is and would benefit from more discussion and perhaps additional data.
eLife Assessment
This is a useful study, bolstering our understanding of spatial reference frames of visual perception. The high-resolution data and sophisticated analyses confirm and enhance earlier findings that visual representations operate in a predominantly retinotopic reference frame throughout the visual hierarchy in the human cortex. However, these analyses are currently incomplete, leaving open the possibility that eye-position gain and or spatiotopic representations may also be present.
Reviewer #1 (Public review):
In this study, Szinte et al. measured the spatial selectivity of fMRI BOLD responses while subjects viewed dynamic noise stimuli vignetted by a moving bar aperture. Subjects viewed these moving bar stimuli as they fixated at one of three screen locations. This design enabled the authors to test whether fMRI responses are better explained by a model in which stimulus location is encoded relative to the retina or relative to the screen (in other words, 'retintopic' vs. 'spatiotopic' encoding). In retinotopic encoding, the pRFs should move with the eyes. In spatiotopic encoding, the pRFs should be locked to particular screen locations, regardless of eye position. The results are unambiguous: the retinotopic model wins.
A number of prior human fMRI studies have addressed this issue, and there is an overwhelming consensus in the field that spatial encoding throughout human visual cortex (and high-level cortex) is retinotopic (during fixation). All of the results shown in the present manuscript are consistent with these earlier observations. Szinte et al. also find that the degree of retinotopic selectivity is not affected by the task or locus of spatial attention. This too has been observed in multiple prior studies.
So, while this manuscript is primarily confirmatory, the study does nonetheless provide valuable measurements at 7T with a higher signal-to-noise ratio and high spatial resolution than previous studies. The authors also apply an innovative Bayesian decoding analysis (which is beautifully documented on their webpage, with a step-by-step tutorial and ample examples). So, a major strength of this paper is the methods; this study does set a high standard and is an ideal example for a rigorous, replicable analysis pipeline and cutting-edge statistical inference.
The results focus on the spatial profile of pRFs with different eye positions. However, the main idea behind eye-position gain fields is that the amplitude of the visual responses changes with eye position. I could not find any analysis testing response amplitude as a function of eye position. In the Discussion, the authors assert: "We did not find an influence of gaze position at the level of individual voxels nor at the level of visual areas." The authors speculate that this might be because gain fields have a salt-and-pepper organization in the cortex that cancel out when pooled across a voxel. While the salt-and-pepper explanation seems like perfectly fine speculation, here they are discussing a result that isn't shown in the Results!
Several prior human fMRI studies have reported eye position gain fields in humans, suggesting that the salt-and-pepper explanation is not correct. Rather, it is likely the case that the authors did not test a sufficiently wide range of eye positions to detect a gain modulation. For example, a study from Merriam et al. (J. Neurosci, 2013), which is mysteriously not cited here, measured both the spatial selectivity of visual receptive fields AND the response amplitude at 8 different eye positions that were spaced by as much as 24 degrees of visual angle (including both vertical and horizontal changes in eye position). Under these conditions, Merriam et al. did find reliable modulation in response amplitude with changes in eye position, even though the spatial selectivity of the responses did not change. Importantly, Merriam et al. found that visual response selectivity was consistent with a retinotopic reference frame (not a spatiotopic reference frame) and that this selectivity was invariant to the attention task. Consideration of these issues suggests that the experimental design used in the current experiment may have precluded the detection of eye position gain fields. The current manuscript would be much improved by a careful consideration of this prior literature, which is so closely related to what the authors report here.
Reviewer #2 (Public review):
Summary:
This manuscript describes a study using fMRI voxel-wise receptive field modeling and Bayesian decoding to assess the reference frame (spatiotopic vs retinotopic) of visual information. Participants viewed sequences of visual stimuli that moved across different screen locations. Across different conditions, participants either fixated at the screen center and viewed stimuli drifting across the full screen (full-screen condition), or fixated at a central, left, or right fixation position while stimuli drifted across a 4-deg aperture centered on that fixation (gaze-center, gaze-left, gaze-right conditions). Within each of those conditions, participants either attended to visual changes around fixation (attend-fix) or in the stimulus bar (attend-bar). First, standard population receptive field mapping was conducted on the full-screen conditions to obtain fiducial maps for each subject. Then, a variety of different analyses were performed, testing retinotopic vs spatiotopic predictions for the gaze-left and gaze-right conditions. Across the extensive set of analyses performed, and across all ROIs tested, the results always best matched the retinotopic predictions. This was the case for both attend-fix and attend-bar conditions. The authors conclude that visual representations operate in a retinotopic reference frame throughout the visual hierarchy, necessitating a "re-orienting" of the search for visual stability mechanisms.
Strengths:
The analyses are sophisticated and thorough, and the results are convincingly in favor of retinotopic representations. The attention manipulation is carefully done. And the finding that the most informative/reliable voxels are the most retinotopic is an important novel contribution.
Weaknesses:
(1) The theoretical advance of this work is unclear, because the finding that visual representations operate in a retinotopic reference frame throughout the visual hierarchy, and regardless of the deployment of spatial attention, has already been demonstrated with fMRI pattern analysis almost 15 years ago (Golomb & Kanwisher, 2012). To be clear, the techniques used in this current study are considerably more modern and sophisticated, and the attention manipulation is much better, but the finding is the same. More importantly, it is never really explained why, from a theoretical perspective, the results might have been expected to differ. Referring to this as an open question feels like a copout. The manuscript needs to engage more with the prior findings and explain the motivation for the current study. Was there something about the prior findings that caused them to doubt the retinotopic conclusion? Did they think that the 7T resolution or alternative decoding approaches might uncover something different? Was this intended as a replication test with more sophisticated techniques?
(2) I think there are definitely some new and useful things this study has to offer, but the overall theoretical contribution needs to be better clarified and contextualized within the prior literature. I would strongly recommend revisiting things like the title (not a novel contribution of this study) and the implication that the current findings "reframe" or "reorient" the search for visual stability mechanisms away from static spatiotopic maps (the field has arguably been "reoriented" in that way for some time now, and this study is certainly not the first to suggest a reframing along these lines). The discussion section, in particular, has little to no acknowledgement that these findings and ideas have been shown before.
(3) The analyses always pit retinotopic vs spatiotopic predictions. But what if both types co-existed, just with retinotopic more predominant? I think this general idea needs some discussion, if not additional analyses. Would the analyses be sensitive enough to pick up sparse spatiotopic coding if present?
Additional questions/critiques/suggestions:
(4) For the out-of-sample predictions analysis (Figure 2):
a) The spatiotopic predictions are much worse for earlier visual regions, but don't seem so different from gaze-center or retinotopic in later areas. How much might this be driven by the fact that pRF size increases along the hierarchy, and for large pRF sizes, the retinotopic and spatiotopic predictions might not be very differentiable? Is there a way to quantify this or include a control model that is neither retinotopic nor spatiotopic?
b) It looks like in some of the regions, the retinotopic (and maybe even spatiotopic) R2 change compared to the gaze center is reliably positive. Why would this be? Is there a reason the fit should be better for the gaze right or gaze left conditions compared to the gaze center?
(5) For the fitting retinotopic and spatiotopic pRF models (Figure 3) and other voxel-specific analyses:
a) For many of the statistics, results are averaged across voxels. This makes sense. But it also seems to me that taking a simple average might obscure some of the potential advantages of this voxel-wise approach. For example, what if there are sparse spatiotopic effects that are washed out by the averaging? Perhaps some way of looking at the statistical distribution of voxels' RFIs could be worth considering?
b) Are there some spatiotopic areas in the searchlight maps? It looks like there may be some blue clusters, but these cortical map figures are really hard to resolve.
(6) For the RFI as a function of model overlap and explained variance (Figure 4):
a) I like this analysis; I find it convincing and novel. Could it be further quantified by correlating on a voxelwise basis the reliability (e.g., explained variance) vs RFI?
b) I'm intrigued by the seemingly reliable blueish (spatiotopic) cells at the bottom of the V1-V3 grids. These seem to suggest that for the voxels with less spatial relevance (overlap), there might be something spatiotopic, even for relatively informative voxels (high explained variance)?
c) On a related note, is the "spatial relevance" measure the same as, or correlated with, eccentricity? It sounds like voxels with high spatial relevance (overlap with the central 4deg aperture) are the more foveal voxels. Intuitively, foveal voxels might be expected to be more retinotopic, right? In addition to clarifying this measure, it'd be nice to see a similar plot with eccentricity on the y-axis.
(7) For the Bayesian decoding (Figure 5):
a) A benefit of the Bayesian decoding (e.g., over the earlier studies using non-Bayesian decoding of retinotopic vs spatiotopic) is the uncertainty estimates. I think these analyses are interesting and should be in the main text figures, not a supplement.
b) Instead of line plots showing the decoded (best) position using the posterior distribution STD as the error shading, could you show the actual posterior distribution as heat maps (like the cartoon in B)? Is it possible there could be a second peak (or clear absence of one) at the spatiotopic prediction location?
(8) Also note that Golomb & Kanwisher also calculated the RFI measure for similar ROIs for both of their attention conditions. It may be worth comparing.
(9) Methods:
a) Is it true that 2 of the authors were actually naïve as to the purpose of the study? Regardless, given the small number of subjects and high ratio of authors as subjects, it might be nice to confirm that the results are not driven by the author-participants.
b) I think 44ms TR is a typo?
c) Why was the order of the bar movement directions always the same? Wouldn't this make the stimuli very predictable for the subjects, which could be potentially problematic?
d) I'm also curious why the gaze conditions were all presented in separate runs, as opposed to different blocks within a run.
e) The eccentricity maps for the fiducial maps (Figure 1G) seem a bit strange to me. Shouldn't the foveal representation be centered at the occipital pole, not the lateral surface?
eLife Assessment
This fundamental study reports convincing evidence for early verbal episodic memory formation. The findings demonstrate that speaker identity is a crucial feature, enabling episodic-like memories from birth, and will be of interest to cognitive neuroscientists working on brain development, memory, language learning and social cognition.
Reviewer #1 (Public review):
Summary:
This manuscript investigates whether newborns can use speaker identity to separate verbal memories, aiming to shed light on the earliest mechanisms of language learning and memory formation. The authors employ a well-designed experimental paradigm using functional near-infrared spectroscopy (fNIRS) to measure neural responses in newborns exposed to familiar and novel words, with careful counterbalancing and acoustic controls. Their main finding is that newborns show differential neural activation to novel versus familiar words, particularly when speaker identity changes, suggesting that even at birth, infants can use indexical cues to support memory.
Strengths:
Major strengths of the work include its innovative approach to a longstanding question in developmental science, the use of appropriate and state-of-the-art neuroimaging methods for this age group, and a thoughtful experimental design that attempts to control for order and acoustic confounds. The study addresses a significant gap in our understanding of how infants process and remember speech, and the data are presented transparently, with clear reporting of both significant and non-significant results.
A previous concern was that the recognition effect appeared restricted to a subgroup of participants. The authors clarify that the bilateral STG and left IFG effects were present in both groups - it was only the right IFG modulation that was group-dependent. This is an important distinction and is now clearer in the revised manuscript. The timing of the effect emerging in a specific testing window also appears less arbitrary given the authors' explanation that prior work guided the analytical approach, and that task difficulty was expected to determine whether recognition would appear in earlier or later test blocks.
The sample size question is handled honestly. A power analysis based on a related ANOVA study produced an implausibly small estimate of N=5-7, which the authors rightly set aside. Aligning with fNIRS neonate studies - where mean sample sizes around N=24 are standard - is defensible, and the within-subject design with mixed-model analysis does improve sensitivity relative to simpler approaches. This is now explained in the manuscript.
The episodic memory framing has been scaled back appropriately. The revised discussion is clear that the study demonstrates what-who binding - an early component of episodic-like processing - rather than mature episodic memory in the Tulvingian sense. This is a more honest characterization of what the paradigm can show, and it opens a reasonable developmental question about how the remaining components (where, when) come online over the first months and years of life.
Weaknesses
The weaknesses are largely interpretive rather than fatal to the core findings. The absence of a same-speaker interference control within the current paradigm means the causal role of speaker change cannot be established entirely from internal evidence alone - the inference relies partly on comparison with Benavides-Varela et al. (2011), which used a somewhat different design. This is a reasonable approach given the ethical and practical constraints of testing newborns, and the authors are transparent about it, but readers should keep in mind that the conclusion about speaker change as the critical variable is supported by converging evidence across studies rather than a direct within-study manipulation.
Overall, the study contributes new and meaningful data on an underexplored aspect of early speech processing: the role of the speaker as a contextual dimension in word memory. The findings, taken together with the prior literature, tell a coherent story and have real implications for theories of early language acquisition and the developmental origins of episodic-like memory. The paradigm is sound and the results are worth pursuing in larger and more controlled follow-up studies.
Reviewer #2 (Public review):
Summary
Previous studies by some of the same authors of the actual manuscript showed that healthy human newborns memorize recently learned nonsense words. They exposed neonates to a familiarization period (several minutes) when multiple repetitions of a bisyllabic word were presented, uttered by the same speaker. Then they exposed neonates to an "interference period" when newborns listened to music or the same speaker uttering a different pseudoword. Finally, neonates were exposed to a test period when infants hear the familiarized word again. Interestingly, when the interference was music, the recognition of the word remained. The word recognition of the word was measured by using the NIRS technique, which estimates the regional brain oxygenation at the scalp level. Specifically, the brain response to the word in the test was reduced, unveiling a familiarity effect, while an increase in regional brain oxygenation corresponds to the detection of a "new word" due to a novelty effect. In previous studies, music does not erase the memory traces for a word (familiarity effect), while a different word uttered by the same speaker does.
The current study aims at exploring whether and how word memory is interfered with by other speech properties, specifically the changes in the speaker, while young children can distinguish speakers by processing the speech. The author's main hypothesis anticipates that new speaker recognition would produce less interference in the familiarized word because somehow neonates "separate" the processing of both words (familiarized uttered by one speaker, and interfering word, uttered by a different speaker), memorizing both words as different auditory events.
From my point of view, this hypothesis is interesting since the results would contribute to estimate the role of the speaker in word learning and speech processing early in life.
Major strengths:
(1) New data from neonates. Exploring neonates' cognitive abilities is a big challenge, and we need more data to enrich the knowledge of the early steps of language acquisition.
(2) The study contributes new data showing the role of speaker (recognition) on word learning (word memory), a quite unexplored factor. The idea that neonates include speakers in speech processing is not new, but its role in word memory has not been evaluated before. The possible interpretation is that neonates integrate the process of the linguistic and communicative aspects of speech at this early age.
(3) The study proposes a quite novel analytic approach. The new mixed models allow exploring the brain response considering an unbalanced design. More than the loss of data, which is frequent in infants' studies, the familiarization, interference and learning processes may take place at different moments of the experiment (e.g. related to changes in behavioural states along the experiment) or expressed in different regions (e.g. related to individual variations in optodes' locations and brain anatomy).
Main weaknesses:
I did not find major weaknesses. However, I would like to have more discussion or explanation in the following points.
(1) It would be fine to report the contribution of each infant to the analysis, i.e. how many good blocks, 1 to 5 in sequence 1 and 2, were provided by each infant.
(2) Why did the factor "blocknumber" range from 0 to 4? The authors should explain what block zero means and why not 1 to 5.
(3) I may suggest intending to integrate the changes in brain activity across the 3 phases. That is, whether changes in familiarization relate to changes in the test and interference phases. For instance, in Figure 2, the brain response distinguishes between same and novel words that occurred over IFG and STG in both hemispheres. However, in the right STG there was no initial increase in the brain response, and the response for the same was higher than the one for novels in the 5th block.
(4) Similarly, it is quite amazing that the brain did not increase the activity with respect to the familiarization during the interference phase, mainly over the left hemisphere, even if both the word and speaker changed. Although the discussion considers these findings, an integrated discussion of the detection of novel words and the detection of a novel speaker over time may benefit from a greater integration of the results.
Appraisal
The authors achieved their aims, because the design and analytic approaches showed significant differences. The conclusions are based on these results. Specifically, the hypothesis that neonates would memorize words after interference, when interfered speech is pronounced by a different speaker was supported by the data, in block 2 and 5 and discussed the potential mechanisms underlying these findings, such as separate processing for different speakers, likely related to the recognition of speaker identity.
I think the discussion is well structured, although I may suggest integrating the changes into the three phases of the study. Maybe comparing with other regions, not related to speech processing.
Evaluating neonates is a challenge. Because physiology is constantly changing. For instance, in 9 minutes newborns may transit from different behavioral states and experience different physiological needs.
This study offers the opportunity to inspire looking for commonalities and individual differences when investigating early memory capacities of newborns.
Comments on revisions:
The authors provided satisfactory answers to my concerns.
I recognize that, because of technical and ethical reasons, the studies with neonates are particularly challenging, however, with a well-balanced design as the one the authors applied, even with small samples the data constitute valuable sources to advance in the field.
Neonate brain works in a particularly state of intense metabolic, functional and structural changes, which we are far to understand. Current data contribute to fill this gap in knowledge.
Author response:
The following is the authors’ response to the original reviews.
Reviewer #1 (Public review)
Summary:
This manuscript investigates whether newborns can use speaker identity to separate verbal memories, aiming to shed light on the earliest mechanisms of language learning and memory formation. The authors employ a well-designed experimental paradigm using functional nearinfrared spectroscopy (fNIRS) to measure neural responses in newborns exposed to familiar and novel words, with careful counterbalancing and acoustic controls. Their main finding is that newborns show differential neural activation to novel versus familiar words, particularly when speaker identity changes, suggesting that even at birth, infants can use indexical cues to support memory.
Strengths:
Major strengths of the work include its innovative approach to a longstanding question in developmental science, the use of appropriate and state-of-the-art neuroimaging methods for this age group, and a thoughtful experimental design that attempts to control for order and acoustic confounds. The study addresses a significant gap in our understanding of how infants process and remember speech, and the data are presented transparently, with clear reporting of both significant and non-significant results.
Weaknesses:
However, there are notable weaknesses that limit the strength of the conclusions. The main recognition effect is restricted to a specific subgroup of participants and emerges only during a particular testing window, raising questions about the robustness and generalizability of the findings. The sample size, while typical for infant neuroimaging, is modest, and the statistical power is further reduced by missing data and group-dependent effects. Additionally, the claims regarding episodic memory and evolutionary implications are somewhat overstated, as the paradigm primarily demonstrates memory retention over a few minutes without evidence of the rich, contextually bound recall characteristic of fully developed episodic memory.
Overall, the authors have achieved their primary aim of demonstrating that speaker identity can facilitate memory separation in newborns, providing valuable preliminary evidence for early indexical processing in language learning. The results are intriguing and likely to stimulate further research, but the limitations in effect robustness and theoretical interpretation mean that the findings should be viewed as an important step forward rather than a definitive answer. The methods and data will be of interest to researchers studying infant cognition, memory, and language, and the study highlights both the promise and the challenges of probing complex cognitive processes in the earliest stages of life.
We thank the reviewer for their thoughtful and positive assessment of our work, and for giving us the opportunity to clarify points that may have been unclear in the original manuscript.
First, considering that the recognition response was quite consistent in previous studies, we expected the effect to emerge within a specific testing window, in either the first or the second block, depending on task difficulty. Accordingly, our analytical approach was designed to reflect this expectation, which was subsequently confirmed by the results. Second, the main recognition effect is not restricted to a specific subgroup of participants. Recognition responses were observed in both groups in the left IFG and bilateral STG. The only group-specific modulation was found in the right IFG, where the effect was primarily driven by Group A. This suggests that activity in this specific region may be influenced by contextual factors such as the nature and amount of recently processed stimuli. We have clarified these points in the revised manuscript to avoid the impression that the core effect is limited to a subset of participants or not generalizable across studies.
Regarding the sample size, a formal calculation was initially attempted based on the effect size reported in a closely related ANOVA-based study (Benavides-Varela et al., 2011; Study 2: Word recognition after intervening melodies, main effect for the comparison same vs novel word [F(1,26) = 19.318; p<0.0001 effect size f =.87). However, inputting this information into a dedicated software (G*power; α = 0.05; number of groups =1; number of measurements = 2) leads to an estimated sample size of N = 5 to 7 (depending on the desired power, range = 0.800.95). This sample size is unrealistically small and not representative of current research standards in the field. A proper formal power analysis for the LMM is otherwise hard to perform, as we lack information about the expected variance and random-effects structure. We therefore aligned our sample size with prior newborn studies using similar stimuli and experimental designs, and with fNIRS studies in newborns and infants (for recent metanalysis see De Roever et al., 2018; Boek et al., 2023; Gemignani et al., 2023; which examined studies with mean N =24; N range= 186 and sample sizes often including various conditions and groups). Note also that our design includes a within-subject comparison, our analytical approach models subject-level variance and handles unbalanced datasets and missing data (which are common in infant studies), thereby improving statistical sensitivity. We have now explicitly clarified this choice in the Introduction.
Finally, we revised the discussion to ensure that interpretations are aligned with our findings, by including a limitations section and a more explicit note regarding theories of memory.
Episodic memory is a multifaceted construct that matures over time through the integration of the what–who-where–when information. The present study does not aim to demonstrate the presence of a fully developed episodic memory system at birth; rather, it shows that specific features of episodic-like processing (i.e., what–who) are already bound from the first days of life. Future studies may track the progressive integration of additional episodic-related components leading to a mature episodic memory system.
Reviewer #1 (Recommendations for the authors):
(1) I wonder why a control condition with same-speaker interference was not included. Adding such a control would allow you to directly test whether the observed effects are truly due to speaker changes, rather than other acoustic or procedural factors. If it is not feasible to add this condition, please discuss its absence explicitly and clarify how it impacts the interpretation of your findings.
We thank the reviewer for raising the issue of a same-speaker interference control. A similar control has been tested previously using a closely related paradigm, showing that recognition does not persist when neonates hear another word produced by the same speaker during the retention period (Benavides-Varela et al., 2011). As noted in the manuscript, there were some methodological differences between that study and the current one. Most importantly, in the present study familiarization was reduced (from ten to five blocks) and the retention interval increased (two to three minutes), making the current paradigm more demanding. We reasoned that, if newborns forgot the word under the prior (less challenging) study, they would also forget it here if a same-speaker interference control would have been implemented. With the current manipulation, despite the difficulty of the paradigm, the recognition response was observed. This pattern suggests that speaker change, rather than general procedural factors, is central to the observed effect. Given these prior findings and the ethical constraints of testing newborns, we believe that adding a new same-speaker control is not essential. We have now made this rationale more explicit in the manuscript (discussion section, limitations, p. 16), hoping that this clarification will make our methodological choices clearer.
(2) It wasn't clear if Group A and Group B have the same number of infants, and whether they were randomly assigned. Please specify.
Participants were initially assigned to Group A or Group B in a counterbalanced way to maintain comparable group sizes. Due to attrition and subsequent exclusion for various reasons (e.g., low signal quality, fussiness, technical issues), the final sample consisted of 17 infants in Group A and 15 infants in Group B. We have now specified this information in the revised manuscript (p. 20).
(3) Please specify the exact number of fNIRS channels assigned to each region of interest (ROI), as it is currently difficult to map the channel numbers in Supplementary Table 2 to the optode montage shown in Figure 2. Additionally, report the percentage of usable channels after quality control.
The inferior frontal gyrus left and right ROIs comprised 4 channels each, the superior temporal gyrus left and right ROIs 5 channels each, and the parietal lobe left and right ROIs 7 channels each. This information has been added to the methods section, along with the average number of channels contributing to each ROI after data rejection and the percentage of channels rejected throughout the recording (p. 23).
(4) Also, a formal power analysis to justify your sample size would be helpful for evaluating the reliability of your findings and is increasingly expected in developmental neuroimaging research.
Thanks for this suggestion. As stated in the public response, we agree that power analyses constitute an important component of methodological rigor in the field. In our case, a formal calculation was initially attempted based on the effect size reported in a closely related ANOVAbased study (Benavides-Varela et al., 2011; Study. 2: Word recognition after intervening melodies, main effect for the comparison same vs novel word [F(1,26) = 19.318; p<0.0001 effect size f =.87).
However, inputting this information into a dedicated software (G’power; α = 0.05; power range = 0.80-0.95; number of groups =1; number of measurements = 2) leads to an estimated sample size of N = 5 to 7, which is unrealistically small and not representative of current research standards in the field. A proper formal power analysis for the LMM is otherwise hard to perform, as we lack information about the expected variance and random-effects structure. We therefore aligned our sample size with prior newborn studies using similar stimuli and experimental designs, and with fNIRS studies in newborns and infants (for recent metanalysis see De Roever et al., 2018; Boek et al., 2023; Gemignani et al., 2023; which examined studies with mean N =24; N range= 1-86 and sample sizes often including various conditions and groups. Note also that our design includes a within-subject comparison, and our analytical approach models subject-level variance and handles unbalanced datasets and missing data (which are common in infant studies), thereby improving statistical sensitivity.
(5) The manuscript references episodic memory explicitly in the abstract and introduction, emphasizing the role of speaker identity in enabling episodic-like memory from birth. However, this concept is not sufficiently addressed or delineated in the discussion. Episodic memory is generally understood as recalling events with contextual details, involving complex integrative processes that extend beyond simple recognition of auditory stimuli. Your paradigm demonstrates memory retention over a few minutes but does not provide strong evidence for the hallmark features of episodic memory, such as contextual binding or autobiographical recollection. Moreover, infant speech recognition and memory formation in early life are influenced by the immediacy and complexity of sensory input, which may not necessarily engage fully developed episodic systems. Clarifying these distinctions and making sure your interpretations and claims are consistent with them would enhance the conceptual clarity of the manuscript.
We agree that episodic memory is a multifaceted construct that, in its mature form, entails the ability to retrieve past events with contextual detail, typically involving autobiographical recollection and the integration of what–-who-where–when information (Tulving, 1993). Our study does not aim to demonstrate the presence of a fully developed episodic memory system at birth, nor do we claim that newborns’ performance satisfies all hallmark criteria of mature episodic memory.
Here, we focused on sensitivity to speaker identity as a contextual dimension relevant to memory formation. Within this narrower sense, both, the patterns of activation and the localization of the response provide evidence for early source–content binding (i.e., what–who), which can be considered a foundational aspect of episodic-like processing. Following up on this foundational step, future studies may track the gradual integration of additional aspects (where-when), ultimately leading to the maturation of a fully functional human episodic memory system.
We have now clarified this point in the revised manuscript (p. 17)
(6) Please add a dedicated limitations section. This should address the group-dependent nature of your main effects, the timing-specific recognition response, and any other methodological constraints that may impact the generalizability of your results.
We thank the reviewer for this comment. We have made our best to expose the limitations of our study in the text (p.16), specifically regarding the reasons for the lack of a control condition and the effects of frequent changes in sleeping states in newborns.
(7) Consider revising sections where claims may be overstated, particularly regarding episodic memory and evolutionary implications.
These sections have now been revised in the abstract and throughout the manuscript to ensure that interpretations remain proportionate to the data and consistent with current theoretical frameworks.
Reviewer #2 (Public review):
Summary:
Previous studies by some of the same authors of the actual manuscript showed that healthy human newborns memorize recently learned nonsense words. They exposed neonates to a familiarization period (several minutes) when multiple repetitions of a bisyllabic word were presented, uttered by the same speaker. Then they exposed neonates to an "interference period" when newborns listened to music or the same speaker uttering a different pseudoword. Finally, neonates were exposed to a test period when infants hear the familiarized word again. Interestingly, when the interference was music, the recognition of the word remained. The word recognition of the word was measured by using the NIRS technique, which estimates the regional brain oxygenation at the scalp level. Specifically, the brain response to the word in the test was reduced, unveiling a familiarity effect, while an increase in regional brain oxygenation corresponds to the detection of a "new word" due to a novelty effect. In previous studies, music does not erase the memory traces for a word (familiarity effect), while a different word uttered by the same speaker does.
The current study aims at exploring whether and how word memory is interfered with by other speech properties, specifically the changes in the speaker, while young children can distinguish speakers by processing the speech. The author's main hypothesis anticipates that new speaker recognition would produce less interference in the familiarized word because somehow neonates "separate" the processing of both words (familiarized uttered by one speaker, and interfering word, uttered by a different speaker), memorizing both words as different auditory events.
From my point of view, this hypothesis is interesting, since the results would contribute to estimating the role of the speaker in word learning and speech processing early in life.
Strengths:
(1) New data from neonates. Exploring neonates' cognitive abilities is a big challenge, and we need more data to enrich the knowledge of the early steps of language acquisition.
(2) The study contributes new data showing the role of speaker (recognition) on word learning (word memory), a quite unexplored factor. The idea that neonates include speakers in speech processing is not new, but its role in word memory has not been evaluated before. The possible interpretation is that neonates integrate the process of the linguistic and communicative aspects of speech at this early age.
(3) The study proposes a quite novel analytic approach. The new mixed models allow exploring the brain response considering an unbalanced design. More than the loss of data, which is frequent in infants' studies, the familiarization, interference and learning processes may take place at different moments of the experiment (e.g. related to changes in behavioural states along the experiment) or expressed in different regions (e.g. related to individual variations in optodes' locations and brain anatomy).
Weaknesses:
I did not find major weaknesses. However, I would like to have more discussion or explanation on the following points.
(1) It would be fine to report the contribution of each infant to the analysis, i.e. how many good blocks, 1 to 5 in sequence 1 and 2, were provided by each infant.
(2) Why did the factor "blocknumber" range from 0 to 4? The authors should explain what block zero means and why not 1 to 5.
(3) I may suggest intending to integrate the changes in brain activity across the 3 phases. That is, whether changes in familiarization relate to changes in the test and interference phases. For instance, in Figure 2, the brain response distinguishes between same and novel words that occurred over IFG and STG in both hemispheres. However, in the right STG there was no initial increase in the brain response, and the response for the same was higher than the one for novels in the 5th block.
(4) Similarly, it is quite amazing that the brain did not increase the activity with respect to the familiarization during the interference phase, mainly over the left hemisphere, even if both the word and speaker changed. Although the discussion considers these findings, an integrated discussion of the detection of novel words and the detection of a novel speaker over time may benefit from a greater integration of the results.
Appraisal:
The authors achieved their aims because the design and analytic approaches showed significant differences. The conclusions are based on these results. Specifically, the hypothesis that neonates would memorize words after interference, when interfered speech is pronounced by a different speaker, was supported by the data in blocks 2 and 5, and the potential mechanisms underlying these findings were discussed, such as separate processing for different speakers, likely related to the recognition of speaker identity.
I think the discussion is well-structured, although I may suggest integrating the changes into the three phases of the study. Maybe comparing with other regions, not related to speech processing.
Evaluating neonates is a challenge. Because physiology is constantly changing. For instance, in 9 minutes, newborns may transit from different behavioral states and experience different physiological needs.
We thank the reviewer for their constructive and positive appraisal of our work and for drawing attention to points that benefited from further clarification or discussion in the manuscript.
In the following, we address each point in turn, using the numbering of the reviewer’s identified concerns.
(1) In the Methods section (“Data Processing and Analysis”, p. 22), we have added detailed information about the number of data points contributed by each infant to the analyses.
(2) The factor “blocknumber” ranged from 0 to 4 for statistical purposes, allowing Block 0 to serve as the reference (intercept) in the model. This coding facilitated the interpretation of parameter estimates. We now clarify this in the revised manuscript (p. 7).
(3) Thanks for this relevant suggestion. In the Discussion, we now explicitly discuss the relationship across phases. We also acknowledged that a thorough examination of these issues lies beyond the scope of the present study as it will require future work based on multivariate and connectivity analyses.
(4) We thank the reviewer for this comment. In the revised manuscript, we have expanded the Discussion to clarify the absence of a strong novelty response during interference. The discussion highlights how the temporal properties of the hemodynamic response and the functional demands of each phase jointly shape the observable fNIRS signal in newborns, with purely sensory novelty effects likely increasing with maturation.
Finally, we agree that evaluating the transitions of sleeping states can further strengthen and clarify the results obtained in the present study. This has now been added as one of the limitations of this study.
eLife Assessment
This valuable study presents a framework for a shareable data analysis pipeline aimed at improving reproducibility in neuroscience. The evidence for robustness and inter-laboratory operability is convincing. Overall, this work will be of interest to neuroscientists engaged in the analysis of large-scale neuronal recordings.
Reviewer #1 (Public review):
Summary
The manuscript by K.H. Lee et al. presents Spyglass, a new open-source framework for building reproducible pipelines in systems neuroscience. The framework integrates the NWB (Neurodata Without Borders) data standard with the DataJoint relational database system to organize and manage analysis workflows. It enables the construction of complete pipelines, from raw data acquisition to final figures. The authors demonstrate their capabilities through examples, including spike sorting, LFP filtering, and sharp-wave ripple (SWR) detection. Additionally, the framework supports interactive visualizations via integration with Figurl, a platform for sharing neuroscience figures online.
Strengths:
Reproducibility in data analysis remains a significant challenge within the neuroscience community, posing a barrier to scientific progress. While many journals now require authors to share their data and code upon publication, this alone does not ensure that the code will execute properly or reproduce the original results. Recognizing this gap, the authors aim to address the community's need for a robust tool to build reproducible pipelines in systems neuroscience.
Comments on revisions:
In this revised version, the authors have addressed the majority of the concerns raised in the initial review. The manuscript is clearer, the documentation and explanations have been strengthened, and several important practical issues-particularly regarding usability, terminology, and deployment-have been meaningfully improved. While the framework continues to position itself both as a flexible analysis environment and as a mechanism for freezing and preserving reproducible pipelines, the authors have clarified their rationale for maintaining this dual role. I have no additional comments at this stage.
Reviewer #2 (Public review):
Summary:
Lee et al. introduce Spyglass, an open-source Python framework designed to tackle the reproducibility crisis in systems neuroscience by integrating the Neurodata Without Borders (NWB) standard with DataJoint relational databases. The framework aims to standardize data ingestion, preprocessing, analysis pipelines, and data sharing for complex electrophysiological and behavioral experiments.
Strengths:
(1) Handling of Complex Workflows: The architectural design is pragmatic and robust. Features such as the "cyclic iteration" motif for spike-sorting curation and the "merge" motif for consolidating multiple data streams effectively handle the iterative nature of data processing without incurring database bloat.
(2) Ecosystem Integration: The revised manuscript clarifies that Spyglass acts as a community hub, explicitly detailing its integration with established tools like SpikeInterface, DeepLabCut, GhostiPy, MoSeq, and Pynapple.
(3) Pipeline Clarity & Practical Demonstration: The addition of Supplementary Figure 1, in conjunction with Figure 5, successfully maps out the complex, multi-step decoding workflow for both the UCSF and NYU datasets. Together, these figures tell a complete and compelling story of how this pipeline can be used in practice, providing much-needed visual clarity on how raw data moves through the database to generate final results.
Appraisal:
The authors have successfully achieved their aims. Spyglass is a highly functional system capable of handling the heavy lifting of data management. The revisions have significantly improved transparency regarding the tool's limitations and its onboarding process, making it a highly attractive blueprint for labs aiming to adhere to FAIR principles.
Author response:
The following is the authors’ response to the original reviews.
Reviewer #1 (Public review):
Summary
The manuscript by K.H. Lee et al. presents Spyglass, a new open-source framework for building reproducible pipelines in systems neuroscience. The framework integrates the NWB (Neurodata Without Borders) data standard with the DataJoint relational database system to organize and manage analysis workflows. It enables the construction of complete pipelines, from raw data acquisition to final figures. The authors demonstrate their capabilities through examples, including spike sorting, LFP filtering, and sharpwave ripple (SWR) detection. Additionally, the framework supports interactive visualizations via integration with Figurl, a platform for sharing neuroscience figures online.
Strengths:
Reproducibility in data analysis remains a significant challenge within the neuroscience community, posing a barrier to scientific progress. While many journals now require authors to share their data and code upon publication, this alone does not ensure that the code will execute properly or reproduce the original results. Recognizing this gap, the authors aim to address the community's need for a robust tool to build reproducible pipelines in systems neuroscience.
We appreciate the summary and the recognition of the key need for maximally reproducible scientific workflows.
Weaknesses:
The issues identified here may serve as a foundation for future development efforts.
(1) User-friendliness:
The primary concern is usability. The manuscript does not clearly define the intended user base within a modern systems neuroscience lab. Improving user experience and lowering the barrier to entry would significantly enhance the framework's potential for broad adoption. The authors provide an online example notebook and a local setup notebook. However, the local setup process is overly complex, with many restrictive steps that could discourage new users. A more streamlined and clearly documented onboarding process is essential. Additionally, the lack of Windows support represents a practical limitation, particularly if the goal is widespread adoption across diverse research environments.
We agree that usability is critical, and we now clarify that Spyglass
“… is designed to be used by everyone in a laboratory who works with the data, both as a general-purpose tool to enable the development of new analysis pipelines and a tool that allows those pipelines and associated results to be frozen and packaged to enable reproducibility…”
To address the local setup issue, we have now created an interactive quick start program to guide new users through the setup (scripts/install.py). It now leads the user through a few prompts with sensible defaults to reduce the complexity of the setup. It aids the user in installing the Spyglass dependencies and creating the Data joint configuration file. We also validate the configuration to make sure the set up was successful (scripts/validate.py). Combined, these should reduce the complexity and set up time for most users while allowing expert users to configure Spyglass as they need. We thank the reviewer for the suggestion.
We also agree that the lack of support for Windows is a key issue, and that is something we plan to address in the coming years. We note that it may be possible to run Spyglass under the Windows Subsystem for Linux (WSL 2), which allows users to run Linux programs on a Windows machine without the need for a virtual machine or dual boot setup.
(2) Dependency management and long-term sustainability:
The framework depends on numerous external libraries and tools for data processing. This raises concerns about long-term maintainability, especially given the short lifespan of many academic software projects and the instability often associated with Python's backward compatibility. It would be helpful for the authors to clarify how flexible and modular the pipeline is, and whether it can remain functional if upstream dependencies become deprecated or change substantially.
This is a very good point that reflects a broad challenge to maintainability and reproducibility. We now explicitly raise this point in our Limitations section, and note that
“…even in cases where reproducing a result would require installing older versions of software, the results themselves remain accessible within NWB files referenced in Spyglass, ensuring that previous results can be built on even as packages evolve.”
The merge table pattern also allows us to update (version) our pipelines as software changes. For example, we have already done so for changes in SpikeInterface versions for the version 1 pipeline for spike sorting. New and older versions of the pipeline (v0 and v1) are accessed through the merge table SpikeSortingOutput. This allows the user to have consistent results despite the version change.
(3) Extensibility for custom pipelines:
A further limitation is the insufficient documentation regarding the creation of custom pipelines. It is unclear how a user could adapt Spyglass to implement their own analysis workflows, especially if these differ from the provided examples (e.g., spike sorting, LFP analysis that are very specific to the hippocampal field). A clearer explanation or example of how to extend the framework for unrelated or novel analyses would greatly improve its utility and encourage community contributions.
Here we failed to provide the required links to the documentation. We now explicitly refer to documentation on Custom Pipeline, which include a link to a YouTube video walking users through the creation of such a pipeline:
Specifically, Spyglass uses DataJoint syntax to define tables as Python classes (see online documentation on Custom Pipelines and this video for examples).
(4) Flexibility vs. Standardization:
The authors may benefit from more explicitly defining the intended role of the framework: is Spyglass designed as a flexible, general-purpose tool for developing custom data analysis pipelines, or is its primary goal to provide a standardized framework for freezing and preserving pipelines post-publication to ensure reproducibility? While both goals are valuable, attempting to fully support both may introduce unnecessary complexity and result in a tool that is not well-suited for either purpose. The manuscript briefly touches on this tradeoff in the introduction, and the latter-pipeline preservation-may be the more natural fit for the package. If so, this intended use should be clearly communicated in the documentation to help users understand its scope and strengths.
We appreciate this point, and have now clarified in the beginning of the Results section that
It is both a general-purpose tool to enable the development of new analysis pipelines and a tool that allows those pipelines and associated results to be frozen and packaged to enable reproducibility.
In practice, our lab uses Spyglass to systematize analyses to enable rapid application across many datasets. Then, once a paper has been finalized, we can export the data and the code in a package that enables reproduction. Being able to do both things is, in our view, a key strength of Spyglass. More broadly, we feel it is critical that there be a clear path for users to take their analysis code and make it reproducible. That process normally involves a very substantial amount of work, and our goal was to reduce the burden on users and make this a straightforward extension of how analyses are carried out.
Impact:
This work represents a significant milestone in advancing reproducible data analysis pipelines in neuroscience. Beyond reproducibility, the integration of cloud-based execution and shareable, interactive figures has the potential to transform how scientific collaboration and data dissemination are conducted. The authors are at the forefront of this shift, contributing valuable tools that push the field toward more transparent and accessible research practices.
We appreciate this positive assessment.
Reviewer #1 (Recommendations for the authors):
(1) "The authors write: ‘the relational database, a well-known data structure that uses tables to organize data.’ This phrasing may be misleading… It would be more accurate to describe them as ‘well-established’ rather than ‘well-known.’"
We have made this change.
(2) The statement "It makes it easy to apply the same analysis to multiple datasets, as users need to specify only the data and parameters for computation ("what") rather than the execution details ("how")." would benefit from further elaboration. Specifically, how does this approach compare in practice to using a simple configuration file (e.g., YAML or JSON) to manage parameters and execution logic? A comparison or example would help ground the claim.?"
We agree one could in principle do something similar with configuration files, but this is a discipline that the user must impose on themselves, as configuration files in general have no constraint on how they are to be used. On the other hand, a system like Spyglass enforces the separation of data from parameters by design. We have now added a brief comment on this point in the Results:
“It provides a structure to organize and systematize the analysis parameters, data, and outputs into different tables. This contrasts with user-generated configuration files where each user could adopt their own idiosyncratic approach to specifying parameters and data.”
We also come back to this point in the Discussion:
Other approaches do away with the relational database altogether. For example, DataLad uses version control tools such as git and git-annex to manage both code and data as files [39]. This enables the creation of a data analysis environment and decentralized data sharing. For building analysis pipelines, it may be combined with other tools for managing the sequential execution of scripts. For example, Snakemakeb[40] (and related projects such as Cobrawap [41]) allows the users to gather and define the input, output, and the associated scripts to execute for each analysis step, thereby tracking the dependency between steps. But because these tools do not provide any formal structure for data analysis or parameter specification, they lack the advantages of the relational database that we discussed, such as being able to easily organize or search for the records of previous analysis based on specific parameters, efficient data sharing and access management to multiple users, and built-in data integrity checks based on constraints native to the database (e.g. primary keys).
(3) The sentence ‘It enables easy access to multiple datasets via queries’ may overstate the benefit… clarify what specific advantages database queries offer.
We agree that this is an important feature and we added the following as an example of the advantage of being able to query the database:
It enables easy access to multiple datasets via queries (e.g. to find all datasets with recordings from a particular brain region or that used a particular behavioral paradigm)
(4) Specifically, Spyglass uses DataJoint syntax to define tables as Python classes’ lacks clarity… Expanding this explanation with a brief, concrete example would
We agree that this sentence does not provide information on how to use DataJoint syntax to define a table. We carefully considered adding that syntax to the manuscript, but we are concerned that doing so here and in other places where syntax examples could be used would decrease the readability of the document. We also noted that other papers that present analysis frameworks typically provide much less information.
Nevertheless, it is clear that users would benefit from a concrete example, and as we mentioned above, we have added a link to the documentation describing how to make custom schema and pipelines, as well as a YouTube video that we created to walk users through this process.
(5) The authors write: "Selection tables associate parameter entries with data object entries." This terminology is confusing. From a naming perspective, it is not immediately obvious what a "selection table" is or how it differs from other components. Moreover, shouldn't parameter entries be associated with a specific pipeline rather than directly with data objects? Further clarification is needed. "
We appreciate that our terminology was not clear. The idea behind a selection table is that there are many data entries and many potential sets of parameters that can be used to analyze each of those entries. We have now revised this section of the text and added an explanatory paragraph:
An analysis pipeline consists of sets of tables downstream of the Common tables. In each step in the analysis, the user populates one of four table types (Figure 2A):
Data tables contain pointers to data objects in either the original NWB file or ones generated by an upstream analysis.
Parameter tables contain a list of the parameters needed to fully specify the desired analysis.
Selection tables allow users to select and pair a data entry and a parameter entry, defining the input to the Compute table.
Compute tables execute the computations to carry out the analysis using the Data and Parameters specified in the Selection table entry. These results are then stored and can serve as Data for downstream analysis.
This design has multiple features that we have found to be beneficial. First, Parameter tables store the full set of parameters needed to specify a given analysis. For example, a Parameter table entry for a firing rate analysis of a single neuron might specify the bin size and smoothing to be used for that analysis. Multiple such entries can be defined, allowing a user to select the most appropriate one for the question being addressed. Second, because Selection tables specify which Parameter table entry was used for a given analysis on the associated Data table entry, they provide the key information needed to know which parameters were used to generate the entry in the downstream Compute table. Third, it is simple to associate a given Data table entry with multiple Parameter table entries and then re-run the analysis on those pairs. This enables a user to understand how their choice of parameters impacts their results, something that is otherwise difficult to manage and track.
(6) Including ‘fitting state-space models’ as a standard example may be misleading… Presenting it as a routine task might set unrealistic expectations."
We agree and have changed “standard” to “a diverse range of”.
(7) Figure 2 would benefit from clearer sequential logic. For example, the object ‘LFPSelection’ appears after a method call referencing it."
We agree that the figure was not explained adequately. We now make it clear in the caption that the method call creates the entry in the LFPSelection table, and is thus upstream of the picture of the table entry that was created.
(8) Example 3 would be strengthened by a comparison to SpikeInterface, a framework increasingly adopted by the community."
Here we clearly did not explain the spike sorting pipeline sufficiently thoroughly. As we now clarify in the text:
This pipeline uses SpikeInterface [19] to perform the operations critical for spike sorting, but also tracks all of the parameters used and provides a system for tracking multiple sorting curations.
Thus, Spyglass takes advantage of the special purpose routines within SpikeInterface, but also provides an organizational framework for the outputs, and, equally critically, allows direct use of the outputs of sorting in downstream analyses with the ability to go back and know which sorting parameters were used for that analysis.
(9) The authors state: "These are saved as Docker containers and optionally uploaded to DANDI." However, it is unclear how end users are expected to interact with these containers. Additional guidance or an example interaction would be valuable.
We agree that this interaction was not described in the text, and we have now added the following to explain how a user might interact with these containers:
...This can be done by (i) hosting the database on the cloud and granting access to users outside the lab; or (ii) exporting and sharing parts of the database that were used by the project. Spyglass facilitates the second option by providing functions that automatically log the table entries and NWB files used for creating figures of a manuscript in a Python environment (Table 1, 05_Export). The dependencies of these entries are traced through the database to compile the complete set of raw, intermediate, and plotted NWB files and their corresponding database entries. These are stored in the `Export` table, which also generates a bash script to create SQL dumps of the identified database entries.
To upload these files to DANDI, users must first register a new dandiset for their project and record their API and dandiset ID. With this information, they can then use the method `DandiPath.compile_dandiset()` to automatically validate, organize, and upload all project files to the DANDI archive. Additionally, this process stores the archive information for each file in the `DandiPath` table, allowing `fetch_nwb` to automatically stream data from the DANDI cloud storage when not available locally.
To create a sharable docker image of the project, we provide a template repository spyglass-export-docker. Users first download a local copy of this repo and copy the SQL dump file, environment yaml, and figure-generating notebooks generated during spyglass export into the appropriate folders. Running the provided docker compose scripts then generates two linked docker containers: one running the reconstructed spyglass SQL database, and a second connected to this database and running a jupyter hub with a python environment matching that used when generating the figures. These can be readily shared with new users to provide them immediate access to all steps of the analysis process and the corresponding data through DANDI streaming
(10) The phrase "not requiring a central location to track available files and providing a user-friendly Python API" is somewhat vague. Does this imply that multiple sources can exist for the same NWB file? How does the system handle potential version conflicts, such as when an NWB file is modified locally? A clearer explanation would help users understand the system's behavior in collaborative scenarios. "
This is an important point that we now explain in the manuscript:
Critically, the downloaded files are never modified locally within Spyglass and attempt to access a modified file would result in a DataJoint error. This ensures that each user is working on the same underlying data even if they are at different sites.
To provide interested readers with more details, we also now point them to the repo for more information:
We point interested readers to the Kachery GitHub repo (https://github.com/magland/kachery) for further descriptions.
(11) "The concept of a ‘kachery zone’ in Figure 4 is ambiguous. Is this storage local or in the cloud? If a third-party storage system is involved, it should be explicitly labeled and described in the diagram."
We agree that the depiction of a Kachery zone in Figure 4 is hard to understand. For the reviewer’s reference, a Kachery zone defines a list of users that have permissions to upload and download a particular set of files that have been linked to that zone. This is a explained in the tutorials, and to simplify the figure we have replaced the Kachery zone with a remote computer.
(12) If one of the manuscript's goals is to showcase the functionality of the pipeline, Figure 5 would be more informative if it also illustrated the workflow or steps involved in generating the displayed figures.
We have added a supplementary figure (Supplementary Figure 1) related to figure 5 that illustrates the main data workflow used in generating the figure. In addition, we note that the code for generating the figure 5 and supplemental are included in the code repository for the paper (https://github.com/LorenFrankLab/spyglass-paper/).
(13) In the conclusion, the authors write: "By contrast, Spyglass begins with a shared data format that includes the raw data and offers both transparent data management and reproducible analysis pipelines using a formal data structure." However, the tools discussed in the previous paragraph seem to offer similar capabilities. The real challenge in transparent data management often lies in the technical overhead associated with setting up and maintaining a database, particularly when collaborating across labs.
Here we may not have explained the differences between Spyglass and these other approaches sufficiently clearly. The various tools mentioned in the paragraph above this one do not begin with a shared format nor do they include a formal data structure. That said, we agree that maintaining a database accessible across labs is a key challenge. We note here that we provide tutorials to ease this process, which are linked and described in the manuscript (e.g. Table 1).
(14) Specifying a preferred IDE… may not be necessary. This recommendation could be made optional or omitted."
We agree that it may not be necessary, but we have also noted that users come to Spyglass with a very wide range of expertise, and in our lab it has been helpful to specify the IDE.
Reviewer #2 (Public review):
Summary:
This valuable paper presents Spyglass, a comprehensive software framework designed to address the critical challenges of reproducibility and data sharing in neuroscience.
The authors have developed a robust ecosystem built on community standards such as NWB and DataJoint, and demonstrate its utility by applying it to datasets from two independent labs, successfully validating the framework's ability to reproduce and extend published findings. While the framework offers a powerful blueprint for modern, reproducible research, its immediate broad impact may be tempered by the significant upfront investment required for adoption and its current focus on electrophysiological data. Nevertheless, Spyglass stands as an important and practical contribution, providing a well-documented and thoughtfully designed path toward more transparent and collaborative science.
Strengths:
(1) Principled solution to a foundational challenge:
The work offers a concrete and comprehensive framework for reproducibility in neuroscience, moving beyond abstract principles to provide an implemented, end-to-end ecosystem.
(2) Pragmatic and robust architectural design:
Features such as the "cyclic iteration" motif for spike-sorting curation and the "merge" motif for pipeline consolidation demonstrate deep, practical experience with neurophysiological analysis and address real-world challenges.
(3) Cross-laboratory validation:
The successful replication and extension of published hippocampal decoding findings across independent datasets strongly support the framework's utility and underscore its potential for enabling reproducible science.
(4) Accessibility through documentation and demos:
Extensive tutorials and the availability of a public demo environment lower some of the barriers to adoption.
We appreciate the Reviewer’s recognition of these strengths.
Weaknesses:
(1) High barrier to adoption:
The requirement to convert all data into NWB, maintain a relational database, and train users in structured workflows is a significant hurdle, particularly for smaller labs.
We agree that this is a significant hurdle, but we also believe that it comes with many advantages. It is also increasingly easy to do given the many community-supported tools, regardless of how much resource the lab has. These points are discussed in detail in “Why NWB?” section.
We also note that, to our knowledge, there is no simpler alternative that provides the key features of Spyglass.
(2) Limited tool integration:
The current pipelines, while useful, still resemble proof-of-principle demonstrations.
Closer integration with established analysis libraries such as Pynapple and others could broaden the toolkit and reduce duplication of effort.
Here we clearly failed to explain that we have integrated other libraries, including Pynapple. We now make this clear in the Results section:
Our goal was take advantage of other open source packages, and we have therefore integrated support for Pynapple [21], a general purpose neural data analysis package. We also built our pipelines to take advantage of other community-developed, open-source packages, like GhostiPy [20], SpikeInterface [19], DeepLabCut [2] and Moseq [29].
We also have added a specific reference to the relevant function call in the Practical use cases and extensions section:
For example, the user can conveniently read specific data types from the NWB file by first ingesting it into Spyglass and accessing database tables with Spyglass functions (e.g. fetch_nwb) or even load those objects in a format compatible with Pynapple [21] (fetch_pynapple).
Pynapple support is actually aided by our design choice of relying on NWB. Because NWB files can be loaded by Pynapple, any analysis that uses a NWB file that can be read by Pynapple can be loaded as a Pynapple object. We have provided methods to do so.
(3) Experimental metadata support:
While NWB provides a solid foundation for storing neurophysiology data streams, it still lacks broad and standardized support for experimental metadata, including descriptions of conditions, subject details, and procedures, as well as links across datasets. This limitation constrains one of Spyglass's key promises: enabling reproducible, crosslaboratory science. The authors should clarify how Spyglass plans to address or mitigate this gap - for example, by adopting or contributing to metadata extensions, providing templates for experimental conditions, or integrating with complementary systems that manage metadata across datasets.
This is an important point. First, NWB provides methods for creating new metadata extensions, and our laboratory has contributed to multiple such extensions and have adopted metadata extensions as they come to exist (for example, we are currently integrating the ndx-pose extension, which has broader support for pose estimation algorithms such as DLC and SLEAP, enabling us to capture relationships between body parts). These extensions, once incorporated into NWB, make it easy to create parallel Spyglass tables that read in the associated metadata. Second, we note that by storing the metadata from the NWB file in a database, Spyglass naturally supports searches across datasets where the metadata is the same (e.g. all the datasets from a given subject or using a given behavioral apparatus).
That said, for these searches to be easy, the underlying NWB files need to use the same ontologies (naming systems). Creating shared naming systems within and across labs is very challenging, but even here having a database helps greatly, as it provides a way to find all the names used for a given field and to thereby make an effort to standardize them.
Finally, while Spyglass aims to enable reproducibility, it will not be possible to solve all standardization issues of the field. We believe that Spyglass is an important step forward in standardization and reproducibility in that it encourages users to use the same data format and processing. To our knowledge, there is no software like it in the field of systems neuroscience. Limitations of the field and of current progress does not invalidate the contribution of Spyglass as a framework.
We now mention all these issues in the Limitations section of the Discussion.
(4) Cross-laboratory interoperability:
While demonstrated across two datasets, the manuscript does not fully address how Spyglass will handle the diversity of metadata standards, acquisition systems, and labspecific practices that remain major obstacles to reproducibility.
We agree that the current version of Spyglass does not fully address this diversity. Neverless, we note that the NWB standard is increasingly widely adopted in our field, and that by building on this standard, it is much similar to create structures that store relevant data across labs.
(5) Visualization limitations:
Beyond the export system and Figurl, NWB offers relatively few options for interactive data exploration. The ability to explore data flexibly and discover new phenomena remains limited, which constrains one of the potential strengths of standardized pipelines.
We agree that there are many other tools, and we have considered additional integrations. We have chosen not to proceed in this direction because the various visualization tools are well constructed, and therefore already easy to use with data retrieved from Spyglass. Thus, users can choose to use Matplotlib, Seaborn, or any of many other visualization tools and apply thos to data accessed through Spyglass without the need for more explicit integration.
Spyglass is well-positioned to become a community framework for reproducible neuroscience workflows, with the potential to set new standards for transparency and data sharing. With expanded modality coverage, tighter integration of existing community tools, stronger solutions for cross-lab interoperability, and richer visualization capabilities, it could have a transformative impact on the field.
We appreciate this summary and will continue to try to make Spyglass more powerful, generalizable, and accessible to the community.
Reviewer #2 (Recommendations for the authors):
(1) Documentation/User onboarding:
While extensive documentation exists, new users may feel overwhelmed. A single Quickstart or "golden path" guide and a one-command validation script would substantially improve usability.
As mentioned in the response to reviewer 1, we have added an interactive quickstart program to walk users through installation and setup (scripts/install.py) and validate the install (scripts/validate.py). This should greatly reduce the complexity of the set-up process and allow new users to use Spyglass quickly and confidently. We thank the reviewer for the suggestion.
(2) Permission handling and multi-user scaling:
Current ad hoc solutions (like cautious deletes) may not scale well in large collaborations. This should be acknowledged, but it is not a fatal weakness given the framework's early stage.
This is a fair point and we now mention this when cautious delete is introduced in the Methods:
Though this is not a formal permission-management system, it serves to prevent accidental deletions. We note that this system does incur additional overhead, and while that has not been an issue for us, it is possible that this would become problematic in use for much larger cross-laboratory collaborations.
(3) Benchmarking and performance evaluation:
"More systematic testing (e.g., reproducibility across independent users, computational efficiency) would be reassuring, but the lack of it does not invalidate the proof-of-principle demonstration. "
We agree. So far at least two other labs have adopted this system and we are working with a consortium funded by the Simons Foundation to use Spyglass as a data sharing system across a larger number of labs.
(4) Support for Cloud solution:
To lower the barrier to adoption, the authors should consider cloud integration, such as preconfigured Docker/Cloud templates or hosted options, so end-users do not need to maintain databases and storage locally.
We agree that cloud-based solutions could be a good option for some labs, although we note that the cost of cloud-based computing can be very high. There is also the burden of moving and storing the data to where it needs to be processed, which can be particularly time intensive with the large-scale data being generated by many laboratories.
At the reviewer’s suggestion, we have added a docker-compose support to lower the barrier to adoption. This includes:
docker-compose.yml with health checks and persistent storage
.env.example configuration template
This allows one-command database setup: `docker compose up –d`
(5) Integration of greater modalities:
The authors should consider expanding support to other major data types, particularly calcium imaging, photometry, and other optical physiology data.
We entirely agree that pipelines to ingest and process these datatypes would be very valuable, and we would welcome collaborations with experts and the general community to build these pipelines. We are, for example, working with a collaborating lab on a photometry pipeline. However, we only have so many people to build and maintain Spyglass, so we are limited by the capacity and expertise of our developers.
(6) Integrate more community tools:
Closer integration with community tools such as Pynapple, Neurosift, and SpikeInterface would broaden functionality and position Spyglass as a hub rather than a parallel ecosystem.
As we mentioned in our responses to Reviewer 1, we entirely agree, and in fact we have already integrated Pynapple support into Spyglass. Because we store files in the NWB format and Pynapple supports NWB, it was easy for us to convert any data we have into the Pynapple format upon request, thus making it easily analyzable by the Pynapple package. Moreover, we use SpikeInterface for the SpikeSorting pipline, and similarly provide pipelines built on other open source projects. As we now clarify in the text:
Spyglass includes pipelines for a diverse range of analysis tasks in systems neuroscience, such as the analysis of LFP, spike sorting, video and position processing, and fitting state-space models for decoding neural data. Tutorials for all pipelines are available on the Spyglass documentation website (Table 1). Our goal was take advantage of other open source packages, and we have therefore integrated support for Pynapple [21], a general purpose neural data analysis package. We also built our pipelines to take advantage of other community-developed, open-source packages, like GhostiPy [20], SpikeInterface [19], DeepLabCut [2] and Moseq [29].
(7) Direct Dandi archive upload functionality:
Scripts and tutorials for uploading data directly from Spyglass to DANDI, with validation of metadata completeness, would provide users with a direct pipeline from raw data to a public archive.
The tutorials for DANDI upload are included as part of the export tutorial notebook (https://lorenfranklab.github.io/spyglass/latest/notebooks/05_Export/). We agree that this was not apparent from the manuscript before and have noted this within the Manuscript table describing these notebooks.
What used to take reps 5-6 hours a week now runs automatically in the background on every deal.
这是一个具体的效率提升数据,显示工作空间代理可以将销售代表每周5-6小时的工作自动化。这相当于每周节省约12.5%-15%的工作时间,是一个显著的效率提升,特别是在销售团队中。
Scientific American has served as an advocate for science and industry for 180 years, and right now may be the most critical moment in that two-century history.
180年的机构历史提供了重要背景,但'most critical moment'的主观判断缺乏量化依据。这种表述反映了媒体对当前科学重要性的强调,但需要具体数据支持这一历史性断言,例如科学资金、论文数量或政策变化的量化指标。
Lichtman is hopeful because ChatGPT's discovery validates a sense he's had since graduate school. 'I had the intuition that these problems were kind of clustered together and they had some kind of unifying feel to them,' he says.
这里提供了专业数学家的直觉判断,但缺乏量化数据支持。'clustered together'和'unifying feel'是模糊表述,无法验证。这反映了数学研究中直觉的重要性,同时也显示了当前AI辅助研究在提供可验证证据方面的局限性。
The LLM took an entirely different route, using a formula that was well known in related parts of math, but which no one had thought to apply to this type of question.
这里暗示了AI的创新性在于跨领域应用已知公式,而非创造全新数学。'well known'的表述表明这不是突破性发现,而是应用方式的创新。这种'组合创新'可能是AI在数学领域的主要贡献方式,需要更多关于具体公式和应用案例的数据支持。
The duo had jump-started the AI-for-Erdős craze late last year by prompting a free version of ChatGPT with open problems chosen at random from the Erdős problems website.
时间点'late last year'表明这种现象已持续数月,不是一时兴起。'随机选择'的方法暗示了大规模AI辅助数学探索的潜力,但文章未提供具体解决了多少问题或成功率,这些数据缺失限制了我们对AI数学能力的全面评估。
Erdős also noticed that the score drops if all of a set's numbers are large—the larger the numbers, the less large the score could become. He guessed that as the set's numbers approached infinity, the maximum score would drop to exactly one.
这个数据点提供了具体的数学预测值'1',这是一个精确的量化结果。当数字趋近于无穷大时,分数降至1的预测展示了数学中的极限概念,这是AI可能帮助验证的精确数学命题。'exactly one'的表述强调了数学的精确性。
Erdős also came up with the Erdős sum, a 'score' you can calculate for any primitive set. He showed that the sum had a maximum possible value—and conjectured that this value must hold only for the set of all prime numbers.
这里提供了数学概念的具体量化指标。'最大可能值'的表述暗示了有明确的数学界限,但文章未提供具体数值。这反映了数学中某些概念虽然可量化,但具体数值可能需要更专业的数学背景才能理解,体现了数学研究的抽象性。
Smaller pieces force the model to pay closer attention to each word, like reading a contract word by word instead of skimming paragraphs.
大多数人认为更智能的AI会以更高效的方式处理信息,但作者指出,为了提高精确度,先进模型实际上需要更细致地处理每个词单元,这违背了人们对'智能'通常意味着'更高效率'的直觉认知。
Then Opus 4.7 shipped & the smarter model became much more expensive. The cause : a new tokenizer
大多数人认为AI模型变贵主要是因为能力提升,但作者揭示了一个反直觉的原因:更精确的分词器(tokenizer)导致需要处理更多token,从而使更智能的模型反而变得更贵。这挑战了'能力提升导致成本上升'的简单归因。
Opus 4.5 costs 67% more than Sonnet. But Opus 4.5 used 76% fewer tokens to reach the same outcome.
大多数人认为单位成本更高的模型总使用成本也会更高,但作者通过具体数据展示,尽管Opus 4.5的单token成本高出67%,但由于其效率大幅提升,实际完成任务的总成本反而降低了60%。这挑战了简单的线性成本思维。
When Anthropic launched Opus 4.5 in November 2025, the bigger, more expensive model was actually cheaper to use.
大多数人认为更先进的AI模型必然更昂贵,但作者指出Claude Opus 4.5作为更大、更先进的模型实际上使用成本更低。这挑战了'先进=昂贵'的普遍认知,展示了AI效率提升可能带来的成本反直觉现象。
The agent interprets new information and adapts the logic. The engine applies that logic continuously and emits precise updates.
大多数人认为AI代理应该完全负责从数据收集到决策执行的整个流程。但作者提出颠覆性的观点:AI应该专注于逻辑解释和适应,而将执行和持续评估交给专门的数据库引擎。这种分工模式挑战了当前AI代理应该全能化的主流认知。
Agents and CDC streams are powerful together because they split the work well.
大多数人可能认为AI代理应该独立完成所有任务,包括数据获取和处理。但作者提出反直觉的分工模式:AI专注于逻辑解释和适应,而数据库引擎专注于持续评估和精确更新。这种分工挑战了当前AI代理应该端到端处理所有任务的主流观点。
The fix is not smarter prompts. It is software built to meet agents halfway.
大多数人认为提高AI性能的关键在于更好的提示工程或更智能的模型。但作者认为解决方案在于重新设计软件架构,使其与AI代理更好地协作,而不是继续改进AI本身。这是一个颠覆性的观点,挑战了当前AI开发的主流方向。
Today's agents, the copilots, the chatbots are designed to be human like.
大多数人认为AI助手应该模仿人类的交流方式,以便更好地与人类协作。但作者认为这种设计是错误的,因为它增加了认知负荷,违背了'平静技术'的理念。作者暗示AI应该更像是背景工具,而不是虚拟同事。
The FBI Internet Crime Complaint Center logged 2.3 billion dollars in losses for victims aged 60 and over in calendar year 2026.
60岁以上受害者在2026年损失高达23亿美元,这是一个惊人的数字。这表明老年群体是语音合成攻击的主要目标,他们可能更容易被紧急冒充电话所欺骗。这一数据强调了针对特定人群的网络安全教育的必要性。
The Wall Street Journal reported in February 2026 that high-quality voice cloning now requires roughly fifteen seconds of clean reference audio for tools available off the shelf.
15秒的干净参考音频是高质量语音克隆的门槛,而Mercor泄露的数据平均每个承包商有2-5分钟的录音,远超过这一阈值。这意味着攻击者可以使用泄露的数据创建非常逼真的语音克隆,大大增加了数据被滥用的风险。
According to the leaked sample index, the archive covers more than 40,000 contractors who signed up to label data, record reading passages, and run through verification calls for AI training.
40,000名承包商受到影响,这是一个相当大的数字。考虑到每个承包商提供了2-5分钟的录音,总录音时长可能达到80,000-200,000分钟,即约1,333-3,333小时。这个规模的数据泄露可能影响数百万最终使用这些AI系统的用户。
The dump is reported at roughly four terabytes and bundles a payload that breach analysts have been warning about for two years: voice biometrics paired with the same person's government-issued identity document.
4TB的数据量表明这是一个大规模的数据泄露事件,相当于约100万首歌曲的音频数据。将语音生物识别与政府签发的身份文件配对是特别危险的组合,因为攻击者可以同时获得声音克隆的素材和身份验证的凭证。这种组合大大增加了数据被武器化的可能性。
Meanwhile, in reality, the only 'official' MeshCore is the github repo. It's the source of truth in terms of what is MeshCore, and Andy has never contributed to that.
大多数人认为拥有商标或域名的人自然拥有项目的'官方'地位,但作者坚持只有GitHub仓库才是真正的'官方'来源,这挑战了知识产权与项目官方身份之间的常规认知。
Since inception, the MeshCore development team have been working hard to build MeshCore. We've released more than 85 versions of the MeshCore Companion, Repeater and Room Server firmwares with support for more than 75 hardware variants. All of this has been hand crafted, by humans.
在当今AI辅助编程盛行的时代,大多数人认为利用AI工具加速开发是理所当然的,但MeshCore团队坚持所有代码都是手工编写,这挑战了软件开发行业的效率优先共识。
Andy Kirby did do an amazing job helping to promote the MeshCore project on his personal YouTube, but only promotes his own products now.
大多数人认为项目贡献者应该持续推广整个项目生态系统,但作者暗示Andy从推广整个项目转向仅推广自己的产品,这种转变在开源社区中是罕见的,通常不被视为最佳实践。
We have always been wary of AI generated code, but felt everyone is free to do what they want and experiment, etc.
大多数人认为在软件开发中使用AI工具是提高效率和创新的合理方式,但作者团队明确表示他们一直对AI生成的代码持谨慎态度,这反映了在开源社区中对AI代码质量控制的非主流立场。
Claude Code has led to a large increase in Show HN projects. So much, that the moderators of HN had to restrict Show HN submissions for new accounts.
大多数人认为AI工具提高了生产力,但作者将其与内容泛滥和平台限制直接关联,暗示AI不仅提高了数量还可能损害了社区质量。这种观点挑战了'AI总是进步'的乐观叙事,提出了技术应用的负面后果。
I guess people will get back to crafting beautiful designs to stand out from the slop. On the other hand, I'm not sure how much design will still matter once AI agents are the primary users of the web.
大多数人认为设计始终对用户体验至关重要,但作者质疑当AI成为主要网络用户时设计的重要性,这挑战了设计行业的核心假设。这一观点暗示设计可能从面向人类转向面向AI,彻底改变设计价值链。
Is this bad? Not really, just uninspired. After all, validating a business idea was never about fancy design, and before the AI era, everything looked like Bootstrap.
大多数人认为AI生成的设计是'坏的设计',但作者认为这只是'缺乏灵感',将其与Bootstrap时代相提并论,暗示这种设计平庸化是技术发展的自然循环而非灾难性退步。这种观点挑战了我们对设计价值的传统认知。
The good world is where everyone has AI, and not as a revokable privilege through an API, but through hard possession.
大多数人可能认为通过API访问AI是民主化和可扩展的方式,但作者认为真正的AI民主化应该是通过硬所有权(hard possession),挑战了当前AI服务的主流商业模式。
It works for Mars. I think there's so much value in colonizing Mars, and it's sad to me to see SpaceX diluting the mission buying up random AI bubble crap.
大多数人可能认为AI和太空探索都是值得追求的目标,但作者认为这两者存在冲突,暗示SpaceX在AI领域的投资分散了其火星殖民的核心使命,挑战了科技多元化发展的共识。
I can hear the rabid Elon fan defending him about Tesla patents or the Twitter algorithm or something, but those are not serious open source projects.
大多数人认为埃隆·马斯克的开源贡献(如特斯拉专利)是值得称赞的,但作者认为这些并非真正的开源项目,暗示马斯克的开源承诺是表面性的,与真正的开源精神(如Linux和Kubernetes)有本质区别。
Even the ideal version, industrial megaprojects at hyperhuman scale while constantly being out over your skis with leverage sounds hellish.
大多数人认为大型AI项目和工业规模的发展是进步和繁荣的象征,但作者认为这种超人类规模的项目听起来像是地狱般的体验,因为它可能导致过度杠杆化和不可持续的压力。