Australian
in fact, employers around the world (not just Australia)..
Australian
in fact, employers around the world (not just Australia)..
George Berkeley: A Treatise Concerning the Principles of Human Knowledge<br /> by Tod Desmond
Four important questions:<br /> - What can I know?
Berkeley believes in two things: ideas and the minds that perceive them.
"manifest contradiction"
Lucretius: things are made of atoms<br /> Berkeley: there are only ideas (and no matter)
Where do ideas and minds separate? where do they connect? how are they different from each other?
primary qualities versus secondary qualities
Plato's theory of absolute ideas<br /> - he rejects matter - GB: we can't separate primary and secondary qualities in our minds
How does matter interact with mind?
Visualization is central to scientific discovery, yet authoring tools remain split between information and scientific visualization,and expertise in one rarely transfers to the other.
Cory Doctorow. The ‘Enshittification’ of TikTok. Wired, 2023. URL: https://www.wired.com/story/tiktok-platforms-cory-doctorow/ (visited on 2023-12-10).
This was really interesting, as I've noticed this concept in alot of games aswell. Around a year or two ago, Clash Royale was booming. However, supercell, the creator of the game, started being greedier and greedier. It started with price increases, new features locked behind paywalls, and no quality of life updates. The once huge player base was bleeding once this got out of control, and now the games player numbers are back down again, mostly because of that greed. This is similar to the Enshittification of Tiktok.
PQ3C — P(HLI abandons WELLBY within 3 years)
give the full question language, and hyperlink the question in context (tooltip if long)
PQ1A: What is your probability that linear WELLBY comparisons are reliable enough for comparing interventions in LMICs? Respondents gave a central estimate (0–100%) and a 90% credible interval.
Note -- I did not intent to have CIs over probabilities. This was an artifact of a changed question and vibe coding. Also investigate whether this was the wording of the question when participants answered it
So, what Meta does to make money (that is, how shareholders get profits), is that they collect data on their users to make predictions about them (e.g., demographics, interests, etc.). Then they sell advertisements, giving advertisers a large list of categories that they can target for their ads. The way that Meta can fulfill their fiduciary duty in maximizing profits i
I've heard about this business model from Meta before, and I find it to be the symbol of user privacy violations. Meta's main practice, their main goal, is to gather this user data, make predictions, and then sale the ad space to certain advertisers for a targeted audience (from my interpretations). That process needs all this data to be compiled, swept through and more importantly stored. With this data stored, it means it can be stolen. Additionally, it means that they are activley surveying you, with every action you have on the platform (typically). Users arent really aware of this. I think its wrong, but at the end of the day I don't really blame the business. Should be more regulation to prevent this from happening.
Adolescence (12 years to adulthood)
Adolescence can be broken down to three categories; Early Adolescence is from 10-13 Middle Adolescence is from 14-17 and Late Adolescence/ Emerging Adulthood 18-24.
With that being said, the World Health Organization classifies the age of adolescents from 10-19.
http://mytypewriter.com/hello-qwerty-typewriter-keyring-pliers-kit
Charles Gu at MyTypewriter.com is selling new typewriter keyring plie0rs!
URL changed to https://mytypewriter.com/products/hello-qwerty-typewriter-keyring-pliers-kit
ᔥ[[Typewriter Chicago]] in Type Shop, Ep. 15: The Ultimate Keyring Toolset Guide at 2022-12-29<br /> (accessed:: 2024-07-08 08:23:36)
A recent study from Columbia University found that we’re bogged down by more than 70 decisions a day. The sheer number of decisions we have to make each day leads to a phenomenon called decision fatigue ,
I agree with this idea. It’s easy to underestimate how many choices we make every day, but once you really think about it, it becomes exhausting. From picking out clothes, to deciding what to eat, to even choosing which email to answer first, all those small decisions build up over time. By the end of the day, I often feel mentally worn out, like my mind has no energy left. I’ve noticed that when I spend the whole day making constant decisions, I’m more likely to make errors or put things off because I feel too drained to think anymore. It’s almost like my brain has completely run out of fuel.
New "Hiring Workers" Views —
Arrival Cost Tracking Cost fields required for each worker's arrival, including amounts paid to worker or MTL [Citation][Citation] Always linked to current employer for the season they're being hired [Citation][Citation] Employer-specific view needed showing all arrival costs for their workers in a consolidated format [Citation] Cost may vary based on travel method (flight, driving, self-arranged) and included services (baggage, agent fees, embassy fees) [Citation][Citation][Citation]
Arrange for flights
So we need the fields for the arrival, for the money amounts to be placed in there. And that money amount could be paid to the worker. Or it could be paid to MTL based on how you specify when you are entering the data.
So, the employers will have views for other things as well, for the workers they're hiring, so they will also have a view, which may be the same view as they have for some of the other information, or it could be a completely dedicated view, just for the cost part of it.
So we will figure it out as we go forward, but they will have the information one way or another, whether it's a combined view with something else, or it's a dedicated view just for the cost. But we need an option for you to enter the arrival cost data and specify who it should be paid to, and for the employer to be able to see it in one place under their profile. Right. So that's for arrival. Am I right so far?
Then you get to enter that information, the cost information in the departure fields. If you said something else, like they're getting hired by another organization that MTL doesn't work with, or MTL hired the same person for another client for the next season.
Instead, you have to do what you did for this client, but for the other client for the new season, which is arrival information.
And this doesn't show up for the current client, it shows up for the new client as arrival cost and arrival information, all of that.
Priorities for local immunotherapy research and drug development
This article is part of the special JITC series: The Role of Local Immunotherapy in the Treatment of Cancer
Local immunotherapy in the neoadjuvant treatment of cancer: optimizing efficacy while limiting toxicity?
This article is part of the special JITC series: The Role of Local Immunotherapy in the Treatment of Cancer
Local immunotherapy for the treatment of cancer: scientific advances and clinical potential
This article is part of the special JITC series: The Role of Local Immunotherapy in the Treatment of Cancer
hurches and their leaders were in many ways of increasing importance to post-warsocieties confronting the implications of the emerging Cold War and the advent ofnuclear weapons with their potential to destroy God’s creation. Interjections by Christianleaders in ethical and political controversies were sought by the public and takenseriously by politicians and the media
Slay - with the rise of mass politics, many participated in religion through activism, opposing things like nuclear weapons as a result of their christian beliefs
The Second World War, coming as it did afterthe mass industrial slaughter of the Great War, followed by chronic economic depressionand political instability, gave added urgency to the general tendency within the Christianchurches since the nineteenth century to respond to the socio-economic, cultural,political and ideological challenges of modernity.
slay!
eLife Assessment
This study provides valuable mechanistic insight into the mutually exclusive distributions of the histone variant H2A.Z and DNA methylation by testing two hypotheses: (i) that DNA methylation suppresses H2A.Z deposition by ATP-dependent chromatin remodelling complexes, and (ii) that DNA methylation destabilizes H2A.Z nucleosomes, thereby preventing H2A.Z retention. Through a series of well-designed and carefully executed experiments, solid support is presented for the first hypothesis. The evidence supporting the second hypothesis is less complete, and the extent to which either mechanism is responsible for H2A.Z exclusion from methylated DNA remains not entirely clear. This work will be of broad interest to researchers in chromatin biology and epigenetics.
Reviewer #1 (Public review):
Summary:
The authors considered the mechanism underlying previous observations that H2A.Z is preferentially excluded from methylated DNA regions. They considered two non-mutually exclusive mechanisms. First, they tested the hypothesis that nucleosomes containing both methylated DNA and H2A.Z might be intrinsically unstable due to their structural features. Second, they explored the possibility that DNA methylation might impede SRCAP-C from efficiently depositing H2A.Z onto these DNA methylated regions.<br /> Their structural analyses revealed subtle differences between H2A.Z-containing nucleosomes assembled on methylated versus unmethylated DNA. To test the second hypothesis, the authors allowed H2A.Z assembly on sperm chromatin in Xenopus egg extracts and mapped both H2A.Z localization and DNA methylation in this transcriptionally inactive system. They compared these data with corresponding maps from a transcriptionally active Xenopus fibroblast cell line. This comparison confirmed the preferential deposition or enrichment of H2A.Z on unmethylated DNA regions, an effect that was much more pronounced in the fibroblast genome than in sperm chromatin. Furthermore, nucleosome assembly on methylated versus unmethylated DNA, along with SRCAP-C depletion from Xenopus egg extracts, provided a means to test whether SRCAP-C contributes to the preferential loading of H2A.Z onto unmethylated DNA.
Strengths:
The strength and originality of this work lie in its focused attempt to dissect the unexplained observation that H2A.Z is excluded from methylated genomic regions.
Weaknesses:
The study has two weaknesses. First, although the authors identify specific structural effects of DNA methylation on H2A.Z-containing nucleosomes, they do not provide evidence demonstrating that these structural differences lead to altered histone dynamics or nucleosome instability. Second, building on the elegant work of Berta and colleagues (cited in the manuscript), the authors implicate SRCAP-C in the selective deposition of H2A.Z at unmethylated regions. Yet the role of SRCAP-C appears only partial, and the study does not address how the structural or molecular consequences of DNA methylation prevent efficient H2A.Z deposition. Finally, additional plausible mechanisms beyond the two scenarios the authors considered are not investigated or discussed in the manuscript.
Comments on revisions:
The authors have addressed all previously raised concerns and propose a revised version of the manuscript. Notably, the abstract and discussion sections have been improved, and new experimental data have been incorporated. Collectively, these revisions enhance the rigor and clarity of the data interpretation and discussion.
Given these improvements, this reviewer believes that the manuscript could be published, particularly if this publication is accompanied by the critical points discussed in the rebuttal letter.
Reviewer #2 (Public review):
This manuscript aims to elucidate the mechanistic basis for the long-standing observation that DNA methylation and the histone variant H2A.Z occupy mutually exclusive genomic regions. The authors test two hypotheses: (i) that DNA methylation intrinsically destabilizes H2A.Z nucleosomes, thereby preventing H2A.Z retention, and (ii) that DNA methylation suppresses H2A.Z deposition by ATP-dependent chromatin-remodelling complexes. The revised manuscript addresses a number of previous concerns, and the manuscript has therefore improved accordingly. However, several limitations remain.
Comments on revisions:
The authors have addressed a number of my previous concerns, and the manuscript has improved accordingly. However, several limitations remain that, in my view, constrain the strength of the conclusions. In particular, the absence of a direct comparison with a canonical nucleosome assembled on the same DNA template. This control is essential to determine whether the observed effects are specific to H2A.Z or reflect more general properties of methylated DNA-nucleosome interactions. Notably, even within the authors' own data, there is a trend suggesting that methylated canonical H2A nucleosomes may also exhibit increased accessibility. Although this does not reach statistical significance, the authors themselves argue that subtle differences can be biologically meaningful; it is therefore plausible that extended digestion conditions (e.g., longer HinfI exposure) could reveal a significant effect. Unless a direct structural comparison with a canonical nucleosome is performed, the possibility that the reported phenomenon is not specific to H2A.Z remains. This is compounded by the reliance on a single restriction enzyme-based assay, which represents a limited experimental approach. Such an approach is insufficient to unequivocally support the central claim that DNA methylation increases accessibility of H2A.Z-containing nucleosomes. Additional orthogonal assays would be required to substantiate this conclusion. With respect to the cryo-EM analysis of methylated and unmethylated 601L H2A.Z nucleosomes, and in general, the authors still do not adequately consider the positional context of CpG methylation. Extensive literature demonstrates that the effects of DNA methylation on canonical nucleosome structure and stability are highly position-dependent. Without accounting for the location of methylated CpGs relative to key DNA-histone contact sites, the structural data remain difficult to interpret mechanistically. Overall, while the manuscript has improved, it remains a relatively limited study that draws broad mechanistic conclusions from a minimal experimental data.
Reviewer #3 (Public review):
Summary:
Histone variant H2A.Z is evolutionarily conserved among various species. The selective incorporation and removal of histone variants on the genome play crucial roles in regulating nuclear events, including transcription. Shih et al. aimed to address antagonistic mechanisms between histone variant H2A.Z deposition and DNA methylation. To this end, the authors reconstituted H2A.Z nucleosomes in vitro using methylated or unmethylated human satellite II DNA sequence and examined how DNA methylation affects H2A.Z nucleosome structure and dynamics. The cryo-EM analysis revealed that DNA methylation induces a more open conformation in H2A.Z nucleosomes. Consistent with this, their biochemical assays showed that DNA methylation subtly increases restriction enzyme accessibility in H2A.Z nucleosomes compared with canonical H2A nucleosomes. The authors identified genome-wide profiles of H2A.Z and DNA methylation using genomic assays and found their unique distribution between Xenopus sperm pronuclei and fibroblast cells. Using Xenopus egg extract systems, the authors showed SRCAP complex, the chromatin remodelers for H2A.Z deposition, preferentially bind to unmethylated DNA to deposit H2A.Z.
Strengths:
The experiments are rigorously performed, and interpretations are clear. The study presents a high-resolution cryo-EM structure of human H2A.Z nucleosome with methylated DNA. Although the effect of DNA methylation on the physical stability of the H2A.Z nucleosome is subtle, this would be important finding that warrants further functional investigation. The discovery that the SRCAP complex senses DNA methylation is novel and provides important mechanistic insight into the antagonism between H2A.Z and DNA methylation.
Weaknesses:
The authors have satisfactorily addressed my concerns.
Author response:
The following is the authors’ response to the current reviews.
Reviewer #1.
We appreciate the constructive comments, which greatly improved this manuscript.
Reviewer #2.
We appreciate Reviewer #2's thorough analysis of our manuscript. However, we are concerned that the reviewer criticized a conclusion different from the one we claim in the manuscript. Although Reviewer #2's public comment stated, "Such an approach is insufficient to unequivocally support the central claim that DNA methylation increases accessibility of H2A.Z-containing nucleosomes", we did not draw such a bold conclusion. In the Abstract, we cautiously described that the impact of DNA methylation we observed was subtle and based on satellite II-derived DNA sequences. We made a nuanced proposal regarding this observation, stating, "Altogether, we propose that SRCAP drives the biased association of H2A.Z to unmethylated DNA, while additional mechanisms, potentially taking advantage of the subtle DNA methylation-induced physical effects, further assist the exclusion of H2A.Z from methylated DNA". We believe our analysis will contribute valuable insights into the mechanistic basis behind the antagonism between DNA methylation and H2A.Z.
Reviewer #3.
We appreciate the constructive comments, which greatly improved this manuscript.
The following is the authors’ response to the original reviews.
eLife Assessment
This study provides valuable mechanistic insight into the mutually exclusive distributions of the histone variant H2A.Z and DNA methylation by testing two hypotheses: (i) that DNA methylation destabilizes H2A.Z nucleosomes, thereby preventing H2A.Z retention, and (ii) that DNA methylation suppresses H2A.Z deposition by ATP-dependent chromatin remodeling complexes. Through a series of well-designed and carefully executed experiments, findings are presented in support of both hypotheses. However, the evidence in support of either hypothesis is incomplete, so that the proposed mechanisms underlying the enrichment of H2A.Z on unmethylated DNA remain somewhat speculative.
We would like to thank the editor and reviewers for their critical assessments of our manuscript. While we do acknowledge the limitations of our work, we believe that our results provide important mechanistic insights into the long-standing question of how H2A.Z is preferentially enriched in hypomethylated genomic DNA regions. First, our structural and biochemical data suggest that DNA methylation increases the openness and physical accessibility of H2A.Z, albeit the effect is relatively subtle and is sequence-dependent. Second, using Xenopus egg extracts and synthetic DNA templates, we provide the first clear and direct evidence that DNA methylation-sensitive H2A.Z deposition is due to the H2A.Z chaperone SRCAP-C, corroborated by our discovery that SRCAP-C binding to DNA is suppressed by DNA methylation. Although the molecular details by which DNA methylation inhibits binding of SRCAP-C is an important area of future study, in our current manuscript, we do provide evidence that directly links the presence of SRCAP-C to the establishment of the DNA methylation/H2A.Z antagonism in a physiological system. Thanks to criticisms by the reviewers, we realized that we did not clearly state in our Abstract that the impact of DNA methylation on intrinsic H2A.Z nucleosome stability is relatively subtle, although we did explain these observations and limitations in the main text. In our revised manuscript, we are willing to edit the text to better clarify the criticisms raised by the reviewers.
Public Reviews:
Reviewer #1 (Public review):
Summary:
The authors considered the mechanism underlying previous observations that H2A.Z is preferentially excluded from methylated DNA regions. They considered two non-mutually exclusive mechanisms. First, they tested the hypothesis that nucleosomes containing both methylated DNA and H2A.Z might be intrinsically unstable due to their structural features. Second, they explored the possibility that DNA methylation might impede SRCAP-C from efficiently depositing H2A.Z onto these DNA methylated regions.
Their structural analyses revealed subtle differences between H2A.Z-containing nucleosomes assembled on methylated versus unmethylated DNA. To test the second hypothesis, the authors allowed H2A.Z assembly on sperm chromatin in Xenopus egg extracts and mapped both H2A.Z localization and DNA methylation in this transcriptionally inactive system. They compared these data with corresponding maps from a transcriptionally active Xenopus fibroblast cell line. This comparison confirmed the preferential deposition or enrichment of H2A.Z on unmethylated DNA regions, an effect that was much more pronounced in the fibroblast genome than in sperm chromatin. Furthermore, nucleosome assembly on methylated versus unmethylated DNA, along with SRCAP-C depletion from Xenopus egg extracts, provided a means to test whether SRCAP-C contributes to the preferential loading of H2A.Z onto unmethylated DNA.
Strengths:
The strength and originality of this work lie in its focused attempt to dissect the unexplained observation that H2A.Z is excluded from methylated genomic regions.
Weaknesses:
The study has two weaknesses. First, although the authors identify specific structural effects of DNA methylation on H2A.Z-containing nucleosomes, they do not provide evidence demonstrating that these structural differences lead to altered histone dynamics or nucleosome instability. Second, building on the elegant work of Berta and colleagues (cited in the manuscript), the authors implicate SRCAP-C in the selective deposition of H2A.Z at unmethylated regions. Yet the role of SRCAP-C appears only partial, and the study does not address how the structural or molecular consequences of DNA methylation prevent efficient H2A.Z deposition. Finally, additional plausible mechanisms beyond the two scenarios the authors considered are not investigated or discussed in the manuscript.
Although we acknowledge the limitations of our study and are willing to expand our discussion to more thoroughly discuss these points, we believe our manuscript provides several important mechanistic insights which this reviewer may not have fully appreciated.
Our first conclusion that H2A.Z nucleosomes on methylated DNA are more open and accessible compared to their unmethylated counterparts is supported by both our cryo-EM study and the restriction enzyme accessibility assay. Although the physical effect of DNA methylation is relatively subtle and is likely sequence dependent, as we clearly noted within the manuscript, the difference does exist and is valuable information for the chromatin field at large to consider.
The second major conclusion of our manuscript is that SRCAP-C exhibits preferential binding to unmethylated DNA over methylated DNA, and that SRCAP-C represents the major mechanism that can explain the biased deposition of H2A.Z to unmethylated DNA in Xenopus egg extracts. Furthermore, our experiments using Xenopus egg extract clearly demonstrated that H2A.Z is deposited by both DNAmethylation sensitive and insensitive mechanisms. Depletion of SRCAP-C almost completely eliminated the levels of DNA-methylation-sensitive H2A.Z deposition and reduced the total level of H2A.Z on chromatin to less than half of that seen in non-depleted extract. This result demonstrated that DNA methylation-sensitive H2A.Z loading is primarily regulated by SRCAP-C, at least in our experimental context where transcription, replication, and other epigenetic modifications are not involved. It is likely that additional mechanisms do further contribute, implicated by our sequencing experiments, particularly at regions with active transcription, and we have noted these possibilities and the rationale for their existence in the Discussion.
Our study also suggests that a SRCAP-independent, DNA methylation-insensitive mechanism of H2A.Z loading exists, which we suspect to be mediated by Tip60-C. In line with this possibility, our data suggest that Tip60-C binds DNA in a DNA methylation-insensitive manner in Xenopus egg extract. Since antibodies to deplete Tip60-C from Xenopus egg extract are currently unavailable, we were unable to directly test that hypothesis and decided not to include Tip60-C into our final model as we lacked experimental evidence for its role. However, whether or not Tip60-C is the complex responsible for the DNA methylation-insensitive pathway does not influence our final conclusion that SRCAP-C plays a major role in DNA methylation-sensitive H2A.Z loading. We are planning to edit our manuscript to more comprehensively discuss these points.
Please note that while Berta et al reported that DNA methylation increases at H2A.Z loci in tumors defective in SRCAP-C, they selected those regions based off where H2A.Z is typically enriched within normal tissues (Berta et al., 2021). They did not show data indicating whether H2A.Z is still retained specifically at those analyzed loci upon mutation of SRCAP-C subunits. Thus, although we greatly admire their work and are pleased that many of our findings align with theirs, their paper did not directly address whether SRCAP-C itself differentiates between DNA methylation status nor the impact that has on H2A.Z and DNA methylation colocalization. In contrast, our Xenopus egg extract system, where de novo methylation is undetectable (Nishiyama et al., 2013; Wassing et al., 2024) offers a unique opportunity to examine the direct impact of DNA methylation on H2A.Z deposition using controlled synthetic DNA substrates. Corroborated with our demonstration that DNA binding of SRCAP-C is suppressed by DNA methylation, we believe that our manuscript provides a specific mechanism that can explain the preferential deposition of H2A.Z at hypomethylated genomic regions.
Reviewer #2 (Public review):
This manuscript aims to elucidate the mechanistic basis for the long-standing observation that DNA methylation and the histone variant H2A.Z occupy mutually exclusive genomic regions. The authors test two hypotheses: (i) that DNA methylation intrinsically destabilizes H2A.Z nucleosomes, thereby preventing H2A.Z retention, and (ii) that DNA methylation suppresses H2A.Z deposition by ATPdependent chromatin-remodelling complexes. However, neither hypothesis is rigorously addressed. There are experimental caveats, issues with data interpretation, and conclusions that are not supported by the data. Substantial revision and additional experiments, including controls, would be required before mechanistic conclusions can be drawn. Major concerns are as follows:
We appreciate the critical assessment of our manuscript by this reviewer. Although we acknowledge the limitations of our study and will revise the manuscript to better describe them, we would like to respectfully argue against the statement that our "conclusions […] are not supported by the data".
(1) The cryo-EM structure of methylated H2A.Z nucleosomes is insufficiently resolved to address the central mechanistic question: where the methylated CpGs are located relative to DNA-histone contact points and how these modifications influence H2A.Z nucleosome structure. The structure provides no mechanistic insights into methylation-induced destabilization.
The fact that the DNA resolution in the methylated structure was not high enough to resolve the positions of methylated CpGs despite a high overall resolution of 2.78 Å implies that 1) the Sat2R-P DNA was not as stably registered as the 601L sequence, requiring us to create two alternative Sat2R-P atomic models to account for the variable positioning in our samples, and 2) that the presence of DNA methylation increases that positional variability. We understand that one may prefer to see highly resolved density around each methylation mark, but we do believe that our inability to accomplish that is actually a feature rather than a weakness and has important biological implications. The decrease in local DNA resolution on the methylated Sat2R-P structure compared to its unmethylated counterpart is meaningful and suggests to us that DNA methylation weakens overall DNA wrapping and positioning on the nucleosome, supported by the increased flexibility seen at the linker DNA ends as well as an increase in the population of highly shifted nucleosomes amongst the methylated particles. Additionally, one major view in the DNA methylation/nucleosome stability field is that the presence of DNA methylation can make DNA stiffer and harder to bend, causing opening and destabilization of nucleosomes (Ngo et al., 2016). The increased opening of linker DNA ends and accessibility of methylated H2A.Z nucleosomes in our hands also aligns with such an idea, again suggesting decreased histone-DNA contact stability on methylated DNA substrates. We plan to revise the writing in our manuscript to better reflect these ideas.
The experimental system also lacks physiological relevance. The template DNA sequence is artificial, despite the existence of well-characterised native genomic sequences for which DNA methylation is known to inhibit H2A.Z incorporation. Alternatively, there are a number of studies examining the effect of DNA methylation on nucleosome structure, stability, DNA unwrapping, and positioning. Choosing one of these DNA sequences would have at least allowed a direct comparison with a canonical nucleosome. Indeed, a major omission is the absence of a cryo-EM structure of a canonical nucleosome assembled on the same DNA template - this is essential to assess whether the observed effects are H2A.Z-specific.
The reviewer raises a fair question about whether canonical H2A would experience the same DNA methylation-dependent structural effects. We had considered solving the H2A structures, however, ultimately decided against it for a few reasons. First, there already exists crystal structures of canonical H2A nucleosomes using a DNA sequence highly similar to our Sat2R-P with and without the presence of DNA methylation (PDB: 5CPI and 5CPJ). The authors of this study did not see any physical differences present in their structures (Osakabe et al., 2015). Additionally, we had included canonical H2A conditions within our restriction enzyme accessibility assay and did not see a significant impact of DNA methylation on those samples (Fig 3). Because of the previous report and our own negative data, we expected that only limited additional insights would be obtained from the canonical H2A structures and decided not to pursue that analysis.
One of the primary reasons we chose the Sat2R-P sequence was, as noted above, that there already was a published study examining how DNA methylation affects nucleosome structure using a variant of this sequence which we could compare to our results, as the reviewer has suggested. We did have to modify the sequence, namely by making it palindromic, in order to increase the final achievable resolution. We viewed the Sat2R-P sequence as an attractive candidate because it is physiologically relevant; the initial sequence was taken directly from human satellite II. Several modifications were made for technical reasons, including making the sequence palindromic as described above and also ensuring that each CpG is recognizable by a methylation-sensitive restriction enzyme so that we could be certain about the degree of methylation on our substrates. These practical concerns outweighed the necessity of maintaining a strict physiological sequence to us. However, we still believe the final Sat2R-P more closely mimics physiological sequences than Widom 601. Additionally, human satellite II is a highly abundant sequence in the human genome that is known to undergo large methylation changes on the onset of many disorders, like cancer, as well as during aging. Thus, there are interesting biological questions surrounding how the methylation state of this particular sequence affects chromatin structure.
Furthermore, it has been reported that satellite II is devoid of H2A.Z (Capurso et al., 2012). Beyond those reasons, the satellite II sequence is generally interesting to our lab because we have been studying genes involved in ICF syndrome, where hypomethylation of satellite II sequences forms one of the hallmarks of this disorder (Funabiki et al., 2023; Jenness et al., 2018; Wassing et al., 2024). We understand that sequence context plays a large role in nucleosome wrapping and stability. This is why we strived to test multiple sequences in each of our assays. We do agree that it would be interesting to use DNA sequences where H2A.Z binding has already been described to be affected in a DNA methylation-dependent manner, forming an exciting future study to pursue.
Furthermore, the DNA template is methylated at numerous random CpG sites. The authors' argument that only the global methylation level is relevant is inconsistent with the literature, which clearly demonstrates that methylation effects on canonical nucleosomes are position-dependent. Not all CpG sites contribute equally to nucleosome stability or unwrapping, and this critical factor is not considered.
We did not argue that only the global methylation level is relevant. We also would appreciate it if the reviewer could provide specific references that "clearly demonstrates that methylation effects on canonical nucleosomes are position-dependent". We are aware of a series of studies conducted by Chongli Yuan's group, including one testing the effect of placing methylated CpGs at different positions along the Widom 601 sequence. In that study (Jimenez-Useche et al., 2013), they did find that positioning of mCpGs has differential impacts on the salt resistance of the nucleosomes, with 5 tandem mCpG copies at the dyad causing the most dramatic nucleosome opening whereas having mCpGs only at the DNA major grooves, but not elsewhere, increased nucleosome stability. However, they did also find that methylation of the original Widom 601 sequence also caused destabilization, albeit to a lesser degree, and another study by the same group (Jimenez-Useche et al., 2014) also found that CpG methylation decreased nucleosome-forming ability for all tested variants of the Widom 601 sequence, regardless of CpG density or positioning.
Other studies monitored how distribution of methylated CpGs correlates with nucleosome positioning (Collings et al., 2013; Davey et al., 1997; Davey et al., 2004). However, these studies assessed the sequence-dependent effects specifically on nucleosome assembly during in vitro salt dialysis, which is a different physical process than the one our manuscript focuses on, especially when considering the fact that H2A.Z is deposited onto preassembled H2A-nucleosome. Our cryo-EM analysis examines the structural changes induced by DNA methylation on already formed nucleosomes rather than the process of formation. Thus, probing accessibility changes using a restriction enzyme was the more appropriate biochemical assay to verify our structures.
We do very much agree that DNA context can influence nucleosome stability under different conditions. A study of molecular dynamics simulations concluded that the "combination of overall DNA geometrical and shape properties upon methylation" makes nucleosomes resistant to unwrapping (Li et al., 2022), while another modeling study suggests that DNA methylation impacts nucleosome stability in a manner dependent on DNA sequence, where "[s]trong binding is weakened and weak binding is strengthened" (Minary and Levitt, 2014). While G/C-dinucleotides are preferentially placed at major groove-inward positions in the nucleosomes in vivo (Chodavarapu et al., 2010; Segal et al., 2006) and G/C-rich segments are excluded from major groove-outward positions in Widom 601-like nucleosomes (Chua et al., 2012), methylated CpG dinucleotides are preferably, if not exclusively, located at major groove-outward positions in vivo. Mechanisms behind this biased mCpG positioning on the nucleosome remain speculative, likely caused by a combination of multiple factors, but the fact that we did not observe clear structural impacts using the Widom 601L sequence, where mCpGs are located at the major groove-outward and -inward positions ((Chua et al., 2012) and our structure), deserves a space for discussion. On the other hand, positioning of mCpG on satellite II-derived sequences that we used in this study was based on a physiological sequence, and thus it may not be appropriate to say that those CpGs are placed at multiple "random" positions. Although we decided not to discuss the position of 5mC on our Sat2R nucleosome structure due to ambiguous base assignments, neither of our two atomic models is consistent with an idea that DNA methylation repositions the CpG to the outward major grooves. As the potential contribution of how DNA methylation affects the nucleosome structure via modulating DNA stiffness has been extensively studied (Choy et al., 2010; Li et al., 2022; Ngo et al., 2016; Perez et al., 2012), we believe that it is appropriate to consider overall DNA properties along the whole DNA sequence, though we are willing to discuss potential positional effects in the revised manuscript.
Perhaps one of the most important points that we did not emphasize enough in our original manuscript was that in contrast to the subtle intrinsic effect of DNA methylation that was DNA sequence dependent, we observed SRCAP-dependent preferential H2A.Z deposition to unmethylated DNA over methylated DNA in both 601 and satellite II DNAs. In the revised manuscript, we will make the value of comparative studies on 601 and satellite II in two distinct mechanisms.
Finally, and most importantly, the reported increase in accessibility of the methylated H2A.Z nucleosome is negligible compared with the much larger intrinsic DNA accessibility of the unmethylated H2A.Z nucleosome. These data do not support the authors' hypothesis and contradict the manuscript's conclusions. Claims that methylated H2A.Z nucleosomes are "more open and accessible" must therefore be removed, and the title is misleading, given that no meaningful impact of DNA methylation on H2A.Z nucleosome stability is demonstrated.
We respectfully disagree with this reviewer's criticism. We investigated the potential impact of DNA methylation on nucleosome stability to the best of our abilities through complementary assays and reported our observations. The effect of DNA methylation is smaller than the difference between H2A.Z and H2A, but we were able to see an effect. It is also not uncommon for small differences to have functional impacts in biological systems. We agree that further testing is required to determine whether this subtle effect is functionally important, and it remains the subject of future research due to the many technical challenges associated with addressing said question. We would like to note that 18 years have passed since Daniel Zilberman first reported the antagonistic relationship between H2AZ and DNA methylation (Zilberman et al., 2008) but very few studies have since directly tested specific mechanistic hypotheses. We believe that our study lays the groundwork for exciting future investigation that better elucidates the pathways that contribute to this antagonism and will have meaningful impacts on the field in general. However, thanks to the reviewer's criticism, we realized that we did not clearly state in the Abstract the relatively subtle effect of DNA methylation on the intrinsic H2A.Z nucleosome stability. Therefore, we will accordingly revise the Abstract to make this point clearer.
(2) The cryo-EM structures of methylated and unmethylated 601L H2A.Z nucleosomes show no detectable differences. As presented, this negative result adds little value. If anything, it reinforces the point that the positional context of CpG methylation is critical, which the manuscript does not consider.
We believe the inclusion and factual reporting of negative data is important for the scientific community as one of the major issues currently in biology research is biased omission of negative data. We considered eLife as a venue to publish this work for this reason. We understand that the reviewer believes our 601L structures may detract from the overall message of our manuscript. We believe this data rather emphasizes the importance of DNA sequence context, something that the reviewer also rightfully notes. It is standard practice in the nucleosome field to use the Widom 601 sequence, along with its variants. Our experience has shown that use of an artificially strong positioning sequence may mask weaker physical effects that could play a physiological role. Thus, we were careful to validate all further assays with multiple DNA sequences and believed it important to report these sequence-dependent effects on nucleosome structure.
(3) Very little H3 signal coincides with H2A.Z at TSSs in sperm pronuclei, yet this is neither explained nor discussed (Supplementary Figure 10D). The authors need to clarify this.
Our H3 signal, which represents the global nucleosome population, is more broadly distributed across the genome than H2A.Z, which is known to localize at specific genomic sites. Since both histone types were sequenced to similar read depths, H3 peaks are generally shallower than H2A.Z and peak heights cannot be directly compared (i.e. they should be represented in separate appropriate data ranges).
(4) In my view, the most conceptually important finding is that H2A.Z-associated reads in sperm pronuclei show ~43% CpG methylation. This directly contradicts the model of strict mutual exclusivity and suggests that the antagonism is context-dependent. Similarly, the finding that the depletion of SRCAP reduces H2A.Z deposition only on unmethylated templates is also very intriguing. Collectively, these result warrants further investigation (see below).
(5) Given that H2A.Z is located at diverse genomic elements (e.g., enhancers, repressed gene bodies, promoters), the manuscript requires a more rigorous genomic annotation comparing H2A.Z occupancy in sperm pronuclei versus XTC-2 cells. The authors should stratify H2A.Z-DNA methylation relationships across promoters, 5′UTRs, exons, gene bodies, enhancers, etc., as described in Supplementary Figure 10A.
We agree that the substantial presence of co-localized H2A.Z and DNA methylation specifically in the sperm pronuclei samples and the changes in pattern between nuclear types are highly interesting and require further investigation. However, we faced technical challenges in our sequencing experiments that made us refrain from conducting a more detailed analysis for fear of over-interpreting potential artifacts. These challenges mainly stemmed from the difficulties in collecting enough material from Xenopus egg extracts and Tn5’s innate bias towards accessible regions of the genome. Because of this, open regions of the genome tend to be overrepresented in our data (as noted in our Discussion), making it challenging to rigorously compare methylation profiles and H2A.Z/H3 associated genomic elements.
While the degree of separation seems to be dependent on nuclei type, we still believe the antagonism exists in both the sperm pronuclei and XTC-2 samples when comparing H2A.Z methylation profiles to the corresponding H3 condition. Our study also demonstrates that H2A.Z is preferentially deposited to hypomethylated DNA in a manner dependent of SRCAP-C (the loss of SRCAP only reduces H2A.Z on unmethylated substrates) but an additional methylation-insensitive H2A.Z deposition mechanism also exists. We realized that this interesting point was not clearly highlighted in Abstract, so we will revise it accordingly.
(6) Although H2A.Z accumulates less efficiently on exogenous methylated substrates in egg extract, substantial deposition still occurs (~50%). This observation directly challenges the strong antagonistic model described in the manuscript, yet the authors do not acknowledge or discuss it. Moreover, differences between unmethylated and methylated 601 DNA raise further questions about the biological relevance of the cryo-EM 601 structures.
As depicted in Figure 6 and described in the Discussion, we clearly indicated that both methylation-sensitive and methylation-insensitive pathways exist to deposit H2A.Z within the genome. We also directly stated in our Discussion that a substantial proportion of H2A.Z colocalizes with DNA methylation both in our study as well as in previous reports, which is of major interest for future study. Additionally, we further discussed how the absence of transcription in Xenopus eggs is a likely reason for the more limited effect of DNA methylation restricting H2A.Z deposition in our egg extract system.
As noted in our response to (2), the lack of a clear impact on our 601L structures implies that this is due to the extraordinarily strong artificial nucleosome positioning capacity of the 601 sequence and its variants. Since 601 is heavily used in chromatin biology, including within DNA methylation research, such negative data are still useful to include and publish.
(7) The SRCAP depletion is insufficiently validated i.e., the antibody-mediated depletion of SRCAP lacks quantitative verification. A minimum of three biological replicates with quantification is required to substantiate the claims.
We are willing to address this concern. However, please note that our data showed that methylation-dependent H2A.Z deposition is almost completely erased upon SRCAP depletion, indicating functionally effective depletion. The specificity of the custom antibody against Xenopus SRCAP was verified by mass spectrometry. Additionally, we have obtained the same effect using another commercially available SRCAP antibody, though we did not include this preliminary result in our original manuscript. Due to its relatively low abundance and high molecular weight, SRCAP western blot signals are weak, making it challenging to quantify the degree of depletion. We also believe that the value of quantification in this context, with the points noted above, is rather limited. In the past, our lab has published papers on depleting the H3T3 kinase Haspin from Xenopus egg extracts (Ghenoiu et al., 2013; Kelly et al., 2010) but were never able to detect Haspin via western blot. This protein was only detected by mass spectrometry specifically on nucleosome array beads with H3K9me3 (Jenness et al., 2018). However, depletion of Haspin was readily monitored by erasure of H3T3ph, the enzymatic product of Haspin. In these experiments, it was impossible, and not critical, to quantitatively monitor the depletion of Haspin protein in order to investigate its molecular functions. Similarly, in this current study, the important fact is that depletion of SRCAP suppressed methylation-sensitive H2A.Z deposition and quantifying the degree of SRCAP depletion would not have a major impact on this conclusion.
(8) It appears that the role of p400-Tip60 has been completely overlooked. This complex is the second major H2A.Z deposition complex. Because p400 exhibits DNA methylation-insensitive binding (Supplementary Figure 14), it may account for the deposition of H2A.Z onto methylated DNA. This possibility is highly significant and must be addressed by repeating the key experiments in Figure 5 following p400-Tip60 depletion.
We are aware that the Tip60 complex is a very likely candidate for mediating DNA methylation insensitive H2A.Z deposition, which is why we tested whether DNA binding of p400 is methylation sensitive. Therefore, the reviewer's statement that we "completely overlooked" Tip60-C’s role does not fairly report on our efforts. We wished to test the potential contribution of Tip60-C, but, unfortunately, the antibodies we currently have available to us were not successful in depleting the complex from egg extract. Since we had no direct experimental evidence indicating the role Tip60-C plays, we decided to take a conservative approach to our model and leave the methylation-insensitive pathway as mediated by something still unidentified. While further investigating Tip60-C’s contribution to this pathway is of definite value, we do not believe that it impacts our major conclusion that SRCAP-C is the main mediator responsible for H2A.Z deposition on unmethylated DNA and thus remains a subject for future study.
(9) The manuscript repeatedly states that H2A.Z nucleosomes are intrinsically unstable; however, this is an oversimplification. Although some DNA unwrapping is observed, multiple studies show that H3/H4 tetramer-H2A.Z/H2B interactions are more stable (important recent studies include the following: DOI: 10.1038/s41594-021-00589-3; 10.1038/s41467-021-22688-x; and reviewed in 10.1038/s41576-02400759-1).
We understand that the H2A.Z stability field is highly controversial. We have introduced the many conflicting reports that have been published in the field but can further expand on the controversies if desired. We also understand that the term “nucleosome stability” is broad and encompasses many physical aspects. As noted in a prior response, we will better specify our use of the term within the manuscript. In our assays, we are most focused on the DNA wrapping stability of the nucleosome and have consistently seen in our hands that H2A.Z nucleosomes are much more open and accessible compared to canonical H2A on satellite II-derived sequences, regardless of methylation status. However, we do understand that many groups have observed the opposite findings while others have obtained results similar to us. We reported on our findings of the general H2A.Z stability with the hopes to help clarify some of the field’s controversies.
In summary, the current manuscript does not present a convincing mechanistic explanation for the antagonism between DNA methylation and H2A.Z. The observation that H2A.Z can substantially coexist with DNA methylation in sperm pronuclei, perhaps, should be the conceptual focus.
We appreciate this reviewer’s advice. However, please note that the first author who led this project has already successfully defended their PhD thesis primarily based on this project, making it impractical and unrealistic to completely change the focus of this manuscript to include an entirely new avenue of research. We believe that our data provide important insights into the mechanisms by which H2A.Z is excluded from methylated DNA, particularly via the DNA methylation-sensitive binding of SRCAP-C, which has never been described before. We agree that many questions are still left unanswered, including the exact molecular mechanism behind how DNA methylation prevents SRCAP-C binding. We have preliminary data that suggest none of the known DNA-binding modules of SRCAP-C, including ZNHIT1, by themselves can explain this sensitivity. This implies that domain dissection in the context of the holo-SRCAP complex is required to fully address this question. We believe this represents a very exciting future avenue of study; however, it does not negate our finding that SRCAP-C itself is important for maintaining the DNA methylation/H2A.Z antagonism. Therefore, we respectfully disagree with this reviewer's summary statement, which misleadingly undermines the impact of our work.
Reviewer #3 (Public review):
Summary:
Histone variant H2A.Z is evolutionarily conserved among various species. The selective incorporation and removal of histone variants on the genome play crucial roles in regulating nuclear events, including transcription. Shih et al. aimed to address antagonistic mechanisms between histone variant H2A.Z deposition and DNA methylation. To this end, the authors reconstituted H2A.Z nucleosomes in vitro using methylated or unmethylated human satellite II DNA sequence and examined how DNA methylation affects H2A.Z nucleosome structure and dynamics. The cryo-EM analysis revealed that DNA methylation induces a more open conformation in H2A.Z nucleosomes. Consistent with this, their biochemical assays showed that DNA methylation subtly increases restriction enzyme accessibility in H2A.Z nucleosomes compared with canonical H2A nucleosomes. The authors identified genome-wide profiles of H2A.Z and DNA methylation using genomic assays and found their unique distribution between Xenopus sperm pronuclei and fibroblast cells. Using Xenopus egg extract systems, the authors showed SRCAP complex, the chromatin remodelers for H2A.Z deposition, preferentially deposit H2A.Z on unmethylated DNA.
Strengths:
The study is solid, and most conclusions are well-supported. The experiments are rigorously performed, and interpretations are clear. The study presents a high-resolution cryo-EM structure of human H2A.Z nucleosome with methylated DNA. The discovery that the SRCAP complex senses DNA methylation is novel and provides important mechanistic insight into the antagonism between H2A.Z and DNA methylation.
We are grateful that this reviewer recognizes the importance of our study.
Weaknesses:
The study is already strong, and most conclusions are well supported. However, it can be further strengthened in several ways.
(1) It is difficult to interpret how DNA methylation alters the orientation of the H4 tail and leads to the additional density on the acidic patch. The data do not convincingly support whether DNA methylation enhances interactions with H2A.Z mono-nucleosomes, nor whether this effect is specific to methylated H2A.Z nucleosomes.
The altered H4 tail orientation and extra density seen on the acidic patch were incidental findings that we thought could be interesting for the field to be aware of but decided not to follow up on as there were other structural differences that were more directly related to our central question. We do believe that the above two differences are linked to each other because we used a highly purified and homogenous sample for cryo-EM analysis and the H4 tail/acidic patch interaction is a well characterized contact that mediates inter-nucleosome interactions. Additionally, other groups have reported that the presence of DNA methylation causes condensation of both chromatin and bare DNA (cited within our manuscript), though the mechanics behind this phenomenon remain to be elucidated. We believed that our structure data may also align with those findings. However, the reviewer is fair in pointing out that we do not provide further experimental evidence in verifying the existence of these increased interactions. We can revise our writing to clarify that these points are currently hypotheses rather than validated results.
(2) It remains unclear whether DNA methylation alters global H2A.Z nucleosome stability or primarily affects local DNA end flexibility. Moreover, while the authors showed locus-specific accessibility by HinfI digestion, an unbiased assay such as MNase digestion would strengthen the conclusions.
We would like to thank the reviewer for bringing up these issues. Although our current data cannot explicitly clarify these possibilities, we favor an idea that DNA methylation specifically alters histone to DNA contacts and that this effect is felt globally across the entire nucleosome rather than only at specific locations. The intrinsic flexibility of linker DNA ends means that that region tends to exhibit the greatest differences under different physical influences, hence the focus on characterizing that area; flexibility of a thread on a spool is most pronounced at the ends. However, we also found that the DNA backbone of H2A.Z on methylated DNA had a lower local resolution compared to its unmethylated counterpart, despite that structure having a higher global resolution, which suggested to us that DNA positioning along the nucleosome is overall weaker under the presence of DNA methylation. This is corroborated by the increased population of open/shifted structures in our classification analysis. The reviewer raises a fair point about the use of a specific restriction enzyme versus MNase. We agree that our accessibility assay is highly influenced by the position of the restriction site and have previously seen that moving the cut site too close to the linker DNA end will abolish any DNA methylation-dependent differences. We did initially attempt an MNase digestion-based assay, but the data were not as reproducible as with the use of a specific restriction enzyme. We do not know the reason behind this irreproducibility though we believe that the processivity of MNase could make it difficult to capture subtle effects like those induced by DNA methylation on already highly accessible H2A.Z nucleosomes. Overall, while we believe that DNA methylation does exert a physical effect, its subtlety may explain the many contradictory studies present within the DNA methylation and nucleosome stability field.
References
Berta, D.G., H. Kuisma, N. Valimaki, M. Raisanen, M. Jantti, A. Pasanen, A. Karhu, J. Kaukomaa, A. Taira, T. Cajuso, S. Nieminen, R.M. Penttinen, S. Ahonen, R. Lehtonen, M. Mehine, P. Vahteristo, J. Jalkanen, B. Sahu, J. Ravantti, N. Makinen, K. Rajamaki, K. Palin, J. Taipale, O. Heikinheimo, R. Butzow, E. Kaasinen, and L.A. Aaltonen. 2021. Deficient H2A.Z deposition is associated with genesis of uterine leiomyoma. Nature. 596:398–403.
Capurso, D., H. Xiong, and M.R. Segal. 2012. A histone arginine methylation localizes to nucleosomes in satellite II and III DNA sequences in the human genome. BMC Genomics. 13:630.
Chodavarapu, R.K., S. Feng, Y.V. Bernatavichute, P.Y. Chen, H. Stroud, Y. Yu, J.A. Hetzel, F. Kuo, J. Kim, S.J. Cokus, D. Casero, M. Bernal, P. Huijser, A.T. Clark, U.
Kramer, S.S. Merchant, X. Zhang, S.E. Jacobsen, and M. Pellegrini. 2010. Relationship between nucleosome positioning and DNA methylation. Nature. 466:388–392.
Choy, J.S., S. Wei, J.Y. Lee, S. Tan, S. Chu, and T.H. Lee. 2010. DNA methylation increases nucleosome compaction and rigidity. J Am Chem Soc. 132:1782–1783.
Chua, E.Y., D. Vasudevan, G.E. Davey, B. Wu, and C.A. Davey. 2012. The mechanics behind DNA sequence-dependent properties of the nucleosome. Nucleic Acids Res. 40:6338–6352.
Collings, C.K., P.J. Waddell, and J.N. Anderson. 2013. Effects of DNA methylation on nucleosome stability. Nucleic Acids Res. 41:2918–2931.
Davey, C., S. Pennings, and J. Allan. 1997. CpG methylation remodels chromatin structure in vitro. J Mol Biol. 267:276–288.
Davey, C.S., S. Pennings, C. Reilly, R.R. Meehan, and J. Allan. 2004. A determining influence for CpG dinucleotides on nucleosome positioning in vitro. Nucleic Acids Res. 32:4322–4331.
Funabiki, H., I.E. Wassing, Q. Jia, J.D. Luo, and T. Carroll. 2023. Coevolution of the CDCA7-HELLS ICF-related nucleosome remodeling complex and DNA methyltransferases. Elife. 12.
Ghenoiu, C., M.S. Wheelock, and H. Funabiki. 2013. Autoinhibition and polo-dependent multisite phosphorylation restrict activity of the histone h3 kinase haspin to mitosis. Mol Cell. 52:734–745.
Jenness, C., S. Giunta, M.M. Muller, H. Kimura, T.W. Muir, and H. Funabiki. 2018. HELLS and CDCA7 comprise a bipartite nucleosome remodeling complex defective in ICF syndrome. Proc Natl Acad Sci U S A. 115:E876–E885.
Jimenez-Useche, I., J. Ke, Y. Tian, D. Shim, S.C. Howell, X. Qiu, and C. Yuan. 2013. DNA methylation regulated nucleosome dynamics. Sci Rep. 3:2121.
Jimenez-Useche, I., D. Shim, J. Yu, and C. Yuan. 2014. Unmethylated and methylated CpG dinucleotides distinctively regulate the physical properties of DNA. Biopolymers. 101:517–524.
Kelly, A.E., C. Ghenoiu, J.Z. Xue, C. Zierhut, H. Kimura, and H. Funabiki. 2010. Survivin reads phosphorylated histone H3 threonine 3 to activate the mitotic kinase Aurora B. Science. 330:235– 239.
Li, S., Y. Peng, D. Landsman, and A.R. Panchenko. 2022. DNA methylation cues in nucleosome geometry, stability and unwrapping. Nucleic Acids Res. 50:1864–1874.
Minary, P., and M. Levitt. 2014. Training-free atomistic prediction of nucleosome occupancy. Proc Natl Acad Sci U S A. 111:6293–6298.
Ngo, T.T., J. Yoo, Q. Dai, Q. Zhang, C. He, A. Aksimentiev, and T. Ha. 2016. Effects of cytosine modifications on DNA flexibility and nucleosome mechanical stability. Nat Commun. 7:10813.
Nishiyama, A., L. Yamaguchi, J. Sharif, Y. Johmura, T. Kawamura, K. Nakanishi, S. Shimamura, K. Arita, T. Kodama, F. Ishikawa, H. Koseki, and M. Nakanishi. 2013. Uhrf1-dependent H3K23 ubiquitylation couples maintenance DNA methylation and replication. Nature. 502:249–253.
Osakabe, A., F. Adachi, Y. Arimura, K. Maehara, Y. Ohkawa, and H. Kurumizaka. 2015. Influence of DNA methylation on positioning and DNA flexibility of nucleosomes with pericentric satellite DNA. Open Biol. 5.
Perez, A., C.L. Castellazzi, F. Battistini, K. Collinet, O. Flores, O. Deniz, M.L. Ruiz, D. Torrents, R. Eritja, M. Soler-Lopez, and M. Orozco. 2012. Impact of methylation on the physical properties of DNA. Biophys J. 102:2140–2148.
Segal, E., Y. Fondufe-Mittendorf, L. Chen, A. Thastrom, Y. Field, I.K. Moore, J.P. Wang, and J. Widom. 2006. A genomic code for nucleosome positioning. Nature. 442:772–778.
Wassing, I.E., A. Nishiyama, R. Shikimachi, Q. Jia, A. Kikuchi, M. Hiruta, K. Sugimura, X. Hong, Y. Chiba, J. Peng, C. Jenness, M. Nakanishi, L. Zhao, K. Arita, and H. Funabiki. 2024. CDCA7 is an evolutionarily conserved hemimethylated DNA sensor in eukaryotes. Sci Adv. 10:eadp5753.
Zilberman, D., D. Coleman-Derr, T. Ballinger, and S. Henikoff. 2008. Histone H2A.Z and DNA methylation are mutually antagonistic chromatin marks. Nature. 456:125–129.
Recommendations for the authors:
Reviewer #1 (Recommendations for the authors):
The authors designed two sets of experiments to explore the molecular mechanisms underlying the mutually exclusive distribution of H2A.Z and DNA methylation previously reported by several groups.
First, they examined how DNA methylation affects the physical stability of H2A.Z-containing nucleosomes. Although their results point to subtle differences between nucleosomes assembled on methylated versus unmethylated DNA, the authors did not extend their analyses to directly test the stability of these H2A.Z-containing nucleosomes under more challenging conditions. Prior studies have demonstrated that certain nucleosomes, such as those containing H3.3-H2A.Z or H2A.Z-H3K56Q, exhibit specific instability, but such instability is only revealed under challenging conditions, for example, altered salt concentrations or the presence of additional factors like FACT (PMID: 17575053; PMID: 19633671; PMID: 19639024; PMID: 41303375). In light of this literature, the observable structural features noted here for nucleosomes containing H2A.Z and methylated DNA are suggestive of increased instability, yet the authors did not employ comparable approaches to rigorously test whether such instability might explain the absence of H2A.Z from methylated genomic regions.
As a result, at this stage of analysis, the idea that nucleosomes containing both H2A.Z and methylated DNA are intrinsically unstable, and that this instability accounts for the depletion of H2A.Z from methylated regions, remains unsubstantiated.
We thank the reviewer's constructive criticisms. Through our response to these points, we were able to significantly improve our manuscript, including major rewriting of the Abstract and Discussion as well as incorporation of new data.
We agree that combinations with other histone variants, modifications, and mutations could further affect our observed impact of DNA methylation on H2A.Z-nucleosome stability. What we observed based on satellite II-derived DNA was that DNA methylation made H2A.Znucleosomes (with H3.2) more open, although the effect of DNA methylation is relatively small (as compared to the general impact of H2A.Z incorporation). We readily admit that such a subtle physical effect is unlikely to be the main driver of the antagonistic distribution of H2A.Z and DNA methylation, though small physical changes have been known to influence larger biological functions, and sought to describe additional regulatory factors that could play major roles.
We also agree that H3.3 is of major interest when discussing H2A.Z. In our Xenopus egg extract experiments using DNA beads, the primary H3 variant deposited is H3.3 as no DNA replication occurs on the beads to allow for H3.1/.2 replication-coupled deposition. From those experiments, we demonstrated that preferential loading of H2A.Z can be primarily explained by SRCAP. In other words, in the absence of SRCAP, loading/retention of H2A.Z on H3.3nucleosomes was not noticeably affected by DNA methylation, indicating that DNA methylation’s physical effects on H2A.Z nucleosomes plays little, if any, role in the preferential accumulation of H2A.Z on unmethylated DNA at least in the context of synthetic DNA beads incubated in
Xenopus egg extract lacking active transcription. Our sequencing data hints at the interesting possibility that transcription, along with other factors missing in egg extract, may be involved in further pruning H2A.Z from methylated DNA which conceivably could take advantage of subtle physical alterations. However, we agree we lack firm supporting evidence for such a mechanism which led us to forgo including that in our final model figure and we instead only report on our observations with discussions on potential biological implications and limitations. Of note, it has been reported that the H2A.Z nucleosome is more accessible than the H2A nucleosome, while inclusion of H3.3 does not further enhance accessibility of the H2A.Z nucleosome (PMID 38920622). We have now noted these points in the Discussion of our revised manuscript.
We appreciate and agree with this reviewer’s point that nucleosome instability sometimes requires challenging conditions to be fully revealed. However, in our system, use of H2A.Z was the challenge provided as we find in our hands that H2A.Z by itself substantially destabilizes histone-DNA contacts compared to canonical H2A. And it is only with this already destabilized nucleosome that we see further enhancement of accessibility/openness in the presence of DNA methylation. This is similar to findings by [PMID: 23260052] that reported that only an intrinsically destabilized sub-population of canonical H2A nucleosomes on 601 DNA experienced detectable physical changes in the presence of DNA methylation.
In response to this reviewer's comment, we edited the Abstract and Discussion to clearly note the subtly of the impact of DNA methylation on H2A.Z nucleosome structure, and that the potential functional significance remains an open question.
Second, the authors investigated whether SRCAP-C contributes to preferential H2A.Z incorporation into unmethylated DNA. The absence of H2A.Z from methylated regions does not necessarily imply that it cannot be incorporated there; it may instead reflect the chromatin environment associated with DNA methylation, which could disfavor SRCAP-C activity, whereas open chromatin environments strongly promote SRCAP-dependent H2A.Z deposition.
This reviewer suggested an alternative model where SRCAP prefers to act on open chromatin and that the apparent preferential H2A.Z deposition to unmethylated DNA is due solely to the increased accessibility associated with unmethylated DNA. Following such a model, one would predict that SRCAP-C's preference to unmethylated DNA would be eliminated on nucleosome-free DNA in Xenopus egg extracts. To test this alternative model, we repeated the SRCAP-C binding experiment in egg extracts depleted of the HIRA complex, the H3.3-H4 chaperone responsible for de novo nucleosome assembly on exogenously added DNA in egg extracts. Contrary to this prediction, both SRCAP and ZNHIT1 still display preferential binding to unmethylated DNA substrates in HIRA-depleted extracts in which nucleosome assembly is suppressed (newly added Suppl Fig 16). The results argue that discrimination of SRCAP-C from methylated DNA is not due to a potential effect of chromatin compaction by DNA methylation. Furthermore, our new result is in line with an idea that SRCAP employs 1D diffusion on the linker DNA before engaging the H2A nucleosome (PMID 39131301), implying that discrimination of SRCAP-C from methylated linker DNA contributes to this process. This is now illustrated in the new model Figure 6.
Please note we also indicate in both our model and in text that there exists an additional methylation-insensitive mechanism that drives H2A.Z deposition on methylated DNA, leading to a substantial amount of colocalized H2A.Z and DNA methylation. Why two different deposition pathways for H2A.Z differing in their methylation sensitivities must exist is an interesting topic for future work and has not been described prior to our report.
This interpretation is consistent with the authors' own comparative mapping of H2A.Z and DNA methylation in sperm pronuclei incubated in egg extract versus a transcriptionally active Xenopus fibroblast line. They observed that about 40% of H2A.Z-associated genomic DNA is methylated in sperm pronuclei, but only 3% in fibroblasts. As they note, the major difference between these systems is the presence of transcription in fibroblasts, a process known to drive H2A.Z eviction/recycling, and which is absent in the egg-extract system. Thus, no specific inhibition of SRCAP-C by methylated DNA needs to be invoked: H2A.Z deposition on both methylated and unmethylated accessible regions, followed by preferential eviction from methylated sites in active nuclei, could fully account for the observed patterns.
As the reviewer correctly notes here, we proposed that transcription is likely to play an important role in pruning H2A.Z from methylated DNA. Our observations and proposed mechanism do not argue against the possible existence of a DNA methylation-insensitive, transcription-dependent mechanism that promotes dissociation of H2A.Z from methylated DNA, which we believe likely would be correlated to gene body methylation. In fact, we did propose in our Discussion that such a transcription-mediated mechanism may conceivably take advantage of the subtly destabilized DNA wrapping of H2A.Z nucleosomes on methylated DNA to further selectively prune H2A.Z at colocalized regions. However, such a mechanism would be an additional component to what we have already described and does not explain the observed preferential recruitment of SRCAP-C to unmethylated DNA in Xenopus egg extracts in the absence of active transcription.
In this respect, studies from the Felsenfeld laboratory showing that double-variant nucleosomes are highly unstable under physiological ionic conditions are particularly relevant (PMID: 19633671; PMID: 19639024). They demonstrated that such unstable nucleosomes are only evident under low ionic strength extraction conditions, emphasizing that the apparent absence of H2A.Z may reflect facilitated removal rather than failure of assembly.
The authors may also have been influenced by the study of Berta et al. (cited in the manuscript), which examined uterine leiomyomas harboring somatic or germline mutations in SRCAP-C subunits. In those tumors, the normal association of H2A.Z with accessible, active chromatin, and its exclusion from methylated regions, was lost. However, this observation does not demonstrate that SRCAP-C actively prevents H2A.Z incorporation into methylated DNA. Instead, it may simply reflect that in the absence of SRCAP-C, a default, less efficient deposition pathway operates regardless of whether the chromatin environment is normally permissive or restrictive for SRCAP-dependent activity.
Even if one accepts the more straightforward interpretation proposed by the present authors, that SRCAP-C is actively inhibited by methylated DNA, as suggested by their pull-down experiments from Xenopus egg extracts using unmethylated and methylated DNA, the hypothesis lacks mechanistic support.
Considering this reviewers' criticism, we have expanded our discussion to indicate a possibility that SRCAP-C may have an alternative mechanism to find open chromatin independent of DNA methylation status. However, our data show that SRCAP-C preferentially binds to unmethylated DNA in a manner independent of transcription or other epigenetic status in Xenopus egg extracts, and that SRCAP-C carries the major mechanism that explains preferential deposition of H2A.Z to unmethylated DNA. Therefore, we believe that our study for the first time offers a mechanistic explanation of how H2A.Z discrimination from methylated DNA is accomplished through SRCAP-dependent H2A.Z deposition.
The following points summarize the issues discussed above:
(1) The authors did not sufficiently test the hypothesis that H2A.Z-methylated DNA nucleosomes are inherently unstable and could explain the exclusion of H2A.Z from methylated genomic regions.
We stand by our conclusion that DNA methylation has an intrinsic capacity to make the H2A.Z nucleosome more open and accessible, even though the effect is subtle. We did not argue that this subtle effect can fully explain the exclusion of H2A.Z from methylated genomic regions. Rather, our Xenopus egg extract experiment suggested that in the transcriptionally inactive egg extract setting, such a mechanism plays little or no role and it is SRCAP-C instead that is the major driver. Whether this physical mechanism also contributes to their exclusion in cells with active transcription remains a future subject of study.
(2) The proposed active role of SRCAP-C in preventing H2A.Z assembly on methylated DNA is supported only by limited experimental data and lacks a mechanistic explanation. In particular, this hypothesis does not account for the significant H2A.Z assembly observed on methylated DNA regions in sperm nuclei after incubation in egg extract.
We respectfully disagree with this summary assessment. Our conclusions are well aligned with the substantial H2A.Z association with methylated DNA in sperm pronuclei assembled in Xenopus egg extracts seen. We demonstrated that:
(1) In transcriptionally-silent Xenopus egg extracts using synthetic DNA beads, DNAbinding of SRCAP-C is inhibited by DNA methylation.
(2) In this set up, H2A.Z is preferentially, if not exclusively, loaded to unmethylated DNA over methylated DNA.
(3) Depletion of SRCAP-C almost completely eliminated preferential association of H2A.Z to unmethylated DNA, while leaving some DNA methylation-insensitive H2A.Z loading.
(4) These data indicate the presence of a SRCAP-C-dependent, DNA methylationsensitive mechanism as well as a SRCAP-C-independent, DNA-methylation-insensitive mechanism to load H2A.Z to chromatin. This conclusion matches well with our genomic analysis showing that H2A.Z is preferentially but not exclusively loaded to hypomethylated genomic segments to sperm pronuclei in Xenopus egg extracts.
(5) As we clearly discussed, this SRCAP-C-dependent mechanism by itself is insufficient to explain the much clearer exclusion of H2A.Z in somatic cells. We discussed the possibility that transcription contributes to further pruning of H2A.Z from methylated DNA.
To deliver this overall message with nuances that we noted above, we have heavily revised the Abstract, the model Figure 6, and Discussion. Thanks to the criticisms raised by this reviewer, we believe that our revised manuscript has been significantly improved.
Reviewer #2 (Recommendations for the authors):
(1) A major omission is the absence of a cryo-EM structure of a canonical nucleosome assembled on the same DNA template - this is essential to assess whether the observed effects are H2A.Z-specific.
We had considered solving the H2A structures, however, ultimately decided against it for a few reasons. First, there already exists crystal structures of canonical H2A nucleosomes using a DNA sequence highly similar to our Sat2R-P with and without the presence of DNA methylation (PDB: 5CPI and 5CPJ). The authors of this study did not see any physical differences present in their structures (Osakabe et al., 2015). Additionally, we had included canonical H2A conditions within our restriction enzyme accessibility assay and did not see a significant impact of DNA methylation on those samples (Fig 3). Because of the previous report and our own negative data, we expected that only limited additional insights would be obtained from the canonical H2A structures and decided not to pursue that analysis, considering the cost and effort for this additional cryo-EM analysis.
(2) The reported increase in accessibility of the methylated H2A.Z nucleosome is negligible compared with the much larger intrinsic DNA accessibility of the unmethylated H2A.Z nucleosome. Claims that methylated H2A.Z nucleosomes are "more open and accessible" must therefore be removed, and the title is misleading, given that no meaningful impact of DNA methylation on H2A.Z nucleosome stability is demonstrated.
We respectfully disagree with this reviewer's criticism. We investigated the potential impact of DNA methylation on nucleosome stability to the best of our abilities through complementary assays and reported our observations. The effect of DNA methylation is smaller than the difference between H2A.Z and H2A, but we were able to see an effect. It is also not uncommon for small differences to have functional impacts in biological systems. We agree that further testing is required to determine whether this subtle effect is functionally important, and it remains the subject of future research due to the many technical challenges associated with addressing said question. We would like to note that 18 years have passed since Daniel Zilberman first reported the antagonistic relationship between H2AZ and DNA methylation (Zilberman et al., 2008) but very few studies have since directly tested specific mechanistic hypotheses. We believe that our study lays the groundwork for exciting future investigation that better elucidates the pathways that contribute to this antagonism and will have meaningful impacts on the field in general. However, thanks to the reviewer's criticism, we realized that we did not clearly state in the Abstract that the effect of DNA methylation on intrinsic H2A.Z nucleosome stability is relatively subtle. We will accordingly revise the Abstract, the model Figure 6, and Discussion to make this point clearer.
(3) The cryo-EM structures of methylated and unmethylated 601L H2A.Z nucleosomes show no detectable differences. As presented, this negative result adds little value and should be removed.
We believe the inclusion and factual reporting of negative data is important for the scientific community as one of the major issues currently in biology research is biased omission of negative data. We considered eLife as a venue to publish this work for this reason. We understand that the reviewer believes our 601L structures may detract from the overall message of our manuscript, however, we believe that this data rather emphasizes the importance of DNA sequence context, something that the reviewer also rightfully notes. It is standard practice in the nucleosome field to use the Widom 601 sequence, along with its variants. Our experience has shown that use of an artificially strong positioning sequence may mask weaker physical effects that could play a physiological role. Thus, we were careful to validate all further assays with multiple DNA sequences and believed it important to report these sequence-dependent effects on nucleosome structure.
(4) Very little H3 signal coincides with H2A.Z at TSSs in sperm pronuclei, yet this is neither explained nor discussed (Supplementary Figure 10D). The authors need to clarify this.
Our H3 signal, which represents the global nucleosome population, is more broadly distributed across the genome than H2A.Z, which is known to localize at specific genomic sites. Since both histone types were sequenced to similar read depths, H3 peaks are generally shallower than H2A.Z and peak heights cannot be directly compared (i.e. they should be represented in separate appropriate data ranges).
(5) In my view, the most conceptually important finding is that H2A.Z-associated reads in sperm pronuclei show ~43% CpG methylation. This directly contradicts the model of strict mutual exclusivity and suggests that the antagonism is context-dependent. Similarly, the finding that the depletion of SRCAP reduces H2A.Z deposition only on unmethylated templates is also very intriguing. Collectively, these result warrants further investigation (see below).
(6) Given that H2A.Z is located at diverse genomic elements (e.g., enhancers, repressed gene bodies, promoters), the manuscript requires a more rigorous genomic annotation comparing H2A.Z occupancy in sperm pronuclei versus XTC-2 cells. The authors should stratify H2A.ZDNA methylation relationships across promoters, 5′UTRs, exons, gene bodies, enhancers, etc., as described in Supplementary Figure 10A.
We appreciate recognition of the importance of our finding by this reviewer. We agree that the substantial presence of co-localized H2A.Z and DNA methylation specifically in the sperm pronuclei samples and the changes in pattern between nuclear types are highly interesting and require further investigation. However, we faced technical challenges in our sequencing experiments that made us refrain from conducting a more detailed analysis for fear of over-interpreting potential artifacts. These challenges mainly stemmed from the difficulties in collecting enough material from Xenopus egg extracts and Tn5’s innate bias towards accessible regions of the genome. Because of this, open regions of the genome tend to be overrepresented in our data (as noted in our Discussion), making it challenging to rigorously compare methylation profiles and H2A.Z/H3 associated genomic elements.
While the degree of separation seems to be dependent on nuclei type, we still believe the antagonism exists in both the sperm pronuclei and XTC-2 samples when comparing H2A.Z methylation profiles to the corresponding H3 condition. Our study also demonstrates that H2A.Z is preferentially deposited to hypomethylated DNA in a manner dependent of SRCAP-C (the loss of SRCAP only reduces H2A.Z on unmethylated substrates) but an additional methylationinsensitive H2A.Z deposition mechanism also exists. We realized that this interesting point was not clearly highlighted in Abstract, so we will revise it accordingly.
(7) Although H2A.Z accumulates less efficiently on exogenous methylated substrates in egg extract, substantial deposition still occurs (~50%). This observation directly challenges the strong antagonistic model described in the manuscript. The authors need to discuss this in more detail.
As depicted in Figure 6 and described in the Discussion, we indicated that both methylation-sensitive and methylation-insensitive pathways exist to deposit H2A.Z within the genome. We also directly stated in our Discussion that a substantial proportion of H2A.Z colocalizes with DNA methylation both in our study as well as in previous reports, which is of major interest for future study. Additionally, we further discussed how the absence of transcription in Xenopus eggs is a likely reason for the more limited effect of DNA methylation restricting H2A.Z deposition in our egg extract system. In the revised manuscript, we heavily edited the Discussion to better clarify these points.
(8) The SRCAP depletion is insufficiently validated, i.e., the antibody-mediated depletion of SRCAP lacks quantitative verification. A minimum of three biological replicates with quantification is required to substantiate the claims.
In response to this, quantification of the SRCAP depletion is now included as Supplementary Figure 13A and B. Since our anti-ZNHIT1 antibodies reproducibly detected ZNHIT1 on DNA beads isolated from egg extracts, we have conducted additional verification of the SRCAP depletion by probing for SRCAP and ZNHIT1 on DNA beads, confirming that these proteins were depleted on DNA beads upon immunodepletion with anti-SRCAP antibodies (Author response image 1). To further validate this conclusion, we added data showing that the effect of SRCAP depletion on methylation-sensitive H2A.Z deposition was reproduced through use of a different commercially available antibody raised against human SRCAP (newly added Suppl Fig 14).
Author response image 1.
Verification of SRCAP depletion using DNA beads. DNA beads were incubated in interphase-cycled Xenopus egg extract that had been depleted with either our custom SRCAP antibody or an IgG negative control. SRCAP and ZNHIT1 association was then assessed via Western Blot.
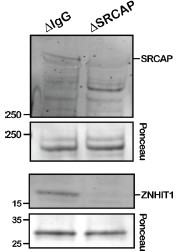
(9) It appears that the role of p400-Tip60 has been completely overlooked. This complex is the second major H2A.Z deposition complex. Because p400 exhibits DNA methylation-insensitive binding (Supplementary Figure 14), it may account for the deposition of H2A.Z onto methylated DNA. This possibility is highly significant and must be addressed by repeating the key experiments in Figure 5 following p400-Tip60 depletion.
Thank you very much for raising this interesting point. We were aware that the TIP60 complex is a very likely candidate for mediating DNA methylation-insensitive H2A.Z deposition, which is why we tested whether DNA binding of p400 is methylation sensitive (shown in the revised Supplementary Figure 15). We wished to test the potential contribution of TIP60-C, but, unfortunately, the antibodies we currently have available to us were not successful in depleting the complex from egg extract. Since we had no direct experimental evidence indicating the role TIP60-C plays, we decided to take a conservative approach to our model and leave the methylation-insensitive pathway as mediated by something still unidentified. While further investigating TIP60-C’s contribution to this pathway is of definite value, we do not believe that it impacts our major conclusion that SRCAP-C is the main mediator responsible for H2A.Z deposition on unmethylated DNA and thus remains a subject for future study. However, we have now added descriptions to note that TIP60-C is a likely candidate to execute the SRCAPindependent and methylation-insensitive mechanism of H2A.Z loading in Xenopus egg extracts. In the model figure, we initially did not include Tip60-C, but we now infer TIP60-C is a likely candidate in the revised model (Figure 6) to facilitate the future research in the field.
(10) The manuscript repeatedly states that H2A.Z nucleosomes are intrinsically unstable; however, this is an oversimplification. Although some DNA unwrapping is observed, multiple studies show that H3/H4 tetramer-H2A.Z/H2B interactions are more stable (important recent studies include the following: DOI: 10.1038/s41594-021-00589-3; 10.1038/s41467-021-22688-x; and reviewed in 10.1038/s41576-024-00759-1). These references should be considered.
We appreciate that the reviewer points out this important issue. Although we had described that controversy exists regarding how H2A.Z and DNA methylation contributes to nucleosome stability, it was not clearly explained. We understand that this confusion was in part due to the term “nucleosome stability”, which is broad and encompasses many physical aspects. As noted in a prior response, we now better specify our use of the term within the manuscript, emphasizing the nucleosome openness and accessibility, particularly at the nucleosome core particle entry/exit sites. As noted by published studies (PMID 38920622), the impact on nucleosome stability may differ between the internal and external segments of nucleosomal DNA. In our assays, we are most focused on the DNA wrapping stability of the nucleosome and have consistently seen in our hands that H2A.Z nucleosomes are much more open and accessible at DNA ends compared to canonical H2A on satellite II-derived sequences, regardless of methylation status. However, we do understand that many groups have observed the opposite findings while others have obtained results similar to us. This may be caused by usage of different assays (for example, nucleosome assembly during salt dialysis or salt sensitivity vs openness/accessibility of preassembled nucleosome). In the Discussion of the revised manuscript, we now explain these factors, with the hope that our study will help clarify some of the field’s controversies.
Reviewer #3 (Recommendations for the authors):
(1) Since the cryo-EM structure determined by single-particle analysis represents only one major population, it would be important to determine the dyad axis position by complementary biochemical assays, such as MNase-seq or chemical digestion by the Fenton reaction (PMID: 22929776).
We would like to thank the reviewer for bringing up this important issue. We agree that the high-resolution structure represents only a subpopulation in which we specifically selected for the most stably wrapped nucleosomes in each sample. This issue is why we then supplemented our high-resolution structure with our in-silico classification analysis to survey the overall structure distribution of the full nucleosome particle population. The classification input contains all nucleosome-like particles picked from both unmethylated and methylated sample micrographs mixed together, ensuring that all particles are taken into consideration and that both samples have been analyzed in an identical manner. From our sorting analysis, we find an increased population of open and shifted nucleosome structures present in our methylated DNA sample, indicating destabilization of DNA-histone wrapping with DNA methylation. This is corroborated by the lower local resolution seen on the DNA backbone of our high-resolution H2A.Z on methylated DNA structure, despite it having a higher global resolution compared to its unmethylated counterpart. This suggested to us that DNA positioning along the nucleosome is overall weaker under the presence of DNA methylation.
The reviewer raises a fair point about the use of a specific restriction enzyme versus MNase. We agree that our accessibility assay is highly influenced by the position of the restriction site and have previously seen that moving the cut site too close to the linker DNA end will abolish any DNA methylation-dependent differences. We realized that we did not explain how we decided to place the HinfI site in the context of our solved cryo-EM structure. In the revised Figure 3B, we now illustrate that the HinfI site is located at a segment where H2A/H2A.Z directly contacts the DNA and explained that this segment belongs to the region that exhibited clear methylation-induced flexibility in our cryo-EM structures. Thus, our structure helped us design this experiment.
We did initially attempt an MNase digestion-based assay, but the data were not as reproducible as with the use of a specific restriction enzyme. We do not know the reason behind this irreproducibility though we believe that the processivity of MNase could make it difficult to capture subtle effects like those induced by DNA methylation on already highly accessible H2A.Z nucleosomes, as subtle technical errors in the MNase concentration can have significant effects. Overall, while we believe that DNA methylation does exert a physical effect, its subtlety may explain the many contradictory studies present within the DNA methylation and nucleosome stability field.
(2) I assume that the authors confirmed complete DNA methylation by restricted enzyme digestion. It would be helpful to include this validation in supplementary figures.
We would like to thank the reviewer for pointing out that this critical verification was missing from our initial manuscript. DNA methylation of Sat2R-P and Sat2R was verified via BstBI digestion (Suppl Fig 1B and 7D, respectively); 601L verified with HpaII digestion (Suppl Fig 6B); and 19x601 DNA verified via BstUI digestion (Suppl Fig 11A). All data has been added to the specified figures. Unfortunately, the 16xHSat2 DNA substrate we used in our assays does not contain appropriate cut-sites for methylation-sensitive restriction enzymes. Due to that, we always prepared the 16xHSat2 DNA in parallel with the 19x601 substrate under identical conditions then use digestion of the 19x601 substrate to verify quality of methylation for each batch. To more directly verify methylation of 16xHSat2 DNA, we used Xenopus laevis ZHX2 and ZHX3, which we recently identified as proteins that selectively associate with methylated DNA in Xenopus egg extracts. Although identification and characterization of Xenopus ZHX2/3 will be described elsewhere, previous published proteomic studies have also identified mammalian ZHXs as proteins that enrich on methylated DNA (PMID 21029866, 23434322). By incubating DNA beads in Xenopus egg extract and probing for endogenous ZHX2/3 (our antibody recognizes both ZHX2 and ZHX3), we verified that ZHXs selectively binds to methylated 16xHSat2 but not unmethylated DNA (Author response image 2). Although this does not necessarily verify that all CpGs in 16xHSat2 were methylated, we observed comparable methylation-induced inhibition of SRCAP binding between 16x601 and 16HSat2, supporting our conclusion.
Author response image 2.
Verification of 16xHSat2 methylation status via ZHX2/3 protein binding. 16xHSat2 DNA beads were incubated in Xenopus egg extract and endogenous ZHX2/3 protein binding assessed via Western Blot with a custom generated antibody that recognizes both ZHX2 and ZHX3.
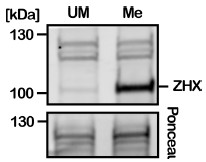
(3) Figure 1A: The dyad position is difficult to identify. Please indicate it clearly using a distinct color (not green).
We now directly indicate each sequence midpoint with a black triangle and also changed the font of DNA sequences to further clarify that the dyad resides at the palindromic center.
eLife Assessment
This study reports on the development and characterization of chickens with genetic deficiencies in type I or type III interferon receptors, which is an important contribution to the field of avian immunology. The data reflecting the development of the new interferon-receptor-deficient chickens is compelling. The initial characterization of IFN biology and infection responses in these knockout chickens provides a solid foundation for future studies on the distinct contributions of type I and type III interferon signaling to antiviral responses.
Reviewer #2 (Public review):
Summary:
This is a laudable effort to help dissect the contributions of type I and type III IFNs to the antiviral response in chicken and therefore represents an important piece of work, not least in the light of birds being a key carrier and worldwide distributor of influenza virus. The first part of the study characterises the generation of IFNAR and IFNLR KO chicken strains and describes basic differences. Four different viruses are then tested in chicken embryos, while the subsequent analysis of the antiviral response in vivo is performed with one influenza H3N1 strain.
Strengths:
Having these two KO chicken strains as a tool is a great achievement. The initial analysis is solid. Clear effect of IFNAR deficiency in in vivo infection, less so for IFNLR deficiency.
Weaknesses:
(1) The antibody induction by KLH immunisation: We still don't know whether or not this vaccination induces IFN responses in wt mice, so it is still not possible to judge whether the effects observed are due to steady-state differences or to differential effects of IFN induced during the vaccination phase. Pre-immune results are now shown and are indeed zero. As suggested, the whole figure 4 is now condensed into one or two panels by proper calculation of Ab titers - would these titres be significantly different? This as all of the other in vivo experiments have not been repeated if I understand the methods section correctly. I understand that there are three R restrictions that are tighter in some countries, and I accept that with the numbers used here, some statistical significance is reached, but this is for instance not the case for survival.
(2) The basic conundrum here and in later figures is now addressed by the authors in the discussion: Situations where IFN type 1 and 3 signalling deficiency each have an independent effect (i.e. fig.4d) suggest that they act by separate, unrelated mechanisms. However, all the literature about these IFN families suggest that they show almost identical signalling and gene induction downstream of their respective receptors. How can the same signalling, clearly active here downstream of the receptors for IFN type 1 or type 3, be non-redundant, i.e. why does the unaffected IFN family not stand in? The mouse studies, which showed a rather subtle phenotype when only one of the two IFN systems was missing, but a massive reduction in virus control in double KO mice, are discussed, but a clear-cut explanation for the differences has not been reached. Reasons could be a direct effect of IFNab on B cells and an indirect effect of IFNL through non-B cells, timing issues, and many other scenarios can be envisaged. The authors do not address this question experimentally, which limits the depth of analysis, they have however now included a discussion of this dilemma.
(3) In the one in vivo experiment performed with chickens, only one virus tested, more influenza strains should be included as well as non-influenza viruses. I appreciate that this is logistically difficult.
(4) The basic conundrum of point 2 applies equally to Fig. 6a, both KOs have a phenotype. Again, in 6d, both IFNs appear to be separately required for Mx induction. An explanation has been attempted, but more experiments, for instance looking at different time points to understand if we are dealing simply with different kinetics of the response, have not been attempted, despite the fact that such experiments are likely not covered by strict three R rules.
(5) The in vivo infection is the most interesting experiment, and the key outcome here is that IFN type 1 is crucial for anti-H3N1 protection in chickens, while type 3 is less impactful. However, this experiment suffers from the different time points when chickens were culled, so many parameters are impossible to compare (e.g. weight loss, histopathology). Some explanation is given as to the comparisons chosen here, but a more thorough analysis at several time points would have strengthened this study.
Comments on revised version:
In the rebuttal, the authors have gone to some length to add to the discussion of the experiments, and some aspects are better explained now than before. Many of these explanations remain speculative however, so the study remains inconclusive in several aspects. As no new data was added, my overall judgement of this study remains unchanged.
Author response:
Public Reviews:
Reviewer #1 (Public review):
Summary:
This manuscript presents an extensive body of work and an outstanding contribution to our understanding of the IFN type I and III system in chickens. The research started with the innovative approach of generating KO chickens that lack the receptor for IFNα/β (IFNAR1) or IFN-λ (IFNLR1). The successful deletion and functional loss of these receptors was clearly and comprehensively demonstrated in comparison to the WT. Moreover, the homozygous KO lines (IFNAR1-/- or IFNLR1-/-) were found to have similar body weights, and normal egg production and fertility compared to their WT counterparts. These lines are a major contribution to the toolbox for the study of avian/chicken immunology.
The significance of this contribution is further demonstrated by the use of these lines by the authors to gain insight into the roles of IFN type I and IFN-type III in chickens, by conducting in ovo and in vivo studies examining basic aspects of immune system development and function, as well as the responses to viral challenges conducted in ovo and in vivo.
Based on solid, state-of the-art methods and convincing evidence from studies comparing various immune system related functions in the IFNAR1-/- or IFNLR1-/- lines to the WT, revealed that the deletion of IFNAR1 and/or IFNLR1 resulted in:
(1) impaired IFN signaling and induction of anti-viral state;
(2) modulation of immune cell profiles in the peripheral blood circulation and spleen;
(3) modulation of the cecum microbiome;
(4) reduced concentrations of IgM and IgY in the blood plasma before and following immunization with model antigen KLH, whereby also line differences in the time-course of the antibody production were observed;
(5) decrease in MHCII+ macrophages and B cells in the spleen of IFNAR1 KO chickens, although the MHCII-expression per cell was not affected in this line; and
(6) reduction in the response of αβ1 TCR+ T cells of IFNAR1 KO chickens as suggested by clonal repertoire analyses.
These studies were then followed by examination of the role of type I and type III IFN in virus infection, using different avian influenza A virus strains as well as an avian gamma corona virus (IBV) in in ovo challenge experiments. These studies revealed: viral titers that reflect virus-species and strain-specific IFN responses; no differences in the secretion of IFN-α/β in both KO compared to the WT lines; a predominant role of type I IFN in inducing the interferon-stimulated gene (ISG) Mx; and that an excessive and unbalanced type I IFN response can harm host fitness (survival rate, length of survival) and contribute to immunopathology.
Based on guidance from the in ovo studies, comprehensive in vivo studies were conducted on host-pathogen interactions in hens from the three lines (WT, IFNAR1 KO, or IFNLR1 KO). These studies revealed the early appearance of symptoms and poor survival of hens from the IFNR1 KO line challenged with H3N1 avian influenza A virus; efficient H#N1 virus replication in IFNAR1 KO hens, increased plasma concentrations of IFNα/β and mRNA expression of IFN-λ in spleens of the IFNAR1 KO hens; a pro-inflammatory role of IFN-λ in the oviduct of hens infected with H3N1 virus; increased proinflammatory cytokine expression in spleens of IFNAR1 KO hens, and Impairment of negative feedback mechanisms regulating IFN-α/β secretion in IFNAR1-KO hens and a significant decrease in this group's antiviral state; additionally it was demonstrated that IFN-α/β can compensate IFN-λ to induce an adequate antiviral state in the spleen during H3N1 infection, but IFN-λ cannot compensate for IFN-α/β signaling in the spleen.
Strengths:
(1) Both the methods and results from the comprehensive, well-designed, and well-executed experiments are considered excellent. The results are well and correctly described in the result narrative and well presented in both the manuscript and supplement Tables and Figures. Excellent discussion/interpretation of results.
(2) The successful generation of the type I and type III IFN KO lines offers unprecedented insight and opens multiple new venues for exploring the IFN system in chickens. The new knowledge reported here is direct evidence of the high impact of this model system on effectively addressing a critical knowledge gap in avian immunology.
(3) The thoughtful selection of highly relevant viruses to poultry and human health for the in ovo and in vivo challenge studies to examine and assess host-pathogen interactions in the IFNR KO and WT lines.
(4) Making use of the unique opportunities in the chicken model to examine and evaluate the host's IFN system responses to various viral challenges in ovo, before conducting challenge studies in hens.
(5) The new knowledge gained from the IFNAR1 and IFNLR1 KO lines will find much-needed application in developing more effective strategies to prevent health challenges like avian influenza and its devastating effects on poultry, humans, and other mammals.
(6) The excellent cooperation and contributions of the co-authors and institutions.
Weaknesses:
No weaknesses were identified by this reviewer.
We thank Reviewer #1 for the very positive and thoughtful evaluation of our manuscript. We appreciate the recognition of the effort involved in generating and characterizing the IFNAR1<sup>-/-</sup> and IFNLR1<sup>-/-</sup> chicken lines and for highlighting their significance as valuable tools for advancing avian immunology.
We are grateful for the reviewer’s clear summary of our findings and for acknowledging the quality of the experimental design, data presentation, and interpretation. The encouraging feedback affirms the broader impact of our study and its contribution to understanding type I and type III interferon biology and antiviral defense mechanisms in chickens.
We have carefully considered all reviewer comments and revised the manuscript accordingly to further clarify methodological details and improve the presentation of our results.
Reviewer #1 (Recommendations for the authors):
Minor suggestions/corrections:
(1) Line 192, 193, 196 - the superscript "+" sign appears to be underlined.
We corrected the formatting of all superscript "+" symbols (L 192-196).
(2) L195: ...in the spleen "of both IIFNR KO lines" (or some clarification of what you are comparing).
The sentence was revised to read “in the spleen of both IFNR knockout lines” for clarity (L 195).
(3) L198: replace "highlighting" with "and".
“Highlighting” was replaced with “and” as suggested (L 198).
(4) L231 and 235: change "monocytes" to "macrophages" as this description appears to refer to spleen cells. Also, make this change in Figure 3b and in the Figure 3 caption (e.g. monocytes/macrophages).
“Monocytes” was replaced with “macrophages” to accurately describe spleen cells. The same correction was made in Figure 3b and the Figure 3 caption as well as in the supplementary Figure 4 (L 229-234).
(5) L257: indicate this significant difference in Figure 5b.
The significant difference has now been clearly indicated in Figure 5b.
(6) L420, 421: change "monocytes" to "macrophages" as this discussion appears to refer to the spleen.
“Monocytes” was replaced with “macrophages” to reflect the correct cell type discussed in the spleen context (L 226-227).
(7) L564-565: has the anti-human MX antibody been shown to cross-react with chicken Mx?
We thank the reviewer for this valuable comment. Yes, the cross-reactivity of the anti-human MxA monoclonal antibody (clone M143, mouse IgGκ; Merck, Germany) with chicken Mx protein has been previously demonstrated. This antibody has been used successfully to detect chicken Mx in several published studies, including Schusser et al., Journal of Virology (2011). Accordingly, supporting references have been added to the revised manuscript (L584-586).
(8) L608: how were PBMC and splenocytes (mononuclear spleen cells?) isolated -Line 647 on page 14 mentions their isolation using Histopaque-1077 density gradient centrifugation
We thank the reviewer for this helpful comment. A detailed description of the isolation procedure for PBMCs and mononuclear spleen cells has now been added to the Materials and Methods section under the new subsection titled “Isolation of peripheral blood and splenic mononuclear cells” In this section, we specify that both PBMCs and splenic mononuclear cells were isolated using Histopaque®-1077 density gradient centrifugation as described on page (14), lines (668-676)
Reviewer #2 (Public review):
Summary:
This study attempts to dissect the contributions of type I and type III IFNs to the antiviral response in chickens. The first part of the study characterises the generation of IFNAR and IFNLR KO chicken strains and describes basic differences. Four different viruses are then tested in chicken embryos, while the subsequent analysis of the antiviral response in vivo is performed with one influenza H3N1 strain.
Strengths:
Having these two KO chicken strains as a tool is a great achievement. The initial analysis is solid. Clear effect of IFNAR deficiency in in vivo infection, less so for IFNLR deficiency.
Weaknesses:
(1) The antibody induction by KLH immunisation: No data indicated whether or not this vaccination induces IFN responses in wt mice, so the effects observed may be due to steady-state differences or to differential effects of IFN induced during the vaccination phase. No pre-immune results are shown. The differences are relatively small and often found at only one plasma dilution - the whole of Figure 4 could be condensed into one or two panels by proper calculation of Ab titers - would these titres be significantly different? This, as all of the other in vivo experiments, has not been repeated, if I understand the methods section correctly.
We thank the reviewer for the valuable comments and helpful suggestions.
Regarding interferon induction by KLH immunisation, we agree that KLH is not known to strongly induce type I or type III interferon responses. Importantly, the goal of this experiment was not to quantify IFN induction per se, but to assess how the absence of IFN receptors affects adaptive antibody responses under standard immunisation conditions. KLH is a highly immunogenic, copper‑containing extracellular oxygen‑carrier protein derived from the marine gastropod Megathura crenulata and is widely used as a T cell–dependent model antigen to study B‑cell activation, antibody production, and class switching in vivo (Harris & Markl, Micron 1999, doi: 10.1016/s0968-4328(99)00036-0; Schusser et al., 2016, doi: 10.1002/eji.201546171). Because chickens are extremely unlikely to encounter KLH under natural conditions, KLH behaves as a neo‑antigen, and anti‑KLH antibodies can be considered to arise from de novo adaptive responses rather than pre‑existing antigen experience. Owing to its structural complexity and unusual glycosylation, KLH provides broad antigenic stimulation and engages adaptive immune mechanisms largely independently of pathogen‑specific innate pattern recognition, while still supporting robust T helper cell responses (Swaminathan et al., 2014, doi: 10.1111/bcp.12422; Geyer et al., 2004, doi: 10.1016/j.micron.2003.10.033). This makes KLH particularly suitable for dissecting intrinsic differences in adaptive immune responses between genotypes.
We have now included pre-immune plasma controls (Figure 4 c, d), demonstrating that baseline antibody levels did not differ statistically between groups and were negligible prior to immunisation.
As for the use of different plasma dilutions, this was necessary to ensure that all samples were measured within the linear detection range of our in-house ELISA. For example, after the primary immunisation, IgY concentrations were relatively low (e.g., day 5 post-immunisation), and plasma samples had to be diluted only 1:100 to detect measurable differences between groups. In contrast, after the booster immunisation, IgY concentrations increased substantially, and lower dilutions such as 1:100 led to signal saturation. Therefore, higher dilutions (up to 1:1600) were required to keep the values within the measurable range.
Following the reviewer’s recommendation, we have now unified the presentation of results by showing data at a single representative dilution for each isotype: 1:100 for IgM (Figure 4C) and 1:1600 for IgY (Figure 4D). These dilutions fall within the linear part of the standard curve to distinguish between groups. We also calculated endpoint antibody titers, which confirmed that the observed differences remain statistically significant (p < 0.05).
Regarding experimental replication, the study design already incorporated sufficient biological replication and longitudinal sampling to ensure robustness of the findings. Each experimental group consisted of ten animals, including three animals that served as negative controls. In addition, animals were sampled at multiple time points following immunisation, allowing the dynamics of the antibody response to be monitored over time. This longitudinal design provides repeated biological measurements within the same experimental cohort and allows confirmation of consistent response patterns across time points. All ELISA measurements were performed in technical triplicates. Together, the combination of adequate group size, appropriate controls, repeated sampling over time, and technical replication provides sufficient statistical power and internal validation of the observed effects. Furthermore, all animal experiments were conducted under strict approval of the Government of Upper Bavaria and in accordance with German animal welfare regulations, which limit unnecessary repetition of in vivo experiments beyond the approved experimental design.
(2) The basic conundrum here and in later figures is never addressed by the authors: Situations where IFN type 1 and 3 signalling deficiency each have an independent effect (i.e., Figure 4d) suggest that they act by separate, unrelated mechanisms. However, all the literature about these IFN families suggests that they show almost identical signalling and gene induction downstream of their respective receptors. How can the same signalling, clearly active here downstream of the receptors for IFN type 1 or type 3, be non-redundant, i.e., why does the unaffected IFN family not stand in? This is a major difference from the mouse studies, which showed a rather subtle phenotype when only one of the two IFN systems was missing, but a massive reduction in virus control in double KO mice (the correct primary paper should be quoted here, not only the review by McNab). Reasons could be a direct effect of IFNab on B cells and an indirect effect of IFNL through non-B cells, timing issues, and many other scenarios can be envisaged. The authors do not address this question, which limits the depth of analysis.<br />
We thank the reviewer for this insightful comment. Indeed, this represents one of the most interesting and novel findings of our study. Unlike in mice, where both type I and type III interferon systems need to be disrupted to observe clear susceptibility to influenza infection, in our chicken model the loss of IFNAR1 alone was sufficient to render the animals highly susceptible. This highlights a key difference between mammalian and avian interferon biology and supports the main goal of our work, to investigate the specific biological activities of avian interferons rather than directly transferring conclusions from mammalian systems.
In relation to Figure 4d (anti-KLH IgY), we observed that both IFNAR1<sup>-/-</sup> and IFNLR1<sup>-/-</sup> animals reduced IgY levels compared to wild type at day 3 after the booster immunisation. However, by day 5 post-booster, IgY levels in IFNLR1<sup>-/-</sup> animals had returned to wild-type levels, while IFNAR1-/- animals still showed significantly lower IgY. This indicates that type III IFN contributes to the early phase of the IgY response but that its absence can later be compensated by type I IFN signalling. In contrast, loss of type I IFN cannot be compensated by type III IFN, suggesting that type I IFN plays a more dominant or sustained role in antibody induction.
Although type I and type III IFNs share overlapping signaling pathways and induce similar sets of ISGs, their effects are not entirely redundant in chickens. A likely explanation is the difference in receptor distribution: IFNAR1 is broadly expressed across most cell types, while IFNLR1 expression is mainly confined to epithelial cells (Reuter et al. 2014, doi: 10.1128/jvi.02764-13; Santhakumar et al., 2017, doi: 10.3389/fimmu.2017.00049). This systemic versus localized receptor pattern likely determines the range of responsive cells and may account for the differential outcomes observed when either receptor is absent.
Taken together, our findings indicate that while type I and type III IFNs share overlapping signaling mechanisms, they maintain distinct biological functions in chickens, consistent with their differing receptor expression and cellular responsiveness. This contrasts with mammalian models, where redundancy between these systems is more apparent and only double knockouts show strong phenotypes especially during influenza infection (Mordstein et al., 2008, doi: 10.1371/journal.ppat.1000151; Mordstein et al., 2010, doi: 10.1128/jvi.00272-10). We have now cited this primary study instead of the McNab review and expanded the Discussion to reflect this interpretation (Page 10, Line 463-467).
(3) In the one in vivo experiment performed with chickens, only one virus was tested; more influenza strains should be included, as well as non-influenza viruses.
We thank the reviewer for this valuable suggestion. The main objective of the present study was to generate and characterize novel chicken models lacking type I and type III interferon receptors in order to investigate their physiological relevance and to obtain the first insights into their roles during viral infection with more emphasis on avian influenza. As part of this manuscript, we performed detailed in ovo experiments using both influenza and non-influenza viruses (Figure 6). These included three influenza strains: H1N1, a mammalian-adapted strain; H3N1, a low pathogenic avian strain showing features of high pathogenicity; and H9N2, a low pathogenic avian strain, as well as a non-influenza virus, the infectious bronchitis virus (IBV). The in ovo analyses revealed clear strain-dependent modulation of interferon responses, and have provided a comprehensive overview of virus-specific interferon activity in chickens. The subsequent in vivo experiment was therefore designed as a proof of concept using the most suitable viral strain to robustly challenge the immune system and to identify the distinct functions of chicken interferons.
(4) The basic conundrum of point 2 applies equally to Figure 6a; both KOs have a phenotype. Again in 6d, both IFNs appear to be separately required for Mx induction. An explanation is needed.
We thank the reviewer for raising this important point. We have revised the Discussion (page 10, lines 442-454) and provided supporting references to clarify how the composition of the chorioallantoic membrane (CAM) and virus tropism together determine the apparent requirement for type I and type III interferons. The CAM contains both epithelial and mesodermal–vascular layers, which support complementary interferon functions: type I IFN acts mainly in systemic and vascular compartments, while type III IFN provides localized protection at the epithelial surface. Consequently, viruses that replicate in both compartments (e.g., WSN33, H3N1) require both IFN pathways for maximal Mx induction (Figures 6a, 6d), whereas viruses with a predominant or prolonged epithelial phase (e.g., H9N2, IBV) at the time point analyzed are effectively controlled by type I IFN signaling alone.
These differences likely reflect virus-specific factors, including cell tropism, replication kinetics, and the spatial–temporal dynamics of receptor expression and signaling. Notably, our measurement of Mx expression at 24 hours post infection (hpi) may represent a phase when type I IFN signaling is dominant and can compensate for the absence of type III IFN. It remains possible that IFN-λ plays a more critical, non-redundant role at earlier stages post infection, when rapid antiviral protection is first required at the epithelial surface. Thus, the apparent redundancy observed at 24 hpi likely reflects temporal compensation and crosstalk between the IFN pathways rather than a lack of biological relevance for type III IFN.
(5) Line 308, where are the viral titers you refer to in the text? The statement that the results demonstrate that excessive IFNab has a negative impact is overstretched, as no IFN measurements of the infected embryos are shown here.
We thank the reviewer for this comment and would like to clarify that measurements of type I IFN (IFN-α/β) concentrations were indeed performed. The data are presented in Figure 6b and cited in the Results section (“Knockout of IFNAR1 and IFNLR1 did not affect IFN-α/β secretion in ovo”). To avoid misunderstanding, the Results section has been revised to explicitly reference the IFN-α/β measurements supporting this conclusion (line 302-309).
These data indicate that all genotypes produced comparable IFN-α/β levels upon viral infection, with the IBV infection inducing approximately tenfold higher IFN-α/β secretion than the influenza strains tested (Figure 6b). The interpretation that an excessive type I IFN response can negatively affect host fitness is based on the combination of quantified IFN-α/β data (Figure 6b) and survival probability results (Supplementary Figure 10), where embryos exhibiting the highest IFN-α/β levels (embryos of all genotypes infected with IBV and embryos infected with IFNLR1<sup>-/-</sup> H9N2) showed the poorest survival despite moderate or low viral titers.
(6) The in vivo infection is the most interesting experiment, and the key outcome here is that IFN type 1 is crucial for anti-H3N1 protection in chickens, while type 3 is less impactful. However, this experiment suffers from the different time points when chickens were culled, so many parameters are impossible to compare (e.g., weight loss, histopathology, IFN measurements, and more). Many of these phenomena are highly dynamic in acute virus infections, so disparate time points do not allow a meaningful comparison between different genotypes. What are the stats in 7b? Is the median rather than the mean indicated by the line? Otherwise, the lines appear in surprising places. SD must be shown, and I find it difficult to believe that there is a significant difference in weight, for e.g., IFNAR KO, unless maybe with a paired t test. What is the statistical test?
We thank the reviewer for these thoughtful comments and agree that disease progression and sampling time can influence comparisons in acute infection studies. Hens were euthanized upon reaching predefined humane endpoint scores in full compliance with the Bavarian animal welfare regulations. Because the infection produced markedly different clinical kinetics among genotypes, all data were interpreted with reference to matched disease stages rather than absolute days post-infection.
For matched comparisons: Viral titers in the trachea and cloaca, as well as plasma IFN-α/β concentrations, were compared between day 2 in IFNAR1<sup>-/-</sup> hens and day 3 in WT and IFNLR1<sup>-/-</sup> hens, which represent equivalent clinical stages before the sharp viral rise seen later in WT and IFNLR1<sup>-/-</sup> birds. At these comparable stages, viral titers were still low and IFN-α/β concentrations remained significantly lower in WT and IFNLR1<sup>-/-</sup> than in IFNAR1<sup>-/-</sup> hens (Figure 7c, d, f), indicating that uncontrolled viral replication and IFN-α/β secretion in the absence of type I signaling occur earlier and more intensely.
For Figure 7b: Because chickens reached humane endpoints at different days post infection (2 dpi for IFNAR1<sup>-/-</sup> and 5–7 dpi for WT and IFNLR1<sup>-/-</sup>), statistical comparisons were performed within each genotype using paired t-tests and all data were shown together as mean ± SD.
We acknowledge that unequal survival times limit direct temporal comparison. However, the consistent pattern across all parameters including early severe disease, high viral load, and excessive IFN-α/β secretion in IFNAR1<sup>-/-</sup> hens versus delayed onset in WT and IFNLR1<sup>-/-</sup>, supports the conclusion that type I IFN signaling is essential for early viral restriction and host survival, while type III IFN contributes mainly to localized inflammatory responses. The experiment cannot be repeated under the current animal welfare authorization.
(7) Figures 7e,f: these comparisons are very difficult to interpret as the virus loads at these time points already differ significantly, so any difference could be secondary to virus load differences.
We thank the reviewer for this valuable comment. We agree that viral load can influence interferon induction; however, our comparisons in Figures 7e and 7f were designed to reflect equivalent stages of disease progression rather than identical time points post-infection. For IFN-λ mRNA expression (Fig. 7e), spleens from IFNAR1<sup>-/-</sup> hens were sampled on day 2 post-infection, when viral titers were maximal, and compared to WT and IFNLR1<sup>-/-</sup> hens sampled on day 5 post-infection, at which point viral titers reached comparable levels. Thus, this comparison represents the phase of peak infection and systemic immune activation across all genotypes rather than an absolute temporal comparison.
Similarly, for IFN-α/β concentrations (Fig. 7f), two levels of comparison were made: between IFNAR1<sup>-/-</sup> hens at day 2 post-infection (high viral titer) and WT and IFNLR1<sup>-/-</sup> hens at day 3 (low viral titer), and between WT and IFNLR1<sup>-/-</sup> hens at day 5 post-infection (high viral titer). In both cases, IFN-α/β levels remained disproportionately elevated in IFNAR1<sup>-/-</sup> hens, indicating that the excessive type I IFN response is primarily due to the loss of receptor-mediated feedback regulation rather than viral load alone.
We have clarified this rationale in the legend of figure 7 and in the results (Line 338-345). We believe these results are valuable as they provide important insight into the temporal dynamics and regulatory interplay between type I and type III interferons during avian influenza infection.
Reviewer #2 (Recommendations for the authors):
Experiments need to be repeated. Comparisons in infection experiments must be done on the same day. More viruses need to be tested.
We thank the reviewer for these constructive recommendations. All infection experiments were conducted under approved animal welfare regulations, which limited the number of replicates and prevented repeating in vivo challenges beyond the authorized design, in line with the 3R principles, particularly Reduction, to avoid unnecessary animal use. To ensure comparability, samples were analyzed at matched disease stages rather than identical time points, as clarified in the revised figure legends (figure 7) and Results (Line 338-345). The study already includes multiple influenza and non-influenza viruses (H1N1, H3N1, H9N2, and IBV) tested in ovo to capture virus-specific interferon responses, while the in vivo H3N1 infection served as a proof-of-concept to dissect genotype-specific immune dynamics.
I have chronic pain issues and I discovered that fixing and fiddling with typewriters helped me focus on other tasks and ignore the pain. So I ended up with about 150 typewriters. I sold about a hundred now and still wants to pare down my 'collection' to 20-25 machines.
via u/AmsterdamAssassin at https://www.reddit.com/r/typewriters/comments/1tq3nub/i_woke_up_one_day_looked_at_my_machines_and/
eLife Assessment
This important study implicates that changes in cell regulation may contribute to the evolution of multicellularity. The evidence supporting the conclusions is convincing, with rigorous methods used to test alternative hypotheses. The work will be of broad interest to cell and evolutionary biologists and those studying the cell cycle and cancer.
Reviewer #1 (Public review):
Summary:
Ducrocq et al. present research exploring the genetic link between simple multicellular group formation (ace2Δ/ace2Δ) and its interaction with cell-cycle progression mutants (e.g., cln3Δ/cln3Δ), demonstrating that this combination can provide fitness benefits during fluctuating resource conditions, resulting in a rapid increase in the fraction of multicellular cell-cycle mutants over unicellular yeast without selection for multicellular size. Because both the multicellular phenotype and the regulatory link enabling faster escape from the stationary phase are controlled by the ACE2 transcription factor, this work demonstrates that multicellular cluster formation can arise as a side effect of a completely independent fitness advantage unrelated to the benefits of group formation itself. As a "passenger phenotype," multicellularity could thus emerge for other selective reasons, potentially facilitating a later transition to more entrenched multicellularity if novel conditions arise that make multicellular group formation directly beneficial.
Importantly, while the literature generally assumes that multicellular group formation incurs a cell-level fitness cost, this work demonstrates that certain genetic - environmental interactions can confer fitness benefits even at the level of individual cells forming multicellular groups. This finding should inspire both theoretical and empirical work exploring multicellular group formation selected for benefits at the level of individual cells, rather than the benefits of forming a larger organismal size that most work has relied on so far.
Strengths:
This work is novel and exciting for research exploring the very first steps of the transition from unicellularity to simple multicellularity. The formation of multicellular groups is almost always assumed to come at a cell-level fitness cost due to reduced reproductive fitness compared to remaining unicellular, which generally needs to be outweighed by the benefits of multicellular group formation (e.g., large size to escape predation) for the multicellular phenotype to be stable. However, this study presents an interesting case of a genetic and environmental condition under which individual cells forming simple multicellular clusters can actually have higher reproductive fitness than solitary living yeast cells. This contrasts with previous snowflake yeast studies where the multicellular phenotype was primarily beneficial due to strong selection for large groups (rather than cell-level fitness gains).
The claims and interpretation of the results align well with the data presented. This is due to the careful and straightforward experimental design testing predictions with a clear, stepwise methodology. The authors rule out alternative explanations and provide support for the proposed link between the mutations (ace2, cln3, and others), their impact on faster exit from quiescence and earlier entry into reproduction in fresh media, and the resulting higher fitness in the snowflake yeast phenotype compared to unicellular yeast.
This experimental framework (combining cell-cycle mutants under the same multicellular background) is very much likely to be adopted by others in the community to explore downstream implications of these results in laboratory and environmental yeast isolates.
Weaknesses:
The authors show that the same multicellular phenotype with higher cell-level fitness due to faster exit from the stationary phase can also be observed with alleles found at other loci in non-laboratory yeast strains, implying that the results are likely not specific to a peculiar case genetically engineered in laboratory strains, but that similar phenotypes may be present in nature. However, this remains to be explored by examining the natural ecology of commercially available or wild yeast isolates and their genomes. This is not a weakness of this study per se, but rather a direction for future work. It does mean, however, that the relevance of these findings for early multicellularity in yeast, and even more so for nascent multicellularity in distinct taxa, remains to be explored in the future. Until then, it is difficult to make strong claims about how applicable these results would be for non-laboratory yeast and other taxa. Regardless, this work represents a very exciting finding.
Comments on revised version:
The authors addressed all concerns thoroughly.
Author response:
The following is the authors’ response to the original reviews.
Public Reviews:
Reviewer #1 (Public review):
Summary:
Ducrocq et al. present research exploring the genetic link between simple multicellular group formation (ace2Δ/ace2Δ) and its interaction with cell-cycle progression mutants (e.g., cln3Δ/cln3Δ), demonstrating that this combination can provide fitness benefits during fluctuating resource conditions, resulting in a rapid increase in the fraction of multicellular cell-cycle mutants over unicellular yeast without selection for multicellular size. Because both the multicellular phenotype and the regulatory link enabling faster escape from the stationary phase are controlled by the Ace2 transcription factor, this work demonstrates that multicellularity can arise as a side-effect of a completely independent fitness advantage unrelated to the benefits of group formation itself. As a "passenger phenotype," multicellularity could thus emerge for other selective reasons, potentially facilitating a later transition to more entrenched multicellularity if novel conditions arise where group formation becomes directly beneficial.
Strengths:
This work is novel and exciting for research exploring the very first steps of the transition from unicellularity to simple multicellularity. This is particularly significant because the formation of multicellular groups is almost always assumed to come at a cell-level fitness cost due to reduced reproductive fitness compared to remaining unicellular. This cell-level fitness cost generally needs to be outweighed by the benefits of multicellular group formation (e.g., large size escaping predation) for the multicellular phenotype to be stable, which is true for a large number of cases studied in the literature, where the multicellular phenotype can only evolve over unicellular competitors under strong selection for multicellular groups. However, this study presents an interesting case of a genetic and environmental condition under which individual cells (forming simple multicellular clusters) can actually have higher reproductive fitness than unicellular yeast. This demonstrates that the assumed cost at the single-cell level does not always apply. In summary, this work represents a unique example contrary to common assumptions regarding the costs of multicellular phenotypes, showing that simple multicellular phenotypes can evolve and remain stable without requiring strong selection for multicellular size or other benefits of group formation.
The claims and interpretation of the results align well with the data presented. This is due to the careful and straightforward experimental design testing predictions with a clear, stepwise methodology, ruling out alternative explanations and providing support for the proposed link between the mutations (ace2, cln3, and others), their impact on faster exit from quiescence, and thus earlier entry into reproduction in fresh media, resulting in higher fitness in the snowflake yeast phenotype compared to unicellular yeast.
Weaknesses:
The authors show that the same multicellular phenotype with higher cell-level fitness due to faster exit from the stationary phase can also be observed with alleles found at other loci in non-laboratory yeast strains, implying that the results are likely not specific to a peculiar case genetically engineered in laboratory strains, but that similar phenotypes may be present in nature. However, this remains to be explored further by examining the natural ecology of commercially available or wild yeast isolates and their genomes. This is by no means a weakness of this study and, therefore, not necessarily something the current work can improve. It does mean, however, that the relevance of these findings for early multicellularity in yeast, and even more so for nascent multicellularity in distinct taxa, remains to be explored in the future. Until then, it is difficult to make strong claims about how applicable these results would be for non-laboratory yeast and other taxa. Regardless, this work does its part by representing a very exciting finding.
Reviewer #2 (Public review):
Summary:
Here, the authors attempt to demonstrate that a simple model of multicellularity - snowflake yeast - exhibits key ecologically relevant changes in the regulation of the cell cycle. By examining the effects of the ace2 mutation in environments where multicellularity is not directly selected for or against, and combining it with mutations in key cell cycle regulators, they hope to show that mutations driving simple multicellularity can be selectively favored due to their effects on the release from quiescence rather than their effects on multicellularity itself.
Strengths:
The experiments performed are extensive and thorough. The yeast genotypes examined are judiciously chosen, so as to map out a functional model of the relationship between alterations to cell cycle control and changes to multicellularity phenotypes. Multiple possible interactions are examined, with the causal link and model of the relationship between the multicellular passenger phenotype and the selectable quiescence-release phenotype being well-supported. There are extensive controls demonstrating the separation between the 'passenger' multicellular phenotype and the cell cycle regulation phenotypes examined, including haploid/diploid strains with different multicellular phenotypes but similar cell cycle regulation phenotypes, and phenocopy strains in which downstream enzymes are deleted rather than key central regulators.
Weaknesses:
My only concerns about these results relate to the focus on selection on cell cycle control being examined in a model of multicellularity with key core cell cycle mutations rather than in a wild-type background, as this is a somewhat artificial system.
I believe, however, that the authors convincingly make their case that this work on the multicellular phenotypes of yeast represents a potent proof-of-concept that simple multicellularity can be driven into existence or selected for as a passenger phenotype due to pleiotropic effects of mutations under selection from real-world ecological pressures. They are able to connect this phenotype back to known mutations of particular cell cycle regulators (RB) in other multicellular lineages and demonstrate that ecologically relevant changes to the cell cycle are connected to multicellular phenotypes. As a proof of concept of the connection between these phenotypes, rather than a study of a particular event in the past of a living lineage, it makes a strong case.
A longstanding question in the field of multicellularity is the selective pressures that can drive simple multicellularity into existence and then act on simple multicells to drive their increased size and complexity. This work brings to the table tangible evidence of the possibility that, instead of being selected for on its own, simple multicellularity can be a side-effect of selection on other key phenotypes.
This separates the question of the origins of multicellularity and the forces that drive its further evolution. This separation can reframe how the field is studied, especially in the context of the apparent dichotomy between dozens of origins of 'simple' multicellularity across the tree of life and a few origins of 'complex' multicellularity in the history of Earth. Especially in light of other evidence that multicellularity is connected to changes in cell cycle regulation, I believe that this is an important insight that will alter the way we think about the origins of this key evolutionary transition.
We thank the reviewers for their insightful comments on our work.
We agree with reviewer #1 that further experiments would be needed to figure out how the observations done on lab strains can apply to yeast in various ecological conditions and particularly in the wild. We here provide a proof of principle that multicellularity selection can arise as a side-effect. It obviously does not prove that it took place during yeast evolution, but we would like to emphasize that resource fluctuations are very common in ecological conditions, making it highly likely that the environmental conditions necessary for the selection of the side effects described have arisen.
We agree with reviewer #2 that our work on yeast strains is “somewhat artificial” as often the case with model organisms under laboratory conditions. Importantly though, we showed that the effect found with the cln3 knock-out mutation can be phenocopied by overexpression of WHI5 (encoding the yeast equivalent of Rb). We propose that variations in the levels of cell cycle regulators during evolution may have played a role in multicellularity selection as a side effect. We agree that this is merely a hypothesis to explain the selection of multicellularity (just like predator escape) and that there is no direct evidence that this occurred in the history of the lineage. Nevertheless, our work provides a first evidence that such a selection of multicellularity as a side effect could be possible, and gives a framework to understand how multicellularity can persist in the wild, even when it is not the primary target of selection.
Recommendations for the authors:
Reviewer #1 (Recommendations for the authors):
As mentioned in my public review, I very much appreciate this work, its interpretation for early multicellularity as an example opposite to the assumed cost of multicellular phenotypes, and the robust design behind the premise and claims. Therefore, my suggestions below are mostly aimed at improving the readability and data presentation.
(1) In the abstract, Lines 24-27 (the last sentence): This statement is worded too generally and therefore reads as too strong. I think the authors' work provides an example that multicellularity itself does not need to be beneficial all the time - this is really exciting and makes sense! However, there is a substantial body of work showing the origin and maintenance of multicellularity for its direct benefits. Relative to that body of work, this represents a special case, and therefore, while we should definitely reconsider the view that "multicellularity always comes at a cell-level fitness cost," we cannot overgeneralize these findings. Please consider reframing this statement.
Done, now line 25 (addition of “in some cases”)
(2) Line 48 (Introduction): "This mostly concerns two major regulators, RB and Cyclin D." Which organisms are you referring to? Please specify.
Done.
(3) In the Introduction, there are at least three sentences that need citations: L57-58, L59-60, and L65. For instance, I do not know what makes CLN3 the yeast functional equivalent of RB, and I wanted to verify this claim, but no references are cited. Please ensure citations are provided throughout the manuscript.
Done: ref 11,12 and 13 were added
(4) This is my main request regarding data collection and presentation. The authors share some microscopy images of mutant strains in Figure 2 for different purposes (e.g., Figure 2B compares the fraction of budded cells between two genotypes). However, I would appreciate seeing a collected microscopy figure showcasing the phenotypes of all genotypes that went into competition experiments, including the planktonic (WT lab strain) yeast, either where they appear or in a supplementary figure, all presented with the same magnification and scale to make them comparable. Because cell size, shape, and multicellular phenotype are all key aspects of the competition experiments, being able to see all those genotypes/phenotypes would prepare the reader to make predictions about the fitness assays and other experiments.
Done Supplementary Figure 1 B-E were added
(5) Related to my previous point, I would appreciate seeing cell size measurements for the different genotypes (both single cells of planktonic genotypes and single cells forming multicellular clusters). Cell size is a key trait that directly impacts the results shown in the paper, and summary statistics comparing them would be helpful for interpreting the results.
Done Supplementary Figure 1 F was added
(6) In competition experiments, the authors mix unicellular and multicellular yeast clusters at 50/50 and measure the fraction of a phenotype of interest (usually the % of snowflake). It took me a while to understand what is being counted under the "% snowflake yeast" category. This is because, while each cell in unicellular yeast should be counted as one unit, one can count a snowflake yeast composed of 50 cells as 50 units or as 1 unit. Please clearly state what is being counted for the Y-axis labeled "% of snowflake yeast" (or relabel those Y-axes in plots to make this clear).
Done: Added in figure legend 1A and Y-axes of competition figures
(7) I recommend editing the genotype labels in figures (see, for instance, Figure 1B, C, D). In Figure 1B, the bars are labeled as "CLN3/CLN3 co-culture" or "cln3Δ/cln3Δ co-culture," etc. These are actually co-cultures of SF vs. PK (with or without a CLN3 copy). Please consider using more representative labels that will be easier for readers to understand.
Done: this has been changed in all concerned figures
(8) In the Results, L225, you begin referring to AMN1368D as AMN1. I suggest using the full allelic form throughout the text so it will be clear each time that you are referring to that specific allele, as I was confused about whether you were discussing the allele or the gene AMN1 itself.
This has been changed throughout the text.
(9) Discussion, Lines 250-252, states that this is a "situation that is likely to happen very often under ecological conditions." Are there any examples you can cite?
Done, as also requested by reviewer #2 (now line 256-7)
(10) Lines 272-275 contain a strong, general statement suggesting that co-evolution of cell cycle regulation and multicellularity could be more general (which is acceptable as speculation). However, the suggestion that this co-evolution could have "started very early in the evolution of eukaryotic cells" is too speculative. I would recommend sticking with the alternative, suggesting that the link between the two phenotypes may be a case of convergent evolution.
Done
(11) Lines 278-279 are both vague and too bold. The text mentions a link between cancer and multicellularity and then extends this link through cell cycle regulators. Without explaining the connection between cancer and multicellularity and then trying to link it to cell cycle regulators, all in a few words without background, this sentence is too vague. Please consider deleting this or spending more time clearly explaining the link, which would at best still be speculative.
These speculative sentences were removed.
(12) First, I wanted to note that I highlighted Lines 284-287, as this passage is clearly written and provides a nice argument. I also wonder if you could mention that your work shows simple multicellular cluster formation should not always come at a cost, contrary to the general assumption in the literature, and add a few citations to support that claim. This would highlight how significant this work is within the broader multicellularity literature.
Changed in discussion (now line 242-4 with additional references 30 and 31)
(13) I recommend labeling the genotype of your "quintuple mutant" in Figure 3. You can refer to it as the quintuple mutant in the text, but I had to go back and forth to see what those mutations were when trying to think about potential genetic interactions. Even the legend of Figure 3 does not specify the genotype and refers to it only as the "quintuple mutant."
Now explicitly stated in the title of the figure
Reviewer #2 (Recommendations for the authors):
I find the presented research to be of high quality, with very important implications. I have suggestions for improvement of the manuscript, but they are largely stylistic, with one paper that I believe deserves citation regarding the proteins involved. I see little need for additional experiments or analysis, just a clearer description of the results and their significance.
(1) Line 62: Yeast CLN3 definitely performs the same role as cyclin D in the cell cycle, but has an unclear phylogenetic relationship with the rest of the cyclins. See Cross, Buchler, & Skotheim 2011 ("Evolution of networks and sequences in eukaryotic cell cycle control"). This reference also covers the functional relationship between RB and Whi5, referred to in nearby sentences, as does Medina, Walsh, and Buchler 2019 ("Evolutionary innovation, fungal cell biology, and the lateral gene transfer of a viral KilA-N domain").
The reference has been added
(2) Line 69: Is the question whether the evolution of G1/S regulation favoring multicellularity the question, or the two of them being connected such that the evolution of one can affect the other?
It is clearly the first of the two questions.
(3) Line 73: Comma after Ace2.
Done
(4) Line 76: It would be clearer to specify that snowflake and ACE2 yeast were co-cultured without settling selection or other selection that explicitly favors multicellularity, unlike in experiments where multicellular evolution is observed, as in Ratcliff publications.
This is now specified.
(5) Line 80: Specify which phenotypes observed for ace2 mutants are observed, specifically, both the multicellularity and the release from quiescence.
Done
(6) Line 146: This observation should be noted as another indication that the multicellular phenotype is not behind the selective pressure, because it is so different between unicells and multicells.
Overall, you have very strong evidence that this is the case, and emphasizing this would benefit the paper!
Done.
(7) Line 151: specify that you are maintaining yeast in proliferation in coculture.
Done.
(8) Line 181: This is another key experiment showing that the multicellular phenotype is not the causal reason for the change in quiescence. It might make things clearer to bring all these confirmatory experiments together, particularly the haploids and the sonicated single cells.
This is now clearly stated line 195.
(9) Line 225: The choice of referring to the non-laboratory strain as the 'AMN1' wild type default may be confusing to readers, who may treat the genetic background you are using as the ground truth wild type. I recommend throughout the paper always specifying the allele's amino acid to avoid any confusion.
The genotype is now clearly presented throughout the text.
(10) Line 238: I would continue to specify that the multicellular phenotype has no selective advantage, specifically when no selection for size is applied.
See added sentence Line 242-4 (revised version)
(11) Line 243: I would say that the evolution of cell cycle regulation may interact with the multicellular phenotype.
This was changed (now line 248)
(12) Line 244: Strike 'indeed' and the 'the' before AMN1 and ACE2.
Done
(13) Line 252: Suggest some ecological conditions under which quiescence exit is likely, such as boom and bust or moving from rotting fruit to rotting fruit.
Done
(14) Line 267: Are you suggesting that the specific genes AMN1 and ACE2 had particular effects on actual organisms in the past, or that it represents a broad pattern of evolution in which multicellularity could be more broadly related to exit from quiescence? I believe it is the latter, and I think that should be clearer.
Modified as suggested
(15) Line 280: In this paragraph, I think that the point being made could be slightly clearer - if I am not mistaken, you are making the distinction between the appearance of multicellularity and its refinement under selection, and that the former may be more common than previously believed, given this proof of concept. I think this can be made clearer. Furthermore, it is worth noting that all experiments that show effects of the multicellular phenotype are in mutant backgrounds, and explaining why this is still relevant to wild organisms. It might be taken by some as indicating that the multicellular phenotypes are not relevant to a wild population, but the connection to known RB mutations in known multicellular lineages and the fact that it is connected to a very key aspect of cell cycle regulation, I think, overcomes this issue, and this should be made clear.
Our study reveals a genetic link between multicellularity and Whi5 and Cln3, two important G1/S cell cycle regulators. Similar genetic interactions have been observed in phylogenetically distant species, reinforcing the idea that the interplay between cell cycle regulation and multicellularity is a general feature and not a mere artifact of mutant background.
The neutral fitness effect of multicellularity in wild-type backgrounds is particularly of interest. By being maintained as a side effect of selection on fundamental cellular processes, the neutral effect of multicellularity may have provided “an evolutionary scheme” for its repeated emergence throughout the tree of life. As such, the "passenger selection" hypothesis fits well with the observations of phenotypic reversibility and facultative multicellularity, despite varying and specific selective pressures. Our work thus gives a framework to understand how multicellularity can persist in the wild, even when it is not the primary target of selection.
(16) Line 314: What promoters are they driven by?
Specified
(17) Line 336: What was the culture volume, and the volume transferred?
Specified
(18) Line 362: How was the proportion of blue-stained cells scored? Manually, or with an imaging software cutoff?
Specified
(19) Figure 1: I think that the full genotypes of each strain should be specified, either in the legend or the key of the figure, rather than always specifying the ACE2 genotype and other mutations separately.
Done as requested by reviewer #1
(20) Figure 2E, 2F: Same as Figure 1, regarding genotypes.
Done
This preprint has now been published in the journal Chemosphere with the title: 'Large-scale phenotyping in a wild rhabditid nematode and C. elegans reveals differential neurobehavioral responses to a nanoscale pollutant and temperature' DOI https://doi.org/10.1016/j.chemosphere.2026.144961
eLife Assessment
This important study demonstrates that paternal diet influences not only testicular morphology but also placental and fetal development, supporting a role for paternal contributions to offspring health. The study also considers potential links between the microbiome and male reproductive health. By combining transcriptomic and histological analyses across multiple tissues, the evidence supporting the central conclusions of the study is convincing.
Reviewer #1 (Public review):
Summary:
Morgan et al. studied how paternal dietary alteration influenced testicular phenotype, placental and fetal growth using a mouse model of paternal low protein diet (LPD) or Western Diet (WD) feeding, with or without supplementation of methyl-donors and carriers (MD). They found diet- and sex-specific effects of paternal diet alteration. All experimental diets decreased paternal body weight and the number of spermatogonial stem cells, while fertility was unaffected. WD males (irrespective of MD) showed signs of adiposity and metabolic dysfunction, abnormal seminiferous tubules and dysregulation of testicular genes related to chromatin homeostasis. Conversely, LPD induced abnormalities in the early placental cone, fetal growth restriction and placental insufficiency, which was partly ameliorated by MD. The paternal diets changed placental transcriptome in a sex-specific manner and led to a loss of sexual dimorphism in the placental transcriptome. These data provide a novel insight on how paternal health can affect the outcome of pregnancies, which is often overlooked in prenatal care.
Strengths:
The authors have performed a well-designed study using commonly used mouse models of paternal underfeeding (low protein) and overfeeding (Western diet). They performed comprehensive phenotyping at multiple timepoints including of the fathers, the early placenta and late gestation feto-placental unit. The inclusion of both testicular and placental morphological and transcriptomic analysis is a powerful non-biased tool for such exploratory observational studies. The authors describe changes in testicular gene expression revolving around histone (methylation) pathways that are linked to altered offspring development (H3.3 and H3K4), which is in line with hypothesised paternal contributions to offspring health. The authors report sex differences in control placentas that mimic those in humans, providing potential for translatability of the findings. The exploration of sexual dimorphism (often overlooked) and its absence in response to dietary modification is novel and contributes to the evidence-base for the inclusion of both sexes in developmental studies.
Comments on revised version:
The authors have done a great job addressing my concerns. The description of the data analysis and the figures are now much clearer. The inclusion of the potential links between the microbiome and male reproductive fitness is informative and improves the flow of the discussion.
Reviewer #2 (Public review):
Summary:
The authors investigated the effects of a low-protein diet (LPD) and a high sugar- and fat-rich diet (Western diet, WD) on paternal metabolic and reproductive parameters and feto-placental development and gene expression. They did not observe significant effects on fertility; however, they reported gut microbiota dysbiosis, alterations in testicular morphology, and severe detrimental effects on spermatogenesis. In addition, they examined whether the adverse effects of these diets could be prevented by supplementation with methyl donors. Although LPD and WD showed limited negative effects on paternal reproductive health (with no impairment of reproductive success), the consequences on fetal and placental development were evident and, as reported in many previous studies, were sex-dependent.
Strengths:
This study is of high quality and addresses a research question of great global relevance, particularly in light of the growing concern regarding the exponential increase in metabolic disorders, such as obesity and diabetes, worldwide. The work highlights the importance of a balanced paternal diet in regulating the expression of metabolic genes in the offspring at both fetal and placental levels. The identification of genes involved in metabolic pathways that may influence offspring health after birth is highly valuable, strengthening the manuscript and emphasizing the need to further investigate long-term outcomes in adult offspring.
The histological analyses performed on paternal testes clearly demonstrate diet-induced damage. Moreover, although placental morphometric analyses and detailed histological assessments of the different placental zones did not reveal significant differences between groups, their inclusion is important. These results indicate that even in the absence of overt placental phenotypic changes, placental function may still be altered, with potential consequences for fetal programming.
Comments on revised version:
The authors have adequately addressed all my previous comments.
Author response:
The following is the authors’ response to the original reviews.
Public Reviews:
Reviewer #1 (Public review):
Summary:
Morgan et al. studied how paternal dietary alteration influenced testicular phenotype, placental and fetal growth using a mouse model of paternal low protein diet (LPD) or Western Diet (WD) feeding, with or without supplementation of methyl-donors and carriers (MD). They found diet- and sex-specific effects of paternal diet alteration. All experimental diets decreased paternal body weight and the number of spermatogonial stem cells, while fertility was unaffected. WD males (irrespective of MD) showed signs of adiposity and metabolic dysfunction, abnormal seminiferous tubules, and dysregulation of testicular genes related to chromatin homeostasis. Conversely, LPD induced abnormalities in the early placental cone, fetal growth restriction, and placental insufficiency, which were partly ameliorated by MD. The paternal diets changed the placental transcriptome in a sex-specific manner and led to a loss of sexual dimorphism in the placental transcriptome. These data provide a novel insight into how paternal health can affect the outcome of pregnancies, which is often overlooked in prenatal care.
Strengths:
The authors have performed a well-designed study using commonly used mouse models of paternal underfeeding (low protein) and overfeeding (Western diet). They performed comprehensive phenotyping at multiple timepoints, including the fathers, the early placenta, and the late gestation feto-placental unit. The inclusion of both testicular and placental morphological and transcriptomic analysis is a powerful, non-biased tool for such exploratory observational studies. The authors describe changes in testicular gene expression revolving around histone (methylation) pathways that are linked to altered offspring development (H3.3 and H3K4), which is in line with hypothesised paternal contributions to offspring health. The authors report sex differences in control placentas that mimic those in humans, providing potential for translatability of the findings. The exploration of sexual dimorphism (often overlooked) and its absence in response to dietary modification is novel and contributes to the evidence-base for the inclusion of both sexes in developmental studies.
Weaknesses:
The data are overall consistent with the conclusions of the authors. The paternal and pregnancy data are discussed separately, instead of linking the paternal phenotype to offspring outcomes. Some clarifications regarding the methods and the model would improve the interpretation of the findings.
(1) The authors insufficiently discuss their rationale for studying methyl-donors and carriers as micronutrient supplementation in their mouse model. The impact of the findings would be better disseminated if their role were explained in more detail.
We acknowledge the Reviewer’s comments regarding the amount of detail in support of the inclusion of methyl carriers and donors within our diet. Therefore, we will revise the manuscript to include more justification, especially within the Introduction section, for their inclusion. Please see lines 111-120.
(2) It is unclear from the methods exactly how long the male mice were kept on their respective diets at the time of mating and culling. Male mice were kept on the diet between 8 and 24 weeks before mating, which is a large window in which the males undergo a considerable change in body weight (Figure 1A). If males were mated at 8 weeks but phenotyped at 24 weeks, or if there were differences between groups, this complicates the interpretation of the findings and the extrapolation of the paternal phenotype to changes seen in the fetoplacental unit. The same applies to paternal age, which is an important known factor affecting male fertility and offspring outcomes.
We thank the Reviewer for their comments regarding the ages of the males analysed. As we had 5 treatment groups, and intended to generate a minimum of 8 litters of offspring per treatment group, this resulted in over 40 litters in total. In order to dissect these litters appropriately, and in a timely fashion, we had to stagger their generation over time. As such, this resulted in utilising our males at different ages/durations on the diet. However, in all our statistical analysis, we factored in the duration of time on the diet, which also acted as a proxy measure of paternal age. We also ensured that we staggered the generation of litters in each diet group so that any age effects were experienced across all paternal regimens.
We have revised the manuscript to acknowledge this fact and to highlight that the duration of time on any diet was factored into the statistical analysis.
(3) The male mice exhibited lower body weights when fed experimental diets compared to the control diet, even when placed on the hypercaloric Western Diet. As paternal body weight is an important contributor to offspring health, this is an important confounder that needs to be addressed. This may also have translational implications; in humans, consumption of a Western-style diet is often associated with weight gain. The cause of the weight discrepancy is also unaddressed. It is mentioned that the isocaloric LPD was fed ad libitum, while it is unclear whether the WD was also fed ad libitum, or whether males under- or over-ate on each experimental diet.
We agree with the Reviewer that the general trend towards a lighter body weight for our experimental animals is unexpected. We can confirm that all diets were fed ad libitum. However, as males were group housed, we were unable to measure food consumption for individual males. We also observed that for males fed the high fat diets, they often shredded significant quantities of their diet, rather than eating it, so preventing accurate measurement of food intake.
We also agree with the Reviewer that body weight can be a significant confounder for many paternal and offspring parameters. However, while the experimental males did become lighter, there were no statistical differences between groups in mean body weight. As such, body weight was not included as a variable within our statistical analysis.
(4) The description and presentation of certain statistical analyses could be improved.
(i) It is unclear what statistical analysis has been performed on the time-course data in Figure 1A (if any). If one-way ANOVA was performed at each timepoint (as the methods and legend suggest), this is an inaccurate method to analyse time-course data.
(ii) It is unclear what methods were used to test the relative abundance of microbiome species at the family level (Figure 2L), whether correction was applied for multiple testing, and what the stars represent in the figure. 3) Mentioning whether siblings were used in any analyses would improve transparency, and if so, whether statistical correction needed to be applied to control for confounding by the father.
We apologies for the lack of clarity regarding the statistical analyses. Going forward, we will revise the manuscript and include a more detailed description of the different analyses, inclusion of siblings and correction for multiple testing.
Reviewer #1 (Public review):
Summary:
The authors investigated the effects of a low-protein diet (LPD) and a high sugar- and fat-rich diet (Western diet, WD) on paternal metabolic and reproductive parameters and fetoplacental development and gene expression. They did not observe significant effects on fertility; however, they reported gut microbiota dysbiosis, alterations in testicular morphology, and severe detrimental effects on spermatogenesis. In addition, they examined whether the adverse effects of these diets could be prevented by supplementation with methyl donors. Although LPD and WD showed limited negative effects on paternal reproductive health (with no impairment of reproductive success), the consequences on fetal and placental development were evident and, as reported in many previous studies, were sex-dependent.
Strengths:
This study is of high quality and addresses a research question of great global relevance, particularly in light of the growing concern regarding the exponential increase in metabolic disorders, such as obesity and diabetes, worldwide. The work highlights the importance of a balanced paternal diet in regulating the expression of metabolic genes in the offspring at both fetal and placental levels. The identification of genes involved in metabolic pathways that may influence offspring health after birth is highly valuable, strengthening the manuscript and emphasizing the need to further investigate long-term outcomes in adult offspring.
The histological analyses performed on paternal testes clearly demonstrate diet-induced damage. Moreover, although placental morphometric analyses and detailed histological assessments of the different placental zones did not reveal significant differences between groups, their inclusion is important. These results indicate that even in the absence of overt placental phenotypic changes, placental function may still be altered, with potential consequences for fetal programming.
Weaknesses:
Overall, this manuscript presents a rich and comprehensive dataset; however, this has resulted in the analysis of paternal gut dysbiosis remaining largely descriptive. While still valuable, this raises questions regarding why supplementation with methyl donors was unable to restore gut microbial balance in animals receiving the modified diets.
We thank the Reviewer for their considered thoughts on the gut dysbiosis induced in our models the minimal impact of the methyl donors and carriers. We will include additional text within the Discussion to acknowledge this. However, at this point in time, we are unsure as to why the methyl donors had minimal impact. It could be that the macronutrients (i.e. protein, fat, carbohydrates) have more of an influence on gut bacterial profiles than micronutrients. Alternatively, due to the prolonged nature of our feeding regimens, any initial influences of the methyl donors may become diluted out over time. We will amend the text to reflect these potential factors.
Recommendations for the authors:
Reviewer #1 (Recommendations for the authors):
The authors have done an immense amount of work, which should be commended. In addition to the public review, I have a few suggestions for improvement.
(1) To further explore the weight discrepancy between the males subjected to diet alteration and those on the control diet, further details about the intake and provision of the diets would be beneficial. Seeing as the fat mass was increased in males fed a WD, do you have information on where the weight 'loss' originated from?
We thank the Reviewer for their insight into the changes in male body weight. We agree that the differences in total body weight verses the amount of adipose tissue, is intriguing. Unfortunately, we were unable to monitor the food intake of our animals for two main reasons. The first was that for animal welfare considerations, all our males were initially group housed prior to mating. This meant that typically, males were housed in groups of 4 during the initial feeding (pre-mating) period. Males were only housed singly upon them being used for mating. As such, it was not possible to obtain food consumption data for individual males.
A second limitation arose due to the high extend of males who were fed the Western Diet effectively shredding the diet. This meant that it was not possible to weight the food to obtain a crude idea of how much they were consuming. The reason for this shredding is not clear to us. All mice received environmental enrichment, as we did not observed this behaviour for our control or low protein diet fed males.
With regards to the weight of the other organs, we did not observe and significant overall changes in organ weight, or weight relative to body weight. Unfortunately, we did not have access to, or conduct any whole body scanning, such as DEXA, which would have given more insight into the body composition of our mice.
(2) The testicular abnormalities and gene expression findings are linked nicely to the offspring's story. This is not as compelling for other findings, including the gut microbiome changes, which are not discussed in the context of the fetoplacental outcomes. More discussion of the potential impact of paternal changes on fetal outcomes would strengthen claims that these findings are impactful.
We thank the Reviewer for their comments and suggestion. Our caution with connecting the gut microbiota to offspring development is that, to the best of our understanding, there is little data with regards to its effect on post-fertilisation development. While there is data showing that the microbiome can produce compounds and metabolites that can affect sperm quality and metabolism, lipid composition and testicular morphology, the connection with post-fertilisation development is limited. Additionally, as we saw no difference in fundamental fertility, as measured by changes in litter size, we propose that there no overall changes in the ability of the sperm from our experimental males to reach, fertilise and support development.
However, we acknowledge the Reviewers comments on strengthening the manuscript and so have included some additional text within the Discussion to highlight the links between the microbiome and male reproductive fitness. Please see lines 337-348.
(3) It is clarified in the methods that n=8 males were used in the study, but different nnumbers are shown for some parameters. It would improve transparency for the reader if it were clarified whether these differences result from missing data or from the removal of statistical outliers.
The Reviewer is correct that while 8 males were initially placed on their respective diets, for some of the analyses, the n-number is less than 8. In some instances, for example the analysis of total body fat (Fig. 1D), data was unfortunately not collected during an initial round of dissections. As such, the n number here is only 6 in each group. Additionally, due to the high cost associated with sequencing the microbiome for 5 groups, we decided to only sequence 6 samples per group. However, we do not feel that this impacts significantly on the overall focus of the data presented.
(4) Despite this, you may have been underpowered to detect differences in some parameters, for example, the placental stereology. Alternative approaches, such as immunostaining with whole-section quantification, may be more sensitive to detect subtle changes. Alternatively, have you considered using smaller grids for improved sensitivity of the stereological analysis?
We thank the Reviewer for their insight into the data and their suggestion for immunostaining. We agree with the Reviewers that a greater number of samples would have strengthened our analyses. However, we are not in the possession of further samples which have been processed in the correct manner for additional stereological analysis. We are hoping to conduct further placental analyses based on our RNA-Seq data, but this will require the generation of new samples.
(5) It would be easier to interpret the figures if it were clear which datasets were analysed using non-parametric tests. Were Figure 2F, 2G, 6A, 6E, and 6I are shown differently for that reason, perhaps? It would improve transparency if non-normally distributed data are shown as medians, as that's what's being compared in a non-parametric test.
We apologies for any confusion regarding the analysis of our data. The Reviewer is correct that the data in 2F and 2G were analysed using a non-parametric test. We have now made this clearer in the legend to the figure highlighting which data sets were analysed by ANOVA or Kruskal–Wallis test. We have also done this for the other figure legends where appropriate. With regard to Figure 6, the data presented in Panels A, E and I were intended to show the range of data extending above and below the 90th and 10th centiles of the CD fetuses. As such, we felt that violin plots were the most appropriate way to display these data.
(6) Supplemental Figure 1 seems to be missing.
We apologise sincerely for the lack of inclusion of Supplemental Figure 1. We will ensure that it is included in our resubmission
(7) Line 523 states that samples with RIN < 7 were used for microarray analysis. Do the authors mean RIN > 7?
We thank the Reviewer for identifying our mistake. The Reviewer is correct that this should have been a RIN >7. We have now corrected this.
(8) It is mentioned in lines 603-604 that paraffin shrinkage was accounted for. It could be useful to describe how this was done.
We have revised the text within the Materials and Methods to provide additional clarity on how we compensated for the shrinkage due to the paraffin processing.
In the revised Methods we have added a brief “Shrinkage correction” subsection describing how paraffin-embedding shrinkage was quantified for each placenta individually. Specifically, we now state that post-embedding placental volume was estimated using the Cavalieri Principle on systematic and uniformly-random sampled H&E sections, and a per-placenta volume shrinkage coefficient (k<sub>V</sub> = V<sub>post</sub>/V<sub>pre</sub>) was calculated.
We have also added the equations showing how this coefficient was used to correct compartment volumes and the derived surface area estimates (surface area calculated from S<sub>v</sub> and the corresponding shrinkage-corrected placenta volume). Please see lines 618-644.
(9) This may be due to the generation of the reviewer PDF, but Figure 4E and 4H are illegible in our version of the manuscript.
We apologies for the lower resolution with these figures and the difficulty in seeing the information presented. We have created revised versions of these figures which we hope are of higher quality and clarity.
(10) What do the stars represent in Figure 6A, E, I - compared to what, controls?
The Reviewer is correct that the asterisks in Figures 6A, E and I represent differences in the proportion of fetuses either above or below the 90th and 10th centile of the CD fetuses respectively. As such, in panel A, for both the LPD and MD-LPD groups, there are significantly more fetuses who are below the 10th centile of the CD group. Similarly, in panel E, there are significantly more placentas in the LPD group that have a weight above the 90th centile of the CD group. We have revised the graphs to make these differences, and their comparisons clearer.
Reviewer #2 (Recommendations for the authors):
Some Recommendations for improving the writing and presentation, and minor corrections to the text and figures:
(1) Please describe Wnt signaling in the Abstract.
The Abstract has been amended to provide some additional text regarding Wnt signalling. Please see lines 60-63.
(2) Page 6, line 134: A brief explanation of why measuring the inhibin beta-A chain should be included.
The text within this section has been amended to include a brief description of the role of Inhibin β-A chain on testicular function. Please see lines 135-139.
(3) The methodology used for Tnf determination is missing and should be described.
We apologies for the lack of detail regarding our analysis of serum Tnf in our males. This has now been included. Please see lines 479-480.
(4) It is important to mention that free fatty acid levels in the MD-WD group were similar to those in the CD group, although they remained comparable to the WD group.
We agree with the Reviewer and have amended the text to indicate that there was no difference in the FFA profile of the MD-WD males to either the CD or WD males. Please see lines 147-148.
(5) Figure 2 presents both metabolic parameters and bacterial profile analyses. Although the authors appear to relate these outcomes, clarity would be improved by presenting them in separate figures.
As requested, we have now presented these data as two separate Figures
(6) Figure 3H: The data suggest that the decrease in the number of spermatogonia (PLZF⁺) observed in the LPD and WD groups was prevented when the diets were supplemented with methyl donors.
(7) However, the description and interpretation of this result (or of a neutral effect) are missing.
We agree with the Reviewer in their interpretation of the PLZF+ data. We have indicated this in the text within the Results and Discussion sections. Please see lines 177-178 and lines.
(8) Line 284: Please check the abbreviation for MD-LPD.
We thank the Reviewer for identifying this typographical mistake. This has now been corrected to state MD-LPD and not MDL.
(9) Line 285: Please check the lettering in the text and in Figure 6H-K.
We thank the Reviewer for identifying this typographical mistake. This has now been corrected to state the panels are Figure 9H-K, as we have split the original Figure 2 into two figures.
eLife Assessment
The work by van der Pijl presents important findings on the role of titin-associated muscle ankyrin repeat proteins (MARPs) on hypertrophy via mTOR signalling. The study presents rigourous data using in vivo loss-of-function and pharmacological approaches to investigate effects on hypertrophy. While the evidence supporting the role of MARPs on hypertrophy is solid, there are limitations. For example, the use of Rapamycin only inhibits some aspects of mTORC1 signalling and the study is limited to analysis of the diaphragm and thus it is not clear if the mechanisms are conserved across other muscle types.
Reviewer #1 (Public review):
[Editors' note: this version has been assessed by the Reviewing Editor without further input from the original reviewers. The authors have addressed the comments raised in the previous round of review.]
Summary:
In this manuscript, the authors employ diaphragm denervation in rats and mice to study titin-based mechanosensing and longitudinal muscle hypertrophy. By integrating bulk RNA-seq, proteomics, and phosphoproteomics, they map the stretch-responsive signalling landscape, uncovering robust induction of the muscle-ankyrin-repeat proteinsௗ(MARP1-3) together with enhanced phosphorylation of titin's N2A element.
Genetic ablation of MARPs in mice amplifies longitudinal fibre growth and is accompanied by activation of the mTOR pathway, whereas systemic rapamycin treatment suppresses the hypertrophic response, highlighting mTORC1 as a key downstream effector of titin/MARP signalling.
Strengths:
The authors address a clear biological question: "how titin-associated factors translate mechanical stretch into longitudinal fibre growth" using a unique and clinically relevant animal model of diaphragm denervation. Using a comprehensive multiomics approach, the authors identify MARPs as potential mediators of these effects and use a genetic mouse model to provide compelling evidence supporting causality. Additionally, connecting these findings to rapamycin, a drug widely used clinically, further increases the relevance and potential impact of the study.
Reviewer #2 (Public review):
Summary:
Muscle hypertrophy is a major regulator of human health and performance. Here, van der Pilj and colleagues assess the role of the giant elastic protein, titin, in regulating the longitudinal hypertrophy of diaphragm muscles following denervation. Interestingly, the authors find an early hypertrophic response, with 30% new serial sarcomeres added within 6 days, followed by subsequent muscle atrophy. Using RBM20 mutant mice, which express a more compliant titin, the authors discovered that this longitudinal hypertrophy is mediated via titin mechanosensing. Through an omics approach, it is suggested that the Muscle ankyrin proteins may regulate this approach. Genetic ablation of MARPs 1-3 blocks the hypertrophic response, although single knockouts are more variable, suggesting extensive complementation between these titin binding proteins. Finally, it is found through the administration of rapamycin that the mTOR signalling pathway plays a role in longitudinal hypertrophic growth.
Strengths:
This paper is well written and uses an impressive suite of genetic mouse models to address this interesting question of what drives longitudinal muscle growth.
Weaknesses:
While the findings are of interest, they lack sufficient mechanistic detail in the current state to separate cross-sectional versus longitudinal hypertrophy. The authors have excellent tools such as the RBM20 model to functionally dissect mTOR signalling to these processes. It is also unclear if this process is unique to the diaphragm or is conserved across other muscle groups during eccentric contractions.
Author response:
The following is the authors’ response to the original reviews.
eLife Assessment
The study presents important insights into the regulation of muscle hypertrophy, regulated by Muscle Ankyrin Repeat Proteins (MARPs) and mTOR. The methods are overall solid and complementary, with only minor limitations. Overall, the findings will be of interest for both muscle-biology specialists and the broader mechanobiology community.
We thank the editors for their interest in our manuscript. Below we respond to the reviewer’s comments. Based on these comments we made extensive textual revisions throughout the manuscript, and we added additional analyses to the revised results.
Reviewer #1 (Public review):
Summary:
In this manuscript, the authors employ diaphragm denervation in rats and mice to study titin‑based mechanosensing and longitudinal muscle hypertrophy. By integrating bulk RNA‑seq, proteomics, and phosphoproteomics, they map the stretch‑responsive signalling landscape, uncovering robust induction of the muscle‑ankyrin‑repeat proteins (MARP1‑3) together with enhanced phosphorylation of titin's N2A element. Genetic ablation of MARPs in mice amplifies longitudinal fibre growth and is accompanied by activation of the mTOR pathway, whereas systemic rapamycin treatment suppresses the hypertrophic response, highlighting mTORC1 as a key downstream effector of titin/MARP signalling.
Strengths:
The authors address a clear biological question: "how titin‑associated factors translate mechanical stretch into longitudinal fibre growth" using a unique and clinically relevant animal model of diaphragm denervation. Using a comprehensive multiomics approach, the authors identify MARPs as potential mediators of these effects and use a genetic mouse model to provide compelling evidence supporting causality. Additionally, connecting these findings to rapamycin, a drug widely used clinically, further increases the relevance and potential impact of the study.
We thank the reviewer for their kind words and critical review of our manuscript. The roles of the MARP proteins are diverse and form an intriguing target for further study.
Weaknesses:
There are several areas where the manuscript could be substantially improved.
(1) The statistical analysis of multi-omics data needs clarification. Typically, analyses across multiple experimental groups require controlling the false discovery rate (FDR) simultaneously to avoid reporting false-positive findings. It would be very helpful if the authors could specify whether adjusted p-values were calculated using a multi-factorial statistical model (e.g., ~group) or through separate pairwise contrasts.
We agree with the reviewer that the description of the statistical analysis could be improved. We report the q-values in the supplemental data tables to correct for false positive data, the p-values reflect pairwise comparisons. Statistical testing was performed on whole proteomes or phospho-proteomes, making for very stringent testing (please also see reply to reviewer 2, response 5). Unbiased quantitative proteomics functions primarily as a screen, in-solution digestion of muscle proteins yields comparatively few peptides making population adjusted p-value calculation very stringent, suggesting no/few differences in expression. Hence, we compared RNAseq to proteome data to isolate consistently differential proteins. We have revised the method section (lines 745-746) to include clarifications of the FDR analysis.
(2) (A)There are three separate points regarding MARP3 that could be improved. First, the authors report that MARP3-KO mice exhibit smaller increases in muscle mass after diaphragm denervation compared to wild-type mice (a -13% difference), indicating MARP3 likely promotes rather than attenuates hypertrophy. However, the manuscript currently states the opposite (lines 215-216); this interpretation should be revisited. (B) Second, it would be valuable if the authors could provide data showing whether MARP3 transcript or protein levels change response to denervation - if they do not, discussing mechanisms behind the observed phenotype would help clarify the findings. (C) Finally, given that some MARP-KO mice already exhibit baseline differences, employing and reporting the full two-way ANOVA (including genotype × treatment interaction) would allow a direct statistical assessment of whether MARP deficiency modifies the muscle's response to stretch. This analysis would help clearly resolve any existing ambiguity.
(A) Compared to wildtype mice, MARP3 KO mice exhibit baseline diaphragm hypertrophy. This suggests that MARP3 may normally restrain hypertrophy under basal conditions. However, in response to UDD, MARP3 KO mice display an attenuated hypertrophic response, which could be interpreted as MARP3 promoting hypertrophy under stress conditions, as noted by the reviewer. The relationship between MARP3 and metabolism remains incompletely understood, but prior studies indicate that loss of MARP3 enhances glucose tolerance and insulin sensitivity (PMID: 12456686), suggesting that MARP3 may act as a negative regulator of metabolic signaling. Both glucose and insulin can activate the PI3K pathway to promote hypertrophy (PMID: 16679293), which may contribute to the baseline hypertrophy observed in MARP3 KO diaphragms. In addition, MARP3 deficiency has been associated with activation of AMPK signaling (PMID: 26398569). AMPK is a key regulator of metabolic pathways and a well-established inhibitor of hypertrophic signaling, in part through suppression of mTOR activity, and is also responsive to mechanical stimuli (PMID: 18556591). Thus, increased AMPK activity in MARP3 KO mice may limit hypertrophy in response to UDD. Supporting this, our phospho-proteomics data indicate increased activation of the AMPK β-subunit following UDD, suggesting a potential role for AMPK signaling in stretch-induced hypertrophy. Based on these considerations, we have removed the statement that MARP3 attenuates hypertrophy and instead incorporated the potential role of AMPK signaling into the Discussion (lines 354–355). While the present study focuses on the triple MARP KO model, future work will examine the specific contributions of individual MARP proteins to muscle hypertrophy.
(B) MARP3 (Ankrd23) upregulation at the RNA level was detected by RNA-seq in rat diaphragm following both UDD and BDD (Supplemental Tables 1 and 2). This is consistent with our prior findings in mice, where western blot analysis showed increased MARP3 protein expression following UDD (PMID: 29978560). We note that reliable detection of MARP3 protein remains technically challenging due to limited availability of specific antibodies.
(C) We agree with the reviewer and have added the results of the two-way ANOVA to the figures (see updated Figure 4). The three MARP proteins exhibit differential effects on diaphragm hypertrophy, supporting their role as modulators of stretch-induced hypertrophy.
(3) The current presentation of multi-omics data is somewhat difficult to follow, making it challenging to determine whether observed changes occur at the transcript or protein level due to inconsistent gene/protein naming and capitalization (e.g., proper forms are mTOR, p70 S6K, 4E-BP1). Clearly organizing and presenting transcript and protein-level changes side-by-side, especially for key molecules discussed in later experiments, would make the data more accessible and provide clearer insights into the biology of titin-mediated mechanosensing.
We agree with the reviewer that naming conventions between gene and protein can be hard to follow. We kept the names for titin-associated proteins as some have multiple protein names and the most common names is shown here. However, we made the suggested changes for the mTOR related proteins (for example, see figure 5).
(4) The current analysis relies on total protein measurements downstream of mTOR, yet mTOR's primary mode of action is to change phosphorylation status. Because the authors have already generated a phosphoproteomic dataset, it would be very helpful to report - or at least comment on - whether known mTOR target phosphosites were detected and how they respond to denervation and rapamycin. Including even a brief summary of canonical sites such as S6K1 Thr389 or 4E - BP1 Thr37/46 would make the link between mTOR activity and hypertrophy much clearer.
We agree with the reviewer that the mTOR data requires more work to ascertain its function in regulating hypertrophy following UDD. We investigated S6K1 Thr389 or 4E BP1 Thr37/46 in both the phosphoproteomic dataset and by western blot. These sites do not appear in phosphoproteome mass spectrometry (supplemental data table 13) and 4E BP1 Thr37/46 was unchanged by western blot (not shown). The S6K1 Thr389 antibody was aspecific in our hands, but Norrby et al (PMID: 22657251) saw increased levels by 6-days UDD. Hence the mTOR aspect of this study is quite complex, suggesting mTOR plays a major role in UDD hypertrophy, but potentially through an alternative activation pathway from what is classically described for muscle hypertrophy. We are investigating the mTOR mechanism further focusing on mTOR’s role in regulating longitudinal hypertrophy with potential connection to titin signaling and hope to publish this in the next few years. We revised the discussion to include canonical mTOR activation in hypertrophy, please see lines 388-392.
(5) Finally, since rapamycin blocks only a subset of mTOR signalling, a brief discussion that distinguishes rapamycin‑sensitive from rapamycin‑insensitive pathways would be valuable. Clarifying whether diaphragm stretch relies exclusively on the sensitive branch or also engages the resistant branch would place the results in a broader mTOR context and deepen the mechanistic narrative.
We agree with the reviewer that distinguishing between rapamycin-sensitive and -insensitive mTOR signaling adds useful context to the interpretation of stretch-induced hypertrophy. Rapamycin primarily inhibits mTORC1, whereas mTORC2 is generally considered rapamycin-insensitive, although prolonged or high-dose exposure can also affect mTORC2 activity. Our data indicate that UDD induces a form of hypertrophy that is sensitive to rapamycin, supporting a prominent role for mTORC1 in this process. However, we cannot exclude the possibility that rapamycin-insensitive pathways, including mTORC2 signaling, also contribute. Notably, denervation itself may influence mTORC2 activity, which could complicate the distinction between stretch- and denervation-mediated signaling. Given these considerations, we have added a brief discussion to acknowledge potential contributions of rapamycin-insensitive mTOR signaling (lines 379-384). A more comprehensive dissection of mTORC1 versus mTORC2 signaling in this context will require targeted approaches and falls beyond the scope of the present study.
Reviewer #1 (Recommendations for the authors):
Minor comments:
(6) The manuscript notes that KEGG analysis "confirmed" the GO‑term findings. Because KEGG pathways and GO terms describe different types of biological information, it might be clearer simply to present them as complementary lines of evidence rather than one validating the other.
We agree and modified the text accordingly. “Concurrently, KEGG PATHWAY database searches (Supplemental data Table 6) indicated that the DEG’s are involved in muscle remodeling.” See lines 166-169.
(7) Figure 2's legend mentions a two‑way ANOVA, but the specific factors tested are not specified. Listing those two factors would help readers interpret the statistics more easily.
The two-way ANOVA refers to the violin plot in figure 2E and tests the difference of the 2 surgical modalities sham vs UDD and sham vs BDD. Sham groups were combined in the graphs for easy comparison. We clarified the text of figure legend 2.
(8) The Methods briefly describe phosphopeptide enrichment, but additional details on the criteria for site identification - such as the localisation algorithm, probability cut‑off, and FDR thresholds - would make the phosphoproteomics section more transparent and reproducible.
Please see the updated method section, lines 756-765
Reviewer #2 (Public review):
Summary:
Muscle hypertrophy is a major regulator of human health and performance. Here, van der Pilj and colleagues assess the role of the giant elastic protein, titin, in regulating the longitudinal hypertrophy of diaphragm muscles following denervation. Interestingly, the authors find an early hypertrophic response, with 30% new serial sarcomeres added within 6 days, followed by subsequent muscle atrophy. Using RBM20 mutant mice, which express a more compliant titin, the authors discovered that this longitudinal hypertrophy is mediated via titin mechanosensing. Through an omics approach, it is suggested that the Muscle ankyrin proteins may regulate this approach. Genetic ablation of MARPs 1-3 blocks the hypertrophic response, although single knockouts are more variable, suggesting extensive complementation between these titin binding proteins. Finally, it is found through the administration of rapamycin that the mTOR signalling pathway plays a role in longitudinal hypertrophic growth.
Strengths:
This paper is well written and uses an impressive suite of genetic mouse models to address this interesting question of what drives longitudinal muscle growth.
We appreciate the reviewer’s kind words on our manuscript and their critical review of our work. A potential separate mechanism governing cross-sectional versus longitudinal hypertrophy is of great interest and something we aim to address in future manuscripts.
Weaknesses:
While the findings are of interest, they lack sufficient mechanistic detail in the current state to separate cross-sectional versus longitudinal hypertrophy. The authors have excellent tools such as the RBM20 model to functionally dissect mTOR signalling to these processes. It is also unclear if this process is unique to the diaphragm or is conserved across other muscle groups during eccentric contractions.
Reviewer #2 (Recommendations for the authors):
(1) Cross-sectional hypertrophy characterization: The paper emphasizes longitudinal hypertrophy but does not quantify the contribution of radial (cross-sectional) hypertrophy to the total mass increase. Given that the denervated costal diaphragm shows ~50% increase in mass (Figure 1B) but there is only ~30% fiber lengthening, it is important to determine the proportion attributable to fiber diameter changes. Histological analysis of muscle fiber cross-sectional area would clarify the relative contributions of longitudinal versus radial hypertrophy to the overall mass phenotype.
We agree with the reviewer that radial hypertrophy is an important mechanism for muscle weight gain in UDD. In previous work we characterized both the radial and longitudinal hypertrophy response in 6-day UDD and found that ~20% of the mass gain seen in UDD is radial hypertrophy (PMID: 29978560). We reference this paper in the discussion section, line 277-278. Doing a full histological work-up of UDD diaphragm would be interesting but falls outside the scope of this manuscript. Our focus was to characterize longitudinal hypertrophy by addition of sarcomeres in series and provide insight into titin’s role in regulating longitudinal hypertrophy. We hope that the reviewer agrees with this approach.
(2) Titin isoform expression analysis: At line 103, the authors propose that longitudinal hypertrophy reduces strain on titin by decreasing fractional sarcomere extension. However, this hypothesis does not exclude the possibility of isoform switching to a less elastic titin variant, which may compensate for changes in mechanical stress. The RNA-sequencing data should be analyzed for titin exon usage patterns between sham and UDD to determine whether changes in isoform composition (e.g., PEVK region splicing) accompany longitudinal hypertrophy. If isoform switching occurs, this represents an alternative or complementary mechanism to sarcomere addition.
We analyzed titin exon usage in rat following both UDD and BDD. Increases in sarcomeres in series associated with UDD show modest changes in titin exon usage, though not significant by population adjusted p-values. The denervation effect of BDD did show changes in splicing, indicating lower inclusion of PEVK encoding exons, suggesting a stiffening of the titin molecules. Stiffening of titin molecules might be protective for the fully paralyzed diaphragm and preserve muscle mass. This would align with our prior publication (PMID: 29978560) which showed that stiffer titin generated more radial hypertrophy in response to UDD. In response to the reviewer’s comment, we added the splicing data to the supplemental data as new figure 2 and briefly address titin splicing in the results section, see lines 121-125.
(3) The comparison of 3-day unilateral diaphragm denervation (UDD) and bilateral diaphragm denervation (BDD) in rats (Figure 1D-E) is used to argue that hypertrophic signaling is stretch-dependent rather than denervation-dependent. However, this interpretation requires clarification. In mice, hypertrophy is detectable as early as 1 day post-UDD, whereas the 3-day BDD protocol may drive an accelerated hypertrophic-to-atrophic remodelling process given the severity of the model. Moreover, longitudinal and global muscle hypertrophy may operate through distinct mechanisms: denervation could suppress longitudinal hypertrophy through a separate pathway while promoting or delaying cross-sectional hypertrophy. The authors should acknowledge that the current evidence does not fully exclude denervation-dependent mechanisms and should consider extended BDD time points or additional mechanistic studies to clarify this distinction.
UDD and BDD are both denervation models and hypertrophy occurs in the denervated costal of UDD operated animals. Stretch is thus the mechanical difference between UDD and BDD and thus the trigger for hypertrophy signaling. At the denervation signaling level both models should in principle be comparable and are unlikely to play different roles between UDD and BDD, except that UDD also induces a more potent hypertrophy signaling profile on top of the atrophy program. That said, BDD is a more severe model and respiration rate is depressed compared to UDD where respiration rate is elevated. BDD rats also engage in abdominal breathing, which mildly stretches the diaphragm. Hypoxia is likely to play a stronger role in BDD than UDD and could thus further enhance the atrophy profile of BDD. We agree with the reviewer that more work is needed to elucidate the BDD remodeling response, however UDD induced stretch is the main driver of longitudinal hypertrophy. In response to the reviewer’s comment, we have added clarifying text to the discussion, lines 286-292.
The potential for there being two independent mechanisms for both radial and longitudinal hypertrophy is of great interest to us. We foresee that dissecting out these differences will require a cell culture-based approach and will aid in avoiding the complexity of overlapping denervation and hypertrophy signals as seen in this manuscript.
(4) Characterization of RBM20 models: The RBM20 experiments rely on the assumption that increased titin compliance reduces stretch sensitivity. However, the paper provides minimal baseline characterization of the diaphragms. Specifically: (a) What are the sarcomere lengths in RBM20-deficient diaphragms at rest and under stretch? (b) How does the passive force-length relationship differ between wildtype and RBM20-deficient diaphragm muscles? and (c) Would RBM20-deficient muscles, despite having longer sarcomeres at baseline, actually experience sufficient strain to activate mechanosensing? These data are necessary to interpret why RBM20-deficient mice show attenuated mass gain rather than none (as in BDD) during UDD (Supplemental Figure 2A-C). Additionally, what would the authors hypothesize would happen if rapamycin were used in RMB20 UDD models? It appears to be an attractive experimental approach to separate potential mTOR contributions to longitudinal versus cross-sectional hypertrophy.
We agree with the reviewer that more work is needed on Rbm20 deficient mice and rats to elucidate their response to stretch. Part of this characterization has previously been published (PMID: 29978560) and Rbm20 splice-deficient mice have reduced passive stiffness in the diaphragm and show a robust mechanosensing response to UDD. Rbm20 splice-deficient mice also show a similar increase in longitudinal hypertrophy, but a blunted radial hypertrophy in response to 6-days UDD. The main reason for not expanding on these mice/rats further was the added complexity of Rbm20 splicing multiple targets that could affect hypertrophy signaling, for example LDB3 (ZASP) and FLNC (Filamin C) are both associated with hypertrophic cardiomyopathy. Hence for the purpose of this manuscript we showed mice and rats having a similar response to UDD, hypertrophy wise, and that titin stiffness (reduced in Rbm20-deficient animals) affects hypertrophy at the diaphragm mass level.
Testing rapamycin on Rbm20-deficient animals could be interesting, however the complexities of also changing splicing of non-titin targets will make interpretation of mTOR signaling difficult. Perhaps an alternative approach would be to generate a titin mouse model with more compliant titin (e.g. increase the size of the PEVK segment), a model we are considering for future studies. TtnΔ112-158 mice, deleting a large portion of the PEVK region (PMID: 30565562) show increases in sarcomere number. We would expect a model with more PEVK to thus show a reduction in the number of sarcomeres in series. We discuss the role of titin stiffness in the discussion and how titin stiffness ties to longitudinal hypertrophy, please see lines 302-314.
(5) Statistical analysis and multiple hypothesis correction: The proteomic analyses appear to employ a nominal p-value threshold (p < 0.05) without correction for multiple comparisons or false discovery rate (FDR) control. This is particularly concerning given the large number of comparisons. For example, the authors report 142 titin phosphorylation sites significantly different between sham and UDD at p < 0.05 (approximately 20% of ~700 identified sites). However, with proper FDR correction (adjusted p < 0.05), only 14 sites remain significant - a 90% reduction. This discrepancy is critical for the discussion on titin N2A phosphorylation sites pS9459 and pS9520, where only pS9520 achieves statistical significance after FDR adjustment. The authors should justify their choice of statistical thresholds and reanalyze key findings using FDR-corrected p-values. Additionally, the phosphoproteomics dataset should be screened for duplicate phosphosite identifications to ensure each site is counted only once.
Reviewer 1 has voiced similar concerns, and we have thus expanded the methodology to explain the statistical tests used to analyze the data and the process of establishing Z-scores of isobaric peptides for the same phospho-sites (see lines 756-765). Our statistical analysis covers all detected peptides, when we only analyze the titin peptides: pS9459 is only significant in t-test, likely due to large variation in isobaric peptides. pS9520 is significant in both independent t-test and FDR. We changed figure 3D to show the fold change instead of the previous Z-score for more intuitive interpretation.
Minor comments:
(6) Line 52: "thesarcomeres" should read "the sarcomeres".
A space has been added, please see line 52.
(7) Line 52: "half-sarcomer" should read "half-sarcomere"
Spelling has been corrected, please see line 52.
(8) Figure clarity: Figure 1 (B-C) presents mouse data, while Figure 1 (D-E) presents rat data. This distinction should be clearly labeled in the figure legend or on the axes to prevent misinterpretation, particularly for readers unfamiliar with the experimental design.
We added the species to the y-axis of revised figure 1B-E and added additional clarification in the figure legend.
(9) Supplementary tables: When reporting statistical comparisons in the supplementary tables, please consider including the directionality of the statistical tests (e.g., which group was higher or lower) alongside p-values. This will facilitate interpretation without requiring reference to the main text figures.
We agree with the reviewer and added statistical direction as a new column next to the p-values, please see the revised supplemental tables.
(10) Given the interesting divergent findings in MARPtKO versus single knockouts, it would be interesting to assess by immunofluorescence the association of each MARP with the N2A region of titin following UDD.
We agree with the reviewer that localization is important. Miller et al (PMID: 14583192) previously localized MARP1-3 to the N2A segment by immuno-EM and our work previously localized MARP1 to N2A using SR-SIM (PMID: 29978560). We will further investigate MARPs binding to the N2A region in an upcoming study that we intend to publish soon.
eLife Assessment
This potentially valuable study investigates the anti-senescence effects of red light exposure, proposing that reduced SIRT4 levels enhance fatty acid metabolism and H3K9ac, thereby attenuating ageing-related phenotypes. The authors use multiple approaches, including cultured cells, animal models, and molecular analyses, to support their conclusions. However, the evidence remains incomplete, as additional controls and stronger mechanistic data are needed to fully support the proposed pathway, particularly how red light exposure reduces SIRT4 levels.
Reviewer #1 (Public review):
Summary:
Deng and colleagues pursue the possibility that red light exposure can provide some benefits and anti-senescence effects in aged mouse models. In addition, they show how red light influences metabolism in cultured keratinocytes. The authors provide a long dissection of the potential paths involved in the changes promoted by red light exposure, identifying CytC oxidase, SIRT4, PPARa and MCD as key players.
Strengths:
The authors did a thorough exploration of the multiple potential avenues by which red light exposure influences metabolism. The in vitro and in vivo evidence nicely complement each other.
Weaknesses:
This is a challenging hypothesis that would require some additional experimental controls. The pathway dissection, while extensive, is sometimes approached in unconvincing ways, and the results are not always evident to judge or interpret. Technically, the western blots and transcriptomic analyses require notable improvements.
Reviewer #2 (Public review):
Summary:
This work identifies a previously unknown way that red light can slow ageing. The authors show that red light lowers the level of a protein called SIRT4 in skin cells. Reducing SIRT4 boosts fatty acid use and increases a type of histone modification that keeps genes active. These changes help cells clear away signs of ageing, reduce inflammation, and restore normal metabolism. The findings open the possibility of developing new treatments that target SIRT4 to reverse age‑related decline.
Strengths:
The evidence is solid because the authors use several complementary methods. They test red light in both cultured cells and naturally aged mice, and they confirm the key role of SIRT4 by silencing its gene. Measurements of metabolism, protein changes, and ageing markers all point in the same direction. However, the exact way red light lowers SIRT4 levels is not fully explained, which leaves a minor gap. Overall, the conclusions are well supported and convincing.
Weaknesses:
The paper does not evolve to use the mechanistic discoveries of the manuscript to help our community to identify the mechanism of photobiomodulation, which is not known so far.
I would like to draw attention to a recently published paper by Herrera et al. (FEBS Letters 2025, doi:10.1002/1873-3468.70195), which shows that red light (660 nm) stimulates mitochondrial fatty acid oxidation in keratinocytes via AMPK‑dependent phosphorylation of ACC, without altering expression of electron transport chain complexes. I believe this paper is highly complementary to the current study.
Herrera et al. demonstrate that red light increases basal, ATP‑linked, and maximal oxygen consumption rates in keratinocytes specifically through enhanced fatty acid oxidation (inhibited by etomoxir). This independently validates the central finding of the current manuscript, i.e., red light boosts lipid metabolism, strengthening the robustness of this concept.
While the current manuscript focuses on the SIRT4‑MCD axis, Herrera et al. identify AMPK phosphorylation and ACC inhibition as key effectors. The authors can integrate and expand their discussion, since SIRT4 downregulation may converge on AMPK activation, or they may represent parallel, reinforcing mechanisms. This would enrich the mechanistic model and open new hypotheses.
The mechanism of photobiomodulation: Herrera et al. explicitly challenge the prevailing paradigm that red light acts solely via cytochrome c oxidase (by showing long‑lasting effects, unchanged OXPHOS protein levels, and no difference in permeabilised cells). The current finding (red light acts through SIRT4 downregulation, i.e., not direct enzymatic activation) aligns perfectly with Herrera´s critique.
Long‑term metabolic effects - Herrera et al. show that a single red light exposure elevates oxygen consumption for up to 2 days. The current study focuses on changes at 12‑24 h. Their data extend the time window and suggest that the metabolic reprogramming you describe may persist longer than currently discussed, which is clinically relevant.
Discussing Herrera et al.'s results would not only acknowledge independent, corroborating evidence but would also allow the authors to position their SIRT4‑centric mechanism within a broader, emerging understanding of red‑light photobiomodulation.
Author response:
Reviewer #1 (Public review):
Weaknesses:
This is a challenging hypothesis that would require some additional experimental controls. The pathway dissection, while extensive, is sometimes approached in unconvincing ways, and the results are not always evident to judge or interpret. Technically, the western blots and transcriptomic analyses require notable improvements.
We would like to thank the reviewer for the careful and patient examination of the issues identified in our manuscript. The poor quality of some of the Western blot bands in Figure 4 may have been caused by inappropriate electrophoresis conditions during the Western blot experiments. In the revised manuscript, we will optimize the electrophoresis conditions to obtain higher-quality protein bands and update the quantitative data. Regarding the quantification format, we believe that heatmaps provide a more intuitive representation of trends in protein expression across different treatment groups. This approach more accurately reflects the results of our biological replicates than simply analyzing the significance of differences in the grayscale values of protein bands. For the analysis of transcriptomic data, we will conduct a more detailed analysis of signal pathway enrichment and the identified differentially expressed genes to ensure that predicted genes are excluded from our current results and redundant data presentation is removed.
Regarding additional experimental controls, such as incorporating experimental data under blue light treatment conditions as a control for red light. While exploring the optimal red light irradiation dose at the cellular level, we simultaneously conducted experiments on the effects of blue light irradiation at the same dose on keratinocyte activity. The results indicated that as the blue light irradiation dose increased (0–160 J/cm<sup>2</sup>), the keratinocyte activity exhibited a dose-dependent decline. This indicates that blue light is phototoxic to keratinocytes. The relevant experimental results have already been published in our previous study (Communications Biology 2024, doi: 10.1038/s42003-024-06973-1). Taken together with the data from our study, this demonstrates that the anti-aging effects of red light reported in the current manuscript are indeed driven by red light.
Reviewer #2 (Public review):
Weaknesses:
The paper does not evolve to use the mechanistic discoveries of the manuscript to help our community to identify the mechanism of photobiomodulation, which is not known so far.
I would like to draw attention to a recently published paper by Herrera et al. (FEBS Letters 2025, doi:10.1002/1873-3468.70195), which shows that red light (660 nm) stimulates mitochondrial fatty acid oxidation in keratinocytes via AMPK‑dependent phosphorylation of ACC, without altering expression of electron transport chain complexes. I believe this paper is highly complementary to the current study.
Herrera et al. demonstrate that red light increases basal, ATP-linked, and maximal oxygen consumption rates in keratinocytes specifically through enhanced fatty acid oxidation (inhibited by etomoxir). This independently validates the central finding of the current manuscript, i.e., red light boosts lipid metabolism, strengthening the robustness of this concept.
While the current manuscript focuses on the SIRT4-MCD axis, Herrera et al. identify AMPK phosphorylation and ACC inhibition as key effectors. The authors can integrate and expand their discussion, since SIRT4 downregulation may converge on AMPK activation, or they may represent parallel, reinforcing mechanisms. This would enrich the mechanistic model and open new hypotheses.
The mechanism of photobiomodulation: Herrera et al. explicitly challenge the prevailing paradigm that red light acts solely via cytochrome c oxidase (by showing long-lasting effects, unchanged OXPHOS protein levels, and no difference in permeabilised cells). The current finding (red light acts through SIRT4 downregulation, i.e., not direct enzymatic activation) aligns perfectly with Herrera´s critique.
Long-term metabolic effects-Herrera et al. show that a single red light exposure elevates oxygen consumption for up to 2 days. The current study focuses on changes at 12-24 h. Their data extend the time window and suggest that the metabolic reprogramming you describe may persist longer than currently discussed, which is clinically relevant.
Discussing Herrera et al.'s results would not only acknowledge independent, corroborating evidence but would also allow the authors to position their SIRT4-centric mechanism within a broader, emerging understanding of red-light photobiomodulation.
We would like to thank the reviewer for providing us with constructive suggestions for discussion. Our results showed that under red light conditions, both glycolipid and lipid metabolism were activated in keratinocytes, and cellular metabolic flux increased. The activation of lipid metabolism directly led to an increase in metabolism-associated H3K9ac and drove the upregulation of anti-aging-related genes; we believe this is key to the anti-aging effects of red light. Mechanistic analysis combining proteomics and acetylation proteomics revealed that red light significantly downregulated SIRT4 expression and increased the acetylation of MCD, a protein regulated by SIRT4 that governs cellular fatty acid oxidation rates. Through validation using cell-level knockdown and inhibitors, we confirmed that SIRT4 inhibition exerts anti-aging effects in vitro and that inhibiting MCD function under red light conditions suppresses H3K9ac. These results establish the role of the SIRT4-MCD signalling axis in mediating the anti-aging effects of red light.
The study by Herrera et al. included a substantial body of validation data confirming the role of red light in promoting fatty acid oxidation, providing robust empirical support for our research. Furthermore, Herrera et al. revealed that red light-induced fatty acid oxidation depends on AMPK and ACC phosphorylation. This mechanism of red-light photobiomodulation may refute the notion that its bio-regulatory effects rely solely on the action of mitochondrial cytochrome c oxidase. Furthermore, together with our study revealing that red light exerts anti-aging photobiomodulatory effects via the SIRT4-MCD signalling axis, these findings independently confirm that red light regulates cellular fatty acid oxidation, thereby demonstrating the pivotal role of activated fatty acid oxidation in the bio-regulatory effects of red light. In the revised manuscript, we will include a discussion on the potential link between the red light-driven downregulation of SIRT4 and the phosphorylation of AMPK/ACC. This will be of positive value in elucidating how SIRT4 exerts its anti-aging effects by regulating lipid metabolism, as well as in explaining the possible mechanisms by which red light downregulates SIRT4.
eLife Assessment
The study presents valuable findings regarding the impact of ARHGEF6 deletion, a RhoGTPase regulator linked to X-linked intellectual disability (XLID46), in the development of interneurons. The evidence supporting the observed cellular and developmental phenotypes collected in both mouse and human iPSC models is convincing, although further work would strengthen the mechanistic interpretation and clarify the specificity of the findings. This work offers new insights into ARHGEF6 function and the potential contribution of its dysfunction to neurodevelopmental disorders.
Reviewer #1 (Public review):
Summary:
The manuscript has several strengths, including a technically comprehensive approach that combines mouse genetics, electrophysiology, live imaging in assembloids, and human organoid models, providing a rich and multifaceted dataset. Cross-species validation through the parallel use of mouse and human systems strengthens the generality of the observed phenotypes and increases relevance to human neurodevelopment.
Consistent phenotypic observations across systems show that ARHGEF6 loss affects migration, neurite morphology, growth cone structure, and neuronal survival, supporting a coherent role in cytoskeletal regulation.
There is clear evidence for developmental defects, including reduced interneuron numbers, increased apoptosis in the ganglionic eminences, and migration deficits, all well supported by quantitative analyses. Also, there is a high-quality electrophysiological characterization that demonstrates reduced firing in interneurons, providing a well-controlled functional phenotype.
Strengths:
The manuscript has several strengths, including a technically comprehensive approach that combines mouse genetics, electrophysiology, live imaging in assembloids, and human organoid models, providing a rich and multifaceted dataset. Cross-species validation through the parallel use of mouse and human systems strengthens the generality of the observed phenotypes and increases relevance to human neurodevelopment.
Consistent phenotypic observations across systems show that ARHGEF6 loss affects migration, neurite morphology, growth cone structure, and neuronal survival, supporting a coherent role in cytoskeletal regulation.
There is clear evidence for developmental defects, including reduced interneuron numbers, increased apoptosis in the ganglionic eminences, and migration deficits, all well supported by quantitative analyses. Also, there is a high-quality electrophysiological characterization that demonstrates reduced firing in interneurons, providing a well-controlled functional phenotype.
Weaknesses:
Despite the strengths mentioned above, the study has some conceptual and experimental weaknesses that reduce its impact. The mechanistic insight is limited, as the research does not directly establish how ARHGEF6 regulates downstream signaling pathways.
Also, there is insufficient evidence for interneuron specificity; although the central claim is that ARHGEF6 plays a selective role in interneurons, the data do not adequately exclude the possibility that the observed effects reflect broader neuronal defects. The study lacks critical controls across cell types, as several phenotypes observed in organoids and progenitors, including apoptosis, reduced neuronal output, and altered morphology, could also affect multiple neuronal populations without being directly tested. Furthermore, the data are predominantly descriptive, with many results remaining correlative and failing to establish causal relationships.
Some more comments:
(1) Given that ARHGEF6 is a guanine nucleotide exchange factor for Rac1 and Cdc42, the absence of direct measurements of GTPase activity or downstream signaling represents a significant gap. The interpretation that the observed phenotypes are mediated through specific cytoskeletal pathways, therefore, remains inferential.
(2) The manuscript repeatedly interprets the findings as interneuron-specific. However, several key observations are not demonstrated to be restricted to IN. Without direct comparison to excitatory neurons or other cell types, it is difficult to conclude that ARHGEF6 plays a selective role in interneurons rather than a more general role in neuronal development. The well-done analysis of the transcriptomic dataset is not sufficient to claim IN specificity. This issue is particularly important for the interpretation of the human organoid experiments, where reductions in SOX2⁺ progenitors and NEUN⁺ neurons, as well as increased apoptosis, could reflect global developmental defects. Similarly, in the mouse experiments, the reduction in GAD67⁺ cells is compelling, but it is not shown whether other neuronal populations are also affected.
(3) The study provides a strong phenotypic description but limited causal resolution. For example, migration defects, altered growth cone morphology, and reduced branching are all consistent with impaired cytoskeletal regulation, but the links between these phenotypes are not directly established. Likewise, while the electrophysiological data convincingly show reduced firing in interneurons, the connection between altered cytoskeletal dynamics and intrinsic excitability is not explored.
(4) Several aspects of data presentation could be improved. In multiple figures (e.g., Figure 1A, D; Figure 4 and Video S1, 2), the images are difficult to interpret due to high cellular density, limited magnification, or lack of clear annotation. In some cases, it is not fully clear how quantifications were performed or which regions were analyzed. Improving the visual clarity with arrows, boxes, and high-magnification inserts of the data would strengthen confidence in the conclusions.
Reviewer #2 (Public review):
The authors investigate the impact of the deletion of the small GTPase regulator ARHGEF6 on the development and physiology of interneurons. Using public databases, they first show that ARHGEF6 is enriched in interneurons or in areas that give rise to them, both in development and adulthood, in humans and mice. Using a complete KO mouse previously reported, and using a GAD67-GFP reporter mice line, they show that in the adult mouse cortex and hippocampus, there is a notorious reduction GFP+ cells. These mice show increased apoptotic cells at different timepoints and areas of the brain during development. In the developing cortex of ARHGEF6-KO mice, there are fewer IN in all layers of the developing cortex, and cells present processes not correctly oriented. IN from the hippocampus in culture show reduced excitability and impaired neurite branching. The authors then established isogenic hiPSCs lines to study ARHGEF6 deletion in human cells and differentiated ventral forebrain neurons, to find interneuron-related and non-related phenotypes. Most importantly, human interneurons grown in organoids show reduced branching and altered growth cone morphology. The authors claim that the novel interneuron phenotypes found in these models can explain, in part, the human intellectual disabilities associated with mutations in this protein. The study is well conducted and opens new avenues of research not only for the role of small GTPases regulation in early nervous system development, but also for how interneuron deficiencies impact a wider range of intellectual disability syndromes found in humans.
However, most conclusions of the present version would be strengthened after considering the following comments:
Major comments
(1) The reported biological processes evaluated at different developmental stages may be directly or indirectly related to ARHGEF6 function itself. As a model of a hereditary disease, full organism gene deletion is valid, since the human patients suffer from that condition as well. However, to investigate the roles of a protein, complete deletions may not be very accurate since they can give rise to phenotypes that are only indirectly related to the protein function itself. Most conclusions of the present manuscript should either be discussed in this regard or add evidence for a direct role of the protein. One such evidence is typically performed with acute knockdowns in culture, or in developing brains by in utero electroporation. For example, Figure 1C shows that the principal excitatory neurons in the hippocampus do not express ARHGEF6. However, most electrophysiological and behavioral evidence of defects in ARHGEF6-KO mice arises from evaluating these cells (Remakers et al., 2012). I am not suggesting that either previous or actual evidence is wrong. But I believe readers would benefit from a clear distinction (or add caution notes) between a functional consequence of the deletion (that can be months away and in other cells than the actual molecular defect) and a true cell biological function of the protein under study. In favor of the authors, this is a concern with most conclusions derived from KO organisms.
(2) Figure 1E-G H I. All conclusions are made with a GAD67-GFP reporter, which is a very powerful and reliable tool for large-scale screening. All the conclusions of the paper would be strengthened if some immunohistochemical staining in the same areas of specific markers for interneurons would be added as supporting complementary evidence.
(3) Cell death in development: It is surprising that the high amount of TUNEL staining during development does not translate into gross histological changes in the adult brain (studied elsewhere). Can authors discuss possible explanations?
(4) Section 4 (Figures 2F-J) - The authors present this staining as an analysis of migration. Normally, migration studies are performed with a "pulse-chase" paradigm, where a single cohort is labeled and then followed over time (normally by in utero electroporation of a fluorescent protein). Tissue is then fixed at different time points, and migration can be followed. On the contrary, the evidence is from a single point, in an experimental setting in which all Gad67 IN are stained, and hence, one cannot imply a defect in migration. The differences between WT and ARHGEF6-KO are obvious and interesting; it is just that they cannot be solely attributed to a problem in migration.
Also, a true phenotype of migration in the current setting should have found that the cells that failed to migrate are accumulated in deeper layers. My impression is that the changes in IN per layer are easier explained by total cell number, rather than migration. Perhaps evaluating earlier timepoints could clarify this.
(5) It is known that ARHGEF6 deletion produces severe F-actin phenotypes in neurons. Have the authors confirmed in their hippocampal cultures GAD67 cells ALSO have these phenotypes? Stress fibers in somas, growth cones, and actin patches along neurites.
(6) Section 4. The authors present data for deficient migration of the GFP-labeled interneurons. Is it possible to assess, in the same sections, whether other cell types are also affected? Although the hypothesis that ARHGEF6 deletion will have an impact in IN is well rooted in expression data, by assessing other cell types, one can even include a positive control or evidence for a cell-autonomous phenotype.
(7) ARHGEDF6 deletion has an important impact on organoid development (size, shape, etc). Have the authors analysed whether these organoids produced fewer interneurons?
(8) In assembloids, the differences in migration parameters are very small between WT and ARHGEF6-KO, which reinforces that perhaps what is observed in the different layers of cortex during mouse development is likely not entirely due to migration, as concluded.
(9) To properly weigh the present evidence -interneuron deficits- using the ARHGEF6-KO model, authors should include a deeper discussion in light of much work that has been done using these mice. How does the finding of a diminished IN population in the brain of these mice explain the large amount of electrophysiological and behavioral evidence produced before with these animals? Perhaps the most important work to discuss these aspects is the initial ARHGEF6-KO report by Ramakers and colleagues (2012), but there are others.
Minor comments
(1) Figure 1A. It looks clear that the GE shows the highest expression of ARHGEF6; however, the reader needs the reference levels where the log2 expression is calculated. What are the reference levels?
(2) Have the authors compared the number of GAD67-eGFP cells in the hippocampal cultures between WT and ARHGEF6-KO mice?
(3) Section 3, as a caution note, authors should mention that it is not possible to know from the evidence provided which cells are dying.
(4) In the dorsal-ventral assembloids, it is expected that the ventral organoid would contain lots of GFP expression compared to the dorsal, but in the image shown (Figure 5A) both parts of the assembloid seem to have the same amount and distribution of GFP. How is that possible?
Reviewer #3 (Public review):
Summary:
ARHGEF6 is a RAC1/CDC42 guanine nucleotide exchange factor that has been proposed to be associated with X-linked intellectual disability, but its relevance to the pathology is not well established. ARHGEF6 has been assigned a role in spine density and plasticity of hippocampal pyramidal neurons, but nothing is known about its role in interneuron development. Here, the authors show that ARHGEF6 is expressed early in development in the inhibitory lineage during the peak of interneuron generation and migration. The aim of the study is therefore to investigate whether, in addition to its role in pyramidal neurons, ARHGEF6 could play a role in inhibitory neuron development. Using both ARHGEF6-KO mice and organoids from ARHGEF6-KO hiPSCs, the authors show that ARHGEF6 plays a critical role in interneuron development and function
Strengths:
The major strength of the paper is the very detailed analysis of the role of ARHGEF6 using two different systems: ARHGEF6-KO mice and deletion of ARHGEF6 in human iPSC-derived organoids. Strikingly, deletion of ARHGEF6 in both systems induces similar defects such as an increase in apoptosis, reduced neuronal output, impaired neuronal morphology, and disrupted migratory dynamics. This compelling evidence demonstrates that ARHGEF6, in addition to its already well-described role in spine formation and plasticity, is playing a crucial role during embryonic development through its function in interneurons.
Weaknesses:
(1) In Figure 1, the authors show that ARHGEF6 is expressed in different regions of the brain, including the interneuron lineage, and that depletion of ARHGEF6 reduces the number of GABAergic neurons in the adult cortex and hippocampus. To try to better characterize this defect, the authors in Figure 2 investigate whether deletion of ARHGEF6 affects interneuron migration and survival during embryonic development. To do so, ARHGEF6 ko mice were crossed with the GAD67-eGFP reporter line to follow the inhibitory lineage. The authors analyse apoptosis using TUNEL staining, and show that it is significantly increased in the ganglion eminence of ARHGEF6-KO E14.5 embryos. The authors claim that this is not the case in the cortex. However, the image shown in Figure 2A really suggests that staining is increased. Which part of the neocortex is analysed for quantification? This should be clarified.
(2) In Figure 2F-J, the authors investigate the migration of interneurons by analysing the GAD67-eGFP staining, and clearly show that the migratory abilities of the depleted neurons are reduced. However, the authors do not discuss the fact that, because depletion of ARHGEF6 increases apoptosis, there are fewer neurons available for migration. This is important for the interpretation of the data. This point should be clarified.
(3) In Supplementary Figure S2, the authors describe the establishment of the ARHGEF6-KO human iPSC line and test the ability of these cells to undergo correct development, especially for the generation of neural progenitor cells. I was wondering why the authors do not present the data of both control and ARHGEF6-KO cells.
(4) At the molecular level, how ARHGEF6 depletion could affect neuronal survival is missing. In addition, as ARHGEF6 is a GEF for RAC1 and Cdc42 amongst other GEFs, I would have expected that the authors test how RAC1 activity (and Cdc42) is affected in ARHGEF6-depleted brains and in ARHGEF6-KO organoids. The measure of phalloidin staining and the anisotropy index are not really meaningful.
(5) The authors show that ARHGEF6-KO forebrain organoids were markedly smaller compared to their isogenic controls, and their study suggests that ARHGEF6 expression impacts progenitor maintenance and neurogenesis. Despite representing only a minority of the total neuronal population, I was wondering whether ARHGEF6-KO mice present brain morphology defects such as microcephaly.
Author response:
Public Reviews:
Reviewer #1 (Public review):
Summary:
The manuscript has several strengths, including a technically comprehensive approach that combines mouse genetics, electrophysiology, live imaging in assembloids, and human organoid models, providing a rich and multifaceted dataset. Cross-species validation through the parallel use of mouse and human systems strengthens the generality of the observed phenotypes and increases relevance to human neurodevelopment.
Consistent phenotypic observations across systems show that ARHGEF6 loss affects migration, neurite morphology, growth cone structure, and neuronal survival, supporting a coherent role in cytoskeletal regulation.
There is clear evidence for developmental defects, including reduced interneuron numbers, increased apoptosis in the ganglionic eminences, and migration deficits, all well supported by quantitative analyses. Also, there is a high-quality electrophysiological characterization that demonstrates reduced firing in interneurons, providing a well-controlled functional phenotype.
Strengths:
The manuscript has several strengths, including a technically comprehensive approach that combines mouse genetics, electrophysiology, live imaging in assembloids, and human organoid models, providing a rich and multifaceted dataset. Cross-species validation through the parallel use of mouse and human systems strengthens the generality of the observed phenotypes and increases relevance to human neurodevelopment.
Consistent phenotypic observations across systems show that ARHGEF6 loss affects migration, neurite morphology, growth cone structure, and neuronal survival, supporting a coherent role in cytoskeletal regulation.
There is clear evidence for developmental defects, including reduced interneuron numbers, increased apoptosis in the ganglionic eminences, and migration deficits, all well supported by quantitative analyses. Also, there is a high-quality electrophysiological characterization that demonstrates reduced firing in interneurons, providing a well-controlled functional phenotype.
We thank the reviewer for their positive and thoughtful assessment of our manuscript. We appreciate their recognition of the technical breadth of the study, including the integration of mouse genetics, electrophysiology, live imaging in assembloids, and human organoid models. We are also grateful that the reviewer highlights the value of our cross-species approach, as a major goal of the study was to determine whether ARHGEF6 loss produces convergent developmental and cellular phenotypes in both mouse and human systems.
Weaknesses:
Despite the strengths mentioned above, the study has some conceptual and experimental weaknesses that reduce its impact. The mechanistic insight is limited, as the research does not directly establish how ARHGEF6 regulates downstream signaling pathways.
We appreciate the reviewer’s constructive comment. We agree that, although our data establish a phenotypic link between ARHGEF6 loss and interneuron development, they do not directly dissect the molecular mechanisms underlying the observed defects. Our interpretation that the mutant phenotype involves dysregulation of cytoskeletal dynamics is based on the directly observed defects in actin polymerization and organization in neural progenitor cells and neuronal growth cones respectively, and is consistent with the abnormalities observed in neurite morphology and neuronal migration. This interpretation is further supported by the established role of Arhgef6 as a regulator of the small Rho GTPases Rac1 and Cdc42. Previous evidence shows that Arhgef6 loss reduces the activity of both GTPases and deregulates the expression of the cytoskeletal regulators Pak1–3, Limk1, and Cofilin in the mouse brain (Ramakers et al., 2012). Moreover, spine abnormalities in Arhgef6-knockdown ex vivo slice cultures can be rescued by expressing the active form of Pak3, a downstream effector of Rac1 and Cdc42 (Node-Langlois et al., 2006). Together, these findings support a model in which the loss of the protein affects development through cytoskeletal dysregulation, likely involving altered Rho GTPase signalling. We nevertheless agree that further experiments would be required to establish a direct causal relationship between ARHGEF6 loss, Rho GTPase activity, cytoskeletal dysregulation, and the interneuron phenotypes described here. We will therefore revise the manuscript to clarify that this mechanistic link remains an interpretation supported by our data and the literature, rather than a direct demonstration within the present study.
Also, there is insufficient evidence for interneuron specificity; although the central claim is that ARHGEF6 plays a selective role in interneurons, the data do not adequately exclude the possibility that the observed effects reflect broader neuronal defects. The study lacks critical controls across cell types, as several phenotypes observed in organoids and progenitors, including apoptosis, reduced neuronal output, and altered morphology, could also affect multiple neuronal populations without being directly tested.
We agree that the current data do not exclude the possibility of alterations in other neuronal lineages, specifically the excitatory lineage. With regard to this, we would like to emphasize that the investigation of excitatory cell phenotypes was beyond the scope of the present study, as this aspect has previously been examined by Ramakers et al., 2012 and Node-Langlois et al., 2006, particularly in the context of hippocampal pyramidal cells, which are among the few cell types showing consistent expression of the gene in the adult mouse brain (Allen Brain Atlas; Yao et al., 2021). In this context, it is interesting to note that, in Ramakers et al., 2012 (Figure S1), MAP2 immunostaining of hippocampal formations revealed comparable distribution and intensity of neuronal cell bodies and dendrites throughout the hippocampus of both wild-type and Arhgef6-KO animals. With regard to morphological maturation of excitatory cells, whereas we observe a simplification of interneuron morphology in both mouse and human models, Ramakers et al., 2012 reported increased dendritic arborization complexity in hippocampal pyramidal cells. With regard to migration, a direct comparison with excitatory neurons would be intrinsically difficult, as excitatory and inhibitory neurons undergo highly distinct migratory processes and are therefore not directly comparable. We greatly appreciate the reviewer’s comment, as it gives us the opportunity to better discuss the relationship between our findings and previous studies in the Discussion. We will revise the manuscript and avoid implying that the phenotype observed is exclusive to interneurons.
Furthermore, the data are predominantly descriptive, with many results remaining correlative and failing to establish causal relationships.
We agree that our study primarily establishes a phenotypic framework and does not fully resolve the causal hierarchy among altered survival, migration, cytoskeletal morphology, and intrinsic excitability. We will revise the manuscript to make this limitation explicit, avoiding statements that imply direct causality beyond the data presented.
Some more comments:
(1) Given that ARHGEF6 is a guanine nucleotide exchange factor for Rac1 and Cdc42, the absence of direct measurements of GTPase activity or downstream signaling represents a significant gap. The interpretation that the observed phenotypes are mediated through specific cytoskeletal pathways, therefore, remains inferential.
We appreciate the comment. The interpretation that our phenotype involves dysregulated cytoskeletal dynamics is based on the observed defects in actin polymerization and F-actin organization in neuronal growth cones and is consistent with the abnormalities in neurite morphology and neuronal migration. We will explicitly state in the Discussion that, since we did not directly measure Rac1 and Cdc42 activity levels in our models, our hypothesis regarding the involvement of this molecular pathway in the establishment of the observed phenotype therefore remains inferential, despite being supported by the current literature.
(2) The manuscript repeatedly interprets the findings as interneuron-specific. However, several key observations are not demonstrated to be restricted to IN. Without direct comparison to excitatory neurons or other cell types, it is difficult to conclude that ARHGEF6 plays a selective role in interneurons rather than a more general role in neuronal development. The well-done analysis of the transcriptomic dataset is not sufficient to claim IN specificity. This issue is particularly important for the interpretation of the human organoid experiments, where reductions in SOX2⁺ progenitors and NEUN⁺ neurons, as well as increased apoptosis, could reflect global developmental defects. Similarly, in the mouse experiments, the reduction in GAD67⁺ cells is compelling, but it is not shown whether other neuronal populations are also affected.
As previously mentioned, we understand the reviewer’s concern regarding the specificity of the observed phenotypes in interneurons and agree that the claims should be tempered. However, it is important to note that the interpretation of the human organoid experiments should be reconsidered. The use of specifically ventralized MGE-like organoids allowed us to assess the cell-autonomous nature of defects such as the reduction in inhibitory progenitors’ neuronal output, the increased apoptosis, and the morphological abnormalities of inhibitory neurons. We will acknowledge in the Discussion the limitations of the study with regard to assessing the cell-autonomous nature of the observed migration defects.
(3) The study provides a strong phenotypic description but limited causal resolution. For example, migration defects, altered growth cone morphology, and reduced branching are all consistent with impaired cytoskeletal regulation, but the links between these phenotypes are not directly established. Likewise, while the electrophysiological data convincingly show reduced firing in interneurons, the connection between altered cytoskeletal dynamics and intrinsic excitability is not explored.
The observed migration defects, altered growth-cone morphology, and reduced branching are consistent with impaired cytoskeletal regulation. However, we acknowledge that the mechanistic links among these phenotypes remain to be directly demonstrated. Similarly, although our electrophysiological data show reduced firing in ARHGEF6-KO interneurons, the present study does not provide direct evidence linking impaired excitability to altered cytoskeletal dynamics. In the latter case, we think that the underlying mechanisms should be further investigated at the subcellular level, particularly with respect to cytoskeleton-mediated intracellular trafficking and localization and distribution of ion channels. One limitation of the present study, which may have masked electrophysiological alterations associated with differences in membrane composition (current Figure S1D–H), is that different interneuron subtypes with distinct intrinsic properties were pooled together in the analysis. We will expand the Discussion to address these limitations.
(4) Several aspects of data presentation could be improved. In multiple figures (e.g., Figure 1A, D; Figure 4 and Video S1, 2), the images are difficult to interpret due to high cellular density, limited magnification, or lack of clear annotation. In some cases, it is not fully clear how quantifications were performed or which regions were analyzed. Improving the visual clarity with arrows, boxes, and high-magnification inserts of the data would strengthen confidence in the conclusions.
We would like to thank the reviewer for pointing this out. We agree that some images and videos would benefit from clearer annotation. In the revised manuscript, we will add high-magnification insets, arrows or boxes highlighting the relevant regions/cells, and clearer descriptions of the quantified regions. We will also improve legends and video labels to indicate genotype, region, and tracked cells.
Reviewer #2 (Public review):
The authors investigate the impact of the deletion of the small GTPase regulator ARHGEF6 on the development and physiology of interneurons. Using public databases, they first show that ARHGEF6 is enriched in interneurons or in areas that give rise to them, both in development and adulthood, in humans and mice. Using a complete KO mouse previously reported, and using a GAD67-GFP reporter mice line, they show that in the adult mouse cortex and hippocampus, there is a notorious reduction GFP+ cells. These mice show increased apoptotic cells at different timepoints and areas of the brain during development. In the developing cortex of ARHGEF6-KO mice, there are fewer IN in all layers of the developing cortex, and cells present processes not correctly oriented. IN from the hippocampus in culture show reduced excitability and impaired neurite branching. The authors then established isogenic hiPSCs lines to study ARHGEF6 deletion in human cells and differentiated ventral forebrain neurons, to find interneuron-related and non-related phenotypes. Most importantly, human interneurons grown in organoids show reduced branching and altered growth cone morphology. The authors claim that the novel interneuron phenotypes found in these models can explain, in part, the human intellectual disabilities associated with mutations in this protein. The study is well conducted and opens new avenues of research not only for the role of small GTPases regulation in early nervous system development, but also for how interneuron deficiencies impact a wider range of intellectual disability syndromes found in humans.
We appreciate the reviewer’s positive evaluation of our manuscript and their recognition of this work’s potential to expand the focus of intellectual disability research on the development and function of the inhibitory system. We are particularly encouraged that the reviewer highlights the strength of our combined mouse and human cellular models, as well as the relevance of the interneuron-related phenotypes we identify across systems.
However, most conclusions of the present version would be strengthened after considering the following comments:
Major comments:
(1) The reported biological processes evaluated at different developmental stages may be directly or indirectly related to ARHGEF6 function itself. As a model of a hereditary disease, full organism gene deletion is valid, since the human patients suffer from that condition as well. However, to investigate the roles of a protein, complete deletions may not be very accurate since they can give rise to phenotypes that are only indirectly related to the protein function itself. Most conclusions of the present manuscript should either be discussed in this regard or add evidence for a direct role of the protein. One such evidence is typically performed with acute knockdowns in culture, or in developing brains by in utero electroporation. For example, Figure 1C shows that the principal excitatory neurons in the hippocampus do not express ARHGEF6. However, most electrophysiological and behavioral evidence of defects in ARHGEF6-KO mice arises from evaluating these cells (Ramakers et al., 2012). I am not suggesting that either previous or actual evidence is wrong. But I believe readers would benefit from a clear distinction (or add caution notes) between a functional consequence of the deletion (that can be months away and in other cells than the actual molecular defect) and a true cell biological function of the protein under study. In favor of the authors, this is a concern with most conclusions derived from KO organisms.
We agree with the reviewer that phenotypes observed in constitutive knockout models may, in some contexts, reflect indirect or compensatory consequences of long-term gene loss. Conditional and/or inducible knockout or knockdown approaches can certainly help dissect the nature of the observed defects and better define the effects of gene ablation at different developmental stages or in specific cell types. However, in the context of our study, it is important to note that the experiments performed in ventralized MGE-like organoids allowed us to assess the cell-autonomous nature of very early developmental defects in the inhibitory lineage, in isolation from other cell types. These defects include reduced neuronal output from inhibitory progenitors, increased apoptosis, and morphological abnormalities in inhibitory neurons. Therefore, the phenotypes reported here are less likely to reflect effects originating in, or indirectly caused by, cell types that do not express Arhgef6.
With regard to Figure 1C, we state in the Results that “among excitatory populations, only CA3 pyramidal neurons and mossy cells exhibited expression levels comparable to those observed in inhibitory clusters (Figure 1D, Table S2),” thereby not neglecting the potential effect of the lack of a functional protein in these populations.
(2) Figure 1E-G H I. All conclusions are made with a GAD67-GFP reporter, which is a very powerful and reliable tool for large-scale screening. All the conclusions of the paper would be strengthened if some immunohistochemical staining in the same areas of specific markers for interneurons would be added as supporting complementary evidence.
We appreciate the insightful comment of the reviewer. Additional validation using established interneuronal markers will further strengthen the GAD67-eGFP analysis. We will perform complementary stainings (e.g., PVALB and CCK) and quantifications and include these data as a Supplementary Figure.
(3) Cell death in development: It is surprising that the high amount of TUNEL staining during development does not translate into gross histological changes in the adult brain (studied elsewhere). Can authors discuss possible explanations?
We appreciate the thoughtful consideration of our findings. We think that possible explanations include partial compensatory mechanisms during development, which may mitigate the long-term anatomical consequences of increased cell death. In addition, the phenotype may be restricted to specific neuronal populations or developmental windows, thereby producing functional alterations without necessarily resulting in overt macroanatomical defects. Thus, although increased developmental cell death may contribute to altered circuit assembly and neuronal output, it may not be sufficient to produce gross histological changes detectable at the adult brain level.
(4) Section 4 (Figures 2F-J) - The authors present this staining as an analysis of migration. Normally, migration studies are performed with a "pulse-chase" paradigm, where a single cohort is labeled and then followed over time (normally by in utero electroporation of a fluorescent protein). Tissue is then fixed at different time points, and migration can be followed. On the contrary, the evidence is from a single point, in an experimental setting in which all Gad67 IN are stained, and hence, one cannot imply a defect in migration. The differences between WT and ARHGEF6-KO are obvious and interesting; it is just that they cannot be solely attributed to a problem in migration.
Also, a true phenotype of migration in the current setting should have found that the cells that failed to migrate are accumulated in deeper layers. My impression is that the changes in IN per layer are easier explained by total cell number, rather than migration. Perhaps evaluating earlier timepoints could clarify this.
We appreciate the reviewer’s suggestion to implement an additional time point in the in vivo migration analysis. Since an earlier in vivo time point would most likely not reveal migration-related defects, as most cells would still be confined to the ganglionic eminence (Liaci et al., 2022), we will include analyses performed at a later developmental time point as supplementary evidence. We will also revise the wording to clarify that the fixed-tissue data show altered distribution and orientation of GAD67-eGFP-positive interneurons, which are consistent with impaired migratory behavior when considered together with the in vitro live-imaging data. At the same time, we will acknowledge that reduced interneuron survival and/or neuronal output may also contribute to the observed phenotype.
(5) It is known that ARHGEF6 deletion produces severe F-actin phenotypes in neurons. Have the authors confirmed in their hippocampal cultures GAD67 cells ALSO have these phenotypes? Stress fibers in somas, growth cones, and actin patches along neurites.
We did not directly assess F-actin organization in GAD67-eGFP murine primary cultures. Direct analyses of F-actin organization, growth-cone morphology, and cytoskeletal organization were performed only in the human system. To further assess this phenotype, we will perform phalloidin staining on GAD67-eGFP brain sections to evaluate F-actin organization in interneurons in vivo.
(6) Section 4. The authors present data for deficient migration of the GFP-labeled interneurons. Is it possible to assess, in the same sections, whether other cell types are also affected? Although the hypothesis that ARHGEF6 deletion will have an impact in IN is well rooted in expression data, by assessing other cell types, one can even include a positive control or evidence for a cell-autonomous phenotype.
We thank the reviewer for their thoughtful suggestions. We agree that extending the analysis to additional cell types would provide further insight into the specificity of the phenotype; however, a comprehensive evaluation of all neuronal populations falls beyond the scope of this research. The use of ventralized MGE-like organoids enabled us to examine whether key defects were cell-autonomous, including the reduced neuronal output of inhibitory progenitors, increased apoptosis, and abnormal inhibitory-neuron morphology.
(7) ARHGEDF6 deletion has an important impact on organoid development (size, shape, etc). Have the authors analysed whether these organoids produced fewer interneurons?
We would like to clarify that the organoids analyzed in the study are ventral MGE-like organoids and therefore the reduction in neuronal output (current Figure 4K) primarily reflects the ventral/interneuron lineage in this model.
(8) In assembloids, the differences in migration parameters are very small between WT and ARHGEF6-KO, which reinforces that perhaps what is observed in the different layers of cortex during mouse development is likely not entirely due to migration, as concluded.
We agree that the migration parameters in assembloids should not be interpreted in isolation. We will revise the text to emphasize that the reduction in the number of interneurons observed in the adult brains is part of a broader pattern that also includes altered neuronal output and reduced viability.
(9) To properly weigh the present evidence -interneuron deficits- using the ARHGEF6-KO model, authors should include a deeper discussion in light of much work that has been done using these mice. How does the finding of a diminished IN population in the brain of these mice explain the large amount of electrophysiological and behavioral evidence produced before with these animals? Perhaps the most important work to discuss these aspects is the initial ARHGEF6-KO report by Ramakers and colleagues (2012), but there are others.
We appreciate the reviewer’s emphasis on the importance of framing our findings within the broader context of the existing literature. We will expand the Discussion to better integrate previous work on ARHGEF6-KO mice. Specifically, we will discuss how reduced interneuron number and altered interneuronal function may contribute to previously reported electrophysiological and behavioral phenotypes, acting in concert with previously described alterations in excitatory neurons and synaptic plasticity (Ramakers et al., 2012).
Minor comments:
(1) Figure 1A. It looks clear that the GE shows the highest expression of ARHGEF6; however, the reader needs the reference levels where the log2 expression is calculated. What are the reference levels?
We would like to thank the reviewer for pointing this out. We will clarify in the caption that the log2(RPKM+1) expression values are shown as absolute values and are not relative to a reference condition.
(2) Have the authors compared the number of GAD67-eGFP cells in the hippocampal cultures between WT and ARHGEF6-KO mice?
We did not rely on total GAD67-eGFP counts in dissociated hippocampal cultures because differences could reflect initial plating composition, survival, and maturation. In our experience, the MGE-like organoid system provides a more controlled in vitro context to assess neuronal output in the ventral lineage.
(3) Section 3, as a caution note, authors should mention that it is not possible to know from the evidence provided which cells are dying.
We agree with the reviewer and will add a cautionary statement noting that TUNEL staining alone does not identify the precise dying cell type. We will clarify that increased cell death in the ganglionic eminence and MGE-like organoids is consistent with a prominent involvement of the ventral/inhibitory lineage, while acknowledging the limits of the assay.
(4) In the dorsal-ventral assembloids, it is expected that the ventral organoid would contain lots of GFP expression compared to the dorsal, but in the image shown (Figure 5A) both parts of the assembloid seem to have the same amount and distribution of GFP. How is that possible?
We appreciate the thoughtful comment of the reviewer. After two weeks of fusion, a considerable number of interneurons are expected to have migrated from the ventral to the dorsal compartment of the assembloid (Birey et al., 2017; Sloan et al., 2018). In terms of distribution, we think that current Figure 5A shows a gradient of eGFP-positive cells within the dorsal compartment, with the number of labeled cells decreasing as the distance from the fusion interface between the two organoids increases. By contrast, a comparable gradient is not evident in the ventral compartment, where several labeled neurons remain present even in regions distal to the fusion site.
Reviewer #3 (Public review):
Summary:
ARHGEF6 is a RAC1/CDC42 guanine nucleotide exchange factor that has been proposed to be associated with X-linked intellectual disability, but its relevance to the pathology is not well established. ARHGEF6 has been assigned a role in spine density and plasticity of hippocampal pyramidal neurons, but nothing is known about its role in interneuron development. Here, the authors show that ARHGEF6 is expressed early in development in the inhibitory lineage during the peak of interneuron generation and migration. The aim of the study is therefore to investigate whether, in addition to its role in pyramidal neurons, ARHGEF6 could play a role in inhibitory neuron development. Using both ARHGEF6-KO mice and organoids from ARHGEF6-KO hiPSCs, the authors show that ARHGEF6 plays a critical role in interneuron development and function
Strengths:
The major strength of the paper is the very detailed analysis of the role of ARHGEF6 using two different systems: ARHGEF6-KO mice and deletion of ARHGEF6 in human iPSC-derived organoids. Strikingly, deletion of ARHGEF6 in both systems induces similar defects such as an increase in apoptosis, reduced neuronal output, impaired neuronal morphology, and disrupted migratory dynamics. This compelling evidence demonstrates that ARHGEF6, in addition to its already well-described role in spine formation and plasticity, is playing a crucial role during embryonic development through its function in interneurons.
We thank the reviewer for this positive assessment of our work and for highlighting the strength of our combined in vivo and human iPSC-derived organoid approaches. We are pleased that the reviewer recognizes the consistency of the phenotypes observed across both systems and acknowledges that our findings support a crucial role, during early stages of embryonic development, for a protein previously thought to be relevant primarily in the synaptic context.
Weaknesses:
(1) In Figure 1, the authors show that ARHGEF6 is expressed in different regions of the brain, including the interneuron lineage, and that depletion of ARHGEF6 reduces the number of GABAergic neurons in the adult cortex and hippocampus. To try to better characterize this defect, the authors in Figure 2 investigate whether deletion of ARHGEF6 affects interneuron migration and survival during embryonic development. To do so, ARHGEF6 ko mice were crossed with the GAD67-eGFP reporter line to follow the inhibitory lineage. The authors analyse apoptosis using TUNEL staining, and show that it is significantly increased in the ganglion eminence of ARHGEF6-KO E14.5 embryos. The authors claim that this is not the case in the cortex. However, the image shown in Figure 2A really suggests that staining is increased. Which part of the neocortex is analysed for quantification? This should be clarified.
We would like to thank the reviewer for pointing this out. The region analyzed was the same as that used to assess GAD67-eGFP-positive cells in Figure 2F. We will clarify the exact neocortical region used for TUNEL quantification and revise the figure and legend to make the analyzed area explicit. We will also analyze additional animals to improve the accuracy of the analysis.
(2) In Figure 2F-J, the authors investigate the migration of interneurons by analysing the GAD67-eGFP staining, and clearly show that the migratory abilities of the depleted neurons are reduced. However, the authors do not discuss the fact that, because depletion of ARHGEF6 increases apoptosis, there are fewer neurons available for migration. This is important for the interpretation of the data. This point should be clarified.
We appreciate this comment and believe that it is particularly relevant to the interpretation of the data shown in Figure 2F–G. We will clarify the limited interpretation of this specific analysis in the Results section. The altered directionality observed in vivo, together with evidence of impaired migratory behavior obtained through in vitro live imaging, supports the possibility that altered migratory dynamics contribute to the phenotype, although increased apoptosis and reduced neuronal output may also contribute.
(3) In Supplementary Figure S2, the authors describe the establishment of the ARHGEF6-KO human iPSC line and test the ability of these cells to undergo correct development, especially for the generation of neural progenitor cells. I was wondering why the authors do not present the data of both control and ARHGEF6-KO cells.
We thank the reviewer for pointing this out. All staining reported in the organoids and assembloids in this paper shows that the WT ATCC-DYS0100 cell line, as well as the mutant, efficiently differentiates into neuronal tissue. The Supplementary Figure was intended to validate the impact of the mutation on the ability of the iPSC line to retain its differentiation capacity as a preliminary step before proceeding with organoid differentiation. We will integrate stainings for NPC markers on the WT line in the Supplementary Figure.
(4) At the molecular level, how ARHGEF6 depletion could affect neuronal survival is missing. In addition, as ARHGEF6 is a GEF for RAC1 and Cdc42 amongst other GEFs, I would have expected that the authors test how RAC1 activity (and Cdc42) is affected in ARHGEF6-depleted brains and in ARHGEF6-KO organoids. The measure of phalloidin staining and the anisotropy index are not really meaningful.
We appreciate the thoughtful comment of the reviewer. Previous evidence already shows that Arhgef6 loss reduces the activity of both GTPases and deregulates the expression of the cytoskeletal regulators Pak1–3, Limk1, and Cofilin in the mouse brain (Ramakers et al., 2012). Regarding organoids, we agree that direct RAC1/CDC42 activity measurements would have strengthened the molecular mechanism. We will revise the manuscript to avoid implying that our phalloidin-based measurements alone establish the underlying dysregulated molecular pathway.
(5) The authors show that ARHGEF6-KO forebrain organoids were markedly smaller compared to their isogenic controls, and their study suggests that ARHGEF6 expression impacts progenitor maintenance and neurogenesis. Despite representing only a minority of the total neuronal population, I was wondering whether ARHGEF6-KO mice present brain morphology defects such as microcephaly.
We appreciate the comment. We did not perform a morphometric analysis for microcephaly in the present study. We will add this limitation to the Discussion and note that gross brain morphology changes were not reported in the previously published ARHGEF6-KO mouse characterization (Ramakers et al., 2012). We will also clarify that the smaller organoid phenotype may reflect developmental defects that may reflect developmental defects that are not fully compensated in a reductionist in vitro model and therefore do not necessarily imply overt microcephaly in vivo.
References
Allen Institute for Brain Science. Allen Mouse Brain Atlas: Arhgef6 ISH data. Available from: Allen Brain Map.
Birey, F., Andersen, J., Makinson, C. D., Islam, S., Wei, W., Huber, N., Fan, H. C., Metzler, K. R. C., Panagiotakos, G., Thom, N., O’Rourke, N. A., Steinmetz, L. M., Bernstein, J. A., Hallmayer, J., Huguenard, J. R., & Pașca, S. P. (2017). Assembly of functionally integrated human forebrain spheroids. Nature, 545(7652), 54–59. https://doi.org/10.1038/nature22330
Liaci, C., Camera, M., Zamboni, V., Sarò, G., Ammoni, A., Parmigiani, E., Ponzoni, L., Hidisoglu, E., Chiantia, G., Marcantoni, A., Giustetto, M., Tomagra, G., Carabelli, V., Torelli, F., Sala, M., Yanagawa, Y., Obata, K., Hirsch, E., & Merlo, G. R. (2022). Loss of ARHGAP15 affects the directional control of migrating interneurons in the embryonic cortex and increases susceptibility to epilepsy. Frontiers in Cell and Developmental Biology, 10, 875468. https://doi.org/10.3389/fcell.2022.875468
Nodé-Langlois, R., Muller, D., & Boda, B. (2006). Sequential implication of the mental retardation proteins ARHGEF6 and PAK3 in spine morphogenesis. Journal of Cell Science, 119(23), 4986–4993. https://doi.org/10.1242/jcs.03273
Pelkey, K. A., Chittajallu, R., Craig, M. T., Tricoire, L., Wester, J. C., & McBain, C. J. (2017). Hippocampal GABAergic inhibitory interneurons. Physiological Reviews, 97(4), 1619–1747. https://doi.org/10.1152/physrev.00007.2017
Ramakers, G. J. A., Wolfer, D., Rosenberger, G., Kuchenbecker, K., Kreienkamp, H.-J., Prange-Kiel, J., Rune, G., Richter, K., Langnaese, K., Masneuf, S., Bösl, M. R., Fischer, K.-D., Krugers, H. J., Lipp, H.-P., van Galen, E., & Kutsche, K. (2012). Dysregulation of Rho GTPases in the αPix/Arhgef6 mouse model of X-linked intellectual disability is paralleled by impaired structural and synaptic plasticity and cognitive deficits. Human Molecular Genetics, 21(2), 268–286. https://doi.org/10.1093/hmg/ddr457
Sloan, S. A., Andersen, J., Pașca, A. M., Birey, F., & Pașca, S. P. (2018). Generation and assembly of human brain region-specific three-dimensional cultures. Nature Protocols, 13(9), 2062–2085. https://doi.org/10.1038/s41596-018-0032-7
Yao, Z., Nguyen, T. N., van Velthoven, C. T. J., Goldy, J., Sedeno-Cortes, A. E., Baftizadeh, F., Bertagnolli, D., Casper, T., Chiang, M., Crichton, K., Ding, S.-L., Fong, O., Garren, E., Glandon, A., Gouwens, N. W., Gray, J., Graybuck, L. T., Hawrylycz, M. J., Hirschstein, D., … Zeng, H. (2021). A taxonomy of transcriptomic cell types across the isocortex and hippocampal formation. Cell, 184(12), 3222–3241.e26. https://doi.org/10.1016/j.cell.2021.04.021
For your initial post in this discussion, address the discussion prompt and follow the discussion guidelines accompanying it. Your initial post is due by Wednesday, at 11:59 PM ET.
Create your initial post in this discussion by Wednesday at 11:59 PM ET.
To view the discussion rubric, select the Options (three dots) icon in the upper right and select Show Rubric. Review the Canvas Guide on finding discussion rubrics for additional details.
Choose one.
keep link in case the interface gets updated
Subquestions Timeline
these are subquestions, but we're missing some of the 'goal oriented' questions here
Review the following resources:
Complete the reading(s) before you begin the module tasks.
Remove callout.
Remove "Read"
Remove bullets
The genetics of an isolated island population, a physically demanding shepherding life and a traditional diet all play a role
The genetics of an isolated island population, a physically demanding shepherding lifestyle, and a traditional diet all play a role
and the 2022 study found the centenarians' microbial profile
and the 2022 study found that the centenarians' microbial profile
but that research is still mostly at the cell-and-mouse stage, not a human longevity trial
but that research is still mostly at the cell and mouse stage, rather than a human longevity trial
and proteins it produces can stimulate cells to release
and the proteins it produces can stimulate cells to release
No single factor explains it. Researchers point to the genetics of an isolated island population, a physically demanding shepherding life, and a traditional plant-heavy diet, and more recently to an unusual gut-microbiome profile. The male-longevity finding has been independently validated against birth, marriage and death records, but the full causal picture is still being studied.
No single factor explains it. Researchers point to the genetics of an isolated island population, a physically demanding shepherding lifestyle, a traditional plant-heavy diet, and, more recently, an unusual gut microbiome profile. The male longevity finding has been independently validated against birth, marriage, and death records, but the full causal picture is still under study.
That is the most actionable takeaway, and the most honest one
That is the most actionable and honest takeaway
plant-based way of eating feeds exactly the kind of bacteria these long-lived people carry
plant-based way of eating feeds the very bacteria these long-lived people harbor
demand, but the broad
demand. Still, the broad
The bacteria enriched in the Sardinian centenarians are the kind that thrive on plant fiber
The bacteria enriched in the Sardinian centenarians are those that thrive on plant fiber
fennel, tomatoes and almonds; and a modest daily glass of the local Cannonau
fennel, tomatoes, almonds, and a modest daily glass of the local Cannonau
The traditional Sardinian shepherd's diet is not exotic, and it is not built around supplements
The traditional Sardinian shepherd's diet is not exotic or built around supplements
have shown that Akkermansia and proteins it produces can stimulate cells to release
have shown that Akkermansia and the proteins it produces can stimulate cells to release
The truly unusual signal was not the raw number of old people
The truly unusual signal was not the raw number of older people
testing company NB1, and the research experts
testing company NB1 and the research experts
the search has led in many directions, including all the way down to the bacteria living in residents' intestines
the search has led in many directions, all the way down to the bacteria living in residents' intestines
and in the village of Villagrande Strisaili the count is so even that men actually edge slightly ahead
and in the village of Villagrande Strisaili, the count is so even that men actually edge slightly ahead
at nearly the same rate as women, and in one village they even edge ahead, something
at nearly the same rate as women, and in one village, they even edge ahead, something
The winds of unipolarity were so strong that coherent arguments for primacy were barely needed at all. Stepping into the breach, some elite discourse shifted from complacent to hallucinatory, particularly among economists. “This expansion will run forever,” said MIT’s Rudi Dornbusch.34Rudi Dornbusch, “Growth Forever,” Wall Street Journal (July 30, 1998) Paul Krugman declared that good economists could disagree on questions like whether “the demand side matters.”35Paul Krugman, (<)em(>)Peddling Prosperity Economic Sense and Nonsense in the Age of Diminished Expectations(<)/em(>) (New York: Norton, 1994) 89 Janet Yellen and Alan Blinder speculated about a future without public debt.36
!
eLife Assessment
This important study examines the effects of diet and exercise on brain structure and behaviour in the 3xTg mouse model of Alzheimer's disease. They show that combined access to a low-fat diet and exercise improves regional brain volume and behaviour in transgenic and wild-type control mice in a sex-specific manner, with analyses linking functional improvements to glucose homeostasis. Although some claims are well supported, the overall strength of the evidence is incomplete and hampered by a lack of clarity regarding the statistical analyses chosen. The work may be of interest to researchers studying neurodegenerative disease, particularly in preclinical contexts.
Reviewer #1 (Public review):
A triple-transgenic (3xTgAD) mouse model of Alzheimer's disease was exposed to a high-fat diet and assigned to one of three interventions: voluntary physical activity, a low-fat diet, and their combination. A high-fat diet significantly increased body weight and induced widespread neuroanatomical changes, with effects modulated by sex and genotype. The combined intervention led to significant weight loss in males of both genotypes. Neuroanatomical analyses revealed that a high-fat diet significantly reduced hippocampal and cerebellar volumes in wild-type mice but had a less pronounced effect on 3xTgAD mice; nevertheless, interventions, particularly the combined approach, increased localized brain volumes in these regions regardless of genotype. Spatial gene enrichment analysis of this pattern identified glucose homeostasis. Overall, these findings suggest that voluntary physical activity and a low-fat diet can modulate brain structure and behaviour, partially counteracting the effects of a high-fat diet, and potentially recruiting biological processes that may support brain health.
The authors describe studies of the 3xTg mouse model of Alzheimer's disease (AD). They set out to study the interactions of diet and exercise on three outcomes: weight gain, MRI, and either the novel object recognition or Morris water maze tasks of memory.
They conclude there are sex and genotype effects on hippocampal volume.
There are several strengths to the study. First, they start out with a great deal of mice. Once they are divided into groups, the sample sizes are not always strong, however. It would be good to know that they were sufficiently powered.
The data are also interesting. Mice were placed on several different diets during the study, which will be of interest to many who question the role of diet in outcomes. They also add exercise as an intervention, and study not only diet but also the combined effect of diet and exercise. This is relevant to those interested in controlling dementia by diet and exercise. Finally, they perform some very interesting analyses to study the data.
That said, the study also has several limitations. For example, it is quite complex. Mice had a standard diet until 2 months of age, then were switched to either a low-fat or a high-fat diet. Some mice had both a different diet and exercise. MRI was performed at 2, 4, and 6 months, when behavior was tested. A drawback of this design is that no assessment of outcomes relevant to this animal model, such as amyloid-beta or tau phosphorylation, was conducted. Also, they used the novel object recognition task, despite stating in the Discussion that this task does not show impairments until well after 6 months of age. They added exercise, but it is not clear whether the animals used the exercise apparatus equally. Also, the animals were housed "communally", so adding an exercise wheel may have made the cage crowded, adding stress to the study. The diets were not simply low- or high-fat because many constituents besides fat content also changed. Regarding fat, the type of fat also changed between diets. Therefore, the gut microbiome was probably affected differently by factors other than fat intake. There was no measurement of food consumption, so some mice may not have eaten as much of the new diet as they did of the old diet they were used to.
Regarding the data, only the outcomes of complex analyses are shown. One would first want to see the changes in body weight and perhaps later how it is analyzed in a more complex way. For behavior, one would first want to see outcomes as typically presented. For example, learning, recall, platform test results from the Morris water maze, and discrimination indices for object recognition. Note that, at one point, I believe the authors note that some groups did not explore thoroughly, which would make novel object recognition hard to interpret. If there was any difficulty with ambulation, both tasks would be hard to interpret.
Regarding MRI, from what can be seen, structures cannot be distinguished clearly. At least some raw data should be shown to demonstrate this and to determine what the data show. The raw data suggest that some of the larger structures can be distinguished, and we should see the data for these areas, even if all areas can't be assessed. Lifestyle interventions can mitigate the effects of diet-induced obesity on body weight, behaviour, and brain anatomy in mouse models. Using a longitudinal design, wild-type and triple-transgenic (3xTgAD) mouse models of Alzheimer's disease were exposed to a high-fat diet and assigned to one of three interventions: voluntary physical activity, a low-fat diet, and their combination. A high-fat diet significantly increased body weight and induced widespread neuroanatomical changes, with effects modulated by sex and genotype. The combined intervention led to significant weight loss in males of both genotypes. Neuroanatomical analyses revealed that a high-fat diet significantly reduced hippocampal and cerebellar volumes in wild-type mice but had a less pronounced effect on 3xTgAD mice; nevertheless, interventions, particularly the combined approach, increased localized brain volumes in these regions regardless of genotype. Multivariate integration of behavioural and neuroanatomical measures identified a brain pattern linking hippocampal and cerebellar volumes to intervention and behavioural performance. Spatial gene-enrichment analysis of this pattern identified biological processes, including glucose homeostasis, as potential biological mechanisms underlying intervention effects. Overall, these findings suggest that voluntary physical activity and a low-fat diet can modulate brain structure and behaviour, partially counteracting the effects of a high-fat diet, and potentially recruiting biological processes that may support brain health. In the end, the authors focus primarily on the hippocampus and discuss the cerebellum, but it seems that changes occur throughout the brain. The choice to focus on the hippocampus and cerebellum needs to be supported.
To gain further insight, the authors analyze genes across different brain regions using the Allen Brain Atlas. Although this seems reasonable in theory, once one realizes how many genes are shared across diverse brain regions, one wonders how such an analysis was conducted. More understanding of this approach, as well as how it was validated, is important. In the end, the authors conclude that the glucose homeostatic pathways were primarily altered, and one would like to understand whether that is indeed true and whether it is the only set of pathways that were changed.
This raises another point: what occurs in a normal wild-type mouse on the standard diet during the first 6 months of life? Do the glucose homeostatic pathways change simply due to age? Sex? It may be that, with age, the mice become more sedentary, which is why. Once that is resolved, what occurs on the standard diet for the 3xTg mice? Perhaps they are more active or more sedentary, regardless of diet or exercise? Thus, the studies end up raising more questions than answers.
Given so much work has already been done, it seems best to simply reorganize the presentation with raw data first, followed by the analysis. For the second section, the implicit assumptions of the analyses should be very clear so that the analyzed data are understood and believable. Limitations of the assumptions, pooling some groups, etc., need to be clear.
Figures. In Figure 1, the weekly measurements are not shown. The points are connected, so an unbroken line is shown. Around the line are lighter lines indicating errors, but with all the lines and colours, one does not know what standard errors surround the values for any given group. This makes the data hard to interpret. In later figures, significant differences are indicated with asterisks, but this seems to be done inconsistently.
In the text, more caution is needed for some assertions. For example, it is not clear that a 2- to 6-month-old is an adolescent. Opinions about the ages of mice that correspond to human life stages have always been debated. Another example is indicating that male mice might gain weight differently than females, as if it were an outcome of diet or exercise. This is because male rodents continue to gain weight in adulthood, but females stabilize because estrogen limits appetite. Additionally, females may not show group differences because they are more variable. This can relate to their estrous cycle. If stressed or housed without males nearby, they may not have a regular estrous cycle, which can then affect their outcomes. This may be particularly true for behavior when they may have been tested during different estrous cycle phases, if they had estrous cycles.
Reviewer #2 (Public review):
Summary:
This manuscript describes an investigation into the effect of diet and exercise interventions in WT and transgenic (male and female) mice who are exposed to either a high-fat or a low-fat diet. The outcome variables include MRI volume and brain morphology, as well as memory performance. First, this study measured the impact of genotype (WT vs 3xTgAD mice), then examined the impact of a high-fat or low-fat diet in each group, and finally examined the impact of a low-fat diet, exercise, or a combined low-fat diet and exercise intervention. This is an important study as it allows us to better understand how changes to lifestyle can affect neurocognitive function and potentially change a person's AD risk.
Strengths:
(1) The study uses a well-controlled longitudinal design, allowing the authors to track how diet and exercise interventions influence brain and behaviour over time.
(2) The integration of multiple levels of analysis (brain imaging, behaviour, and multivariate modelling) provides a rich and comprehensive assessment of intervention effects.
(3) The inclusion of both genotype and sex as key variables strengthens the relevance and interpretability of the findings, given known differences in risk and response across groups.
Weaknesses:
There are a lot of analyses in this paper, and I had a little bit of trouble distilling the major take-home messages. For example, I was left wondering:
(1) If the effect of genotype and the effect of the high-fat diet were consistent in the current study compared to the authors' previous work (e.g. Rollins et al., 2019). A more direct report on the consistency of these findings (maybe even an overlap map, if possible) would benefit the reader.
(2) How consistent/different are the volumetric and morphometric (DBM) results from each other? Especially in the regions of interest (hippocampus and cerebellum), are increases in volumes always related to "expansion" of a given region using DBM? Some of the similarities are reported in the results, but for transparency, a side-by-side table comparing the results across techniques for each effect of interest might provide more clarity.
(3) I was interested in the Partial Least Squares approach that the authors used to investigate how patterns of brain measures relate to the behavioral variables. Because they are presented mostly in the supplement (except for Figure 6E), it's difficult to map the LVs described onto the univariate contrasts in Figures 2-5. In general, greater clarity is needed regarding how the PLS-derived latent variables relate to the univariate findings, and whether the emphasis on LV3 reflects a principled selection or post hoc interpretation.
(4) If I understand the results correctly, there were only modest differences in behavior reported, and the patterns were somewhat inconsistent across sex and genotype. In fact, the authors report that the high-fat diet alone did not impair memory on the Morris Water maze (line 323). The discrepancy between robust neuroanatomical effects and relatively modest behavioural changes raises important questions about the functional significance of the observed structural alterations.
(5) On line 507, the authors state, "Notably, 3xTgAD mice already show smaller brain volumes at baseline, which may constrain the detectable impact of the diet." Is this true for the entire brain or just the hippocampus and cerebellum? Would a global reduction in brain volume due to the 3xTgAD AD model affect the interpretation of the intervention effects?
Reviewer #3 (Public review):
Summary:
The authors sought to determine the individual and combined effects of exercise and low-fat diet consumption on regional brain volume and cognitive function in triple-transgenic Alzheimer's disease mice and wild-type controls.
Strengths:
(1) A strength of this study is its longitudinal design, which captures regional changes in brain volume across the interventions tested.
(2) Its comprehensive design includes 10 groups and is well-powered to isolate genotype-, sex-, diet- and exercise-related effects (and interactions).
(3) The analyses of volumetric and voxel-based measures are comprehensive.
Weaknesses:
(1) Use of automated tracking for NOR data reduces confidence in the behavioural data.
(2) No measures of Ab or tau pathology appear to be performed.
(3) Mice from the critical 'combined' intervention groups are not included in the PLS regression model that integrates behavioural and brain data.
(4) Analyses of behavioural data include a large number of variables without adequate justification.
eLife Assessment
The manuscript by Rotsides et al. reports the design and validation of SMART-MR1, a miniaturized MR1 metabolite-display platform in which the α1/α2 ligand-binding domain is stabilized by a synthetic helical domain in place of the α3 domain and β2-microglobulin. Supported by biochemical, biophysical, and structural approaches, including ITC, NMR, and cryo-EM, the work provides solid evidence that SMART-MR1 retains native-like ligand binding and A-F7 TCR recognition while enabling experimental approaches for ligand screening that are difficult with conventional MR1 constructs. The study is valuable for the MR1 and MAIT-cell fields, particularly as a tool for ligand screening and mechanistic studies of MR1-restricted antigen presentation. There are several suggestions to further strengthen the study's impact, including clearer benchmarking against existing MR1 platforms, broader validation across ligands and TCRs, and functional evidence from MAIT-cell staining or activation assays.
Reviewer #1 (Public review):
Summary:
This study presents an Important tool for the study of MR1 antigen binding, opening new possibilities, and cutting-edge techniques. The evidence supporting the claims of the authors is solid, although including some functional experiments using primary T-cells would also provide a more complete physiologic evaluation. The work will be of interest to T cell immunologists, in general, especially those studying unconventional T cells.
Strengths:
In this study, the authors developed a single-chain MR1-derived protein by exchanging the α3 domain and β2-microglobulin for a helical stabilizing domain that they had previously developed. The aim was to generate a more compact structure that would still fold properly, without the risk of losing β2-microglobulin. This overall more robust structure would facilitate ligand exploration using various cutting-edge biophysical techniques.
The authors successfully demonstrated that their construct folds similarly to native MR1 and retains the ability to bind MAIT TCR in solution, as shown by cryo-EM experiments. Its melting temperature was equivalent to that of the native protein. Importantly, the construct enables the use of differential scanning fluorometry and transverse relaxation-optimized spectroscopy, which represent the main strengths of this work. These approaches should greatly facilitate the screening of additional unknown ligands and enable interaction mapping.
Weaknesses:
One possible area for improvement would be to extend the validation to additional known ligands, particularly weaker binders. Furthermore, although the cryo-EM data are highly convincing, including either MAIT cell staining or MAIT activation assays with the generated construct would provide stronger functional validation of its equivalence to the wild-type protein with respect to ligand-binding properties.
Overall, this work is of great interest to the field, as several groups worldwide are seeking to identify endogenous/tumour-derived MR1 ligands. In addition, some pathogens lacking the capacity to produce 5-OP-RU have been shown to activate MAIT cells, raising the possibility that unknown pathogen-derived ligands may also exist.
Reviewer #2 (Public review):
Summary:
The authors develop a miniaturized MR1 construct (SMART-MR1) in which the α1/α2 platform is stabilized by a synthetic domain, and show that it can bind ligands, engage a cognate TCR, and recapitulate native-like recognition by cryo-EM.
Strengths:
The work is well-written, technically strong and carefully executed. The authors combine biochemical, biophysical and structural approaches, including ITC, NMR and cryo-EM, to show that SMART-MR1 behaves in a manner closely resembling native MR1. The reduction in size and the demonstration of solution NMR are clear practical advantages for certain types of mechanistic studies.
Weaknesses:
The main limitation is that the manuscript does not clearly establish a practical advantage over existing MR1 formats, such as single-chain MR1-β2M or previously described stabilized constructs. The comparison is largely framed against native MR1, which risks overstating the problem, and on the basis of the data presented, it is unlikely that other researchers will adopt this system. In addition, the choice of the A-F7 TCR as a validation reagent may overestimate the generality of the approach, as this receptor is known to exhibit relatively broad ligand tolerance, including recognition of MR1 presenting vitamin B6 metabolites (PDB 9CGR) and structurally diverse synthetic ligands. The extent to which SMART-MR1 supports recognition by a broader range of MR1-restricted TCRs is not addressed.
Reviewer #3 (Public review):
Summary:
This manuscript describes the engineering, production and validation of an MR1 variant with enhanced suitability for screening of ligands and biophysical and structural analysis. The authors utilize a previous advance from their laboratory on a classical MHC (HLA-A2) whereby the alpha 3 and b2m domains are replaced by a helical stabilizing domain.
Strengths:
This variant has a smaller molecular weight than the native MR1, can be produced easily through refolding and is thus much more suitable for NMR analysis. The authors provide data demonstrating that many of the parameters typically evaluated in protein biochemistry/biophysics are similar to reported values between this engineered variant and the wild-type protein. Overall, this is a significant advance to the MR1 field and more broadly to MR1 relevance in immunology and cancer biology, as this will accelerate high-throughput screening and discovery of disease-relevant ligands for MR1, which have been overshadowed by the misguided fixation on 5-OP-RU.
Weaknesses:
Minor concerns about the lack of comparison with the native MR1 extracellular domain construct in the validation of this engineered construct.
eLife Assessment
The study by Izquierdo and colleagues provides important insights into the field of genomic and transcriptomic prediction of traits across multiple environments. The rationale and analyses conducted to integrate the two types of ~omics datasets across two environments are solid. However, some clarification would be appreciated in the presentation of the results, and adding some statistical control to clarify how the predictors were selected, or assessing their importance using the SHAP framework, would further consolidate the findings.
Reviewer #1 (Public review):
Summary:
P. Izquierdo et al. investigated the genetic determinism of various traits of interest in switchgrass using large-scale genomic and transcriptomic data. More specifically, they worked on a diversity panel comprising 426 genotypes evaluated in common-garden experiments at two locations (Michigan and Texas). The phenotypic and genomic data were already published. In this work, they produced transcriptomic data for each of the 426 genotypes at each site, and they carried out phenotype predictions using genomic and transcriptomic data separately or together. While they were moderately correlated at each location, both omic information appeared to be complementary for the prediction of phenotype. To further exploit the fact that they have data across two locations, they computed differences for phenotypes and transcripts between locations as indicators of trait and transcript plasticity, respectively. They built predictive models of trait plasticity using genomic information and transcript plasticity, which proved to be quite accurate for traits affected by GxE. Finally, they made use of SHAP values from predictive models of flowering time and biomass at each location, as well as for their plasticity, to gain insight into their genetic determinism. These SHAP values provide the importance of the predictive features (SNP and/or transcripts) for trait prediction. This allowed them to confirm some candidate genes and to propose new candidates for both traits.
Strengths:
I found this study interesting and rich. I think the sample size (426 genotypes) is large enough to support the findings. The use of a modern machine-learning approach (XGBoost) together with SHAP indices to find interesting features and get insights into the biological mechanisms underlying flowering time and biomass production is quite original. The methodology employed is globally sound. I also like the fact that the authors accounted implicitly for the population structure by providing a baseline prediction using the first 5 PCs.
Weaknesses:
While the methodology is globally sound, I sometimes had difficulties following exactly what was done. This is partly due to the fact that the authors used 2 omics (SNPs and transcripts) to predict phenotypes, and sometimes, in the results, it is not clear which of the 2 is the focus. This was especially the case for the importance of the features and the interpretability of the models, where I found it sometimes hard to tell whether the analysis was done on SNPs or transcripts.
Also, regarding the methodology, I did not understand why the authors needed to perform a feature selection approach. Maybe it was required to perform the interaction analysis, which could not be deployed on all the features? But regarding the importance of the features, I do not get the added value of the selection over the direct use of SHAP indices when using all features. Maybe this is because I am not a specialist in this kind of approach, but maybe the authors could add more details to explain the rationale behind the feature selection.
Reviewer #2 (Public review):
Summary:
The authors aimed to evaluate whether integrating genomic (SNP) and transcriptomic information with machine learning can improve phenotypic prediction of polygenic traits across environments. The manuscript explored not only the predictability across models and predictor feature sets, but also attempted to identify meaningful genes and interactions underlying trait variation.
Strengths:
The main strength of the manuscript is its integration of SNP, transcriptomic, and phenotype datasets for 426 sorghum genotypes between Texas and Michigan. It provides a systematic comparison of predictor types (SNP versus transcriptomic abundance) and model strategies to integrate them.
Weaknesses:
(1) Experimental Design
The experimental design raises several concerns that should be clarified before strong biological conclusions are drawn from the transcriptomic analyses.
First, the transcriptomic sampling is not well aligned with the developmental stages most relevant to the phenotypes being modeled. Leaf tissue was collected at a single time point in each environment, whereas traits such as flowering time, biomass, tiller count, and panicle height arise from developmental processes occurring over extended and potentially distinct temporal windows. Consequently, the measured expression profiles are likely to reflect physiological states specific to the sampling dates (May 5-6 in Texas and June 22-24 in Michigan) rather than the regulatory processes underlying the target phenotypes.
Second, the phrase "haphazardly randomized" is questionable for a field experiment. It is unclear whether the design included formal randomization, blocking, row/column structure, or spatial correction. Without explicit accounting for spatial field heterogeneity, environmental variation within sites may confound genotype and transcriptomic effects.
Third, the Methods do not clearly describe biological replication for RNA-seq. If each genotype-by-environment combination were represented by a single transcriptomic sample, then within-genotype expression variance cannot be estimated. This is important because transcript abundance is highly sensitive to microenvironment, sampling time, tissue status, developmental stage, and technical variation. The absence of replication significantly weakens confidence in gene-level feature importance and gene-gene interaction claims.
Four, the analysis of expression differences across environments is based on a simple subtraction (TX - MI) followed by correlation with genetic similarity. This approach is not standard in transcriptomic analysis and does not account for variability, replication, or statistical uncertainty. Conventional methods for assessing differential expression and genotype-by-environment interactions rely on model-based frameworks that explicitly estimate variance components and test for interaction effects. Without such modeling, the observed expression differences may reflect noise or confounding factors rather than genotype-driven responses.
(2) SHAP contribution values
Although SHAP is a well-established framework for decomposing model predictions into feature-level contributions, its use in this manuscript raises several concerns regarding interpretation, statistical validity, and biological inference.
First, SHAP values quantify the contribution of features within the fitted model, conditional on the joint distribution of inputs and the model structure. They do not represent causal effects or direct biological importance. There is a difference where SHAP values are often in log-odds and the regression model uses absolute units. Without a fair evaluation of model fit, the interpretation of SHAP values needs to take a cautious step because a model could fit poorly when a feature shows very high SHAP values.
In genomic data, where features are highly correlated due to linkage disequilibrium and co-expression, SHAP values can distribute contribution values across correlated variables in ways that are not uniquely identifiable. As a result, features highlighted as "important" may reflect correlation structure rather than true functional relevance.
This correlative structure can be exacerbated in this manuscript because of the use of TPM-normalized transcript abundances as predictor variables without biological replicates. Assume the estimates of transcript abundances are robust, TPM values are compositional, with a constant-sum constraint that creates dependencies among all genes that induce negative correlations. This issue is particularly relevant for the interpretation of gene importance and interaction effects, where correlated predictors can lead to unstable and non-unique attributions. This biological interpretation of transcript-based features remains uncertain.
(3) Result interpretation
For example, in page 11, "plasticity SNP- and transcriptomic-based models generally outperformed single-environment models for traits with low cross-environment correlation, such as green-up (Fig. 2c, r = -0.13, p < 8.3 × 10⁻³) and tiller count (Fig. 2f, r = -0.08, p = 0.1) (Supplementary Fig. S1).", is too broad. For green-up, the Diff model appears much better than MI, but not clearly better than TX.
And, same page 11, "...Diffexp was more predictive than SNPs for trait plasticity in biomass, flowering time, and tiller count..." only holds true for biomass, not flowering time, or tiller count.
The aspect of "complementary information" between SNP and transcriptomic models in page 12 is stronger than what is supported by Figure 2. Figure 2 shows different predictive performance, but it does not by itself demonstrate complementarity. Establishing complementarity requires evidence that combining SNP+T improves prediction consistently or captures distinct, non-overlapping signals. Yet the preceding section says SNP+T outperformed either single data type in only 15% of cases, with modest gains. This is confusing. Also, there was not G+T in Figure 2; it is SNP+T.
eLife Assessment
This manuscript provides important insights into how U2AF2-dependent intron retention regulates the localization and function of long noncoding RNAs, with convincing evidence supported by multiple complementary approaches. The work is notable for linking intron retention to nuclear speckle localization and cellular phenotypes, including proliferation and migration, although the mechanistic basis remains incompletely resolved. Overall, the study presents a compelling dataset with clear biological implications but would benefit from additional analyses to strengthen mechanistic interpretation and generality.
Reviewer #1 (Public review):
Intron retention is observed in many long noncoding RNAs. The authors here used a powerful genome-wide screening strategy to identify proteins controlling intron retention in the long noncoding RNA PURPL. One of the top hits across multiple cell lines surprisingly, was U2AF2, which is well known to bind the polypyrimidine tract close to the 3' splice site to promote splicing. Nonetheless, U2AF2 is working in the opposite direction here. Convincing follow-up RT-PCR experiments confirmed that knocking down U2AF2 does indeed lead to reduced intron retention of PURPL. The authors then show that this intron retention event is functionally important for both the nuclear retention of PURPL as well as its ability to enhance cell proliferation.
The authors then used transcriptome-wide analyses to look for additional intron retention events affected by U2AF2. Among the ~250 genes with decreased intron retention (more splicing) upon U2AF2 knockdown was MALAT1, a well-established long noncoding RNA that normally localizes to nuclear speckles. Depletion of U2AF2 or removal of the MALAT1 2nd intron resulted in reduced speckle localization and cell migration, revealing a critical and fascinating role for this intron retention event. Overall, the authors have used a set of complementary approaches to clearly demonstrate a very intriguing role for U2AF2 in controlling intron retention and functionality of a set of long noncoding RNAs.
I feel the current work has revealed an important role of intron retention in controlling the localization and functionality of long noncoding RNAs, which is likely broad in scope and is likely regulated by cell state.
One experimental suggestion: The authors show that expressing intron-2 containing PURPL in PURPL-depleted cells is sufficient to induce faster proliferation, but a valuable comparison would be identifying the phenotype expressing spliced PURPL transcript.
Reviewer #2 (Public review):
Summary:
This study identified U2AF1/2 as a regulator of pre-mRNA splicing that either promotes or supresses the splicing of introns on different genes. The authors then focused on two genes PURPL and MALAT1 that U2AF1/2 can promote intron retention of specific introns, and characterized the biological implications of these introns regulated by U2AF1/2.
Strengths:
(1) The experiments in this manuscript are relatively rigorously designed and performed, often with validation checks such as verifying the knockout, verifying the treatment itself doesn't have an effect, etc.
(2) The experiments provided comprehensive support for the claims that these specific introns are important for the stability or nuclear localization of the RNA, as well as that U2AF1/2 suppresses the splicing of these introns.
(3) The writing of the manuscript is very clear and doesn't overstate the conclusions that can be drawn from the experiments.
Weaknesses:
I think one main weakness of this study is the lack of a deeper analysis of the mechanisms. Whether studying the mechanism is within the scope of this paper is probably debatable, but with the current experiment setup and data, I believe there are some analyses that can be relatively easily done to enhance the value or significance of this study. My detailed questions and suggestions are listed below:
(1) Line 194-195 and Figure 2A: How many RBPs are included in "other RBPs" in line 194? Does "other RBPs" only include PTBP1, PRPF8 and SRSF1 in Figure 2A, or do they include all the ~100 RBPs with HepG2 eCLIP data available on ENCODE? If U2AF1/2 have the highest occupancy around the intron 2 region among the ~100 RBPs, it would be nice to visualize it.
(2) Figure 2A and 2B: Why didn't U2AF2 show interaction with exon 2 and 3 in RNA-IP but showed enrichment over exon 2 and exon 3 regions in the eCLIP data?
(3) Figure 3C - 3F: Maybe I misinterpreted the experiments, but to my understanding, these experiments showed that the exogenous PURPL with intron 2 promoted cell proliferation compared to when the exogenous PURPL wasn't induced, but didn't compare to the effect of the same amount of PURPL with intron 2 removed. Wouldn't it be clearer to compare the effects of exogenous PURPL with intron 2 and exogenous PURPL without intron 2 to pinpoint whether the effect is related to intron 2? Without an intron 2 specific experiment, these current experiments don't seem to provide much added value than "PURPL promotes cell proliferation".
(4) It's not very clear what proportion of these introns are retained in the endogenous PURPL and MALAT1 in various tissues, cell types and conditions. I think it will be valuable to provide this background (either from previous research, public database or data from this study).
(5) Since U2AF1/2 have a wide range of targets as demonstrated by Figure 4A, I think it would be valuable to have some experiments that directly disrupt the interaction between U2AF1/2 and PURPL and MALAT1 and test the effect on splicing outcomes, such as by mutating the sequence that U2AF1/2 bind to. The section on the weak py-tract of PURPL touched upon this topic but focused more on how the weak py-tract causes the intron 2 retention in the background rather than how U2AF1/2 binding and action were affected by sequence mutations. I think experiments on disrupting the direct binding between U2AF1/2 on targets can provide valuable mechanistic insights.
(6) Across all the target genes of U2AF1/2, it might be feasible to do some systematic analysis to find what correlates with whether U2AF1/2 have a promoting or suppressing effect on intron splicing. For example, do genes with decreased IR after U2AF2 depletion systematically have a weak py-tract compared to genes with increased IR? This dataset can potentially provide many hypotheses for understanding the dual role of U2AF1/2.
Reviewer #3 (Public review):
Summary:
This manuscript characterized the splicing regulation of two long non-coding RNAs relevant to cancer, starting with a focus on PURPL and ending with insights into MALAT1. A CRISPR screen for the regulators of PURPL intron retention revealed a role for the U2AF heterodimer in inducing this retention, with U2AF2 as the actual hit. This is surprising, because the canonical function of U2AF is to recognize the polypyrimidine tract (PPT) and 3' splice site junction to induce splicing at the site. The brief mechanistic characterization of this phenomenon showed that this intron retention accounts for the nuclear localization and instability of the PURPL transcript, and seems to confer the enhanced cell proliferation feature. U2AF2 also induces retention of two introns in MALAT1, and one of them is essential for its nuclear speckle localization and enhanced cell migration.
Strengths:
These findings about PURPL and MALAT1 are clear and interesting.
Weaknesses:
The results are not sufficiently connected to each other, because one regulation is nuclear-speckle dependent but not the other.
Here are my specific comments:
Major comments:
The main issue is the lack of focus because of the distinct and incomplete analysis pertaining to the two long noncoding RNAs, PURPL and MALAT1. The paper starts with a very good genetic screen on the former, and immunofluorescence and functional analysis on the latter, with U2AF2 as the main link to induce intron retention. The first one does not show clear localization while the second docks to nuclear speckles, apparently because of the retained intron. Hence the two mechanisms are related yet distinct. Here are some suggestions to enhance the characterization and connection between the two cases:
(1) As the MALAT1 intron 2 retention contributes to its speckle localization but not the retained PURPL intron, the retained introns or their 3' splice site sequences should be swapped to see if they determine the localization.
(2) Figure 3, the rescue of the PURPL knockout by the intron-retained RNA to induce proliferation is a powerful experiment, that is lacking the rescue with the RNA without the intron as a control. This must be done and shown.
(3) The weakness of the PPT of PURPL intron 2 appears as a clear feature of its retention dependent on U2AF2, which appears direct, as backed by CLIP data. It would be good to show direct binding by EMSA or equivalent techniques. Furthermore, the data is also consistent with other determinants. The exon and upstream intronic sequences, including the branch point, could also be involved, so mutations in these are also required.
(4) In brief, what are the commonalities and differences between PURPL and MALAT1 with regard to their U2AF2-dependent intron retention?
You stay on the tile and keep everything. The enemy stays too. Next turn: fight again or leave.
no qui direi che ritornoi allo shelter immediatamente ma il tuo turno finisce pero tieni tutto quello che hai
1 Combat, Step by Step Combat is short. The enemy shows its hand first, then you decide how hard to push.
qui vorrei un copy piu cosi: Combat is one die roll. Your talent, your equipment, your followers, your skills, and anyone at the table can change that roll before it's final. Any hero can step in anytime, during anyone's turn. You can use your Skills to change the course of a battle, or exhaust one to reroll any die on the board.
Cooperative and Simultaneous: Every fight belongs to the whole table.
Tile names. Green = Safe Haven, Red = Dread Vault. The yellow tile name (Wayward Hall) is provisional. Card decks keep their names: Wonder, Mishap, Misfortune.
togli questo
JUJU's Castle is a fully cooperative dungeon crawler for one to four players. Every tile you step on is revealed as you go, so the dungeon builds itself differently every time. Some rooms hand you allies and treasure. Others throw enemies at you. The red rooms guard legendary equipment behind something that will probably knock you out.
riscirverla cosi: JUJU's Castle is a fully cooperative dungeon crawler for 1-4 players. There is no set board: the dungeon builds itself as you step into the dark, revealing allies, traps, and brutal enemies guarding legendary gear.
It’s a game of asymmetric powers, shared battles, and defying luck. You will fight together, interrupt turns to save your friends, and hunt down powerful Relics. But tread carefully, finding them will wake the Hydra, and once it rises, there is no going back.
Four heroes walk into a castle that rearranges itself as they move. Somewhere inside, four Sacred Relics are waiting. Find all four and the Hydra wakes up: six heads, and you have to cut them all down at the same moment.
Da cambiare, non mi piace, vorrei qualcosa piu impactful, tipo: There is something sleeping deep inside JUJU's Castle. And the dungeon will do anything to stop you from getting there.
Note: This response was posted by the corresponding author to Review Commons. The content has not been altered except for formatting.
Learn more at Review Commons
Manuscript number: RC-2023-01861
Corresponding author(s): Manuela, Baccarini
We were happy to learn that all three reviewers found the paper novel and of interest for a cell biology audience. They especially highlighted the carefully conducted screen, whose results will be integrally published with this paper and will be of use for scientists interested in lysosome biology. The revised manuscript contains key validation experiments (antibody/KO controls, lysosome positioning quantification, live-cell actin dynamics) to strengthen our central conclusions.
This section is mandatory. Please insert a point-by-point reply describing the revisions that were already carried out and included in the transferred manuscript.
Reviewer 1
The colocalization of endogenous PLEKHG3 and LAMP1 as depicted in figures 3B and 3C (data from fixed cells) is not convincing. PLEKHG3 appears to be present on cortical actin structures as opposed to being colocalized with LAMP1 on lysosomes. And related to this point:
There is no apparent colocalization of PLEKHG3 and lysotracker in the movie S5.
Answer:
We do not claim that the two structures always colocalize, but that PLEKHG3 is a LAMTOR3 vicinal protein that co-enriches with a subset of peripheral lysosomes at focal adhesions (FAs)/protrusions. The images in Figure 3C are schematic for how PLEKHG3-high/low and LAMP1-high/low regions were defined for quantification. We agree with the Reviewer and with the previous literature that PLEKHG3 main localization is to cortical actin structures, as reaffirmed by the strong cortical actin localization shown in Figure 3F of the original version and in Figure S2C (HEK293T cells) and in Figure S3A in HeLa cells in the revised version. We have clarified the text referring to Figure 3F on page 26, line 11-14 as follows:
“Immunofluorescence experiments showed the reported colocalization of endogenous PLEKHG3 (Figure S2C in HEK293T cells, Figure S3A in HeLa cells) and GFP-PLEKHG3 with cortical actin structures and the partial localization of LAMP1-positive vesicles to these structures in correspondence with vinculin-positive focal adhesions.”
Live imaging in GFP-PLEKHG3-expressing cells (including movie S5, and particularly the stills of the leading edge in Figure 4F) further supports this spatial association without implying obligate colocalization. We added explicit language (p. 27, lines 19-21): “Following a single cell over time, we could observe that __a subset of __lysosomes appears to travel to PLEKHG3 accumulation sites and specifically move into developing protrusions.”
The authors should also confirm the specificity of the PLEKHG3 antibody in immunofluorescence using control and PLEKHG3 siRNA in untransfected cells that have not been transfected with GFP-PLEKHG3 (as is shown in Fig. S2C). Numerous antibodies recognize the overexpressed protein but do not recognize the same protein at endogenous expression levels.
Answer: To assess the specificity of the antibody for endogenous PLEKHG3 we have used HEK293T cells, which based on the fact that PLEKHG3 is most highly expressed in neuronal cells (https://www.proteinatlas.org/ENSG00000126822-PLEKHG3/tissue#expression_summary) should yield a clearer endogenous signal. The pattern of PLEKHG3-positive bands is similar to that observed in HeLa cells, and only the band around 250 kD is clearly reduced by the siPLEKHG3. The IF images show a selective loss of the PLEKHG3 signal in correspondence of actin filaments close to the plasma membrane, whereas the nuclear signal is preserved, and therefore to be considered non-specific (revised Figure S2B-C).
Extract from revised Figure S2B-C: ____PLEKHG3 KD test in HEK293T cells: B) Western blot of HEK293T cells showing downregulation of PLEKHG3 expression upon siPLEKHG3 treatment compared to siScr. Bar plot shows quantification of PLEKHG3 bands from immunoblot above. Error bars = SEM, n=3. * = p values according to student's t-test. C) Immunofluorescence images of HEK293T cells. siPLEKHG3 shows drop in PLEKHG3 intensity in the periphery of the cell and less colocalization with Phalloidin. Scale bar = 50 µm. Line plots show intensity profiles of Phalloidin (green) and PLEKHG3 (red) along the white lines in the merged inset images. Scale bar = 10 µm.
In addition, we have now generated a PLEKHG3 CRISPR-Cas KO in HeLa cells. The results, shown in revised Figure S2G-I, confirm the specificity of our reagents and the localization of PLEKHG3 seen in HEK293T cells.
Extract from revised Figure S2G-I: G) Immunoblot and quantification of HeLa PLEKHG3 KO cells represents the degree of PLEKHG3 depletion achieved using different guides compared to WT cells transfected with empty vector (EV). The most potent guides (8-9) are boxed in red. H) Immunofluorescence images of WT and PLEKHG3 KO8 cells reveal an overall drop in PLEKHG3 intensity and the specific loss of PLEKHG3 signal at the periphery of the cells. I) Quantification of PLEKHG3 intensity as displayed in H for two KO cell lines compared to WT cells. Dots represent individual data points of each of the three-color coded replicates; diamonds represent the mean of each replicate; black bars represent the mean ± the SEM of three biological replicates; * = p values according to 2-way-ANOVA. Error bars = SEM.
These results establish that the peripheral cortical signal is specific for endogenous PLEKHG3; the nuclear signal is non-specific. Loss of PLEKHG3, however, had no effect on lysosomal distribution, morphometric parameters (see revised Figure S4A-C) or protrusive activity (see revised Figure S6E-F) compared to WT cells.
Extract from revised Figure S4A-C: ____PLEKHG3 KO does not influence lysosomal distribution or cell morphometry: A) __Quantification of lysosomal distribution in WT compared to two KO cell lines. N ≥ 50 cells in three biological replicates. __B) Schematic representation of analysis of cell shape descriptors as referred to in C). Left picture shows the calculated outline in yellow based on which the cell area and circularity are calculated. Right picture shows the minor and major cell axis which, calculated as fraction, result in the aspect ratio of the cell. Scale bar = 50 µm. C) Quantification of cell morphometric parameters Area, Circularity and Aspect ratio. N ≥ 50 cells in three biological replicates. Black dots represent mean of each biological replicate. Statistical analysis according to student’s t-test. Error bars = SEM.
The claim that "peripheral accumulation of lysosomes inhibits protrusion formation and limits cell motility" should be tested more rigorously using the RAMP method, preferably in living cells. Other approaches, such as overexpression/siRNA of Arl8b and other motor adaptors, such as SKIP/PLEKHM2, can be used to alter lysosome positioning and confirm this central finding of the manuscript. The authors could also consider including additional mechanistic data in order to comprehend how lysosome positioning controls cell motility. For instance, the RAMP approach could be employed to investigate cortical actin dynamics upon repositioning of lysosomes to the peripheral/perinuclear region.
Answer: We have purchased the RAMP system from Addgene and adapted the reporters to express fluorophores compatible with our color setup in the different respective cell lines (HeLa GFP/GFP-PLEKHG3 as well as in HeLa PLEKHG3 KO cells. Unfortunately, we’ve experienced difficulties with imaging due to suboptimal efficiency of the double transfection necessary to introduce the RAMP system into the cell lines. The LAMP1 and the KIF plasmids were co-expressed at very different levels in the cells, leading to the need for high laser power in both channels, which too often resulted in cell death. Additionally, the redistribution of the lysosomes after biotin addition was incomplete and slower than initially expected, which made it impossible to investigate cortical actin dynamics.
To gain some mechanistic insight, we have performed further live cell imaging analyses comparing PLEKHG3 WT vs KO cells and GFP vs GFP-PLEKHG3 cells expressing a combination of BFP-LifeAct (to visualize F-actin) with either control mCherry or mCherry-KIF1A to move lysosomes to the periphery.
Extract from Figure S____1____A-C,E,G: PLEKHG3 localizes to F-actin independently of lysosomal transport but is dispensable for protrusive activity. A) __Stills from live cell imaging (Movies S12-15). Cells stably expressing GFP or GFP-PLEKHG3 were transfected with the indicated mCherry constructs. Yellow arrows = forming protrusions; blue arrows = retracting protrusions. Stills were generated over a period of 2 hrs. Scale bar = 50 µm. __B) __Quantification of protrusions formed and retracted over time in cells from A. Values indicate average number of protrusions formed in a timespan of three hours from a total of ≥ 15 cells per condition. Error bars = SEM. C) Quantification of colocalization by Fijis Coloc2 Plugin (see materials and methods) over a timespan of three hours. Lines represent mean of all cells per condition, and light-color shading represents the SEM. __E) Stills from live cell imaging (Movies S18-21). PLEKHG3 WT and PLEKHG3 KO cells were transfected with the indicated mCherry constructs and incubated with LysoTracker. Yellow arrows = forming protrusions; blue arrows = retracting protrusions. Stills were generated over a period of 2 hrs. Scale bar = 50 µm. G) Quantification of protrusions formed and retracted over time in cells from E. Values indicate average number of protrusions formed in a timespan of one hour from a total of ≥ 15 cells per condition. Error bars = SEM. In B,G, black asterisks denote p values according to Kruskal-Wallis and Bonferroni post-hoc testing, comparing the effect of KIF1A against mCherry or PLEKHG3 WT against KO.__ __
It is not clear how the authors conclude that Figure 4E graph shows "the LAMP1 signal was stronger in paxillin-labeled FA compared to control regions". The 4E graph shows LAMP1 signal in GFP versus GFP-PLEKHG3 and shows a modest enrichment of LAMP1 in FAs in GFP-PLEKHG3 overexpression. LAMP1 enrichment in FAs is also not obvious in the image shown in Figure 4B.
Answer: We stand corrected – the Figure we referred to was not in the manuscript. It has been inserted now, as a plot next to Figure. Figure 4B (schematic representation of colocalization analysis) was designed to explain how we define focal adhesions (paxillin positive) and adjacent control regions (same size and shape, but paxillin-negative). The actual analysis was missing and has now been inserted. We apologize for this mistake.
We do not claim that PLEKHG3 brings lysosomes to FAs. The enrichment of lysosomes in FA regions of cells expressing GFP-PLEKHG3 compared to GFP-expressing cells shown in 4E, as the Reviewer correctly notes, is marginal and is not highlighted anywhere in the text exactly for this reason.
In Fig. 2B, there appears to be a labeling error. The lanes 2,4 and 7 appear to be transfected with L3-T-V5 but labeled as GFP-V5-cyto. Here the PLEKHG3 band should be indicated.
AND -Fig. 2C is an IP experiment as per the manuscript text but it is labeled as pulldown.
Answer: We stand corrected, and the necessary changes have been made in the revised version in Figure 2B.
Reviewer 2
1 - Specificity of PLEKHG3 antibody: In Fig. S2, authors show that PLEKHG3 antibody recognizes 3 bands (above 100 kDa, above 130 kDa and 250 kDa) and all of them are reduced by the silencing of PLEKHG3. Then, in Fig. 2A and C, authors only show the band above 130 kDa, despite implying that the specific band should be "much higher than the 134 kDa calculated from the aminoacid sequence of the protein".
In Fig. 2 B, they show all the bands shown in Fig. S2 and presumably favor that the specific band is the 250 kDa one. Finally, in Fig. 2D, they show all bands and note that the band above 130 kDa is not specific. Therefore, authors need to conclude what is the specific band and always analyze the same one, and, possibly, use a different antibody or purify this one to remove non-specific binding. Without this, the main result of the paper, cannot be substantiated.
Answer: We apologize for this misunderstanding. The antibody recognizes three bands, all reduced by siRNA treatment. These three bands are only resolved in the gels in Figure S2A and B, and in Figure 2B. The reason for this is the high molecular weight of the isoforms, that are resolved in these 8% gels, but collapse into one band in the 15% gels shown in Figure 2A and C. Therefore, the high molecular weight bands are not resolved under these conditions. 8% gels such as the ones in Figure 2B are needed to resolve the high molecular weight bands.
Figure 2D shows an 8% gel, and therefore all bands are visible. The band marked by an arrow is only present in the streptavidin pulldowns but not in the input or in the supernatant and is therefore considered unspecific. This has been clarified in the revised figure legend on page 41. In addition, to assess the specificity of the antibody for endogenous PLEKHG3 we have used HEK293T cells, which based on the fact that PLEKHG3 is most highly expressed in neuronal cells (https://www.proteinatlas.org/ENSG00000126822-PLEKHG3/tissue#expression_summary) should yield a clearer endogenous signal. The results of this experiment are shown in Figure S2B-C of the revised manuscript. The pattern of PLEKHG3-positive bands is similar to that observed in HeLa cells, and only the band around 250 kD is clearly reduced by the siPLEKHG3. The IF images show a selective loss of the PLEKHG3 signal in correspondence of actin filaments close to the plasma membrane, whereas the nuclear signal is preserved, and therefore to be considered non-specific. More importantly, we have now generated a PLEKHG3 CRISPR-Cas KO in HeLa cells. The results, shown in Figure S2G-I confirm the specificity of our reagents and the localization of PLEKHG3 seen in HEK293T cells. Loss of PLEKHG3 however, had no effect on lysosomal distribution or morphometric parameters compared to WT cells (Figure S4A-C).
2 - In page 12, authors state that "These results indicated that PLEKHG3 is a transient interactor, or a proximal, not directly binding protein, of L3" and in page 14 that "... PLEKHG3 is a proximal L3 protein rather than a transient physical interactor". It is not clear at all how did the authors reach such conclusions, nor they have data to conclude this. Indeed, they would have to express the proteins in vitro and test their interaction to conclude about a direct binding. They also do not know what is the stability of the interaction.
Answer: This is also a misunderstanding. We mislabeled Figure 2C as “pulldown”, rather than “IP”, as it is characterized in the text. We revised terminology to “vicinal (proximity-labeled) protein” throughout, avoiding claims on directness. Our basis is: robust L3 TurboID labeling of PLEKHG3; failure to co-immunoprecipitate PLEKHG3 with V5-tagged L3 (Fig. 2C); lack of PLEKHG3 labeling by TMEM192; and unchanged PLEKHG3 FA localization in L3 KO (Fig. S3H–J). Together, these support spatial proximity rather than a stable L3–PLEKHG3 complex. We explicitly state that we did not perform in vitro binding due to the negative co-IP.
Based on these negative data, we did not proceed to test the possibility of complex formation in vitro.
3 - Still in page 12, authors state that "... two different membrane structures, protrusions and ruffles". What do the authors mean exactly by "protrusions", as there are several different ones (e.g., lamellipodia, filopodia, pseudopods)? And how can they distinguish between ruffles and, for example, lamellipodia? They need to use markers and more carefully analyze their morphology to be able to distinguish these. Like this, it is too preliminary.
Answer: It was our intention to indicate with the arrows the trajectories in the figure along which we measured the MFI of LAMP1 and PLEKHG3. Although this is indicated in the figure legend, it had apparently given the impression that the arrows indicated specific membrane structures. Since we are focusing on different types of membrane protrusions rather than ruffles, we replaced the ambiguous terms "ruffles" and "protrusions" with the terms "elongated protrusions" (Figure 3D upper panel) and then compared these with "non" elongated protrusions” (Figure 3D lower panel). Indeed, we note that PLEKHG3 accumulation is possible below and along the plasma membrane, but colocalization with lysosomes occurs preferentially in elongated protrusions. We therefore amended the text on page 26, line 4-9 as follows:
„More specifically, we found that PLEKHG3 colocalized more strongly with LAMP1-positive vesicles in elongated membrane structures (Figure 3D-E). Focal adhesion sites, which anchor the intracellular cortical actin network to the extracellular matrix and are remodeled with the help of late endosomes/lysosomes during protrusion formation and cell motility, can also be found in such elongated membrane protrusions (reviewed in [58,59]).”
5 - It is not clear if in cells KO for PLEKHG3, the overexpression of KIF1A leads to more lysosomes localizing close to the PM, as well as more protrusions and more cell motility, as the authors only compare cell overexpressing GFP or GFP-PLEKHGL3.
Answer: We have now generated a PLEKHG3 KO cell line. In these cells, KIF1A still drives peripheral lysosome clustering and suppresses protrusive activity and actin dynamic (see revised Figure S4A-C displayed below). Baseline lysosome distribution and morphometric parameters are unchanged in KO cells (see revised Figure S6E-F displayed below).
Extract from revised Figure S4A-C: ____PLEKHG3 KO does not influence lysosomal distribution or cell morphometry: A) __Quantification of lysosomal distribution in WT compared to two KO cell lines. N ≥ 50 cells in three biological replicates. __B) Schematic representation of analysis of cell shape descriptors as referred to in C). Left picture shows the calculated outline in yellow based on which the cell area and circularity are calculated. Right picture shows the minor and major cell axis which, calculated as fraction, result in the aspect ratio of the cell. Scale bar = 50 µm. C) Quantification of cell morphometric parameters Area, Circularity and Aspect ratio. N ≥ 50 cells in three biological replicates. Black dots represent mean of each biological replicate. Statistical analysis according to student’s t-test. Error bars = SEM.
Extract from revised Figure S6E,G: ____PLEKHG3 localizes to F-actin independent of lysosomal transport but is neglectable for lysosomal effect on protrusive activity. E) Stills from live cell imaging (Movies S18-21). PLEKHG3 WT and PLEKHG3 KO cells were transfected with the indicated mCherry constructs and incubated with LysoTracker. Yellow arrows = forming protrusions; blue arrows = retracting protrusions. Stills were generated over a period of 2 hrs. Scale bar = 50 µm. G) Quantification of protrusions formed and retracted over time in cells from E. Values indicate average number of protrusions formed in a timespan of one hour from a total of ≥ 15 cells per condition. Error bars = SEM. In F,G, black asterisks denote p values according to Kruskal-Wallis and Bonferroni post-hoc testing, comparing the effect of KIF1A against mCherry or PLEKHG3 WT against KO.
6 - Regarding the statistical analysis, authors assert that it was done using Student's t tests, unless otherwise stated. However, they never refer in figure legends other statistical analysis methods. If so, they cannot use such test, for example, in cases where more than two groups are compared.
Answer: We clarified in Methods that we performed two-group comparisons unless otherwise stated. Where >2 groups are compared, we used appropriate tests with correction (e.g., Kruskal–Wallis with Bonferroni in Fig. S6B, S6G). Figure legends now explicitly state the test used.
__Minor comments: __
1 - In the abstract, authors refer that cytosolic proteins are recruited to platforms on the limiting membrane of lysosomes. What do they mean by "platforms"? Is it microdomains?
Answer: We apologize for this lack of clarity and have now changed the first sentence in the abstract on page 1 to “Lysosomes are key organelles involved in metabolic signaling pathways through their ability to recruit cytosolic molecules to protein platforms bound to the lysosomal membrane”. We refer to protein platforms as multifunctional protein complexes that can recruit and assemble signaling components (e.g., the recruitment of mTORC1 activating proteins by the LAMTOR complex).
2 - In the Introduction, there is a period before the reference at the end of the first paragraph.
Answer: We stand corrected. See changes on page 18, line 9.
3 - In the results, Fig. 1E is mentioned before Fig. 1D and Figure S1F before Fig S1E, which can be confusing.
Answer: Figure S1E on page 6 was mislabeled as Figure 1E and Figure S1K on page 9 was mislabeled as Figure 1K. We stand corrected. See changes on page 21, line 21+23 and page 23, line 5.
4 - All the immunofluorescence images need to be bigger, in general, and have zoom-ins, except Fig. 3A, 4B, 4F, and S2C. Also, in Fig. S1F, the green channel has different intensities and the V5-lyso signal is clearly saturated. Finally, Fig. S1D, S1I and S3F must be enlarged, too.
Answer: We appreciate the Reviewer's suggestion, but enlarging all the immunofluorescence images and including zoom-ins would make the manuscript very crowded and could distract from the main findings. Regarding the expression levels of the baits, as mentioned in the manuscript, we aimed to express them at near-endogenous levels. However, TMEM192 is expressed at higher levels than LAMTOR3 in these cells, which may have resulted in the observed discrepancy. We hope the Reviewer will understand our decision and find the current presentation of the data clear and informative.
5 - In page 9, where it reads "Figure 1K", should read "Figure S1K".
Answer: See answer to minor point 3.
6 - The observation that PLEKHG3 silencing leads to loss of the perinuclear clustering of LAMP1-positive vesicles, and increase in their accumulation at the cell tips, is not referred in the text.
Answer: While this might seem the case in part of the cells shown in the representative image in Figure S2C, population-level analysis (n > 30 cells) did not support a shift in lysosome distribution with PLEKHG3 silencing.
__Figure 1 for Reviewer 2: __Lysosomal distribution in HeLa cells transfected with either siScr or siPLEKHG3. X-axis is relative distance from the nucleus and Y-axis the normalized intensity of the LAMP1 channel. Results are averages of >30 cells from one experiment (only displayed in “final revision” document).
Similar results were obtained using two independent PLEKHG3 KO cell lines, and are shown in Figure S4A
__Extract from revised Figure S4A-C: PLEKHG3 KO does not influence lysosomal distribution or cell morphometry: A) __Quantification of lysosomal distribution in WT compared to two KO cell lines. N ≥ 50 cells in three biological replicates.
7 - Fig. 2C is not referred in the legend.
Answer: We stand corrected and have changed the legend of Figure 2 accordingly on page 41.
8 - Figure S3A and B: authors should show the colocalization of endogenous PLEKHG3 with phalloidin and not only the GFP-tagged protein.
Answer: We thank the Reviewer for this comment and have performed this experiment showing the colocalization of endogenous PLEKHG3 with F-actin structures stained by Phalloidin. Even though the endogenous PLEKHG3 staining in HeLa cells is rather weak, sites where membrane protrusions are formed are clearly marked with PLEKHG3 staining below the plasma membrane. These data confirm the specific colocalization of PLEKHG3 with Phalloidin shown in the revised Figure S3A. See also the extract from Figure S3A below.
Extract from revised Figure S3A: Immunofluorescence images of HeLa cells. A) HeLa cells stained with PLEKHG3 (red) and Phalloidin (green). The nucleus is indicated by DAPI staining (blue). Scale bar = 50 µm. Insets on the right as indicated by white box in image on the left. Scale bar = 10 µm. Line plot corresponds to white line in merged inset.
9 - In page 14, authors refer to Fig. 3G, which does not exist.
Answer: We stand corrected, the sentence on page 14, line 9 (now page 26 line 24 in revised document) refers to Figure S3G.
10 - In page 30 and page 32, different antibodies for LAMP1 and PLEKHG3 are mentioned, but in the figure legends authors do not refer which one they used.
Answer: We tried different PLEKHG3 antibodies but ended up using only one. The other antibody has been excluded from the list on page 32, line 18 (now page 9, lines 4-5 in revised manuscript). We have specified which LAMP1 antibodies were used in which Figure in the Material and Methods on page 6, line 23 and page 7, line 4-5.
11 - In page 33, where it reads "300 µm protein", it should probably read "300 µg protein".
Answer: We stand corrected. See changes on page 10, line 2.
Reviewer 3
A key issue … is that the authors focus solely on peripheral lysosomes as target compartments for PLEKHG3. This is not self-evident, particularly in light of images presented in Figures 2 and 3, where colocalization of PLEKHG3 with perinulcear lysosomes appears very likely. The authors should make differences/similarities they observe between effects on perinuclear versus peripheral lysosomes explicit both with data and in the text, if such differences exist.
Answer: The Reviewer is likely addressing the images in Figure 3, which were obtained by staining endogenous PLEKHG3 and do diffuse staining around the nucleus. This perinuclear haze is resistant to siPLEHG3 (revised Figure S2C) or to PLEKHG3 CRISPR-Cas9-mediated ablation (revised Figure S2H) and is not observed with the GFP-PLEKHG3 fusion protein (revised Figure S2E-F), which gives a less diffuse signal. This is why we are confident about the colocalization of PLEKHG3 with peripheral lysosomes.
Data presented in Figure 6 showing cell motility analysis is interesting and has potential to make the manuscript impactful. Similarly, data in Figure 4F (live cell imaging) looks attractive but is not informative in the absence of relevant genetic perturbations as comparisons. These types of experiments would benefit greatly from PLEKHG3 loss of function analysis, as well as mutational analysis in the over-expression setting.
Answer: We have now generated a PLEKHG3 KO cell line. Loss of PLEKHG3, however, had no effect on lysosomal distribution or morphometric parameters compared to WT cells, and it does not impact the suppression of protrusions/actin dynamics by KIF1A is preserved in KO, indicating PLEKHG3 is not required for this phenotype.
Mutational analysis of PLEKHG3–LAMTOR binding is not feasible in the absence of co-IP or other direct binding evidence (see revised Figure S6E,G displayed in the answer above).
Minor point: 1. Multicolor overlays with one of the channels in white is in my view not reader-friendly. Appreciating colocalization between endosomes/lysosomes, actin and G is very important for this study, and while is typically reserved to show overlay between green and magenta or green (standard for 2 channels), red and blue (standard for 3-channels). I therefore advise the authors to choose a different color combination throughout the figures when presenting microscopy images.
Answer: White as a channel color has been substituted for with red (in the 2- and 3-color images) or with blue (in the 4-color images) throughout the images of the revised manuscript, except for the stills from the videos that have not been changed because no colocalization analysis has been performed in this case.
Please include a point-by-point response explaining why some of the requested data or additional analyses might not be necessary or cannot be provided within the scope of a revision. This can be due to time or resource limitations or in case of disagreement about the necessity of such additional data given the scope of the study. Please leave empty if not applicable.
Reviewer 2
4 - At least Fig. 2F and 3A need quantification. Regarding cell motility, there is no quantification and the authors must perform a quantitative assay (despite stating that "As another measure of cell motility, analysis of the number of forming protrusions and retracting membranes..."). Not only this is not a measure of cell motility, but there the issue of what are "protrusions" referred above. Therefore, authors need to quantify the distance that the cells move and/or perform quantitative motility/migration assays.
Answer: We appreciate the Reviewer’s attention to detail and agree that the quantification of these figures is essential to understand the results. We believe that the Reviewer refers to Figure 3F and Figure 4A, as there is no Figure 2F, and Figure 3A only confirms the localization of endogenous PLEKHG3, as previously reported in (Nguyen et al., PNAS 2016). If our assumption is correct, then the salient aspects of Figure 3F, which is a representative image, are quantified
To address the Reviewer's concern, we have clarified our definition of motility in the introduction by stating on page 19, line 23 – page 20, line 2: "We demonstrate that PLEKHG3 colocalizes with lysosomes at focal adhesion and protrusion sites, and that the localization and function of this protein – and consequently, overall cell motility – are fundamentally dependent on lysosomal dynamics." This revision ensures that our results are accurately described and minimizes any potential confusion. Additionally, we have removed the statement on page 23, line 1 of the original manuscript. We apologize for any confusion our original wording may have caused and appreciate the opportunity to clarify our intentions.
Reviewer 3
The mechanism of PLEKHG3 action on lysosomes/late endosomes is underdeveloped in my view. In the absence of for instance mutational analyses to examine what drives the interaction of PLEKHG3 with LAMTOR3, as well as delineation of at least some molecular consequences of this binding, the study remains incomplete.
Answer: We are grateful for the Reviewer's feedback and concur that gaining insight into the mechanistic details of PLEKHG3's interaction with LAMTOR3 would be beneficial. We now consistently refer to PLEKHG3 as a L3 vicinal protein based on TurboID and lack of co-IP. Because L3 KO does not alter PLEKHG3 FA localization and we find no evidence for a stable complex, mutational binding analyses lack a clear readout and are beyond the scope of this revision. We emphasize the conceptual advance—lysosome positioning gates PLEKHG3 cortical enrichment at FAs while peripheral lysosome clustering correlates with more adhesive, less protrusive behavior—and explicitly flag mechanistic questions (e.g., integrin turnover, IQGAP, Rac1 pools) as future work.
We hope that the Reviewer will bear with us on this point, considering the novelty of our findings, which illuminate the interplay between lysosomes and actin dynamics as well as the role of PLEKHG3 in regulating cell protrusions—findings not previously reported in the literature.
Note: This preprint has been reviewed by subject experts for Review Commons. Content has not been altered except for formatting.
Learn more at Review Commons
The manuscript by Ettelt et al describes the identification of PLEKHG3 as a collaborator of the LAMTOR complex on lysosomes using proximity-based biotinylation. The biotinylation screen is well executed and controlled. The authors choose to follow up on PLEKHG3, a protein involved in actin dynamics, which they refer to as understudied (I let the validity of the latter statement to be evaluated by the editor). Generally speaking, the data are of good quality, and the manuscript is clear and well written. However, much of the evidence on the role of PLEKHG3 on lysosomes is suggestive at best and further investigation into its mechanisms of action is warranted. Some important points to address prior to publication are detailed below.
Major Points:
Minor point
In principle, I consider this study to be of interest to the community of cell biologists working on the endolysosomal system and/or the actin cytoskeleton and its relationship to intracellular membranes. However, the authors find themselves in a rather crowded field. I feel that developing the mechanism of action of PLEKHG3 on lysosomes beyond this first submission could help with boosting the impact of the study. There is clearly something interesting going on, but what that is exactly, remains unclear in my view.
Note: This preprint has been reviewed by subject experts for Review Commons. Content has not been altered except for formatting.
Learn more at Review Commons
Summary: The authors use proximity-dependent labelling and mass spectrometry to identify cytoplasmic proteins that interact with lysosomes. They show that PLEKHG3 interacts with the LAMTOR complex; that PLEKH3 accumulates in focal adhesion sites, where it colocalizes with peripheral lysosomes; and that the increased translocation of lysosomes to the periphery leads to less "protrusions", as well as rounder cells and less motile cells.
Major comments: While the study is generally carefully performed and thorough, there are major shortcomings that affect the conclusions taken, namely the specificity of the PLEKHG3 antibody, the identification of "protrusions" and ruffles, several quantifications missing, and the data used to conclude about cell motility. There are also conclusions for which there is no concrete or solid evidence.
Specific issues:
Minor comments:
The study provides evidence that lysosome positioning can affect cortical actin cytoskeleton dynamics, as well as cell shape and motility. Experiments are in general thorough and data subjected to quantification. However, there are fundamental conclusions that are preliminary at this stage, as some of the data is not yet solid enough. Therefore, it needs to be further strengthened to be considered for publication. In general, it reads well but the amount of abbreviations (e.g. in the case of the constructs) makes it somehow difficult to follow. The study will be interesting for the cell biology, membrane trafficking and cytoskeleton dynamics communities.
Note: This preprint has been reviewed by subject experts for Review Commons. Content has not been altered except for formatting.
Learn more at Review Commons
The manuscript by Ettelt et al., describes identification of Rho guanine nucleotide exchange factor- PLEKHG3 as one of the positive hits from a TurboID proximity-dependent labeling screen using LAMTOR3 (one of the subunits of the pentameric LAMTOR complex/Ragulator) as a bait protein. The authors find that PLEKHG3 colocalizes with lysosomes at focal adhesions and that peripheral clustering of lysosomes promotes PLEKHG3 localization near the plasma membrane, and also inhibits protrusion formation and cell motility. The experiments, particularly the Turbo ID proximity-dependent labeling screen, are well-executed, and the imaging data is aptly quantified. The manuscript explores an exciting question of how lysosome positioning regulates cortical actin dynamics and thereby cell motility.
Major comments:
Moreover, do the authors observe colocalization between GFP-PLEKHG3 and lysotracker in living cells? There is no apparent colocalization of PLEKHG3 and lysotracker in the movie S5. - The authors observe that GFP-PLEKHG3 is concentrated at the cell's periphery when KIF1A is overexpressed, whereas RUFY3 overexpression results in more cytosolic staining. To bolster their conclusion that a change in lysosomal positioning alters the subcellular localization of PLEKHG3, it is preferable to employ inducible techniques, such as the recently described "reversible association with motor proteins" (RAMP) (PMID: 31100061). The method is a rapid and reversible method for altering organelle positioning. It is still unknown whether PLEKHG3 is associated with lysosomes and mechanism of how positioning of lysosomes affects PLEKHG3 localization. - Similarly to the preceding point, the claim that "peripheral accumulation of lysosomes inhibits protrusion formation and limits cell motility" should be tested more rigorously using the RAMP method, preferably in living cells. Other approaches, such as overexpression/siRNA of Arl8b and other motor adaptors, such as SKIP/PLEKHM2, can be used to alter lysosome positioning and confirm this central findings of the manuscript. The authors could also consider including additional mechanistic data in order to comprehend how lysosome positioning controls cell motility. For instance, the RAMP approach could be employed to investigate cortical actin dynamics upon repositioning of lysosomes to the peripheral/perinuclear region. - It is not clear how the authors conclude that Figure 4E graph shows "the LAMP1 signal was stronger in paxillin-labeled FA compared to control regions". The 4E graph shows LAMP1 signal in GFP versus GFP-PLEKHG3 and shows a modest enrichment of LAMP1 in FAs in GFP-PLEKHG3 overexpression. LAMP1 enrichment in FAs is also not obvious in the image shown in Figure 4B. - In Fig. 2B, there appears to be a labeling error. The lanes 2,4 and 7 appear to be transfected with L3-T-V5 but labeled as GFP-V5-cyto. Here the PLEKHG3 band should be indicated. - Fig. 2C is an IP experiment as per the manuscript text but it is labeled as pulldown.
Using a TurboID proximity-dependent labelling screen, the authors identified an interesting subset of actin-remodeling proteins that interact with the lysosomal protein LAMTOR3. The authors further characterized one of these proteins, PLEKGH3, and found that lysosome positioning regulates PLEKGH3 localization, as well as plasma membrane protrusion formation and cell motility. This study suggests that lysosome peripheral accumulation could regulate cortical actin remodelling and consequently cell migration by regulating PLEKGH3 localization (although this is not tested in the manuscript). This study adds to the previous findings that microtubule-based transport of late endosomes regulate delivery of late endosomal LAMTOR proteins to the vicinity of focal adhesions, which in turn, regulate focal adhesion dynamics. The mechanism of how lysosomes can influence actin remodeling will be important in the context of cancer cell migration. My area of expertise is lysosome fusion and motility and I have limited expertise in regulation of actin dynamics and how Rho family members regulate actin remodeling.
eLife Assessment
This Review Article provides an overview of circadian findings obtained using the zebrafish model and will be of particular interest to researchers working with zebrafish in chronobiology and behavioural neuroscience. The article would benefit from a broader conceptual framework that more clearly positions zebrafish within the wider landscape of animal models used in circadian biology, including comparisons with other extensively studied systems. In addition, several citation inaccuracies and interpretational issues identified during peer review should be carefully addressed to strengthen the accuracy and impact of the review.
Ezmerelda’s Magic Wagon
**PC INFO: ** as you approach the tower via the causeway you see a person on their hands and knees between the wheels of the wagon parked at the base of the tower.
DM INFO: this is Ezmerelda - do Ezmerelda’s Retreat below in special events.
Partnership ensures higher education institutions transitioning to remote teaching can preserve the integrity of their tests and exams
Online proctoring software has been widely criticized as harmful to students.
RRID:SCR_002798
DOI: 10.6084/m9.figshare.32149279
Resource: GraphPad Prism (RRID:SCR_002798)
Curator: @dhovakimyan1
SciCrunch record: RRID:SCR_002798
RRID:SCR_001622
DOI: 10.6084/m9.figshare.32149279
Resource: MATLAB (RRID:SCR_001622)
Curator: @dhovakimyan1
SciCrunch record: RRID:SCR_001622
RRID:SCR_014210
DOI: 10.6084/m9.figshare.32149279
Resource: Image Lab Software (RRID:SCR_014210)
Curator: @dhovakimyan1
SciCrunch record: RRID:SCR_014210
RRID:SCR_008426
DOI: 10.6084/m9.figshare.32149279
Resource: Bio-Rad Laboratories (RRID:SCR_008426)
Curator: @dhovakimyan1
SciCrunch record: RRID:SCR_008426
RRID:SCR_003070
DOI: 10.6084/m9.figshare.32149279
Resource: ImageJ (RRID:SCR_003070)
Curator: @dhovakimyan1
SciCrunch record: RRID:SCR_003070
RRID:SCR_003070
DOI: 10.6084/m9.figshare.32149279
Resource: ImageJ (RRID:SCR_003070)
Curator: @dhovakimyan1
SciCrunch record: RRID:SCR_003070
RRID:AB_3711604
DOI: 10.1210/jc.2017-01658
Resource: RRID:AB_3711604
Curator: @scibot
SciCrunch record: RRID:AB_3711604
RRID:AB_3716444
DOI: 10.1210/jc.2017-01658
Resource: RRID:AB_3716444
Curator: @scibot
SciCrunch record: RRID:AB_3716444
RRID:AB_3711607
DOI: 10.1210/jc.2017-01658
Resource: RRID:AB_3711607
Curator: @scibot
SciCrunch record: RRID:AB_3711607
RRID:AB_3711608
DOI: 10.1210/jc.2017-01658
Resource: RRID:AB_3711608
Curator: @scibot
SciCrunch record: RRID:AB_3711608
RRID:AB_3711609
DOI: 10.1210/jc.2017-01658
Resource: RRID:AB_3711609
Curator: @scibot
SciCrunch record: RRID:AB_3711609
RRID:AB_3711605
DOI: 10.1210/jc.2017-01658
Resource: RRID:AB_3711605
Curator: @scibot
SciCrunch record: RRID:AB_3711605
RRID:AB_3711606
DOI: 10.1210/jc.2017-01658
Resource: RRID:AB_3711606
Curator: @scibot
SciCrunch record: RRID:AB_3711606
AB_119602
DOI: 10.1210/jc.2017-01658
Resource: RRID:AB_3711609
Curator: @dhovakimyan1
SciCrunch record: RRID:AB_3711609
10 errors, each worth 2 marks.
If you are changing the A1 to 10%, inside the A1, 10 errors each carry 2 marks to be changed to1 mark.
call tracking industry
Discover how Callyzer delivers real-time business call intelligence with advanced call tracking, agent monitoring, and actionable insights to improve sales performance and customer communication.
Know More: https://www.openpr.com/news/4510379/callyzer-brings-clarity-to-the-call-tracking-industry-with
Ted Chiang. Will A.I. Become the New McKinsey? The New Yorker, May 2023. URL: https://www.newyorker.com/science/annals-of-artificial-intelligence/will-ai-become-the-new-mckinsey (visited on 2023-12-10).
This article takls about how AI should be compared less to a magical genie and more to like a consulting firm, a way to help companies cut costs and increase profit. He mentions that the downsides of AI is that it could make inequality worse if it's replacing workers or justifying decisions because the algorithm said so. Overall, tying this back to the overall chapters, it shows how tech is shaped by so many different factors like automation, platform design, the owner's accountability and desires, and many more I could mention. The main issue isn't what AI can just do, but who controls it and what harm it could bring.
How have your views on social media changed (or been reinforced)?
I'd say that my views on social media have been reinforced because this class showed me that social media problems aren't caused by individual users but also because of the way platforms are designed. Features like recommendation algorithms, likes, shares, and doomscrolling can shape what people see and how they behave online. I used to think of social media mostly just as a tool for communication, but it's more that I see it as a system influenced by business goals and seeking engagement. If I could change something, it would be to make platforms prioritize it's users and intentional use, user control, and well being over keeping peoples presence online for the longest amount of time possible.
A pipeline is a list of stages that run in order. Inside a stage, the jobs run at the same time. A later stage waits for the earlier one to finish.
test
Right sales words and phrases can turn a hesitant prospect into a loyal customer, while the wrong words? Well, they can send your deal straight into the abyss of “Let me think about it.”
data layer
The problem arises because of layering
Be a slayer of Layers
The NoSQL comeback nobody saw coming
I did.
Better still
with the right notation and methodology 1 can keep articulating ideas till they they become fully articulated, elaborated, formulated to become eventually locally complete, consistent and intentionally transparent
into working afforDances Play
On December 12, 1980, American oil tycoon Armand Hammer pays $5,126,000 at auction for a notebook containing writings by the legendary artist Leonardo da Vinci.The manuscript, written around 1508, was one of some 30 similar books da Vinci produced during his lifetime on a variety of subjects. It contained 72 loose pages featuring some 300 notes and detailed drawings, all relating to the common theme of water and how it moved.
This was very interesting to know since it occurred on my birthday 28 years ago!
Without passion, you may find yourself struggling, withdrawing from courses, earning poor grades, or dropping out.
I do not agree with this statement. I used to work overnights, so I would have time during the day for my college courses. I had dropped out or received poor grades for putting too much on my plate, was exhausted and was burnt out from work.
KPMG—one of the world's largest professional services firms for audit, tax, legal, and advisory services across 138 countries and territories
这个数据点表明KPMG的全球业务覆盖范围极广,138个国家和地区的业务覆盖显示了其作为国际专业服务巨头的规模。这个数字可信度较高,因为大型专业服务公司通常会公布其国际业务覆盖范围。与四大其他三家相比,这个覆盖范围处于同一量级,反映了全球专业服务市场的格局。
RSI is the new AGI — and it's just as hard to pin down
文章标题使用了'new'这个词,暗示RSI是一个新兴概念,但缺乏历史背景来支持这一说法。这可能导致读者对RSI的发展历程产生误解。文章应该提供RSI概念的历史发展信息,而不是简单地将其标记为'新'概念。
A new crop of AI labs are focused on recursive self-improvement — but the goal is proving elusive.
文章暗示递归自我改进的目标难以实现,但没有解释为什么它比其他AI目标更难实现。这是一个隐藏的前提假设,需要更多背景信息来支持。文章应该明确说明RSI面临的特定挑战,而不是笼统地说它'难以捉摸'。
RSI is the new AGI — and it's just as hard to pin down
文章标题暗示RSI与AGI具有相同的困难程度,但这是一个未经证比的断言。文章需要提供证据来证明RSI与AGI具有同等的技术挑战,而不是简单地假设它们难度相当。这种类比可能导致读者对两个领域的理解产生误导。
A new crop of AI labs are focused on recursive self-improvement — but the goal is proving elusive.
文章暗示AI实验室专注于递归自我改进,但缺乏具体证据支持这一说法。这是一个未经证实的概括,可能忽略了其他研究方向。文章应该提供具体例子和数据来支持这一论点,而不是做出笼统的断言。
RSI is the new AGI — and it's just as hard to pin down
文章标题做出了一个未经证实的断言,将递归自我改进(RSI)与通用人工智能(AGI)等同起来。这种等同缺乏证据支持,混淆了两个不同的概念。RSI是一种技术路径,而AGI是一个更广泛的目标。文章需要提供更多证据来支持这一等同主张,或者更准确地区分这两个概念。
Currently, the US only fully manufactures about 10 percent of the chips it requires
美国仅能自主生产约10%所需的芯片,这表明美国在半导体制造方面高度依赖进口。这一数据凸显了美国在AI芯片制造上的脆弱性,也解释了为什么特朗普政府试图通过关税政策将芯片制造业回流美国。然而,10%的自给率远低于特朗普政府期望的目标,显示了美国在半导体制造方面的巨大挑战。
A locally installed tool is auditable. You can read the code, pin the version, and know it won't change under you. A remote tool—a hosted MCP server, a cloud connector—can change behavior at any point after you've approved it;
大多数人认为远程工具比本地安装的工具更安全,因为它们由专业团队维护。但作者指出远程工具实际上可能更危险,因为它们可以在用户批准后随时改变行为,而本地工具则更加可控。这一观点挑战了云原生和远程服务的默认安全假设。
The same isolation keeping Claude contained also kept host-based endpoint detection and response out. From the EDR's perspective, Claude Cowork is an opaque hypervisor process.
大多数人认为更强的隔离总是意味着更好的安全性,但作者指出过度的隔离会阻止安全监控工具(如EDR)发挥作用,创造出'安全盲点'。这一发现挑战了安全领域中'隔离越多越好'的普遍假设,强调了安全与可见性之间的平衡。
Battle-tested hypervisors, syscall filters, and container runtimes have survived more adversarial attention than anything you'll build. Across every deployment described here, the standard primitives held while our own work around them exposed flaws.
大多数人认为定制化的安全组件会比成熟的开源工具更安全,但作者的经验表明,经过实战检验的标准组件(如hypervisors和容器运行时)实际上比自定义组件更可靠。这一观点挑战了安全工程中常见的'重新发明轮子'倾向,强调了使用成熟解决方案而非自定义实现的重要性。
The more approvals a user sees, the less attention they pay to each, becoming over time much less diligent in their supervision.
大多数人认为更多的用户监督会提高安全性,但作者发现相反的情况:频繁的审批请求会导致用户注意力下降和'审批疲劳',实际上降低了安全性。这一发现挑战了传统安全理念,即认为更多的用户参与总是能增强系统安全性。
The government sought to evaluate models up to 90 days prior to release, while AI labs pushed for a much shorter timeline of only 14 days.
大多数人认为科技公司会支持更严格的监管以确保安全,但作者认为AI公司实际上推动的是更短的测试时间,这挑战了科技公司总是寻求更多监管保护的主流观点。
Trump delays AI safety testing EO, claiming it would be an innovation 'blocker.' 'I really thought [the order] could have been a blocker.'
大多数人认为政府AI安全测试会促进创新和保障安全,但作者认为特朗普认为安全测试会阻碍创新,这挑战了监管通常被认为能促进负责任创新的共识。
According to Lee, parallel to the AI race is 'a separate, potentially more important race' to figure out how 'who can govern powerful AI without choking off innovation.' China may be slightly edging ahead of the US in that race.
大多数人认为美国在AI领域领先中国,但作者认为中国在AI治理方面可能领先美国,这是一个反直觉的观点,挑战了主流认知中美国在AI技术和监管方面都领先的看法。
Adoption differences extend beyond discipline and career stage. We classify researcher names according to gender and find that those with typically male names have adopted coding agents at more than twice the rate of respondents with typically female names.
性别差异数据显示男性研究人员采用编码代理的比率是女性的两倍以上,这是一个显著的不平等现象。值得注意的是,这种差异不仅存在于总体样本中,即使在尝试过AI的研究者中仍然存在,表明这可能不仅仅是技术接触机会的差异,还可能与工作文化、职业发展压力等因素有关。
Claude Code is the most common coding agent tool reported, with 86% of users reporting Claude Code use (31% report using Codex, the next most common tool).
Claude Code在编码代理工具中占据主导地位(86%的使用率),远超其他工具如Codex(31%)。这表明Anthropic的产品在学术研究领域具有显著的市场优势。然而,需要注意的是,这个数据是在特定时间段(2026年初)收集的,市场格局可能随时间变化。
On a 1 to 10 scale, 88% of respondents were above a 5, and half were at 8 or above. Figure 6 shows that these ratings vary strongly with AI use. The left side of the plot shows researchers that use AI for more types of tasks are more optimistic.
88%的研究者对AI提高论文写作生产力持乐观态度(评分>5),其中50%评分达到8或以上。这种乐观程度与AI使用强度呈正相关,表明实际使用体验可能影响研究者对AI工具的预期。然而,70%的研究者对AI对整个社会科学领域的积极影响持更谨慎态度,反映了研究者对AI工具影响的复杂看法。
The vast majority of respondents (81%) have tried using AI chatbots in research, particularly for writing code and editing prose. But only 20% have adopted coding agents—tools like Claude Code that autonomously write and execute analysis code—into their work.
81%使用AI聊天机器人的比例远高于20%采用编码代理的比例,这表明虽然大多数社会科学家已经尝试过AI工具,但只有少数人真正采用了更先进的自主编码工具。这个差距反映了AI工具采用过程中的明显分层,可能与技术接受度、工作流程整合难度有关。
The time from business to production workflow drops from months to days.
这是一个关于AI代理加速部署时间的定性描述,虽然缺乏具体数字,但反映了从'月'到'日'的数量级变化。这一声明暗示了AI代理可以显著缩短业务需求到实际部署的时间周期,提高组织敏捷性。然而,此处缺乏量化依据,不同复杂度的实施时间可能会有很大差异。
McKinsey predicts that by 2030, three-quarters of current jobs will require redesign, upskilling, or redeployment
McKinsey预测到2030年,四分之三的现有工作需要重新设计、技能提升或重新部署。这是一个相当惊人的比例,表明AI代理将对就业市场产生深远影响。这一预测强调了组织需要提前规划人力资源战略,包括培训和转型计划,以应对即将到来的劳动力结构变化。
Although 85% of organizations say they want to be agentic within the next three years, 76% say their current operations and infrastructure can't support that change.
这是一个显著的组织目标与实际能力之间的差距数据。85%的组织表示希望在未来三年内实现代理AI转型,但76%的组织承认现有基础设施不支持这一转变。这表明企业对AI代理技术的期望远超其实际准备程度,可能导致项目失败和投资浪费。此数据来自Celonis调研,可信度较高。
The time is now to make changes in the way we train, prepare, and support young people who are about to enter the workforce
文章没有提供具体的时间框架或量化指标来支持'现在必须改变'的紧迫性声明。这一论点基于前述数据,但缺乏具体的转型时间表或预期效果数据。需要更多具体数据来评估改革的时间紧迫性和预期效果。
the unemployment rate for recent college graduates rose to 5.6%, while the underemployment rate (the share of graduates working in jobs that typically do not require a college degree) reached 42.5%, its highest level since the covid pandemic
5.6%的毕业生失业率与42.5%的未充分就业率形成鲜明对比,后者是前者的7.5倍多。这一巨大差异表明,虽然失业率相对可控,但大量毕业生被迫从事低于其教育水平的工作,这可能对长期职业发展产生负面影响。
the unemployment rate for recent college graduates rose to 5.6%, while the underemployment rate (the share of graduates working in jobs that typically do not require a college degree) reached 42.5%
纽约联储数据显示,2025年第四季度大学毕业生失业率达5.6%,未充分就业率高达42.5%,为疫情以来最高水平。这一数据表明毕业生就业市场正在恶化,42.5%的未充分就业率尤其值得关注,意味着近半数毕业生从事不需要大学学位的工作。
workers aged 22 to 25 in the most AI-exposed occupations experienced a 16% relative decline in employment after the spread of generative AI
这是一个显著的数据点,表明AI对年轻就业者产生了实质性影响。16%的相对下降幅度相当可观,特别是在控制了其他影响因素后。这一数据来自斯坦福数字经济实验室的工作论文,具有一定的学术可信度,但需要注意这是相对下降而非绝对下降。
the unemployment rate for recent college graduates rose to 5.6%, while the underemployment rate (the share of graduates working in jobs that typically do not require a college degree) reached 42.5%
5.6%的失业率和42.5%的低就业率是衡量应届毕业生就业状况的重要指标。这一数据来自纽约联邦储备银行,具有较高的可信度。42.5%的低就业率是自疫情以来的最高水平,表明高等教育文凭的价值正在受到挑战。这些数据与AI对初级工作的影响可能相关,但文章也指出不能确定AI是唯一原因。
workers aged 22 to 25 in the most AI-exposed occupations experienced a 16% relative decline in employment after the spread of generative AI
这个16%的就业下降率是文章中最关键的数据点,表明AI对年轻就业者有显著影响。这个数据来自斯坦福数字经济实验室的工作论文,具有一定可信度。然而,这是相对下降率,不是绝对数量,且仅限于AI高度暴露的职业。这一数据与整体就业稳定的趋势形成鲜明对比,说明AI的影响存在结构性差异。
Autism Works - Neurodiversity in the Workplace Dave's Garage Dave's Garage 1.13M subscribers
😭🫶
Dark factory versus light factory: Parts of your work where humans and agents talk to each other (planning, design, review) stay visible can be thought of as light, and parts where agents grind through clearly defined work on their own stay in the background, in the dark.
这个比喻简洁而深刻地揭示了人机协作的两种模式。'暗工厂'与'亮工厂'的区分帮助开发者理解何时需要人类监督,何时可以让AI自主工作。随着对AI输出信任度的提升,可以将更多流程移至'暗处',这种框架为AI与人类的协作提供了清晰的指导原则。
Parts of your work where humans and agents talk to each other (planning, design, review) stay visible can be thought of as light, and parts where agents grind through clearly defined work on their own stay in the background, in the dark.
这个比喻生动地描述了人机协作的两种模式:'明工厂'和'暗工厂'。它揭示了随着对AI代理信任度的提升,我们可以将更多工作流程转移到暗处,让AI自主处理明确任务,而人类专注于需要创造性和判断力的环节。这种区分帮助我们更好地设计人机协作的工作流。
What happens when every company has access to the same model? The best riders win.
这句话揭示了AI时代的核心竞争动态。当技术门槛降低,真正的竞争将转向如何有效利用这些技术的能力。这一洞见简洁而深刻,点明了AI时代竞争的本质不是拥有技术,而是如何应用和优化技术的能力。
The best riders win.
这句话简洁有力地总结了AI时代的竞争本质。当所有公司都能访问相同的AI模型时,真正的竞争优势来自于如何有效地'驾驭'这些AI系统。这一洞见简洁而深刻,点明了AI时代竞争的核心不是技术本身,而是如何应用和优化技术的能力。
Like a mustang, AI is powerful but wild. Harnessing the power means domestication.
这个比喻生动形象地将AI比作野马,强调了AI的原始力量和不可预测性。'驯服'一词暗示了AI技术需要被引导和控制的本质,这一比喻既形象又深刻,让人一眼就能理解AI技术的本质和挑战。
The end of the software era is the beginning of the harness era.
这句话简洁有力地概括了AI技术带来的范式转变,从传统软件到AI控制系统的过渡。'Harness'(驾驭)一词精准捕捉了AI需要被引导和控制的本质,暗示AI虽然强大但需要被'驯服'才能发挥最大价值。这一洞见简洁而深刻,能独立存在并引发思考。
SDKs deserve as much care as the APIs they wrap.
行动建议:在开发API时,不要只关注后端实现,同时要重视SDK的质量和开发者体验。投入资源为你的API创建高质量的、多语言的SDK和CLI工具,这将直接影响开发者对你的API的采用率和满意度。
Agents are only as capable as the systems they can reach.
行动建议:如果你正在构建AI代理系统,优先考虑其连接能力和工具集成性。评估你的代理能够访问哪些系统和API,并确保它有足够的连接器来执行任务。这种以连接能力为中心的设计思路将显著提升你的代理的实用价值。
This dynamic UI management is the future of software value : the harness to control the interface/ensure it's correct & the knowledge management to rationalize all the AI products over time
大多数人关注AI的功能和结果,但作者认为未来软件价值在于动态UI管理和知识管理,这种将界面控制和管理而非功能实现视为核心价值的观点与主流认知相悖。
Software systems need to decide which of these to keep over time & which are disposable ; those newer semi-permanent artifacts will become the new heads
大多数人认为软件界面应该是稳定和持久的。但作者提出界面应该是可丢弃的,半永久性的界面元素会随时间演变,这种将界面视为临时而非固定组件的观点与传统的软件设计理念相悖。
The user interface, the head isn't disappearing, it's become plastic, malleable to the interface a user needs when they need it.
大多数人认为AI和自动化将导致传统用户界面被淘汰或简化。但作者认为界面正在'塑料化'—变得更加灵活和可塑,能够根据用户即时需求变化,挑战了界面简化或消失的主流观点。
Vibe drafts the deliverable using the Canvas tool, from a one-page brief to a report, an RFP response, or a board deck
文章提到Vibe可以创建从一页简报到董事会演示文稿的各种文档,但没有提供具体的生成速度、质量评估或用户满意度数据。这类AI内容生成工具的效果通常需要量化指标来评估,如生成文档的准确率、用户采纳率或节省的时间。缺乏这些数据使得难以判断Vibe在文档生成方面的实际价值主张。
Mistral Vibe extension for VS Code; the coding agent working across your whole project, inside your IDE.
文章提到VS Code扩展,但没有提供具体的安装量、用户渗透率或性能数据。对于开发者工具而言,这类数据对于评估产品在目标市场的渗透率至关重要。与GitHub Copilot等竞争对手相比,我们无法判断Vibe Code的市场接受度。此类技术产品声明需要后续的使用统计数据来验证其实际采用率。
A public institution that cannot verify the sources in its own AI policy is unlikely to be ready to verify the AI systems it procures, deploys, or regulates.
这句话犀利地指出了南非AI政策中的一个系统性问题:连自身政策都无法验证,如何监管外部AI系统?这一洞见不仅批评了当前政策的缺陷,更暗示了建立AI治理能力需要从内部做起,强调了验证机制在AI治理中的重要性。
The country whose mines supply platinum-group metals essential to semiconductor manufacturing, and through them to AI compute, has drafted a policy that treats it as a consumer of AI systems rather than a stakeholder in their governance.
这句话揭示了南非政策制定中的一个根本性矛盾:作为关键矿产供应国,南非本应在AI治理中拥有话语权,却将自己定位为AI系统的消费者而非治理参与者。这一洞见尖锐地指出了南非在AI政策中的战略短视,以及资源优势未能转化为政策影响力的遗憾。
In physics, leverage requires three things: a fulcrum, a lever arm, and the ability to apply force.
作者巧妙地借用物理学中的杠杆原理来比喻南非的AI政策制定过程,这种比喻生动形象且易于理解。将矿产比作'fulcrum'(支点),政策比作'lever arm'(杠杆臂),而未明确规定的'OPTION'条款则是施加力量的地方,这种类比使复杂的政策问题变得直观且引人深思。
South Africa is not just another developing country struggling to govern artificial intelligence; it is the exception with leverage, and the window to act on it is closing.
这句话精准地定义了南非在AI政策制定中的独特地位,强调了其拥有特殊优势但正在错失机会。作者用'exception with leverage'这一简洁有力的表述,点明了南非作为非洲大陆AI治理的关键角色,而'window to act on it is closing'则传达了紧迫感,使读者立即认识到问题的严重性。
Traditional compliance was designed around human actors. We now need a modern AI approach for verifying identity, assessing intent, and establishing liability when the counterparty is an autonomous agent
大多数人认为合规原则和框架具有普遍适用性,但作者认为针对人类设计的合规系统无法应对AI代理带来的新挑战。这一观点挑战了合规工作的基础假设,暗示需要根本性重构合规方法以适应自主代理。
If we assume that agents will soon become the predominant purchasers on the web, this opens an entirely new category of risk
大多数人认为合规风险主要来自人类行为者和传统交易模式,但作者认为自主AI代理将成为网络上的主要购买者,创造全新的合规风险类别。这一前瞻性观点挑战了现有合规框架的基础假设,暗示需要全新的合规方法。
Over the last 20 years the fastest-growing occupation in the US was manicurists and pedicurists. But following close behind? Compliance Officers.
大多数人认为合规是企业的负担和成本中心,但作者认为合规已成为美国增长最快的职业之一,暗示合规已成为经济中不可或缺的重要组成部分。这一观点挑战了人们对合规工作价值的传统认知,表明合规不仅必要而且正在扩张。
Over the last 20 years the fastest-growing occupation in the US was manicurists and pedicurists. But following close behind? Compliance Officers.
这个数据点显示合规官员是美国近20年来增长最快的职业之一,仅次于美甲师。这一趋势反映了监管环境日益复杂化,企业需要更多合规人员来应对不断增加的法规要求。这一数据可信度较高,因为它是基于美国劳工统计局的官方数据,表明合规已成为一个庞大的就业领域。
To disarm means discrediting the assumption that technical power automatically confers the right to govern.
这句话以简洁有力的方式挑战了技术精英的权威基础,提出了一个颠覆性的观点:技术能力不应等同于治理权利。它不仅是一个结论,更是一个行动呼吁,体现了作者对技术民主化的深刻思考。这句话能独立存在并被广泛引用,因为它触及了技术治理的根本问题。
In fact, as with every major technological shift, AI tends to amplify the power of those who already possess economic resources, expertise and access to data.
这句话揭示了技术变革中的不平等加剧现象,用一个简洁的观察点明了AI时代的核心矛盾。它不仅是对现状的描述,更是对技术发展历史模式的洞察。这句话能独立存在并被广泛引用,因为它触及了技术与社会不平等关系的本质。
When such power is concentrated in the hands of a few, it tends to become opaque and evade public oversight, increasing the risk of distorted forms of development that give rise to new dependencies, exclusions, manipulations and inequalities.
这句话用精准的语言描述了权力集中的后果,形成了一个完整的因果链条:集中→不透明→缺乏监督→扭曲发展→新形式的不平等。它不仅是一个观察,更是一个警示,体现了作者对权力动态的深刻理解。这句话能独立存在并引发读者对权力结构的反思。
technology built and governed by a small elite cannot, by definition, serve the common good.
这句话简洁有力地指出了技术治理的根本问题——精英控制与公共利益之间的矛盾。它表达了一个精准的洞见:技术本身的中立性无法掩盖权力集中带来的系统性问题。这句话能独立存在并被广泛引用,因为它触及了技术民主化的核心议题。
GenAI (Gemini and Claude) was used to streamline the research process, pull in insights, and polish the language for maximum clarity and readability.
文章在最后提到使用AI工具辅助研究和写作,但未披露AI参与的具体程度和方式。这可能导致读者对文章内容的原创性和可靠性产生疑问。更透明的做法应详细说明AI在哪些具体环节参与、如何验证AI生成内容的准确性,以及人类作者如何审查和修改AI输出。
By embedding our technical security rules directly into the agent workflow, we transformed those early near-misses into a secure, production-ready platform
文章声称通过嵌入安全规则解决了安全问题,但没有提供足够的证据证明这种方法的实际效果或安全性。这是一种未经充分验证的因果关系断言。改进方法应包括具体的测试结果、安全审计数据或第三方验证,以支持这一论断的有效性。
Business functions like our marketing team, who are building with AI, are not exempt from the security obligations that apply to engineers building applications.
文章假设所有业务部门都应承担与工程团队相同的安全义务,但未考虑不同团队的技术能力和资源差异。这可能是一个过度概括的论断。更平衡的方法应承认不同团队有不同的技术能力和安全需求,并提供适合各团队安全实践的具体指导,而非一刀切的安全要求。
The AI recommended making the storage bucket public, or setting cloud file storage to "anyone with the link." When challenged, it justified this by saying every company does it.
这里存在一个逻辑谬误,即诉诸普遍性谬误(apppeal to popularity)。AI声称'每家公司都这么做'并不能证明这是安全的做法。这混淆了普遍做法与安全实践之间的区别。改进方法应该是提供具体的、基于证据的安全标准,而不是依赖行业普遍行为作为安全依据。
annual employment growth for coders has slowed significantly—by about 3%—since the introduction of ChatGPT
程序员就业增长率自ChatGPT推出以来下降了约3%,这是一个值得注意的下降。然而,文章同时指出'程序员就业总数仍在增长',只是增速放缓。这表明AI正在改变特定职业的性质,而非完全消除这些职业。3%的增速下降反映了AI对编程领域的影响,但影响程度相对温和。
16% decline in entry-level jobs in AI-exposed occupations
这个数据点显示AI相关职业的入门级工作岗位下降了16%,这是一个显著的下降幅度。特别是考虑到这是在控制其他因素后的结果,表明AI确实对年轻工人的就业产生了负面影响。这一数据与文章中提到的'22至25岁年轻人在AI暴露职业中就业人数下降'的观点一致,也反映了AI对特定职业的早期影响。
a little over 40% of workers but adoption varies by sectors
数据显示约40%的工人使用生成式AI,但不同行业采用率差异显著。这个数据点表明AI在工作场所的采用情况比企业层面更广泛,但仍未达到主流水平。40%的采用率是一个中等水平,说明AI已经开始影响工作方式,但尚未完全普及,这与文章中提到的'AI尚未对劳动力市场产生颠覆性影响'的观点相符。
US Census data showing that only one in five companies are using AI in any business function.
这个数据点表明AI在企业中的采用率相对较低,仅为20%。这意味着尽管媒体对AI的炒作很多,但实际商业应用仍处于早期阶段。这一数据与文章中提到的'AI尚未对劳动力市场产生大规模影响'的观点一致,也解释了为什么劳动力市场统计数据尚未显示AI带来的显著变化。
Verified skills extend this AI governance to agent capabilities. Runtime controls help govern agent behavior during execution. Verified skills govern capabilities that enter the workflow and become a common way to extend trust agents across coding tools, registries, and enterprise platforms.
行动建议:将验证技能作为AI代理治理的核心组成部分,不仅在运行时控制代理行为,还要管理进入工作流的能力。这种方法可以扩展到编码工具、注册表和企业平台,建立跨平台的信任机制。
Certificate retrieval, supported verification tooling, and example verification commands see the signing documentation. For example, you can verify a signed skill locally. To do so, follow these steps: Download the NVIDIA Agentic Capabilities root certificate as nv-agent-root-cert.pem Install an OpenSSF Model Signing (OMS) verifier, such as pip install model-signing Execute the following command to verify the skill signature
行动建议:按照文中提供的步骤下载NVIDIA代理能力根证书,安装OpenSSF模型签名验证器,并使用提供的命令验证技能签名。这种实践可以确保您下载的技能是真实的且未被篡改,增强对AI代理能力的信任。
To get started with the cuOpt verified skill, for example, follow these steps: 1. Pull the cuOpt verified skill from the catalog: git clone github.com/nvidia/skills && cd skills/skills/cuopt 2. Verify the signature: model_signing verify certificate. --signature skill.oms.sig --certificate-chain nv-agent-root-cert.pem --ignore-unsigned-files 3. Open SKILLCARD.yaml to see ownership, dependencies, license, and verification status.
行动建议:按照文中提供的具体步骤,克隆并验证NVIDIA的cuOpt技能,查看技能卡片以了解所有权、依赖关系、许可证和验证状态。这种实践可以确保您使用的技能是经过验证的,并且可以安全地集成到您的AI代理工作流中。
Over the past six months, OpenAI forward deployed engineers and researchers along with Thrive Holdings' engineers collaborated to build Tax AI
六个月的开发周期表明这是一个长期、复杂的项目。'forward deployed engineers'表明OpenAI团队采用了嵌入式工作方式,这有助于更好地理解实际业务需求。这种跨公司合作模式可能成为AI专业领域应用的标准开发方式。
The best agent businesses are going to need to execute like hedge funds — winning on alpha measured in customer P&L, not in benchmark scores.
这句话用对冲基金作为比喻,生动地描述了优秀AI应用公司的成功标准。作者指出,这些公司需要在客户的实际业务成果(P&L)上获得超额收益(alpha),而不是在通用基准测试上获得高分。这个洞见强调了AI应用公司应该以客户的实际业务价值为中心,而不是技术指标。
The model is fungible underneath; the system of work is not.
这句话简洁而深刻地指出了AI应用层的本质区别。作者认为,底层的AI模型是可以互换的,但工作的系统(system of work)却是独特的。这个洞见揭示了为什么专注于构建特定工作系统的公司能够长期保持竞争优势,而仅仅依赖通用模型的公司则难以建立持久的业务。
The workflow you ship on day one is not the moat. The loop that production usage creates over time is.
这句话深刻地揭示了AI应用公司的真正护城河所在。作者指出,初始的工作流程不是竞争壁垒,而是在生产环境中持续使用、学习和改进所形成的循环才是真正的护城河。这个洞见强调了实践经验、数据积累和持续迭代的重要性,对于理解AI应用公司的长期价值至关重要。
You can be everywhere at once, or you can be great at one thing. Not both.
这句话简洁有力地表达了大型实验室与专注应用公司之间的核心区别和战略选择。它揭示了为什么大型AI实验室无法深入解决特定垂直领域的复杂问题,为什么专注的垂直应用公司有机会在这些领域建立竞争优势。这个结论句为创业者提供了清晰的战略指导。
The labs really are coming for a huge swath of the application surface. But 'the application layer' isn't just one homogenous opportunity.
这句话精准地捕捉了AI应用层的复杂性和多样性。作者指出大型AI实验室确实会覆盖大量应用领域,但这并不意味着所有应用机会都是同质的。这个洞见反驳了'AI将杀死所有应用层'的简单化观点,为创业者指明了在特定垂直领域寻找机会的方向。
The Yellow Brick Road is our shorthand for the path the labs are walking, where they're committing extraordinary resources.
这句话用《绿野仙踪》中的黄砖路作为比喻,形象地描述了大型AI实验室正在走的道路。这个比喻生动地表达了这些实验室拥有巨大资源,正在构建一条明显可见的发展路径。这个洞见帮助读者理解AI应用生态中的不同发展方向,以及为什么有些领域竞争激烈而有些领域则存在机会。
the model alone is no longer the product
大多数人认为基础模型本身就是AI产品,但作者认为单一模型不再构成完整产品。这一反直觉观点强调,真正的AI产品需要模型+工具+工作流+UI+记忆+经济学的组合,挑战了AI行业长期以来的'模型中心主义'思维模式。
Model Labs are increasingly also building Agents as the product
大多数人认为模型实验室应该专注于提升基础模型的能力,但作者认为这些实验室现在正转变为代理实验室。这一观点挑战了AI行业的基础假设,即模型本身是产品,而不是模型只是更大代理系统的一部分。这标志着AI行业从'模型即产品'向'代理即产品'的根本性转变。
if you can effectively posttrain a model to only meaningfully perform with your closed source agent, then you get to funnel the majority of users to your agent at the expense of your model/API co-opetition
大多数人认为开源模型会促进竞争和开放生态,但作者认为模型与代理的协同可能导致更封闭的生态系统。这一反直觉观点指出,企业可能通过训练模型使其仅在特定代理环境中有效工作,从而将用户锁定在自己的代理产品中,这与开源社区期望的开放性背道而驰。
The quote is a big reversal of stance from a position ~uniformly held by anyone who worked at **Team Big Model**, including his previous head of OpenAI Labs
大多数人认为大型模型实验室会继续专注于基础模型研发,但作者认为这是一个立场的重大转变,因为连OpenAI前高管都开始转向代理产品。这挑战了AI行业长期以来的'模型优先'共识,表明即使是Big Model团队也开始认可代理产品的价值。
discussing
In-class exercises can include demonstrating how AI-generated citations can look authentic to instruct students on both the pitfalls of relying too heavily on AI and reinforcing what should be included in a source citation.
Honestly, another application could be to generate sources and citations--teacher verified--to use in curriculum when teaching these research skills. This can be a huge timesaver for teachers.
nswer the following questions to help create a subnetting scheme that meets the stated network requirements.
is the font below too small to read?
ARP spoofing attack:
Unlike other figures, when this pops up, the background is bit dark?
Very beautiful work!
As far as I'm aware there aren't any structures of DksA bound to an RNAP elongation complex. Have you thought about how this interaction would impact your model of ppGpp-binding and RNAP swiveling? Would DksA prevent swiveling given its binding location, or the structural states be in competition? Would be curious to see impact of DksA in vitro as well as what your in vivo results would look like in a ∆dksA background
hyperactivity in the circuit
Direct = facilitates movement through inhibiting thalamus