int d could be int days
When naming things, focus on giving meaningful names, that you can pronounce and are searchable. Also, avoid prefixes
int d could be int days
When naming things, focus on giving meaningful names, that you can pronounce and are searchable. Also, avoid prefixes
naming things, write better functions and a little about comments. Next, I intend to talk about formatting, objects and data structures, how to handle with errors, about boundaries (how to deal with another's one code), unit testing and how to organize your class better. I know that it'll be missing an important topic about code smells
Ideas to consider while developing clean code:
Should be verbs, and not nouns, because methods represent actions that objects must do
Methods names = verbs
decrease the switch/if/else is to use polymorphism
It's better to avoid excessive switch/if/else statements

In the ideal world, they should be 1 or 2 levels of indentation
Functions in the ideal world shouldn't be long
Cross-platform development is now a standard because of wide variety of architectures like mobile devices, cloud servers, embedded IoT systems. It was almost exclusively PCs 20 years ago.
A package management ecosystem is essential for programming languages now. People simply don’t want to go through the hassle of finding, downloading and installing libraries anymore. 20 years ago we used to visit web sites, downloaded zip files, copied them to correct locations, added them to the paths in the build configuration and prayed that they worked.
How library management changed in 20 years
IDEs and the programming languages are getting more and more distant from each other. 20 years ago an IDE was specifically developed for a single language, like Eclipse for Java, Visual Basic, Delphi for Pascal etc. Now, we have text editors like VS Code that can support any programming language with IDE like features.
How IDEs "unified" in comparison to the last 20 years
Your project has no business value today unless it includes blockchain and AI, although a centralized and rule-based version would be much faster and more efficient.
Comparing current project needs to those 20 years ago
Being a software development team now involves all team members performing a mysterious ritual of standing up together for 15 minutes in the morning and drawing occult symbols with post-its.
In comparison to 20 years ago ;)
Language tooling is richer today. A programming language was usually a compiler and perhaps a debugger. Today, they usually come with the linter, source code formatter, template creators, self-update ability and a list of arguments that you can use in a debate against the competing language.
How coding became much more supported in comparison to the last 20 years
There is StackOverflow which simply didn’t exist back then. Asking a programming question involved talking to your colleagues.
20 years ago StackOverflow wouldn't give you a hand
Since we have much faster CPUs now, numerical calculations are done in Python which is much slower than Fortran. So numerical calculations basically take the same amount of time as they did 20 years ago.
Python vs Fortran ;)
operational transforms (a.k.a. OTs), the standard multiplayer algorithm popularized by apps like Google Docs. As a startup we value the ability to ship features quickly, and OTs were unnecessarily complex for our problem space
Operational Transforms (OT) are unnecessarily complex for problems unlike Google Docs
Every Figma document is a tree of objects, similar to the HTML DOM. There is a single root object that represents the entire document. Underneath the root object are page objects, and underneath each page object is a hierarchy of objects representing the contents of the page. This tree is is presented in the layers panel on the left-hand side of the Figma editor.
Structure of Figma documents
When a document is opened, the client starts by downloading a copy of the file. From that point on, updates to that document in both directions are synced over the WebSocket connection. Figma lets you go offline for an arbitrary amount of time and continue editing. When you come back online, the client downloads a fresh copy of the document, reapplies any offline edits on top of this latest state, and then continues syncing updates over a new WebSocket connection
Offline editing isn't a problem, unlike the online one
An important consequence of this is that changes are atomic at the property value boundary. The eventually consistent value for a given property is always a value sent by one of the clients. This is why simultaneous editing of the same text value doesn’t work in Figma. If the text value is B and someone changes it to AB at the same time as someone else changes it to BC, the end result will be either AB or BC but never ABC
Consequence of approaches like last-writer-wins
We use a client/server architecture where Figma clients are web pages that talk with a cluster of servers over WebSockets. Our servers currently spin up a separate process for each multiplayer document which everyone editing that document connects to
Way Figma approaches client/server architecture
CRDTs are designed for decentralized systems where there is no single central authority to decide what the final state should be. There is some unavoidable performance and memory overhead with doing this. Since Figma is centralized (our server is the central authority), we can simplify our system by removing this extra overhead and benefit from a faster and leaner implementation
CRDTs are designed for decentralized systems
Another approach is to use a tool like H2O to export the model as a POJO in a JAR Java library, which you can then add as a dependency in your application. The benefit of this approach is that you can train the models in a language familiar to Data Scientists, such as Python or R, and export the model as a compiled binary that runs in a different target environment (JVM), which can be faster at inference time
H2O - export models trained in Python/R as a POJO in JAR
Continuous Delivery for Machine Learning (CD4ML) is a software engineering approach in which a cross-functional team produces machine learning applications based on code, data, and models in small and safe increments that can be reproduced and reliably released at any time, in short adaptation cycles.
Continuous Delivery for Machine Learning (CD4ML) (long definition)
Basic principles:
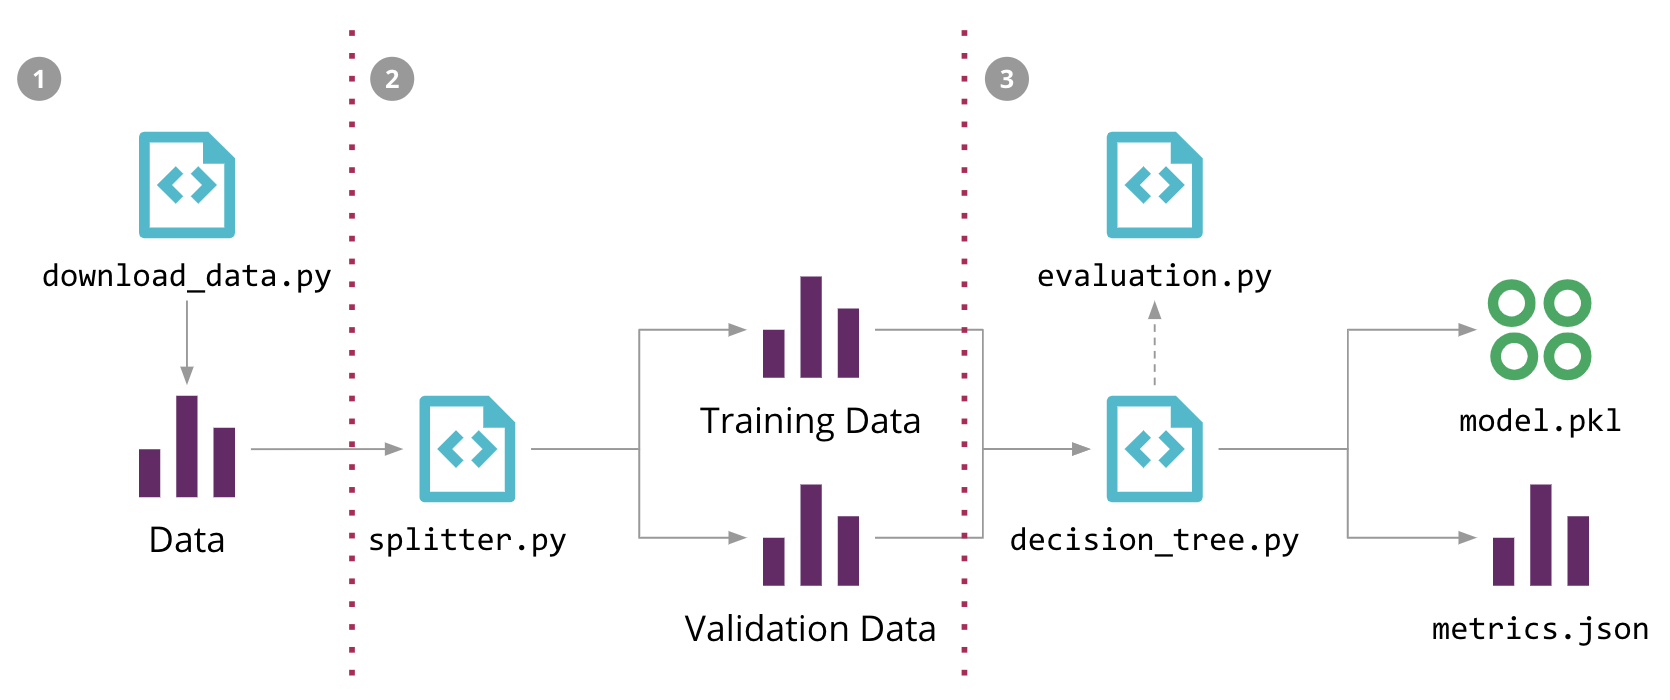
In order to formalise the model training process in code, we used an open source tool called DVC (Data Science Version Control). It provides similar semantics to Git, but also solves a few ML-specific problems:
DVC - transform model training process into code.
Advantages:
Machine Learning pipeline for our Sales Forecasting problem, and the 3 steps to automate it with DVC
Sales Forecasting process
Continuous Delivery for Machine Learning end-to-end process
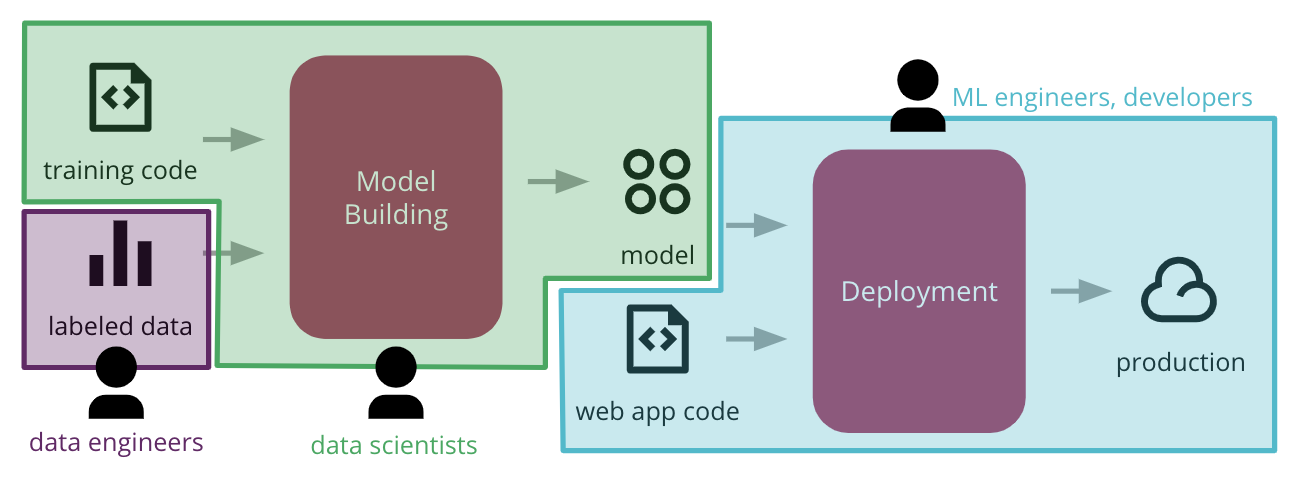
common functional silos in large organizations can create barriers, stifling the ability to automate the end-to-end process of deploying ML applications to production
Common ML process (leading to delays and frictions)
There are different types of testing that can be introduced in the ML workflow.
Automated tests for ML system:
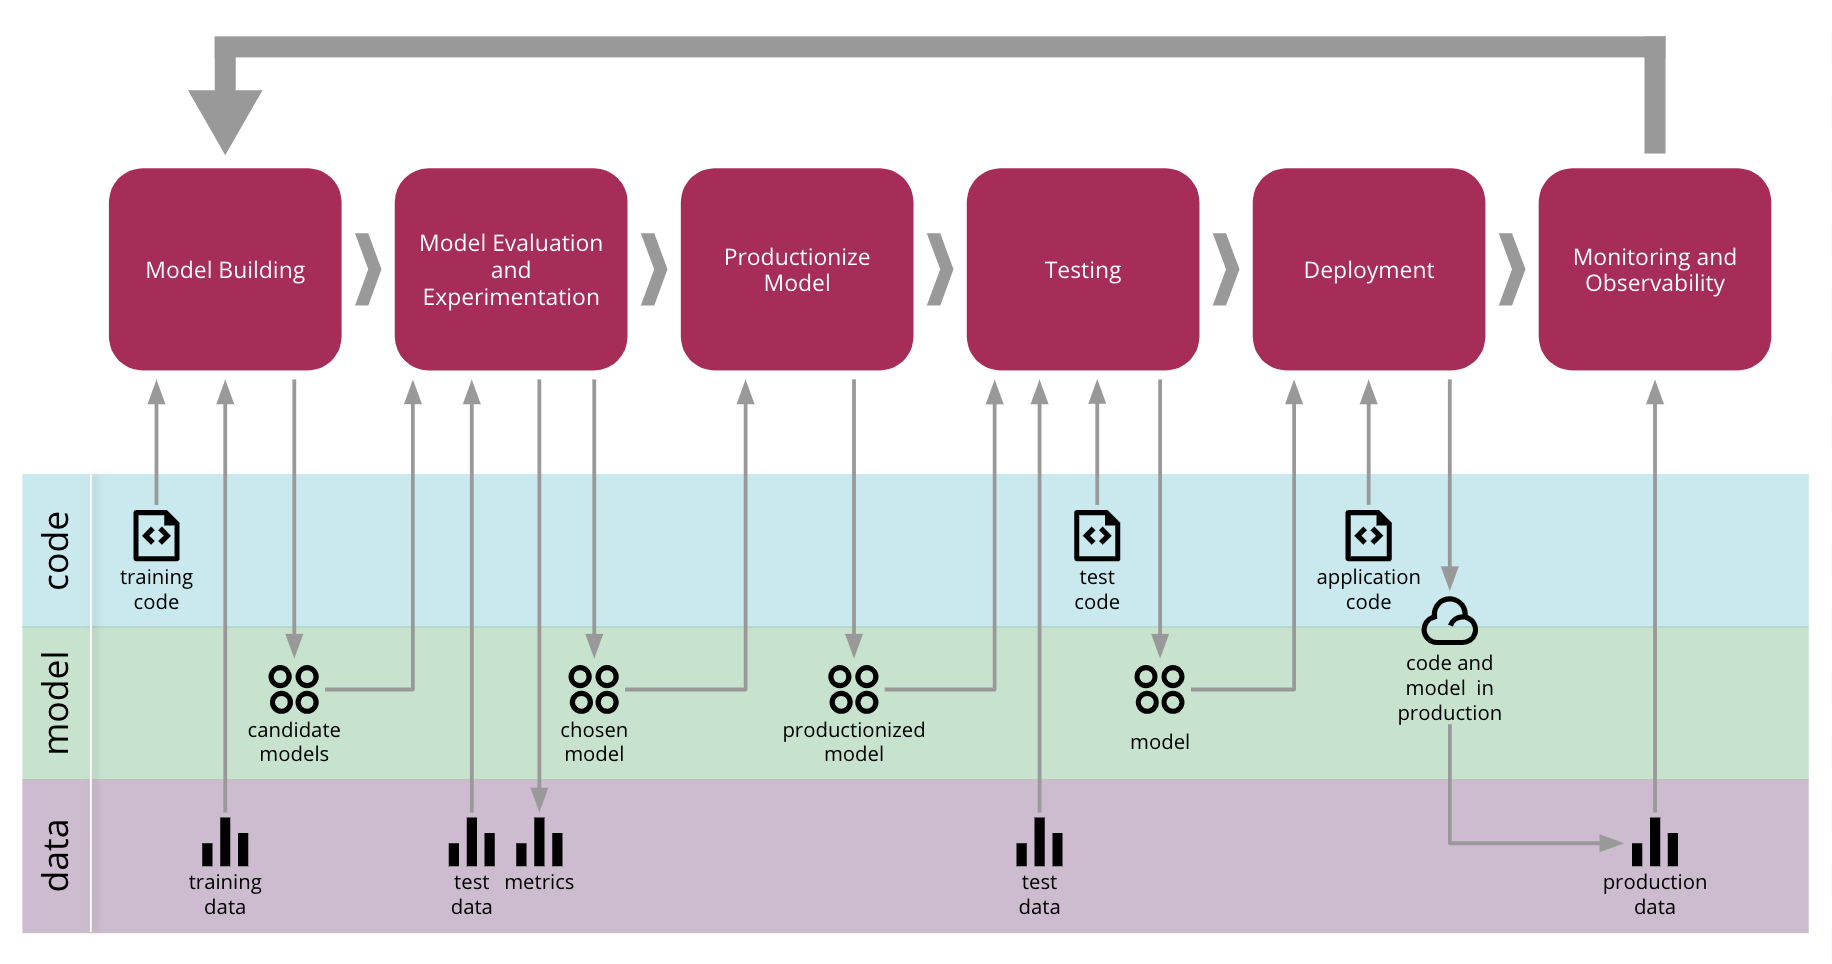
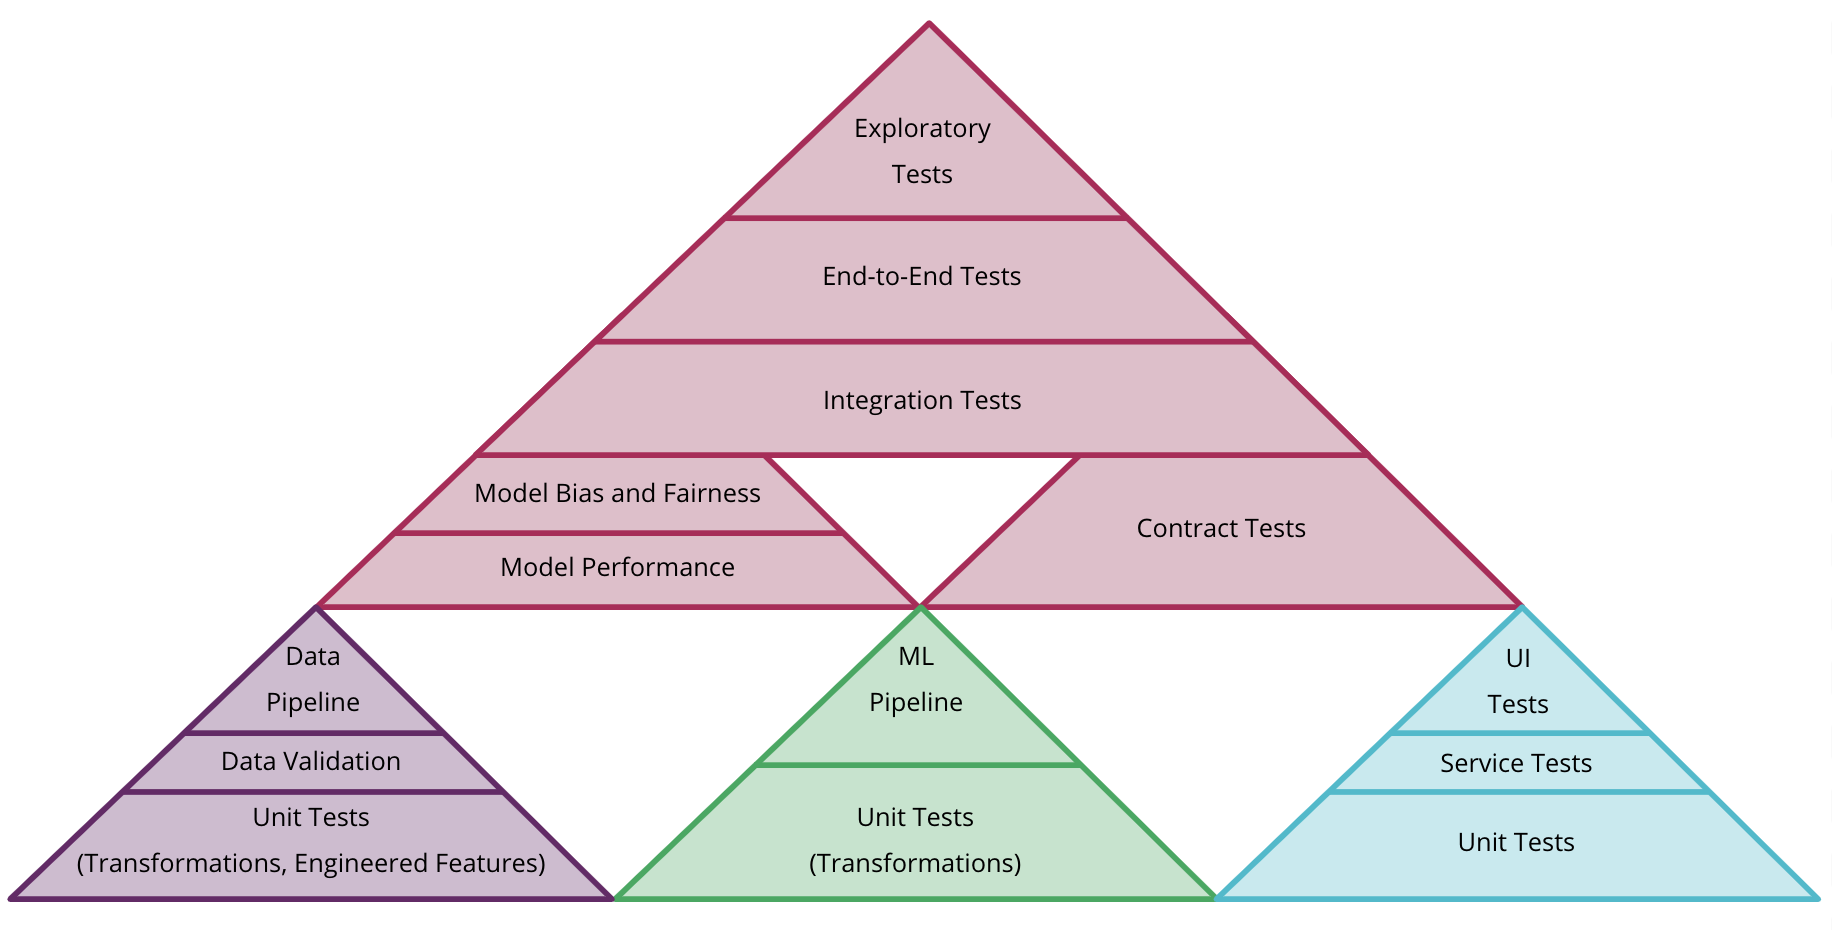
example of how to combine different test pyramids for data, model, and code in CD4ML
Combining tests for data (purple), model (green) and code (blue)
A deployment pipeline automates the process for getting software from version control into production, including all the stages, approvals, testing, and deployment to different environments
Deployment pipeline
We chose to use GoCD as our Continuous Delivery tool, as it was built with the concept of pipelines as a first-class concern
GoCD - open source Continuous Delivery tool
Continuous Delivery for Machine Learning (CD4ML) is the discipline of bringing Continuous Delivery principles and practices to Machine Learning applications.
Continuous Delivery for Machine Learning (CD4ML)
Android and iOS
Payment for mobile OS:
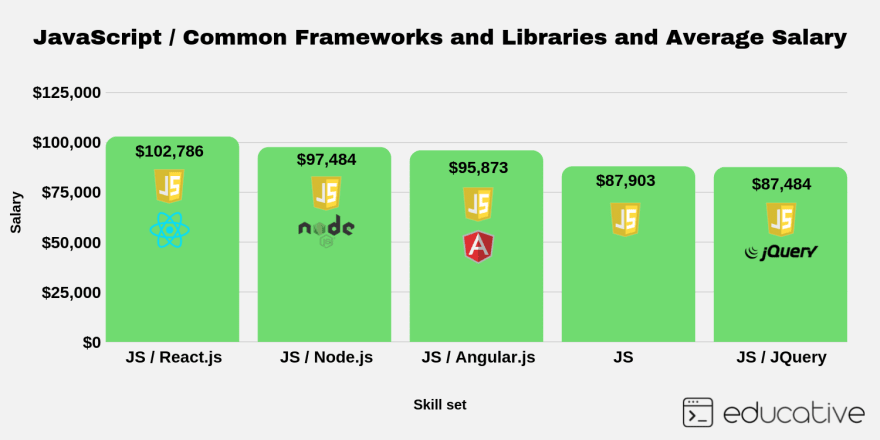
Frontend Devs: What should I learn after JavaScript? Explore these frameworks and libraries
Most paid JS frameworks and libraries:
I am not sure how but one kind soul somehow found the project, forked it, refactored it, "modernized" it, added linting, code sniffing, added CI and opened the pull request.
It's worth sharing your code, since someone can always find it and improve it, so that you can learn from it
It is solved when you understand why it occurred and why it no longer does.
What does it mean for a problem to be solved?
Let's reason through our memoizer before we write any code.
Operations performed by a memoizer:
Which is written as:
// Takes a reference to a function
const memoize = func => {
  // Creates a cache of results
  const results = {};
  // Returns a function
  return (...args) => {
    // Create a key for results cache
    const argsKey = JSON.stringify(args);
    // Only execute func if no cached value
    if (!results[argsKey]) {
      // Store function call result in cache
      results[argsKey] = func(...args);
    }
    // Return cached value
    return results[argsKey];
  };
};
Let's replicate our inefficientSquare example, but this time we'll use our memoizer to cache results.
Replication of a function with the use of memoizer (check the code below this annotation)
The biggest problem with JSON.stringify is that it doesn't serialize certain inputs, like functions and Symbols (and anything you wouldn't find in JSON).
Problem with JSON.stringify.
This is why the previous code shouldn't be used in production
Memoization is an optimization technique used in many programming languages to reduce the number of redundant, expensive function calls. This is done by caching the return value of a function based on its inputs.
Memoization (simple definition)
Documenting code is describing its use and functionality to your users. While it may be helpful in the development process, the main intended audience is the users.
Documenting code:
Class method docstrings should contain the following: A brief description of what the method is and what it’s used for Any arguments (both required and optional) that are passed including keyword arguments Label any arguments that are considered optional or have a default value Any side effects that occur when executing the method Any exceptions that are raised Any restrictions on when the method can be called
Class method should contain:
(check example below)
Comments to your code should be kept brief and focused. Avoid using long comments when possible. Additionally, you should use the following four essential rules as suggested by Jeff Atwood:
Comments should be as concise as possible. Moreover, you should follow 4 rules of Jeff Atwood:
From examining the type hinting, you can immediately tell that the function expects the input name to be of a type str, or string. You can also tell that the expected output of the function will be of a type str, or string, as well.
Type hinting introduced in Python 3.5 extends 4 rules of Jeff Atwood and comments the code itself, such as this example:
def hello_name(name: str) -> str:
    return(f"Hello {name}")
strDocstrings can be further broken up into three major categories: Class Docstrings: Class and class methods Package and Module Docstrings: Package, modules, and functions Script Docstrings: Script and functions
3 main categories of docstrings
According to PEP 8, comments should have a maximum length of 72 characters.
If comment_size > 72 characters:
use `multiple line comment`
Docstring conventions are described within PEP 257. Their purpose is to provide your users with a brief overview of the object.
Docstring conventions
All multi-lined docstrings have the following parts: A one-line summary line A blank line proceeding the summary Any further elaboration for the docstring Another blank line
Multi-line docstring example:
"""This is the summary line

This is the further elaboration of the docstring. Within this section,
you can elaborate further on details as appropriate for the situation.
Notice that the summary and the elaboration is separated by a blank new
line.

# Notice the blank line above. Code should continue on this line.
say_hello.__doc__ = "A simple function that says hello... Richie style"
Example of using __doc:
Code (version 1):
def say_hello(name):
    print(f"Hello {name}, is it me you're looking for?")

say_hello.__doc__ = "A simple function that says hello... Richie style"
Code (alternative version):
def say_hello(name):
    """A simple function that says hello... Richie style"""
    print(f"Hello {name}, is it me you're looking for?")
Input:
>>> help(say_hello)
Returns:
Help on function say_hello in module __main__:

say_hello(name)
    A simple function that says hello... Richie style
class constructor parameters should be documented within the __init__ class method docstring
init
Scripts are considered to be single file executables run from the console. Docstrings for scripts are placed at the top of the file and should be documented well enough for users to be able to have a sufficient understanding of how to use the script.
Docstrings in scripts
Documenting your code, especially large projects, can be daunting. Thankfully there are some tools out and references to get you started
You can always facilitate documentation with tools.
(check the table below)
Commenting your code serves multiple purposes
Multiple purposes of commenting:
BUG, FIXME, TODOIn general, commenting is describing your code to/for developers. The intended main audience is the maintainers and developers of the Python code. In conjunction with well-written code, comments help to guide the reader to better understand your code and its purpose and design
Commenting code:
Along with these tools, there are some additional tutorials, videos, and articles that can be useful when you are documenting your project
Recommended videos to start documenting
(check the list below)
If you use argparse, then you can omit parameter-specific documentation, assuming it’s correctly been documented within the help parameter of the argparser.parser.add_argument function. It is recommended to use the __doc__ for the description parameter within argparse.ArgumentParser’s constructor.
argparse
There are specific docstrings formats that can be used to help docstring parsers and users have a familiar and known format.
Different docstring formats:
Daniele Procida gave a wonderful PyCon 2017 talk and subsequent blog post about documenting Python projects. He mentions that all projects should have the following four major sections to help you focus your work:
Public and Open Source Python projects should have the docs folder, and inside of it:
(check the table below for a summary)
Since everything in Python is an object, you can examine the directory of the object using the dir() command
dir() function examines directory of Python objects. For example dir(str).
Inside dir(str) you can find interesting property __doc__
Documenting your Python code is all centered on docstrings. These are built-in strings that, when configured correctly, can help your users and yourself with your project’s documentation.
Docstrings - built-in strings that help with documentation
Along with docstrings, Python also has the built-in function help() that prints out the objects docstring to the console.
help() function.
After typing help(str) it will return all the info about str object
The general layout of the project and its documentation should be as follows:
project_root/
│
├── project/  # Project source code
├── docs/
├── README
├── HOW_TO_CONTRIBUTE
├── CODE_OF_CONDUCT
├── examples.py
(private, shared or open sourced)
In all cases, the docstrings should use the triple-double quote (""") string format.
Think only about """ when using docstrings
I need to specify types of input and output. But then I get speedup due to autocompletion, hints, and linting if for any reason I make a mistake.
In TypeScript, you spend a bit more time in the variable definition, but then autocompletion, hints, and linting will reward you. It also boosts code readability
TSDoc is a way of writing TypeScript comments where they’re linked to a particular function, class or method (like Python docstrings).
TSDoc <--- TypeScript comment syntax. You can create documentation with TypeDoc
ESLint does automatic code linting
ESLint <--- pluggable JS linter:
if (x = 5) { ... })Debugging is twice as hard as writing the code in the first place. Therefore, if you write the code as cleverly as possible, you are, by definition, not smart enough to debug it.
According to the Kernighan's Law, writing code is not as hard as debugging
interactive notebooks fall short when you want to write bigger, maintainable code
Survey regarding programming notebooks:

Write a new test and the result. If you want to make it REPL-like, instead of writing console.log(x.toString()) use expect(x.toString()).toBe('') and you will directly get the result.
jest <--- interactive JavaScript (TypeScript and others too) testing framework. You can use it as a VS Code extension.
Basically, instead of console.log(x.toString()), you can use except(x.toString()).toBe(''). Check this gif to understand it further
I recommend Airbnb style JavaScript style guide and Airbnb TypeScript)
Recommended style guides from Airbnb for:
Creating meticulous tests before exploring the data is a big mistake, and will result in a well-crafted garbage-in, garbage-out pipeline. We need an environment flexible enough to encourage experiments, especially in the initial place.
Overzealous nature of TDD may discourage from explorable data science
a methodology that combines a programming language with a documentation language, thereby making programs more robust, more portable, more easily maintained, and arguably more fun to write than programs that are written only in a high-level language. The main idea is to treat a program as a piece of literature, addressed to human beings rather than to a computer.
Exploratory testing described by Donald Knuth
Development Pros Cons
Table comparing pros and cons of:
This kind of “exploring” is easiest when you develop on the prompt (or REPL), or using a notebook-oriented development system like Jupyter Notebooks
It's easier to explore the code:
but, it's not efficient to develop in them
notebook contains an actual running Python interpreter instance that you’re fully in control of. So Jupyter can provide auto-completions, parameter lists, and context-sensitive documentation based on the actual state of your code
Notebook makes it easier to handle dynamic Python features
They switch to get features like good doc lookup, good syntax highlighting, integration with unit tests, and (critically!) the ability to produce final, distributable source code files, as opposed to notebooks or REPL histories
Things missed in Jupyter Notebooks:
Exploratory programming is based on the observation that most of us spend most of our time as coders exploring and experimenting
In exploratory programming, we:
the developer doesn’t need to worry about allocating memory, or the character set encoding of the string, or a host of other things.
Comparison of C (1972) and TypeScript (2012) code.
(check the code above)
“No Code” systems are extremely good for putting together proofs-of-concept which can demonstrate the value of moving forward with development.
Great point of "no code" trend
With someone else’s platform, you often end up needing to construct elaborate work-arounds for missing functionality, or indeed cannot implement a required feature at all.
You can quickly implement 80% of the solution in Salesforce using a mix of visual programming (basic rule setting and configuration), but later it's not so straightforward to add the missing 20%
The best way to explain the difference between launch and attach is to think of a launch configuration as a recipe for how to start your app in debug mode before VS Code attaches to it, while an attach configuration is a recipe for how to connect VS Code's debugger to an app or process that's already running.
Simple difference between two core debugging modes: Launch and Attach available in VS Code.
Depending on the request (attach or launch), different attributes are required, and VS Code's launch.json validation and suggestions should help with that.
Logpoint is a variant of a breakpoint that does not "break" into the debugger but instead logs a message to the console. Logpoints are especially useful for injecting logging while debugging production servers that cannot be paused or stopped. A Logpoint is represented by a "diamond" shaped icon. Log messages are plain text but can include expressions to be evaluated within curly braces ('{}').
Logpoints - log messages to the console when breakpoint is hit.
Can include expressions to be evaluated with {}, e.g.:
fib({num}): {result}
Here are some optional attributes available to all launch configurations
Optional arguments for launch.json:
presentation ("order", "group" or "hidden")preLaunchTaskpostDebugTaskinternalConsoleOptionsdebugServerserverReadyActionThe following attributes are mandatory for every launch configuration
In the launch.json file you've to define at least those 3 variables:
type (e.g. "node", "php", "go")request ("launch" or "attach")name (name to appear in the Debug launch configuration drop-down)Many debuggers support some of the following attributes
Some of the possibly supported attributes in launch.json:
programargsenvcwdportstopOnEntryconsole (e.g. "internalConsole", "integratedTerminal", "externalTerminal")Version control is at the heart of any modern engineering org. The ability for multiple engineers to asynchronously contribute to a codebase is crucial—and with notebooks, it’s very hard.
Version control in notebooks?
The priorities in building a production machine learning pipeline—the series of steps that take you from raw data to product—are not fundamentally different from those of general software engineering.
Reproducibility is an issue with notebooks. Because of the hidden state and the potential for arbitrary execution order, generating a result in a notebook isn’t always as simple as clicking “Run All.”
Problem of reproducibility in notebooks
A notebook, at a very basic level, is just a bunch of JSON that references blocks of code and the order in which they should be executed.But notebooks prioritize presentation and interactivity at the expense of reproducibility. YAML is the other side of that coin, ignoring presentation in favor of simplicity and reproducibility—making it much better for production.
Summary of the article:
Notebook = presentation + interactivity
YAML = simplicity + reproducibility
Notebook files, however, are essentially giant JSON documents that contain the base-64 encoding of images and binary data. For a complex notebook, it would be extremely hard for anyone to read through a plaintext diff and draw meaningful conclusions—a lot of it would just be rearranged JSON and unintelligible blocks of base-64.
Git traces plaintext differences and with notebooks it's a problem
There is no hidden state or arbitrary execution order in a YAML file, and any changes you make to it can easily be tracked by Git
In comparison to notebooks, YAML is more compatible for Git and in the end might be a better solution for ML
Python unit testing libraries, like unittest, can be used within a notebook, but standard CI/CD tooling has trouble dealing with notebooks for the same reasons that notebook diffs are hard to read.
unittest Python library doesn't work well in a notebook
Use camelCase when naming objects, functions, and instances.
camelCase for objects, functions and instances
const thisIsMyFuction() {}
Use PascalCase only when naming constructors or classes.
PascalCase for constructors and classes
// good
class User {
  constructor(options) {
    this.name = options.name;
  }
}

const good = new User({
  name: 'yup',
});
Use uppercase only in constants.
Uppercase for constants
export const API_KEY = 'SOMEKEY';
If you'd just like to see refactorings without Quick Fixes, you can use the Refactor command (Ctrl+Shift+R).
To easily see all the refactoring options, use the "Refactor" command
Stary, dobry Uncle Bob mówi, że poza etatem trzeba na programowanie poświęcić 20h tygodniowo.Gdy podzielimy to na 7 dni w tygodniu, to wychodzi prawie 3 godziny dziennie.Dla jednych mało, dla innych dużo.
Uncle Bob's advice: ~ 3h/day for programming
Z gier można wyciągnąć też inną naukę. Jeśli Twoim celem jest przejście do następnej lokacji, to czy musisz wykonywać wszystkie zadania poboczne?No nie musisz. Dlatego wyżej, gdy podawałem wymagane umiejętności dla osoby, która prowadzi szkolenia z Reacta, albo pracuje dla startupów, to napisałem “dobra znajomość JSa”, bo “doskonała” nie pomoże Ci w osiągnięciu tego celu.
Don't overlearn
W miarę jak będziesz się rozwijać i zdobywać nowe informacje, Twój plan będzie trzeba dostosować do nowych warunków.
Be prepared for a change. Be flexible in defining your goals
Arnie miał wielkie plany, ale nie realizował wszystkich na raz.Skupił się na jednej rzeczy - kulturystyce - bo wiedział, że to otworzy mu drogę do Ameryki i do aktorstwa.
Think BIG, act small
(small actions lead to big changes)
Jeśli wybierzesz kilka rzeczy na raz to ryzykujesz, że znowu zaczniesz miotać się we wszystkich kierunkach.Nie polecam takiej opcji, bo właśnie przez takie myślenie kończymy potem wkurwieni, z siwymi włosami i podkrążonymi oczami.Doświadczyłem wszystkich tych trzech objawów i dopiero kiedy skupiłem się na jednej rzeczy, to odzyskałem balans i przestałem się denerwować.
It's not so effective to have dozens of goals, but the one you can purely focus on
Niestety, jeśli faktycznie chcesz być najlepszą osobą, to z moich obserwacji wynika, że trzeba zapierdzielać.
Wanna be the best in what you're doing? Oh boy, be prepared...
W czasach młodości Arniego, Reg Park był wielką gwiazdą kulturystyki, sławnym oraz bogatym aktorem i otaczały go piękne dziewczyny.Arnie chciał się wydostać z zadupia w Austrii, przeprowadzić do Ameryki i mieć dokładnie to samo co Reg.Wolność, sławę, kasę i dziewczyny.Wszystkie jego działania były podporządkowane dotarciu do tego celu.Arnie dokładnie zawęził czego chce.
Taking example from Arnold Schwarzenegger we shall have clear & precise goals
👉 Wiele osób ma cele w stylu “chcę się nauczyć Reacta”. I jest to zbyt słabo sprecyzowany cel.👉 Celem musi być coś w stylu “chcę się nauczyć Reacta, żeby pracować w firmie X i robić projekty dla startupów z Doliny Krzemowej”.👉 Albo “chcę się nauczyć Reacta, żeby pracować w Facebooku z Danem Abramovem nad kolejnymi wersjami Reacta”.👉 Albo “chcę się nauczyć Reacta, żeby prowadzić szkolenia stacjonarne dla backendowców, którzy nie umieją we frontendy”.
Instead of planning to "learn machine learning" give it a bit more details, e.g.:
In result, achieving your goal will become different (imho better)
Pytać wszystkich wszędzie i powiększaj swoją znajomość tematu. Poszerzaj worek możliwości.Przeszukaj Reddita, Stacka, grupy na Facebooku. Znajdź jakiegoś mądrego człowieka na social media i napisz mu DM.
Ask everyone/everywhere for advice if you really don't know what you want to do
Suppose you have only two rolls of dice. then your best strategy would be to take the first roll if its outcome is more than its expected value (ie 3.5) and to roll again if it is less.
Expected payoff of a dice game:
Description: You have the option to throw a die up to three times. You will earn the face value of the die. You have the option to stop after each throw and walk away with the money earned. The earnings are not additive. What is the expected payoff of this game?
Rolling twice: $$\frac{1}{6}(6+5+4) + \frac{1}{2}3.5 = 4.25.$$
Rolling three times: $$\frac{1}{6}(6+5) + \frac{2}{3}4.25 = 4 + \frac{2}{3}$$
Therefore, En=2n+1−2=2(2n−1)
Simplified formula for the expected number of tosses (e) to get n consecutive heads (n≥1):
$$e_n=2(2^n-1)$$
For example, to get 5 consecutive heads, we've to toss the coin 62 times:
$$e_n=2(2^5-1)=62$$
We can also start with the longer analysis of the 5 scenarios:
Thus:
$$e=\frac{1}{2}(e+1)+\frac{1}{4}(e+2)+\frac{1}{8}(e+3)+\frac{1}{16}\\(e+4)+\frac{1}{32}(e+5)+\frac{1}{32}(5)=62$$
We can also generalise the formula to:
$$e_n=\frac{1}{2}(e_n+1)+\frac{1}{4}(e_n+2)+\frac{1}{8}(e_n+3)+\frac{1}{16}\\(e_n+4)+\cdots +\frac{1}{2^n}(e_n+n)+\frac{1}{2^n}(n) $$
It's responsible for allocating and scheduling containers, providing then with abstracted functionality like internal networking and file storage, and then monitoring the health of all of these elements and stepping in to repair or adjust them as necessary.In short, it's all about abstracting how, when and where containers are run.
Kubernetes (simple explanation)
You’ll see pressure to push towards “Cloud neutral” solutions using Kubernetes in various places
Maybe Kubernetes has the advantage of being cloud neutral, but: you pay the cost of a cloud migration:
Heroku? App Services? App Engine?
You can set up yourself in production in minutes to only a few hours
Kubernetes (often irritatingly abbreviated to k8s, along with it’s wonderful ecosystem of esoterically named additions like helm, and flux) requires a full time ops team to operate, and even in “managed vendor mode” on EKS/AKS/GKS the learning curve is far steeper than the alternatives.
Kubernetes:
Azure App Services, Google App Engine and AWS Lambda will be several orders of magnitude more productive for you as a programmer. They’ll be easier to operate in production, and more explicable and supported.
Use the closest thing to a pure-managed platform as you possibly can. It will be easier to operate in production, and more explicable and supported:
With the popularisation of docker and containers, there’s a lot of hype gone into things that provide “almost platform like” abstractions over Infrastructure-as-a-Service. These are all very expensive and hard work.
Kubernetes aren't always required unless you work on huge problems
By using events that are buffered in queues, your system can support outage, scaling up and scaling down, and rolling upgrades without any special consideration. It’s normal mode of operation is “read from a queue”, and this doesn’t change in exceptional circumstances.
Event driven architectures with replay / message logs
Reserved resources, capacity, or physical hardware can be protected for pieces of your software, so that an outage in one part of your system doesn’t ripple down to another.
Idea of Bulkheads
The complimentary design pattern for all your circuit breakers – you need to make sure that you wrap all outbound connections in a retry policy, and a back-off.
Idempotency and Retries design pattern
Circuit breaking is a useful distributed system pattern where you model out-going connections as if they’re an electrical circuit. By measuring the success of calls over any given circuit, if calls start failing, you “blow the fuse”, queuing outbound requests rather than sending requests you know will fail.
Circuit breaking - useful distributed system pattern. It's phenomenal way to make sure you don't fail when you know you might.
“scaling out is the only cost-effective thing”, but plenty of successful companies managed to scale up with a handful of large machines or VMs
Scaling is hard if you try do it yourself, so absolutely don’t try do it yourself. Use vendor provided, cloud abstractions like Google App Engine, Azure Web Apps or AWS Lambda with autoscaling support enabled if you can possibly avoid it.
Scaling shall be done with cloud abstractions
Hexagonal architectures, also known as “the ports and adapters” pattern
Hexagonal architectures - one of the better pieces of "real application architecture" advice.
Good microservice design follows a few simple rules
Microservice design rules:
What Microservices are supposed to be: Small, independently useful, independently versionable, independently shippable services that execute a specific domain function or operation. What Microservices often are: Brittle, co-dependent, myopic services that act as data access objects over HTTP that often fail in a domino like fashion.
What Microservices are supposed to be: independent
VS
what they often are: dependent
In the mid-90s, “COM+” (Component Services) and SOAP were popular because they reduced the risk of deploying things, by splitting them into small components
History of Microservices:
all a design pattern is, is the answer to a problem that people solve so often, there’s an accepted way to solve it
“Design patterns are just bug fixes for your programming languages”
"they’re just the 1990s version of an accepted and popular stackoverflow answer"
Let’s do a quick run through of some very common ones:
most common design patterns:
CDNs are web servers run by other people, all over the world. You upload your data to them, and they will replicate your data across all of their “edges” (a silly term that just means “to all the servers all over the world that they run”) so that when someone requests your content, the DNS response will return a server that’s close to them, and the time it takes them to fetch that content will be much quicker.
CDNs (Content Delivery Networks)
Offloading to a CDN is one of the easiest ways you can get extra performance for a very minimal cost
Understanding how a distributed cache works is remarkably simple – when an item is added, the key (the thing you use to retrieve that item) that is generated includes the address or name of the computer that’s storing that data in the cache. Generating keys on any of the computers that are part of the distributed cache cluster will result in the same key. This means that when the client libraries that interact with the cache are used, they understand which computer they must call to retrieve the data.
Distributed caching (simple explanation)
Memory caches are used to store the result of something that is “heavy” to calculate, takes time, or just needs to be consistent across all the different computers running your server software. In exchange for a little bit of network latency, it makes the total amount of memory available to your application the sum of all the memory available across all your servers.
Distributed caching:
All a load balancer does, is accept HTTP requests for your application (or from it), pick a server that isn’t very busy, and forward the request.
Load balancers:
GraphQL gels especially well with modern JavaScript driven front ends, with excellent tools like Apollo and Apollo-Server that help optimise these calls by batching requests.
GraphQL + Apollo or Apollo-Server
BFF is an API that serves one, and specifically only one application
BFF (backend for frontend):
GraphQL really is just a smart and effective way to schema your APIs, and provide a BFF – that’s backend for frontend
What sets GraphQL apart a little from previous approaches (notably Microsofts’ OData) is the idea that Types and Queries are implemented with Resolver code on the server side, rather than just mapping directly to some SQL storage.
What makes GraphQL favorable over other implementations.
In result:
GraphQL is confusingly, a Query Language, a standard for HTTP APIs and a Schema tool all at once.
GraphQL
Use a swagger or OpenAPI library to generate a schema and you’re pretty much doing what most people are doing.
Generating RESTful schema
JSON-RPC is “level 0” of the Richardson Maturity Model – a model that describes the qualities of a REST design.
JSON-RPC.
You can build it by:
REST is a good architectural style (and it is, a lot of the modern naysaying about REST is relatively uninformed and not too dissimilar to the treatment SOAP had before it)
REST is still a good architectural style
there was a push for standardisation of “SOAP” (simple object access protocol) APIs
Standarisation of SOAP brought a lot of good stuff but people found XML cumbersome to read.
A lot of things being solved in SOAP had to subsequently be re-solved on top of JSON using emerging open-ish standards like Swagger (now OpenAPI) and JSON:API
The basics of HTTP are easy to grasp – there’s a mandatory “request line”
Mandatory HTTP request line:
Then, there's a bunch of optional request header fields.
Example HTTP request:
GET http://www.davidwhitney.co.uk/ HTTP/1.1
Host: www.davidwhitney.co.uk
Connection: keep-alive
User-Agent: Mozilla/5.0 (Windows NT 10.0; Win64; x64…
Accept: text/html,application/xhtml+xml,application/xml;q=0.9
Accept-Encoding: gzip, deflate
Accept-Language: en-GB,en-US;q=0.9,en;q=0.8
Example response:
HTTP/1.1 200 OK
Cache-Control: public,max-age=1
Content-Type: text/html; charset=utf-8
Vary: Accept-Encoding
Server: Kestrel
X-Powered-By: ASP.NET
Date: Wed, 11 Dec 2019 21:52:23 GMT
Content-Length: 8479


<!DOCTYPE html>
<html lang="en">...
web is an implementation of the design pattern REST – which stands for “Representational State Transfer”. You’ll hear people talk about REST a lot – it was originally defined by Roy Fielding in his PhD dissertation, but more importantly was a description of the way HTTP/1.0 worked at the time
Origins of the REST design pattern
So the web is RESTful by default. REST describes the way HTTP works.
Most APIs you use, or build will be “REST-ish”.
Honestly for the most part it’s a matter of taste, and they’re all perfectly appropriate ways to build web applications.
Which model to choose:
static site generators became increasingly popular – normally allowing you to use your normal front-end web dev stack, but then generating all the files using a build tool to bundle and distribute to dumb web servers or CDNs
Examples of static site generators: Gatsby, Hugo, Jekyll, Wyam
MVVM is equally common in single page apps where there’s two way bindings between something that provides data (the model) and the UI (which the view model serves).

SPAs are incredibly common, popularised by client-side web frameworks like Angular, React and Vue.js.
SPAs:
Angular - client side MVC framework following its pattern, except it's running inside the users web browser.
React - implementation of FRP. A little more flexible, but more concerned with state change events in data (often using some event store like Redux)
http://www.mycoolsite.com/Home/Index
With such a website, MVC model would try to:
HomeController" file/module (depending on programming language) inside the controllers directory.Index" function would probably exist and would return a model (some data) that would be rendered by a view (HTML template from the views folder)(All the different frameworks do this slightly differently, but the core idea stays the same – features grouped together by controllers, with functions for returning pages of data and handling input from the web)
when most people say “MVC” they’re really describing “Rails-style” MVC apps where your code is organised into a few different directories
Different directories of the MVC pattern:
most people stick to a handful of common patterns
Common patterns:
There are tonne of general purpose web servers out there
Realistically, you'll see a mixture of:
“web servers”, implement the “HTTP protocol” – a series of commands you can send to remote computers – that let you say “hey, computer, send me that document”
Web servers (simple explanation)
He is intrigued by the unique qualities of each person, organizes for maximum productivity, has a great desire to learn, can sense other people’s feelings, and is introspective and appreciates intellectual discussions—strengths that have been confirmed both through the Clifton StrengthsFinder assessment and are reflected in his personal and professional life.
Way in which you can summarise the results of Gallup's test on your LinkedIn.
People pay for premium content for the content itself and connection to the creator, not for studio lighting and animations
Repeated measures involves measuring the same cases multiple times. So, if you measured the chips, then did something to them, then measured them again, etc it would be repeated measures. Replication involves running the same study on different subjects but identical conditions. So, if you did the study on n chips, then did it again on another n chips that would be replication.
Difference between repeated measures and replication
I’m sharing a few insights I specifically found useful for developers who are not specialized in this domain.
Insights on databases from a Google engineer:
So I wrote a GitHub Actions workflow that automatically updates the README page in the repo every time a new TIL markdown file is added or updated!
You can use GitHub Actions to automatically rewrite your README.md
Think of mental laziness as a lack of mental exercise. Mental exercise, such as tough decisions, actually burn more calories and impact your overall physiology.
Mental laziness
Laziness is stagnation without regard for enjoyment or perceptions. In other words it is the opposite of ambition or progression.
Laziness - interesting definition
At the company I work at, one of our products is an embeddable commenting system. Unlike single-page applications, when we encounter bugs they’re usually on the client’s website. This raised the question, how can we embed a piece of code that will run on all our client’s websites, that will help us debug and improve our overall build experience.
Case when userscripts apply (not extensions)
“Hey, I have a good idea for a game,” I said. “It’s called the function machine game. I will think of a function machine. You tell me things to put into the function machine, and I will tell you what comes out. Then you have to guess what the function machine does.” He immediately liked this game and it has been a huge hit; he wants to play it all the time. We played it while driving to a party yesterday, and we played it this morning while I was in the shower.
Great idea for a game with your kids to develop logical thinking in them
Tau Day is an annual celebration of the circle constant τ=6.283185…\tau = 6.283185\ldots, which takes place every June 28 (6/28 in the American calendar system).
Tau (τ) = 2π radians = 360°
It's simply a more intuitive way of representing a full circular rotation. Possibly Euler could've changed it 100 years ago, but too many textbooks already applied the concept of 2π radians instead
To customize settings for debugging tests, you can specify "request":"test" in the launch.json file in the .vscode folder from your workspace.
Customising settings for debugging tests while running
Python: Debug All Tests
or
Python: Debug Test Method
For example, the test_decrement functions given earlier are failing because the assertion itself is faulty.
Debugging tests themselves
test_decrement)inc_dec.decrement(3) to see what is the actual output when we use x=3Support for running tests in parallel with pytest is available through the pytest-xdist package.
pytest-xdist provides support for parallel testing.
py -3 -m pip install pytest-xdist
pytest.ini in your project directory and specify in it the number of CPUs to be used (e.g. 4):[pytest]
addopts=-n4
With pytest, failed tests also appear in the Problems panel, where you can double-click on an issue to navigate directly to the test
pytest displays failed tests also in PROBLEMS

VS Code also shows test results in the Python Test Log output panel (use the View > Output menu command to show the Output panel, then select Python Test Log
Another way to view the test results:
View > Output > Python Test Log
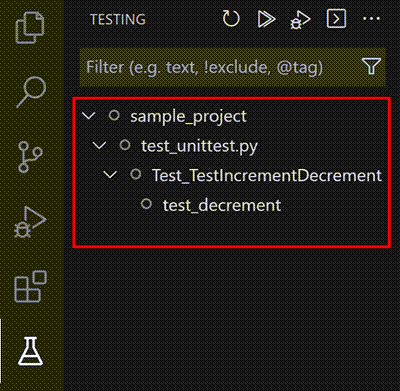
For Python, test discovery also activates the Test Explorer with an icon on the VS Code activity bar. The Test Explorer helps you visualize, navigate, and run tests
Test Explorer is activated after discovering tests in Python:
Once VS Code recognizes tests, it provides several ways to run those tests
After discovering tests, we can run them, for example, using CodeLens:

You can trigger test discovery at any time using the Python: Discover Tests command.
After using python.testing.autoTestDiscoverOnSaveEnabled, it'll be set to true and discovering tests whenever a test file is saved.
If discovery succeeds, the status bar shows Run Tests instead:

Sometimes tests placed in subfolders aren't discovered because such test files cannot be imported. To make them importable, create an empty file named __init__.py in that folder.
Tip to use when tests aren't discoverable in subfolderds (create __init__.py file)
Testing in Python is disabled by default. To enable testing, use the Python: Configure Tests command on the Command Palette.
Start testing in VS Code by using Python: Configure Tests (it automatically chooses one testing framework and disables the rest).
Otherwise, you can configure tests manually by setting only one of the following to True:
python.testing.unittestEnabledpython.testing.pytestEnabledpython.testing.nosetestsEnabledpython.testing.pytestArgs: Looks for any Python (.py) file whose name begins with "test_" or ends with "_test", located anywhere within the current folder and all subfolders.
Default behaviour of test discovery by pytest framework
python.testing.unittestArgs: Looks for any Python (.py) file with "test" in the name in the top-level project folder.
Default behaviour of test discovery by unittest framework
Create a file named test_unittest.py that contains a test class with two test methods
Sample test file using unittest framework. inc_dec is the file that's being tested:
import inc_dec    # The code to test
import unittest   # The test framework

class Test_TestIncrementDecrement(unittest.TestCase):
    def test_increment(self):
        self.assertEqual(inc_dec.increment(3), 4) # checks if the results is 4 when x = 3

    def test_decrement(self):
        self.assertEqual(inc_dec.decrement(3), 4)

if __name__ == '__main__':
    unittest.main()
Each test framework has its own conventions for naming test files and structuring the tests within, as described in the following sections. Each case includes two test methods, one of which is intentionally set to fail for the purposes of demonstration.
Nose2, the successor to Nose, is just unittest with plugins
Nose2 testing
Python tests are Python classes that reside in separate files from the code being tested.
general background on unit testing, see Unit Testing on Wikipedia. For a variety of useful unit test examples, see https://github.com/gwtw/py-sorting
Running the unit test early and often means that you quickly catch regressions, which are unexpected changes in the behavior of code that previously passed all its unit tests.
Regressions
Developers typically run unit tests even before committing code to a repository; gated check-in systems can also run unit tests before merging a commit.
When to run unit tests:
in unit testing you avoid external dependencies and use mock data or otherwise simulated inputs
Unit tests are small, isolated piece of code making them quick and inexpensive to run
The practice of test-driven development is where you actually write the tests first, then write the code to pass more and more tests until all of them pass.
Essence of TDD
The combined results of all the tests is your test report
test report
each test is very simple: invoke the function with an argument and assert the expected return value.
e.g. test of an exact number entry:
    def test_validator_valid_string():
        # The exact assertion call depends on the framework as well
        assert(validate_account_number_format("1234567890"), true)
Unit tests are concerned only with the unit's interface—its arguments and return values—not with its implementation
unit is a specific piece of code to be tested, such as a function or a class. Unit tests are then other pieces of code that specifically exercise the code unit with a full range of different inputs, including boundary and edge cases.
Essence of unit testing
Open Command tool and search for coverage
Checking CSS coverage inside Chrome Dev Tools:
Stroną, która jako jedyna wyświetla wszystkie dostępne do śledzenia statki powietrze jest ADSBexchange.com, którą zasilimy naszymi danymi. Jest to największa na świecie społeczność właścicieli odbiorników ADS-B / Mode S / MLAT i jednocześnie największe na świecie, w pełni publiczne i darmowe, źródło niefiltrowanych danych o lotach. Zapewniany przez to narzędzie dostęp do danych lotów na całym świecie jest wykorzystywany zarówno przez hobbystów, badaczy, jak i, co ciekawe, dziennikarzy.
ADSBexchange.com in comparison to commercial sites like FlightAware or Flightradar24 doesn't hide any flights (as here no one can pay to hide them from the public access).
Can G Suite Admin Read My Email?
tl;dr: YES (check the article for detailed steps)
AinD launches Android apps in Docker, by nesting Anbox containers inside Docker.
AinD - useful tool when we need to run an Android app 24/7 in the cloud.
Unlike the alternatives, AinD is not VM, but IaaS based
gh repo create hello-world -d "A react app for the web" --public
GitHub released a new CLI: gh with which you can do much more operations.
For example, you can create repo without going into your browser:
gh repo create hello-world -d "A react app for the web" --public
Generally, it will be great for CI/CD pipelines
An emerging way to bypass the need for passwords is to use magic links. A magic link is a temporary URL that expires after use, or after a specific interval of time. Magic links can be sent to your email address, an app, or a security device. Clicking the link authorizes you to sign in.
Magic Links to replace passwords?
Hashing passwords won’t save you or your users. Once a database of passwords has been stolen, hackers aim immense distributed computing power at those password databases. They use parallel GPUs or giant botnets with hundreds of thousands of nodes to try hundreds of billions of password combinations per second in hopes of recovering plaintext username/password pairs.
What happens when the database is in hacker's hands
The solution will be to go for serverless functions. This means that instead of occupying a server completely, it will only use the server capacity when the function needs to run.
Serverless as a cheap back end option
My favourites are Zeit and Netlify. They are quite similar in the features they provide: continuous deployment, around 100GB of bandwidth per month, and a built-in CDN. Another benefit is that they both provide the option of serverless functions, as we will see in the next section. This simplifies the number of services we need to integrate for our entire stack.
Good website hosting:
Zeit or Netlify
(CD + 100 GB of bandwith / month + built-in CDN)
Guédelon Castle (Château de Guédelon) is a castle currently under construction near Treigny, France. The castle is the focus of an experimental archaeology project aimed at recreating a 13th-century castle and its environment using period technique, dress, and material.
Guédelon Castle (Château de Guédelon)
More info on HN
To take full advantage of tabular augmentation for time-series you would perform the techniques in the following order: (1) transforming, (2) interacting, (3) mapping, (4) extracting, and (5) synthesising
process of modular feature engineering and observation engineering while emphasising the order of augmentation to achieve the best predicted outcome from a given information set
Tabular Data Augmentation
1) Redash and Falcon focus on people that want to do visualizations on top of SQL2) Superset, Tableau and PowerBI focus on people that want to do visualizations with a UI3) Metabase and SeekTable focus on people that want to do quick analysis (they are the closest to an Excel replacement)
Comparison of data analysis tools:
1) Redash & Falcon - SQL focus
2) Superset, Tableau & PowerBI - UI workflow
3) Metabase & SeekTable - Excel like experience
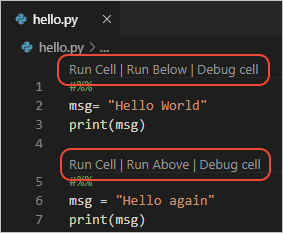
Visual Studio Code supports working with Jupyter Notebooks natively, as well as through Python code files.
To run cells inside a Python script in VSCode, all you need to is to define Jupyter-like code cells within Python code using a # %% comment:
# %%
msg = "Hello World"
print(msg)

# %%
msg = "Hello again"
print(msg)
JupyterLab project, which enables a richer UI including a file browser, text editors, consoles, notebooks, and a rich layout system.
How JupyterLab differs from a traditional notebook
I could probably bootstrap my way up from this with the C compiler to write a terrible editor, then write a terrible TCP client, find my way out to ftp.gnu.org, get wget, and keep going from there. Assume that documentation is plentiful. You want a copy of the Stevens book so you can figure out how to do a DNS query by banging UDP over the network? Done.
What would the author do in a situation of being alone in a room with:
HD #1 is blank. HD #2 has a few scraps of a (Linux) OS on it: bootloader, kernel, C library and compiler, that sort of thing. There's a network connection of some sort, and that's about it. There are no editors and nothing more advanced than 'cat' to read files. You don't have jed, joe, emacs, pico, vi, or ed (eat flaming death). Don't even think about X. telnet, nc, ftp, ncftp, lftp, wget, curl, lynx, links? Luxury! Gone. Perl, Python and Ruby? Nope.